BRISTOW GROUP INC.
10-Ks and 10-Qs
|
|
|
|
|
|
|
|
|
|
|
|
|
|
|
|
|
|
|
|
|
|
|
|
|
|
|
|
|
|
|
|
|
|
|
|
|
|
|
|
|
|
|
|
United States
SECURITIES AND EXCHANGE COMMISSION
Washington, D.C. 20549
FORM 10-K
ANNUAL REPORT
PURSUANT TO SECTIONS 13 OR 15(d) OF THE
SECURITIES EXCHANGE ACT OF 1934
|
(Mark one)
|
|
|
ý
|
ANNUAL REPORT PURSUANT TO SECTION 13 OR 15(d) OF THE SECURITIES EXCHANGE ACT OF 1934
|
For the fiscal year ended
December 31, 2013
OR
|
¨
|
TRANSITION REPORT PURSUANT TO SECTION 13 OR 15(d) OF THE SECURITIES EXCHANGE ACT OF 1934
|
For the transition period from to
Commission file number 001-35701
Era Group Inc.
(Exact name of Registrant as Specified in Its Charter)
|
Delaware
|
|
72-1455213
|
|
(State or Other Jurisdiction of
Incorporation or Organization)
|
|
(I.R.S. Employer
Identification No.)
|
|
818 Town & Country Blvd., Suite 200
Houston, Texas
|
|
77024
|
|
(Address of Principal Executive Offices)
|
|
(Zip Code)
|
Registrant’s telephone number, including area code (281) 606-4900
|
Securities registered pursuant to Section 12(b) of the Act:
|
||
|
Title of Each Class
|
|
Name of Each Exchange on Which Registered
|
|
Common Stock, par value $.01 per share
|
|
New York Stock Exchange
|
|
Securities registered pursuant to Section 12(g) of the Act:
|
|
None
|
|
(Title of Class)
|
Indicate by check mark if the registrant is a well-known seasoned issuer, as defined in Rule 405 of the Securities Act.
¨
Yes
ý
No
Indicate by check mark if the registrant is not required to file reports pursuant to Section 13 or Section 15(d) of the Act.
¨
Yes
ý
No
Indicate by check mark whether the registrant (1) has filed all reports required to be filed by Section 13 or 15(d) of the Securities Exchange Act of 1934 during the preceding 12 months (or such shorter period that the registrant was required to file such reports), and (2) has been subject to such filing requirements for the past 90 days.
ý
Yes
¨
No
Indicate by check mark whether the registrant has submitted electronically and posted on its corporate Web site, if any, every Interactive Data File required to be submitted and posted pursuant to Rule 405 of Regulation S-T (§ 232.405 of this chapter) during the preceding 12 months (or for such shorter period that the registrant was required to submit and post such files).
ý
Yes
¨
No
Indicate by check mark if disclosure of delinquent filers pursuant to Item 405 of Regulation S-K is not contained herein, and will not be contained, to the best of registrant’s knowledge, in definitive proxy or information statements incorporated by reference in Part III of this Form 10-K or any amendment to this Form 10-K.
ý
Indicate by check mark whether the registrant is a large accelerated filer, an accelerated filer, a non-accelerated filer, or a smaller reporting company. See definitions of “large accelerated filer,” “accelerated filer,” and “smaller reporting company” in Rule 12b-2 of the Exchange Act. (Check one):
|
Large accelerated filer
¨
|
|
Accelerated filer
¨
|
|
Non-accelerated filer
x
(Do not check if a smaller
reporting company)
|
|
Smaller reporting company
¨
|
Indicate by check mark whether the registrant is a shell company (as defined in Rule 12b-2 of the Exchange Act).
¨
Yes
ý
No
The aggregate market value of the voting stock of the registrant held by non-affiliates as of June 30, 2013 was $489,236,846. The total number of shares of Common Stock, par value $0.01 per share, outstanding as of February 28, 2014 was 20,183,893. The Registrant has no other class of Common Stock outstanding.
ERA GROUP INC.
FORM 10-K
TABLE OF CONTENTS
|
PART I
|
||
|
Item 1.
|
||
|
Item 1A.
|
||
|
Item 1B.
|
||
|
Item 2.
|
||
|
Item 3.
|
||
|
Item 4.
|
||
|
PART II
|
||
|
Item 5.
|
||
|
Item 6.
|
||
|
Item 7.
|
||
|
Item 7A.
|
||
|
Item 8.
|
||
|
Item 9.
|
||
|
Item 9A.
|
||
|
Item 9B.
|
||
|
PART III
|
||
|
Item 10.
|
||
|
Item 11.
|
||
|
Item 12.
|
||
|
Item 13.
|
||
|
Item 14.
|
||
|
PART IV
|
||
|
Item 15.
|
||
FORWARD-LOOKING STATEMENTS
This Annual Report on Form 10-K includes “forward-looking statements” within the meaning of the Private Securities Litigation Reform Act of 1995. Such forward-looking statements concerning management’s expectations, strategic objectives, business prospects, anticipated economic performance and financial condition and other similar matters involve known and unknown risks, uncertainties and other important factors that could cause the actual results, performance or achievements of results to differ materially from any future results, performance or achievements discussed or implied by such forward-looking statements. Such risks, uncertainties and other important factors include, among others:
|
•
|
the effect of the Spin-off, including the ability of the Company to recognize the expected benefits from the Spin-off and the Company’s dependence on SEACOR’s performance under various agreements;
|
|
•
|
decreased demand and loss of revenues resulting from developments that may adversely impact the offshore oil and gas industry, including the issuance of new safety and environmental guidelines or regulations that could increase the costs of exploration and production, reduce the area of operations and result in permitting delays, U.S. government implemented moratoriums directing operators to cease certain drilling activities and any extension of such moratoriums that may result in unplanned customer suspensions, cancellations, rate reductions or non-renewals of aviation equipment contracts or failures to finalize commitments to contract aviation equipment;
|
|
•
|
safety issues experienced by a particular helicopter model that could result in customers refusing to use that helicopter model or a regulatory body grounding that helicopter model, which could also permanently devalue that helicopter model;
|
|
•
|
the cyclical nature of the oil and gas industry;
|
|
•
|
increased U.S. and foreign government legislation and regulation, including environmental and aviation laws and regulations, and the Company’s compliance therewith and the costs thereof;
|
|
•
|
dependence on the activity in the U.S. Gulf of Mexico and Alaska and the Company’s ability to expand into other markets;
|
|
•
|
liability, legal fees and costs in connection with providing emergency response services;
|
|
•
|
decreased demand for the Company’s services as a result of declines in the global economy;
|
|
•
|
declines in valuations in the global financial markets and a lack of liquidity in the credit sectors, including interest rate fluctuations, availability of credit, inflation rates, change in laws, trade barriers, commodity prices and currency exchange fluctuations;
|
|
•
|
activity in foreign countries and changes in foreign political, military and economic conditions;
|
|
•
|
the failure to maintain an acceptable safety record;
|
|
•
|
activity with non-wholly owned entities;
|
|
•
|
the dependence on a small number of customers;
|
|
•
|
consolidation of the Company’s customer base;
|
|
•
|
the ongoing need to replace aging helicopters;
|
|
•
|
dependence on the used aircraft market;
|
|
•
|
industry fleet capacity;
|
|
•
|
restrictions imposed by the U.S. federal aviation laws and regulations on the amount of foreign ownership of the Company’s common stock;
|
|
•
|
operational risks;
|
|
•
|
risks associated with the Company’s debt structure;
|
|
•
|
operational and financial difficulties of the Company’s joint ventures and partners;
|
|
•
|
effects of adverse weather conditions and seasonality;
|
|
•
|
adequacy of insurance coverage;
|
|
•
|
the attraction and retention of qualified personnel; and
|
|
•
|
various other matters and factors, many of which are beyond the Company’s control.
|
In addition, these statements constitute Era Group’s cautionary statements under the Private Securities Litigation Reform Act of 1995. It is not possible to predict or identify all such factors. Consequently, the foregoing should not be considered a complete
1
discussion of all potential risks or uncertainties. The words “estimate,” “project,” “intend,” “believe,” “plan” and similar expressions are intended to identify forward-looking statements. Forward-looking statements speak only as of the date of the document in which they are made. Era Group disclaims any obligation or undertaking to provide any updates or revisions to any forward-looking statement to reflect any change in Era Group’s expectations or any change in events, conditions or circumstances on which the forward-looking statement is based. The forward-looking statements in this Annual Report on Form 10-K should be evaluated together with the many uncertainties that affect Era Group’s businesses, particularly those discussed in greater detail in Part I, Item 1A, “Risk Factors” of this Annual Report on Form 10-K.
|
ITEM 1.
|
BUSINESS
|
General
Unless the context indicates otherwise, the terms “we,” “our,” “ours,” “us” and the “Company” refer to Era Group Inc. and its consolidated subsidiaries. “Era Group” refers to Era Group Inc., incorporated in 1999 in Delaware. “Common Stock” refers to the common stock,
par value
$0.01 per share, of Era Group. The Company's fiscal year ended on
December 31, 2013
.
We are one of the largest helicopter operators in the world and the longest serving helicopter transport operator in the U.S., which is our primary area of operations. Our helicopters are primarily used to transport personnel to, from and between offshore installations, drilling rigs and platforms. In the year ended
December 31, 2013
, approximately
60%
and
18%
of our total operating revenues were earned in the U.S. Gulf of Mexico and Alaska, respectively. We also provide helicopters and related services to third-party helicopter operators in other countries. In addition to our U.S. customers, we currently have customers in Brazil, Canada, India, Mexico, Norway, Spain, Sweden, the United Kingdom and Uruguay.
The primary users of our helicopter services are major integrated and independent oil and gas companies, including Anadarko Petroleum Corporation (“Anadarko”), Shell Exploration and Production Company (“Shell”), Exxon Mobil Global Services Co., and Petrobras America Inc. (“Petrobras America”), and the U.S. government. In the years ended
December 31, 2013
and
2012
, approximately
75%
and
65%
of our operating revenues, respectively, were derived from helicopter services, including emergency search and rescue services, provided to clients primarily involved in oil and gas activities. In addition to serving the oil and gas industry, we provide helicopters under dry-lease, air medical services, firefighting support and Alaska flightseeing tours, among other activities.
In recent years, we have developed helicopter dry-leasing opportunities to enter developing international markets. We dry-lease to third parties and foreign affiliates. These third parties and affiliates in turn provide helicopter services to clients in their local markets. Under our dry-lease arrangements, operational responsibility is normally assumed by the lessee, which results in lower investment costs for overseas infrastructure. In certain countries where we believe it is beneficial to access the local market for offshore helicopter support, such as Brazil, we have entered into joint venture relationships. We typically own a 50% interest in the foreign affiliates and their financial results are not consolidated with our financial results.
In Alaska, we operate a fixed based operation (“FBO”) at Ted Stevens Anchorage International Airport, leasing storage space and selling fuel and other services to a diverse group of general aviation companies and large corporations. In addition, we operate light and medium helicopters on the North Slope and around Prudhoe Bay in support of oil and gas exploration, development and production activities and inland in support of firefighting and utility activities. We also operate light helicopters in a flightseeing operation, primarily in support of the cruise line industry providing passengers with glacier and dog-sled tours from Juneau and Denali.
We provide a number of additional services through joint ventures that complement our core chartering and dry-leasing activities. We hold a 50% interest in our Dart Holding Company Ltd. (“Dart”) joint venture, which is a sales and manufacturing organization based in Canada that engineers and manufactures after-market helicopter parts and accessories for sale to helicopter manufacturers and operators and distributes parts and accessories on behalf of other manufacturers. We also hold a 50% interest in Era Training Center LLC (“Era Training”), a joint venture based in Lake Charles, Louisiana, that provides instruction, flight simulator and other training to our employees, pilots working for third parties, other helicopter companies, including our competitors, and government agencies.
Era Group’s principal executive office is located at 818 Town & Country Blvd., Suite 200, Houston, Texas 77024, and its telephone number is (281) 606-4900. Era Group’s website address is
www.eragroupinc.com
. The reference to Era Group’s website is not intended to incorporate the information on the website into this Annual Report on Form 10-K.
2
Spin-Off
On January 31, 2013, SEACOR Holdings Inc. (“SEACOR”) completed the spin-off (“Spin-off”) of the Company by means of a dividend to SEACOR’s stockholders of all of the Company’s issued and outstanding Common Stock. Prior to the Spin-off, SEACOR and the Company entered into a distribution agreement and several other agreements that govern their post-Spin-off relationship. Era Group is now an independent company with its Common Stock listed on the New York Stock Exchange under the symbol “ERA.”
Emerging Growth Company
We are an “Emerging Growth Company,” as defined in the Jumpstart Our Business Startups Act (the “JOBS Act”), and are eligible to take advantage of certain exemptions from various reporting requirements that are applicable to other public companies that are not “Emerging Growth Companies.” These include, but are not limited to, not being required to comply with the auditor attestation requirements of Section 404 of the Sarbanes-Oxley Act of 2002, reduced disclosure obligations regarding executive compensation in our periodic reports and proxy statements, and exemptions from the requirements of holding a non-binding advisory vote on executive compensation and obtaining stockholder approval of any golden parachute payments not previously approved.
Segment and Geographic Information
The Company has determined that its operations comprise a single segment. Helicopters are highly mobile and may be utilized in any of the Company’s service lines as business needs dictate. The Company provides helicopters under contracts ranging from dry-leases, where only the helicopter is provided, to contracts providing full service operational support. Financial data for geographic areas is reported in Note 16 “Segment Information, Major Customers and Geographical Data” of
the Notes to the Consolidated Financial Statements in Item 8 of
this Annual Report on Form 10-K.
Our Strategy
Our goal is to be a premier global provider of helicopter transport and related services. The following are potential opportunities which we regularly review:
Expand into new and growing geographic markets—
We believe there are significant opportunities in offshore oil and gas markets outside of the U.S., and we continually seek to access these growth markets. In July 2011, we acquired an interest in Aeróleo Taxi Aereo S/A (“Aeróleo”), a Brazilian company servicing the Brazilian offshore oil and gas industry and to which we dry-lease helicopters and provide support services. Throughout 2013, we operated an AW139 medium helicopter for customers in Uruguay. We also have working relationships with operators in Asia, Australia and Europe. We believe that several of these markets are underserved by larger multinational helicopter operators and, as a result, provide us with opportunities for growth.
Further develop dry-leasing opportunities—
We believe dry-leasing helps to provide a source of revenues and cash flow and access to emerging, international oil and gas markets. We believe customers look to us for helicopter dry-leasing because of our modern fleet, with a selection of helicopter models to meet their needs, and our ability to provide related services, such as training and maintenance support. We intend to continue to develop and grow our participation in international markets where the fundamentals for helicopter demand are favorable, particularly to service offshore deepwater installations and new areas of exploration. We believe that the market for dry-leasing will continue to grow as smaller operators in developing areas prefer the limited financial commitments of leasing equipment over purchasing.
Continue to expand and upgrade our versatile fleet—
We regularly review our asset portfolio by assessing market conditions and changes in our customers’ demand for different helicopter models. We buy, sell and lease out equipment in the ordinary course of our business. As offshore oil and gas drilling and production move to deeper water in most parts of the world, we believe more heavy and medium helicopters may be required in the future. We believe our strong relationships with the original equipment manufacturers (“OEMs”) will help us maintain an asset base suitable for use within our own operations and for dry-leasing to other operators. In addition, we intend to continue to pursue opportunities to realize value from our fleet's versatility by shifting assets between markets when circumstances warrant.
Continue to selectively diversify sources of earnings and cash flow—
Where attractive opportunities exist, we seek to diversify into related markets. One of our joint ventures, Dart, engineers and manufactures after-market helicopter parts and accessories for sale to helicopter manufacturers and operators and distributes parts and accessories on behalf of other manufacturers. Another joint venture, Era Training, provides instruction, flight simulator and other training to our employees, pilots working for other helicopter operators, including our competitors, and government agencies.
Pursue joint ventures and strategic acquisitions—
Over the last few years, in addition to expanding and diversifying our fleet, we have grown our business and entered new markets through joint ventures. Since 2004, we have entered into six joint ventures and partnering arrangements, including Aeróleo, Dart, Era Do Brazil LLC, Era Training, Heli-Union Era Australia Pty Ltd. and Lake Palma S.L. (“Lake Palma”). We regularly seek to identify potential joint venture opportunities, as well as pursue strategic acquisitions when available.
We will continue to build upon the expertise, relationships and buying power in our operating businesses to develop other business opportunities and sources of revenue.
3
Equipment and Services
We own and operate three classes of helicopters:
|
•
|
Heavy
helicopters, which have twin engines and a typical passenger capacity of 16 to 19, are primarily used in support of the deepwater offshore oil and gas industry, frequently in harsh environments or in areas with long distances from shore, such as those in the U.S. Gulf of Mexico, Brazil, Australia and the North Sea. Heavy helicopters are also used to support search and rescue operations.
|
|
•
|
Medium
helicopters, which mostly have twin engines and a typical passenger capacity of 11 to 12, are primarily used to support the offshore oil and gas industry, search and rescue services, air medical services, firefighting activities and corporate uses.
|
|
•
|
Light
helicopters, which may have single or twin engines and a typical passenger capacity of five to nine, are used to support a wide range of activities, including the shallow water oil and gas industry, the mining industry, power line and pipeline surveying, air medical services, tourism and corporate uses.
|
As of
December 31, 2013
, we owned or operated a total of
165
helicopters, consisting of
nine
heavy helicopters,
61
medium helicopters,
36
light twin engine helicopters and
59
light single engine helicopters. In addition, we had two AW139 helicopters which were fully paid for in 2013 but not delivered and operational until 2014. As of
December 31, 2013
, we had commitments to purchase an additional
21
new helicopters consisting of
ten
AW189 heavy helicopters, four S92 heavy helicopters,
two
AW139 medium helicopters and
five
AW169 light twin helicopters. The AW139 helicopters are scheduled to be delivered in 2014. The AW189 helicopters are scheduled to be delivered beginning 2014 through 2017. The S92 helicopters are scheduled to be delivered in 2016 and 2017. Delivery dates for the AW169 helicopters have yet to be determined. In addition, we had outstanding options to purchase up to an additional ten AW189 helicopters, five S92 helicopters and four AW139 helicopters. If these options were exercised, the helicopters would be delivered beginning in 2014 through 2018.
As of
December 31, 2013
,
124
helicopters were located in the United States and
41
were located in foreign jurisdictions.
The following table identifies the types of helicopters that comprise our fleet and the number of those helicopters in our fleet as of
December 31, 2013
. “Owned” are those helicopters owned by us. “Joint Ventured” are those helicopters owned by entities in which we have an interest of 50% or less. “Leased-in” are those helicopters leased-in under operating leases. “Managed” are those helicopters that are owned by non-affiliated entities and operated by us for a fee.
4
|
Owned
(1)
|
Joint
Ventured
|
Leased-in
|
Managed
|
Total
|
Max.
Pass.
(2)
|
Cruise
Speed
(mph)
|
Approx.
Range
(miles)
|
Average
Age
(3)
(years)
|
|||||||||||||||||||
|
As of December 31, 2013
|
|||||||||||||||||||||||||||
|
Heavy:
|
|||||||||||||||||||||||||||
|
EC225
|
9
|
|
—
|
|
—
|
|
—
|
|
9
|
|
19
|
|
162
|
|
582
|
|
4
|
|
|||||||||
|
Medium:
|
|||||||||||||||||||||||||||
|
AW139
|
34
|
|
1
|
|
—
|
|
—
|
|
35
|
|
12
|
|
173
|
|
426
|
|
4
|
|
|||||||||
|
B212
|
11
|
|
—
|
|
—
|
|
—
|
|
11
|
|
11
|
|
115
|
|
299
|
|
35
|
|
|||||||||
|
B412
|
6
|
|
—
|
|
—
|
|
—
|
|
6
|
|
11
|
|
138
|
|
352
|
|
32
|
|
|||||||||
|
S76 A/A++
|
3
|
|
—
|
|
|
|
—
|
|
3
|
|
12
|
|
155
|
|
348
|
|
27
|
|
|||||||||
|
S76 C+/C++
|
5
|
|
—
|
|
—
|
|
1
|
|
6
|
|
12
|
|
161
|
|
348
|
|
7
|
|
|||||||||
|
59
|
|
1
|
|
—
|
|
1
|
|
61
|
|
||||||||||||||||||
|
Light—twin engine:
|
|||||||||||||||||||||||||||
|
A109
|
7
|
|
—
|
|
—
|
|
2
|
|
9
|
|
7
|
|
161
|
|
405
|
|
8
|
|
|||||||||
|
BK-117
|
—
|
|
—
|
|
2
|
|
1
|
|
3
|
|
9
|
|
150
|
|
336
|
|
N/A
|
|
|||||||||
|
EC135
|
17
|
|
—
|
|
2
|
|
1
|
|
20
|
|
7
|
|
138
|
|
288
|
|
5
|
|
|||||||||
|
EC145
|
3
|
|
—
|
|
—
|
|
1
|
|
4
|
|
9
|
|
150
|
|
336
|
|
5
|
|
|||||||||
|
27
|
|
—
|
|
4
|
|
5
|
|
36
|
|
||||||||||||||||||
|
Light—single engine:
|
|||||||||||||||||||||||||||
|
A119
|
17
|
|
7
|
|
—
|
|
—
|
|
24
|
|
7
|
|
161
|
|
270
|
|
7
|
|
|||||||||
|
AS350
|
35
|
|
—
|
|
—
|
|
—
|
|
35
|
|
5
|
|
138
|
|
361
|
|
17
|
|
|||||||||
|
52
|
|
7
|
|
—
|
|
—
|
|
59
|
|
||||||||||||||||||
|
Total Fleet
|
147
|
|
8
|
|
4
|
|
6
|
|
165
|
|
12
|
|
|||||||||||||||
|
(1)
|
Excludes two AW139 helicopters which were fully paid for in 2013 but not delivered and operational until 2014. Includes one S76A medium helicopter that was sold subsequent to December 31, 2013.
|
|
(2)
|
In typical configuration for our operations.
|
|
(3)
|
Reflects the average age of helicopters that are owned by us.
|
The management of our global helicopters involves a careful evaluation of the expected demand for helicopter services across global oil and gas markets, including the type of helicopter needed to meet this demand. As offshore oil and gas drilling and production globally moves to deeper water, more heavy and medium helicopters and newer technology helicopters may be required. Our orders and options to purchase helicopters are primarily for heavy and medium helicopters. These capital commitments reflect our effort to meet customer demand for helicopters suitable for the deepwater market.
Heavy and medium helicopters fly longer distances at higher speeds and can carry heavier payloads than light helicopters and are usually equipped with sophisticated avionics permitting them to operate in more demanding weather conditions and difficult climates. Heavy and medium helicopters are most commonly used for crew changes on large offshore production facilities and drilling rigs servicing the oil and gas industry. They are the preferred helicopters in international offshore markets, where facilities tend to be larger, the drilling locations more remote, and onshore infrastructure more limited.
In the U.S., we provide and operate helicopters under contracts using a Federal Aviation Administration (“FAA”) issued Part 135 Air Operator’s Certificate (“AOC”) for a variety of activities, primarily offshore oil and gas exploration, development and production, air medical services, firefighting, flightseeing tours, and emergency response search and rescue. For operating contracts, we are required to provide a complete support package including flight crews, helicopter maintenance and management of flight operations.
In international markets, our helicopters are typically operated using another operator’s AOC, frequently through dry-leases under which our customers handle all the operational support. Certain other international contracts require us to provide more limited operational support, which typically consists of pilot training and/or helicopter maintenance.
5
Markets
Our current principal markets for our transportation and search and rescue services to the offshore oil and gas exploration, development and production industry are in the U.S. Gulf of Mexico and Alaska. In addition, we currently conduct our international activities in support of oil and gas exploration, development and production activity, primarily in Brazil and other parts of Latin America, Europe and Asia.
U.S. Markets.
We are one of the largest suppliers of helicopter services in the U.S. Gulf of Mexico, where we operate from 15 bases.
Our client base in the U.S. Gulf of Mexico mostly consists of international, independent and major integrated oil and gas companies. The U.S. Gulf of Mexico is a major offshore oil and gas producing region and the largest oil and gas aviation market in the world. According to PFC Energy in its November 2013 Oil and Gas Helicopter Market Outlook, the U.S. Gulf of Mexico has over 3,000 production platforms, of which approximately 2,000 have helipads and approximately 1,000 are manned. The deepwater platforms are serviced by heavy and medium helicopters. The shallow water platforms are typically unmanned and are serviced by light helicopters. Among our strengths in this region, in addition to our 15 operating bases, are our advanced proprietary flight-following systems, our Era Training services, our maintenance operations and our search and rescue services.
We have six operating bases in Alaska, where we provide support for independent and major integrated oil and gas companies. In addition to supporting oil company activities in the Cook Inlet and along the North Slope of Alaska, we operate a FBO at Ted Stevens Anchorage International Airport, provide summer flightseeing tours and support inland firefighting and mining operations. Despite the remote location of our Alaskan bases, they are strategically located to provide services to our customers. These bases frequently include crew accommodations, hangars and fuel systems, all of which can be otherwise difficult or expensive to secure and maintain in such remote locations.
Our air medical services operations are primarily located in the northeastern U.S. and Florida.
International Markets.
We currently conduct our international activities in Brazil and other parts of Latin America, Europe and Asia. We actively market our services globally. The following is a description of our international activities.
|
•
|
Brazil and Latin America—Brazil has one of the largest deepwater offshore exploration and production areas in the world. We hold a 50% economic interest and 20% voting interest in Aeróleo, which we acquired in July 2011. Aeróleo was founded in 1968 to provide logistical air support to the Brazilian oil and gas industry and has been active mainly in the Campos Basin, the largest offshore oilfield area in Brazil. Aeróleo has a network of three operating bases distributed strategically in Brazil. As of
December 31, 2013
, Aeróleo had a fleet of 12 helicopters, including three EC225 helicopters and nine AW139 helicopters that we dry-lease to Aeróleo. Aeróleo's main customers are Petroleo Brasileiro S.A. (“Petrobras Brazil”), Queiroz Galvão S/A, Repsol Brazil, S.A. and Saipem do Brasil Lda. Since the acquisition of our interest in Aeróleo, Aeróleo has experienced financial difficulties. Refer to Item 7 of Part II—“Management's Discussion and Analysis of Financial Condition and Results of Operation—Offshore Oil and Gas Support” and “—Dry-Leasing” and Item 1A—“Risk Factors—We rely on relatively few customers for a significant share of our revenues, the loss of any of which could adversely affect our business, financial condition and results of operations” for additional information. We also dry-leased helicopters in Mexico to service the offshore oil and gas industry in the last fiscal year and intend on remaining active in this region in the future.
|
|
•
|
Europe—We dry-lease helicopters and provide logistics and spare parts support to numerous operators in Europe. These helicopters are used in Norway, Spain, Sweden and the United Kingdom by operators providing search and rescue services, firefighting operations and oil and gas exploration and production support. We also hold a 51% interest in Lake Palma, a joint venture that leases helicopters to FAASA, a firefighting operator based in Spain.
|
|
•
|
Asia—In India, we dry-lease helicopters and provide logistics and spare parts support to an operator in the oil and gas industry.
|
Demand for helicopters in support of offshore oil and gas exploration, development and production, both in the U.S. and internationally, is affected by the level of offshore exploration and drilling activities, which in turn is influenced by a number of factors, including:
|
•
|
expectations as to future oil and gas commodity prices;
|
|
•
|
customer assessments of offshore drilling prospects compared with land-based opportunities;
|
|
•
|
customer assessments of cost, geological opportunity and political stability in host countries;
|
|
•
|
worldwide demand for oil and natural gas;
|
6
|
•
|
the ability of The Organization of Petroleum Exporting Countries (“OPEC”) to set and maintain production levels and pricing;
|
|
•
|
the level of production of non-OPEC countries;
|
|
•
|
the relative exchange rates for the U.S. dollar; and
|
|
•
|
various U.S. and international government policies regarding exploration and development of oil and gas reserves.
|
Seasonality
A significant portion of our operating revenues and profits related to oil and gas industry activity is dependent on actual flight hours. The fall and winter months have fewer hours of daylight, particularly in Alaska and the North Sea, and flight hours are generally lower at these times. In addition, prolonged periods of adverse weather in the fall and winter months, coupled with the effect of fewer hours of daylight, can adversely impact operating results. In general, the months of December through February in the U.S. Gulf of Mexico and October through April in Alaska have more days of adverse weather conditions than the other months of the year. In the U.S. Gulf of Mexico, June through November is tropical storm season. During a tropical storm, we are unable to operate in the area of the storm. However, flight activity may increase immediately before and after a storm due to the evacuation and return of offshore workers. The Alaska flightseeing operation is also seasonal with activity occurring only from late May until early September. There is less seasonality in our dry-leasing and air medical activities.
Customers and Contractual Arrangements
Our principal customers in the U.S. Gulf of Mexico are major integrated and independent exploration and production companies and U.S. government agencies, primarily the Bureau of Safety and Environmental Enforcement (“BSEE”). We provide helicopters to BSEE under contract and provide services including the provision of flight crews, helicopter maintenance and management of flight operations. In Alaska, our principal customers are oil and gas companies, mining companies and cruise line passengers. Internationally, we typically dry-lease helicopters to local helicopter companies that operate our helicopters under their operating certificates and retain the operating risk. These companies in turn provide helicopter transportation services to oil and gas companies, firefighting operators and governmental agencies. As of
December 31, 2013
, approximately 24% of our helicopters were utilized in support of these dry-leasing activities.
During the year ended
December 31, 2013
, our top ten customers accounted for 64% of total revenues. In 2013 and 2012, Anadarko and U.S. government agencies each accounted for 10% or more of our total revenues. In 2011, Anadarko and Aeróleo each accounted for 10% or more of our total revenues.
We charter the majority of our helicopters primarily through master service agreements, subscription agreements, day-to-day charter arrangements and dry-leases. Master service agreements and subscription agreements typically require a fixed monthly fee plus incremental payments based on flight hours flown. These agreements have fixed terms ranging from one month to five years and generally may be canceled upon 30 days’ notice. Day-to-day charter arrangements call for either a combination of a daily fixed fee plus a charge based on hours flown or an hourly rate with a minimum number of hours to be charged. Dry-leases generally run from two to five years with no early cancellation provisions. Services provided under dry-leases can include only the equipment or can include the equipment plus logistical and maintenance support. The rate structure, as it applies to our oil and gas contracts, typically contains terms that limit our exposure to increases in fuel costs over a pre-agreed level. Fuel costs in excess of these levels are passed through to customers.
Air medical services are provided under contracts with hospitals that typically include a fixed monthly and hourly rate structure.
With respect to flightseeing helicopters, block space is allocated to cruise lines and seats are sold directly to customers. Our FBO sells fuel on an ad-hoc basis. Training revenues are charged at a set rate per training course and include instructors, training materials and flight or flight simulator time, as applicable.
Competitive Conditions
The helicopter industry is highly competitive. There are, however, factors that provide advantages and in some instances barriers to entry, particularly customer certification and access to appropriate facilities in strategic locations. Customers tend to rely heavily on existing relationships and seek operators with established safety records and knowledge of the operating environment.
We are one of the largest helicopter companies operating in the U.S. Gulf of Mexico and one of the largest operating in Alaska. In the U.S. Gulf of Mexico, we have many competitors, the three largest being Bristow Group Inc. (“Bristow”), PHI, Inc. and Rotorcraft Leasing Company LLC. Some oil and gas customers in the U.S. Gulf of Mexico operate their own helicopter fleets in addition to smaller companies that offer services similar to ours. In Alaska, we compete against a large number of operators including Erickson Air-Crane, Inc. and PHI, Inc. In international markets, there could be several major competitors depending on th
7
e region. Our primary competitors in Brazil consist of Lider Aviação Holding S.A., OMNI Táxi Aéreo Ltda., and Brazilian Helicopter Services Taxi Aéreo Ltda.
In air medical services, there are several major competitors with fleets dedicated to air medical operations including Air Methods Corporation, PHI, Inc. and Air Medical Group Holdings. We compete against national and regional firms, and there is usually more than one competitor in each local market. In addition, we compete against hospitals that operate their own helicopters and, in some cases, against ground ambulances.
In most instances, an operator must have an acceptable safety record, demonstrated reliability and suitable equipment to bid for work. Among bidders meeting these criteria, customers typically make their final choice based on price and helicopter preference.
Our dry-leasing business competes against financial leasing companies such as Element Financial Corp., Lease Corporation International (Aviation) Limited, Macquarie Rotocraft Leasing, Milestone Aviation Group and Waypoint Leasing.
Risks of Foreign Operations
We have activities worldwide and for the years ended December 31, 2013, 2012 and 2011, 18%, 22%, and 28%, respectively, of our operating revenues were derived from foreign activities.
Foreign operations are subject to inherent risks, which, if they materialize, could have a material adverse effect on our financial position and our results of operations. See the risk factor regarding “We are subject to risks associated with our international operations” in “Item 1A. Risk Factors.”
Government Regulation
Regulatory Matters
Our operations are subject to significant federal, state and local regulations in the United States, as well as international treaties and conventions and the laws of foreign jurisdictions where we operate our equipment or where the equipment is registered or operated. We hold the status of an air carrier under the relevant provisions of Title 49 of the United States Transportation Code and engage in the operating and dry-leasing of helicopters in the U.S. and, as such, we are subject to various statutes and regulations. We are governed principally by: (i) the regulations of the United States Department of Transportation (“DOT”), including Part 298 registration as an On-Demand Air Taxi Operator; and (ii) the regulations of the FAA applicable to an FAA Part 135 Air Taxi certificate holder. Among other things, the DOT regulates our status as an air carrier, including our U.S. citizenship. The FAA regulates our flight operations and, in this respect, has jurisdiction over our personnel, helicopters, ground facilities and certain technical aspects of our operations. In addition to the FAA, the National Transportation Safety Board is authorized to investigate our helicopter accidents and to recommend improved safety standards. We are also subject to the Communications Act of 1934, as amended, because of the use of radio facilities in our operations. Our FBO in Alaska is further subject to the oversight of the Anchorage International Airport.
Helicopters operating in the U.S. are subject to registration and their owners are subject to citizenship requirements under the Federal Aviation Act. This Act generally requires that before a helicopter may be legally operated in the U.S., it must be owned by “citizens of the U.S.,” which, in the case of a corporation, means a corporation: (i) organized under the laws of the U.S. or of a state, territory or possession thereof, (ii) of which at least 75% of its voting interests are owned or controlled by persons who are “U.S. citizens” (as defined in the Federal Aviation Act and regulations promulgated thereunder), and (iii) of which the president and at least two-thirds of the board of directors and managing officers are U.S. citizens.
We also are subject to state and local regulations including, but not limited to, significant state regulations for our air medical services and search and rescue operations. In addition, our international operations, primarily helicopter dry-leasing and our joint ventures, are required to comply with the laws and regulations in the jurisdictions in which they conduct business.
Environmental Compliance
Our business is subject to federal, state, local and international laws and regulations relating to environmental protection and occupational safety and health, including laws that govern the discharge of oil and pollutants into navigable waters. Such laws include the federal Water Pollution Control Act, also known as the Clean Water Act, which imposes restrictions on the discharge of pollutants to the navigable waters of the U.S. We are also subject to the Coastal Zone Management Act, which authorizes state development and implementation of certain programs to manage water pollution to restore and protect coastal waters. In addition, because our operations generate and, in some cases, involve the transportation of hazardous wastes, we are subject to the Federal Resource Conservation and Recovery Act, which regulates the use, generation, transportation, treatment, storage and disposal of hazardous and certain non-hazardous wastes. Violations of these laws, along with comparable state and local laws, may result in civil and criminal penalties, fines, injunctions or other sanctions. We are also subject to the Comprehensive Environmental Response, Compensation and Liability Act and certain comparable state laws, which establish strict and, under certain circumstances, joint and several liabilities for specified parties in connection with liability for the investigation and remediation
8
of releases of hazardous materials into the environment and damages to natural resources. Such liability can arise even as a result of conduct that was lawful at the time it occurred or the conduct of, or conditions caused by, prior operators or third parties.
In addition, our customers in the oil and gas exploration, development and production industry are affected by environmental laws and regulations, which have recently become stricter as a result of the
Deepwater Horizon
matter, that restrict their activities and may result in reduced demand for our services.
We believe that our operations are currently in material compliance with all environmental laws and regulations. We do not expect that we will be required to make capital expenditures in the near future that are material to our financial position or operations to comply with environmental laws and regulations; however, because such laws and regulations are frequently changing and may impose stricter requirements, we cannot predict the ultimate cost of complying with these laws and regulations. The recent trend in environmental legislation and regulation is generally toward stricter standards, and it is our view that this trend is likely to continue.
We manage exposure to losses from the above-described laws through our efforts to use only well-maintained, well-managed and well-equipped facilities and equipment and our development of safety and environmental programs, including our insurance program. We believe these efforts will be able to accommodate all reasonably foreseeable environmental regulatory changes. There can be no assurance, however, that any future laws, regulations or requirements or that any discharge or emission of pollutants by us will not have a material adverse effect on our business, financial position or our results of operations.
Safety, Industry Hazards and Insurance
The safety of our passengers and the maintenance of a safe working environment for our employees is our number one operational priority. Our customers subject our operations to regular audits and evaluate us based on our safety record and operational fitness, and we believe our attention to safety is a critical element in obtaining and retaining customers.
We are committed to safety, and we continually strive to provide safe, reliable and cost-efficient services. As an industry leader, we also look to provide innovative improvements to the overall safety environment in the markets in which we operate. In response to the U.S. Gulf of Mexico’s unique conditions, including limited radio coverage and rapidly changing weather conditions, we established an in-house VHF radio network and offshore weather stations and contributed to the introduction of SATCOM/GPS navigation equipment. These efforts culminated in our receiving industry and FAA recognition for our efforts as a major contributor to the success of the FAA’s Automated Dependent Surveillance-Broadcast (ADS-B) system. This system greatly improves safety through enhanced flight following, communications and weather reporting. We were the first helicopter operator in Alaska to receive approval for Airborne Radar Approaches.
We believe we have an excellent safety record and a strong safety culture throughout our organization. We have implemented a safety program that includes, among many other features, (i) transition and recurrent training using flight training devices, (ii) an FAA approved flight operational quality assurance program and (iii) health and usage monitoring systems, otherwise known as HUMS, which automatically monitor and report on vibrations and other anomalies on key components of certain helicopters in our fleet.
In early 2007, we became the first Part 135 helicopter operator in the U.S. to receive FAA approval for our Flight Operations Quality Assurance program. This system monitors a number of flight parameters and flags any diversions from accepted flight profiles. We are also committed to equipping our fleet with HUMS which can detect wear and tear on helicopter components before they reach unserviceable condition.
Helicopter operations are potentially hazardous and may result in incidents or accidents. Hazards include adverse weather conditions, collisions, fire and mechanical failures, which may result in death or injury to personnel, damage to equipment, loss of operating revenues, contamination of cargo, pollution and other environmental damages and increased costs. We maintain aviation hull, liability and war risk, general liability, workers compensation and other insurance customary in the industry in which we operate. We also conduct training and safety programs to promote a safe working environment and minimize hazards.
Employees
As of
December 31, 2013
, we employed 875 individuals, including 286 pilots and 243 mechanics. We consider relations with our employees to be good. None of our employees are covered by collective bargaining agreements.
9
Where you can find more information
We are required to file annual, quarterly and current reports, proxy statements and other information with t
he U.S. Securities and Exchange Commission (“SEC”). Unless otherwise stated herein, these filings are not deemed to be incorporated by reference in this report. All of the Company’s filings with the SEC will be available once filed, free of charge, on Era Group
’s website, including its Annual Reports on Form 10-K, Quarterly Reports on Form 10-Q, Current Reports on Form 8-K, Proxy Statements and any amendments to those reports. These reports and amendments will be available on Era Group’s website as soon as reasonably practicable after the Company electronically files the reports or amendments with the SEC. The reference to Era Group's website is not intended to incorporate the information on the website into this Annual Report on Form 10-K. They will also be available at the SEC’s Public Reference Room at 100 F Street, N.E., Washington, D.C. 20549. Information as to the operation of the SEC’s Public Reference Room can be obtained by calling the SEC at 1-800-SEC-0330. The SEC maintains a website (www.sec.gov) that contains reports, proxy and information statements and other information. In addition, the Company’s Corporate Governance and other policies, and the Board of Directors’ Audit Committee, Compensation Committee and Nominating and Corporate Governance Committee charters are available, free of charge, on Era Group’s website or in print for stockholders.
10
|
ITEM 1A.
|
RISK FACTORS
|
Our results of operations, financial condition and cash flow may be adversely affected by numerous risks. Carefully consider the risks described below, which represent some of the more critical risk factors that affect us, as well as the other information that has been provided in this Annual Report on Form 10-K. Additional risks not described below may also impair our business operations.
Risks Related to Our Business and Industry
Demand for many of our services is impacted by the level of activity in the offshore oil and gas exploration, development and production industry.
In the years ended
December 31, 2013
and 2012, approximately
75%
and
65%
, respectively, of our operating revenues were generated by the provision of helicopter services, including search and rescue services, to companies primarily engaged in offshore oil and gas exploration, development and production activities. Demand for our services and our results of operations are significantly impacted by levels of activity in those sectors. These levels of activity have historically been volatile. This volatility is likely to continue in future periods. The level of offshore oil and natural gas exploration, development and production activity is not only likely to be volatile, but it is also subject to factors beyond our control, including:
|
•
|
general economic conditions;
|
|
•
|
prevailing oil and natural gas prices and expectations about future prices and price volatility;
|
|
•
|
assessments of offshore drilling prospects compared with land-based opportunities;
|
|
•
|
the cost of exploring for, producing and delivering oil and natural gas offshore;
|
|
•
|
worldwide demand for energy, petroleum products and chemical products;
|
|
•
|
availability and rate of discovery of new oil and natural gas reserves in offshore areas;
|
|
•
|
federal, state, local and international political conditions, and policies including cabotage, local content, exploration and development of oil and gas reserves;
|
|
•
|
technological advancements affecting exploration, development, energy production and consumption;
|
|
•
|
weather conditions;
|
|
•
|
environmental regulation;
|
|
•
|
regulation of drilling activities and the availability of drilling permits and concessions; and
|
|
•
|
the ability of oil and natural gas companies to generate or otherwise obtain funds for offshore oil and gas exploration, development and production.
|
We are in a cyclical business.
Our industry has historically been cyclical and is affected by the volatility of oil and gas price levels, fluctuations in government programs and spending and general economic conditions. Changes in commodity prices can have a significant effect on demand for our services, and periods of low activity intensify price competition in the industry and often result in our helicopters being idle for long periods of time. A prolonged significant downturn in oil and natural gas prices, or increased regulation containing onerous compliance requirements, are likely to cause a substantial decline in expenditures for exploration, development and production activity, which would result in a decline in demand and lower rates for our services. Similarly, the government agencies with which we do business could face budget cuts or limit spending, which would also result in a decline in demand and lower rates for our services. These changes could adversely affect our business, financial condition and results of operations.
We are highly dependent upon the level of activity in the U.S. Gulf of Mexico and Alaska, which are mature exploration and production regions.
In the years ended
December 31, 2013
and 2012, our operating revenues derived from helicopter services provided to clients primarily involved in oil and gas activities in the U.S. Gulf of Mexico and Alaska, represented approximately
60%
and
13%
, respectively, and
56%
and 9%, respectively, of our total operating revenues. The U.S. Gulf of Mexico and Alaska are mature exploration and production regions that have undergone substantial seismic survey and exploration activity for many years. Because a large number of oil and gas properties in these regions have already been drilled, additional prospects of sufficient size and quality could be more difficult to identify. We believe that the production from these mature oil and gas properties is declining and that the future production may decline to the point that such properties are no longer economically viable to operate, in which case, our services with respect to such properties will no longer be needed. Oil and gas companies may not identify sufficient additional drilling sites to replace those that become depleted. If activity in oil and gas exploration, development and production
11
in either the U.S. Gulf of Mexico or Alaska materially declines, our business, financial condition and results of operations could be materially and adversely affected. We cannot predict the levels of activity in these areas.
Operational risks including, but not limited to, equipment failure and negligence could adversely impact our results of operations and in some instances, expose us to liability. These risks may not be covered by our insurance or our insurance may be inadequate to protect us from the liabilities that could arise.
The operation of helicopters is subject to various risks, including catastrophic disasters, crashes, adverse weather conditions, mechanical failures and collisions, which may result in loss of life, personal injury and/or damage to property and equipment. Our helicopters have been involved in accidents in the past, some of which included loss of life, personal injury and property damage. We, or third parties operating our helicopters, may experience accidents in the future. These risks could endanger the safety of both our own and our customers' personnel, equipment, cargo and other property, as well as the environment. If any of these events were to occur with equipment that we operate or dry-lease to third parties, we could experience loss of revenues, termination of charter contracts, higher insurance rates, and damage to our reputation and customer relationships. In addition, to the extent an accident occurs with a helicopter we operate, we could be held liable for resulting damages. The occurrence of any such incident could have a material adverse effect on our operations and financial condition.
Certain models of helicopters that we operate have also experienced accidents while operated by third parties. If other operators experience accidents with helicopter models that we operate or dry-lease, obligating us to take such helicopters out of service until the cause of the accident is rectified, we would lose revenues and might lose customers. In addition, safety issues experienced by a particular model of helicopter could result in customers refusing to use that particular helicopter model or a regulatory body grounding that particular helicopter model. The value of the helicopter model might also be permanently reduced in the market if the model were to be considered less desirable for future service.
For instance, there have been three accidents involving the EC225 helicopter, including two ditchings, that led major global operators to indefinitely suspend EC225 helicopter operations in October 2012. One of the helicopters was under dry-lease from us to one of our customers, while the other two were owned and operated by parties unrelated to us. Airbus Helicopters (formerly Eurocopter), a division of European Aeronautic Defense and Space Company and manufacturer of the EC225 helicopter, through an internal investigation identified the root cause of the EC225 helicopter service failures and implemented engineering solutions, prevention and detection measures to remedy the matters that led to the suspension. In July 2013, the European Aviation Safety Agency (EASA) regulatory authority approved these measures, resulting in the United Kingdom Civil Aviation Authority and the Civil Aviation Authority of Norway lifting operational restrictions. These measures and related regulatory approvals facilitated the return to service of the EC225 helicopter thereafter on a worldwide basis.
We continued to earn revenues associated with our EC225 helicopters during the suspension under dry-leases; however, as discussed in the next paragraph, one of our lessee’s customers attempted to suspend its payment obligations. We did not collect hourly revenues on our EC225 helicopters during the suspension since the helicopters were not flying. We did earn revenue on the medium helicopters used to replace the EC225 helicopters in support of these customer contract obligations.
Our Brazilian joint venture, Aeróleo, experienced financial difficulties resulting from an incident with an AW139 helicopter operated by a competitor followed by the extended global suspension of the EC225 helicopter. In July 2011, Aeróleo received notice that it was successful in its bid to place four AW139 helicopters on contract with Petrobras Brazil and in turn entered into dry-leases with us for the helicopters and mobilized them to Brazil. In August 2011, Petrobras Brazil canceled the award in response to an accident involving an AW139 helicopter on contract with Petrobras Brazil from one of Aeróleo's competitors. As a result, the four AW139 helicopters under dry-lease to Aeróleo were idle from August 2011 until late November 2012. Due to resulting liquidity issues experienced by Aeróleo, we, together with our partner, contributed $9.2 million of shareholder debt to Aeróleo in September 2012, to enable it to continue operations. In November 2012, in response to an emergency tender issued by Petrobras Brazil as a result of the above noted suspension of use of EC225 helicopters, Aeróleo executed contracts with Petrobras Brazil and it began utilizing these four AW139 helicopters until termination of the contract on November 30, 2013. These AW139 helicopters are scheduled to begin multi-year contracts with Petrobras Brazil commencing in October 2014, but are not currently under contract following the termination of the emergency tender contract. Aeróleo dry-leases three EC225 helicopters from us which are, in turn, on contract with Petrobras Brazil. Following the suspension of the use of the EC225 helicopters in late October 2012, Petrobras Brazil continued to pay the full contracted monthly rate until Petrobras Brazil attempted to unilaterally suspend its EC225 helicopter contracts with Aeróleo and the other helicopter operators in Brazil for the duration of the suspension of the use of the EC225 helicopters commencing April 2013, alleging that the helicopter could not meet the terms of the contract. Two other competitors in Brazil have a total of nine EC225 helicopters on contract with Petrobras Brazil. Aeróleo did not receive monthly payments for its EC225 helicopters under contract with Petrobras Brazil from April through late September and October, 2013 and commenced generating hourly flight revenues thereafter upon the resumption of Aeróleo’s EC225 helicopters flight operations for Petrobras Brazil. As of December 31, 2013, we had deferred the recognition of $21.0 million of revenues owed to us by Aeróleo. Should Aeróleo be unable to fully recover the amount of the suspended payments or encounter any additional financial challenges, it may impede Aeróleo’s ability to pay for the equipment leased from us, necessitate an infusion of capital to allow Aeróleo to operate and adversely impact our results of operations.
12
Even if an incident with a particular model of helicopter does not result in the grounding of the helicopter model by applicable governmental regulatory and safety agencies or a decision by operators to pull the model from service, we may not be able to use such helicopter model for other reasons such as loss in confidence for the model by our customers, their employees or the unions to which our or our customer's employees belong.
We carry insurance, including hull and liability, liability and war risk, general liability, workers’ compensation, and other insurance customary in the industry in which we operate. Our insurance coverage is subject to deductibles and maximum coverage amounts. Our insurance policies are also subject to compliance with certain conditions, the failure of which could lead to a denial of coverage as to a particular claim or the voiding of a particular insurance policy. The amount of insurance coverage we are able to maintain may be inadequate to cover all potential liabilities or the total amount of insured claims and liabilities. Even in cases where insurance covers the costs of repair due to damage to a helicopter, there may be diminution in the value of the helicopter as result of its being less desirable for future service that is likely not covered by insurance. We cannot assure you that our existing insurance coverage can be renewed at commercially reasonable rates nor is it possible to obtain insurance to protect against all of our operations risks and liabilities. Any material liability not covered by insurance or for which third-party indemnification is not available, would have a material adverse effect on our financial condition, results of operations and/or cash flows.
The helicopter industry is subject to intense competition.
The helicopter industry is highly competitive. We compete against a number of helicopter operators, including other major global helicopter operators such as Bristow Group Inc. (“Bristow”) and CHC Group Ltd. In the U.S., we face competition for business in the oil and gas industry from three major operators: Bristow, PHI, Inc. and Rotorcraft Leasing Company, LLC. In our international markets, we also face competition from local operators in countries where foreign regulations may require that contracts be awarded to local companies owned or controlled by nationals or from operators that are more recognized in some of those markets. There can be no assurance that our competitors will not be successful in capturing a share of our present or potential customer base. We also face potential competition from customers that establish their own flight departments and smaller operators that can, with access to capital, expand their fleets and operate more sophisticated and costly equipment. In providing air medical transport services, we face competition from Air Medical Group Holdings, Air Methods Corporation, PHI, Inc. and many other operators. In addition, helicopter leasing companies, such as Lease Corporation International (Aviation) Limited, Macquarie Rotocraft Leasing, Milestone Aviation Group and Waypoint Leasing, provide offerings which compete with, and could capture a share of our, dry-leasing opportunities to third parties. We also compete with other providers of medical air transport, search and rescue, firefighting and flightseeing services in various markets.
Chartering of helicopters usually involves an aggressive bidding process or intense negotiations. To qualify for work in most instances, an operator must have an acceptable safety record, demonstrated reliability, and the requisite equipment for the job, as well as sufficient resources to provide coverage when primary equipment comes out of service for maintenance. Companies that can satisfy these criteria and meet these needs are invited to bid for work. Customers typically make their final choice based on the best price available for the helicopter that is needed in the time frame that is mandated by their need. If we were unable to satisfy the criteria to participate in bids, we would be unable to compete effectively and our business, financial condition and results of operations would be materially and adversely affected.
A significant portion of our business is obtained by competitive bid or other competitive process which often require us to expend significant resources with no guaranty of recoupment.
Chartering of helicopters usually involves an aggressive competitive bidding process or intense negotiations. Customers typically make their final choice based on the best price available for the helicopter needed in the time frame mandated by their need. Successfully competing in competitive bidding situations subjects us to risks associated with the substantial time, money, and effort, including proposal development and marketing activities, required to prepare bids and proposals for contracts that may not be awarded to us.
If we do not ultimately win a bid, we may obtain little or no benefit from these expenditures and may not be able to recoup them on future projects.
Even where we are not involved in a competitive bidding process, due to the intense competition in our markets and increasing customer demand for shorter delivery periods, we must, in some cases, begin implementation of a project before the corresponding order has been finalized, increasing the risk that we will have to write off expenses associated with pursuing opportunities that ultimately do not come to fruition.
In certain of our international markets where foreign regulations may require that contracts be awarded to local companies owned or controlled by nationals, we participate in bids as a subcontractor or vendor to the local bidding company. These third parties may not be able to win these bids for reasons unrelated to us, our safety record, reliability, or equipment. Accordingly, we may lose potential business, which may be significant, for reasons beyond our control.
13
In order to grow our business, we may require additional capital in the future, which may not be available to us.
Our business is capital intensive, and to the extent we do not generate sufficient cash from operations, we will need to raise additional funds through bank financings or other public or private debt or equity financings to execute our growth strategy. Adequate sources of capital funding may not be available when needed, or may not be available on favorable terms. In addition, as a result of the Spin-off, we can no longer rely on SEACOR to provide us with capital contributions to the extent other sources of funding are not available. Further, if we raise additional funds by issuing equity or certain types of convertible debt securities, dilution to the holdings of our existing stockholders may result. Further, if we raise additional debt financing, we will incur additional interest expense and the terms of such debt may be at less favorable rates than existing debt and could require the pledge of assets as security or subject us to financial and/or operating covenants that affect our ability to conduct our business.
A
ny capital raising activities would be subject to the restrictions in the Tax Matters Agreement. Refer to Item 13 of Part III— “Certain Relationships and Related Party Transactions–Agreements between SEACOR and Era Group Relating to the Separation—Tax Matters Agreement” for additional information. If funding is insufficient at any time in the future, or we are unable to conduct capital raising activities as a result of restrictions in the Tax Matters Agreement, we may be unable to acquire additional helicopters, take advantage of business opportunities or respond to competitive pressures, any of which could harm our business, financial condition and results of operations.
Difficult economic and financial conditions could have a material adverse effect on us.
The financial results of our business are both directly and indirectly dependent upon economic conditions throughout the world, which in turn can be impacted by conditions in the global financial markets. These factors are outside our control and changes in circumstances are difficult to predict. Uncertainty about global economic conditions may lead businesses to postpone spending in response to tighter credit and reductions in income or asset values, which may lead many lenders and institutional investors to reduce, and in some cases, cease to provide funding to borrowers. Weak economic activity may lead government customers to cut back on services. Factors such as interest rates, availability of credit, inflation rates, economic uncertainty, changes in laws (including laws relating to taxation), trade barriers, commodity prices, currency exchange rates and controls, and national and international political circumstances (including wars, terrorist acts or security operations) could have a material adverse effect on our business and investments, which could reduce our revenues, profitability and value of our assets. These factors (including the failure of lenders participating in our senior secured revolving credit facility (the “Revolving Credit Facility”) to fulfill their commitments and obligations) may also adversely affect our liquidity and our financial condition, and the business, liquidity and financial condition of our customers. Adverse liquidity conditions for our customers could negatively impact their capital investment activity. In addition, periods of poor economic conditions could increase our ongoing exposure to credit risks on our accounts receivable balances. We have procedures that are designed to monitor and limit exposure to credit risk on our receivables; however, there can be no assurance that such procedures will effectively limit our credit risk and avoid losses, and, if not effective, could have a material adverse effect on our business, financial condition and results of operations.
For example, a slowdown in economic activity could reduce worldwide demand for energy and result in an extended period of lower oil and natural gas prices. Demand for our services depends on oil and natural gas industry activity and expenditure levels that are directly affected by trends in oil and natural gas prices. A reduction in oil and natural gas prices could depress the activity levels of oil and gas companies, which in turn would reduce demand for our services. Perceptions of longer-term lower oil and natural gas prices by oil and gas companies can similarly further reduce or defer major expenditures given the long-term nature of many large-scale development projects. Lower levels of activity can result in a corresponding decline in the demand for our services, which could have a material adverse effect on our revenue and profitability. Unstable economic conditions or turmoil in financial markets may also increase the volatility of our stock price.
Failure to maintain an acceptable safety record may have an adverse impact on our ability to obtain and retain customers.
Our customers consider safety and reliability a primary concern in selecting a helicopter service provider. We must maintain a record of safety and reliability that is acceptable to, and in certain instances is contractually required by, our customers. In an effort to maintain an appropriate standard, we incur considerable costs to maintain the quality of (i) our safety program, (ii) our training programs and (iii) our fleet of helicopters. For example, we have implemented a safety program that includes, among many other features, (i) transition and recurrent training using flight training devices, (ii) an FAA approved flight operational quality assurance program and (iii) health and usage monitoring systems, otherwise known as HUMS, which automatically monitor and report on vibrations and other anomalies on key components of certain helicopters in our fleet. In addition, many of our customers regularly conduct audits of our operations and safety programs. We cannot assure you that our safety program or our other efforts will provide an adequate level of safety or an acceptable safety record. If we are unable to maintain an acceptable safety record, we may not be able to retain existing customers or attract new customers, which could have a material adverse effect on our business, financial condition and results of operations.
14
We rely on relatively few customers, some of which are our affiliates, for a significant share of our revenues, the loss of any of which could adversely affect our business, financial condition and results of operations.
We derive a significant portion of our revenues from a limited number of oil and gas exploration, development and production companies and government agencies. Specifically, services provided to Anadarko, U.S. government agencies, primarily the BSEE, Shell Exploration and Production Company and Aeróleo, accounted for 19%, 11%, 6% and 5% of our revenues, respectively, for the year ended
December 31, 2013
. The portion of our revenues attributable to any single customer may change over time, depending on the level of activity by any such customer, our ability to meet the customer’s needs and other factors, many of which are beyond our control. In addition, most of our contracts with our oil and gas customers can be canceled on relatively short notice and do not commit our customers to acquire specific amounts of services. The loss of business from any of our significant customers could have a material adverse effect on our business, financial condition, liquidity and results of operations.
Further, to the extent any of our customers experience an extended period of operational or financial difficulty, our revenues and results of operations could be materially adversely affected. Aeróleo, which in addition to being a significant customer is a joint venture in which we hold an interest, has experienced financial difficulties. In August 2011, Petrobras Brazil canceled the award for AW139 helicopters in response to an accident involving an AW139 helicopter on contract with Petrobras Brazil from one of Aeróleo’s competitors. As a result, four of our AW139 helicopters under dry-lease to Aeróleo that had been mobilized in response to notification that Aeróleo was successful in its bid to place them on contract with Petrobras Brazil remained idle from August 2011 until late November 2012. In November 2012, in response to the suspension of the use of EC225 helicopters described above, Petrobras Brazil contracted with Aeróleo to utilize these four AW139 helicopters until termination of the contract on November 30, 2013. These AW139 helicopters are scheduled to begin multi-year contracts with Petrobras Brazil commencing in October 2014, but are not currently under contract following the termination of the emergency tender contract. In addition, Petrobras Brazil attempted to unilaterally suspend its EC225 helicopter contracts with Aeróleo and the other operators in Brazil commencing April 1, 2013, following the suspension of the use of the EC225 helicopters and alleging that the EC225 helicopters could not meet the terms of the contract. Aeróleo did not receive monthly payments for its EC225 helicopters under contract with Petrobras Brazil from April through late September and October, 2013 and commenced generating hourly flight revenues thereafter upon the resumption of Aeróleo’s EC225 helicopters flight operations for Petrobras Brazil. Another Aeróleo customer, OGX Petroleo & Gas Participacoes SA (“OGX”), has recently experienced financial difficulties and has filed for bankruptcy protection. These financial difficulties could impair OGX's ability to pay its receivables to Aeróleo, which could, in turn, impair Aeróleo's ability to make its dry-lease payments owed to us and impact our revenue. We currently recognize revenues from Aeróleo only as cash is received. Due to the resulting liquidity issues experienced by Aeróleo, we, together with our partner, contributed $9.2 million of additional debt capital to Aeróleo to enable it to continue operating in September 2012. As of December 31, 2013, we had deferred recognition of $21.0 million of revenues from Aeróleo. If we needed to contribute additional capital to Aeróleo it could affect our liquidity. Further, to the extent we do not collect receivables owed to us from Aeróleo or earn less revenues from the relationship than anticipated, our results of operations and liquidity could be materially adversely affected.
We derive revenue from non-wholly owned entities, which, if we develop problems with our non-wholly owned entities, could adversely affect our financial condition and results of operations.
We have interests in several non-wholly owned entities as a result of our entering into new markets through joint ventures and aviation regulatory requirements requiring us to operate through non-wholly owned entities with local shareholders. We depend to some extent upon good relations with our local shareholders to ensure profitable operations. In the event shareholder disputes arise, these could negatively impact our revenues and profit sharing from these entities.
Our customers include U.S. government agencies that are dependent on budget appropriations, which may fluctuate and, as a result, limit their ability to use our services.
U.S. government agencies, primarily the BSEE, are among our key customers and accounted for 11% of our revenues for the year ended
December 31, 2013
. Government agencies receive funding through budget appropriations, which are determined through the political process, and as a result, funding for the agencies with which we do business may fluctuate. There has been increased Congressional scrutiny of discretionary program spending by the U.S. government in light of concerns over the size of the national debt and lawmakers have discussed the need to cut or impose caps on discretionary spending in coming years, which could mean budget cuts to federal agencies to which we provide services. If any of these agencies, particularly BSEE, experience reductions in their budgets or if they change their spending priorities, their ability or willingness to spend on helicopter operations may decline, and they may substantially reduce or cease using our services, which could have a material adverse effect on our business, financial condition and results of operations.
15
Consolidation of our customer base could adversely affect demand for our services and reduce our revenues.
Many of our customers are major integrated oil and gas companies or independent oil and gas exploration, development and production companies. In recent years, these companies have undergone substantial consolidation, and additional consolidation is possible. Consolidation results in fewer companies to charter or contract for our services, and in the event one of our customers combines with a company that is using the services of one of our competitors, the combined company could decide to use the services of that competitor or another provider. Further, merger activity among both major and independent oil and natural gas companies affects exploration, development and production activity as the consolidated companies often put projects on hold while integrating operations. Consolidation may also result in an exploration and development budget for a combined company that is lower than the total budget of both companies before consolidation. Reductions in budgets could adversely affect demand for our services and our results of operations.
The implementation by our customers of cost-saving measures could reduce the demand for our services.
Oil and gas companies are continually seeking to implement measures aimed at cost savings. These measures can include efforts to improve efficiencies and reduce costs by reducing headcount or finding less expensive means for moving personnel offshore. Reducing headcount, changing rotations for personnel working offshore, therefore requiring fewer trips to and from installations, or using marine transport, are some, but not all of the possible initiatives that could result in reduced demand for our helicopter transport services. In addition, customers could establish their own helicopter operations or devise other transportation alternatives. The continued implementation of these kinds of measures could reduce the demand for helicopter services provided by independent operators like us, and could have a material adverse effect on our business, financial condition and results of operations.
Weather and seasonality can impact our results of operations.
A significant portion of our revenues is dependent on actual flight hours. Prolonged periods of adverse weather and storms can adversely impact our operations and flight hours. The fall and winter months generally have more days of adverse weather conditions than the other months of the year, with poor visibility, high winds, and heavy precipitation in some areas. While some of our helicopters are equipped to fly at night, we generally do not do so. Operations servicing offshore oil and gas transport of passengers, and also other non-emergency operations, are generally conducted during daylight hours. During winter months there are fewer daylight hours, particularly in Alaska. Flight hours, and therefore revenues, tend to decline in the winter. In addition, oil and gas exploration activity in Alaska decreases during the winter months due to the harsh weather conditions. Our operations in the U.S. Gulf of Mexico may also be adversely affected by weather. Tropical storm season runs from June through November. Tropical storms and hurricanes limit our ability to operate our helicopters in the proximity of a storm, reduce oil and gas exploration, development and production activity, add expenses to secure equipment and facilities and require us to move assets out of the path of a storm. Despite our efforts to plan for storms and secure our equipment, we may suffer damage to our helicopters or our facilities, thereby reducing our ability to provide our services. In addition, these factors also result in seasonal impacts on our business and results of operations.
Our operations depend on facilities we use throughout the world. These facilities are subject to physical and other risks that could disrupt production.
Our facilities could be damaged or our operations could be disrupted by a natural disaster, labor strike, war, political unrest, terrorist activity or a pandemic. We operate numerous bases in and along the U.S. Gulf of Mexico and we are particularly exposed to risk of loss or damage from hurricanes in that region. In addition, our operations in Alaska (including our FBO business at Ted Stevens Anchorage International Airport) are at risk from earthquake activity. In particular, we have fuel tanks at our FBO facility with approximately 200,000 gallons of fuel storage capacity, all of which could be substantially damaged or compromised due to an earthquake. Although we have obtained property damage insurance, a major catastrophe such as a hurricane, earthquake or other natural disaster at any of our sites, or significant labor strikes, work stoppages, political unrest, war or terrorist activities in any of the areas where we conduct operations, could result in a prolonged interruption or stoppage of our business or material sub-parts of it. Any disruption resulting from these events could cause the loss of sales and customers. Our insurance may not adequately compensate us for any of these events, and, if not so covered, it could have a material adverse effect on our results of operations and financial condition.
A shortfall in availability of raw materials, components, parts and subsystems required for the repair and maintenance of our helicopters could adversely affect us, as would cost increases imposed by suppliers if they cannot be passed on to customers or if our equipment has been committed to contracts without coverage for escalating expenses.
In connection with the required routine repairs and maintenance that we perform or are performed by others on our helicopters, we rely on seven key vendors (Agusta Aerospace Corporation, Sikorsky Aircraft Corporation, Airbus Helicopters Inc., Bell Helicopter Textron Inc., Pratt and Whitney Canada, Turbomeca USA, Inc. and Honeywell International), for the supply and overhaul of components on our helicopters. Consolidations involving suppliers could further reduce the number of alternative suppliers for us and increase the cost of components. These vendors have historically been the manufacturers of helicopter
16
components and parts, and their factories tend to work at or near full capacity supporting the helicopter production lines for new equipment. This leaves little capacity for the production of parts requirements for maintenance of our helicopters. The tight production schedules, as well as new regulatory requirements, the availability of raw materials or commodities, or the need to upgrade parts or product recalls can add to backlogs, resulting in key parts being in limited supply or available on an allocation basis. To the extent that these suppliers also supply parts for helicopters used by the U.S. military, parts delivery for our helicopters may be delayed during periods in which there are high levels of military operations. Any shortages could have an adverse impact on our ability to repair and maintain our helicopters. Our inability to perform timely repair and maintenance could result in our helicopters being underutilized and cause us to lose opportunities with existing or potential customers, each of which could have an adverse impact on our results of operations. Furthermore, our operations in remote locations, where delivery of these components and parts could take a significant period of time, may also impact our ability to repair and maintain our helicopters. Although every effort is made to mitigate such impact, this may pose a risk to our results of operations. In addition, supplier cost increases for critical helicopter components and parts can also adversely impact our results of operations. Cost increases are passed on to our customers through rate increases where possible, including as a component of contract escalation charges. However, as certain of our contracts are long-term in nature and may not have escalation or escalation may be tied to an index, which may not increase as rapidly as the cost of parts, we may see our margins erode. In addition, as many of our helicopters are manufactured by two European based companies, the cost of spare parts could be impacted by changes in currency exchange rates.
Our dependence on a small number of helicopter manufacturers poses a significant risk to our business and prospects, including our ability to execute our growth strategy.
Although our fleet includes equipment from all four of the major helicopter manufacturers, our current fleet expansion and replacement needs rely on three manufacturers. If any of the manufacturers with whom we contract face production delays due to, for example, natural disasters, labor strikes or unavailability of skilled labor, we may experience a significant delay in the delivery of previously ordered helicopters. During these periods, we may not be able to obtain additional helicopters with acceptable pricing, delivery dates or other terms. Delivery delays or our inability to obtain acceptable helicopters would adversely affect our revenues and profitability and could jeopardize our ability to meet the demands of our customers and execute our growth strategy. In addition, lack of availability of new helicopters resulting from a backlog in orders could result in an increase in prices for certain types of used helicopters. Furthermore, regulatory authorities may require us to temporarily or permanently remove certain helicopter models from service following certain incidents or accidents.
We rely on the secondary used aircraft market to dispose of our older aircraft and parts due to our on-going fleet modernization efforts.
We manage our global aircraft fleet by evaluating expected demand for helicopter services across global markets, including the type of aircraft needed to meet this demand. As offshore oil and gas drilling and production globally moves to deeper water, more heavy and medium aircraft and newer technology aircraft may be required. As older aircraft models come off of current contracts and are replaced by new aircraft, our management evaluates our future needs for these aircraft models and ultimately the ability to recover our remaining investments in these aircraft through sales into the aftermarket. We are dependent upon the secondary used aircraft and parts market to dispose of older models of aircraft.
The book value of our owned aircraft as reflected on our balance sheet is based on our practice of depreciating our aircraft over their expected useful life to the expected salvage value to be received for the aircraft at the end of that life. From time to time, we disclose our net asset value, which is based, in large part, on the fair market value of our aircraft derived from a combination of available market data, utilization of estimates, application of significant judgment and assistance of valuation specialists, including values obtained from third party analysts. There is no assurance that either the book value or the fair market value of any aircraft represents the amount that we could obtain from an unaffiliated third party in an arm’s length sale of the aircraft, and market factors will impact whether we record gains or losses on aircraft sales and whether we are able to achieve the estimated fair market value of such aircraft. The number of aircraft sales and the amount of gains and losses recorded on these sales is unpredictable. A failure to dispose of helicopters and parts in the secondary market could impair our ability to operate our fleet efficiently and service existing contracts or win new mandates and could have a material adverse effect on our business, financial condition or results of operations.
Our future growth may be impacted by our ability to expand into markets outside of the U.S. Gulf of Mexico and Alaska.
Our future growth will depend on our ability to expand into markets outside of the U.S. Expansion of our business depends on our ability to operate in these other regions.
Expansion of our business outside of the U.S. Gulf of Mexico and Alaska may be adversely affected by:
|
•
|
local regulations restricting foreign ownership of helicopter operators;
|
|
•
|
requirements to award contracts to local operators; and
|
|
•
|
the number and location of new drilling concessions granted by foreign governments.
|
17
We cannot predict the restrictions or requirements that may be imposed in the countries in which we operate or wish to operate. If we are unable to continue to operate or obtain and retain contracts in markets outside of the U.S. Gulf of Mexico and Alaska, our future business, financial condition and results of operations may be adversely affected, and our operations outside of the U.S. Gulf of Mexico and Alaska may not grow.
Our operations in the U.S. Gulf of Mexico were adversely impacted by the Deepwater Horizon drilling rig incident and resulting oil spill, and may be adversely impacted by proposed legislation and resulting litigation in response to that incident.
We are highly dependent on offshore oil and gas activities in the U.S. Gulf of Mexico. On April 22, 2010, the
Deepwater Horizon
, a semi-submersible deepwater drilling rig operating in the U.S. Gulf of Mexico, sank after an apparent blowout and fire resulting in a significant flow of hydrocarbons from the BP Plc. ("BP") Macondo well. As a result, from May 2010 to October 2010, the U.S. Department of Interior imposed a moratorium on offshore drilling operations. Drilling resumed in November 2010 but activity in the U.S. Gulf of Mexico did not reach pre-blowout levels until September 2011. As a result of the blowout at the BP Macondo well and subsequent moratorium on drilling activities, our operating results were adversely affected in the fourth quarter of 2010 and the first half of 2011. In addition, as a result of the blowout, the U.S. Department of Interior issued new rules designed to improve drilling and workplace safety in the U.S. Gulf of Mexico, and various congressional committees began pursuing legislation to regulate drilling activities and increase liability. The Bureau of Ocean Energy Management, BSEE and Office of National Resources Revenue are expected to continue to issue new safety and environmental guidelines or regulations for drilling in the U.S. Gulf of Mexico, and other regulatory agencies could potentially issue new safety and environmental guidelines or regulations in other geographic regions, and may take other steps that could increase the costs of exploration and production, reduce the area of operations and result in permitting delays. We are monitoring legislation and regulatory developments; however, it is difficult to predict the ultimate impact of any new guidelines, regulations or legislation. A prolonged suspension of drilling activity or permitting delays in the U.S. Gulf of Mexico, new regulations and/or increased liability for companies operating in this sector, whether or not caused by a new incident in the region, could result in reduced demand for our services, and reduced cash flows and profitability.
In addition, our operations in the U.S. Gulf of Mexico, along with those of certain of our customers, may be adversely impacted by, among other factors:
|
•
|
the suspension, stoppage or termination by customers of existing contracts and the demand by customers for new or renewed contracts in the U.S. Gulf of Mexico and other affected regions;
|
|
•
|
unplanned customer suspensions, cancellations, rate reductions, non-renewals of commitments to charter aviation equipment or failures to finalize commitments to charter aviation equipment;
|
|
•
|
the cost or availability of relevant insurance coverage; and
|
|
•
|
adverse weather conditions and natural disasters including, but not limited to, hurricanes and tropical storms.
|
Any one or a combination of these factors could reduce revenues, increase operating costs and have a material adverse effect on our business, financial condition and results of operations.
Significant increases in fuel costs can have a material adverse effect on our business, financial condition and results of operations.
Fuel is essential to the operation of our helicopters and to our ability to carry out our transport services and is a key component of our operating expenses. High fuel costs can increase the cost of operating our helicopters. Any increased fuel costs may negatively impact our net sales, margins, operating expenses and results of operations. Although we have been able to pass along a significant portion of increased fuel costs to our customers in the past, we cannot assure you that we can do so again if another prolonged period of high fuel costs occurs. To the extent there is a significant increase in fuel costs that we are unable to pass on to our customers, it may have a material adverse effect on our business, financial condition and results of operations.
Our contracts generally can be terminated or downsized by our customers without penalty.
Many of our operating contracts and charter arrangements in the U.S. Gulf of Mexico and Alaska contain provisions permitting early termination by the customer for any reason, generally without penalty, and with limited notice requirements. In addition, many of our contracts permit our customers to decrease the number of helicopters under contract with a corresponding decrease in the fixed monthly payments without penalty. We also give to and receive from our customers indemnities relating to damages caused or sustained by us in connection with our operations. Our customers’ changing views on risk allocation may cause us to accept greater risk to win new business or may result in our losing business if we are not prepared to take such risks. As a result, you should not place undue reliance on our customer contracts or the terms of those contracts. The termination of contracts by our significant customers or the decrease in their usage of our helicopter services could have a material adverse effect on our business, financial condition and results of operations.
18
We may not be able to obtain work on acceptable terms covering some of our new helicopters, and some of our new helicopters may replace existing helicopters already under contract, which could adversely affect the utilization of our existing fleet.
As of
December 31, 2013
, we had placed orders for
21
new helicopters. Five of these helicopters are scheduled to be delivered in 2014, two are scheduled to be delivered in 2015, six are scheduled to be delivered in 2016 and three are scheduled to be delivered in 2017. Delivery dates for the remaining five helicopters have yet to be determined. Many of our new helicopters may not be covered by customer contracts when they are placed into service, and we cannot assure you as to when we will be able to utilize these new helicopters or on what terms. To the extent our helicopters are covered by a customer contract, many of these contracts are short-term, requiring us to seek renewals frequently. We also expect that some of our customers may request new helicopters in lieu of our existing helicopters, which could adversely affect the utilization of our existing fleet.
Adverse results of legal proceedings could have a material adverse effect on us.
We are subject to, and may in the future be subject to, a variety of legal proceedings and claims that arise out of the ordinary conduct of our business. Results of legal proceedings cannot be predicted with certainty. Irrespective of their merits, legal proceedings may be both lengthy and disruptive to our operations and may cause significant expenditure and diversion of management attention. We may be faced with significant monetary damages or injunctive relief against us that could have a material adverse effect on a portion of our business operations or a material adverse effect on our financial condition and results of operations.
We may undertake one or more significant corporate transactions that may not achieve their intended results, may adversely affect our financial condition and our results of operations or result in unforeseeable risks to our business.
We continuously evaluate the acquisition of operating businesses and assets and may in the future undertake one or more significant transactions. Any such transaction could be material to our business and could take any number of forms, including mergers, joint ventures and the purchase of equity interests. The consideration for such transactions may include, among other things, cash, common stock or equity interests in us or our subsidiaries, or a contribution of equipment to obtain equity interests, and in conjunction with a transaction we might incur additional indebtedness. We also routinely evaluate the benefits of disposing of certain of our assets. Such dispositions could take the form of asset sales, mergers or sales of equity interests.
These transactions may present significant risks such as insufficient revenues to offset liabilities assumed, potential loss of significant revenues and income streams, increased or unexpected expenses, inadequate return of capital, regulatory or compliance issues, the triggering of certain covenants in our debt instruments (including accelerated repayment) and unidentified issues not discovered in due diligence. In addition, such transactions could distract management from current operations. As a result of the risks inherent in such transactions, we cannot guarantee that any such transaction will ultimately result in the realization of its anticipated benefits or that it will not have a material adverse impact on our business, financial condition or results of operations. If we were to complete such an acquisition, disposition, investment or other strategic transaction, we may require additional debt or equity financing that could result in a significant increase in our amount of debt and our debt service obligations or the number of outstanding shares of our Common Stock, thereby diluting holders of our Common Stock outstanding prior to such acquisition.
We are subject to risks associated with our international operations.
We operate and dry-lease helicopters in international markets. During the years ended
December 31, 2013
and 2012, approximately 18% and 22%, respectively, of our operating revenues resulted from our international operations. We expect to increase our international operations in the future. Our international operations are subject to a number of risks, including:
|
•
|
political conditions and events, including embargoes;
|
|
•
|
restrictive actions by U.S. and foreign governments, including in Brazil, India, Mexico, Norway, Spain, Sweden and Uruguay, that could limit our ability to provide services in those countries;
|
|
•
|
the imposition of withholding or other taxes on foreign income, tariffs or restrictions on foreign trade and investment;
|
|
•
|
adverse tax consequences;
|
|
•
|
limitations on repatriation of earnings or currency exchange controls and import/export quotas;
|
|
•
|
nationalization, expropriation, asset seizure, blockades and blacklisting;
|
|
•
|
limitations in the availability, amount or terms, of insurance coverage;
|
|
•
|
loss of contract rights and inability to adequately enforce contracts;
|
|
•
|
political instability, war and civil disturbances or other risks that may limit or disrupt markets, such as terrorist attacks, piracy and kidnapping;
|
19
|
•
|
fluctuations in currency exchange rates, hard currency shortages and controls on currency exchange that affect demand for our services and our profitability;
|
|
•
|
potential noncompliance with a wide variety of laws and regulations, such as the U.S. Foreign Corrupt Practices Act of 1977 (the “FCPA”), and similar non-U.S. laws and regulations, including the U.K. Bribery Act 2010 (the “UKBA”) and Brazil’s Clean Companies Act (the “BCCA”);
|
|
•
|
labor strikes;
|
|
•
|
changes in general economic conditions;
|
|
•
|
adverse changes in foreign laws or regulatory requirements, including those with respect to flight operations and environmental protections; and
|
|
•
|
difficulty in staffing and managing widespread operations.
|
If we are unable to adequately address these risks, we could lose our ability to operate in certain international markets and our business, financial condition and results of operations could be materially and adversely affected.
There are risks associated with our debt structure.
As of December 31, 2013, our indebtedness consisted of $200.0 million aggregate principal amount of our 7.750% senior notes due 2022 (“Senior Notes”), $55.0 million of borrowings outstanding under the Revolving Credit Facility and $30.3 million of aggregate indebtedness of one of our subsidiaries outstanding under two promissory notes. In addition, we had the ability to borrow up to
$136.1 million
under our Revolving Credit Facility, after taking into account the financial ratios we are required to maintain under the facility as discussed in more detail below.
The agreements governing our Revolving Credit Facility and the indenture governing our Senior Notes contain various covenants that limit our ability to, among other things:
|
•
|
make investments;
|
|
•
|
incur or guarantee additional indebtedness;
|
|
•
|
incur liens or pledge the assets of certain of our subsidiaries;
|
|
•
|
pay dividends;
|
|
•
|
enter into transactions with affiliates; and
|
|
•
|
enter into certain sales of all or substantially all of our assets, mergers and consolidations.
|
Our Revolving Credit Facility also requires that we maintain a maximum funded debt to EBITDA (as defined in our Revolving Credit Facility) ratio (the “RC Leverage Ratio”) of 5.0 to 1.0 (increased from 4.0 to 1.0 as a result of the issuance of our Senior Notes) and comply with certain other financial ratios. Failure to comply with these covenants is an event of default under the facility and, as a result, our ability to borrow under our Revolving Credit Facility is dependent on and limited by our ability to comply with the RC Leverage Ratio limit and other financial ratios. Refer to Note 8 to Notes to Consolidated Financial Statements in Item 8 of this Annual Report on Form 10-K for additional information.
If we experience reduced operating revenues, our ability to utilize our Revolving Credit Facility may be limited and we may require additional investments in our capital stock to maintain our financial ratio within applicable limits. Any inability to borrow under our Revolving Credit Facility could have a material adverse effect on our ability to make capital expenditures, on our results of operations and on our liquidity. Further, failure to maintain the financial ratios required under the Revolving Credit Facility would constitute an event of default, allowing the lenders under our Revolving Credit Facility to declare the entire balance of any and all sums payable under the Revolving Credit Facility immediately due and payable, which in turn would permit the holders of the Senior Notes to accelerate maturity of the Senior Notes as well.
Our ability to meet our debt service obligations and refinance our indebtedness, including any future debt that we may incur, will depend upon our ability to generate cash in the future from operations, financings or asset sales, which are subject to general economic conditions, industry cycles, seasonality and other factors, some of which may be beyond our control. If we cannot repay or refinance our debt as it becomes due, we may be forced to sell assets or take other disadvantageous actions, including (i) reducing financing in the future for working capital, capital expenditures and general corporate purposes or (ii) dedicating an unsustainable level of our cash flow from operations to the payment of principal and interest on our indebtedness. In addition, our ability to withstand competitive pressures and to react to changes in our industry could be impaired. The lenders who hold such debt could also accelerate amounts due, which could potentially trigger a default or acceleration of our other debt.
Our future debt levels and the terms of any future indebtedness we may incur may contain restrictive covenants and limit our liquidity and our ability to obtain additional financing and pursue acquisitions and joint ventures or purchase new helicopters.
20
Tight credit conditions could limit our ability to secure additional financing, if required, due to difficulties accessing the credit and capital markets.
Our global operations are subject to foreign currency, interest rate, fixed-income, equity and commodity price risks.
We are exposed to currency fluctuations and exchange rate risks. A significant portion of our capital purchase obligations are denominated in foreign currencies and, although some of these risks may be hedged, fluctuations could significantly impact our cost of purchase and, as a result, our financial condition and results of operation. We purchase some of our helicopters and helicopter parts from foreign manufacturers and maintain operations in foreign countries, which results in portions of our revenues and expenses being denominated in foreign currencies. We attempt to minimize our exposure to currency exchange risk by contracting the majority of our services in U.S. dollars. As a result, a strong U.S. dollar may increase the local cost of our services that are provided under the U.S. dollar denominated contracts, which may reduce demand for our services in foreign countries. Some of these risks may be hedged, but fluctuations could impact our financial condition and our results of operations. Our financial condition and our results of operations may also be affected by the cost of hedging activities that we undertake to protect against currency exchange risk. We operate in countries with foreign exchange controls, including Brazil and India. These controls may limit our ability to repatriate funds from our unconsolidated foreign affiliates or otherwise convert local currencies into U.S. dollars. These limitations could adversely affect our ability to access cash from these operations and our liquidity.
We are subject to governmental regulation that limits foreign ownership of helicopter companies.
We are subject to governmental regulation that limits foreign ownership of helicopter companies. Failure to comply with regulations and requirements for citizen ownership in the various markets in which we operate and may operate in the future, may subject our helicopters to deregistration or impoundment. If required levels of citizen ownership are not met or maintained, joint ventures in which we have significant investments also could be prohibited from operating within these countries. Deregistration of our helicopters or helicopters operated by our joint venture partners for any reason, including foreign ownership in excess of permitted levels, would have a material adverse effect on our ability to conduct operations within these markets. We cannot assure you that there will be no changes in aviation laws, regulations, required levels of citizen ownership, or administrative requirements or the interpretations thereof, that could restrict or prohibit our ability to operate in certain regions. Any such restriction or prohibition on our ability to operate may have a material adverse effect on our business, financial condition, and results of operations.
We limit foreign ownership of our company, which could reduce the price of our Common Stock and cause owners of our Common Stock who are not U.S. persons to lose their voting rights.
Our amended and restated certificate of incorporation provides that persons or entities that are not “citizens of the U.S.” (as defined in the Federal Aviation Act of 1958) shall not collectively own or control more than 24.9% of the voting power of our outstanding capital stock (the “Permitted Foreign Ownership Percentage”) and that, if at any time persons that are not citizens of the U.S. nevertheless collectively own or control more than the Permitted Foreign Ownership Percentage, the voting rights of our outstanding voting capital stock in excess of the Permitted Foreign Ownership Percentage owned by stockholders who are not citizens of the U.S. shall automatically be reduced. These voting rights will be reduced pro rata among the holders of voting shares who are not citizens of the U.S. to equal the Permitted Foreign Ownership Percentage based on the number of votes to which the underlying voting securities are entitled. Shares held by persons who are not citizens of the U.S. may lose their associated voting rights and be redeemed as a result of these provisions. These restrictions may also have a material adverse impact on the liquidity or market value of our Common Stock because holders may be unable to transfer our Common Stock to persons who are not citizens of the U.S.
If we do not restrict the amount of foreign ownership of our Common Stock, we may fail to remain a U.S. citizen, might lose our status as a U.S. air carrier and be prohibited from operating helicopters in the U.S., which would adversely impact our business, financial condition and results of operations.
Since we hold the status of a U.S. air carrier under the regulations of both the U.S. DOT and the FAA and we engage in the operating and dry-leasing of helicopters in the U.S., we are subject to regulations pursuant to Title 49 of the Transportation Code (“Transportation Code”) and other statutes (collectively, “Aviation Acts”). The Transportation Code requires that Certificates to engage in air transportation be held only by citizens of the U.S. as that term is defined in the relevant section of the Transportation Code. That section requires: (i) that our president and two-thirds of our board of directors and other managing officers be U.S. citizens; (ii) that at least 75% of our outstanding voting stock be owned by U.S. citizens; and (iii) that we must be under the actual control of U.S. citizens. Further, our helicopters operating in the U.S. must generally be registered in the U.S. In order to register such helicopters under the Aviation Acts, we must be owned or controlled by U.S. citizens. Although our amended and restated certificate of incorporation and amended and restated bylaws contain provisions intended to ensure compliance with the provisions of the Aviation Acts, a failure to maintain compliance would result in loss of our air carrier status and thereby adversely affect our business, financial condition and results of operations and we would be prohibited from both operating as an air carrier and operating helicopters in the U.S. during any period in which we did not comply with these regulations.
21
The Outer Continental Shelf Lands Act, as amended, provides the federal government with broad discretion in regulating the leasing of offshore resources for the production of oil and gas.
We currently derive a significant portion of our revenues from helicopter services we provide in the U.S. Gulf of Mexico for the purposes of offshore oil and gas exploration, development and production. As such, we are subject to the U.S. government’s exercise of authority under the provisions of the Outer Continental Shelf Lands Act that restrict the availability of offshore oil and gas leases by requiring lease conditions such as the implementation of safety and environmental protections, the preparation of spill contingency plans and air quality standards for certain pollutants, the violations of which could result in potential court injunctions curtailing operations and lease cancellations and by requiring that all pipelines operating on or across the outer continental shelf provide open and nondiscriminatory access to shippers. These provisions could adversely impact exploration and production activity in these regions. If activity in oil and gas exploration, development and production in these regions declines, our business, financial condition and results of operations could be materially and adversely affected.
We are subject to tax and other legal compliance risks, including anti-corruption statutes, the violation of which may adversely affect our business and operations.
As a global business, we are subject to complex laws and regulations in the U.S. and other countries in which we operate. Changes in laws or regulations and related interpretations and other guidance could result in higher expenses and payments. Uncertainty relating to such laws or regulations may also affect how we conduct our operations and structure our investments and could limit our ability to enforce our rights.
In order to compete effectively in certain foreign jurisdictions, we seek to establish joint ventures with local operators or strategic partners. We are subject to a variety of tax and legal compliance risks. These risks include, among other things, possible liability relating to taxes and compliance with U.S. and foreign export laws, competition laws and regulations, including the FCPA, the UKBA and the BCCA. The FCPA generally prohibits U.S. companies and their intermediaries from making improper payments to foreign officials for the purpose of obtaining or maintaining business. Each of the UKBA and BCCA has similar provisions. We could be charged with wrongdoing for any of these matters as a result of our actions or the actions of our agents, local partners or joint ventures, even though these parties may not be subject to such statutes. If convicted or found liable of tax or other legal infractions, or if we have been determined to be in violation of the FCPA, we could be subject to significant fines, penalties, repayments, other damages (in certain cases, treble damages), or suspension or debarment from government contracts, which could have a material adverse effect on our business, financial condition and results of operations. We are also subject to laws in the U.S. and outside of the U.S. regulating competition.
Independently, failure of us or one of our joint ventures or strategic partners to comply with applicable export and trade practice laws could result in civil or criminal penalties and suspension or termination of export privileges.
Negative publicity may adversely impact us.
Media coverage and public statements that insinuate improper actions by us or relate to accidents or other issues involving the safety of our helicopters or operations, regardless of their factual accuracy or truthfulness, may result in negative publicity, litigation or governmental investigations by regulators. Addressing negative publicity and any resulting litigation or investigations may distract management, increase costs and divert resources. Negative publicity may have an adverse impact on our reputation, our customer relationships and the morale of our employees, which could adversely affect our business, cash flows from operations, financial condition and results of operations.
Our inability to attract and retain qualified personnel could have an adverse effect on our business.
Attracting and retaining qualified pilots, mechanics and other highly skilled personnel is an important factor in our future success. Our inability to attract and retain qualified personnel could have an adverse effect on our business and our growth strategy. Many of our customers require pilots with very high levels of flight experience. In addition, the maintenance of our helicopters requires mechanics that are trained and experienced in servicing particular makes and models of helicopters. The market for these highly skilled personnel is competitive and we cannot be certain that we will be successful in attracting and retaining qualified personnel in the future. In addition, if we enter into new markets or obtain additional customer contracts or the demand for our services increases, we may be required to hire additional pilots, mechanics and other flight-related personnel, which we may not be able to do on a timely or cost-effective basis.
If our employees were to unionize, our operating costs could increase.
Our employees are not currently represented by a collective bargaining agreement. However, we have no assurances that our employees will not unionize in the future. If any of our employees were to unionize, it could increase our operating costs, force us to alter our operating methods and/or have a material adverse effect on our results of operations.
Environmental regulation and liabilities, including new or developing laws and regulations, may increase our costs of operations and adversely affect us.
22
Our business is subject to federal, state, local and international laws and regulations relating to environmental protection and occupational safety and health, including laws that govern the discharge of oil and pollutants into navigable waters. Such laws include the federal Water Pollution Control Act, also known as the Clean Water Act, which imposes restrictions on the discharge of pollutants to the navigable waters of the U.S. We are also subject to the Coastal Zone Management Act, which authorizes state development and implementation of certain programs to manage water pollution to restore and protect coastal waters. In addition, because our operations generate and, in some cases, involve the transportation of hazardous wastes, we are subject to the Federal Resource Conservation and Recovery Act, which regulates the use, generation, transportation, treatment, storage and disposal of hazardous and certain non-hazardous wastes. Violations of these laws, along with comparable state and local laws, may result in civil and criminal penalties, fines, injunctions or other sanctions. We are also subject to the Comprehensive Environmental Response, Compensation and Liability Act and certain comparable state laws, which establish strict and, under certain circumstances, joint and several liabilities for specified parties in connection with liability for the investigation and remediation of releases of hazardous materials into the environment and damages to natural resources. Such liability can arise even as a result of conduct that was lawful at the time it occurred or the conduct of, or conditions caused by, prior operators or third parties. In addition, our customers in the oil and gas exploration, development and production industry are affected by environmental laws and regulations, which have recently become stricter as a result of the
Deepwater Horizon
matter (discussed above), that restrict their activities and may result in reduced demand for our services.
Any failure by us to comply with any environmental laws and regulations may result in administrative, civil or criminal sanctions, revocation or denial of permits or other authorizations, imposition of limitations on our operations, and site investigatory, remedial or other corrective actions.
Environmental laws and regulations change frequently, which makes it difficult to predict their cost or impact on our results of operations. In recent years, governments have increasingly focused on climate change, carbon emissions, and energy use. Laws and regulations that curb the use of energy, or require the use of renewable fuels or renewable sources of energy—such as wind or solar power—could result in a reduction in demand for hydrocarbon-based fuels such as oil and natural gas. In addition, governments could pass laws, regulations or taxes that increase the cost of fuel, thereby impacting both demand for our services and also our cost of operations. Such initiatives could have a material adverse effect on our business, financial condition and results of operations.
Actions taken by government agencies, such as the Department of Commerce, the Department of Transportation and the Federal Aviation Administration, could increase our costs and prohibit or reduce our ability to operate successfully.
Our operations are highly regulated by several U.S. government regulatory agencies. For example, as a certified air carrier, we are subject to regulations promulgated by the DOT and the FAA. The FAA regulates our flight operations and imposes requirements with respect to personnel, aircraft, ground facilities and other aspects of our operations, including:
|
•
|
certification and reporting requirements;
|
|
•
|
inspections;
|
|
•
|
maintenance standards;
|
|
•
|
personnel training standards; and
|
|
•
|
maintenance of personnel and aircraft records.
|
The Department of Transportation can review our economic fitness to continue our operations, both presently and if a substantial change occurs to our management, ownership or capital structure, among other things. The Department of Commerce, through its International Traffic in Arms Regulations, regulates our imports and exports of aircraft (through leases and sales) as well as parts sales to international customers and the use of certain regulated technology in domestic and international airspace. If we fail to comply with these laws and regulations, or if these agencies develop concerns over our operations, we could face administrative, civil and/or criminal penalties. In addition, we may become subject to regulatory actions that could suspend, curtail or significantly modify our operations. A suspension or substantial curtailment of our operations or any substantial modification of our current operations may have a material adverse effect on our business, financial condition and results of operations.
Future changes to the regulations and laws under which we operate, and promulgation of new regulations and laws also could have a material adverse effect on our business, financial position and results of operations.
Our FBO in Alaska is subject to extensive government regulation and other cost-related risks that could disrupt operations.
Our FBO in Alaska is subject to oversight by the Ted Stevens Anchorage International Airport, is dependent upon that airport being “open for business” and is subject to federal regulatory requirements by the FAA, the Transportation Security Administration (the “TSA”) and other agencies. If the FAA, TSA or other agencies were to impose significant operating restrictions or increase insurance obligations such that insurance could not be obtained or purchased for a reasonable cost, or if any federal
23
regulatory requirement were to require significant expenditure, the market for services from our FBO could be significantly impaired or entirely eliminated. In addition, the biggest revenue producing activity at our FBO, fuel sales to transient customers, could be adversely impacted by increases in fuel prices, the ability of our competitors to undercut our pricing, restrictions on private air travel and/or taxes on fuel or aircraft, any of which could make private air travel prohibitively expensive. Should the FBO’s operations be restricted or shut down, whether due to regulatory issues, the weather, a natural disaster, terrorist activity, or any other reason, our operations could be adversely impacted.
Our stock price may fluctuate significantly.
Our Common Stock has limited trading history. The trading price of our Common Stock may be volatile and subject to wide price fluctuations in response to various factors, including:
|
•
|
market conditions in the broader stock market;
|
|
•
|
actual or anticipated fluctuations in our quarterly financial condition and results of operations;
|
|
•
|
introduction of new equipment or services by us or our competitors;
|
|
•
|
issuance of new or changed securities analysts’ reports or recommendations;
|
|
•
|
sales, or anticipated sales, of large blocks of our stock;
|
|
•
|
additions or departures of key personnel;
|
|
•
|
regulatory or political developments;
|
|
•
|
litigation and governmental investigations; and
|
|
•
|
changing economic conditions.
|
Stock markets in general have experienced volatility that has often been unrelated to the operating performance of a particular company. These broad market fluctuations could adversely affect the trading price of our Common Stock.
For as long as we are an emerging growth company, we will be exempt from certain reporting requirements, including those relating to accounting standards and disclosure about our executive compensation, that apply to other public companies.
In April 2012, President Obama signed into law the Jumpstart Our Business Startups Act (the “JOBS Act”). The JOBS Act contains provisions that, among other things, relax certain reporting requirements for emerging growth companies, including certain requirements relating to accounting standards and compensation disclosure. We are classified as an emerging growth company, which is defined as a company with annual gross revenues of less than $1 billion, that has been a public reporting company for a period of less than five years, and that does not have a public float of $700 million or more in securities held by non-affiliated holders. For as long as we are an emerging growth company, unlike other public companies, unless we elect not to take advantage of applicable JOBS Act provisions, we will not be required to (i) provide an auditor’s attestation report on management’s assessment of the effectiveness of our system of internal control over financial reporting pursuant to Section 404 of the Sarbanes-Oxley Act, (ii) comply with any new or revised financial accounting standards applicable to public companies until such standards are also applicable to private companies under Section 102(b)(1) of the JOBS Act, (iii) comply with any new requirements adopted by the Public Company Accounting Oversight Board (the “PCAOB”), such as requiring mandatory audit firm rotation or a supplement to the auditor’s report in which the auditor would be required to provide additional information about the audit and the financial statements of the issuer, (iv) comply with any new audit rules adopted by the PCAOB after April 5, 2012 unless the SEC determines otherwise, (v) provide certain disclosure regarding executive compensation required of larger public companies or (vi) hold stockholder advisory and other votes on executive compensation. We cannot predict if investors will find our Common Stock less attractive if we choose to rely on these exemptions. If some investors find our Common Stock less attractive as a result of any choices to reduce future disclosure, there may be a less active trading market for our Common Stock and our stock price may be more volatile.
As noted above, under the JOBS Act, emerging growth companies can delay adopting new or revised accounting standards that have different effective dates for public and private companies until such time as those standards apply to private companies. We do not intend to take advantage of such extended transition period. This election is irrevocable pursuant to Section 107 of the JOBS Act.
As a result of becoming a public company, in connection with the Spin-off, we are subject to requirements that will be burdensome and costly.
Prior to the Spin-off, we operated our business as a segment of a public company. As a result of the Spin-off, we became an independent, public company and are required to file with the SEC annual and quarterly information and other reports that are specified in Section 13 of the Exchange Act and are required to ensure that we have the ability to prepare financial statements that are fully compliant with all SEC reporting requirements on a timely basis. In addition, we are now subject to other reporting and corporate governance requirements, including the requirements of the New York Stock Exchange (“NYSE”), and certain provisions
24
of the Sarbanes-Oxley Act of 2002 and the regulations promulgated thereunder, which impose significant compliance obligations upon us. As a public company, we are required to:
|
•
|
prepare and distribute periodic public reports and other stockholder communications in compliance with our obligations under the federal securities laws and NYSE rules;
|
|
•
|
create or expand the roles and duties of our board of directors and committees of the board of directors;
|
|
•
|
institute more comprehensive financial reporting and disclosure compliance functions;
|
|
•
|
supplement our internal accounting and auditing function, including hiring additional staff with expertise in accounting and financial reporting for a public company;
|
|
•
|
enhance and formalize closing procedures at the end of our accounting periods;
|
|
•
|
enhance our internal audit function;
|
|
•
|
enhance our investor relations function;
|
|
•
|
establish new internal policies, including those relating to disclosure controls and procedures; and
|
|
•
|
involve and retain to a greater degree outside counsel and accountants in the activities listed above.
|
These changes require a significant commitment of additional resources. We may not be successful in implementing these requirements and not implementing them could adversely affect our business or results of operations. In addition, if we fail to implement the requirements with respect to our internal accounting and audit functions, our ability to report our results of operations on a timely and accurate basis could be impaired. We have entered into various agreements with SEACOR in connection with the separation, including an Amended and Restated Transition Services Agreement under which SEACOR continues to provide us on an interim basis with certain support services, including information systems support. The process of replacing such services integral to our closing processes, internal policies, disclosure controls and procedures, could impact our ability to implement the foregoing requirements.
Failure to establish and maintain effective internal controls over financial reporting could have an adverse effect on our business, operating results and stock price.
Maintaining effective internal control over financial reporting is necessary for us to produce reliable financial reports and is important in helping to prevent financial fraud. To date, we have not identified any material weaknesses related to our internal control over financial reporting or disclosure controls and procedures, although we have not conducted an audit of our controls. If we are unable to maintain adequate internal controls, our business and operating results could be harmed. We recently implemented a process to document and test our internal control procedures to satisfy the requirements of Section 404 of Sarbanes-Oxley and the related rules of the SEC, which require, among other things, our management to assess annually the effectiveness of our internal control over financial reporting beginning with this Annual Report on Form 10-K. To the extent we are no longer an emerging growth company, we will need to further evaluate how to document and test these procedures to satisfy the requirements of Section 404 of Sarbanes-Oxley and the related rules of the SEC requiring our independent registered public accounting firm to issue a report on our internal control over financial reporting. During the course of this documentation and testing, we may identify deficiencies that we may be unable to remedy before the requisite deadline for those reports. Our auditors have not conducted an audit of our internal control over financial reporting. Any failure to remediate material weaknesses noted by us or our independent registered public accounting firm or to implement required new or improved controls or difficulties encountered in their implementation could cause us to fail to meet our reporting obligations or result in material misstatements in our financial statements. If our management or our independent registered public accounting firm were to conclude in their reports that our internal control over financial reporting was not effective, investors could lose confidence in our reported financial information, and the trading price of our Common Stock could drop significantly. Failure to comply with Section 404 of Sarbanes-Oxley could potentially subject us to sanctions or investigations by the SEC, the FINRA, the NYSE or other regulatory authorities.
Provisions in our amended and restated certificate of incorporation and amended and restated bylaws and Delaware law may discourage, delay or prevent a change of control of our company or changes in our management.
Our amended and restated certificate of incorporation and bylaws include certain provisions that could have the effect of discouraging, delaying or preventing a change of control of our company or changes in our management, including, among other things:
|
•
|
restrictions on the ability of our stockholders to fill a vacancy on the board of directors;
|
|
•
|
restrictions related to the ability of non-U.S. citizens owning our Common Stock;
|
|
•
|
our ability to issue preferred stock with terms that the board of directors may determine, without stockholder approval, which could be used to significantly dilute the ownership of a hostile acquirer;
|
25
|
•
|
the absence of cumulative voting in the election of directors which may limit the ability of minority stockholders to elect directors; and
|
|
•
|
advance notice requirements for stockholder proposals and nominations, which may discourage or deter a potential acquirer from soliciting proxies to elect a particular slate of directors or otherwise attempting to obtain control of us.
|
These provisions in our amended and restated certificate of incorporation and bylaws may discourage, delay or prevent a transaction involving a change in control of our company that is in the best interest of our stockholders. Even in the absence of a takeover attempt, the existence of these provisions may adversely affect the prevailing market price of our Common Stock if they are viewed as discouraging future takeover attempts.
Risk Factors Relating to the Spin-off
Our historical financial information may not be representative of the results we would have achieved as a stand-alone public company and may not be a reliable indicator of our future results.
Our historical financial information may not necessarily reflect what our financial position, results of operations or cash flows would have been had we been an independent entity during the periods presented or those that we will achieve in the future. The costs and expenses reflected in our historical financial information include an allocation for certain corporate functions historically provided by SEACOR, that may be different from the comparable expenses that we would have incurred had we operated as a stand-alone company. Our historical financial information does not reflect changes that will occur in our cost structure, financing and operations as a result of our transition to becoming a stand-alone public company, including changes in our cash management, employee base, potential increased costs associated with reduced economies of scale and increased costs associated with SEC reporting and NYSE requirements.
We rely on SEACOR’s performance under various agreements and we will continue to be dependent on SEACOR to provide us with support services for our business.
We have entered into various agreements with SEACOR in connection with the separation, including an Amended and Restated Transition Services Agreement, Distribution Agreement, Tax Matters Agreement and Employee Matters Agreement. These agreements govern our relationship with SEACOR subsequent to the separation. It is possible that if SEACOR were to fail to fulfill its obligations under these agreements we could suffer operational difficulties or significant losses.
If we are required to indemnify SEACOR for certain liabilities and related losses arising in connection with any of these agreements, we may be subject to substantial liabilities, which could materially adversely affect our financial position. If SEACOR is required to indemnify us for certain liabilities and related losses arising in connection with any of these agreements, we may be subject to substantial liabilities if SEACOR does not fulfill its obligations, which could materially adversely affect our financial position.
Under the terms of the Amended and Restated Transition Services Agreement, SEACOR continues to provide us on an interim basis with certain support services, including information systems support, cash disbursement support, and treasury management. We expect these services to be provided for varying durations but no greater than two years from the time of the Spin-off. Although SEACOR is contractually obligated to provide us with services during the term of the agreement, we cannot assure you that these services will be performed as efficiently or proficiently after the expiration of the agreement, or that we will be able to replace these services in a timely manner or on comparable terms. They also contain provisions that may be more favorable than terms and provisions we might have obtained in arms-length negotiations with unaffiliated third parties. When SEACOR ceases to provide services pursuant to the agreement, our costs of procuring those services from third parties may increase. In addition, we may not be able to replace these services or enter into appropriate third-party agreements on terms and conditions, including cost, comparable to those under the Amended and Restated Transition Services Agreement. Although we intend to replace some of the services that will be provided by SEACOR under the Amended and Restated Transition Services Agreement, we may encounter difficulties replacing certain services or be unable to negotiate pricing or other terms as favorable as those we currently have in effect. To the extent that we may require additional support from SEACOR not addressed in the Amended and Restated Transition Services Agreement, we would need to negotiate the terms of receiving such corporate support in future agreements.
We may not realize all of the anticipated benefits of the Spin-off.
As an independent, publicly traded company, we believe that our business will benefit from, among other things, allowing us to better focus our financial and operational resources on our specific business, allowing our management to design and implement corporate strategies and policies that are based primarily on the business characteristics and strategic decisions of our business, allowing us to more effectively respond to industry dynamics and allowing the creation of effective incentives for our management and employees that are more closely tied to our business performance. However, we may not be able to achieve some or all of the benefits that we believe we can achieve as an independent company in the time we expect, if at all. Because our
26
business has previously operated as part of the wider SEACOR organization, we may not be able to successfully implement the changes necessary to operate independently and may incur additional costs that could adversely affect our business.
If there is a determination that the separation is taxable for U.S. federal income tax purposes because the facts, assumptions, representations or undertakings underlying the IRS ruling or tax opinion are incorrect or for any other reason, then SEACOR, its stockholders that are subject to U.S. federal income tax and Era Group could incur significant U.S. federal income tax liabilities.
In connection with the Spin-off, SEACOR received a private letter ruling from the IRS, together with an opinion of Weil, Gotshal & Manges LLP, tax counsel to SEACOR, substantially to the effect that, among other things, the separation qualifies as a transaction that is tax-free for U.S. federal income tax purposes under Section 355 of the Code. The ruling and opinion rely on certain facts, assumptions, representations and undertakings from SEACOR and us regarding the past and future conduct of the companies’ respective businesses and other matters. If any of these facts, assumptions, representations or undertakings are incorrect or not otherwise satisfied, SEACOR and its stockholders may not be able to rely on the ruling or the opinion and could be subject to significant tax liabilities. Notwithstanding the private letter ruling and opinion of tax counsel, the IRS could determine on audit that the separation is taxable if it determines that any of these facts, assumptions, representations or undertakings are not correct or have been violated or if it disagrees with the conclusions in the opinion that are not covered by the private letter ruling, or for other reasons, including as a result of certain significant changes in the stock ownership of SEACOR or us after the separation. If the separation is determined to be taxable, SEACOR, its stockholders that are subject to U.S. federal income tax and Era Group could incur significant U.S. federal income tax liabilities
Prior to the separation, we and SEACOR entered into the Tax Matters Agreement that governs the parties' respective rights, responsibilities and obligations with respect to taxes, tax attributes, the preparation and filing of tax returns, the control of audits and other tax proceedings and assistance and cooperation in respect of tax matters. Taxes relating to or arising out of the failure of certain of the transactions described in the private letter ruling request and the opinion of tax counsel to qualify as a tax-free transaction for U.S. federal income tax purposes will be borne by SEACOR, except, in general, if such failure is attributable to our action or inaction or SEACOR's action or inaction, as the case may be, or any event (or series of events) involving our assets or stock or the assets or stock of SEACOR, as the case may be, in which case the resulting liability will be borne in full by us or SEACOR, respectively.
Our obligations under the Tax Matters Agreement are not limited in amount or subject to any cap. Further, even if we are not responsible for tax liabilities of SEACOR and its subsidiaries under the Tax Matters Agreement, we nonetheless could be liable under applicable tax law for such liabilities if SEACOR were to fail to pay them. If we are required to pay any liabilities under the circumstances set forth in the Tax Matters Agreement or pursuant to applicable tax law, the amounts may be significant.
We may not be able to engage in certain corporate transactions for a period of time after the separation.
To preserve the tax-free treatment to SEACOR of the separation, under the Tax Matters Agreement that we entered into with SEACOR, we may not take any action that would jeopardize the favorable tax treatment of the distribution. These restrictions may limit our ability to pursue certain strategic transactions or engage in other transactions that might increase the value of our business for the two-year period following the separation. Refer to Item 13 of Part III—“Certain Relationships and Related Party Transactions—Agreements between SEACOR and Era Group Relating to the Separation—Tax Matters Agreement” for additional information.
A number of our directors own common stock and other equity instruments of SEACOR, which could cause conflicts of interests.
Our Non-Executive Chairman and a number of our other directors own a substantial amount of SEACOR common stock along with other equity instruments, the value of which is related to the value of common stock of SEACOR. The direct and indirect interests of our Non-Executive Chairman and other directors in common stock of SEACOR and the presence of certain of SEACOR’s principal executives on our board of directors could create, or appear to create, conflicts of interest with respect to matters involving both us and SEACOR that could have different implications for SEACOR than they do for us. As a result, we may be precluded from pursuing certain opportunities on which we would otherwise act, such as acquisitions or other opportunities for expansion that would otherwise fit within our business model or would complement our growth strategy.
The Spin-off may expose us to potential liabilities arising out of state and federal fraudulent conveyance laws and legal dividend requirements.
The distribution was subject to review under various state and federal fraudulent conveyance laws. Fraudulent conveyance laws generally provide that an entity engages in a constructive fraudulent conveyance when (i) the entity transfers assets and does not receive fair consideration or reasonably equivalent value in return, and (ii) the entity (a) is insolvent at the time of the transfer or is rendered insolvent by the transfer, (b) has unreasonably small capital with which to carry on its business, or (c) intends to incur or believes it will incur debts beyond its ability to repay its debts as they mature. An unpaid creditor or an entity acting on behalf of a creditor (including without limitation a trustee or debtor-in-possession in a bankruptcy by us or SEACOR or any of
27
our respective subsidiaries) may bring an action alleging that the distribution or any of the related transactions constituted a constructive fraudulent conveyance. If a court accepts these allegations, it could impose a number of remedies, including without limitation, voiding our claims against SEACOR, requiring our stockholders to return to SEACOR some or all of the shares of our Common Stock issued in the distribution, or providing SEACOR with a claim for money damages against us in an amount equal to the difference between the consideration received by SEACOR and the fair market value of our company at the time of the distribution.
The measure of insolvency for purposes of the fraudulent conveyance laws will vary depending on which jurisdiction’s law is applied. Generally, an entity would be considered insolvent if (1) the present fair saleable value of its assets is less than the amount of its liabilities (including contingent liabilities); (2) the present fair saleable value of its assets is less than its probable liabilities on its debts as such debts become absolute and matured; (3) it cannot pay its debts and other liabilities (including contingent liabilities and other commitments) as they mature; or (4) it has unreasonably small capital for the business in which it is engaged. We cannot assure you what standard a court would apply to determine insolvency or that a court would determine that we, SEACOR or any of our respective subsidiaries were solvent at the time of or after giving effect to the distribution.
The distribution of our Common Stock is also subject to review under state corporate distribution statutes. Under the General Corporation Law of the State of Delaware, a corporation may only pay dividends to its stockholders either (i) out of its surplus (net assets minus capital) or (ii) if there is no such surplus, out of its net profits for the fiscal year in which the dividend is declared and/or the preceding fiscal year. Although SEACOR intended that the distribution of our Common Stock be entirely from surplus, we cannot assure you that a court will not later determine that some or all of the distribution to SEACOR stockholders was unlawful.
As a condition to the distribution, the SEACOR board of directors obtained an opinion from a nationally recognized provider of such opinions that SEACOR and Era Group were each solvent and adequately capitalized immediately after the separation. We cannot assure you, however, that a court would reach the same conclusions set forth in such opinion in determining whether SEACOR or we were insolvent at the time of, or after giving effect to, the Spin-off, or whether lawful funds were available for the separation and the distribution to SEACOR’s stockholders.
|
ITEM 1B.
|
UNRESOLVED STAFF COMMENTS
|
None.
|
ITEM 2.
|
PROPERTIES
|
Our executive offices are located in Houston, Texas and we maintain our U.S. Gulf of Mexico regional headquarters in Lake Charles, Louisiana, where we coordinate operations for the entire U.S. Gulf of Mexico, manage the support of our worldwide operations, and house our primary maintenance facility and training center. We maintain additional bases in the U.S. Gulf of Mexico near key offshore development sites as well.
In addition, we maintain multiple operating bases in Alaska, including the regional headquarters in Anchorage and two seasonal locations to support flightseeing activity. Medical services are typically provided from customer-owned facilities.
The majority of the bases from which we operate are leased.
Helicopters are the principal physical properties owned by the Company and are more fully described in “Item 1. Business.”
|
ITEM 3.
|
LEGAL PROCEEDINGS
|
In the normal course of our business, we become involved in various other litigation matters including, among other things, claims by third parties for alleged property damages and personal injuries. Management has used estimates in determining our potential exposure to these matters and has recorded reserves in its financial statements related thereto as appropriate. It is possible that a change in our estimates related to these exposures could occur, but we do not expect such changes in estimated costs would have a material effect on our consolidated financial position or results of operations.
|
ITEM 4.
|
MINE SAFETY DISCLOSURES
|
Not applicable.
28
EXECUTIVE OFFICERS OF THE REGISTRANT
Officers of Era Group serve at the pleasure of the Board of Directors. The name, age and offices held by each of the executive officers of Era Group as of March 14, 2014 were as follows:
|
Name
|
Age
|
Position
|
||
|
Sten L. Gustafson
|
47
|
Chief Executive Officer since April 2012. Mr. Gustafson was appointed a Director of the Company in November 2012. From 2009 until 2012, Mr. Gustafson served as Managing Director and Head of Energy, Americas at Deutsche Bank Securities. From 2004 until 2009, Mr. Gustafson was an investment banker at UBS Investment Bank. In addition, Mr. Gustafson is an officer and director of certain Era Group joint ventures and subsidiaries.
|
||
|
Christopher S. Bradshaw
|
37
|
Executive Vice President and Chief Financial Officer since October 2012. From 2009 until 2012, Mr. Bradshaw served as Managing Partner and Chief Financial Officer of U.S. Capital Advisors LLC, an independent financial advisory firm. Prior to co-founding U.S. Capital Advisors, he was an energy investment banker at UBS Securities LLC, Morgan Stanley & Co., and PaineWebber Incorporated. In addition, Mr. Bradshaw is an officer and director of certain Era Group joint ventures and subsidiaries.
|
||
|
Shefali A. Shah
|
42
|
Senior Vice President, General Counsel and Corporate Secretary since March 2014 and served as our Acting General Counsel and Corporate Secretary from the Spin-off in February 2013 until February 2014. Since June 2006, Ms. Shah held several positions with Comverse Technology, Inc., including Senior Vice President, General Counsel and Corporate Secretary. Prior thereto, Ms. Shah was an associate at Weil Gotshal & Manges LLP from September 2002 to May 2006 and Hutchins, Wheeler & Dittmar, P.C. from September 1996 to September 2002.
|
||
|
Stuart Stavley
|
41
|
Senior Vice President—Fleet Management since October 2012. From October 2010 to October 2012, Mr. Stavley served as Vice President—Fleet Management of the Company. From September 2008 through October 2010, he served as the Company's Director of Technical Services and from September 2005 through September 2008 as the Company's Director of Maintenance. He began with the Company in 1993 and prior to September 2005 also served as Chief Inspector and Field AMT.
|
||
|
Paul White
|
38
|
Senior Vice President—Domestic since October 2012. From August 2010 to October 2012, Mr. White served as Vice President, General Manager Gulf of Mexico of the Company. Mr. White served as the Company's General Manager of Training from September 2008 to August 2010 and Director of Training from 2007 to 2010. Previously Mr. White served in various roles for the Company including Pilot, Check Airman, Senior Check Airman and Assistant Chief Pilot CFP Part 135.
|
||
|
Jennifer Whalen
|
40
|
Vice President and Chief Accounting Officer since August 2013. From April 2012 to August 2013, Ms. Whalen served as the Company's Controller. From August 2007 to March 2012, Ms. Whalen served in several capacities at nLIGHT Photonics Corporation, including as Director of Accounting. Prior to these roles, Ms. Whalen served as the Manager of Accounting at InFocus Corporation for just over two years. Ms. Whalen started her career in the assurance practice with PricewaterhouseCoopers LLP.
|
||
|
ITEM 5.
|
MARKET FOR REGISTRANT’S COMMON EQUITY, RELATED STOCKHOLDER MATTERS AND ISSUER PURCHASES OF EQUITY SECURITIES
|
Market for the Company’s Common Stock
Era Group’s Common Stock trades on the New York Stock Exchange (“NYSE”) under the trading symbol “ERA.” A “when-issued” trading market for Era Group's Common Stock on the NYSE began on January 22, 2013 and “regular-way” trading of Era Group’s Common Stock began on February 1, 2013. Prior to January 22, 2013, there was no public market for Era Group’s Common Stock. Set forth in the table below for the periods presented are the high and low sale prices for Era Group’s Common Stock.
29
|
HIGH
|
LOW
|
|||
|
Fiscal Year Ending December 31, 2013:
|
||||
|
First Quarter (from February 1, 2013)
|
$23.80
|
$18.55
|
||
|
Second Quarter
|
28.03
|
20.85
|
||
|
Third Quarter
|
27.95
|
24.17
|
||
|
Fourth Quarter
|
34.64
|
26.59
|
||
On March 14, 2014, the last reported sale price of our Common Stock on the NYSE was $29.60 per share.
Holders of Record
As of February 28, 2014, there were 188 holders of record of Common Stock.
Dividends
We have not paid cash dividends and do not currently intend to pay dividends on our Common Stock. We intend to retain all available funds and any future earnings to reduce debt and fund the development and growth of our business. Our Revolving Credit Facility and Senior Notes limit our ability to pay dividends. Future agreements we may enter into, including with respect to any future debt we may incur, may also further limit or restrict our ability to pay dividends. Any future determination to pay dividends will be at the discretion of our board of directors and will take into account:
|
•
|
restrictions in our Revolving Credit Facility, Senior Notes and other debt instruments of ours outstanding at that time;
|
|
•
|
general economic and business conditions;
|
|
•
|
our financial condition and results of operations;
|
|
•
|
our capital requirements and the capital requirements of our subsidiaries;
|
|
•
|
the ability of our operating subsidiaries to pay dividends and make distributions to us; and
|
|
•
|
such other factors as our board of directors may deem relevant.
|
Company Purchase of Equity Securities
The following table presents information regarding our repurchases of shares of our Common Stock on a monthly basis during the fourth quarter of 2013:
|
Total Number of Shares Purchased
(1)
|
Average Price Paid Per Share
|
Total Number of Shares
Purchased as Part of
Publicly Announced
Plans or Programs
(2)
|
Maximum Value of
shares that may Yet
be Purchased under
the Plans or Programs
|
|||||||||||
|
10/01/13 - 10/31/13
|
—
|
|
$
|
—
|
|
—
|
|
$
|
—
|
|
||||
|
11/01/13 - 11/30/13
|
—
|
|
$
|
—
|
|
—
|
|
$
|
—
|
|
||||
|
12/01/13 - 12/31/13
|
377
|
|
$
|
32.39
|
|
—
|
|
$
|
—
|
|
||||
|
(1)
|
Represents the surrender of shares of Common Stock to satisfy statutory minimum tax withholding obligations in connection with the vesting of restricted stock awards issued to employees under our stockholder-approved long-term incentive plan.
|
(2) We did not have at any time during the quarter, and currently do not have, a share repurchase program in place.
30
Performance Graph
The following graph shows a comparison from February 1, 2013 through December 31, 2013 of the cumulative total return for our Common Stock, the Standard & Poor's 500 Stock Index (S&P 500 Index), the Standard & Poor's Oil & Gas Equipment Select Industry Index and our peer group
(1)
. The graph assumes that $100 was invested at the market close on February 1, 2013.
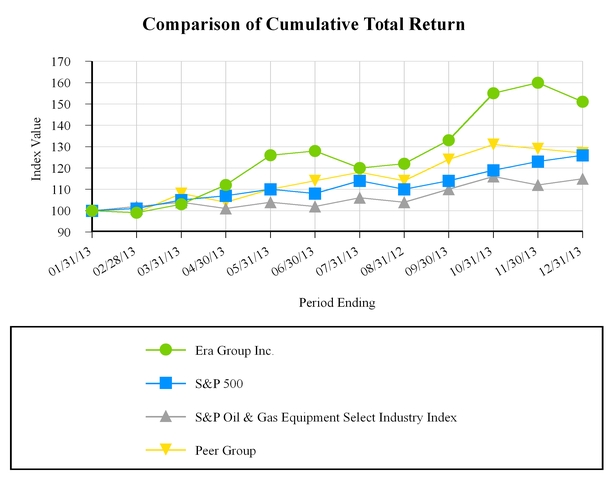
_________________________
(1) Index of Air Methods Corp, Bristow Group Inc., Gulfmark Offshore Inc., Hornbeck Offshore Services Inc., PHI Inc., Seacor Holdings Inc. and Tidewater Inc.
|
ITEM 6.
|
SELECTED FINANCIAL DATA
|
SELECTED HISTORICAL FINANCIAL INFORMATION
The following table sets forth, for the periods indicated, selected historical consolidated financial data for the Company (in thousands, except per share data). Such financial data should be read in conjunction with “Item 7. Management’s Discussion and Analysis of Financial Condition and Results of Operations” and “Item 8. Financial Statements and Supplementary Data” included in Parts II and IV, respectively, of this Annual Report on Form 10-K.
31
|
|
Years Ended December 31,
|
|||||||||||||||||||
|
|
2013
|
2012
|
2011
|
2010
|
2009
|
|||||||||||||||
|
Statements of Operations Data:
|
||||||||||||||||||||
|
Operating Revenues
|
$
|
298,959
|
|
$
|
272,921
|
|
$
|
258,148
|
|
$
|
235,366
|
|
$
|
235,667
|
|
|||||
|
Operating income
|
46,163
|
|
32,051
|
|
36,108
|
|
19,748
|
|
29,274
|
|
||||||||||
|
Net income (loss) attributable to Era Group Inc.
|
18,705
|
|
7,787
|
|
2,108
|
|
(3,639
|
)
|
1,839
|
|
||||||||||
|
Earnings (Loss) Per Common Share:
|
||||||||||||||||||||
|
Basic and diluted
|
$
|
0.88
|
|
$
|
(0.03
|
)
|
$
|
0.18
|
|
$
|
(3,639.00
|
)
|
$
|
1,839.00
|
|
|||||
|
Statement of Cash Flows Data – provided by (used in):
|
||||||||||||||||||||
|
Operating activities
|
$
|
64,371
|
|
$
|
13,915
|
|
$
|
40,930
|
|
$
|
83,743
|
|
$
|
57,234
|
|
|||||
|
Investing activities
|
(43,459
|
)
|
(114,765
|
)
|
(149,089
|
)
|
(132,549
|
)
|
(64,116
|
)
|
||||||||||
|
Financing activities
|
(1,508
|
)
|
32,634
|
|
183,094
|
|
46,963
|
|
9,386
|
|
||||||||||
|
Effects of exchange rate changes on cash and cash equivalents
|
426
|
|
599
|
|
489
|
|
(1,768
|
)
|
(1,396
|
)
|
||||||||||
|
Capital expenditures
|
(110,105
|
)
|
(112,986
|
)
|
(158,929
|
)
|
(130,770
|
)
|
(90,762
|
)
|
||||||||||
|
Balance Sheet Data (at period end):
|
||||||||||||||||||||
|
Cash and cash equivalents
|
$
|
31,335
|
|
$
|
11,505
|
|
$
|
79,122
|
|
$
|
3,698
|
|
$
|
7,309
|
|
|||||
|
Total assets
|
958,583
|
|
937,564
|
|
933,224
|
|
719,024
|
|
627,156
|
|
||||||||||
|
Long-term debt, less current portion
|
279,391
|
|
276,948
|
|
285,098
|
|
35,885
|
|
—
|
|
||||||||||
|
Total equity
|
436,061
|
|
275,285
|
|
275,147
|
|
163,593
|
|
167,496
|
|
||||||||||
32
|
ITEM 7.
|
MANAGEMENT’S DISCUSSION AND ANALYSIS OF FINANCIAL CONDITION AND RESULTS OF OPERATIONS
|
Overview
We are one of the largest helicopter operators in the world and the longest serving helicopter transport operator in the U.S., which is our primary area of operations. Our helicopters are primarily used to transport personnel to, from and between, offshore installations, drilling rigs and platforms. In the year ended
December 31, 2013
, approximately
60%
and
18%
of our total operating revenues were earned in the U.S. Gulf of Mexico and Alaska, respectively, and in the year ended December 31, 2012,
56%
and 15% of our total operating revenues were earned in such regions, respectively. We also provide helicopters and related services to third-party helicopter operators in other countries. In addition to our U.S. customers, we currently have customers in Brazil, Canada, India, Mexico, Norway, Spain, Sweden, the United Kingdom and Uruguay.
The primary users of our transport services are major integrated and independent oil and gas companies and U.S. government agencies. In the years ended
December 31, 2013
and 2012, approximately
75%
and
65%
of our operating revenues, respectively, were derived from helicopter services, including emergency search and rescue services, provided to clients primarily involved in oil and gas activities. In addition to serving the oil and gas industry, we provide helicopters under dry-lease, air medical services, firefighting support and Alaska flightseeing tours, among other activities.
As of
December 31, 2013
, we owned or operated a total of
165
helicopters, consisting of
nine
heavy helicopters,
61
medium helicopters,
36
light twin engine helicopters and
59
light single engine helicopters. In addition, we had two AW139 medium helicopters that were fully paid for in 2013 but not delivered and operational until 2014. As of
December 31, 2013
, we had commitments to purchase an additional
21
new helicopters consisting of
ten
AW189 heavy helicopters, four S92 heavy helicopters,
two
AW139 medium helicopters and
five
AW169 light twin helicopters. The AW139 helicopters are scheduled to be delivered in 2014. The AW189 helicopters are scheduled to be delivered beginning 2014 through 2017. The S92 helicopters are scheduled to be delivered in 2016 and 2017. Delivery dates for the AW169 helicopters have yet to be determined. In addition, we had outstanding options to purchase up to an additional ten AW189 helicopters, five S92 helicopters and four AW139 helicopters. If these options were exercised, the helicopters would be delivered beginning in 2014 through 2018.
Demand for new, sophisticated equipment continues to grow, particularly in response to the requirements of the offshore oil and gas industry, which has become more focused on deepwater activities. To service these new areas of exploration, helicopters must have greater payloads and range. Helicopters supporting air medical and search and rescue operations and other public uses also require new technology and safety improvements. According to PFC Energy in its September 2013 Oil and Gas Helicopter Fleet Analysis presentation, approximately 28% of the global helicopter fleet was more than 20 years old. Replacement is hampered by the following factors: (i) there are only four major helicopter original equipment manufacturers (“OEMs”) that have a full range of service models; (ii) lead times for delivery of new equipment can be as long as three years; and (iii) many smaller operators are still unable to raise capital.
We believe our Revolving Credit Facility (to the extent of our borrowing capacity thereunder) and our strong relationships with OEMs will help position us to add new helicopters to our fleet and upgrade existing helicopters, thereby maintaining an asset base suitable for use within our own operations and for dry-leasing to other operators. We also leverage our strong relationships with OEMs to support growth in other services, such as selling specialty equipment and accessories for helicopters, and training.
On January 31, 2013, SEACOR completed the Spin-off of the Company by means of a dividend to SEACOR’s stockholders of all of the Company’s issued and outstanding Common Stock. Prior to the Spin-off, SEACOR and the Company entered into a distribution agreement and several other agreements that will govern their post-Spin-off relationship. Era Group is now an independent company with its Common Stock listed on the New York Stock Exchange under the symbol “ERA”.
Offshore Oil and Gas Support
The offshore oil and gas market is highly cyclical with demand linked to the price of oil and gas, which tends to fluctuate depending on many factors, including global economic activity and levels of inventory. In addition to the price of oil and gas, the availability of acreage and local tax incentives or disincentives and requirements for maintaining interests in leases affect activity levels in the oil and gas industry. Price levels for oil and gas by themselves can cause additional fluctuations by inducing changes in consumer behavior.
For the last seven years we have provided transportation services to government inspectors of offshore installations, drilling rigs and platforms. This contract was renewed in 2011 and is expected to run through 2016. As of
December 31, 2013
, 25 of our helicopters were operating under this contract with customer options to increase the number to up to 30 helicopters.
Brazil is among the most important markets for offshore oil and gas activity world-wide. We believe the Brazilian market will require significant additions to the heavy and medium helicopter fleet currently in operation in the country as it expands its production efforts over time. The U.S. Energy Information Administration has stated that recent discoveries of large offshore, pre-salt oil deposits could transform Brazil into one of the larger oil producers in the world, and Petroelo Brasileiro S.A. (“Petrobras
33
Brazil”) has estimated that it will achieve an oil production target of approximately four million barrels per day by 2020.
We committed to participate in this market by acquiring an ownership interest in Aeróleo Taxi Aereo S/A (“Aeróleo”), a Brazilian helicopter operator, in July 2011. A detailed discussion of some of the financial difficulties experienced by Aeróleo thereafter is described below.
We also provide search and rescue services in the U.S. Gulf of Mexico on a subscription basis. We currently have three AW139 helicopters configured for this service and several subscribers.
Dry-Leasing
Beginning in 2005, we began to deploy helicopters in international markets, frequently under dry-lease arrangements to third parties. The majority of these helicopters are supporting oil and gas activities in regions of rapidly expanding activity, such as Brazil and India. We also have equipment working in the North Sea, Mexico and Spain. As of
December 31, 2013
, we had
41
helicopters located in foreign jurisdictions compared with 15 helicopters as of December 31, 2006. In many cases the helicopters are contracted to local helicopter operators, which often prefer to lease helicopters rather than purchase them. Dry-leasing affords us the opportunity to access new markets without significant initial infrastructure investment and generally without ongoing operating risk.
As of
December 31, 2013
, we had three EC225 heavy helicopters and nine AW139 helicopters dry-leased to Aeróleo, which provides helicopter transportation services to OGX Petroleo e Gas Participacoes S.A, Petrobras Brazil, Queiroz Galvão S/A, Repsol Brazil, S.A. and Saipem do Brasil Lda. under multi-year contracts. A number of the AW139 helicopters on dry-lease to Aeróleo were idle from August 2011 until late November 2012. In November 2012, Aeróleo executed contracts with Petrobras Brazil as a result of an emergency tender issued by Petrobras Brazil due to the suspension of the use of the EC225 helicopters and it began to utilize four AW139 helicopters until termination of the contract on November 30, 2013.
These AW139 helicopters are expected to be deployed under multi-year contracts with Petrobras Brazil commencing in October 2014, but are not currently under contract following the termination of the emergency tender contract.
As noted above, Petrobras Brazil alleged that the EC225 helicopters could not meet the terms of the contract and attempted to unilaterally suspend its EC225 helicopter contracts with Aeróleo and other operators in Brazil, commencing in April 2013 for the duration of the suspension. Petrobras Brazil commenced paying the monthly rate again in September and October 2013 and hourly rates upon resumption of EC225 helicopter flight operations in November and December 2013.
We hold a 51% interest in Lake Palma S.L. (“Lake Palma”), a joint venture that dry-leases helicopters to Fumigación Aérea Andaluza S.A., a firefighting operator based in Spain (“FAASA”). In addition, we had three light single helicopters and nine medium helicopters dry-leased directly to FAASA. We are also focused on developing our presence in the Australia, India and Southeast Asia helicopter markets, which we believe represent growth opportunities.
Other Activities and Services
Consistent with our strategy to selectively diversify sources of earnings and cash flow, we deploy a number of helicopters in support of other industries and activities. In the years ended
December 31, 2013
and 2012, approximately
9%
and
13%
of our operating revenues were generated by these other activities and services. In 2007, we entered the air medical services market through the acquisition of the flight operations of Keystone Helicopter Corporation. We now supply helicopters, pilots and mechanics to hospitals and manage helicopters on their behalf.
We also operate a fixed based operation (“FBO”) at Ted Stevens Anchorage International Airport, provide Alaska summer flightseeing tours and support inland firefighting and mining operations in Alaska.
We have also developed services to the helicopter industry that we believe complement our core activities. We hold a 50% interest in Dart Holding Company Ltd. (“Dart”), an international sales and manufacturing organization focused on after-market helicopter parts and accessories. We hold a 50% interest in Era Training Center LLC (“Era Training”) that provides classroom instruction, flight simulator, helicopter and other training to our employees, pilots working for third parties, other helicopter companies, including our competitors, and government agencies.
Aeroleo - Recent Developments
Aeróleo, our Brazilian joint venture, has experienced financial difficulties since our investment in July 2011. In August 2011, Petrobras Brazil canceled an award for AW139 helicopters in response to an accident involving an AW139 helicopter on contract with Petrobras Brazil from one of Aeróleo’s competitors. As a result, four of our AW139 helicopters under dry-lease to Aeróleo that had been mobilized in response to notification that Aeróleo was successful in its bid to place them on contract with Petrobras Brazil remained idle from August 2011 until late November 2012. In November 2012, in response to the suspension of the use of EC225 helicopters described above, Petrobras Brazil contracted with Aeróleo to utilize these four AW139 helicopters until termination of the contract on November 30, 2013. These AW139 helicopters are scheduled to begin multi-year contracts with Petrobras Brazil commencing in October 2014, but are not currently under contract following the termination of the emergency tender contract.
34
In addition, Petrobras Brazil attempted to unilaterally suspend its EC225 helicopter contracts with Aeróleo and the other operators in Brazil commencing April 1, 2013, following the suspension of the use of the EC225 helicopters and alleging that the EC225 helicopters could not meet the terms of the contract. Aeróleo did not receive monthly payments for its EC225 helicopters under contract with Petrobras Brazil from April through late September and October 2013, and commenced generating hourly flight revenues thereafter upon the resumption of Aeróleo’s EC225 helicopters flight operations for Petrobras Brazil.
Another Aeróleo customer, OGX Petroleo & Gas Participacoes SA (“OGX”), has recently experienced financial difficulties and has filed for bankruptcy protection. These financial difficulties could impair OGX's ability to pay its receivables to Aeróleo, which could, in turn, impair Aeróleo's ability to make its dry-lease payments owed to us and impact our revenue. We currently recognize revenues from Aeróleo only as cash is received.
In addition to these financial difficulties, we were in a dispute with our partner in Aeróleo with respect to our contractual shareholder rights in connection with any attempted sale or transfer of our partner's interests, which was being resolved through arbitration. On February 15, 2014, definitive agreements were executed with respect to the transfer to a third party of the 50% economic and 80% voting interest held by our partner in Aeróleo. As consideration for the transfer of interests and the other terms and conditions of the transaction, Aeróleo will be required to make payments to affiliates of the transferring partner in the form of severance and partial repayment of shareholder loans that will likely require a capital infusion by us of approximately $2 million. The transaction remains subject to the satisfaction of customary closing conditions, including receipt of required local regulatory approval, and is expected to close in the second half of 2014. On February 19, 2014, in connection with the execution of the definitive agreements, we filed a joint motion to dismiss the ongoing arbitration with our partner. As a result of the transaction, we may be required to consolidate the financial results of Aeróleo upon consummation thereof. Please see Note 20 “Subsequent Event” of the Notes to the Consolidated Financial Statements included in Item 8 of this Annual Report on Form 10-K for information regarding an agreement entered into with our partner in Aeróleo.
A continuation of any combination of these financial difficulties, taken separately or together, may impede Aeróleo’s ability to pay for equipment leased from us, necessitate an infusion of capital from us to allow Aeróleo to continue to operate and, as a result, adversely impact our results of operations. Due to liquidity issues experienced by Aeróleo, as of December 31, 2013, we had deferred the recognition of $21.0 million of revenues from Aeróleo. Refer to Item 1A of Part I—“Risk Factors—We rely on relatively few customers for a significant share of our revenues, the loss of any of which could adversely affect our business and results of operations” for additional information.
Fleet Developments and Capital Commitments
In recent years, we have continued to focus on the modernization of our fleet and, when possible, standardization of equipment. Oil and gas companies typically require modern helicopters that offer enhanced safety features and greater performance. Customers flying offshore tend to prefer twin-engine helicopters to single-engine helicopters due to the additional safety afforded from two engines. In response to this demand, we have transformed our fleet significantly. Since the beginning of 2005, we have added 125 helicopters, disposed of 93 helicopters and reduced the average age of our owned fleet from 17 years to
12
years. As of
December 31, 2013
,
25%
of our fleet was five years old or less. We have spent
$110.1 million
, $113.0 million and $158.9 million to acquire helicopters and other equipment in the years ended
December 31, 2013
, 2012 and 2011, respectively, primarily for heavy and medium helicopters.
As of
December 31, 2013
, we had commitments of $
341.7 million
, primarily pursuant to agreements to purchase helicopters, consisting of
ten
AW189 helicopters, four S92 helicopters,
two
AW139 helicopters and
five
AW169 helicopters. The AW139 helicopters are scheduled to be delivered in 2014. The AW189 helicopters are scheduled to be delivered beginning 2014 through 2017. The S92 helicopters are scheduled to be delivered in 2016 and 2017. Delivery dates for the AW169 helicopters have yet to be determined. Approximately $
164.4 million
of these commitments (inclusive of deposits paid on options not yet exercised) may be terminated without further liability other than aggregate liquidated damages of $
11.1 million
. In addition, we had outstanding options to purchase up to an additional ten AW189 helicopters, five S92 helicopters and four AW139 helicopters. If these options were exercised, the helicopters would be delivered beginning in 2014 through 2018.
35
Components of Revenues and Expenses
We derive our revenues primarily from operating and dry-leasing our equipment and our profits depend on our cost of capital, the acquisition costs of assets, our operating costs, our contract policy and our reputation.
Operating revenues recorded under U.S. Gulf of Mexico are primarily generated from offshore oil and gas related activities. Similarly, operating revenues recorded under Alaska are primarily generated from offshore oil and gas related activities but also include revenues from operations supporting firefighting and mining activities. In both the U.S. Gulf of Mexico and Alaska, operating revenues are typically earned through a combination of fixed monthly fees plus an incremental charge based on flight hours flown. Charter revenues are typically earned through either a combination of a daily fixed fee plus a charge based on hours flown or an hourly rate with a minimum number of hours to be charged daily.
Operating revenues recorded under dry-leasing are generated from dry-leases to third-party operators or joint venture partners, where we are not responsible for the operation of the helicopters. For certain of these dry-leases, we also provide crew training, management expertise, and logistical and maintenance support. Dry-leases typically call for a fixed monthly fee only, but may also include an additional charge based on flight hours flown. The majority of our dry-leasing revenues have been generated by helicopters deployed internationally.
Operating revenues for search and rescue services are earned through a fixed monthly fee plus an incremental charge for flight hours flown, and charter revenues are typically earned through either a combination of a daily fixed fee plus a charge based on hours flown or an hourly rate with a minimum number of hours to be charged daily.
Operating revenues recorded under air medical services include revenues from management services to hospitals. Operating revenues are earned through a fixed monthly fee plus an incremental charge for flight hours flown.
Operating revenues recorded under flightseeing are generated on a per passenger basis.
The aggregate cost of our operations depends primarily on the size and asset mix of the fleet. Our operating costs and expenses are grouped into the following categories:
|
•
|
personnel (includes wages, benefits, payroll taxes, savings plans, subsistence and travel);
|
|
•
|
repairs and maintenance (primarily routine activities as well as helicopter refurbishments and engine and major component overhauls that are performed in accordance with planned maintenance programs);
|
|
•
|
insurance (the cost of hull and liability insurance premiums and loss deductibles);
|
|
•
|
fuel;
|
|
•
|
leased-in equipment (includes the cost of leasing helicopters and equipment); and
|
|
•
|
other (primarily base expenses, property, sales and use taxes, communication costs, freight expenses, and other).
|
We engage a number of third-party vendors to maintain the engines and certain components on some of our helicopter models under programs known as “power-by-hour” maintenance contracts. These programs require us to pay for the maintenance service ratably over the contract period, typically based on actual flight hours. Power-by-hour providers generally bill monthly based on hours flown in the prior month, the costs being expensed as incurred. In the event we place a helicopter in a program after a maintenance period has begun, it may be necessary to pay an initial buy-in charge based on hours flown since the previous maintenance event. This buy-in charge is normally recorded as a prepaid expense and amortized as an operating expense over the remaining power-by-hour contract period. If a helicopter is sold or otherwise removed from a program before the scheduled maintenance work is carried out, we may be able to recover part of our payments to the power-by-hour provider, in which case we record a reduction to operating expense when we receive the refund. We also incur repairs and maintenance expense through vendor arrangements whereby we obtain repair quotes and authorize service through a repair order process.
Our policy of expensing all repair costs as incurred may result in operating expenses varying substantially when compared with a prior year or prior quarter if a disproportionate number of repairs, refurbishments or overhauls are undertaken. This variation can be exacerbated by the timing of entering or exiting third-party power-by-hour programs.
For helicopters that we dry-lease to third parties under arrangements whereby the customer assumes operational responsibility, we often provide maintenance and parts support but generally we incur no other material operating costs. In most instances our dry-leases require clients to procure adequate insurance but we purchase contingent hull and liability coverage to mitigate the risk of a client’s coverage failing to respond. In some instances we provide training and other services to support our dry-lease customers.
36
Prior to our entry into our Revolving Credit Facility on December 22, 2011, we participated in a cash management program whereby certain of our operating and capital expenditures were funded through advances from SEACOR and certain cash collections of ours were forwarded to SEACOR. We incurred interest on the outstanding advances, which is reported as interest expense on advances from SEACOR in our consolidated statements of operations. Interest was calculated and settled on a quarterly basis using interest rates set at the discretion of SEACOR. Following our entry into our Revolving Credit Facility, we no longer participate in this cash management program.
SEACOR had provided certain support services to us under a shared services arrangement, including payroll processing, information systems support, cash disbursement support, cash receipt processing and treasury management. We were historically charged for our share of actual costs incurred, generally based on volume processed or units supported. On December 30, 2011, we entered into a Transition Services Agreement, providing for the same services described above, pursuant to which SEACOR continued to provide these support services. In connection with the Spin-off we entered into an Amended and Restated Transition Services Agreement with SEACOR pursuant to which such services will continue to be provided for a period of time after the Spin-off but not to exceed two years from the time of the Spin-off.
SEACOR incurred costs in providing its operating segments with certain corporate services including executive oversight, risk management, legal, accounting and tax, and charged quarterly management fees to its operating segments in order to cover such costs. Total management fees charged by SEACOR to its operating segments include actual corporate costs incurred plus a mark-up and were generally allocated within the consolidated group using income-based performance metrics reported by an operating segment in relation to SEACOR’s other operating segments. The costs we incurred for management fees from SEACOR are reported as SEACOR management fees in our consolidated statements of operations. Effective January 1, 2012, SEACOR provided these corporate services under the Transition Services Agreement for a fixed quarterly charge of $500,000, subject to the terms and conditions of the Transition Services Agreement. Upon completion of the Spin-off, we are no longer charged a management fee by SEACOR but incur costs under the Amended and Restated Transition Services Agreement.
37
Results of Operations
|
|
2013
|
2012
|
2011
|
|||||||||||||||
|
|
$000s
|
%
|
$000s
|
%
|
$000s
|
%
|
||||||||||||
|
Operating Revenues:
|
||||||||||||||||||
|
United States
|
245,581
|
|
82
|
|
213,920
|
|
78
|
|
185,677
|
|
72
|
|
||||||
|
Foreign
|
53,378
|
|
18
|
|
59,001
|
|
22
|
|
72,471
|
|
28
|
|
||||||
|
298,959
|
|
100
|
|
272,921
|
|
100
|
|
258,148
|
|
100
|
|
|||||||
|
Costs and Expenses:
|
||||||||||||||||||
|
Operating:
|
||||||||||||||||||
|
Personnel
|
69,658
|
|
23
|
|
65,273
|
|
24
|
|
61,527
|
|
24
|
|
||||||
|
Repairs and maintenance
|
56,830
|
|
19
|
|
43,924
|
|
16
|
|
49,756
|
|
19
|
|
||||||
|
Insurance and loss reserves
|
10,609
|
|
3
|
|
10,750
|
|
4
|
|
8,479
|
|
3
|
|
||||||
|
Fuel
|
23,491
|
|
8
|
|
22,021
|
|
8
|
|
20,131
|
|
8
|
|
||||||
|
Leased-in equipment
|
2,941
|
|
1
|
|
1,450
|
|
—
|
|
2,003
|
|
1
|
|
||||||
|
Other
|
23,083
|
|
8
|
|
23,777
|
|
9
|
|
20,811
|
|
8
|
|
||||||
|
186,612
|
|
62
|
|
167,195
|
|
61
|
|
162,707
|
|
63
|
|
|||||||
|
Administrative and general
|
38,924
|
|
13
|
|
34,785
|
|
13
|
|
31,893
|
|
12
|
|
||||||
|
Depreciation and amortization
|
45,561
|
|
15
|
|
42,502
|
|
15
|
|
42,612
|
|
17
|
|
||||||
|
271,097
|
|
90
|
|
244,482
|
|
89
|
|
237,212
|
|
92
|
|
|||||||
|
Gains on Asset Dispositions and Impairments, Net
|
18,301
|
|
6
|
|
3,612
|
|
1
|
|
15,172
|
|
6
|
|
||||||
|
Operating Income
|
46,163
|
|
16
|
|
32,051
|
|
12
|
|
36,108
|
|
14
|
|
||||||
|
Other Income (Expense):
|
||||||||||||||||||
|
Interest income
|
591
|
|
—
|
|
910
|
|
—
|
|
738
|
|
—
|
|
||||||
|
Interest expense
|
(18,050
|
)
|
(6
|
)
|
(10,648
|
)
|
(4
|
)
|
(1,376
|
)
|
(1
|
)
|
||||||
|
Interest expense on advances from SEACOR
|
—
|
|
—
|
|
—
|
|
—
|
|
(23,410
|
)
|
(9
|
)
|
||||||
|
SEACOR management fees
|
(168
|
)
|
—
|
|
(2,000
|
)
|
(1
|
)
|
(8,799
|
)
|
(3
|
)
|
||||||
|
Derivative losses, net
|
(104
|
)
|
—
|
|
(490
|
)
|
—
|
|
(1,326
|
)
|
—
|
|
||||||
|
Foreign currency gains, net
|
698
|
|
—
|
|
720
|
|
—
|
|
516
|
|
—
|
|
||||||
|
Other, net
|
19
|
|
—
|
|
30
|
|
—
|
|
9
|
|
—
|
|
||||||
|
(17,014
|
)
|
(6
|
)
|
(11,478
|
)
|
(5
|
)
|
(33,648
|
)
|
(13
|
)
|
|||||||
|
Income Before Income Tax Expense and Equity in Earnings (Losses) of 50% or Less Owned Companies
|
29,149
|
|
10
|
|
20,573
|
|
7
|
|
2,460
|
|
1
|
|
||||||
|
Income Tax Expense
|
11,727
|
|
4
|
|
7,298
|
|
2
|
|
434
|
|
—
|
|
||||||
|
Income Before Equity in Earnings (Losses) of 50% or Less Owned Companies
|
17,422
|
|
6
|
|
13,275
|
|
5
|
|
2,026
|
|
1
|
|
||||||
|
Equity in Earnings (Losses) of 50% or Less Owned Companies
|
882
|
|
—
|
|
(5,528
|
)
|
(2
|
)
|
82
|
|
—
|
|
||||||
|
Net Income
|
18,304
|
|
6
|
|
7,747
|
|
3
|
|
2,108
|
|
1
|
|
||||||
|
Net Loss Attributable to Noncontrolling Interest
|
401
|
|
—
|
|
40
|
|
—
|
|
—
|
|
—
|
|
||||||
|
Net Income Attributable to Era Group Inc.
|
18,705
|
|
6
|
|
7,787
|
|
3
|
|
2,108
|
|
1
|
|
||||||
|
Accretion of Redemption Value on Series A Preferred Stock
|
721
|
|
—
|
|
8,469
|
|
3
|
|
210
|
|
—
|
|
||||||
|
Net Income (Loss) Attributable to Common Shares
|
17,984
|
|
6
|
|
(682
|
)
|
—
|
|
1,898
|
|
1
|
|
||||||
38
Operating Revenues by Service Line.
The following tables set forth, for the years indicated, the amount of operating revenues by service line.
|
|
2013
|
2012
|
2011
|
|||||||||||||||
|
|
$000s
|
%
|
$000s
|
%
|
$000s
|
%
|
||||||||||||
|
Operating Revenues:
|
||||||||||||||||||
|
Oil and Gas
(1)
|
||||||||||||||||||
|
U.S. Gulf of Mexico
|
160,611
|
|
54
|
|
140,900
|
|
52
|
|
109,635
|
|
42
|
|
||||||
|
Alaska
|
38,255
|
|
13
|
|
25,969
|
|
9
|
|
23,602
|
|
9
|
|
||||||
|
International
|
4,768
|
|
2
|
|
—
|
|
—
|
|
—
|
|
—
|
|
||||||
|
203,634
|
|
69
|
|
166,869
|
|
61
|
|
133,237
|
|
51
|
|
|||||||
|
Dry-leasing
|
48,963
|
|
16
|
|
59,256
|
|
22
|
|
72,700
|
|
28
|
|
||||||
|
Search and Rescue
|
16,764
|
|
6
|
|
10,674
|
|
4
|
|
9,514
|
|
4
|
|
||||||
|
Air Medical Services
|
12,740
|
|
4
|
|
19,751
|
|
7
|
|
25,836
|
|
10
|
|
||||||
|
FBO
|
10,182
|
|
3
|
|
9,782
|
|
4
|
|
10,406
|
|
4
|
|
||||||
|
Flightseeing
|
7,095
|
|
2
|
|
6,998
|
|
2
|
|
6,861
|
|
3
|
|
||||||
|
Eliminations
|
(419
|
)
|
—
|
|
(409
|
)
|
—
|
|
(406
|
)
|
—
|
|
||||||
|
298,959
|
|
100
|
|
272,921
|
|
100
|
|
258,148
|
|
100
|
|
|||||||
________________
(1) Primarily oil and gas services, but also includes revenues from activities such as firefighting and utility support.
Year Ended
December 31, 2013
compared with Year Ended
December 31, 2012
Operating Revenues.
Operating revenues were $26.0 million higher for the year ended December 31, 2013 (the “Current Year”) compared with the year ended December 31, 2012 (the “Prior Year”).
Operating revenues from oil and gas operations in the U.S. Gulf of Mexico were $19.7 million higher in the Current Year. Operating revenues from medium helicopters increased $20.7 million primarily due to increased utilization in the Current Year to support an increase in deepwater drilling, completion and production activity and due to medium helicopters being used to fill in for the EC225 heavy helicopters which were temporarily suspended from October 2012 until July 2013. In addition, operating revenues from single engine helicopters increased $4.5 million due to higher rates. These increases were partially offset by a $3.0 million decrease from heavy helicopters due to the temporary suspension of the EC225 helicopters and a decrease of $1.3 million in light twin helicopters due to lower utilization. In addition, other revenues decreased by $1.2 million primarily due to a reduction in parts sales.
Operating revenues from oil and gas activities in Alaska were $12.3 million higher in the Current Year. The resumption of services with a major oil and gas customer that had been temporarily suspended during a portion of the Prior Year contributed $9.1 million to this increase, and short-term work related to a drillship running aground contributed a further $2.8 million to the increase.
Operating revenues from international oil and gas operations were $4.8 million higher due to a new contract in Uruguay that was awarded in late 2012 and commenced in January 2013.
Revenues from dry-leasing activities were $10.3 million lower in the Current Year primarily due to a $11.5 million decrease related to contracts that ended during the Current Year, of which $4.8 million related to helicopters that were subsequently sold. These decreases were partially offset by an increase of $0.9 million as a result of rate escalations.
Operating revenues from search and rescue activities increased $6.1 million in the Current Year primarily due to new search and rescue customers and increased activity with existing customers.
Operating revenues from air medical services were $7.0 million lower primarily due to the conclusion of three long-term hospital contracts, partially offset by a new contract that began in 2013 and increases in rates on existing contracts. The change in contracts is primarily due to a shift in management philosophy designed to enhance profitability on these services and to one customer bringing these services in-house upon conclusion of its contract with us.
Operating revenues from flightseeing and FBO activities increased by $0.1 million and $0.4 million, respectively, in the Current Year. This is primarily the result of better weather conditions resulting in more flying activity.
39
Operating Expenses.
Operating expenses were $19.4 million higher in the Current Year. Repairs and maintenance expenses increased $12.9 million primarily due to a $8.1 million increase as a result of the timing of repairs and a net $7.2 million decrease in vendor and maintenance credits from the Prior Year. These increases were partially offset by a decrease in power-by-hour expense of $2.4 million primarily due to the temporary suspension of the EC225 helicopters. Personnel costs increased $4.4 million primarily due to the addition of personnel to support the increase in oil and gas activity discussed above. Fuel expense increased $1.5 million due to increased flight hours and an increase in the average price per gallon. Lease expense increased $1.5 million due to a one-time charge related to operating leases on certain air medical helicopters. These increases were partially offset by a decrease in other operating expenses of $0.7 million, primarily due to a decrease in part sales related to air medical contracts.
Administrative and General.
Administrative and general expenses were $4.1 million higher in the Current Year. Compensation and employee costs increased $4.1 million primarily due to the recognition of management bonus awards, severance costs related to changes in senior management and share awards compensation related to equity awards granted in 2013 following our Spin-off from SEACOR. Excluding $2.9 million of expenses associated with a contemplated initial public offering of our Common Stock recognized in the Prior Year, legal, professional and other expenses increased by $4.0 million due to costs associated with being a public company, legal expenditures and an increase in shared services fees from SEACOR under our Amended and Restated Transition Services Agreement. In addition, travel expenses increased $0.4 million due to business development activities. These increases were partially offset by a $1.9 million decrease in allowance for doubtful accounts. The Prior Year included a $2.5 million provision in connection with a customer bankruptcy while $0.4 million was provided in the Current Year due to collection issues related to a note with a customer that had purchased parts in a previous year.
Depreciation.
Depreciation expense was $3.1 million higher in the Current Year primarily due to the addition of new and higher cost helicopters.
Gains on Asset Dispositions and Impairments, Net.
During the Current Year, we sold or otherwise disposed of helicopters and other equipment for cash proceeds of $65.1 million, resulting in gains of $18.3 million. These amounts included: a gain of $5.4 million on the sale of an EC225 helicopter that was damaged in an incident in May 2012 while under dry-lease to a customer and subsequently sold to that customer in the Current Year for cash proceeds of $24.6 million; a gain of $1.2 million on the recognition of insurance proceeds of $2.1 million related to a S76A helicopter involved in an incident in the Current Year; a gain of $0.3 million related to an AW139 helicopter involved in an incident in the Prior Year; and gains of $11.3 million on the sale of helicopters and other equipment in the normal course of our business. In addition, we recognized previously deferred gains of $0.1 million in 2013. During the Prior Year, the Company sold helicopter components and other equipment for proceeds of $5.5 million and recognized gains of $2.9 million. In addition, we recognized previously deferred gains of $0.7 million in 2012.
Operating Income
. Operating income as a percentage of revenues was 16% in the Current Year compared with 12% in the Prior Year. Excluding gains on asset dispositions discussed above, operating income as a percentage of revenues was 9% in the Current Year compared with 10% in the Prior Year. Repairs and maintenance expenses increased as a result of the timing of repairs in 2013 and the absence of the benefit from vendor credits in the Prior Year.
Interest Expense.
On December 7, 2012, we completed an offering of $200.0 million aggregate principal amount of 7.750% Senior Notes, the net proceeds of which were used to repay $190.0 million of borrowings outstanding under our Revolving Credit Facility. As a result of the higher interest rate on the notes, interest expense was $7.4 million higher in the Current Year.
SEACOR Management Fees.
On December 30, 2011, we entered into a Transition Services Agreement with SEACOR to provide various corporate services at a fixed rate of $2.0 million per annum beginning January 1, 2012. These costs, which were classified as SEACOR Management Fees, effectively fixed what had previously been a variable allocation of SEACOR corporate overhead expenses to each of its business units based on certain financial contribution metrics. These costs terminated effective with the completion of the Spin-off. In connection with the Spin-off, we entered into an Amended and Restated Transition Services Agreement with SEACOR to provide various shared services, the costs for which are classified as administrative and general expenses.
Income Tax Expense.
Income tax expense was $4.4 million higher in the Current Year primarily due to an increase in income before income tax expense and equity in earnings (losses) of 50% or less owned companies. In addition, we established a valuation allowance on certain state deferred tax assets during the year. The effective tax rate in the Prior Year was lower due to permanent differences related to share-based compensation awards, state income tax expenses and holdings in non-controlling interests.
Equity in Earnings (Losses) of 50% or Less Owned Companies.
Earnings from equity investments were $0.9 million in the Current Year, an increase of $6.4 million compared to the Prior Year loss of $5.5 million. During the Prior Year, we recognized a loss of $0.6 million and an impairment charge of $5.9 million, net of tax, on our investment in our Brazilian joint venture. In the Current Year, no losses were recognized on our Brazilian joint venture as they were fully written down in 2012. Earnings on other equity investments were consistent during the respective periods.
40
Year Ended
December 31, 2012
compared with Year Ended
December 31, 2011
Operating Revenues.
Operating revenues were $14.8 million higher for the year ended December 31, 2012 compared with the year ended December 31, 2011. Operating revenues in the U.S. Gulf of Mexico were $32.4 million higher primarily due to newly delivered helicopters being placed in service, an expansion of government services support and an increase in charter revenues primarily in support of hurricane evacuations. Operating revenues from Alaska, primarily oil and gas activities, increased by $2.4 million primarily due to an increase in charter activity and hours flown in support of firefighting contracts, and the full-year impact of contracts that commenced in 2011. Operating revenues from dry-leasing activities decreased by $13.4 million. Dry-leasing revenues for helicopters chartered to our Brazilian joint venture were $11.2 million lower primarily due to the deferral and reduction of dry-leasing revenues as a result of difficulties experienced by the joint venture in connection with a canceled contract award for four AW139 helicopters under dry-lease from us. In addition, dry-leasing revenues from the Brazilian joint venture were lower due to decreased flight hours for helicopters undergoing major maintenance. Dry-leasing revenues for another customer were also lower due to the net deferral of $1.9 million due to the customer's short-term liquidity issues. Operating revenues for air medical services were $6.1 million lower primarily due to the conclusion of a long-term hospital contract, partially offset by the full-year impact of a hospital contract that was awarded during 2011.
Operating Expenses
. Operating expenses were $4.5 million higher in the year ended December 31, 2012 compared with the year ended December 31, 2011. Personnel costs were $3.7 million higher primarily due to the implementation of a pilot pay scale adjustment and the addition of personnel to support increased activity in the U.S. Gulf of Mexico. Repairs and maintenance expenses were $5.8 million lower in 2012 primarily due to the recognition of $7.7 million in vendor credits and $1.4 million in maintenance credits received in connection with the end of two customer dry-leases. In addition, repairs and maintenance expenses decreased by $3.6 million due to a reduction in EC225 hours flown. These decreases were partially offset by a $5.3 million increase as additional helicopters were placed in power-by-hour programs and a $1.6 million increase in other repairs and maintenance costs primarily due to the timing of repairs on helicopters not covered by power-by-hour arrangements. Insurance and loss reserves were $2.3 million higher due to an increase in the overall fleet value and the recognition of a good experience credit from our hull and liability underwriters in the year ended December 31, 2011. Fuel costs were $1.9 million higher primarily due to increased flight hours in the U.S. Gulf of Mexico, in line with the increased activity discussed above. Other operating expenses were $3.0 million higher primarily due to the receipt in the year ended December 31, 2011 of $1.9 million in insurance proceeds related to hurricane damages sustained in 2005.
Administrative and General.
Administrative and general expenses were $2.9 million higher in the year ended December 31, 2012 compared with the year ended December 31, 2011. Allowance for doubtful accounts were $2.8 million higher, of which $2.5 million was provided in the year ended December 31, 2012 in connection with a customer bankruptcy. The year ended December 31, 2012 also includes legal and professional expenses of $2.9 million associated with a contemplated initial public offering of our Common Stock. These increases were partially offset by a $3.5 million decrease in severance costs associated with changes in executive management.
Depreciation
. Depreciation expenses were $0.1 million lower in the year ended December 31, 2012 compared to the year ended December 31, 2011 primarily due to a change in estimate of the useful life and salvage value of helicopters, which reduced depreciation expense in the year ended December 31, 2012, partially offset by the addition of higher cost equipment. Effective July 1, 2011, the Company changed its estimated useful life and salvage value for helicopters from 12 to 15 years and 30% to 40%, respectively, due to improvements in new helicopter models that continue to increase their long-term value and make them viable for operation over a longer period of time.
Gains on Asset Dispositions and Impairments, Net
.
During the year ended December 31, 2012, we sold or otherwise disposed of eight helicopters, helicopter components and other equipment for proceeds of $5.5 million and gains of $2.9 million. In addition, we recognized previously deferred gains of $0.7 million. During the year ended December 31, 2011, we sold ten helicopters and other equipment and received insurance proceeds related to the loss of a helicopter. We received net proceeds of $29.2 million on the disposition of these assets, including insurance proceeds, and had gains of $16.5 million of which $14.5 million was recognized currently and $2.0 million was deferred. In addition, we recognized previously deferred gains of $0.7 million.
Operating Income
.
Excluding gains on asset dispositions, operating income as a percentage of revenues was 10% in the year ended December 31, 2012 compared to 8% in the year ended December 31, 2011. The increase was primarily due to the recognition of vendor credits and maintenance credits in the year ended December 31, 2012.
Interest expense and interest expense on advances from SEACOR.
On December 22, 2011, we entered into a Revolving Credit Facility and used $242.3 million of borrowings under the facility to settle all of our outstanding advances from SEACOR. On December 7, 2012, we completed an offering of $200.0 million aggregate principal amount of 7.750% Senior Notes, the net proceeds of which were used to repay $190.0 million of borrowings outstanding under our Revolving Credit Facility. As a result, interest expense was $10.6 million for the year ended December 31, 2012, compared with $1.4 million for the year ended December
41
31, 2011, and interest expense on advances from SEACOR was $23.4 million lower in the year ended December 31, 2012 compared to the year ended December 31, 2011.
SEACOR management fees
.
SEACOR management fees represent various corporate costs incurred by SEACOR, which are in turn charged to all of its operating segments. These fees were previously allocated using income-based performance metrics of us in relation to SEACOR’s other operating segments. On December 30, 2011, we entered into a Transition Services Agreement with SEACOR to provide these services at a fixed rate of $2.0 million per annum beginning January 1, 2012. As a result, SEACOR management fees for the year ended December 31, 2012 were $2.0 million compared with $8.8 million for the year ended December 31, 2011.
Equity in losses of 50% or less owned companies
.
During the year ended December 31, 2012, we recognized an impairment charge of $5.9 million, net of tax, on our investment in our Brazilian joint venture.
Derivative gains (losses), net
.
Derivative losses in 2012 were primarily the result of losses from interest rate swap agreements.
Foreign currency gains (losses), net
.
Foreign currency gains, net in 2012 and 2011 were primarily due to the weakening of the U.S. dollar against the Euro underlying certain cash balances.
Income Tax Expense (Benefit)
.
During the year ended December 31, 2012, our effective income tax rate was 35.5%. During the year ended December 31, 2011, our effective income tax rate was 17.6% primarily due to the recognition of an income tax benefit of $0.7 million on adjustments to deferred tax liabilities resulting from changes in state tax apportionment factors and an expense of $0.4 million as a result of allocated non-deductible SEACOR management fees.
Liquidity and Capital Resources
Our ongoing liquidity requirements arise primarily from working capital needs, meeting our capital commitments (including the purchase of helicopters and other equipment) and the repayment of debt obligations. In addition, we may use our liquidity to fund acquisitions or to make other investments. Sources of liquidity are cash balances and cash flows from operations and, from time to time, we may secure additional liquidity through the issuance of equity, debt or borrowings under our Revolving Credit Facility.
Historically, SEACOR advanced substantial amounts of capital to us to fund our expenditures. Prior to entering into our Revolving Credit Facility on December 22, 2011, we participated in a cash management program whereby certain of our operating and capital expenditures were funded through advances from SEACOR and certain cash collections were forwarded to SEACOR. As a consequence of this arrangement, we historically maintained minor cash balances.
On December 22, 2011, we entered into our $350.0 million Revolving Credit Facility. On December 7, 2012, we completed an offering of $200.0 million aggregate principal amount of 7.750% Senior Notes and used the net proceeds from the offering to repay $190.0 million of borrowings outstanding under our Revolving Credit Facility. In connection with the Senior Notes Offering, we permanently reduced the borrowing capacity under that facility from $350.0 million to $200.0 million. On December 20, 2012, we borrowed $50.0 million under the Revolving Credit Facility to fund the repurchase of shares of Series B preferred stock from SEACOR, which was the balance outstanding as of December 31, 2012.
Our Revolving Credit Facility requires that we maintain a maximum funded debt to EBITDA (as defined in our Revolving Credit Facility) ratio (“RC Leverage Ratio”) of 5.0 to 1.0 (increased from 4.0 to 1.0 as a result of the issuance of the Senior Notes) and also requires that we comply with certain other financial ratios. Failure to meet these ratios is an event of default under the facility, and therefore our ability to borrow under our Revolving Credit Facility is dependent on and limited by our compliance with this RC Leverage Ratio requirement and our ability to comply with other financial ratios. See “—Senior Secured Revolving Credit Facility.” As of December 31, 2013, the amount of additional borrowings we could borrow under the Revolving Credit Facility, based on our RC Leverage Ratio as of such date, was $
136.1 million
.
On December 23, 2011, we issued 1,400,000 shares of our Series A preferred stock to SEACOR in exchange for $140.0 million of aggregate advances previously provided to us by SEACOR. SEACOR also contributed an additional $180.0 million of capital to us in respect of additional prior advances. Holders of our Series A preferred stock were entitled to receive quarterly cash dividends at the rate of 6% per annum from the date of issuance.
During the year ended December 31, 2013, we made payments on our Revolving Credit Facility totaling $50.0 million from cash flows provided by operating activities, and drew down $55.0 million on the Revolving Credit Facility primarily to fund the purchase of helicopters. In the year ended December 31, 2012, we drew down $88.0 million from our Revolving Credit Facility, primarily to repurchase 500,000 shares of Series B preferred stock held by SEACOR and to fund the purchase of an EC225 helicopter and certain other assets. During the year ended December 31, 2012, we experienced a decrease in operating income primarily due to a reduction in gains on asset dispositions, which had a significant impact on our last twelve-months EBITDA (as defined in our Revolving Credit Facility). As a result, SEACOR purchased one million shares of our Series B preferred stock, including 300,000 shares of our Series B preferred stock for $30.0 million on June 8, 2012 and 700,000 shares of our Series B
42
preferred stock for $70.0 million on September 25, 2012. We used a portion of the proceeds from these issuances to repay borrowings under our Revolving Credit Facility so that we would be able to maintain compliance with the financial ratios under the facility. See “—Year Ended December 31, 2012 compared with Year Ended December 31, 2011—Operating Income.” We repurchased the Series B preferred stock in December 2012, after which no shares of Series B preferred stock remain outstanding.
As of
December 31, 2013
, we had unfunded capital commitments of $
341.7 million
, primarily pursuant to agreements to purchase helicopters. Approximately $98.7
million is payable in 2014, with the remaining commitments payable in 2015 through 2017. The Company also had $
2.3 million
of deposits paid on options not yet exercised. Approximately $
164.4 million
of these commitments (inclusive of deposits paid on options not yet exercised) may be terminated without further liability to us other than aggregate liquidated damages of $
11.1 million
. In addition, we had outstanding options to purchase up to an additional ten AW189 helicopters, five S92 helicopters, and four AW139 helicopters. If these options were exercised, the helicopters would be delivered beginning in 2014 through 2018. We expect to finance the remaining acquisition costs through a combination of cash on hand, cash provided by operating activities and borrowings under our Revolving Credit Facility.
Summary of Cash Flows
|
2013
|
2012
|
2011
|
||||||||||
|
|
(in thousands)
|
|||||||||||
|
Cash provided by (used in):
|
||||||||||||
|
Operating Activities
|
$
|
64,371
|
|
$
|
13,915
|
|
$
|
40,930
|
|
|||
|
Investing Activities
|
(43,459
|
)
|
(114,765
|
)
|
(149,089
|
)
|
||||||
|
Financing Activities
|
(1,508
|
)
|
32,634
|
|
183,094
|
|
||||||
|
Effect of Exchange Rate Changes on Cash and Cash Equivalents
|
426
|
|
599
|
|
489
|
|
||||||
|
Net Increase (Decrease) in Cash and Cash Equivalents
|
$
|
19,830
|
|
$
|
(67,617
|
)
|
$
|
75,424
|
|
|||
Operating Activities
Cash flows provided by operating activities increased by $50.5 million during the year ended
December 31, 2013
compared with the year ended
December 31, 2012
. Cash flows provided by operating activities decreased by $27.0 million during the year ended December 31, 2012 compared with the year ended December 31, 2011. The components of cash flows provided by operating activities during the years ended December 31 were as follows:
|
2013
|
2012
|
2011
|
||||||||||
|
|
(in thousands)
|
|||||||||||
|
Operating income before depreciation and gains on asset dispositions and impairments, net
|
$
|
73,423
|
|
$
|
70,941
|
|
$
|
63,548
|
|
|||
|
Changes in operating assets and liabilities before interest and income taxes
|
6,102
|
|
(102,327
|
)
|
(8,977
|
)
|
||||||
|
Cash settlements on derivative transactions, net
|
(478
|
)
|
—
|
|
—
|
|
||||||
|
Dividends received from 50% or less owned companies
|
—
|
|
(16
|
)
|
1,236
|
|
||||||
|
Interest paid, excluding capitalized interest
|
(17,839
|
)
|
(7,821
|
)
|
(24,524
|
)
|
||||||
|
Benefit on net tax operating losses purchased by SEACOR
|
—
|
|
51,961
|
|
18,236
|
|
||||||
|
Income taxes paid, net of refunds
|
20
|
|
(143
|
)
|
(557
|
)
|
||||||
|
SEACOR management fees
|
(168
|
)
|
(2,000
|
)
|
(8,799
|
)
|
||||||
|
Other
|
3,311
|
|
3,320
|
|
767
|
|
||||||
|
Total cash flows provided by operating activities
|
$
|
64,371
|
|
$
|
13,915
|
|
$
|
40,930
|
|
|||
Operating income before depreciation and gains on asset dispositions and impairments, net was $2.5 million higher in the year ended
December 31, 2013
compared with the year ended
December 31, 2012
, primarily due to a $36.8 million and $6.1 million increase in revenues from oil and gas and search and rescue activities, respectively. These increases were partially offset by a $10.3 million decrease in dry-leasing revenues, and a $7.0 million reduction in operating revenues from air medical services. There was an increase of $12.9 million in repairs and maintenance expenses, a $4.4 million increase in personnel cost, a $4.1 million increase in administrative and general expenses, and a $1.5 million increase in lease expense primarily due to a one-time charge related to operating leases on certain air medical helicopters.
43
Operating income before depreciation and gains on asset dispositions and impairments, net was $7.4 million higher in the year ended December 31, 2012 compared with the year ended December 31, 2011, primarily due to a $32.4 million increase in revenues in the Gulf of Mexico and a decrease of $5.8 million in repairs and maintenance expenses. These increases were offset by a $13.4 million decrease in dry-leasing revenues, a $6.1 million reduction in operating revenues from air medical services, a $3.8 million increase in personnel cost, a $2.3 million increase in insurance and loss reserves, a $3.0 million increase in other operating expenses primarily due to a $1.9 million receipt of insurance proceeds in the period ended December 31, 2011 and a $2.9 million increase in administrative and general expenses.
C
hanges in operating assets and liabilities before interest and income taxes was $108.4 million higher in the year ended December 31, 2013 compared with the year ended December 31, 2012, primarily due to the repurchase of Series B preferred stock held by SEACOR and settlements of intercompany transactions with SEACOR in 2012.
Interest paid, excluding capitalized interest was $10.0 million higher in the year ended
December 31, 2013
compared with the year ended
December 31, 2012
, primarily due a higher interest rate on our Senior Notes.
Benefit on net tax operating losses purchased by SEACOR and SEACOR management fees were $52.0 million and $1.8 million lower, respectively, in the year ended December 31, 2013 compared with the year ended
December 31, 2012
as a result of the Spin-off from SEACOR.
Investing Activities
During the year ended December 31, 2013, net cash used in investing activities was $43.5 million primarily as follows:
|
•
|
Capital expenditures were $110.1 million, which consisted primarily of helicopter acquisitions.
|
|
•
|
Proceeds from the disposition of property and equipment were $65.2 million.
|
|
•
|
Net principal payments on notes receivable from third-parties and equity investees were $1.5 million.
|
During the year ended December 31, 2012, net cash used in investing activities was $114.8 million primarily as follows:
|
•
|
Capital expenditures were $113.0 million, which consisted primarily of helicopter acquisitions.
|
|
•
|
Proceeds from the disposition of property and equipment were $5.2 million.
|
|
•
|
Investments in, and advances to, 50% or less owned companies were $10.6 million.
|
|
•
|
Net principal payments on notes receivable from third-parties and equity investees were $3.6 million.
|
During the year ended December 31, 2011, net cash used in investing activities was $149.1 million primarily as follows:
|
•
|
Capital expenditures were $158.9 million, which consisted primarily of helicopter acquisitions.
|
|
•
|
Proceeds from the disposition of property and equipment were $26.0 million.
|
|
•
|
Cash settlements on derivative transactions, net were $6.1 million.
|
|
•
|
Investments in, and advances to, 50% or less owned companies were $21.8 million.
|
Financing Activities
During the year ended December 31, 2013, net cash used in financing activities was $1.5 million primarily as follows:
|
•
|
Net principal payments on long-term debt were $52.8 million.
|
|
•
|
Proceeds from Revolving Credit Facility were $55.0 million.
|
|
•
|
Dividends paid on Series A preferred stock were $5.0 million.
|
|
•
|
Proceeds from SEACOR on the settlement of stock options were $0.7 million.
|
|
•
|
Proceeds and tax benefits from share-based awards were $0.5 million.
|
During the year ended December 31, 2012, net cash provided by financing activities was $32.6 million primarily as follows:
|
•
|
Proceeds of $191.9 million, net of issuance costs, for our Senior Notes.
|
|
•
|
Proceeds from the issuance of Series B preferred stock were $100.0 million.
|
|
•
|
Borrowings under our Revolving Credit Facility were $88.0 million.
|
|
•
|
Net principal payments on long-term debt were $292.8 million.
|
44
|
•
|
Payments in connection with the repurchase of Series B preferred stock from SEACOR were $50.0 million.
|
|
•
|
Dividends paid to SEACOR were $4.4 million.
|
During the year ended December 31, 2011, net cash provided by financing activities was $183.1 million primarily as follows:
•
Proceeds from borrowings under our Revolving Credit Facility of $249.0 million, net of $3.0 million of transaction costs.
|
•
|
Repayments to SEACOR of $63.2 million.
|
|
•
|
Scheduled payments on long-term debt of $2.7 million.
|
Senior Secured Revolving Credit Facility
On December 22, 2011, we entered into a $350.0 million senior secured revolving credit facility (the “Revolving Credit Facility”) that matures in December 2016. The Revolving Credit Facility provides us with the ability to borrow up to $200.0 million with sub-limits of up to $50.0 million for letters of credit and up to $25.0 million for swingline advances, subject to the terms and conditions specified in the Revolving Credit Facility. Under certain circumstances the borrowing capacity under the Revolving Credit Facility may be increased by up to an additional $100.0 million. As of December 31, 2013, we had $55.0 million outstanding advances under the Revolving Credit Facility at an annual rate of 2.35% and, based on our leverage ratio under the facility, we had the ability to borrow an additional
$136.1
million under the facility, net of issued letters of credit of $8.9 million. The remaining amounts under the senior secured revolving credit facility are available to fund working capital needs. For additional information about the terms of the Revolving Credit Facility, see Note 8 of the Notes to Consolidated Financial Statements included in Item 8 of this Annual Report on Form 10-K.
Senior Notes
On December 7, 2012, we completed an offering of $200.0 million aggregate principal amount of 7.750% senior unsecured notes due December 15, 2022. The net proceeds of the offering were used to repay $190.0 million of borrowings outstanding under our Revolving Credit Facility. In connection with the offering, we permanently reduced the borrowing capacity under that facility from $350.0 million to $200.0 million. Interest on the notes is payable semi-annually in arrears on each June 15 and December 15 of each year, beginning on June 15, 2013. We may redeem the notes at any time and from time to time as specified in the indenture governing the notes. For additional information about the terms of the notes, see Note 8 of the Notes to Consolidated Financial Statements included in Item 8 of this Annual Report on Form 10-K.
Short and Long-Term Liquidity Requirements
We anticipate that we will generate positive cash flows from operations and that these cash flows will be adequate to meet our working capital requirements. During the year ended
December 31, 2013
, our cash provided by operations was
$64.4
million. To support our capital expenditure program and/or other liquidity requirements, we may use operating cash flow, cash balances or proceeds from sales of assets, issue debt or equity, borrow under our Revolving Credit Facility or any combination thereof.
Our availability of long-term financing is dependent upon our ability to generate operating profits sufficient to meet our requirements for working capital, capital expenditures and a reasonable return on investment. We believe that earning such operating profits will permit us to maintain our access to favorably priced financing arrangements. Management will continue to closely monitor our liquidity and the credit markets.
Off-Balance Sheet Arrangements
On occasion, we and our partners will guarantee certain obligations on behalf of our joint ventures. As of
December 31, 2013
, we had no such guarantees in place.
Contractual Obligations and Commercial Commitments
The following table summarizes the Company’s contractual obligations and other commercial commitments and their aggregate maturities as of
December 31, 2013
(in thousands):
45
|
Payments Due By Period
|
||||||||||||||||||||
|
Total
|
Less than 1 Year
|
1-3 Years
|
3-5 Years
|
After 5 Years
|
||||||||||||||||
|
(in thousands)
|
||||||||||||||||||||
|
Contractual Obligations:
|
||||||||||||||||||||
|
Long-term Debt
(1)
|
$
|
430,248
|
|
$
|
20,406
|
|
$
|
116,842
|
|
$
|
31,000
|
|
$
|
262,000
|
|
|||||
|
Capital Purchase Obligations
(2)
|
341,742
|
|
98,691
|
|
216,536
|
|
26,515
|
|
—
|
|
||||||||||
|
Operating Leases
(3)
|
18,359
|
|
3,060
|
|
3,796
|
|
2,884
|
|
8,619
|
|
||||||||||
|
Purchase Obligations
(4)
|
9,749
|
|
9,749
|
|
—
|
|
—
|
|
—
|
|
||||||||||
|
Other
(5)
|
10
|
|
10
|
|
—
|
|
—
|
|
—
|
|
||||||||||
|
$
|
800,108
|
|
$
|
131,916
|
|
$
|
337,174
|
|
$
|
60,399
|
|
$
|
270,619
|
|
||||||
____________________
|
(1)
|
Maturities of our borrowings and interest payments pursuant to such borrowings are based on contractual terms. Interest amounts represent the expected cash payments for interest on our long-term debt based on the interest rates in place and amounts outstanding at December 31, 2013.
|
|
(2)
|
Capital purchase obligations represent commitments for the purchase of property and equipment as of
December 31, 2013
. Such commitments relate to orders we had placed as of
December 31, 2013
for
21
new helicopters, consisting of
two
AW139 medium helicopters,
five
AW169 light twin helicopters,
ten
AW189 heavy helicopters and four S92 heavy helicopters. Of the total unfunded capital commitments, $
164.4 million
may be terminated without further liability other than liquidated damages of $
11.1 million
in the aggregate. These commitments are not recorded as liabilities on our consolidated balance sheet as of
December 31, 2013
, as we had not yet received the goods or taken title to the property. The AW139 helicopters are scheduled to be delivered in 2014. The AW189 helicopters are scheduled to be delivered beginning 2014 through 2017. The S92 helicopters are scheduled to be delivered in 2016 and 2017. Delivery dates for the AW169 helicopters have yet to be determined.
|
|
(3)
|
Operating leases primarily include leases of helicopters and other property that have a remaining term in excess of one year.
|
|
(4)
|
Purchase obligations primarily include purchase orders for helicopter inventory and maintenance as of
December 31, 2013
. These commitments are for goods and services to be acquired in the ordinary course of business and are fulfilled by our vendors within a short period of time.
|
|
(5)
|
Other primarily includes deferred compensation arrangements.
|
Effects of Inflation
The Company’s operations expose it to the effects of inflation. In the event that inflation becomes a significant factor in the world economy, inflationary pressures could result in increased operating and financing costs.
Contingencies
In the normal course of our business, we become involved in various other litigation matters including, among other things, claims by third parties for alleged property damages and personal injuries. Management has used estimates in determining our potential exposure to these matters and has recorded reserves in its financial statements related thereto as appropriate. It is possible that a change in our estimates related to these exposures could occur, but we do not expect such changes in estimated costs would have a material effect on our consolidated financial position or results of operations.
Critical Accounting Policies and Estimates
Use of Estimates
. The preparation of financial statements in conformity with accounting principles generally accepted in the United States requires management to make estimates and assumptions that affect the reported amounts of assets and liabilities and disclosure of contingent assets and liabilities at the date of the financial statements and the reported amounts of revenues and expenses during the reporting period. Such estimates include those related to allowance for doubtful accounts, useful lives of property and equipment, impairments, inventories, income tax provisions and certain accrued liabilities. Actual results could differ from those estimates and those differences may be material.
Revenue Recognition
. We recognize revenue when it is realized or realizable and earned. Revenue is realized or realizable and earned when persuasive evidence of an arrangement exists, delivery has occurred or services have been rendered, the price to the buyer is fixed or determinable and collectability is reasonably assured. Revenue that does not meet these criteria is deferred until the criteria are met.
We charter the majority of our helicopters through master service agreements, subscription agreements, day-to-day charter arrangements and dry-leases. Master service agreements and subscription agreements typically require a fixed monthly fee plus incremental payments based on hours flown. These agreements have fixed terms ranging from one month to five years and generally may be canceled by providing 30 days’ notice. Day-to-day charter arrangements call for either a combination of a daily fixed fee plus a charge based on hours flown or an hourly rate with a minimum number of hours to be charged daily. Dry-leases require a fixed monthly fee for the customer’s right to use the helicopter and, where applicable, a charge based on hours flown as compensation for any maintenance, parts, and/or personnel support that we may provide to the customer. Dry-leases generally run from two to
46
five years with no early cancellation provisions. Air medical services are provided under contracts with hospitals that typically include a fixed monthly and hourly rate structure. With respect to flightseeing operations, we allocate block space to cruise lines and seats are sold directly to customers. We also operate a fixed based operation (“FBO”) at Ted Stevens Anchorage International Airport that sells fuel on an ad-hoc basis and leases storage space.
Trade Receivables
. Customers are primarily major integrated and independent exploration and production companies, hospitals, international helicopter operators and the U.S. government. Customers are typically granted credit on a short-term basis and related credit risks are considered minimal. We routinely review our trade receivables and make provisions for probable doubtful accounts; however, those provisions are estimates and actual results could differ from those estimates and those differences may be material. Trade receivables are deemed uncollectible and removed from accounts receivable and the allowance for doubtful accounts when collection efforts have been exhausted.
Derivative Instruments
. We account for derivatives through the use of a fair value concept whereby all of our derivative positions are stated at fair value in the accompanying consolidated balance sheets. Realized and unrealized gains and losses on derivatives not designated as hedges are reported in the accompanying consolidated statements of operations as derivative gains (losses), net. Realized and unrealized gains and losses on derivatives designated as fair value hedges are recognized as a corresponding increase or decrease in the fair value of the underlying hedged item to the extent they are effective, with any ineffective portion reported in the accompanying consolidated statements of operations as derivative gains (losses), net.
Inventories
. Inventories are stated at the lower of average cost or market value and consist primarily of spare parts and fuel. We record write-downs, as needed, to adjust the carrying amount of inventories to the lower of cost or market.
Property and Equipment
. Property and equipment, stated at cost, is depreciated using the straight-line method over the estimated useful life of the asset to an estimated salvage value. With respect to helicopters, the estimated useful life is typically based upon a newly built asset being placed into service and represents the point at which it is typically not justifiable for us to continue to operate the asset in the same or similar manner. From time to time, we may acquire older assets that have already exceeded our useful life policy, in which case we depreciate such assets based on our best estimate of remaining useful life.
|
As of December 31, 2013, the estimated useful life (in years) of the Company’s categories of new property and equipment was as follows:
|
|||
|
Helicopters (estimated salvage value at 40% of cost)
|
15
|
|
|
|
Machinery, equipment and spares
|
5-7
|
|
|
|
Buildings and leasehold improvements
|
10-30
|
|
|
|
Furniture, fixtures, vehicles and other
|
3-5
|
|
|
We review the estimated useful lives and salvage values of our fixed assets on an ongoing basis. Effective July 1, 2011, we changed the estimated useful life and salvage value for helicopters from 12 to 15 years and 30% to 40%, respectively, due to improvements in new helicopter models that continue to increase their long-term value and make them viable for operation over a longer period of time. For the year ended December 31, 2011, the change in estimate increased operating income by $7.6 million, net income by $4.9 million and basic and diluted earnings per share by $0.48.
Equipment maintenance and repair costs and the costs of routine overhauls and inspections performed on helicopter engines and major components are charged to operating expense as incurred. Expenditures that extend the useful life or improve the marketing and commercial characteristics of equipment as well as major renewals or improvements to other properties are capitalized.
We engage a number of third-party vendors to maintain the engines and certain components on some of our helicopter models under programs known as “power-by-hour” maintenance contracts. These programs require us to pay for the maintenance service ratably over the contract period, typically based on actual flight hours. Power-by-hour providers generally bill monthly based on hours flown in the prior month, the costs being expensed in the period in which flight hours are flown. In the event we place a helicopter in a program after a maintenance period has begun, it may be necessary to pay an initial buy-in charge based on hours flown since the previous maintenance event. The buy-in charge is normally recorded as a pre-paid expense and amortized as an operating expense over the remaining power-by-hour contract period. If a helicopter is sold or otherwise removed from a program before the scheduled maintenance work is carried out, we may be able to recover part of our payments to the power-by-hour provider, in which case we record a reduction to operating expense when we receive the refund.
We also incur repairs and maintenance expense through vendor arrangements whereby we obtain repair quotes and authorize service through a repair order process. Under these arrangements, we record the repairs and maintenance cost as the work is completed. As a result, the timing of repairs and maintenance may result in operating expenses varying substantially when compared with a prior year or prior quarter if a disproportionate number of repairs, refurbishments or overhauls for components not covered under power-by-hour arrangements are performed during a period.
47
Certain interest costs incurred during the construction of equipment are capitalized as part of the assets’ carrying values and are amortized over such assets’ estimated useful lives.
Impairment of Long-Lived Assets
. We perform an impairment analysis on long-lived assets used in operations when indicators of impairment are present. If the carrying value of the assets is not recoverable, as determined by the estimated undiscounted cash flows, the carrying value of the assets is reduced to fair value. Generally, fair value is determined using valuation techniques such as expected discounted cash flows or appraisals, as appropriate.
Impairment of 50% or Less Owned Companies
. We perform regular reviews of each investee’s financial condition, the business outlook for its products and services, and its present and projected results and cash flows. When an investee has experienced consistent declines in financial performance or difficulties in raising capital to continue operations and when we expect the decline to be other-than-temporary, the investment is written down to fair value. Actual results may vary from estimates due to the uncertainties regarding the projected financial performance of investees, the severity and expected duration of declines in value and the available liquidity in the capital markets to support the continuing operations of the investees in which we have investments.
Income Taxes
. Commencing February 1, 2013, we will file a standalone consolidated U.S. federal tax return. Deferred income tax assets and liabilities have been provided in recognition of the income tax effect attributable to the book and tax basis differences of assets and liabilities reported in the accompanying consolidated financial statements. Deferred tax assets or liabilities are provided using the enacted tax rates expected to apply to taxable income in the periods in which they are expected to be settled or realized. Interest and penalties relating to uncertain tax positions are recognized in interest expense and administrative and general, respectively, in the accompanying consolidated statements of operations. We record a valuation allowance to reduce our deferred tax assets if it is more likely than not that some portion or all of the deferred tax assets will not be realized. Prior to the Spin-off, the Company was included in the consolidated U.S. federal income tax return of SEACOR. SEACOR’s policy for allocation of U.S. federal income taxes requires its subsidiaries to compute their provision for U.S. federal income taxes on a separate company basis and settle with SEACOR. Net operating loss benefits were settled with SEACOR on a current basis and were used in the consolidated U.S. federal income tax return to offset taxable profits of other affiliates. For all periods prior to the Spin-off the total provision for income taxes included in the consolidated statements of operations would remain as currently reported had the Company not been eligible to be included in the consolidated U.S. federal income tax return of SEACOR.
|
Item 7A.
|
Quantitative and Qualitative Disclosures about Market Risk
|
As of December 31, 2013, we had non-U.S. dollar denominated capital purchase commitments of €156.3 million ($214.8 million). An adverse change of 10% in the underlying foreign currency exchange rate would increase the U.S. Dollar equivalent of the non-hedged purchase commitment by $21.5
million.
As of December 31, 2013, we maintained cash balances of €2.2 million, receivable balances of €4.5 million and payable balances of €1.1 million. An adverse change of 10% in the underlying foreign currency exchange rate would reduce net income by $0.2 million, $0.4 million and $0.1 million, respectively.
We had $55.0 million of LIBOR-based variable rate borrowings under the Revolving Credit Facility as of
December 31, 2013
. The average borrowing rate under the facility at
December 31, 2013
was 2.35%. A 10% increase in LIBOR would result in additional annual interest expense of $9,000, net of tax.
As of
December 31, 2013
, excluding debt outstanding under our Revolving Credit Facility, we had $30.3 million of variable rate debt due in 2015. These instruments bear a variable interest rate that resets every three months and is computed as the three-month LIBOR rate at the date of each reset plus 260 basis points. As of
December 31, 2013
, the interest rate on these borrowings was 2.84%. A 10% increase in the underlying LIBOR would raise the rate to 2.87%, reflecting a corresponding increase to gross interest expense of $5,000. In addition, as of
December 31, 2013
, we had interest rate swap agreements with a notional value of $31.8
million. These agreements call for us to pay a fixed interest rate ranging from 1.67% to 1.83% and receive interest payments based on LIBOR. As of
December 31, 2013
, we had a liability of $0.6
million having marked to market our positions in these interest rate swap agreements.
48
|
ITEM 8.
|
FINANCIAL STATEMENTS AND SUPPLEMENTARY DATA
|
The consolidated financial statements and related notes required by this item are included in Part IV, Item 15 of this Form 10-K and are presented beginning on page 73 of this Annual Report on Form 10-K.
|
ITEM 9.
|
CHANGES IN AND DISAGREEMENTS WITH ACCOUNTANTS ON ACCOUNTING AND FINANCIAL DISCLOSURE
|
None.
|
ITEM 9A.
|
CONTROLS AND PROCEDURES
|
Evaluation of Disclosure Controls and Procedures
With the participation of the Company’s principal executive officer and principal financial officer, management evaluated the effectiveness of the Company’s disclosure controls and procedures (as defined in Rules 13a-15(e) and 15d-15(e) under the Securities Exchange Act of 1934, as amended (the “Exchange Act”)), as of December 31, 2013. Based on their evaluation, the Company’s principal executive officer and principal financial officer concluded that the Company’s disclosure controls and procedures were effective and operating to provide reasonable assurance that material information required to be disclosed in the reports that we file or submit under the Exchange Act is recorded, processed, summarized and reported within the time periods specified in the SEC’s rules and forms, including ensuring that such material information is accumulated and communicated to our management, including our Chief Executive Officer and Chief Financial Officer, as appropriate to allow timely decisions regarding required disclosure, as of December 31, 2013.
Management's Report on Internal Control Over Financial Reporting
Our management is responsible for establishing and maintaining adequate internal control over financial reporting (as defined in Rule 13a-15(f) under the Securities Exchange Act of 1934).
Management conducted an evaluation of the effectiveness of its internal control over financial reporting as of December 31, 2013 based on the framework in Internal Control – Integrated Framework (1992) issued by the Committee of Sponsoring Organizations of the Treadway Commission. This evaluation included a review of the documentation surrounding our financial controls, an evaluation of the design effectiveness of these controls, testing of the operating effectiveness of these controls and a conclusion on this evaluation. Although there are inherent limitations in the effectiveness of any system of internal control over financial reporting – including the possibility of the circumvention or overriding of controls – based on management’s evaluation, management has concluded that our internal control over financial reporting was effective as of December 31, 2013.
Changes in Internal Control Over Financial Reporting
During the quarter ended December 31, 2013, there were no changes in our internal control over financial reporting that have materially affected or are reasonably likely to materially affect our internal control over financial reporting.
We have been evaluating, designing and enhancing controls, including internal controls over financial reporting, related to processes that previously were handled by SEACOR and/or will continue for a limited time to be handled by SEACOR under the Amended and Restated Transition Services Agreement, including payroll processing, information systems support, cash disbursement support, cash receipt processing and treasury management, and have been discussing these matters with our independent accountants and the Audit Committee of our Board of Directors. Based on these evaluations and discussions, we consider what revisions, improvements or corrections are necessary in order for us to conclude that our internal controls are effective. We are in the process of identifying areas where there is a need for improvement in our internal controls, and following such process will design and implement controls and processes to address the issues identified through this review.
|
ITEM 9B.
|
OTHER INFORMATION
|
None.
49
|
ITEM 10.
|
DIRECTORS AND EXECUTIVE OFFICERS AND CORPORATE GOVERNANCE
|
The following table sets forth information with respect to the members of our board of directors.
|
Name
|
Age
|
Position
|
||
|
Charles Fabrikant
|
69
|
Chairman of the Board of Directors
|
||
|
Sten L. Gustafson
|
47
|
Chief Executive Officer and Director
|
||
|
Oivind Lorentzen
|
63
|
Director
|
||
|
Blaine Fogg
|
73
|
Director
|
||
|
Steven Webster
|
62
|
Director
|
||
|
Ann Fairbanks
|
72
|
Director
|
||
|
Christopher P. Papouras
|
46
|
Director
|
||
|
Yueping Sun
|
57
|
Director
|
||
Charles Fabrikant
served as our President and Chief Executive Officer from October 2011 to April 2012 and has served as Chairman of our board of directors since July 2011. Effective April 1, 2012, Mr. Fabrikant resigned from his position as President and Chief Executive Officer. He continues to serve as Non-Executive Chairman of our board of directors. Mr. Fabrikant is the Executive Chairman of SEACOR and has been a director of SEACOR and several of its subsidiaries since its inception in 1989. Mr. Fabrikant served as President and Chief Executive Officer of SEACOR from 1989 through September 2010. Mr. Fabrikant is a graduate of Columbia University School of Law and Harvard University. Mr. Fabrikant is a director of Diamond Offshore Drilling, Inc., a contract oil and gas driller. He is also President of Fabrikant International Corporation ("FIC"), a privately owned corporation engaged in marine investments. FIC may be deemed an affiliate of ours.
With over 30 years’ experience in the maritime, transportation, investment and environmental industries and his position as the founder of SEACOR, Mr. Fabrikant's broad experience and deep understanding of our company make him uniquely qualified to serve as Non-Executive Chairman of our board of directors.
Sten L. Gustafson
has served as our Chief Executive Officer since April 1, 2012. Prior to joining us, Mr. Gustafson spent 17 years in energy investment banking, most recently serving as Managing Director and Head of Energy, Americas at Deutsche Bank Securities from 2009 until 2012. From 2004 until 2009, Mr. Gustafson was an investment banker at UBS Investment Bank. Mr. Gustafson received a B.A. in English from Rice University and a J.D. from the University of Houston Law Center.
Mr. Gustafson adds a valuable perspective to our board of directors given his strong background in corporate finance and international and investment banking.
Oivind Lorentzen
has been a member of our board of directors since September 2010. Mr. Lorentzen has served as Chief Executive Officer of SEACOR since September 2010. From 1990 until September 2010, Mr. Lorentzen was President of Northern Navigation America, Inc., a Stamford, Connecticut based investment management and ship-owning agency company concentrating in specialized marine transportation and ship finance. From 1979 to 1990, Mr. Lorentzen was Managing Director of Lorentzen Empreendimentos S.A., an industrial and shipping group in Brazil, and he served on its board of directors until December 2005. Mr. Lorentzen was Chairman of NFC Shipping Funds, a leading private equity fund in the maritime industry, from 2000 to 2008. Mr. Lorentzen is also a director of Blue Danube, Inc., an inland marine service provider, and a director of Genessee & Wyoming Inc., an owner and operator of short line and regional freight railroads.
Mr. Lorentzen adds a valuable perspective to our board of directors given his experience as the CEO of SEACOR and his strong background in finance, having served as the CEO of an investment management and ship-owning company specializing in ship finance.
Blaine V. ("Fin") Fogg
has been a member of our board of directors since January 2013. Mr. Fogg served on SEACOR's board of directors from September 2010 to January 2013. Mr. Fogg is Of Counsel at the law firm of Skadden, Arps, Slate, Meagher & Flom LLP, practicing corporate and securities law. He previously was a partner at the firm from 1972 until 2004. Mr. Fogg has been a director of Griffon Corporation, a diversified management and holding company, since May 2005, and has been President of The Legal Aid Society of New York since November 2009.
Mr. Fogg's decades of experience as a corporate and securities lawyer concentrating on mergers, acquisitions and other corporate transactions add great value to our board of directors with respect to its transactional matters and corporate governance.
Steven Webster
has been a member of our board of directors since January 2013. Mr. Webster served on SEACOR's board of directors from September 2005 to January 2013. Mr. Webster has been a Co-Managing Partner of Avista Capital Partners LP, a private equity investment business he co-founded that focuses on the energy, healthcare and other industries, since 2005. From 2000 through June 2005, Mr. Webster was Chairman of Global Energy Partners, an affiliate of Credit Suisse First Boston's Alternative Capital Division. From 1988 through 1997, Mr. Webster was Chairman and CEO of Falcon Drilling Company, Inc.
50
(“Falcon Drilling”) an offshore drilling company he founded, and through 1999, served as President and CEO of R&B Falcon Corporation (“R&B Falcon”), the successor to Falcon Drilling formed through its merger with Reading & Bates Corporation. Mr. Webster served as a Vice Chairman of R&B Falcon until 2001 when it merged with Transocean, Inc. Mr. Webster formerly served on the board of directors of Crown Resources Corporation, Brigham Exploration Company, Goodrich Petroleum Corporation, Grey Wolf, Inc., Encore Bancshares, Inc., Solitario Exploration & Royalty Corporation, Geokinetics Inc. and Pinnacle Gas Resource. Mr. Webster currently serves as Chairman of Carrizo Oil & Gas, Inc., a Houston based independent energy company engaged in the exploration, development and production of natural gas and oil, and Basic Energy Services Inc., a company that provides well site services to domestic oil and gas producers. He is also a Trust Manager of Camden Property Trust, a real estate investment trust specializing in multi-family housing, and a director of Hercules Offshore, Inc., an international provider of offshore contract drilling and liftboat services, Hi-Crush Proppants LP, which is a general partner of Hi-Crush Partners LP, a company that produces and supplies proppants, and various private companies. Mr. Webster served as a director of Seabulk International, Inc. both before and following its merger with SEACOR in July 2005 until March 2006.
Mr. Webster's extensive experience with private equity and equity-related investments provides additional depth to the board's analysis of investment and acquisition opportunities. His board positions and his experience as Chairman and Chief Executive Officer of a public company provide additional experience to our board of directors in evaluating corporate opportunities.
Ann Fairbanks
has been a member of our board of directors since March 2013. Mrs. Fairbanks is the founder and Chairman of The Fairbanks Investment Fund, a U.S. private equity fund providing capital to middle market European companies which seek strategic growth in global markets, since its inception in 2007. From 1990 to 2000, Mrs. Fairbanks was a partner in investment subsidiaries of Keystone, Inc., the principal investment vehicle for Robert M. Bass, a Fort Worth, Texas-based investor. Prior to joining Keystone, Mrs. Fairbanks served in a number of U.S. government positions: from 1983 to 1987 as Chief Operating Officer of the primary bank regulator for the U.S. Thrift Industry, the Federal Home Loan Bank board, which also had oversight responsibility for the Federal Home Loan Bank System, the Federal Savings and Loan Insurance Corporation, and the Federal Home Loan Mortgage Corporation. She subsequently served as a Presidential appointee on the initial board of the newly privatized Federal Home Loan Mortgage Corporation until 1994. From 1981 to 1983, Mrs. Fairbanks served as Deputy Assistant Director for Economic Policy on the White House Domestic Policy Staff of President Ronald Reagan. Mrs. Fairbanks currently serves as the chairman of the board of directors of each of Clarion Industries and Proteonic and as a director on the board of directors of each of Invectys SA and Routin SA. Previously, Mrs. Fairbanks has served on the boards of directors of ING Bank, FSB, where she was lead director through sale of the bank to Capital One Bank in 2010; Tarkett SA, as a director and member of the Audit Committee from 2002 to 2007; and Modelabs SA, as a director, from 2009 to 2011. She is also a member of the board of directors and Executive Committee of the French-American Foundation in New York, since 2002; a member of the board of directors of the French-American Foundation in France, since 2006; a member of the National Committee of the Aspen Music Festival, since 2001; and a member of the International Women's Forum in Washington, D.C., since 1996.
Mrs. Fairbanks' extensive experience with investment activities and board positions provides additional depth to the our board of directors’ analysis and evaluation of investment and acquisition opportunities and other corporate opportunities and enhances our board of directors’ leadership and corporate governance experience.
Christopher P. Papouras
has been a member of our board of directors since March 2013. Mr. Papouras has been President of Canrig Drilling Technology, Ltd., a leading supplier of drilling equipment for the oil and gas drilling industry, since 1998. Prior to that, Mr. Papouras was President of Epoch Well Services, Inc., a provider of information technology services to the oil and gas industry, and Assistant to the Chairman of Nabors Industries, Inc., a land drilling contractor and subsidiary of Nabors Industries Ltd. Mr. Papouras currently serves as a director of Drillmap Inc., a private company that offers software solutions for the oil and gas industry. Mr. Papouras is active in the Young Presidents' Organization, serves as an advisory board member of Knowledge is Power Program, Houston Public Schools and serves on the board of directors and Executive Committee of the Boys & Girls Club of Greater Houston.
Mr. Papouras brings extensive industry experience as well as corporate leadership and financial and operational management experience to our board of directors.
Yueping Sun
has been a member of our board of directors since March 2013. Ms. Sun has been Of Counsel for the law firm of Yetter Coleman LLP since 2005, where her principal areas of practice include corporate and securities law. She also has served as Rice University Representative since 2004. Previously, Ms. Sun practiced law in New York City with White & Case LLP and Sidley Austin Brown & Wood LLP. Ms. Sun is a board member of the Asia Society Texas Center, St. John's School, and the United Way of Greater Houston, a trustee of Texas Children's Hospital and honorary co-chair of Rice's Baker Institute Roundtable. She also serves as a member of the advisory board of Rice's Shepherd School of Music, the Kinder Institute for Urban Research, Asian Chamber of Commerce, Chinese Community Center, and the Mayor's International Trade and Development Council for Asia/Australia. Ms. Sun has been recognized by several organizations for her contributions to the community, including the 2010 International Executive of the Year, Texas China Distinguished Leader in Education Award, the 2011 Asian American Leadership Award, Woman on the Move, one of the Most 50 Influential Women of 2010 and the 2012 ABC Channel 13 Woman of Distinction.
51
Ms. Sun's experience as a corporate and securities lawyer concentrating on cross-border and other corporate transactions adds great value to the board with respect to transactional matters and corporate governance, and her broad experience provides for enhanced board diversity.
Executive Officers
Information regarding our executive officers is included in Part I under “Executive Officers of the Registrant.”
Corporate Governance
Board of Directors and Director Independence
Our business and affairs are managed under the direction of our board of directors. Our amended and restated bylaws provide that our board of directors will consist of not less than five and not more than fifteen directors. During the last fiscal year, our board of directors held nine meetings. Each of the directors attended at least 75% of the combined total meetings of the full board of directors and the committees on which he or she served in the last fiscal year.
A majority of our directors are independent, non-employee directors. Our board of directors has made the affirmative determination that a majority of our directors, namely Messrs. Webster, Fogg and Papouras and Mmes. Fairbanks and Sun, are independent as such term is defined by the applicable rules and regulations of the New York Stock Exchange. Additionally, each of these directors meets the categorical standards for independence established by our board of directors (the “Era Categorical Standards”). In making such determination, our board of directors considered the fact that Mr. Webster is also a director of Hercules Offshore, Inc. ("Hercules"), a customer of the Company, and that the total amount earned by the Company from business conducted with Hercules did not exceed $0.1 million in the year ended December 31, 2013.
A copy of the Era Categorical Standards is available on our website at
www.eragroupinc.com
by clicking “Corporate Governance.” Our website and the information contained therein or connected thereto shall not be deemed to be incorporated into this Annual Report on Form 10-K.
Committees of the Board of Directors
Our board of directors has established the following committees, each of which operates under a written charter that has been posted on our website at
www.eragroupinc.com.
Our website and the information contained therein or connected thereto shall not be deemed to be incorporated into this Annual Report on Form 10-K.
Audit Committee.
The Audit Committee met four times during the last fiscal year and is currently comprised of Ann Fairbanks, Blaine Fogg and Christopher Papouras. Mr. Papouras is the Audit Committee Chairman. Our board of directors has determined that Mr. Papouras is an "audit committee financial expert" for purposes of the rules of the SEC. In reaching this determination, our board of directors considered, among other things, the experience of Mr. Papouras as President of Canrig Drilling Technology, Ltd., in addition to other experience, as further set forth above. In addition, our board of directors determined that each of the members of the Audit Committee are independent, as defined by the rules of the NYSE, Section 10A(m)(3) of the Exchange Act and in accordance with the Era Categorical Standards. The Audit Committee is expected to meet at least quarterly.
Committee Function. The Audit Committee assists the board of directors in fulfilling its responsibility to oversee:
|
•
|
management's execution of our financial reporting process, including the reporting of any material events, transactions, changes in accounting estimates or changes in important accounting principles and any significant issues as to adequacy of internal controls;
|
|
•
|
the selection, performance and qualifications of our independent registered public accounting firm (including its independence);
|
|
•
|
the review of the financial reports and other financial information provided by us to any governmental or regulatory body, the public or other users thereof;
|
|
•
|
our systems of internal accounting and financial controls and the annual independent audit of our financial statements;
|
|
•
|
risk management and controls, which includes assisting management with identifying and monitoring risks, developing effective strategies to mitigate risk, and incorporating procedures into its strategic decision-making (and reporting developments related thereto to our board of directors); and
|
|
•
|
the processes for handling complaints relating to accounting, internal accounting controls and auditing matters.
|
The Audit Committee's role is one of oversight. Our management is responsible for preparing our financial statements and the independent auditors are responsible for auditing those financial statements. Our management, including the internal audit staff, or outside provider of such services, and the independent auditors have more time, knowledge and detailed information about
52
us than do Audit Committee members. Consequently, in carrying out its oversight responsibilities, the Audit Committee will not provide any expert or special assurance as to our financial statements or any professional certification as to the independent auditors' work.
Compensation Committee.
The Compensation Committee met four times during the last fiscal year and is currently comprised of Blaine Fogg, Yueping Sun and Steven Webster. Blaine Fogg is the Compensation Committee Chairman. Our board of directors has determined that each member of the Compensation Committee is independent, as defined by the rules of the NYSE and in accordance with the Era Categorical Standards. In addition, the members of the Compensation Committee qualify as "non-employee directors" for purposes of Rule 16b-3 under the Exchange Act and as "outside directors" for purposes of Section 162(m) of the Code.
Committee Function. The Compensation Committee, among other things:
|
•
|
reviews all of our compensation practices;
|
|
•
|
establishes and approves compensation for the Chief Executive Officer, the Chief Financial Officer, other executive officers, and certain officers or managers who receive an annual base salary of more than $200,000;
|
|
•
|
evaluates officer and director compensation plans, policies and programs;
|
|
•
|
reviews and approves benefit plans;
|
|
•
|
produces a report on executive compensation (if required) to be included in our proxy statements or other SEC filings; and
|
|
•
|
approves all grants of equity awards.
|
The Chairman sets the agenda for meetings of the Compensation Committee. The meetings are attended by the Chairman of our board of directors and the General Counsel, if requested. At each meeting, the Compensation Committee has the opportunity to meet in executive session. The Chairman of the Compensation Committee reports the Compensation Committee's actions regarding compensation of executive officers to the full board of directors. The Compensation Committee has the sole authority to retain, obtain the advice of and terminate any compensation consultants, independent legal counsel or other advisors to assist the Compensation Committee in its discharge of its duties and responsibilities, including the evaluation of director or executive officer compensation.
Nominating and Corporate Governance Committee.
The Nominating and Governance Committee did not hold any meetings during the last fiscal year and acted by written consent. The Nominating and Governance Committee is currently comprised of Ann Fairbanks, Yueping Sun and Steven Webster. Our board of directors has determined that each member of the Nominating and Governance Committee is independent, as defined by the rules of the NYSE and in accordance with the Era Categorical Standards.
Committee Function. The Nominating and Corporate Governance Committee assists the board of directors with:
|
•
|
identifying, screening and reviewing individuals qualified to serve as directors and recommending to the board of directors candidates for election at our Annual Meeting of Stockholders and to fill vacancies on the board of directors;
|
|
•
|
recommending modifications, as appropriate, to our policies and procedures for identifying and reviewing candidates for the board of directors, including policies and procedures relating to candidates for the board of directors submitted for consideration by stockholders;
|
|
•
|
reviewing the composition of the board of directors as a whole, including whether the board of directors reflects the appropriate balance of independence, sound judgment, business specialization, technical skills, diversity and other desired qualities;
|
|
•
|
reviewing periodically the size of the board of directors and recommending any appropriate changes;
|
|
•
|
overseeing the evaluation of the board of directors and management;
|
|
•
|
recommending changes in director compensation; and
|
|
•
|
various governance responsibilities.
|
Selection of Nominees for the Board of Directors. To fulfill its responsibility to recruit and recommend to the full board of directors nominees for election as directors, the Nominating and Corporate Governance Committee reviews the composition of the full board of directors to determine the qualifications and areas of expertise needed to further enhance the composition of the board of directors and works with management in attracting candidates with those qualifications.
53
In identifying new director candidates, the Nominating and Corporate Governance Committee seeks advice and names of candidates from Nominating and Corporate Governance Committee members, other members of the board of directors, members of management and other public and private sources. The Nominating and Corporate Governance Committee, in formulating its recommendation of candidates to the board of directors, considers each candidate's personal qualifications and how such personal qualifications effectively address the perceived then current needs of the board of directors. Appropriate personal qualifications and criteria for membership on the board of directors include the following:
|
•
|
experience investing in and/or guiding complex businesses as an executive leader or as an investment professional within an industry or area of importance to us;
|
|
•
|
proven judgment and competence, substantial accomplishments, and prior or current association with institutions noted for their excellence;
|
|
•
|
complementary professional skills and experience addressing the complex issues facing a multifaceted international organization;
|
|
•
|
an understanding of our businesses and the environment in which we operate; and
|
|
•
|
diversity as to business experiences, educational and professional backgrounds and ethnicity.
|
After the Nominating and Corporate Governance Committee completes its evaluation, it presents its recommendations to the board of directors for consideration and approval. The Nominating and Corporate Governance Committee may also, but need not, retain a search firm in order to assist it in these efforts.
Stockholder Recommendations.
The Nominating and Corporate Governance Committee will consider director candidates suggested by our stockholders provided that the recommendations are made in accordance with the same procedures required under our bylaws for nomination of directors by stockholders. Stockholder nominations that comply with these procedures and that meet certain criteria outlined will receive the same consideration that the Nominating and Corporate Governance Committee's nominees receive. There have been no material changes to these procedures since we last provided this disclosure.
Code of Business Conduct and Ethics
Our board of directors has adopted a set of Corporate Governance Guidelines, a Code of Business Conduct and Ethics and a Supplemental Code of Ethics. A copy of each of these documents, along with the charters of each of the committees described above, is available on our website at
www.eragroupinc.com
, by clicking “Corporate Governance” and is also available to stockholders in print without charge upon written request to our Investor Relations Department, 818 Town & Country Blvd. Suite 200, Houston, Texas, 77024.
Our Corporate Governance Guidelines address areas such as director responsibilities and qualifications, director compensation, management succession, board committees and annual self-evaluation. Our Code of Business Conduct and Ethics is applicable to our directors, officers, and employees and our Supplemental Code of Ethics is applicable to our Chief Executive Officer and senior financial officers. We will disclose future amendments to, or waivers from, certain provisions of our Supplemental Code of Ethics on our website within two business days following the date of such amendment or waiver.
Section 16(a) Beneficial Ownership Reporting Compliance
Section 16(a) of the Exchange Act requires that each director and executive officer of the Company and each person owning more than 10% of our Common Stock report his or her initial ownership of our Common Stock and any subsequent changes in that ownership to the SEC. The Company is required to disclose in this Annual Report on Form 10-K any failure to file or late filings of such reports.
Based solely upon a review of copies of forms furnished to the Company or written representations from certain reporting persons that no other reports were required for such reporting persons, the Company believes that all Section 16(a) reports were filed on a timely basis with respect to the most recent fiscal year.
|
ITEM 11.
|
EXECUTIVE COMPENSATION
|
Compensation of Directors
Prior to the completion of our spin-off from SEACOR Holdings Inc. on January 31, 2013 (the "Spin-off"), we did not pay our directors for their service on our board of directors. In February 2013, we adopted a director compensation package for members of our board of directors that are not employees of ours. Our directors (other than our non-executive chairman) are entitled to an annual cash retainer of $60,000 and are also entitled to additional cash compensation of $2,000 for each meeting of our board of directors or its committees attended in person and $1,000 for each such meeting attended telephonically. Our non-executive chairman is entitled to an annual cash retainer of $220,000. In addition, the chairperson of each of our audit, compensation and nominating and governance committees are entitled to additional annual cash retainers of $20,000, $15,000 and $10,000,
54
respectively. Directors are also eligible for equity awards under our 2012 Share Incentive Plan. We expect that annual awards to non-employee directors will be in the form of restricted stock awards with a value of $60,000 (2,930 shares of restricted stock for the grant made in March 2013) and will vest on the one year anniversary of the date of the grant. In addition, upon election to our board of directors, directors will generally receive an initial award of 4,000 shares of restricted stock that will vest over 4 years. In March 2013, upon his election to our board of directors, Oivind Lorentzen received an initial award of 1,000 shares of restricted stock vesting on the first anniversary of the date of grant in lieu of the full initial award described above. If a non-employee director’s service as a director of the Company terminates upon death, disability or change in control of the Company, any unvested restricted stock awards will become fully vested. If a non-employee director’s service as a director of the Company terminates for any other reason, the unvested restricted stock awards will be forfeited.
NON-EMPLOYEE DIRECTOR COMPENSATION TABLE
The following table shows the compensation of the Company’s non-employee directors for the year ended December 31, 2013.
|
Name
|
Fees earned or paid in cash
|
Stock Awards
(4)
|
Total
|
||||||
|
($)
|
($)
|
($)
|
|||||||
|
Charles Fabrikant
|
224,056
|
|
141,926
|
|
365,982
|
|
|||
|
Ann Fairbanks
(2)(3)
|
66,667
|
|
141,926
|
|
208,593
|
|
|||
|
Blaine Fogg
(1)(3)
|
93,343
|
|
141,926
|
|
235,269
|
|
|||
|
Oivind Lorentzen
|
69,833
|
|
80,486
|
|
150,319
|
|
|||
|
Christopher Papouras
(3)
|
81,304
|
|
141,926
|
|
223,230
|
|
|||
|
Yueping Sun
(1)(2)
|
67,667
|
|
141,926
|
|
209,593
|
|
|||
|
Steven Webster
(1)(2)
|
96,113
|
|
141,926
|
|
238,039
|
|
|||
______________________________
(1) Member of the Compensation Committee.
(2) Member of the Nominating and Corporate Governance Committee.
(3) Member of the Audit Committee.
|
(4)
|
On March 19, 2013, each of the non-employee directors was granted 2,930 shares of Common Stock vesting on the one year anniversary of the date of grant. In addition, on that date, each of the non-employee directors, excluding Oivind Lorentzen, was granted 4,000 shares of Common Stock upon being elected to our board of directors vesting ratably in annual, equal increments over four years. Mr. Lorentzen was granted 1,000 shares of Common Stock vesting on the one year anniversary of the date of grant. The dollar amount of stock awards set forth in this column is equal to the grant date fair value of such stock awards calculated in accordance with the Financial Accounting Standards Board (“FASB”) Accounting Standards Codification Topic 718 without regard to forfeitures. Discussion of the policies and assumptions used in the calculation of grant date value are set forth in Notes 1 and 13 of the Notes to the Consolidated Financial Statements in Item 8 of this Annual Report on Form 10-K.
|
(5) The following table shows the outstanding shares of restricted stock held by each non-employee director as of December 31, 2013.
|
Non-Employee Director
|
Outstanding Shares of Restricted Stock
|
|
|
Charles Fabrikant
|
6,930
|
|
|
Ann Fairbanks
|
6,930
|
|
|
Blaine Fogg
|
6,930
|
|
|
Oivind Lorentzen
|
3,930
|
|
|
Christopher Papouras
|
6,930
|
|
|
Yueping Sun
|
6,930
|
|
|
Steven Webster
|
6,930
|
|
55
Compensation of Officers
2013 Compensation
The compensation of Sten L. Gustafson, our Chief Executive Officer, and our other executive officers identified in our Summary Compensation Table, who we refer to as the “named executive officers,” generally consists of a combination of base salary, bonuses and equity-based compensation. Executive officers and all salaried employees also receive a benefits package. Our named executive officers do not have employment, severance, change-of-control or similar types of agreements with us.
Components of 2013 Compensation
Base Salary.
Our named executive officers' base salary levels are determined based on the experience and skill required for executing our business strategy and overseeing operations and will be adjusted as appropriate at levels designed to be consistent with professional and market standards.
For the year ended December 31, 2013, Mr. Gustafson's base salary was $400,000, Mr. Bradshaw's base salary was $300,000, Mr. Stavley’s base salary was $150,000 and Mr. White’s base salary was $150,000. Effective January 1, 2014, the base salaries were adjusted to $500,000 for Mr. Gustafson, $335,000 for Mr. Bradshaw, $225,000 for Mr. Stavley and $225,000 for Mr. White.
Cash Bonus Compensation.
Cash bonus awards to our executive officers are discretionary and our Compensation Committee, with input from management, determines the amount and structure of cash bonuses on a case-by-case basis for each individual, which we believe is the best approach for us. We have also adopted the Era Group Inc. Management Incentive Plan (the “MIP”) to allow us to award annual bonus compensation that complies with the requirements of Section 162(m) of the Code. For a description of the MIP see “—Era Management Incentive Plan.”
In March 2014, our Compensation Committee approved cash bonus awards in respect of 2013 of $700,000 to Mr. Gustafson, $290,000 to Mr. Bradshaw, $112,500 to Mr. Stavley and $112,500 to Mr. White. Other than $40,000 of the cash award granted to Mr. Bradshaw as a salary adjustment paid in full prior to March 15, 2014, the cash bonuses are payable over three years, 60% in the year awarded (for services in the prior calendar year) and 20% in each of the next two subsequent years. Interest is paid on the deferred portion of this cash bonus compensation at the Company’s borrowing rate at the time of payment, currently LIBOR plus 210 bps or approximately 2.35% per annum.
In February 2013, our Compensation Committee awarded Mr. Gustafson a one-time cash bonus of $500,000 in lieu of a portion of the replacement restricted stock awards he was to receive as described below.
Equity Compensation.
In connection with the Spin-off, we adopted the Era Group Inc. 2012 Share Incentive Plan (the “Share Incentive Plan”). Our Compensation Committee, with input from management, determines the amount and allocation of equity awards on a case-by-case basis for each individual, which we believe is the best approach for us. We currently employee two types of equity-based awards: restricted stock and stock options. The amount of the awards and allocation is based on our Compensation Committee’s analysis and other factors, including an estimate of the value of such awards.
Restricted Stock.
In December 2012, SEACOR's Compensation Committee awarded 12,000 shares and 5,000 shares of SEACOR restricted stock to Messrs. Gustafson and Bradshaw, respectively. The shares of SEACOR restricted stock awarded to Messrs. Gustafson and Bradshaw were cancelled in connection with the Spin-off and replaced with the awards discussed below. In March 2013, our Compensation Committee awarded Mr. Gustafson 75,000 shares of restricted stock and Mr. Bradshaw 40,000 shares of restricted stock in place of their SEACOR restricted stock awards and awarded each of Messrs. Stavley and White 15,000 shares of restricted stock. These shares of restricted stock vest in four equal installments on the anniversary of the grant.
In connection with the Spin-off, except with respect to SEACOR restricted stock awards granted to Mr. Gustafson and Mr. Bradshaw in December 2012, outstanding restricted stock awards of SEACOR common stock held by our employees and employees and directors of SEACOR that were granted under SEACOR’s equity incentive plans were treated the same as other shares of SEACOR’s common stock in the Spin-off. Holders of these SEACOR restricted stock awards received one fully vested share of our Common Stock for each SEACOR restricted stock award held by such employee. All other terms of these SEACOR restricted stock awards remain the same.
Stock Options.
In March 2013, Mr. Gustafson was granted options to purchase 100,000 shares of our Common Stock, Mr. Bradshaw was granted options to purchase 40,000 shares of our Common Stock, and each of Messrs. Stavley and White were granted options to purchase 15,000 shares of our Common Stock. These options were granted with a strike price of $20.48 per share (equal to the closing market price of our Common Stock on the NYSE on the date of grant) and vest in four equal installments on the anniversary of the grant.
In connection with the Spin-off, outstanding stock options to purchase shares of SEACOR common stock granted to employees and directors of SEACOR under SEACOR’s equity incentive plans were adjusted to reflect the difference in value of SEACOR's common stock on the “regular way” market on the day before and the effective date of the Spin-off, by changing the
56
exercise price and number of shares of SEACOR common stock subject to the stock options. In addition, Era Group employees and directors of SEACOR that joined our board of directors and resigned from SEACOR’s board of directors after the Spin-off had their outstanding stock options to purchase shares of SEACOR common stock canceled and replaced with stock options to purchase shares of our Common Stock based on a similar formula.
Compensation Committee Interlocks and Insider Participation
None of the current members of our Compensation Committee is or was an officer or employee of the Company. During the last fiscal year, none of our executive officers served as a director or member of the compensation committee of any other entity whose executive officers serves on our board of directors or our Compensation Committee.
Summary Compensation Table
The following table sets forth compensation information for our named executive officers with respect to the fiscal years ended December 31, 2012 and December 31, 2013. Share information with respect to the fiscal year ended December 31, 2012 relates to SEACOR common stock.
|
Year
|
Salary
|
Bonus
(1)
|
Stock Awards
(2)
|
Option Awards
(2)
|
All Other Compensation
(3)
|
Total
|
|||||||||||||
|
($)
|
($)
|
($)
|
($)
|
($)
|
($)
|
||||||||||||||
|
Sten Gustafson
(3)
|
2013
|
400,000
|
|
1,200,000
|
|
1,536,000
|
|
891,000
|
|
7,650
|
|
4,034,650
|
|
||||||
|
Chief Executive Officer and Director
|
2012
|
300,000
|
|
150,000
|
|
990,960
|
|
—
|
|
5,700
|
|
1,446,660
|
|
||||||
|
Chris Bradshaw
|
2013
|
300,000
|
|
290,000
|
|
819,200
|
|
356,400
|
|
7,650
|
|
1,773,250
|
|
||||||
|
Executive Vice President and Chief Financial Officer
|
2012
|
59,231
|
|
25,000
|
|
412,900
|
|
—
|
|
—
|
|
497,131
|
|
||||||
|
Paul White
|
2013
|
150,000
|
|
112,500
|
|
307,200
|
|
133,650
|
|
4,950
|
|
708,300
|
|
||||||
|
Senior Vice President, Domestic
|
2012
|
150,000
|
|
75,000
|
|
49,170
|
|
—
|
|
7,500
|
|
281,670
|
|
||||||
|
Stuart Stavley
|
2013
|
150,000
|
|
112,500
|
|
307,200
|
|
133,650
|
|
4,950
|
|
708,300
|
|
||||||
|
Senior Vice President, Fleet Management
|
2012
|
150,000
|
|
75,000
|
|
49,170
|
|
—
|
|
7,500
|
|
281,670
|
|
||||||
|
(1)
|
In general, sixty percent (60%) of the bonus is paid at the time of the award and the remaining forty percent (40%) is paid in two equal annual installments approximately one and two years after the date of the grant. Any outstanding balance is generally payable upon the death, disability, qualified retirement, termination without “cause” of the employee, or the occurrence of a “change-in-control,” however, the outstanding balance is generally forfeited if the employee is terminated with “cause” or resigns without “good reason.” Interest is paid on the deferred portion of the bonus at the Company’s borrowing rate at the time of payment, currently LIBOR plus 210 bps or approximately 2.35% per annum, and during the year ended December 31, 2013 the interest that would have accrued at the Company’s current borrowing rate on previously approved bonus amounts that have been deferred totaled $6,110, $235, $1,181 and $1,181 for Messrs. Gustafson, Bradshaw, White and Stavley, respectively. The amounts for 2013 for Mr. Gustafson include the cash bonus of $500,000 awarded to Mr. Gustafson by the Compensation Committee in February 2013 in lieu of a portion of replacement equity related to the Spin-off.
|
|
(2)
|
The dollar amount of restricted stock and stock options set forth in these columns reflects the aggregate grant date fair value of restricted stock and option awards made during 2013 and 2012, respectively, in accordance with the FASB ASC Topic 718 without regard to forfeitures. Discussion of the policies and assumptions used in the calculation of the grant date fair value are set forth in Notes 1 and 13 of the Notes to the Consolidated Financial Statements in Item 8 to this Annual Report on Form 10-K.
|
|
(3)
|
This column includes contributions to match the pre-tax effective deferral contributions (included under Salary made (i) by SEACOR under the SEACOR Savings Plan, a defined contribution plan established by SEACOR effective July 1, 1994) meeting the requirements of Section 401(k) of the Internal Revenue Code for 2012 and (ii) by the Company under the qualified 401(k) savings plan adopted in connection with the Spin-off for 2013.
|
57
Outstanding Equity Awards at Fiscal Year-end (2013)
The following table sets forth certain information with respect to outstanding equity awards at December 31, 2013, held by the named executive officers.
|
Option Awards
|
Stock Awards
|
||||||||
|
Name
|
Number of Securities Underlying Unexercised Options (Exercisable)
|
Number of Securities Underlying Unexercised Options (Unexercisable)
(1)
|
Option Exercise Price
|
Option Expiration Date
|
Number of Shares or Units of Stock that Have Not Vested
|
Market Value of Shares or Units that Have Not Vested
|
|||
|
(#)
|
(#)
|
($)
|
(#)
|
($)
|
|||||
|
Sten Gustafson
Chief Executive Officer and Director |
—
|
|
100,000
|
|
20.48
|
3/19/2023
|
75,000
(2)
|
2,314,500
(6)
|
|
|
Chris Bradshaw
Executive Vice President and Chief Financial Officer |
—
|
|
40,000
|
|
20.48
|
3/19/2023
|
40,000
(2)
|
1,234,400
(6)
|
|
|
Stuart Stavley
Senior Vice President
|
—
|
|
15,000
|
|
20.48
|
3/19/2023
|
15,000
(2)
|
462,900
(6)
|
|
|
250
(3)
|
22,800
(7)
|
||||||||
|
200
(4)
|
18,240
(7)
|
||||||||
|
100
(5)
|
9,120
(7)
|
||||||||
|
Paul White
Senior Vice President
|
—
|
|
15,000
|
|
20.48
|
3/19/2023
|
15,000
(2)
|
462,900
(6)
|
|
|
300
(3)
|
27,360
(7)
|
||||||||
|
200
(4)
|
18,240
(7)
|
||||||||
|
100
(5)
|
9,120
(7)
|
||||||||
_________________________
|
(1)
|
Options vest incrementally at a rate of one-fourth per year.
|
|
(2)
|
These shares vest in equal portions on March 19, 2014, 2015, 2016 and 2017, assuming continued employment with the Company.
|
|
(3)
|
These shares vest on March 4, 2015.
|
|
(4)
|
These shares vest on March 4, 2016.
|
|
(5)
|
These shares vest on March 4, 2017.
|
|
(6)
|
These amounts equal the number of shares of restricted stock indicated multiplied by the closing price of our Common Stock on December 31, 2013, which was $30.86.
|
|
(7)
|
These amounts equal the number of shares of restricted stock indicated multiplied by the closing price of SEACOR's common stock on December 31, 2013, which was $91.20.
|
401(k) Plan
In connection with the Spin-off, we adopted a qualified 401(k) savings plan which allows executives to defer from 1% of cash compensation up to the maximum amount allowed under Internal Revenue Service guidelines. The terms of the plan permit the Company to make discretionary contributions from time to time. Participants are always vested in their own contributions to the plan and are fully vested in the Company’s contributions generally after five years of service.
Effective January 1, 2014, our plan was amended to provide for
qualified non-elective
Company contributions in an amount equal to 3% of each employee’s eligible pay and immediate and full vesting in the Company’s contributions.
Employment and Other Contracts and Potential Payments Upon Death, Disability, Qualified Retirement, Termination Without Cause or a Change of Control
The named executive officers do not have employment, severance or change-of-control agreements with the Company.
58
Except as set forth below, as of December 31, 2013, our named executive officers would not have received any payments upon a change of control of the Company.
Under the 2012 Share Incentive Plan, stock options and restricted stock are payable or vest upon the death, qualified retirement, termination without "cause" of the employee, or the occurrence of a "change in control." However, the outstanding balance is generally forfeited if the employee is terminated with "cause" or resigns without "good reason." In addition, it has been our practice to accelerate the payment of outstanding cash bonuses in similar circumstances, but we are under no contractual obligation to do so.
As of December 31, 2013, Messrs. Gustafson, Bradshaw, Stavley and White would have received $266,110, $10,235, $41,181 and $41,181, respectively, in bonus awards (including the interest paid on the deferred portion of this cash bonus compensation at the Company’s borrowing rate of LIBOR plus 210 bps or approximately 2.35% per annum through the date of payment); $2,314,500, $1,234,400, $513,060 and $517,620, respectively, in stock awards; and $1,038,000, $415,200, $155,700 and $155,700, respectively, in option awards, in each case, upon their respective death, disability, qualified retirement, termination without "cause" or "change in control" of the Company.
The bonus award amounts represent the total of all remaining annual installments of bonus payments yet to be paid as of December 31, 2013, of which $133,055, $5,118, $25,829, and $25,829, respectively, has been paid to Messrs. Gustafson, Bradshaw, Stavley and White in March 2014. The stock and option award amounts reflect the accumulated value for unvested shares and options based on the closing price of our Common Stock as of December 31, 2013, which was $30.86, with the value for unvested options based on the difference between strike prices and such closing price.
Indemnification Agreements
We have entered into indemnification agreements with each of our directors and executive officers. These agreements, among other things, require us to indemnify each director and executive officer to the fullest extent permitted by Delaware law, including indemnification of expenses such as attorneys' fees, judgments, fines and settlement amounts incurred by the director or executive officer in any action or proceeding, including any action or proceeding by or in right of us, arising out of the person's services as a director or executive officer.
Era Management Incentive Plan
We adopted the Era Group Inc. Management Incentive Plan (the "MIP") to allow us to award annual bonus compensation that complies with the requirements of Section 162(m) of the Code. Generally, Section 162(m) denies a deduction to publicly held corporations for compensation paid to certain executive officers in excess of $1 million per executive per taxable year. An exception applies to certain performance based compensation that meets the requirements of Section 162(m). We believe that bonus opportunities granted under the MIP should qualify for the performance based compensation exception to Section 162(m).
We adopted the MIP because we believe that the MIP promotes our financial interests, including growth, by (i) attracting and retaining officers and key executives of outstanding competence; (ii) motivating officers and key executives by means of performance-related incentives; and (iii) providing competitive incentive compensation opportunities.
The MIP is administered by our Compensation Committee. The Compensation Committee has the power to select employees to participate in the MIP, determine the size of awards under the MIP and make all necessary determinations under the MIP.
Executive employees who are, or are expected to be, "covered employees" under Section 162(m) and other executive employees, selected in the sole discretion of the Compensation Committee, are eligible to participate in the MIP. A participant may be designated as being eligible to receive an incentive cash bonus with respect to an annual performance period. The maximum annual bonus payable to any participant is $6 million. Unless otherwise determined by the Compensation Committee or our board of directors, the annual performance period will begin on January 1 of each calendar year and end on December 31 of that calendar year. Within 90 days after the beginning of each performance period, the Compensation Committee will establish specific performance goals for such annual performance period.
The performance goals are specific targets and objectives established by our Compensation Committee. These performance goals are primarily based on the earnings before interest, taxes, depreciation, amortization and non-cash items of the Company, or any business or division thereof, but may also be based on one or more specified objective performance measures. Performance goals may also be based on comparisons to the performance of other companies or an index covering multiple companies, measured by one or more of the foregoing performance measures.
59
As soon as reasonably practical following the completion of each annual performance period, our Compensation Committee will confirm which of the applicable performance goals, if any, have been achieved and the amount of bonuses payable as a result. The evaluation of performance measures against the performance goals may (A) be adjusted consistent with exclusions or adjustments provided for in our financing agreements, or (B) exclude or adjust for the impact of certain events or occurrences that were not budgeted or planned for in setting the goals, including but not limited to changes in accounting standards or tax laws and the effects of non-operational or extraordinary items as defined by generally accepted accounting principles. Our Compensation Committee may not increase any annual bonus payable. Our Compensation Committee may, however, reduce or eliminate any annual bonus payable; provided, however, such action will not result in any increase in the amount of any annual bonus payable to any other MIP participant.
|
ITEM 12.
|
SECURITY OWNERSHIP OF CERTAIN BENEFICIAL OWNERS AND MANAGEMENT AND RELATED STOCKHOLDER MATTERS
|
The following table provides information with respect to the beneficial ownership of our Common Stock as of February 28, 2014 by:
|
•
|
each of our stockholders known to be the beneficial owner of more than 5% of our outstanding shares of Common Stock;
|
|
•
|
each director named in the summary compensation table;
|
|
•
|
each officer named in the summary compensation table; and
|
|
•
|
all of our current directors and executive officers as a group.
|
As of February 28, 2014, there were 20,183,893 shares of our Common Stock outstanding.
The amounts and percentages of Common Stock beneficially owned are reported on the basis of the regulations of the SEC governing the determination of beneficial ownership of securities. Under these rules, a person is deemed to be a beneficial owner of a security if that person has or shares voting power, which includes the power to vote or to direct the voting of such security, or investment power, which includes the power to dispose of or to direct the disposition of such security. A person is also deemed to be a beneficial owner of any securities of which that person has a right to acquire beneficial ownership within 60 days. Under these rules, more than one person may be deemed to be a beneficial owner of the same securities.
Except as otherwise noted in the footnotes below, each person or entity identified in the table has sole voting and investment power with respect to the securities they hold.
60
|
Name
|
Amount and Nature of Beneficial Ownership
|
Percentage of Class
|
||||
|
Directors and Named Executive Officers:
|
||||||
|
Charles Fabrikant
(1)
|
881,518
|
|
4.37%
|
|
||
|
Christopher S. Bradshaw
(2)
|
50,000
|
|
*
|
|
||
|
Shannon Fairbanks
(3)
|
8,805
|
|
*
|
|
||
|
Blaine Fogg
(4)
|
43,140
|
|
*
|
|
||
|
Sten L. Gustafson
(5)
|
101,626
|
|
*
|
|
||
|
Oivind Lorentzen
(6)
|
162,180
|
|
*
|
|
||
|
Christopher P. Papouras
(3)
|
6,930
|
|
*
|
|
||
|
Stuart Stavley
(7)
|
20,714
|
|
*
|
|
||
|
Yueping Sun
(3)
|
6,930
|
|
*
|
|
||
|
Steven Webster
(8)
|
124,705
|
|
*
|
|
||
|
Paul White
(9)
|
19,156
|
|
*
|
|
||
|
All current directors and executive officers as a group (13 individuals)
(10)
|
1,448,866
|
|
7.18
|
%
|
||
|
Principal Stockholders:
|
||||||
|
BlackRock Inc.
(11)
40 East 52nd Street
New York, NY 10022
|
1,798,026
|
|
8.91
|
%
|
||
|
Dimensional Fund Advisors LP
(12)
Palisades Wes, Building One
6300 Bee Cave Road
Austin, TX 78476
|
1,328,760
|
|
6.58
|
%
|
||
|
Keeley Asset Management Corp.
(13)
111 West Jackson, Suite 810
Chicago, IL 60604
|
1,168,837
|
|
5.79
|
%
|
||
|
Royce & Associates
(14)
745 Fifth Avenue
New York, NY 10151
|
1,011,420
|
|
5.01
|
%
|
||
|
Wellington Management Company, LLP
(15)
280 Congress Street
Boston, MA 02110
|
2,381,701
|
|
11.80
|
%
|
||
__________
|
(1)
|
Includes 459,874 shares of our Common Stock that Mr. Fabrikant may be deemed to own through his interest in, and control of (i) Fabrikant International Corporation, of which he is President, the record owner of 338,529 shares of our Common Stock; (ii) VSS Holding Corporation, of which he is President and sole stockholder, the record owner of 24,236 shares of our Common Stock; (iii) the Article Seven Trust, of which he is a trustee, the record owner of 1,434 shares of our Common Stock; (iv) the Charles Fabrikant 1974 Trust, of which he is a trustee, the record owner of 1,540 shares of our Common Stock; (v) the Jane Strasser 1974 Trust, of which he is a trustee, the record owner of 1,540 shares of our Common Stock; (vi) the Sara J. Fabrikant 2012 GST Exempt Trust, of which he is a trustee, the record owner of 12,000 shares of our Common Stock; (vii) the Estate of Elaine Fabrikant, over which he is the executor, the record owner of 18,995 shares of our Common Stock; (vii) the Charles Fabrikant 2012 GST Exempt Trust, of which his wife is a trustee, the record holder of 60,000 shares of our Common Stock; (x) the Harlan Saroken 2009 Family Trust, of which his wife is a trustee, the record holder of 800 shares of our Common Stock; and (xi) the Eric Fabrikant 2009 Family Trust, of which his wife is a trustee, the record owner of 800 shares of our Common Stock. Also includes 6,930 shares of restricted stock over which Mr. Fabrikant exercises sole voting power.
|
|
(2)
|
Represents 40,000 shares of restricted stock over which Mr. Bradshaw exercises sole voting power and includes options to purchase 10,000 shares of our Common Stock
that have vested or will vest within 60 days of
February 28, 2014
.
|
|
(3)
|
Includes 6,930 shares of restricted stock over which the named person exercises voting power.
|
|
(4)
|
Represents 6,930 shares of restricted stock over which Mr. Fogg exercises sole voting power and includes options to purchase 33,460 shares of our Common Stock that have vested or will vest within 60 days of February 28, 2014.
|
61
|
(5)
|
Includes 600 shares of our Common Stock that are held by Mr. Gustafson’s wife. Also includes 75,000 shares of restricted stock over which Mr. Gustafson exercises sole voting power and options to purchase 25,000 shares of our Common Stock that have vested or will vest within 60 days of February 28, 2014.
|
|
(6)
|
Includes 32,500 shares that Mr. Lorentzen may be deemed to own through various trusts held for his children. Also includes 3,930 shares of restricted stock over which Mr. Lorentzen exercises sole voting power.
|
|
(7)
|
Represents 15,000 shares of restricted stock over which Mr. Stavley exercises sole voting power and includes options to purchase 3,750 shares of our Common Stock that have vested or will vest within 60 days of February 28, 2014.
|
|
(8)
|
Represents 6,930 shares of restricted stock over which Mr. Webster exercises sole voting power and includes options to purchase 93,688 shares of our Common Stock that have vested or will vest within 60 days of February 28, 2014.
|
|
(9)
|
Represents 15,000 shares of restricted stock over which Mr. White exercises sole voting power and includes options to purchase 3,750 shares of our Common Stock that have vested or will vest within 60 days of February 28, 2014.
|
|
(10)
|
I
ncludes Mmes. Whalen, Fairbanks, Shah and Sun and Messrs. Fabrikant, Gustafson, Bradshaw, Lorentzen, Fogg, Webster, Stavley, Papouras and White. The address for each such individual is c/o Era Group Inc., 818 Town & Country Blvd., Suite 200, Houston, Texas, 77024.
|
|
(11)
|
According to a Schedule 13G filed on January 29, 2014, by BlackRock Inc. (“BlackRock”), BlackRock has sole dispositive power and sole voting power with respect to 1,706,488 shares of our Common Stock. BlackRock serves as a parent holding company, and, for purposes of the reporting requirements of the Exchange Act, may be deemed to beneficially own 1,798,026 shares of our Common Stock. Various persons have the right to receive, or the power to direct, the receipt of dividends from, or the proceeds from the sale of, such shares of our Common Stock. No one person’s interest in such shares of our Common Stock is more than 5% of our total Common Stock outstanding.
|
|
(12)
|
According to a Schedule 13G filed on February 10, 2014, by Dimensional Fund Advisors LP (“Dimensional”), Dimensional has sole voting power with respect to 1,292,642 shares of our Common Stock and sole dispositive power with respect to 1,328,760 shares of our Common Stock. Dimensional furnishes investment advice to four investment companies registered under the Investment Company Act of 1940, and serves as investment manager to certain other commingled group trusts and separate accounts (collectively, the “Funds”). In certain cases, subsidiaries of Dimensional may act as advisor or sub-advisor to certain Funds. In its role as investment advisor, sub-advisor and/or manager, neither Dimensional nor its subsidiaries possess voting and/or investment power over the shares of our Common Stock owned by the Funds and may be deemed to be the beneficial owner of the shares of our Common Stock. However, all of our Common Stock reported herein is owned by the Funds and Dimensional disclaims beneficial ownership of all such securities. Various funds have the right to receive or the power to direct the receipt of dividends from, or the proceeds from the sale of the securities held in their respective accounts. No one such Fund’s interest in such shares of our Common Stock is more than 5% of our total Common Stock outstanding.
|
|
(13)
|
According to a Schedule 13G filed on February 7, 2014, by The Keeley Asset Management Corp. (“Keeley”) and Keeley Small Cap Value Fund (“KSCVF”), Keeley and KSCVF share the same beneficial ownership the sole voting power with respect to 1,168,837 shares of our Common Stock, sole dispositive power with respect to 1,168,837 shares of our Common Stock. Various persons have the right to receive, or the power to direct, the receipt of dividends from, or the proceeds from the sale of, such shares of our Common Stock. No one person’s interest in such shares of our Common Stock is more than 5% of the total Common Stock outstanding.
|
|
(14)
|
According to a Schedule 13G filed on January 9, 2014, by Royce & Associates LLC ("Royce"), Royce has sole dispositive and sole voting power over 1,011,420 shares of Common Stock. Royce serves as an investment adviser, and for purposes of the reporting requirements of the Exchange Act may be deemed to beneficially own 1,011,420 shares of our Common Stock.
|
|
(15)
|
According to a Schedule 13G amendment filed on February 14, 2014, by Wellington Management Company, LLP (“Wellington”), Wellington has shared voting power with respect to 1,968,129 shares of our Common Stock and shared dispositive power with respect to 2,381,701 shares of our Common Stock. Wellington serves as an investment advisor and for purposes of the reporting requirements of the Exchange Act may be deemed to beneficially own 2,381,701 shares of our Common Stock. Various persons have the right to receive, or the power to direct, the receipt of dividends from, or the proceeds from the sale of, such shares of our Common Stock. No one person’s interest in such shares of our Common Stock is more than 5% of our total Common Stock outstanding.
|
Equity Compensation Plan Information
In 2013, we adopted the 2012 Share Incentive Plan and the 2013 Employee Stock Purchase Plan. The following table sets forth information as of December 31, 2013 regarding shares of our Common Stock to be issued upon exercise and the weighted-average exercise price of all outstanding options, warrants and rights granted under the 2012 Share Incentive Plan as well as the
62
number of shares available for issuance under the 2012 Share Incentive Plan and the 2013 Employee Stock Purchase Plan. No equity compensation plans have been adopted without the approval of the Company’s stockholders.
|
Plan Category
|
Number of Securities to be Issued Upon Exercise of Outstanding Options, Warrants and Rights
|
Weighted-Average Exercise Price of Outstanding Options, Warrants and Rights
|
Number of Securities Remaining Available for Future Issuance Under Equity Compensation Plans (Excluding Securities Reflected in Column (a))
|
||||||
|
Equity compensation plans approved by security holders
(1)
|
328,040
|
|
19.05
|
|
3,664,998
(2)
|
|
|||
|
Equity compensation plans not approved by security holders
|
—
|
|
—
|
|
—
|
|
|||
|
Total
|
328,040
|
|
19.05
|
|
3,664,998
|
|
|||
_________________________
(1) Consists of the 2012 Share Incentive Plan and the 2013 Employee Stock Purchase Plan.
|
(2)
|
As of December 31, 2013, the plans with securities remaining available for future issuance consisted of the 2012 Share Incentive Plan and the 2013 Employee Stock Purchase Plan. As of December 31, 2013, 3,364,998 shares of our Common Stock remained available for issuance under the 2012 Share Incentive Plan with respect to awards (other than outstanding awards) and could be issued in the form of stock options, stock appreciation rights, stock awards and stock units, and 300,000 shares of our Common Stock remained available for issuance under the 2013 Employee Stock Purchase Plan. On February 28, 2014, an aggregate of 24,492 shares of our Common Stock were issued under the 2013 Employee Stock Purchase Plan in respect of the six month offering period ending on such date, such that 275,508 shares of our Common Stock remained available for issuance under the 2013 Employee Stock Purchase Plan thereafter.
|
|
ITEM 13.
|
CERTAIN RELATIONSHIPS AND RELATED TRANSACTIONS, AND DIRECTOR INDEPENDENCE
|
Related Party Transactions
Set forth below is a description of certain relationships and related person transactions between us or our subsidiaries and our directors, executive officers and holders of more than 5% of our voting securities during the fiscal year ended December 31, 2013.
Agreements between SEACOR and Era Group Relating to the Spin-off
In order to govern certain ongoing relationships between SEACOR and Era Group following the Spin-off, SEACOR and Era Group entered into agreements pursuant to which certain services and rights are provided for and in which SEACOR and Era Group have agreed to indemnify each other against certain liabilities arising from our respective businesses. The following is a summary of the terms of the material agreements we have entered into with SEACOR.
This summary does not purport to be complete and may not contain all of the information about these agreements that is important to you. These summaries are subject to, and qualified in their entirety by reference to, the agreements described below, each of which were included as an exhibit to this Annual Report on Form 10-K. You are encouraged to read each of these agreements carefully and in their entirety, as they are the primary legal documents governing the relationship between SEACOR and Era Group.
Distribution Agreement
We entered into the Distribution Agreement with SEACOR in connection with the Spin-off. The Distribution Agreement sets forth the agreements between us and SEACOR regarding the principal transactions that were necessary to separate us from SEACOR. It also sets forth other agreements that govern certain aspects of our relationship with SEACOR following the Spin-off.
Except for matters covered by the Distribution Agreement, the Transition Services Agreement, the Tax Matters Agreement, the Employee Matters Agreement and the other arms-length transactions entered into in the ordinary course of business, any and all agreements, arrangements, commitments and understandings, between us and our subsidiaries and other affiliates, on the one hand, and SEACOR and its subsidiaries and other affiliates (other than us and our affiliates), on the other hand, terminated as of January 31, 2013, the date of the Spin-off (referred to as the "distribution date").
63
In general, neither us nor SEACOR made any representations or warranties regarding the transactions covered by the Distribution Agreement or the respective businesses, assets, liabilities, condition or prospects of SEACOR or us.
Distribution. On the distribution date, SEACOR distributed to its stockholders one share of our Common Stock for every share of SEACOR common stock held by SEACOR stockholders.
Removal of Guarantees and Releases from Liabilities. The Distribution Agreement provided for any removal of guarantees that were necessary in advance of the Spin-off of Era Group from SEACOR. Each of us and SEACOR generally were required to use commercially reasonable efforts to obtain such removal of guarantees, if any. The Distribution Agreement also provided for the settlement or extinguishment of certain liabilities and other obligations between us and SEACOR, if any.
Release of Claims. We agreed to broad releases pursuant to which we released SEACOR and its affiliates, successors and assigns from, and indemnify and hold harmless all such persons against and from, any claims against any of them that arose out of or related to the management of our business and affairs on or prior to the distribution date.
Indemnification. We and SEACOR agreed to indemnify each other and each of our and their respective affiliates and representatives, and each of the heirs, executors, successors and assigns of such representatives against certain liabilities in connection with the Spin-off, all liabilities to the extent relating to or arising out of our or their respective business as conducted at any time, and any breach by such company of the Distribution Agreement.
Exchange of Information. We and SEACOR agreed to provide each other with information relating to the other party or the conduct of its business prior to the Spin-off, and information reasonably necessary to prepare financial statements and any reports or filings to be made with any governmental authority. We and SEACOR also agreed to retain such information in accordance with our and their respective record retention policies as in effect on the date of the Distribution Agreement and to afford each other access to former and current representatives as witnesses or records as reasonably required in connection with any relevant litigation.
Further Assurances. We and SEACOR agreed to take all actions reasonably necessary or desirable to consummate and make effective the transactions contemplated by the Distribution Agreement and the ancillary agreements related thereto, including using commercially reasonable efforts to promptly obtain all consents and approvals, to enter into all agreements and to make all filings and applications that were required for the consummation of such transactions.
Amended and Restated Transition Services Agreement
Prior to the Spin-off, SEACOR provided us with a number of support services, including payroll processing, information systems support, cash disbursement support, cash receipt processing and treasury management pursuant to the terms of a transition services agreement. Prior to the Spin-off, we and SEACOR entered into an Amended and Restated Transition Services Agreement, pursuant to which SEACOR will continue to provide us with these services on an interim basis to help ensure an orderly transition following the Spin-off. SEACOR has no obligation to provide additional services.
Under the Amended and Restated Transition Services Agreement, SEACOR provides us with the services described above in a manner historically provided to us by SEACOR during the 12 months prior to the date of the agreement, and we will use such services for substantially the same purposes and substantially the same manner as we used them during such 12 month period.
Amounts payable for services provided under the Amended and Restated Transition Services Agreement are calculated on a fixed-fee basis, with the Amended and Restated Transition Services Agreement specifying fixed fees for each category of services described therein. As we transition the functions covered by the Amended and Restated Transition Services Agreement to us over the two year term of the agreement, the amount paid to SEACOR will be reduced by the fee related to that respective support function. Initially, we expected to pay SEACOR an aggregate annualized fee of $3.4 million for the services provided under the Amended and Restated Transition Services Agreement. In fiscal year 2013, we paid SEACOR $3.1 million for the services provided under the Amended and Restated Transition Services Agreement. In fiscal year 2014, we expect to pay SEACOR approximately $3.0 million for the services provided under the Amended and Restated Transition Services Agreement.
We are responsible for our own transition-related costs and expenses (e.g., for us to procure our own IT infrastructure) and certain costs and expenses incurred by SEACOR to transfer software licenses to us, including (i) transfer fees charged by third party software licensors and (ii) unamortized SEACOR costs and expenses to procure and deploy the software being transferred to us.
Subject to limited exceptions, each of us and SEACOR agreed to limit its liability to the other in respect of causes of action arising under the agreement. In addition, we have agreed to indemnify SEACOR against third party claims stemming from our (i) failure to fulfill obligations under the agreement and (ii) infringement of the intellectual property of any third party; provided that we will not be required to indemnify SEACOR for losses resulting from SEACOR's willful misconduct, bad faith or gross negligence. SEACOR has agreed to indemnify us against third party claims stemming from SEACOR's (i) failure to fulfill its confidentiality obligations as set forth in the Transition Services Agreement and (ii) infringement of the intellectual property
64
of any third party; provided that SEACOR will not be required to indemnify us for losses resulting from our willful misconduct, bad faith or gross negligence.
Pursuant to the Amended and Restated Transition Services Agreement, each of us and SEACOR have agreed to customary confidentiality agreements regarding any confidential information of the other party received in the course of performance of the services.
The Amended and Restated Transition Services Agreement will continue in effect for two years following the distribution date. In the event that we default under the agreement, SEACOR may, in addition or as an alternative to terminating the agreement, declare immediately due and payable all sums for which we are liable under the agreement or suspend the agreement and decline to continue to perform any of its obligations thereunder. In the event SEACOR outsources its functions or resources used by SEACOR to provide us services under the Amended and Restated Transition Services Agreement, SEACOR will have the option, but not the obligation, to transition us along with SEACOR to the new outsourced solution. If SEACOR opts not to transition us to the new SEACOR outsourced solution, SEACOR may opt to stop providing us these outsourced services upon 90 days' notice.
Employee Matters Agreement
Prior to the Spin-off, we entered into the Employee Matters Agreement with SEACOR. The Employee Matters Agreement allocates liabilities and responsibilities between us and SEACOR relating to employee compensation and benefit plans and programs, including the treatment of retirement and health plans, equity incentive and employee stock purchase plans.
In general, the Employee Matters Agreement provided that our employees would participate in our equity incentive plans and would cease to participate in SEACOR's equity incentive plans. We are responsible for all employment and benefit-related obligations and liabilities of our employees following the Spin-off.
Specific provisions of the Employee Matters Agreement include the following:
|
•
|
401(k) Plan.
In connection with the Spin-off, our employees ceased participating in the SEACOR 401(k) Plan, and we established a replacement 401(k) plan for the benefit of our employees with substantially similar terms and conditions as the SEACOR 401(k) Plan. Account balances of our employees were transferred from the SEACOR 401(k) Plan to the Era Group 401(k) Plan in connection with the Spin-off.
|
|
•
|
Health and Welfare Plans. In connection with the Spin-off, our employees ceased participating in the SEACOR health and welfare plans, and we established health and welfare plans that closely resemble the SEACOR health and welfare plans for the benefit of our employees.
|
|
•
|
Employee Equity Plans. Prior to the Spin-off, our employees participated in the SEACOR Employee Share Purchase Plan (the "ESPP"). Pursuant to the terms of the ESPP, upon the effective date of the Spin-off, our employees ceased participating in the ESPP and were repaid any contributions to the ESPP that were been used to purchase shares of SEACOR common stock. In connection with the Spin-off, we established a replacement employee stock purchase plan for our employees to purchase shares of our Common Stock.
|
Tax Matters Agreement
Prior to the Spin-off, we and SEACOR entered into the Tax Matters Agreement that governs the parties' respective rights, responsibilities and obligations with respect to taxes, tax attributes, the preparation and filing of tax returns, the control of audits and other tax proceedings and assistance and cooperation in respect of tax matters. In general, liabilities for taxes attributable to us and our subsidiaries allocable to a tax period (or portion thereof) ending on or before the distribution date were allocable to SEACOR (other than taxes of our foreign subsidiaries), and liabilities for taxes attributable to us and our subsidiaries allocable to a tax period (or portion thereof) beginning after the distribution date are allocable to us. Taxes relating to or arising out of the failure of certain of the transactions described in the private letter ruling request and the opinion of tax counsel to qualify as a tax-free transaction for U.S. federal income tax purposes will be borne by SEACOR, except, in general, if such failure is attributable to our action or inaction or SEACOR's action or inaction, as the case may be, or any event (or series of events) involving our assets or stock or the assets or stock of SEACOR, as the case may be, in which case the resulting liability will be borne in full by us or SEACOR, respectively.
Our obligations under the Tax Matters Agreement are not limited in amount or subject to any cap. Further, even if we are not responsible for tax liabilities of SEACOR and its subsidiaries under the Tax Matters Agreement, we nonetheless could be liable under applicable tax law for such liabilities if SEACOR were to fail to pay them. If we are required to pay any liabilities under the circumstances set forth in the Tax Matters Agreement or pursuant to applicable tax law, the amounts may be significant.
The Tax Matters Agreement also contains restrictions on our ability (and the ability of any member of our group) to take actions that could cause the Spin-off to fail to qualify as a tax-free reorganization for U.S. federal income tax purposes, including entering into, approving or allowing any transaction that results in a sale or other disposition of a substantial portion of our assets or stock and the liquidation or dissolution of us and certain of our subsidiaries. These restrictions will apply for the two-year period
65
after the Spin-off, unless SEACOR obtains a private letter ruling from the IRS or an unqualified opinion of a nationally recognized law firm that such action will not cause the Spin-off or certain related transactions to fail to qualify as tax-free transactions for U.S. federal income tax purposes. Notwithstanding receipt of such ruling or opinion, in the event that such action causes the Spin-off or certain related transactions to fail to qualify as a tax-free transaction for U.S. federal income tax purposes, we will continue to remain responsible for taxes arising therefrom.
Relationship with SEACOR
We were acquired by SEACOR in 2004 and conducted our business as SEACOR's Aviation Services segment. Prior to the Spin-off, all of the shares of our issued and outstanding capital stock were owned by SEACOR. Following completion of the Spin-off, SEACOR does not own any shares of our Common Stock.
As a subsidiary of SEACOR, we benefited from opportunities to cross-market our aviation services to SEACOR's customers that required aviation support for their offshore oil and gas activities and opportunities to utilize our helicopters in support of emergency responses. During 2013, the Company provided less than $0.1 million of aviation services to SEACOR under flight charter arrangements.
Other Transactions with SEACOR
As part of a consolidated group prior to the Spin-off, certain of our costs and expenses were incurred by SEACOR and charged to us. These costs and expenses are included in both operating expenses and administrative and general expenses in the accompanying consolidated statements of operations and are summarized as follows for the year ended December 31, 2013 (in thousands):
|
Payroll costs for SEACOR personnel assigned to us and participation in SEACOR employee benefit plans, defined contribution plan and share award plans
|
$
|
5
|
|
|
Shared services allocation for administrative support
|
299
|
|
|
|
Shared services under the Amended and Restated Transition Services Agreement
|
3,063
|
|
|
|
$
|
3,367
|
|
|
|
•
|
Actual payroll costs of SEACOR personnel assigned to us were charged to us.
|
|
•
|
SEACOR also provides certain administrative support services to us under a shared services arrangement, including payroll processing, information systems support, cash disbursement support, cash receipt processing, and treasury management.
|
SEACOR also incurred various corporate costs in connection with providing certain corporate services, including, but not limited to, executive oversight, risk management, legal, accounting and tax, and charges quarterly management fees to its operating segments in order to fund its corporate overhead to cover such costs. Total management fees charged by SEACOR to its operating segments included actual corporate costs incurred plus a mark-up and are generally allocated within the consolidated group using income-based performance metrics reported by an operating segment in relation to SEACOR's other operating segments. On December 30, 2011, we and SEACOR entered into an agreement for SEACOR to provide these services at a fixed rate of $2.0 million per annum beginning January 1, 2012 and remained in effect through the date of the Spin-off. Costs we incurred for management fees from SEACOR are reported as SEACOR management fees in our consolidated statements of operations.
Related Person Transactions Policy
We have established a written policy for the review and approval or ratification of transactions with related persons (the "Related Person Transactions Policy") to assist us in reviewing transactions in excess of $120,000 ("Transactions") involving us and our subsidiaries and Related Persons (as defined below). Examples include, among other things, sales, purchases or transfers of real or personal property, use of property or equipment by lease or otherwise, services received or furnished, borrowing or lending (including guarantees) and employment by us of an immediate family member of a Related Person or a change in the material terms or conditions of employment of such an individual.
The Related Person Transactions Policy supplements our other conflict of interest policies set forth in our Corporate Governance Guidelines, our Code of Conduct and Business and Ethics and our other internal procedures. A summary description of the Related Person Transactions Policy is set forth below.
For purposes of the Related Person Transactions Policy, a Related Person includes our directors, director nominees and executive officers since the beginning of our last fiscal year, beneficial owners of 5% or more of any class of our voting securities and members of their respective Immediate Family (as defined in the Related Person Transactions Policy).
66
The Related Person Transactions Policy provides that Transactions must be approved or ratified by the board of directors. The board of directors has delegated to the Audit Committee the review and, when appropriate, the approval or ratification of Transactions. Upon the presentation of a proposed Transaction, the Related Person will be excused from participation and voting on the matter. In approving, ratifying or rejecting a Transaction, the Audit Committee will consider such information as it deems important to conclude if the transaction is fair and reasonable to us.
Whether a Related Person's interest in a Transaction is material will depend on all facts and circumstances, including whether a reasonable investor would consider the Related Person's interest in the Transaction important, together with all other available information, in deciding whether to buy, sell or hold our securities. In administering this Related Person Transaction Policy, the board of directors or the relevant committee will be entitled (but not required) to rely upon such determinations of materiality by our management.
The following factors will be taken into consideration in determining whether to approve or ratify a Transaction with a Related Person:
|
i.
|
the Related Person's relationship to us and their interest in the Transaction;
|
|
ii.
|
the material facts of the Transaction, including the proposed aggregate value of such Transaction;
|
|
iii.
|
the materiality of the Transaction to the Related Person and us, including the dollar value of the Transaction, without regard to profit or loss;
|
|
iv.
|
the business purpose for and reasonableness of the Transaction, taken in the context of the alternatives available to us for attaining the purposes of the Transaction;
|
|
v.
|
whether the Transaction is comparable to an arrangement that could be available on an arms-length basis and is on terms that are generally available;
|
|
vi.
|
whether the Transaction is in the ordinary course of our business and was proposed and considered in the ordinary course of business; and
|
|
vii.
|
the effect of the transaction on our business and operations, including on our internal control over financial reporting and system of disclosure controls or procedures, and any additional conditions or controls (including reporting and review requirements) that should be applied to such transaction.
|
The following arrangements will not generally give rise to transactions with a Related Person for purposes of the Related Person Transactions Policy given their nature, size and/or degree of significance to us:
|
i.
|
use of property, equipment or other assets owned or provided by us, including helicopters, vehicles, housing and computer or telephonic equipment, by a Related Person primarily for our business purposes where the value of any personal use during the course of a year is less than $10,000;
|
|
ii.
|
reimbursement of business expenses incurred by a director or executive officer in the performance of his or her duties and approved for reimbursement by us in accordance with our customary policies and practices;
|
|
iii.
|
compensation arrangements for non-employee directors for their services as such that have been approved by the board of directors or a committee thereof;
|
|
iv.
|
compensation arrangements, including base pay and bonuses (whether in the form of cash or equity awards), for employees or consultants (other than a director or nominee for election as a director) for their services as such that have been approved by the Compensation Committee and employee benefits regularly provided under plans and programs generally available to employees; however, personal benefits from the use of our-owned or provided assets ("Perquisites"), including but not limited to personal use of our-owned or provided helicopters and housing, not used primarily for our business purposes may give rise to a transaction with a Related Person;
|
|
v.
|
a transaction where the rates or charges involved are determined by competitive bids or involving the rendering of services as a common or contract carrier, or public utility, at rates or charges fixed in conformity with law or governmental authority; and
|
|
vi.
|
a transaction involving services as a bank depository of funds, transfer agent, registrar, trustee under a trust indenture, or similar services.
|
Director Independence
Our board of directors has made the affirmative determination that a majority of the Company's directors, namely Messrs. Webster, Fogg and Papouras and Mmes. Fairbanks and Sun, are independent as such term is defined by the applicable rules and regulations of the New York Stock Exchange. Additionally, each of these directors meets the categorical standards for independence
67
established by our board of directors. A copy of our Corporate Governance Policy is available on our website at
www.eragroupinc.com
. Our website and the information contained therein or connected thereto shall not be deemed to be incorporated into this Annual Report on Form 10-K.
68
|
ITEM 14.
|
PRINCIPAL ACCOUNTANT FEES AND SERVICES
|
Fees for professional services provided by Ernst & Young for the years ended December 31 were as follows:
|
Fees
|
2013
|
2012
|
||||||
|
Audit Fees
|
$
|
739,753
|
|
$
|
435,250
|
|
||
|
Audit-Related Fees
|
—
|
|
4,900
|
|
||||
|
Tax Fees
|
31,493
|
|
92,982
|
|
||||
|
All Other Fees
|
—
|
|
—
|
|
||||
|
Total
|
$
|
771,246
|
|
$
|
533,132
|
|
||
Audit Fees represent fees for professional services provided in connection with the audit of the Company's financial statements and services provided in connection with other statutory or regulatory filings. Audit-Related Fees represent fees for professional services provided in consulting on interpretations and application of FASB pronouncements and SEC regulations. Tax Fees represent fees for services in connection with the preparation and filing of tax returns in jurisdictions outside the United States.
The Audit Committee has determined that the provision of the services described above is compatible with maintaining the independence of Ernst & Young LLP. All of the services described in the foregoing table were approved by our Audit Committee with respect to the year ended December 31, 2013 and by SEACOR's Audit Committee with respect to the year ended December 31, 2012, in each case, in a manner consistent with that committee's policies and pre-approval process.
Pre-approval Policy for Services of Independent Registered Public Accounting Firm
The Audit Committee's policy is to pre-approve all audit services, audit-related services, and other services permitted by law provided by the independent registered public accounting firm. In accordance with that policy, the committee is expected to annually review and approve a list of specific services and categories of services, including audit, audit related, tax, and other permitted services, for the current or upcoming fiscal year, subject to specified terms and cost levels. Any service not included in the approved list of services or any modification to previously approved services, including changes in fees, must be specifically preapproved by the Audit Committee. Where proposed additions or modifications relate to tax and all other non-audit services to be provided by the independent registered public accounting firm, the Audit Committee may delegate the responsibility of pre-approval to the Chair of the Audit Committee. To ensure prompt handling of unforeseeable or unexpected matters that arise between Audit Committee meetings, the Audit Committee has delegated authority to the members of the Audit Committee, to review and if appropriate approve in advance, any request by the independent registered public accounting firm to provide tax and/or all other non-audit services.
|
ITEM 15.
|
EXHIBITS AND FINANCIAL STATEMENT SCHEDULES
|
|
(a)
|
Documents filed as part of this report:
|
1. Financial Statements
The consolidated financial statements filed as part of this report are listed on the Index to Consolidated Financial Statements of this Annual Report on Form 10-K.
2.
Financial Statement Schedules
All financial statement schedules have been omitted here because they are not applicable, not required, or the information is shown in the consolidated financial statements or notes thereto.
3. Exhibits
|
Exhibit Index
|
Exhibit Description
|
||
|
2.1
|
*
|
Distribution Agreement between SEACOR Holdings Inc. and Era Group Inc. (incorporated herein by reference to Exhibit 10.1 of the Company's Current Report on Form 8-K filed with the SEC on February 1, 2013 (File No. 001-35701)).
|
|
69
|
3.1
|
*
|
Amended and Restated Certificate of Incorporation of Era Group Inc. (incorporated herein by reference to Exhibit 3.1 of the Company's Current Report on Form 8-K filed with the SEC on February 1, 2013 (File No. 001-35701)).
|
|
|
3.2
|
*
|
Amended and Restated Bylaws of Era Group Inc. (incorporated herein by reference to Exhibit 3.2 of the Company's Current Report on Form 8-K filed with the SEC on February 1, 2013 (File No. 001-35701)).
|
|
|
4.1
|
*
|
Form of Common Stock Certificate of Era Group Inc. (incorporated herein by reference to Exhibit 4.1 of the Company's Amendment No. 2 to Registration Statement on Form 10 filed with the SEC on January 15, 2013, as amended (File No. 001-35701)).
|
|
|
4.2
|
*
|
Registration Rights Agreement, dated as of December 7, 2012, among Era Group Inc., the guarantors named therein and Deutsche Bank Securities Inc., on behalf of itself and the other initial purchasers named therein (incorporated herein by reference to Exhibit 4.1 to SEACOR Holding Inc.’s current report on Form 8-K filed with the SEC on December 7, 2012 (File No. 333-175942)).
|
|
|
4.3
|
*
|
Indenture, dated as of December 7, 2012, among Era Group Inc., the guarantors named therein and Wells Fargo Bank, National Association (incorporated herein by reference to Exhibit 4.3 of the Company's Amendment No. 1 to Registration Statement on Form 10 filed with the SEC on January 15, 2013, as amended (File No. 001-35701)).
|
|
|
10.1
|
*
|
Amended and Restated Transition Services Agreement between SEACOR Holdings Inc. and Era Group Inc. (incorporated herein by reference to Exhibit 10.2 of the Company's Current Report on Form 8-K filed with the SEC on February 1, 2013 (File No. 001-35701)).
|
|
|
10.2
|
*
|
Tax Matters Agreement between SEACOR Holdings Inc. and Era Group Inc. (incorporated herein by reference to Exhibit 10.3 of the Company's Current Report on Form 8-K filed with the SEC on February 1, 2013 (File No. 001-35701)).
|
|
|
10.3
|
*
|
Employee Matters Agreement between SEACOR Holdings Inc. and Era Group Inc. (incorporated herein by reference to Exhibit 10.4 of the Company's Current Report on Form 8-K filed with the SEC on February 1, 2013 (File No. 001-35701)).
|
|
|
10.4
|
* +
|
Era Group Inc. 2012 Share Incentive Plan. (incorporated herein by reference to Exhibit 10.4 of the Company's Registration Statement on Form 10 filed with the SEC on October 12, 2012, as amended (File No. 001-35701)).
|
|
|
10.5
|
* +
|
Form of Stock Option Grant Agreement pursuant to the Era Group Inc. 2012 Share Incentive Plan. (incorporated herein by reference to Exhibit 10.3 of the Company's Current Report on Form 8-K filed with the SEC on March 5, 2013, as amended (File No. 001-35701)).
|
|
|
10.6
|
* +
|
Form of Restricted Stock Grant Agreement pursuant to the Era Group Inc. 2012 Share Incentive Plan. (incorporated herein by reference to Exhibit 10.2 of the Company's Current Report on Form 8-K filed with the SEC on March 5, 2013, as amended (File No. 001-35701)).
|
|
|
10.7
|
* +
|
Form of Performance-Based Restricted Stock Grant Agreement pursuant to the Era Group Inc. 2012 Share Incentive Plan. (incorporated herein by reference to Exhibit 10.4 of the Company’s Current Report on Form 8-K filed with the SEC on March 5, 2013 (File No. 001-35701)).
|
|
|
10.8
|
+
|
Form of Non-Employee Director Restricted Stock Award Agreement pursuant to the Era Group Inc. 2012 Share Incentive Plan.
|
|
|
10.9
|
*
|
Agreement, dated as of December 22, 2011, for a U.S. $350,000,000 Senior Secured Revolving Credit Facility by and among Era Group Inc., Wells Fargo Securities, LLC, JPMorgan Chase Bank, N.A., Deutsche Bank Securities Inc., Suntrust Robinson Humphrey, Inc. and other financial institutions identified on Schedule A thereto (incorporated herein by reference to Exhibit 10.25 to SEACOR Holdings Inc's annual report on Form 10-K filed with the SEC on February 24, 2012 (File No.: 001-12289)).
|
|
|
10.10
|
*
|
Separation and Consulting Agreement dated as of September 30, 2012. (incorporated herein by reference to Exhibit 10.9 of the Company's Registration Statement on Form 10 filed with the SEC on October 12, 2012, as amended (File No. 001-35701)).
|
|
|
10.11
|
* +
|
Form of Indemnification Agreement between Era Group Inc. and individual officers and directors. (incorporated herein by reference to Exhibit 10.10 of the Company's Registration Statement on Form 10 filed with the SEC on October 12, 2012, as amended (File No. 001-35701)).
|
|
|
10.12
|
+
|
Era Group Inc. Management Incentive Plan (incorporated herein by reference to Exhibit 10.11 of the Company's Amendment No. 1 to Registration Statement on Form 10 filed with the SEC on December 18, 2012, as amended (File No. 001-35701)).
|
|
|
10.13
|
+
|
Era Group Inc. 2013 Employee Stock Purchase Plan (incorporated herein by reference to Exhibit 99.1 of the Company’s Registration Statement on Form S-8 filed with the Commission on March 8, 2013(File No. 333-187166))
|
|
|
10.14
|
*
|
Series B Exchange Agreement, dated December 18, 2012, between SEACOR Holdings Inc. and Era Group Inc. (incorporated herein by reference to Exhibit 10.12 of the Company's Amendment No. 3 to Registration Statement on Form 10 filed with the SEC on January 14, 2013, as amended (File No. 001-35701)).
|
|
70
|
10.15
|
*
|
Separation and Consulting Agreement dated February 27, 2013 (incorporated herein by reference to Exhibit 10.1 of the Company's Current Report on Form 8-K filed with the SEC on March 5, 2013 (File No. 001-35701))
|
|
|
21.1
|
**
|
List of subsidiaries of Era Group Inc.
|
|
|
23.1
|
Consent of Ernst & Young LLP, independent registered public accounting firm.
|
||
|
23.2
|
Consent of KPMG LLP, independent registered public accounting firm.
|
||
|
31.1
|
Certification by the Principal Executive Officer Pursuant to Rule 13a-14(a) or Rule 15d-14(a) of the Exchange Act.
|
||
|
31.2
|
Certification by the Principal Financial Officer Pursuant to Rule 13a-14(a) or Rule 15d-14(a) of the Exchange Act.
|
||
|
32.1
|
Certification by the Principal Executive Officer Pursuant to 18 U.S.C. Section 1350, as adopted pursuant to Section 906 of the Sarbanes-Oxley Act of 2002.
|
||
|
32.2
|
Certification by the Principal Financial Officer Pursuant to 18 U.S.C. Section 1350, as adopted pursuant to Section 906 of the Sarbanes-Oxley Act of 2002.
|
||
|
*
|
Incorporated herein by reference as indicated.
|
|
+
|
Management contracts or compensatory plans or arrangements required to be filed as an Exhibit pursuant to Item 15 (b) of the rules governing the preparation of this Annual Report on Form 10-K.
|
71
SIGNATURES
Pursuant to the requirements of Section 13 of the Securities Exchange Act of 1934, the registrant has duly caused this report, to be signed on its behalf by the undersigned, and in the capacities indicated, thereunto duly authorized.
|
Era Group Inc.
|
|||
|
By:
|
/s/ Christopher S. Bradshaw
|
||
|
Christopher S. Bradshaw,
Executive Vice President and Chief Financial Officer
|
|||
|
Date: March 21, 2014
|
|||
|
Pursuant to the requirements of the Securities Exchange Act of 1934, this report has been signed below by the following
persons on behalf of the registrant and in the capacities and on the dates indicated. |
|||
|
Signer
|
Title
|
Date
|
|
|
/s/ Sten L. Gustafson
|
Chief Executive Officer and Director
|
March 21, 2014
|
|
|
Sten L. Gustafson
|
(Principal Executive Officer)
|
||
|
/s/ Christopher S. Bradshaw
|
Executive Vice President and Chief Financial
|
March 21, 2014
|
|
|
Christopher S. Bradshaw
|
Officer (Principal Financial Officer)
|
||
|
/s/ Jennifer Whalen
|
Vice President and Chief Accounting Officer
|
March 21, 2014
|
|
|
Jennifer Whalen
|
(Principal Accounting Officer)
|
||
|
/s/ Charles Fabrikant
|
Chairman of the Board and Director
|
March 21, 2014
|
|
|
Charles Fabrikant
|
|||
|
/s/ Oivind Lorentzen
|
Director
|
March 21, 2014
|
|
|
Oivind Lorentzen
|
|||
|
/s/ Blaine V. Fogg
|
Director
|
March 21, 2014
|
|
|
Blaine V. Fogg
|
|||
|
/s/ Steven Webster
|
Director
|
March 21, 2014
|
|
|
Steven Webster
|
|||
|
/s/ Ann Fairbanks
|
Director
|
March 21, 2014
|
|
|
Ann Fairbanks
|
|||
|
/s/ Christopher P. Papouras
|
Director
|
March 21, 2014
|
|
|
Christopher P. Papouras
|
|||
|
/s/ Yueping Sun
|
Director
|
March 21, 2014
|
|
|
Yueping Sun
|
|||
72
INDEX TO CONSOLIDATED FINANCIAL STATEMENTS
|
|
Page
|
|
|
Consolidated Financial Statements:
|
||
73
REPORT OF INDEPENDENT REGISTERED PUBLIC ACCOUNTING FIRM
The Board of Directors and Stockholders of Era Group Inc.
We have audited the accompanying consolidated balance sheets of Era Group Inc. as of December 31, 2013 and 2012, and the related consolidated statements of operations, comprehensive income, changes in equity, and cash flows for each of the three years in the period ended December 31, 2013. These financial statements are the responsibility of the Company's management. Our responsibility is to express an opinion on these financial statements based on our audits. We did not audit the consolidated financial statements of Dart Holding Company Ltd., a corporation in which the Company has a 50% interest, which statements reflect total revenues of $18,999,000 for the five months ended December 31, 2011. Those statements were audited by other auditors whose report has been furnished to us, and our opinion, insofar as it relates to the amounts included for Dart Holding Company Ltd., is based solely on the report of the other auditors.
We conducted our audits in accordance with the standards of the Public Company Accounting Oversight Board (United States). Those standards require that we plan and perform the audit to obtain reasonable assurance about whether the financial statements are free of material misstatement. We were not engaged to perform an audit of the Company's internal control over financial reporting. Our audits included consideration of internal control over financial reporting as a basis for designing audit procedures that are appropriate in the circumstances, but not for the purpose of expressing an opinion on the effectiveness of the Company's internal control over financial reporting. Accordingly, we express no such opinion. An audit also includes examining, on a test basis, evidence supporting the amounts and disclosures in the financial statements, assessing the accounting principles used and significant estimates made by management, and evaluating the overall financial statement presentation. We believe that our audits and the report of other auditors provide a reasonable basis for our opinion.
In our opinion, based on our audits and the report of other auditors, the consolidated financial statements referred to above present fairly, in all material respects, the consolidated financial position of Era Group Inc. at December 31, 2013 and 2012, and the consolidated results of its operations and its cash flows for each of the three years in the period ended December 31, 2013, in conformity with U.S. generally accepted accounting principles.
|
/s/ Ernst & Young LLP
|
|
|
Houston, Texas
|
|
|
March 21, 2014
|
|
74
REPORT OF INDEPENDENT REGISTERED PUBLIC ACCOUNTING FIRM
FOR DART HOLDING COMPANY LTD.
To the Shareholders of Dart Holding Company Ltd.
We have audited the Dart Holding Company Ltd.’s consolidated statements of income, comprehensive income and retained earnings, and cash flows for the period from August 1, 2011 to December 31, 2011. These consolidated financial statements are the responsibility of the Company’s management. Our responsibility is to express an opinion on these consolidated financial statements based on our audit.
We conducted our audit in accordance with the auditing standards of the Public Company Accounting Oversight Board (United States). Those standards require that we plan and perform the audit to obtain reasonable assurance about whether the financial statements are free of material misstatement. The Company is not required to have, nor were we engaged to perform, an audit of its internal control over financial reporting. Our audit included consideration of internal control over financial reporting as a basis for designing audit procedures that are appropriate in the circumstances, but not for the purpose of expressing an opinion on the effectiveness of the Company’s internal control over financial reporting. Accordingly, we express no such opinion. An audit also includes examining, on a test basis, evidence supporting the amounts and disclosures in the financial statements, assessing the accounting principles used and significant estimates made by management, as well as evaluating the overall financial statement presentation. We believe that our audit provides a reasonable basis for our opinion.
In our opinion, the consolidated financial statements referred to above present fairly, in all material respects, the results of Dart Holding Company Ltd.’s operations and its cash flows for the period from August 1, 2011 to December 31, 2011 in conformity with U.S. generally accepted accounting principles.
/s/ KPMG LLP
Calgary, Canada
March 7, 2012
75
ERA GROUP INC.
(in thousands, except share amounts)
|
|
December 31,
|
|||||||
|
|
2013
|
2012
|
||||||
|
ASSETS
|
||||||||
|
Current Assets:
|
||||||||
|
Cash and cash equivalents
|
$
|
31,335
|
|
$
|
11,505
|
|
||
|
Receivables:
|
||||||||
|
Trade, net of allowance for doubtful accounts of $3,101 and $2,668 in 2013 and 2012, respectively
|
38,137
|
|
48,810
|
|
||||
|
Other, net of allowance for doubtful accounts of $437 and $nil in 2013 and 2012, respectively
|
4,374
|
|
4,430
|
|
||||
|
Inventories, net
|
26,853
|
|
26,650
|
|
||||
|
Prepaid expenses and other
|
2,167
|
|
1,803
|
|
||||
|
Deferred income taxes
|
2,347
|
|
3,642
|
|
||||
|
Total current assets
|
105,213
|
|
96,840
|
|
||||
|
Property and Equipment:
|
||||||||
|
Helicopters
|
864,900
|
|
897,611
|
|
||||
|
Construction in progress
|
85,289
|
|
22,644
|
|
||||
|
Machinery, equipment and spares
|
75,170
|
|
72,161
|
|
||||
|
Buildings and leasehold improvements
|
29,138
|
|
25,451
|
|
||||
|
Furniture, fixtures, vehicles and other
|
12,461
|
|
12,409
|
|
||||
|
1,066,958
|
|
1,030,276
|
|
|||||
|
Accumulated depreciation
|
(263,306
|
)
|
(242,471
|
)
|
||||
|
803,652
|
|
787,805
|
|
|||||
|
Investments, at Equity, and Advances to 50% or Less Owned Companies
|
34,986
|
|
34,696
|
|
||||
|
Goodwill
|
352
|
|
352
|
|
||||
|
Other Assets
|
14,380
|
|
17,871
|
|
||||
|
Total Assets
|
$
|
958,583
|
|
$
|
937,564
|
|
||
|
LIABILITIES AND STOCKHOLDERS' EQUITY
|
||||||||
|
Current Liabilities:
|
||||||||
|
Accounts payable and accrued expenses
|
$
|
13,293
|
|
$
|
15,703
|
|
||
|
Accrued wages and benefits
|
8,792
|
|
4,576
|
|
||||
|
Accrued interest
|
772
|
|
1,401
|
|
||||
|
Accrued income taxes
|
613
|
|
—
|
|
||||
|
Derivatives
|
621
|
|
1,025
|
|
||||
|
Current portion of long-term debt
|
2,787
|
|
2,787
|
|
||||
|
Other current liabilities
|
3,267
|
|
4,207
|
|
||||
|
Total current liabilities
|
30,145
|
|
29,699
|
|
||||
|
Long-Term Debt
|
279,391
|
|
276,948
|
|
||||
|
Deferred Income Taxes, Net
|
209,574
|
|
203,536
|
|
||||
|
Deferred Gains and Other Liabilities
|
3,412
|
|
7,864
|
|
||||
|
Total liabilities
|
522,522
|
|
518,047
|
|
||||
|
Series A Preferred Stock, at redemption value; $0.01 par value; 10,000,000 shares authorized; none issued and outstanding in 2013; 1,400,000 shares issued and outstanding in 2012
|
—
|
|
144,232
|
|
||||
|
Equity:
|
||||||||
|
Era Group Inc. Stockholders' Equity:
|
||||||||
|
Common stock, $0.01 par value, 60,000,000 shares authorized; 20,189,895 outstanding in 2013 (exclusive of 4,350 treasury shares); none issued and outstanding in 2012
|
202
|
|
—
|
|
||||
|
Class B common stock, $0.01 par value, 60,000,000 shares authorized; none issued and outstanding in 2013; 24,500,000 issued and outstanding in 2012
|
—
|
|
245
|
|
||||
|
Additional paid-in capital
|
421,310
|
|
278,838
|
|
||||
|
Retained earnings (accumulated deficit)
|
14,680
|
|
(4,025
|
)
|
||||
|
Treasury shares, at cost (4,350 and nil in 2013 and 2012, respectively)
|
(113
|
)
|
—
|
|
||||
|
Accumulated other comprehensive income, net of tax
|
176
|
|
20
|
|
||||
|
436,255
|
|
275,078
|
|
|||||
|
Noncontrolling interest in subsidiary
|
(194
|
)
|
207
|
|
||||
|
Total equity
|
436,061
|
|
275,285
|
|
||||
|
Total Liabilities and Stockholders’ Equity
|
$
|
958,583
|
|
$
|
937,564
|
|
||
The accompanying notes are an integral part of these consolidated financial statements.
76
ERA GROUP INC.
(in thousands, except share data)
|
|
For the years ended December 31,
|
|||||||||||
|
|
2013
|
2012
|
2011
|
|||||||||
|
Operating Revenues
|
$
|
298,959
|
|
$
|
272,921
|
|
$
|
258,148
|
|
|||
|
Costs and Expenses:
|
||||||||||||
|
Operating
|
186,612
|
|
167,195
|
|
162,707
|
|
||||||
|
Administrative and general
|
38,924
|
|
34,785
|
|
31,893
|
|
||||||
|
Depreciation
|
45,561
|
|
42,502
|
|
42,612
|
|
||||||
|
271,097
|
|
244,482
|
|
237,212
|
|
|||||||
|
Gains on Asset Dispositions and Impairments, Net
|
18,301
|
|
3,612
|
|
15,172
|
|
||||||
|
Operating Income
|
46,163
|
|
32,051
|
|
36,108
|
|
||||||
|
Other Income (Expense):
|
||||||||||||
|
Interest income
|
591
|
|
910
|
|
738
|
|
||||||
|
Interest expense
|
(18,050
|
)
|
(10,648
|
)
|
(1,376
|
)
|
||||||
|
Interest expense on advances from SEACOR
|
—
|
|
—
|
|
(23,410
|
)
|
||||||
|
SEACOR management fees
|
(168
|
)
|
(2,000
|
)
|
(8,799
|
)
|
||||||
|
Derivative losses, net
|
(104
|
)
|
(490
|
)
|
(1,326
|
)
|
||||||
|
Foreign currency gains, net
|
698
|
|
720
|
|
516
|
|
||||||
|
Other, net
|
19
|
|
30
|
|
9
|
|
||||||
|
(17,014
|
)
|
(11,478
|
)
|
(33,648
|
)
|
|||||||
|
Income Before Income Tax Expense (Benefit) and Equity in Earnings (Losses) of 50% or Less Owned Companies
|
29,149
|
|
20,573
|
|
2,460
|
|
||||||
|
Income Tax Expense (Benefit):
|
||||||||||||
|
Current
|
4,591
|
|
(51,213
|
)
|
(17,905
|
)
|
||||||
|
Deferred
|
7,136
|
|
58,511
|
|
18,339
|
|
||||||
|
11,727
|
|
7,298
|
|
434
|
|
|||||||
|
Income (Loss) Before Equity in Earnings (Losses) of 50% or Less Owned Companies
|
17,422
|
|
13,275
|
|
2,026
|
|
||||||
|
Equity in Earnings (Losses) of 50% or Less Owned Companies, Net of Tax
|
882
|
|
(5,528
|
)
|
82
|
|
||||||
|
Net Income
|
18,304
|
|
7,747
|
|
2,108
|
|
||||||
|
Net Loss Attributable to Noncontrolling Interest in Subsidiary
|
401
|
|
40
|
|
—
|
|
||||||
|
Net Income Attributable to Era Group Inc.
|
18,705
|
|
7,787
|
|
2,108
|
|
||||||
|
Accretion of Redemption Value on Series A Preferred Stock
|
721
|
|
8,469
|
|
210
|
|
||||||
|
Net Income (Loss) Attributable to Common Shares
|
$
|
17,984
|
|
$
|
(682
|
)
|
$
|
1,898
|
|
|||
|
Earnings (Loss) Per Common Share:
|
||||||||||||
|
Basic and Diluted Earnings (Loss) Per Common Share
|
$
|
0.88
|
|
$
|
(0.03
|
)
|
$
|
0.18
|
|
|||
|
Weighted Average Common Shares Outstanding
|
20,489,200
|
|
24,500,000
|
|
10,270,444
|
|
||||||
The accompanying notes are an integral part of these consolidated financial statements.
77
ERA GROUP INC.
CONSOLIDATED STATEMENTS OF COMPREHENSIVE INCOME
(in thousands)
|
|
For the years ended December 31,
|
|||||||||||
|
|
2013
|
2012
|
2011
|
|||||||||
|
Net Income
|
$
|
18,304
|
|
$
|
7,747
|
|
$
|
2,108
|
|
|||
|
Other Comprehensive Income (Loss):
|
||||||||||||
|
Foreign currency translation adjustments
|
240
|
|
944
|
|
(802
|
)
|
||||||
|
Income tax (expense) benefit
|
(84
|
)
|
(331
|
)
|
281
|
|
||||||
|
156
|
|
613
|
|
(521
|
)
|
|||||||
|
Comprehensive Income
|
18,460
|
|
8,360
|
|
1,587
|
|
||||||
|
Comprehensive Loss Attributable to Noncontrolling Interest in Subsidiary
|
401
|
|
40
|
|
—
|
|
||||||
|
Comprehensive Income Attributable to Era Group Inc.
|
$
|
18,861
|
|
$
|
8,400
|
|
$
|
1,587
|
|
|||
The accompanying notes are an integral part of these consolidated financial statements.
78
ERA GROUP INC.
CONSOLIDATED STATEMENTS OF CHANGES IN EQUITY
(in thousands)
|
Era Group Inc. Stockholder Equity
|
|||||||||||||||||||||||||||||||||||||||||
|
|
Series A Convertible Preferred Stock
|
Series B Convertible Preferred Stock
|
Class B Common Stock
|
Common
Stock
|
Additional
Paid-in
Capital
|
Retained Earnings (Accumulated Deficit)
|
Shares
Held In Treasury |
Accumulated
Other
Comprehensive
Income (Loss)
|
Non -
controlling
Interest in Subsidiary
|
Total
Equity
|
|||||||||||||||||||||||||||||||
|
Year Ended December 31, 2010
|
$
|
—
|
|
$
|
—
|
|
$
|
1
|
|
$
|
—
|
|
$
|
177,584
|
|
$
|
(13,920
|
)
|
$
|
—
|
|
$
|
(72
|
)
|
$
|
—
|
|
$
|
163,593
|
|
|||||||||||
|
Non-cash distribution to SEACOR
|
—
|
|
—
|
|
—
|
|
—
|
|
(69,823
|
)
|
—
|
|
—
|
|
—
|
|
—
|
|
(69,823
|
)
|
|||||||||||||||||||||
|
Non-cash contribution from SEACOR
|
—
|
|
—
|
|
—
|
|
—
|
|
180,000
|
|
—
|
|
—
|
|
—
|
|
—
|
|
180,000
|
|
|||||||||||||||||||||
|
Share exchange (see note 10)
|
—
|
|
—
|
|
244
|
|
—
|
|
(244
|
)
|
—
|
|
—
|
|
—
|
|
—
|
|
—
|
|
|||||||||||||||||||||
|
Issuance of Series A Preferred Stock
|
140,000
|
|
—
|
|
—
|
|
—
|
|
—
|
|
—
|
|
—
|
|
—
|
|
—
|
|
—
|
|
|||||||||||||||||||||
|
Accretion of redemption value on Series A Preferred Stock
|
210
|
|
—
|
|
—
|
|
—
|
|
(210
|
)
|
—
|
|
—
|
|
—
|
|
—
|
|
(210
|
)
|
|||||||||||||||||||||
|
Net Income
|
—
|
|
—
|
|
—
|
|
—
|
|
—
|
|
2,108
|
|
—
|
|
—
|
|
—
|
|
2,108
|
|
|||||||||||||||||||||
|
Currency translation adjustments, net of tax
|
—
|
|
—
|
|
—
|
|
—
|
|
—
|
|
—
|
|
—
|
|
(521
|
)
|
—
|
|
(521
|
)
|
|||||||||||||||||||||
|
Year Ended December 31, 2011
|
140,210
|
|
—
|
|
245
|
|
—
|
|
287,307
|
|
(11,812
|
)
|
—
|
|
(593
|
)
|
—
|
|
275,147
|
|
|||||||||||||||||||||
|
Issuance of Series B Preferred Stock
|
—
|
|
100,000
|
|
—
|
|
—
|
|
—
|
|
—
|
|
—
|
|
—
|
|
—
|
|
—
|
|
|||||||||||||||||||||
|
Accretion of redemption value on Series A Preferred Stock
|
8,469
|
|
—
|
|
—
|
|
—
|
|
(8,469
|
)
|
—
|
|
—
|
|
—
|
|
—
|
|
(8,469
|
)
|
|||||||||||||||||||||
|
Preferred stock dividend
|
(4,447
|
)
|
—
|
|
—
|
|
—
|
|
—
|
|
—
|
|
—
|
|
—
|
|
—
|
|
—
|
|
|||||||||||||||||||||
|
Redemption of Series B Preferred Stock
|
—
|
|
(100,000
|
)
|
—
|
|
—
|
|
—
|
|
—
|
|
—
|
|
—
|
|
—
|
|
—
|
|
|||||||||||||||||||||
|
Acquisition of subsidiary with a noncontrolling interest
|
—
|
|
—
|
|
—
|
|
—
|
|
—
|
|
—
|
|
—
|
|
—
|
|
247
|
|
247
|
|
|||||||||||||||||||||
|
Net Income
|
—
|
|
—
|
|
—
|
|
—
|
|
—
|
|
7,787
|
|
—
|
|
—
|
|
(40
|
)
|
7,747
|
|
|||||||||||||||||||||
|
Currency translation adjustments, net of tax
|
—
|
|
—
|
|
—
|
|
—
|
|
—
|
|
—
|
|
—
|
|
613
|
|
—
|
|
613
|
|
|||||||||||||||||||||
|
Year Ended December 31, 2012
|
144,232
|
|
—
|
|
245
|
|
—
|
|
278,838
|
|
(4,025
|
)
|
—
|
|
20
|
|
207
|
|
275,285
|
|
|||||||||||||||||||||
|
Accretion of redemption value on Series A Preferred Stock
|
721
|
|
—
|
|
—
|
|
—
|
|
(721
|
)
|
—
|
|
—
|
|
—
|
|
—
|
|
(721
|
)
|
|||||||||||||||||||||
|
Preferred stock dividend
|
(4,953
|
)
|
—
|
|
—
|
|
—
|
|
—
|
|
—
|
|
—
|
|
—
|
|
—
|
|
—
|
|
|||||||||||||||||||||
|
Recapitalization of Era Group by SEACOR
|
(140,000
|
)
|
—
|
|
(245
|
)
|
199
|
|
140,046
|
|
—
|
|
—
|
|
—
|
|
—
|
|
140,000
|
|
|||||||||||||||||||||
|
Issuance of Era Group stock options in settlement of SEACOR stock options
|
—
|
|
—
|
|
—
|
|
—
|
|
706
|
|
—
|
|
—
|
|
—
|
|
—
|
|
706
|
|
|||||||||||||||||||||
|
Issuance of common stock:
|
|||||||||||||||||||||||||||||||||||||||||
|
Restricted stock grants
|
—
|
|
—
|
|
—
|
|
3
|
|
(3
|
)
|
—
|
|
—
|
|
—
|
|
—
|
|
—
|
|
|||||||||||||||||||||
|
Proceeds and tax benefits from share award plans
|
—
|
|
—
|
|
—
|
|
—
|
|
527
|
|
—
|
|
—
|
|
—
|
|
—
|
|
527
|
|
|||||||||||||||||||||
|
Share-based compensation
|
—
|
|
—
|
|
—
|
|
—
|
|
1,815
|
|
—
|
|
—
|
|
—
|
|
—
|
|
1,815
|
|
|||||||||||||||||||||
|
Cancellation of restricted stock
|
—
|
|
—
|
|
—
|
|
—
|
|
102
|
|
—
|
|
(113
|
)
|
—
|
|
—
|
|
(11
|
)
|
|||||||||||||||||||||
|
Net income (loss)
|
—
|
|
—
|
|
—
|
|
—
|
|
—
|
|
18,705
|
|
—
|
|
—
|
|
(401
|
)
|
18,304
|
|
|||||||||||||||||||||
|
Currency translation adjustments, net of tax
|
—
|
|
—
|
|
—
|
|
—
|
|
—
|
|
—
|
|
—
|
|
156
|
|
—
|
|
156
|
|
|||||||||||||||||||||
|
December 31, 2013
|
$
|
—
|
|
$
|
—
|
|
$
|
—
|
|
$
|
202
|
|
$
|
421,310
|
|
$
|
14,680
|
|
$
|
(113
|
)
|
$
|
176
|
|
$
|
(194
|
)
|
$
|
436,061
|
|
|||||||||||
The accompanying notes are an integral part of these consolidated financial statements
79
ERA GROUP INC.
(in thousands)
|
|
For the years ended December 31,
|
|||||||||||
|
|
2013
|
2012
|
2011
|
|||||||||
|
Cash Flows from Operating Activities:
|
||||||||||||
|
Net income
|
$
|
18,304
|
|
$
|
7,747
|
|
$
|
2,108
|
|
|||
|
Adjustments to reconcile net income to net cash provided by operating activities:
|
|
|
|
|||||||||
|
Depreciation
|
45,561
|
|
42,502
|
|
42,612
|
|
||||||
|
Amortization of deferred financing costs
|
610
|
|
1,663
|
|
25
|
|
||||||
|
Shared-based compensation
|
1,815
|
|
—
|
|
—
|
|
||||||
|
Debt discount amortization
|
231
|
|
15
|
|
—
|
|
||||||
|
Bad debt expense, net
|
885
|
|
2,798
|
|
20
|
|
||||||
|
Gains on asset dispositions and impairments, net
|
(18,301
|
)
|
(3,612
|
)
|
(15,172
|
)
|
||||||
|
Derivative losses, net
|
104
|
|
490
|
|
1,326
|
|
||||||
|
Cash settlements on derivative transactions, net
|
(478
|
)
|
(419
|
)
|
—
|
|
||||||
|
Foreign currency gains, net
|
(698
|
)
|
(720
|
)
|
(516
|
)
|
||||||
|
Deferred income tax expense
|
7,136
|
|
58,511
|
|
18,339
|
|
||||||
|
Non-cash settlement of current tax benefit (see Note 10)
|
—
|
|
(50,000
|
)
|
—
|
|
||||||
|
Equity in (earnings) losses of 50% or less owned companies, net of tax
|
(882
|
)
|
5,528
|
|
(82
|
)
|
||||||
|
Dividends received from 50% or less owned companies
|
—
|
|
(16
|
)
|
1,236
|
|
||||||
|
Changes in operating assets and liabilities:
|
|
|
|
|||||||||
|
Decrease (increase) in receivables
|
9,668
|
|
320
|
|
(9,311
|
)
|
||||||
|
Increase (decrease) in prepaid expenses and other assets
|
1,250
|
|
(2,153
|
)
|
(5,967
|
)
|
||||||
|
(Decrease) increase in accounts payable, accrued expenses and other liabilities
|
(834
|
)
|
(48,739
|
)
|
6,312
|
|
||||||
|
Net cash provided by operating activities
|
64,371
|
|
13,915
|
|
40,930
|
|
||||||
|
Cash Flows from Investing Activities:
|
||||||||||||
|
Purchases of property and equipment
|
(110,105
|
)
|
(112,986
|
)
|
(158,929
|
)
|
||||||
|
Proceeds from disposition of property and equipment
|
65,151
|
|
5,188
|
|
26,043
|
|
||||||
|
Cash settlements on derivative transactions, net
|
—
|
|
—
|
|
6,109
|
|
||||||
|
Investments in and advances to 50% or less owned companies
|
—
|
|
(10,627
|
)
|
(21,840
|
)
|
||||||
|
Principal payments on notes due from equity investees
|
863
|
|
2,574
|
|
—
|
|
||||||
|
Principal payments (advances) on third party notes receivable, net
|
632
|
|
1,086
|
|
(472
|
)
|
||||||
|
Net cash used in investing activities
|
(43,459
|
)
|
(114,765
|
)
|
(149,089
|
)
|
||||||
|
Cash Flows from Financing Activities:
|
||||||||||||
|
Payments to SEACOR, net
|
—
|
|
—
|
|
(63,166
|
)
|
||||||
|
Proceeds from issuance of long-term debt
|
55,000
|
|
284,622
|
|
252,000
|
|
||||||
|
Long-term debt issuance costs
|
—
|
|
(4,754
|
)
|
(3,050
|
)
|
||||||
|
Payments on long-term debt
|
(52,788
|
)
|
(292,787
|
)
|
(2,690
|
)
|
||||||
|
Issuance of Series B preferred stock
|
—
|
|
100,000
|
|
—
|
|
||||||
|
Settlement of Series B preferred stock
|
—
|
|
(50,000
|
)
|
—
|
|
||||||
|
Dividends paid on Series A preferred stock
|
(4,953
|
)
|
(4,447
|
)
|
—
|
|
||||||
|
Proceeds and tax benefits from share award plans
|
527
|
|
—
|
|
—
|
|
||||||
|
Proceeds from SEACOR on the settlement of stock options
|
706
|
|
—
|
|
—
|
|
||||||
|
Net cash (used in) provided by financing activities
|
(1,508
|
)
|
32,634
|
|
183,094
|
|
||||||
|
Effects of Exchange Rate Changes on Cash and Cash Equivalents
|
426
|
|
599
|
|
489
|
|
||||||
|
Net Increase (Decrease) in Cash and Cash Equivalents
|
19,830
|
|
(67,617
|
)
|
75,424
|
|
||||||
|
Cash and Cash Equivalents, Beginning of Year
|
11,505
|
|
79,122
|
|
3,698
|
|
||||||
|
Cash and Cash Equivalents, End of Year
|
$
|
31,335
|
|
$
|
11,505
|
|
$
|
79,122
|
|
|||
The accompanying notes are an integral part of these consolidated financial statements.
80
ERA GROUP INC.
NOTES TO CONSOLIDATED FINANCIAL STATEMENTS
1. NATURE OF OPERATIONS AND ACCOUNTING POLICIES
Nature of Operations
. Era Group Inc. (“Era Group”) and its subsidiaries (collectively referred to as the “Company”) is one of the largest helicopter operators in the world and the longest serving helicopter transport operator in the United States, which is its primary area of operation. The Company is primarily engaged in transportation services to the offshore oil and gas exploration, development and production industry. Its major customers are major integrated and independent oil and gas companies and U.S. government agencies. In addition to serving the oil and gas industry, the Company provides air medical services, firefighting support, flightseeing tours in Alaska, and emergency search and rescue services. The Company operates a fixed base operation (“FBO”) at Ted Stevens Anchorage International Airport and a Federal Aviation Administration (“FAA”) approved maintenance repair station in Lake Charles, Louisiana. The Company has an interest in Dart Holding Company Ltd., a sales and manufacturing organization based in Canada that engineers, manufactures and distributes after-market helicopter parts and accessories, and has an interest in a training center based in Lake Charles, Louisiana that provides instruction, flight simulator and other training service.
Prior to January 31, 2013, the Company was wholly owned by SEACOR Holdings Inc. (along with its other majority-owned subsidiaries being collectively referred to as “SEACOR”) and represented SEACOR’s aviation services business segment. On January 31, 2013, SEACOR recapitalized the Company through the exchange of all of its Class B common stock and its
$140.0 million
of Series A preferred stock for
19,883,583
shares of newly-issued Era Group common stock, par value
$0.01
per share (the “Recapitalization”). Following the Recapitalization, the Company had only
one
class of common stock issued and outstanding and no preferred stock outstanding. On January 31, 2013, SEACOR then completed a spin-off by means of a dividend to SEACOR’s stockholders of all of the Company’s issued and outstanding common stock (the “Spin-off”). The Company filed a Registration Statement on Form 10 with the Securities and Exchange Commission (“SEC”) that was declared effective on January 15, 2013. Prior to the Spin-off, SEACOR and the Company entered into a distribution agreement and several other agreements that govern the post-Spin-off relationship. Era Group is now an independent company with its common stock listed on the New York Stock Exchange under the symbol “ERA.”
Basis of Consolidation
. The consolidated financial statements include the accounts of Era Group Inc., its wholly-owned subsidiaries and entities that meet the criteria of Variable Interest Entities ("VIEs") of which the Company is the primary beneficiary. All significant inter-company accounts and transactions are eliminated in consolidation.
The Company employs the equity method of accounting for investments in business ventures when it has the ability to exercise significant influence over the operating and financial policies of the ventures. Significant influence is generally deemed to exist if the Company has between 20% and 50% of the voting rights of an investee. The Company reports its investments in and advances to equity investees in the accompanying consolidated balance sheets as investments, at equity, and advances to 50% or less owned companies. The Company reports its share of earnings or losses of equity investees in the accompanying consolidated statements of operations as equity in earnings (losses) of 50% or less owned companies, net of tax.
Use of Estimates
. The preparation of financial statements in conformity with accounting principles generally accepted in the United States requires management to make estimates and assumptions that affect the reported amounts of assets and liabilities and disclosure of contingent assets and liabilities at the date of the financial statements and the reported amounts of revenues and expenses during the reporting period. Such estimates include those related to allowance for doubtful accounts, useful lives of property and equipment, impairments, inventories, income tax provisions and certain accrued liabilities. Actual results could differ from those estimates and those differences may be material.
Reclassifications
. Certain amounts reported for prior years in the consolidated financial statements have been reclassified to conform with the current year's presentation.
Revenue Recognition
. The Company recognizes revenue when it is realized or realizable and earned. Revenue is realized or realizable and earned when persuasive evidence of an arrangement exists, delivery has occurred or services have been rendered, the price to the buyer is fixed or determinable and collectability is reasonably assured. Revenue that does not meet these criteria is deferred until the criteria are met. Deferred revenues for the years ended December 31 were as follows (in thousands):
|
2013
|
2012
|
2011
|
||||||||||
|
Balance at beginning of period
|
$
|
8,953
|
|
$
|
123
|
|
$
|
216
|
|
|||
|
Revenues deferred during period
|
37,936
|
|
25,908
|
|
266
|
|
||||||
|
Revenues recognized during period
|
(22,646
|
)
|
(17,078
|
)
|
(359
|
)
|
||||||
|
Balance at end of period
|
$
|
24,243
|
|
$
|
8,953
|
|
$
|
123
|
|
|||
81
As of
December 31, 2013
and
2012
, deferred revenues included $
21.0 million
and $
7.0 million
, respectively, related to dry-lease revenues for certain helicopters leased by the Company to Aeróleo Taxi Aero S/A (“Aeróleo”), its Brazilian joint venture (see Note 5). The deferral originated from difficulties experienced by Aeróleo following one of its customer’s cancellation of certain contracts for a number of AW139 helicopters under dry-lease from the Company, and the deferral continues as a result of financial difficulties at Aeróleo. The Company will recognize revenues as cash is received or earlier should future collectability become reasonably assured. The accounts receivable balances related to the deferred revenue are netted for presentation. All costs and expenses related to these dry-leases were recognized as incurred.
As of
December 31, 2013
and
2012
, deferred revenues also included $
3.2 million
and $
1.9 million
, respectively, related to dry-lease revenues for certain helicopters leased by the Company to one of its customers in India. The deferral resulted from the customer having its operating certificate revoked for a period of time and therefore being unable to operate. The certificate has since been reinstated but uncertainty still remains regarding the collectability of the dry-lease revenues. The Company will recognize revenues as cash is received or earlier should future collectability become reasonably assured. The accounts receivable balances related to the deferred revenue are netted for presentation. All costs and expenses related to these dry-leases were recognized as incurred.
The Company charters the majority of its helicopters through master service agreements, subscription agreements, day-to-day charter arrangements and dry-leases. Master service agreements and subscription agreements typically require a fixed monthly fee plus incremental payments based on hours flown. These agreements have fixed terms ranging from
one
month to
five
years and generally may be canceled by providing
30
days’ notice. Day-to-day charter arrangements call for either a combination of a daily fixed fee plus a charge based on hours flown or an hourly rate with a minimum number of hours to be charged daily. Dry-leases require a fixed monthly fee for the customer’s right to use the helicopter and, where applicable, a charge based on hours flown as compensation for any maintenance, parts, and/or personnel support that the Company may provide to the customer. Dry-leases generally run from
two
to
five
years with no early cancellation provisions. Air medical services are provided under contracts with hospitals that typically include a fixed monthly and hourly rate structure. With respect to flightseeing operations, the Company allocates block space to cruise lines and seats are sold directly to customers. The Company also operates a fixed based operation (“FBO”) at Ted Stevens Anchorage International Airport that sells fuel on an ad-hoc basis and leases storage space.
Cash Equivalents
. The Company considers all highly liquid investments with an original maturity of three months or less when purchased to be cash equivalents. Cash equivalents consist of overnight investments.
Trade Receivables
. Customers are primarily major integrated and independent exploration and production companies, hospitals, international helicopter operators and the U.S. government. Customers are typically granted credit on a short-term basis and related credit risks are considered minimal. The Company routinely reviews its trade receivables and makes provisions for probable doubtful accounts; however, those provisions are estimates and actual results could differ from those estimates and those differences may be material. Trade receivables are deemed uncollectible and removed from accounts receivable and the allowance for doubtful accounts when collection efforts have been exhausted. Allowance for doubtful accounts for the years ended December 31 were as follows (in thousands):
|
2013
|
2012
|
2011
|
||||||||||
|
Balance at beginning of period
|
$
|
2,668
|
|
$
|
59
|
|
$
|
205
|
|
|||
|
Additional allowances
|
764
|
|
2,798
|
|
20
|
|
||||||
|
Write-offs and recoveries
|
(331
|
)
|
(189
|
)
|
(166
|
)
|
||||||
|
Balance at end of period
|
$
|
3,101
|
|
$
|
2,668
|
|
$
|
59
|
|
|||
Derivative Instruments
. The Company accounts for derivatives through the use of a fair value concept whereby all of the Company’s derivative positions are stated at fair value in the accompanying consolidated balance sheets. Realized and unrealized gains and losses on derivatives not designated as hedges are reported in the accompanying consolidated statements of operations as derivative losses, net. Realized and unrealized gains and losses on derivatives designated as fair value hedges are recognized as a corresponding increase or decrease in the fair value of the underlying hedged item to the extent they are effective, with any ineffective portion reported in the accompanying consolidated statements of operations as derivative losses, net.
Concentrations of Credit Risk
. The Company is exposed to concentrations of credit risk relating to its receivables due from customers in the industries described above. The Company does not generally require collateral or other security to support its outstanding receivables. The Company minimizes its credit risk relating to receivables by performing ongoing credit evaluations and, to date, credit losses have not been material. The Company is also exposed to concentrations of credit risk associated with cash, cash equivalents and derivative instruments. The Company minimizes its credit risk relating to these positions by monitoring the financial condition of the financial institutions and counterparties involved and by primarily conducting business with large, well-established financial institutions and diversifying its counterparties. The Company does not currently anticipate
82
nonperformance by any of its significant counterparties. The Company’s
two
largest customers comprised
24%
and
36%
of net trade receivables as of
December 31, 2013
and
2012
, respectively.
Inventories
. Inventories are stated at the lower of average cost or market value and consist primarily of spare parts and fuel. The following table is a roll forward of the allowance related to dormant, obsolete and excess inventory for the years ended December 31 (in thousands):
|
2013
|
2012
|
2011
|
||||||||||
|
Balance at beginning of period
|
$
|
9,213
|
|
$
|
7,281
|
|
$
|
7,054
|
|
|||
|
Increases (decreases) to allowance
|
(4,044
|
)
|
1,932
|
|
227
|
|
||||||
|
Balance at end of period
|
$
|
5,169
|
|
$
|
9,213
|
|
$
|
7,281
|
|
|||
In 2013, the Company sold inventory held by a third party on consignment at a loss for which an allowance was previously provided. This resulted in a
$5.2 million
reduction of the allowance related to this inventory upon removal of the assets.
Property and Equipment
. Property and equipment, stated at cost, is depreciated using the straight-line method over the estimated useful life of the asset to an estimated salvage value. With respect to helicopters, the estimated useful life is typically based upon a newly built asset being placed into service and represents the point at which it is typically not justifiable for the Company to continue to operate the asset in the same or similar manner. From time to time, the Company may acquire older assets that have already exceeded the Company’s useful life policy, in which case the Company depreciates such assets based on its best estimate of remaining useful life.
As of
December 31, 2013
the estimated useful life (in years) of the Company’s categories of new property and equipment was as follows:
|
Helicopters (estimated salvage value at 40% of cost)
|
15
|
|
|
|
Machinery, equipment and spares
|
5-7
|
|
|
|
Buildings and leasehold improvements
|
10-30
|
|
|
|
Furniture, fixtures, vehicles and other
|
3-5
|
|
|
The Company reviews the estimated useful lives and salvage values of its fixed assets on an ongoing basis. Effective July 1, 2011, the Company changed its estimated useful life and salvage value for helicopters from
12
to
15
years and
30%
to
40%
, respectively, due to improvements in new helicopter models that continue to increase their long-term value and make them viable for operation over a longer period of time. For the six months ended December 31, 2011, the change in estimate increased operating income by
$7.6 million
, net income by
$4.9 million
and basic and diluted earnings per share by
$0.48
.
Equipment maintenance and repair costs and the costs of routine overhauls and inspections performed on helicopter engines and major components are charged to operating expense as incurred. Expenditures that extend the useful life or improve the marketing and commercial characteristics of equipment as well as major renewals or improvements to other properties are capitalized.
The Company engages a number of third-party vendors to maintain the engines and certain components on some of its helicopter models under programs known as “power-by-hour” maintenance contracts. These programs require the Company to pay for the maintenance service ratably over the contract period, typically based on actual flight hours. Power-by-hour providers generally bill monthly based on hours flown in the prior month, the costs being expensed as incurred. In the event the Company places a helicopter in a program after a maintenance period has begun, it may be necessary to pay an initial buy-in charge based on hours flown since the previous maintenance event. The buy-in charge is normally recorded as a prepaid expense and amortized as an operating expense over the remaining power-by-hour contract period. If a helicopter is sold or otherwise removed from a program before the scheduled maintenance work is carried out, the Company may be able to recover part of its payments to the power-by-hour provider, in which case, the Company records a reduction to operating expense when it receives the refund.
The Company also incurs repairs and maintenance expense through vendor arrangements whereby the Company obtains repair quotes and authorizes service through a repair order process. Under these arrangements, the Company records the repairs and maintenance cost as the work is completed. As a result, the timing of repairs and maintenance may result in operating expenses varying substantially when compared with a prior year or prior quarter if a disproportionate number of repairs, refurbishments or overhauls for components not covered under power-by-hour arrangements are performed during a period.
Certain interest costs incurred during the construction of equipment are capitalized as part of the assets’ carrying values and are amortized over such assets’ estimated useful lives. Capitalized interest totaled $
1.1 million
, $
1.5 million
and $
2.7 million
in
2013
,
2012
and
2011
, respectively.
83
Impairment of Long-Lived Assets
. The Company performs an impairment analysis on long-lived assets used in operations when indicators of impairment are present. The Company’s helicopters in operation are evaluated for impairment on an aggregate fleet basis. If the carrying value of the assets is not recoverable, as determined by the estimated undiscounted cash flows, the carrying value of the assets is reduced to fair value. Generally, fair value is determined using valuation techniques, such as expected discounted cash flows or appraisals, as appropriate. For the years ended
December 31, 2013
,
2012
and
2011
, the Company recognized no impairment charges.
Impairment of 50% or Less Owned Companies
. The Company performs regular reviews of each investee’s financial condition, the business outlook for its products and services, and its present and projected results and cash flows. When an investee has experienced consistent declines in financial performance or difficulties in raising capital to continue operations, and when the Company expects the decline to be other-than-temporary, the investment is written down to fair value. Actual results may vary from estimates due to the uncertainty regarding the projected financial performance of investees, the severity and expected duration of declines in value and the available liquidity in the capital markets to support the continuing operations of the investees in which the Company has investments. For the year ended
December 31, 2013
, the Company did not recognize any impairment charges. For the year ended December 31,
2012
, the Company recognized an impairment charge of
$5.9 million
, net of tax, on its investment in and advances to Aeróleo (See Note 5). The Company did not recognize any impairment charges in
2011
related to its 50% or less owned companies.
Goodwill
. Goodwill is recorded when the purchase price paid for an acquisition exceeds the fair value of net identified tangible and intangible assets acquired. The Company performs an annual impairment test of goodwill and further periodic tests to the extent indicators of impairment develop between annual impairment tests. The Company’s impairment review process compares the fair value of the acquired entity to its carrying value, including goodwill. To determine its fair value, the Company uses a discounted future cash flow approach that uses estimates for revenues, costs, and appropriate discount rates, among others. These estimates are reviewed each time the Company tests goodwill for impairment and are typically developed as part of the Company’s routine business planning and forecasting process. While the Company believes its estimates and assumptions are reasonable, variations from those estimates could produce materially different results. The Company did not recognize any goodwill impairments in
2013
,
2012
or
2011
.
Business Combinations.
The Company recognizes, with certain exceptions,
100
percent of the fair value of assets acquired, liabilities assumed, and non controlling interests when the acquisition constitutes a change in control of the acquired entity. Shares issued in consideration for a business combination, contingent consideration arrangements and pre-acquisition loss and gain contingencies are all measured and recorded at their acquisition-date fair value. Subsequent changes to fair value of contingent consideration arrangements are generally reflected in earnings. Any in-process research and development assets acquired are capitalized as are certain acquisition-related restructuring costs if the criteria related to exit or disposal cost obligations are met as of the acquisition date. Acquisition-related transaction costs are expensed as incurred and any changes in an acquirer’s existing income tax valuation allowances and tax uncertainty accruals are recorded as an adjustment to income tax expense. The operating results of entities acquired are included in the accompanying consolidated statements of operations from the date of acquisition.
Deferred Financing Costs.
Deferred financing costs incurred in connection with the issuance of debt are amortized over the life of the related debt using the effective interest rate method for term loans and straight line method for revolving credit facilities. Amortization expense for deferred financing costs totaled $
0.6 million
, $
1.7 million
and
less than $0.1 million
in
2013
,
2012
and
2011
, respectively, and are included in interest expense in the accompanying consolidated statements of operations.
Income Taxes
. Commencing February 1, 2013, the Company will file a standalone consolidated U.S. federal tax return. Deferred income tax assets and liabilities have been provided in recognition of the income tax effect attributable to the book and tax basis differences of assets and liabilities reported in the accompanying consolidated financial statements. Deferred tax assets or liabilities are provided using the enacted tax rates expected to apply to taxable income in the periods in which they are expected to be settled or realized. Interest and penalties relating to uncertain tax positions are recognized in interest expense and administrative and general, respectively, in the accompanying consolidated statements of operations. The Company records a valuation allowance to reduce its deferred tax assets if it is more likely than not that some portion or all of the deferred tax assets will not be realized. Prior to the Spin-off, the Company was included in the consolidated U.S. federal income tax return of SEACOR. SEACOR’s policy for allocation of U.S. federal income taxes required its subsidiaries to compute their provision for U.S. federal income taxes on a separate company basis and settle with SEACOR. Net operating loss benefits were settled with SEACOR on a current basis and were used in the consolidated U.S. federal income tax return to offset taxable profits of other affiliates. For all periods prior to the Spin-off the total provision for income taxes included in the consolidated statements of operations would remain as currently reported had the Company not been eligible to be included in the consolidated U.S. federal income tax return of SEACOR.
Deferred Gains.
A portion of the gains realized from sales of the Company’s helicopters to its 50% or less owned companies is not immediately recognized in income and has been recorded in the accompanying consolidated balance sheets in deferred gains and other liabilities.
84
During the year ended December 31, 2011, the Company sold
one
helicopter to Era do Brazil. In addition, the Company previously sold
two
helicopters to a finance company that were in turn leased back by Lake Palma and sold
four
helicopters directly to Lake Palma. The balance in the deferred gain account for 2013, 2012, and 2011 was
$0
,
$1.6 million
, and
$2.4 million
, respectively. The one helicopter related to Era Do Brazil is now in the consolidated balance sheet and there is no longer a deferred gain.
Foreign Currency Translation
. Certain of the Company’s investments, at equity, and advances to 50% or less owned companies were measured using their functional currency, which is the currency of the primary foreign economic environment in which they operate. These investments are translated to U.S. dollars at currency exchange rates as of the balance sheet dates and its equity earnings (losses) at the weighted average currency exchange rates during the applicable reporting periods. Translation adjustments are reported in other comprehensive income (loss) in the accompanying consolidated statements of comprehensive income (loss).
Foreign Currency Transactions
. From time to time, the Company enters into transactions denominated in currencies other than its functional currency. Gains and losses resulting from changes in currency exchange rates between the functional currency and the currency in which a transaction is denominated are included in foreign currency gains (losses), net in the accompanying consolidated statements of operations in the period which the currency exchange rates change.
Earnings (Loss) Per Common Share.
Basic earnings (loss) per common share of the Company are computed based on the weighted average number of common shares issued and outstanding during the relevant periods. Diluted earnings (loss) per common share of the Company are computed based on the weighted average number of common shares issued and outstanding plus the effect of potentially dilutive securities through the application of the if-converted method that assumes all common shares have been issued and outstanding during the relevant periods pursuant to the conversion of all outstanding Series A and Series B preferred stock.
ERA Savings Plan.
The Company provides a defined contribution plan (the “Savings Plan”) for its eligible U.S.-based employees. The Company’s contribution to the Savings Plan is limited to
50%
of an employee’s first
6%
of wages invested in the Savings Plan and is subject to annual review by the Board of Directors of ERA. The Company’s Savings Plan costs were
$1.1 million
for the year ended December 31, 2013. Prior to 2013, SEACOR provided a defined contribution plan for participating employees. The Company’s Savings Plan costs were
$1.0 million
and
$0.9 million
for the years ended December 31, 2012 and 2011, respectively.
Effective January 1, 2014, our plan was amended to provide for qualified non-elective Company contributions in an amount equal to
3%
of each employee’s eligible plan and immediate and full vesting in the Company’s contributions.
2. FAIR VALUE MEASUREMENTS
The fair value of an asset or liability is the price that would be received to sell an asset or transfer a liability (an exit price) in the principal or most advantageous market for the asset or liability in an orderly transaction between market participants on the measurement date. The Company utilizes a fair value hierarchy that maximizes the use of observable inputs and minimizes the use of unobservable inputs when measuring fair value and defines three levels of inputs that may be used to measure fair value.
Level 1
inputs are quoted prices in active markets for identical assets or liabilities.
Level 2
inputs are observable inputs other than quoted prices included in
Level 1
that are observable for the asset or liability either directly or indirectly, including quoted prices for similar assets or liabilities in active markets, quoted prices in markets that are not active, inputs other than quoted prices that are observable for the asset or liability, or inputs derived from observable market data.
Level 3
inputs are unobservable inputs that are supported by little or no market activity and are significant to the fair value of the assets or liabilities.
|
The Company’s financial assets and liabilities as of December 31 that are measured at fair value on a recurring basis were as follows (in thousands):
|
||||||||||||
|
Level 1
|
Level 2
|
Level 3
|
||||||||||
|
2013
|
||||||||||||
|
LIABILITIES
|
||||||||||||
|
Derivative instruments (included in other current liabilities)
|
$
|
—
|
|
$
|
621
|
|
$
|
—
|
|
|||
|
2012
|
||||||||||||
|
LIABILITIES
|
||||||||||||
|
Derivative instruments (included in other current liabilities)
|
$
|
—
|
|
$
|
1,025
|
|
$
|
—
|
|
|||
85
|
The estimated fair value of the Company’s other financial assets and liabilities as of December 31 were as follows (in thousands):
|
||||||||||||||||
|
Estimated Fair Value
|
||||||||||||||||
|
2013
|
Carrying Amount
|
Level 1
|
Level 2
|
Level 3
|
||||||||||||
|
ASSETS
|
||||||||||||||||
|
Cash and cash equivalents
|
$
|
31,335
|
|
$
|
31,335
|
|
$
|
—
|
|
$
|
—
|
|
||||
|
Notes receivable from other business ventures (included in other
receivables and other assets)
|
169
|
|
169
|
|
—
|
|
—
|
|
||||||||
|
LIABILITIES
|
||||||||||||||||
|
Long-term debt, including current portion
|
282,178
|
|
—
|
|
297,399
|
|
—
|
|
||||||||
|
2012
|
||||||||||||||||
|
ASSETS
|
||||||||||||||||
|
Cash and cash equivalents
|
$
|
11,505
|
|
$
|
11,505
|
|
$
|
—
|
|
$
|
—
|
|
||||
|
Notes receivable from other business ventures (included in other
receivables and other assets)
|
925
|
|
925
|
|
—
|
|
—
|
|
||||||||
|
LIABILITIES
|
||||||||||||||||
|
Long-term debt, including current portion
|
279,735
|
|
—
|
|
283,120
|
|
—
|
|
||||||||
The carrying values of cash, cash equivalents and the Company’s recently issued notes receivable from other business ventures approximate fair value. The Company’s long-term debt was estimated using discounted cash flow analysis based on estimated current rates. Considerable judgment was required in developing certain of the estimates of fair value and accordingly, the estimates presented herein are not necessarily indicative of the amounts that the Company could realize in a current market exchange.
|
The Company’s non-financial assets and liabilities that were measured at fair value during the years ended December 31 were as follows (in thousands):
|
||||||||||||
|
Level 1
|
Level 2
|
Level 3
|
||||||||||
|
2013
|
||||||||||||
|
ASSETS
|
||||||||||||
|
Investment in Era do Brazil
(2)
|
$
|
—
|
|
$
|
248
|
|
$
|
—
|
|
|||
|
2012
|
||||||||||||
|
ASSETS
|
||||||||||||
|
Investment in Aeróleo
(1)
|
$
|
—
|
|
$
|
—
|
|
$
|
—
|
|
|||
|
Investment in Era do Brazil
(2)
|
—
|
|
248
|
|
—
|
|
||||||
____________________
|
(1)
|
On March 1, 2012, the Company wrote-off its equity investment in its Aeróleo joint venture (see Note 5).
|
|
(2)
|
On September 30, 2012, the Company marked its equity investment in its Era do Brazil joint venture to fair value. As the primary beneficiary, the Company has consolidated Era do Brazil in its financial statements effective September 30, 2012 (see Note 5).
|
3. DERIVATIVE INSTRUMENTS AND HEDGING STRATEGIES
SEACOR had entered into forward currency exchange contracts on behalf of the Company. These derivative instruments were classified as either assets or liabilities based on their individual fair values. As of December 31, 2013, none of these derivative instruments were outstanding. The Company had designated its forward currency exchange contracts as fair value hedges in respect of capital commitments denominated in Euros. By entering into these forward currency exchange contracts, the Company had fixed a portion of its euro capital commitments in U.S. dollars to protect against currency fluctuations for equipment that was scheduled to be delivered in 2011 through 2013.
86
|
The Company recognized gains (losses) on derivative instruments designated as fair value hedges for the years ended December 31 as follows (in thousands):
|
||||||||||||
|
2013
|
2012
|
2011
|
||||||||||
|
Foreign currency exchange contracts, effective and ineffective portions
|
$
|
—
|
|
$
|
—
|
|
$
|
5,770
|
|
|||
|
Decrease in fair value of hedged items included in property and equipment
corresponding to the effective portion of derivative gains
|
—
|
|
—
|
|
(5,810
|
)
|
||||||
|
$
|
—
|
|
$
|
—
|
|
$
|
(40
|
)
|
||||
During the year ended December 31, 2011, the Company entered into
two
interest rate swap agreements maturing in 2014 and 2015 that call for the Company to pay fixed interest rates of
1.67%
and
1.83%
on an aggregate notional value of
$31.8 million
and receive a variable interest rate based on the London Interbank Offered Rate (“LIBOR”) on these notional values. The general purpose of these interest rate swap agreements is to provide protection against increases in interest rates, which might lead to higher interest costs for the Company. The fair value of these derivative instruments at December 31, 2013 were liabilities of
$0.6 million
. The Company recognized gains of
$0.4 million
and losses of
$0.5 million
on these derivative instruments for the year ended December 31, 2013 and 2012, respectively.
4. ACQUISITIONS AND DISPOSITIONS
The Company’s capital expenditures were $
110.1 million
, $
113.0 million
and $
158.9 million
in
2013
,
2012
and
2011
, respectively, and consisted primarily of helicopter acquisitions and deposits on future helicopter deliveries. The Company records helicopter acquisitions in Property and Equipment and places helicopters in service once all completion work has been finalized and the helicopters are ready for use. A summary of changes to our owned helicopter fleet during the years ended December 31 were as follows:
Equipment Additions
.
|
2013
(1)
|
2012
(2)
|
2011
|
|||||||
|
Light helicopters - single engine
|
—
|
|
3
|
|
1
|
|
|||
|
Light helicopters - twin engine
|
2
|
|
4
|
|
3
|
|
|||
|
Medium helicopters
|
4
|
|
8
|
|
4
|
|
|||
|
Heavy helicopters
|
—
|
|
3
|
|
1
|
|
|||
|
6
|
|
18
|
|
9
|
|
||||
Equipment Dispositions
. The Company sold or otherwise disposed of property and equipment for $
65.2 million
, $
5.2 million
and $
26.0 million
in
2013
,
2012
and
2011
, respectively. Major equipment dispositions for the years ended December 31 were as follows:
|
2013
|
2012
(3)
|
2011
(4)
|
|||||||
|
Light helicopters - single engine
|
—
|
|
—
|
|
3
|
|
|||
|
Light helicopters - twin engine
|
4
|
|
6
|
|
3
|
|
|||
|
Medium helicopters
|
10
|
|
2
|
|
2
|
|
|||
|
Heavy helicopters
|
1
|
|
—
|
|
3
|
|
|||
|
15
|
|
8
|
|
11
|
|
||||
____________________
|
(1)
|
Includes
two
light-twin helicopters and
one
medium helicopter that were previously leased-in.
|
|
(2)
|
Includes
three
light-single helicopters and
one
medium helicopter that were previously leased-in.
|
|
(3)
|
Excludes
two
light-twin helicopters that were removed from service and includes
one
light-single helicopter that had previously been removed from service.
|
|
(4)
|
Includes
one
light-single helicopter that had previously been removed from service and excludes
one
light-twin helicopter that was removed from service in 2011.
|
87
5. INVESTMENTS, AT EQUITY, AND ADVANCES TO 50% OR LESS OWNED COMPANIES
|
Investments, at equity, and advances to 50% or less owned companies as of December 31 were as follows (in thousands):
|
||||||||||
|
Ownership
|
2013
|
2012
|
||||||||
|
Dart
|
50.0%
|
$
|
25,264
|
|
$
|
25,212
|
|
|||
|
Aeróleo
(1)
|
50.0%
|
—
|
|
—
|
|
|||||
|
Era do Brazil
(2)
|
50.0%
|
—
|
|
—
|
|
|||||
|
Era Training Center
|
50.0%
|
6,236
|
|
6,740
|
|
|||||
|
Lake Palma
(3)
|
51.0%
|
3,411
|
|
2,512
|
|
|||||
|
Heli-Union Era Australia
|
45.0%
|
75
|
|
232
|
|
|||||
|
$
|
34,986
|
|
$
|
34,696
|
|
|||||
____________________
|
(1)
|
Investment impaired in March 2012.
|
|
(2)
|
Consolidated entity as of September 30, 2012.
|
|
(3)
|
The Company owns a
51%
financial interest in this joint venture; however, it does not consolidate the venture as it only controls
50%
of the venture’s voting rights.
|
Combined Condensed Financials
. Summarized financial information for the Company’s investments, at equity, as of and for the years ended December 31 was as follows (in thousands) for Dart Holding Company Ltd.:
|
2013
|
2012
|
|||||||||
|
Current Assets
|
$
|
19,231
|
|
$
|
18,845
|
|
||||
|
Noncurrent Assets
|
37,636
|
|
42,423
|
|
||||||
|
Current Liabilities
|
8,613
|
|
8,754
|
|
||||||
|
Noncurrent Liabilities
|
6,963
|
|
12,590
|
|
||||||
|
2013
|
2012
|
2011
|
||||||||||
|
Operating Revenues
|
$
|
39,185
|
|
$
|
42,870
|
|
$
|
43,198
|
|
|||
|
Costs and Expenses:
|
||||||||||||
|
Operating and administrative
|
31,538
|
|
33,706
|
|
34,431
|
|
||||||
|
Depreciation and amortization
|
5,213
|
|
5,375
|
|
2,746
|
|
||||||
|
36,751
|
|
39,081
|
|
37,177
|
|
|||||||
|
Operating Income
|
$
|
2,434
|
|
$
|
3,789
|
|
$
|
6,021
|
|
|||
|
Net Income
|
$
|
789
|
|
$
|
1,245
|
|
$
|
3,974
|
|
|||
Combined Condensed Financials
. Summarized financial information for the Company’s investments, at equity, as of and for the years ended December 31 was as follows (in thousands) for all other investments:
|
2013
|
2012
|
|||||||||
|
Current Assets
|
$
|
4,378
|
|
$
|
2,278
|
|
||||
|
Noncurrent Assets
|
20,018
|
|
22,611
|
|
||||||
|
Current Liabilities
|
2,789
|
|
2,523
|
|
||||||
|
Noncurrent Liabilities
|
7,918
|
|
9,146
|
|
||||||
88
|
2013
|
2012
|
2011
|
||||||||||
|
Operating Revenues
|
$
|
4,682
|
|
$
|
20,009
|
|
$
|
53,827
|
|
|||
|
Costs and Expenses:
|
||||||||||||
|
Operating and administrative
|
1,035
|
|
16,221
|
|
51,726
|
|
||||||
|
Depreciation
|
3,450
|
|
3,165
|
|
3,081
|
|
||||||
|
4,485
|
|
19,386
|
|
54,807
|
|
|||||||
|
Operating Income
|
$
|
197
|
|
$
|
623
|
|
$
|
(980
|
)
|
|||
|
Net Income (Loss)
|
$
|
(476
|
)
|
$
|
540
|
|
$
|
(1,590
|
)
|
|||
As of
December 31, 2013
and 2012, cumulative undistributed net earnings (losses) of 50% or less owned companies included in the Company’s consolidated accumulated deficit were a loss of
$4.6 million
and
$5.8 million
, respectively.
Dart .
A wholly owned subsidiary of the Company, Era DHS LLC, acquired
49%
of the capital stock of Dart Helicopter Services LLC (“Dart Helicopters”), a sales, marketing and parts manufacturing organization based in North America that engineers and manufactures after-market parts and equipment for sale to helicopter manufacturers and operators. During 2009, the Company provided a
$0.3 million
loan to Dart Helicopters with a maturity of June 2012 at an annual interest rate of
5%
, which is payable quarterly with principal due at maturity. On February 28, 2011, the Company made an additional investment of
$5.0 million
in Dart Helicopters and, on July 31, 2011, contributed its ownership in Dart Helicopters to Dart Holding Company Ltd. (“Dart”) in exchange for a
50%
interest in Dart and a note receivable of
$5.1 million
. The note receivable bears an interest rate of
4.0%
per annum, requires quarterly principal and interest payments and matures on July 31, 2023. During the years ended December 31, 2013, 2012 and 2011, the Company purchased
$2.9 million
,
$1.7 million
and
$2.3 million
, respectively, of products from Dart Helicopters and Dart. The Company received no management fees during the years ended
December 31, 2013
and 2012. The management fees earned during the year ended December 31, 2011 were not material.
Aeróleo
. On July 1, 2011, the Company acquired a
50%
economic interest and a
20%
voting interest in Aeróleo Taxi Aereo S/A (“Aeróleo”), a Brazilian entity that provides helicopter transport services to the Brazilian offshore oil and gas industry, for
$4.8 million
in cash. The Company and its partner also each loaned Aeróleo
$6.0 million
at an interest rate of
6%
per annum. On March 1, 2012, the Company recorded an impairment charge of
$5.9 million
, net of tax, on its investment in and advances to Aeróleo. The impairment charge resulted from difficulties experienced by Aeróleo following
one
of its customer’s cancellation of certain contracts for a number of AW139 helicopters under dry-lease from the Company. The Company leases
11
helicopters to Aeróleo and for the years ended
December 31, 2013
and 2012,
and
the period July 1, 2011 through December 31, 2011, the Company recognized
$16.2 million
,
$17.6 million
and
$14.0 million
, respectively, of operating revenues from these leases, of which
$21.0 million
and
$5.3 million
was outstanding as of
December 31, 2013
and 2012, respectively (See Notes 1 and 20).
Era Training Center.
Era Training Center LLC (“Era Training Center”) operates flight training devices and provides training services to the Company and third-party customers. During the years ended
December 31, 2013
, 2012 and 2011, the Company provided helicopter, management and other services to the joint venture totaling
$0.4 million
,
$0.5 million
and
$0.7 million
, respectively, and paid the joint venture
$0.7 million
,
$0.8 million
and
$0.1 million
for simulator fees in 2013, 2012 and 2011, respectively. In December 2010, Era Training Center signed a
$3.2 million
note with the Company to purchase
two
flight simulators. The note is secured by the
two
flight simulators and bears interest at
6%
. Terms of the note require quarterly interest-only payments for the first year and
$0.1 million
quarterly payments of principal and interest thereafter until January 2026. In 2012 and 2011, the Company made additional advances of
$0.8
and
$1.2 million
under the note, respectively.
Lake Palma.
Lake Palma, S.L. (“Lake Palma”) operates
seven
helicopters in Spain. The Company received advances of
$1.2 million
in 2012, and did not receive any advances in 2013.
Era do Brazil
. On July 1, 2011, the Company and its partner each contributed
$4.8 million
in cash to Era do Brazil LLC (“Era do Brazil”), a
50
-50 joint venture. Era do Brazil immediately acquired a helicopter, subject to a lease to Aeróleo, from the Company for
$11.5 million
(
$9.5 million
in cash and a
$2.0 million
note payable). During the year ended December 31, 2012, the Company loaned
$10.8 million
to Era do Brazil secured by a helicopter purchased from the Company in 2011 and Era do Brazil's ownership interests. Upon receipt of the proceeds from the loan, Era do Brazil repaid the outstanding principal amount of
$1.6 million
remaining on the original helicopter acquisition note due to the Company and loaned
$9.2 million
to Aeróleo in the form of
two
notes, each of an equal amount. Era do Brazil then distributed the
two
notes due from Aeróleo to its members. As a result of these transactions, Era do Brazil is a highly leveraged entity with all its outstanding debt due to the Company. As the primary beneficiary, the Company has consolidated Era do Brazil in its financial statements effective September 30, 2012. The Company provides maintenance services to Era do Brazil and for the period January 1, 2012 through September 30, 2012 and the period July 1, 2011 through December 31, 2011, the Company recognized
$0.4 million
and
$0.3 million
, respectively, of operating revenues from these services.
89
6. ESCROW DEPOSITS ON LIKE-KIND EXCHANGES
From time to time, the Company enters into Qualified Exchange Accommodation Agreements with a third party to meet the like-kind exchange requirements of Section 1031 of the Internal Revenue Code and the provisions of Revenue Procedure 2000-37. In accordance with these provisions, the Company is permitted to deposit proceeds from the sale of assets into escrow accounts for the purpose of acquiring other assets and qualifying for the temporary deferral of taxable gains realized. Consequently, the Company established escrow accounts with financial institutions for the deposit of funds received on sale of equipment, which were designated for replacement property within a specified period of time. As of December 31, 2013 and 2012, there were no deposits in like-kind exchange escrow accounts.
7. INCOME TAXES
|
The components of income tax expense (benefit) for the years ended December 31 were as follows (in thousands):
|
||||||||||||
|
2013
|
2012
|
2011
|
||||||||||
|
Current:
|
||||||||||||
|
Federal
|
$
|
3,758
|
|
$
|
(51,420
|
)
|
$
|
(18,986
|
)
|
|||
|
State
|
91
|
|
267
|
|
39
|
|
||||||
|
Foreign
|
742
|
|
(60
|
)
|
1,042
|
|
||||||
|
4,591
|
|
(51,213
|
)
|
(17,905
|
)
|
|||||||
|
Deferred:
|
||||||||||||
|
Federal
|
5,912
|
|
58,566
|
|
19,313
|
|
||||||
|
State
|
1,224
|
|
(55
|
)
|
(974
|
)
|
||||||
|
7,136
|
|
58,511
|
|
18,339
|
|
|||||||
|
$
|
11,727
|
|
$
|
7,298
|
|
$
|
434
|
|
||||
|
The following table reconciles the difference between the statutory federal income tax rate for the Company and the effective income tax rate for the years ended December 31:
|
|||||||||
|
Provision (Benefit):
|
2013
|
2012
|
2011
|
||||||
|
Statutory rate
|
35.0
|
%
|
35.0
|
%
|
35.0
|
%
|
|||
|
Non-deductible SEACOR management fees
|
—
|
%
|
—
|
%
|
16.4
|
%
|
|||
|
SEACOR share award plans
|
—
|
%
|
(0.8
|
)%
|
2.2
|
%
|
|||
|
State taxes
|
1.7
|
%
|
0.6
|
%
|
(9.6
|
)%
|
|||
|
State effective tax rate changes
|
—
|
%
|
—
|
%
|
(29.0
|
)%
|
|||
|
Valuation allowance
|
2.7
|
%
|
—
|
%
|
—
|
%
|
|||
|
Other
|
0.8
|
%
|
0.7
|
%
|
2.6
|
%
|
|||
|
40.2
|
%
|
35.5
|
%
|
17.6
|
%
|
||||
During the year ended December 31, 2011, the Company recognized an income tax benefit of
$0.7 million
on adjustments to deferred tax liabilities resulting from changes in state tax apportionment factors. Prior to the Spin-off, the Company participated in share award programs sponsored by SEACOR and received an additional income tax benefit or expense based on the difference between the fair market value of share awards at the time of grant and the fair market value at the time of vesting or exercise.
90
|
The components of net deferred income tax liabilities as of December 31 were as follows (in thousands):
|
||||||||
|
2013
|
2012
|
|||||||
|
Deferred tax liabilities:
|
||||||||
|
Property and equipment
|
$
|
211,062
|
|
$
|
205,766
|
|
||
|
Buy-in on maintenance programs
|
3,078
|
|
3,929
|
|
||||
|
Other
|
560
|
|
322
|
|
||||
|
Total deferred tax liabilities
|
214,700
|
|
210,017
|
|
||||
|
Deferred tax assets:
|
||||||||
|
Equipment leases
|
638
|
|
971
|
|
||||
|
Other
|
7,625
|
|
9,152
|
|
||||
|
Valuation allowance
|
(790
|
)
|
—
|
|
||||
|
Total deferred tax assets
|
7,473
|
|
10,123
|
|
||||
|
Net deferred tax liabilities
|
$
|
207,227
|
|
$
|
199,894
|
|
||
As of December 31, 2013, the Company had state income tax net operating loss ("NOL") carryforwards of
$116.2 million
in various states, which will expire from 2020 to 2033 and for which a deferred tax asset of
$6.9 million
has been recorded.
The Company believes that it is more likely than not the benefit from some state NOL carryover will not be realized. In recognition of the risk, the Company has provided a valuation allowance of
$0.8 million
on the deferred tax assets relating to those NOL carry forwards. If the assumptions change and the Company determines it will be able to realize those NOLs, the tax benefits relating to any reversal of the valuation allowance on deferred tax assets would be recorded in the income tax provision in which such adjustments are identified.
As of December 31, 2013 and 2012, the Company had no unrecognized tax benefits. The Company did not incur any interest and penalties nor accrue any interest for the years ended December 31, 2013 and 2012. When applicable, the Company recognizes interest and penalties related to uncertain tax positions in interest expense and administrative and general, respectively, in the accompanying consolidated statements of operations.
|
The Company’s borrowings as of December 31 were as follows (in thousands):
|
||||||||
|
2013
|
2012
|
|||||||
|
7.750% Senior Notes (excluding unamortized discount)
|
$
|
200,000
|
|
$
|
200,000
|
|
||
|
Senior Secured Revolving Credit Facility
|
55,000
|
|
50,000
|
|
||||
|
Promissory Notes
|
30,311
|
|
33,098
|
|
||||
|
285,311
|
|
283,098
|
|
|||||
|
Portion due with one year
|
(2,787
|
)
|
(2,787
|
)
|
||||
|
Unamortized discount
|
(3,133
|
)
|
(3,363
|
)
|
||||
|
$
|
279,391
|
|
$
|
276,948
|
|
|||
|
The Company’s long-term debt maturities for the years ended December 31 are as follows (in thousands):
|
||||
|
2014
|
$
|
2,787
|
|
|
|
2015
|
27,524
|
|
||
|
2016
|
55,000
|
|
||
|
2017
|
—
|
|
||
|
2018
|
—
|
|
||
|
Years subsequent to 2018
|
200,000
|
|
||
|
$
|
285,311
|
|
||
7.750% Senior Notes.
On December 7, 2012, the Company issued
$200.0 million
aggregate principal amount of its
7.750%
senior unsecured notes due December 15, 2022 (the “
7.750%
Senior Notes”) and received net proceeds of
$191.9 million
. Interest on the
7.750%
Senior Notes is payable semi-annually in arrears on each June 15 and December 15 of each year, beginning
91
on June 15, 2013. The
7.750%
Senior Notes may be redeemed at any time, and from time to time on or after December 15, 2017 at the applicable redemption prices set forth in the indenture governing the
7.750%
Senior Notes, plus accrued and unpaid interest, if any, to the redemption date. Prior to December 15, 2017, the Company may also redeem the
7.750%
Senior Notes, in whole or in part, at a redemption price based on a “make-whole” premium plus accrued and unpaid interest, if any, the redemption date. In addition, at any time on or prior to December 15, 2015, the Company may redeem up to
35%
of the
7.750%
Senior Notes at a redemption price equal to
107.750%
of their principal amount, plus accrued and unpaid interest if any, to the redemption date, using the proceeds of certain equity offerings. The indenture contains covenants that restrict the Company's ability to, among other things, incur additional indebtedness, pay dividends or make other distributions or repurchase or redeem its capital stock, prepay, redeem or repurchase certain debt, make loans and investments, sell assets, incur liens, enter into transactions with affiliates, enter into agreements restricting its subsidiaries' ability to pay dividends, and consolidate, merge or sell all or substantially all of their assets. In addition, upon a specified change of control trigger event or a specified asset sales, the Company may be required to offer to repurchase the
7.750%
Senior Notes.
The Company’s payment obligations under the
7.750%
Senior Notes are fully and unconditionally guaranteed by all of our wholly owned existing U.S. subsidiaries that are guarantors under our revolving credit facility.
The net proceeds of the offering were used to repay
$190.0 million
of borrowings outstanding under the revolving credit facility. In connection with the issuance of the
7.750%
Senior Notes, the borrowing capacity under the revolving credit facility was permanently reduced from
$350.0 million
to
$200.0 million
.
Senior Secured Revolving Credit Facility.
On December 22, 2011, the Company entered into a
$350.0 million
senior secured revolving credit facility that matures in December 2016, is secured by substantially all of the tangible and intangible assets of the Company and is guaranteed by the Company’s wholly owned U.S. subsidiaries. Advances under the senior secured revolving credit facility are available for general corporate purposes and can be used to issue up to
$50.0 million
in letters of credit. Interest on advances are at the option of the Company of either a “base rate” or LIBOR as defined plus an applicable margin. The “base rate” is defined as the highest of: (a) the Prime Rate, as defined; (b) the Federal Funds Effective Rate, as defined, plus
50
basis points; or (c) a daily LIBOR, as defined, plus an applicable margin. The applicable margin is based on the Company’s funded debt to earnings before interest, taxes, depreciation and amortization (“EBITDA”), as defined, and ranges from
100
to
200
basis points on the “base rate” margin and
210
to
335
basis points on the LIBOR margin. The applicable margin as of
December 31, 2013
, was
100
basis points on the “base rate” margin and
210
basis points on the LIBOR margin. A quarterly commitment fee is payable based on the average unfunded portion of the committed amount at a rate based on the Company’s funded debt to EBITDA, as defined, and ranges from
25
to
70
basis points, and as of
December 31, 2013
the commitment fee was
25
basis points.
The senior secured revolving credit facility contains various restrictive covenants including interest coverage, funded debt to EBITDA, secured funded debt to EBITDA, funded debt to the fair market value of owned helicopters, fair market value of mortgaged helicopters to funded debt, fair market value of mortgaged helicopters registered in the United States to fair market value of all mortgaged helicopters, as well as other customary covenants, representations and warranties, funding conditions and events of default, all as defined in the senior secured revolving credit facility. In addition, under certain conditions, the senior secured revolving credit facility may restrict the ability of the Company to distribute dividends on its preferred and common stock. Generally, dividends may be declared and paid quarterly provided the Company is in compliance with the various covenants of the senior secured revolving credit facility, as defined, and the dividend amount does not exceed
20%
of the net income of the Company for the previous four consecutive quarters.
As of
December 31, 2013
, the Company had
$55.0 million
outstanding advances under the senior secured revolving credit facility at an annual rate of
2.35%
and
$136.1
million available, net of issued letters of credit of
$8.9 million
. The remaining amounts under the senior secured revolving credit facility are available to fund working capital needs.
Promissory Notes
. On December 23, 2010, the Company entered into a promissory note for
$27.0 million
to purchase a heavy helicopter. The note is secured by the helicopter and bears a variable interest rate that resets every three months and is computed as the three-month LIBOR rate at the date of each reset plus
260
basis points. At
December 31, 2013
, the interest rate on this note was
2.85%
. The note requires
$0.1 million
monthly payments of principal plus accrued interest with a final payment of
$19.0 million
in December 2015.
On November 24, 2010, the Company entered into a promissory note for
$11.7 million
to purchase a medium helicopter. The note is secured by the helicopter and bears a variable interest rate that resets every three months and is computed as the three-month LIBOR rate at the date of each reset plus
260
basis points. As of
December 31, 2013
, the interest rate on this note was
2.84%
. The note requires
$0.1 million
monthly payments of principal plus accrued interest with a final payment of
$5.9 million
in December 2015.
9. SERIES A PREFERRED STOCK
In July 2011, the Company’s Board of Directors adopted the Company’s amended and restated certificate of incorporation to authorize the issuance of
10,000,000
shares
$0.01
par value preferred stock in one or more series and to fix the preferences,
92
powers and relative, participating, optional or other special rights, and qualifications, limitations or restrictions thereof, including the dividend rate, conversion rights, voting rights, redemption rights and liquidation preference and to fix the number of shares to be included in any such series without any further vote or action by our stockholders. Any preferred stock so issued may rank senior to the Company’s common stock with respect to the payment of dividends or amounts upon liquidation, dissolution or winding up, or both. In addition, any such shares of preferred stock may have class or series voting rights.
On December 23, 2011, the Company’s Board of Directors designated
1,400,000
shares of preferred stock as
6%
Cumulative Perpetual Preferred Stock, Series A (“Series A Preferred Stock”), all of which were issued to SEACOR in exchange for
$140.0 million
of advances from SEACOR. The stated value per share of Series A Preferred Stock was
$100
(the “Original Issue Price”). The shares of the Series A Preferred Stock were redeemable at the option of the Company, in whole or in part, at the Original Purchase Price plus any accrued but unpaid dividends on the Series A Preferred Stock.
As SEACOR controlled the redemption of the Series A Preferred Stock through its control of the Company, the Company classified the Series A Preferred Stock outside of stockholders' equity.
On January 31, 2013, as part of the Recapitalization, SEACOR exchanged its
1,400,000
shares of Series A Preferred Stock, which represented all of the Company's Series A Preferred Stock then outstanding, for shares of newly-issued Era Group common stock.
10. SERIES B PREFERRED STOCK
On June 8, 2012, the Company's Board of Directors designated
300,000
shares of Series B Preferred Stock and on September 25, 2012, designated an additional
700,000
shares of Series B Preferred Stock, all of which were issued to SEACOR in exchange for
$100.0 million
. The proceeds were used to reduce outstanding borrowings under the Company’s senior secured revolving credit facility. The stated value per share of Series B Preferred Stock was
$100
(the “Original Issue Price”). The shares of the Series B Preferred Stock were redeemable at the option of the Company, in whole or in part, at the Original Purchase Price.
On December 18, 2012, the Company entered into an agreement with SEACOR, pursuant to which SEACOR transferred to the Company
500,000
shares of its Series B preferred stock (
$50.0 million
in liquidation value) that SEACOR held in partial satisfaction for the benefit that SEACOR will receive by applying U.S. federal net operation losses generated by the Company in 2012. In addition, the agreement called for the settlement in cash for the remaining
500,000
shares of Series B preferred stock held by SEACOR for a purchase price of
$50.0 million
. On December 20, 2012, the Company borrowed
$50.0 million
under the Revolving Credit Facility to fund the repurchase of the remaining
500,000
shares of Series B preferred stock. As of December 31, 2012, there were no shares of Series B Preferred Stock issued or outstanding.
11. COMMON STOCK
In July 2011, the Company’s Board of Directors adopted the Company’s amended and restated certificate of incorporation to authorize the issuance of
60,000,000
shares
$0.01
par value Class A common stock and
60,000,000
shares
$0.01
par value Class B common stock. Effective August 1, 2011, each then issued share of the Company’s no par value common stock was exchanged for
24,500
shares of Class B common stock. The rights of the holders of Class A and Class B common shares were substantially identical, except with respect to voting and conversion. Specifically, the holders of Class B common stock were entitled to
eight
votes per share and the holders of Class A common stock were entitled to
one
vote per share. The shares of Class B common stock were convertible into Class A common stock (i) at the holder’s option and (ii) automatically upon the transfer of any such shares of Class B common stock to a person other than SEACOR or a subsidiary of SEACOR (except in the case of a tax-free spinoff to stockholders of SEACOR) or if the aggregate number of shares of Class B common stock beneficially owned by SEACOR and its affiliates fell below
20%
of the aggregate number of shares of common stock then outstanding (except in the case of a tax-free spinoff to stockholders of SEACOR). In addition, if SEACOR were to effect a tax-free spinoff, following such tax-free spinoff, all of the outstanding shares of Class B common stock may be converted into shares of Class A common stock with the consent of a majority of the holders of Class A common stock and the holders of Class B common stock, voting as separate classes. On January 31, 2013, as part of the Recapitalization, all of the outstanding shares of Class B common stock were exchanged for newly issued common stock (see Note 1).
93
12. EARNINGS PER SHARE
Basic earnings (loss) per common share of the Company are computed based on the weighted average number of common shares issued and outstanding during the relevant periods. Diluted earnings (loss) per common share of the Company are computed based on the weighted average number of common shares issued and outstanding plus the effect of potentially dilutive securities through the application of the if-converted method and/or treasury method. Dilutive securities for this purpose assumes all common shares have been issued and outstanding during the relevant periods pursuant to the conversion of all outstanding Series A preferred stock, restricted stock grants have vested and common shares have been issued pursuant to the exercise of outstanding stock options.
Computations of basic and diluted earnings per common share for the years ended December 31 were as follows (in thousands, except share data):
|
2013
|
2012
|
2011
|
||||||||||
|
Net Income (Loss) Attributable to Common Shares
|
$
|
17,984
|
|
$
|
(682
|
)
|
$
|
1,898
|
|
|||
|
Shares:
|
||||||||||||
|
Weighted average number of common shares outstanding—basic
|
20,489,200
|
|
24,500,000
|
|
10,270,444
|
|
||||||
|
Assumed conversion of Series A Preferred Stock
(1)
|
—
|
|
—
|
|
—
|
|
||||||
|
Net effect of dilutive stock options and restricted stock awards based on the treasury stock method
(2)
|
—
|
|
—
|
|
—
|
|
||||||
|
Weighted average number of common shares outstanding—diluted
|
20,489,200
|
|
24,500,000
|
|
10,270,444
|
|
||||||
|
Basic and Diluted Earnings (Loss) per Common Share
|
$
|
0.88
|
|
$
|
(0.03
|
)
|
$
|
0.18
|
|
|||
____________________
(1) Excludes
753,535
and
7,679,623
for the years ending December 31 2013 and 2012, respectively, weighted average common shares for the conversion of Series A preferred stock as the effect of their inclusion would have been antidilutive.
(2) Excludes
250,110
for the year ending December 31, 2013, weighted average common shares for certain share awards as the effect of their inclusion would have been antidilutive.
No
share awards existed in 2012.
13. SHARE-BASED COMPENSATION
Share Incentive Plans.
In 2013, the Company adopted the Era Group Inc. 2013 Employee Stock Purchase Plan (“ESPP”) under which the Company may offer up to a maximum of
300,000
shares of the Company’s common stock for purchase by eligible employees at a price equal to
85%
of the lesser of (i) the fair market value of Common Stock on the first day of the offering period or (ii) the fair market value of Common Stock on the last day of the offering period. Common Stock is made available for purchase under the ESPP for
six
-month offering periods. The ESPP is intended to comply with Section 423 of the Internal Revenue Code of 1986, as amended (the “Code”), but is not intended to be subject to Section 401(a) of the Code or the Employee Retirement Income Security Act of 1974. The Board of Directors of the Company may amend or terminate the ESPP at any time; however, no increase in the number of shares of Common Stock reserved for issuance under the ESPP may be made without stockholder approval. The ESPP has a term of
ten
years.
In
2013, the Company adopted the Era Group Inc. 2012 Incentive Plan (“2012 Plan”) under which a maximum of
4,000,000
shares of the Company’s common stock are reserved for issuance. Awards granted under the 2012 Plan may be in the form of stock options, stock appreciation rights, shares of restricted stock, other share-based awards (payable in cash or common stock) or performance awards, or any combination thereof, and may be made to outside directors, employees or consultants. As of December 31, 2013,
3,364,998
shares remained available for grant under the 2012 Plan.
94
Share Award Transactions.
Transactions in connection with the Company’s share-based compensation plans during the year ended December 31, 2013 were as follows:
|
Director stock awards granted
|
45,510
|
|
|
Restricted stock awards granted
|
224,850
|
|
|
Restricted stock awards canceled
|
3,700
|
|
|
Stock option activities:
|
||
|
Outstanding as of December 31, 2012
|
—
|
|
|
Converted stock options
|
169,058
|
|
|
Granted
|
200,000
|
|
|
Exercised
|
(40,302
|
)
|
|
Forfeited
|
(716
|
)
|
|
Expired
|
—
|
|
|
Outstanding as of December 31, 2013
|
328,040
|
|
Total share-based compensation expense, which includes stock options, restricted stock and ESPP purchases, totaled
$2.0 million
for the year ended December 31, 2013. A portion of the restricted stock awards are performance-based. The Company has assessed the probability of meeting the criteria and has recorded the appropriate expense. As of December 31, 2013, the Company had approximately
$5.8 million
in total unrecognized compensation costs.
During the year ended December 31, 2013, the Company awarded
264,760
, net, shares of restricted stock at an average grant date fair value of
$21.28
per share, granted
200,000
stock options and converted
37,900
options to purchase SEACOR common stock held by Company employees and directors prior to the Spin-off into
169,058
options to purchase Era Group common stock. The fair value used for the converted stock options was evaluated before and after the Spin-off and there was no change. The following table shows the assumptions used to compute the share-based compensation expense for stock options granted during the year ended December 31, 2013:
|
Risk free interest rate
|
0.81
|
%
|
|
|
Expected life (years)
|
5
|
|
|
|
Volatility
|
50
|
%
|
|
|
Dividend yield
|
—
|
%
|
|
|
Weighted average exercise price of options granted
|
$19.05 per option
|
|
|
|
Weighted average grant-date fair value of options granted
|
$7.87 per option
|
|
|
During the year ended December 31, 2013, the number of shares and the weighted average grant price of restricted stock and restricted stock unit transactions were as follows:
|
Number of Shares
|
Weighted Average Grant Price
|
||||||
|
Nonvested as of December 31, 2012
|
—
|
|
$
|
—
|
|
||
|
Granted
|
270,360
|
|
$
|
21.28
|
|
||
|
Vested
|
(1,900
|
)
|
$
|
21.69
|
|
||
|
Forfeited
|
(3,700
|
)
|
$
|
20.48
|
|
||
|
Nonvested as of December 31, 2013
|
264,760
|
|
$
|
21.29
|
|
||
95
During the year ended December 31, 2013, the number of shares, the weighted average grant date fair value and the weighted average exercise price on stock option transactions were as follows:
|
Nonvested Options
|
Vested/Exercisable Options
|
Total Options
|
|||||||||||||||||||
|
Number of Shares
|
Weighted Average Grant Date Fair Value
|
Number of Shares
|
Weighted Average Exercise Price
|
Number of Shares
|
Weighted Average Exercise Price
|
||||||||||||||||
|
Outstanding as of December 31, 2012
|
—
|
|
$
|
—
|
|
—
|
|
$
|
—
|
|
—
|
|
$
|
—
|
|
||||||
|
Granted
|
235,452
|
|
$
|
9.59
|
|
133,606
|
|
$
|
15.28
|
|
369,058
|
|
$
|
18.52
|
|
||||||
|
Vested
|
(34,896
|
)
|
$
|
6.07
|
|
34,896
|
|
$
|
17.32
|
|
—
|
|
$
|
—
|
|
||||||
|
Exercised
|
—
|
|
$
|
—
|
|
(40,302
|
)
|
$
|
14.31
|
|
(40,302
|
)
|
$
|
14.31
|
|
||||||
|
Expired
|
—
|
|
$
|
—
|
|
—
|
|
$
|
—
|
|
—
|
|
$
|
—
|
|
||||||
|
Forfeited
|
—
|
|
$
|
—
|
|
(716
|
)
|
$
|
14.62
|
|
(716
|
)
|
$
|
14.62
|
|
||||||
|
Outstanding as of December 31, 2013
|
200,556
|
|
$
|
10.21
|
|
127,484
|
|
$
|
16.14
|
|
328,040
|
|
$
|
19.05
|
|
||||||
During the year ended December 31, 2013, the aggregate intrinsic value of exercised stock options was
$0.4 million
. As of December 31, 2013, the weighted average remaining contractual term for total outstanding stock options and vested/exercisable stock options was
7.92
years. As of December 31, 2013, the aggregate intrinsic value of all options outstanding and all vested/exercisable options outstanding was
$6.2 million
.
14. RELATED PARTY TRANSACTIONS
During 2013 and 2012, the Company provided
$0.1 million
and less than
$0.1 million
, respectively, of aviation services to SEACOR under flight charter arrangements. During 2011, the Company provided
no
aviation services to SEACOR under flight charter arrangements.
|
As part of a consolidated group, certain costs and expenses of the Company were borne by SEACOR and charged to the Company. These costs and expenses are included in both operating expenses and administrative and general expenses in the accompanying consolidated statements of operations and are summarized as follows for the years ended December 31 (in thousands):
|
||||||||||||
|
2013
|
2012
|
2011
|
||||||||||
|
Payroll costs for SEACOR personnel assigned to the Company and participation in
SEACOR employee benefit plans, defined contribution plan and share award plans
|
$
|
5
|
|
$
|
8,159
|
|
$
|
11,404
|
|
|||
|
Shared services allocation for administrative support
|
299
|
|
2,937
|
|
2,692
|
|
||||||
|
Shared services under the Amended and Restated Transition Services Agreement
|
3,063
|
|
—
|
|
—
|
|
||||||
|
$
|
3,367
|
|
$
|
11,096
|
|
$
|
14,096
|
|
||||
|
•
|
Actual payroll costs of SEACOR personnel assigned to the Company were charged to the Company.
|
|
•
|
Prior to 2013, SEACOR maintained self-insured health benefit plans for participating employees, including those of the Company, and charged the Company for its share of total plan costs incurred based on the percentage of its participating employees.
|
|
•
|
Prior to 2013, SEACOR provided a defined contribution plan for participating employees, including those of the Company, and charged the Company for its share of employer matching contributions based on
50%
of the participating employees’ first
6%
of wages contributed to the plan.
|
|
•
|
SEACOR also provides certain administrative support services to the Company under a shared services arrangement, including payroll processing, information systems support, cash disbursement support, cash receipt processing, and treasury management.
|
SEACOR incurred various corporate costs in connection with providing certain corporate services, including, but not limited to, executive oversight, risk management, legal, accounting and tax, and charges quarterly management fees to its operating segments in order to fund its corporate overhead to cover such costs. Total management fees charged by SEACOR to its operating segments include actual corporate costs incurred plus a mark-up and are generally allocated within the consolidated group using
96
income-based performance metrics reported by an operating segment in relation to SEACOR’s other operating segments. On December 30, 2011, the Company and SEACOR entered into an agreement for SEACOR to provide these services at a fixed rate of
$2.0 million
per annum beginning January 1, 2012. Costs the Company incurred for management fees from SEACOR are reported as SEACOR management fees in the Company’s consolidated statements of operations.
Prior to the Company’s entry into a senior secured revolving credit facility on December 22, 2011, the Company participated in a cash management program whereby certain operating and capital expenditures of the Company were funded through advances from SEACOR and certain cash collections of the Company were forwarded to SEACOR. The Company incurred interest on the outstanding advances, which was reported as interest expense on advances from SEACOR in the accompanying consolidated statements of operations. Interest was calculated and settled on a quarterly basis using interest rates set at the discretion of SEACOR.
On December 23, 2011, SEACOR recapitalized the Company in connection with the Company’s entry into a senior secured revolving credit facility. As part of the recapitalization, the Company issued
1,400,000
shares of its Series A preferred stock to SEACOR in exchange for
$140.0 million
of aggregate advances previously provided to it by SEACOR. SEACOR also contributed an additional
$180.0 million
of capital to the Company in respect of additional prior advances. All remaining outstanding advances from SEACOR through November 30, 2011 were settled by the Company with a cash payment of
$199.7 million
to SEACOR on December 23, 2011. The Company’s advance activity with SEACOR from December 1, 2011 through December 23, 2011, primarily consisting of capital expenditures on helicopters and partially offset by SEACOR’s purchase of the Company’s 2011 tax operating loss benefit of
$18.2 million
, were settled by the Company with a cash payment of
$42.6 million
to SEACOR on February 9, 2012.
During 2011, SEACOR received insurance proceeds from one of its insurance carriers for damages related to Hurricanes Katrina and Rita. The Company’s share of these proceeds totaled
$1.9 million
and were offset against the Company’s other operating expenses.
On March 31, 2011, the Company distributed to SEACOR a receivable from SEACOR Asset Management LLC in the amount of
$69.8 million
representing a return of capital to SEACOR.
15. COMMITMENTS AND CONTINGENCIES
The Company’s unfunded capital commitments as of
December 31, 2013
consisted primarily of agreements to purchase helicopters and totaled $
341.7 million
, of which
$98.7 million
is payable in 2014 with the balance payable through 2017. The Company also had $
2.3 million
of deposits paid on options not yet exercised. The Company may terminate $
164.4 million
of its total commitments (inclusive of deposits paid on options not yet exercised) without further liability other than liquidated damages of $
11.1 million
in the aggregate.
In the normal course of its business, the Company becomes involved in various other litigation matters including, among other things, claims by third parties for alleged property damages and personal injuries. Management has used estimates in determining the Company’s potential exposure to these matters and has recorded reserves in its financial statements related thereto where appropriate. It is possible that a change in the Company’s estimates of that exposure could occur, but the Company does not expect such changes in estimated costs would have a material effect on the Company’s consolidated financial position, or its results of operations or its cash flows.
As of
December 31, 2013
, the Company leased
five
helicopters and certain facilities and equipment. These leasing agreements have been classified as operating leases for financial reporting purposes and related rental fees are charged to expense over the lease terms. The leases generally contain purchase and lease renewal options or rights of first refusal with respect to sale or lease of the equipment. The lease terms range in duration from
one
to
ten
years. Total rental expense for the Company’s operating leases in 2013, 2012 and 2011 was
$6.0 million
,
$4.0 million
and
$4.3 million
, respectively. Future minimum payments in the years ended December 31 under operating leases that have a remaining term in excess of one year as of
December 31, 2013
were as follows (in thousands):
|
Minimum Payments
|
||||
|
2014
|
$
|
3,060
|
|
|
|
2015
|
2,017
|
|
||
|
2016
|
1,779
|
|
||
|
2017
|
1,543
|
|
||
|
2018
|
1,341
|
|
||
|
Years subsequent to 2018
|
8,619
|
|
||
97
16. SEGMENT INFORMATION, MAJOR CUSTOMERS AND GEOGRAPHICAL DATA
The Company has determined that its operations comprise a single segment. Helicopters are highly mobile and may be utilized in any of the Company’s service lines as business needs dictate.
In 2013, Anadarko Petroleum Corporation (“Anadarko”) and the U.S. government accounted for
19%
and
11%
, respectively, of the Company’s operating revenues. In 2012, Anadarko and the U.S. government accounted for
15%
and
11%
, respectively, of the Company’s operating revenues. In 2011, Anadarko and Aeróleo accounted for
12%
and
11%
, respectively, of the Company’s operating revenues. For the years ended
December 31, 2013
, 2012 and 2011, approximately
18%
,
22%
and
28%
, respectively, of the Company’s operating revenues were derived from foreign operations. The Company’s foreign revenues are primarily derived from international dry-leasing activities.
|
The following represents the Company’s operating revenues attributed by geographical region in which services are provided to customers for the years ended December 31 (in thousands):
|
||||||||||||
|
2013
|
2012
|
2011
|
||||||||||
|
Operating Revenues:
|
||||||||||||
|
United States
|
$
|
245,581
|
|
$
|
213,920
|
|
$
|
185,677
|
|
|||
|
Latin America and the Caribbean
|
23,407
|
|
23,636
|
|
38,321
|
|
||||||
|
Europe
|
22,008
|
|
25,749
|
|
21,352
|
|
||||||
|
Asia
|
7,679
|
|
9,298
|
|
12,480
|
|
||||||
|
Canada
|
284
|
|
318
|
|
318
|
|
||||||
|
$
|
298,959
|
|
$
|
272,921
|
|
$
|
258,148
|
|
||||
|
The Company’s long-lived assets are primarily its property and equipment employed in various geographical regions of the world. The following represents the Company’s property and equipment based upon the assets’ physical location as of December 31 (in thousands):
|
||||||||
|
2013
|
2012
|
|||||||
|
Property and Equipment:
|
||||||||
|
United States
|
$
|
579,509
|
|
$
|
475,315
|
|
||
|
Latin America and the Caribbean
|
130,844
|
|
143,592
|
|
||||
|
Europe
|
73,631
|
|
134,156
|
|
||||
|
Asia
|
19,349
|
|
34,314
|
|
||||
|
Canada
|
319
|
|
428
|
|
||||
|
$
|
803,652
|
|
$
|
787,805
|
|
|||
17. SUPPLEMENTAL INFORMATION FOR STATEMENTS OF CASH FLOWS
Supplemental information for the years ended December 31 was as follows (in thousands):
|
2013
|
2012
|
2011
|
||||||||||
|
Benefit of net tax operating losses cash purchased by SEACOR
|
$
|
—
|
|
$
|
1,961
|
|
$
|
18,236
|
|
|||
|
Income taxes paid, net of refunds
|
20
|
|
143
|
|
557
|
|
||||||
|
Interest paid to SEACOR, excluding capitalized interest
|
—
|
|
—
|
|
23,410
|
|
||||||
|
Interest paid to others, excluding capitalized interest
|
17,839
|
|
7,821
|
|
1,114
|
|
||||||
|
Schedule of Non-Cash Investing and Financing Activities:
|
||||||||||||
|
Company financed sale of equipment and parts
|
—
|
|
350
|
|
3,189
|
|
||||||
|
Non-cash distribution from Era do Brazil of a note receivable
|
—
|
|
4,618
|
|
—
|
|
||||||
|
Non-cash distribution to SEACOR
|
—
|
|
—
|
|
69,823
|
|
||||||
|
Non-cash contribution from SEACOR
|
—
|
|
—
|
|
180,000
|
|
||||||
|
Exchange of advances from SEACOR for Series A Preferred Stock
|
—
|
|
—
|
|
140,000
|
|
||||||
|
Settlement of Series B preferred stock in exchange for net tax operating losses
|
—
|
|
50,000
|
|
—
|
|
||||||
98
18. QUARTERLY FINANCIAL INFORMATION (UNAUDITED)
Selected financial information for interim quarterly periods is presented below (in thousands, except share data). Earnings (loss) per common share are computed independently for each of the quarters presented and the sum of the quarterly earnings (loss) per share may not necessarily equal the total for the year:
|
Three Months Ended
|
||||||||||||||||
|
Mar. 31
|
Jun. 30
|
Sep. 30
|
Dec. 31
|
|||||||||||||
|
2013
|
||||||||||||||||
|
Operating Revenues
|
$
|
67,727
|
|
$
|
74,237
|
|
$
|
80,997
|
|
$
|
75,998
|
|
||||
|
Operating Income
|
$
|
14,617
|
|
$
|
10,792
|
|
$
|
11,196
|
|
$
|
9,558
|
|
||||
|
Net Income
|
$
|
6,589
|
|
$
|
4,950
|
|
$
|
5,088
|
|
$
|
1,677
|
|
||||
|
Net Income attributable to Common Shares
|
$
|
5,973
|
|
$
|
5,055
|
|
$
|
5,204
|
|
$
|
1,752
|
|
||||
|
Basic Earnings Per Common Share
|
$
|
0.28
|
|
$
|
0.25
|
|
$
|
0.26
|
|
$
|
0.09
|
|
||||
|
Diluted Earnings Per Common Share
|
$
|
0.28
|
|
$
|
0.25
|
|
$
|
0.25
|
|
$
|
0.09
|
|
||||
|
2012
|
||||||||||||||||
|
Operating Revenues
|
$
|
61,052
|
|
$
|
62,985
|
|
$
|
77,989
|
|
$
|
70,895
|
|
||||
|
Operating Income
|
$
|
3,834
|
|
$
|
7,401
|
|
$
|
11,092
|
|
$
|
9,724
|
|
||||
|
Net Income
|
$
|
(4,632
|
)
|
$
|
3,648
|
|
$
|
5,200
|
|
$
|
3,531
|
|
||||
|
Net Income (Loss) attributable to Common Shares
|
$
|
(6,732
|
)
|
$
|
1,513
|
|
$
|
3,101
|
|
$
|
1,436
|
|
||||
|
Basic and Diluted Earnings (Loss) Per Common Share
|
$
|
(0.27
|
)
|
$
|
0.06
|
|
$
|
0.13
|
|
$
|
0.06
|
|
||||
19. GUARANTORS OF SECURITIES
On December 7, 2012, Era Group issued
$200.0 million
aggregate principal amount of its
7.750%
Senior Notes. Era Group’s payment obligations under the
7.750%
Senior Notes are jointly and severally guaranteed by all of Era Group's existing 100% owned U.S. subsidiaries that guarantee the Revolving Credit Facility and its future U.S. subsidiaries that guarantee the Revolving Credit Facility or other material indebtedness Era Group may incur in the future (the “Guarantors”). All the Guarantors currently guarantee the Revolving Credit Facility, and the guarantees of the Guarantors are full and unconditional and joint and several. Era Group has no independent assets or operations and subsidiaries of Era Group other than the Guarantors are minor. In addition, there are no significant restrictions on the ability of Era Group or any Guarantor to obtain funds from its subsidiaries by dividend or loan. As a result, Era Group is exempt from providing full financial statements for the Guarantors and other subsidiaries.
20. SUBSEQUENT EVENTS
On February 15, 2014, the Company’s partner in Aeróleo signed purchase agreements to transfer its
50%
economic interest and
80%
voting interest in Aeróleo to a third party who will become the Company’s new local partner in Aeróleo. In addition, the Company’s current partner in Aeróleo will transfer all outstanding shareholder loans and other equity interests in the Company’s affiliates to the Company and its new partner upon consummation of the transaction. Upon consummation of the transaction, as consideration for the transfer of interests and the other terms and conditions of the transaction, affiliates of the Company’s local partner will receive certain payments from Aeróleo as severance and partial repayment of shareholder loans. Such payments are likely to require a capital infusion from the Company to Aeróleo of approximately
$2.0 million
. The transaction remains subject to customary closing conditions, including receipt of required local regulatory approval, and is expected to close in the second half of 2014. On February 19, 2014, in connection with execution of the purchase agreements, the Company filed with its partner a joint motion to dismiss the ongoing arbitration.
In connection with the consummation of the transactions contemplated by the purchase agreements, the Company intends to enter into a shareholders agreement with the new partner providing for certain protective provisions requiring unanimous shareholder approval of specified significant actions and a put/call arrangement which would give the Company the right to purchase (or permit a purchaser designee to purchase) the Aeróleo interests held by the Company’s new partner in Aeróleo and give the new partner in Aeróleo the right to put his interests to the Company at any time and for any reason. The put/call price is the greater of the book value of the shares and the original purchase price therefor.
99
As a result of the transaction and the contemplated arrangements between the Company and its new partner in Aeróleo, the Company may be required to consolidate the financial results of Aeróleo in its financial statements following the consummation of the transactions.
100
TABLE OF CONTENTS
Part IItem 1. BusinessItem 1A. Risk FactorsItem 1B. Unresolved Staff CommentsItem 2. PropertiesItem 3. Legal ProceedingsItem 4. Mine Safety DisclosuresPart IIItem 5. Market For Registrant S Common Equity, Related Stockholder Matters and Issuer Purchases Of Equity SecuritiesItem 6. Selected Financial DataItem 7. Management S Discussion and Analysis Of Financial Condition and Results Of OperationsItem 7A. Quantitative and Qualitative Disclosures About Market RiskItem 8. Financial Statements and Supplementary DataItem 9. Changes in and Disagreements with Accountants on Accounting and Financial DisclosureItem 9A. Controls and ProceduresItem 9B. Other InformationPart IIIItem 10. Directors and Executive Officers and Corporate GovernanceItem 11. Executive CompensationItem 12. Security Ownership Of Certain Beneficial Owners and Management and Related Stockholder MattersItem 13. Certain Relationships and Related Transactions, and Director IndependenceItem 14. Principal Accountant Fees and ServicesPart IVItem 15. Exhibits and Financial Statement Schedules