VALVOLINE INC
10-Ks and 10-Qs
|
|
|
|
|
|
|
|
|
|
|
|
|
|
|
|
|
|
|
|
|
|
|
|
|
|
|
|
|
|
|
|
|
|
|
|
|
|
|
|
|
|
|
|
|
|
|
|
|
|
|
|
|
|
|
|
|
|
|
|
|
|
|
|
|
|
|
|
|
|
|
|
|
|
|
|
|
|
|
|
|
|
|
|
|
|
|
|
|
|
|
|
|
|
|
|
|
|
|
|
|
|
|
|
|
|
|
|
|
|
|
|
|
|
|
|
|
|
|
|
|
|
|
|
|
|
|
|
|
|
|
|
|
|
|
|
|
|
|
|
|
|
|
|
|
|
|
|
UNITED STATES
SECURITIES AND EXCHANGE COMMISSION
WASHINGTON, D.C. 20549
FORM 10-K
|
þ
|
ANNUAL REPORT PURSUANT TO SECTION 13 OR 15(d) OF THE SECURITIES EXCHANGE ACT OF 1934
|
For the fiscal year ended September 30, 2018
OR
|
o
|
TRANSITION REPORT PURSUANT TO SECTION 13 OR 15(d) OF THE SECURITIES EXCHANGE ACT OF 1934
|
For the transition period from _________ to ___________
Commission file number 001-37884
VALVOLINE INC.
|
Kentucky
(State or other jurisdiction of incorporation or organization)
|
30-0939371
(I.R.S. Employer Identification No.)
|
100 Valvoline Way
Lexington, Kentucky 40509
Telephone Number (859) 357-7777
Securities Registered Pursuant to Section 12(b) of the Act:
|
Title of each class
|
Name of each exchange on which registered
|
|
Common stock, par value $0.01 per share
|
New York Stock Exchange
|
Securities Registered Pursuant to Section 12(g) of the Act: None
Indicate by check mark if the Registrant is a well-known seasoned issuer, as defined in Rule 405 of the Securities Act. Yes
þ
No
o
Indicate by check mark if the Registrant is not required to file reports pursuant to Section 13 or Section 15(d) of the Act.
Yes
o
No
þ
Indicate by check mark whether the Registrant (1) has filed all reports required to be filed by Section 13 or 15(d) of the Securities Exchange Act of 1934 during the preceding 12 months (or for such shorter period that the Registrant was required to file such reports), and (2) has been subject to such filing requirements for the past 90 days.
Yes
þ
No
o
Indicate by check mark whether the Registrant has submitted electronically every Interactive Data File required to be submitted pursuant to Rule 405 of Regulation S-T during the preceding 12 months (or for such shorter period that the Registrant was required to submit such files).
Yes
þ
No
o
Indicate by check mark if disclosure of delinquent filers pursuant to Item 405 of Regulation S-K is not contained herein, and will not be contained, to the best of Registrant’s knowledge, in definitive proxy or information statements incorporated by reference in Part III of this Form 10-K or any amendment to this Form 10-K.
þ
Indicate by check mark whether the Registrant is a large accelerated filer, an accelerated filer, a non-accelerated filer, smaller reporting company, or an emerging growth company. See the definitions of “large accelerated filer,” “accelerated filer,” “smaller reporting company,” and “emerging growth company” in Rule 12b-2 of the Exchange Act. (Check one):
|
Large Accelerated Filer
þ
|
Accelerated Filer
o
|
|
Non-Accelerated Filer
o
|
Smaller Reporting Company
o
|
|
Emerging Growth Company
o
|
|
If an emerging growth company, indicate by check mark if the registrant has elected not to use the extended transition period for complying with any new or revised financial accounting standards provided pursuant to Section 13(a) of the Exchange Act.
o
Indicate by check mark whether the Registrant is a shell company (as defined in Rule 12b-2 of the Act). Yes
o
No
þ
The aggregate market value of voting common stock held by non-affiliates at March 31, 2018 was approximately $4.4 billion. At November 16, 2018, there were 188,163,312 shares of common stock outstanding.
DOCUMENTS INCORPORATED BY REFERENCE
Portions of the Registrant’s definitive proxy statement (“Proxy Statement”) for its 2019 Annual Meeting of Shareholders, which will be filed within 120 days of the Registrant’s fiscal year end, are incorporated by reference into Part III of this Annual Report on Form 10-K.
TABLE OF CONTENTS
|
Page
|
|||
|
PART I
|
|||
|
Item 1.
|
|||
|
Item 1A.
|
|||
|
Item 1B.
|
|||
|
Item 2.
|
|||
|
Item 3.
|
|||
|
Item 4.
|
|||
|
PART II
|
|||
|
Item 5.
|
|||
|
Item 6.
|
|||
|
Item 7.
|
|||
|
Item 7A.
|
|||
|
Item 8.
|
|||
|
Item 9.
|
|||
|
Item 9A.
|
|||
|
Item 9B.
|
|||
|
PART III
|
|||
|
Item 10.
|
|||
|
Item 11.
|
|||
|
Item 12.
|
|||
|
Item 13.
|
|||
|
Item 14.
|
|||
|
PART IV
|
|||
|
Item 15.
|
|||
2
Forward-Looking Statements
Certain statements in this Annual Report on Form 10-K, other than statements of historical facts, including estimates, projections, statements related to the Company’s business plans and operating results are forward-looking statements within the meaning of the Private Securities Litigation Reform Act of 1995. Valvoline has identified some of these forward-looking statements with words such as “anticipates,” “believes,” “expects,” “estimates,” “is likely,” “predicts,” “projects,” “forecasts,” “may,” “will,” “should” and “intends” and the negative of these words or other comparable terminology. These forward-looking statements are based on Valvoline’s current expectations, estimates, projections and assumptions as of the date such statements are made and are subject to risks and uncertainties that may cause results to differ materially from those expressed or implied in the forward-looking statements. Factors that might cause such differences include, but are not limited to, those discussed under the headings “Risk Factors” in Part I, Item 1A of this Form 10-K, “Management’s Discussion and Analysis of Financial Condition and Results of Operation” in Part II, Item 7 of this Form 10-K and “Quantitative and Qualitative Disclosures about Market Risk” in Part II, Item 7A of this Form 10-K. Valvoline assumes no obligation to update or revise these forward-looking statements for any reason, even if new information becomes available in the future.
3
A
PART I
Overview
Valvoline Inc., a Kentucky corporation, is a worldwide marketer and supplier of engine and automotive maintenance products and services. The terms “Valvoline,” the “Company,” “we,” “us,” “management” and “our” as used herein refer to Valvoline Inc., its predecessors and its consolidated subsidiaries, except where the context indicates otherwise. On September 28, 2016, Valvoline completed its initial public offering (“IPO”) of common stock and trades on the New York Stock Exchange (“NYSE”) under the symbol, “VVV.”
Valvoline™ is one of the most recognized and respected premium consumer brands in the global automotive lubricant industry, known for its innovative, high quality products and superior levels of service. Established in 1866, Valvoline’s heritage spans over 150 years, during which it was the petroleum industry’s first U.S. trademarked motor oil brand and has developed powerful name recognition across multiple product and service channels. In addition to the iconic Valvoline-branded passenger car motor oils and other automotive lubricant products, Valvoline provides a wide array of lubricants used in heavy duty equipment, as well as automotive chemicals and fluids designed to improve engine performance and lifespan. Valvoline’s premium branded product offerings enhance its high-quality reputation and provide customers with solutions that address a wide variety of automotive and engine needs.
Valvoline has a strong international presence with products sold in more than 140 countries. In the United States and Canada, Valvoline’s products and services are sold to retailers with over 30,000 retail outlets, to installer customers with over 12,000 locations, and through 1,242 company-owned and franchised stores.
Company background
Valvoline was incorporated in May 2016 as a subsidiary of Ashland Global Holdings Inc. (which together with its predecessors and consolidated subsidiaries is referred to herein as “Ashland”). Prior to this time, Valvoline operated as an unincorporated commercial unit of Ashland. Following a series of restructuring steps prior to the IPO, the Valvoline business was transferred from Ashland to Valvoline such that the Valvoline business included substantially all of the historical Valvoline business reported by Ashland, as well as certain other legacy Ashland assets and liabilities transferred to Valvoline from Ashland (the “Contribution”). In connection with the IPO,
34.5 million
shares of Valvoline common stock were sold to investors and Ashland retained
170 million
shares representing
83%
of the total outstanding shares of Valvoline common stock.
On May 12, 2017, Ashland distributed all of its remaining interest in Valvoline to Ashland stockholders (the “Distribution”) through a pro rata dividend on shares of Ashland common stock outstanding at the close of business on the record date of May 5, 2017, which marked the completion of Valvoline’s separation from Ashland. Effective upon the Distribution, Ashland no longer owned any shares of Valvoline common stock, and Valvoline was no longer a controlled and consolidated subsidiary of Ashland.
Valvoline’s products
Valvoline’s portfolio is designed to deliver quality product solutions to meet the needs of its wide variety of customers with varying needs. Valvoline
has a history of leading innovation with ground-breaking products such as its all climate motor oil and the first high mileage motor oil.
I
n addition to the iconic Valvoline-branded passenger car motor oils and other co-branded and private label automotive lubricant products, Valvoline provides a wide array of lubricants used in heavy duty equipment, as well as automotive coolants and chemicals designed to improve engine performance and lifespan. Valvoline prod
ucts are used in a broad range of vehicles and engines, including light-duty (passenger cars, light trucks and two wheelers) and heavy duty (heavy trucks, agricultural, mining and construction equipment) as well as electric vehicles.
Premium branded product offerings enhance Valvoline’s high quality reputation and provide customers with solutions that address a wide variety of needs. Valvoline’s product offerings fall into the following categories:
4
|
Product categories
|
% of 2018 Sales
|
Description
|
||||
|
Lubricants
|
Passenger car / Light duty
|
86%
|
Comprehensive assortment meeting the needs of passenger car, motorcycle and other light duty engines, including motor oil, transmission fluid, greases and gear oil
|
|||
|
Heavy duty
|
Lubricating solutions for a wide range of heavy duty applications ranging from on-road (Class 4 – Class 8 vehicles) to off-road construction, mining, agricultural and power generation equipment
|
|||||
|
Antifreeze
|
Antifreeze / Coolants
|
5%
|
Antifreeze/coolants for original equipment manufacturers (“OEMs”); full assortment of additive technologies and chemistries to meet virtually all light-duty and heavy duty engine applications and heat transfer requirements of batteries and fuel cells used to power electric vehicles
|
|||
|
Chemicals
|
Maintenance chemicals
|
3%
|
Functional and maintenance chemicals ranging from brake fluids and power steering fluids to chemicals specifically designed to clean and maintain optimal performance of fuel, cooling and drive train systems
|
|||
|
Coatings
|
Specialty coatings designed to target rust prevention, and sound absorption for automotive and industrial applications
|
|||||
|
Filters
|
Filters
|
4%
|
Oil and air filters meeting the needs of light-duty vehicles
|
|||
|
Other
|
Other complementary products and royalties
|
2%
|
Windshield wiper blades, light bulbs, serpentine belts, drain plugs, and franchisee royalties
|
|||
Industry overview
Valvoline participates primarily in the global finished lubricants market. In total, global annual lubricants demand is estimated to be approximately 12 billion gallons. Demand for passenger car motor oil and motorcycle oil is estimated to account for approximately 24% of global lubricant demand, while the remaining 76% of demand is estimated for commercial and industrial products. The United States has historically accounted for the largest portion of lubricant demand, followed by China and India. The lubricants market is impacted by the following key drivers and trends:
|
•
|
Global lubricants market demand is shifting towards higher performance finished lubricants, largely driven by advancements in vehicle/equipment design and OEM requirements for improved efficiency, reduced carbon footprints and optimized fuel consumption.
|
|
•
|
There has been increasingly stringent regulation, particularly in North America and Europe, aimed at reducing toxic emissions, which has led to a continuous drive for innovation to address changing specifications for lubricants.
|
|
•
|
Trends back to 2006 indicate that the North American transport lubes market has experienced relatively flat average annual volumes due in part to an increase in oil change intervals, which have resulted from changing OEM recommendations and advancements in engine technology, offset by an increase in the number of cars on the road and miles driven.
|
|
•
|
A surge in the number of cars on the road has led to rapid expansion of passenger vehicle lubricant sales in developing regions.
|
Reportable segments
Valvoline’s reporting structure is composed of three reportable segments: Core North America, Quick Lubes and International. Additionally, to reconcile to consolidated results, certain corporate and other non-operational matters are included in Unallocated and other. Refer to the below for a description of each reportable segment:
5
Core North America
The Core North America segment sells Valvoline™ and other branded and private label engine and automotive maintenance products in the United States and Canada to retailers for consumers to perform their own automotive and engine maintenance, as well as to installers that service vehicles and equipment for consumers. Sales of Valvoline products for consumers to perform their own automotive and engine maintenance are referred to as “Do-It-Yourself” or “DIY” consumers, and sales of Valvoline products for consumers to have their vehicles and equipment serviced are referred to as “Do-It-For-Me” or “DIFM” consumers. Sales for DIY consumers are primarily branded products sold through the retail channel to customers such as retail auto parts stores, as well as to leading mass merchandisers and independent auto part stores. Sales through the retail channel also include non-branded packaged goods to warehouse distributors that resell to both DIY consumers and to installers for DIFM consumers. Sales for DIFM consumers are generally sold through the installer channel to customers such as car dealers, general repair shops and third-party quick lube locations directly as well as through a network of approximately 200 distributors. Valvoline also sells products to heavy duty fleet customers, such as on-highway fleets and construction companies through the installer distributor network. Valvoline has a strategic relationship with Cummins Inc. (“Cummins”), a leading supplier of heavy duty engines, for co-branding products for heavy duty consumers. Other sales within Core North America include OEM and specialty consumers.
Quick Lubes
The Quick Lubes segment services the passenger car and light truck quick lube market in the United States and Canada through Valvoline’s owned and operated quick lube service center stores, quick lube service center stores franchised to independent operators, and Express Care™ stores where independent operators service vehicles with Valvoline products. Valvoline operates the second largest quick lube service chain by number of stores in the United States with Valvoline Instant Oil Change
SM
(“VIOC”)
and the third largest quick lube service chain in Canada with Great Canadian Oil Change. Valvoline’s quick lube service center stores offer customers a quick, easy and trusted way to maintain their vehicles, utilizing well-trained technicians who have access to a proprietary service process that sets forth rigorous protocols for both the steps that must be followed in the service of vehicles and for interactions with customers. The Express Care™ platform supports smaller operators that do not fit Valvoline’s franchise model and generally offer other services in addition to quick lubes, such as automotive repairs and car washes. As of September 30,
2018
, the Quick Lubes system consisted of
462
company-owned and
780
franchised locations and operated in 46 states in the U.S. and five provinces in Canada. As of September 30,
2018
, there were
347
Express Care™ locations.
International
Valvoline’s International segment sells Valvoline™ and other branded engine and automotive maintenance products through wholly-owned affiliates, joint ventures, licensees and independent distributors in more than 140 countries outside of the United States and Canada for the maintenance of consumer and commercial vehicles and equipment. Key international regions include Europe, Middle East, and Africa (“EMEA”); Latin America (which includes Mexico, Central and South America); and Asia Pacific (which includes Australia, India and China). Valvoline has a growing presence in a number of emerging markets, including China, India and Latin America. International sales include products for both light duty and heavy duty. Light duty products are sold internationally primarily through distributors to installer customers. Heavy duty products are sold either directly to key customers or through distributors. Valvoline has 50/50 joint ventures with Cummins in India, China and Argentina, and joint ventures with other partners in Latin America.
Unallocated and other
Unallocated and other generally includes items such as certain corporate and non-operational matters, including company-wide restructuring activities and adjustments related to legacy businesses that are no longer attributed to Valvoline.
Business and growth strategies
The strength of Valvoline’s business model is the ability to generate profitable sales across multiple channels to market, leveraging the strength of the Valvoline brand through effective marketing, innovative product technology and the capabilities of the Valvoline team. Valvoline has delivered strong profits and return on capital, with balanced results. Today, Valvoline leverages its multi-channel model to deliver solid margins, generate high free cash flow, and provide significant growth opportunities. Valvoline’s key business and growth strategies include:
|
•
|
Accelerating Quick Lube unit growth through organic service center expansion and opportunistic acquisitions, while enhancing service center store-level performance;
|
|
•
|
Improving execution and continuing to focus investment in key emerging markets where demand is growing;
|
6
|
•
|
Strengthening and expanding Valvoline’s existing business by improving distribution channels and increasing penetration of Valvoline’s full product portfolio;
|
|
•
|
Broadening electric vehicle (“EV”) capabilities by developing relationships with OEMs and leveraging innovation in the development of future EV products and light services in direct and adjacent markets; and
|
|
•
|
Investing in talent and technology to develop Valvoline’s global hands-on expert capabilities and culture to drive speed and efficiency in both customer-facing and back-office critical processes.
|
Quick Lubes store development
During fiscal 2018, Valvoline acquired
136
service center stores, which included
73
franchise service center stores,
60
former franchise service center stores, and
3
service center stores acquired in single and multi-store transactions. These acquisitions included the Company’s first international quick lube service center store acquisition and expansion into Canada. During fiscal 2017, the Company acquired
43
service center stores that included
14
former franchise service center stores and
29
service center stores acquired in single and multi-store transactions. During fiscal 2016,
104
service center stores were acquired that included
42
franchise service center stores,
9
former franchise service center stores and
53
service center stores acquired in single and multi-store transactions.
As of September 30, 2018, Valvoline operated, either directly or through its franchisees, 1,242 quick lube service center stores, an increase of 115 over the prior year. In addition to the 76 acquired stores added to the Quick Lubes system described above, a combined 39 net new company-owned and franchised service center stores were added to the system during fiscal 2018. The Quick Lubes system consisted of
462
company-owned and
780
franchised locations and operated in 46 states in the U.S. and five provinces in Canada. As of September 30,
2018
, there were
347
Express Care™ locations.
VIOC delivered system-wide same-store sales growth of 8.3% in fiscal 2018, the 12th consecutive year of system-wide same-store sales growth (determined on a fiscal year basis, with new stores excluded from the metric until the completion of their first full fiscal year in operation).
Competition
The industry is highly competitive and Valvoline faces competition in all product categories and subcategories. Competition is based on several key criteria, including brand recognition, product performance and quality, product price, product availability and security of supply, ability to develop products in cooperation with customers and customer service, as well as the ability to bring innovative products or services to the marketplace.
In the Core North America segment, Valvoline’s principal competitors for retail customers are global integrated oil brands, such as Shell, which produces Pennzoil and Quaker State; BP, which produces Castrol; Exxon Mobil, which produces Mobil 1; as well as mid-tier brands and private label producers. Valvoline currently ranks as the number three passenger car motor oil brand in the DIY market by volume. With respect to installer customers in the United States and Canada, Valvoline competes with these same major integrated oil brands, many of which have significantly greater financial resources and more diverse portfolios of products and services, leading to greater operating and financial flexibility.
The Quick Lubes segment competes with other major franchised brands that offer a turn-key operations management system, such as Jiffy Lube (owned by Shell), Grease Monkey, Take 5 Oil Change, Express Oil Change and Mr. Lube, as well as national branded companies that offer a professional signage program with limited business model support, similar to Valvoline’s Express Care network, as well as regional players such as Super-Lube and American Lube Fast that are not directly affiliated with a major brand. Valvoline also competes to some degree with automotive dealerships and service stations, which provide quick lube and other preventative maintenance services. Valvoline believes there are over 9,000 existing quick lube stores currently operating in the U.S. market. Jiffy Lube is currently the Company’s largest competitor by number of stores with just over 1,900 stores owned or operated by franchisees in the U.S. The Canadian quick lubes market is similarly fragmented with a small number of large players that comprise roughly half of the market, while the remainder is made up of smaller local and regional competitors, automotive dealerships and service stations.
Major competitors of Valvoline’s International segment vary by region. Valvoline generally faces strong competition from global integrated oil brands, as these companies have a particularly strong presence in Europe and Asia. In certain markets, Valvoline also competes with regional brands, including brands produced by national oil companies, such as Sinopec in China and Indian Oil in India.
7
Competitive factors in all of these markets include price, innovation of solutions, brand awareness and loyalty, customer service, and sales and marketing. Valvoline’s Core North America and International reportable segments also compete at retailers on the basis of shelf space and product packaging.
Marketing and sales
Valvoline places a high priority on sales and marketing and focuses marketing efforts on areas expected to yield the highest rate of return. Valvoline has a centralized marketing services group as well as dedicated marketing resources in each reportable segment, which are well qualified to reach target customers. The majority of Valvoline’s large customers are supported by direct sales representatives with a number of key customers having dedicated Valvoline teams. In addition, Valvoline has a number of distributors within the Core North America and International reportable segments that represent the Company’s products. In Core North America, Valvoline
products are sold to consumers through over 30,000 retail outlets, to installer customers with over 12,000 locations, and in Quick Lubes through
1,242
company-owned and franchised stores and 347
Express Care™ location
s. Valvoline serves its customer base through its sales force and technical support organization, allowing leverage of the Company’s technology portfolio and customer relationships globally, while meeting customer demands locally. Valvoline also utilizes its digital infrastructure and technology to more efficiently interact with customers, driving customer engagement to deliver growth, customer retention and acquisition.
Valvoline uses a variety of marketing techniques to build awareness of, and create demand for, Valvoline products and services. Valvoline advertises through social and digital media, as well as traditional media outlets such as television and radio. Valvoline selectively sponsors teams in high performance racing, including a current sponsorship of Hendrick Motorsports, featuring drivers Chase Elliott, Jimmie Johnson, William Byron and Alex Bowman. In addition, Valvoline sponsors other teams and players including the Manchester City Football Club and the Memphis Grizzlies, as well as Valvoline’s joint venture sponsorship of renowned Indian cricket player, Virat Kohli.
Research and development
Valvoline’s innovation is central to the successful performance of its business. Valvoline research and development is focused on developing new and innovative products to meet the current and future needs of its customers. These products are developed through Valvoline’s “Hands on Expertise” innovation approach, which begins with the mathematical modeling of critical product design elements and extends through field testing. In addition, Valvoline technology centers, located in the Americas, EMEA and Asia Pacific regions, develop solutions for existing and emerging on and off-road equipment. Valvoline’s research and development team also leverages its strong relationships with customers and suppliers to incorporate their feedback into the research and development process. In addition to its own research and development initiatives, Valvoline also conducts limited testing for other entities, which builds its expertise and partially offsets its research and development costs. Valvoline will continue to incur research and development expenditures in the future to develop innovative, high-quality products and services and to help maintain and enhance Valvoline’s competitive position.
Intellectual property
Valvoline is continually seeking to develop new technology and enhance its existing technology. Valvoline has been issued 36 U.S. and 62 international patents and has 26 U.S. and 81 international patent applications pending or published. Valvoline also holds over 2,500 trademarks in various countries around the world, which Valvoline believes are some of its most valuable assets, and for which Valvoline dedicates significant resources to protect. These trademarks include the Valvoline trademark and the famous “V” brand logo trademark, which are registered in over 150 countries. In addition, Valvoline uses various trade names and service marks in its business, including Valvoline
TM
, Valvoline Instant Oil Change
SM
, among others and including those for key products. Valvoline also has a variety of intellectual property licensing agreements. Valvoline owns over 700 domain names that are used to promote Valvoline products and services and provide information about the Company.
Raw material supply and prices
The key raw materials used in Valvoline’s business are base oils, additives, packaging materials (high density polyethylene bottles, corrugated packaging and steel drums) and ethylene glycol. Valvoline continuously monitors global supply and cost trends of these key raw materials and obtains these raw materials from a diversified network of large global suppliers and regional providers. Valvoline’s sourcing strategy is to ensure supply through contracting a diversified supply base while leveraging market conditions to take advantage of spot opportunities whenever such conditions are available. Valvoline leverages worldwide spend to pursue favorable contract terms from the global suppliers and use the regional providers to ensure market competitiveness and reliability in its supply chain. For materials that must be customized, Valvoline works with market leaders with global footprints and well developed business continuity plans. Valvoline also utilizes the Company’s research and development resources to develop alternative product formulations, which provide flexibility in the event of supply interruptions. Valvoline closely monitors the Company’s supply chain and conducts annual supply risk assessments of its critical suppliers to reduce risk.
8
Valvoline has a large manufacturing and distribution footprint in the United States, with seven lubricant blending and packaging plants and several packaging and warehouse locations. Additional blending and packaging plants are located in Australia, Canada and the Netherlands. In May 2018, Valvoline announced plans to build its first blending and packaging plant in China, which when complete is expected to have annual capacity in excess of 30 million gallons of lubricants. Valvoline also uses numerous third-party toll manufacturers and warehouses and is part of a joint venture that operates a blending and packaging facility in India.
Valvoline seeks to actively manage fluctuations in supply costs, product selling prices and the timing thereof to preserve margins. The prices of many of Valvoline’s products fluctuate based on the price of base oil, which is a large percentage of Valvoline’s cost of sales. Given that base oil, a derivative of crude, is highly correlated to the global oil market, there can be volatility in base oil prices. The amount of volatility is related to the world crude price as well as to the global supply and demand balance of base oil. Base oil prices generally follow crude prices, but the lag period between changes in the price of crude oil and changes in the price of base oil is influenced by whether there is an excess of or shortness in the supply of base oil.
Valvoline works diligently to adjust product selling prices to react to changes in base oil costs and protect margins. As part of the strategy to mitigate the impact of base oil volatility, Valvoline has negotiated base oil supply contracts with terms that have reduced the impact of changes in the base oil market on Valvoline’s financial results. Valvoline has revised contracts in several of the Company’s sales channels to accelerate the timing of adjustments to selling prices in response to changes in raw material prices. Pricing adjustments to product sold to Valvoline’s larger national or regional installer customer accounts tend to be made pursuant to contract and are often based on movements in published base oil indices. Pricing for product sold to Valvoline’s franchisees is adjusted on a periodic basis pursuant to an agreed upon index (weighted combination of published base oil indices), the composition and weighting of which may be updated from time to time by Valvoline and representatives of Valvoline’s franchisees. Pricing adjustments for product sold to retail customers, private label products in the United States and product sold to smaller installer customer accounts are generally market driven, based on negotiations in light of base oil costs and the pricing strategies of Valvoline’s competitors.
Backlog
Although Valvoline may experience availability constraints from time to time for certain products, orders are generally filled within 30 days of receiving them. Therefore, Valvoline usually has a product backlog of less than 30 days at any one time, which the Company does not consider material to its business.
Seasonality
Overall, there is little seasonality in Valvoline’s business. Valvoline’s Quick Lubes business, and to a lesser extent, its Core North America business tend to experience slightly higher sales volume in the summer months due to summer vacations and increased driving, as well as during the periods of time leading into holidays. Both businesses also tend to slow a little from October to February due to inclement weather in parts of the United States and Canada. Valvoline’s International business experiences little seasonality due to its geographic diversity and the high percentage of its business in the commercial and industrial lubricants market, which is less influenced by weather.
Environmental and regulatory matters
Valvoline is subject to numerous federal, state, local and non-U.S. environmental health and safety (“EHS”) laws and regulations. These laws and regulations govern matters such as safe working conditions; product stewardship; air emissions; discharges to the land and surface waters; generation, handling, storage, transportation, treatment and disposal of hazardous substances and waste materials; and the registration and evaluation of chemicals. Valvoline maintains policies and procedures to control EHS risks and monitor compliance with applicable EHS laws and regulations. These laws and regulations also require Valvoline to obtain and comply with permits, registrations or other authorizations issued by governmental authorities. These authorities can modify or revoke the Company’s permits, registrations or other authorizations and can enforce compliance through fines and injunctions. Valvoline expects to incur ongoing costs to comply with existing and future EHS requirements, including the cost of dedicated EHS resources that are responsible for ensuring its business maintains compliance with applicable laws and regulations.
Valvoline is also subject to regulation by various U.S. federal regulatory agencies and by the applicable regulatory authorities in countries in which Valvoline’s products are manufactured and sold. Such regulations principally relate to the ingredients, classification, labeling, manufacturing, packaging, transportation, advertising and marketing of Valvoline’s products. In addition, the Company is subject to the Foreign Corrupt Practices Act and other countries’ anti-corruption and anti-bribery regimes.
While such matters are presently not material to Valvoline’s results of operations, financial position, or cash flows, there can be no assurances that existing or future environmental laws and other regulations applicable to the Company’s operations or products will not lead to a material adverse impact on Valvoline’s results of operations, financial position or cash flows.
9
Employees
As of September 30,
2018
, Valvoline had approximately 6,700 employees worldwide (excluding contract employees).
Available information
More information about Valvoline is available on the Company’s website at http://www.valvoline.com. On this website, Valvoline makes available, free of charge, its annual reports on Form 10-K, quarterly reports on Form 10-Q, current reports on Form 8-K and any amendments to those reports, as well as any beneficial ownership reports of officers and directors filed on Forms 3, 4 and 5. All such reports are available as soon as reasonably practicable after they are electronically filed with, or electronically furnished to, the SEC. Valvoline also makes available, free of charge on its website, its Amended and Restated Articles of Incorporation, By-Laws, Corporate Governance Guidelines, Board Committee Charters, Director Independence Standards and the Global Standards of Business Conduct that apply to Valvoline’s directors, officers and employees. These documents are also available in print to any shareholder who requests them. The information contained on Valvoline’s website is not part of this Annual Report on Form 10-K and is not incorporated by reference in this document. References to website addresses are provided as inactive textual references only. The SEC also maintains a website (http://www.sec.gov) that contains reports, proxy and information statements and other information regarding issuers, including Valvoline, that file electronically with the SEC.
10
Executive officers of Valvoline
The following is a list of Valvoline’s executive officers, their ages, positions and experience during the last five years.
SAMUEL J. MITCHELL, JR. (age 57) is Chief Executive Officer and Director of Valvoline. Mr. Mitchell was appointed as a director and Chief Executive Officer in May 2016 and September 2016, respectively. He served as Senior Vice President of Ashland from 2011 to September 2016 and President of Valvoline from 2002 to September 2016.
MARY E. MEIXELSPERGER (age 58) is Chief Financial Officer of Valvoline since June 2016. Prior to joining Valvoline, Ms. Meixelsperger was Senior Vice President and Chief Financial Officer of DSW Inc. from April 2014 to June 2016 and held the roles of Chief Financial Officer, Controller and Treasurer at Shopko Stores from 2006 to 2014.
JULIE M. O’DANIEL (age 51) is Senior Vice President, Chief Legal Officer and Corporate Secretary of Valvoline since January 2017. Ms. O’Daniel served as General Counsel and Corporate Secretary from September 2016 to January 2017. She served as Lead Commercial Counsel of Valvoline from April 2014 to September 2016 and as Litigation Counsel of Valvoline from July 2007 to April 2014.
THOMAS A. GERRALD II (age 54) is Senior Vice President, Core North America of Valvoline since September 2016. He served as Senior Vice President, U.S. Installer Channel, of Valvoline from June 2012 to September 2016.
FRANCES E. LOCKWOOD (age 68) is Senior Vice President and Chief Technology Officer of Valvoline since September 2016. She served as Senior Vice President, Technology, of Valvoline from May 1994 to September 2016.
HEIDI J. MATHEYS (age 46) is Senior Vice President and Chief Marketing Officer of Valvoline since September 2016. Ms. Matheys served as Senior Vice President, Do-It-Yourself Channels, of Valvoline from August 2013 to September 2016 and as Vice President, Global Brands, of Valvoline from September 2012 to August 2013.
CRAIG A. MOUGHLER (age 61) is Senior Vice President, International & Product Supply of Valvoline since September 2016. Mr. Moughler served as Senior Vice President, International of Valvoline from October 2002 to September 2016.
BRAD A. PATRICK (age 54) is Chief People and Communication Officer of Valvoline since January 2018. Prior to joining Valvoline, Mr. Patrick was Executive Vice President and Chief Human Resources Officer of Shearer’s Snacks from November 2015 to January 2018 and held the role of Executive Vice President and Chief Human Resources Officer at Tempur Sealy International, Inc. from December 2010 to November 2015.
ANTHONY R. PUCKETT (age 56) is Senior Vice President and President, Quick Lubes of Valvoline since September 2016. He served as President of Valvoline Instant Oil Change from August 2007 to September 2016.
DAVID J. SCHEVE (age 43) is Chief Accounting Officer and Controller of Valvoline since October 2016. Prior to joining Valvoline, Mr. Scheve was Chief Financial Officer and Vice President of Finance of Southern Graphic Systems from March 2014 to October 2016 and its Global Corporate Controller from June 2007 to March 2014.
11
The following “risk factors” could materially and adversely affect Valvoline’s business, operations, financial position or future financial performance. This information should be considered when reading the rest of this Annual Report on Form 10-K, including Management’s Discussion and Analysis and the consolidated financial statements and related notes. These factors could cause future results to differ from those in forward-looking statements and from historical trends.
Risks related to Valvoline’s business
The competitive nature of Valvoline’s markets or other factors may delay or prevent it from passing-through increases in raw material costs on to its customers. In addition, certain of Valvoline’s suppliers may be unable to deliver products or raw materials or may withdraw from contractual arrangements. The occurrence of either event could adversely affect Valvoline’s results of operations.
Rising and volatile raw material prices, especially for base oil and lubricant additives, have in the past and may in the future, negatively impact Valvoline’s costs, results of operations and the valuation of its inventory. Valvoline may not always be able to raise prices in response to increased costs of raw materials or may experience a lag in passing-through such cost increases, as the ability to pass on the costs of such price increases is largely dependent upon market conditions. Likewise, reductions in the valuation of Valvoline’s inventory due to market volatility may not be recovered and could result in losses.
Valvoline purchases certain products and raw materials from suppliers, often pursuant to written supply contracts. If those suppliers are unable to meet Valvoline’s orders in a timely manner or choose to terminate or otherwise avoid contractual arrangements, Valvoline may not be able to make alternative supply arrangements or may face increased costs from alternative suppliers. For base oils, Valvoline’s suppliers are primarily large oil producers, many of whom operate oil lubricant production and sales businesses as part of their enterprise. There are risks inherent in obtaining important raw materials from actual or potential competitors, including the risk that applicable antitrust laws may be inadequate to mitigate Valvoline’s exposure to these risks. Valvoline purchases substantially all of its lubricant additives from the following four suppliers: Afton Chemical Corporation, Chevron Oronite Company LLC, the Infineum group of companies and Lubrizol Corporation. Because the industry is characterized by a limited number of lubricant additives suppliers, there are a limited number of alternative suppliers with whom Valvoline could transact in the event of a disruption to its existing supply relationships; for example, due to disruptions to its suppliers' operations caused by natural disasters, severe weather conditions, climate change or significant changes in trade regulations. The inability of Valvoline’s suppliers to meet its supply demands could also have a material adverse effect on its business.
Also, domestic and global government regulations related to the manufacture or transport of certain raw materials may impede Valvoline’s ability to obtain those raw materials on commercially reasonable terms. If Valvoline is unable to obtain and retain qualified suppliers under commercially acceptable terms, its ability to manufacture and deliver products in a timely, competitive and profitable manner or grow its business successfully could be adversely affected.
Valvoline faces significant competition from other companies, which places downward pressure on prices and margins and may adversely affect Valvoline’s business and results of operations.
Valvoline operates in highly competitive markets, competing against a number of domestic and international companies. Competition is based on several key criteria, including brand recognition, product performance and quality, product price, product availability and security of supply, ability to develop products in cooperation with customers and customer service, as well as the ability to bring innovative products or services to the marketplace. Certain key competitors, including Shell/Pennzoil, BP/Castrol and Exxon/Mobil, are significantly larger than Valvoline and have greater financial resources and more diverse portfolios of products and services, leading to greater operating and financial flexibility. As a result, these competitors may be better able to withstand adverse changes in conditions within the relevant industry, the prices of raw materials and energy or general economic conditions. In addition, competitors’ pricing decisions could compel Valvoline to decrease its prices, which could negatively affect Valvoline’s margins and profitability. Additional competition in markets served by Valvoline, such as the entry of new private label competitors, could adversely affect margins and profitability and could lead to a reduction in market share. Also, Valvoline competes in certain markets that are flat to declining, such as the U.S. passenger car motor oil market. If Valvoline’s strategies for dealing with flat to declining markets and leveraging market opportunities are not successful, its results of operations could be negatively affected.
Demand for Valvoline’s products and services could be adversely affected by consumer spending trends, declining economic conditions, industry trends and a number of other factors, all of which are beyond its control.
Demand for Valvoline’s products and services may be affected by a number of factors it cannot control, including the number and age of vehicles in current service, regulation and legislation, technological advances in the automotive industry and changes in engine
12
technology, including the adoption rate of electric or other alternative engine technologies, changing automotive OEM specifications and longer recommended intervals between oil changes. In addition, during periods of declining economic conditions, consumers may defer vehicle maintenance. Similarly, increases in energy prices or other factors may cause miles driven to decline, resulting in less vehicle wear and tear and lower demand for maintenance, which may lead to consumers deferring purchases of Valvoline’s products and services. All of these factors, which impact metrics such as drain intervals and oil changes per day, could result in a decline in the demand for Valvoline’s products and services and adversely affect its sales, cash flows and overall financial condition.
Valvoline has set aggressive growth goals for its business, including increasing sales, cash flow, market share, margins and number of Quick Lubes stores, to achieve its long-term strategic objectives. Execution of Valvoline’s growth strategies and business plans to facilitate that growth involves a number of risks.
Valvoline has set aggressive growth goals for its business to meet its long-term strategic objectives and improve shareholder value. Valvoline’s failure to meet one or more of these goals or objectives could negatively impact its business and is one of the most important risks that Valvoline faces. Aspects of that risk include, among others, changes to the economic environment, changes to the competitive landscape, including those related to automotive maintenance recommendations and consumer preferences, entry of new competitors, attraction and retention of skilled employees, the potential failure of product innovation plans, failure to comply with existing or new regulatory requirements, failure to maintain a competitive cost structure and other risks outlined in greater detail in this “Risk Factors” section.
Damage to Valvoline’s brand and reputation could have an adverse effect on its business.
Maintaining Valvoline’s strong reputation with both consumers and customers is a key component of its business. Product or service complaints or recalls, its inability to ship, sell or transport affected products and governmental investigations may harm its reputation with consumers and customers, which may materially and adversely affect its business operations, decrease sales and increase costs.
Valvoline manufactures and markets a variety of products, such as automotive and industrial lubricants and antifreeze, and provides automotive maintenance services. If allegations are made that some of Valvoline’s products have failed to perform up to consumers’ or customers’ expectations or have caused damage or injury to individuals or property, or that Valvoline’s services were not provided in a manner consistent with its vision and values, the public may develop a negative perception of Valvoline and its brands. In addition, if Valvoline’s franchisees or Express Care operators do not successfully operate their quick lube service centers in a manner consistent with Valvoline’s standards, its brand, image and reputation could be harmed, which in turn could negatively impact its business and operating results. In addition, if any party with whom Valvoline has a sponsorship relationship were to generate adverse publicity, Valvoline's brand image could be harmed. A negative public perception of Valvoline’s brands, whether justified or not, could impair its reputation, involve it in litigation, damage its brand equity and have a material adverse effect on its business. In addition, damage to the reputation of Valvoline’s competitors or others in its industry could negatively impact Valvoline’s reputation and business.
Valvoline uses information technology systems to conduct business, and a cyber security threat, privacy/data breach, or failure of a key information technology system could adversely affect Valvoline’s business and reputation.
Valvoline relies on its information technology systems, including systems which are managed or provided by third-party service providers, to conduct its business. Despite steps Valvoline takes to mitigate or eliminate them, cyber-security threats to its information technology systems are increasing and becoming more advanced and breaches could occur as a result of the activity of hackers or error or misconduct by our employees, contractors or third-party service providers. A breach of or failure of Valvoline’s information technology systems could lead to the loss and destruction of trade secrets, confidential information, proprietary data, intellectual property, customer and supplier data and employee personal information, and could disrupt business operations which could adversely affect Valvoline’s relationships with business partners and harm its brands, reputation and financial results. Valvoline’s customer data may include names, addresses, phone numbers, email addresses and payment account information, among other information. Depending on the nature of the customer data that is compromised, Valvoline may also have obligations to notify users, law enforcement or payment companies about the incident and may need to provide some form of remedy, such as refunds for the individuals affected by the incident. Valvoline could also face fines and penalties should it fail to adequately notify affected parties pursuant to new and evolving privacy laws in various jurisdictions in which it does business.
Valvoline’s significant global operations subject it to risks, which could adversely affect its business, financial condition and results of operations.
Sales from the International business segment accounted for 26% of Valvoline’s sales for fiscal 2018. Valvoline expects sales from international markets to continue to grow and to represent an even larger portion of its sales in the future. Also, a significant portion of Valvoline’s manufacturing capacity is located outside of the United States. Accordingly, its business is subject to risks related to the differing legal, political, cultural, social and regulatory requirements and economic conditions of many jurisdictions.
The global nature of Valvoline’s business presents difficulties in hiring and maintaining a workforce in certain countries. Fluctuations in exchange rates may affect product demand and may adversely affect the profitability in U.S. dollars of products and services
13
provided in other countries. In addition, other countries may impose additional withholding taxes or otherwise tax Valvoline’s income, or adopt other restrictions on trade or investment, including currency exchange controls. The imposition of new or additional tariffs or other significant changes in trade regulations are also risks that could impair Valvoline’s financial performance. For example, the United States, China and the European Union (“EU”) have all recently imposed or indicated the possibility of imposing new or additional tariffs on foreign goods. If Valvoline is subject to new or additional tariffs, such as, in China, where Valvoline products became subject to additional tariffs in fiscal 2018, operating costs could increase and Valvoline may not be able to recapture those costs. In addition, if Valvoline is unable to successfully grow its brand internationally, it may not be able to achieve its international growth plans, which could negatively impact sales, profitability and cash flow.
Certain legal and political risks are also inherent in the operation of a company with Valvoline’s global scope. For example, it may be more difficult for Valvoline to enforce its agreements or collect receivables through other legal systems. There is a risk that non-U.S. governments may nationalize private enterprises in certain countries where Valvoline operates. Terrorist activities and the response to such activities may threaten Valvoline’s operations. Social and cultural norms in certain countries may not support compliance with Valvoline’s corporate policies including those that require compliance with substantive laws and regulations. Also, changes in general economic and political conditions in countries where Valvoline operates are a risk to Valvoline’s financial performance and future growth. In addition, in executing its global growth strategies, Valvoline has entered into several important strategic relationships with joint venture partners, such as Cummins, unaffiliated distributors, toll manufacturers and others. The need to identify financially and commercially strong partners to fill these roles who will comply with the high manufacturing and legal compliance standards Valvoline requires is a risk to Valvoline’s financial performance.
As Valvoline continues to operate its business globally, its success will depend, in part, on its ability to anticipate and effectively manage these and other related risks. There can be no assurance that the consequences of these and other factors relating to Valvoline’s global operations will not have an adverse effect on its business, financial condition or results of operations.
Adverse developments in the global economy or in regional economies and potential disruptions of financial markets could negatively impact Valvoline’s customers and suppliers, and therefore have a negative impact on its results of operations.
A global or regional economic downturn may reduce customer demand or inhibit Valvoline’s ability to produce and sell products. Valvoline’s business and operating results are sensitive to global and regional economic downturns, credit market tightness, declining consumer and business confidence, fluctuating commodity prices, volatile exchange rates, changes in interest rates, sovereign debt defaults and other challenges, including those related to international sanctions and acts of aggression or threatened aggression that can affect the global economy. With 74% of Valvoline’s sales coming from North America in fiscal 2018, Valvoline is particularly sensitive to the risk of an economic slowdown or downturn in that region. In the event of adverse developments or stagnation in the economy or financial markets, Valvoline’s customers may experience deterioration of their businesses, reduced demand for their products, cash flow shortages and difficulty obtaining financing. As a result, existing or potential customers might delay or cancel plans to purchase products and may not be able to fulfill their obligations to Valvoline in a timely fashion. Further, suppliers may experience similar conditions, which could impact their ability to fulfill their obligations to Valvoline. A weakening or reversal of the global economy or a substantial part of it could negatively impact Valvoline’s business, results of operations, financial condition and ability to grow.
Because of the concentration of Valvoline’s sales to a small number of retailers, the loss of one or more, or a significant reduction in, orders from, its top retail customers could adversely affect its financial results, as could the loss of one of its distributor relationships.
Valvoline’s Core North America segment’s sales represented approximately 45% of Valvoline’s total sales in fiscal 2018. NAPA Auto Parts, AutoZone, Advance Auto Parts, O’Reilly Auto Parts and another large national retailer together accounted for 47% of Core North America’s fiscal 2018 sales and 52% of Core North America’s outstanding trade accounts receivable as of September 30, 2018. NAPA Auto Parts accounted for greater than 17% of Core North America’s fiscal 2018 sales. Valvoline’s volume of sales to these customers fluctuates and can be influenced by many factors, including product pricing, purchasing patterns and promotional activities. The loss of, or significant reduction in orders from, one of Valvoline’s top five retail customers or any other significant customer could have a material adverse effect on its business, financial condition, results of operations or cash flows, as could customer disputes regarding shipments, fees, merchandise condition or related matters. Valvoline’s inability to collect accounts receivable from one of its major customers, or a significant deterioration in the financial condition of one of these customers, including a bankruptcy filing or a liquidation, could also have a material adverse effect on Valvoline’s financial condition, results of operations or cash flows. Valvoline also relies on independent distributors to sell and deliver its products. The consolidation of distributors, loss of a relationship with a distributor, significant disagreement with a distributor, or significant deterioration in the financial condition of a distributor could also have a material adverse effect on Valvoline’s financial condition, results of operations or cash flows.
14
Valvoline’s marketing activities may not be successful.
Valvoline invests substantial resources in advertising, consumer promotions and other marketing activities in order to maintain and strengthen its brand image and product awareness. The Valvoline name and brand image are integral to the growth of its business and its expansion into new markets. Failure to adequately market and differentiate its products and services from competitive products and services could adversely affect Valvoline’s business. There can be no assurances that Valvoline’s marketing strategies will be effective or that its investments in advertising activities will result in a corresponding increase in sales of its products. If Valvoline’s marketing initiatives are not successful, it will have incurred significant expenses without the benefit of higher sales of its products.
Failure to develop and market new products and production technologies could impact Valvoline’s competitive position and have an adverse effect on its business and results of operations.
The lubricants industry is subject to periodic technological change and ongoing product improvements. In order to maintain margins and remain competitive, Valvoline must successfully develop and introduce new products or improvements that appeal to its customers and ultimately to global consumers. Changes in additive technologies, base oil production techniques and sources, and the demand for improved performance by OEMs and consumers place particular pressure on Valvoline to continue to improve its product offerings. Valvoline’s efforts to respond to changes in consumer demand in a timely and cost-efficient manner to drive growth could be adversely affected by difficulties or delays in product development and service innovation, including the inability to identify viable new products, successfully complete research and development, obtain regulatory approvals, obtain intellectual property protection or gain market acceptance of new products or service techniques. Due to the lengthy development process, technological challenges and intense competition, there can be no assurance that any of the products Valvoline is currently developing, or could develop in the future, will achieve substantial commercial success. The time and expense invested in product development may not result in commercial products or provide revenues. Valvoline could be required to write-off its investments related to a new product that does not reach commercial viability. Moreover, Valvoline may experience operating losses after new products are introduced and commercialized because of high start-up costs, unexpected manufacturing costs or problems, or lack of demand.
Valvoline may be unable to execute its growth strategy, and acquisitions, joint ventures, strategic alliances and investments could result in operating difficulties, dilution and other harmful consequences that may adversely impact Valvoline’s business and results of operations.
Acquisitions, particularly for the Quick Lubes business segment are an important element of Valvoline’s overall growth strategy. In addition, building strategic alliances for distribution and manufacturing, particularly in international markets, including through joint venture partnerships, product distribution and toll manufacturing arrangements, are also important element of Valvoline’s overall growth strategy. Valvoline expects to continue to evaluate and enter into discussions regarding a wide array of potential strategic transactions, and to continue to grow its Quick Lubes business organically and through acquisitions. An inability to execute these plans could have a material adverse impact on Valvoline’s financial condition and results of operations. In addition, the process of integrating an acquired company, business, or product may create unforeseen operating difficulties or expenditures. The areas where Valvoline faces risks include:
|
•
|
inability to fully execute plans to add stores to Valvoline's Quick Lubes business, due to lack of desirable real estate sites, regulatory or municipal hurdles, a lack of viable acquisition targets, or other factors;
|
|
•
|
diversion of management’s time and attention from operating Valvoline’s business to acquisition integration challenges;
|
|
•
|
failure to successfully grow the acquired business or product lines;
|
|
•
|
inability to implement adequate controls, procedures and policies at the acquired company;
|
|
•
|
integration of the acquired company’s accounting, human resources and other administrative systems, and coordination of product, engineering and sales and marketing functions;
|
|
•
|
transition of operations, users and customers onto Valvoline’s existing platforms;
|
|
•
|
reliance on the expertise of Valvoline’s strategic partners with respect to market development, sales, local regulatory compliance and other operational matters;
|
|
•
|
failure to achieve expected synergies or realize expected financial or strategic benefits from an acquisition;
|
|
•
|
failure to obtain required approvals on a timely basis, if at all, from governmental authorities, or conditions placed upon approval under competition and antitrust laws which could, among other things, delay or prevent Valvoline from completing a transaction, or otherwise restrict its ability to realize the expected financial or strategic goals of an acquisition;
|
|
•
|
in the case of non-U.S. acquisitions, the need to integrate operations across different cultures and languages and to address economic, currency, political and regulatory risks associated with specific countries;
|
|
•
|
cultural challenges associated with integrating employees from the acquired company into Valvoline’s organization, and retention of employees from the companies that Valvoline acquires;
|
|
•
|
liability for, or reputational harm from, activities of the acquired company before the acquisition or from Valvoline’s strategic partners; and
|
15
|
•
|
litigation or other claims in connection with the acquired company, including claims from terminated employees, customers, former security holders or other third parties.
|
Valvoline’s failure to address these risks or other problems encountered in connection with its past or future acquisitions, investments or strategic alliances could cause Valvoline to fail to realize the anticipated benefits of such acquisitions, investments or strategic alliances, incur unanticipated liabilities and harm Valvoline’s business generally.
Valvoline’s acquisitions, investments and strategic alliances could also result in dilutive issuances of its equity securities, the incurrence of debt, contingent liabilities or amortization expenses, impairment of goodwill or purchased long-lived assets and restructuring charges, any of which could harm its financial condition, results of operations and cash flows. Also, the anticipated benefits of Valvoline’s acquisitions may not be realized. Valvoline’s balance sheet includes goodwill primarily related to acquisitions and future acquisitions may result in Valvoline’s recognition of additional goodwill. The impairment of a significant portion of this goodwill would negatively affect its financial results.
The success of Valvoline’s growth initiatives depends on its ability to successfully develop and implement digital platforms to better engage customers and consumers.
Valvoline is in the process of designing and implementing a number of digital platforms that will integrate its operations with customer and consumer data. The successful development and implementation of these digital platforms will depend on Valvoline’s ability to identify an appropriate strategy, dedicate adequate resources and select technologies that will provide it with adequate flexibility to adapt to future developments in the marketplace and changes in consumer and customer behavior. Valvoline has incurred and expects to incur significant upfront investments to develop these digital platforms. There is a risk that once implemented, these digital platforms will not deliver all or part of the expected benefits, including additional sales. As Valvoline develops and implements its digital platforms, it may elect to modify, replace or abandon certain technology initiatives, which could result in asset write-downs.
Valvoline’s success depends upon its ability to attract and retain key employees and the identification and development of talent to succeed senior management.
Valvoline’s success depends on its ability to attract, retain and develop key personnel, and the inability to recruit and retain key personnel or the unexpected loss of key personnel may adversely affect Valvoline’s operations. This risk of unwanted employee turnover is substantial in positions that require certain technical expertise, particularly in the Quick Lubes business. This risk is also substantial in developing international markets that Valvoline has targeted for growth and in North America, where attracting marketing and technical expertise to geographies necessary to support its management is important to its success. In addition, Valvoline relies heavily on its senior management team, and its future success depends, in part, on its ability to identify and develop or recruit talent to succeed its senior management and other key positions throughout the organization. If Valvoline fails to identify and develop or recruit successors, it is at risk of being harmed by the departures of these key employees.
Business disruptions from natural, operational and other catastrophic risks could seriously harm Valvoline’s operations and financial performance. In addition, a catastrophic event at one of Valvoline’s facilities or involving its products or employees could lead to liabilities that could further impair its operations and financial performance.
Business disruptions, including those related to operating hazards inherent in the production of lubricants, natural disasters, severe weather conditions, climate change, supply or logistics disruptions, increasing costs for energy, temporary plant and/or power outages, information technology systems and network disruptions, cyber-security breaches, terrorist attacks, armed conflicts, war, pandemic diseases, fires, floods or other catastrophic events, could seriously harm Valvoline’s operations, as well as the operations of Valvoline’s customers and suppliers, and may adversely impact Valvoline’s financial performance. Although it is impossible to predict the occurrence or consequences of any such events, they could result in reduced demand for Valvoline’s products; make it difficult or impossible for Valvoline to manufacture its products, deliver products and services to its customers, or receive raw materials from suppliers; lead to increased costs of raw materials; or create delays and inefficiencies in the supply chain. In addition to leading to a serious disruption of Valvoline’s businesses, a catastrophic event at one of Valvoline’s facilities or involving its products or employees could lead to substantial legal liability to or claims by parties allegedly harmed by the event.
While Valvoline maintains business continuity plans that are intended to allow it to continue operations or mitigate the effects of events that could disrupt its business, Valvoline cannot provide assurances that its plans would fully protect it from all such events. In addition, insurance maintained by Valvoline to protect against property damage, loss of business and other related consequences resulting from catastrophic events is subject to coverage limitations, depending on the nature of the risk insured. This insurance may not be sufficient to cover all of Valvoline’s damages or damages to others in the event of a catastrophe. In addition, insurance related to these types of risks may not be available now or, if available, may not be available in the future at commercially reasonable rates.
16
The business model for Valvoline’s Quick Lubes business, including its dependence on franchised oil change centers, presents a number of risks.
The Quick Lubes business, VIOC and Great Canadian Oil Change, is made up of an international network of both company-owned and franchised stores. Valvoline’s success relies in part on the financial success and cooperation of its franchisees. However, Valvoline has limited influence over their operations. Valvoline’s franchisees manage their businesses independently and are responsible for the day-to-day operations of approximately 63% of Quick Lube system stores as of September 30, 2018. Valvoline’s revenue and income growth from franchised stores are largely dependent on the ability of its franchisees to grow their sales. Valvoline’s franchisees may have limited or no sales growth, and Valvoline’s revenues and margins could be negatively affected as a result. In addition, if sales or business performance trends worsen for franchisees, their financial results may deteriorate, which could result in, among other things, store closures, delayed or reduced payments to Valvoline and reduced growth in the number of Quick Lube stores.
Valvoline’s success also depends on the willingness and ability of its independent franchisees to implement major initiatives, which may require additional investment by them, and remain aligned with Valvoline on operating, promotional and capital-intensive reinvestment plans. The ability of Valvoline’s franchisees to contribute to the achievement of Valvoline’s overall plans is dependent in large part on the availability of funding to its franchisees at reasonable interest rates and may be negatively impacted by the financial markets in general or the creditworthiness of individual franchisees.
Valvoline’s operating performance and reputation could also be negatively impacted if its independent franchisees experience service failures or otherwise operate in a manner that projects a brand image inconsistent with Valvoline’s values, particularly if Valvoline’s contractual and other rights and remedies are limited, costly to exercise or subject to litigation. If Valvoline’s franchisees do not successfully operate Quick Lube stores in a manner consistent with Valvoline’s standards, Valvoline’s brand, image and reputation could be harmed, which in turn could negatively impact its business and operating results. Although Valvoline should not be liable for the acts of its independently owned franchisees, it is possible that a court may not recognize the legal distinction between Valvoline and its franchisees and hold Valvoline liable for a franchisee’s violation of applicable laws or regulations.
The ownership mix of company-owned and franchised Quick Lube stores also affects Valvoline’s results and financial condition. The decision to own stores or to operate under franchise or license agreements is driven by a large number of factors with a complex and changing interrelationship. The size of Valvoline’s largest franchisees creates additional risk due to Valvoline’s dependence on their particular growth, financial and operating performance and cooperation and alignment with Valvoline’s initiatives.
Valvoline is the primary supplier of products to all Quick Lube stores. The growth and performance of Valvoline’s lubricants and other product lines depends in large part on the performance of its Quick Lubes business, potentially amplifying the negative effect of the other risks related to the Quick Lubes business model. Poor performance by Quick Lube stores would negatively impact revenues and income for other Valvoline reporting segments.
The impact of changing laws or regulations or the manner of interpretation or enforcement of existing laws or regulations could adversely impact Valvoline’s financial performance and restrict its ability to operate its business or execute its strategies.
New laws or regulations, or changes in existing laws or regulations or the manner of their interpretation or enforcement, could increase Valvoline’s cost of doing business and restrict its ability to operate its business or execute its strategies. This risk includes, among other things, regulations related to the protection and use of private information of its employees and customers, regulations issued by the U.S. Federal Trade Commission (and analogous non-U.S. agencies) affecting Valvoline and its customers and compliance with the EU’s Registration, Evaluation, Authorisation and Restriction of Chemicals, or REACH regulation (and analogous non-EU initiatives). In addition, compliance with laws and regulations is complicated by Valvoline’s substantial and growing global footprint, which will require significant and additional resources to ensure compliance with applicable laws and regulations in the more than 140 countries where Valvoline conducts business.
Valvoline’s global operations expose it to trade and economic sanctions and other restrictions imposed by the United States, the European Union and other governments and organizations. The U.S. Departments of Justice, Commerce, State and Treasury and other federal agencies and authorities have a broad range of civil and criminal penalties they may seek to impose against corporations and individuals for violations of economic sanctions laws, export control laws, the Foreign Corrupt Practices Act (the “FCPA”) and other federal statutes and regulations, including those established by the Office of Foreign Assets Control (“OFAC”). Under these laws and regulations, as well as other anti-corruption laws, anti-money-laundering laws, export control laws, customs laws, sanctions laws and other laws governing Valvoline’s operations, various government agencies may require export licenses, may seek to impose modifications to business practices, including cessation of business activities in sanctioned countries or with sanctioned persons or entities and modifications to compliance programs, which may increase compliance costs, and may subject Valvoline to fines, penalties and other sanctions. A violation of these laws or regulations could adversely impact Valvoline’s business, results of operations and financial condition.
17
Although Valvoline has implemented policies and procedures in these areas, it cannot be sure that its policies and procedures are sufficient or that directors, officers, employees, representatives, distributors, consultants and agents have not engaged and will not engage in conduct for which Valvoline may be held responsible, nor can Valvoline be sure that its business partners have not engaged and will not engage in conduct that could materially affect their ability to perform their contractual obligations to Valvoline or even result in its being held liable for such conduct. Violations of the FCPA, OFAC restrictions or other export control, anti-corruption, anti-money-laundering and anti-terrorism laws or regulations may result in severe criminal or civil sanctions, and Valvoline may be subject to other liabilities, which could have a material adverse effect on its business, financial condition, cash flows and results of operations.
Data protection requirements could increase operating costs and requirements and a breach in information privacy or other related risks could negatively impact operations.
Valvoline is subject to federal, state, and non-U.S. laws, directives, and regulations relating to the collection, use, retention, disclosure, security and transfer of personal data relating to its customers and employees. These laws, directives and regulations, and their interpretation and enforcement continue to evolve and may be inconsistent from jurisdiction to jurisdiction. For example, the General Data Protection Regulation (“GDPR”), which went into effect in the European Union on May 25, 2018, applies to all of Valvoline’s activities conducted from an establishment in the European Union and may also apply to related products and services that Valvoline offers to customers in the European Union. Complying with the GDPR and similar emerging and changing privacy and data protection requirements may cause Valvoline to incur substantial costs. Noncompliance with these legal obligations relating to privacy and data protection could result in penalties, legal proceedings by governmental entities or others, and significant legal and financial exposure and could affect its ability to retain and attract customers. Any failure or perceived failure by Valvoline or any third parties with which it does business to comply with these laws, rules and regulations, or with other obligations to which Valvoline may be or become subject, may result in actions against Valvoline by governmental entities, private claims and litigation, fines, penalties or other liabilities. Any such action would be expensive to defend, damage Valvoline’s reputation and adversely affect business, operating results, financial position and cash flows.
Valvoline shares in ownership of joint ventures, which may limit its ability to manage third-party risks associated with these projects.
For financial or strategic reasons, Valvoline conducts a portion of its business through joint ventures.
Joint ventures, particularly Valvoline’s existing 50/50 joint ventures with Cummins in India and China, are an important part of its growth strategy internationally.
In these joint ventures, Valvoline shares influence over the operation of the joint venture and its assets, but does not have a controlling interest or vote. Therefore, joint ventures may involve risks such as the possibility that a joint venture partner in an investment might become bankrupt, be unable to meet its capital contribution obligations, have economic or business interests or goals that are inconsistent with Valvoline's business interests or goals, or take actions that are contrary to Valvoline's direction or to applicable laws and regulations.
If Valvoline’s relationship with one of its joint venture partners were to deteriorate, it could negatively impact Valvoline’s ability to achieve its growth goals internationally.
In addition, joint venture partners could take actions binding on the joint venture without Valvoline's consent, or Valvoline may be unable to take action without the concurrence of its joint venture partners. Consequently, actions by the joint venture, joint venture partner or other third-party could expose Valvoline to claims for damages, financial penalties and reputational harm, any of which could have an adverse effect on its business and operations. Although joint ventures may generate positive cash flow, in some cases they may be unable or unwilling to distribute that cash to the joint venture partners.
Imposition of new taxes, disagreements with tax authorities or additional tax liabilities could adversely affect Valvoline’s business, financial condition, reputation or results of operations.
Valvoline’s products are made, manufactured, distributed or sold in more than 140 countries and territories. As such, Valvoline is subject to a myriad of tax laws and regulations applicable in those countries and territories, as well as those of the United States and its various state and local governments. Economic and political pressure to increase tax revenues in jurisdictions where Valvoline operates or does business, or the adoption of new or reformed tax regulations, may make resolving tax disputes more difficult, and the final resolution of tax audits and any related litigation may differ from historical provisions and accruals resulting in an adverse impact on Valvoline’s business, financial condition, reputation or results of operations. Changes in how United States multinational corporations are taxed on earnings, including changes in interpretations and the issuance of additional guidance surrounding recently enacted U.S. tax reform legislation, could adversely affect Valvoline’s business, financial condition or results of operations.
Valvoline may fail to adequately protect its intellectual property rights or may be accused of infringing the intellectual property rights of third parties.
Valvoline relies heavily upon its trademarks, domain names and logos to market its brands and to build and maintain brand loyalty and recognition, as well as upon trade secrets. Valvoline also relies on a combination of laws and contractual restrictions with employees, customers, suppliers, affiliates and others, to establish and protect its various intellectual property rights. For example, Valvoline has generally registered and continues to register and renew, or secure by contract where appropriate, trademarks and
18
service marks as they are developed and used, and reserve, register and renew domain names as appropriate. Effective trademark protection may not be available or may not be sought in every country in which Valvoline’s products are made available and contractual disputes may affect the use of marks governed by private contract. Similarly, not every variation of a domain name may be available to or be registered by Valvoline, even if available.
Valvoline generally seeks to apply for patents or for other similar statutory protections as and if it deems appropriate, based on then-current facts and circumstances, and will continue to do so in the future. No assurances can be given that any patent application Valvoline has filed or will file will result in a patent being issued, or that any existing or future patents will afford adequate or meaningful protection against competitors or against similar technologies. In addition, no assurances can be given that third parties will not create new products or methods that achieve similar results without infringing upon patents Valvoline owns. Furthermore, the terms of patents are finite and the patents that Valvoline owns will eventually expire after the statutory term of patent protection ends in the jurisdiction where such patents are issued.
Despite these measures, Valvoline’s intellectual property rights may still not be protected in a meaningful manner, challenges to contractual rights could arise and third parties could copy or otherwise obtain and use Valvoline’s intellectual property without authorization, including its trade secrets and other confidential intellectual property. The occurrence of any of these events could result in the erosion of Valvoline’s brands and limit its ability to market its brands using its various trademarks, cause Valvoline to lose such trade secrets, as well as impede its ability to effectively compete against competitors with similar products and services, any of which could adversely affect its business, financial condition and results of operations.
From time to time, Valvoline has been subject to legal proceedings and claims, including claims of alleged infringement of trademarks, copyrights, patents and other intellectual property rights held by third parties. In the future, third parties may sue Valvoline for alleged infringement of their proprietary or intellectual property rights. Valvoline may not be aware of whether its products do or will infringe existing or future patents or other intellectual property rights of others. In addition, litigation may be necessary to enforce Valvoline’s intellectual property rights, protect its trade secrets or determine the validity and scope of proprietary rights claimed by others. Any litigation or other intellectual property proceedings of this nature, regardless of outcome or merit, could result in substantial costs and diversion of management and technical resources, or loss of rights in Valvoline’s intellectual property, any of which could adversely affect Valvoline’s business, financial condition and results of operations.
Valvoline’s substantial indebtedness may adversely affect its business, results of operations and financial condition.
Valvoline has substantial indebtedness and financial obligations. As of September 30, 2018, Valvoline had outstanding indebtedness of approximately $1.3 billion, with a borrowing capacity remaining of $328 million.
Valvoline may incur substantial additional debt from time to time to finance working capital, capital expenditures, investments or acquisitions, or for other general corporate purposes. Valvoline's substantial indebtedness could adversely affect its business, results of operations and financial condition by, among other things:
|
•
|
requiring Valvoline to dedicate a substantial portion of its cash flow from operations to pay principal and interest on its debt, which would reduce the availability of its cash flow to fund working capital, capital expenditures, acquisitions, execution of its growth strategy and other general corporate purposes;
|
|
•
|
limiting Valvoline’s ability to borrow additional amounts to fund working capital, capital expenditures, acquisitions, debt service requirements, execution of its growth strategy and other purposes;
|
|
•
|
making Valvoline more vulnerable to adverse changes in general economic, industry and regulatory conditions and in its business by limiting its flexibility in planning for, and making it more difficult for it to react quickly to, changing conditions;
|
|
•
|
placing Valvoline at a competitive disadvantage compared with its competitors that have less debt and lower debt service requirements;
|
|
•
|
making Valvoline more vulnerable to increases in interest rates since some of its indebtedness is subject to variable rates of interest; and
|
|
•
|
making it more difficult for Valvoline to satisfy its financial obligations.
|
In addition, Valvoline may not be able to generate sufficient cash flow from its operations to repay its indebtedness when it becomes due and to meet its other cash needs. If Valvoline is not able to pay its debts as they become due, it could be in default under the terms of its indebtedness. Valvoline might also be required to pursue one or more alternative strategies to repay indebtedness, such as selling assets, refinancing or restructuring its indebtedness or selling additional debt or equity securities. Valvoline may not be able to refinance its debt or sell additional debt or equity securities or its assets on favorable terms, if at all, and if it must sell its assets, it may negatively affect Valvoline’s ability to generate revenues.
19
If Valvoline is unable to access the capital markets or obtain bank credit, its financial position, growth plans, liquidity and results of operations could be negatively impacted.
Valvoline is dependent on a stable, liquid, and well-functioning financial system to fund its operations and capital investments. In particular, Valvoline may rely on the public and private debt and equity markets to fund portions of its capital investments and the commercial paper market and bank credit facilities to fund seasonal needs for working capital. Valvoline’s access to these markets depends on multiple factors including the condition of the capital markets, Valvoline’s operating performance and credit ratings. If rating agencies lower Valvoline’s credit ratings, it could adversely impact Valvoline’s ability to access the debt markets, its cost of funds and other terms for new debt issuances. Each of the credit rating agencies reviews its rating periodically, and there is no guarantee Valvoline’s current credit rating will remain the same.
Valvoline’s pension and other postretirement benefit plan obligations are currently underfunded, and Valvoline may have to make significant cash payments to some or all of these plans, which would reduce the cash available for its businesses.
In connection with Valvoline’s separation from Ashland, Valvoline assumed certain of Ashland’s historical pension and other postretirement benefit plans and related liabilities. The funded status of Valvoline's pension plans is dependent upon many factors, including returns on invested assets, the level of certain market interest rates and the discount rate used to determine pension obligations. Though Valvoline has taken a number of actions in fiscal 2018 and 2017 to reduce the risk and volatility associated with the most significant of these plans, the U.S. qualified plan, changing market conditions or laws and regulations could require material increases in our expected cash contributions to our pension plans in future years. Specifically, unfavorable returns on plan assets or unfavorable changes in applicable laws or regulations could materially change the timing and amount of required plan funding, which would reduce the cash available for Valvoline’s businesses. In addition, a decrease in the discount rate used to determine pension obligations could result in an increase in the valuation of pension obligations, which could affect the reported funded status of Valvoline’s pension plans and future contributions. Similarly, an increase in discount rates could increase the periodic pension cost in subsequent fiscal years. Valvoline’s policy to recognize changes in the fair value of the pension assets and liabilities annually and as otherwise required through mark to market accounting could result in volatility in Valvoline’s results of operations, which could be material. In addition, Valvoline’s pension and other postretirement benefit plan obligations are currently underfunded, and Valvoline may have to make significant cash payments to some or all of these plans, which would reduce the cash available for its businesses.
Under the Employee Retirement Income Security Act of 1974, as amended, the Pension Benefit Guaranty Corporation (“PBGC”) has the authority to terminate an underfunded tax-qualified pension plan under limited circumstances. In the event Valvoline’s tax-qualified pension plans are terminated by the PBGC, Valvoline could be liable to the PBGC for some portion of the underfunded amount.
Valvoline is responsible for, and has financial exposure to, liabilities from pending and threatened claims which could adversely impact its results of operations and cash flow.
There are various claims, lawsuits and administrative proceedings pending or threatened against Valvoline. Such actions are with respect to commercial matters, false advertising, product liability, toxic tort liability and other matters that seek remedies or damages, some of which are for substantial amounts. While these actions are being contested, their outcome is not predictable. Valvoline’s results could be adversely affected by financial exposure to these liabilities. Valvoline could also be subject to additional legal proceedings in the future that may adversely affect its business, including administrative proceedings, class actions, employment and personal injury claims, disputes with current or former suppliers, claims by current or former franchisees and intellectual property claims.
Insurance maintained by Valvoline to protect against claims for damages alleged by third parties is subject to coverage limitations, depending on the nature of the risk insured. This insurance may not be sufficient to cover all of Valvoline’s liabilities to others. In addition, insurance related to these types of risks may not be available now or, if available, may not be available in the future at commercially reasonable rates.
Valvoline’s business exposes it to potential product liability claims and recalls, false advertising claims and other claims, which could adversely affect its financial condition and performance.
The development, manufacture and sale of automotive, commercial and industrial lubricants and automotive chemicals and the provision of automotive maintenance services involve an inherent risk of exposure to product liability claims, false advertising claims, product recalls, workplace exposure, product seizures and related adverse publicity. A product liability claim, false advertising claim or related judgment against the Company could also result in substantial and unexpected expenditures, affect consumer or customer confidence in Valvoline’s products and services, and divert management’s time and attention from other responsibilities. Although Valvoline maintains product and general liability insurance, there can be no assurance that the type or level of coverage it has is adequate or that it will be able to continue to maintain its existing insurance or obtain comparable insurance at a reasonable cost, if at all. A product recall or a partially or completely uninsured product liability, false advertising or other judgment against Valvoline could have a material adverse effect on its reputation, results of operations and financial condition.
20
Valvoline has incurred, and will continue to incur, costs as a result of EHS and hazardous substances liabilities and related compliance requirements. These costs could adversely impact Valvoline’s cash flow, its results of operations or financial condition.
Valvoline is subject to extensive federal, state, local and non-U.S. laws, regulations, rules and ordinances relating to pollution, protection of the environment and human health and safety, as well as the generation, storage, handling, treatment, disposal and remediation of hazardous substances and waste materials. Valvoline has incurred, and will continue to incur, costs and capital expenditures to comply with these laws and regulations.
EHS regulations change frequently, and such regulations and their enforcement have tended to become more stringent over time. Accordingly, changes in EHS laws and regulations and the enforcement of such laws and regulations could interrupt Valvoline’s operations, require modifications to its facilities or cause it to incur significant liabilities, costs or losses that could adversely affect its profitability. Actual or alleged violations of EHS laws and regulations could result in restrictions or prohibitions on plant operations as well as substantial damages, penalties, fines, civil or criminal sanctions and remediation costs.
Valvoline’s business involves the production, storage and transportation of hazardous substances. Under some environmental laws, Valvoline may be strictly liable and/or jointly and severally liable for environmental damages caused by releases of hazardous substances and waste materials into the environment. For instance, under relevant laws and regulations Valvoline may be deemed liable for soil and/or groundwater contamination at sites it currently owns and/or operates even though the contamination was caused by a third party such as a former owner or operator, and at sites it formerly owned and operated if the release of hazardous substances or waste materials was caused by it or by a third party during the period it owned and/or operated the site. Valvoline also may be deemed liable for soil and/or groundwater contamination at sites to which it sent hazardous wastes for treatment or disposal, notwithstanding that the original treatment or disposal activity accorded with all applicable regulatory requirements.
Valvoline is subject to payment-related risks for company-owned and franchised Quick Lube stores.
At company-owned and franchised Quick Lube stores, Valvoline accepts a variety of payment methods, including credit cards and debit cards. Accordingly, Valvoline is, and will continue to be, subject to significant and evolving regulations and compliance requirements, including obligations to implement enhanced authentication processes that could result in increased costs, reduce the ease of use of certain payment methods and expand liability for Valvoline. For certain payment methods, including credit and debit cards, Valvoline pays interchange and other fees, which may increase over time. Valvoline relies on independent service providers for payment processing, including credit and debit cards. If these independent service providers become unwilling or unable to provide these services to Valvoline, or if the cost of using these providers increases, Valvoline’s business could be harmed. Valvoline is also subject to payment card association operating rules, including data security rules, certification requirements and rules governing electronic funds transfers, which could change or be reinterpreted to make it difficult or impossible for Valvoline to comply. If Valvoline fails to comply with these rules or requirements, or if its data security systems are breached or compromised, Valvoline may be liable for losses incurred by card issuing banks or consumers, subject to fines and higher transaction fees, lose its ability to accept credit and debit card payments from its customers or process electronic fund transfers or facilitate other types of payments and its brand, business and results of operations could be significantly harmed.
Failure to maintain effective internal controls in accordance with Section 404 of Sarbanes- Oxley could have a material adverse effect on Valvoline’s business and stock price.
As a public company, Valvoline is subject to Section 404 of the Sarbanes-Oxley Act of 2002 (“Sarbanes-Oxley”), which requires annual assessments by Valvoline’s management of the effectiveness of Valvoline’s internal control over financial reporting and annual reports by Valvoline’s independent registered public accounting firm that address the effectiveness of internal control over financial reporting. During the course of annual testing, Valvoline may identify deficiencies or material weaknesses which it may not be able to remediate in time to meet its deadline for compliance with Section 404. Testing and maintaining internal control can divert management’s attention from other matters that are important to the operation of Valvoline’s business. Valvoline may not be able to conclude on an ongoing basis that it has effective internal control over financial reporting in accordance with Section 404 or Valvoline’s independent registered public accounting firm may not be able or willing to issue an unqualified report on the effectiveness of Valvoline’s internal control over financial reporting. If Valvoline concludes that its internal control over financial reporting is not effective in any annual assessment, Valvoline cannot be certain as to the timing of completion of its evaluation, testing and remedial actions or their effect on its operations. If either Valvoline is unable to conclude that it has effective internal control over financial reporting or its independent auditors are unable to provide it with an unqualified report as required by Section 404 in any annual assessment, then investors could lose confidence in Valvoline’s reported financial information, which could have a negative effect on the trading price of Valvoline's stock.
21
Risks related to Valvoline’s separation from Ashland
The Distribution could result in significant tax liability to Ashland, and in certain circumstances, Valvoline could be required to indemnify Ashland for material taxes pursuant to indemnification obligations under the Tax Matters Agreement.
Ashland obtained a written opinion of counsel to the effect that the Distribution should qualify for non-recognition of gain and loss under Section 355 of the Internal Revenue Code of 1986, as amended (the “Code”). The opinion of counsel does not address any U.S. state, local or non-U.S. tax consequences of the Distribution. The opinion assumes that the Distribution is completed according to the terms of the Separation Agreement entered into between Ashland and Valvoline (the “Separation Agreement”) and relies on the facts as described in the Separation Agreement, the Tax Matters Agreement, other ancillary agreements, the information statement distributed to Ashland’s shareholders in connection with the Distribution and a number of other documents. In addition, the opinion is based on certain representations as to factual matters from, and certain covenants by, Ashland and Valvoline. The opinion cannot be relied on if any of the assumptions, representations or covenants is incorrect, incomplete or inaccurate or is violated in any material respect.
The opinion of counsel is not binding on the Internal Revenue Service (the “IRS”) or the courts, and thus there can be no assurance that the IRS or a court will not take a contrary position. Ashland has not requested, and does not intend to request, a ruling from the IRS regarding the U.S. federal income tax consequences of the Distribution.
If the Distribution were determined not to qualify for non-recognition of gain and loss, then Ashland would recognize a gain as if it had sold its Valvoline common stock in a taxable transaction in an amount up to the fair market value of the common stock it distributed in the Distribution. In addition, certain reorganization transactions undertaken in connection with the separation and the Distribution could be determined to be taxable, which could result in additional taxable gain. Under certain circumstances set forth in the Tax Matters Agreement, Valvoline could have a substantial indemnification obligation to Ashland with respect to the tax associated with some or all of such gain, which could have a material adverse impact on Valvoline's financial condition.
Valvoline could have an indemnification obligation to Ashland if events or actions subsequent to the Distribution cause the Distribution to be taxable.
If, due to breaches of covenants that Valvoline has agreed to in connection with the Separation Agreement or the Distribution, it were determined that the Distribution did not qualify for non-recognition of gain and loss, Valvoline could be required to indemnify Ashland for the resulting taxes (and reasonable expenses). In addition, Section 355(e) of the Code generally creates a presumption that the Distribution would be taxable to Ashland, but not to its shareholders, if Valvoline or its shareholders were to engage in transactions that result in a 50% or greater change (by vote or value) in the ownership of Valvoline’s stock during the four-year period beginning on the date that begins two years before the date of the Distribution, which occurred on May 12, 2017, unless it were established that such transactions and the Distribution were not part of a plan or series of related transactions. If the Distribution were taxable for U.S. federal income tax purposes to Ashland due to a breach of Valvoline’s covenants or a 50% or greater change in the ownership of Valvoline’s stock during the aforementioned four-year period, Ashland would recognize gain as if it had sold Valvoline common stock in a taxable transaction in an amount up to the fair market value of the stock held by it immediately before the Distribution, and Valvoline generally would be required to indemnify Ashland for the tax on such gain and related expenses, as well as any additional gain in connection with certain reorganization transactions undertaken to effect the separation and the Distribution. Any such obligation could have a material impact on Valvoline’s financial condition.
Valvoline has agreed to numerous restrictions to preserve the tax-free nature of the Distribution, which may reduce its strategic and operating flexibility.
Valvoline agreed in the Tax Matters Agreement to covenants and indemnification obligations designed to preserve the tax-free nature of the Distribution. These covenants and indemnification obligations may limit Valvoline’s ability to pursue strategic transactions or engage in new businesses or other transactions that might be beneficial and could discourage or delay a strategic transaction that its shareholders may consider favorable.
Valvoline will have joint and several liability with Ashland for the consolidated U.S. federal income taxes of the Ashland consolidated group for the taxable periods in which Valvoline was part of the Ashland consolidated group. In addition, Valvoline has agreed to indemnify Ashland for certain pre-IPO U.S. taxes that arise on audit and are directly attributable to neither the Valvoline business nor Ashland’s specialty ingredients and performance materials businesses (collectively, the “Chemicals business”).
Valvoline and Ashland as well as their respective subsidiaries were part of U.S. federal consolidated group tax returns and certain combined or similar group tax returns (together, “Combined Tax Returns”) through the date of the Distribution. Therefore, Valvoline has joint and several liability with Ashland to the respective taxing authorities for the Combined Tax Returns for the periods up to and including the date of the Distribution.
22
Pursuant to the Tax Matters Agreement, Valvoline is required to indemnify Ashland for: (a) certain U.S. federal, state or local taxes of Ashland and/or its subsidiaries for any tax period ending on or prior to the (i) Distribution that arise on audit or examination and are directly attributable to Valvoline or (ii) IPO that arise on audit or examination and are directly attributable to neither the Valvoline business nor the Chemicals business; and (b) certain non-U.S. taxes of Ashland and/or its subsidiaries for any tax period ending on or prior to the Distribution that arise on audit or examination and are directly attributable to Valvoline.
The Tax Matters Agreement also requires Valvoline to indemnify Ashland for any taxes (and reasonable expenses) resulting from the failure of the Distribution to qualify for non-recognition of gain and loss or certain reorganization transactions related to the separation or the IPO and Distribution to qualify for their intended tax treatment (“Transaction Taxes”), where the taxes result from (1) breaches of representations or covenants that Valvoline made or agreed to in connection with these transactions, (2) the application of certain provisions of U.S. federal income tax law to the Distribution with respect to acquisitions of Valvoline common stock or (3) any other actions that Valvoline knows or reasonably should expect would give rise to such taxes.
The Tax Matters Agreement also requires Valvoline to indemnify Ashland for a portion of certain other taxes arising from the separation allocated to Valvoline generally based on Valvoline’s market capitalization relative to the market capitalization of Ashland at the time of the Distribution.
Valvoline has only been a stand-alone public company since September 2016 and fully separated from Ashland since May 2017, and its financial results are not necessarily representative of the results it would have achieved on a stand-alone basis prior to May 2017 and may not be a reliable indicator of its future results.
The historical financial information Valvoline has included in this Annual Report on Form 10-K include certain expenses of Ashland that were allocated or billed to Valvoline as an unincorporated business unit of Ashland for corporate functions, which included treasury, legal, accounting, insurance, information technology, payroll administration, human resources, stock incentive plans and other services. Valvoline believes the assumptions underlying the consolidated financial statements, including the assumptions regarding allocated expenses, reasonably reflect the utilization of services provided to or the benefit received during those periods. However, these shared expenses may not represent what Valvoline’s financial position, results of operations or cash flows would have been had it operated autonomously or independently from Ashland during those periods. Actual costs that would have been incurred if Valvoline had been a stand-alone company would depend on multiple factors, including organizational structure and strategic decisions in various areas, such as information technology and infrastructure.
In addition, the historical financial information Valvoline has included in this Annual Report on Form 10-K does not reflect what its financial position, results of operations or cash flows would have been had it been a stand-alone entity during the historical periods presented, or what its financial position, results of operations or cash flows will be in the future as an independent entity.
Ashland has agreed to indemnify Valvoline for certain liabilities. However, there can be no assurance that the indemnity will be sufficient to insure Valvoline against the full amount of such liabilities, or that Ashland’s ability to satisfy its indemnification obligation will not be impaired in the future.
Pursuant to the Separation Agreement and certain other agreements with Ashland, Ashland agreed to indemnify Valvoline for certain liabilities. However, third parties could also seek to hold Valvoline responsible for any of the liabilities that Ashland agreed to retain, and there can be no assurance that the indemnity from Ashland will be sufficient to protect Valvoline against the full amount of such liabilities, or that Ashland will be able to fully satisfy its indemnification obligations in the future. Even if Valvoline ultimately succeeded in recovering from Ashland any amounts for which Valvoline is held liable, Valvoline may be temporarily required to bear these losses. Each of these risks could negatively affect Valvoline’s business, financial position, results of operations and cash flows.
Valvoline’s inability to resolve favorably any disputes that arise between Valvoline and Ashland with respect to their past and ongoing relationships may adversely affect its operating results.
Disputes may arise between Ashland and Valvoline in a number of areas relating to their past and ongoing relationships, including:
|
•
|
labor, tax, employee benefit, indemnification and other matters arising from Valvoline’s separation from Ashland;
|
|
•
|
employee retention and recruiting;
|
|
•
|
business combinations involving Valvoline; and
|
|
•
|
the nature, quality and pricing of services that Valvoline and Ashland have agreed to provide each other.
|
Valvoline may not be able to resolve potential conflicts, and even if it does, the resolution may not be favorable. The agreements Valvoline entered into with Ashland may be amended upon agreement between the parties.
23
None.
24
Valvoline’s corporate headquarters is located in Lexington, Kentucky. Valvoline owns or leases approximately 40 facilities throughout North America, Europe, Australia, and Asia that comprise over 2 million square feet of blending, packaging, distribution, warehouse, research and development and office space. In addition, Valvoline owns or leases the property associated with 462 quick lubes stores under the VIOC brand throughout the United States. The properties leased by Valvoline have expiration dates ranging from less than one year to more than 25 years (including certain renewal options).
The following table provides a summary of Valvoline’s principal owned and leased facilities:
|
Approx. Area
|
|||||||
|
Location
|
|
(Sq. Ft.)
|
|
Principal Use
|
|||
|
Lexington, Kentucky
|
|
|
|
187,000
|
|
|
Corporate Headquarters and Research & Development
|
|
West Chester, Ohio
|
320,000
|
Warehouse and Distribution
|
|||||
|
Dordrecht, Netherlands
|
|
|
|
150,000
|
|
|
Blending, Packaging & Warehouse
|
|
Santa Fe Springs, California
|
|
|
|
149,000
|
|
|
Blending, Packaging & Warehouse
|
|
Leetsdale, Pennsylvania
|
|
|
|
125,000
|
|
|
Warehouse and Distribution
|
|
Cincinnati, Ohio
|
|
|
|
125,000
|
|
|
Blending, Packaging & Warehouse
|
|
Willow Springs, Illinois
|
|
|
|
95,000
|
|
|
Blending, Packaging & Warehouse
|
|
Freedom (Rochester), Pennsylvania
|
|
|
|
90,000
|
|
|
Blending, Packaging & Warehouse
|
|
Deer Park, Texas
|
|
|
|
87,000
|
|
|
Blending, Packaging & Warehouse
|
|
St. Louis, Missouri
|
|
|
|
78,000
|
|
|
Blending, Packaging & Warehouse
|
|
Mississauga, Canada
|
|
|
|
63,000
|
|
|
Blending, Packaging & Warehouse
|
|
Sydney, Australia
|
|
|
|
60,000
|
|
|
Blending, Packaging & Warehouse
|
|
Atlanta, Georgia
|
60,000
|
Blending, Packaging & Warehouse
|
|||||
In addition, throughout North America, Valvoline contracts with third parties to provide blending, packaging, warehousing and distribution services. Valvoline believes its physical properties are suitable and adequate for the Company’s business, and none of the property owned by Valvoline is subject to any major known encumbrances. Additional information regarding certain lease obligations may be found in Note 11 of the Notes to Consolidated Financial Statements in Item 8 of Part II of this Annual Report on Form 10-K.
From time to time, Valvoline is party to lawsuits, claims and other legal proceedings that arise in the ordinary course of business. Many of these legal matters involve complex issues of law and fact and may proceed for protracted periods of time. The Company’s legal proceedings are reviewed on an ongoing basis to establish liabilities for the outcome of such matters where losses are determined to be probable and reasonably estimable and to provide disclosure of matters for which management believes a material loss is at least reasonably possible. There are certain claims and legal proceedings pending where loss is not determined to be probable or reasonably estimable, and therefore, accruals have not been made. As disclosed within the Notes to Consolidated Financial Statements included in Item 8 of Part II of this Annual Report on Form 10-K, the Company believes it has established adequate accruals for liabilities that are probable and reasonably estimable.
Although the ultimate resolution of these matters cannot be predicted with certainty and there can be no assurances that the actual amounts required to satisfy liabilities from these matters will not exceed the amounts reflected in the consolidated financial statements, based on information available at this time and taking into account established accruals for estimated liabilities, it is the opinion of management that such pending claims or proceedings are not reasonably likely to have a material adverse effect on its financial position, results of operations, or cash flows.
Not applicable.
25
Market information
Valvoline common stock is listed on the NYSE and trades under the symbol “VVV.” Valvoline’s common stock also has trading privileges on NASDAQ. Prior to September 23, 2016, the pricing date of the IPO, there was no public market for Valvoline’s common stock.
As of November 16, 2018, there were approximately 10,500 holders of Valvoline common stock.
Dividend policy
Valvoline expects to continue to pay quarterly cash dividends to the holders of its common stock; however, the declaration and payment of dividends to holders of Valvoline common stock will be at the discretion of the Board in accordance with applicable law after taking into account various factors, including Valvoline’s financial condition, operating results, current and anticipated cash needs, cash flows, impact on Valvoline’s effective tax rate, indebtedness, legal requirements and other factors that the Board considers relevant. In addition, the instruments governing Valvoline’s indebtedness may limit its ability to pay dividends. Therefore, no assurance is given that Valvoline will pay any dividends to its stockholders, or as to the amount of any such dividends if the Board determines to do so.
Stock performance graph
The following graph compares the cumulative total stockholder return on a $100 investment in Valvoline common stock, the S&P Mid Cap 400 Index and the S&P Mid Cap 400 Consumer Staples Index for the period from September 30, 2016 (following the IPO) to September 30, 2018. This graph assumes an investment in the Valvoline common stock and each index were $100 on
September 30, 2016 and that all dividends were reinvested.
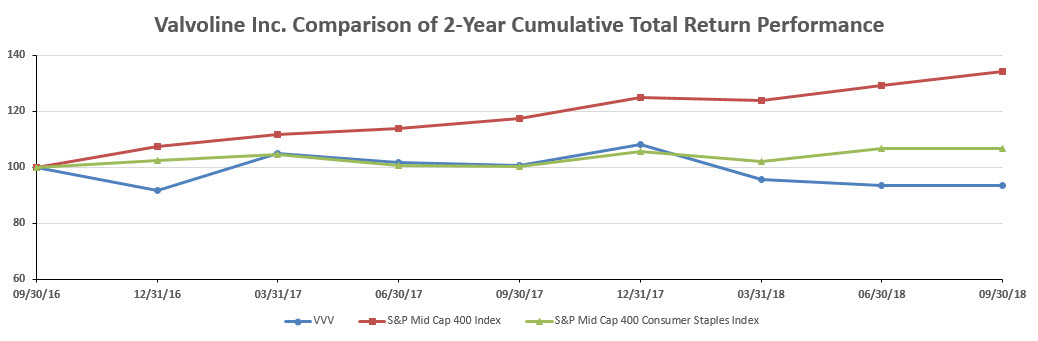
|
Comparison of cumulative total returns
|
9/30/2016
|
9/30/2017
|
9/30/2018
|
|||||||||
|
Valvoline Inc.
|
$
|
100
|
|
$
|
101
|
|
$
|
94
|
|
|||
|
S&P Mid Cap 400 Index
|
$
|
100
|
|
$
|
118
|
|
$
|
134
|
|
|||
|
S&P Mid Cap 400 Consumer Staples Index
|
$
|
100
|
|
$
|
100
|
|
$
|
107
|
|
|||
26
Purchases of Company common stock
During the three months ended September 30, 2018, the Company repurchased 4.6 million shares of its common stock for $101 million pursuant to the Board of Directors authorization on January 31, 2018 to repurchase up to $300 million of common stock through September 30, 2020. As of September 30, 2018, $75 million remains available for share repurchases under this authorization.
Share repurchase activity during the three months ended September 30, 2018 was as follows:
|
Monthly period
|
Total number of shares purchased
(1)
|
Average price paid per share
|
Total number of shares purchased a part of publicly announced plans or programs
|
Dollar value of shares that may yet be purchased under the plans or programs (in millions)
(2)
|
||||||||||
|
July 1, 2018 to July 31, 2018
|
1,950,068
|
|
$
|
21.81
|
|
1,935,711
|
|
$
|
133
|
|
||||
|
August 1, 2018 to August 31, 2018
|
2,289,122
|
|
$
|
21.56
|
|
2,289,122
|
|
$
|
84
|
|
||||
|
September 1, 2018 to September 30, 2018
|
410,666
|
|
$
|
21.65
|
|
410,666
|
|
$
|
75
|
|
||||
|
Total
|
4,649,856
|
|
$
|
21.65
|
|
4,635,499
|
|
|||||||
|
(1)
|
Total number of shares purchased includes both shares repurchased under the Board of Directors authorization described above, as well as vested restricted stock awards purchased to cover withholding taxes.
|
|
(2)
|
Further information regarding the Company’s share repurchases can be found in Note 17 to Consolidated Financial Statements in Item 8 of Part II of this Annual Report on Form 10-K.
|
27
|
Valvoline Inc. and Consolidated Subsidiaries
|
||||||||||||||||||||
|
Five-Year Selected Financial Information
(a)
|
||||||||||||||||||||
|
For the years ended September 30
|
||||||||||||||||||||
|
(In millions except per share data)
|
2018
|
2017
|
2016
|
2015
|
2014
|
|||||||||||||||
|
Summary of operations
|
||||||||||||||||||||
|
Sales
|
$
|
2,285
|
|
$
|
2,084
|
|
$
|
1,929
|
|
$
|
1,967
|
|
$
|
2,041
|
|
|||||
|
Gross profit
|
$
|
806
|
|
$
|
776
|
|
$
|
748
|
|
$
|
700
|
|
$
|
648
|
|
|||||
|
Operating income
|
$
|
395
|
|
$
|
394
|
|
$
|
396
|
|
$
|
360
|
|
$
|
316
|
|
|||||
|
Net income
(b)
|
$
|
166
|
|
$
|
304
|
|
$
|
273
|
|
$
|
196
|
|
$
|
173
|
|
|||||
|
Common stock information
|
||||||||||||||||||||
|
Basic earnings per share
(c)
|
$
|
0.84
|
|
$
|
1.49
|
|
$
|
1.60
|
|
$
|
1.15
|
|
$
|
1.02
|
|
|||||
|
Diluted earnings per share
(c)
|
$
|
0.84
|
|
$
|
1.49
|
|
$
|
1.60
|
|
$
|
1.15
|
|
$
|
1.02
|
|
|||||
|
Dividends per common share
|
$
|
0.30
|
|
$
|
0.20
|
|
$
|
—
|
|
$
|
—
|
|
$
|
—
|
|
|||||
|
Cash flow information
|
||||||||||||||||||||
|
Cash flows from operating activities
|
$
|
320
|
|
$
|
(130
|
)
|
$
|
311
|
|
$
|
330
|
|
$
|
170
|
|
|||||
|
Less: Additions to property, plant and equipment
|
(93
|
)
|
(68
|
)
|
(66
|
)
|
(45
|
)
|
(37
|
)
|
||||||||||
|
Plus: Discretionary contributions to pension plans
|
—
|
|
394
|
|
—
|
|
—
|
|
—
|
|
||||||||||
|
Free cash flow
(d)
|
$
|
227
|
|
$
|
196
|
|
$
|
245
|
|
$
|
285
|
|
$
|
133
|
|
|||||
|
As of September 30
|
||||||||||||||||||||
|
(In millions)
|
2018
|
2017
|
2016
|
2015
|
2014
|
|||||||||||||||
|
Balance sheet information
|
||||||||||||||||||||
|
Total assets
|
$
|
1,854
|
|
$
|
1,915
|
|
$
|
1,825
|
|
$
|
978
|
|
$
|
1,083
|
|
|||||
|
Long-term debt and capital lease obligations (including current portion)
|
$
|
1,342
|
|
$
|
1,075
|
|
$
|
749
|
|
$
|
4
|
|
$
|
4
|
|
|||||
|
Stockholders’ (deficit) equity
|
$
|
(358
|
)
|
$
|
(117
|
)
|
$
|
(330
|
)
|
$
|
617
|
|
$
|
725
|
|
|||||
|
For the years ended September 30
|
||||||||||||||||||||
|
Unaudited (In millions)
|
2018
|
2017
|
2016
|
2015
|
2014
|
|||||||||||||||
|
Other financial and operational data
|
||||||||||||||||||||
|
Lubricant sales volume (gallons)
|
181.9
|
|
179.7
|
|
174.5
|
|
167.4
|
|
162.6
|
|
||||||||||
|
Company-owned same-store sales growth
(e)
|
8.7
|
%
|
7.0
|
%
|
6.2
|
%
|
7.5
|
%
|
4.5
|
%
|
||||||||||
|
Franchised same-store sales growth
(e)(f)
|
8.0
|
%
|
7.5
|
%
|
8.0
|
%
|
7.8
|
%
|
5.5
|
%
|
||||||||||
|
Combined same-store sales growth
(e)(f)
|
8.3
|
%
|
7.4
|
%
|
7.5
|
%
|
7.7
|
%
|
5.2
|
%
|
||||||||||
|
EBITDA
(g)
|
$
|
449
|
|
$
|
574
|
|
$
|
468
|
|
$
|
335
|
|
$
|
301
|
|
|||||
|
Adjusted EBITDA
(g)
|
$
|
466
|
|
$
|
447
|
|
$
|
440
|
|
$
|
412
|
|
$
|
359
|
|
|||||
|
(a)
|
During the periods presented, Valvoline experienced certain changes in the composition of its assets and liabilities affecting the comparability of financial information between years. These changes include, but are not limited to, the Contribution of assets and liabilities from Ashland in fiscal 2016, an IPO in fiscal 2016, establishing a stand-alone capital structure in fiscal 2016, and the separation from Ashland in fiscal 2017.
|
|
(b)
|
Net income includes the impact of immediately recognizing actuarial gains and losses for defined benefit pension and other postretirement plan remeasurements. During the years ended September 30, Valvoline recognized a remeasurement loss of $38 million in 2018, a gain of $68 million in 2017, a gain of $18 million in 2016, a loss of $46 million in 2015, and a loss of $61 million in 2014.
|
|
(c)
|
The weighted average common shares outstanding for the years ended September 30, 2016, 2015 and 2014 are based on the 170 million shares issued to Ashland in the Contribution.
|
|
(d)
|
In addition to cash flows from operating activities determined in accordance with U.S. GAAP, Valvoline uses free cash flow as a non-GAAP metric of cash flow generation. By deducting capital expenditures from operating cash flows and adding discretionary contributions to pension plans, the Company is able to provide a better indication of the ongoing cash being generated that is ultimately available for both debt and equity holders as well as other investment opportunities. Unlike cash flow from operating activities, free cash flow includes the impact of capital expenditures, providing a more complete picture of cash generation. Free cash flow has certain limitations, including that it does not reflect adjustments for certain non-discretionary cash flows, such as mandatory debt repayments. The amount of mandatory versus discretionary expenditures can vary significantly between periods. Valvoline’s results of operations are presented based on its management structure and internal accounting practices. The structure and practices are specific to Valvoline; therefore, its financial results and free cash flow are not necessarily comparable with similar information for other comparable companies. Free cash flow has limitations as an analytical tool and should not be considered in isolation from, or as an alternative to, or more meaningful than, cash flows provided by operating activities as determined in accordance with U.S. GAAP. In evaluating free cash flow, be aware that in the future Valvoline may incur expenses similar to those for which adjustments are made in calculating free cash flow. Valvoline’s presentation of free cash flow should not be construed as a basis to infer that its future results will be unaffected by unusual or nonrecurring
|
28
items. Because of these limitations, one should rely primarily on cash flows provided by operating activities as determined in accordance with U.S. GAAP and use free cash flow only as a supplement.
|
(e)
|
Valvoline determines same-store sales growth on a fiscal year basis, with new stores excluded from the metric until the completion of their first full fiscal year in operation.
|
|
(f)
|
Valvoline franchisees are distinct legal entities and Valvoline does not consolidate the results of operations of its franchisees.
|
|
(g)
|
In addition to net income determined in accordance with U.S. GAAP, Valvoline evaluates operating performance using certain non-GAAP measures including Earnings before interest, taxes, depreciation and amortization (“EBITDA”), which management defines as net income/loss, plus income tax expense/benefit, net interest and other financing expenses, and depreciation and amortization; and Adjusted EBITDA, which Valvoline defines as EBITDA adjusted for key items and net pension and other postretirement plan income/expense. Key items consist of income or expenses associated with certain unusual, infrequent or non-operational income or expenses not directly attributable to the underlying business, which management believes impacts the comparability of operational results between periods and are also often related to legacy matters or market-driven events that do not have an immediate, corresponding impact on the Company’s ongoing performance. Key items may consist of adjustments related to: the impairment of an equity investment; legacy businesses, including the separation from Ashland and associated impacts of related indemnities; significant acquisitions or dispositions, restructuring-related matters, and other matters that are non-operational or unusual in nature. Net pension and other postretirement plan income/expense includes several elements impacted by changes in plan assets and obligations that are primarily driven by changes in the debt and equity markets, as well as those that are predominantly legacy in nature and related to prior service to the Company from employees (e.g., retirees, former employees, current employees with frozen benefits). These elements include (i) interest cost, (ii) expected return on plan assets, (iii) actuarial gains/losses, and (iv) amortization of prior service cost/credit. Significant factors that can contribute to changes in these elements include changes in discount rates used to remeasure pension and other postretirement obligations on an annual basis or upon a qualifying remeasurement, differences between actual and expected returns on plan assets, and other changes in actuarial assumptions, such as the life expectancy of plan participants. Accordingly, management considers that these elements are more reflective of changes in current conditions in global financial markets (in particular, interest rates) and are outside the operational performance of the business and are also primarily legacy amounts that are not directly related to the underlying business and do not have an immediate, corresponding impact on the compensation and benefits provided to eligible employees for current service. Adjusted EBITDA will continue to include pension and other postretirement service costs related to current employee service as well as the costs of other benefits provided to employees for current service.
|
Valvoline believes the use of non-GAAP measures on a consolidated and reportable segment basis assists investors in understanding the ongoing operating performance of its business by presenting comparable financial results between periods. The non-GAAP information provided is used by management and may not be comparable to similar measures disclosed by other companies, because of differing methods used by other companies in calculating EBITDA and Adjusted EBITDA. EBITDA and Adjusted EBITDA provide a supplemental presentation of Valvoline’s operating performance on a consolidated and reportable segment basis.
EBITDA and Adjusted EBITDA each have limitations as analytical tools and should not be considered in isolation from, or as an alternative to, or more meaningful than, net income as determined in accordance with U.S. GAAP. Because of these limitations, one should rely primarily on net income as determined in accordance with U.S. GAAP and use EBITDA and Adjusted EBITDA only as supplements. In evaluating EBITDA and Adjusted EBITDA, one should be aware that in the future Valvoline may incur expenses similar to those for which adjustments are made in calculating EBITDA and Adjusted EBITDA. Valvoline’s presentation of EBITDA and Adjusted EBITDA should not be construed as a basis to infer that future results will be unaffected by unusual or nonrecurring items.
The following table reconciles net income to EBITDA and Adjusted EBITDA for the periods presented.
|
For the years ended September 30
|
||||||||||||||||||||
|
(In millions)
|
2018
|
2017
|
2016
|
2015
|
2014
|
|||||||||||||||
|
Net income
|
$
|
166
|
|
$
|
304
|
|
$
|
273
|
|
$
|
196
|
|
$
|
173
|
|
|||||
|
Income tax expense
|
166
|
|
186
|
|
148
|
|
101
|
|
91
|
|
||||||||||
|
Net interest and other financing expenses
|
63
|
|
42
|
|
9
|
|
—
|
|
—
|
|
||||||||||
|
Depreciation and amortization
|
54
|
|
42
|
|
38
|
|
38
|
|
37
|
|
||||||||||
|
EBITDA
|
449
|
|
574
|
|
468
|
|
335
|
|
301
|
|
||||||||||
|
Net pension and other postretirement plan (income) expense
|
—
|
|
(138
|
)
|
(35
|
)
|
37
|
|
52
|
|
||||||||||
|
Legacy and separation-related expenses, net
|
14
|
|
11
|
|
6
|
|
—
|
|
—
|
|
||||||||||
|
Acquisition and divestiture-related losses
|
3
|
|
—
|
|
1
|
|
26
|
|
—
|
|
||||||||||
|
Impairment of equity investment
|
—
|
|
—
|
|
—
|
|
14
|
|
—
|
|
||||||||||
|
Restructuring
|
—
|
|
—
|
|
—
|
|
—
|
|
6
|
|
||||||||||
|
Adjusted EBITDA
|
$
|
466
|
|
$
|
447
|
|
$
|
440
|
|
$
|
412
|
|
$
|
359
|
|
|||||
29
|
Index to Management’s Discussion and Analysis of Financial Condition and Results of Operations
|
Page
|
The following discussion should be read in conjunction with the consolidated financial statements and the accompanying Notes to Consolidated Financial Statements included in Item 8 of Part II of this Annual Report on Form 10-K.
BUSINESS OVERVIEW
Valvoline is a worldwide marketer and supplier of engine and automotive maintenance products and services. Established in 1866, Valvoline’s heritage spans over 150 years, during which it has developed powerful name recognition across multiple product and service channels. In addition to the iconic Valvoline-branded passenger car motor oils and other automotive lubricant products, Valvoline provides a wide array of lubricants used in heavy duty equipment, as well as automotive chemicals and fluids designed to improve engine performance and lifespan. Valvoline’s premium branded product offerings enhance its high-quality reputation and provide customers with solutions that address a wide variety of needs.
In the United States and Canada, Valvoline’s products and services are sold to retailers with over 30,000 retail outlets, to installer customers with over 12,000 locations, and through 1,242 franchised and company-owned stores. Valvoline also has a strong international presence with products sold in more than 140 countries. Valvoline serves its customer base through its sales force and technical support organization, allowing Valvoline to leverage its technology portfolio and customer relationships globally, while meeting customer demands locally. This combination of scale and strong local presence is critical to the Company’s success.
Valvoline's fiscal year ends on September 30 of each year, and Valvoline has three reportable segments: Core North America, Quick Lubes, and International, with certain corporate and non-operational items included in Unallocated and Other to reconcile to consolidated results. Refer to Item 1 included in Part I of this Annual Report on Form 10-K for a description of Valvoline's reportable segments.
FISCAL 2018 OVERVIEW
The following were the significant events for fiscal 2018, each of which is discussed more fully in this Annual Report on Form 10-K:
|
•
|
Growth in both sales and earnings in Quick Lubes was driven by organic same-store sales growth and an overall increase in the number of stores from both acquisitions, including Quick Lubes’ first international acquisition in Canada and new store openings. During fiscal 2018, Quick Lubes grew system-wide same-store sales by 8.3%, marking the 12
th
consecutive year of system-wide same-store sales growth. This growth was the result of a balanced contribution from both increased average ticket and number of transactions due to effective marketing and customer retention programs, excellent in-store execution, and favorable pricing and premium mix. Additionally, the Quick Lubes system added 115 net new stores in fiscal 2018, which included organic and inorganic growth in company-owned service center stores, as well as expansion in franchised service center stores.
|
|
•
|
In International, volumes were up 2% for the year and income from operations grew 11%, which was driven by joint venture contributions, favorable currency exchange benefits, cost management, as well as the success of passing through raw material inflation.
|
|
•
|
Core North America faced significant raw material cost inflation and competitive pressure during fiscal 2018, but grew premium mix and passed through price increases in response to higher costs. Though the environment was challenging during
|
30
the fiscal year, the Core North America business generated earnings that supported the Company’s growth in both the Quick Lubes and International reportable segments.
|
•
|
Valvoline returned $383 million to its shareholders during the year through dividends and share repurchases. During fiscal 2018, the Company paid $58 million, or $0.298 per common share, in cash dividends and repurchased 15 million shares of Valvoline common stock for $325 million.
|
|
•
|
During fiscal 2018, tax reform legislation was enacted in the U.S. and in Kentucky, where Valvoline is incorporated. While this legislation is expected to ultimately benefit Valvoline with a lower effective tax rate and decreased cash taxes, the Company recorded $78 million of additional income tax expense during the fiscal year primarily to remeasure net deferred tax assets at lower corporate tax rates and recognize deemed repatriation taxes as a result of the new tax legislation.
|
BUSINESS STRATEGY
Valvoline’s key business and growth strategies include:
|
•
|
Accelerating Quick Lube unit growth through organic service center expansion and opportunistic acquisitions, while enhancing service center store-level performance;
|
|
•
|
Improving execution and continuing to focus investment in key emerging markets where demand is growing;
|
|
•
|
Strengthening and expanding Valvoline’s existing business by improving distribution channels and increasing penetration of Valvoline’s full product portfolio;
|
|
•
|
Broadening electric vehicle (“EV”) capabilities by developing relationships with OEMs and leveraging innovation in the development of future EV products and light services in direct and adjacent markets; and
|
|
•
|
Investing in talent and technology to develop Valvoline’s global hands-on expert capabilities and culture to drive speed and efficiency in both customer-facing and back-office critical processes.
|
Use of Non-GAAP Measures
To aid in the understanding of Valvoline’s ongoing business performance, certain items within this document are presented on an adjusted, non-GAAP basis. These non-GAAP measures are not defined within U.S. GAAP and do not purport to be alternatives to net income/loss or cash flows from operating activities as measures of operating performance or cash flows. The following are the non-GAAP measures management has included and how management defines them:
|
•
|
EBITDA, which management defines as net income/loss, plus income tax expense/benefit, net interest and other financing expenses, and depreciation and amortization;
|
|
•
|
Adjusted EBITDA, which management defines as EBITDA adjusted for key items, as further described below, and net pension and other postretirement plan income; and
|
|
•
|
Free cash flow, which management defines as operating cash flows less capital expenditures and certain other adjustments as applicable.
|
These measures are not prepared in accordance with U.S. GAAP, and management believes the use of non-GAAP measures assists investors in understanding the ongoing operating performance of Valvoline’s business by presenting comparable financial results between periods. The non-GAAP information provided is used by Valvoline’s management and may not be comparable to similar measures disclosed by other companies, because of differing methods used by other companies in calculating EBITDA, Adjusted EBITDA and free cash flow. EBITDA, Adjusted EBITDA, and free cash flow provide a supplemental presentation of Valvoline’s operating performance. For a reconciliation of non-GAAP measures, refer to the “Results of Operations” and “Financial Position, Liquidity and Capital Resources” sections below.
Due to depreciable assets associated with the nature of the Company’s operations and interest costs associated with Valvoline’s capital structure, management believes EBITDA is an important supplemental measure to evaluate the Company’s operating results between periods on a comparable basis.
Management believes Adjusted EBITDA provides investors with a meaningful supplemental presentation of Valvoline’s operating performance. Adjusted EBITDA excludes the impact of the following:
31
|
•
|
Key items - Key items consist of income or expenses associated with certain unusual, infrequent or non-operational income or expenses not directly attributable to the underlying business, which management believes impacts the comparability of operational results between periods. Key items may consist of adjustments related to: the impairment of an equity investment; legacy businesses, including the separation from Ashland and associated impacts of related indemnities; significant acquisitions or dispositions, restructuring-related matters, and other matters that are non-operational or unusual in nature. Key items are considered by management to be outside the comparable operational performance of the business and are also often related to legacy matters or market-driven events that are not directly related to the underlying business and do not have an immediate, corresponding impact on the Company’s ongoing performance. Details with respect to the composition of key items recognized during the respective periods presented herein are set forth below in the “EBITDA and Adjusted EBITDA” section of “Results of Operations” that follows.
|
|
•
|
Net pension and other postretirement plan income - Net pension and other postretirement plan income includes several elements impacted by changes in plan assets and obligations that are primarily driven by changes in the debt and equity markets, as well as those that are predominantly legacy in nature and related to prior service to the Company from employees (e.g., retirees, former employees, current employees with frozen benefits). These elements include (i) interest cost, (ii) expected return on plan assets, (iii) actuarial gains/losses, and (iv) amortization of prior service cost/credit. Significant factors that can contribute to changes in these elements include changes in discount rates used to remeasure pension and other postretirement obligations on an annual basis or upon a qualifying remeasurement, differences between actual and expected returns on plan assets, and other changes in actuarial assumptions, such as the life expectancy of plan participants. Accordingly, management considers that these elements are more reflective of changes in current conditions in global financial markets (in particular, interest rates) and are outside the operational performance of the business and are also primarily legacy amounts that are not directly related to the underlying business and do not have an immediate, corresponding impact on the compensation and benefits provided to eligible employees for current service. Adjusted EBITDA will continue to include pension and other postretirement service costs related to current employee service as well as the costs of other benefits provided to employees for current service.
|
Management uses free cash flow as an additional non-GAAP metric of cash flow generation. By including capital expenditures and certain other adjustments as applicable, management is able to provide a better indication of the ongoing cash being generated that is ultimately available for both debt and equity holders as well as other investment opportunities. Unlike cash flow from operating activities, free cash flow includes the impact of capital expenditures, providing a more complete picture of cash generation. Free cash flow has certain limitations, including that it does not reflect adjustments for certain non-discretionary cash flows, such as mandatory debt repayments. The amount of mandatory versus discretionary expenditures can vary significantly between periods.
Valvoline’s results of operations are presented based on Valvoline’s management structure and internal accounting practices. The structure and practices are specific to Valvoline; therefore, Valvoline’s financial results, EBITDA, Adjusted EBITDA and free cash flow are not necessarily comparable with similar information for other comparable companies. EBITDA, Adjusted EBITDA and free cash flow each have limitations as analytical tools and should not be considered in isolation from, or as an alternative to, or more meaningful than, net income and cash flows from operating activities as determined in accordance with U.S. GAAP. Because of these limitations, net income and cash flows from operating activities should primarily be relied upon as determined in accordance with U.S. GAAP and EBITDA, Adjusted EBITDA, and free cash flow should be used only as supplements. In evaluating EBITDA, Adjusted EBITDA, and free cash flow, one should be aware that in the future Valvoline may incur expenses/income similar to those for which adjustments are made in calculating EBITDA, Adjusted EBITDA, and free cash flow. Valvoline’s presentation of EBITDA, Adjusted EBITDA, and free cash flow should not be construed as a basis to infer that Valvoline’s future results will be unaffected by unusual or nonrecurring items.
32
RESULTS OF OPERATIONS
Consolidated review
The following table summarizes the results of the Company’s operations for the years ended September 30:
|
2018
|
2017
|
2016
|
|||||||||||||||||||
|
(In millions)
|
% of Sales
|
% of Sales
|
% of Sales
|
||||||||||||||||||
|
Sales
|
$
|
2,285
|
|
100.0
|
%
|
$
|
2,084
|
|
100.0
|
%
|
$
|
1,929
|
|
100.0
|
%
|
||||||
|
Gross profit
|
$
|
806
|
|
35.3
|
%
|
$
|
776
|
|
37.2
|
%
|
$
|
748
|
|
38.8
|
%
|
||||||
|
Net operating expenses
|
$
|
411
|
|
18.0
|
%
|
$
|
382
|
|
18.3
|
%
|
$
|
352
|
|
18.2
|
%
|
||||||
|
Operating income
|
$
|
395
|
|
17.3
|
%
|
$
|
394
|
|
18.9
|
%
|
$
|
396
|
|
20.5
|
%
|
||||||
|
Net income
|
$
|
166
|
|
7.3
|
%
|
$
|
304
|
|
14.6
|
%
|
$
|
273
|
|
14.2
|
%
|
||||||
Sales
Fiscal 2018 sales increased $201 million, or 10% compared to fiscal 2017, and fiscal 2017 sales increased $155 million, or 8% compared to fiscal 2016. The following table provides a reconciliation of the changes:
|
(In millions)
|
2018 Change
|
2017 Change
|
||||||
|
Pricing
|
$
|
76
|
|
$
|
37
|
|
||
|
Volume and mix
|
63
|
|
86
|
|
||||
|
Currency exchange
|
20
|
|
2
|
|
||||
|
Acquisitions
|
42
|
|
30
|
|
||||
|
Change in sales
|
$
|
201
|
|
$
|
155
|
|
||
2018 compared to 2017
Key drivers of the increase in sales from the prior year were increased product pricing, favorable premium mix, acquisitions of Quick Lubes service center stores, as well as overall increased volumes. During fiscal 2018, lubricant gallons sold increased 1% to 181.9 million. In addition, there were favorable changes in product mix, with increases in the percentage of premium lubricant sales within the Core North America and Quick Lubes reportable segments, as well as favorable currency exchange.
2017 compared to 2016
The primary drivers of the increase in sales were higher volumes and increased product pricing. Favorable changes in product mix with increases in the percentage of sales for premium lubricants in Core North America and Quick Lubes and favorable currency exchange increased sales. During fiscal 2017, lubricant gallons sold increased 3% to 179.7 million. Acquisitions within the Quick Lubes reportable segment also increased sales during fiscal 2017.
The changes to reportable segment sales and the drivers thereof are discussed in further detail in “Reportable Segment Review” below.
Gross profit
Gross profit increased $30 million in fiscal 2018 compared to fiscal 2017, and gross profit increased $28 million in fiscal 2017 compared to fiscal 2016. The following table provides a reconciliation of the changes:
|
(In millions)
|
2018 Change
|
2017 Change
|
||||||
|
Volume and mix
|
$
|
19
|
|
$
|
36
|
|
||
|
Acquisitions
|
10
|
|
6
|
|
||||
|
Currency exchange
|
5
|
|
1
|
|
||||
|
Price and cost
|
(4
|
)
|
(15
|
)
|
||||
|
Change in gross profit
|
$
|
30
|
|
$
|
28
|
|
||
33
2018 compared to 2017
The increase in gross profit was primarily driven by overall favorable changes in volume and premium mix, acquisitions of Quick Lubes service center stores, and favorable currency exchange. These increases were partially offset by the lag between cost and price increases during fiscal 2018. Overall, gross profit benefited from performance in the Quick Lubes and International reportable segments, which was partially offset by margin pressures driven by raw material cost inflation and competitive pressures in the Core North America reportable segment.
Gross profit margin was 35.3% for fiscal 2018 compared to 37.2% for fiscal 2017. The decrease in gross profit margin was primarily due to higher raw material costs, some of which had been passed through pricing, but had a dilutive effect to margin rate.
2017 compared to 2016
The increase in gross profit was primarily driven by overall favorable volume, changes in mix and acquisitions of Quick Lubes service center stores. These increases were partially offset by the lag between cost and price increases primarily due to base oil price increases in fiscal 2017. Overall, gross profit benefited from performance in the Quick Lubes and International reportable segments, which was partially offset by margin pressures driven by raw material inflation in the Core North America reportable segment.
Gross profit margin was 37.2% for fiscal 2017 compared to 38.8% for fiscal 2016. The decrease in gross profit margin was primarily due to higher raw material costs during 2017.
The changes to reportable segment gross profit and the drivers thereof are discussed in further detail in “Reportable Segment Review” below.
Net operating expenses
The table below provides details of the components of net operating expenses during the years ended September 30:
|
2018
|
2017
|
2016
|
|||||||||||||||||||
|
(In millions)
|
% of Sales
|
% of Sales
|
% of Sales
|
||||||||||||||||||
|
Selling, general and administrative expenses
|
$
|
430
|
|
18.8
|
%
|
$
|
396
|
|
19.0
|
%
|
$
|
365
|
|
18.9
|
%
|
||||||
|
Legacy and separation-related expenses, net
|
14
|
|
0.6
|
%
|
11
|
|
0.5
|
%
|
6
|
|
0.3
|
%
|
|||||||||
|
Equity and other income, net
|
(33
|
)
|
(1.4
|
)%
|
(25
|
)
|
(1.2
|
)%
|
(19
|
)
|
(1.0
|
)%
|
|||||||||
|
Net operating expenses
|
$
|
411
|
|
18.0
|
%
|
$
|
382
|
|
18.3
|
%
|
$
|
352
|
|
18.2
|
%
|
||||||
2018 compared to 2017
Selling, general and administrative expenses increased $34 million during fiscal 2018 compared to 2017. Acquisitions, depreciation and amortization as well as currency exchange contributed $14 million to the year-over-year increase. The remaining increases were primarily the result of planned investments in the Company’s teams and shared infrastructure expenses necessary to operate independently, which were phased in during fiscal 2017 through completion of Valvoline’s separation from Ashland in the third fiscal quarter of 2017.
Legacy and separation-related expenses, net increased $3 million during fiscal 2018 compared to 2017. This increase was primarily due to costs recognized related to a legacy Ashland multiemployer pension plan and costs associated with the Tax Matters Agreement with Ashland, offset in part by the decline in separation costs incurred in fiscal 2017 to complete the separation from Ashland in May 2017.
Equity and other income, net increased $8 million during fiscal 2018 compared to 2017 and was primarily driven by an increase in equity and royalty income of $3 million related to the strong performance from the Company’s unconsolidated joint ventures. The remaining increase was primarily attributed to the sale of two Quick Lube stores in fiscal 2018 that increased other income by approximately $3 million.
2017 compared to 2016
Selling, general and administrative expenses increased $31 million in fiscal 2017 compared to 2016. This increase was primarily driven by the spend for people and professional assistance necessary to operate independently and establish Valvoline as a stand-alone
34
company that more than offset a decrease in allocated corporate costs from the Company’s former parent. In addition, costs increased related to acquisitions and currency exchange.
Legacy and separation-related expenses, net increased $5 million during fiscal 2017 compared to 2016. This increase was primarily driven by increased separation costs of $26 million due to the separation from Ashland during 2017. Offsetting this increase was a $16 million benefit for a reduction in amounts due to Ashland under the Tax Matters Agreement as a result of Ashland’s expected utilization of Valvoline tax attributes in the Ashland group income tax returns and a $5 million benefit related to a change in estimate for legacy Ashland insurance reserves.
Equity and other income, net increased by $6 million during fiscal 2017 compared to 2016. Equity income was flat compared to 2016, while other income increased by $6 million primarily due to an increase in income generated by research and development testing and royalties from the Company’s investments in joint ventures, which had increased volumes and revenues.
Net pension and other postretirement plan income
2018 compared to 2017
Net pension and other postretirement plan income decreased $138 million in fiscal 2018 from the prior year primarily due to a loss on pension and other postretirement plan remeasurement of $38 million compared to a gain of $68 million in fiscal 2017. This change was largely attributed to the lower than expected return on plan assets, which was partially offset by the benefit obligation actuarial gain for increases in discount rates and reduced mortality improvements. In addition, recurring pension and other postretirement plan non-service income declined by $32 million in fiscal 2018 primarily related to the pension de-risking actions taken by the Company in late fiscal 2017 to shift the U.S. qualified pension plan’s target asset allocation toward more fixed income securities and better match the asset duration to that of the pension plan obligations.
2017 compared to 2016
Net pension and other postretirement plan income for fiscal 2017 increased $103 million compared to 2016. Specifically, during 2017, remeasurement gains of $68 million were recognized along with recurring pension and postretirement plan non-service income of $70 million. This compared to remeasurement gains of $18 million and non-service income of $17 million in fiscal 2016. The increased remeasurement gains in fiscal 2017 were largely attributed to the higher than expected return on assets, the benefit obligation actuarial gain for increases in discount rates and reduced mortality improvements, and the effect of the other postretirement benefit plan amendment to reduce retiree medical benefits that was effective in fiscal 2017.
Net interest and other financing expenses
2018 compared to 2017
Net interest and other financing expenses increased by $21 million during fiscal 2018 compared to 2017. The increase in interest expense was attributed to higher outstanding debt during 2018 compared to 2017, primarily related to the borrowing to fund contributions to the U.S. qualified pension plan in the aggregate principal amount of $400 million during the fourth fiscal quarter of 2017 and increased borrowings under the trade receivables securitization and revolving credit facilities during 2018.
2017 compared to 2016
Net interest and other financing expenses increased by $33 million during fiscal 2017 compared to 2016. This increase was largely driven by the timing of Valvoline’s debt structure that was put into place in late fiscal 2016 preceding the IPO, which included the term loan borrowing and the issuance of senior unsecured notes with an aggregate principal amount of $375 million that drove higher year over year interest costs. In addition, there was an increase in interest associated with higher outstanding debt in 2017 related to $75 million in new borrowings on the accounts receivable securitization facility entered into in the first fiscal quarter of 2017 and the issuance of notes in the aggregate principal amount of $400 million in the fourth fiscal quarter of 2017.
Income tax expense
2018 compared to 2017
Income tax expense was $166 million for fiscal 2018, or an effective tax rate of 50.0%, compared to expense of $186 million, or an effective tax rate of 38.0% for fiscal 2017. The increase in the effective tax rate is primarily due to the enactment of U.S. and Kentucky tax reform legislation in fiscal 2018, which resulted in a net increase in income tax expense of approximately $78 million
35
largely related to remeasurement of net deferred tax assets that more than offset benefits of the related reduction in the federal income tax rate for fiscal 2018.
2017 compared to 2016
Income tax expense for fiscal 2017 was $186 million, or an effective tax rate of 38.0%, compared to an expense of $148 million, or an effective tax rate of 35.2% for 2016. In fiscal 2017, the effective tax rate was impacted by increased net pension and other postretirement plan income that generated income in higher tax rate jurisdictions, income tax expense resulting from the Tax Matters Agreement activity with Ashland, certain non-deductible separation costs, and the partial loss of certain tax deductions from the $394 million voluntary contribution to the U.S. qualified pension plan, partially offset by a benefit from a state valuation allowance release.
EBITDA and Adjusted EBITDA
The following table reconciles net income to EBITDA and Adjusted EBITDA for the years ended September 30:
|
(In millions)
|
2018
|
2017
|
2016
|
|||||||||
|
Net income
|
$
|
166
|
|
$
|
304
|
|
$
|
273
|
|
|||
|
Income tax expense
|
166
|
|
186
|
|
148
|
|
||||||
|
Net interest and other financing expenses
|
63
|
|
42
|
|
9
|
|
||||||
|
Depreciation and amortization
|
54
|
|
42
|
|
38
|
|
||||||
|
EBITDA
|
449
|
|
574
|
|
468
|
|
||||||
|
Net pension and other postretirement plan income
|
—
|
|
(138
|
)
|
(35
|
)
|
||||||
|
Legacy and separation-related expenses, net
|
14
|
|
11
|
|
6
|
|
||||||
|
Acquisition and divestiture-related losses
|
3
|
|
—
|
|
1
|
|
||||||
|
Adjusted EBITDA
(a)
|
$
|
466
|
|
$
|
447
|
|
$
|
440
|
|
|||
|
(a)
|
Net pension and other postretirement plan income includes remeasurement gains and losses and recurring non-service pension and other postretirement net periodic income, which consists of interest cost, expected return on plan assets and amortization of prior service credit. Refer to Note 13 of the Notes to Consolidated Financial Statements included in Item 8 of Part II of this Annual Report on Form 10-K for further details.
|
The increase in Adjusted EBITDA of $19 million in fiscal 2018 was primarily due to the performance of the Quick Lubes and International reportable segments that had favorable changes in volume, premium mix improvements in Core North America and Quick Lubes, acquisitions in Quick Lubes, as well as the benefits from currency exchange and increased equity and other income, partially offset by higher planned investments in selling, general and administrative expense.
The increase in Adjusted EBITDA of $7 million from fiscal 2016 to 2017 was primarily due to solid performance by the reportable segments, led by Quick Lubes, and offset by investments in the Company’s stand-alone public company infrastructure.
Reportable Segment Review
Valvoline’s business is managed within the following three reportable segments:
|
•
|
Core North America
- sells engine and automotive maintenance products in the United States and Canada to retailers, installers and heavy-duty customers to service vehicles and equipment.
|
|
•
|
Quick Lubes
- services the passenger car and light truck quick lube market in the United States and Canada through company-owned and independent franchised retail quick lube service center stores, as well as Express Care stores where independent operators service vehicles with Valvoline products.
|
|
•
|
International
- sells engine and automotive maintenance products in approximately
140
countries outside of the United States and Canada for the maintenance of consumer and commercial vehicles and equipment.
|
Results of Valvoline’s reportable segments are presented based on how operations are managed internally, including how the results are reviewed by the chief operating decision maker. The structure and practices are specific to Valvoline; therefore, the financial results of its reportable segments are not necessarily comparable with similar information for other comparable companies. Valvoline’s reportable segments are measured for profitability based on operating income; therefore, Valvoline does not generally allocate items to each reportable segment below operating income, such as net pension and other postretirement income, interest expense or income tax expense. Valvoline allocates all items above operating income to its reportable segments except for certain significant corporate and
36
non-operational matters, including, but not limited to, company-wide restructuring activities and adjustments related to legacy businesses that Valvoline no longer operates. Due to the freeze of U.S. pension benefits effective September 30, 2016, continuing service costs are limited to certain international pension plans, and are reported in the reportable segment and caption of the Consolidated Statements of Comprehensive Income as the related employee payroll expenses. All remaining non-service and remeasurement components of pension and other postretirement benefits costs are recorded below operating income and attributed to Unallocated and other.
The following table presents sales, operating income and statistical operating information by reportable segment for the years ended September 30:
|
(In millions)
|
2018
|
2017
|
2016
|
|||||||||
|
Sales
|
||||||||||||
|
Core North America
|
$
|
1,035
|
|
$
|
1,004
|
|
$
|
979
|
|
|||
|
Quick Lubes
|
660
|
|
541
|
|
457
|
|
||||||
|
International
|
590
|
|
539
|
|
493
|
|
||||||
|
Consolidated sales
|
$
|
2,285
|
|
$
|
2,084
|
|
$
|
1,929
|
|
|||
|
Operating income
|
||||||||||||
|
Core North America
|
$
|
172
|
|
$
|
199
|
|
$
|
212
|
|
|||
|
Quick Lubes
|
153
|
|
130
|
|
117
|
|
||||||
|
International
|
84
|
|
76
|
|
74
|
|
||||||
|
Total operating segments
|
409
|
|
405
|
|
403
|
|
||||||
|
Unallocated and other
|
(14
|
)
|
(11
|
)
|
(7
|
)
|
||||||
|
Consolidated operating income
|
$
|
395
|
|
$
|
394
|
|
$
|
396
|
|
|||
|
Depreciation and amortization
|
||||||||||||
|
Core North America
|
$
|
18
|
|
$
|
15
|
|
$
|
16
|
|
|||
|
Quick Lubes
|
30
|
|
22
|
|
17
|
|
||||||
|
International
|
6
|
|
5
|
|
5
|
|
||||||
|
Consolidated depreciation and amortization
|
$
|
54
|
|
$
|
42
|
|
$
|
38
|
|
|||
|
Operating information
|
||||||||||||
|
Core North America
|
||||||||||||
|
Lubricant sales gallons
|
98.8
|
|
99.4
|
|
101.2
|
|
||||||
|
Premium lubricants (percent of U.S. branded volumes)
|
49.2
|
%
|
45.8
|
%
|
41.4
|
%
|
||||||
|
Gross profit as a percent of sales
(a)
|
35.9
|
%
|
39.5
|
%
|
41.2
|
%
|
||||||
|
Quick Lubes
|
||||||||||||
|
Lubricant sales gallons
|
24.4
|
|
22.5
|
|
20.2
|
|
||||||
|
Premium lubricants (percent of U.S. branded volumes)
|
62.4
|
%
|
59.9
|
%
|
57.1
|
%
|
||||||
|
Gross profit as a percent of sales
(a)
|
40.1
|
%
|
40.3
|
%
|
41.6
|
%
|
||||||
|
International
|
||||||||||||
|
Lubricant sales gallons
(b)
|
58.7
|
|
57.8
|
|
53.1
|
|
||||||
|
Lubricant sales gallons, including unconsolidated joint ventures
|
98.7
|
|
94.7
|
|
85.3
|
|
||||||
|
Premium lubricants (percent of lubricant volumes)
|
27.4
|
%
|
27.6
|
%
|
29.0
|
%
|
||||||
|
Gross profit as a percent of sales
(a)
|
28.9
|
%
|
29.8
|
%
|
31.4
|
%
|
||||||
|
(a)
|
Gross profit is defined as sales, less cost of sales.
|
|
(b)
|
Excludes volumes from unconsolidated subsidiaries.
|
37
Core North America
2018 compared to 2017
Core North America sales increased $31 million, or 3%, to $1,035 million during fiscal 2018, which was driven by higher product pricing as a result of the pass through of raw material cost increases.
Gross profit decreased approximately $25 million during fiscal 2018 compared to 2017. This decline was primarily related to higher raw material costs as compared to the prior year period and the lag between cost and price increases, which more than offset the benefits of pricing actions and premium product mix improvements. Costs also increased in the first half of fiscal 2018 related to certain transitory items, including the timing of promotional expenses and costs related to the transition to new packaging. In total, cost in excess of pricing decreased gross profit by approximately $19 million. In addition, competitive pressure drove less promotional effectiveness and volume in the retail channel, and volumes were lower in the installer channel due to competitive pricing pressure, declines from a retail customer that filed for bankruptcy, and the transfer of Great Canadian Oil Change to the Quick Lubes reportable segment as a result of the acquisition and integration into the Quick Lubes system. These changes resulted in a higher mix of lower margin sales. Volume declines and unfavorable branded product mix partially offset by the premium product mix improvements described above decreased gross profit by $6 million.
Gross profit margin decreased during fiscal 2018 primarily due to higher raw material costs and the dilutive impact to margin resulting from price increases to cover costs without additional margin, and to a lesser extent, the mix impacts in the retail and installer channels noted.
Selling, general and administrative expenses, which include the allocation of corporate costs, decreased approximately $1 million during fiscal 2018 compared to 2017. This change is attributed to reduced operating expenses, which more than offset an increase in bad debt expense associated with a retail customer that filed for bankruptcy in early October 2018.
2017 compared to 2016
Core North America sales increased $25 million, or 3%, to $1,004 million in fiscal 2017. Higher product pricing and favorable changes in product mix increased sales by $41 million, partially offset by lower volumes that decreased sales by $16 million.
Gross profit decreased $6 million during fiscal 2017 compared to 2016. Higher raw material costs, partially offset by higher product pricing and decreased gross profit by $14 million, while changes in volume and product mix combined for a net increase in gross profit by $8 million. Gross profit margin during the year decreased 1.7 percentage points to 39.5% driven largely by higher raw materials costs during 2017 as compared to 2016.
Selling, general and administrative expense increased $7 million during fiscal 2017, primarily as a result of $2 million of increased employee costs and an $8 million increase of shared expenses partially due to stand-alone public company costs, net of a $3 million decrease in bad debts.
38
Quick Lubes
Quick Lubes sales are influenced by the number of service center stores and the business performance of those stores. The following tables provide supplemental information regarding company-owned and franchised stores that Valvoline believes is relevant to an understanding of the Quick Lubes business and its performance.
|
Company-owned
|
||||||||
|
For the years ended September 30
|
||||||||
|
2018
|
2017
|
2016
|
||||||
|
Beginning of period
|
384
|
|
342
|
|
279
|
|
||
|
Opened
|
17
|
|
3
|
|
3
|
|
||
|
Acquired
|
3
|
|
29
|
|
52
|
|
||
|
Conversions between company-owned and franchised
|
58
|
|
14
|
|
9
|
|
||
|
Closed
|
—
|
|
(4
|
)
|
(1
|
)
|
||
|
End of period
|
462
|
|
384
|
|
342
|
|
||
|
Franchised*
|
||||||||
|
For the years ended September 30
|
||||||||
|
2018
|
2017
|
2016
|
||||||
|
Beginning of period
|
743
|
|
726
|
|
663
|
|
||
|
Opened
|
28
|
|
38
|
|
33
|
|
||
|
Acquired
|
73
|
|
—
|
|
42
|
|
||
|
Conversions between company-owned and franchised
|
(58
|
)
|
(14
|
)
|
(9
|
)
|
||
|
Closed
|
(6
|
)
|
(7
|
)
|
(3
|
)
|
||
|
End of period
|
780
|
|
743
|
|
726
|
|
||
|
Total stores
|
1,242
|
|
1,127
|
|
1,068
|
|
||
The year over year change from fiscal 2018 to 2017 is primarily driven by the acquisition of Great Canadian Oil Change that added 73 franchised service centers stores, as well as 42 net service center stores openings, including 3 acquired company-owned service center stores.
|
For the years ended September 30
|
||||||||
|
2018
|
2017
|
2016
|
||||||
|
Same-Store Sales Growth** - Company-owned
|
8.7
|
%
|
7.0
|
%
|
6.2
|
%
|
||
|
Same-Store Sales Growth** - Franchised*
|
8.0
|
%
|
7.5
|
%
|
8.0
|
%
|
||
|
Same-Store Sales Growth** - Combined*
|
8.3
|
%
|
7.4
|
%
|
7.5
|
%
|
||
* Valvoline’s franchisees are distinct legal entities and Valvoline does not consolidate the results of operations of its franchisees.
** Valvoline determines same-store sales growth on a fiscal year basis, with new stores excluded from the metric until the completion of their first full fiscal year in operation.
2018 compared to 2017
Quick Lubes sales increased $119 million, or 22%, to $660 million during fiscal 2018. Volume growth increased sales by $41 million due to the increase in lubricant gallons and transactions. Implemented pricing actions and premium mix led to higher average ticket contributing $33 million to the increase. These improvements were
due to marketing and customer retention programs and strong in-store execution.
Furthermore, continued investment in acquisitions increased sales by $45 million.
Gross profit increased $46 million during fiscal 2018 compared to 2017. Increases in volume and improved premium mix combined to increase gross profit by approximately $23 million. Favorable pricing in excess of costs increased gross profit by $12 million, while acquisitions increased gross profit by $11 mil
lion. Gross profit margin decreased by 0.2 percentage points to 40.1% as a result of higher costs from acquisitions partially offset by pricing and mix improvements.
Selling, general and administrative expenses, which include the allocation of corporate costs, increased approximately $28 million during fiscal 2018. The increase was primarily a result of $16 million in shared infrastructure costs and planned investments. Increased
39
advertising spend to drive customer acquisition totale
d $2
million and acquis
ition costs consisting largely of amortization expense related to acquired intangible assets increased $8 million. Expenses also increased by $2 million due to a foreign currency exchange loss associated with a contract to fix the U.S. dollar purchase price for the Great Canadian Oil Change Ltd. acquisition which closed in fiscal 2018.
The Quick Lubes segment benefited from the sale of two service center stores to a franchisee, which resulted in a $3 million gain on the sale that was recorded in Equity and other income, net in fiscal 2018.
2017 compared to 2016
Quick Lubes sales increased $84 million, or 18%, to $541 million during fiscal 2017. Volume increased sales by $29 million as lubricant sales gallons increased to 22.5 million gallons during 2017. Acquisitions increased sales by $30 million and favorable product pricing increased sales by approximately $17 million. Favorable changes in product mix increased sales $8 million.
Gross profit increased $28 million during fiscal 2017 compared to 2016. Increases in volumes and higher premium product mix combined to increase gross profit by approximately $15 million. Favorable product pricing, partially offset by increased raw material costs, increased gross profit by $7 million, while acquisitions increased gross profit by $6 million. Gross profit margin during fiscal 2017 decreased 1.3 percentage points to 40.3% driven largely by higher raw materials costs.
Selling, general and administrative expense increased $15 million during fiscal 2017. The increase was primarily a result of a $4 million increase in advertising and sales promotion costs, a $3 million increase in operating costs as a result of acquisitions, and an $8 million increase in shared expenses partially due to stand-alone public company costs. Equity and other income was essentially flat in fiscal 2017 compared to 2016.
International
2018 compared to 2017
International sales increased $51 million, or 9%, to $590 million in fiscal 2018. Favorable product pricing increased sales by $20 million reflecting the pass through of raw material cost increases. Higher volumes led by high-growth markets and effective channel development increased sales by $12 million. Favorable currency exchange increased sales by $19 million.
Gross profit increased $10 million in fiscal 2018 compared to 2017. Increased product pricing actions net of higher raw material costs increased gross profit by $4 million. Favorable volume and geographic mix increased gross profit by $2 million. Favorable currency exchange increased gross profit by approximately $4 million. Gross profit margin during 2018 decreased 0.9 percentage points to 28.9% primarily due to higher product costs and decreased premium product mix.
Selling, general and administrative expenses, which include the allocation of corporate costs, increased approximately $5 million during the year. This increase was primarily driven by the impacts of currency exchange, as well as planned increases related to the Company’s investments in its teams and shared infrastructure expenses.
Equity and other income, net increased $4 million in fiscal 2018 compared to 2017 primarily as a result of increased equity and royalty income from the Company’s joint ventures, particularly those in China and India, which had increased volumes during 2018. These increases were partially offset by a $1 million loss related to t
he liquidation of the Company’s Brazilian subsidiary.
2017 compared to 2016
International sales increased $46 million, or 9%, to $539 million in fiscal 2017. Higher volumes and changes in product mix combined to increase sales by a net $45 million, or 9%. Favorable currency exchange increased sales by $2 million, while unfavorable product pricing decreased sales by $1 million due to pricing increases being put into place in the latter part of 2017.
Gross profit increased $6 million in fiscal 2017 compared to 2016. Increases in volumes partially offset by unfavorable changes in product mix combined to increase gross profit by $14 million. Favorable currency exchange increased gross profit by $1 million, while higher product costs resulted in a $9 million decrease in gross profit. Gross profit margin during 2017 decreased 1.6 percentage points to 29.8% largely driven by higher raw materials costs, coupled with the timing of price increases and unfavorable changes in product mix.
Selling, general and administrative expense increased $7 million during fiscal 2017, primarily as a result of $2 million of employee costs, $2 million of legal reserves and expenses related to the settlement of historical tax matters, $1 million related to currency exchange and a $2 million increase in shared expenses partially due to stand-alone public company costs.
Equity and other income, net increased $3 million in fiscal 2017 compared to 2016 primarily as a result of increased royalty income from joint ventures during 2017.
40
FINANCIAL POSITION, LIQUIDITY AND CAPITAL RESOURCES
Overview
The Company closely manages its liquidity and capital resources. Valvoline’s liquidity requirements depend on key variables including the level of investment needed to support business strategies, the performance of the business, capital expenditures, borrowing arrangements, and working capital management. Capital expenditures, acquisitions, share repurchases, and dividend payments are components of the Company’s cash flow and capital management strategy, which to a large extent, can be adjusted in response to economic and other changes in the business environment. The Company has a disciplined approach to capital allocation, which focuses on investing in key priorities that support Valvoline’s business and growth strategies and returning capital to shareholders, while funding ongoing operations.
As of September 30, 2018, the Company had $96 million in
cash and cash equivalents, of which approximately $74 million was held by Valvoline’s non-U.S. subsidiaries. The Company utilizes a variety of strategies to deploy available cash in locations where it is needed, and the Company had not previously provided for U.S. income taxes on undistributed earnings and other outside basis differences of its non-U.S. subsidiaries as it was the Company’s intention for these tax basis differences to remain indefinitely reinvested based on access to sufficient liquidity within the United States, as well as plans for use and investment outside of the United States. Due to the enactment of U.S. tax reform legislation in December 2017, undistributed earnings of the Company’s non-U.S. subsidiaries were subject to the one-time deemed repatriation tax, which provides opportunity to mobilize cash with lower tax consequences. The Company reevaluated its assertion and no longer intends to indefinitely reinvest the Company’s non-U.S. current and undistributed earnings. Valvoline recorded estimated incremental withholding taxes during the year ended September 30, 2018, which were not material. Certain other outside basis differences restricted by regulations, operational or investing needs for non-U.S. subsidiaries remain indefinitely reinvested.
Cash flows
Valvoline’s cash flows as reflected in the Consolidated Statements of Cash Flows are summarized as follows for the years ended September 30:
|
(In millions)
|
2018
|
2017
|
2016
|
|||||||||
|
Cash provided by (used in):
|
||||||||||||
|
Operating activities
|
$
|
320
|
|
$
|
(130
|
)
|
$
|
311
|
|
|||
|
Investing activities
|
(213
|
)
|
(135
|
)
|
(148
|
)
|
||||||
|
Financing activities
|
(209
|
)
|
295
|
|
10
|
|
||||||
|
Effect of currency exchange rate changes on cash and cash equivalents
|
(3
|
)
|
(1
|
)
|
(1
|
)
|
||||||
|
(Decrease) increase in cash and cash equivalents
|
$
|
(105
|
)
|
$
|
29
|
|
$
|
172
|
|
|||
Operating activities
Cash flows provided by operating activities increased by $450 million in fiscal 2018 and was primarily related to the Company's discretionary contribution to the U.S. qualified pension plan of $394 million that occurred in late fiscal 2017. The remaining increase in cash flows from operating activities is largely attributable to decreased tax payments of $48 million driven by tax-sharing payments made to Ashland in 2017 related to the pre-Distribution periods compared to lower payments in fiscal 2018. The reduced tax payments are due to the expected utilization of tax attributes generated by the discretionary contribution to the U.S. qualified pension plan in late fiscal 2017, utilization of foreign tax credits, as well as increased tax depreciation as a result of U.S tax reform.
Cash flows from operating activities decreased by $441 million in fiscal 2017 compared to fiscal 2016. The decrease in cash flows from operating activities was primarily related to the Company’s discretionary pension contribution of $394 million and other incremental pension contributions of $16 million, as well as incremental payments of $92 million related to interest and taxes during 2017, which included tax-sharing payments to Ashland related to the pre-Distribution periods. These decreases were generally offset by improved net earnings and non-cash stock-based compensation expense.
Investing activities
Cash flows used in investing activities increased by $78 million in fiscal 2018, which was primarily due to planned Quick Lubes service center store expansion both through acquisition and newly-constructed company-owned store openings. Combined, these activities increased cash used in investing activities by $82 million from fiscal 2017.
41
Cash used in investing activities decreased by $13 million in fiscal 2017 compared to 2016. This decrease was primarily due to decreases in acquisition activity of $15 million. During fiscal 2017, the Company acquired
43
locations, including Time-It Lube, for an aggregate purchase price of
$72 million
, of which
$4 million
was paid in fiscal 2016. During fiscal 2016,
104
service center stores were acquired, including Oil Can Henry’s, for an aggregate purchase price of
$79 million
.
Valvoline is currently forecasting approximately $115 to $120 million of capital expenditures for fiscal 2019, funded primarily from operating cash flows. In addition, on May 2, 2018, Valvoline announced plans to build its first blending and packaging plant in China to meet the country’s growing demand for premium lubricants and coolants. Valvoline plans to invest approximately $70 million, which the Company expects will create a more efficient and effective local supply chain and enable faster-to-market new products and packaging. The plant is expected to have annual capacity in excess of 30 million gallons of lubricants. Capital expenditures related to this investment were not material in fiscal 2018; however, included within the above estimate of capital expenditures in fiscal 2019 is approximately $20 to $25 million related to this planned investment.
From October 1 through November 19, 2018, Valvoline acquired
35
service center stores for an aggregate approximate purchase price of
$30 million
. These acquisitions included
31
franchise service center stores in Ontario, Canada acquired from Oil Changers Inc. and four former franchise service center stores acquired in single and multi-store transactions.
Financing activities
Cash flows from financing activities decreased by $504 million in fiscal 2018 primarily driven by returning additional capital to shareholders of $293 million in the form of increased share repurchases and dividend payments, reduced net proceeds from borrowings of $166 million, and higher payments on borrowings of $18 million in fiscal 2018. Proceeds from net borrowings declined related to the issuance of senior unsecured notes and proceeds from the accounts receivable securitization in fiscal 2017, which were less than Valvoline’s borrowings on its revolver and against its additional accounts receivable securitization capacity in fiscal 2018
.
The remaining decline in cash flows from financing activities was largely related to the purchase of the outstanding ownership interest in a consolidated subsidiary for $15 million in fiscal 2018.
Cash flows from financing activities increased by $285 million in fiscal 2017 from fiscal 2016, which was primarily driven by the net proceeds from the issuance of senior unsecured notes in late fiscal 2017 of $394 million offset by $90 million in returns to shareholders in fiscal 2017 following Distribution through dividends and share repurchases, compared to fiscal 2016 when Valvoline’s capital structure was established late in the fiscal year preceding and up to IPO and cash flows prior to this time were transferred to Ashland’s centralized cash management system and considered to be effectively settled for cash at the time the transactions were recorded.
Free cash flow and other liquidity information
The following table sets forth free cash flow for the disclosed periods and reconciles cash flows from operating activities to free cash flow. Free cash flow has certain limitations, including that it does not reflect adjustments for certain non-discretionary cash flows, such as mandatory debt repayments. Refer to “Use of Non-GAAP Measures” within this Item 7 for additional information regarding this non-GAAP measure.
|
For the years ended September 30
|
||||||||||||
|
(In millions)
|
2018
|
2017
|
2016
|
|||||||||
|
Cash flows provided by (used in) operating activities
|
$
|
320
|
|
$
|
(130
|
)
|
$
|
311
|
|
|||
|
Adjustments:
|
||||||||||||
|
Additions to property, plant and equipment
|
(93
|
)
|
(68
|
)
|
(66
|
)
|
||||||
|
Discretionary contributions to pension plans
|
—
|
|
394
|
|
—
|
|
||||||
|
Free cash flow
|
$
|
227
|
|
$
|
196
|
|
$
|
245
|
|
|||
At September 30, 2018, working capital (current assets minus current liabilities, excluding long-term debt due within one year) was $344 million compared to $327 million in 2017. Liquid assets (cash, cash equivalents, and accounts receivable) were 123% of current liabilities as of September 30, 2018 and 2017. The increase in working capital is primarily related to the amendment of the trade receivables securitization facility in fiscal 2018 to extend the maturity date from one to three years, which resulted in reclassifying outstanding borrowings from current liabilities to long-term debt, partially offset by net decreases in remaining working capital accounts largely driven by the decrease in cash and cash equivalents as result of cash activity in fiscal 2018 outlined above.
42
Debt
The following summary reflects Valvoline’s debt as of September 30:
|
(In millions)
|
2018
|
2017
|
||||||
|
Short-term debt
|
$
|
—
|
|
$
|
75
|
|
||
|
Long-term debt (including current portion and debt issuance cost discounts)
(a)
|
1,322
|
|
1,049
|
|
||||
|
Total debt
|
$
|
1,322
|
|
$
|
1,124
|
|
||
|
(a)
|
Includes $1 million and $2 million of debt acquired through acquisitions as of September 30, 2018 and 2017, respectively. This balance is also net of $11 million and $13 million of debt issuance cost discounts, which are direct reductions from the carrying amount of debt, as of September 30, 2018 and 2017, respectively.
|
As of September 30, 2018, the senior secured credit facility consisted of a term loan facility with an aggregate principal outstanding balance of $270 million and a $450 million revolving credit facility with an outstanding balance of $147 million. The revolving credit facility also allows a portion of the availability to be used for outstanding letters of credit, and as of September 30, 2018, there were $10 million in letters of credit outstanding. As of September 30, 2017, the outstanding principal balance of the term loan facility was $285 million, and there was no outstanding balance on the revolving facility.
As of September 30, 2018 and 2017, the Company had outstanding $400 million in aggregate principal balance of 4.375% senior unsecured notes due in 2025 and $375 million in aggregate principal balance of 5.500% senior unsecured notes due in 2024. In December 2017, the Company completed registered exchange offers for these notes.
During the first fiscal quarter of 2018, the Company amended the trade receivables securitization facility to extend the maturity date to November 19, 2020 and increase the maximum funding under the facility to $175 million. Valvoline borrowed $101 million under this facility during the fiscal year ended September 30, 2018 and used the proceeds to supplement the Company’s daily cash needs. Valvoline repaid $36 million on this facility during the fiscal year ended September 30, 2018. The Company had $140 million and $75 million outstanding under this facility as of September 30, 2018 and 2017, respectively.
Refer to Note 10 of the Notes to Consolidated Financial Statements included in Item 8 of Part II of this Annual Report on Form 10-K for additional details regarding the Company’s debt instruments.
Debt covenant restrictions
Valvoline’s debt contains usual and customary representations and warranties, and usual and customary affirmative and negative covenants, including limitations on liens, additional indebtedness, investments, restricted payments, asset sales, mergers, affiliate transactions and other customary limitations, as well as financial covenants (including maintenance of a maximum consolidated leverage ratio and a minimum consolidated interest coverage ratio). As of the end of any fiscal quarter, the maximum consolidated net leverage ratio and minimum consolidated interest coverage ratio permitted under the 2016 Senior Credit Agreement are 4.5 and 3.0, respectively. As of September 30, 2018, Valvoline is in compliance with all covenants of its debt obligations.
43
Contractual obligations and other commitments
The following table sets forth Valvoline’s obligations and commitments to make future payments under existing contracts at September 30, 2018. Excluded from the table are contractual obligations for which the ultimate settlement of quantities or prices are not fixed and determinable.
|
(In millions)
|
Total
|
Less than
1 Year |
1-3
years |
3-5
years |
More than
5 years |
|||||||||||||||
|
Contractual obligations
(a)
|
||||||||||||||||||||
|
Long-term debt
|
$
|
1,333
|
|
$
|
30
|
|
$
|
527
|
|
$
|
—
|
|
$
|
776
|
|
|||||
|
Interest payments
(b)
|
296
|
|
59
|
|
110
|
|
76
|
|
51
|
|
||||||||||
|
Operating lease obligations
|
170
|
|
28
|
|
44
|
|
34
|
|
64
|
|
||||||||||
|
Capital lease and financing obligations
|
80
|
|
6
|
|
12
|
|
12
|
|
50
|
|
||||||||||
|
Employee benefit obligations
(c)
|
127
|
|
18
|
|
28
|
|
24
|
|
57
|
|
||||||||||
|
Total contractual obligations
|
$
|
2,006
|
|
$
|
141
|
|
$
|
721
|
|
$
|
146
|
|
$
|
998
|
|
|||||
|
(a)
|
Other long-term liabilities of approximately $130 million are excluded from this table as the uncertainty related to the amount and period of cash settlements prevents the Company from making a reasonably reliable estimate. These other long-term liabilities include the Company’s net obligations to its former parent company, deferred compensation, unrecognized tax benefits, and self-insurance liabilities that primarily related to workers’ compensation claims, among others.
|
|
(b)
|
Includes interest expense on both variable and fixed rate debt assuming no prepayments. Variable interest rates have been assumed to remain constant through the end of the term at the rates that existed as of September 30, 2018.
|
|
(c)
|
Includes estimated funding of pension plans for 2019, as well as projected benefit payments through 2028 for Valvoline’s unfunded pension plans. Excludes benefit payments from pension plan trust funds.
|
Pension and other postretirement plan obligations
During fiscal 2018, the Company made contributions of approximately $16 million to its U.S. non-qualified and non-U.S. pension plans.
In April 2018, Valvoline received a demand for payment of a partial withdrawal liability assessment of approximately $30 million related to the sale of a business by Ashland in fiscal 2011 and the associated reduction in contributions and the number of employees covered by one of the multiemployer pension plans. The Company is vigorously contesting the assessment and the calculation method utilized in its determination and received information in October 2018 indicating the multiemployer plan may accept approximately $10 million to settle this liability. Valvoline is evaluating the potential settlement options and submitted a formal arbitration request on October 31, 2018. The Company’s current best estimate of cost associated with this assessment is not material to the consolidated financial statements as of and for the periods ended September 30, 2018. Refer to Note 13 of the Notes to Consolidated Financial Statements in Item 8 of Part II of this Annual Report on Form 10-K for additional information.
Tax-related commitments
On December 22, 2017, the President of the United States signed into law tax reform legislation, which generally became effective January 1, 2018. This legislation includes a number of provisions, including lowering the federal corporate income tax rate from a maximum of 35% to 21% and changing or limiting certain tax deductions. Based on the effective date of the rate reduction, the Company’s federal corporate statutory income tax rate was a blended rate of 24.5% for fiscal 2018, declining to 21% beginning in fiscal 2019. The Company currently expects that its consolidated effective tax rate for fiscal 2019 will be between 25% and 26%. Such estimates are based on management’s current assumptions with respect to, among other things, the Company’s earnings, state income taxes and tax deductions.
The estimated impacts of U.S. tax reform legislation recorded during the fiscal year ended September 30, 2018 as well as the forward-looking estimates are provisional in nature, and the Company will continue to assess the impact and provide additional information and record adjustments through the income tax provision in the relevant period as amounts are known and reasonably estimable during the measurement period. Accordingly, the impact may differ from the Company’s provisional estimates due to and among other factors, information currently not available, changes in interpretations and the issuance of additional guidance, as well as changes in assumptions the Company has currently made, including actions the Company may take in future periods as a result of the legislation.
Many states have enacted state specific tax reform and legislation in response to U.S. tax reform legislation. In general, these impacts are not material to the Company’s financial statements. Valvoline is incorporated in Kentucky, which enacted income tax reform on April 13, 2018. The provisions of Kentucky tax reform generally become effective in fiscal 2019 and include a number of provisions, notably lowering the corporate income tax rate from a maximum of 6% to 5%. The Company expects these changes will ultimately benefit Valvoline with decreased cash taxes and a lower effective tax rate that is included in management’s estimated consolidated
44
effective tax rate for fiscal 2019 noted above. The Company will continue to monitor enacted state legislation and make relevant updates to management estimates when warranted.
As a result of the separation from Ashland, Valvoline agreed to indemnify Ashland for certain income tax matters. As of September 30, 2018, Valvoline’s liability for these estimated indemnification obligations is $66 million. Valvoline records a liability when it is probable and reasonably estimable that indemnification will be due to Ashland and makes adjustments through earnings in the period that changes are known. Given the nature of this obligation and the uncertainty surrounding its estimation, the period(s) of any cash settlement are not currently estimable, though management considers that is likely for a number of years to elapse before the indemnification liability has been fully resolved.
Dividend payments and share repurchases
During the year ended September 30, 2018, the Company paid cash dividends of $0.298 per common share for $58 million. On November 19, 2018, the Company’s Board of Directors approved a quarterly cash dividend of $0.106 per share on Valvoline common stock, which is payable December 17, 2018 to shareholders of record on November 30, 2018. Future declarations of quarterly dividends are subject to approval by the Board of Directors and may be adjusted as business needs or market conditions arise. For the year ended September 30, 2017, the Company paid cash dividends of $0.196 per common share for $40 million.
During the year ended September 30, 2018, the Company repurchased approximately 15 million shares of its common stock for $325 million. Of this amount, $100 million was repurchased to complete the Board of Directors authorization on April 24, 2017 under which $150 million of the Company’s common stock could be repurchased through December 31, 2019. The remaining $225 million was repurchased pursuant to the Board of Directors authorization on January 31, 2018 to repurchase up to $300 million of common stock through September 30, 2020. As of September 30, 2018, $75 million remains available for share repurchases under this authorization. The Company will reassess additional share repurchases in May 2019 or thereafter.
Summary
As of September 30, 2018, cash and cash equivalents totaled $96 million and total debt was $1.3 billion. Valvoline’s ability to generate positive cash flows from operations is dependent on general economic conditions, the competitive environment, and is subject to the business and other risk factors described in Item 1A of Part I of this Annual Report on Form 10-K. If the Company is unable to generate sufficient cash flows from operations, or otherwise comply with the terms of its credit facilities, Valvoline may be required to seek additional financing alternatives. The Company’s total borrowing capacity remaining under the accounts receivable securitization and the senior secured credit facility was $328 million (due to a $10 million reduction for letters of credit) as of September 30, 2018.
Management believes that the Company has sufficient liquidity based on its current cash position, cash generated from business operations and existing financing to meet its required pension and other postretirement plan contributions, debt servicing obligations, tax-related and other contractual commitments, as well as operating requirements for the next twelve months.
OFF-BALANCE SHEET ARRANGEMENTS
As of September 30, 2018, Valvoline has no contractual obligations that are reasonably likely to have a material effect on the Company’s consolidated financial statements that are not fully recorded on the Consolidated Balance Sheets or fully disclosed in the Notes to Consolidated Financial Statements. As part of Valvoline’s normal course of business, it is a party to certain financial guarantees and other commitments, and while these arrangements involve elements of performance and credit risk that are not included in the Consolidated Balance Sheets, such risk is not currently considered reasonably likely to have a material effect on the Company’s consolidated financial statements. The possibility that Valvoline would have to make actual cash expenditures in connection with these obligations is largely dependent on the performance of the party whose obligations Valvoline guarantees, or the occurrence of future events.
NEW ACCOUNTING PRONOUNCEMENTS
For a discussion and analysis of recently issued and adopted accounting pronouncements and the impact on Valvoline, refer to Note 2 of the Notes to Consolidated Financial Statements in Item 8 of Part II of this Annual Report on Form 10-K.
CRITICAL ACCOUNTING POLICIES AND ESTIMATES
The preparation of Valvoline’s consolidated financial statements in conformity with U.S. GAAP requires management to make estimates and assumptions that affect the reported amounts of assets, liabilities, sales and expenses, and the disclosures of contingent matters. Significant items that are subject to such estimates and assumptions include, but are not limited to, long-lived assets (including intangible assets and goodwill), customer incentives, employee benefit obligations and income taxes. Although
45
management bases its estimates on historical experience and various other assumptions that are believed to be reasonable under the circumstances, actual results could differ significantly from the estimates under different assumptions or conditions.
Valuation of goodwill and other intangible assets
Goodwill and other intangible assets are primarily established based on the allocation of purchase consideration to the assets acquired and liabilities assumed based on their fair values as of the acquisition date. During fiscal 2018, Valvoline acquired
136
service center stores for an aggregate purchase price of
$125 million
. The excess of the fair value of purchase consideration over the fair value of these assets acquired and liabilities assumed is recorded as goodwill. When determining the fair values of assets acquired and liabilities assumed, management makes significant estimates and assumptions, particularly with respect to intangible assets. Critical estimates in valuing intangible assets include, but are not limited to, expected future cash flows, which includes consideration of future growth rates and margins, customer attrition rates, future changes in technology and brand awareness, and discount rates. Fair value estimates are based on the assumptions management believes a market participant would use in pricing the asset or liability. Identifiable intangible assets are primarily comprised of trademarks and trade names, reacquired franchise rights, and customer relationships.
Goodwill
Goodwill is tested at the reporting unit level for impairment on an annual basis during the fourth quarter as of July 1 or more frequently if certain events occur indicating that the carrying value of goodwill may be impaired. Judgment is involved in determining if an indicator of impairment has occurred. Such indicators may include a decline in expected cash flows, a significant adverse change in legal factors or in the business climate, a decision to sell a business, unanticipated competition, or slower growth rates, among others. Valvoline’s reporting units are consistent with its reportable segments of Core North America ($89 million in goodwill as of September 30, 2018), Quick Lubes ($252 million in goodwill as of September 30, 2018), and International ($40 million in goodwill as of September 30, 2018).
In evaluating goodwill for impairment, Valvoline has the option to first perform a qualitative assessment to determine whether further impairment testing is necessary or to perform a quantitative assessment by comparing the fair value of a reporting unit to its carrying amount, including goodwill. Under the qualitative assessment, an entity is not required to calculate the fair value of a reporting unit unless the entity determines that it is more likely than not that its fair value is less than its carrying amount. Qualitative factors include macroeconomic conditions, industry and market conditions, cost factors, and overall financial performance, among others. These factors require significant judgment and estimates and application of alternative assumptions could produce different results.
If under the quantitative assessment, the fair value of a reporting unit is less than its carrying amount, then the amount of the impairment loss, if any, must be measured under step two of the impairment analysis. In step two of the analysis, an impairment loss will be recorded equal to the excess of the carrying value of the reporting unit’s goodwill over its implied fair value. Fair values of the reporting units are estimated using a weighted methodology considering the output from both the income and market approaches. The income approach incorporates the use of a discounted cash flow (“DCF”) analysis. A number of significant assumptions and estimates are involved in the application of the DCF model to forecast operating cash flows, including markets and market shares, sales volumes and prices, costs to produce, tax rates, capital spending, discount rate and working capital changes. Several of these assumptions vary among reporting units, and the cash flow forecasts are generally based on approved strategic operating plans. The market approach is performed using the Guideline Public Companies method which is based on earnings multiple data. The Company also performs a reconciliation between market capitalization and the estimate of the aggregate fair value of the reporting units, including consideration of a control premium.
Valvoline elected to perform a qualitative assessment during fiscal 2018 and 2017 and determined that it is more likely than not that the fair values of Valvoline’s reporting units are in excess of carrying amounts. In fiscal 2016, a quantitative assessment indicated that each reporting unit had a fair value that exceeded carrying value by 300% and more.
Valvoline’s assessment of an impairment on goodwill could change in future periods if any or all of the following events were to occur with respect to a particular reporting unit: a significant change in projected business results, a divestiture decision, significant changes to certain cash flow assumptions, economic deterioration that is more severe or of a longer duration than anticipated, or other significant economic events.
Other intangible assets
Total other intangible assets were $67 million, net of $9 million of accumulated amortization as of September 30, 2018. Other intangible assets are evaluated for impairment whenever events or changes in circumstances indicate the carrying amount of an asset may not be recoverable. Various factors are considered in determining whether a trigger requiring impairment assessment has
46
occurred, such as changes in the expected use of the assets, changes in technology or development of alternative assets, changes in economic conditions, changes in operating performance and changes in expected future cash flows.
If the future undiscounted cash flows result in a value that is less than the carrying value, then the intangible asset is considered impaired and a loss is recognized based on the amount by which the carrying amount exceeds the estimated fair value. Fair value is determined based on the highest and best use of the assets considered from the perspective of market participants, which may be different than the Company’s actual intended use of the assets. Judgment is involved in identifying impairment triggering events, determining asset groups, future undiscounted cash flows and the fair value of asset groups.
There were no significant impairments recorded by the Company during fiscal 2018, 2017 or 2016.
Customer incentives
Valvoline recognizes revenue when persuasive evidence of an arrangement exists, products are delivered or services are rendered, the sales price is fixed or determinable and collectability is reasonably assured. Provisions are made at the time of revenue recognition for sales rebates and discounts consisting primarily of promotional rebates and customer pricing discounts. These provisions are recorded as a reduction of revenue based on contract terms and the Company’s historical experience with similar programs and require management’s judgment with respect to estimating customer participation and performance levels. Differences between estimated expense and actual sales incentives realized are generally immaterial and are recognized in earnings in the period such differences are determined. The cost of these programs recognized as a reduction of sales totaled $357 million, $360 million and $388 million in the Consolidated Statements of Comprehensive Income for the years ended September 30, 2018, 2017 and 2016, respectively. A 10% change in the reserves for customer incentive programs as of September 30, 2018 would have affected net earnings by approximately $6 million in fiscal 2018.
Employee benefit obligations
Valvoline sponsors defined benefit pension and other postretirement plans in the U.S and in certain countries outside the U.S. The majority of these plans were transferred to and assumed by the Company in the Contribution of certain of Ashland’s pension and other postretirement benefit obligations and plan assets in late fiscal 2016. Following the Contribution, Valvoline accounts for these obligations as single-employer plans for which Valvoline recognizes the unfunded plan liabilities and the full amount of any costs or gains. Valvoline also has certain international single-employer pension plans for which the net liabilities and associated costs have been recognized in each period presented herein.
As of September 30, 2018, Valvoline’s net unfunded pension and other postretirement plan liabilities included in the Consolidated Balance Sheets totaled $346 million, and the U.S. plans represented 95% of this total employee benefit obligation. Total pension and other postretirement net periodic benefit costs included in the Consolidated Statements of Comprehensive Income for the year ended September 30, 2018 were:
|
(In millions)
|
2018
|
|||
|
Service costs
|
$
|
2
|
|
|
|
Non-service pension and other postretirement net periodic income
(a)
|
(38
|
)
|
||
|
Losses on pension and other postretirement plans remeasurement
(b)
|
38
|
|
||
|
Total pension and other postretirement net periodic benefit costs
|
$
|
2
|
|
|
|
(a)
|
Non-service pension and other postretirement net periodic income includes the expected return on plan assets and amortization of prior service credit, net of interest costs.
|
|
(b)
|
Losses on pension and other postretirement plans remeasurement include the change in the actual return on plan assets and net actuarial losses upon remeasurement as of September 30, 2018.
|
Valvoline recognizes the change in the fair value of plan assets and the net actuarial gains and losses calculated using updated actuarial assumptions as of the measurement date, which for Valvoline is September 30, and when a plan qualifies for an interim remeasurement. The remaining components of pension and other postretirement benefits income are recorded ratably on a quarterly basis. Due to the freeze of U.S. pension benefits effective September 30, 2016, continuing service costs are limited to certain international pension plans, and are reported in the same caption of the Consolidated Statements of Comprehensive Income as the related employee payroll expenses. All components of net periodic benefit income other than service cost are recognized below operating income within Net pension and other postretirement plan income in the Consolidated Statements of Comprehensive Income.
47
Actuarial assumptions
The Company’s pension and other postretirement benefit costs and obligations are dependent on actuarial valuations and various assumptions that attempt to anticipate future events and are used in calculating the expense and liabilities relating to these plans. These assumptions include estimates and judgments the Company makes about interest rates, expected long-term investment return on plan assets, rate of increase in healthcare costs, rates of future compensation increases and mortality. Though management considers current market conditions and other relevant factors in establishing these assumptions, the actuarial assumptions used may differ materially from actual results due to changing market and economic conditions, longer or shorter life spans of participants, and differences between the actual and expected return on plan assets. These differences may result in a significant impact to the amount of pension or other postretirement benefits cost recorded or that may be recorded.
Changes in assumptions or asset values may have a significant effect on the measurement of expense or income. Significant assumptions the Company must review and set annually and at each measurement date related to its pension and other postretirement benefit obligations are:
|
•
|
Expected long-term return on plan assets — Based on long-term historical actual asset return information, the mix of investments that comprise plan assets and future estimates of long-term investment returns. The Company also deducts various expenses using the fair value of plan assets to estimate expense. The weighted-average long-term expected rate of return on assets assumption was 5.17% for fiscal 2018. In fiscal 2018, the global pension plan assets generated an actual weighted-average return of (1.1)%, primarily driven by the market performance of U.S. plan assets based on the Company’s investment strategy to hedge plan assets with the movement in liabilities related to changes in the interest rates. However, the expected return on plan assets is designed to be a long-term assumption, and therefore, actual returns will be subject to year-to-year variances. The U.S. pension plans comprise the most significant portion of plan assets, and for fiscal 2019, the expected rate of return on assets assumption for the U.S. pension plans will be 4.70%. The expected long-term return on plan assets assumption has no impact on the reported net liability or net actuarial gains or losses upon remeasurement, but does impact the recognition of recurring non-service net periodic income recorded ratably on a quarterly basis.
|
Valvoline’s pension plans hold a variety of investments designed to diversify risk. Plan assets are invested in equity securities, government and agency securities, corporate debt, other non-traditional assets such as hedge funds. The investment goal of the pension plans is to achieve an adequate net investment return to provide for future benefit payments to its participants. U.S. target asset allocation percentages as of September 30, 2018 were 25% equity and 75% fixed income investments. The U.S. pension plans are managed by professional investment managers that operate under investment management contracts that include specific investment guidelines, requiring among other actions, adequate diversification and prudent use of risk management practices such as portfolio constraints relating to established benchmarks. Valvoline’s investment strategy and management practices relative to plan assets of non-U.S. plans generally are consistent except in those countries where investment of plan assets is dictated by applicable regulations.
|
•
|
Discount rate — Reflects the rates at which benefits could effectively be settled and is based on current investment yields of high-quality corporate bonds. Consistent with historical practice, the Company uses an actuarially-developed full yield curve approach, the above mean yield curve, to match the timing of cash flows of expected future benefit payments from the plans by applying specific spot rates along the yield curve to determine the assumed discount rate. Valvoline’s fiscal 2018 expense, excluding actuarial gains and losses, for both U.S. and non-U.S. pension plans was determined using the spot discount rate as of the beginning of the fiscal year. The service cost and interest cost discount rates for fiscal 2018 pension expense were 2.94% and 3.23%, respectively, and 4.05% and 3.11%, respectively, for other postretirement expense. The weighted-average discount rate at the end of fiscal 2018 was 4.28% for the pension plans and 4.08% for the postretirement health and life plans.
|
|
•
|
Mortality — Based on the Society of Actuaries RP-2014 mortality base tables with mortality improvements after 2006 removed and replaced with a mortality improvement scale based on the intermediate projection in the Social Security Administration’s Annual Trustees Report released in 2018. Valvoline believes the updated mortality improvement scales provide a reasonable assessment of current mortality trends and is an appropriate estimate of future mortality projections.
|
|
•
|
Rate of compensation increase — This assumption is no longer applicable to the U.S. pension plans due to the benefit accrual freeze as of September 30, 2016. In addition, some of the non-U.S. pension plans are also frozen, while those that remain open relate to areas where local laws require plans to operate within the applicable country. The weighted-average rate of compensation increase assumption for these non-U.S. plans was 3.05% for fiscal 2018.
|
|
•
|
Healthcare cost trend rate — Because Valvoline’s retiree healthcare plans contain various caps that limit Valvoline’s contributions and as medical inflation is expected to continue at a rate in excess of these caps, the healthcare cost trend rate has not had a significant impact on Valvoline’s postretirement healthcare benefit costs.
|
48
The following table illustrates the estimated increases in pension and other postretirement expense that would have resulted from a one percentage point change in each of the following significant assumptions in the years ended September 30:
|
(In millions)
|
2018
|
2017
|
||||||
|
Increase in pension costs from:
|
||||||||
|
Decrease in the discount rate
|
$
|
237
|
|
$
|
281
|
|
||
|
Increase in the salary adjustment rate
|
$
|
1
|
|
$
|
1
|
|
||
|
Increase in other postretirement costs from:
|
||||||||
|
Decrease in the discount rate
|
$
|
5
|
|
$
|
6
|
|
||
Based on the Company’s investing strategy, plan assets hedge approximately 85% of the movement in liabilities related to changes in interest rates for the Company’s U.S. qualified pension plan, which comprises a substantial portion of Valvoline’s total employee benefit plan obligation.
For the year ended September 30, 2018, the asset and actuarial net losses on pension and other postretirement benefit plan remeasurements reflected below operating income were $38 million, which were primarily attributed to lower than expected returns on plan assets, partially offset by increases in discount rates and reduced mortality improvements.
Income taxes
Valvoline is subject to income taxes in the United States and numerous international jurisdictions. Judgment in forecasting the taxable income using historical and projected future operating results is required in determining Valvoline’s provision for income taxes and the related assets and liabilities. Each increase of $4 million to income tax expense would impact the fiscal 2018 effective tax rate by one percentage point.
The provision for income taxes includes current income taxes as well as deferred income taxes. Under U.S. GAAP, deferred tax assets and liabilities are determined based on differences between the financial reporting and tax basis of assets and liabilities and are measured using enacted tax rates and laws that are expected to be in effect when the deferred assets or liabilities are expected to be settled or realized. The effect of changes in tax rates on deferred taxes is recognized in the period in which such changes are enacted.
On December 22, 2017, the President of the United States signed into law tax reform legislation, which generally became effective January 1, 2018. Among other things, this legislation lowered the U.S. statutory tax rate from 35% to 21%, broadened the base to which U.S. income tax applies, imposed a one-time, deemed repatriation tax on net undistributed earnings of non-U.S. subsidiaries not previously subject to U.S. income tax, and effectively created a new minimum tax on certain future non-U.S. earnings. The SEC issued guidance on accounting for the impact of this tax legislation that allows companies to record provisional amounts to the extent that they are reasonably estimable and adjust them over time as more information becomes available, not to extend beyond the measurement period of one year from the enactment of the legislation. As a result of this legislation, Valvoline recorded provisional income tax expense in fiscal 2018 of approximately $70 million, which was primarily related to the remeasurement of net deferred tax assets and to reflect the new tax rate and the deemed repatriation tax.
Prior to the Act, the Company had not provided for U.S. income taxes on undistributed earnings and other outside basis differences of its non-U.S. subsidiaries as it was the Company’s intention for these tax basis differences to remain indefinitely reinvested. As these tax basis differences were subject to the deemed repatriation tax, the Company reevaluated its indefinite reinvestment assertion and no longer intends to indefinitely reinvest the Company’s non-U.S. undistributed earnings. As a result, Valvoline recorded estimated withholding taxes on current and undistributed earnings of non-U.S. subsidiaries. Certain other outside basis differences restricted by regulations, operational or investing needs for non-U.S. subsidiaries remains indefinitely reinvested.
Although management believes that the judgments and estimates discussed herein are reasonable, the ultimate impact of tax reform legislation may differ from the provisional amounts estimated due to further refinement of the Company’s estimates through the measurement period, changes in interpretations and assumptions made, or actions that may be taken as a result of the legislation.
In response to U.S. tax reform legislation, many states have also enacted state specific tax reform and legislation, which in general, have not been material to the Company’s consolidated financial statements. Valvoline is incorporated in Kentucky, which enacted income tax reform on April 13, 2018. The provisions of Kentucky tax reform generally become effective in fiscal 2019 and include a number of provisions, notably lowering the corporate income tax rate from a maximum of 6% to 5%. As a result of this legislation, Valvoline recorded income tax expense in fiscal 2018 of approximately $8 million, which was primarily related to the remeasurement of deferred tax assets and to reflect the new tax rate. The Company continues to monitor enacted state and other legislation and makes relevant updates to its accounting for income taxes when warranted.
49
Valuation allowances are established when necessary on a jurisdictional basis to reduce deferred tax assets to the amounts expected to be realized when it is more likely than not that some portion or all of a deferred tax asset will not be realized. The determination as to whether a deferred tax asset will be realized is based on the evaluation of positive and negative evidence, which includes historical profitability, future market growth, future taxable income, the expected timing of the reversals of existing temporary differences and tax planning strategies. The Company assesses deferred taxes and the adequacy or need for a valuation allowance on a quarterly basis. As of September 30, 2018, the Company had $138 million of net deferred tax assets, including $7 million in valuation allowances. If the Company is unable to generate sufficient future taxable income, there is a material change in the actual effective tax rates, the time period within which the underlying temporary differences become taxable or deductible, or if the tax laws change unfavorably, then Valvoline could be required to increase the valuation allowance against deferred tax assets, resulting in an increase in income tax expense and the effective tax rate.
As a result of the separation from Ashland, Valvoline agreed to indemnify Ashland for certain income tax matters. As of September 30, 2018, Valvoline’s liability for these estimated indemnification obligations is $66 million. Valvoline records a liability when it is probable and reasonably estimable that indemnification will be due to Ashland and makes adjustments through earnings in the period that changes are known. Certain of these estimates require management to forecast its use of tax attributes generated in the pre-Distribution periods, as well as to evaluate the likelihood and potential magnitude of tax positions taken in consolidated Ashland returns in the periods prior to Distribution expected to be sustained upon examination by the taxing authorities.
The Company is subject to ongoing tax examinations and assessments in various jurisdictions, including those in the pre-Distribution periods. At any time, multiple tax years are subject to audit by the various tax authorities and a number of years may elapse before a particular matter, for which a liability has been established, is audited and fully resolved or clarified. In evaluating the exposures associated with various tax filing positions, including its indemnification obligations to Ashland, the Company may record liabilities for such exposures. The Company’s liabilities for these matters are currently primarily recorded within its indemnification obligation to Ashland. Valvoline generally adjusts its liabilities for unrecognized tax benefits and related indemnification obligations through earnings in the period in which an uncertain tax position is effectively settled, the statute of limitations expires for the relevant taxing authority to examine the tax position or when more information becomes available. Although management believes that the judgments and estimates discussed herein are reasonable, actual results could differ, and may materially increase or decrease the effective tax rate, as well as impact the Company’s operating results.
Valvoline is exposed to market risks arising from adverse changes in:
|
•
|
Currency exchange rates;
|
|
•
|
Inflation and changing prices;
|
|
•
|
Interest rates; and
|
|
•
|
Credit risk.
|
Currency exchange risk
A significant portion of Valvoline’s operations and revenue occur outside the U.S., and in currencies other than the U.S. Dollar, and the Company’s results can be significantly impacted by changes in currency exchange rates. Valvoline’s currency risk is primarily limited to the Euro, Australian Dollar, Canadian Dollar and Chinese Yuan with respect to sales, profits, and assets and liabilities denominated in currencies other than the U.S. Dollar. Although the Company uses financial instruments to hedge certain currency risks, Valvoline is not fully protected against currency fluctuations and reported results of operations could be affected by changes in currency exchange rates. Valvoline believes its currency risk is limited as 72% of Valvoline’s revenue during the years ended September 30, 2018, 2017 and 2016 are attributed to the sales in the United States. Valvoline does not have material exposures to market risk with respect to investments.
To manage exposures and mitigate the impact of currency fluctuations on the operations of non-U.S. subsidiaries, the Company uses derivatives not designated as hedging instruments consisting primarily of forward contracts to hedge currency denominated balance sheet exposures. For these derivatives, changes in the fair value are recognized in income to offset the gain or loss on the hedged item in the same period as the remeasurement losses and gains of the related foreign currency-denominated exposures. The Company utilizes derivative instruments that are purchased exclusively from highly-rated financial institutions. These contracts are recorded on the Consolidated Balance Sheets as assets or liabilities at fair market value based upon market price quotations. The Company did not transact or have open any hedging contracts with respect to commodities as of and for the year ended September 30, 2018, nor does Valvoline employ derivatives for trading or speculative purposes.
For purposes of analyzing potential risk, sensitivity analysis is used to quantify potential impacts that market rate changes may have on the fair values of the Company’s derivative portfolio. The sensitivity analysis represents the hypothetical changes in value of the
50
derivative and does not reflect the related gain or loss on the forecasted underlying exposure. A 10% appreciation or depreciation in the value of the U.S. Dollar against non-U.S. currencies from the prevailing market rates would have resulted in a corresponding increase or decrease of $7 million as of September 30, 2018 in the fair value of open derivative contracts. The Company expects that any increase or decrease in the fair value of the portfolio would be substantially offset by increases or decreases in the underlying exposures.
The U.S. Dollar was weaker in 2018 compared to 2017 based on comparable weighted averages for the Company’s functional currencies. This had a favorable impact of 0.9% on 2018 revenue versus 2017 revenue. This excludes the effects of derivative activities, and therefore, does not reflect the actual impact of fluctuations in exchange rates on the Company’s operating income.
Inflation and changing prices
Valvoline’s financial statements are prepared on the historical cost method of accounting in accordance with U.S. GAAP, and as a result, do not reflect changes in the purchasing power of the U.S. Dollar. Monetary assets (such as cash, cash equivalents and accounts receivable) lose purchasing power as a result of inflation, while monetary liabilities (such as accounts payable and indebtedness) result in a gain, because they can be settled with dollars of diminished purchasing power. As of September 30,
2018
, Valvoline’s monetary assets were less than its monetary liabilities, leaving the Company currently less exposed to the effects of future inflation.
Replacement costs for Valvoline’s plants and equipment generally would exceed their historical costs. Accordingly, depreciation expense would be greater if it were based on current replacement costs. However, because replacement facilities and assets would reflect technological improvements and changes in business strategies, these would be expected to be more productive than existing assets, mitigating at least part of the risk of changing prices.
Valvoline uses the last-in, first-out (“LIFO”) method to value a portion of its inventories to provide a better matching of revenues with current costs. However, LIFO values such inventories below their replacement costs during inflationary periods.
Interest rate risk
The Company is subject to interest rate risk principally in relation to variable-rate debt. Approximately 58% of the Company’s outstanding borrowings as of September 30, 2018 had fixed rates. The increase in pre-tax interest expense for the year ended September 30, 2018 from a hypothetical 100 basis point increase in variable interest rates would be approximately $6 million.
Concentrations of credit risk
The Company is potentially subject to concentrations of credit risk on accounts receivable and financial instruments, such as derivative instruments and cash and cash equivalents. Credit risk includes the risk of nonperformance by counterparties. The maximum potential loss may exceed the amount recognized on the balance sheet. Exposure to credit risk is managed through credit approvals, credit limits, selecting highly-rated financial institutions as counterparties to transactions and monitoring procedures. To mitigate losses in the event of nonperformance by counterparties in derivative transactions, Valvoline has entered into master netting arrangements that allow settlement with counterparties on a net basis. Valvoline’s business often involves large transactions with customers for which the Company does not require collateral. If one or more of those customers were to default in its obligations under applicable contractual arrangements, the Company could be exposed to potentially significant losses. Moreover, a prolonged downturn in the global economy could have an adverse impact on the ability of customers to pay their obligations on a timely basis. The Company believes that the reserves for potential losses are adequate. As of September 30, 2018, there was not a significant concentration of credit risk related to financial instruments.
51
|
Index to Financial Statements and Supplementary Data
|
Page
|
52
Report of Independent Registered Public Accounting Firm
To the Stockholders and Board of Directors of
Valvoline Inc. and Consolidated Subsidiaries
Opinion on the Financial Statements
We have audited the accompanying consolidated balance sheets of Valvoline Inc. and Consolidated Subsidiaries (the Company) as of September 30, 2018 and 2017, the related consolidated statements of comprehensive income, stockholders’ deficit and cash flows for each of the three years in the period ended September 30, 2018, and the related notes and financial statement schedule listed in the Index at Item 15(a) (collectively referred to as the “consolidated financial statements”). In our opinion, the consolidated financial statements present fairly, in all material respects, the financial position of the Company at September 30, 2018 and 2017, and the results of its operations and its cash flows for each of the three years in the period ended September 30, 2018, in conformity with U.S. generally accepted accounting principles.
We also have audited, in accordance with the standards of the Public Company Accounting Oversight Board (United States) (PCAOB), the Company's internal control over financial reporting as of September 30, 2018, based on criteria established in Internal Control-Integrated Framework issued by the Committee of Sponsoring Organizations of the Treadway Commission (2013 framework), and our report dated November 21, 2018, expressed an unqualified opinion thereon.
Basis for Opinion
These financial statements are the responsibility of the Company's management. Our responsibility is to express an opinion on the Company’s financial statements based on our audits. We are a public accounting firm registered with the PCAOB and are required to be independent with respect to the Company in accordance with the U.S. federal securities laws and the applicable rules and regulations of the Securities and Exchange Commission and the PCAOB.
We conducted our audits in accordance with the standards of the PCAOB. Those standards require that we plan and perform the audit to obtain reasonable assurance about whether the financial statements are free of material misstatement, whether due to error or fraud. Our audits included performing procedures to assess the risks of material misstatement of the financial statements, whether due to error or fraud, and performing procedures that respond to those risks. Such procedures included examining, on a test basis, evidence regarding the amounts and disclosures in the financial statements. Our audits also included evaluating the accounting principles used and significant estimates made by management, as well as evaluating the overall presentation of the financial statements. We believe that our audits provide a reasonable basis for our opinion.
/s/ Ernst & Young LLP
We have served as the Company’s auditor since 2016.
Cincinnati, Ohio
November 21, 2018
53
|
Valvoline Inc. and Consolidated Subsidiaries
|
||||||||||||
|
|
||||||||||||
|
Years ended September 30
|
||||||||||||
|
(In millions except per share amounts)
|
2018
|
2017
|
2016
|
|||||||||
|
Sales
|
$
|
2,285
|
|
$
|
2,084
|
|
$
|
1,929
|
|
|||
|
Cost of sales
|
1,479
|
|
1,308
|
|
1,181
|
|
||||||
|
Gross profit
|
806
|
|
776
|
|
748
|
|
||||||
|
Selling, general and administrative expenses
|
430
|
|
396
|
|
365
|
|
||||||
|
Legacy and separation-related expenses, net
|
14
|
|
11
|
|
6
|
|
||||||
|
Equity and other income, net
|
(33
|
)
|
(25
|
)
|
(19
|
)
|
||||||
|
Operating income
|
395
|
|
394
|
|
396
|
|
||||||
|
Net pension and other postretirement plan income
|
—
|
|
(138
|
)
|
(35
|
)
|
||||||
|
Net interest and other financing expenses
|
63
|
|
42
|
|
9
|
|
||||||
|
Net loss on acquisition
|
—
|
|
—
|
|
1
|
|
||||||
|
Income before income taxes
|
332
|
|
490
|
|
421
|
|
||||||
|
Income tax expense
|
166
|
|
186
|
|
148
|
|
||||||
|
Net income
|
$
|
166
|
|
$
|
304
|
|
$
|
273
|
|
|||
|
NET INCOME PER SHARE
|
||||||||||||
|
Basic
|
$
|
0.84
|
|
$
|
1.49
|
|
$
|
1.60
|
|
|||
|
Diluted
|
$
|
0.84
|
|
$
|
1.49
|
|
$
|
1.60
|
|
|||
|
WEIGHTED AVERAGE COMMON SHARES OUTSTANDING
|
||||||||||||
|
Basic
|
197
|
|
204
|
|
170
|
|
||||||
|
Diluted
|
197
|
|
204
|
|
170
|
|
||||||
|
DIVIDENDS PAID PER COMMON SHARE
|
$
|
0.30
|
|
$
|
0.20
|
|
$
|
—
|
|
|||
|
COMPREHENSIVE INCOME
|
||||||||||||
|
Net income
|
$
|
166
|
|
$
|
304
|
|
$
|
273
|
|
|||
|
Other comprehensive (loss) income, net of tax
|
||||||||||||
|
Currency translation adjustments
|
(10
|
)
|
7
|
|
8
|
|
||||||
|
Amortization of pension and other postretirement plan prior service credit
|
(9
|
)
|
(8
|
)
|
(1
|
)
|
||||||
|
Other comprehensive (loss) income
|
(19
|
)
|
(1
|
)
|
7
|
|
||||||
|
Comprehensive income
|
$
|
147
|
|
$
|
303
|
|
$
|
280
|
|
|||
See Notes to Consolidated Financial Statements.
54
|
Valvoline Inc. and Consolidated Subsidiaries
|
||||||||
|
|
||||||||
|
As of September 30
|
||||||||
|
(In millions except per share amounts)
|
2018
|
2017
|
||||||
|
Assets
|
||||||||
|
Current assets
|
||||||||
|
Cash and cash equivalents
|
$
|
96
|
|
$
|
201
|
|
||
|
Accounts receivable, net
|
409
|
|
385
|
|
||||
|
Inventories, net
|
176
|
|
175
|
|
||||
|
Prepaid expenses and other current assets
|
44
|
|
29
|
|
||||
|
Total current assets
|
725
|
|
790
|
|
||||
|
Noncurrent assets
|
||||||||
|
Property, plant and equipment, net
|
420
|
|
391
|
|
||||
|
Goodwill and intangibles, net
|
448
|
|
335
|
|
||||
|
Equity method investments
|
31
|
|
30
|
|
||||
|
Deferred income taxes
|
138
|
|
281
|
|
||||
|
Other noncurrent assets
|
92
|
|
88
|
|
||||
|
Total noncurrent assets
|
1,129
|
|
1,125
|
|
||||
|
Total assets
|
$
|
1,854
|
|
$
|
1,915
|
|
||
|
Liabilities and Stockholders’ Deficit
|
||||||||
|
Current liabilities
|
||||||||
|
Short-term debt
|
$
|
—
|
|
$
|
75
|
|
||
|
Current portion of long-term debt
|
30
|
|
15
|
|
||||
|
Trade and other payables
|
178
|
|
192
|
|
||||
|
Accrued expenses and other liabilities
|
203
|
|
196
|
|
||||
|
Total current liabilities
|
411
|
|
478
|
|
||||
|
Noncurrent liabilities
|
||||||||
|
Long-term debt
|
1,292
|
|
1,034
|
|
||||
|
Employee benefit obligations
|
333
|
|
342
|
|
||||
|
Other noncurrent liabilities
|
176
|
|
178
|
|
||||
|
Total noncurrent liabilities
|
1,801
|
|
1,554
|
|
||||
|
Commitments and contingencies
|
|
|
||||||
|
Stockholders’ deficit
|
||||||||
|
Preferred stock, no par value, 40 shares authorized; no shares issued and outstanding
|
—
|
|
—
|
|
||||
|
Common stock, par value $0.01 per share, 400 shares authorized, 188 and 203 shares issued and outstanding at September 30, 2018 and 2017, respectively
|
2
|
|
2
|
|
||||
|
Paid-in capital
|
7
|
|
5
|
|
||||
|
Retained deficit
|
(399
|
)
|
(167
|
)
|
||||
|
Accumulated other comprehensive income
|
32
|
|
43
|
|
||||
|
Total stockholders
’
deficit
|
(358
|
)
|
(117
|
)
|
||||
|
Total liabilities and stockholders’ deficit
|
$
|
1,854
|
|
$
|
1,915
|
|
||
See Notes to Consolidated Financial Statements.
55
|
Valvoline Inc. and Consolidated Subsidiaries
|
|||||||||||||||||||||||||||
|
Consolidated Statements of Stockholders’ Deficit
|
|||||||||||||||||||||||||||
|
Paid-in capital
|
Retained deficit
|
Accumulated other comprehensive (loss) income
|
Ashland’s net investment
|
Total
|
|||||||||||||||||||||||
|
Common stock
|
|||||||||||||||||||||||||||
|
(In millions except per share amounts)
|
Shares
|
Amount
|
|||||||||||||||||||||||||
|
Balance at September 30, 2015
|
—
|
|
$
|
—
|
|
$
|
—
|
|
$
|
—
|
|
$
|
(61
|
)
|
$
|
678
|
|
$
|
617
|
|
|||||||
|
Net income
|
—
|
|
—
|
|
—
|
|
—
|
|
—
|
|
273
|
|
273
|
|
|||||||||||||
|
Net transfers to Ashland
|
—
|
|
—
|
|
—
|
|
—
|
|
—
|
|
(1,500
|
)
|
(1,500
|
)
|
|||||||||||||
|
Contribution of net liabilities from Ashland
|
—
|
|
—
|
|
—
|
|
—
|
|
51
|
|
(490
|
)
|
(439
|
)
|
|||||||||||||
|
Issuance of common stock to Ashland and in connection with initial public offering, net of offering costs
|
205
|
|
2
|
|
710
|
|
—
|
|
—
|
|
—
|
|
712
|
|
|||||||||||||
|
Currency translation adjustments
|
—
|
|
—
|
|
—
|
|
—
|
|
8
|
|
—
|
|
8
|
|
|||||||||||||
|
Amortization of pension and other postretirement prior service credits in income
|
—
|
|
—
|
|
—
|
|
—
|
|
(1
|
)
|
—
|
|
(1
|
)
|
|||||||||||||
|
Balance at September 30, 2016
|
205
|
|
2
|
|
710
|
|
—
|
|
(3
|
)
|
(1,039
|
)
|
(330
|
)
|
|||||||||||||
|
Net income
|
—
|
|
—
|
|
—
|
|
304
|
|
—
|
|
—
|
|
304
|
|
|||||||||||||
|
Contribution of net liabilities from Ashland
|
—
|
|
—
|
|
—
|
|
(55
|
)
|
47
|
|
(2
|
)
|
(10
|
)
|
|||||||||||||
|
Net transfers from Ashland
|
—
|
|
—
|
|
—
|
|
—
|
|
—
|
|
5
|
|
5
|
|
|||||||||||||
|
Distribution of Ashland’s net investment
|
—
|
|
—
|
|
(710
|
)
|
(326
|
)
|
—
|
|
1,036
|
|
—
|
|
|||||||||||||
|
Dividends paid, $0.196 per common share
|
—
|
|
—
|
|
—
|
|
(40
|
)
|
—
|
|
—
|
|
(40
|
)
|
|||||||||||||
|
Stock-based compensation
|
—
|
|
—
|
|
5
|
|
—
|
|
—
|
|
—
|
|
5
|
|
|||||||||||||
|
Repurchase of common stock
|
(2
|
)
|
—
|
|
—
|
|
(50
|
)
|
—
|
|
—
|
|
(50
|
)
|
|||||||||||||
|
Currency translation adjustments
|
—
|
|
—
|
|
—
|
|
—
|
|
7
|
|
—
|
|
7
|
|
|||||||||||||
|
Amortization of pension and other postretirement prior service credits in income
|
—
|
|
—
|
|
—
|
|
—
|
|
(8
|
)
|
—
|
|
(8
|
)
|
|||||||||||||
|
Balance at September 30, 2017
|
203
|
|
2
|
|
5
|
|
(167
|
)
|
43
|
|
—
|
|
(117
|
)
|
|||||||||||||
|
Net income
|
—
|
|
—
|
|
—
|
|
166
|
|
—
|
|
—
|
|
166
|
|
|||||||||||||
|
Dividends paid, $0.298 per common share
|
—
|
|
—
|
|
—
|
|
(58
|
)
|
—
|
|
—
|
|
(58
|
)
|
|||||||||||||
|
Stock-based compensation
|
—
|
|
—
|
|
9
|
|
—
|
|
—
|
|
—
|
|
9
|
|
|||||||||||||
|
Repurchase of common stock
|
(15
|
)
|
—
|
|
—
|
|
(325
|
)
|
—
|
|
—
|
|
(325
|
)
|
|||||||||||||
|
Purchase of remaining ownership interest in subsidiary
|
—
|
|
—
|
|
(7
|
)
|
(7
|
)
|
—
|
|
—
|
|
(14
|
)
|
|||||||||||||
|
Reclassification of income tax effects of U.S. tax reform
|
—
|
|
—
|
|
—
|
|
(8
|
)
|
8
|
|
—
|
|
|||||||||||||||
|
Currency translation adjustments
|
—
|
|
—
|
|
—
|
|
—
|
|
(10
|
)
|
—
|
|
(10
|
)
|
|||||||||||||
|
Amortization of pension and other postretirement prior service credits in income
|
—
|
|
—
|
|
—
|
|
—
|
|
(9
|
)
|
—
|
|
(9
|
)
|
|||||||||||||
|
Balance at September 30, 2018
|
188
|
|
$
|
2
|
|
$
|
7
|
|
$
|
(399
|
)
|
$
|
32
|
|
$
|
—
|
|
$
|
(358
|
)
|
|||||||
See Notes to Consolidated Financial Statements.
56
|
Valvoline Inc. and Consolidated Subsidiaries
|
||||||||||||
|
|
Years ended September 30
|
|||||||||||
|
(In millions)
|
2018
|
2017
|
2016
|
|||||||||
|
Cash flows from operating activities
|
||||||||||||
|
Net income
|
$
|
166
|
|
$
|
304
|
|
$
|
273
|
|
|||
|
Adjustments to reconcile to cash flows from operations
|
||||||||||||
|
Depreciation and amortization
|
54
|
|
42
|
|
38
|
|
||||||
|
Debt issuance cost and discount amortization
|
3
|
|
3
|
|
4
|
|
||||||
|
Deferred income taxes
|
145
|
|
117
|
|
13
|
|
||||||
|
Equity income from unconsolidated affiliates, net of distributions
|
(4
|
)
|
(4
|
)
|
4
|
|
||||||
|
Pension contributions
|
(16
|
)
|
(412
|
)
|
(2
|
)
|
||||||
|
Loss (gain) on pension and other postretirement plan remeasurements
|
38
|
|
(68
|
)
|
(42
|
)
|
||||||
|
Stock-based compensation expense
|
12
|
|
9
|
|
—
|
|
||||||
|
Other, net
|
1
|
|
—
|
|
1
|
|
||||||
|
Change in assets and liabilities
(a)
|
||||||||||||
|
Accounts receivable
|
(38
|
)
|
(22
|
)
|
(17
|
)
|
||||||
|
Inventories
|
(4
|
)
|
(35
|
)
|
(4
|
)
|
||||||
|
Payables and accrued liabilities
|
(2
|
)
|
—
|
|
5
|
|
||||||
|
Other assets and liabilities
|
(35
|
)
|
(64
|
)
|
38
|
|
||||||
|
Total cash provided by (used in) operating activities
|
320
|
|
(130
|
)
|
311
|
|
||||||
|
Cash flows from investing activities
|
||||||||||||
|
Additions to property, plant and equipment
|
(93
|
)
|
(68
|
)
|
(66
|
)
|
||||||
|
Acquisitions, net of cash acquired
|
(125
|
)
|
(68
|
)
|
(83
|
)
|
||||||
|
Other investing activities, net
|
5
|
|
1
|
|
1
|
|
||||||
|
Total cash used in investing activities
|
(213
|
)
|
(135
|
)
|
(148
|
)
|
||||||
|
Cash flows from financing activities
|
||||||||||||
|
Net transfers from (to) Ashland
|
—
|
|
5
|
|
(1,504
|
)
|
||||||
|
Cash contributions from Ashland
|
—
|
|
—
|
|
60
|
|
||||||
|
Proceeds from initial public offering, net of offering costs of $40
|
—
|
|
—
|
|
719
|
|
||||||
|
Proceeds from borrowings, net of issuance costs
|
304
|
|
470
|
|
1,372
|
|
||||||
|
Repayments on borrowings
|
(108
|
)
|
(90
|
)
|
(637
|
)
|
||||||
|
Repurchases of common stock
|
(325
|
)
|
(50
|
)
|
—
|
|
||||||
|
Purchase of additional ownership in subsidiary
|
(15
|
)
|
—
|
|
—
|
|
||||||
|
Cash dividends paid
|
(58
|
)
|
(40
|
)
|
—
|
|
||||||
|
Other financing activities
|
(7
|
)
|
—
|
|
—
|
|
||||||
|
Total cash (used in) provided by financing activities
|
(209
|
)
|
295
|
|
10
|
|
||||||
|
Effect of currency exchange rate changes on cash and cash equivalents
|
(3
|
)
|
(1
|
)
|
(1
|
)
|
||||||
|
(Decrease) increase in cash and cash equivalents
|
(105
|
)
|
29
|
|
172
|
|
||||||
|
Cash and cash equivalents - beginning of year
|
201
|
|
172
|
|
—
|
|
||||||
|
Cash and cash equivalents - end of year
|
$
|
96
|
|
$
|
201
|
|
$
|
172
|
|
|||
|
Supplemental disclosures
|
||||||||||||
|
Interest paid
|
$
|
53
|
|
$
|
35
|
|
$
|
—
|
|
|||
|
Income taxes paid
|
$
|
26
|
|
$
|
26
|
|
$
|
17
|
|
|||
(a)
Excludes changes resulting from operations acquired or sold.
See Notes to Consolidated Financial Statements.
57
Valvoline Inc. and Consolidated Subsidiaries
Notes to Consolidated Financial Statements
Description of business
Valvoline Inc. (“Valvoline” or the “Company”) is a worldwide marketer and supplier of engine and automotive maintenance products and services. Valvoline is one of the most recognized and respected premium consumer brands in the global automotive lubricant industry, known for its high quality products and superior levels of service. Established in 1866, Valvoline’s heritage spans more than 150 years, during which it has developed powerful name recognition across multiple product and service channels.
Valvoline was incorporated in May 2016 as a subsidiary of Ashland Global Holdings Inc. (which together with its predecessors and consolidated subsidiaries is referred to herein as “Ashland”). Prior to this time, Valvoline operated as an unincorporated commercial unit of Ashland. Following a series of restructuring steps prior to the initial public offering (the “IPO”) of Valvoline common stock, the Valvoline business was transferred from Ashland to Valvoline such that the Valvoline business included substantially all of the historical Valvoline business reported by Ashland, as well as certain other legacy Ashland assets and liabilities transferred to Valvoline from Ashland (the “Contribution”). In connection with the IPO on September 28, 2016,
34.5 million
shares of Valvoline common stock were sold to investors and Ashland retained
170 million
shares representing
83%
of the total outstanding shares of Valvoline common stock.
On May 12, 2017, Ashland distributed all of its remaining interest in Valvoline to Ashland stockholders (the “Distribution”) through a pro rata dividend on shares of Ashland common stock outstanding at the close of business on the record date of May 5, 2017, which marked the completion of Valvoline’s separation from Ashland. Effective upon the Distribution, Ashland no longer owned any shares of Valvoline common stock, and Valvoline was no longer a controlled and consolidated subsidiary of Ashland.
Basis of presentation and consolidation
The accompanying consolidated financial statements have been prepared in accordance with accounting principles generally accepted in the United States of America (“U.S. GAAP”) and U.S. Securities and Exchange Commission (“SEC”) regulations. The financial statements are presented on a consolidated basis for all periods presented and include the accounts of the Company and its majority-owned and controlled subsidiaries. All intercompany transactions and balances within Valvoline have been eliminated in consolidation. Certain prior period amounts have been reclassified in the accompanying consolidated financial statements and notes thereto to conform to the current period presentation.
The Contribution of the Valvoline business by Ashland to Valvoline was treated as a reorganization of entities under common Ashland control. As a result, Valvoline retrospectively presented the consolidated financial statements of Valvoline and its subsidiaries for periods presented prior to the completion of the Contribution, which were prepared on a stand-alone basis and derived from Ashland’s consolidated financial statements and accounting records using the historical results of operations, and assets and liabilities attributed to Valvoline’s operations, as well as allocations of expenses from Ashland. The consolidated financial statements for periods presented subsequent to the completion of the Contribution reflect the transfer of various assets and liabilities from Ashland on a carryover basis (historical cost) and the consolidated operations of Valvoline and its majority-owned subsidiaries as a separate, stand-alone entity.
All transactions and balances between Valvoline and Ashland have been reported in the consolidated financial statements. For periods prior to the IPO, these transactions were considered to be effectively settled for cash at the time the transactions were recorded. These transactions and net cash transfers to and from Ashland’s centralized cash management system are reflected as a component of Ashland’s net investment in the Consolidated Statements of Stockholders’ Deficit and as a financing activity within the accompanying Consolidated Statements of Cash Flows. Ashland’s net investment represents the cumulative net investment by Ashland in Valvoline through the IPO, including net income through the completion of the IPO and net cash transfers to and from Ashland through Distribution. Valvoline’s retained earnings from the IPO through September 30, 2016 were not material and accordingly, were not separately presented in the Consolidated Statements of Stockholders’ Deficit. Concurrent with the Distribution, Ashland’s net investment in Valvoline was reduced to
zero
with a corresponding adjustment to
Paid-in capital
and
Retained deficit
.
Prior to the completion of the IPO, Valvoline utilized centralized functions of Ashland to support its operations, and in return, Ashland allocated certain of its expenses to Valvoline. These costs, together with an allocation of Ashland overhead costs, are included within
Selling, general and administrative expenses
in the Consolidated Statements of Comprehensive Income for the year ended September 30, 2016 and are disclosed in more detail in Note 18. Upon completion of the IPO, Valvoline assumed responsibility for the costs of these functions.
58
Valvoline’s significant accounting policies, which conform to U.S. GAAP and are applied on a consistent basis in all years presented, except when otherwise disclosed, are described below.
Use of estimates, risks and uncertainties
The preparation of the consolidated financial statements in conformity with U.S. GAAP requires management to make estimates and judgments that affect the reported amounts of assets, liabilities, revenues and expenses, and the disclosures of contingent matters. Significant items that are subject to such estimates and assumptions include, but are not limited to, long-lived assets (including intangible assets and goodwill), customer incentives, employee benefit obligations and income taxes. Although management bases its estimates on historical experience and various other assumptions that are believed to be reasonable under the circumstances, actual results could differ significantly from the estimates under different assumptions or conditions.
Cash and cash equivalents
All short-term, highly liquid investments having original maturities of three months or less are considered to be cash equivalents.
Accounts receivable and allowance for doubtful accounts
Valvoline records an allowance for doubtful accounts as a best estimate of the amount of probable credit losses for accounts receivable. Valvoline estimates the allowance for doubtful accounts based on a variety of factors, including the length of time receivables are past due, the financial health of its customers, macroeconomic conditions, past transaction history with the customer and changes in customer payment terms. If the financial condition of its customers deteriorates or other circumstances occur that result in an impairment of customers’ ability to make payments, the Company records additional allowances as needed. The Company writes off uncollectible accounts receivable against the allowance for doubtful accounts when collection efforts have been exhausted and/or any legal action taken by the Company has concluded.
Inventories
Inventories are primarily carried at the lower of cost or net realizable value using the weighted average cost method. In addition, certain lubricants are valued at the lower of cost or market using the last-in, first-out (“LIFO”) method to provide matching of revenues with current costs. Cost includes materials, labor and manufacturing overhead related to the purchase and production of inventories. The Company regularly reviews inventory quantities on hand and the estimated utility of inventory. Excess and obsolete reserves are established when inventory is estimated to not be usable based on forecasted usage, product demand and life cycle, as well as utility.
Property, plant and equipment
Property, plant and equipment is recorded at cost and is depreciated using the straight-line method over the estimated useful lives of the assets. Buildings are depreciated principally over
5
to
25
years and machinery and equipment principally over
5
to
30
years. Property, plant and equipment is relieved of the cost and related accumulated depreciation when assets are disposed of or otherwise retired. Gains or losses on the dispositions of property, plant and equipment are included in the Consolidated Statements of Comprehensive Income and generally reported in
Equity and other income, net
. Property, plant and equipment carrying values are evaluated for recoverability when impairment indicators are present and are conducted at the lowest identifiable level of cash flows. Such indicators could include, among other factors, operating losses, unused capacity, market value declines and technological obsolescence. Recorded values of asset groups of property, plant and equipment that are not expected to be recovered through undiscounted future net cash flows are written down to current fair value, which generally is determined from estimated discounted future net cash flows (assets held for use) or net realizable value (assets held for sale).
Business combinations
The financial results of the businesses that Valvoline has acquired are included in the Company’s consolidated financial results from the respective dates of the acquisitions. The Company allocates the purchase consideration to the identifiable assets acquired and liabilities assumed in the business combination based on their acquisition-date fair values. The excess of the purchase consideration over the amounts assigned to the identifiable assets and liabilities is recognized as goodwill. Factors giving rise to goodwill generally include synergies that are anticipated as a result of the business combination, including access to new customers and markets. The fair values of identifiable intangible assets acquired in business combinations are generally determined using an income approach, requiring financial forecasts and estimates as well as market participant assumptions.
59
Goodwill and other intangible assets
Valvoline tests goodwill for impairment annually as of July 1 or when events and circumstances indicate an impairment may have occurred. This annual assessment consists of Valvoline determining each reporting unit’s current fair value compared to its current carrying value. Valvoline’s reporting units are Core North America, Quick Lubes, and International.
In evaluating goodwill for impairment, Valvoline has the option to first perform a qualitative assessment to determine whether further impairment testing is necessary or to perform a quantitative assessment by comparing the fair value of a reporting unit to its carrying amount, including goodwill. Under the qualitative assessment, an entity is not required to calculate the fair value of a reporting unit unless the entity determines that it is more likely than not that its fair value is less than its carrying amount. Qualitative factors include macroeconomic conditions, industry and market conditions, cost factors, and overall financial performance, among others.
If under the quantitative assessment, the fair value of a reporting unit is less than its carrying amount, then the amount of the impairment loss, if any, must be measured under step two of the impairment analysis. In step two of the analysis, an impairment loss will be recorded equal to the excess of the carrying value of the reporting unit’s goodwill over its implied fair value. Fair values of the reporting units are estimated using a weighted methodology considering the output from both the income and market approaches. The income approach incorporates the use of a discounted cash flow (“DCF”) analysis. A number of significant assumptions and estimates are involved in the application of the DCF model to forecast operating cash flows, including markets and market shares, sales volumes and prices, costs to produce, tax rates, capital spending, discount rate, weighted average cost of capital, terminal values and working capital changes. Several of these assumptions vary among reporting units. The cash flow forecasts are generally based on approved strategic operating plans. The market approach is performed using the Guideline Public Companies method which is based on earnings multiple data. The Company also performs a reconciliation between market capitalization and the estimate of the aggregate fair value of the reporting units, including consideration of a control premium.
Valvoline elected to perform a qualitative assessment during fiscal 2018 and determined that it is not more likely than not that the fair values of Valvoline’s reporting units are less than carrying amounts.
Acquired finite-lived intangible assets principally consist of certain trademarks and trade names, reacquired franchise rights and customer relationships. Intangible assets acquired in an asset acquisition are carried at cost, less accumulated amortization. For intangible assets acquired in a business combination, the estimated fair values of the assets acquired are used to establish the carrying value, which is determined generally using an income approach, and the Company employs assumptions developed using the perspective of a market participant. These intangible assets are amortized on a straight-line basis over their estimated useful lives. Valvoline reviews finite-lived intangible assets for impairment whenever events or changes in circumstances indicate the carrying amount of an asset may not be recoverable and any not expected to be recovered through undiscounted future net cash flows and assets are written down to current fair value.
Equity method investments
Investments in companies, including joint ventures, where Valvoline has the ability to exert significant influence, but not control, over operating and financial policies of the investee are accounted for using the equity method of accounting. Judgment regarding the level of influence over each investment includes considering key factors such as the Company’s ownership interest, representation on the board of directors, and participation in policy-making decisions. The Company’s proportionate share of the net income or loss of these companies is included within
Equity and other income, net
in the Consolidated Statements of Comprehensive Income.
The Company evaluates equity method investments for impairment whenever events or changes in circumstances indicate that the carrying amount of the investment might not be recoverable. Factors considered by the Company when reviewing an equity method investment for impairment include the length of time and extent to which the fair value of the equity method investment has been less than cost, the investee’s financial condition and near-term prospects, and the intent and ability to hold the investment for a period of time sufficient to allow for anticipated recovery. An impairment that is other-than-temporary is recognized in the period identified.
Pension and other postretirement benefit plans
Valvoline sponsors defined benefit pension and other postretirement plans in the U.S and in certain countries outside the U.S. The majority of these plans were transferred to and assumed by the Company in the Contribution of certain of Ashland’s pension and other postretirement benefit obligations and plan assets in late fiscal 2016. Following the Contribution, Valvoline accounts for these obligations as single-employer plans for which Valvoline recognizes the net liabilities and the full amount of any costs or gains. Valvoline also has certain international single-employer pension plans for which the net liabilities and associated costs have been recognized in each period presented herein.
60
Valvoline recognizes the funded status of each applicable plan on the Consolidated Balance Sheets whereby each underfunded plan is recognized as a liability. The funded status is measured as the difference between the fair value of plan assets and the benefit obligation. Changes in the fair value of plan assets and net actuarial gains or losses are recognized upon remeasurement, which is at least annually as of September 30, the measurement date, and whenever a remeasurement is triggered. The remaining components of pension and other postretirement benefits income are recorded ratably on a quarterly basis. The fair value of plan assets represents the current market value of assets held by irrevocable trust funds for the sole benefit of participants, and the benefit obligation is the actuarial present value of the benefits expected to be paid based on estimates. These valuations reflect the terms of the plans and use participant-specific information such as compensation, age and years of service, as well as certain key assumptions that require significant judgment, including, but not limited to, estimates of discount rates, expected return on plan assets, rate of compensation increases, interest rates and mortality rates. Actuarial gains and losses may be related to actual results that differ from assumptions as well as changes in assumptions, which may occur each year.
Due to the freeze of U.S. pension benefits effective September 30, 2016, continuing service costs are limited to certain international pension plans, and are reported in the same caption of the Consolidated Statements of Comprehensive Income as the related employee payroll expenses. All components of net periodic benefit income other than service cost are recognized below operating income within
Net pension and other postretirement plan income
in the Consolidated Statements of Comprehensive Income.
Prior to the Contribution in fiscal 2016, Valvoline employees were eligible to participate in pension and other postretirement benefit plans sponsored by Ashland in many of the countries where the Company did business. Valvoline accounted for its participation in Ashland-sponsored pension and other postretirement benefit plans as a participation in a multiemployer plan and recognized its allocated portion of net periodic benefit cost based on Valvoline-specific plan participants.
Commitments and contingencies
Liabilities for loss contingencies arising from claims, assessments, litigation, fines, penalties and other sources are recorded when it is probable that a liability has been incurred and the amount of the loss can be reasonably estimated. Legal costs such as outside counsel fees and expenses are charged to expense in the period incurred and are recorded in
Selling, general and administrative expenses
in the Consolidated Statements of Comprehensive Income.
Revenue recognition
Sales generally are recognized when persuasive evidence of an arrangement exists, products are delivered or services are rendered, the sales price is fixed or determinable and collectability is reasonably assured. Valvoline reports all sales net of tax assessed by qualifying governmental authorities. Certain shipping and handling costs paid by the customer are recorded in sales, while those costs paid by Valvoline are recorded in cost of sales. Shipping and handling costs recorded in sales were
$10 million
in fiscal 2018 and
$16 million
in both fiscal 2017 and 2016.
Sales rebates and discounts, consisting primarily of promotional rebates and customer pricing discounts, are offered through various programs to customers.
Sales
are recorded net of these rebates and discounts totaling
$357 million
,
$360 million
, and
$388 million
in the Consolidated Statements of Comprehensive Income for the years ended September 30, 2018, 2017, and 2016, respectively. Provisions for sales rebates and discounts are established and recognized as incurred, generally at the time of the sale, or over the term of the sales contract. Valvoline bases its estimates on historical rates of customer discounts and rebates as well as the specific identification of discounts and rebates expected to be realized. Allowances related to these customer incentive programs are adjusted based on actual experience and adjustments are recorded to earnings in the period changes are known and reasonably estimable. Reserves for these customer programs and incentives were
$57 million
and
$54 million
as of September 30, 2018 and 2017, respectively, and are recorded within
Accrued expenses and other liabilities
in the Consolidated Balance Sheets.
Franchise revenue included within sales was
$29 million
,
$28 million
, and
$25 million
during fiscal 2018, 2017, and 2016, respectively. Franchise revenue generally consists of initial franchise fees and royalties. Initial franchise fees are recognized when all material obligations have been substantially performed and the store has opened for business. Franchise royalties are based upon a percentage of monthly sales of the franchisees and are recognized as such sales occur.
Expense recognition
Cost of sales
include material and production costs, as well as the costs of inbound and outbound freight, purchasing and receiving, inspection, warehousing, internal transfers and all other distribution network costs. Selling, general and administrative expenses are expensed as incurred and include sales and marketing costs, research and development costs, advertising, customer support, and administrative costs, including allocated corporate charges from Ashland in the periods prior to the IPO. Advertising costs (
$63 million
in fiscal 2018,
$61 million
in fiscal 2017 and
$58 million
in fiscal 2016) and research and development costs (
$14 million
in fiscal 2018 and
$13 million
in both fiscal 2017 and 2016) are expensed as incurred.
61
Stock-based compensation
Stock-based compensation expense is recognized within
Selling, general and administrative expense
in the Consolidated Statements of Comprehensive Income and is principally
based on the grant date fair value of new or modified awards over the requisite vesting period
. The Company’s outstanding stock-based compensation awards are primarily classified as equity, with certain liability-classified awards based on award terms and conditions. Valvoline accounts for forfeitures when they occur.
Income taxes
Income tax expense is provided based on income before income taxes. Deferred income taxes represent benefits and expenses that will be used to reduce or increase corporate taxes expected to be paid as well as differences between the tax bases and carrying amounts of assets and liabilities that will result in taxable or deductible amounts in future years. Deferred tax assets and liabilities are measured using enacted tax rates expected to apply to taxable income in years in which those temporary differences are expected to be recovered or settled. As changes in tax laws or rates occur, deferred tax assets and liabilities are adjusted in the period changes are enacted through income tax expense. Valvoline records valuation allowances related to its deferred income tax assets when it is more likely than not that some portion or all of the deferred income tax assets will not be realized.
For the periods prior to the Distribution, Valvoline’s operating results are included in Ashland’s consolidated U.S., state, and certain international subsidiaries’ income tax returns. For these periods, the income tax provision in these Consolidated Statements of Comprehensive Income was calculated on a separate return basis as if Valvoline was operating on a stand-alone basis and filed separate tax returns in the jurisdictions in which it operated.
The Company recognizes the tax benefit from an uncertain tax position only if it is more likely than not that the tax position will be sustained on examination by the taxing authorities, based on the technical merits of the position. The tax benefits recognized in the consolidated financial statements from such a position are measured based on the largest benefit that has a greater than fifty percent likelihood of being sustained upon examination by authorities. Interest and penalties related to unrecognized tax benefits are recognized as part of the provision for income taxes and are accrued beginning in the period that such interest and penalties would be applicable under relevant tax law and until such time that the related tax benefits are recognized. Interest and penalties were not material to any of the periods presented herein.
Derivatives
Valvoline’s derivative instruments consist of currency exchange contracts, which are accounted for as either assets or liabilities in the Consolidated Balance Sheets at fair value and the resulting gains or losses are recognized as adjustments to earnings. Valvoline does not currently have any derivative instruments that are designated and qualify as hedging instruments. The Company classifies its cash flows for these transactions as investing activities in the Consolidated Statements of Cash Flows.
Fair value measurements
Fair value is defined as an exit price, representing an amount that would be received to sell an asset or the amount paid to transfer a liability in an orderly transaction between market participants at the measurement date. As such, fair value is a market-based measurement determined based on assumptions that market participants would use in pricing an asset or liability. As a basis for considering such assumptions, the guidance prioritizes the inputs used to measure fair value into the three-tier fair value hierarchy. The fair value hierarchy gives the highest priority to quoted prices in active markets for identical assets or liabilities (Level 1) and the lowest priority to unobservable inputs (Level 3). An instrument’s classification within the fair value hierarchy is based upon the lowest level of input that is significant to the instrument’s fair value measurement. Certain investments which measure fair value using the net asset value (“NAV”) per share practical expedient are not classified within the fair value hierarchy and are separately disclosed.
Valvoline measures its financial assets and financial liabilities at fair value based on one or more of the following three valuation techniques:
|
•
|
Market approach: Prices and other relevant information generated by market transactions involving identical or comparable assets or liabilities
|
|
•
|
Cost approach: Amount that would be required to replace the service capacity of an asset (replacement cost)
|
|
•
|
Income approach: Techniques to convert future amounts to a single present amount based upon market expectations (including present value techniques, option pricing and excess earnings models)
|
The Company generally uses a market approach, when practicable, in valuing financial instruments. In certain instances, when observable market data is lacking, the Company uses valuation techniques consistent with the income approach whereby future cash flows are converted to a single discounted amount. The Company uses multiple sources of pricing as well as trading and other market
62
data in its process of reporting fair values. The fair values of accounts receivables and accounts payable approximate their carrying values due to the relatively short-term nature of the instruments.
The methods described above may produce a fair value that may not be indicative of net realizable value or reflective of future fair values. Furthermore, while the Company believes its valuation methods are appropriate and consistent with other market participants, the use of different methodologies or assumptions to determine the fair value of certain financial instruments could result in a different fair value measurement.
Currency translation
Operations outside the United States are measured primarily using the local currency as the functional currency. Upon consolidation, the results of operations of the subsidiaries and affiliates whose functional currency is other than the U.S. dollar are translated into U.S. dollars at the average exchange rates for the year while assets and liabilities are translated at year-end exchange rates. Adjustments to translate assets and liabilities into U.S. dollars are recorded in the stockholders’ equity section of the Consolidated Balance Sheets as a component of
Accumulated other comprehensive income
and are included in net earnings only upon sale or substantial liquidation of the underlying non-U.S. subsidiary or affiliated company.
Earnings per share
Basic earnings per share (“EPS”) is calculated by dividing net income by the weighted-average number of common shares outstanding during the reported period. Diluted EPS is calculated similar to basic EPS, except that the weighted-average number of shares outstanding includes the number of shares that would have been outstanding had potentially dilutive common shares been issued. Potentially dilutive securities include stock appreciation rights and nonvested share-based awards. Nonvested market and performance-based share awards are included in the weighted-average diluted shares outstanding each period if established market or performance criteria have been met at the end of the respective periods.
Recent accounting pronouncements
The following standards relevant to Valvoline were either issued or adopted in the current year, or are expected to have a meaningful impact on Valvoline in future periods.
Recently adopted
During fiscal 2018, Valvoline adopted the following:
|
•
|
In July 2015, the Financial Accounting Standards Board (“FASB”) issued accounting guidance to simplify the subsequent measurement of certain inventories by replacing the lower of cost or market test with a lower of cost or net realizable value test. The guidance applies only to inventories for which cost is determined by methods other than LIFO and retail inventory methods. Valvoline adopted this guidance prospectively on October 1, 2017. Valvoline utilizes LIFO to value a significant portion of its inventory. The impact of adoption was not material to the Company’s consolidated financial statements.
|
|
•
|
In March 2017, the FASB issued accounting guidance that changed how employers who sponsor defined benefit pension and/or postretirement benefit plans present the net periodic benefit cost in the Consolidated Statements of Comprehensive Income. This guidance requires employers to present the service cost component of net periodic benefit cost in the same caption as other employee compensation costs for services rendered during the period. All other components of the net periodic benefit cost are presented separately outside of the operating income caption. Valvoline retrospectively adopted this guidance on October 1, 2017. Accordingly,
Net pension and other postretirement plan income
has been reclassified to non-operating income for all periods presented within the Consolidated Statements of Comprehensive Income, which reduced previously reported operating income by
$138 million
and
$35 million
for the years ended September 30, 2017 and 2016, respectively.
|
|
•
|
In February 2018, the FASB issued accounting guidance that allows companies to reclassify stranded tax effects resulting from the reduction of the U.S. statutory corporate tax rate enacted in U.S. tax reform legislation in December 2017. The Company adopted this guidance in the fourth quarter of fiscal 2018, which resulted in a reclassification of
$8 million
of stranded tax effects related to the deferred taxes for unamortized benefit plan credits that increased both
Accumulated other comprehensive income
and
Retained deficit
within the Consolidated Balance Sheet and Consolidated Statement of Stockholders’ Deficit. The adoption of this guidance did not have an impact on the Company’s results of operations or cash flows.
|
63
|
•
|
In March 2018, the FASB issued accounting guidance that codified SEC staff views on the income tax accounting implications of U.S. tax reform legislation enacted in December 2017. The guidance clarifies the timing of the measurement period, changes in subsequent reporting periods and reporting requirements as a result of the legislation. As further discussed in Note 12, the Company recorded provisional impacts of the legislation in fiscal 2018 and will recognize any changes to these provisional estimates up to one year from the enactment date of the legislation.
|
|
•
|
In August 2018, the FASB issued accounting guidance that modifies the disclosure requirements with respect to fair value measurements. Among the changes, entities will no longer be required to disclose the amount of and reasons for transfers between Levels 1 and 2 of the fair value hierarchy, but will be required to disclose the range and weighted average used to develop significant unobservable inputs for Level 3 fair value measurements. Valvoline early adopted this guidance, which does not have an impact on the Company’s consolidated financial statements, but revises disclosures as reflected in Notes 3 and 13 herein.
|
|
•
|
In August 2018, the FASB issued accounting guidance that modifies the disclosure requirements with respect to defined benefit pension and other postretirement plans. This guidance removes disclosures that no longer are considered cost beneficial, clarifies the specific requirements of disclosures, and adds certain disclosure requirements. Valvoline early adopted this guidance, which does not have an impact on the Company’s consolidated financial statements, but revises disclosures as reflected in Note 13 herein.
|
Issued but not yet adopted
In May 2014, the FASB issued accounting guidance outlining a single comprehensive model for entities to use in accounting for revenue arising from contracts with customers, which supersedes most current revenue recognition guidance. This guidance introduces a five-step model for revenue recognition that focuses on transfer of control, as opposed to transfer of risk and rewards under current guidance. The Company has substantially completed its assessment of the accounting required under the new revenue recognition guidance and will adopt the new guidance in the first quarter of fiscal 2019. The Company’s revenue is primarily generated from the sale and service delivery of engine and automotive maintenance products to customers, which is not accounted for under industry-specific guidance. Valvoline’s performance obligations generally consist of a single delivery element whereby revenue is recognized at the point in time when ownership, risks and rewards transfer. Revenue transactions recorded under the new guidance are expected to be substantially consistent with the treatment under existing guidance.
The Company will adopt the new revenue recognition guidance using the modified retrospective method, which recognizes the cumulative effect of the changes in retained deficit at adoption, but will not retrospectively apply the new guidance to prior periods. The Company expects to adjust retained deficit at adoption primarily related to the timing of certain sales made to distributors for approximately
$15 million
to
$20 million
on a pre-tax basis. In addition, the Company expects immaterial impacts to reclassify certain activities in the Consolidated Statements of Comprehensive Income on an ongoing basis following adoption.
The Company will expand footnote disclosures under the new revenue guidance beginning in the first quarter of fiscal 2019, including disaggregation of revenue, pro forma impacts of changes to the financial statements in the initial year of adoption, and qualitative disclosures related to the nature and terms of its sales, timing of the transfer of control and judgments used in the application of the five-step model. The Company has also implemented appropriate changes to business processes to support recognition and disclosure under the new guidance.
In August 2018, the FASB issued new accounting guidance related to fees paid by a customer in a cloud computing arrangement, which aligns the accounting for implementation costs incurred in a cloud computing arrangement that is a service arrangement with the existing capitalization guidance for implementation costs incurred to develop or obtain internal-use software. Valvoline will early adopt this guidance on a prospective basis on October 1, 2018, and as a result, certain relevant costs related to these arrangements may be capitalized. The adoption of this guidance is not expected to have a material impact on the Company's financial condition, results of operations or cash flows.
In February 2016, the FASB issued new accounting guidance related to lease transactions. The primary objective of this guidance is to increase transparency and comparability among organizations by requiring lessees to recognize assets and liabilities on the balance sheet for the rights and obligations created by leases and to disclose key information about leasing arrangements. This new guidance is effective for the Company in the first quarter of fiscal 2020 using a modified retrospective approach. The Company has begun planning its assessment and implementation process, including a process to identify all forms of its leases globally, as well as analyzing the practical expedients and evaluating the specific impacts on its consolidated financial statements. While the Company’s evaluation of this guidance is in the early stages, adoption is expected to have a material impact on the Consolidated Balance Sheets as the majority of the Company’s operating leases are expected to be recognized as right of use assets and associated lease liabilities. The Company also anticipates expanded footnote disclosures related to its leases under the new guidance.
64
The FASB issued other accounting guidance during the period that is not currently applicable or expected to have a material impact on Valvoline’s financial statements, and therefore, is not described above.
Valvoline uses applicable guidance for defining fair value, the initial recording and periodic remeasurement of certain assets and liabilities measured at fair value, and related disclosures for instruments measured at fair value. Fair value accounting guidance establishes a fair value hierarchy, which prioritizes the inputs to valuation techniques used to measure fair value into three broad levels. An instrument’s classification within the fair value hierarchy is based upon the lowest level of input that is significant to the instrument’s fair value measurement. Valvoline measures assets and liabilities using inputs from the following three levels of fair value hierarchy:
Level 1 - Observable inputs such as unadjusted quoted prices in active markets for identical assets or liabilities.
Level 2 - Inputs other than quoted prices included within Level 1 that are observable for the asset or liability, either directly or indirectly. These include quoted prices for similar assets or liabilities in active markets and quoted prices for identical or similar assets or liabilities in markets that are not active.
Level 3 - Unobservable inputs for the asset or liability for which there is little, if any, market activity at the measurement date. Unobservable inputs reflect Valvoline’s own assumptions about what market participants would use to price the asset or liability. The inputs are developed based on the best information available in the circumstances, which may include Valvoline’s own financial data, such as internally developed pricing models, DCF methodologies, as well as instruments for which the fair value determination requires significant management judgment.
The following table sets forth the Company’s financial assets and liabilities that were accounted for at fair value on a recurring basis by level within the fair value hierarchy as of September 30:
|
(In millions)
|
Fair Value Hierarchy
|
2018
|
2017
|
|||||||
|
Cash and cash equivalents
|
||||||||||
|
Money market funds
|
Level 1
|
$
|
5
|
|
$
|
11
|
|
|||
|
Time deposits
|
Level 2
|
22
|
|
35
|
|
|||||
|
Prepaid expenses and other current assets
|
||||||||||
|
Currency derivatives
|
Level 2
|
1
|
|
1
|
|
|||||
|
Other noncurrent assets
|
||||||||||
|
Non-qualified trust funds
|
Level 1
|
25
|
|
30
|
|
|||||
|
Total assets at fair value
|
$
|
53
|
|
$
|
77
|
|
||||
|
Accrued expenses and other liabilities
|
||||||||||
|
Currency derivatives
|
Level 2
|
$
|
1
|
|
$
|
1
|
|
|||
|
Total liabilities at fair value
|
$
|
1
|
|
$
|
1
|
|
||||
Money market funds
Money market funds trade in an active market and are valued using quoted market prices, which are Level 1 inputs.
Time deposits
Time deposits are balances held with financial institutions that have maturities of
three
months or less. Time deposits are held at face value plus accrued interest, which approximates fair value, and are categorized as Level 2.
Currency derivatives
The Company uses derivatives not designated as hedging instruments consisting of forward contracts to hedge non-U.S. currency denominated balance sheet exposures and exchange one currency for another for a fixed rate on a future date of
twelve
months or less. The Company had outstanding contracts with notional values of
$74 million
and
$47 million
as of September 30, 2018 and 2017, respectively. The fair value of these outstanding contracts are recorded as assets and liabilities on a gross basis measured using readily
65
observable market inputs to estimate the fair value for similar derivative instruments and are classified as Level 2. Valvoline has entered into master netting arrangements to mitigate losses in the event of nonperformance by counterparties that allow settlement on a net basis, the effect of which was not material to the recorded assets and liabilities as of September 30, 2018 or 2017.
Gains and losses on these instruments are recognized in
Selling, general and administrative expenses
in the Consolidated Statements of Comprehensive Income as exchange rates change the fair value of these instruments and upon settlement to offset the remeasurement gain or loss on the related foreign currency-denominated exposures in the same period. Gains and losses recognized related to these instruments were not material in any period presented herein.
Non-qualified trust funds
The Company maintains a non-qualified trust to fund benefit payments for certain of its U.S. non-qualified pension plans. This fund is classified as Level 1 as it primarily consists of highly liquid fixed income U.S. government bonds that trade with sufficient frequency and volume to enable pricing information to be obtained on an ongoing basis. Gains and losses related to these investments are immediately recognized within
Selling, general and administrative expenses
in the Consolidated Statements of Comprehensive Income and were not material in any period presented herein.
The Company’s outstanding fixed rate senior notes consist of
5.500%
senior unsecured notes due 2024 with an aggregate principal amount of
$375 million
issued in July 2016 (the “2024 Notes”) and
4.375%
senior unsecured notes due 2025 with an aggregate principal amount of
$400 million
issued in August 2017 (the “2025 Notes” and together with the 2024 Notes, the “Senior Notes”).
The fair values of the Senior Notes shown in the table below are based on recent trading values, which are considered Level 2 inputs within the fair value hierarchy. Long-term debt is included in the Consolidated Balance Sheets at carrying value, rather than fair value, and is therefore excluded from the fair value table above. Carrying values shown in the following table are net of unamortized discounts and issuance costs.
|
September 30, 2018
|
September 30, 2017
|
|||||||||||||||||||||||
|
(In millions)
|
Fair value
|
Carrying value
|
Unamortized discount and issuance costs
|
Fair value
|
Carrying value
|
Unamortized discount and issuance costs
|
||||||||||||||||||
|
2024 Notes
|
$
|
376
|
|
$
|
370
|
|
$
|
(5
|
)
|
$
|
401
|
|
$
|
370
|
|
$
|
(5
|
)
|
||||||
|
2025 Notes
|
376
|
|
395
|
|
(5
|
)
|
408
|
|
394
|
|
(6
|
)
|
||||||||||||
|
Total
|
$
|
752
|
|
$
|
765
|
|
$
|
(10
|
)
|
$
|
809
|
|
$
|
764
|
|
$
|
(11
|
)
|
||||||
Refer to Note 10 for details of other debt instruments that have variable interest rates, and accordingly, their carrying amounts approximate fair value.
Pension plan assets
Pension plan assets are measured at fair value at least annually on September 30. Refer to Note 13 for disclosures regarding the fair value of plan assets, including classification within the fair value hierarchy.
Quick Lubes store acquisitions
During fiscal 2018, Valvoline acquired
136
service center stores for an aggregate purchase price of
$125 million
. These acquisitions included
73
franchise service center stores,
60
former franchise service center stores, and
3
service center stores acquired in single and multi-store transactions. During fiscal 2017, the Company acquired
43
service center stores for an aggregate purchase price of
$72 million
, of which
$4 million
was paid in fiscal 2016. These acquisitions included
14
former franchise service center stores and
29
service center stores acquired in single and multi-store transactions. During fiscal 2016,
104
service center stores were acquired for an aggregate purchase price of
$79 million
. These acquisitions included
42
franchise service center stores,
9
former franchise service center stores and
53
service center stores acquired in single and multi-store transactions.
66
The Company’s acquisitions are accounted for such that the assets acquired and liabilities assumed are recognized at their acquisition date fair values, with any excess of the consideration transferred over the estimated fair values of the identifiable net assets acquired recorded as goodwill. Unless otherwise noted, goodwill is generally expected to be deductible for income tax purposes and is primarily attributed to the operational synergies and potential growth expected to result in economic benefits in the respective markets of the acquisitions.
A summary follows of the aggregate cash consideration paid and the total assets acquired and liabilities assumed for the years ended September 30:
|
(In millions)
|
2018
|
2017
|
2016
|
|||||||||
|
Inventories
|
$
|
2
|
|
$
|
1
|
|
$
|
1
|
|
|||
|
Other current assets
|
1
|
|
—
|
|
1
|
|
||||||
|
Property, plant and equipment
|
2
|
|
2
|
|
9
|
|
||||||
|
Goodwill
(a)
|
58
|
|
60
|
|
94
|
|
||||||
|
Intangible assets
|
||||||||||||
|
Trademarks and trade names
(b)
|
27
|
|
1
|
|
1
|
|
||||||
|
Reacquired franchise rights
(a) (c)
|
26
|
|
6
|
|
—
|
|
||||||
|
Customer relationships
(d)
|
9
|
|
2
|
|
—
|
|
||||||
|
Other
|
—
|
|
—
|
|
1
|
|
||||||
|
Other noncurrent assets
|
—
|
|
—
|
|
3
|
|
||||||
|
Trade and other payables
|
—
|
|
—
|
|
(11
|
)
|
||||||
|
Debt
|
—
|
|
—
|
|
(11
|
)
|
||||||
|
Other noncurrent liabilities
|
—
|
|
—
|
|
(9
|
)
|
||||||
|
Net assets acquired
|
$
|
125
|
|
$
|
72
|
|
$
|
79
|
|
|||
|
(a)
|
Approximately
$83 million
of the goodwill recognized in fiscal 2016 was not deductible for income tax purposes. In addition, during fiscal 2018, the purchase price allocation for the acquisition of certain former franchise service center stores during fiscal 2017 was adjusted to reduce goodwill and increase reacquired franchise rights by
$6 million
.
|
|
(b)
|
Weighted average amortization period of
19 years
.
|
|
(c)
|
Prior to the acquisition of former franchise service center stores, Valvoline licensed the right to operate franchised quick lube service centers, including use of the Company’s trademarks and trade name. In connection with these acquisitions, Valvoline reacquired those rights and recognized separate definite-lived reacquired franchise rights intangible assets, which are being amortized on a straight-line basis over the weighted average remaining term of approximately
8 years
. The effective settlement of these arrangements resulted in
no
settlement gain or loss as the contractual terms were at market.
|
|
(d)
|
Weighted average amortization period of
13 years
.
|
The fair values above are preliminary for up to one year from the date of acquisition as they are subject to measurement period adjustments as new information is obtained about facts and circumstances that existed as of the acquisition date. The Company does not expect any material changes to the preliminary purchase price allocations summarized above for acquisitions completed during the last twelve months.
The incremental results of operations of the acquired stores, which were not material to the Company’s consolidated results, have been included in the consolidated financial statements from the date of each acquisition, and accordingly, pro forma disclosure of financial information has not been presented.
Below are further details on the significant acquisitions completed in each period presented in the consolidated financial statements herein.
Fiscal 2018 acquisitions
Henley Bluewater
On October 2, 2017, the Company acquired the business assets of
56
former franchise service center stores from Henley Bluewater LLC for
$60 million
. These stores build on the infrastructure and talent base of the existing Company-owned operations in northern Ohio and add Company-owned locations in Michigan. Of the
$60 million
, approximately
$36 million
was allocated to goodwill with the remainder primarily allocated to reacquired franchise rights intangible assets, which are being amortized on a straight-line basis over the weighted average remaining term of approximately
seven
years.
Great Canadian Oil Change
67
On July 13, 2018, Valvoline acquired the business assets of
73
franchise service center stores from Great Canadian Oil Change Ltd. for
$53 million
. This acquisition expands Valvoline’s Quick Lubes footprint outside of the United States and increases the Quick Lubes system to more than
1,200
company-owned and franchised locations in North America. Of the
$53 million
, approximately
$16 million
was allocated to goodwill with
$27 million
allocated to trade names,
$9 million
to customer relationships, and the remainder allocated to working capital. The finite-lived intangible assets are being amortized on a straight-line basis over
20 years
and
15 years
for trade names and customer relationships, respectively.
Fiscal 2017 acquisitions
Time-It Lube
On January 31, 2017, Valvoline acquired the business assets of
28
service center stores from Time-It Lube LLC and Time-It Lube of Texas, LP (collectively, “Time-It Lube”) for
$49 million
, of which approximately
$45 million
was allocated to goodwill, and the remainder was allocated to working capital, trade names and customer relationships. This acquisition expanded the presence of Quick Lubes into east Texas and marked its entry into Louisiana.
Fiscal 2016 acquisitions
Oil Can Henry’s
On February 1, 2016, the business assets of
42
franchise service center stores and
47
service center stores were acquired from OCH International, Inc. (“Oil Can Henry’s”) for
$62 million
. This acquisition complemented the existing Quick Lubes service center store base and expanded its profile within several northwest U.S. markets. Of the
$62 million
purchase price,
$82 million
was allocated to goodwill,
$11 million
to the assumption of debt, and the remainder was allocated to net working capital, property, plant and equipment, trade names, and other noncurrent assets and liabilities.
Remaining ownership interest in subsidiary
Valvoline historically owned a
70%
controlling interest and consolidated the financial results of its subsidiary in Thailand. In December 2017, Valvoline purchased the remaining
30%
interest for total consideration of approximately
$16 million
, making it a wholly-owned subsidiary of the Company. This interest was not material to the current or prior period financial statements for presentation and disclosure as a noncontrolling interest, which was eliminated as a result of this purchase through an adjustment to
Paid-in capital
and
Retained deficit
.
Dispositions
During fiscal 2018, Valvoline completed the liquidation of its Brazilian subsidiary within the International reportable segment and sold
two
service center stores to a franchisee within the Quick Lubes reportable segment. These transactions resulted in a net gain of
$2 million
, which was recognized in
Equity and other income, net
in the Consolidated Statements of Comprehensive Income during the year ended September 30, 2018.
Valvoline has a strategic relationship with Cummins, Inc. (“Cummins”), a leading supplier of engines and related component products, which includes co-branding products for heavy duty consumers and a
50%
interest in joint ventures in India, China, and Argentina. Valvoline also has joint ventures with other partners in Latin America. Valvoline’s investments in these unconsolidated affiliates were
$31 million
and
$30 million
as of September 30, 2018 and 2017, respectively.
68
Valvoline’s stockholders’ deficit included
$30 million
and
$28 million
of undistributed earnings from affiliates accounted for under the equity method as of
September 30, 2018
and
2017
, respectively. Summarized financial information for Valvoline’s equity method investments follows as of and for the years ended September 30:
|
(In millions)
|
2018
|
2017
|
||||||
|
Financial position
|
||||||||
|
Current assets
|
$
|
116
|
|
$
|
105
|
|
||
|
Current liabilities
|
(76
|
)
|
(69
|
)
|
||||
|
Working capital
|
40
|
|
36
|
|
||||
|
Noncurrent assets
|
23
|
|
25
|
|
||||
|
Noncurrent liabilities
|
(1
|
)
|
(1
|
)
|
||||
|
Stockholders’ equity
|
$
|
62
|
|
$
|
60
|
|
||
|
(In millions)
|
2018
|
2017
|
2016
|
|||||||||
|
Results of operations
|
||||||||||||
|
Sales
|
$
|
313
|
|
$
|
289
|
|
$
|
255
|
|
|||
|
Income from operations
|
$
|
62
|
|
$
|
53
|
|
$
|
46
|
|
|||
|
Net income
|
$
|
27
|
|
$
|
25
|
|
$
|
23
|
|
|||
The Company’s transactions with affiliate companies accounted for under the equity method were as follows for the years ended September 30:
|
(In millions)
|
2018
|
2017
|
2016
|
|||||||||||
|
Equity income
(a)
|
$
|
14
|
|
$
|
12
|
|
$
|
12
|
|
|||||
|
Distributions received
|
$
|
10
|
|
$
|
8
|
|
$
|
16
|
|
|||||
|
Royalty income
(a)
|
$
|
8
|
|
$
|
7
|
|
$
|
4
|
|
|||||
|
Sales to
|
$
|
12
|
|
12
|
|
$
|
12
|
|
—
|
|
$
|
10
|
|
|
|
Purchases from
|
$
|
2
|
|
$
|
—
|
|
$
|
—
|
|
|||||
|
(a)
|
Equity and royalty income are recognized in
Equity and other income, net
in the Consolidated Statements of Comprehensive Income.
|
Valvoline has outstanding receivable balances with affiliates accounted for under the equity method of
$6 million
and
$3 million
as of September 30, 2018 and 2017, respectively, included in
Accounts receivable, net
within the Consolidated Balance Sheets.
The following summarizes Valvoline’s accounts receivable in the Consolidated Balance Sheets as of September 30:
|
(In millions)
|
2018
|
2017
|
||||||
|
Trade
|
$
|
390
|
|
$
|
362
|
|
||
|
Other
|
26
|
|
28
|
|
||||
|
Accounts receivable, gross
|
416
|
|
390
|
|
||||
|
Allowance for doubtful accounts
|
(7
|
)
|
(5
|
)
|
||||
|
Total accounts receivable, net
|
$
|
409
|
|
$
|
385
|
|
||
Valvoline is party to an agreement to sell certain trade accounts receivable in the form of drafts or bills of exchange to a financial institution. Each draft constitutes an order to pay Valvoline for obligations of the customer arising from the sale of goods. The intention of the arrangement is to decrease the time accounts receivable is outstanding and increase cash flows. During the year ended September 30, 2018, Valvoline sold
$129 million
of accounts receivable to the financial institution.
Prior to the Distribution, Ashland was party to the agreement to sell certain Valvoline trade accounts receivable and remitted payment to Valvoline upon sale. During fiscal 2017 and prior to the Distribution,
$40 million
of Valvoline accounts receivable were sold to the financial institution and proceeds were remitted to Valvoline. Once Valvoline became party to the arrangement following the
69
Distribution and through the remainder of the year ended September 30, 2017,
$50 million
of accounts receivable were sold to the financial institution, for a total of
$90 million
in fiscal 2017.
Inventories are primarily carried at the lower of cost or net realizable value using the weighted average cost method. In addition, certain lubricants with a replacement cost of
$89 million
at
September 30, 2018
and
$83 million
at
September 30, 2017
are valued at the lower of cost or market using the LIFO method.
The following summarizes Valvoline’s inventories in the Consolidated Balance Sheets as of September 30:
|
(In millions)
|
2018
|
2017
|
||||||
|
Finished products
|
$
|
189
|
|
$
|
180
|
|
||
|
Raw materials, supplies and work in process
|
30
|
|
31
|
|
||||
|
Reserve for LIFO cost valuation
|
(40
|
)
|
(33
|
)
|
||||
|
Excess and obsolete inventory reserves
|
(3
|
)
|
(3
|
)
|
||||
|
Total inventories, net
|
$
|
176
|
|
$
|
175
|
|
||
The following table summarizes the various components of property, plant and equipment within the Consolidated Balance Sheets as of September 30:
|
(In millions)
|
2018
|
2017
|
||||||
|
Land
|
$
|
51
|
|
$
|
51
|
|
||
|
Buildings
(a)
|
292
|
|
286
|
|
||||
|
Machinery and equipment
|
442
|
|
442
|
|
||||
|
Construction in progress
|
62
|
|
44
|
|
||||
|
Total property, plant and equipment
|
847
|
|
823
|
|
||||
|
Accumulated depreciation
(b)
|
(427
|
)
|
(432
|
)
|
||||
|
Net property, plant and equipment
|
$
|
420
|
|
$
|
391
|
|
||
|
(a)
|
Includes
$22 million
and
$28 million
of assets under capitalized leases as of September 30,
2018
and September 30,
2017
respectively.
|
|
(b)
|
Includes
$4 million
and
$4 million
for assets under capitalized leases as of September 30,
2018
and September 30,
2017
, respectively.
|
Non-cash accruals included in total property, plant and equipment totaled
$13 million
and
$39 million
for the years ended September 30, 2018 and 2017, respectively.
The following summarizes property, plant and equipment charges included within the Consolidated Statements of Comprehensive Income.
|
(In millions)
|
2018
|
2017
|
2016
|
|||||||||
|
Depreciation (includes capital leases)
|
$
|
49
|
|
$
|
42
|
|
$
|
38
|
|
|||
70
Goodwill
The following summarizes the changes in the carrying amount of goodwill for each reportable segment and in total during fiscal
2018
and
2017
:
|
(In millions)
|
Core North America
|
Quick Lubes
|
International
|
Total
|
||||||||||||
|
Balance at September 30, 2016
|
$
|
89
|
|
$
|
135
|
|
$
|
40
|
|
$
|
264
|
|
||||
|
Acquisitions
(a)
|
—
|
|
66
|
|
—
|
|
66
|
|
||||||||
|
Balance at September 30, 2017
|
89
|
|
201
|
|
40
|
|
330
|
|
||||||||
|
Acquisitions
(b)
|
—
|
|
52
|
|
—
|
|
52
|
|
||||||||
|
Dispositions
(c)
|
—
|
|
(1
|
)
|
—
|
|
(1
|
)
|
||||||||
|
Balance at September 30, 2018
|
$
|
89
|
|
$
|
252
|
|
$
|
40
|
|
$
|
381
|
|
||||
|
(a)
|
Activity associated with the acquisition of Time-It Lube and
15
additional service center stores. Refer to Note 4 for details regarding the acquisitions.
|
|
(b)
|
Activity associated with the acquisitions of Great Canadian Oil Change, Henley Bluewater,
seven
additional service center stores, and adjustments related to prior year acquisitions. Refer to Note 4 for further details.
|
|
(c)
|
Activity associated with the derecognition of goodwill as a result of the sale and disposition of
two
quick lube service center stores. Refer to Note 4 for details regarding the disposition.
|
Other intangible assets
Valvoline’s purchased intangible assets were specifically identified when acquired, have finite lives, and are reported in
Goodwill and intangibles, net
on the Consolidated Balance Sheets. The following summarizes the gross carrying amounts and accumulated amortization of the Company’s intangible assets as of September 30:
|
(In millions)
|
2018
|
2017
|
||||||||||||||||||||||
|
Gross carrying amount
|
Accumulated amortization
|
Net carrying amount
|
Gross carrying amount
|
Accumulated amortization
|
Net carrying amount
|
|||||||||||||||||||
|
Definite-lived intangible assets
|
||||||||||||||||||||||||
|
Trademarks and trade names
|
$
|
29
|
|
$
|
(2
|
)
|
$
|
27
|
|
$
|
2
|
|
$
|
(1
|
)
|
$
|
1
|
|
||||||
|
Reacquired franchise rights
|
32
|
|
(4
|
)
|
28
|
|
—
|
|
—
|
|
—
|
|
||||||||||||
|
Customer relationships
|
14
|
|
(3
|
)
|
11
|
|
5
|
|
(2
|
)
|
3
|
|
||||||||||||
|
Other intangible assets
|
1
|
|
—
|
|
1
|
|
1
|
|
—
|
|
1
|
|
||||||||||||
|
Total definite-lived intangible assets
|
$
|
76
|
|
$
|
(9
|
)
|
$
|
67
|
|
$
|
8
|
|
$
|
(3
|
)
|
$
|
5
|
|
||||||
The table that follows summarizes amortization expense (actual and estimated) for intangible assets, assuming no additional amortizable intangible assets, for the years ended September 30:
|
Actual
|
Estimated
|
|||||||||||||||||||||||
|
(In millions)
|
2018
|
2019
|
2020
|
2021
|
2022
|
2023
|
||||||||||||||||||
|
Amortization expense
|
$
|
6
|
|
$
|
7
|
|
$
|
7
|
|
$
|
7
|
|
$
|
6
|
|
$
|
6
|
|
||||||
71
The following table summarizes Valvoline’s short-term borrowings and long-term debt as of September 30:
|
(In millions)
|
2018
|
2017
|
||||||
|
2025 Notes
|
$
|
400
|
|
$
|
400
|
|
||
|
2024 Notes
|
375
|
|
$
|
375
|
|
|||
|
Term Loans
|
270
|
|
285
|
|
||||
|
Revolver
|
147
|
|
—
|
|
||||
|
Trade Receivables Facility
|
140
|
|
75
|
|
||||
|
Other
(a)
|
(10
|
)
|
(11
|
)
|
||||
|
Total debt
|
$
|
1,322
|
|
$
|
1,124
|
|
||
|
Short-term debt
|
—
|
|
75
|
|
||||
|
Current portion of long-term debt
|
30
|
|
15
|
|
||||
|
Long-term debt
|
$
|
1,292
|
|
$
|
1,034
|
|
||
|
(a)
|
As of September 30, 2018, other includes
$11 million
of debt issuance costs and discounts and
$1 million
of debt primarily acquired through acquisitions. As of September 30, 2017, other included
$13 million
of debt issuance costs and discounts and
$2 million
of debt acquired through acquisitions.
|
Senior Notes
During August 2017, Valvoline completed the issuance of
4.375%
senior unsecured notes due 2025 with an aggregate principal amount of
$400 million
. The net proceeds from the offering of the 2025 Notes were
$394 million
(after deducting initial purchasers’ discounts and debt issuance costs), which were used to make a voluntary contribution to the Company’s qualified U.S. pension plan.
During July 2016, Valvoline completed the issuance of
5.500%
senior unsecured notes due 2024 with an aggregate principal amount of
$375 million
. The net proceeds from the offering of the 2024 Notes were
$370 million
(after deducting initial purchasers’ discounts and debt issuance costs), which were transferred to Valvoline’s former parent, Ashland.
The Senior Notes are subject to customary events of default for similar debt securities, which if triggered may accelerate the payment of principal, premium, if any, and accrued but unpaid interest on the notes. Such events of default include non-payment of principal and interest, non-performance of covenants and obligations, default on other material debt, and bankruptcy or insolvency. If a change of control repurchase event occurs, Valvoline, may be required to offer to purchase the Senior Notes from the holders thereof. The Senior Notes are not otherwise required to be repaid prior to maturity, although they may be redeemed at the option of Valvoline at any time prior to their maturity in the manner specified in the governing indentures. The Senior Notes are guaranteed by each of Valvoline’s subsidiaries that guarantee obligations under the existing senior credit facility described below.
Valvoline completed registered exchange offers for the Senior Notes in December 2017, for which
no
additional proceeds were received.
Senior Credit Agreement
The 2016 Senior Credit Agreement provides for an aggregate principal amount of
$1,325 million
in senior secured credit facilities (“2016 Credit Facilities”), comprised of (i) a
five
-year
$875 million
term loan facility (“Term Loans”), and (ii) a
five
-year
$450 million
revolving credit facility (including a
$100 million
letter of credit sublimit) (“Revolver”). As of September 30, 2018 and 2017, the Term Loans had outstanding principal balances of $
270 million
and $
285 million
, respectively. As of September 30, 2018, there was $
147 million
outstanding under the Revolver, and there was
no
amount outstanding as of September 30, 2017. During the year ended September 30, 2018, Valvoline borrowed $
204 million
and made payments of $
57 million
on the Revolver. As of September 30, 2018, the total borrowing capacity remaining under the Revolver was $
293 million
due to a reduction of $
10 million
for letters of credit outstanding.
The outstanding principal balance of the Term Loans is required to be repaid in quarterly installments of approximately
$8 million
for each of fiscal 2019 and 2020,
$15 million
for fiscal 2021, with the balance due at maturity. At Valvoline’s option, amounts outstanding under the 2016 Senior Credit Agreement bear interest at either LIBOR or an alternate base rate, in each case plus the applicable interest rate margin. The interest rate fluctuates between LIBOR plus
1.500%
per annum and LIBOR plus
2.500%
per annum (or
72
between the alternate base rate plus
0.500%
per annum and the alternate base rate plus
1.500%
annum), based upon Valvoline’s corporate credit ratings or the consolidated first lien net leverage ratio (as defined in the 2016 Senior Credit Agreement).
The 2016 Credit Facilities are guaranteed by Valvoline’s existing and future subsidiaries (other than certain immaterial subsidiaries, joint ventures, special purpose financing subsidiaries, regulated subsidiaries, non-U.S. subsidiaries and certain other subsidiaries), and are secured by a first-priority security interest in substantially all the personal property assets and certain real property assets of Valvoline and the guarantors, including all or a portion of the equity interests of certain of Valvoline’s domestic subsidiaries and first-tier non-U.S. subsidiaries. The 2016 Credit Facilities may be prepaid at any time without premium.
The 2016 Senior Credit Agreement contains usual and customary representations and warranties and usual and customary affirmative and negative covenants, including limitations on liens, additional indebtedness, investments, restricted payments, asset sales, mergers, affiliate transactions and other customary limitations, as well as financial covenants (including maintenance of a maximum consolidated net leverage ratio and a minimum consolidated interest coverage ratio). As of the end of any fiscal quarter, the maximum consolidated net leverage ratio and minimum consolidated interest coverage ratio permitted under the 2016 Senior Credit Agreement are
4.5
and
3.0
, respectively. As of September 30, 2018, Valvoline was in compliance with all covenants under the 2016 Senior Credit Agreement.
Trade Receivables Facility
On November 29 2016, Valvoline entered into a
$125 million
,
one
-year revolving trade receivables securitization facility (“Trade Receivables Facility”) with certain financial institutions. On November 20, 2017, the Company amended the Trade Receivables Facility to extend the maturity date to November 19, 2020 and increase the maximum funding under the facility to
$175 million
based on the availability of eligible receivables and other customary factors and conditions.
Under the Trade Receivables Facility, Valvoline sells and/or transfers a majority of its U.S. trade receivables to a wholly-owned, bankruptcy-remote subsidiary as they are originated, and advances by the lenders to that subsidiary (in the form of cash or letters of credit) are secured by those trade receivables. The assets of this financing subsidiary are restricted as collateral for the payment of its obligations under the Trade Receivables Facility, and its assets and credit are not available to satisfy the debts and obligations owed to the creditors of the Company. The Company includes the assets, liabilities and results of operations of this financing subsidiary in its consolidated financial statements.
During the first fiscal quarter of 2017, Valvoline borrowed
$75 million
under the Trade Receivables Facility and used the net proceeds to repay an equal amount of the Term Loans. During the year ended September 30, 2018, Valvoline made payments of
$36 million
and borrowed
$101 million
under the Trade Receivables Facility, using the proceeds to supplement the Company’s daily cash needs.
The Company accounts for the Trade Receivables Facility as secured borrowings. Based upon the maturity dates in place in each respective period, as of September 30, 2018, the
$140 million
balance outstanding was classified as
Long-term debt
and the
$75 million
balance at September 30, 2017 was classified as
Short-term debt
in the Consolidated Balance Sheets. Based on the availability of eligible receivables, the total borrowing capacity remaining under the Trade Receivables Facility as of September 30, 2018 was approximately
$35 million
. The financing subsidiary owned
$275 million
and
$247 million
of outstanding accounts receivable as of September 30, 2018 and 2017, respectively, and these amounts are included in
Accounts receivable, net
in the Company’s Consolidated Balance Sheets.
The financing subsidiary pays customary fees to the lenders, and advances by a lender under the Trade Receivables Facility accrue interest for which the weighted average interest rates were
2.8%
and
1.8%
for the years ended September 30, 2018 and 2017, respectively. The Trade Receivables Facility contains various customary affirmative and negative covenants and default and termination provisions, which provide for acceleration of amounts owed under the Trade Receivables Facility in circumstances including, but not limited to, the failure to pay interest or other amounts when due, defaults on certain other indebtedness, certain insolvency events, and breach of representation.
73
Long-term debt maturities
The future maturities of debt outstanding as of September 30, 2018, excluding debt issuance costs and discounts, are as follows:
|
(In millions)
|
||||
|
Years ending September 30
|
|
|||
|
2019
|
|
$
|
30
|
|
|
2020
|
|
30
|
|
|
|
2021
|
|
497
|
|
|
|
2022
|
|
—
|
|
|
|
2023
|
|
—
|
|
|
|
Thereafter
|
|
776
|
|
|
|
Total
|
|
$
|
1,333
|
|
Valvoline conducts certain of its sales, support, manufacturing and distribution operations using leased facilities, and also operates certain equipment and vehicles under leases, the initial lease terms of which vary in length. Many of the leases contain renewal options and escalation clauses that are not material to the consolidated financial statements. Capitalized and financing lease obligations are primarily included in
Other noncurrent liabilities
with related assets in
Property, plant and equipment, net
within the Consolidated Balance Sheets. Future minimum lease payments for noncancelable operating and capital leases and financing obligations as of September 30, 2018 for the following fiscal years ended September 30 are:
|
(In millions)
|
Operating leases
(a)
|
Capital leases and financing obligations
|
||||||
|
2019
|
$
|
28
|
|
$
|
6
|
|
||
|
2020
|
23
|
|
6
|
|
||||
|
2021
|
21
|
|
6
|
|
||||
|
2022
|
18
|
|
6
|
|
||||
|
2023
|
16
|
|
6
|
|
||||
|
Thereafter
|
64
|
|
50
|
|
||||
|
Total future minimum lease payments
|
$
|
170
|
|
80
|
|
|||
|
Imputed interest
|
(33
|
)
|
||||||
|
Present value of minimum lease payments
|
$
|
47
|
|
|||||
(a) Minimum payments have not been reduced by minimum sublease rental income of approximately
$4 million
due under future noncancelable subleases.
The composition of net rent expense for all operating leases, including leases of property and equipment, was as follows for the years ended September 30:
|
(In millions)
|
2018
|
2017
|
2016
|
|||||||||
|
Minimum rentals
|
$
|
25
|
|
$
|
18
|
|
$
|
15
|
|
|||
|
Contingent rentals
|
2
|
|
2
|
|
2
|
|
||||||
|
Sublease rental income
|
(2
|
)
|
(1
|
)
|
(1
|
)
|
||||||
|
Net rent expense
|
$
|
25
|
|
$
|
19
|
|
$
|
16
|
|
|||
74
The following table presents pre-tax income and the principal components of the reconciliation between the effective tax rate and the U.S. federal statutory income tax rate in effect for the years ended September 30:
|
(In millions)
|
2018
|
2017
|
2016
|
|||||||||
|
Income before income taxes
|
||||||||||||
|
United States
|
$
|
282
|
|
$
|
433
|
|
$
|
382
|
|
|||
|
Non-U.S.
|
50
|
|
57
|
|
39
|
|
||||||
|
Total income before income taxes
|
$
|
332
|
|
$
|
490
|
|
$
|
421
|
|
|||
|
U.S. statutory tax rate
|
24.5
|
%
|
35.0
|
%
|
35.0
|
%
|
||||||
|
Income taxes computed at U.S. statutory tax rate
|
$
|
81
|
|
$
|
171
|
|
$
|
147
|
|
|||
|
Increase (decrease) in amount computed resulting from:
|
||||||||||||
|
Unrecognized tax benefits
|
—
|
|
2
|
|
3
|
|
||||||
|
State taxes, net of federal benefit
|
14
|
|
17
|
|
16
|
|
||||||
|
International rate differential
|
—
|
|
(7
|
)
|
(5
|
)
|
||||||
|
Permanent items
|
(3
|
)
|
(8
|
)
|
(11
|
)
|
||||||
|
Remeasurement of net deferred taxes
|
73
|
|
—
|
|
—
|
|
||||||
|
Deemed repatriation
|
4
|
|
—
|
|
—
|
|
||||||
|
Tax Matters Agreement activity
|
(2
|
)
|
10
|
|
—
|
|
||||||
|
Other
|
(1
|
)
|
1
|
|
(2
|
)
|
||||||
|
Income tax expense
|
$
|
166
|
|
$
|
186
|
|
$
|
148
|
|
|||
|
Effective tax rate
|
50.0
|
%
|
38.0
|
%
|
35.2
|
%
|
||||||
Tax reform legislation
On December 22, 2017, the President of the United States signed into law tax reform legislation (the “Act”), which generally became effective January 1, 2018. The Act includes a number of provisions, including lowering the federal corporate income tax rate from a maximum of 35% to 21% and changing or limiting certain tax deductions. While the Company expects this rate reduction will ultimately benefit Valvoline, the Act also includes provisions that are expected to offset some of the benefit of the rate reduction, including the repeal of the deduction for domestic production activities and the expansion of the limitation on the deduction of certain executive compensation. In addition, the Act alters the landscape of taxation of non-U.S. operations and provides immediate deductions for certain new investments, among other provisions.
Based on the effective date of the rate reduction in the Act, the Company’s federal corporate statutory income tax rate was a blended rate of
24.5%
for fiscal 2018, declining to 21% for fiscal 2019 and beyond.
During the year ended September 30, 2018, enactment of the Act resulted in the following provisional impacts:
|
•
|
The remeasurement of net deferred tax assets resulted in a net
$67 million
increase in income tax expense primarily related to the lower enacted corporate tax rate;
|
|
•
|
Income tax expense increased by
$4 million
related to the deemed repatriation tax on undistributed non-U.S. earnings and profits and
$2 million
for withholding taxes due to the Company’s change in indefinite reinvestment assertion regarding its undistributed earnings; and
|
|
•
|
The remeasurement of net indemnity liabilities associated with the Tax Matters Agreement increased pre-tax expense by
$7 million
and generated a
$3 million
tax benefit primarily related to the reduced federal benefit of state tax deductions, which drove increases in the higher expected utilization of tax attributes payable to Ashland.
|
The estimated impacts of the Act recorded during the year ended September 30, 2018 are provisional, and management will continue to assess the impact and record adjustments through the income tax provision up to one year from the enactment date as amounts are known and reasonably estimable. Accordingly, the impact of the Act may differ from the Company’s provisional estimates due to and among other factors, information currently not available, changes in interpretations and the issuance of additional guidance, as well as
75
changes in assumptions the Company has currently made, including actions the Company may take in future periods as a result of the Act.
The Company also reclassified
$8 million
from accumulated other comprehensive income to retained deficit related to the stranded tax effects resulting from the change in the federal corporate tax rate during fiscal 2018 as further detailed in Notes 2 and 17.
Many states have enacted state specific tax reform and legislation in response to the Act. In general, these impacts are not material to the Company’s financial statements. Valvoline is incorporated in Kentucky, which enacted income tax reform on April 13, 2018. The provisions of Kentucky tax reform generally become effective in fiscal 2019 and include a number of provisions, notably lowering the corporate income tax rate from a maximum of 6% to 5%. While the Company expects these changes will ultimately benefit Valvoline, during the year ended September 30, 2018, the enactment of Kentucky tax reform resulted in the following impacts:
|
•
|
The remeasurement of net deferred tax assets at the lower enacted Kentucky corporate tax rate resulted in a net
$4 million
increase in income tax expense; and
|
|
•
|
The remeasurement of the net indemnity liabilities associated with the Tax Matters Agreement increased pre-tax income by
$4 million
and generated
$4 million
of income tax expense primarily related to the lower expected utilization of tax attributes payable to Ashland.
|
The Company will continue to monitor enacted state legislation and make relevant updates to estimates when warranted.
Components of income tax expense
Income tax expense consisted of the following for the years ended September 30:
|
(In millions)
|
2018
|
2017
|
2016
|
|||||||||
|
Current
|
||||||||||||
|
Federal
(a)
|
$
|
(2
|
)
|
$
|
47
|
|
$
|
99
|
|
|||
|
State
|
6
|
|
8
|
|
24
|
|
||||||
|
Non-U.S.
|
17
|
|
14
|
|
12
|
|
||||||
|
21
|
|
69
|
|
135
|
|
|||||||
|
Deferred
|
||||||||||||
|
Federal
|
136
|
|
106
|
|
14
|
|
||||||
|
State
|
9
|
|
12
|
|
2
|
|
||||||
|
Non-U.S.
|
—
|
|
(1
|
)
|
(3
|
)
|
||||||
|
145
|
|
117
|
|
13
|
|
|||||||
|
Income tax expense
|
$
|
166
|
|
$
|
186
|
|
$
|
148
|
|
|||
|
(a)
|
Benefit from favorable settlement with tax authorities in fiscal 2018.
|
Deferred income taxes are provided for income and expense items recognized in different years for tax and financial reporting purposes.
76
Deferred taxes
A summary of the deferred tax assets and liabilities included in the Consolidated Balance Sheets follows as of September 30:
|
(In millions)
|
2018
|
2017
|
||||||
|
Deferred tax assets
|
||||||||
|
Federal net operating loss carryforwards
|
$
|
—
|
|
$
|
96
|
|
||
|
Non-U.S. net operating loss carryforwards
(a)
|
2
|
|
1
|
|
||||
|
State net operating loss carryforwards
(b)
|
19
|
|
28
|
|
||||
|
Employee benefit obligations
|
86
|
|
132
|
|
||||
|
Compensation accruals
|
21
|
|
29
|
|
||||
|
Credit carryforwards
(c)
|
36
|
|
13
|
|
||||
|
Other
|
9
|
|
13
|
|
||||
|
Valuation allowances
(d)
|
(7
|
)
|
(8
|
)
|
||||
|
Net deferred tax assets
|
166
|
|
304
|
|
||||
|
Deferred tax liabilities
|
||||||||
|
Goodwill and other intangibles
|
3
|
|
3
|
|
||||
|
Property, plant and equipment
|
23
|
|
17
|
|
||||
|
Undistributed earnings
|
2
|
|
3
|
|
||||
|
Total deferred tax liabilities
|
28
|
|
23
|
|
||||
|
Total net deferred tax assets
|
$
|
138
|
|
$
|
281
|
|
||
|
(a)
|
Gross non-U.S. net operating loss carryforwards of
$7 million
expire in fiscal years 2020 to 2033, with
$5 million
that has no expiration.
|
|
(b)
|
Apportioned gross net operating loss carryforwards of
$481 million
expire in fiscal years 2019 through 2037.
|
|
(c)
|
Credit carryforwards consist primarily of non-U.S. tax credits that generally expire in the fiscal years 2025 through 2037.
|
|
(d)
|
Valuation allowances primarily relate to certain state and non-U.S. net operating loss carryforwards and certain other deferred tax assets that are not expected to be realized or realizable.
|
As a result of the Act and Kentucky tax reform, the Company revalued its net deferred tax assets, which resulted in a reduction in the value of approximately
$71 million
primarily related to the reduction in the federal and Kentucky corporate income tax rates that was recorded as additional deferred income tax expense in the Company’s Consolidated Statements of Comprehensive Income for the year ended September 30, 2018 as noted above.
Undistributed earnings
The Act implements a new territorial tax system that imposes a one-time transition tax, or deemed repatriation, on undistributed earnings of certain non-U.S. subsidiaries that is based in part on the amount of these earnings held in cash and other specified assets. The mandatory deemed repatriation resulted in a
$23 million
gross liability, but allows for the realization of
$19 million
of previously unrecognized foreign tax credits related to taxes previously paid in relevant local jurisdictions. The net result was
$4 million
of income tax expense which was recognized during the year ended September 30, 2018.
Prior to the Act, the Company had not provided for U.S. income taxes on undistributed earnings and other outside basis differences of its non-U.S. subsidiaries as it was the Company’s intention for these tax basis differences to remain indefinitely reinvested based on access to sufficient liquidity within the United States, as well as plans for use and investment outside of the United States. As these tax basis differences were subject to the deemed repatriation tax, the Company reevaluated its assertion and no longer intends to indefinitely reinvest the Company’s non-U.S. current and undistributed earnings. As a result, Valvoline recorded
$2 million
for estimated incremental withholding taxes during fiscal 2018 and began to account for certain of its non-U.S. subsidiaries as being immediately subject to tax, while certain other outside basis differences restricted by regulations, operational or investing needs for non-U.S. subsidiaries remain indefinitely reinvested. If these earnings were to be repatriated in the future, the Company may be subject to additional income and withholding taxes, which are not practicable to estimate.
77
Tax Matters Agreement
The Tax Matters Agreement was entered into on September 22, 2016 between Ashland and Valvoline (the “Tax Matters Agreement”) and generally provides that Valvoline is required to indemnify Ashland for the following items:
|
•
|
Taxes of Valvoline for all taxable periods that begin on or after the day after the date of the Distribution;
|
|
•
|
Taxes of Valvoline for the period between the IPO and Distribution that are not attributable to Ashland Group Returns (as defined below);
|
|
•
|
Taxes for the pre-IPO period that arise on audit or examination and are directly attributable to the Valvoline business;
|
|
•
|
Certain U.S. federal, state or local taxes for the pre-IPO period of Ashland and/or its subsidiaries for that period that arise on audit or examination and are directly attributable to neither the Valvoline business nor the Ashland chemicals business;
|
|
•
|
Certain tax attributes inherited from Ashland as the result of the Contribution from Ashland; and
|
|
•
|
Transaction Taxes (as defined below) that are allocated to Valvoline under the Tax Matters Agreement.
|
For taxable periods that begin on or after the day after the date of Distribution, Valvoline has not been included in Ashland’s consolidated U.S. and state income tax returns, nor in income tax returns of certain Ashland international subsidiaries (collectively, the “Ashland Group Returns”). Following the Distribution, Valvoline files tax returns that include only Valvoline and/or its subsidiaries, as appropriate, and accordingly, Valvoline is not required to make tax sharing payments to Ashland for these taxable periods. Valvoline has joint and several liability with Ashland to the U.S. Internal Revenue Service (“IRS”) for the consolidated U.S. federal income taxes of the Ashland consolidated group for the taxable periods in which Valvoline was part of the Ashland Group Returns. Valvoline will have joint control with Ashland, over any audit or examination related to taxes for which Valvoline is required to indemnify Ashland.
For the periods prior to the Distribution, Valvoline was included in the Ashland Group Returns. Under the Tax Matters Agreement, Ashland generally made all necessary tax payments to the relevant tax authorities with respect to Ashland Group Returns, and Valvoline made tax sharing payments to Ashland, inclusive of tax attributes utilized. The amount of the tax sharing payments were generally determined as if Valvoline and each of its relevant subsidiaries included in the Ashland Group Returns filed their own consolidated, combined or separate tax returns for the period from the IPO to the Distribution that include only Valvoline and/or its relevant subsidiaries, as the case may be. During fiscal 2017, Valvoline made
$48 million
in net tax-sharing payments to Ashland for the period prior to the Distribution.
During fiscal 2018, Valvoline recognized
$8 million
of pre-tax expense in
Legacy and separation-related expenses, net
withi
n the Consolidated Statements of Comprehensive Income for the estimated adjustments in net amounts due to Ashland primarily as a result of Ashland’s lower than expected utilization of Valvoline tax attributes in Ashland Group Returns, tax reform legislation that reduced statutory rates, as well as the settlement of fiscal 2012 and 2013 federal examinations that resulted in increases in Valvoline’s expected utilization of tax attributes. Valvoline recognized an income tax benefit of
$5 million
during fiscal 2018 related to these changes. In fiscal 2017, Valvoline recognized a
$16 million
pre-tax benefit in
Legacy and separation-related expenses, net
for a reduction in amounts due to Ashland under the Tax Matters Agreement as a result of Ashland’s estimated utilization of Valvoline tax attributes in the Ashland Group Returns. This pre-tax benefit was offset by income tax expense of
$16 million
.
Total liabilities related to obligations owed to Ashland under the Tax Matters Agreement are primarily recorded in
Other noncurrent liabilities
in the Consolidated Balance Sheets and were
$66 million
and
$62 million
as of September 30, 2018 and 2017, respectively.
The Tax Matters Agreement also provides that Valvoline indemnify Ashland for any taxes (and reasonable expenses) resulting from the failure of the Distribution to qualify for non-recognition of gain and loss or certain reorganization transactions related to the Contribution or the Distribution to qualify for their intended tax treatment (“Transaction Taxes”), where the taxes result from (1) breaches of covenants (including covenants containing the restrictions described below that are designed to preserve the tax-free nature of the Distribution), (2) the application of certain provisions of U.S. federal income tax law to the Distribution with respect to acquisitions of Valvoline’s common stock, or (3) any other actions that Valvoline knows or reasonably should expect would give rise to such taxes. The Tax Matters Agreement also requires Valvoline to indemnify Ashland for a portion of certain other Transaction Taxes allocated to Valvoline based on Valvoline’s market capitalization relative to the market capitalization of Ashland.
The Tax Matters Agreement imposes certain restrictions on Valvoline and its subsidiaries (including restrictions on share issuances or repurchases, business combinations, sales of assets and similar transactions) that are designed to preserve the tax-free nature of the Distribution. These restrictions apply for the two-year period following the Distribution. Valvoline may be able to engage in an otherwise restricted action if Valvoline obtains an appropriate opinion from counsel or ruling from the IRS.
78
Unrecognized tax benefits
The aggregate changes in the balance of gross unrecognized tax benefits were as follows for the years ended September 30:
|
(In millions)
|
2018
|
2017
|
2016
|
|||||||||
|
Gross unrecognized tax benefits as of October 1
|
$
|
10
|
|
$
|
8
|
|
$
|
5
|
|
|||
|
Increases related to tax positions from prior years
|
2
|
|
—
|
|
2
|
|
||||||
|
Increases related to tax positions taken during the current year
|
1
|
|
2
|
|
1
|
|
||||||
|
Settlements with tax authorities
|
(2
|
)
|
—
|
|
—
|
|
||||||
|
Lapses of statutes of limitation
|
(1
|
)
|
—
|
|
—
|
|
||||||
|
Gross unrecognized tax benefits as of September 30
(a)
|
$
|
10
|
|
$
|
10
|
|
$
|
8
|
|
|||
|
(a)
|
As of September 30, 2018 and 2017, the Company had accruals of
$1 million
for interest and penalties related to unrecognized tax benefits.
|
Unrecognized tax benefits of
$10 million
as of September 30,
2018
and 2017 would favorably impact the effective income tax rate if recognized.
Together with Ashland, the Company resolved IRS examinations in fiscal 2018 for the 2012 and 2013 tax years, and accordingly, U.S. federal tax years remain open from fiscal 2014 forward. With certain exceptions, years beginning on or after fiscal 2006 remain open to examination by certain U.S. state and non-U.S. taxing authorities.
Because Valvoline is routinely under examination by various taxing authorities, it is reasonably possible that the amount of unrecognized tax benefits will change during the next twelve months. An estimate of the amount or range of such change cannot be made at this time. However, the Company does not expect the change, if any, to have a material effect on the Company’s consolidated financial statements within the next twelve months. Given the indemnification of Ashland and the years remaining open to examination, the majority of the Company’s liability for unrecognized tax benefits as of September 30, 2018 and 2017 is included in the Tax Matters Agreement obligation to Ashland summarized above within
Other noncurrent liabilities
in the Consolidated Balance Sheets.
Pension and other postretirement plans
The majority of U.S. pension plans have been closed to new participants since January 1, 2011 and effective September 30, 2016, the accrual of pension benefits for participants were frozen. In addition, most international pension plans are closed to new participants while those that remain open relate to areas where local laws require plans to operate within the applicable country.
Valvoline also sponsors healthcare and life insurance plans for certain qualifying retired or disabled employees. These other postretirement benefit plans were amended to reduce retiree life and medical benefits effective October 1, 2016 and January 1, 2017, respectively. These plans have limited the annual per capita costs to an amount equivalent to base year per capita costs, plus annual increases of up to
1.5%
per year for costs incurred. As a result, health care cost trend rates do not have a significant impact on the Company’s future obligations for these plans. The assumed pre-65 health care cost trend rate as of September 30, 2018 was
7.5%
and continues to be reduced to
4.5%
in 2037 and thereafter.
79
Components of net periodic benefit income
The following table summarizes the components of pension and other postretirement plans net periodic benefit income and the assumptions used in this determination for the years ended September 30:
|
(In millions)
|
Pension benefits
|
Other postretirement benefits
|
||||||||||||||||||||||
|
2018
|
2017
|
2016
|
2018
|
2017
|
2016
|
|||||||||||||||||||
|
Net periodic benefit income
|
||||||||||||||||||||||||
|
Service cost
|
$
|
2
|
|
$
|
2
|
|
$
|
3
|
|
$
|
—
|
|
$
|
—
|
|
$
|
—
|
|
||||||
|
Interest cost
|
75
|
|
86
|
|
11
|
|
2
|
|
1
|
|
—
|
|
||||||||||||
|
Expected return on plan assets
|
(103
|
)
|
(145
|
)
|
(17
|
)
|
—
|
|
—
|
|
—
|
|
||||||||||||
|
Amortization of prior service credit
(a)
|
—
|
|
—
|
|
—
|
|
(12
|
)
|
(12
|
)
|
(1
|
)
|
||||||||||||
|
Actuarial loss (gain)
|
38
|
|
(63
|
)
|
(42
|
)
|
—
|
|
(5
|
)
|
—
|
|
||||||||||||
|
Pre-separation allocation from Ashland
(b)
|
—
|
|
—
|
|
21
|
|
—
|
|
—
|
|
—
|
|
||||||||||||
|
Net periodic benefit costs (income)
|
$
|
12
|
|
$
|
(120
|
)
|
$
|
(24
|
)
|
$
|
(10
|
)
|
$
|
(16
|
)
|
$
|
(1
|
)
|
||||||
|
Weighted-average plan assumptions
(c)
|
||||||||||||||||||||||||
|
Discount rate for service cost
(d)
|
2.94
|
%
|
2.15
|
%
|
4.10
|
%
|
4.05
|
%
|
2.95
|
%
|
4.25
|
%
|
||||||||||||
|
Discount rate for interest cost
(d)
|
3.23
|
%
|
2.84
|
%
|
3.23
|
%
|
3.11
|
%
|
2.64
|
%
|
2.92
|
%
|
||||||||||||
|
Rate of compensation increase
|
3.05
|
%
|
2.99
|
%
|
3.23
|
%
|
—
|
|
—
|
|
—
|
|
||||||||||||
|
Expected long-term rate of return on plan assets
|
5.17
|
%
|
6.56
|
%
|
6.77
|
%
|
—
|
|
—
|
|
—
|
|
||||||||||||
|
(a)
|
Other postretirement plan amendments noted above resulted in negative plan amendments that are amortized within this caption during all periods presented.
|
|
(b)
|
The pre-Contribution allocation from Ashland in fiscal 2016 until the transfer of plans to Valvoline at September 1, 2016 consist of service cost of
$7 million
, non-service income of
$10 million
, and actuarial losses of
$24 million
.
|
|
(c)
|
The plan assumptions are a blended weighted-average rate for Valvoline’s U.S. and non-U.S. plans. The 2016 assumptions reflect a combination of a full year of Valvoline stand-alone plans and one month for the plans transferred to Valvoline on September 1, 2016. The U.S. pension plans represented approximately
97%
of the total pension projected benefit obligation as of September 30, 2018. Other postretirement benefit plans consist of U.S. and Canada, with the U.S. plan representing approximately
75%
of the total other postretirement projected benefit obligation as of September 30, 2018. Non-U.S. plans use assumptions generally consistent with those of U.S. plans.
|
|
(d)
|
Weighted-average discount rates reflect the adoption of the full yield curve approach in fiscal 2016.
|
The following table summarizes the amortization of prior service credit recognized in accumulated other comprehensive loss:
|
Pension benefits
|
Other postretirement benefits
|
|||||||||||||||
|
(In millions)
|
2018
|
2017
|
2018
|
2017
|
||||||||||||
|
Amortization of prior service credit recognized in accumulated other comprehensive income
|
$
|
—
|
|
$
|
—
|
|
$
|
12
|
|
$
|
12
|
|
||||
|
Net periodic benefit costs (income)
|
12
|
|
(120
|
)
|
(10
|
)
|
(16
|
)
|
||||||||
|
Total amount recognized in net periodic benefit cost (income) and accumulated other comprehensive income
|
$
|
12
|
|
$
|
(120
|
)
|
$
|
2
|
|
$
|
(4
|
)
|
||||
80
Obligations and funded status
The following table summarizes the changes in benefit obligations and the fair value of plan assets, as well as key assumptions used to determine the benefit obligations, and the amounts recognized in the Consolidated Balance Sheets as of September 30,
2018
and
2017
for the Company’s pension and other postretirement benefit plans:
|
(In millions)
|
Pension benefits
|
Other postretirement benefits
|
||||||||||||||
|
2018
|
2017
|
2018
|
2017
|
|||||||||||||
|
Change in benefit obligations
|
||||||||||||||||
|
Benefit obligations as of October 1
|
$
|
2,381
|
|
$
|
3,138
|
|
$
|
57
|
|
$
|
73
|
|
||||
|
Service cost
|
2
|
|
2
|
|
—
|
|
—
|
|
||||||||
|
Interest cost
|
75
|
|
86
|
|
2
|
|
1
|
|
||||||||
|
Participant contributions
|
—
|
|
—
|
|
—
|
|
3
|
|
||||||||
|
Benefits paid
|
(146
|
)
|
(210
|
)
|
(7
|
)
|
(16
|
)
|
||||||||
|
Actuarial gain
|
(95
|
)
|
(60
|
)
|
—
|
|
(5
|
)
|
||||||||
|
Currency exchange rate changes
|
(3
|
)
|
4
|
|
(1
|
)
|
1
|
|
||||||||
|
Transfers in
|
9
|
|
6
|
|
—
|
|
—
|
|
||||||||
|
Settlements
|
(136
|
)
|
(585
|
)
|
—
|
|
—
|
|
||||||||
|
Benefit obligations as of September 30
|
$
|
2,087
|
|
$
|
2,381
|
|
$
|
51
|
|
$
|
57
|
|
||||
|
Change in plan assets
|
||||||||||||||||
|
Fair value of plan assets as of October 1
|
$
|
2,081
|
|
$
|
2,307
|
|
$
|
—
|
|
$
|
—
|
|
||||
|
Actual return on plan assets
|
(30
|
)
|
148
|
|
—
|
|
—
|
|
||||||||
|
Employer contributions
|
16
|
|
412
|
|
7
|
|
13
|
|
||||||||
|
Participant contributions
|
—
|
|
—
|
|
—
|
|
3
|
|
||||||||
|
Benefits paid
|
(146
|
)
|
(210
|
)
|
(7
|
)
|
(16
|
)
|
||||||||
|
Currency exchange rate changes
|
(3
|
)
|
3
|
|
—
|
|
—
|
|
||||||||
|
Settlements
|
(136
|
)
|
(585
|
)
|
—
|
|
—
|
|
||||||||
|
Transfers in
|
10
|
|
6
|
|
—
|
|
—
|
|
||||||||
|
Fair value of plan assets as of September 30
|
$
|
1,792
|
|
$
|
2,081
|
|
$
|
—
|
|
$
|
—
|
|
||||
|
Unfunded status of the plans as of September 30
|
$
|
295
|
|
$
|
300
|
|
$
|
51
|
|
$
|
57
|
|
||||
|
Amounts recognized in the Consolidated Balance Sheets
|
||||||||||||||||
|
Current benefit liabilities
|
$
|
10
|
|
$
|
11
|
|
$
|
6
|
|
$
|
8
|
|
||||
|
Noncurrent benefit liabilities
|
285
|
|
289
|
|
45
|
|
49
|
|
||||||||
|
Net amount recognized
|
$
|
295
|
|
$
|
300
|
|
$
|
51
|
|
$
|
57
|
|
||||
|
Amounts recognized in accumulated other comprehensive income (loss)
|
||||||||||||||||
|
Prior service cost (credit)
|
$
|
2
|
|
$
|
2
|
|
$
|
(56
|
)
|
$
|
(68
|
)
|
||||
|
Weighted-average plan assumptions
|
||||||||||||||||
|
Discount rate
|
4.28
|
%
|
3.76
|
%
|
4.08
|
%
|
3.48
|
%
|
||||||||
|
Rate of compensation increase
|
3.10
|
%
|
3.13
|
%
|
—
|
|
—
|
|
||||||||
Valvoline recognizes the change in the fair value of plan assets and net actuarial gains and losses annually in the fourth quarter of each fiscal year and whenever a plan is determined to qualify for a remeasurement. Such gains and losses are reported within
Net pension and other postretirement plan income
in the Consolidated Statements of Comprehensive Income and were a loss of
$38 million
and a gain of
$68 million
for the years ended September 30, 2018 and 2017, respectively.
81
The fiscal 2018 loss was primarily attributed to lower than expected return on plan assets, which was partially offset by the benefit obligation actuarial gain for increases in discount rates and reduced mortality improvements. The fiscal 2017 gain was primarily attributed to the higher than expected return on assets and the benefit obligation actuarial gain for increases in discount rates and reduced mortality improvements. The fiscal 2017 gain also included the effect of the other postretirement benefit plan amendment to reduce retiree medical benefits that resulted in a remeasurement gain of
$8 million
during the first fiscal quarter of 2017.
Pension settlement program
During 2018, Valvoline offered the option of receiving a lump sum payment to certain participants with vested qualified U.S. pension plan retirement benefits in lieu of receiving monthly annuity payments. Approximately
2,600
participants elected to receive the settlement, and lump sum payments were made from plan assets to these participants in September 2018 for approximately
$134 million
. The benefit obligation settled approximated payments to plan participants and did not generate a material settlement adjustment during fiscal 2018.
Pension annuity program
On August 29, 2017, Valvoline used pension assets to purchase a non-participating annuity contract from an insurer that will pay and administer future pension benefits for approximately
6,000
participants within the qualified U.S. pension plan. Valvoline transferred approximately
$585 million
of the outstanding pension benefit obligation in exchange for pension trust assets that approximated the liability.
The annuity purchase transaction did not generate a material settlement adjustment during fiscal 2017. The insurer unconditionally and irrevocably guaranteed the full payment of benefits to plan participants associated with the annuity purchase and benefit payments are in the same form that was in effect under the plan. The insurer also assumed all investment risk associated with the pension assets that were delivered as annuity contract premiums.
Accumulated benefit obligation
The accumulated benefit obligation for all pension plans was
$2.1 billion
as of September 30,
2018
and
$2.4 billion
as of September 30,
2017
. Information for pension plans with a benefit obligation in excess of the fair value of plan assets follows for the Company’s plans as of September 30:
|
(In millions)
|
2018
|
2017
|
||||||||||||||
|
Benefit obligation
|
Plan assets
|
Benefit obligation
|
Plan assets
|
|||||||||||||
|
Plans with projected benefit obligation in excess of plan assets
|
$
|
2,045
|
|
$
|
1,749
|
|
$
|
2,381
|
|
$
|
2,081
|
|
||||
|
Plans with accumulated benefit obligation in excess of plan assets
|
$
|
2,034
|
|
$
|
1,741
|
|
$
|
2,368
|
|
$
|
2,072
|
|
||||
82
Plan assets
The following table summarizes the various investment categories that the pension plan assets are invested in and the applicable fair value hierarchy as described in Note 3 that the financial instruments are classified within these investment categories as of September 30,
2018
:
|
Total fair value
|
Quoted prices in active markets for identical assets
|
Significant other observable inputs
|
Significant unobservable inputs
|
Assets measured at NAV
|
||||||||||||||||
|
(In millions)
|
Level 1
|
Level 2
|
Level 3
|
|||||||||||||||||
|
Cash and cash equivalents
|
$
|
100
|
|
$
|
100
|
|
$
|
—
|
|
$
|
—
|
|
$
|
—
|
|
|||||
|
U.S. government securities and futures
(a)
|
74
|
|
(3
|
)
|
77
|
|
—
|
|
—
|
|
||||||||||
|
Other government securities
|
92
|
|
1
|
|
91
|
|
—
|
|
—
|
|
||||||||||
|
Corporate debt instruments
|
1,056
|
|
661
|
|
395
|
|
—
|
|
—
|
|
||||||||||
|
Insurance contracts
|
4
|
|
—
|
|
—
|
|
4
|
|
—
|
|
||||||||||
|
Private equity and hedge funds
|
60
|
|
—
|
|
—
|
|
—
|
|
60
|
|
||||||||||
|
Common collective trusts
|
406
|
|
—
|
|
—
|
|
—
|
|
406
|
|
||||||||||
|
Total assets at fair value
|
$
|
1,792
|
|
$
|
759
|
|
$
|
563
|
|
$
|
4
|
|
$
|
466
|
|
|||||
|
(a)
|
Level 1 investments are in a liability position as of September 30, 2018 and represent exchange-traded futures contracts that are used to manage the interest rate risk in the plan asset portfolio.
|
The following table summarizes the various investment categories that the pension plan assets are invested in and the applicable fair value hierarchy that the financial instruments are classified within these investment categories as of September 30,
2017
:
|
Total fair value
|
Quoted prices in active markets for identical assets
|
Significant other observable inputs
|
Significant unobservable inputs
|
Assets measured at NAV
|
||||||||||||||||
|
(In millions)
|
Level 1
|
Level 2
|
Level 3
|
|||||||||||||||||
|
Cash and cash equivalents
|
$
|
13
|
|
$
|
13
|
|
$
|
—
|
|
$
|
—
|
|
$
|
—
|
|
|||||
|
U.S. government securities and futures
|
339
|
|
207
|
|
132
|
|
—
|
|
—
|
|
||||||||||
|
Other government securities
|
86
|
|
—
|
|
86
|
|
—
|
|
—
|
|
||||||||||
|
Corporate debt instruments
|
1,197
|
|
934
|
|
263
|
|
—
|
|
—
|
|
||||||||||
|
International equity
|
16
|
|
—
|
|
16
|
|
—
|
|
—
|
|
||||||||||
|
Private equity and hedge funds
|
414
|
|
—
|
|
—
|
|
—
|
|
414
|
|
||||||||||
|
Other investments
|
16
|
|
—
|
|
—
|
|
16
|
|
—
|
|
||||||||||
|
Total assets at fair value
|
$
|
2,081
|
|
$
|
1,154
|
|
$
|
497
|
|
$
|
16
|
|
$
|
414
|
|
|||||
Cash and cash equivalents
The carrying value of cash and cash equivalents approximates fair value.
Government securities
Government securities that trade in an active market are valued using quoted market prices, which are Level 1 inputs. Other government securities are valued based on Level 2 inputs, which include yields available on comparable securities of issuers with similar credit ratings. Treasury futures are used to manage interest rate risk and are valued at the closing price reported on the exchange market for exchange-traded futures, which is a Level 1 input.
83
Corporate debt instruments
Corporate debt instruments that trade in an active market are valued using quoted market prices, which are Level 1 inputs. Other corporate debt instruments are valued based on Level 2 inputs, which includes quoted market prices in inactive markets and observable market quotations for similar bonds.
Insurance contracts
Insurance contracts are arrangements with insurance companies that guarantee the payment of the pension entitlements and are valued based on Level 3 inputs, which are neither quoted prices nor observable inputs for pricing. Insurance contracts are valued at cash surrender value, which approximates fair value.
International equity
International equity includes investments in equity securities generally traded in inactive markets, which include Level 2 inputs.
Private equity and hedge funds
Private equity and hedge funds primarily represent alternative investments not traded on an active market which are valued at the NAV per share determined by the manager of the fund based on the fair value of the underlying net assets owned by the fund divided by the number of shares or units outstanding.
Common collective trusts
Common collective trusts are comprised of a diversified portfolio of investments across various asset classes, including U.S. and international equities, fixed-income securities, commodities and currencies. The collective trust funds are valued using a NAV provided by the manager of each fund, which is based on the underlying net assets owned by the fund, divided by the number of shares outstanding.
The following table provides a reconciliation of the beginning and ending balances for Level 3 plan assets:
|
(In millions)
|
Total Level 3 assets
|
|||
|
Balance at September 30, 2016
|
$
|
23
|
|
|
|
Actual return on assets held at end of year
|
(7
|
)
|
||
|
Balance at September 30, 2017
|
$
|
16
|
|
|
|
Purchases
|
3
|
|
||
|
Sales
|
(8
|
)
|
||
|
Actual return on assets held at end of year
|
1
|
|
||
|
Actual return on assets sold during year
|
(8
|
)
|
||
|
Balance at September 30, 2018
|
$
|
4
|
|
|
Level 3 assets that were liquidated during fiscal 2018 and represented real estate investments that were valued using DCF and unobservable inputs, including future rentals, expenses and residual values from a market participant view of the highest and best use of the real estate.
84
The following table summarizes investments for which fair value is measured using the NAV per share practical expedient as of September 30, 2018:
|
(In millions)
|
Fair value
|
Unfunded commitments
|
Redemption frequency (if currently eligible)
|
Redemption notice period
|
|||||||
|
Long/short hedge funds
|
$
|
38
|
|
$
|
—
|
|
None
(a)
|
None
(a)
|
|||
|
Relative value hedge funds
|
11
|
|
—
|
|
None
(b)
|
None
(b)
|
|||||
|
Multi-strategy hedge funds
|
2
|
|
—
|
|
None
(b)
|
None
(b)
|
|||||
|
Event driven hedge funds
|
1
|
|
—
|
|
None
(b)
|
None
(b)
|
|||||
|
Common collective trusts
|
386
|
|
—
|
|
Daily
|
Up to 3 days
|
|||||
|
12
|
|
Monthly
|
5 days
|
||||||||
|
8
|
|
—
|
|
N/A
(c)
|
N/A
(c)
|
||||||
|
Private equity
|
8
|
|
6
|
|
None
(d)
|
None
(d)
|
|||||
|
$
|
466
|
|
$
|
6
|
|
||||||
|
(a)
|
These hedge funds are in the process of liquidation and approximately
88%
will be liquidated over the next year.
|
|
(b)
|
These hedge funds are in the process of liquidation and the timing of such is unknown.
|
|
(c)
|
These assets are held in Australia and are investments in funds that include a diversified portfolio across various asset classes. The time period for redemption of these assets is not determinable.
|
|
(d)
|
These private equity instruments are estimated to be liquidated over the next
1
to
5
years.
|
Investments and strategy
In developing an investment strategy for its defined benefit plans, Valvoline considered the following factors: the nature of the plans’ liabilities, the allocation of liabilities between active, deferred and retired plan participants, the funded status of the plans, the applicable investment horizon, the respective size of the plans and historical and expected investment returns. Valvoline’s U.S. pension plan assets are managed by outside investment managers, which are monitored against investment return benchmarks and Valvoline’s established investment strategy. Investment managers are selected based on an analysis of, among other things, their investment process, historical investment results, frequency of management turnover, cost structure and assets under management. Assets are periodically reallocated between investment managers to maintain an appropriate asset mix and diversification of investments and to optimize returns.
The current target asset allocation for the U.S. plan is
75%
fixed securities and
25%
equity-based securities. Fixed income securities primarily include long duration high grade corporate debt obligations. Equity-based securities include both traditional equities as well as a mix of non-traditional assets such as hedge and commingled funds and private equity. Investment managers may employ a limited use of futures or other derivatives to manage risk within the portfolio through efficient exposure to markets.
Valvoline’s investment strategy and management practices relative to plan assets of non-U.S. plans generally are consistent with those for U.S. plans, except in those countries where the investment of plan assets is dictated by applicable regulations. The weighted-average asset allocations for Valvoline’s U.S. and non-U.S. plans by asset category follow as of September 30:
|
Target
|
2018
|
2017
|
||||||
|
Plan assets allocation
|
||||||||
|
Equity securities
|
15-25%
|
23
|
%
|
20
|
%
|
|||
|
Debt securities
|
65-85%
|
76
|
%
|
78
|
%
|
|||
|
Other
|
0-20%
|
1
|
%
|
2
|
%
|
|||
|
Total
|
100
|
%
|
100
|
%
|
||||
The basis for determining the expected long-term rate of return is a combination of future return assumptions for the various asset classes in Valvoline’s investment portfolio based on active management, historical analysis of previous returns, market indices, and a projection of inflation, net of plan expenses.
85
Funding and benefit payments
Valvoline contributed
$16 million
and
$412 million
to its pension plans during fiscal 2018 and 2017, respectively. The 2017 contributions include
$394 million
of discretionary contributions made to the U.S. qualified pension plan funded by the proceeds received from the 2025 Notes described in Note 10. Valvoline does
not
plan to contribute to the U.S. qualified pension plan in fiscal 2019, but expects to contribute approximately
$13 million
to its U.S. non-qualified and non-U.S. pension plans.
The following benefit payments, which reflect future service expectations, are projected to be paid in each of the next five years and five years thereafter in aggregate:
|
(In millions)
|
Pension benefits
|
Other postretirement benefits
|
||||||
|
2019
|
$
|
142
|
|
$
|
6
|
|
||
|
2020
|
142
|
|
5
|
|
||||
|
2021
|
143
|
|
4
|
|
||||
|
2022
|
142
|
|
4
|
|
||||
|
2023
|
141
|
|
3
|
|
||||
|
Thereafter
|
695
|
|
15
|
|
||||
|
Total
|
$
|
1,405
|
|
$
|
37
|
|
||
Other plans
Defined contribution and other defined benefit plans
Valvoline’s savings plan provides matching contributions subject to a maximum percentage. Expense associated with this plan was
$14 million
in both fiscal 2018 and 2017. In fiscal 2016, qualifying Valvoline employees were eligible to participate in Ashland’s savings plan, and Valvoline’s allocated expense was
$11 million
.
Valvoline also sponsors various other benefit plans, some of which are required by local laws within the certain countries. Total current and noncurrent liabilities associated with these plans were
$1 million
and
$3 million
, respectively, as of September 30, 2018, and
$1 million
and
$4 million
, respectively, as of September 30, 2017.
Multiemployer pension plans
Valvoline participates in
two
multiemployer pension plans that provide pension benefits to certain union-represented employees under the terms of collective bargaining agreements. Valvoline assumed responsibility for contributions to these plans in connection with the separation from Ashland. Contributions to these plans were not material for fiscal 2018, 2017 or 2016.
In April 2018, Valvoline received a demand for payment of a partial withdrawal liability assessment of approximately
$30 million
related to the sale of a business by Ashland in fiscal 2011 and the associated reduction in contributions and the number of employees covered by one of the multiemployer pension plans. The Company is vigorously contesting the assessment and the calculation method utilized in its determination and received information in October 2018 indicating the multiemployer plan may accept approximately
$10 million
to settle this liability. The Company is evaluating the potential settlement options and submitted a formal arbitration request on October 31, 2018. The Company’s current best estimate of cost associated with this assessment is not material to the consolidated financial statements as of and for the periods ended September 30, 2018.
From time to time, Valvoline is party to lawsuits, claims and other legal proceedings that arise in the ordinary course of business. The Company establishes liabilities for the outcome of such matters where losses are determined to be probable and reasonably estimable. Where appropriate, the Company has recorded liabilities with respect to these matters, which were immaterial for the periods presented as reflected in the consolidated financial statements herein. There are certain claims and legal proceedings pending where loss is not determined to be probable or reasonably estimable, and therefore, accruals have not been made. In addition, Valvoline discloses matters for which management believes a material loss is at least reasonably possible.
86
In all instances, management has assessed each matter based on current information available and made a judgment concerning its potential outcome, giving due consideration to the amount and nature of the claim and the probability of success. As disclosed herein, the Company believes it has established adequate accruals for liabilities that are probable and reasonably estimable.
Although the ultimate resolution of these matters cannot be predicted with certainty and there can be no assurances that the actual amounts required to satisfy liabilities from these matters will not exceed the amounts reflected in the consolidated financial statements, based on information available at this time, it is the opinion of management that such pending claims or proceedings will not have a material adverse effect on its consolidated financial statements.
Valvoline has approved incentive plans that authorize
11 million
shares to be issued, with approximately
7 million
remaining available for issuance as of September 30, 2018. The Valvoline incentive plans authorize the grant of stock options, stock appreciation rights (“SARs”), restricted stock, performance shares and other nonvested stock awards. The Company’s principal stock incentive plan, the 2016 Valvoline Inc. Incentive Plan, uses a fungible share pool in which all awards other than stock options and SARs reduce the plan’s authorized shares on a
4.5
-to-1 ratio. The Compensation Committee of the Board of Directors administers the Valvoline incentive plans and has the authority to determine the individuals to whom awards will be made, the amount of those awards and other terms and conditions of the awards.
Prior to the Distribution, share-based awards for key Valvoline employees and directors were principally settled in Ashland common stock and granted through participation in Ashland’s stock incentive plans. In periods preceding the Distribution, stock-based compensation expense was allocated to Valvoline based on the awards and terms previously granted.
In connection with the Distribution on May 12, 2017, outstanding Ashland share-based awards held by Valvoline employees and directors were converted to equivalent share-based awards of Valvoline based on an exchange ratio of Ashland’s fair market value prior to the Distribution in relation to Valvoline’s fair market value post-Distribution. This conversion modified the number of awards outstanding, as well as certain terms and conditions of the original grants relative to performance and market measures. The conversion was treated as a modification for accounting purposes, and accordingly, Valvoline estimated its pre- and post-modification fair value, which resulted in an increase in the incremental fair value of the awards that was not material and is being expensed ratably over the remaining vesting period for each award.
T
he following is a summary of stock-based compensation expense recognized by the Company during the years ended September 30:
|
(In millions)
|
2018
|
2017
(b)
|
||||||
|
Stock appreciation rights
|
$
|
2
|
|
$
|
3
|
|
||
|
Nonvested stock awards
|
9
|
|
5
|
|
||||
|
Performance awards
|
1
|
|
2
|
|
||||
|
Total stock-based compensation expense, pre-tax
(a)
|
12
|
|
10
|
|
||||
|
Tax benefit
|
(3
|
)
|
(4
|
)
|
||||
|
Total stock-based compensation expense, net of tax
|
$
|
9
|
|
$
|
6
|
|
||
|
(a)
|
Includes approximately
$1 million
in each period presented related to certain awards that are cash-settled and liability-classified; therefore, fair value is remeasured at the end of each reporting period until settlement.
|
|
(b)
|
Stock-based compensation expense in fiscal 2017 includes
$4 million
that was allocated from Ashland prior to Distribution.
|
Stock Appreciation Rights
SARs were granted to certain Valvoline employees to provide award holders with the ability to profit from the appreciation in value of a set number of shares of common stock over a period of time by exercising their award and receiving the sum of the increase in shares. SARs were granted at a price equal to the fair market value of the stock on the date of grant and typically vest and become exercisable over a period of
one
to
three
years. Unexercised SARs lapse
ten
years after the grant date.
87
The following table summarizes the activity relative to SARs for the year ended September 30,
2018
:
|
Number of shares
(in thousands)
|
Weighted average exercise price per share
|
Weighted average remaining term
(in years)
|
Aggregate intrinsic value (in millions)
|
||||||||||
|
SARs outstanding as of September 30, 2017
|
1,824
|
|
$
|
17.48
|
|
7.1 years
|
$
|
11
|
|
||||
|
Granted
|
228
|
|
$
|
23.08
|
|
||||||||
|
Exercised
|
(205
|
)
|
$
|
13.64
|
|
$
|
2
|
|
|||||
|
Forfeited
|
(49
|
)
|
$
|
20.50
|
|
||||||||
|
SARs outstanding as of September 30, 2018
|
1,798
|
|
$
|
18.54
|
|
6.7 years
|
$
|
6
|
|
||||
|
SARs exercisable as of September 30, 2018
|
1,207
|
|
$
|
17.14
|
|
5.8 years
|
$
|
5
|
|
||||
As of September 30,
2018
, there was
$1 million
of total unrecognized compensation cost related to SARs, which is expected to be recognized over a weighted average period of
1.7
years.
Stock-based compensation expense for SARs was computed using the Black-Scholes option-pricing model to estimate the grant date fair value of new or modified awards with the following key assumptions:
|
2018
|
2017
|
|||||||
|
Weighted average grant date fair value per share
|
$
|
5.56
|
|
$
|
7.44
|
|
||
|
Assumptions (weighted average)
|
||||||||
|
Risk-free interest rate
(a)
|
2.2
|
%
|
1.7
|
%
|
||||
|
Expected dividend yield
|
0.9
|
%
|
0.9
|
%
|
||||
|
Expected volatility
(b)
|
23.3
|
%
|
22.8
|
%
|
||||
|
Expected term (in years)
(c)
|
5.88
|
|
7.45
|
|
||||
|
(a)
|
Based on the U.S. Treasury yield curve in effect at the time of grant or modification for the expected term of the award. The range of risk-free interest rates used for SARs converted at Distribution in fiscal 2017 was
1.1%
to
1.9%
.
|
|
(b)
|
Due to the lack of historical data for Valvoline, expected volatility is based on the average of peer companies’ historical daily equity volatilities with look-back periods commensurate with the expected term. The range of expected volatility used for SARs converted at Distribution in fiscal 2017 was
21.5%
to
24.4%
.
|
|
(c)
|
Due to the lack of historical data for Valvoline, the expected term is based on the mid-point between the vesting date and the end of the contractual term.
|
Nonvested stock awards
Nonvested stock awards in the form of Restricted Stock Awards (“RSAs”) and Restricted Stock Units (“RSUs”) were granted to certain Valvoline employees and directors. These awards were granted at a price equal to the fair market value of the underlying common stock on the grant date, generally vest over a
one
to
three
-year period, and are subject to forfeiture upon termination of service before the vesting period ends. These awards were primarily granted as RSUs that settle in shares upon vesting, while RSAs result in share issuance at grant, which entitle award holders to voting rights that are restricted until vesting. Dividends on nonvested stock awards granted are in the form of additional units or shares of nonvested stock awards, which are subject to vesting and forfeiture provisions.
The following table summarizes nonvested share activity for the year ended September 30,
2018
:
|
Number of shares
(in thousands)
|
Weighted average grant date fair value per share
|
||||||
|
Unvested shares as of September 30, 2017
|
1,275
|
|
$
|
22.71
|
|
||
|
Granted
|
359
|
|
$
|
23.17
|
|
||
|
Vested
|
(254
|
)
|
$
|
22.73
|
|
||
|
Forfeited
|
(102
|
)
|
$
|
22.66
|
|
||
|
Unvested shares as of September 30, 2018
|
1,278
|
|
$
|
23.07
|
|
||
88
The total grant date fair value of shares vested was
$6 million
and less than
$1 million
for the years ended September 30, 2018 and 2017, respectively.
The weighted average grant date fair value per share for new and modified nonvested stock awards in fiscal 2017 was
$22.82
.
As of September 30,
2018
, there wa
s
$9 million
of total unrecognized compensation costs related to nonvested stock awards, which is expected to be recognized over a weighted average period of
2.6
years. The aggregate intrinsic value of nonvested stock awards as of September 30,
2018
is
$27 million
.
Performance awards
Performance shares/units were awarded to certain key Valvoline employees that are tied to overall financial performance relative to the financial performance of selected industry peer groups and/or internal targets. Awards are granted annually, with each award typically covering a
three
-year performance and vesting period. Each performance share/unit is convertible to one share of common stock, and the actual number of shares issuable upon vesting is determined based upon actual performance compared to market and financial performance targets. Nonvested performance shares/units generally do not entitle employees to vote or to receive any dividends thereon.
The following table summarizes performance award activity for the year ended September 30,
2018
:
|
Number of shares
(in thousands)
|
Weighted average grant date fair value per share
|
||||||
|
Unvested shares as of September 30, 2017
|
182
|
|
$
|
23.20
|
|
||
|
Granted
|
164
|
|
$
|
23.82
|
|
||
|
Forfeited
|
(19
|
)
|
$
|
17.93
|
|
||
|
Unvested shares as of September 30, 2018
|
327
|
|
$
|
22.64
|
|
||
As of September 30,
2018
, there was
$1 million
of unrecognized compensation costs related to nonvested performance share awards, which is expected to be recognized over a weighted average period of approximately
1.8
years. The aggregate intrinsic value of the nonvested stock awards as of September 30,
2018
is
$7 million
. The weighted average grant date fair value per share for performance shares/units awards modified in fiscal 2017 was
$18.44
.
With regard to the performance conditions, the fair value of new or modified awards is equal to the grant date fair market value of Valvoline’s common stock, and compensation cost is recognized over the requisite service period when it is probable that the performance condition will be satisfied. For market conditions, compensation cost is recognized regardless of whether the conditions are satisfied and based on the grant date fair value of new or modified awards using a Monte Carlo simulation valuation model using the following key assumptions:
|
2018
|
2017
|
|||||
|
Assumptions (weighted average)
|
||||||
|
Risk-free interest rates
(a)
|
1.7
|
%
|
1.2
|
%
|
||
|
Expected dividend yield
|
1.0
|
%
|
1.0
|
%
|
||
|
Expected volatility
(b)
|
24.2
|
%
|
21.0
|
%
|
||
|
Expected term (in years)
|
3.0
|
|
1.9
|
|
||
|
(a)
|
Based on the U.S. Treasury yield curve in effect at the time of grant or modification for the expected term of the award. The range of risk-free interest rates used for performance awards was
1.6%
to
1.8%
in fiscal 2018 and
0.9%
to
1.5%
in fiscal 2017 for awards converted at Distribution.
|
|
(b)
|
Due to the lack of historical data for Valvoline, expected volatility is based on the average of peer companies’ historical volatilities with look-back periods commensurate with the expected term. The range of expected volatility used for performance awards converted at Distribution in fiscal 2017 was
18.9%
to
22.4%
.
|
89
The following is the summary of basic and diluted EPS for the years ended September 30:
|
(In millions except per share data)
|
2018
|
2017
|
2016
|
|||||||||
|
Numerator
|
||||||||||||
|
Net income
|
$
|
166
|
|
$
|
304
|
|
$
|
273
|
|
|||
|
Denominator
|
||||||||||||
|
Weighted average shares common shares outstanding
(a)
|
197
|
|
204
|
|
170
|
|
||||||
|
Effect of potentially dilutive securities
(b)
|
—
|
|
—
|
|
—
|
|
||||||
|
Weighted average diluted shares outstanding
|
197
|
|
204
|
|
170
|
|
||||||
|
|
||||||||||||
|
Earnings per share
|
||||||||||||
|
Basic
|
$
|
0.84
|
|
$
|
1.49
|
|
$
|
1.60
|
|
|||
|
Diluted
|
$
|
0.84
|
|
$
|
1.49
|
|
$
|
1.60
|
|
|||
|
(a)
|
The weighted average common shares outstanding for the year ended September 30, 2016 is based on the
170 million
shares issued to Ashland in the Contribution.
|
|
(b)
|
During the year ended September 30, 2017, share-based awards that were previously denominated in Ashland common stock were converted to Valvoline common stock at the Distribution. As presented in the table, there was not a significant dilutive impact in the years ended September 30, 2018 and 2017 from potential common shares.
|
Stockholder dividends
Since the first fiscal quarter of 2017, the Company has issued a quarterly cash dividend. The Company’s dividend activity was as follows during the years ended September 30:
|
(In millions except per share amounts)
|
2018
|
2017
|
2016
|
|||||||||
|
Cash outlay
|
$
|
58
|
|
$
|
40
|
|
$
|
—
|
|
|||
|
Dividend per share
|
$
|
0.298
|
|
$
|
0.196
|
|
$
|
—
|
|
|||
Share repurchases
During fiscal 2017, Valvoline’s Board of Directors authorized the repurchase of
$150 million
of the Company’s common stock for which the shares were repurchased during fiscal 2017 and 2018. In January 2018, the Board authorized the repurchase of up to
$300 million
of the Company’s common stock through September 30, 2020. As of September 30,
2018
, the remaining amount available for repurchase was
$75 million
. Upon repurchase, shares were retired and recorded as a reduction in
Common stock
for par value with the price paid in excess of par value recorded as an increase in
Retained deficit
. The following table summarizes the Company’s share repurchase activity during the years ended September 30:
|
(In millions)
|
2018
|
2017
|
2016
|
|||||||||
|
Total cost
|
$
|
325
|
|
$
|
50
|
|
$
|
—
|
|
|||
|
Shares repurchased
|
15
|
|
2
|
|
—
|
|
||||||
90
Accumulated other comprehensive income
Changes in accumulated other comprehensive income by component for the years ended September 30, 2017 and 2018 were as follows:
|
(In millions)
|
Unamortized benefit plan credits
|
Currency translation adjustments
|
Total
|
|||||||||
|
Balance as of September 30, 2016
|
$
|
52
|
|
$
|
(55
|
)
|
$
|
(3
|
)
|
|||
|
Fiscal 2017 activity, net of tax
|
(8
|
)
|
54
|
|
46
|
|
||||||
|
Balance as of September 30, 2017
|
44
|
|
(1
|
)
|
43
|
|
||||||
|
Fiscal 2018 activity, net of tax
|
(1
|
)
|
(10
|
)
|
(11
|
)
|
||||||
|
Balance as of September 30, 2018
|
$
|
43
|
|
$
|
(11
|
)
|
$
|
32
|
|
|||
Amounts reclassified from accumulated other comprehensive income for the years ended September 30 were as follows:
|
(in millions)
|
2018
|
2017
|
||||||
|
Amortization of pension and other postretirement plan prior service credit
(a)
|
$
|
(12
|
)
|
$
|
(12
|
)
|
||
|
Loss on liquidation of subsidiary
(b)
|
1
|
|
—
|
|
||||
|
Tax effect of reclassifications
|
2
|
|
4
|
|
||||
|
Net of tax
|
(9
|
)
|
(8
|
)
|
||||
|
Reclassification of income tax effects of U.S. tax reform
(c)
|
8
|
|
—
|
|
||||
|
Total amounts reclassified, net of tax
|
$
|
(1
|
)
|
$
|
(8
|
)
|
||
|
(a)
|
Amortization of unrecognized prior service credits included in net periodic benefit income for pension and other postretirement plans was reported in
Net pension and other postretirement plan income
within the Consolidated Statements of Comprehensive Income.
|
|
(b)
|
Represents the realization of cumulative translation adjustments in
Equity and other income, net
within the Consolidated Statements of Comprehensive Income as a result of the liquidation of the Company’s Brazilian subsidiary.
|
|
(c)
|
Represents the reclassification of stranded income tax effects of U.S. tax reform to
Retained deficit
in the Consolidated Balance Sheet.
|
The Company generally releases the income tax effects from accumulated other comprehensive income as benefit plan credits are amortized into earnings.
Separation from Ashland
On May 12, 2017, Ashland completed the Distribution of all
170 million
shares of Valvoline common stock as a pro rata dividend on shares of Ashland common stock outstanding at the close of business on the record date of May 5, 2017. Based on the shares of Ashland common stock outstanding on the record date, each share of Ashland common stock received
2.745338
shares of Valvoline common stock in the Distribution. Concurrent with the Distribution,
Ashland’s net investment
in Valvoline was reduced to zero with a corresponding adjustment to
Paid-in capital
and
Retained deficit
. Refer to Note 1 for additional information regarding the separation from Ashland.
Ashland Transactions
Separation from Ashland
Immediately prior to the Distribution, Ashland owned
170 million
shares of Valvoline common stock, which represented approximately
83%
of the outstanding shares of Valvoline common stock. Effective upon the Distribution, Ashland no longer held any shares of Valvoline common stock. Refer to Note 1 for further information on the separation from Ashland. Also refer to Note 15 for information regarding the conversion of share-based awards from Ashland to Valvoline at Distribution.
Related party payables
Valvoline had total net obligations due to Ashland of
$79 million
and
$74 million
as of September 30,
2018
and 2017, respectively, which were primarily recorded in
Other noncurrent liabilities
in the Consolidated Balance Sheets. These liabilities generally relate to net obligations due to Ashland under the Tax Matters Agreement as well as reimbursements payable to Ashland for certain other
91
contractual obligations, including those that are intended to transfer to Valvoline as part of the Distribution and those related to transition services. Refer to Note 12 for additional details regarding the Tax Matters Agreement and related obligations.
Transition Services Agreements
Valvoline also entered into a Transition Services Agreement (“TSA”) and Reverse Transition Services Agreement (“RTSA”) as well as certain other arrangements in connection with the separation from Ashland, which provide for certain continued corporate support services provided by Valvoline and Ashland to one another following the IPO. In connection with the IPO, Valvoline began to set up its own corporate functions, and pursuant to the TSA, Ashland provided various corporate support services for Valvoline, including certain accounting, human resources, information technology, office and building, risk, security, tax and treasury services. Pursuant to the RTSA, Valvoline provided Ashland with various corporate support services, including certain human resources, information technology, office and building, security and tax services, as well as certain regulatory compliance services required during the period in which Valvoline remained a majority-owned subsidiary of Ashland. In general, these agreements began following the completion of the IPO and cover a period not expected to exceed
24 months
. The charges associated with these services were not material during the years ended September 30, 2018, 2017 and 2016, and the costs are consistent with expenses that Ashland had historically allocated or Valvoline incurred with respect to such services, plus a mark-up of
five
percent.
Corporate allocations
Prior to the completion of the IPO in fiscal 2016, Valvoline utilized centralized functions of Ashland to support its operations, and in return, Ashland allocated certain of its expenses to Valvoline. Such expenses represent costs related, but not limited to, treasury, legal, accounting, insurance, information technology, payroll administration, human resources, incentive plans and other services. These costs, together with an allocation of Ashland overhead costs, were
$79 million
for the year ended September 30, 2016 and were included within
Selling, general and administrative expenses
in the Consolidated Statements of Comprehensive Income. Where it was possible to specifically attribute such expenses to activities of Valvoline, amounts were charged or credited directly to Valvoline without allocation or apportionment. Allocation of all other such expenses was based on a reasonable reflection of the utilization of service provided or benefits received by Valvoline during the periods presented on a consistent basis, such as headcount, square footage, tangible assets or sales. Valvoline’s management considers the methods used in allocating expenses to be reasonable estimates. Upon completion of the IPO, Valvoline assumed responsibility for the costs of these functions as noted above.
The following table summarizes the centralized and administrative support costs that were allocated to Valvoline from Ashland for the year ended September 30, 2016:
|
(In millions)
|
|||
|
Information technology
|
$
|
20
|
|
|
Financial and accounting
|
12
|
|
|
|
Building services
|
11
|
|
|
|
Legal and environmental
|
6
|
|
|
|
Human resources
|
5
|
|
|
|
Shared services
|
2
|
|
|
|
Stock-based compensation
|
11
|
|
|
|
Other general and administrative
|
12
|
|
|
|
Total
|
$
|
79
|
|
Cash management and treasury
For periods prior to the IPO in fiscal 2016, Valvoline participated in Ashland’s centralized treasury and cash management processes. Accordingly, the cash and cash equivalents were held by Ashland at the corporate level and were not attributed to Valvoline. Transactions in periods prior to the IPO were considered to be effectively settled for cash at the time the transactions were recorded. These transactions and net cash transfers to and from Ashland’s centralized cash management system are reflected as a component of Ashland’s net investment on the Consolidated Statement of Stockholders’ Deficit and as a financing activity within the accompanying Consolidated Statements of Cash Flows. In the Consolidated Statement of Stockholders’ Deficit, Ashland’s net investment represents the cumulative net investment by Ashland in Valvoline through the IPO, including net cash transfers to and from Ashland through the Distribution.
92
All significant transactions between Valvoline and Ashland have been included in the consolidated financial statements. In the periods preceding the IPO and Distribution, Valvoline also participated in certain of Ashland’s treasury activities related to accounts receivable factoring. Refer to Note 6 for additional information.
Valvoline manages and reports within the following
three
segments:
|
•
|
Core North America
- sells engine and automotive maintenance products in the United States and Canada to retailers, installers and heavy-duty customers to service vehicles and equipment.
|
|
•
|
Quick Lubes
- services the passenger car and light truck quick lube market in the United States and Canada through company-owned and independent franchised retail quick lube service center stores, as well as Express Care stores where independent operators service vehicles with Valvoline products.
|
|
•
|
International
- sells engine and automotive maintenance products in approximately
140
countries outside of the United States and Canada for the maintenance of consumer and commercial vehicles and equipment.
|
These segments represent components of the Company for which separate financial information is available that is utilized on a regular basis by the chief operating decision maker in assessing segment performance and in allocating the Company’s resources. Sales and operating income are the primary U.S. GAAP measures evaluated in assessing each reportable segment’s financial performance. Intersegment sales are not material, and assets are not allocated and included in the assessment of segment performance; consequently, these items are not disclosed by segment herein.
To maintain operating focus on business performance, certain corporate and non-operational items, including adjustments related to legacy businesses that no longer are attributed to Valvoline, are excluded from the segment operating results utilized by the chief operating decision maker in evaluating segment performance and are separately delineated within Unallocated and other to reconcile to total reported
Operating income
as shown in the table below.
Valvoline did not have a single customer that represented 10% of consolidated net sales in fiscal
2016
,
2017
or
2018
.
93
Reportable segment results
The following table presents sales, operating income, and depreciation and amortization by reportable segment for the years ended September 30:
|
(In millions)
|
2018
|
2017
|
2016
|
|||||||||
|
Sales
|
||||||||||||
|
Core North America
|
$
|
1,035
|
|
$
|
1,004
|
|
$
|
979
|
|
|||
|
Quick Lubes
|
660
|
|
541
|
|
457
|
|
||||||
|
International
|
590
|
|
539
|
|
493
|
|
||||||
|
Consolidated sales
|
$
|
2,285
|
|
$
|
2,084
|
|
$
|
1,929
|
|
|||
|
Operating income
|
||||||||||||
|
Core North America
|
$
|
172
|
|
$
|
199
|
|
$
|
212
|
|
|||
|
Quick Lubes
|
153
|
|
130
|
|
117
|
|
||||||
|
International
(a)
|
84
|
|
76
|
|
74
|
|
||||||
|
Total operating segments
|
409
|
|
405
|
|
403
|
|
||||||
|
Unallocated and other
(b)
|
(14
|
)
|
(11
|
)
|
(7
|
)
|
||||||
|
Consolidated operating income
|
$
|
395
|
|
$
|
394
|
|
$
|
396
|
|
|||
|
Depreciation and amortization
|
||||||||||||
|
Core North America
|
$
|
18
|
|
$
|
15
|
|
$
|
16
|
|
|||
|
Quick Lubes
|
30
|
|
22
|
|
17
|
|
||||||
|
International
|
6
|
|
5
|
|
5
|
|
||||||
|
Consolidated depreciation and amortization
|
$
|
54
|
|
$
|
42
|
|
$
|
38
|
|
|||
|
(a)
|
Equity income is included in operating income and is recognized within the International reportable segment. Equity income was
$14 million
,
$12 million
and
$12 million
in fiscal 2018, 2017 and 2016, respectively. Refer to Note 5 for additional details regarding the Company’s equity method investments.
|
|
(b)
|
Unallocated and other includes
Legacy and separation-related expenses, net
.
|
The following table summarizes sales by category for each reportable segment for the years ended September 30:
|
Sales by category
|
|||||||||||||||||||||
|
Core North America
|
Quick Lubes
|
International
|
|||||||||||||||||||
|
2018
|
2017
|
2016
|
2018
|
2017
|
2016
|
2018
|
2017
|
2016
|
|||||||||||||
|
Lubricants
|
85
|
%
|
86
|
%
|
87
|
%
|
85
|
%
|
84
|
%
|
83
|
%
|
89
|
%
|
89
|
%
|
89
|
%
|
|||
|
Antifreeze
|
8
|
%
|
7
|
%
|
7
|
%
|
1
|
%
|
1
|
%
|
1
|
%
|
5
|
%
|
6
|
%
|
3
|
%
|
|||
|
Filters
|
3
|
%
|
3
|
%
|
2
|
%
|
8
|
%
|
8
|
%
|
8
|
%
|
3
|
%
|
1
|
%
|
1
|
%
|
|||
|
Chemicals and other
|
4
|
%
|
4
|
%
|
4
|
%
|
2
|
%
|
2
|
%
|
2
|
%
|
3
|
%
|
4
|
%
|
7
|
%
|
|||
|
Franchise
|
—
|
|
—
|
|
—
|
|
4
|
%
|
5
|
%
|
6
|
%
|
—
|
|
—
|
|
—
|
|
|||
|
Total
|
100
|
%
|
100
|
%
|
100
|
%
|
100
|
%
|
100
|
%
|
100
|
%
|
100
|
%
|
100
|
%
|
100
|
%
|
|||
94
Entity-wide disclosures
Sales and net property, plant and equipment are attributed to the geographic area or country to which product is delivered and the assets physically reside, respectively. The following table presents sales and net property, plant and equipment by geographic area for Valvoline for the years ended September 30:
|
Sales from external customers
|
Property, plant and equipment, net
|
|||||||||||||||||||
|
(In millions)
|
2018
|
2017
|
2016
|
2018
|
2017
|
|||||||||||||||
|
United States
|
$
|
1,652
|
|
$
|
1,504
|
|
$
|
1,397
|
|
$
|
384
|
|
$
|
352
|
|
|||||
|
International
|
633
|
|
580
|
|
532
|
|
36
|
|
39
|
|
||||||||||
|
Total
|
$
|
2,285
|
|
$
|
2,084
|
|
$
|
1,929
|
|
$
|
420
|
|
$
|
391
|
|
|||||
Sales by geography expressed as a percentage of total consolidated sales were as follows:
|
For the years ended September 30
|
|||||||||
|
Sales by geography
|
2018
|
2017
|
2016
|
||||||
|
North America
(a)
|
74
|
%
|
74
|
%
|
75
|
%
|
|||
|
EMEA (Europe, Middle East and Africa)
|
8
|
%
|
7
|
%
|
7
|
%
|
|||
|
Asia Pacific
|
13
|
%
|
14
|
%
|
14
|
%
|
|||
|
Latin America
|
5
|
%
|
5
|
%
|
4
|
%
|
|||
|
Total
|
100
|
%
|
100
|
%
|
100
|
%
|
|||
|
(a)
|
Valvoline includes the United States and Canada in its North American region.
|
The following table presents quarterly financial information and per share data:
|
First Quarter
|
Second Quarter
|
Third Quarter
|
Fourth Quarter
|
|||||||||||||||||||||||||||||||||||||
|
(In millions except per share amounts)
|
2018
|
2017
|
2018
|
2017
|
2018
|
2017
|
2018
|
2017
|
||||||||||||||||||||||||||||||||
|
Sales
|
$
|
545
|
$
|
489
|
$
|
569
|
$
|
514
|
$
|
577
|
$
|
534
|
$
|
594
|
$
|
547
|
||||||||||||||||||||||||
|
Gross profit
|
$
|
195
|
$
|
185
|
$
|
207
|
$
|
198
|
$
|
201
|
$
|
197
|
$
|
203
|
$
|
196
|
||||||||||||||||||||||||
|
Operating income
(a)
|
$
|
88
|
$
|
94
|
$
|
100
|
$
|
100
|
$
|
102
|
$
|
87
|
$
|
105
|
$
|
113
|
||||||||||||||||||||||||
|
Income before income taxes
(a) (b)
|
$
|
84
|
$
|
110
|
$
|
94
|
$
|
109
|
$
|
97
|
$
|
94
|
$
|
57
|
$
|
177
|
||||||||||||||||||||||||
|
Net (loss) income
(c)
|
$
|
(10
|
)
|
$
|
72
|
$
|
67
|
$
|
71
|
$
|
64
|
$
|
56
|
$
|
45
|
$
|
105
|
|||||||||||||||||||||||
|
Net (loss) income per common share
(d)
|
||||||||||||||||||||||||||||||||||||||||
|
Basic
|
$
|
(0.05
|
)
|
$
|
0.35
|
$
|
0.33
|
$
|
0.35
|
$
|
0.33
|
$
|
0.27
|
$
|
0.23
|
$
|
0.52
|
|||||||||||||||||||||||
|
Diluted
|
$
|
(0.05
|
)
|
$
|
0.35
|
$
|
0.33
|
$
|
0.35
|
$
|
0.33
|
$
|
0.27
|
$
|
0.23
|
$
|
0.52
|
|||||||||||||||||||||||
|
(a)
|
Operating and pre-tax income included
Legacy and separation-related expenses, net
of
$6 million
in the first fiscal quarter of 2017,
$6 million
in the second fiscal quarter of 2017,
$13 million
in the third fiscal quarter of 2017,
$14 million
of income in the fourth fiscal quarter of 2017,
$9 million
in the first fiscal quarter of 2018,
$8 million
in the second fiscal quarter of 2018, and
$3 million
of income in the third fiscal quarter of 2018.
|
|
(b)
|
Pre-tax income included pension and other postretirement benefit plan remeasurement gains of
$8 million
and
$60 million
in the first quarter of fiscal 2017 and the fourth quarter of fiscal 2017, respectively. Pre-tax income in the fourth quarter of fiscal 2018 includes pre-tax pension other postretirement plan remeasurement losses of
$38 million
.
|
|
(c)
|
Net (loss) income for fiscal 2018 includes additional income tax expense related to U.S. and Kentucky tax reform enacted during the year of
$71 million
in the first quarter of fiscal 2018,
$2 million
in the second fiscal quarter of 2018,
$3 million
in the third fiscal quarter of 2018, and
$2 million
in the fourth fiscal quarter of 2018.
|
|
(d)
|
Net (loss) income per share in each quarter is computed using the weighted average number of shares outstanding during that quarter while net income per share for the full year is computed using the weighted average number of shares outstanding during the year. Thus, the sum of the four quarters’ net (loss) income per share will not necessarily equal the full-year net income per share.
|
95
The Senior Notes are general unsecured senior obligations of Valvoline Inc. and are fully and unconditionally guaranteed on a senior unsecured basis, jointly and severally, by the combined “Guarantor Subsidiaries.” Other subsidiaries (the “Non-Guarantor Subsidiaries”) largely represent the international operations of the Company, which do not guarantee the Senior Notes. Under the terms of the indentures, Valvoline Inc. and the Guarantor Subsidiaries each fully and unconditionally, jointly and severally, guarantee the payment of interest, principal and premium, if any, on each of the notes included in the Senior Notes. Refer to Note 10 for additional information.
The Guarantor Subsidiaries are subject to release in certain circumstances, including (i) the sale of all of the capital stock of the subsidiary, (ii) the designation of the subsidiary as an “Unrestricted Subsidiary” under the indenture governing the Senior Notes; or (iii) the release of the subsidiary as a guarantor from the Company’s 2016 Senior Credit Agreement described further in Note 10.
In connection with the registered exchange offers for the Senior Notes completed in December 2017, the Company is required to comply with Rule 3-10 of SEC Regulation S-X (“Rule 3-10”), and has therefore included the accompanying condensed consolidating financial statements in accordance with Rule 3-10(f) of SEC Regulation S-X.
The following tables should be read in conjunction with the consolidated financial statements herein and present, on a consolidating basis, the condensed statements of comprehensive income; condensed balance sheets; and condensed statements of cash flows for the parent issuer of these Senior Notes, the Guarantor Subsidiaries on a combined basis, the Non-Guarantor Subsidiaries on a combined basis and the eliminations necessary to arrive at the Company’s consolidated results. The principal elimination entries relate to investments in subsidiaries and intercompany balances and transactions. The Company has accounted for its investments in its subsidiaries under the equity method.
In connection with the restructuring steps that occurred immediately prior to Valvoline's IPO as described in Note 1, certain subsidiaries were created and contributed to Valvoline which formed a new organizational structure to affect the separation from Ashland, which was completed in May 2017. Activity for the parent issuer, Guarantor Subsidiaries and Non-Guarantor Subsidiaries has been presented herein to reflect the guarantee structure in place at September 30, 2018 for all periods presented based upon the historical activity that occurred within Valvoline's legal structure that existed in each respective period presented.
|
Condensed Consolidating Statements of Comprehensive Income
|
||||||||||||||||||||
|
For the year ended September 30, 2018
|
||||||||||||||||||||
|
(In millions)
|
Valvoline Inc.
(Parent Issuer) |
Guarantor Subsidiaries
|
Non-Guarantor Subsidiaries
|
Eliminations
|
Consolidated
|
|||||||||||||||
|
Sales
|
$
|
—
|
|
$
|
1,782
|
|
$
|
558
|
|
$
|
(55
|
)
|
$
|
2,285
|
|
|||||
|
Cost of sales
|
—
|
|
1,132
|
|
402
|
|
(55
|
)
|
1,479
|
|
||||||||||
|
Gross profit
|
—
|
|
650
|
|
156
|
|
—
|
|
806
|
|
||||||||||
|
Selling, general and administrative expenses
|
11
|
|
327
|
|
92
|
|
—
|
|
430
|
|
||||||||||
|
Legacy and separation-related expenses, net
|
8
|
|
6
|
|
—
|
|
—
|
|
14
|
|
||||||||||
|
Equity and other (income) expenses, net
|
—
|
|
(50
|
)
|
17
|
|
—
|
|
(33
|
)
|
||||||||||
|
Operating (loss) income
|
(19
|
)
|
367
|
|
47
|
|
—
|
|
395
|
|
||||||||||
|
Net pension and other postretirement plan expense (income)
|
—
|
|
1
|
|
(1
|
)
|
—
|
|
—
|
|
||||||||||
|
Net interest and other financing expenses
|
53
|
|
6
|
|
4
|
|
—
|
|
63
|
|
||||||||||
|
(Loss) income before income taxes
|
(72
|
)
|
360
|
|
44
|
|
—
|
|
332
|
|
||||||||||
|
Income tax expense
|
14
|
|
140
|
|
12
|
|
—
|
|
166
|
|
||||||||||
|
Equity in net income of subsidiaries
|
(252
|
)
|
(32
|
)
|
—
|
|
284
|
|
—
|
|
||||||||||
|
Net income
|
$
|
166
|
|
$
|
252
|
|
$
|
32
|
|
$
|
(284
|
)
|
$
|
166
|
|
|||||
|
Total comprehensive income
|
$
|
147
|
|
$
|
234
|
|
$
|
25
|
|
$
|
(259
|
)
|
$
|
147
|
|
|||||
96
|
Condensed Consolidating Statements of Comprehensive Income
|
||||||||||||||||||||
|
For the year ended September 30, 2017
|
||||||||||||||||||||
|
(In millions)
|
Valvoline Inc.
(Parent Issuer) |
Guarantor Subsidiaries
|
Non-Guarantor Subsidiaries
|
Eliminations
|
Consolidated
|
|||||||||||||||
|
Sales
|
$
|
—
|
|
$
|
1,618
|
|
$
|
523
|
|
$
|
(57
|
)
|
$
|
2,084
|
|
|||||
|
Cost of sales
|
—
|
|
986
|
|
379
|
|
(57
|
)
|
1,308
|
|
||||||||||
|
Gross profit
|
—
|
|
632
|
|
144
|
|
—
|
|
776
|
|
||||||||||
|
Selling, general and administrative expenses
|
9
|
|
296
|
|
91
|
|
—
|
|
396
|
|
||||||||||
|
Legacy and separation-related expenses, net
|
(15
|
)
|
26
|
|
—
|
|
—
|
|
11
|
|
||||||||||
|
Equity and other (income) expenses, net
|
—
|
|
(37
|
)
|
12
|
|
—
|
|
(25
|
)
|
||||||||||
|
Operating income
|
6
|
|
347
|
|
41
|
|
—
|
|
394
|
|
||||||||||
|
Net pension and other postretirement plan income
|
—
|
|
(134
|
)
|
(4
|
)
|
—
|
|
(138
|
)
|
||||||||||
|
Net interest and other financing expenses
|
36
|
|
4
|
|
2
|
|
—
|
|
42
|
|
||||||||||
|
(Loss) income before income taxes
|
(30
|
)
|
477
|
|
43
|
|
—
|
|
490
|
|
||||||||||
|
Income tax (benefit) expense
|
(3
|
)
|
178
|
|
11
|
|
—
|
|
186
|
|
||||||||||
|
Equity in net income of subsidiaries
|
(331
|
)
|
(32
|
)
|
—
|
|
363
|
|
—
|
|
||||||||||
|
Net income
|
$
|
304
|
|
$
|
331
|
|
$
|
32
|
|
$
|
(363
|
)
|
$
|
304
|
|
|||||
|
Total comprehensive income
|
$
|
303
|
|
$
|
330
|
|
$
|
43
|
|
$
|
(373
|
)
|
$
|
303
|
|
|||||
97
|
Condensed Consolidating Statements of Comprehensive Income
|
||||||||||||||||||||
|
For the year ended September 30, 2016
|
||||||||||||||||||||
|
(In millions)
|
Valvoline Inc.
(Parent Issuer) |
Guarantor Subsidiaries
|
Non-Guarantor Subsidiaries
|
Eliminations
|
Consolidated
|
|||||||||||||||
|
Sales
|
$
|
—
|
|
$
|
1,500
|
|
$
|
476
|
|
$
|
(47
|
)
|
$
|
1,929
|
|
|||||
|
Cost of sales
|
—
|
|
895
|
|
333
|
|
(47
|
)
|
1,181
|
|
||||||||||
|
Gross profit
|
—
|
|
605
|
|
143
|
|
—
|
|
748
|
|
||||||||||
|
Selling, general and administrative expenses
|
—
|
|
285
|
|
80
|
|
—
|
|
365
|
|
||||||||||
|
Legacy and separation-related expenses, net
|
—
|
|
6
|
|
—
|
|
—
|
|
6
|
|
||||||||||
|
Equity and other (income) expenses, net
|
—
|
|
(21
|
)
|
2
|
|
—
|
|
(19
|
)
|
||||||||||
|
Operating income
|
—
|
|
335
|
|
61
|
|
—
|
|
396
|
|
||||||||||
|
Net pension and other postretirement plan (income) expense
|
—
|
|
(43
|
)
|
8
|
|
—
|
|
(35
|
)
|
||||||||||
|
Net interest and other financing expenses
|
9
|
|
—
|
|
—
|
|
—
|
|
9
|
|
||||||||||
|
Net loss on acquisition
|
—
|
|
1
|
|
—
|
|
—
|
|
1
|
|
||||||||||
|
(Loss) income before income taxes
|
(9
|
)
|
377
|
|
53
|
|
—
|
|
421
|
|
||||||||||
|
Income tax (benefit) expense
|
(4
|
)
|
143
|
|
9
|
|
—
|
|
148
|
|
||||||||||
|
Equity in net income of subsidiaries
|
(278
|
)
|
(44
|
)
|
—
|
|
322
|
|
—
|
|
||||||||||
|
Net income
|
$
|
273
|
|
$
|
278
|
|
$
|
44
|
|
$
|
(322
|
)
|
$
|
273
|
|
|||||
|
Total comprehensive income
|
$
|
280
|
|
$
|
285
|
|
$
|
53
|
|
$
|
(338
|
)
|
$
|
280
|
|
|||||
98
|
Condensed Consolidating Balance Sheets
|
||||||||||||||||||||
|
As of September 30, 2018
|
||||||||||||||||||||
|
(In millions)
|
Valvoline Inc.
(Parent Issuer) |
Guarantor Subsidiaries
|
Non-Guarantor Subsidiaries
|
Eliminations
|
Consolidated
|
|||||||||||||||
|
Assets
|
||||||||||||||||||||
|
Current assets
|
||||||||||||||||||||
|
Cash and cash equivalents
|
$
|
—
|
|
$
|
20
|
|
$
|
76
|
|
$
|
—
|
|
$
|
96
|
|
|||||
|
Accounts receivable, net
|
—
|
|
48
|
|
480
|
|
(119
|
)
|
409
|
|
||||||||||
|
Inventories, net
|
—
|
|
95
|
|
81
|
|
—
|
|
176
|
|
||||||||||
|
Prepaid expenses and other current assets
|
1
|
|
38
|
|
5
|
|
—
|
|
44
|
|
||||||||||
|
Total current assets
|
1
|
|
201
|
|
642
|
|
(119
|
)
|
725
|
|
||||||||||
|
Noncurrent assets
|
||||||||||||||||||||
|
Property, plant and equipment, net
|
—
|
|
384
|
|
36
|
|
—
|
|
420
|
|
||||||||||
|
Goodwill and intangibles, net
|
—
|
|
396
|
|
52
|
|
—
|
|
448
|
|
||||||||||
|
Equity method investments
|
—
|
|
31
|
|
—
|
|
—
|
|
31
|
|
||||||||||
|
Investment in subsidiaries
|
801
|
|
509
|
|
—
|
|
(1,310
|
)
|
—
|
|
||||||||||
|
Deferred income taxes
|
62
|
|
63
|
|
13
|
|
—
|
|
138
|
|
||||||||||
|
Other noncurrent assets
|
2
|
|
85
|
|
5
|
|
—
|
|
92
|
|
||||||||||
|
Total noncurrent assets
|
865
|
|
1,468
|
|
106
|
|
(1,310
|
)
|
1,129
|
|
||||||||||
|
Total assets
|
$
|
866
|
|
$
|
1,669
|
|
$
|
748
|
|
$
|
(1,429
|
)
|
$
|
1,854
|
|
|||||
|
Liabilities and Stockholders’ Deficit
|
||||||||||||||||||||
|
Current liabilities
|
||||||||||||||||||||
|
Current portion of long-term debt
|
$
|
30
|
|
$
|
—
|
|
$
|
—
|
|
$
|
—
|
|
$
|
30
|
|
|||||
|
Trade and other payables
|
3
|
|
241
|
|
53
|
|
(119
|
)
|
178
|
|
||||||||||
|
Accrued expenses and other liabilities
|
7
|
|
168
|
|
28
|
|
—
|
|
203
|
|
||||||||||
|
Total current liabilities
|
40
|
|
409
|
|
81
|
|
(119
|
)
|
411
|
|
||||||||||
|
Noncurrent liabilities
|
||||||||||||||||||||
|
Long-term debt
|
1,151
|
|
1
|
|
140
|
|
—
|
|
1,292
|
|
||||||||||
|
Employee benefit obligations
|
—
|
|
317
|
|
16
|
|
—
|
|
333
|
|
||||||||||
|
Other noncurrent liabilities
|
33
|
|
141
|
|
2
|
|
—
|
|
176
|
|
||||||||||
|
Total noncurrent liabilities
|
1,184
|
|
459
|
|
158
|
|
—
|
|
1,801
|
|
||||||||||
|
Commitments and contingencies
|
|
|
|
|
|
|||||||||||||||
|
Stockholders’ (deficit) equity
|
(358
|
)
|
801
|
|
509
|
|
(1,310
|
)
|
(358
|
)
|
||||||||||
|
Total liabilities and stockholders’ deficit/equity
|
$
|
866
|
|
$
|
1,669
|
|
$
|
748
|
|
$
|
(1,429
|
)
|
$
|
1,854
|
|
|||||
99
|
Condensed Consolidating Balance Sheets
|
||||||||||||||||||||
|
As of September 30, 2017
|
||||||||||||||||||||
|
(In millions)
|
Valvoline Inc.
(Parent Issuer) |
Guarantor Subsidiaries
|
Non-Guarantor Subsidiaries
|
Eliminations
|
Consolidated
|
|||||||||||||||
|
Assets
|
||||||||||||||||||||
|
Current assets
|
||||||||||||||||||||
|
Cash and cash equivalents
|
$
|
—
|
|
$
|
99
|
|
$
|
102
|
|
$
|
—
|
|
$
|
201
|
|
|||||
|
Accounts receivable, net
|
—
|
|
57
|
|
389
|
|
(61
|
)
|
385
|
|
||||||||||
|
Inventories, net
|
—
|
|
94
|
|
81
|
|
—
|
|
175
|
|
||||||||||
|
Prepaid expenses and other current assets
|
—
|
|
25
|
|
4
|
|
—
|
|
29
|
|
||||||||||
|
Total current assets
|
—
|
|
275
|
|
576
|
|
(61
|
)
|
790
|
|
||||||||||
|
Noncurrent assets
|
||||||||||||||||||||
|
Property, plant and equipment, net
|
—
|
|
353
|
|
38
|
|
—
|
|
391
|
|
||||||||||
|
Goodwill and intangibles, net
|
—
|
|
333
|
|
2
|
|
—
|
|
335
|
|
||||||||||
|
Equity method investments
|
—
|
|
30
|
|
—
|
|
—
|
|
30
|
|
||||||||||
|
Investment in subsidiaries
|
606
|
|
447
|
|
—
|
|
(1,053
|
)
|
—
|
|
||||||||||
|
Deferred income taxes
|
145
|
|
122
|
|
14
|
|
—
|
|
281
|
|
||||||||||
|
Other noncurrent assets
|
314
|
|
80
|
|
6
|
|
(312
|
)
|
88
|
|
||||||||||
|
Total noncurrent assets
|
1,065
|
|
1,365
|
|
60
|
|
(1,365
|
)
|
1,125
|
|
||||||||||
|
Total assets
|
$
|
1,065
|
|
$
|
1,640
|
|
$
|
636
|
|
$
|
(1,426
|
)
|
$
|
1,915
|
|
|||||
|
Liabilities and Stockholders’ Deficit
|
||||||||||||||||||||
|
Current liabilities
|
||||||||||||||||||||
|
Short-term debt
|
$
|
—
|
|
$
|
—
|
|
$
|
75
|
|
$
|
—
|
|
$
|
75
|
|
|||||
|
Current portion of long-term debt
|
15
|
|
—
|
|
—
|
|
—
|
|
15
|
|
||||||||||
|
Trade and other payables
|
2
|
|
198
|
|
53
|
|
(61
|
)
|
192
|
|
||||||||||
|
Accrued expenses and other liabilities
|
103
|
|
60
|
|
33
|
|
—
|
|
196
|
|
||||||||||
|
Total current liabilities
|
120
|
|
258
|
|
161
|
|
(61
|
)
|
478
|
|
||||||||||
|
Noncurrent liabilities
|
||||||||||||||||||||
|
Long-term debt
|
1,032
|
|
2
|
|
—
|
|
—
|
|
1,034
|
|
||||||||||
|
Employee benefit obligations
|
—
|
|
321
|
|
21
|
|
—
|
|
342
|
|
||||||||||
|
Other noncurrent liabilities
|
30
|
|
453
|
|
7
|
|
(312
|
)
|
178
|
|
||||||||||
|
Total noncurrent liabilities
|
1,062
|
|
776
|
|
28
|
|
(312
|
)
|
1,554
|
|
||||||||||
|
Commitments and contingencies
|
|
|
|
|
|
|||||||||||||||
|
Stockholders’ (deficit) equity
|
(117
|
)
|
606
|
|
447
|
|
(1,053
|
)
|
(117
|
)
|
||||||||||
|
Total liabilities and stockholders’ deficit/equity
|
$
|
1,065
|
|
$
|
1,640
|
|
$
|
636
|
|
$
|
(1,426
|
)
|
$
|
1,915
|
|
|||||
100
|
Condensed Consolidating Statements of Cash Flows
|
||||||||||||||||||||
|
For the year ended September 30, 2018
|
||||||||||||||||||||
|
(In millions)
|
Valvoline Inc.
(Parent Issuer) |
Guarantor Subsidiaries
|
Non-Guarantor Subsidiaries
|
Eliminations
|
Consolidated
|
|||||||||||||||
|
Cash flows (used in) provided by operating activities
|
$
|
(57
|
)
|
$
|
390
|
|
$
|
(13
|
)
|
$
|
—
|
|
$
|
320
|
|
|||||
|
Cash flows from investing activities
|
||||||||||||||||||||
|
Additions to property, plant and equipment
|
—
|
|
(88
|
)
|
(5
|
)
|
—
|
|
(93
|
)
|
||||||||||
|
Acquisitions, net of cash required
|
—
|
|
(72
|
)
|
(53
|
)
|
—
|
|
(125
|
)
|
||||||||||
|
Other investing activities, net
|
—
|
|
5
|
|
—
|
|
—
|
|
5
|
|
||||||||||
|
Return of advance from subsidiary
|
312
|
|
—
|
|
—
|
|
(312
|
)
|
—
|
|
||||||||||
|
Cash flows provided by (used in) investing activities
|
312
|
|
(155
|
)
|
(58
|
)
|
(312
|
)
|
(213
|
)
|
||||||||||
|
Cash flows from financing activities
|
||||||||||||||||||||
|
Proceeds from borrowings, net of issuance costs
|
203
|
|
—
|
|
101
|
|
—
|
|
304
|
|
||||||||||
|
Repayments on borrowings
|
(72
|
)
|
—
|
|
(36
|
)
|
—
|
|
(108
|
)
|
||||||||||
|
Repurchases of common stock
|
(325
|
)
|
—
|
|
—
|
|
—
|
|
(325
|
)
|
||||||||||
|
Purchase of additional ownership in subsidiary
|
—
|
|
—
|
|
(15
|
)
|
—
|
|
(15
|
)
|
||||||||||
|
Cash dividends paid
|
(58
|
)
|
—
|
|
—
|
|
—
|
|
(58
|
)
|
||||||||||
|
Other financing activities
|
(3
|
)
|
(2
|
)
|
(2
|
)
|
—
|
|
(7
|
)
|
||||||||||
|
Other intercompany activity, net
|
—
|
|
(312
|
)
|
—
|
|
312
|
|
—
|
|
||||||||||
|
Cash flows (used in) provided by financing activities
|
(255
|
)
|
(314
|
)
|
48
|
|
312
|
|
(209
|
)
|
||||||||||
|
Effect of currency exchange rate changes on cash and cash equivalents
|
—
|
|
—
|
|
(3
|
)
|
—
|
|
(3
|
)
|
||||||||||
|
Decrease in cash and cash equivalents
|
—
|
|
(79
|
)
|
(26
|
)
|
—
|
|
(105
|
)
|
||||||||||
|
Cash and cash equivalents - beginning of year
|
—
|
|
99
|
|
102
|
|
—
|
|
201
|
|
||||||||||
|
Cash and cash equivalents - end of year
|
$
|
—
|
|
$
|
20
|
|
$
|
76
|
|
$
|
—
|
|
$
|
96
|
|
|||||
101
|
Condensed Consolidating Statements of Cash Flows
|
||||||||||||||||||||
|
For the year ended September 30, 2017
|
||||||||||||||||||||
|
(In millions)
|
Valvoline Inc.
(Parent Issuer) |
Guarantor Subsidiaries
|
Non-Guarantor Subsidiaries
|
Eliminations
|
Consolidated
|
|||||||||||||||
|
Cash flows provided by (used in) operating activities
|
$
|
97
|
|
$
|
(180
|
)
|
$
|
(47
|
)
|
$
|
—
|
|
$
|
(130
|
)
|
|||||
|
Cash flows from investing activities
|
||||||||||||||||||||
|
Additions to property, plant and equipment
|
—
|
|
(64
|
)
|
(4
|
)
|
—
|
|
(68
|
)
|
||||||||||
|
Acquisitions, net of cash required
|
—
|
|
(68
|
)
|
—
|
|
—
|
|
(68
|
)
|
||||||||||
|
Other investing activities, net
|
—
|
|
1
|
|
—
|
|
—
|
|
1
|
|
||||||||||
|
Advance to subsidiary
|
(312
|
)
|
—
|
|
—
|
|
312
|
|
—
|
|
||||||||||
|
Cash flows used in investing activities
|
(312
|
)
|
(131
|
)
|
(4
|
)
|
312
|
|
(135
|
)
|
||||||||||
|
Cash flows from financing activities
|
||||||||||||||||||||
|
Net transfers from Ashland
|
5
|
|
—
|
|
—
|
|
—
|
|
5
|
|
||||||||||
|
Proceeds from borrowings, net of issuance costs
|
395
|
|
—
|
|
75
|
|
—
|
|
470
|
|
||||||||||
|
Repayments on borrowings
|
(90
|
)
|
—
|
|
—
|
|
—
|
|
(90
|
)
|
||||||||||
|
Repurchases of common stock
|
(50
|
)
|
—
|
|
—
|
|
—
|
|
(50
|
)
|
||||||||||
|
Cash dividends paid
|
(40
|
)
|
—
|
|
—
|
|
—
|
|
(40
|
)
|
||||||||||
|
Other intercompany activity, net
|
(5
|
)
|
317
|
|
—
|
|
(312
|
)
|
—
|
|
||||||||||
|
Cash flows provided by financing activities
|
215
|
|
317
|
|
75
|
|
(312
|
)
|
295
|
|
||||||||||
|
Effect of currency exchange rate changes on cash and cash equivalents
|
—
|
|
—
|
|
(1
|
)
|
—
|
|
(1
|
)
|
||||||||||
|
Increase in cash and cash equivalents
|
—
|
|
6
|
|
23
|
|
—
|
|
29
|
|
||||||||||
|
Cash and cash equivalents - beginning of year
|
—
|
|
93
|
|
79
|
|
—
|
|
172
|
|
||||||||||
|
Cash and cash equivalents - end of year
|
$
|
—
|
|
$
|
99
|
|
$
|
102
|
|
$
|
—
|
|
$
|
201
|
|
|||||
102
|
Condensed Consolidating Statements of Cash Flows
|
||||||||||||||||||||
|
For the year ended September 30, 2016
|
||||||||||||||||||||
|
(In millions)
|
Valvoline Inc.
(Parent Issuer) |
Guarantor Subsidiaries
|
Non-Guarantor Subsidiaries
|
Eliminations
|
Consolidated
|
|||||||||||||||
|
Cash flows (used in) provided by operating activities
|
$
|
(35
|
)
|
$
|
307
|
|
$
|
39
|
|
$
|
—
|
|
$
|
311
|
|
|||||
|
Cash flows from investing activities
|
||||||||||||||||||||
|
Additions to property, plant and equipment
|
—
|
|
(60
|
)
|
(6
|
)
|
—
|
|
(66
|
)
|
||||||||||
|
Acquisitions, net of cash required
|
—
|
|
(83
|
)
|
—
|
|
—
|
|
(83
|
)
|
||||||||||
|
Other investing activities, net
|
—
|
|
1
|
|
—
|
|
—
|
|
1
|
|
||||||||||
|
Cash flows used in investing activities
|
—
|
|
(142
|
)
|
(6
|
)
|
—
|
|
(148
|
)
|
||||||||||
|
Cash flows from financing activities
|
|
|
|
|
|
|||||||||||||||
|
Net transfers to Ashland
|
(1,504
|
)
|
—
|
|
—
|
|
—
|
|
(1,504
|
)
|
||||||||||
|
Cash contributions from Ashland
|
60
|
|
—
|
|
—
|
|
—
|
|
60
|
|
||||||||||
|
Proceeds from initial public offering, net of offering costs
|
719
|
|
—
|
|
—
|
|
—
|
|
719
|
|
||||||||||
|
Proceeds from borrowings, net of issuance costs
|
1,372
|
|
—
|
|
—
|
|
—
|
|
1,372
|
|
||||||||||
|
Repayments on borrowings
|
(637
|
)
|
—
|
|
—
|
|
—
|
|
(637
|
)
|
||||||||||
|
Other intercompany activity, net
|
25
|
|
(72
|
)
|
47
|
|
—
|
|
—
|
|
||||||||||
|
Cash flows provided by (used in) financing activities
|
35
|
|
(72
|
)
|
47
|
|
—
|
|
10
|
|
||||||||||
|
Effect of currency exchange rate changes on cash and cash equivalents
|
—
|
|
—
|
|
(1
|
)
|
—
|
|
(1
|
)
|
||||||||||
|
Increase in cash and cash equivalents
|
—
|
|
93
|
|
79
|
|
—
|
|
172
|
|
||||||||||
|
Cash and cash equivalents - beginning of year
|
—
|
|
—
|
|
—
|
|
—
|
|
—
|
|
||||||||||
|
Cash and cash equivalents - end of year
|
$
|
—
|
|
$
|
93
|
|
$
|
79
|
|
$
|
—
|
|
$
|
172
|
|
|||||
Quick Lubes acquisitions
Valvoline acquired
35
service center stores for an aggregate purchase price of approximately
$30 million
from October 1 through November 19, 2018, which continues the expansion of the Company’s existing Quick Lubes network. These acquisitions included
31
franchise service center stores in Ontario, Canada acquired from Oil Changers Inc. and
four
former franchise service center stores acquired in single and multi-store transactions.
Dividend declared
On November 19, 2018, the Company’s Board of Directors approved a quarterly cash dividend of
$0.106
per share of common stock. The dividend is payable December 17, 2018 to shareholders of record on November 30, 2018.
103
None.
Evaluation of disclosure controls and procedures
Valvoline’s Chief Executive Officer (“CEO”) and Chief Financial Officer (“CFO”), with the assistance of management, has evaluated the effectiveness of the Company’s disclosure controls and procedures (as defined in Rules 13a-15(e) and 15d-15(e) under the Securities Exchange Act of 1934, as amended (“Exchange Act”)), as of the end of the period covered by this Annual Report on Form 10-K (the “Evaluation Date”), and based upon such evaluation, have concluded that as of the Evaluation Date, the Company’s disclosure controls and procedures were effective. These controls are designed to ensure that information required to be disclosed in the reports that are filed or submitted under the Exchange Act is recorded, processed, summarized, and reported within the time periods specified in the rules and forms of the Securities and Exchange Commission (“SEC”), and that such information is accumulated and communicated to Valvoline’s management, including the CEO and CFO, to allow timely decisions regarding required disclosure.
Management’s report on internal control over financial reporting
Management is responsible for establishing and maintaining adequate internal control over financial reporting (as defined in Rules 13a-15(f) and 15d-15(f) under the Exchange Act). Management assessed the effectiveness of the Company’s internal control over financial reporting as of September 30, 2018 based on the criteria set forth by the Committee of Sponsoring Organizations of the Treadway Commission (“COSO”) in the 2013 Internal Control - Integrated Framework. Based on this assessment, management concluded that the Company’s internal control over financial reporting was effective as of September 30, 2018 based on those criteria. The Company’s internal control over financial reporting is designed to provide reasonable assurance regarding the reliability of financial reporting and the preparation of financial statements for external purposes in accordance with U.S. GAAP. Valvoline’s independent registered public accounting firm, Ernst & Young LLP, has issued an audit report with respect to the effectiveness of the Company’s internal control over financial reporting as of September 30, 2018, which appears herein.
Changes in internal control
There were no changes in Valvoline’s internal control over financial reporting during the fourth fiscal quarter ended September 30, 2018 that materially affected, or are reasonably likely to materially affect, Valvoline’s internal control over financial reporting.
104
REPORT OF INDEPENDENT REGISTERED PUBLIC ACCOUNTING FIRM
To the Stockholders and Board of Directors of
Valvoline Inc. and Consolidated Subsidiaries
Opinion on Internal Control over Financial Reporting
We have audited Valvoline Inc. and Consolidated Subsidiaries’ internal control over financial reporting as of September 30, 2018, based on criteria established in Internal Control-Integrated Framework issued by the Committee of Sponsoring Organizations of the Treadway Commission (2013 framework) (the COSO criteria). In our opinion, Valvoline Inc. and Consolidated Subsidiaries (the Company) maintained, in all material respects, effective internal control over financial reporting as of September 30, 2018, based on the COSO criteria.
We also have audited, in accordance with the standards of the Public Company Accounting Oversight Board (United States) (PCAOB), the consolidated balance sheets of the Company as of September 30, 2018 and 2017, the related consolidated statements of comprehensive income, stockholders’ deficit and cash flows for each of the three years in the period ended September 30, 2018, and the related notes and financial statement schedule listed in the Index at Item 15(a) and our report dated November 21, 2018, expressed an unqualified opinion thereon.
Basis for Opinion
The Company’s management is responsible for maintaining effective internal control over financial reporting and for its assessment of the effectiveness of internal control over financial reporting included in the accompanying Management’s Report on Internal Control over Financial Reporting. Our responsibility is to express an opinion on the Company’s internal control over financial reporting based on our audit. We are a public accounting firm registered with the PCAOB and are required to be independent with respect to the Company in accordance with the U.S. federal securities laws and the applicable rules and regulations of the Securities and Exchange Commission and the PCAOB.
We conducted our audit in accordance with the standards of the PCAOB. Those standards require that we plan and perform the audit to obtain reasonable assurance about whether effective internal control over financial reporting was maintained in all material respects.
Our audit included obtaining an understanding of internal control over financial reporting, assessing the risk that a material weakness exists, testing and evaluating the design and operating effectiveness of internal control based on the assessed risk, and performing such other procedures as we considered necessary in the circumstances. We believe that our audit provides a reasonable basis for our opinion.
Definition and Limitations of Internal Control Over Financial Reporting
A company’s internal control over financial reporting is a process designed to provide reasonable assurance regarding the reliability of financial reporting and the preparation of financial statements for external purposes in accordance with generally accepted accounting principles. A company’s internal control over financial reporting includes those policies and procedures that (1) pertain to the maintenance of records that, in reasonable detail, accurately and fairly reflect the transactions and dispositions of the assets of the company; (2) provide reasonable assurance that transactions are recorded as necessary to permit preparation of financial statements in accordance with generally accepted accounting principles, and that receipts and expenditures of the company are being made only in accordance with authorizations of management and directors of the company; and (3) provide reasonable assurance regarding prevention or timely detection of unauthorized acquisition, use, or disposition of the company’s assets that could have a material effect on the financial statements.
Because of its inherent limitations, internal control over financial reporting may not prevent or detect misstatements. Also, projections of any evaluation of effectiveness to future periods are subject to the risk that controls may become inadequate because of changes in conditions, or that the degree of compliance with the policies or procedures may deteriorate.
/s/ Ernst & Young LLP
Cincinnati, Ohio
November 21, 2018
105
None.
106
A list of Valvoline’s executive officers and related information appears under the caption “Executive Officers of Valvoline” in Part I, Item 1 of this Annual Report on Form 10-K. The other information required by this item will be included under the captions, “Proposal One - Election of Directors,” “Corporate Governance - Overview of Governance Principles,” “Corporate Governance - Shareholder Recommendations for and Nominations of Directors,” “Audit Committee Report,” and “Corporate Governance - Section 16(a) Beneficial Ownership Reporting Compliance” in Valvoline’s Proxy Statement for its 2019 Annual Meeting of Shareholders (“2019 Proxy Statement”), which will be filed with the SEC within 120 days after September 30, 2018, and is incorporated herein by reference.
The information required by this item will be included under the captions “Compensation of Directors,” “Corporate Governance - Compensation Committee Interlocks and Insider Participation,” “Corporate Governance - The Board’s Role in Risk Oversight,” “Executive Compensation,” “Compensation Discussion and Analysis,” “Summary Compensation Table,” “Grants of Plan-Based Awards for Fiscal 2018,” “Outstanding Equity Awards at Fiscal 2018 Year End,” “Option Exercises and Stock Vested for Fiscal 2018,” “Pension Benefits for Fiscal 2018,” “Non-Qualified Deferred Compensation for Fiscal 2018,” “Potential Payments Upon Termination or Change in Control for Fiscal 2018 Table,” “CEO Pay Ratio,” and “Report of the Compensation Committee” in Valvoline’s 2019 Proxy Statement and is incorporated herein by reference.
The information required by this item will be included under the captions “Stock Ownership Information” and “Equity Compensation Plan Information” in Valvoline’s 2019 Proxy Statement and is incorporated herein by reference.
The information required by this item will be included under the captions “Corporate Governance - Valvoline’s Board of Directors - Independence,” and “Corporate Governance - Related Person Transaction Policy” in Valvoline’s 2019 Proxy Statement and is incorporated herein by reference.
The information required by this item is set forth under the captions “Audit Committee Matters” and “Proposal Two - Ratification of Independent Registered Public Accounting Firm” in Valvoline’s 2019 Proxy Statement and is incorporated herein by reference.
107
(a) Documents filed as part of this Report
(1) Financial statements
The consolidated financial statements of Valvoline filed as part of this Annual Report on Form 10-K are included under Part II, Item 8.
Separate financial statements of unconsolidated affiliates are omitted because none of these companies constitute significant subsidiaries using the 20% tests when considered individually. Summarized financial information for all unconsolidated affiliates is disclosed in Note 5 of the Notes to Consolidated Financial Statements.
(2) Financial statement schedule
Financial Statement Schedule II - Valuation and Qualifying Accounts included in this Form 10-K. All other schedules are not required under the related instructions or are not applicable.
(3) Exhibits
See Item 15(b) included in this Annual Report on Form 10-K.
(b) Documents required by Item 601 of Regulation S-K
|
3.1
|
-
|
|
|
3.2
|
-
|
|
|
4.1
|
-
|
|
|
4.2
|
-
|
|
|
4.3
|
-
|
|
|
4.4
|
-
|
|
The following Exhibits 10.1 through 10.23 are contracts or compensatory plans or arrangements or management contracts required to be filed as exhibits pursuant to Items 601(b)(10)(ii)(A) and 601(b)(10)(iii)(A) and (B) of Regulations S-K.
|
10.1
|
-
|
|
|
10.2
|
-
|
|
|
10.3
|
-
|
|
108
|
10.4
|
-
|
|
|
10.5
|
-
|
|
|
10.6
|
-
|
|
|
10.7
|
-
|
|
|
10.8
|
-
|
|
|
10.9
|
-
|
|
|
10.10
|
-
|
|
|
10.11
|
-
|
|
|
10.12
|
-
|
|
|
10.13
|
-
|
|
|
10.14
|
-
|
|
|
10.15
|
-
|
|
|
10.16
|
-
|
|
|
10.17
|
-
|
|
|
10.18
|
-
|
|
|
10.19
|
-
|
|
|
10.20
|
-
|
|
|
10.21
|
-
|
|
|
10.22
|
-
|
|
|
10.23
|
-
|
|
109
|
10.24
|
-
|
|
|
10.25
|
-
|
|
|
10.26
|
-
|
|
|
10.27
|
||
|
10.28
|
-
|
|
|
10.29
|
-
|
|
|
10.30
|
-
|
|
|
10.31
|
-
|
|
|
10.32
|
-
|
|
|
10.33
|
-
|
|
|
10.34
|
-
|
|
|
10.35**
|
-
|
|
|
10.36**
|
-
|
|
|
21*
|
-
|
|
|
23.1*
|
-
|
|
|
24*
|
-
|
|
|
31.1*
|
-
|
|
|
31.2*
|
-
|
|
110
|
32*
|
-
|
|
|
101
|
Interactive data files pursuant to Rule 405 of Regulations S-T: (i) the Consolidated Statements of Comprehensive Income for the years ended September 30, 2018, 2017 and 2016, (ii) the Consolidated Balance Sheets at September 30, 2018 and 2017, (iii) the Consolidated Statement of Stockholders’ Deficit for the years ended September 30, 2018, 2017 and 2016, (iv) the Consolidated Statements of Cash Flows for the years ended September 30, 2018, 2017 and 2016, and (v) the Notes to the Consolidated Financial Statements.
|
|
* Filed herewith.
** Confidential treatment previously granted for certain portions which are omitted in the copy of the exhibit electronically filed
with the SEC. The omitted information has been filed separately with the SEC pursuant to Valvoline’s application for confidential treatment.
SM
Service mark, Valvoline or its subsidiaries, registered in various countries.
™ Trademark, Valvoline or its subsidiaries, registered in various countries.
†
Trademark owned by a third party.
Upon written or oral request, a copy of the above exhibits will be furnished at cost.
111
|
VALVOLINE INC.
|
||||||||||||||||||
|
SCHEDULE II - VALUATION AND QUALIFYING ACCOUNTS
|
||||||||||||||||||
|
For the years ended September 30, 2018, 2017 and 2016
|
||||||||||||||||||
|
(In millions)
|
||||||||||||||||||
|
(A)
|
(B)
|
(C)
|
(D)
|
(E)
|
||||||||||||||
|
Additions
|
||||||||||||||||||
|
Description
|
Balance at beginning of period
|
Charged to expenses
|
Charged to other accounts
|
Deductions
|
Balance at end of period
|
|||||||||||||
|
Allowance for doubtful accounts
|
||||||||||||||||||
|
Year ended September 30, 2018
|
$
|
5
|
|
$
|
2
|
|
$
|
1
|
|
$
|
(1
|
)
|
$
|
7
|
|
|||
|
Year ended September 30, 2017
|
$
|
5
|
|
$
|
1
|
|
$
|
—
|
|
$
|
(1
|
)
|
$
|
5
|
|
|||
|
Year ended September 30, 2016
|
$
|
4
|
|
$
|
1
|
|
$
|
—
|
|
$
|
—
|
|
$
|
5
|
|
|||
|
Inventory excess and obsolete reserves
|
||||||||||||||||||
|
Year ended September 30, 2018
|
$
|
3
|
|
$
|
—
|
|
$
|
—
|
|
$
|
—
|
|
$
|
3
|
|
|||
|
Year ended September 30, 2017
|
$
|
2
|
|
$
|
1
|
|
$
|
—
|
|
$
|
—
|
|
$
|
3
|
|
|||
|
Year ended September 30, 2016
|
$
|
2
|
|
$
|
—
|
|
$
|
—
|
|
$
|
—
|
|
$
|
2
|
|
|||
|
Deferred tax asset valuation allowance
|
||||||||||||||||||
|
Year ended September 30, 2018
|
$
|
8
|
|
$
|
—
|
|
$
|
—
|
|
$
|
(1
|
)
|
$
|
7
|
|
|||
|
Year ended September 30, 2017
|
$
|
12
|
|
$
|
—
|
|
$
|
—
|
|
$
|
(4
|
)
|
$
|
8
|
|
|||
|
Year ended September 30, 2016
|
$
|
7
|
|
$
|
—
|
|
$
|
5
|
|
$
|
—
|
|
$
|
12
|
|
|||
112
SIGNATURES
Pursuant to the requirements of Section 13 or 15(d) of the Securities Exchange Act of 1934, the Registrant has duly caused this report to be signed on its behalf by the undersigned, thereunto duly authorized.
|
VALVOLINE INC.
|
|
|
(Registrant)
|
|
|
By:
|
|
|
/s/ Mary E. Meixelsperger
|
|
|
Mary E. Meixelsperger
|
|
|
Chief Financial Officer
|
|
|
Date: November 21, 2018
|
|
Pursuant to the requirements of the Securities Exchange Act of 1934, this report has been signed below by the following persons on behalf of the Registrant, in the capacities indicated, on November 21, 2018.
|
Signatures
|
Capacity
|
|
|
/s/ Samuel J. Mitchell, Jr.
|
Chief Executive Officer and Director
|
|
|
Samuel J. Mitchell, Jr.
|
(Principal Executive Officer)
|
|
|
/s/ Mary E. Meixelsperger
|
Chief Financial Officer
|
|
|
Mary E. Meixelsperger
|
(Principal Financial Officer)
|
|
|
/s/ David J. Scheve
|
Controller and Chief Accounting Officer
|
|
|
David J. Scheve
|
(Principal Accounting Officer)
|
|
|
*
|
Non-Executive Chairman and Director
|
|
|
Stephen F. Kirk
|
||
|
*
|
Director
|
|
|
Richard J. Freeland
|
||
|
*
|
Director
|
|
|
Stephen E. Macadam
|
||
|
*
|
Director
|
|
|
Vada O. Manager
|
||
|
*
|
Director
|
|
|
Charles M. Sonsteby
|
||
|
*
|
Director
|
|
|
Mary J. Twinem
|
||
|
*By:
|
/s/ Julie M. O’Daniel
|
|
Julie M. O’Daniel
|
|
|
Attorney-in-Fact
|
|
|
Date:
|
November 21, 2018
|
113
TABLE OF CONTENTS
Part IItem 1. BusinessItem 1A. Risk FactorsItem 1B. Unresolved Staff CommentsItem 2. PropertiesItem 3. Legal ProceedingsItem 4. Mine Safety DisclosuresPart IIItem 5. Market For Registrant S Common Equity, Related Stockholder Matters and Issuer Purchases Of Equity SecuritiesItem 6. Selected Financial DataItem 7. Management S Discussion and Analysis Of Financial Condition and Results Of OperationsItem 7A. Quantitative and Qualitative Disclosures About Market RiskItem 8. Financial Statements and Supplementary DataNote 1 Description Of Business and Basis Of PresentationNote 2 Significant Accounting PoliciesNote 3 Fair Value MeasurementsNote 4 Acquisitions and DivestituresNote 5 Equity Method InvestmentsNote 6 - Accounts ReceivableNote 7 InventoriesNote 8 Property, Plant and EquipmentNote 9 Goodwill and Other IntangiblesNote 10 DebtNote 11 Lease CommitmentsNote 12 Income TaxesNote 13 Employee Benefit PlansNote 14 Litigation, Claims and ContingenciesNote 15 - Stock-based Compensation PlansNote 16 - Earnings Per ShareNote 17 - Stockholders DeficitNote 18 Related Party TransactionsNote 19 Reportable Segment InformationNote 20 Quarterly Financial Information (unaudited)Note 21 Guarantor Financial InformationNote 22 Subsequent EventsItem 9. Changes in and Disagreements with Accountants on Accounting and Financial DisclosureItem 9A. Controls and ProceduresItem 9B. Other InformationPart IIIItem 10. Directors, Executive Officers and Corporate GovernanceItem 11. Executive CompensationItem 12. Security Ownership Of Certain Beneficial Owners and Management and Related Stockholder MattersItem 13. Certain Relationships and Related Transactions and Director IndependenceItem 14. Principal Accountant Fees and ServicesPart IVItem 15. Exhibits and Financial Statement Schedule