VALVOLINE INC
10-Ks and 10-Qs
|
|
|
|
|
|
|
|
|
|
|
|
|
|
|
|
|
|
|
|
|
|
|
|
|
|
|
|
|
|
|
|
|
|
|
|
|
|
|
|
|
|
|
|
|
|
|
|
|
|
|
|
|
|
|
|
|
|
|
|
|
|
|
|
|
|
|
|
|
|
|
|
|
|
|
|
|
|
|
|
|
|
|
|
|
|
|
|
|
|
|
|
|
|
|
|
|
|
|
|
|
|
|
|
|
|
|
|
|
|
|
|
|
|
|
|
|
|
|
|
|
|
|
|
|
|
|
|
|
|
|
|
|
|
|
|
|
|
|
|
|
|
|
|
|
|
|
|
UNITED STATES
SECURITIES AND EXCHANGE COMMISSION
WASHINGTON, D.C. 20549
______________________
FORM
10-Q
(Mark one)
|
|
QUARTERLY REPORT PURSUANT TO SECTION 13 OR 15(d) OF THE SECURITIES EXCHANGE ACT OF 1934 | ||||
For the quarterly period ended
March 31, 2023
OR
|
|
TRANSITION REPORT PURSUANT TO SECTION 13 OR 15(d) OF THE SECURITIES EXCHANGE ACT OF 1934 | ||||
For the transition period from _________ to ___________
Commission file number
001-37884

(Exact name of registrant as specified in its charter)
|
|
|
||||
| (State or other jurisdiction of incorporation or organization) |
(I.R.S. Employer Identification No.)
|
||||
(Address of principal executive offices) (Zip Code)
Telephone Number (
859
)
357-7777
(Registrant’s telephone number, including area code)
Securities registered pursuant to Section 12(b) of the Act:
| Title of each class | Trading Symbol(s) | Name of each exchange on which registered | ||||||||||||
|
|
|
|
||||||||||||
Indicate by check mark whether the registrant (1) has filed all reports required to be filed by Section 13 or 15(d) of the Securities Exchange Act of 1934 during the preceding 12 months (or for such shorter period that the Registrant was required to file such reports), and (2) has been subject to such filing requirements for the past 90 days.
Yes
þ
No
o
Indicate by check mark whether the registrant has submitted electronically every Interactive Data File required to be submitted pursuant to Rule 405 of Regulation S-T (§232.405 of this chapter) during the preceding 12 months (or for such shorter period that the registrant was required to submit such files).
Yes
þ
No
o
Indicate by check mark whether the registrant is a large accelerated filer, an accelerated filer, a non-accelerated filer, a smaller reporting company or an emerging growth company. See the definitions of “large accelerated filer,” “accelerated filer,” “smaller reporting company,” and “emerging growth company” in Rule 12b-2 of the Exchange Act.
|
|
☑ |
Accelerated filer
|
☐
|
||||||||
|
Non-accelerated filer
|
☐
|
Smaller reporting company
|
|
||||||||
|
Emerging growth company
|
|
||||||||||
If an emerging growth company, indicate by check mark if the registrant has elected not to use the extended transition period for complying with any new or revised financial accounting standards provided pursuant to Section 13(a) of the Exchange Act. ☐
Indicate by check mark whether the registrant is a shell company (as defined in Rule 12b-2 of the Act). Yes
☐
No
þ
At
May 5, 2023, there were
165,808,937
shares of the registrant
’
s common stock outstanding.
TABLE OF CONTENTS
|
|
Page | ||||
| PART I – FINANCIAL INFORMATION | |||||
| PART II – OTHER INFORMATION | |||||
2
PART I - FINANCIAL INFORMATION
ITEM 1. FINANCIAL STATEMENTS
Valvoline Inc. and Consolidated Subsidiaries
Condensed Consolidated Statements of Comprehensive Income
|
Three months ended
March 31 |
Six months ended
March 31 |
|||||||||||||||||||||||||
| (In millions, except per share amounts - unaudited) | 2023 | 2022 | 2023 | 2022 | ||||||||||||||||||||||
| Net revenues | $ |
|
$ |
|
$ |
|
$ |
|
||||||||||||||||||
| Cost of sales |
|
|
|
|
||||||||||||||||||||||
| Gross profit |
|
|
|
|
||||||||||||||||||||||
| Selling, general and administrative expenses |
|
|
|
|
||||||||||||||||||||||
| Net legacy and separation-related expenses |
|
|
|
|
||||||||||||||||||||||
| Other income, net |
(
|
(
|
(
|
(
|
||||||||||||||||||||||
| Operating income |
|
|
|
|
||||||||||||||||||||||
| Net pension and other postretirement plan expense (income) |
|
(
|
|
(
|
||||||||||||||||||||||
| Net interest and other financing expenses |
|
|
|
|
||||||||||||||||||||||
| Income before income taxes |
|
|
|
|
||||||||||||||||||||||
| Income tax expense (benefit) |
|
|
(
|
|
||||||||||||||||||||||
| Income from continuing operations |
|
|
|
|
||||||||||||||||||||||
| Income from discontinued operations |
|
|
|
|
||||||||||||||||||||||
| Net income | $ |
|
$ |
|
$ |
|
$ |
|
||||||||||||||||||
| NET EARNINGS PER SHARE | ||||||||||||||||||||||||||
| Basic earnings per share | ||||||||||||||||||||||||||
| Continuing operations |
|
|
|
|
||||||||||||||||||||||
| Discontinued operations |
|
|
|
|
||||||||||||||||||||||
| Basic earnings per share | $ |
|
$ |
|
$ |
|
$ |
|
||||||||||||||||||
| Diluted earnings per share | ||||||||||||||||||||||||||
| Continuing operations |
|
|
|
|
||||||||||||||||||||||
| Discontinued operations |
|
|
|
|
||||||||||||||||||||||
| Diluted earnings per share | $ |
|
$ |
|
$ |
|
$ |
|
||||||||||||||||||
| WEIGHTED AVERAGE COMMON SHARES OUTSTANDING | ||||||||||||||||||||||||||
| Basic |
|
|
|
|
||||||||||||||||||||||
| Diluted |
|
|
|
|
||||||||||||||||||||||
| Comprehensive income | ||||||||||||||||||||||||||
| Net income | $ |
|
$ |
|
$ |
|
$ |
|
||||||||||||||||||
| Other comprehensive income (loss), net of tax | ||||||||||||||||||||||||||
| Currency translation adjustments |
|
(
|
|
(
|
||||||||||||||||||||||
| Amortization of pension and other postretirement plan prior service credits |
(
|
(
|
(
|
(
|
||||||||||||||||||||||
| Unrealized (loss) gain on cash flow hedges |
(
|
|
(
|
|
||||||||||||||||||||||
| Other comprehensive income |
|
|
|
|
||||||||||||||||||||||
| Comprehensive income | $ |
|
$ |
|
$ |
|
$ |
|
||||||||||||||||||
See Notes to Condensed Consolidated Financial Statements.
3
Valvoline Inc. and Consolidated Subsidiaries
Condensed Consolidated Balance Sheets
| (In millions, except per share amounts - unaudited) |
March 31
2023 |
September 30
2022 |
||||||||||||
| Assets | ||||||||||||||
| Current assets | ||||||||||||||
| Cash and cash equivalents | $ |
|
$ |
|
||||||||||
| Receivables, net |
|
|
||||||||||||
| Inventories, net |
|
|
||||||||||||
| Prepaid expenses and other current assets |
|
|
||||||||||||
| Current assets held for sale |
|
|
||||||||||||
| Total current assets |
|
|
||||||||||||
| Noncurrent assets | ||||||||||||||
| Property, plant and equipment, net |
|
|
||||||||||||
| Operating lease assets |
|
|
||||||||||||
| Goodwill and intangibles, net |
|
|
||||||||||||
| Other noncurrent assets |
|
|
||||||||||||
| Total noncurrent assets |
|
|
||||||||||||
| Total assets | $ |
|
$ |
|
||||||||||
| Liabilities and Stockholders’ Equity | ||||||||||||||
| Current liabilities | ||||||||||||||
| Current portion of long-term debt | $ |
|
$ |
|
||||||||||
| Trade and other payables |
|
|
||||||||||||
| Accrued expenses and other liabilities |
|
|
||||||||||||
| Current liabilities held for sale |
|
|
||||||||||||
| Total current liabilities |
|
|
||||||||||||
| Noncurrent liabilities | ||||||||||||||
| Long-term debt |
|
|
||||||||||||
| Employee benefit obligations |
|
|
||||||||||||
| Operating lease liabilities |
|
|
||||||||||||
| Other noncurrent liabilities |
|
|
||||||||||||
| Total noncurrent liabilities |
|
|
||||||||||||
| Commitments and contingencies |
|
|
||||||||||||
| Stockholders' equity | ||||||||||||||
|
Preferred stock,
|
|
|
||||||||||||
|
Common stock, par value $
|
|
|
||||||||||||
| Paid-in capital |
|
|
||||||||||||
| Retained earnings |
|
|
||||||||||||
| Accumulated other comprehensive income (loss) |
|
(
|
||||||||||||
| Stockholders' equity |
|
|
||||||||||||
|
Total liabilities and stockholders’ equity
|
$ |
|
$ |
|
||||||||||
See Notes to Condensed Consolidated Financial Statements.
4
Valvoline Inc. and Consolidated Subsidiaries
Condensed Consolidated Statements of Cash Flows
|
Six months ended
March 31 |
||||||||||||||
| (In millions - unaudited) | 2023 | 2022 | ||||||||||||
| Cash flows from operating activities | ||||||||||||||
| Net income | $ |
|
$ |
|
||||||||||
| Adjustments to reconcile to cash flows from operations | ||||||||||||||
| Income from discontinued operations |
(
|
(
|
||||||||||||
| Depreciation and amortization |
|
|
||||||||||||
| Deferred income taxes |
(
|
|
||||||||||||
| Stock-based compensation expense |
|
|
||||||||||||
| Other, net |
|
|
||||||||||||
| Change in operating assets and liabilities | ||||||||||||||
| Receivables |
|
(
|
||||||||||||
| Inventories |
(
|
|
||||||||||||
| Payables and accrued liabilities |
|
(
|
||||||||||||
| Other assets and liabilities |
|
(
|
||||||||||||
| Operating cash flows from continuing operations |
|
|
||||||||||||
| Operating cash flows from discontinued operations |
(
|
|
||||||||||||
| Total cash provided by operating activities |
|
|
||||||||||||
| Cash flows from investing activities | ||||||||||||||
| Additions to property, plant and equipment |
(
|
(
|
||||||||||||
| Acquisitions of businesses, net of cash acquired |
(
|
(
|
||||||||||||
| Other investing activities, net |
|
|
||||||||||||
| Investing cash flows from continuing operations |
(
|
(
|
||||||||||||
| Investing cash flows from discontinued operations |
|
(
|
||||||||||||
| Total cash provided by (used in) investing activities |
|
(
|
||||||||||||
| Cash flows from financing activities | ||||||||||||||
| Proceeds from borrowings, net of issuance costs |
|
|
||||||||||||
| Repayments on borrowings |
(
|
|
||||||||||||
| Repurchases of common stock |
(
|
(
|
||||||||||||
| Cash dividends paid |
(
|
(
|
||||||||||||
| Other financing activities |
(
|
(
|
||||||||||||
| Financing cash flows from continuing operations |
(
|
(
|
||||||||||||
| Financing cash flows from discontinued operations |
(
|
(
|
||||||||||||
| Total cash used in financing activities |
(
|
(
|
||||||||||||
| Effect of currency exchange rate changes on cash, cash equivalents and restricted cash |
|
|
||||||||||||
| Increase (decrease) in cash, cash equivalents and restricted cash |
|
(
|
||||||||||||
| Cash, cash equivalents and restricted cash - beginning of period |
|
|
||||||||||||
| Cash, cash equivalents and restricted cash - end of period | $ |
|
$ |
|
||||||||||
See Notes to Condensed Consolidated Financial Statements.
5
Valvoline Inc. and Consolidated Subsidiaries
Condensed Consolidated Statements of Stockholders' Equity
| Six months ended March 31, 2023 | ||||||||||||||||||||||||||||||||||||||
| (In millions, except per share amounts - unaudited) | Common stock | Paid-in capital | Retained earnings | Accumulated other comprehensive (loss) income | Totals | |||||||||||||||||||||||||||||||||
| Shares | Amount | |||||||||||||||||||||||||||||||||||||
| Balance at September 30, 2022 |
|
$ |
|
$ |
|
$ |
|
$ |
(
|
$ |
|
|||||||||||||||||||||||||||
| Net income | — | — | — |
|
— |
|
||||||||||||||||||||||||||||||||
|
Dividends paid, $
|
— | — |
|
(
|
— |
(
|
||||||||||||||||||||||||||||||||
| Stock-based compensation, net of issuances |
|
— |
(
|
— | — |
(
|
||||||||||||||||||||||||||||||||
| Repurchases of common stock |
(
|
(
|
— |
(
|
— |
(
|
||||||||||||||||||||||||||||||||
| Other comprehensive income, net of tax | — | — | — | — |
|
|
||||||||||||||||||||||||||||||||
| Balance at December 31, 2022 |
|
$ |
|
$ |
|
$ |
|
$ |
(
|
$ |
|
|||||||||||||||||||||||||||
| Net income | — | — | — |
|
— |
|
||||||||||||||||||||||||||||||||
| Stock-based compensation, net of issuances |
|
— |
|
— | — |
|
||||||||||||||||||||||||||||||||
| Repurchases of common stock |
(
|
— | — |
(
|
— |
(
|
||||||||||||||||||||||||||||||||
| Other comprehensive income, net of tax | — | — | — | — |
|
|
||||||||||||||||||||||||||||||||
| Balance at March 31, 2023 |
|
$ |
|
$ |
|
$ |
|
$ |
|
$ |
|
|||||||||||||||||||||||||||
| Six months ended March 31, 2022 | ||||||||||||||||||||||||||||||||||||||
| (In millions, except per share amounts - unaudited) | Common stock | Paid-in capital | Retained earnings | Accumulated other comprehensive income (loss) | Totals | |||||||||||||||||||||||||||||||||
| Shares | Amount | |||||||||||||||||||||||||||||||||||||
| Balance at September 30, 2021 |
|
$ |
|
$ |
|
$ |
|
$ |
|
$ |
|
|||||||||||||||||||||||||||
| Net income | — | — | — |
|
— |
|
||||||||||||||||||||||||||||||||
|
Dividends paid, $
|
— | — |
|
(
|
— |
(
|
||||||||||||||||||||||||||||||||
| Stock-based compensation, net of issuances |
|
— |
(
|
— | — |
(
|
||||||||||||||||||||||||||||||||
| Repurchases of common stock |
(
|
— | — |
(
|
— |
(
|
||||||||||||||||||||||||||||||||
| Other comprehensive income, net of tax | — | — | — | — |
|
|
||||||||||||||||||||||||||||||||
| Balance at December 31, 2021 |
|
$ |
|
$ |
|
$ |
|
$ |
|
$ |
|
|||||||||||||||||||||||||||
| Net income | — | — | — |
|
— |
|
||||||||||||||||||||||||||||||||
|
Dividends paid, $
|
— | — |
|
(
|
— |
(
|
||||||||||||||||||||||||||||||||
| Stock-based compensation, net of issuances | — | — |
|
— | — |
|
||||||||||||||||||||||||||||||||
| Repurchases of common stock |
(
|
— | — |
(
|
— |
(
|
||||||||||||||||||||||||||||||||
| Other comprehensive income, net of tax | — | — | — | — |
|
|
||||||||||||||||||||||||||||||||
| Balance at March 31, 2022 |
|
$ |
|
$ |
|
$ |
|
$ |
|
$ |
|
|||||||||||||||||||||||||||
See Notes to Condensed Consolidated Financial Statements.
6
|
Index to Notes to Condensed Consolidated Financial Statements
|
Page | ||||
7
Valvoline Inc. and Consolidated Subsidiaries
Notes to Condensed Consolidated Financial Statements (Unaudited)
NOTE 1 –
BASIS OF PRESENTATION AND SIGNIFICANT ACCOUNTING POLICIES
The accompanying unaudited condensed consolidated financial statements have been prepared by Valvoline Inc. (“Valvoline” or the “Company”) in accordance with accounting principles generally accepted in the United States of America (“U.S. GAAP”) and Securities and Exchange Commission regulations for interim financial reporting, which do not include all information and footnote disclosures normally included in annual financial statements. Therefore, these condensed consolidated financial statements should be read in conjunction with Valvoline’s Annual Report on Form 10-K for the fiscal year ended September 30, 2022. Certain prior period amounts disclosed herein have been reclassified to conform to the current presentation.
Use of estimates, risks and uncertainties
The preparation of the condensed consolidated financial statements in conformity with U.S. GAAP requires management to make estimates and judgments that affect the reported amounts of assets, liabilities, revenues and expenses, and the disclosures of contingent matters. Although management bases its estimates on historical experience and various other assumptions that are believed to be reasonable under the circumstances, actual results could differ significantly from the estimates under different assumptions or conditions.
Valvoline has substantially maintained its operations throughout the novel coronavirus ("COVID-19") pandemic to-date and has continued precautionary measures to protect the Company's employees and customers and manage through the currently known impacts on its business. Given the unprecedented nature of the pandemic, the extent of future impacts cannot be reasonably estimated at this time due to numerous uncertainties, including the ultimate duration and severity of the pandemic.
Strategic separation
On March 1, 2023, Valvoline completed the previously announced sale of VGP Holdings LLC, which holds all of the issued and outstanding equity interests in the companies that, along with their respective subsidiaries, comprised the Company’s former Global Products reportable segment (“Global Products”) to Aramco Overseas Company B.V. (“Aramco” or the “Buyer”) (the “Transaction”).
As a result, in all prior periods presented within these condensed consolidated financial statements, the assets and liabilities associated with the Global Products disposal group have been classified as held for sale within the Condensed Consolidated Balance Sheet and its operations have been classified as discontinued operations within the Condensed Consolidated Statements of Comprehensive Income and Cash Flows.
The operating results and cash flows of the Global Products business have been reported through February 28, 2023, the date prior to closing the Transaction. Refer to Note 2 for additional information regarding the Global Products business, including the assets and liabilities divested and income from discontinued operations. Unless otherwise noted, disclosures within these remaining Notes to Condensed Consolidated Financial Statements relate solely to the Company's continuing operations.
Inflation Reduction Act of 2022
The Inflation Reduction Act (the “IRA”) was enacted in the United States in August 2022, which includes, among other provisions, a 15% alternative minimum tax
on corporate adjusted income in excess of certain thresholds for taxable years beginning after
December 31, 2022.
The Company does not expect this provision will have a material impact on its condensed consolidated financial statements.
The IRA also imposes an excise tax of one percent on share repurchases that occur after December 31, 2022. Corporations are permitted to credit certain new stock issuances against their stock repurchases during the same taxable period. Valvoline has repurchased
4.9
million shares of its common stock for $
170.0
million since January 1, 2023 and recognized excise taxes of $
1.7
million in Retained earnings as incremental costs to complete the repurchases during the three months ended March 31, 2023.
8
Recent accounting pronouncements
The following accounting guidance relevant to Valvoline was either issued or adopted in the current year, or is expected to have a meaningful impact on Valvoline in future periods upon adoption.
Recently adopted
In March 2020, the Financial Accounting Standards Board (“FASB”) issued guidance related to reference rate reform that simplifies the accounting for contract modifications and hedging arrangements as the market transitions from the London Interbank Offered Rate ("LIBOR") and other interbank reference rates to alternative reference rates. In December 2022, FASB issued guidance to extend the temporary transition period which now can be applied on a prospective basis through the end of December 2024 for qualifying modified arrangements.
Valvoline amended its Credit Agreement, effective upon the sale of Global Products on March 1, 2023. This amendment includes the transition to the Secured Overnight Financing Rate (“SOFR”) or an alternate base rate, among other modifications. Refer to Note 5 for additional details. Concurrent with the amendment of the Credit Agreement, Valvoline modified its interest rate swap agreements solely to change the reference rates from LIBOR to SOFR and applied the optional expedients available under the reference rate reform accounting guidance. This modification aligns with changes to its variable rate debt under the Credit Agreement amendment. Valvoline expects these hedges to continue to effectively hedge its exposure risk to interest rates.
As of March 31, 2023, Valvoline has no outstanding long-term debt or interest rate swap agreements with payments based on LIBOR.
NOTE 2 -
DISCONTINUED OPERATIONS
Financial results
On July 31, 2022, the Company entered into a definitive agreement to sell Global Products to Aramco. On March 1, 2023, Valvoline completed the sale of Global Products for a cash purchase price of $
2.65
billion and recognized a pre-tax gain on the sale of $
1.6
billion that was recognized in Income from discontinued operations within the Condensed Consolidated Statements of Comprehensive Income. This gain is preliminary and subject to final settlements in accordance with the Purchase Agreement.
The following table summarizes Income from discontinued operations within the Condensed Consolidated Statements of Comprehensive Income:
|
Three months ended
March 31 |
Six months ended
March 31 |
|||||||||||||||||||||||||
| (In millions) | 2023 | 2022 | 2023 | 2022 | ||||||||||||||||||||||
| Net revenues | $ |
|
$ |
|
$ |
|
$ |
|
||||||||||||||||||
| Cost of sales |
|
|
|
|
||||||||||||||||||||||
| Gross profit |
|
|
|
|
||||||||||||||||||||||
| Selling, general and administrative expenses |
|
|
|
|
||||||||||||||||||||||
| Net legacy and separation-related expense |
|
|
|
|
||||||||||||||||||||||
| Equity and other income, net |
(
|
(
|
(
|
(
|
||||||||||||||||||||||
| Operating income from discontinued operations |
|
|
|
|
||||||||||||||||||||||
| Net pension and other postretirement plan (income) expense |
|
|
|
|
||||||||||||||||||||||
| Net interest and other financing expenses |
|
|
|
|
||||||||||||||||||||||
|
Gain on sale of discontinued operations
(a)
|
(
|
|
(
|
|
||||||||||||||||||||||
| Income from discontinued operations before income taxes |
|
|
|
|
||||||||||||||||||||||
|
Income tax expense
(b)
|
|
|
|
|
||||||||||||||||||||||
| Income from discontinued operations | $ |
|
$ |
|
$ |
|
$ |
|
||||||||||||||||||
(a)
The gain on sale also includes the release of Accumulated other comprehensive income of $
30.7
million associated with the realization of cumulative translation losses attributed to the Global Products business.
9
(b)
Income tax expense in the three and six months ended March 31, 2023 includes the tax effects of the gain on sale of $
420.2
million comprised of current and deferred expense of $
327.6
million and $
92.6
million, respectively.
A summary of the held for sale assets and liabilities included in the Condensed Consolidated Balance Sheets follows:
| (In millions) |
September 30
2022 |
||||
| Current assets | |||||
| Cash and cash equivalents | $ |
|
|||
| Receivables, net |
|
||||
| Inventories, net |
|
||||
| Prepaid expenses and other current assets |
|
||||
| Property, plant and equipment, net |
|
||||
| Goodwill and intangibles, net |
|
||||
| Other noncurrent assets |
|
||||
| Current assets held for sale | $ |
|
|||
| Current liabilities | |||||
| Trade and other payables | $ |
|
|||
| Accrued expenses and other liabilities |
|
||||
| Long-term debt |
|
||||
| Other current liabilities |
|
||||
| Current liabilities held for sale | $ |
|
|||
Post-closing arrangements
The products used in Valvoline’s service delivery are sourced from Global Products. Valvoline has entered into a long-term supply agreement whereby Valvoline purchases substantially all lubricant and certain ancillary products for its stores from Global Products. Net revenues within the results of Global Products above include product sales to the Company's continuing operations prior to the closing of the Transaction, which were considered to be effectively settled and were not eliminated. The following table summarizes these transactions:
|
Three months ended
March 31 |
Six months ended
March 31 |
|||||||||||||||||||||||||
| (In millions) | 2023 | 2022 | 2023 | 2022 | ||||||||||||||||||||||
| Net revenues | $ |
|
$ |
|
$ |
|
$ |
|
||||||||||||||||||
Valvoline also entered into a Transition Services Agreement with the Buyer, effective March 1, 2023, to provide and receive services including information technology, legal, finance, and human resources support for a period not expected to exceed 18 months. The income and costs associated with these services were not material during the three and six months ended March 31, 2023.
As part of the Transaction, the Company recognized an estimated obligation of $
15.5
million, predominantly within Accrued expenses and other liabilities in the Condensed Consolidated Balance Sheet as of March 31, 2023 related to certain pre-closing employee matters reimbursable to the Buyer.
10
NOTE 3 -
FAIR VALUE MEASUREMENTS
The following tables set forth the Company’s financial assets and liabilities that were accounted for at fair value on a recurring basis by level within the fair value hierarchy:
|
As of March 31, 2023
|
||||||||||||||||||||||||||||||||
| (In millions) | Total | Level 1 | Level 2 | Level 3 |
NAV
(a)
|
|||||||||||||||||||||||||||
| Cash and cash equivalents | ||||||||||||||||||||||||||||||||
| Money market funds | $ |
|
$ |
|
$ | — | $ | — | $ | — | ||||||||||||||||||||||
| Time deposits |
|
— |
|
— | — | |||||||||||||||||||||||||||
| Prepaid expenses and other current assets | ||||||||||||||||||||||||||||||||
|
Currency derivatives
(b)
|
|
— |
|
— | — | |||||||||||||||||||||||||||
| Interest rate swap agreements |
|
— |
|
— | — | |||||||||||||||||||||||||||
| Other noncurrent assets | ||||||||||||||||||||||||||||||||
| Non-qualified trust funds |
|
— |
|
— |
|
|||||||||||||||||||||||||||
| Interest rate swap agreements |
|
— |
|
— | — | |||||||||||||||||||||||||||
| Total assets at fair value | $ |
|
$ |
|
$ |
|
$ | — | $ |
|
||||||||||||||||||||||
| Accrued expenses and other liabilities | ||||||||||||||||||||||||||||||||
|
Currency derivatives
(b)
|
$ |
|
$ | — | $ |
|
$ | — | $ | — | ||||||||||||||||||||||
| Other noncurrent liabilities | ||||||||||||||||||||||||||||||||
| Deferred compensation obligations |
|
— | — | — |
|
|||||||||||||||||||||||||||
| Total liabilities at fair value | $ |
|
$ |
|
$ |
|
$ | — | $ |
|
||||||||||||||||||||||
|
As of September 30, 2022
|
||||||||||||||||||||||||||||||||
| (In millions) | Total | Level 1 | Level 2 | Level 3 |
NAV
(a)
|
|||||||||||||||||||||||||||
| Cash and cash equivalents | ||||||||||||||||||||||||||||||||
| Money market funds | $ |
|
$ |
|
$ | — | $ | — | $ | — | ||||||||||||||||||||||
| Time deposits |
|
— |
|
— | — | |||||||||||||||||||||||||||
| Prepaid expenses and other current assets | ||||||||||||||||||||||||||||||||
|
Currency derivatives
(b)
|
|
— |
|
— | — | |||||||||||||||||||||||||||
| Interest rate swap agreements |
|
— |
|
— | — | |||||||||||||||||||||||||||
| Other noncurrent assets | ||||||||||||||||||||||||||||||||
| Non-qualified trust funds |
|
— |
|
— |
|
|||||||||||||||||||||||||||
| Interest rate swap agreements |
|
— |
|
— | — | |||||||||||||||||||||||||||
| Total assets at fair value | $ |
|
$ |
|
$ |
|
$ | — | $ |
|
||||||||||||||||||||||
| Accrued expenses and other liabilities | ||||||||||||||||||||||||||||||||
|
Currency derivatives
(b)
|
$ |
|
$ | — | $ |
|
$ | — | $ | — | ||||||||||||||||||||||
| Other noncurrent liabilities | ||||||||||||||||||||||||||||||||
| Deferred compensation obligations |
|
— | — | — |
|
|||||||||||||||||||||||||||
| Total liabilities at fair value | $ |
|
$ |
|
$ |
|
$ | — | $ |
|
||||||||||||||||||||||
(a)
Funds measured at fair value using the net asset value ("NAV") per share practical expedient have not been classified in the fair value hierarchy.
(b)
The Company had outstanding contracts with notional values of $
20.6
million and $
150.5
million as of March 31, 2023 and September 30, 2022, respectively.
Long-term debt
Long-term debt is reported in the Condensed Consolidated Balance Sheets at carrying value, rather than fair value, and is therefore excluded from the disclosure above of financial assets and liabilities measured at fair value within the condensed consolidated financial statements on a recurring basis. The fair values of the Company's outstanding fixed rate senior notes shown below are based on recent trading values, which are considered Level 2 inputs within the fair value hierarchy.
11
| March 31, 2023 | September 30, 2022 | |||||||||||||||||||||||||||||||||||||
| (In millions) | Fair value |
Carrying value
(a)
|
Unamortized
discounts and issuance costs |
Fair value |
Carrying value
(a)
|
Unamortized
discounts and issuance costs |
||||||||||||||||||||||||||||||||
| 2030 Notes | $ |
|
$ |
|
$ |
(
|
$ |
|
$ |
|
$ |
(
|
||||||||||||||||||||||||||
| 2031 Notes |
|
|
(
|
|
|
(
|
||||||||||||||||||||||||||||||||
| Total | $ |
|
$ |
|
$ |
(
|
$ |
|
$ |
|
$ |
(
|
||||||||||||||||||||||||||
Refer to Note 5 for details of these senior notes as well as Valvoline's other debt instruments that have variable interest rates with carrying amounts that approximate fair value.
NOTE 4 -
BUSINESS COMBINATIONS
The Company acquired
13
service center stores in single and multi-store transactions for an aggregate purchase price of $
18.9
million during the six months ended March 31, 2023. These acquisitions expand Valvoline's retail presence in key North American markets, increase the number of company-operated service center stores, and contribute to increasing its footprint to
1,781
system-wide service center stores.
During the six months ended March 31, 2022, the Company acquired
21
service center stores in single and multi-store transactions for an aggregate purchase price of $
23.4
million.
The Company’s acquisitions are accounted for as business combinations.
A summary follows of the aggregate cash consideration paid and the total assets acquired and liabilities assumed for the six months ended March 31:
| (In millions) | 2023 | 2022 | ||||||||||||
| Inventories | $ |
|
$ |
|
||||||||||
|
Property, plant and equipment
(a)
|
|
|
||||||||||||
| Operating lease assets |
|
|
||||||||||||
|
Goodwill
(b)
|
|
|
||||||||||||
|
Intangible assets
(c)
|
|
|
||||||||||||
|
Reacquired franchise rights
(d)
|
|
|
||||||||||||
| Other |
|
|
||||||||||||
| Other current liabilities |
(
|
(
|
||||||||||||
| Operating lease liabilities |
(
|
(
|
||||||||||||
| Other noncurrent liabilities |
(
|
|
||||||||||||
| Total net assets acquired | $ |
|
$ |
|
||||||||||
(a)
Includes $
2.4
million of
in property, plant and equipment and
of $
0.1
million and $
2.3
million in current and noncurrent liabilities, respectively, for leases acquired during the six months ended March 31, 2023. No finance lease assets or liabilities were acquired during the six months ended March 31, 2022
.
(b)
Goodwill is generally expected to be deductible for income tax purposes and is primarily attributed to the operational synergies and potential growth expected to result in economic benefits in the respective markets of the acquisitions.
(c)
Intangible assets acquired during the six months ended March 31, 2023 and 2022 have weighted average amortization periods of
9
and
5
years, respectively.
(d)
Prior to the acquisition of former franchise service center stores, the Company licensed the right to operate franchised service centers, including the use of Valvoline's trademarks and trade name. In connection with these acquisitions, Valvoline reacquired those rights and recognized separate definite-lived reacquired franchise rights intangible assets, which are being amortized on a straight-line basis over the weighted average remaining term of approximately
10
years for the rights reacquired in fiscal 2023. The effective settlement of these arrangements resulted in
no
settlement gain or loss as the contractual terms were at market.
The fair values above are preliminary for up to one year from the date of acquisition as they may be subject to measurement period adjustments if new information is obtained about facts and circumstances that existed as of the
12
NOTE 5 -
DEBT
The following table summarizes Valvoline’s total debt as of:
| (In millions) |
March 31
2023 |
September 30
2022 |
||||||||||||
| 2031 Notes | $ |
|
$ |
|
||||||||||
| 2030 Notes |
|
|
||||||||||||
| Term Loan |
|
|
||||||||||||
|
Revolver
(a)
|
|
|
||||||||||||
| Trade Receivables Facility |
|
|
||||||||||||
| Debt issuance costs and discounts |
(
|
(
|
||||||||||||
| Total debt |
|
|
||||||||||||
| Current portion of long-term debt |
|
|
||||||||||||
| Long-term debt | $ |
|
$ |
|
||||||||||
(a)
As of March 31, 2023, the total borrowing capacity remaining under the $
475.0
million revolving credit facility was $
471.2
million due to a reduction of $
3.8
million for letters of credit outstanding.
As of March 31, 2023, Valvoline was in compliance with all covenants under its long-term borrowings.
Senior Credit Agreement
Key terms and conditions
In December 2022, Valvoline amended the Senior Credit Agreement, which became effective March 1, 2023 commensurate with the sale of the Global Products business. The Senior Credit Agreement provides an aggregate principal amount of $
950.0
million in senior secured credit facilities comprised of (i) a
five-year
$
475.0
million term loan facility (the “Term Loan”) and (ii) a
five-year
$
475.0
million revolving credit facility (the “Revolver”), including a $
100.0
million letter of credit sublimit.
The principal amount of the Term Loan under the Senior Credit Agreement is required to be repaid in quarterly installments of approximately $
5.9
million beginning with the first fiscal quarter after the sale of Global Products, with the remainder due at maturity and prepayment required in the amount of the net cash proceeds from certain events. Amounts outstanding under the Senior Credit Agreement may be prepaid at any time, and from time to time, in whole or part, without premium or penalty. At Valvoline’s option, amounts outstanding under the Senior Credit Agreement will bear interest at either SOFR or an alternative base rate, in each case plus the applicable interest rate margin. The interest rate will fluctuate between SOFR plus
1.375
% per year and SOFR plus
2.250
% per year (or between the alternative base rate plus
0.375
% per year and the alternative base rate plus
1.250
% per year), based upon Valvoline’s consolidated total net leverage ratio.
Proceeds from the Term Loan, in addition to a portion of the proceeds from the sale of the Global Products business, were used to pay in full the outstanding borrowings under the prior Credit Agreement, including the principal balance of the term loan facility of $
445.6
million and outstanding borrowings under the revolving credit facility of $
290.0
million, as well as accrued and unpaid interest and fees and expenses related to the amendment. The Company recognized $
0.9
million of expense within Net interest and other financing expenses in the Condensed Consolidated Statements of Comprehensive Income during the three and six months ended March 31, 2023 associated with the modification of the Credit Agreement, which included accelerated amortization of previously capitalized debt issuance costs.
13
Covenants and guarantees
The amended Senior Credit Agreement contains covenants and provisions that became effective March 1, 2023. These terms and conditions are generally consistent with the prior Credit Agreement, including the maintenance of financial covenants as of the end of each fiscal quarter and guarantees from certain of Valvoline’s existing and future subsidiaries.
Trade Receivables Facility
In connection with the sale of Global Products on March 1, 2023, the Company repaid the Trade Receivables Facility of $
175.0
million and recognized a loss on extinguishment of $
1.0
million in Income from discontinued operations in the Condensed Consolidated Income Statements for the three and six months ended March 31, 2023.
NOTE 6 –
INCOME TAXES
Income tax provisions for interim quarterly periods are based on an estimated annual effective income tax rate calculated separately from the effect of significant, infrequent or unusual discrete items related specifically to interim periods.
The following summarizes income tax expense and the effective tax rate in each interim period:
|
Three months ended
March 31 |
Six months ended
March 31 |
|||||||||||||||||||||||||
| (In millions) | 2023 | 2022 | 2023 | 2022 | ||||||||||||||||||||||
| Income tax expense (benefit) | $ |
|
$ |
|
$ |
(
|
$ |
|
||||||||||||||||||
| Effective tax rate percentage |
|
% |
|
% |
(
|
% |
|
% | ||||||||||||||||||
The increase in income tax expense for the three months ended March 31, 2023 was principally driven by higher pre-tax earnings, while the reduction in the effective tax rate for this period was primarily attributed to unfavorable impacts in the prior year from the suspended operations of a former Global Products business. The favorable income tax provision and effective tax rate in the six months ended March 31, 2023 were primarily attributed to release of valuation allowances due to the change in expectations regarding the utilization of certain legacy tax attributes as described further below.
Legacy tax attributes
In connection with amending the Tax Matters Agreement, management expects the Company is currently more likely than not to realize certain legacy tax attributes that were transferred from its former parent prior to Valvoline's initial public offering in late fiscal 2016. As a result, the Company recognized an income tax benefit of $
26.5
million during the six months ended March 31, 2023 in connection with releasing its valuation allowance. Additionally, Valvoline recognized $
24.4
million of expense within Net legacy and separation-related expenses in the Condensed Consolidated Statement of Comprehensive Income during the six months ended March 31, 2023 to reflect its increased estimated indemnity obligation due to its former parent company as a result of the terms of the amended Tax Matters Agreement.
Unrecognized tax benefits
14
NOTE 7 –
EMPLOYEE BENEFIT PLANS
The following table summarizes the components of pension and other postretirement plan expense (income):
| Pension benefits | Other postretirement benefits | |||||||||||||||||||||||||
| (In millions) | 2023 | 2022 | 2023 | 2022 | ||||||||||||||||||||||
| Three months ended March 31 | ||||||||||||||||||||||||||
| Interest cost | $ |
|
$ |
|
$ |
|
$ |
|
||||||||||||||||||
| Expected return on plan assets |
(
|
(
|
|
|
||||||||||||||||||||||
| Amortization of prior service credits |
|
|
(
|
(
|
||||||||||||||||||||||
| Net periodic benefit costs (income) | $ |
|
$ |
(
|
$ |
(
|
$ |
(
|
||||||||||||||||||
| Six months ended March 31 | ||||||||||||||||||||||||||
| Interest cost | $ |
|
$ |
|
$ |
|
$ |
|
||||||||||||||||||
| Expected return on plan assets |
(
|
(
|
|
|
||||||||||||||||||||||
| Amortization of prior service credit |
|
|
(
|
(
|
||||||||||||||||||||||
| Net periodic benefit costs (income) | $ |
|
$ |
(
|
$ |
(
|
$ |
(
|
||||||||||||||||||
NOTE 8 –
LITIGATION, CLAIMS AND CONTINGENCIES
From time to time, Valvoline is party to lawsuits, claims and other legal proceedings that arise in the ordinary course of business. The Company establishes liabilities for the outcome of such matters where losses are determined to be probable and reasonably estimable. Where appropriate, the Company has recorded liabilities with respect to these matters, which were not material for the periods presented as reflected in the condensed consolidated financial statements herein. There are certain claims and legal proceedings pending where loss is not determined to be probable or reasonably estimable, and therefore, accruals have not been made. In addition, Valvoline discloses matters when management believes a material loss is at least reasonably possible.
In all instances, management has assessed each matter based on current information available and made a judgment concerning its potential outcome, giving due consideration to the amount and nature of the claim and the probability of success. The Company believes it has established adequate accruals for liabilities that are probable and reasonably estimable.
Although the ultimate resolution of these matters cannot be predicted with certainty and there can be no assurances that the actual amounts required to satisfy liabilities from these matters will not exceed the amounts reflected in the condensed consolidated financial statements, based on information available at this time, it is the opinion of management that such pending claims or proceedings will not have a material adverse effect on its condensed consolidated financial statements.
15
NOTE 9 -
EARNINGS PER SHARE
The following table summarizes basic and diluted earnings per share:
|
Three months ended
March 31 |
Six months ended
March 31 |
|||||||||||||||||||||||||
| (In millions, except per share amounts) | 2023 | 2022 | 2023 | 2022 | ||||||||||||||||||||||
| Numerator | ||||||||||||||||||||||||||
| Income from continuing operations | $ |
|
$ |
|
$ |
|
$ |
|
||||||||||||||||||
| Income from discontinued operations |
|
|
|
|
||||||||||||||||||||||
| Net income | $ |
|
$ |
|
$ |
|
$ |
|
||||||||||||||||||
| Denominator | ||||||||||||||||||||||||||
| Weighted average common shares outstanding |
|
|
|
|
||||||||||||||||||||||
|
Effect of potentially dilutive securities
(a)
|
|
|
|
|
||||||||||||||||||||||
| Weighted average diluted shares outstanding |
|
|
|
|
||||||||||||||||||||||
| Basic earnings per share | ||||||||||||||||||||||||||
| Continuing operations | $ |
|
$ |
|
$ |
|
$ |
|
||||||||||||||||||
| Discontinued operations |
|
|
|
|
||||||||||||||||||||||
| Basic earnings per share | $ |
|
$ |
|
$ |
|
$ |
|
||||||||||||||||||
| Diluted earnings per share | ||||||||||||||||||||||||||
| Continuing operations | $ |
|
$ |
|
$ |
|
$ |
|
||||||||||||||||||
| Discontinued operations |
|
|
|
|
||||||||||||||||||||||
| Diluted earnings per share | $ |
|
$ |
|
$ |
|
$ |
|
||||||||||||||||||
(a)
There were
0.3
million and
0.2
million outstanding stock appreciation rights not included in the computation of diluted earnings per share in the three months ended March 31, 2023 and 2022, respectively, and
0.2
million and
0.1
million in the six months ended March 31, 2023 and 2022 because the effect would have been antidilutive.
NOTE 10 -
SUPPLEMENTAL FINANCIAL INFORMATION
Cash, cash equivalents and restricted cash
The following provides a reconciliation of cash, cash equivalents and restricted cash reported within the Condensed Consolidated Statements of Cash Flows to the Condensed Consolidated Balance Sheets:
| (In millions) |
March 31
2023 |
September 30
2022 |
March 31
2022 |
|||||||||||||||||
| Cash and cash equivalents - continuing operations | $ |
|
$ |
|
$ |
|
||||||||||||||
|
Cash and cash equivalents - discontinued operations
(a)
|
|
|
|
|||||||||||||||||
|
Restricted cash - discontinued operations
(a)
|
|
|
|
|||||||||||||||||
| Total cash, cash equivalents and restricted cash | $ |
|
$ |
|
$ |
|
||||||||||||||
(a)
In the periods prior to the close of the sale of Global Products, these balances were included in Current assets held for sale within the Condensed Consolidated Balance Sheets.
Accounts and other receivables
The following summarizes Valvoline’s accounts and other receivables in the Condensed Consolidated Balance Sheets as of:
| (In millions) |
March 31
2023 |
September 30
2022 |
||||||||||||
| Current | ||||||||||||||
| Trade | $ |
|
$ |
|
||||||||||
| Other |
|
|
||||||||||||
| Receivables, gross |
|
|
||||||||||||
| Allowance for credit losses |
(
|
(
|
||||||||||||
| Receivables, net | $ |
|
$ |
|
||||||||||
|
Non-current
(a)
|
||||||||||||||
| Notes receivable | $ |
|
$ |
|
||||||||||
| Other |
|
|
||||||||||||
| Noncurrent notes receivable, gross |
|
|
||||||||||||
| Allowance for losses |
(
|
(
|
||||||||||||
| Noncurrent notes receivable, net | $ |
|
$ |
|
||||||||||
(a)
Included in Other noncurrent assets within the Condensed Consolidated Balance Sheets.
Revenue recognition
The following disaggregates the Company’s net revenues by timing of revenue recognized:
|
Three months ended
March 31 |
Six months ended
March 31 |
|||||||||||||||||||||||||
| (In millions) | 2023 | 2022 | 2023 | 2022 | ||||||||||||||||||||||
| Net revenues transferred at a point in time | $ |
|
$ |
|
$ |
|
$ |
|
||||||||||||||||||
| Franchised revenues transferred over time |
|
|
|
|
||||||||||||||||||||||
| Net revenues | $ |
|
$ |
|
$ |
|
$ |
|
||||||||||||||||||
The following table summarizes net revenues by category:
|
Three months ended
March 31 |
Six months ended
March 31 |
|||||||||||||||||||||||||
| (In millions) | 2023 | 2022 | 2023 | 2022 | ||||||||||||||||||||||
| Oil changes and related fees | $ |
|
$ |
|
$ |
|
$ |
|
||||||||||||||||||
| Non-oil changes and related fees |
|
|
|
|
||||||||||||||||||||||
|
Franchise fees and other
(a)
|
|
|
|
|
||||||||||||||||||||||
| Total | $ |
|
$ |
|
$ |
|
$ |
|
||||||||||||||||||
16
NOTE 11 –
SUBSEQUENT EVENTS
Share repurchases
The Company repurchased
2.9
million of its shares for an aggregate amount of $
100.1
million from April 1, 2023 through May 5, 2023. These repurchases leave $
1.373
billion in authority remaining as of May 6, 2023 under the authorization announced on November 15, 2022 from the Valvoline Board of Directors (the “Board”) to repurchase up to to $
1.6
billion of common stock (the “2022 Share Repurchase Authorization”).
On May 10, 2023, Valvoline announced its intention to commence a modified “Dutch auction” tender offer for up to $
1.0
billion in value of shares of its common stock, subject to market conditions, at a specified price range that is yet to be determined. The tender offer would utilize a substantial portion of the remaining 2022 Share Repurchase Authorization.
17
FORWARD-LOOKING STATEMENTS
Certain statements in this Quarterly Report on Form 10-Q, other than statements of historical fact, are forward-looking statements within the meaning of the Private Securities Litigation Reform Act of 1995. Such forward-looking statements may include, without limitation, benefits and synergies of the sale of Global Products; future opportunities for the remaining stand-alone retail business; and any other statements regarding Valvoline's future operations, financial or operating results, capital allocation, debt leverage ratio, anticipated business levels, dividend policy, anticipated growth, market opportunities, strategies, competition, and other expectations and targets for future periods. Other forward-looking statements used herein include statements about the expected tender offer, including the value of shares expected to be offered to purchase in the tender offer and whether the tender offer is actually commenced and consummated as planned or at all. Valvoline has identified some of these forward-looking statements with words such as “anticipates,” “believes,” “expects,” “estimates,” “is likely,” “predicts,” “projects,” “forecasts,” “may,” “will,” “should,” and “intends,” and the negative of these words or other comparable terminology. These forward-looking statements are based on Valvoline’s current expectations, estimates, projections, and assumptions as of the date such statements are made and are subject to risks and uncertainties that may cause results to differ materially from those expressed or implied in the forward-looking statements. Factors that might cause such differences include, but are not limited to, those discussed under the headings “Risk Factors,” “Management’s Discussion and Analysis of Financial Condition and Results of Operations,” and “Quantitative and Qualitative Disclosures about Market Risk” in this Quarterly Report on Form 10-Q and Valvoline’s most recently filed Annual Report on Form 10-K. Valvoline assumes no obligation to update or revise these forward-looking statements for any reason, even if new information becomes available in the future, unless required by law.
| Index to Management’s Discussion and Analysis of Financial Condition and Results of Operations | Page | ||||
ITEM 2. MANAGEMENT’S DISCUSSION AND ANALYSIS OF FINANCIAL CONDITION AND RESULTS OF OPERATIONS
The following discussion and analysis should be read in conjunction with the Annual Report on Form 10-K for the fiscal year ended September 30, 2022, as well as the condensed consolidated financial statements and the accompanying Notes to Condensed Consolidated Financial Statements included in Item 1 of Part I in this Quarterly Report on Form 10-Q.
BUSINESS OVERVIEW AND PURPOSE
The quick, easy, and trusted name in preventive vehicle maintenance, Valvoline leads the industry with vehicle service innovations that simplify customer’s lives and take the worry out of car care. With average customer ratings that demonstrate high levels of service satisfaction, Valvoline has built a new model for transparency in vehicle maintenance. From the signature 15-minute stay-in-your-car oil change to cabin air filters to battery replacements to tire rotations, the Company’s model offers maintenance solutions for all types of vehicles. The Company operates and franchises nearly 1,800 service center locations through its Valvoline Instant Oil Change
SM
and Great Canadian Oil Change retail brands and helps independent operators growth their businesses through its nearly 300 Valvoline Express Care locations in North America.
Valvoline is focused on expanding its footprint and driving a best-in-class customer experience, while evolving its service offerings to capture growing opportunities in the market by growing non-oil change services, services for the future of mobility, and pursuing fleet service solutions to address medium and heavy-duty vehicles that require comprehensive maintenance needs
.
18
BUSINESS STRATEGY
Continuing Valvoline’s shift to services as a trusted leader in preventive automotive maintenance, the Company will continue growing through ongoing improvements in service to drive same-store sales and investments in network expansion, while continuing to develop capabilities for an evolving car parc. Valvoline’s strategic initiatives include:
•
Continuing to capture increased market share and drive non-oil change revenue growth in existing stores by building on Valvoline’s strong foundation in technology and data, which enables the Company to be an industry leader in automobile aftermarket services and makes vehicle care easy for customers;
•
Aggressively growing the retail footprint with company-operated store growth and an increased emphasis on franchisee unit growth;
•
Developing capabilities to capture new customers through services expansion focused on fleet manager needs and needs of the evolving car parc; and
•
Creating value for the Company's shareholders by positioning the continuing operations for long-term success following the completion of the sale of Global Products.
RECENT DEVELOPMENTS
Strategic separation
On March 1, 2023, Valvoline completed the sale of its former Global Products business to Aramco for a cash purchase price of $2.65 billion, subject to certain customary adjustments as set forth in the Purchase Agreement. Refer to Note 2 of the Notes to Condensed Consolidated Financial Statements included in Item 1 of Part I in this Quarterly Report on Form 10-Q for further details regarding the Global Products business.
With the net proceeds of $2.38 billion from the Transaction, Valvoline is focused on accelerating the return of capital to shareholders through share repurchases, reductions of debt, and investments in attractive retail service growth opportunities. In November 2022, the Company announced that the Board approved a $1.6 billion authorization to repurchase its common stock, which the Company expects to fully utilize within the 18 months following the sale of Global Products. On May 10, 2023, Valvoline announced the intention to commence a modified “Dutch auction” tender offer for up to $1.0 billion in value of shares of its common stock, subject to market conditions, at a specified price range that is yet to be determined. The tender offer would utilize a substantial portion of the remaining 2022 Share Repurchase Authorization. Additionally, Valvoline repaid the pre-existing Trade Receivables Facility and expects to redeem its 2030 Notes within 12 months of closing the Transaction, subject to market conditions.
COVID-19 update
Valvoline has substantially maintained its operations, demonstrating growth and strong results, while managing through the effects of the COVID-19 global pandemic. Valvoline’s offices and locations have established protocols based on continuous monitoring of the circumstances and trend data surrounding the pandemic.
Management is unable to reasonably quantify the impact of COVID-19 on its current year results. The continually evolving COVID-19 pandemic remains uncertain and while the Company cannot predict the duration or scale of the pandemic, it will continue to monitor the ongoing impacts and its effects on business, results of operations, and liquidity. The Company will continue to implement and adjust its procedures and processes as needed. For more information, refer to Risk Factors included in Item 1A of Part I in Valvoline’s Annual Report on Form 10-K for the fiscal year ended September 30, 2022.
SECOND FISCAL QUARTER 2023 OVERVIEW
The following were the significant events for the second fiscal quarter of 2023, each of which is discussed more fully in this Quarterly Report on Form 10-Q:
19
•
Valvoline reached the final milestone on the path to becoming a pure-play, automotive services company with closing the sale of its former Global Products reportable segment, resulting in net proceeds of $2.38 billion and the recognition of a pre-tax gain of $1.6 billion.
•
Valvoline’s net revenues grew 16% over the prior year period driven by system-wide same-store sales ("SSS") growth of 13.5% and the addition of 120 net new stores to the system from the prior year.
•
Net income from continuing operations grew 43% to $32.9 million and diluted earnings per share increased 46% to $0.19 in the three months ended March 31, 2023 compared to the prior year. This growth is attributable to strong gross profit expansion as well as lower net interest expense that included $8.3 million of income earned from investing the net proceeds from the sale of Global Products. These benefits were moderated by higher pension and other postretirement plan non-service expense.
•
Adjusted EBITDA increased 26% over the prior year period due to strong top-line growth driven by increased transactions and higher average ticket price from pricing actions and non-oil change service penetration. Additionally, benefits from improved cost efficiency were partially offset by growth investments in selling, general and administrative expenses.
•
The Company returned $170.0 million to its shareholders during the quarter through repurchases of 4.9 million shares of Valvoline common stock.
Use of Non-GAAP Measures
To aid in the understanding of Valvoline’s ongoing business performance, certain items within this document are presented on an adjusted, non-GAAP basis. These non-GAAP measures have limitations as analytical tools and should not be considered in isolation from, or as an alternative to, or more meaningful than, the financial statements presented in accordance with U.S. GAAP. The financial results presented in accordance with U.S. GAAP and reconciliations of non-GAAP measures included within this Quarterly Report on Form 10-Q should be carefully evaluated.
The following are the non-GAAP measures management has included and how management defines them:
•
EBITDA
-
net income/loss, plus income tax expense/benefit, net interest and other financing expenses, and depreciation and amortization;
•
Adjusted EBITDA
-
EBITDA adjusted for the impacts of certain unusual, infrequent or non-operational activity not directly attributable to the underlying business, which management believes impacts the comparability of operational results between periods ("key items," as further described below);
•
Free cash flow -
cash flows from operating activities less capital expenditures and certain other adjustments as applicable; and
•
Discretionary free cash flow
-
cash flows from operating activities less maintenance capital expenditures and certain other adjustments as applicable.
Non-GAAP measures include adjustments from results based on U.S. GAAP that management believes enables comparison of certain financial trends and results between periods and provides a useful supplemental presentation of Valvoline's operating performance that allows for transparency with respect to key metrics used by management in operating the business and measuring performance. The manner used to compute non-GAAP information used by management may differ from the methods used by other companies and may not be comparable. For a reconciliation of the most comparable U.S. GAAP measures to the non-GAAP measures, refer to the “Results of Operations” and “Financial Position, Liquidity and Capital Resources” sections below.
Management believes EBITDA measures provide a meaningful supplemental presentation of Valvoline’s operating performance between periods on a comparable basis due to the depreciable assets associated with the nature of the Company’s operations, as well as income tax and interest costs related to Valvoline’s tax and capital structures, respectively. Adjusted EBITDA measures enable comparison of financial trends and results between periods where certain items may not be reflective of the Company’s underlying and ongoing operations performance or vary independent of business performance.
20
Management uses free cash flow and discretionary free cash flow as additional non-GAAP metrics of cash flow generation. By including capital expenditures and certain other adjustments, as applicable, management is able to provide an indication of the ongoing cash being generated that is ultimately available for both debt and equity holders as well as other investment opportunities. Free cash flow includes the impact of capital expenditures, providing a supplemental view of cash generation. Discretionary free cash flow includes maintenance capital expenditures, which are routine uses of cash that are necessary to maintain the Company's operations and provides a supplemental view of cash flow generation to maintain operations before discretionary investments in growth. Free cash flow and discretionary free cash flow have certain limitations, including that they do not reflect adjustments for certain non-discretionary cash flows, such as mandatory debt repayments..
The non-GAAP measures used by management exclude key items. Key items are often related to legacy matters or market-driven events considered by management to not be reflective of the ongoing operating performance. Key items may consist of adjustments related to: legacy businesses, including the separation from Valvoline's former parent company, the former Global Products reportable segment, and associated impacts of related activity and indemnities; non-service pension and other postretirement plan activity; restructuring-related matters, including organizational restructuring plans, the separation of Valvoline’s businesses, significant acquisitions or divestitures, debt extinguishment and modification, and tax reform legislation; in addition to other matters that management considers non-operational, infrequent or unusual in nature.
Details with respect to the description and composition of key items recognized during the respective periods presented herein are set forth below in the “EBITDA and Adjusted EBITDA” section of “Results of Operations” that follows.
Key Business Measures
Valvoline tracks its operating performance and manages its business using certain key measures, including system-wide, company-operated and franchised store counts and SSS and system-wide store sales. Management believes these measures are useful to evaluating and understanding Valvoline’s operating performance and should be considered as supplements to, not substitutes for, Valvoline's net revenues and operating income, as determined in
accordance with U.S. GAAP.
Net revenues are influenced by the number of service center stores and the business performance of those stores. Stores are considered open upon acquisition or opening for business. Temporary store closings remain in the respective store counts with only permanent store closures reflected in the activity and end of period store counts. SSS is defined as net revenues by U.S. stores (company-operated, franchised and the combination of these for system-wide SSS), with new stores, including franchised conversions, excluded from the metric until the completion of their first full fiscal year in operation as this period is generally required for new store sales levels to begin to normalize.
Net revenues are limited to sales at company-operated stores, in addition to royalties and other fees from independent franchised and Express Care stores. Although Valvoline does not recognize store-level sales from franchised stores as net revenues in its Condensed Consolidated Statements of Comprehensive Income, management believes system-wide and franchised SSS comparisons, store counts, and total system-wide store sales are useful to assess market position relative to competitors and overall operating performance.
21
RESULTS OF OPERATIONS
The following summarizes the results of the Company’s continuing operations for the periods ended March 31:
| Three months ended March 31 | Six months ended March 31 | |||||||||||||||||||||||||||||||||||||||||||||||||
| 2023 | 2022 | 2023 | 2022 | |||||||||||||||||||||||||||||||||||||||||||||||
| (In millions) | Amount | % of Net revenues | Amount | % of Net revenues | Amount | % of Net revenues | Amount | % of Net revenues | ||||||||||||||||||||||||||||||||||||||||||
| Net revenues | $ | 344.5 | 100.0% | $ | 296.0 | 100.0% | $ | 677.3 | 100.0% | $ | 583.3 | 100.0% | ||||||||||||||||||||||||||||||||||||||
| Gross profit | $ | 126.7 | 36.8% | $ | 107.3 | 36.3% | $ | 245.5 | 36.2% | $ | 219.5 | 37.6% | ||||||||||||||||||||||||||||||||||||||
| Net operating expenses | $ | 65.5 | 19.0% | $ | 67.3 | 22.7% | $ | 155.0 | 22.9% | $ | 127.5 | 21.9% | ||||||||||||||||||||||||||||||||||||||
| Operating income | $ | 61.2 | 17.8% | $ | 40.0 | 13.5% | $ | 90.5 | 13.4% | $ | 92.0 | 15.8% | ||||||||||||||||||||||||||||||||||||||
| Income from continuing operations | $ | 32.9 | 9.6% | $ | 23.0 | 7.8% | $ | 59.9 | 8.8% | $ | 57.2 | 9.8% | ||||||||||||||||||||||||||||||||||||||
|
Three months ended
March 31 |
Six months ended
March 31 |
|||||||||||||||||||||||||
| 2023 | 2022 | 2022 | 2022 | |||||||||||||||||||||||
|
System-wide store sales - in millions
(a)
|
$ | 659.9 | $ | 557.0 | $ | 1,303.9 | $ | 1,107.9 | ||||||||||||||||||
|
Year-over-year growth
(a)
|
18.5 | % | 19.0 | % | 17.7 | % | 24.7 | % | ||||||||||||||||||
|
Same-store sales growth
(b)
|
||||||||||||||||||||||||||
| Company-operated | 14.2 | % | 10.0 | % | 13.5 | % | 15.7 | % | ||||||||||||||||||
|
Franchised
(a)
|
12.9 | % | 15.5 | % | 12.0 | % | 20.9 | % | ||||||||||||||||||
|
System-wide
(a)
|
13.5 | % | 13.1 | % | 12.7 | % | 18.6 | % | ||||||||||||||||||
| Number of stores at end of period | |||||||||||||||||||||||||||||||||||
|
Second Quarter
2023 |
First Quarter
2023 |
Fourth Quarter
2022 |
Third Quarter
2022 |
Second Quarter
2022 |
|||||||||||||||||||||||||||||||
| Company-operated | 832 | 813 | 790 | 772 | 757 | ||||||||||||||||||||||||||||||
|
Franchised
(a)
|
949 | 933 | 925 | 918 | 904 | ||||||||||||||||||||||||||||||
|
Total system-wide stores
(a)
|
1,781 | 1,746 | 1,715 | 1,690 | 1,661 | ||||||||||||||||||||||||||||||
| (a) | Measures include Valvoline franchisees, which are independent legal entities. Valvoline does not consolidate the results of operations of its franchisees. | ||||||||||||||||||||||||||||||||||
| (b) | Valvoline determines SSS growth as sales by U.S. stores, with new stores, including franchised conversions, excluded from the metric until the completion of their first full fiscal year in operation. | ||||||||||||||||||||||||||||||||||
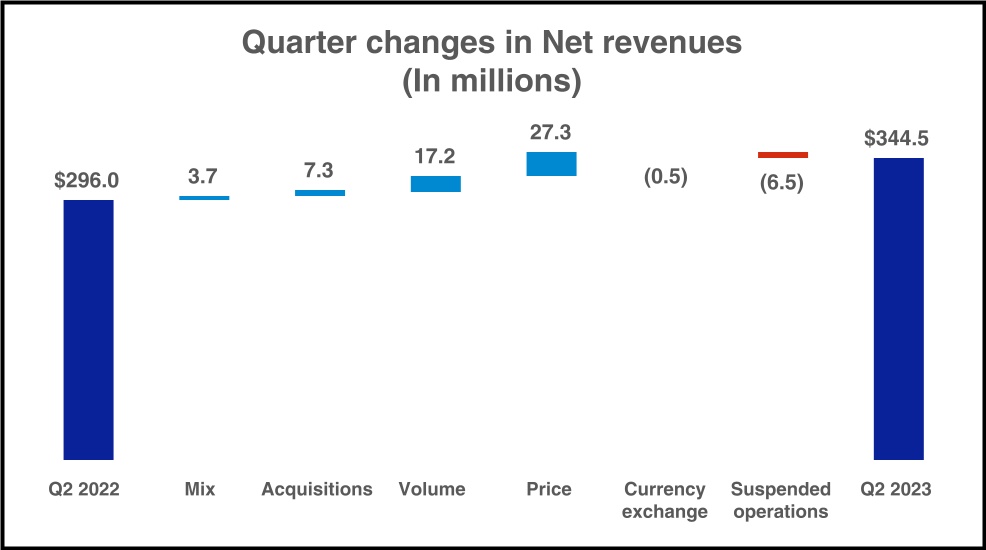
Net revenues
Net revenues increased $48.5 million, or 16% for the three months ended March 31, 2023 compared to the prior year period. System-wide SSS grew 13.5% over the prior year primarily from increased ticket as a result of pricing actions, continued non-oil change service penetration, and growth in transactions. Net revenue growth also benefited from the addition of 120 net new stores over the prior year, and these increases were partially offset by net revenues from suspended operations of $6.5 million that did not recur in the current year period. The following reconciles the year-over-year change in net revenues:
22
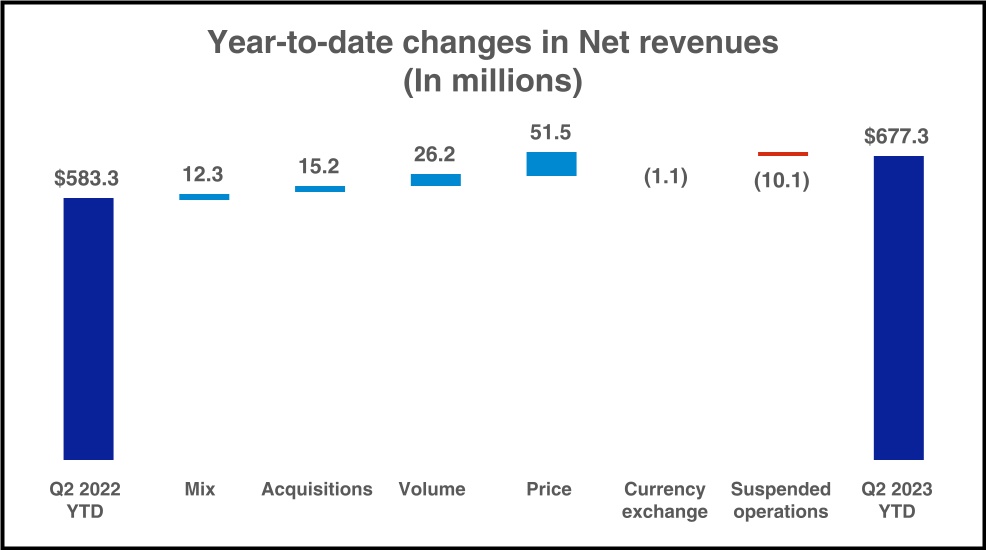
Net revenues increased $94.0 million, or 16%, for the six months ended March 31, 2023 over the prior year period due to system-wide SSS growth and acquisitions. System-wide SSS grew 12.7% compared to the prior year largely from increased average ticket as a result of pricing actions taken over the last year, increased non-oil change services and premiumization, in addition to continued gains in vehicles serviced. Partially offsetting these increases were $10.1 million of lower net revenues from operations suspended in the prior year of a former Global Products business that was not included in the sale. The following reconciles the year-over-year change in net revenues:
Gross profit
Gross profit increased $19.4 million, or 18%, for the three months ended March 31, 2023 compared to the prior year period driven by increased transactions and higher average ticket from pricing actions and non-oil change services, as well as unit growth. The following reconciles the year-over-year change in gross profit:
23
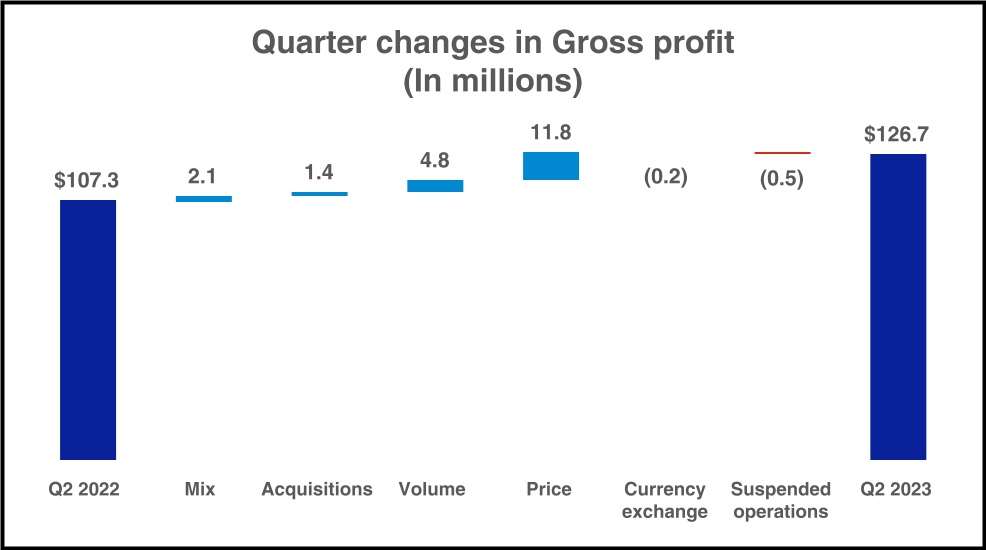
The improvement in gross profit margin in the three months ended March 31, 2023 compared to the prior year period was primarily due to labor cost deleverage.
Gross profit improved $26.0 million, or 12%, for the six months ended March 31, 2023 compared to the prior year period driven by increased average ticket from pricing actions as well as non-oil change services and premiumization. Additionally, higher transactions and unit growth from acquisitions provided benefits to gross profit. The following reconciles the year-over-year change in gross profit:
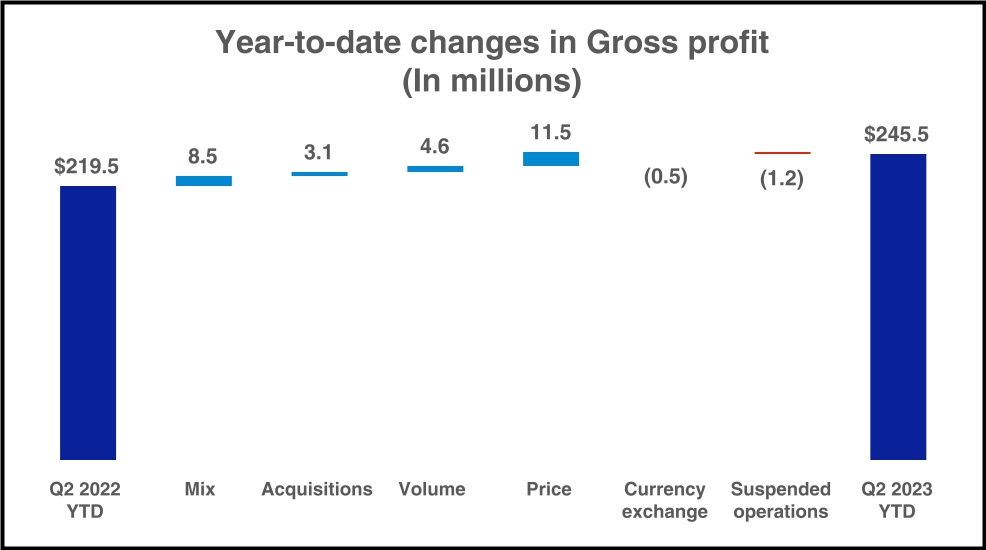
The decline in gross profit margin in the six months ended March 31, 2023 compared to the prior year period was primarily the result of the dilutive impact from passing through cost increases in company store operations pricing, in addition to increased labor and product expenses.
24
Net operating expenses
Details of the components of net operating expenses are summarized below for the periods ended March 31:
| Three months ended March 31 | Six months ended March 31 | |||||||||||||||||||||||||||||||||||||||||||||||||
| 2023 | 2022 | 2023 | 2022 | |||||||||||||||||||||||||||||||||||||||||||||||
| (In millions) | Amount | % of Net revenues | Amount | % of Net revenues | Amount | % of Net revenues | Amount | % of Net revenues | ||||||||||||||||||||||||||||||||||||||||||
| Selling, general and administrative expenses | $ | 62.6 | 18.2 | % | $ | 63.2 | 21.3 | % | $ | 128.6 | 19.0 | % | $ | 123.4 | 21.2 | % | ||||||||||||||||||||||||||||||||||
| Net legacy and separation-related expenses | 3.8 | 1.1 | % | 6.2 | 2.1 | % | 29.2 | 4.3 | % | 9.0 | 1.5 | % | ||||||||||||||||||||||||||||||||||||||
| Other income, net | (0.9) | (0.3) | % | (2.1) | (0.7) | % | (2.8) | (0.4) | % | (4.9) | (0.8) | % | ||||||||||||||||||||||||||||||||||||||
| Net operating expenses | $ | 65.5 | 19.0 | % | $ | 67.3 | 22.7 | % | $ | 155.0 | 22.9 | % | $ | 127.5 | 21.9 | % | ||||||||||||||||||||||||||||||||||
Selling, general and administrative (“SG&A”) expenses decreased $0.6 million and increased $5.2 million in the three and six months ended March 31, 2023, respectively, compared to the prior year periods. SG&A investments combined to increase expense by $4.7 million and $11.9 million in the three and six months ended March 31, 2023, respectively, and were primarily within advertising, talent and process improvements to support future growth. In the three months ended March 31, 2023, these investments were more than offset by declines in prior year expenses that did not recur to the same extent, while partially offsetting investments in the six months ended March 31, 2023. These prior year expenses included costs of $4.6 million, primarily expected credit losses, associated with suspended operations of the former Global Products business that was not included in the sale, in addition to $1.2 million and $1.9 million of lower costs in the three and six months ended March 31, 2023, respectively, associated with information technology investments and transitions. SG&A efficiency improved as expenses as a percentage of sales were lower compared to the prior year periods.
Net legacy and separation-related expenses decreased $2.4 million in the three months ended March 31, 2023 compared to the prior year period as the prior year expenses were largely comprised of advisory and consulting fees related to evaluating and planning for the separation of the Company’s two former reportable segments, where the current period expense was generally limited to costs associated with the modification of certain performance-based unvested stock awards for the continuing operation as a result of the completion of the Transaction. Net legacy and separation-related expenses increased $20.2 million in the six months ended March 31, 2023 compared to the prior year period primarily due to the increased indemnity obligation of $24.4 million as a result of the amendment of the Tax Matters Agreement and the Company’s expected utilization of certain legacy tax attributes, which are payable to Valvoline’s former parent company.
Other income, net decreased $1.2 million and $2.1 million in the three and six months ended March 31, 2023, respectively, compared to the prior year periods. Decreases in the three and six months ended March 31, 2023 were primarily related to increased expense associated with an investment impairment of $1.0 million. Additionally, an economic incentive realized in the prior year did not recur in the six months ended March 31, 2023.
Net pension and other postretirement plan expense (income)
Net pension and other postretirement plans had increased expense of $12.8 million and $25.8 million in the three and six months ended March 31, 2023, respectively, compared to the prior year periods. Higher interest costs more than offset recurring expected returns on plan assets which declined based on prior year asset returns and a lower risk asset mix.
Net interest and other financing expenses
Net interest and other financing expenses decreased $3.6 million and $1.9 million during the three and six months ended March 31, 2023, respectively, compared to the prior year periods. Higher outstanding borrowings in the first five months of the fiscal year were offset by increased interest income earned on the investment of net proceeds received from the sale of Global Products.
25
Income tax provision
The following table summarizes income tax provision and the effective tax rate:
| Three months ended March 31 | Six months ended March 31 | |||||||||||||||||||||||||
| (In millions) | 2023 | 2022 | 2023 | 2022 | ||||||||||||||||||||||
| Income tax expense (benefit) | $ | 11.4 | $ | 9.3 | $ | (8.7) | $ | 19.4 | ||||||||||||||||||
| Effective tax rate percentage | 25.7 | % | 28.8 | % | (17.0) | % | 25.3 | % | ||||||||||||||||||
The increase in income tax expense for the three months ended March 31, 2023 was principally driven by higher pre-tax earnings, while the reduction in the effective tax rate for this period was primarily attributed to unfavorable impacts in the prior year from the suspended operations of a former Global Products business. The favorable income tax provision and effective tax rate in the six months ended March 31, 2023 were primarily attributed to release of valuation allowances due to the change in expectations regarding the utilization of certain legacy tax attributes as described further below. The Company expects an estimated effective tax rate of approximately 25.5% to 26.5% in fiscal 2023, exclusive of discrete activity.
Legacy tax attributes
In connection with amending the Tax Matters Agreement, management expects the Company is currently more likely than not to realize certain legacy tax attributes that were transferred from its former parent prior to Valvoline's initial public offering in late fiscal 2016. As a result, the Company recognized an income tax benefit of $26.5 million during the six months ended March 31, 2023 in connection with releasing its valuation allowance. Additionally, Valvoline recognized $24.4 million of expense within Net legacy and separation-related expenses in the Condensed Consolidated Statement of Comprehensive Income during the six months ended March 31, 2023 to reflect its increased estimated indemnity obligation due to its former parent company as a result of the terms of the amended Tax Matters Agreement. Payments of the indemnity obligation are currently expected to begin in future periods of fiscal 2023 as management amends its related income tax returns and begins reflecting utilization of these legacy tax attributes.
Income from discontinued operations
The following summarizes Income from discontinued operations for the period ended March 31:
|
Three months ended
March 31 |
Six months ended
March 31 |
|||||||||||||||||||||||||
| (In millions) | 2023 | 2022 | 2023 | 2022 | ||||||||||||||||||||||
| Income from discontinued operations | $ | 1,194.4 | $ | 58.4 | $ | 1,249.3 | $ | 111.2 | ||||||||||||||||||
Income from discontinued operations increased $1.1 billion for both the three and six months ended March 31, 2023 compared to the prior year periods primarily due to the recognition of a gain on the sale of Global Products of $1.15 billion after taxes and transaction expenses. Increased income as a result of the gain on sale was partially offset by higher costs related to the separation and divestiture of $14.4 million and $20.6 million in the three and six months ended March 31, 2023, respectively.
26
Continuing operations EBITDA and Adjusted EBITDA
The following table reconciles Income from continuing operations to EBITDA and Adjusted EBITDA:
|
Three months ended
March 31 |
Six months ended
March 31 |
|||||||||||||||||||||||||
| (In millions) | 2023 | 2022 | 2023 | 2022 | ||||||||||||||||||||||
| Income from continuing operations | $ | 32.9 | $ | 23.0 | $ | 59.9 | $ | 57.2 | ||||||||||||||||||
| Income tax expense (benefit) | 11.4 | 9.3 | (8.7) | 19.4 | ||||||||||||||||||||||
| Net interest and other financing expenses | 13.3 | 16.9 | 32.0 | 33.9 | ||||||||||||||||||||||
| Depreciation and amortization | 20.6 | 17.6 | 39.1 | 34.5 | ||||||||||||||||||||||
|
EBITDA from continuing operations
(a)
|
78.2 | 66.8 | 122.3 | 145.0 | ||||||||||||||||||||||
|
Net pension and other postretirement plan expense (income)
(b)
|
3.6 | (9.2) | 7.3 | (18.5) | ||||||||||||||||||||||
|
Net legacy and separation-related expenses
(c)
|
3.8 | 6.2 | 29.2 | 9.0 | ||||||||||||||||||||||
|
Information technology transition costs
(d)
|
0.4 | 1.6 | 0.7 | 2.6 | ||||||||||||||||||||||
|
Suspended operations
(e)
|
0.1 | 4.0 | (0.1) | 3.7 | ||||||||||||||||||||||
|
Investment-related costs
(f)
|
1.0 | — | 1.0 | — | ||||||||||||||||||||||
|
Adjusted EBITDA from continuing operations
(a)
|
$ | 87.1 | $ | 69.4 | $ | 160.4 | $ | 141.8 | ||||||||||||||||||
| (a) | EBITDA from continuing operations is defined as income from continuing operations, plus Income tax expense (benefit), net interest and other financing expenses, and depreciation and amortization attributable to continuing operations. Adjusted EBITDA from continuing operations is EBITDA adjusted for key items attributable to continuing operations. | ||||
| (b) |
Includes several elements impacted by changes in plan assets and obligations that are primarily driven by the debt and equity markets, including remeasurement gains and losses, when applicable; and recurring non-service pension and other postretirement net periodic activity, which consists of interest cost, expected return on plan assets and amortization of prior service credits. Management considers that these elements are more reflective of changes in current conditions in global markets (in particular, interest rates), outside the operational performance of the business, and are also legacy amounts that are not directly related to the underlying business and do not have an impact on the compensation and benefits provided to eligible employees for current service. Refer to Note 7 in the Notes to Condensed Consolidated Financial Statements in Item 1 of Part I in this Quarterly Report on Form 10-Q for further details.
|
||||
| (c) |
Activity associated with legacy businesses and the separation from Valvoline’s former parent company and its former Global Products reportable segment. This activity includes the recognition of and adjustments to indemnity obligations to its former parent company; certain legal, financial, professional advisory and consulting fees; and other expenses incurred by the continuing operations in connection with and directly related to these separation transactions and legacy matters. This incremental activity directly attributable to legacy matters and separation transactions is not considered reflective of the underlying operating performance of the Company’s continuing operations. Of specific note, the Company recognized $24.4 million of pre-tax expense during the six months ended March 31, 2023 to reflect its increased estimated indemnity obligation, which also resulted in an income tax benefit of $26.5 million to reflect the release of valuation allowances in connection with the amendment of the Tax Matters Agreement with Valvoline’s former parent company.
|
||||
| (d) |
Consist of redundant expenses incurred from duplicative technology platforms required while implementing the Company’s stand-alone enterprise resource planning software system during fiscal 2023 and transitioning its data centers during fiscal 2022. These expenses are reflective of incremental costs directly associated with technology transitions and are not considered to be reflective of the ongoing expenses of operating the Company’s technology platforms.
|
||||
| (e) |
Represents the results of a former Global Products business where operations were suspended during fiscal 2022 that were not included in the sale. These results are not indicative of the operating performance of the Company’s ongoing continuing operations.
|
||||
| (f) |
Expense recognized to reduce the carrying value of an investment interest determined to be impaired. This cost is not considered to be reflective of the underlying performance of the Company’s ongoing continuing operations.
|
||||
Adjusted EBITDA from continuing operations increased $17.7 million for the three months ended March 31, 2023 and $18.6 million for the six months ended March 31, 2023 compared to the prior year periods driven by robust revenue growth due to increased transactions and higher average ticket from pricing actions and non-oil change service penetration, as well as unit growth. Additionally, gross profit benefits from improved cost efficiency were partially offset by increased SG&A investments to support future growth.
FINANCIAL POSITION, LIQUIDITY AND CAPITAL RESOURCES
Overview
The Company closely manages its liquidity and capital resources. Valvoline’s liquidity requirements depend on key variables, including the level of investment needed to support business strategies, the performance of the business,
27
capital expenditures, borrowing arrangements, and working capital management. Capital expenditures, acquisitions, share repurchases, and dividend payments are components of the Company’s cash flow and capital management strategy, which to a large extent, can be adjusted in response to economic and other changes in the business environment. The Company has a disciplined approach to capital allocation, which focuses on investing in key priorities that support Valvoline’s business and growth strategies and returning capital to shareholders, while funding ongoing operations.
Continuing operations cash flows
Valvoline’s continuing operations cash flows as reflected in the Condensed Consolidated Statements of Cash Flows are summarized as follows for the six months ended March 31:
| (In millions) | 2023 | 2022 | ||||||||||||
| Cash provided (used by): | ||||||||||||||
| Operating activities | $ | 173.5 | $ | 46.8 | ||||||||||
| Investing activities | $ | (96.3) | $ | (75.0) | ||||||||||
| Financing activities | $ | (279.4) | $ | (122.5) | ||||||||||
Operating activities
The increase in cash flows provided by operating activities of $126.7 million from the prior year was driven by higher cash earnings and favorable changes in net working capital, primarily the timing of establishing certain separation-related payables and accruals where payments are expected to be remitted and settled in future periods. These favorable changes were partially offset by increased interest and tax payments during the current year.
Investing activities
The increase in cash flows used in investing activities of $21.3 million from the prior year was principally related to higher capital expenditures of $21.7 million, driven by growth investments primarily related to new store construction, and lower repayments of franchisee loans receivable of $4.5 million. The combination of these changes increased cash flows used in investing activities and were partially offset by lower current year acquisition spend of $4.5 million.
Financing activities
The increase in cash flows used in financing activities of $156.9 million from the prior year was primarily due to returning $191.1 million more in cash to shareholders through increased share repurchases. This increased use of cash from prior year was partially offset by increased net proceeds from current year net borrowings of $11.9 million, which were used for general corporate purposes and funding working capital needs, in addition to lower dividends paid of $23.2 million.
Continuing operations free cash flow
The following sets forth free cash flow and discretionary free cash flow and reconciles cash flows from operating activities to both measures. These free cash flow measures have certain limitations, including that they do not reflect adjustments for certain non-discretionary cash flows, such as mandatory debt repayments. Refer to the “Use of Non-GAAP Measures” section included above in this Item 2 for additional information regarding these non-GAAP measures.
28
|
Six months ended
March 31 |
||||||||||||||
| (In millions) | 2023 | 2022 | ||||||||||||
| Cash flows provided by operating activities | $ | 173.5 | $ | 46.8 | ||||||||||
| Less: Maintenance capital expenditures | (9.7) | (8.3) | ||||||||||||
| Discretionary free cash flow | 163.8 | 38.5 | ||||||||||||
| Less: Growth capital expenditures | (69.7) | (49.4) | ||||||||||||
| Free cash flow | $ | 94.1 | $ | (10.9) | ||||||||||
The increase in free cash flow from continuing operations over the prior year was driven by higher cash flow provided by operating activities, partially offset by higher capital expenditures. Higher capital expenditures were primarily due to growth investments related to new store construction.
Discontinued operations cash flows
Valvoline has historically satisfied its short-term working capital and operational needs, in addition to indebtedness and other obligations, through the earnings, assets and cash flows generated by its consolidated operations. Following the Transaction, Valvoline will not be able to rely on the earnings, assets or cash flows that are attributable to the Global Products business. The cash flows of the discontinued operation are reflected in the Condensed Consolidated Statements of Cash Flows and are summarized below for the six months ended March 31:
| (In millions) | 2023 | 2022 | ||||||||||||
| Cash (used in) provided by: | ||||||||||||||
| Operating activities | $ | (63.4) | $ | 49.0 | ||||||||||
| Investing activities | $ | 2,623.2 | $ | (9.2) | ||||||||||
| Financing activities | $ | (108.1) | $ | (1.0) | ||||||||||
The decrease in operating cash flows provided by discontinued operations was largely due to the partial period of operational results in the current year prior to the sale of the Global Products business on March 1, 2023. Additionally, changes in net working capital during the pre-close period drove unfavorable operating cash flows primarily due to trade and other payables activity in the cost inflationary environment. The Company expects to remit payments relating to the current income taxes payable on the gain on sale of discontinued operations in the second half of fiscal 2023.
Cash flows provided by investing activities of discontinued operations were significantly higher in the current year period due to the cash consideration received, net of cash transferred to Global Products entities, at the close of the Transaction of $2.6 billion.
The increase in cash flows used in financing activities of discontinued operations was primarily due to higher net repayments on borrowings during the current period, driven by the extinguishment of the $175.0 million Trade Receivables Facility.
Debt
Inclusive of the interest rate swap agreements, approximately 92% of Valvoline's outstanding borrowings at March 31, 2023 had fixed interest rates, with the remainder bearing variable rates. As of March 31, 2023, Valvoline was in compliance with all covenants of its debt obligations and had borrowing capacity remaining of $471.2 million under its Revolver.
In December 2022, Valvoline amended the Senior Credit Agreement, which became effective upon the sale of Global Products on March 1, 2023. The Senior Credit Agreement provides for an aggregate principal amount of $950.0 million in senior secured credit facilities comprised of (i) a five-year $475.0 million term loan facility (the “Term Loan”) and (ii) a five-year $475.0 million revolving credit facility (the “Revolver”), including a $100.0 million letter of credit sublimit.
29
Refer to Note 5 of the Notes to Condensed Consolidated Financial Statements for additional details regarding the Company’s debt instruments.
Dividend payments and share repurchases
During the six months ended March 31, 2023, the Company paid cash dividends of $0.125 per common share for $21.8 million and repurchased 7.8 million shares of its common stock for $257.4 million. These repurchases utilized the $130.4 million that remained in aggregate share repurchase authority as of September 30, 2022 under the May 17, 2021 Board authorization to repurchase up to $300 million of common stock through September 30, 2024 (the “2021 Share Repurchase Authorization”), in addition to $127.0 million from the 2022 Share Repurchase Authorization. As of March 31, 2023, $1.473 billion remained available under the 2022 Share Repurchase Authorization.
From April 1, 2023 through May 5, 2023, the Company repurchased 2.9 million shares for an aggregate amount of $100.1 million, leaving $1.373 billion in aggregate share repurchase authority remaining under the 2022 Share Repurchase Authorization as of May 6, 2023.
The dividend and share repurchase authorization is part of a broader capital allocation framework to deliver value to shareholders by first driving growth in the business, organically and through acquisitions and franchise development, and then returning excess cash to shareholders through dividends and share repurchases. As focus further shifts to the growth of Valvoline in connection with the sale of Global Products, the Company discontinued its dividend after the first quarter of fiscal 2023 and will continue to return value to shareholders through share repurchases.
The Company anticipates repurchasing shares of its common stock up to the full amount of its remaining share repurchase authorization within the 18 months following the sale of Global Products. On May 10, 2023, Valvoline announced its intention to commence a modified “Dutch auction” tender offer for up to $1.0 billion in value of shares of its common stock, subject to market conditions, at a specified price range that is yet to be determined. The tender offer would utilize a substantial portion of the remaining 2022 Share Repurchase Authorization.
Summary
Valvoline’s continuing operations had cash and cash equivalents of $2.3 billion, total debt of $1.6 billion, and total remaining borrowing capacity of $471.2 million as of March 31, 2023. Valvoline’s ability to continue to generate positive cash flows from operations is dependent on general economic conditions, the competitive environment in the industry, and is subject to the business and other risk factors described in Item 1A of Part I of the Annual Report on Form 10-K for the fiscal year ended September 30, 2022.
Management believes that the Company has sufficient liquidity based on its current cash and cash equivalents position, cash generated from business operations, and existing financing to meet its required pension and other postretirement plan contributions, debt servicing obligations, tax-related and other material cash and operating requirements for the next twelve months.
NEW ACCOUNTING PRONOUNCEMENTS
For a discussion and analysis of recently issued accounting pronouncements and the impacts on Valvoline, refer to Note 1 in the Notes to Condensed Consolidated Financial Statements in Item 1 of Part I of this Quarterly Report on Form 10-Q.
CRITICAL ACCOUNTING ESTIMATES
The Company’s critical accounting estimates are described in Item 7 of Part II in Valvoline’s Annual Report on Form 10-K for the fiscal year ended September 30, 2022. Management reassessed the critical accounting estimates as disclosed in the Annual Report on Form 10-K, and except as disclosed below, determined there were no changes in the six months ended March 31, 2023.
Customer incentives
30
Valvoline records revenue for the amount that reflects the consideration the Company is expected to be entitled to based on when control of the promised good or service is transferred to the customer. The nature of Valvoline’s contracts with customers can give rise to variable consideration that decreases the transaction price and consists primarily of promotional rebates and customer pricing discounts based on achieving certain levels of purchasing activity. The costs and related reserves associated with these programs were predominantly attributed to the Global Products business. Due to the sale of Global Products on March 1, 2023, Valvoline no longer considers these customer incentive programs to be a critical accounting estimate to its remaining business.
ITEM 3. QUANTITATIVE AND QUALITATIVE DISCLOSURES ABOUT MARKET RISK
The Company’s market risks are discussed in Item 7A of Part II in Valvoline's Annual Report on Form 10-K for the fiscal year ended September 30, 2022. Management reassessed the quantitative and qualitative market risk disclosures as described in the Annual Report on Form 10-K and determined there were no material changes to market risks in the six months ended March 31, 2023.
ITEM 4. CONTROLS AND PROCEDURES
Disclosure Controls and Procedures
Valvoline’s Chief Executive Officer (“CEO”) and Chief Financial Officer (“CFO”), with the assistance of management, have evaluated the effectiveness of the Company’s disclosure controls and procedures (as defined in Rules 13a-15(e) and 15d-15(e) under the Securities Exchange Act of 1934, as amended (“Exchange Act”)), as of the end of the period covered by this Quarterly Report on Form 10-Q (the “Evaluation Date”), and based upon such evaluation, have concluded that as of the Evaluation Date, the Company’s disclosure controls and procedures were effective. These controls are designed to ensure that information required to be disclosed in the reports that are filed or submitted under the Exchange Act is recorded, processed, summarized, and reported within the time periods specified in the rules and forms of the Securities and Exchange Commission, and that such information is accumulated and communicated to Valvoline’s management, including the CEO and CFO, to allow timely decisions regarding required disclosure.
Changes in Internal Control
Following the completion of the Transaction, Valvoline and Global Products began providing each other information technology and support services under the terms of a transition services agreement. Management has established controls to mitigate risks related to unauthorized access to Company data and to establish oversight of transition services received.
There were no other significant changes in Valvoline’s internal control over financial reporting that occurred during the fiscal quarter ended March 31, 2023 that materially affected, or are reasonably likely to materially affect, Valvoline’s internal control over financial reporting.
31
PART II - OTHER INFORMATION
ITEM 1. LEGAL PROCEEDINGS
From time to time, Valvoline is party to lawsuits, claims and other legal proceedings that arise in the ordinary course of business. For a description of Valvoline's legal proceedings, refer to Note 8 of the Notes to Condensed Consolidated Financial Statements included in Item 1 of Part I of this Quarterly Report on Form 10-Q.
ITEM 1A. RISK FACTORS
Information about the Company’s risk factors is contained in Item 1A of Part I in Valvoline’s Annual Report on Form 10-K for the fiscal year ended September 30, 2022. Except for the addition of the risk factor set forth below, there have been no material changes to the Company’s risk factors previously disclosed.
Adverse developments and instability in financial institutions and markets may adversely impact Valvoline’s business and financial condition.
The global macroeconomic environment could be negatively affected by, among other things, disruptions to the banking system and financial market volatility resulting from recent bank failures and actions to reduce inflation. The Company utilizes and typically maintains material balances of cash and cash equivalents and is therefore reliant on banks and financial institutions to safeguard and allow ready access to these assets. Specifically, as a result of the receipt of net proceeds in connection with the sale of Global Products, the Company has in excess of $2.3 billion in cash and cash equivalents as of March 31, 2023 held by various financial institutions, the majority of which is held in U.S. government money market funds.
The failure of a bank, or other adverse conditions in the financial markets, impacting the institutions or counterparties with which the Company, or its customers or vendors, maintain deposits or financing activities, could impact Valvoline’s timely access to liquid assets or its financial performance. There are no assurances or guarantees that deposits greater than the
Federal Deposit Insurance Corporation
limits will be protected by the U.S. government or that any bank, government or financial institution will be able to obtain the needed liquidity in the event of a failure or similar crisis. If financial institutions are unable to provide timely access to deposits and funds, the Company may be required to seek additional financing. As a result of uncertainty in the broader financial markets, there may be additional impacts to Valvoline’s business that cannot be predicted at this time.
ITEM 2. UNREGISTERED SALES OF EQUITY SECURITIES AND USE OF PROCEEDS
The Company repurchased 4.9 million
shares of its common stock during the three months ended March 31, 2023, utilizing the $43.0 million remaining under the 2021 Share Repurchase Authorization and $127.0 million under the 2022 Share Repurchase Authorization.
Repurchases of the Company’s common stock during the three months ended March 31, 2023 were:
32
| Monthly period | Total number of shares purchased | Average price paid per share | Total number of shares purchased as part of publicly announced plans or programs |
Dollar value of shares that may yet be purchased
under the plans or programs (in millions) |
||||||||||
| January 1, 2023 - January 31, 2023 | 1,582,367 | $ | 34.69 | 1,582,367 | $ | 1,588.1 | ||||||||
| February 1, 2023 - February 28, 2023 | 1,475,385 | $ | 35.26 | 1,475,385 | $ | 1,536.0 | ||||||||
| March 1, 2023 - March 31, 2023 | 1,828,929 | $ | 34.46 | 1,828,929 | $ | 1,473.0 | ||||||||
| Total | 4,886,681 | $ | 34.78 | 4,886,681 | ||||||||||
33
ITEM 6. EXHIBITS
| 31.1* | |||||
| 31.2* | |||||
| 32** | |||||
| 10.1* | |||||
| 10.2* | |||||
| 101.INS | XBRL Instance Document - the instance document does not appear in the Interactive Data File because its XBRL tags are embedded within the Inline XBRL document. | ||||
| 101.SCH | XBRL Taxonomy Extension Schema Document. | ||||
| 101.CAL | XBRL Taxonomy Extension Calculation Linkbase Document. | ||||
| 101.DEF | XBRL Taxonomy Extension Definition Linkbase Document. | ||||
| 101.LAB | XBRL Taxonomy Extension Label Linkbase Document. | ||||
| 101.PRE | XBRL Taxonomy Extension Presentation Linkbase Document. | ||||
| 104 |
Cover
Page Interactive Data File (formatted as inline XBRL and contained in Exhibit 101).
|
||||
* Filed herewith.
** Furnished herewith.
™ Trademark, Valvoline or its subsidiaries, registered in various countries.
SM
Service mark, Valvoline or its subsidiaries, registered in various countries.
34
SIGNATURE
Pursuant to the requirements of the Securities Exchange Act of 1934, the Registrant has duly caused this report to be signed on its behalf by the undersigned thereunto duly authorized.
| VALVOLINE INC. | ||||||||
| (Registrant) | ||||||||
| May 10, 2023 | By: | /s/ Mary E. Meixelsperger | ||||||
| Mary E. Meixelsperger | ||||||||
| Chief Financial Officer | ||||||||
35
TABLE OF CONTENTS
Part I - Financial InformationItem 1. Financial StatementsNote 1 Basis Of Presentation and Significant Accounting PoliciesNote 2 - Discontinued OperationsNote 3 - Fair Value MeasurementsNote 4 - Business CombinationsNote 5 - DebtNote 6 Income TaxesNote 7 Employee Benefit PlansNote 8 Litigation, Claims and ContingenciesNote 9 - Earnings Per ShareNote 10 - Supplemental Financial InformationNote 11 Subsequent EventsItem 2. Management S Discussion and Analysis Of Financial Condition and Results Of OperationsItem 3. Quantitative and Qualitative Disclosures About Market RiskItem 4. Controls and ProceduresPart II - Other InformationItem 1. Legal ProceedingsItem 1A. Risk FactorsItem 2. Unregistered Sales Of Equity Securities and Use Of ProceedsItem 6. Exhibits