V2X, INC.
10-Ks and 10-Qs
|
|
|
|
|
|
|
|
|
|
|
|
|
|
|
|
|
|
|
|
|
|
|
|
|
|
|
|
|
|
|
|
|
|
|
|
|
|
|
|
|
UNITED STATES SECURITIES AND EXCHANGE COMMISSION
Washington, D.C. 20549
Form 10-K
(Mark One)
þ
ANNUAL REPORT PURSUANT TO SECTION 13 OR 15(d) OF THE SECURITIES EXCHANGE ACT OF 1934
For the fiscal year ended
December 31, 2014
or
¨
TRANSITION REPORT PURSUANT TO SECTION 13 OR 15(d) OF THE SECURITIES EXCHANGE ACT OF 1934
For the transition period from to
Commission File Number: 001-36341
Vectrus, Inc.
(Exact name of registrant as specified in its charter)
|
Indiana
|
|
38-3924636
|
|
(State or other jurisdiction of incorporation or organization)
|
(I.R.S. Employer Identification No.)
|
|
|
655 Space Center Drive, Colorado Springs, Colorado 80915
|
||
|
(Address of Principal Executive Offices)
|
||
|
Registrant’s telephone number, including area code:
|
||
|
(719) 591-3600
|
||
SECURITIES REGISTERED PURSUANT TO SECTION 12(b) OF THE ACT:
|
Title of Each Class
|
Name of Exchange on Which Registered
|
|
|
Common Stock, Par Value $.01 Per Share
|
New York Stock Exchange
|
|
SECURITIES REGISTERED PURSUANT TO SECTION 12(g) OF THE ACT: NONE
Indicate by check mark if the registrant is a well-known seasoned issuer, as defined in Rule 405 of the Securities Act. Yes
¨
No
þ
Indicate by check mark if the registrant is not required to file reports pursuant to Section 13 or Section 15(d) of the Act. Yes
¨
No
þ
Indicate by check mark whether the registrant (1) has filed all reports required to be filed by Section 13 or 15(d) of the Securities Exchange Act of 1934 during the preceding 12 months or for such shorter period that the registrant was required to file such reports) and (2) has been subject to such filing requirements for the past 90 days. Yes
þ
No
¨
Indicate by check mark whether the registrant has submitted electronically and posted on its corporate Web site, if any, every Interactive Data File required to be submitted and posted pursuant to Rule 405 of Regulation S-T (§232.405 of this chapter) during the preceding 12 months (or for such shorter period that the registrant was required to submit and post such files). Yes
þ
No
¨
Indicate by check mark if disclosure of delinquent filers pursuant to Item 405 of Regulation S-K is not contained herein, and will not be contained, to the best of registrant’s knowledge, in definitive proxy or information statements incorporated by reference in Part III of this Form 10-K or any amendment to this Form 10-K.
þ
Indicate by check mark whether the registrant is a large accelerated filer, an accelerated filer, a non-accelerated filer, or a smaller reporting company. See the definitions of “large accelerated filer,” “accelerated filer” and “smaller reporting company” in Rule 12b-2 of the Exchange Act. (Check one):
|
Large accelerated filer
¨
|
Accelerated filer
¨
|
Non-accelerated filer
þ
|
Smaller reporting company
¨
|
|
|
(Do not check if a smaller reporting company)
|
||||
Indicate by check mark whether the registrant is a shell company (as defined in Rule 12b-2 of the Exchange act). Yes
¨
No
þ
On the last business day of the Registrant’s most recently completed second fiscal quarter the registrant was a wholly owned subsidiary of Exelis Inc., and on that date none of the Registrant’s common stock was held by non-affiliates.
As of
March 11, 2015
there were 10,528,031 shares of common stock ($0.01 par value per share) outstanding.
DOCUMENTS INCORPORATED BY REFERENCE
Portions of the Registrant's definitive Proxy Statement to be filed with the Securities and Exchange Commission pursuant to Regulation 14A relating to the Registrant's Annual Meeting of Shareholders, to be held on May 15, 2015 will be incorporated by reference in this Form 10-K in response to Items 10,11,12,13 and 14 of Part III.
VECTRUS, INC.
INDEX TO ANNUAL REPORT ON FORM 10-K
TABLE OF CONTENTS
|
|
|
|
Page No.
|
|
|
|
|
|
|
Item 1.
|
|
||
|
Item 1A.
|
|
||
|
Item 1B.
|
|
||
|
Item 2.
|
|
||
|
Item 3.
|
|
||
|
Item 4.
|
|
||
|
|
|
|
|
|
Item 5.
|
|
||
|
Item 6.
|
|
||
|
Item 7.
|
|
||
|
Item 7A.
|
|
||
|
Item 8.
|
|
||
|
Item 9.
|
|
||
|
Item 9A.
|
|
||
|
Item 9B.
|
|
||
|
|
|
|
|
|
Item 10.
|
|
||
|
Item 11.
|
|
||
|
Item 12.
|
|
||
|
Item 13.
|
|
||
|
Item 14.
|
|
||
|
|
|
|
|
|
Item 15.
|
|
||
|
|
|
||
|
|
|
||
ITEM 1.
DESCRIPTION OF BUSINESS
Overview
Vectrus is a leading provider of services to the United States (U.S.) government worldwide. We operate in a single segment and offer services in three major capability areas: infrastructure asset management, logistics and supply chain management and information technology and network communication. Our infrastructure asset management services support the U.S. Army, Air Force and Navy and include infrastructure services, security, warehouse management and distribution, ammunition management, civil engineering, military base maintenance and operations, communications, emergency services, transportation, and life support activities at a number of critical global military installations. Our logistics and supply chain management services support and maintain the vehicle and equipment stocks of the U.S. Army and Marine Corps. Our information technology and network communication services consist of sustainment of communications systems, network security, systems installation and full life cycle management of information technology systems for the U.S. Army, Air Force and Navy.
Our primary customer is the U.S. Department of Defense (DoD) with a high concentration in the U.S. Army. For the year ended
December 31, 2014
, we had revenue of
$1.2 billion
, all of which was derived from U.S. government customers.
We employ approximately
5,000
people and engage more than
6,000
subcontractor personnel around the world. This includes an experienced management team with an average of
29
years of experience in the military, industry, and a wide range of U.S. government entities. Our management team has a proven track record of winning new contracts, driving premier operating efficiency, and managing all aspects of the demanding compliance culture required to do business with the U.S. government in the United States and abroad. We are also a leading employer of veterans with more than
30%
of our employees reporting a military background, and we have been recognized a number of times in recent years by veteran-focused organizations as a military-friendly employer.
We have a proven history of deploying resources rapidly and with precision to support the mission success of our customers. Leveraging a history of more than
50
years, we provide global service solutions in
85
locations and
15
countries across
three
continents in both stable and unstable political and economic environments.
Separation from Exelis Inc.
On September 27, 2014, Exelis Inc. (Exelis) completed the Spin-off (the Spin-off) of Vectrus, Inc. (Vectrus, the Company, our company, we, us and our), formerly Exelis' Mission Systems business, which was part of Exelis' Information and Technical Services segment.
Prior to the Spin-off, we were a subsidiary of Exelis. The financial information included herein for periods prior to the Spin-off may not necessarily reflect our financial position, results of operations and cash flows in the future or what our financial position, results of operations and cash flows would have been had we been an independent, publicly traded company during the periods presented that occurred prior to the Spin-off. We have incurred and are incurring additional costs to be able to function as an independent, publicly traded company, including additional costs related to corporate finance, governance and public reporting.
4
Our Business Strategy
By delivering value to our customers through exceptional performance and cost efficiencies, we believe we are positioned to continue to drive earnings and cash flow, and create value for our shareholders. Key components of our business strategy include:
|
•
|
Expand Our Geographic Footprint.
The drawdown of U.S. Forces from Afghanistan has resulted and will continue to result in the further contraction of certain of our programs. Our business development resources are focused on opportunities in international regions and the U.S. We believe our ability to ramp up quickly, and then sustain a qualified workforce on large, complex programs will continue to be a differentiator for our company. This capability enables us to win contracts from existing and new customers, and we expect will enhance our market leadership position.
|
|
•
|
Broaden Our Customer Base.
We are leveraging our leadership position in the Middle East with the U.S. Army to provide our full range of offerings to other U.S. government military and civil agencies in the United States and worldwide. We believe our core strengths of program performance and operational excellence, and our focus on the needs and missions of our customers, have allowed us to thrive with current customers and have translated to growth with closely related new U.S. government customers.
|
|
•
|
Capitalize on Essential Infrastructure Asset Management and Sustainment Services.
We intend to continue to provide services to the U.S. government in light of its reliance on civilian contractors and its significant expenditures on the types of services we provide. The requirements we fill are essential to the basic operation of the mission of our customers. We will pursue opportunities that provide mission critical and enduring services, such as information technology support, rather than only optional upgrades or replacements.
|
|
•
|
Extend, Deepen and Enhance Our Technical Capabilities.
We expect to internally invest in our own capabilities as well as evaluate and pursue acquisitions on a strategic basis, with a view to adding capabilities that allow us to deliver an even higher value added and differentiated service.
|
Our Business
We focus on service offerings in three major capabilities in support of the U.S. government; infrastructure asset management, logistics and supply chain management, and information technology and network communication services. Our primary geographic areas of operation include the Middle East, Asia, Europe, the Caribbean, and the United States.
Infrastructure Asset Management
The infrastructure asset management services competency supports the U.S. Army, Air Force and Navy with enduring technical services. For the year ended
December 31, 2014
, contracts within the infrastructure asset management services had revenue of
$778.8 million
.
Our infrastructure asset management capabilities consist of:
|
•
|
Infrastructure Operations and Maintenance (O&M) Services: These services include technical and trades competencies in both the continental United States (CONUS) and outside continental United States (OCONUS), including contingency environments. Services also include curriculum and training program development in multiple languages to impart required skills to the local work force in accordance with western technical and Occupational Safety and Health Administration standards.
|
|
•
|
Security: These services include static and mobile security including entry and exit points to U.S. and or coalition bases; installation security; residential security; personal security detachment (PSD) operations in contingency environments; and management of biometric screening, interviews, and security badging.
|
|
•
|
Warehouse Management and Distribution: These services include warehousing operations; inventory control and supply support activity operations; container and cargo management and tracking; and material and vertical handling equipment.
|
5
|
•
|
Ammunition Management: These services include inventory control, accountability and shelf-life management of all ammunition classes including ground and aviation ammunition; and ammunition supply point operations and security.
|
|
•
|
Air Base Maintenance and Operations: These services include flight line operations and scheduling; runway maintenance and sweeping; base support facilities operations and maintenance services; and ramp and cargo operations.
|
|
•
|
Communications: These services include classified and unclassified email, voice, Voice Over Internet Protocol services, video teleconferencing, help desk operations, data and information management and analysis, and electronic repair.
|
|
•
|
Emergency Services: These services include U.S. and overseas military installation fire, medical and emergency services operations and inspections.
|
|
•
|
Transportation: These services include personnel and all classes of supply; shuttle bus services; operational movement of personnel and household goods and supplies; and movement control including passenger terminal support, aerial port and arrival/departure airfield control group.
|
|
•
|
Life Support Activities: These services include mail and postal operations, housing management, morale, welfare, recreation services, food services and medical clinic operations.
|
Infrastructure Asset Management Key Contracts:
|
•
|
Afghanistan National Security Forces. We operate two contracts with the U.S. Army Corps of Engineers that provide O&M and training services to the Afghanistan National Police, Army and personnel country-wide. We operate and maintain critical infrastructure including power plant production, waste water treatment and potable water supply at multiple sites. Supporting tasks include procurement, stocking and warehousing of parts and materials; work order management; and training of Afghanistan public works employees in skills applicable to various trades to ultimately operate and maintain the extensive infrastructure constructed by the U.S. government.
|
|
•
|
Kuwait Base Operations and Security Support Services. Our largest base operations support services contract is for Camp Arifjan, Kuwait, one of the largest logistics bases in the U.S. Military, and involves more than 22 diverse functional support areas in multiple locations, ranging from medical services, postal and maintenance, to public works, transportation and emergency services.
|
|
•
|
Maxwell Air Force Base Operations Support (Montgomery, Alabama). We operate and maintain the key facilities at the Air University, which provides the full spectrum of Air Force education, from pre-commissioning to the highest levels of professional military education such as the Air War College. We perform facility maintenance, air base and equipment maintenance, communication architecture support and minor construction.
|
|
•
|
Kaiserslautern Facilities Engineering Services (Germany). We have provided facility engineering services for the Kaiserslautern Military Community for over 30 continuous years. Work consists of maintenance and repair of installed building equipment, utility services, construction, and a number of ancillary support functions.
|
Logistics and Supply Chain Management
Logistics and supply chain management qualifications at Vectrus are deep and serve some of DoD's most important and complex missions. We have supported the DoD in both domestic and international environments, geographically ranging from the continental United States to the Middle East and Southwest Asia. The equipment stocks we maintain and repair number in the thousands, and are as diverse as fork lifts, night vision goggles, weapons, and combat vehicles. For the year ended
December 31, 2014
, contracts within the logistics and supply chain management services had revenue of
$234.6 million
.
6
Our logistics and supply chain management capabilities consist of:
|
•
|
Equipment Maintenance, Repair and Services: These services include maintaining the Army’s vehicle and supporting equipment stocks, ranging from mine resistant armor protected vehicles to radios, generator sets and weapons. We have a record of innovation and new service development, using Lean Six Sigma capabilities to devise optimal methods to perform maintenance and repair on war-damaged vehicles.
|
|
•
|
Care of Supplies in Storage: These services include warehousing, inspecting, servicing and maintaining large equipment sets in storage.
|
|
•
|
Warehouse Management and Distribution: These services include maintaining, issuing and shipping military supplies for contingency and humanitarian missions.
|
|
•
|
Supply Point Distribution: These services include the maintenance, storage and distribution of various commodities such as ammunition, retail fuel, lubricants and repair parts.
|
|
•
|
Transportation Support: These services include support for military units movements by both air and rail, containerized movement of equipment and supplies, personal property shipments and motor pool operations.
|
Logistics and Supply Chain Management Key Contracts:
|
•
|
Army Pre-Positioned Stocks 5 (APS-5) Kuwait. Our company supports the Army’s largest pre-positioned stocks stored and maintained in Kuwait. We receive, harvest from theatre, retrograde, inspect, repair, service, stock, and inventory a wide range of equipment. Additionally, we perform the task of warehousing for large and complex equipment sets. We also maintain, issue and ship military supplies to provide worldwide support to humanitarian and contingency mission efforts as required.
|
|
•
|
Fort Rucker Logistics Support Services (Alabama). We provide multifaceted logistic services in support of the Logistics Readiness Center (LRC) for all ground equipment and soldiers on Fort Rucker and Eglin Air Force Bases. Work under this contract includes maintenance of communication and electronic equipment, vehicles and equipment, and weapons; supply functions for receipt and issue, fuel and ammunition; and transportation.
|
|
•
|
Marine Corps Logistics Support Services. We provide support to the Marine Corps in the areas of distribution, supply chain, and storage services in support of Marine Corps and Navy operations from the Middle East, throughout the United States and the Pacific Rim. This includes logistics planning and the asset visibility system supporting the Marine Corps Logistics Command in the U.S. Central Command, U.S. Pacific Command and other DoD and non-DoD agencies.
|
Information Technology and Network Communication Services
Since 1965, we have provided information technology and Command, Control, Communications and Computer (C4) support services for the U.S. government's worldwide communications and network systems. The support ranges from legacy World War II era and emerging communications systems in Europe to dynamic state-of-the-art communications systems in remote and hostile locations like Iraq and Afghanistan. We have demonstrated our capacity to effectively operate, maintain, supply, staff, sustain and modernize a wide array of information technology and communications systems. Our information technology and network communication work is performed in Europe, the Middle East, Asia, throughout the United States, and at sea. To support high standards and performance excellence in this area, our company applies the principles of Information Technology Infrastructure Library (ITIL) and is certified to the ISO 9001, ISO 20000 and Capability Maturity Model Integration (CMMI) level III standards and maintains important information assurance, network protection, project management and design credentials for operating in this business sector. For the year ended
December 31, 2014
, contracts within the information technology and network communication services had revenue of
$189.9 million
.
7
Our information technology and network communication capabilities consist of:
|
•
|
Communications: These services include complete 24/7/365 communications systems O&M including systems administration, network administration, O&M of technical control facilities, secure and non-secure telephone switch operations, Voice Over Internet Protocol, multi-media networks, cabling and distribution infrastructure and video information systems. Our support also includes contingency and backup site operations.
|
|
•
|
Management and Service Support: These services include full life cycle management and service delivery support functions including preventative maintenance scheduling, material supply control functions, help desk support, training, electronic repair, logistics trend analysis, configuration control, project support agreements, technical reports, parts lists, site survey reports, systems as-built documentation and computer-aided design and drafting.
|
|
•
|
Network and Cyber Security: These services include network cyber center operations, information assurance and data and information management and analysis.
|
|
•
|
Systems Installation and Activation: These services include engineering and technical support to identify and define systems requirements, determine capabilities and delineate and define interfaces, protocols, required upgrades, installation/de-installation, testing, integration, modification, documentation, troubleshooting and training pertaining to information technology and C4 systems.
|
|
•
|
Quality control functions for all operations.
|
Information Technology and Network Communication Services Key Contracts:
|
•
|
Operations, Maintenance and Defense of Army Communications in Southwest Asia and Central Asia (OMDAC-SWACA). This contract is for the operation and maintenance of the Army’s largest communications network from locations in the Middle East and Central Asia. Technical support activities include satellite communications, earth station terminals, microwave link O&M, fiber and wire communications, local area network administration, wide area network administration, technical control facilities, defense messaging systems, defense cyber-center operations, cable television, and other contingency requirements for the warfighter.
|
|
•
|
Fleet Systems Engineering Team (FSET). We provide on-site technical and end-to-end systems engineering support for command, control, communications, computer and intelligence (C4I) systems for the U.S. Navy. FSET assures effective operations for all afloat and ashore C4I systems throughout the deployment cycle and provides systems engineering and technical support for rapid introduction of new capabilities into the fleet. Our engineers conduct on-site troubleshooting and maintenance assistance for problems that cross multiple C4I systems, provide over-the-shoulder training on C4I systems, and technical processes crossing multiple C4I systems.
|
|
•
|
U.S. Army Corps of Engineer (USACE) Enterprise Information Management and Information Technology Support Services (ACE-IT). We provide information management, information technology and cyber support services to more than 37,000 USACE customers throughout the United States, including USACE headquarters in Washington D.C.; nine separate Engineer divisions, 44 Engineer districts -- and their associated field and area project offices. The Engineer support effort also includes rapid response and flexible support for emergency operations.
|
8
Customers
We attribute the strength of our relationship with the DoD and other branches of the U.S. government to our focus on program performance, global responsiveness and operational excellence, as well as our core values of integrity, respect and responsibility. Our primary customer is the DoD. Our revenue from the U.S. government for the periods presented below was as follows:
|
|
|
Year Ending December 31,
|
||||||||||
|
(In thousands)
|
|
2014
|
|
2013
|
|
2012
|
||||||
|
DoD
|
|
$
|
1,172,018
|
|
$
|
1,473,830
|
|
$
|
1,790,020
|
|
||
|
Other U.S. government¹
|
|
31,251
|
|
37,808
|
|
38,344
|
|
|||||
|
Total Revenue
|
|
$
|
1,203,269
|
|
$
|
1,511,638
|
|
$
|
1,828,364
|
|
||
|
¹ Tethered Aerostat Radar System (TARS) program, which was retained by Exelis
|
||||||||||||
Revenue by military branch for the years ending December 31, 2014, 2013 and 2012 was as follows:
|
Year Ending December 31,
|
||||||||||||
|
(In thousands)
|
2014
|
2013
|
2012
|
|||||||||
|
Army
|
$
|
1,054,408
|
|
$
|
1,391,402
|
|
$
|
1,698,714
|
|
|||
|
Navy
|
26,163
|
|
3,333
|
|
3,267
|
|
||||||
|
Air Force
|
87,799
|
|
78,669
|
|
88,039
|
|
||||||
|
Marines
|
3,648
|
|
426
|
|
—
|
|
||||||
|
Other U.S Government¹
|
31,251
|
|
37,808
|
|
38,344
|
|
||||||
|
Total Revenue
|
$
|
1,203,269
|
|
$
|
1,511,638
|
|
$
|
1,828,364
|
|
|||
|
¹ TARS program, which was retained by Exelis
|
||||||||||||
Competition
Our competition aligns with our three core capabilities: infrastructure asset management, logistics and supply chain management and information technology and network communication services. In the infrastructure asset management services sector, our primary competitors are PAE Facilities Management, Delta Tucker Holdings, Inc. (Dyncorp), KBR Inc., and Fluor Corporation. Our logistics and supply chain management area competitors include Dyncorp and AECOM. Our principal competitors in the information technology and network communication sector include a division of Lockheed Martin Corporation, Harris Corporation, Science Application International Corporation, and Computer Sciences Corporation.
In recent periods, the U.S. government has restricted certain work performed in the United States to small businesses, including the Alaska native companies from time to time. We participate as a subcontractor for select opportunities, as appropriate.
Competitive bids for the work that Vectrus pursues are based on technical qualifications and corporate experience in performing contracts of similar size and scope, and are highly price sensitive. While not every contract is procured via selection of the lowest priced bidder, customers are sensitive to cost based on their budget allocations. Acquisition cycles are long (generally 12 to 24 months) and contracts are enduring as they typically have a five-year performance cycle, with some extending to ten years.
U.S. government customers have shown a strong preference for multiple award indefinite delivery, indefinite quantity (IDIQ) contracts. These contracts offer awards to a large pool of contractors, followed by competition within the pool for individual programs via task orders under each IDIQ over the period of performance. Period of performance under IDIQ contracts follows a traditional five-year performance cycle. The governing IDIQ contracts often have multi-billion dollar ceiling values.
There are typically fewer competitors in the overseas market for each of our core capabilities. We believe that primary strength of our company is its expeditionary nature that is grounded in our ability to recruit U.S. and
9
international personnel with appropriate expertise, as well as navigate the logistical, legal, and other challenges of operating in multiple, challenging overseas locations.
We also believe that our company’s success in gaining market share is founded in exceptional performance of current contracts, which is required as references for future work. Our company closely monitors overhead to foster highly competitive pricing and uses an in-house business development model both to manage the cost of revenue and to identify advantages for future bids.
Seasonality
We do not consider any material portion of our business to be seasonal. Various factors can affect the distribution of our sales between accounting periods, including the timing of award, the availability of customer funding, product deliveries and customer acceptance.
Regulatory Environment
The U.S. government markets in which we serve are highly regulated. We market our services to the DoD and equivalent foreign agencies, National Aeronautics and Space Administration (NASA), and intelligence and other civilian agencies. When working with U.S. agencies and entities, we comply with laws and regulations relating to the creation, administration and performance of contracts. Among other things, these laws and regulations:
|
•
|
Require compliance with government standards for contract administration, accounting and management internal control systems;
|
|
•
|
Define allowable and unallowable costs and otherwise govern our right to reimbursement under various flexibly priced U.S. government contracts;
|
|
•
|
Require certification and disclosure of all cost and pricing data in connection with certain contract negotiations;
|
|
•
|
Require us not to compete for, or to divest ourselves of work, if an organizational conflict of interest, as defined by these laws and regulations, related to such work exists and cannot be appropriately mitigated; and
|
|
•
|
Restrict the use and dissemination of information classified for national security purposes and the exportation of certain products and technical data.
|
U.S. government contracts generally are subject to the Federal Acquisition Regulation (FAR), which sets forth policies, procedures and requirements for the acquisition of goods and services by the U.S. government, agency-specific regulations that implement or supplement FAR, such as the DoD’s Defense Federal Acquisition Regulation Supplement and other applicable laws and regulations. These regulations impose a broad range of requirements, many of which are unique to government contracting, including various procurement, import and export, security, contract pricing and cost, allowable costs, contract performance, contract termination and adjustment, and audit requirements. Our failure to comply with these regulations and requirements could result in reductions to the value of contracts, contract modifications or termination for cause, and the assessment of penalties and fines and lead to suspension or debarment from government contracting or subcontracting for a period of time. In addition, as government contractors we are also subject to routine audits and investigations by U.S. government agencies such as the Defense Contract Audit Agency (DCAA) and the Defense Contract Management Agency (DCMA). These agencies review our performance, cost structure and compliance with applicable laws, regulations and standards under our contracts. The DCAA also reviews the adequacy of and our compliance with our internal control systems and policies, including our accounting, purchasing, government property, estimating, and related business systems.
The U.S. government may revise its procurement practices or adopt new or revised contract rules and regulations at any time. In order to help ensure compliance with these complex laws and regulations, all of our employees are required to complete ethics training and other compliance training relevant to their respective positions.
We are subject to U.S. government laws, regulations and policies, including the International Traffic in Arms Regulations, the Foreign Corrupt Practices Act and the False Claims Act. When working overseas, we must comply not only with applicable U.S. laws and regulations, but also with foreign government laws, regulations and
10
procurement policies and practices, which may differ from U.S. law, including regulations relating to import-export control, foreign tax considerations, foreign labor and environmental law, and anti-corruption.
Contracts
U.S. government programs generally are implemented by the award of individual contracts to a prime contractor, which may utilize a subcontractor. Congress generally appropriates funds on a fiscal year basis even though a program may extend across several fiscal years. Consequently, programs are often only partially funded initially, and additional funds are committed only as Congress makes further appropriations. The contracts and subcontracts under a program generally are subject to termination for convenience or adjustment if appropriations for such programs are not available or if they change. The U.S. government is required to equitably adjust a contract price for additions to or reductions in scope or other changes that it directs.
Generally, the sales price elements for our contracts are firm-fixed-price, cost-plus or cost reimbursable. A firm-fixed-price type contract typically offers higher profit margin potential than a cost-plus type contract, which is commensurate with the greater levels of risk we assume on a firm-fixed-price type contract. Our company is principally a prime contractor on typically long-term, five-to ten-year contracts.
On a firm-fixed-price type contract, we agree to perform the contractual statement of work for a predetermined sales price. Although a firm-fixed-price type contract generally permits us to retain profits if the total actual contract costs are less than the estimated contract costs, we bear the risk that increased or unexpected costs may reduce our profit or cause us to sustain losses on the contract. Accounting for the sales on a firm-fixed-price type contract that is covered by contract accounting standards requires the preparation of estimates of (1) the total contract revenue, (2) the total costs at completion, which is equal to the sum of the actual incurred costs to date on the contract and the estimated costs to complete the contract’s statement of work, and (3) the measurement of progress towards completion. Adjustments to original estimates for a firm-fixed-price type contract’s revenue are often required as work progresses under a contract. Even though the overall scope of work required under the contract may not change, profit can be adjusted as experience is gained and as efficiencies are realized.
On a cost-plus type contract, we are paid our allowable incurred costs plus a profit, which can be fixed or variable depending on the contract’s fee arrangement, up to predetermined funding levels determined by our customers. Cost-plus type contracts with award and incentive fee provisions are our primary variable contract fee arrangement. Award fees provide for a fee based on actual performance relative to contractually specified performance criteria. Incentive fees provide for a fee based on the relationship between total allowable and target cost. Most of our cost plus contracts also contain a firm-fixed fee element.
On most of our contracts there is a cost reimbursable element that captures consumable materials required for the program. Typically these costs do not bear fees. On cost-plus type contracts we do not bear the risks of unexpected cost overruns, provided that we do not incur costs that exceed the predetermined funded amounts. We commonly have elements of firm-fixed-price, cost-plus and cost-reimbursable contracts on a single contract.
The table below presents the percentage of our total revenue generated from each contract-type for the years ended
December 31, 2014
,
2013
and
2012
.
|
|
|
December 31,
|
|||||||
|
Contract type
|
|
2014
|
|
2013
|
|
2012
|
|||
|
Firm-Fixed-Price
|
|
24
|
%
|
28
|
%
|
25
|
%
|
||
|
Cost-Plus and Cost Reimbursable ¹
|
|
76
|
%
|
72
|
%
|
75
|
%
|
||
|
Total Revenue
|
|
100
|
%
|
100
|
%
|
100
|
%
|
||
|
|
|
|
|
|
|
|
|||
|
¹ Includes time and material contracts
|
|
|
|
|
|
|
|||
We were the prime contractor on contracts representing
86%
of our revenue for the year ended
December 31, 2014
.
11
Environmental
We are subject to Federal, state, local, and foreign environmental protection laws and regulations, including those governing the management and disposal of hazardous substances, the cleanup of contaminated sites, and the maintenance of a safe and healthy workplace for our employees, contractors, and visitors. Environmental laws and regulations are subject to change, the nature of which is inherently unpredictable, and the timing of potential changes is uncertain. Environmental requirements are significant factors affecting all of our operations and we have established a comprehensive program to address compliance with applicable environmental requirements.
Employees and Executive Officers
Integrity, respect and responsibility are our core values. We maintain rigorous compliance and other corporate responsibility programs that ensure a safe and secure work environment and compliance with government regulations, and allow employees to voice any concerns while knowing that matters raised will be appropriately addressed. Our company employs people of diverse backgrounds and we believe that our diversity enhances our creativity and enriches our work culture. We are committed to good corporate citizenship and intend to always maintain the trust and support of the communities in which our employees work and live.
As of
December 31, 2014
, our global workforce was comprised of approximately
5,000
employees and more than
6,000
subcontracted workers, spanning
85
locations in
15
countries. Approximately
930
of our employees are represented under
nine
collective bargaining agreements with labor unions, with
four
of the
nine
collective bargaining agreements due to expire prior to the end of
2015
. We believe that relations with our employees are positive.
The following table sets forth certain information as of
December 31, 2014
, concerning our executive officers including a five-year employment history and any directorships held in public companies.
|
Name
|
Age
|
Current Title(s)
|
Business Experience
|
||
|
Kenneth W. Hunzeker
|
62
|
Chief Executive Officer (CEO) and President
|
Mr. Hunzeker has served as CEO and President of Vectrus since the Spin-off. Prior to the Spin-off, Mr. Hunzeker was Executive Vice President at Exelis and President of the Mission Systems business division of Exelis. Prior to holding that position, Mr. Hunzeker was the President and General Manager of ITT Mission Systems, ITT Corporation. Mr. Hunzeker joined ITT Defense and Information Solutions, ITT Corporation in September 2010 as Vice President, Government Relations after 35 years of distinguished service in the U.S. Army, most recently serving as Deputy Commander, United States Forces—Iraq.
|
||
|
Theodore R. Wright
|
59
|
Executive Vice President and Chief Operating Officer (COO)
|
Mr. Wright has served as Executive Vice President and COO of Vectrus since the Spin-off. Prior to the Spin-off, Mr. Wright was Executive Vice President and COO of the Mission Systems business division of Exelis, a position he held since October 2013. He retired from the Air Force Reserves in 2009 after serving 30 years and reaching the rank of Colonel. Mr. Wright was President and CEO of Academi, a security, training and executive protection services provider from June 2011 to March 2013. He also served as President of KBR North American Government and Defense business group, which provides logistics and construction services, from September 2010 to June 2011. While at BAE Systems from 2004 to 2010, Mr. Wright served as President of the Systems Technology Solutions and Services Division for two years.
|
||
|
Matthew M. Klein
|
44
|
Senior Vice President and Chief Financial Officer (CFO)
|
Mr. Klein has served as Senior Vice President and CFO of the Company since the Spin-off. Prior to the Spin-off, Mr. Klein was Vice President and Chief Financial Officer of the Mission Systems business division of Exelis and had served in that position since May 2011. Prior to being named to that position, Mr. Klein was the Assistant Controller for the Electronic Systems business of ITT Communications Systems division located in Fort Wayne, Indiana. He also served as the acting Assistant Controller for ITT Electronic Systems, Radar, Reconnaissance and Acoustic Systems in Van Nuys, California. In addition, Mr. Klein served in the ITT internal audit department leading various audits for units worldwide. He joined ITT Corporation in 1996.
|
||
12
|
Janet L. Oliver
|
55
|
Senior Vice President, Business Development
|
Ms. Oliver has served as Senior Vice President, Business Development, since the Spin-off. Prior to the Spin-off, Ms. Oliver was Vice President and Director of Business Development of the Mission Systems business division of Exelis, a position she had held since she joined Mission Systems in 2009. She was Vice President and Director of the U.S. and Europe Programs from April 2011 to January 2012, a position that she had held concurrently with her responsibilities as the Vice President and Director of Business Development.
|
||
|
Kelvin R. Coppock
|
62
|
Senior Vice President, Contracts
|
Mr. Coppock has served as Senior Vice President, Contracts, since the Spin-off. Prior to the Spin-off, Mr. Coppock was Vice President, Contracts, of the Missions Systems business division of Exelis. Prior to assuming that position, Mr. Coppock was Division Operations Officer, Director and General Manager of the Communications and Information Systems Business Area of Exelis Mission Systems from 2005 to 2013. Mr. Coppock started with ITT Corporation in 2004 as the Director of Program Management at ITT Systems Division where he was responsible for developing the Program Management Center of Excellence, standardizing management systems and functional processes, and leveraging best practices across our company.
|
||
|
Charles A. Anderson
|
56
|
Senior Vice President, Programs
|
Mr. Anderson has served as Senior Vice President, Programs, since the Spin-off. Prior to the Spin-off, Mr. Anderson was Businesses Area Vice President and General Manager of the Mission Systems business division of Exelis for all programs in and outside of the continental United States. He joined Mission Systems in November 2011 immediately following his retirement from the United States Army at the rank of Major General with nearly 32 years of service.
|
||
|
Michele L. Tyler
|
46
|
Senior Vice President, Chief Legal Officer and Corporate Secretary
|
Ms. Tyler has served as Senior Vice President, Chief Legal Officer and Corporate Secretary since the Spin-off. In addition to the legal function, Ms. Tyler is responsible for overseeing the Trade Compliance, Environmental, Safety & Health, Security, Facilities, and Ethics & Compliance departments. Prior to the Spin-off, Ms. Tyler was Vice President and General Counsel of the Mission Systems business division of Exelis. Ms. Tyler was responsible for all legal support for Mission Systems. Previously, she was Associate General Counsel, primarily responsible for labor and employment matters for the Exelis Mission Systems business. Ms. Tyler joined ITT Mission Systems in January 2009 as Senior Counsel.
|
||
|
Francis A. Peloso
|
45
|
Senior Vice President and Chief Human Resources Officer
|
Mr. Peloso has served as Senior Vice President and Chief Human Resources Officer since the Spin-off. Prior to the Spin-off, Mr. Peloso was Vice President and Director, Human Resources of the Mission Systems business division of Exelis. Appointed to this role in November 2010, Mr. Peloso was responsible for all Human Resources activities and strategies for Mission Systems. Mr. Peloso joined ITT Corporation in 2000 and worked across a variety of business areas, including ITT Corporation's World Headquarters, ITT Mission Systems, ITT Communications Systems, and ITT Electronic Systems. From April 2010 to November 2010, Mr. Peloso served as the West Coast Regional Director for the Electronic Systems Division of ITT Corporation.
|
||
Other Information
Vectrus was incorporated in the State of Indiana on February 4, 2014. Our headquarters is located in Colorado Springs, Colorado, at 655 Space Center Drive. Our telephone number is (719) 591-3600.
Available Information
You can read and copy any materials that we file with the United State Securities and Exchange Commission (SEC) at the SEC’s Public Reference Room at 100 F Street, NE, Washington, D.C. 20549. Information on the Public Reference Room may be obtained by calling the SEC at 1-800-732-0330. In addition, the SEC maintains a website that contains reports, proxy and information statements, and other information regarding issuers that file with the SEC at www.sec.gov.
Our website address is www.vectrus.com. Our annual reports on Form 10-K, quarterly reports on Form 10-Q, current reports on Form 8-K, and any amendments to these reports are available free of charge on our website as soon as reasonably practicable after we electronically file those reports with the SEC. The information provided on our website is not part of this report, and is therefore not incorporated by reference, unless such information is otherwise specifically referenced elsewhere in this report.
13
ITEM 1A.
RISK FACTORS
You should carefully consider each of the following risks, which we believe are the principal risks that we face and of which we are currently aware, and all of the other information in this report. Some of the risks described below relate to our business, while others relate to the Spin-off. Other risks relate principally to the securities markets and ownership of our common stock.
Should any of the following risks and uncertainties develop into actual events, our business, financial condition or results of operations could be materially and adversely affected, the trading price of our common stock could decline, and you could lose all or part of your investment.
Risks Relating to Our Business
We face the following risks in connection with the general conditions and trends of the industry in which we operate:
We are dependent on the U.S. government’s presence and operations in Afghanistan for a material portion of our revenue and operating income, and the announced withdrawal of military personnel and suspension or removal of funding for security and training activities in the region by the U.S. government may have an adverse effect on our revenue and operating income prospects.
We derived approximately
$270.1 million
,
$513.1 million
and
$624.9 million
of our revenue and
$24.3 million
,
$91.4 million
and
$75.2 million
of our operating income for the years ended
December 31, 2014
,
2013
and
2012
, respectively, from services ultimately sold to the U.S. government for contracts based in Afghanistan. This reflected a decrease of
47%
in revenue and decrease of
73%
in operating income for the
2014
period as compared to
2013
, and a decrease of
18%
in revenue and an increase of
21%
in operating income for the
2013
period as compared to
2012
. These amounts represented
22%
,
34%
and
34%
of our overall revenue, respectively, for these periods. Our company has four large contracts with operations in Afghanistan, with work in each of our major capability areas; infrastructure asset management, logistics and supply chain management, and information technology and network communication services. Afghanistan contracts have experienced lower program activity in
2014
due to reduced service level requirements. U.S. funding for programs in Afghanistan has decreased in recent periods, and is expected to continue to decrease as the U.S. government plans to reduce the U.S. presence in Afghanistan. In May 2014, the Obama Administration announced its plan to steadily withdraw U.S. forces in Afghanistan by 2016. It is expected that the U.S. military will maintain a presence after the subsequent transition to the Afghan government. This withdrawal of military personnel and suspension or removal of funding for security and training activities in Afghanistan by the U.S. government will have an adverse effect on our revenue and operating income prospects.
We are dependent on the U.S. government and if our reputation or relationship with the U.S. government was harmed, our revenue and growth prospects could be adversely affected.
All of our
2014
revenue and
2013
revenue was derived from services ultimately sold to the U.S. government, primarily the DoD, either as a prime contractor or as a subcontractor to other contractors engaged in work for the U.S. government. For the year ended
December 31, 2014
, we generated approximately
88%
of our total revenue from the U.S. Army. We expect to continue to derive all or most of our revenue from work performed under U.S. government contracts. Our reputation and relationship with the U.S. government, and in particular with the branches and agencies of the DoD, are key factors in maintaining and growing this revenue. Negative press reports or publicity, which could pertain to employee or subcontractor misconduct, conflicts of interest, termination of a contract or task order, poor contract performance, deficiencies in services, reports or other deliverables, information security breaches or other aspects of our business, regardless of accuracy, could harm our reputation, particularly with these branches and agencies. If our reputation is negatively affected, or if we lose our ability to conduct business in a foreign country (i.e., business license), or if we lose a required security clearance, or if we are suspended or debarred from contracting with government agencies or any branch of the DoD for any reason, the amount of our business with the U.S. government and other customers would decrease and our future revenue and growth prospects would be adversely affected.
A significant portion of our revenue is derived from a few large contracts, and the loss or material reduction of any of these contracts could have a material adverse effect on our results of operations and cash flows.
Aggregate revenue from our four largest contracts amounted to approximately
$822.0 million
, or
68%
, of our revenue for the year ended
December 31, 2014
. These four contracts: the Kuwait Base Operations and Security Support Services (K-BOSSS) contract for Camp Arifjan, Kuwait; the Operations, Maintenance and Defense of Army Communications in Southwest Asia and Central Asia (OMDAC-SWACA) contract; the Logistics Civilian Augmentation
14
Program (LOGCAP) contract and the Kuwait based Army Prepositioned Stocks-5 (APS-5 Kuwait) contract each accounted for more than 10% of our revenue for the year ended
December 31, 2014
. Accordingly, our results of operations and cash flows are highly dependent on these contracts. The loss or material reduction of any of these contracts would have a material adverse effect on our results of operations and cash flows.
A decline in the U.S. government defense budget, changes in spending or budgetary priorities or delays in contract awards may significantly and adversely affect our future revenue and limit our growth prospects. Further, because we depend on U.S. government contracts, a delay in the completion of the U.S. government’s budget process could delay procurement of the services and solutions we provide and have an adverse effect on our future revenue.
Our contracts and revenue are correlated primarily with and dependent upon the U.S. defense budget which is subject to the congressional budget authorization and appropriations process. Congress usually appropriates funds for a given program on a September 30 fiscal year basis, even though contract periods of performance may extend over many years. Consequently, at the beginning of a major program, the contract is usually partially funded, and additional monies are normally committed to the contract by the procuring agency only as appropriations are made by Congress in future fiscal years. DoD budgets are a function of several factors beyond our control, including, but not limited to, changes in U.S. procurement policies, budget considerations, current and future economic conditions, presidential administration priorities, changing national security and defense requirements, geo-political developments and actual fiscal year congressional appropriations for defense budgets. Any of these factors could result in a significant redirection of current and future DoD budgets and impact our future operations and cash flows. Such factors may have direct bearing on new business opportunities as well as on whether the U.S. government will exercise its options for services under existing contracts, thus affecting the timing and volume of our business.
For example, the Budget Control Act of 2011 (Budget Control Act) established limits on discretionary government spending, which included an approximate $487 billion reduction in defense spending over a ten-year period, governmental fiscal year 2012 through 2021. If discretionary spending limits are surpassed then additional cuts of up to $500 billion, through a process known as "sequestration," are possible over the same time period.
The sequestration went into effect in government fiscal year 2013 and required national defense spending reductions of approximately $43 billion for 2013. However, in December 2013, the U.S. Government enacted the Bipartisan Budget Act, which reduced the overall impact of sequestration cuts in government fiscal year 2014 and 2015. Unless another agreement is reached, further cuts to defense spending from sequestration remain possible through government fiscal year 2021.
The President's fiscal year 2016 total budget request for DoD O&M increased $3.7 billion to $250.0 billion versus the 2015 enacted amount of $246.3 billion. However, this amount is above the limit of the Budget Control Act.
The U.S. government also conducts periodic reviews of U.S. defense strategies and priorities, which may shift DoD budgetary priorities, reduce overall U.S. government spending or delay contract or task order awards for defense related programs, potentially affecting future Vectrus revenue and earnings. In addition, changes to the DoD acquisition system and contracting models could affect whether and how we pursue certain opportunities and the terms under which we are able to do so. Overall, we expect that top-line defense spending will decline over the next several years. Such funding cuts will likely have an impact across the DoD budget. Such reductions in U.S. government spending and policy could have a material impact on our business.
The funding of U.S. government programs is subject to an annual congressional budget authorization and appropriation process. In years when the U.S. government does not complete its budget process before the end of its fiscal year on September 30, government operations are typically funded pursuant to a “continuing resolution,” which allows Federal government agencies to operate at spending levels approved in the previous budget cycle, but does not authorize new spending initiatives. When the U.S. government operates under a continuing resolution, delays can occur in the procurement of the services and solutions that we provide and may result in new initiatives being cancelled. In addition, when supplemental appropriations are required to operate the U.S. government or fund specific programs and the passage of legislation needed to approve any supplemental appropriation bill is delayed, the overall funding environment for our business could be adversely affected.
Competition within our markets and an increase in bid protests may reduce our revenue and market share.
Our business is highly competitive and we compete with larger companies that have greater name recognition, greater financial resources and larger technical staffs. We also compete with smaller, more specialized
15
companies that are able to concentrate their resources on particular areas. Additionally, we compete with the U.S. government’s own capabilities.
The markets in which we operate are characterized by the changing needs of our customers. Accordingly, our success depends on our ability to provide services that address these changing needs. To remain competitive, we must consistently provide superior service and performance on a cost-effective basis to our customers. Our competitors may be able to provide our customers with different or greater capabilities or better contract terms than we can provide, including past contract experience, geographic presence, price and the availability of qualified professional personnel. Moreover, even if we are qualified to work on a government contract, we may not be awarded the contract because of existing government policies designed to protect small businesses and under-represented minority contractors. In addition, our competitors may consolidate or establish teaming or other relationships among themselves or with third parties to increase their ability to address customers’ needs. Accordingly, we anticipate that larger or new competitors or alliances among competitors may emerge which may adversely affect our ability to compete.
If we are unable to continue to compete successfully against our current or future competitors, we may experience declines in revenue and market share which could negatively impact our financial position, results of operations, or cash flows.
The competitive environment is also affected by bid protests from unsuccessful bidders. Bid protests could result in the award decision being overturned, requiring a renewed competition of the contract. Even where a bid protest does not result in a renewed competition, the resolution typically extends the time until the contract activity can begin, which may reduce our earnings in the period in which the contract would otherwise have commenced.
We may not be successful in winning new contracts, which will have an adverse impact on our business and prospects.
Our contracts and task orders with the federal government are typically awarded through a competitive bidding process. This competitive bidding process presents a number of risks, including the following:
|
•
|
we may bid on programs for which the work activities, deliverables, and timelines are vague or incompletely describe the actual work, which may result in pricing assumptions that are too high or too low; and
|
|
•
|
we may encounter expense and delay if our competitors protest or challenge awards of contracts to us in competitive bidding, and any such protest or challenge could result in the resubmission of bids on modified specifications, or in the termination, reduction or modification of the awarded contract.
|
Because our contracts are typically for a fixed duration, if we are unable to win a particular new contract, we may be prevented from providing the client the services that are purchased under that contract for a number of years. If we are unable to consistently win new contract awards over any extended period, or to the degree expected, our business and prospects will be adversely affected and our actual results may differ materially and adversely from those anticipated.
The non-renewal or termination of our existing U.S. government contracts may adversely affect our business.
The U.S. government services marketplace is characterized by contracts of shorter duration as compared to large production and systems integration programs. Services contracts generally are of a finite duration of five years and may range between three and ten years. Upon expiration of a contract, if the customer requires further services of the type provided by the contract, there is frequently a competitive rebidding process. There can be no assurance that we will be able to renew or replace our current contracts upon expiration or completion. In addition, the U.S. government may terminate any of our government contracts, in whole or in part, at any time at its convenience with little or no notice. Additionally, the U.S. government may terminate our contract for default if we fail to meet our obligations under a contract. If any of our contracts were to be terminated for convenience, we generally would be entitled to receive payment for work completed and allowable termination or cancellation costs. If any of our government contracts were to be terminated for default, generally the customer would pay only for the work that has been accepted; moreover, the customer can require us to pay the difference between the original contract price and the cost to re-procure the contract items, net of the work accepted from the original contract. In addition, the U.S. government can also hold us liable for damages resulting from the default.
16
The expiration, non-renewal or termination of any of our government contracts, whether for convenience or default, would adversely affect our current programs and reduce our revenue, earnings or cash flows. A termination for default may also negatively affect our reputation, performance ratings and our ability to win new contracts, particularly for contracts covering the same or similar types of services.
As a U.S. government contractor, we are subject to a number of procurement regulations and could be adversely affected by changes in regulations or any failure to comply with these regulations.
We operate in a highly regulated environment and must comply with many significant procurement regulations and other requirements. These regulations and requirements, although customary in government contracts, increase our performance and compliance costs. If any such regulations or procurement requirements change, our costs of complying with them could increase and therefore reduce our margins. Some significant statutes and regulations that affect us include:
|
•
|
the FAR and department or agency-specific regulations that implement or supplement FAR, such as the DoD’s Defense Federal Acquisition Regulation Supplement, which regulate the formation, administration and performance of U.S. government contracts;
|
|
•
|
the Truth in Negotiations Act, which requires certification and disclosure of cost and pricing data in connection with certain contract negotiations;
|
|
•
|
the Procurement Integrity Act, which regulates access to competitor bid and proposal information and government source selection information, and our ability to provide compensation to certain former government officials;
|
|
•
|
the Civil False Claims Act, which provides for substantial civil penalties for violations, including for submission of a false or fraudulent claim to the U.S. government for payment or approval; and
|
|
•
|
the U.S. government Cost Accounting Standards, which impose accounting requirements that govern our right to reimbursement under certain cost-based U.S. government contracts.
|
If we are convicted or otherwise found to have violated these or other laws or regulations, or are found not to have acted responsibly as defined by them, we may be subject to reductions of the value of contracts, contract modifications or termination and the assessment of penalties and fines, compensatory damages or treble damages, which could have a material adverse effect on our financial position, results of operations, or cash flows. Such findings or convictions could also result in suspension or debarment from government contracting. Given our dependence on government contracting, suspension or debarment would have a material adverse effect on our financial position, results of operations, or cash flows.
Our business is subject to reviews, investigations, audits and cost adjustments by the U.S. government, which, if resolved unfavorably to us, could adversely affect our profitability, cash position or growth prospects.
U.S. government agencies, including the DCAA, the DCMA and others, routinely audit and review a contractor’s performance on government contracts, indirect rates and pricing practices, and compliance with applicable contracting and procurement laws, regulations and standards. They also review the adequacy of the contractor’s compliance with government standards for its business systems, including its accounting system, earned value management system, estimating system, materials management system, purchasing system and property management system.
Both contractors and the U.S. government agencies conducting these audits and reviews have come under increased scrutiny. As a result, audits and reviews have become more rigorous and the standards to which we are held are being more strictly interpreted and applied, increasing the likelihood of an audit or review resulting in an adverse outcome.
A finding of significant control deficiencies in our system audits or other reviews can result in decremented billing rates to our U.S. government customers until the control deficiencies are corrected and our corrections are accepted by DCMA. Government audits and reviews may conclude that our practices are not consistent with applicable laws and regulations and result in adjustments to contract costs and mandatory customer refunds. Such adjustments can be applied retroactively, which could result in significant customer refunds. Our receipt of adverse audit findings or the failure to obtain an “approved” determination of our various accounting and management internal
17
control systems from the responsible U.S. government agency could significantly and adversely affect our business, including our ability to bid on new contracts and our competitive position in the bidding process. A determination of non-compliance with applicable contracting and procurement laws, regulations and standards could also result in the U.S. government imposing penalties and sanctions against us, including withholding of payments, suspension of payments and increased government scrutiny that could delay or adversely affect our ability to invoice and receive timely payment on contracts, perform contracts or compete for contracts with the U.S. government. In addition, the U.S. government, from time to time, may require its contractors to reduce certain contract prices, or may disallow costs allocated to certain contracts. These adjustments can involve substantial amounts. In the past, as a result of such audits and other investigations and inquiries, we have on occasion made adjustments to our contract prices and the costs allocated to our government contracts.
We are routinely subject to governmental investigations relating to our contracts and operations. If a review or investigation identifies improper or illegal activities, we may be subject to civil or criminal penalties or administrative sanctions, including the termination of contracts, forfeiture of profits, the triggering of price reduction clauses, suspension of payments, fines and suspension or debarment from doing business with governmental agencies. We may suffer harm to our reputation if allegations of impropriety are made against us, which would impair our ability to win new contract awards or receive contract renewals. Civil penalties and sanctions are not uncommon in our industry. If we incur a material penalty or administrative sanction or otherwise suffer harm to our reputation, our profitability, cash position and future prospects could be adversely affected.
The DoD continues to evolve its business practices, which could have a material effect on its overall procurement processes and adversely impact our current programs and potential new awards.
The DoD continues to pursue various initiatives designed to gain efficiencies and to focus and enhance business practices. These initiatives and resulting changes, such as increased usage of fixed price contracts, multiple award contracts and small business set-aside contracts, are having an impact on the contracting environment in which we do business. Any of these changes could impact our ability to obtain new contracts or renew our existing contracts when those contracts are re-competed. These initiatives are evolving, and the full impact to our business remains uncertain and subject to the manner in which the DoD implements them. Any new contracting requirements or procurement methods could be costly or administratively difficult for us to implement and could adversely affect our future revenue, profitability and prospects.
We incurred new indebtedness prior to consummation of the Spin-off, and the degree to which we are leveraged as an independent, publicly traded company may have a material adverse effect on our business, financial condition or results of operations.
Prior to the Spin-off we relied upon Exelis for working capital requirements on a short-term basis and for other financial support functions. As an independent, publicly traded company, we cannot rely on the earnings, assets or cash flow of Exelis, and we are responsible for servicing our own debt, and obtaining and maintaining sufficient working capital. In connection with the Spin-off, we incurred borrowings of
$140.0 million
under a senior secured term facility and entered into a senior secured revolving facility permitting borrowings of up to
$75.0 million
. (See Note 6 "Debt" in the Notes to the Consolidated and Combined Financial Statements.) The proceeds from the senior secured term facility were used to fund a cash distribution to Exelis of approximately
$136.3 million
. We expect to incur higher debt servicing costs on the new indebtedness than we would have incurred otherwise as a subsidiary of Exelis and/or not have access to other less expensive sources of capital from short-term debt markets.
Our ability to make payments on and to refinance our indebtedness, including the debt incurred pursuant to the Spin-off, as well as any future debt that we may incur, will depend on our ability to generate cash in the future from operations, financings or asset sales. Our ability to generate cash is subject to general economic, financial, competitive, legislative, regulatory and other factors that are beyond our control. If we are not able to repay or refinance our debt as it becomes due, we may be forced to sell assets or take other disadvantageous actions, including (i) reducing financing in the future for working capital, capital expenditures and general corporate purposes or (ii) dedicating an unsustainable level of our cash flow from operations to the payment of principal and interest on our indebtedness. In addition, our ability to withstand competitive pressures and to react to changes in our industry could be impaired. The lenders who hold such debt could also accelerate amounts due, which could potentially trigger a default or acceleration of any of the Company's future debt.
In addition, we may increase our debt or raise additional capital, subject to restrictions in our credit agreement. If our cash flow from operations is less than we anticipate, or if our cash requirements are more than we expect, we may require more financing. However, debt or equity financing may not be available to us on terms
18
acceptable to us, if at all. If we incur additional debt or raise equity through the issuance of preferred stock, the terms of the debt or preferred stock issued may give the holders rights, preferences and privileges senior to those of holders of our common stock, particularly in the event of liquidation. The terms of the debt may also impose additional and more stringent restrictions on our operations than we currently have. If we raise funds through the issuance of additional equity, your percentage ownership in us would decline. If we are unable to raise additional capital when needed, it could affect our financial health, which could negatively affect your investment in us. Also, regardless of the terms of our debt or equity financing, the amount of our stock that we can issue may be limited because the issuance of our stock may cause the distribution to be a taxable event for Exelis under Section 355(e) of the Code, and under the Tax Matters Agreement we entered into with Exelis in connection with the Spin-off (the Tax Matters Agreement), we could be required to indemnify Exelis for that tax.
Our level of indebtedness could limit our ability to finance our future operations and limit cash flow available for our operations.
Our credit agreement contains a number of significant covenants that, among other things, restrict our ability to:
|
•
|
create liens and encumbrances;
|
|
•
|
incur additional indebtedness;
|
|
•
|
merge, dissolve, liquidate or consolidate;
|
|
•
|
make acquisitions, investments, advances or loans;
|
|
•
|
dispose of or transfer assets;
|
|
•
|
pay dividends or make other payments in respect of our capital stock;
|
|
•
|
amend certain material governance or debt documents;
|
|
•
|
redeem or repurchase capital stock or prepay, redeem or repurchase certain debt;
|
|
•
|
engage in certain transactions with affiliates;
|
|
•
|
enter into speculative hedging arrangements; and
|
|
•
|
enter into certain restrictive agreements.
|
These restrictions could impair our ability to finance our future operations or capital needs or engage in other business activities that may be in our interests. In addition, the credit agreement also requires us to maintain compliance with certain financial ratios, including those relating to earnings before interest, taxes, depreciation and amortization and consolidated indebtedness. Our ability to comply with these ratios and covenants may be affected by events beyond our control. A breach of the credit agreement or our inability to comply with the required financial ratios or covenants included therein could result in a default under the credit agreement. In the event of any such default, the lenders under the credit agreement could elect to:
|
•
|
declare all outstanding debt, accrued interest and fees to be due and immediately payable;
|
|
•
|
take enforcement actions with respect to the collateral securing our debt; and
|
|
•
|
require us to apply all of our available cash to repay our outstanding senior debt.
|
Our variable rate indebtedness may expose us to interest rate risk, which could cause our debt costs to increase significantly.
Our term loan and revolving facility borrowings have variable rates of interest, which expose us to interest rate risks and to the risk of rising interest rates. As of December 31, 2014, we have approximately
$137.4 million
of aggregate debt outstanding, which consists of a floating-rate term loan (See Note 6 "Debt" in the Notes to the Consolidated and Combined Financial Statements). We also have the ability to incur up to
$75.0 million
of additional floating-rate debt under our revolving facility. If the LIBOR or other applicable base rates under our senior secured credit facilities increase in the future, then the interest expense on the floating-rate debt could increase materially.
19
We are subject to risks associated with operating internationally.
Our U.S. government contracts operating internationally represented approximately
83%
of total revenue for the year ended
December 31, 2014
. We are subject to a variety of U.S. and foreign laws and regulations, including, without limitation foreign labor laws, business compliance, tax and anti-corruption laws, including the Foreign Corrupt Practices Act. Failure by us or our subcontractors or vendors to comply with these laws and regulations could result in administrative, civil, or criminal liabilities and could, in the extreme case, result in suspension or debarment from government contracts, which could have a material adverse effect on us.
Our business operations are also subject to a variety of risks associated with conducting business internationally, including, without limitation:
|
•
|
Changes in or interpretations of foreign laws or policies that may adversely affect the performance of our services;
|
|
•
|
Political instability in foreign countries;
|
|
•
|
Terrorist activity by various groups in the areas in which we operate;
|
|
•
|
Imposition of inconsistent laws or regulations;
|
|
•
|
Conducting business in places where laws, business practices and customs are unfamiliar or unknown; and
|
|
•
|
Imposition of limitations on or increase in withholding and other taxes on payments by foreign operations.
|
The services we provide internationally, including through the use of subcontractors, are sometimes in countries with unstable governments, in areas of military conflict or at military installations. This increases the risk of an incident resulting in damage or destruction to our work or living sites or resulting in injury or loss of life to our employees, subcontractors or other third parties. We maintain insurance to mitigate risk and potential liabilities related to our international operations, but our insurance coverage may not be adequate to cover these claims and liabilities and we may be forced to bear substantial costs arising from those claims. In addition, any accidents or incidents that occur in connection with our international operations could result in negative publicity for our company, which may adversely affect our reputation and make it more difficult for us to compete for future contracts or result in the loss of existing and future contracts. The impact of these factors is difficult to predict, but any one or more of them could adversely affect our financial position, results of operations, or cash flows.
We may not be successful in expanding our geographic footprint or broadening our customer base, which could adversely affect our business, results of operations and financial condition.
Our business strategy is based, in part, on aligning our business development resources on opportunities in international regions, leveraging our leadership position in the Middle East with the U.S. Army and providing our full range of offerings to other U.S. government military and civil agencies. This business strategy involves a number of risks, including the risk that the expected results will not be achieved or that we will be unable to effectively execute this business strategy resulting in harm to our existing reputation or relationship with the U.S. government. These activities may also impose additional compliance burdens on us and could also subject us to enhanced regulatory scrutiny and greater risks associated with operating internationally. We may also incur additional expenditures in connection with our investments in new business opportunities and these investments may also result in losses and costs.
The success of our business strategy will depend on, among other things:
|
•
|
the availability of suitable opportunities;
|
|
•
|
the level of competition from other companies that may have greater financial resources;
|
|
•
|
our ability to obtain requisite approvals and licenses from the relevant governmental authorities and to comply with applicable laws and regulations without incurring undue costs and delays; and
|
|
•
|
our ability to successfully negotiate and enter into beneficial arrangements with our customers.
|
20
Our contract sites are inherently dangerous workplaces. Failure to maintain safe work sites and equipment could result in environmental disasters, employee deaths or injuries, reduced profitability, the loss of projects or customers and possible exposure to litigation.
Our project sites often put our employees and others in close proximity with mechanized equipment, moving vehicles, and highly regulated materials. In addition, some of our project sites are in hostile and unstable environments, including war zones. If we fail to implement safety procedures or if the procedures we implement are ineffective, we may suffer the loss of or injury to our employees, as well as expose ourselves to possible litigation. As a result, our failure to maintain adequate safety standards and equipment, as well as the nature of the environment in which we conduct business, could result in reduced profitability or the loss of projects or customers, and could have a material adverse impact on our business, financial condition, and results of operations.
Misconduct of our employees, subcontractors, agents or business partners could cause us to lose customers and could have a significant adverse impact on our business and reputation, adversely affecting our ability to obtain new contracts.
Misconduct, fraud or other improper activities by our employees, subcontractors, agents or business partners could have a significant adverse impact on our business and reputation. Such misconduct could include the failure to comply with Federal, state, local or foreign government procurement regulations, regulations regarding the protection of classified information, legislation regarding the pricing of labor and other costs in government contracts, laws and regulations relating to environmental matters, bribery of foreign government officials, lobbying or similar activities, boycotts, antitrust and any other applicable laws or regulations. Misconduct involving data security lapses resulting in the compromise of personal information or the improper use of our customer’s sensitive or classified information could result in remediation costs, regulatory sanctions against us and serious harm to our reputation. Other examples of potential misconduct include falsifying time or other records and violations of the Anti-Kickback Act. Although we have implemented policies, procedures and controls to prevent and detect these activities, these precautions may not prevent all misconduct and as a result, we could face unknown risks or losses. Our failure to comply with applicable laws or regulations or misconduct by any of our employees, subcontractors, agents or business partners could subject us to fines and penalties, loss of security clearance, loss of current and future customer contracts and suspension or debarment from contracting with Federal, state or local government agencies, any of which would adversely affect our business, our reputation and our future financial results.
We use estimates in accounting for many of our programs and changes in our estimates could adversely affect our future financial results.
Revenue from our contracts is recognized primarily using the percentage-of-completion method or on the basis of partial performance towards completion. These methodologies require estimates of total costs at completion, fees earned on the contract, or both. This estimation process, particularly due to the nature of the services being performed and the long-term nature of certain contracts, is complex and involves significant judgment. Adjustments to original estimates are often required as work progresses, experience is gained and additional information becomes known, even though the scope of the work required under the contract may not change. Any adjustment as a result of a change in estimates is recognized as events become known. Changes in the underlying assumptions, circumstances or estimates could result in adjustments that may adversely affect our future financial results.
We may not realize as revenue the full amounts reflected in our backlog, which could adversely affect our expected future revenue and growth prospects.
As of
December 31, 2014
, our total backlog was
$2.9 billion
, which included
$814.0 million
in funded backlog. Due to the U.S. government’s ability to not exercise or award contract options or to terminate, modify or curtail our programs or contracts, we may realize less than expected or in some cases never realize revenue from some of the contracts that are included in our backlog. Our unfunded backlog, in particular, contains management’s estimate of amounts expected to be realized on unfunded contract work that may never be realized as revenue. If we fail to realize as revenue amounts included in our backlog, our expected future revenue, growth prospects and profitability could be adversely affected.
Our earnings and margins may vary based on the mix of our contracts, our performance, and our ability to control costs.
We generate revenue under various types of contracts, which include cost plus, cost reimbursement (including non-fee-bearing costs), time and materials (T&M), firm fixed price level of effort (FFP-LOE) and firm fixed
21
price (FFP). Our earnings and profitability may vary materially depending on changes in the proportionate amount of revenue derived from each type of contract, the nature of services provided, as well as the achievement of performance objectives and the stage of performance at which the right to receive fees, particularly under incentive and award fee contracts, is finally determined. Cost reimbursement and T&M contracts generally have lower profitability than FFP contracts.
Our profitability is adversely affected when we incur contract costs that we cannot bill to our customers. To varying degrees, each of our contract types involves some risk that we could underestimate the costs and resources necessary to fulfill the contract. While FFP contracts allow us to benefit from cost savings, these contracts also increase our exposure to the risk of cost overruns. Revenue derived from FFP contracts represented approximately
24%
of our total revenue for fiscal
2014
. When making proposals on FFP contracts, we rely heavily on our estimates of costs and timing for completing the associated projects, as well as assumptions regarding technical issues. In each case, our failure to accurately estimate costs or the resources needed to perform our contracts or to effectively manage and control our costs during the performance of our work could result in reduced profits or in losses. More generally, any increased or unexpected costs or unanticipated delays in connection with the performance of our contracts, including costs and delays caused by contractual disputes or other factors outside of our control, such as performance failures of our subcontractors, natural disasters or other force majeure events, could make our contracts less profitable than expected or unprofitable.
The failure to perform to customer expectations or contract requirements may result in reduced fees or claims made against us by our customers and may affect our financial performance in that period. Under each type of contract, if we are unable to control costs, our operating results could be adversely affected, particularly if we are unable to justify an increase in contract value to our customers. Cost overruns or the failure to perform on existing programs also may adversely affect our ability to retain existing programs and win future contract awards.
Our earnings and margins depend, in part, on our ability to perform under contracts.
When agreeing to contractual terms, our management makes assumptions and projections about future conditions and events, many of which extend over long periods. These projections assess the productivity and availability of labor, the complexity of the work to be performed, the cost and availability of materials and the impact of delayed performance. If we incur costs in excess of initial estimates or funding on a contract, we generally seek reimbursement for those costs but we may not be able to negotiate full recovery for these costs. We cannot predict the extent to which funding for any contract will be increased in the event actual costs significantly exceed our estimates, if at all. If there is a significant change in one or more of these circumstances or estimates, or if we face unanticipated contract costs that we are not able to recover, the profitability of one or more of these contracts may be adversely affected.
Our earnings and margins depend, in part, on subcontractor performance.
We rely on other companies to perform some of the services that we provide to our customers. Disruptions or performance problems caused by our subcontractors could have an adverse effect on our ability to meet our commitments to customers. Our ability to perform our obligations as a prime contractor could be adversely affected if one or more of the subcontractors is unable to provide the agreed-upon services in a timely and cost-effective manner.
Goodwill represents a significant portion of our assets and any impairment of these assets could negatively impact our results of operations.
At
December 31, 2014
, our goodwill was approximately
$216.9 million
, which represented approximately
43%
of our total assets. Goodwill is tested for impairment on an annual basis, or whenever events or changes in circumstances indicate that the carrying value of goodwill may not be recoverable. We estimate the fair value of the reporting unit used in the goodwill impairment test using an income approach and market approach, and as a result the fair value measurements depend on revenue growth rates, future operating margin assumptions, risk-adjusted discount rates, future economic and market conditions, and identification of appropriate market comparable data. Because of the significance of our goodwill, any future impairment of this asset could have a material adverse effect on our results of operations.
We depend on the recruitment and retention of qualified personnel, and our failure to attract and retain such personnel could seriously harm our business.
Due to the specialized nature of our business, our future performance is highly dependent upon the continued
22
services of our personnel and executive officers, the development of additional management personnel and the hiring of new qualified technical, marketing, sales and management personnel for our operations. Competition for qualified personnel is intense, and we may not be successful in attracting or retaining qualified personnel. In addition, certain personnel may be required to receive security clearance and substantial training in order to work on certain contracts or perform certain tasks. We also employ international personnel and engage with foreign subcontractors and labor brokers, which requires compliance with numerous foreign laws and regulations related to labor, benefits, taxes, insurance and reporting requirements, among others. The loss of key employees, our inability to attract new qualified employees, adequately train employees or the delay in hiring key personnel could have an adverse effect our business, results of operations and financial condition.
Our business depends upon obtaining and maintaining required facility security clearance and individual security clearances.
Many of our federal government contracts require our employees to maintain various levels of security clearances and we are required to maintain certain facility security clearances complying with U.S. government requirements. Obtaining and maintaining security clearances for employees involves a lengthy process and it can be difficult to identify, recruit and retain employees who already hold security clearances. If our employees are unable to obtain or retain security clearances or if our employees who hold security clearances terminate employment with us, our ability to perform the work under the contract may be negatively affected, and the customer whose work requires cleared employees could terminate the contract or decide not to renew it upon its expiration. In addition, many of the contracts on which we bid require us to maintain a facility security clearance. To the extent we are not able to maintain a facility security clearance, we may not be able to bid on or win new contracts, or effectively re-bid on expiring contracts.
Some of our workforce is represented by labor unions so our business could be harmed in the event of a prolonged work stoppage.
Approximately
930
of our employees are unionized, which represents approximately
19%
of our employee-base at
December 31, 2014
. As a result, we may experience work stoppages, which could adversely affect our business. We cannot predict how stable our union relationships will be or whether we will be able to successfully negotiate successor agreements without impacting our financial condition. In addition, the presence of unions may limit our flexibility in dealing with our workforce. Work stoppages could negatively impact our ability to provide services to our customers on a timely basis, which could negatively impact our results of operations and financial condition.
Our profitability could suffer if we are not able to maintain adequate staffing for our contracts.
The cost of providing our services, including the extent to which we utilize our workforce, affects our profitability. The rate at which we utilize our workforce is affected by a number of factors, including:
|
•
|
our ability to transition employees from completed contracts to new assignments and to hire and assimilate new employees;
|
|
•
|
our ability to hire personnel in foreign countries;
|
|
•
|
our ability to manage attrition;
|
|
•
|
our need to devote time and resources to training, business development, professional development and other non-chargeable activities; and
|
|
•
|
our ability to manage a subcontractor workforce.
|
We rely on our information systems in our operations. Security breaches and other disruptions could adversely affect our business and results of operations.
As a U.S. defense contractor, we face certain security threats, including cyber-security threats to our information technology infrastructure, attempts to gain access to proprietary or classified information, and threats to physical security. Cyber-security threats are evolving and include, among others, malicious software, attempts to gain unauthorized access to data, and other electronic security breaches that could lead to disruptions in mission critical systems, unauthorized release of confidential or otherwise protected information and corruption of data. The unavailability of our information systems, the failure of these systems to perform as anticipated for any reason or any significant breach of security could disrupt our operations, lead to financial losses from remedial actions, require
23
significant management attention and resources, and negatively impact our reputation among our customers and the public, which could have a negative impact on our financial condition, results of operations and liquidity.
Our systems are decentralized, which presents various risks, including the risk that we may be slower or less able to identify or react to problems affecting a business function than we would be in a more centralized environment. In addition, “company-wide” business initiatives, such as the integration of information technology systems, separation and migration of business systems and data from Exelis, or the formation of a technology system impacting different parts of our business, are often more challenging and costly to implement, and their risk of failure higher, than they would be in a more centralized environment. Depending on the nature of the initiative in question, such failure could materially adversely affect our business, financial condition or results of operations.
Legal disputes could require us to pay potentially large damage awards and could be costly to defend, which would adversely affect our cash balances and profitability, and could damage our reputation.
We are subject to a number of lawsuits and claims as described under “Part I, Item 3. Legal Proceedings”. We are also subject to, and may become a party to, a variety of other litigation or claims and suits that arise from time to time in the ordinary course of our business. Adverse judgments or settlements in some or all of these legal disputes may result in significant monetary damages or injunctive relief against us. Any claims or litigation could be costly to defend, and even if we are successful or if fully indemnified or insured, could damage our reputation and make it more difficult to compete effectively or obtain adequate insurance in the future. Litigation and other claims are subject to inherent uncertainties and management’s view of these matters may change in the future.
Unanticipated changes in our tax provisions or exposure to additional U.S. and foreign income tax liabilities could affect our profitability.
We are subject to income taxes in the United States and many foreign jurisdictions. Significant judgment is required in determining our worldwide provision for income taxes. In the ordinary course of our business, there are many transactions and calculations where the ultimate tax determination is uncertain. Furthermore, changes in domestic or foreign income tax laws and regulations, or their interpretation and enforcement, could result in higher or lower income tax rates assessed or changes in the taxability of certain sales or the deductibility of certain expenses, thereby affecting our income tax expense and profitability. In addition, we regularly are under audit by tax authorities. The final determination of tax audits and any related litigation could be materially different from our historical income tax provisions and accruals. Additionally, changes in the geographic mix of our sales could also impact our tax liabilities and affect our income tax expense and profitability.
Our insurance may be insufficient to protect us from claims or losses.
We maintain insurance coverage with third-party insurers as part of our overall risk management strategy and because some of our contracts require us to maintain specific insurance coverage limits. However, not every risk or liability is or can be protected by insurance, and, for those risks we insure, the limits of coverage we purchase or that are reasonably obtainable in the market may not be sufficient to cover all actual losses or liabilities incurred. If any of our third-party insurers fail, cancel our coverage or otherwise are unable to provide us with adequate insurance coverage, then our overall risk exposure and our operational expenses would increase and the management of our business operations would be disrupted. Our insurance may be insufficient to protect us from significant warranty and other liability claims or losses. Moreover, there is a risk that commercially available liability insurance will not continue to be available to us at a reasonable cost, if at all. If liability claims or losses exceed our current or available insurance coverage, our business and prospects may be harmed. We are also subject to the requirements of the Defense Base Act (DBA), which generally requires insurance coverage to be provided to persons employed at U.S. military bases outside of the United States. Failure to obtain DBA insurance may result in fines or other sanctions, including the loss of a particular contract. Regardless of the adequacy of our liability insurance coverage, any significant claim may have an adverse effect on our industry and market reputation, leading to a substantial decrease in demand for our services and reduced revenue.
Business disruptions caused by natural disasters and other crises could adversely affect our profitability and our overall financial position.
We have significant operations located in regions of the United States and internationally that may be exposed to natural disasters, such as hurricanes, tornadoes, blizzards, flooding, wildfires or earthquakes. Our business could also be disrupted by pandemics and other national or international crises. Although preventative measures may help mitigate the damage from such occurrences, the damage and disruption to our business resulting
24
from any of these events may be significant. If our insurance and other risk mitigation mechanisms are not sufficient to recover all costs, including loss of revenue from sales to customers, we could experience a material adverse effect on our financial position and results of operations.
We depend on our teaming arrangements and relationships with other contractors and subcontractors. If we are not able to maintain these relationships, or if these parties fail to satisfy their obligations to us or the customer, our revenue, profitability and growth prospects could be adversely affected.
We rely on our teaming relationships with other prime contractors and subcontractors in order to submit bids for large procurements or other opportunities where we believe the combination of services provided by us and the other companies will help us to win and perform the contract. Our future revenue and growth prospects could be adversely affected if other contractors eliminate or reduce their contract relationships with us, or if the U.S. government terminates or reduces these other contractors' programs, does not award them new contracts or refuses to pay under a contract. Companies that do not already have access to U.S. government contracts may perform services as our subcontractor and that exposure could enhance such companies’ prospect of securing a future position as a prime U.S. government contractor which could increase competition for future contracts and impair our ability to perform on contracts.
We may have disputes with our subcontractors arising from, among other things, the quality and timeliness of work performed by the subcontractor, customer concerns about the subcontractor, our failure to extend existing task orders or issue new task orders under a subcontract, proper invoicing, cost reasonableness, allocability, allowability, the hiring of each other’s personnel, adjustments to the scope of the subcontractor’s work, or the subcontractor’s failure to comply with applicable law. Current uncertain economic conditions heighten the risk of financial stress of our subcontractors, which could adversely impact their ability to meet their contractual requirements to us. If any of our subcontractors fail to timely meet their contractual obligations or have regulatory compliance or other problems, our ability to fulfill our obligations as a prime contractor or higher tier subcontractor may be jeopardized. Significant losses could arise in future periods and subcontractor performance deficiencies could result in our termination for default. A termination for default could eliminate a revenue source, expose us to liability and have an adverse effect on our ability to compete for future contracts and task orders.
Government withholding regulations could adversely affect our operating performance.
In February 2012, the DoD issued the final Defense Federal Acquisition Regulation Supplement (DFARS) rule which allows withholding of a percentage of payments when a contractor’s business system has one or more significant deficiencies. The DFARS rule applies to Cost Accounting Standards (CAS) covered contracts that have the DFARS clause in the contract terms and conditions. The final rule represents a significant change in the contracting environment for companies performing work for the DoD. Contracting officers may withhold 5% of contract payments for one or more significant deficiencies in any single contractor business system or up to 10% of contract payments for significant deficiencies in multiple contractor business systems. A significant deficiency as defined by the DoD is a “shortcoming in the system that materially affects the ability of officials of the DoD to rely upon information produced by the system that is needed for management purposes.” The final rule is applicable to new DoD contracts awarded after February 2012.
Internal system or service failures could disrupt our business and impair our ability to effectively provide our services to our customers, which could damage our reputation and adversely affect our revenue and profitability.
Any system or service disruptions, including those caused by ongoing projects to improve our information technology systems and the delivery of services, whether through our shared services organization or outsourced services, if not anticipated and appropriately mitigated, could have a material adverse effect on our business including, among other things, an adverse effect on our ability to bill our customers for work performed on our contracts, collect the amounts that have been billed and produce accurate financial statements in a timely manner. We are also subject to systems failures, including network, software or hardware failures, whether caused by us, third-party service providers, cybersecurity threats, natural disasters, power shortages, terrorist attacks or other events, which could cause loss of data and interruptions or delays in our business, cause us to incur remediation costs, subject us to claims and damage our reputation. In addition, the failure or disruption of our communications or utilities could cause us to interrupt or suspend our operations or otherwise adversely affect our business. Our property and business interruption insurance may be inadequate to compensate us for all losses that may occur as a result of any system or operational failure or disruption and, as a result, our future results could be adversely affected.
25
The effects of changes in worldwide economic and capital markets conditions may significantly affect our ability to maintain liquidity or procure capital.
Our business may be adversely affected by factors in the United States and other countries that are beyond our control, such as disruptions in financial markets or downturns in economic activity in specific countries or regions, or in the various industries in which our company operates; social, political or labor conditions in specific countries or regions; or adverse changes in the availability and cost of capital, interest rates, foreign currency exchange rates, tax rates, or regulations in the jurisdictions in which our company operates. If, for any reason, we lose access to our currently available lines of credit, or if we are required to raise additional capital, we may be unable to do so in the current credit and stock market environment, or we may be able to do so only on unfavorable terms.
Adverse changes to financial conditions could jeopardize certain counterparty obligations, including those of our insurers and financial institutions and other third parties.
We may make or enter into acquisitions, investments, joint ventures and divestitures that involve numerous risks and uncertainties.
We may selectively pursue strategic acquisitions, investments and joint ventures. These transactions require significant investment of time and resources and may disrupt our business and distract our management from other responsibilities. Even if successful, these transactions could reduce earnings for a number of reasons, including the amortization of intangible assets, impairment charges, acquired operations that are not yet profitable or the payment of additional consideration under earn-out arrangements if an acquisition performs better than expected. Acquisitions, investments and joint ventures pose many other risks that could adversely affect our reputation, operations or financial results, including:
|
•
|
we may not be able to identify, compete effectively for or complete suitable acquisitions and investments at prices we consider attractive;
|
|
•
|
we may not be able to accurately estimate the financial effect of acquisitions and investments on our business and we may not realize anticipated synergies or acquisitions may not result in improved operating performance;
|
|
•
|
we may encounter performance problems with acquired technologies, capabilities and products, particularly with respect to those that are still in development when acquired;
|
|
•
|
we may have trouble retaining key employees and customers of an acquired business or otherwise integrating such businesses, such as incompatible accounting, information management, or other control systems, which could result in unforeseen difficulties;
|
|
•
|
we may assume material liabilities that were not identified as part of our due diligence or for which we are unable to receive a purchase price adjustment or reimbursement through indemnification;
|
|
•
|
we may assume legal or regulatory risks, particularly with respect to smaller businesses that have immature business processes and compliance programs;
|
|
•
|
acquired entities or joint ventures may not operate profitably, which could adversely affect our operating income or operating margins and we may be unable to recover investments in any such acquisitions;
|
|
•
|
acquisitions, investments and joint ventures may require us to spend a significant amount of cash or to issue capital stock, resulting in dilution of ownership; and
|
|
•
|
we may not be able to effectively influence the operations of our joint ventures or we may be exposed to certain liabilities if our joint venture partners do not fulfill their obligations.
|
If our acquisitions, investments or joint ventures fail, perform poorly or their value is otherwise impaired for any reason, including contractions in credit markets and global economic conditions, our business and financial results could be adversely affected.
26
Risks Relating to Our Recent Separation from Exelis
We face the following risks in connection with our recent separation from Exelis:
We may be responsible for U.S. Federal income tax liabilities that relate to the distribution.
In connection with the Spin-off, our former parent, Exelis, received an opinion of tax counsel to the effect that the Spin-off would qualify as a tax-free distribution under Section 355 of the Code. An opinion of tax counsel is not binding on the Internal Revenue Service (the “IRS”). Accordingly, the IRS may reach conclusions with respect to the Spin-off that are different from the conclusions reached in the opinion. The opinion was based on certain factual statements and representations, which, if incomplete or untrue in any material respect, could alter tax counsel’s conclusions.
We are not aware of any facts or circumstances that would cause any such factual statements or representations in the opinion of tax counsel to be incomplete or untrue or cause the facts on which the opinion is based to be materially different from the facts at the time of the Spin-off. If, notwithstanding the receipt of the opinion of tax counsel, the IRS were to determine the Spin-off to be taxable, Exelis would recognize a substantial tax liability.
Even if the Spin-off otherwise qualifies as a tax-free transaction for U.S. Federal income tax purposes, the distribution will be taxable to Exelis (but not to Exelis shareholders) pursuant to Section 355(e) of the Code if there are one or more acquisitions (including issuances) of the stock of either us or Exelis, representing 50% or more, measured by vote or value, of the then-outstanding stock of either corporation and the acquisition or acquisitions are deemed to be part of a plan or series of related transactions that include the distribution. Any acquisition of our common stock within two years before or after the distribution (with exceptions, including public trading by less-than-5% shareholders and certain compensatory stock issuances) generally will be presumed to be part of such a plan unless that presumption is rebutted. The resulting tax liability may have a material adverse effect on the business, financial condition, results of operations or cash flows of us or Exelis.
We have agreed not to enter into any transaction that could cause any portion of the Spin-off to be taxable to Exelis, including under Section 355(e). Pursuant to the Tax Matters Agreement, we and Exelis have also agreed to indemnify each other for any tax liabilities resulting from such transactions to the extent a party’s actions caused such tax liability, whether or not the indemnified party consented to such transaction or the indemnifying party was otherwise permitted to enter into such transaction under the Tax Matters Agreement. In addition, under U.S. Treasury regulations, each member of the Exelis consolidated group at the time of the Spin-off (including us and our subsidiaries) would be severally liable for the resulting U.S. Federal income tax liability if all or a portion of the Spin-off does not qualify as a tax-free transaction, and we will make certain payments to Exelis in respect of certain tax benefits that would be realized by us in connection with the Spin-off under the Tax Matters Agreement if the Spin-off were to be taxable. These obligations may discourage, delay or prevent a change of control of our company.
In connection with the Spin-off, we and Exelis have each agreed to a broad release of claims and indemnification of the other party; we may be required to expend cash and resources to satisfy our indemnification obligations to Exelis and there is no assurance that Exelis’ indemnities to us will be sufficient to insure us against the full amount of such liabilities, or that Exelis will have the ability to satisfy its indemnification obligations to us in the future.
In the Distribution Agreement that we and Exelis entered into in connection with the Spin-off, Exelis agreed to indemnify us from certain claims and liabilities, and we agreed to indemnify Exelis for certain claims and liabilities as discussed further in Note 15, “Related Party Transactions and Parent Company Equity,” and Note 16, “Commitments and Contingencies”. Indemnities that we are required to provide Exelis may be significant and could negatively impact our business, particularly those indemnities relating to our actions that could impact the tax-free nature of the Spin-off. Third-parties could also seek to hold us responsible for any of the liabilities that Exelis has agreed to retain. Further, there can be no assurance that the indemnity from Exelis will be sufficient to protect us against the full amount of such liabilities, or that Exelis will be able to fully satisfy its indemnification obligations. Moreover, even if we ultimately succeed in recovering from Exelis any amounts for which we are held liable, we may be temporarily required to bear these losses ourselves. Each of these risks could negatively affect our business, results of operations and financial condition.
27
Our accounting and other management systems and resources may not be adequately prepared to meet the financial reporting and other requirements to which we are subject as a new independent, publicly traded company.
Prior to Spin-off, our financial results were included within the consolidated results of Exelis. While we believe that our financial reporting and internal controls were appropriate for a subsidiary of a public company, prior to the Spin-off, we were not directly subject to the reporting and other requirements of the Exchange Act. As an independent, publicly traded company, we are directly subject to reporting and other obligations under the Exchange Act. Beginning with our Annual Report on Form 10-K for the year ending December 31, 2015, we will be required to comply with Section 404 of the Sarbanes-Oxley Act of 2002 (the “Sarbanes-Oxley Act”) which will require annual management assessments of the effectiveness of our internal controls over financial reporting and a report by our independent registered public accounting firm as to whether we maintained, in all material respects, effective internal controls over financial reporting as of the last day of the year. These reporting and other obligations may place significant demands on our management, administrative and operational resources, including accounting systems and resources.
The Exchange Act requires that we file annual, quarterly and current reports with respect to our business and financial condition. Under the Sarbanes-Oxley Act, we are required to maintain effective disclosure controls and procedures and internal controls over financial reporting. To comply with these requirements, we may need to further upgrade our systems; implement additional financial and management controls, reporting systems and procedures; and hire additional accounting and finance staff. We expect to incur additional annual expenses as we continue to address these requirements, and those expenses may be significant. If we are unable to upgrade our financial and management controls, reporting systems, information technology systems and procedures in a timely and effective fashion, our ability to comply with our financial reporting requirements and other rules that apply to reporting companies under the Exchange Act could be impaired. Any failure to achieve and maintain effective internal controls could have a material adverse effect on our financial condition, results of operations or cash flows.
We do not have a recent operating history as an independent company and our historical financial information may not be a reliable indicator of our future results.
The historical financial information we have included in this Annual Report on Form 10-K for periods prior to the Spin-off has been derived in part from the consolidated financial statements of Exelis and does not necessarily reflect what our financial position, results of operations and cash flows would have been as a separate, stand-alone entity during the periods presented. Exelis did not account for us, and we were not operated, as a single stand-alone entity for certain of the periods presented even if we represented an important business in the historical consolidated financial statements of Exelis. In addition, the historical information is not necessarily indicative of what our results of operations, financial position and cash flows will be in the future. For example, following the Spin-off, changes have occurred and will occur in our cost structure, funding and operations, including changes in our tax structure, increased costs associated with reduced economies of scale and increased costs associated with becoming a public, stand-alone company. While we were profitable as part of Exelis, we cannot assure you that as a stand-alone company our profits will continue at a similar level.
We may be unable to achieve some or all of the benefits that we expect to achieve as an independent, publicly traded company.
As an independent, publicly traded company, we believe that our business will benefit from, among other items; (i) greater strategic focus of management’s efforts and resources, (ii) enhanced focus on customers, (iii) direct and differentiated access to capital resources, (iv) improved management incentive tools, and (v) ability to utilize stock as an acquisition currency. However, now that we are separate from Exelis, we may be more susceptible to market fluctuations and other adverse events than we would have been were we still a part of Exelis.
28
Our customers, prospective customers and suppliers will need assurances that our financial stability on a stand-alone basis is sufficient to satisfy their requirements for doing or continuing to do business with them.
Some of our customers, prospective customers and suppliers will need assurances that our financial stability on a stand-alone basis is sufficient to satisfy their requirements for doing or continuing to do business with them. If our customers, prospective customers or suppliers are not satisfied with our financial stability, it could have a material adverse effect on our ability to bid for and obtain or retain projects, as well as on our business, financial condition, results of operations and cash flows.
The Spin-off may expose us to potential liabilities arising out of state and Federal fraudulent conveyance laws and legal distribution requirements.
The Spin-off could be challenged under various state and Federal fraudulent conveyance laws. An unpaid creditor or an entity vested with the power of such creditor (such as a trustee or debtor-in-possession in a bankruptcy) could claim that Exelis did not receive fair consideration or reasonably equivalent value in the Spin-off, and that the Spin-off left Exelis insolvent or with unreasonably small capital or that Exelis intended or believed it would incur debts beyond its ability to pay such debts as they mature. If a court were to agree with such a plaintiff, then such court could void the Spin-off as a fraudulent transfer and could impose a number of different remedies, including without limitation, returning our assets or your shares in our company to Exelis or providing Exelis with a claim for money damages against us in an amount equal to the difference between the consideration received by Exelis and the fair market value of our company at the time of the Spin-off.
The measure of insolvency for purposes of the fraudulent conveyance laws may vary depending on which jurisdiction’s law is applied. Generally, however, an entity would be considered insolvent if the fair saleable value of its assets is less than the amount of its liabilities (including the probable amount of contingent liabilities), and such entity would be considered to have unreasonably small capital if it lacked adequate capital to conduct its business in the ordinary course and pay its liabilities as they become due. No assurance can be given as to what standard a court would apply to determine insolvency or that a court would determine that Exelis was solvent at the time of or after giving effect to the Spin-off, including the distribution of our common stock.
The distribution by Exelis of the Vectrus common stock in the Spin-off could also be challenged under state corporate distribution statutes. Under the Indiana Business Corporation Law, a corporation may not make distributions to its shareholders if, after giving effect to the distribution, (i) the corporation would not be able to pay its debts as they become due in the usual course of business; or (ii) the corporation’s total assets would be less than the sum of its total liabilities. No assurance can be given that a court will not later determine that the distribution by Exelis of Vectrus common stock in the Spin-off was unlawful.
Under the Distribution Agreement, we are responsible for the debts, liabilities and other obligations related to the business or businesses which we own and operate following the consummation of the Spin-off. Although we do not expect to be liable for any obligations not expressly assumed by us pursuant to the Distribution Agreement, it is possible that we could be required to assume responsibility for certain obligations retained by Exelis should Exelis fail to pay or perform its retained obligations.
We may have been able to receive better terms from unaffiliated third parties than the terms we receive in our agreements related to the Spin-off.
The agreements related to the Spin-off, including the Distribution Agreement, Employee Matters Agreement, Tax Matters Agreement, Transition Services Agreements and any other agreements, were negotiated in the context of our separation from Exelis while we were still part of Exelis. Accordingly, these agreements may not reflect terms that would have resulted from arm’s-length negotiations among unaffiliated third parties. The terms of the agreements negotiated in the context of our separation are related to, among other things, allocations of assets and liabilities, rights and indemnification and other obligations between Exelis and us. To the extent that certain terms of those agreements provide for rights and obligations that could have been procured from third parties, we may have received better terms from third parties because third parties may have competed with each other to win our business.
We may incur greater costs as an independent company than we did when we were part of Exelis.
As part of Exelis, we took advantage of its size and purchasing power in procuring certain goods and services such as insurance and health care benefits, and technology such as computer software licenses. We also relied on Exelis to provide various corporate functions. After the Spin-off, as a separate, independent entity, we may be unable to obtain these goods, services and technologies at prices or on terms as favorable to us as those we obtained prior
29
to the distribution. We may also incur costs for functions previously performed by Exelis that are higher than the amounts reflected in our historical financial statements, which could cause our profitability to decrease.
Following the Spin-off, we are dependent on Exelis to provide certain services pursuant to the Transition Services Agreement.
Currently, we rely on Exelis to provide certain corporate and administrative services such as certain information technology, financial and human resource services. We expect to develop the capability to provide all such services internally at Vectrus. However, to the extent that we are unable to develop such capabilities after the separation, we will rely on Exelis to continue to provide certain services for a period of time pursuant to a Transition Services Agreement that we entered into in connection with the Spin-off. If Exelis is unable or unwilling to provide such services pursuant to the Transition Services Agreement, or if the agreement is terminated prior to the end of its term, we may be unable to provide such services ourselves or we may have to incur additional expenditures to obtain such services from another provider.
Risks Relating to Our Common Stock
You face the following risks in connection with ownership of our common stock:
There is not a long market history for our common stock and the market price of our common stock may fluctuate significantly.
We cannot predict the prices at which our common stock may trade. The market price of our common stock may fluctuate widely, depending on many factors, some of which may be beyond our control, including:
|
•
|
our dependence on the defense industry and the business risks peculiar to that industry, including changing priorities or reductions in the U.S. government or international defense budgets;
|
|
•
|
government regulations and compliance therewith, including changes to the DoD procurement process;
|
|
•
|
the availability of government funding and changes in customer requirements for our services;
|
|
•
|
competition and industry capacity;
|
|
•
|
misconduct of our employees, subcontractors, agents and business partners;
|
|
•
|
the mix of our contracts and programs, our performance, and our ability to control costs;
|
|
•
|
governmental investigations;
|
|
•
|
changes in interest rates and other factors that affect earnings and cash flows;
|
|
•
|
our level of indebtedness and our ability to make payments on or service our indebtedness;
|
|
•
|
our ability to obtain financing as needed;
|
|
•
|
subcontractor performance;
|
|
•
|
our ability to retain and recruit qualified personnel;
|
|
•
|
security breaches and other disruptions to our information technology and operations;
|
|
•
|
unanticipated changes in our tax provisions or exposure to additional income tax liabilities;
|
|
•
|
actual or anticipated fluctuations in our operating results due to factors related to our business;
|
|
•
|
wins and losses on contract re-competitions and new business pursuits;
|
|
•
|
success or failure of our business strategy;
|
|
•
|
our quarterly or annual earnings, or those of other companies in our industry;
|
|
•
|
announcements by us or our competitors of significant acquisitions or dispositions;
|
|
•
|
changes in accounting standards, policies, guidance, interpretations or principles;
|
30
|
•
|
the failure of securities analysts to cover our common stock;
|
|
•
|
changes in earnings estimates by securities analysts or our ability to meet those estimates;
|
|
•
|
the operating and stock price performance of other comparable companies;
|
|
•
|
investor perception of our company and the defense industry, including changing priorities or reductions in the U.S. government defense budget;
|
|
•
|
natural or environmental disasters that investors believe may affect us;
|
|
•
|
overall market fluctuations;
|
|
•
|
results from any material litigation or government investigation;
|
|
•
|
changes in laws and regulations affecting our business; and
|
|
•
|
general economic conditions and other external factors.
|
Stock markets in general have experienced volatility that has often been unrelated to the operating performance of a particular company. These broad market fluctuations could adversely affect the trading price of our common stock.
We do not currently plan to pay a regular dividend on our common stock, and our indebtedness could limit our ability to pay dividends on our common stock in the future.
We do not currently plan to pay a regular dividend on our common stock. The declaration of any future cash dividends and, if declared, the amount of any such dividends, will be subject to our financial condition, earnings, capital requirements, financial covenants and other contractual restrictions and to the discretion of our Board of Directors. Our Board of Directors may take into account such matters as general business conditions, industry practice, our financial condition and performance, our future prospects, our cash needs and capital investment plans, income tax consequences, applicable law and such other factors as our Board of Directors may deem relevant.
Additionally, indebtedness that we incurred in connection with the Spin-off could have important consequences for holders of our common stock. If we cannot generate sufficient cash flow from operations to meet our debt-payment obligations, then our ability to pay dividends, if so determined by the Board of Directors, will be impaired and we may be required to attempt to restructure or refinance our debt, raise additional capital or take other actions such as selling assets, reducing or delaying capital expenditures or reducing our dividend. There can be no assurance, however, that any such actions could be effected on satisfactory terms, if at all, or would be permitted by the terms of our debt or our other credit and contractual arrangements. In addition, the terms of the agreements governing our current debt or debt that we may incur in the future may limit the payment of dividends.
Anti-takeover provisions in our organizational documents and Indiana law could delay or prevent a change in control.
Certain provisions of our amended and restated articles of incorporation and our amended and restated by-laws may delay or prevent a merger or acquisition that a shareholder may consider favorable. For example, the amended and restated articles of incorporation and the amended and restated by-laws, among other things, provide for a classified board and do not permit shareholders to convene special meetings or to remove our directors other than for cause. In addition, the amended and restated articles of incorporation authorize our Board of Directors to issue one or more series of preferred stock. These provisions may also discourage acquisition proposals or delay or prevent a change in control, which could harm our stock price. Indiana law also imposes some restrictions on mergers and other business combinations between any holder of 10% or more of our outstanding common stock and us as well as certain restrictions on the voting rights of “control shares” of an “issuing public corporation.”
Under the Tax Matters Agreement, we have agreed not to enter into any transaction involving an acquisition (including issuance) of Vectrus common stock or any other transaction that could cause the distribution to be taxable to Exelis. Exelis and we have also agreed to indemnify each other for any tax liabilities resulting from such transactions to the extent a party’s actions caused such tax liability, whether or not the indemnified party consented to such transaction or the indemnifying party was otherwise permitted to enter into such transaction under the Tax Matters Agreement. Generally, Exelis will recognize taxable gain on the distribution if there are one or more acquisitions (including issuances) of our capital stock, directly or indirectly, representing 50% or more, measured by
31
vote or value, of our then-outstanding capital stock, and the acquisitions or issuances are deemed to be part of a plan or series of related transactions that include the distribution. Any such shares of our common stock acquired, directly or indirectly, within two years before or after the distribution (with exceptions, including public trading by less-than-5% shareholders and certain compensatory stock issuances) will generally be presumed to be part of such a plan unless that presumption is rebutted. As a result, our obligations may discourage, delay or prevent a change of control of our company.
ITEM 1B.
UNRESOLVED STAFF COMMENTS
None.
ITEM 2.
PROPERTIES
We have
85
locations, in
15
countries on
three
continents. Our contract performance typically occurs on the government customer’s facility. We consider our corporate headquarters office located at 655 Space Center Drive, Colorado Springs, Colorado our only significant location. Our Colorado Springs office is leased and has
104,000
square feet. We consider the property that we lease to be in good condition and generally suitable for the purposes for which it is used.
ITEM 3.
LEGAL PROCEEDINGS
From time to time we are involved in legal proceedings that are incidental to the operation of our business. Some of these proceedings seek remedies relating to employment matters, matters in connection with our contracts and matters arising under provisions relating to the protection of the environment.
Although the ultimate outcome of any legal matter cannot be predicted with certainty, based on present information, including our assessment of the merits of the particular claim, we do not expect that any asserted or unasserted legal claims or proceedings, individually or in the aggregate, will have a material adverse effect on our cash flow, results of operations or financial condition.
See Part IV, Item 15., Note 16, "Commitments and Contingencies" in the notes to Consolidated Combined Financial Statements included in this Annual Report on Form 10-K for further information.
ITEM 4.
MINE SAFETY DISCLOSURES
Not Applicable.
ITEM 5.
MARKET FOR REGISTRANT’S COMMON EQUITY, RELATED STOCKHOLDER MATTERS AND ISSUER PURCHASES OF EQUITY SECURITIES
COMMON STOCK – MARKET PRICES AND DIVIDENDS
Our common stock is traded on the New York Stock Exchange (NYSE) under the symbol “VEC". Our common stock started “regular-way” trading on the NYSE on September 29, 2014. Prior to September 29, 2014, there was no public market for our common stock. Our common stock was traded on a “when-issued” basis from September 16, 2014 to September 29, 2014. As of
December 31, 2014
, there were approximately
9,961
stockholders of record and
10.5 million
outstanding shares.
The trading price data, as reported on the NYSE for the indicated periods is as follows:
|
|
|
Sales Price
|
||
|
Months Ended
|
|
High
|
|
Low
|
|
October 31, 2014
|
|
$24.44
|
|
$19.44
|
|
November 30, 2014
|
|
$28.26
|
|
$22.76
|
|
December 31, 2014
|
|
$31.27
|
|
$26.99
|
32
To date we have not declared or paid any dividends on our common stock. The declaration and payment of dividends by us is subject to the discretion of our Board of Directors and depends on many factors including our financial condition, earnings, capital requirements, covenants associated with our debt obligations, legal requirements, regulatory constraints and other factors deemed relevant by the Board of Directors. Therefore, there can be no assurance as to what level of dividends, if any, will be paid in the future. In deciding whether to pay future dividends on our common stock, our Board of Directors may take into account such matters as general business conditions, industry practice, our financial condition and performance, our future prospects, our cash needs and capital investment plans, income tax consequences, applicable law and such other factors as our Board of Directors may deem relevant. See Item 7. "Management's Discussion and Analysis of Financial Condition and Results of Operations - Liquidity and Capital Resources".
EQUITY COMPENSATION PLAN INFORMATION
The information called for by Item 5(a) is incorporated herein by reference to the portions of the definitive proxy statement referred to in Item 10 of this Annual Report on Form 10-K set forth under the caption “Equity Compensation Plan Information.”
ISSUER PURCHASES OF EQUITY SECURITIES
We did not repurchase any of our equity securities for the year ended
December 31, 2014
.
STOCK PERFORMANCE GRAPH
The following graph provides a comparison of the cumulative total shareholder return on the Company’s common stock to the returns of S&P 500 and the S&P Aerospace and Defense Select Industry Index from September 16, 2014 (the first day our common stock began “when-issued” trading on the New York Stock Exchange) through
December 31, 2014
. Our common stock began “regular-way” trading in connection with the Spin-off on September 29, 2014. “When-issued” trading refers to a sale or purchase made conditionally because the security has been authorized but not yet issued. “Regular-way” trading refers to trading after a security has been issued. The graph is not, and is not intended to be, indicative of future performance of our common stock. This graph is not deemed to be “filed” with the SEC or subject to the liabilities of Section 18 of the Securities Exchange Act of 1934, and should not be deemed to be incorporated by reference into any of our prior or subsequent filings under the Securities Act of 1933 or the Securities Exchange Act of 1934, except as shall be expressly set forth by specific reference in such filing.
33
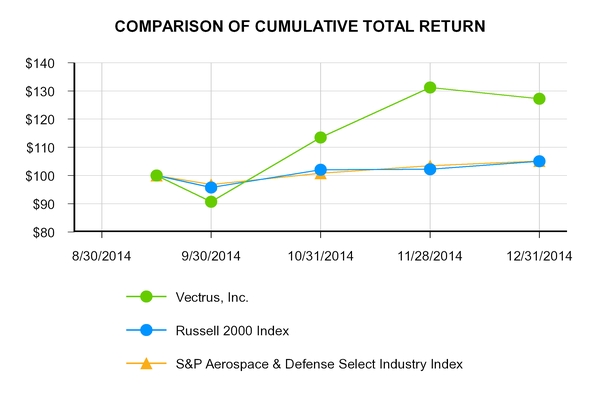
The above graph assumes the following:
|
(1)
|
$100 invested at the close of business on September 16, 2014, in Vectrus common stock, Russell 2000 Index and S&P Aerospace & Defense Select Industry Index.
|
|
(2)
|
The cumulative total return assumes reinvestment of dividends.
|
ITEM 6.
SELECTED FINANCIAL DATA
The financial statements presented in this Annual Report on Form 10-K represent:
(i) periods prior to September 27, 2014 when we were part of Exelis (referred to as "Combined Financial Statements") and
(ii) the period as of and subsequent to September 27, 2014 when we became a separate publicly-traded company (referred to as "Consolidated Financial Statements").
The statement of income data for each of the three years ended
December 31,
2014
,
2013
and
2012
and the balance sheet data as of
December 31,
2014
and
2013
are derived from audited consolidated and combined financial statements included elsewhere in this Annual Report on Form 10-K. The statement of income data for the year ended
December 31,
2011
and the balance sheet data as of
December 31,
2012
are derived from audited combined financial statements that are not included in this Annual Report on Form 10-K. The statement of income data for the year ended
December 31,
2010
and the balance sheet data as of
December 31,
2011
and
December 31,
2010
are derived from unaudited combined financial statements that are not included in this Annual Report on Form 10-K, which has been prepared on the same basis as the audited data and, in the opinion of management, includes all adjustments necessary for a fair presentation of the information set forth herein.
34
|
|
Year Ended December 31,
|
|||||||||||||||||||
|
(In thousands, except per share data)
|
|
2014
|
|
2013
|
|
2012
|
|
2011
|
|
2010
|
||||||||||
|
Results of Operations
|
|
|
|
|
|
|
|
|
|
|
||||||||||
|
Revenue
|
|
$
|
1,203,269
|
|
$
|
1,511,638
|
|
$
|
1,828,364
|
|
$
|
1,805,603
|
|
$
|
1,131,727
|
|
||||
|
Operating income
|
|
38,417
|
|
131,322
|
|
110,351
|
|
87,488
|
|
34,608
|
|
|||||||||
|
Operating margin
|
|
3.2
|
%
|
8.7
|
%
|
6.0
|
%
|
4.8
|
%
|
3.1
|
%
|
|||||||||
|
Net income
|
|
$
|
22,812
|
|
$
|
84,392
|
|
$
|
74,665
|
|
$
|
54,323
|
|
$
|
21,611
|
|
||||
|
Basic earnings per common share ¹
|
|
$
|
2.18
|
|
$
|
8.06
|
|
$
|
7.13
|
|
$
|
5.19
|
|
$
|
2.06
|
|
||||
|
Diluted earnings per common share ¹
|
|
$
|
2.13
|
|
$
|
8.06
|
|
$
|
7.13
|
|
$
|
5.19
|
|
$
|
2.06
|
|
||||
|
Financial Position
|
|
|||||||||||||||||||
|
Total assets
|
|
499,491
|
|
489,164
|
|
591,139
|
|
614,704
|
|
473,556
|
|
|||||||||
|
Total debt
|
|
$
|
137,375
|
|
$
|
—
|
|
$
|
—
|
|
$
|
—
|
|
$
|
—
|
|
||||
|
|
|
|
|
|
|
|
|
|
|
|
||||||||||
|
¹ For periods ended September 27, 2014 and prior, basic and diluted earnings per share are computed using the number of shares of Vectrus common stock outstanding on September 27, 2014, the date on which the Vectrus common stock was distributed to the shareholders of Exelis Inc.
|
||||||||||||||||||||
The selected historical consolidated and combined financial data presented above should be read in conjunction with our audited Consolidated and Combined Financial Statements and accompanying notes and Management’s Discussion and Analysis of Financial Condition and Results of Operations included in this Annual Report on Form 10-K. Our historical financial information may not be indicative of our future performance. Our historical consolidated and combined financial information prior to September 27, 2014 reflects our performance as a business division of Exelis and may not provide a useful indicator of future performance. For further discussion of the factors that may affect comparability, see “Risk Factors” in Item 1A of this Annual Report on Form 10-K.
ITEM 7.
MANAGEMENT’S DISCUSSION AND ANALYSIS OF FINANCIAL CONDITION AND RESULTS OF OPERATIONS
The following discussion of our financial condition and results of operations should be read in conjunction with the audited Consolidated and Combined Financial Statements and notes thereto as well as the discussion in the section of this Annual Report on Form 10-K entitled "Description of Business." This Annual Report provides additional information regarding the Company, our services, industry outlook and forward-looking statements that involve risks and uncertainties. The forward-looking statements are not historical facts, but rather are based on current expectations, estimates, assumptions and projections about our industry, business and future financial results. Our actual results could differ materially from the results contemplated by these forward-looking statements. See "Forward-Looking and Cautionary Statements" for further information regarding forward-looking statements. Amounts presented in and throughout this Item 7 are rounded and, as such, any rounding differences could occur in period over period changes and percentages reported.
Forward-Looking Statement Information.
This Annual Report on Form 10-K and certain information incorporated herein by reference contain forward-looking statements within the meaning of Section 21E of the Securities Exchange Act of 1934, as amended (the “Exchange Act”), and Section 27A of the Securities Act of 1933, as amended (the “Securities Act”), and the Private Securities Litigation Reform Act of 1995 and, as such, may involve risks and uncertainties. All statements included or incorporated by reference in this report, other than statements that are purely historical, are forward-looking statements. Forward-looking statements generally can be identified by the use of forward-looking terminology such as “may,” “will,” “expect,” “intend,” “estimate,” “anticipate,” “believe,” “could,” “potential,” “continue” or similar terminology. These statements are based on the beliefs and assumptions of the management of the Company based on information currently available to management. Forward-looking statements are not guarantees of future performance and are subject to risks and uncertainties that could cause actual results to differ materially from the results contemplated by the forward-looking statements.
The forward-looking statements included or incorporated by reference in this report are subject to additional risks and uncertainties further discussed under Item 1A. “Risk Factors” and are based on information available to us on the filing date of this report. Readers are cautioned not to place undue reliance on forward-looking statements,
35
which speak only as of the date of this report. New risks and uncertainties arise from time to time, and we cannot predict those events or how they may affect us. We assume no obligation to update any forward-looking statements.
The Company undertakes no obligation to update any forward-looking statements, whether as a result of new information, future events or otherwise, except as required by law. In addition, forward-looking statements are subject to certain risks and uncertainties that could cause actual results to differ materially from the Company’s historical experience and our present expectations or projections. These risks and uncertainties include, but are not limited to risks and uncertainties relating to the Spin-off, including whether the Spin-off and the related transactions will result in any tax liability, the operational and financial profile of the Company after giving effect to the Spin-off, and the ability of the Company to operate as an independent entity; economic, political and social conditions in the countries in which we conduct our businesses; changes in U.S. or international government defense budgets; protests of new awards; our ability to submit proposals for and/or win all potential opportunities in our pipeline; government regulations and compliance therewith, including changes to the Department of Defense procurement process; changes in technology; intellectual property matters; governmental investigations, reviews, audits and cost adjustments; contingencies related to actual or alleged environmental contamination, claims and concerns; delays in completion of the U.S. government's budget; our success in expanding our geographic footprint or broadening or customer base; our ability to realize the full amounts reflected in our backlog and to retain and renew our existing contracts; impairment of goodwill; misconduct of our employees, subcontractors, agents and business partners; our ability to control costs; our level of indebtedness; subcontractor performance; economic and capital markets conditions; our ability to retain and recruit qualified personnel; security breaches and other disruptions to our information technology and operation; changes in our tax provisions or exposure to additional income tax liabilities; changes in U.S. generally accepted accounting principles (GAAP); and other factors described in Item 1A, “Risk Factors,” and elsewhere in this report and described from time to time in our future reports filed with the Securities and Exchange Commission (SEC).
Use of Non-GAAP Financial Information
Certain matters discussed in this report, including the information presented in Part II under “Item 7. Management’s Discussion and Analysis of Financial Condition and Results of Operations,” include measures not derived in accordance with GAAP. These measures should not be considered in isolation or as a substitute for any measure derived in accordance with GAAP, and also may be inconsistent with similar measures presented by other companies. In Part II under “Item 7. Management’s Discussion and Analysis of Financial Condition and Results of Operations,” the reasons for the Company’s use of these measures are presented under the heading, “Key Performance and Non-GAAP Measures,” and reconciliations of these measures to the most closely comparable GAAP measures are presented under the heading “Discussion of Financial Results.”
Overview
Vectrus is a leading provider of services to the U.S. government worldwide. We operate in a single segment and offer services in three major capability areas: infrastructure asset management, logistics and supply chain management, and information technology and network communication. Our infrastructure asset management services support the U.S. Army, Air Force and Navy and include infrastructure services, security, warehouse management and distribution, ammunition management, military base maintenance and operations, communications, emergency services, transportation, and life support activities at a number of critical global military installations. Our logistics and supply chain management services support and maintain the vehicle and equipment stocks of the U.S. Army and Marine Corps. Our information technology and network communication services consist of sustainment of communications systems, network security, systems installation and full life cycle management of information technology systems for the U.S. Army, Air Force and Navy.
Our primary customer is the U.S. DoD, with a high concentration in the U.S. Army. For the year ended
December 31, 2014
, we had revenue of
$1.2 billion
, all of which was derived from U.S. government customers.
Separation from Exelis Inc.
On September 27, 2014, Exelis completed the Spin-off of Vectrus, Inc. (Vectrus, the Company, our company, we, us and our), formerly Exelis' Mission Systems business, which was part of Exelis' Information and Technical Services segment.
Prior to the Spin-off, we were a subsidiary of Exelis. The financial information included herein for periods prior to the Spin-off may not necessarily reflect our financial position, results of operations and cash flows in the future or what our financial position, results of operations and cash flows would have been had we been an independent,
36
publicly traded company during the periods presented that occurred prior to the Spin-off. We have incurred and are incurring additional costs to be able to function as an independent, publicly traded company, including additional costs related to corporate finance, governance and public reporting.
Executive Summary
Vectrus reported revenue of
$1.2 billion
for the year ended
December 31, 2014
, a decrease of approximately
20.4%
from the
$1.5 billion
of revenue reported for the year ended
December 31, 2013
. This decrease was driven primarily by lower program activity in the Middle East and Afghanistan as a result of U.S. troop withdrawals and lower service level requirements on contracts in those regions.
Operating income for the year ended
December 31, 2014
, was
$38.4 million
, reflecting a decrease of approximately
$92.9 million
, or
70.7%
, compared to the year ended
December 31, 2013
, due to lower revenue driven by lower program activity in the Middle East and Afghanistan as a result of U.S. troop withdrawals and higher general corporate expenses incurred for separation costs associated with becoming a stand-alone public company. (See Key Performance and Non-GAAP Measures.)
During the performance of long-term sales contracts, estimated final contract prices and costs are reviewed periodically and revisions are made as required and recorded in income in the periods in which they are determined. Changes in estimated revenue, cost of revenue and the related effect to operating income are recognized using a cumulative catch-up adjustment which recognizes in the current period the cumulative effect of the changes on current and prior periods based on a contract's percentage of completion. Aggregate changes in contract estimates recognized using the cumulative catch-up method of accounting for the year ended
December 31, 2014
were de minimis, and for the year ended
December 31, 2013
, increased operating income by approximately
$38.3 million
.
We derived approximately
$270.1 million
of our revenue for the year ended
December 31, 2014
, from services ultimately sold to the U.S. government for contracts based in Afghanistan. Revenue for contracts based in Afghanistan totaled approximately
$513.1 million
and
$624.9 million
for the years ended
December 31, 2013
and
December 31, 2012
. U.S. funding for programs in Afghanistan has decreased in recent periods, and is expected to continue to decrease as the U.S. government reduces the U.S. presence in Afghanistan. In May 2014, the Obama Administration announced its plan to steadily withdraw U.S. Forces in Afghanistan by 2016. It is expected that the U.S. military will maintain a presence after the subsequent transition to the Afghan government. This withdrawal of military personnel and the subsequent reduction of funding for security and training activities in Afghanistan by the U.S. government will have an adverse effect on our revenue and operating income.
Further details related to the year ended
December 31, 2014
, compared to year ended
December 31, 2013
and year ended
December 31, 2013
, compared to year ended
December 31, 2012
are contained in the Discussion of Financial Results section.
Recent Developments
Vectrus was awarded a number of U.S. government contracts in 2014, three of which we believe will have a significant impact on revenue in future years. On October 31, 2014, a Danish company owned by Vectrus received notice of award of an approximately $411 million Hybrid Firm-Fixed Price Contract for Thule Base Maintenance. Under this contract we will operate and maintain Thule Air Base (AB), providing services such as civil engineering, airfield/water port operations, fuels management, transportation, non-secure communications, environmental management, food services, medical/public health, supply, recreation and community services. The location of performance is Thule AB, Greenland. The work is expected to be complete by September 30, 2022, which is the final completion date of the last option. Although in February 2015, the U.S. Government Accounting Office denied the protests filed by three unsuccessful competitors, at least one of them has filed a subsequent protest with the Court of Federal Claims. We are moving forward with the phase-in, as directed by the customer.
The second contract is with the U.S. Army Corps of Engineers and was awarded on August 15, 2014. Under the contract, we will provide information technology support including: test, evaluation and engineering and design for the U.S. Army Corps of Engineers in the United States. The contract value is approximately $517 million and it has a five-year duration.
The third contract is with the U.S. Air Forces in Europe and was awarded on September 17, 2014. Under the contract, we will provide civil engineering, airfield support, facilities support, transportation and warehousing support for all U.S. Air Force bases in Turkey and in Spain. The contract value is approximately $458 million and has a seven-year duration. The contract transition began in January of 2015 and full performance will start in March of 2015.
37
Economic Opportunities, Challenges and Risks
The U.S. government’s investment in services and capabilities in response to evolving security challenges creates a complex and evolving business environment for Vectrus and other firms in this market segment. However, the DoD budget remains the largest in the world and management estimates our addressable portion of the DoD budget exceeds
$25.0 billion
. Further, we expect the U.S. government will continue to place a high priority on national security and will continue to invest in affordable solutions for its facilities, logistics, equipment and communication needs, which aligns with our core capabilities and strengths. In addition, we plan to address a larger portion of the U.S. government budget and expand our focus to other sectors of the U.S. government, such as the intelligence community and other civilian agencies. Management believes there is an opportunity to capture a larger share of this approximately
$100.0 billion
addressable market.
The enacted total fiscal year 2015 DoD budget is $560.4 billion, 3.6% lower in comparison to the fiscal year 2014 DoD budget. The total DoD budget includes the DoD's base budget and Oversees Contingency Operations (OCO) budget. The enacted fiscal year DoD base budget provided $496.1 billion, which is essentially flat with fiscal year 2014. The enacted fiscal year 2015 DoD OCO budget is $64.3 billion, 24.5% lower in comparison to the fiscal year 2014 DoD OCO budget.
The total fiscal year 2016 DoD budget request is $585.3 billion, 4.4% higher in comparison to the enacted total fiscal year 2015 DoD budget. The fiscal year 2016 DoD base budget request is $534.3 billion, 7.7 % higher in comparison to the enacted fiscal year 2015 base budget. However, the fiscal 2016 base budget request is $36 billion above the limitations mandated by the Budget Control Act. The fiscal year 2016 DoD OCO budget request is $50.9 billion, 20.8% lower in comparison to the enacted fiscal year 2015 DoD OCO budget.
The President's fiscal year 2016 total budget request for DoD O&M increased $3.7 billion to $250.0 billion versus the 2015 enacted amount of $246.3 billion. The President's fiscal year 2016 base budget request for DoD O&M, which is above the limit of the Budget Control Act, increased $14.5 billion to $209.8 billion versus the 2015 enacted amount of $195.4 billion. The President's fiscal year 2016 OCO budget request for DoD O&M reduces the 2015 enacted amount from $51.0 billion to $40.2 billion.
Although we anticipate reductions to certain programs in which we participate or for which we expect to compete, we believe spending on O&M of defense assets, as well as civilian agency infrastructure and equipment, will continue to be a U.S. government priority. We expect our portfolio of capabilities aligns well with U.S. government cost-saving initiatives that demand that users utilize existing equipment and infrastructure rather than executing new purchases and new infrastructure construction. Vectrus’ focus is on sustaining existing base and installed equipment, which we believe aligns with our customers’ intent. Many of the core functions Vectrus performs are mission-essential. The following are examples of a few of these core functions: (i) keeping communication networks operational; (ii) operating and repairing utilities such as electricity, gas and steam; and (iii) providing firefighting services. While customers may reduce the level of service required from our Company, we believe that the complete elimination of these services is unlikely.
Our programs generally face declining revenue streams going forward, in particular with programs related to the support of ongoing operations in Afghanistan. Programs related specifically to the support of ongoing operations in Afghanistan are subject to changes in the level of U.S. commitment. In May 2014, the Obama Administration announced its plan to steadily withdraw U.S. forces in Afghanistan by 2016. It is expected that the U.S. military will maintain a presence after the subsequent transition to the Afghan government. This expectation is reflected in our strategic business plan as well as in our efforts to win new business. We believe we are well positioned to address emerging opportunities in the United States and the Middle East and North Africa region.
The future scope of these activities and pace of U.S. military drawdowns remain uncertain, pending disclosure of the U.S. government’s full drawdown plan. There has been particular uncertainty around the Obama Administration’s statements and intentions regarding the future footprint in Afghanistan.
The pace and depth of U.S. government acquisition reform and cost savings initiatives, combined with increased industry competitiveness to win long-term positions on key programs, could add pressure to revenue levels and profit margins going forward.
The information provided above does not represent a complete list of trends and uncertainties that could impact our business in either the near or long-term. It should, however, be considered along with the risk
38
factors identified under the caption “Risk Factors” identified in Part 1, Item 1A in this Annual Report on Form 10-K and the matters identified under the caption “Forward-Looking and Cautionary Statements" herein.
Key Performance and Non-GAAP Measures
The primary financial performance measures Vectrus uses to manage its businesses and monitor results of operations are revenue trends and operating income trends. Management believes that these financial performance measures are the primary drivers for Vectrus’ earnings and net cash from operating activities. Operating income represents revenue less both cost of revenue and selling, general and administrative (SG&A) expenses.
We define operating margin as operating income divided by revenue. Cost of revenue consists of labor, subcontracting costs, materials, and an allocation of indirect costs, which includes service center transaction costs. Selling, general and administrative expenses consist of indirect labor costs (including wages and salaries for executives and administrative personnel), bid and proposal expenses and other general and administrative expenses not allocated to cost of revenue.
We manage the nature and amount of costs at the contract level, which forms the basis for estimating our total costs and profitability for a specific contract. Management evaluates its contracts and business performance by focusing on revenue, operating income and operating margin. This is consistent with our approach for managing our business, which begins with management’s approach for assessing the bidding opportunity for each contract and then managing contract profitability throughout the performance period.
In addition to the key performance measures discussed above, we consider adjusted operating income to be useful to management and investors in evaluating our operating performance for the periods presented and to provide a tool for evaluating our ongoing operations. Adjusted operating income is defined as net income, adjusted to exclude: income taxes; interest expense; items that may include, but are not limited to, other income; significant charges or credits that impact current results but are not related to our ongoing operations; unusual and infrequent non-operating items and non-operating tax settlements or adjustments, such as separation costs incurred to become a stand-alone public company and operating income associated with the TARS program, which was retained by Exelis. This information can assist investors in assessing our financial performance and measures our ability to generate capital for deployment among competing strategic alternatives and initiatives. Adjusted operating income, however, is not a measure of financial performance under GAAP and should not be considered a substitute for revenue, operating income, income from continuing operations, or net cash from continuing operations as determined in accordance with GAAP. A reconciliation of adjusted operating income from net income is provided below.
|
Year Ended December 31,
|
||||||||||||
|
(In thousands)
|
2014
|
2013
|
2012
|
|||||||||
|
Net income
|
$
|
22,812
|
|
$
|
84,392
|
|
$
|
74,665
|
|
|||
|
Income tax expense
|
14,079
|
|
47,041
|
|
35,731
|
|
||||||
|
Interest (expense) income, net
|
(1,526
|
)
|
111
|
|
45
|
|
||||||
|
Income from operations
|
38,417
|
|
131,322
|
|
110,351
|
|
||||||
|
TARS operating income (pretax)
|
(1,623
|
)
|
(2,909
|
)
|
(4,069
|
)
|
||||||
|
Separation costs to become a stand-alone public company (pretax)
|
13,237
|
|
705
|
|
—
|
|
||||||
|
Adjusted operating income
|
$
|
50,031
|
|
$
|
129,118
|
|
|
$
|
106,282
|
|
||
39
DISCUSSION OF FINANCIAL RESULTS
Year ended
December 31, 2014
, compared to Year ended
December 31, 2013
Selected financial highlights are presented in the table below:
|
|
|
Year Ended December 31,
|
|
Change
|
|||||||||||
|
(In thousands)
|
|
2014
|
|
2013
|
|
$
|
%
|
||||||||
|
|
|
|
|
|
|
|
|
||||||||
|
Revenue
|
|
$
|
1,203,269
|
|
$
|
1,511,638
|
|
$
|
(308,369
|
)
|
(20.4
|
)%
|
|||
|
Cost of revenue
|
|
1,084,512
|
|
1,297,089
|
|
(212,577
|
)
|
(16.4
|
)%
|
||||||
|
% of revenue
|
|
90.1
|
%
|
85.8
|
%
|
||||||||||
|
Selling, general and administrative
|
|
80,340
|
|
83,227
|
|
(2,887
|
)
|
(3.5
|
)%
|
||||||
|
% of revenue
|
|
6.7
|
%
|
5.5
|
%
|
||||||||||
|
Operating income
|
|
38,417
|
|
131,322
|
|
(92,905
|
)
|
(70.7
|
)%
|
||||||
|
Operating margin
|
|
3.2
|
%
|
8.7
|
%
|
||||||||||
|
Interest (expense) income, net
|
|
(1,526
|
)
|
111
|
|
(1,637
|
)
|
(1,474.8
|
)%
|
||||||
|
Income before taxes
|
|
36,891
|
|
131,433
|
|
(94,542
|
)
|
(71.9
|
)%
|
||||||
|
% of revenue
|
|
3.1
|
%
|
8.7
|
%
|
||||||||||
|
Income tax expense
|
|
14,079
|
|
47,041
|
|
(32,962
|
)
|
(70.1
|
)%
|
||||||
|
Effective income tax rate
|
|
38.2
|
%
|
35.9
|
%
|
||||||||||
|
Net Income
|
|
$
|
22,812
|
|
$
|
84,392
|
|
$
|
(61,580
|
)
|
(73.0
|
)%
|
|||
Revenue
Revenue for the year ended
December 31, 2014
, was
$1.2 billion
reflecting a decrease of
$308.4 million
, or
20.4%
, as compared to the year ended
December 31, 2013
. The decline in revenue was attributable mainly to lower activity for our Afghanistan based contracts. Programs with contract activity in Afghanistan experienced declines of approximately
$243.0 million
as maintenance responsibility was transferred to local Afghans on certain contracts and facility service levels were reduced to align to changing U.S. government priorities in Afghanistan. Middle East based programs experienced revenue declines of
$85.7 million
as the U.S. government continued to reduce troop levels, close bases and consolidate contracting activity in the Middle East. The U.S. government also placed equipment in storage due to reduced equipment requirements in-theater which reduced maintenance requirements. The decrease in revenue was offset by a
$12.3 million
increase in domestic programs due to increased level of effort for construction projects in 2014 and a new Navy contract awarded in September 2013 with performance beginning in November 2013.
Cost of Revenue
The decrease in cost of revenue of
$212.6 million
, or
16.4%
, for the year ended
December 31, 2014
, as compared to the year ended
December 31, 2013
, was primarily due to lower revenue as described above. The cost of revenue as a percentage of revenue increased due to the declining leverage of certain program costs as a result of lower revenue in our Afghanistan based programs.
Selling, General & Administrative (SG&A) Expenses
For the year ended
December 31, 2014
, SG&A expenses of
$80.3 million
decreased by
3.5%
as compared to
$83.2 million
for the year ended
December 31, 2013
. The decrease was driven by cost reductions implemented during 2013 to align costs with revenue declines partially offset by higher general corporate expenses of
$13.2 million
incurred for separation costs associated with becoming a stand-alone public company. Cost reductions included the administrative office closure in Doha, Qatar and additional indirect staff reductions based in Colorado Springs, Colorado as we implemented a leaner headquarters operating model.
40
Operating Income
Operating income for the year ended
December 31, 2014
, decreased by
$92.9 million
, or
70.7%
, as compared to the year ended
December 31, 2013
. Operating income as a percentage of revenue was
3.2%
for the year ended
December 31, 2014
, compared to
8.7%
for the year ended
December 31, 2013
.
Operating income decreased as a result of the decreases in revenue, cost of revenue and SG&A as discussed above. In addition, during the performance of long-term sales contracts, estimated final contract prices and costs are reviewed periodically and revisions are made as required and recorded as income in the period in which they are determined. Changes in estimated revenue, cost of revenue and the related effect to operating income are recognized using a cumulative catch-up adjustment which recognizes in the current period the cumulative effect of the changes on current and prior periods based on a contract’s percentage of completion. Aggregate cumulative catch-up adjustments for the year ended
December 31, 2014
, were de minimis, and for the year ended
December 31, 2013
, increased operating income by approximately
$38.3 million
. Aggregate cumulative catch-up adjustments for the year ended December 31, 2013 of
$38.3 million
relate to operational efficiencies and non-recurring contract modifications on Afghanistan and Middle East programs. Operational efficiencies relate primarily to cost savings from decreased staffing levels due to productivity improvements on maturing contracts, decreased subcontract work as we in-sourced work at reduced costs, and lower administrative support required to operate maturing contracts.
Income Tax Expense
We recorded income tax expense of
$14.1 million
and
$47.0 million
for the years ended
December 31, 2014
and
2013
, respectively, which represented effective income tax rates of
38.2%
and
35.9%
, respectively.
Year ended
December 31, 2013
, compared to year ended
December 31, 2012
Selected financial highlights are presented in the table below:
|
Year Ended December 31,
|
Change
|
||||||||||||||
|
(In thousands)
|
2013
|
2012
|
$
|
%
|
|||||||||||
|
|
|||||||||||||||
|
Revenue
|
$
|
1,511,638
|
|
$
|
1,828,364
|
|
$
|
(316,726
|
)
|
(17.3
|
)%
|
||||
|
Cost of revenue
|
1,297,089
|
|
1,635,697
|
|
(338,608
|
)
|
(20.7
|
)%
|
|||||||
|
% of revenue
|
85.8
|
%
|
89.5
|
%
|
|||||||||||
|
Selling, general and administrative
|
83,227
|
|
82,316
|
|
911
|
|
1.1
|
%
|
|||||||
|
% of revenue
|
5.5
|
%
|
4.5
|
%
|
|||||||||||
|
Operating income
|
131,322
|
|
110,351
|
|
20,971
|
|
19.0
|
%
|
|||||||
|
Operating margin
|
8.7
|
%
|
6.0
|
%
|
|||||||||||
|
Interest income (expense), net
|
111
|
|
45
|
|
66
|
|
146.7
|
%
|
|||||||
|
Income before taxes
|
131,433
|
|
110,396
|
|
21,037
|
|
19.1
|
%
|
|||||||
|
% of revenue
|
8.7
|
%
|
6.0
|
%
|
|||||||||||
|
Income tax expense
|
47,041
|
|
35,731
|
|
11,310
|
|
31.7
|
%
|
|||||||
|
Effective income tax rate
|
35.9
|
%
|
31.8
|
%
|
|||||||||||
|
Net Income
|
$
|
84,392
|
|
$
|
74,665
|
|
$
|
9,727
|
|
13.0
|
%
|
||||
Revenue
Revenue for the year ended
December 31, 2013
, was
$1.5 billion
, reflecting a decrease of
$316.7 million
, or
17.3%
, as compared to the year ended
December 31, 2012
. The decline in revenue was attributable mainly to lower activity in Middle East and Afghanistan based programs. Middle East based programs experienced revenue declines of
$136.9 million
as a result of base closures as the U.S. government consolidated contracting activity and reduced maintenance requirements. Equipment was placed in storage due to reduced equipment requirements in-theater as the U.S. government continued to reduce troop levels in the Middle East. Programs with contract activity in Afghanistan experienced declines of approximately
$111.8 million
as maintenance responsibility was transferred to local Afghans on certain contracts and facility service levels were reduced, to align to changing U.S. government priorities in Afghanistan. Revenue from domestic contracts
41
declined
$30.9 million
related primarily to the completion of a contract and general customer service level reductions across remaining domestic programs. Europe based programs declined
$37.1 million
driven primarily by a change to the labor structure of a contract, which reduced overall staffing levels and the contract value.
Cost of Revenue
The decrease in the cost of revenue of
$338.6 million
, or
20.7%
, for the year ended
December 31, 2013
, as compared to the year ended
December 31, 2012
, was primarily due to lower revenue as described above. The cost of revenue as a percentage of revenue decreased due to the operational efficiencies on our Middle Eastern and Afghanistan programs.
SG&A Expenses
For the year ended
December 31, 2013
, SG&A expenses of
$83.2 million
increased by
1.1%
as compared to
$82.3 million
for the year ended
December 31, 2012
. The increase was driven by an increase in general corporate expenses of
$4.0 million
which were offset by partial year savings of
$2.0 million
as a result of local cost reductions implemented during 2013 to align costs with revenue declines. Local cost reductions included the administrative office closure in Doha, Qatar and additional indirect staff reductions based in Colorado Springs, Colorado as we implemented a leaner headquarters operating model.
Operating Income
Operating income for the year ended
December 31, 2013
, increased by
$21.0 million
, or
19.0%
, as compared to the year ended
December 31, 2012
and operating income as a percentage of revenue was
8.7%
for the year ended
December 31, 2013
, compared to
6.0%
for the year ended
December 31, 2012
. The increase in operating income and margin is due primarily to operational efficiencies (noted above) and positive non-recurring contract modifications on Afghanistan based programs of approximately
$16.0 million
. The contract modifications related primarily to final pricing and fee negotiations with the customer for contracts with open years from 2011 through 2013 which resulted in a positive adjustment to revenue.
Operating income increased as a result of a decrease in the cost of revenue offset by a decrease in revenue and an increase in SG&A as discussed above. In addition, during the performance of long-term sales contracts, estimated final contract prices and costs are reviewed periodically and revisions are made as required and recorded as income in the period in which they are determined. Changes in estimated revenue, cost of revenue and the related effect to operating income are recognized using a cumulative catch-up adjustment which recognizes in the current period the cumulative effect of the changes on current and prior periods based on a contract’s percentage of completion. Aggregate cumulative catch-up adjustments for the year ended
December 31, 2013
and
December 31, 2012
increased operating income by approximately
$38.3 million
and
$10.8 million
, respectively. The aggregate cumulative catch-up adjustments for the year ended December 31, 2013 of
$38.3 million
relate to operational efficiencies and non-recurring contract modifications on Afghanistan and Middle East programs. Operational efficiencies relate primarily to cost savings from decreased staffing levels due to productivity improvements on maturing contracts, decreased subcontract work as we in-sourced work at reduced costs, and lower administrative support required to operate maturing contracts.
Income Tax Expense
The Company recorded income tax expense of
$47.0 million
and
$35.7 million
for the years ended
December 31, 2013
and
2012
, respectively, which represented effective income tax rates of
35.9%
and
31.8%
, respectively. The year over year increase in the effective income tax rate was due primarily to a non-recurring benefit in 2012 from the cumulative impact of a reduction in the state effective tax rate.
Backlog
Total backlog includes both funded backlog (firm orders for which funding is contractually obligated by the customer) and unfunded backlog (firm orders for which funding is not currently contractually obligated by the customer) and represents firm orders and potential options on multi-year contracts. Total backlog excludes potential orders under IDIQ contracts. The value of the backlog is based on anticipated revenue levels over the anticipated life of the contract. Actual volumes may be greater or less than anticipated. Total backlog is converted into revenue as work is performed. The level of order activity related to DoD programs can be affected by the timing of government funding authorizations and their project evaluation cycles. Year-over-year comparisons could, at times, be impacted by these factors, among others.
42
We expect to recognize a substantial portion of our funded backlog as revenue within the next 12 months. However, the U.S. government may cancel any contract at any time through a termination for convenience. Most of our contracts have terms that would permit us to recover all or a portion of our incurred costs and fees for work performed in the event of a termination for convenience.
Funded orders received decreased approximately
$361.8 million
to
$1.4 billion
during the twelve months ended
December 31, 2014
, as compared to the same period in
2013
primarily due to the timing of several large funded awards received in the twelve months ended
December 31, 2013
, on our Middle East and Afghanistan based programs.
Total backlog decreased by
$16.6 million
in the twelve months ended
December 31, 2014
, due primarily to certain Middle East and Afghanistan programs won in 2010 and 2011 nearing the end of their five year period of performance contract life cycle. As of
December 31, 2014
, total backlog (funded and unfunded) was
$2.9 billion
.
|
|
Year Ended December 31,
|
||||||
|
(In millions)
|
2014
|
|
2013
|
||||
|
Funded backlog
|
$
|
814
|
|
$
|
647
|
|
|
|
Unfunded backlog
|
2,038
|
|
2,222
|
|
|||
|
Total backlog
|
$
|
2,852
|
|
$
|
2,869
|
|
|
LIQUIDITY AND CAPITAL RESOURCES
Liquidity
Historically, we have generated operating cash flow sufficient to fund our working capital, capital expenditure and financing requirements. We expect to fund our ongoing working capital, capital expenditure and financing requirements through cash flows from operations, cash on hand and access to capital markets.
If our cash flows from operations are less than we expect, we may need to access the long-term or short-term capital markets. Although we believe that our current financing arrangements will permit us to finance our operations on acceptable terms and conditions, our access to and the availability of financing on acceptable terms and conditions in the future will be impacted by many factors, including: (i) our credit ratings or absence of a credit rating, (ii) the liquidity of the overall capital markets and (iii) the current state of the economy. We cannot provide assurance that such financing will be available to us on acceptable terms or that such financing will be available at all.
Prior to the Spin-off, the majority of our operations participated in U.S. and international cash management and funding arrangements managed by Exelis where cash was swept from our balance sheet daily and cash to meet our operating and investing needs was provided as needed by Exelis. Transfers of cash both to and from these arrangements are reflected as a component of "Parent company equity" for periods prior to September 27, 2014 in the Consolidated and Combined Balance Sheets.
The cash presented on our balance sheet consists of U.S. and international cash from wholly owned subsidiaries. The Company does not currently expect that it will be required to repatriate undistributed earnings of foreign subsidiaries. We expect our U.S. domestic cash resources will be sufficient to fund our U.S. operating activities and cash commitments for financing activities. Approximately
$0.7 million
of our total
$42.8 million
in cash at
December 31, 2014
, is held by our foreign subsidiaries and is not available to fund U.S. operations unless repatriated.
In connection with the Spin-off, we entered into a term loan in the aggregate principal amount of
$140.0 million
and a five-year senior secured revolving credit facility (the Revolver) which permits borrowings up to
$75.0 million
, of which
$35.0 million
will be available for the issuance of letters of credit (see Note 6, "Debt" in the Notes to the Consolidated and Combined Financial Statements). Net proceeds from the term loan were used to fund a
$136.3 million
distribution to a subsidiary of Exelis on September 26, 2014. As of
December 31, 2014
, our cash balance was
$42.8 million
43
Dividends
We do not currently plan to pay a regular dividend on our common stock. The declaration of any future cash dividends and if declared, the amount of any such dividends, will depend upon our financial condition, earnings, capital requirements, financial covenants and other contractual restrictions and the discretion of our Board of Directors. In deciding whether to pay future dividends on our common stock, our Board of Directors may take into account such matters as general business conditions, industry practice, our financial condition and performance, our future prospects, our cash needs and capital investment plans, income tax consequences, applicable law and such other factors as our Board of Directors may deem relevant.
Sources and Uses of Liquidity
The following table sets forth net cash provided by operating activities, investing and financing activities for the years ended
December 31, 2014
,
December 31, 2013
and
December 31, 2012
.
Accounts receivable and unbilled receivables are the principal components of our working capital and are generally driven by our level of revenue with other short-term fluctuations related to payment practices by our customers and the timing of our billings. Our receivables reflect amounts billed to our customers, as well as the revenue that was recognized in the preceding month, which is normally billed the month following each balance sheet date.
The total amount of our accounts receivable can vary significantly over time and is sensitive to revenue levels and the timing of payments received from our customers. Days sales outstanding (DSO) is a metric used to monitor accounts receivable levels. Our DSO was
68
and
67
days as of
December 31, 2014
and
December 31, 2013
, respectively.
|
|
|
Year Ended December 31,
|
||||||||||
|
(In thousands)
|
|
2014
|
|
2013
|
|
2012
|
||||||
|
Operating Activities
|
|
$
|
42,979
|
|
$
|
92,792
|
|
$
|
115,869
|
|
||
|
Investing Activities
|
|
(3,350
|
)
|
(2,429
|
)
|
(2,564
|
)
|
|||||
|
Financing Activities
|
|
(6,607
|
)
|
(94,924
|
)
|
(113,753
|
)
|
|||||
|
Foreign Exchange
|
|
(645
|
)
|
607
|
|
1,052
|
|
|||||
|
Net change in cash
|
|
$
|
32,377
|
|
$
|
(3,954
|
)
|
$
|
604
|
|
||
Net cash provided by operating activities decreased by
$49.8 million
for the year ended
December 31, 2014
, as compared to the year ended
December 31, 2013
, due to lower net income of
$61.6 million
and lower contributions from accounts receivables of
$79.9 million
due to strong collections in 2013. These changes were partially offset by (i) changes in accounts payable of
$57.2 million
driven by the timing of payments to vendors, (ii) deferred taxes of
$27.2 million
, primarily due to the changes in unbilled receivables, billings in excess of cost, compensation accruals and tax amortization of goodwill in 2013 compared to 2014, (iii) compensation and other employee benefits of
$6.8 million
driven primarily by the lower costs associated with the revenue decline and (iv) other liabilities of
$1.0 million
due to the addition of the current portion of the long-term debt.
Net cash provided by operating activities decreased by
$23.1 million
for the year ended December 31, 2013 as compared to the year ended December 31, 2012, primarily due to (i) changes in accounts payable of
$61.0 million
driven by the timing of payments to vendors, (ii) changes in compensation and other benefits of
$27.9 million
driven by timing of payments, (iii) changes in other liabilities of
$13.9 million
due to income tax expenses allocated by Exelis and (iv) changes in deferred taxes of
$8.7 million
primarily due to the changes in unbilled receivables, compensation accruals and tax amortization of goodwill, partially offset by increases in accounts receivable of
$76.9 million
and net income of
$9.7 million
.
Net cash of
$3.4 million
,
$2.4 million
and
$2.6 million
was used in investing activities, primarily for capital expenditures, for the years ended
December 31, 2014
,
December 31, 2013
and
December 31, 2012
, respectively.
Net cash used by financing activities increased for the year ended
December 31, 2014
compared to the year ended
December 31, 2013
due to
$140.0 million
received from our term loan facility, net of
$3.7 million
of debt issuance costs (see Note 6, "Debt" in the Notes to the Consolidated and Combined Financial Statements) and
$2.6 million
in repayments of the term loan facility made in 2014. These changes were offset by a distribution to a subsidiary of Exelis of
$136.3 million
, a final working capital adjustment payment from Exelis to the Company of
$2.6
44
million
and transfers to and from Exelis. The components of net transfers include: (i) cash deposits from the Company to Exelis, (ii) cash borrowings Exelis used to fund operations, capital expenditures or acquisitions, (iii) charges (benefits) for income taxes, and (iv) allocations of the corporate expenses of Exelis described in Note 15, “Related Party Transactions and Parent Company Equity,” in the Notes to Consolidated and Combined Financial Statements. In addition, $0.2 million was used in the payment of employee withholding taxes on share-based compensation.
Changes in cash provided by and used in financing activities for the years ended December 31, 2013 and December 31, 2012 were due to transfers to and from Exelis. The components of net transfers include: (i) cash deposits from the Company to Exelis, (ii) cash borrowings Exelis used to fund operations, capital expenditures or acquisitions, (iii) charges (benefits) for income taxes, and (iv) allocations of the corporate expenses of Exelis described in Note 15, “Related Party Transactions and Parent Company Equity,” in the Notes to Consolidated and Combined Financial Statements.
Capital Resources
At
December 31, 2014
, the Company held cash of
$42.8 million
, which included
$0.7 million
held by foreign subsidiaries, and had
$60.6 million
of available borrowing capacity under the Revolver which expires on September 17, 2019. We believe that our cash at
December 31, 2014
, as supplemented by cash flows from operations and the Revolver, will be sufficient to fund our anticipated operating costs, capital expenditures and current debt repayment obligations for at least the next 12 months.
Contractual Obligations
Our commitments to make future payments under long-term contractual obligations were as follows, as of
December 31, 2014
:
|
Payments Due by Period
|
||||||||||||||||
|
(In thousands)
|
|
Less than 1 year
|
|
|
||||||||||||
|
Contractual Obligations
|
Total
|
1 - 3 Years
|
3 - 5 Years
|
|||||||||||||
|
Operating leases
|
$
|
7,091
|
|
$
|
2,590
|
|
$
|
3,370
|
|
$
|
1,131
|
|
||||
|
Principal payments on Term Facility
|
137,375
|
|
11,375
|
|
65,625
|
|
60,375
|
|
||||||||
|
Interest on Term Facility and Revolving Facility Fees¹
|
14,311
|
|
3,967
|
|
9,445
|
|
899
|
|
||||||||
|
Total
|
$
|
158,777
|
|
$
|
17,932
|
|
$
|
78,440
|
|
$
|
62,405
|
|
||||
|
¹ There were no outstanding borrowings on the Revolver at December 31, 2014
|
||||||||||||||||
At
December 31, 2014
, Vectrus had gross unrecognized tax benefits of
$7.6 million
, which are not reflected in the table above. We anticipate that approximately
$6.9 million
of the unrecognized tax benefits would, if recognized, affect our effective tax rate. We believe the majority of our uncertain tax positions at
December 31, 2014
will significantly decrease within twelve months of the reporting date due to the resolution of examinations. The IRS is currently conducting an examination for tax years 2009 - 2012.
In addition, as part of the Spin-off, Exelis indemnified Vectrus for a receivable of approximately
$11.4 million
. The Company recorded a corresponding liability as we are contractually required to remit payment to Exelis for amounts collected related to the indemnified receivable.
Off-Balance Sheet Arrangements
We have obligations relating to operating leases, as discussed above, and letters of credit outstanding. Our Revolver permits borrowings up to
$75.0 million
, of which
$35.0 million
is available for the issuance of letters of credit. As of
December 31, 2014
, there were
six
letters of credit outstanding in the aggregate amount of
$14.4 million
, which reduced our borrowing availability to
$60.6 million
under the Revolver. These arrangements have not had and management does not believe it is likely that they will in the future have, a material effect on our liquidity, capital resources, operations or financial condition. At
December 31, 2013
, we had no material off-balance sheet arrangements other than operating leases.
45
CRITICAL ACCOUNTING POLICIES, ESTIMATES AND JUDGMENTS
The preparation of financial statements in conformity with GAAP requires management to make estimates and assumptions that affect the reported amounts of assets and liabilities, the disclosure of contingent assets and liabilities at the date of the financial statements and the reported amounts of revenue and expenses during the reporting periods. Estimates are revised as additional information becomes available. Management believes that the accounting estimates employed and the resulting balances are reasonable; however, actual results in these areas could differ from management's estimates under different assumptions or conditions.
Significant accounting policies used in the preparation of the Consolidated and Combined Financial Statements are discussed in Note 1, "Description of Business and Summary of Significant Accounting Policies," in the Notes to the Consolidated and Combined Financial Statements. We believe that the assumptions and estimates associated with revenue recognition, goodwill impairment assessments and income taxes have the greatest potential impact on our financial statements because they are inherently uncertain, involve significant judgments, include areas where different estimates reasonably could materially impact the financial statements. These significant critical accounting policies are discussed in this section. Management believes that the accounting estimates employed and the resulting balances are reasonable; however, actual results in these areas could differ from management's estimates under different assumptions or conditions.
Revenue Recognition
As a defense contractor engaging in long-term contracts, substantially all of our revenue is derived from long-term service contracts for which revenue is recognized under the percentage-of-completion method based on units of delivery or percentage of costs incurred to total costs. For units of delivery, revenue and profits are recognized based upon the ratio of actual units delivered to estimated total units to be delivered under the contract. Under the cost-to-total cost method, revenue is recognized based upon the ratio of costs incurred to estimated total costs at completion. Revenue under cost-reimbursement contracts is recorded as costs are incurred and includes estimated earned fees or profits calculated on the basis of the relationship between costs incurred and total estimated costs. Revenue and profits on time-and-material type contracts are recognized based on billable rates multiplied by direct labor hours incurred plus material and other reimbursable costs incurred. The completed contract method is utilized when reasonable and reliable cost estimates for a project cannot be made. Amounts invoiced to customers in excess of revenue recognized are recorded as deferred revenue, until the revenue recognition criteria are satisfied, and are recorded as Billings in excess of costs in the accompanying balance sheet. Revenue that is earned and recognized in excess of amounts invoiced is recorded as a component of receivables.
During the performance of long-term sale contracts, estimated final contract prices and costs are reviewed periodically and revisions are made as required and recorded in income in the period in which they are determined. Additionally, the fees under certain contracts may be increased or decreased in accordance with cost or performance incentive provisions which measure actual performance against established targets or other criteria. Such incentive fee awards or penalties are included in revenue when there is sufficient information to reasonably assess anticipated contract performance. Amounts representing contract change orders, claims, requests for equitable adjustment, or limitations in funding on contracts are recorded only if it is probable the claim will result in additional contract revenue and the amounts can be reliably estimated. As of
December 31, 2014
, there were no material unapproved claims or unapproved change orders. Provisions for estimated losses on uncompleted long-term contracts are made in the period in which such losses are determined and are recorded as a component of cost of revenue. Contract revenue and cost estimates are reviewed and reassessed periodically. Changes in these estimates could result in recognition of cumulative catch-up adjustments to the contract’s inception to date revenue, cost of revenue and profit in the period in which such changes are made, based on a contract’s percent complete. Changes in revenue and cost estimates could also result in a forward loss or an adjustment to a forward loss. The net effect of the favorable and unfavorable changes in contract estimates for the year ended
December 31, 2014
was de minimis. The net effect of the favorable and unfavorable changes in contract estimates for the years ended
December 31, 2013
and
2012
was an increase in operating income of approximately
$38.3 million
and
$10.8 million
, respectively. The gross aggregate effects of these favorable and unfavorable changes in estimates in
2014
,
2013
and
2012
were
$4.0 million
,
$42.2 million
and
$11.9 million
favorable to operating income and
$6.6 million
,
$3.9 million
and
1.1 million
unfavorable operating income, respectively.
Of the
$6.6 million
unfavorable change in contract estimates in 2014, $2.5 million is due to the TARS program, which was retained by Exelis. The aggregate cumulative catch-up adjustment for the year ended December 31, 2013 of
$38.3 million
relates to operational efficiencies and non-recurring contract modifications on Afghanistan and Middle East programs. Operational efficiencies relate primarily to cost savings from decreased staffing levels due
46
to productivity improvements on maturing contracts, decreased subcontract work as we in-sourced work at reduced costs, and lower administrative support required to operate maturing contracts. We believe operational efficiencies achieved in 2013 will translate into lower future revenue and profit as current contracts come up for re-competition. Non-recurring contract modifications relate to one time favorable or unfavorable contract modifications. In certain circumstances, pricing for contract elements, or contract line items, is finalized during or after work commences on the specified activity. We had two contracts with open contract elements in 2013 related to performance in 2011, 2012 and 2013. The uncertainties around final fee and pricing negotiations were resolved favorably in the second and third quarters of 2013. We do not expect similar contract modifications on current contracts to occur in the future. This is consistent with our recent cumulative catch-up experience which resulted in only a de minimis favorable adjustment, excluding the impact of the TARS program retained by Exelis, to the year ended
December 31, 2014
.
Aggregate revenue from our four largest contracts was approximately
$822.0 million
, or
68%
, of our revenue for the year ended
December 31, 2014
. These contracts are as follows:
|
•
|
Kuwait Base Operations and Security Support Services (K-BOSSS), performance commenced in February 2011 with a base period (eight months) and four option years with a contractual expiration date of September 2015 (to date the customer has exercised four option years);
|
|
•
|
Operations, Maintenance and Defense of Army Communications in Southwest Asia and Central Asia (OMDAC-SWACA), performance commenced in July 2013 with a base period (11 months) and four option years with a contractual expiration date of May 2018 (to date the customer has exercised one option year);
|
|
•
|
Logistics Civilian Augmentation Program (LOGCAP) is a subcontract basic ordering agreement with task orders awarded at the discretion of the prime contractor, the current task order runs through June 2015, and the basic ordering agreement period of performance expires in June 2018; and
|
|
•
|
Kuwait based Army Prepositioned Stocks-5 (APS-5 Kuwait), performance commenced in March 2010 with a base period and four option years (to date the customer has exercised all four option years and the period of performance has been extended with a four-month contract with two one-month options with a contractual expiration date of August 2015).
|
Option exercises are at the sole discretion of the U.S. Government. Changes in contract revenue and cost estimates on these four contracts could result in significant cumulative catch-up adjustments to the contract’s inception to date revenue, cost of revenue and profit in the period in which such changes are made. Contract estimates are based on various assumptions to project the outcome of future events that often span several years. These assumptions include labor productivity and availability; the complexity of the work to be performed; the cost and availability of materials; and the performance of subcontractors. Due to the significance of judgment in the estimated final contract prices and costs, it is likely that materially different revenue, cost of revenue and profit amounts could be recorded if we used different assumptions, or if the underlying circumstances were to change. Changes in underlying assumptions/estimates, or other circumstances, may adversely or positively affect financial performance in future periods.
The table below presents the percentage of our total revenue generated from each contract type for the years ended
December 31, 2014
,
2013
and
2012
:
|
|
|
December 31,
|
|||||||
|
Contract type
|
|
2014
|
|
2013
|
2012
|
||||
|
Firm-Fixed-Price
|
|
24
|
%
|
28
|
%
|
25
|
%
|
||
|
Cost-Plus and Cost Reimbursable ¹
|
|
76
|
%
|
72
|
%
|
75
|
%
|
||
|
Total Revenue
|
|
100
|
%
|
100
|
%
|
100
|
%
|
||
|
¹ Includes time and material contracts
|
|
|
|
|
|
|
|||
Goodwill
We test goodwill for impairment as of October 1 each year, or more frequently as circumstances indicate it is necessary. Testing compares the estimated fair values of our reporting unit to the reporting unit carrying value. We consider a variety of factors when estimating the fair value of our reporting unit, including estimates about the future
47
operating results of the reporting unit, multiples of earnings, various market analyses, and recent sales of comparable businesses, if such information is available to us. The Company makes a variety of estimates and judgments about the relevance and comparability of these factors to the reporting unit in estimating their fair values. If the carrying value of our reporting unit exceeds its estimated fair value, the fair value of the reporting unit is allocated to the reporting unit’s assets and liabilities to determine the implied fair value of the reporting unit’s goodwill and whether impairment is necessary. No impairment charges related to goodwill have been recorded during
2014
,
2013
and
2012
.
Income Taxes
Our income taxes as presented are calculated on a separate tax return basis, although our operations have historically been included in the U.S. Federal and state tax returns or non-U.S. jurisdictions tax returns of Exelis. The global tax model of Exelis has been developed based on its entire portfolio of businesses. Accordingly, our tax results as presented are not necessarily reflective of the tax results that we would have generated on a stand-alone basis.
Prior to Spin-off, we did not maintain taxes payable to or from Exelis and we were deemed to settle the annual current tax balances immediately with the legal tax paying entities in the respective jurisdictions. These settlements were reflected as changes in parent company equity. Any taxes prior to the Spin-off are addressed in the Tax Matters Agreement with Exelis (See Part IV, Item 15, Note 15, "Related Party Transactions and Parent Company Equity" in the Notes to Consolidated and Combined Financial Statements). Subsequent to the Spin-off, we will file our own consolidated tax return and we maintain our own standalone taxes payable based on our post Spin-off activity.
We determine the provision for income taxes using the asset and liability approach. Under this approach, deferred tax assets and liabilities are determined based on temporary differences between the financial reporting and tax bases of assets and liabilities, applying enacted tax rates in effect for the year in which we expect the differences will reverse. Based on the evaluation of available evidence, we recognize future tax benefits, such as net operating loss carryforwards, to the extent that we believe it is more likely than not we will realize these benefits. We periodically assess the likelihood that we will be able to recover our deferred tax assets and reflect any changes to our estimate of the amount we are more likely than not to realize in the valuation allowance, with a corresponding adjustment to earnings or other comprehensive income (loss), as appropriate. We believe all our deferred tax assets are realizable, as such, we do not believe a valuation allowance is required.
Our effective tax rate reflects the impact of certain undistributed foreign earnings for which we have not provided U.S. taxes because we plan to reinvest such earnings indefinitely outside the United States. We plan foreign earnings remittance amounts based on projected cash flow needs, as well as the working capital and long-term investment requirements of our foreign subsidiaries and our domestic operations. Based on these assumptions, we estimate the amount we will distribute to the United States and provide the U.S. Federal taxes due only on these amounts. Material changes in our estimates of cash, working capital and long-term investment requirements in the various jurisdictions in which we do business could impact our actual remittance amounts and, accordingly, our effective tax rate.
The calculation of our tax liabilities involves dealing with uncertainties in the application of complex tax regulations in a multitude of jurisdictions across our global operations. We recognize potential liabilities and record tax liabilities for anticipated tax audit issues in the U.S. and other tax jurisdictions based on our estimate of whether, and the extent to which, additional taxes will be due. Furthermore, we recognize the tax benefit from an uncertain tax position only if it is more likely than not that the tax position will be sustained on examination by the taxing authorities, based on the technical merits of the position. The tax benefits recognized in the financial statements from such a position are measured based on the largest benefit that has a greater than 50% likelihood of being realized upon ultimate settlement.
We adjust our liability for unrecognized tax benefits in light of changing facts and circumstances; however, due to the complexity of some of these uncertainties, the ultimate resolution may result in a payment that is materially different from our current estimate of the tax liabilities. If our estimate of tax liabilities proves to be less than the ultimate assessment, an additional tax expense would result. If a payment of these amounts ultimately proves to be less than the recorded amounts, the reversal of the liabilities would result in tax benefits being recognized in the period when we determine the liabilities are no longer necessary to be provided.
48
New Accounting Pronouncements
See Part IV, Item 15, Note 2, "Recent Accounting Pronouncements" in the Notes to Consolidated Combined Financial Statements included in this Annual Report on Form 10-K for information regarding accounting pronouncements and accounting standards updates.
ITEM 7A.
QUANTITATIVE AND QUALITATIVE DISCLOSURES ABOUT MARKET RISK
Vectrus has limited exposure to foreign currency exchange risk as the substantial majority of our business is conducted in U.S. dollars. As a business area within Exelis prior to the Spin-off, Vectrus did not directly experience exposure to the impacts of certain market risks, including those related to equity price risk and interest rate risk. Following the Spin-off, we are subject to interest rate risk with our Senior Secured Term Facility and Revolver, as both require us to pay interest on outstanding borrowings at variable rates. Each one percentage point change associated with the Term Loan Facility would result in a
$1.4 million
change in our annual cash interest expenses. Assuming our Revolver was fully drawn to a principal amount equal to
$75.0 million
, each one percentage point change in interest rates would result in a
$0.8 million
change in our annual cash interest expense.
ITEM 8.
FINANCIAL STATEMENTS AND SUPPLEMENTARY DATA
See Index to Consolidated and Combined Financial Statements herein.
ITEM 9.
CHANGES IN AND DISAGREEMENTS WITH ACCOUNTANTS ON ACCOUNTING AND FINANCIAL DISCLOSURE
None.
ITEM 9A.
CONTROLS AND PROCEDURES
Disclosure Controls and Procedures
The Company's management, with the participation of the Company's Chief Executive Officer and the Chief Financial Officer, has evaluated the effectiveness of the Company's disclosure controls and procedures (as defined in Rules 13a-15(e) and 15 d-15(e) under the Securities Exchange Act of 1934, as amended (the Exchange Act) as of
December 31, 2014
. Based on such evaluation, the Chief Executive Officer and President and Chief Financial Officer concluded that, as of
December 31, 2014
, the Company’s disclosure controls and procedures were effective to ensure that information required to be disclosed in reports the Company files or submit under the Exchange Act is (i) recorded, processed, summarized and reported within the time periods specified in SEC rules and forms, and (ii) accumulated and communicated to management to allow timely decisions regarding required disclosure. Any controls and procedures, no matter how well designed and operated, can provide only reasonable assurance of achieving the desired control objectives.
Changes in Internal Control over Financial Reporting
We evaluated the changes in internal control over financial reporting that occurred during the three months ended
December 31, 2014
, and concluded that no change occurred in our internal control over financial reporting during the Company’s fourth fiscal quarter ended
December 31, 2014
, that materially affected, or is reasonably likely to materially affect, our internal control over financial reporting.
Management's Annual Report on Internal Control over Financial Reporting
This Annual Report on Form 10-K does not include a report of management’s assessment regarding internal control over financial reporting or an attestation report of our registered public accounting firm due to a transition period established by the rules of the SEC for newly public companies.
ITEM 9B.
OTHER INFORMATION
None.
49
ITEM 10.
DIRECTORS, EXECUTIVE OFFICERS AND CORPORATE GOVERNANCE
The information called for by Item 10 is incorporated herein by reference to the definitive proxy statement for the Company’s 2015 annual meeting of shareholders to be filed within 120 days after the Company's fiscal year ended
December 31, 2014
pursuant to Regulation 14A of the Exchange Act. The information called for by Item 10 with respect to executive officers is set forth above in Part I, Item 1, Description of Business.
The Company filed with the SEC, as exhibits to the Company’s Annual Report on Form 10-K, the certifications required under Section 302 of the Sarbanes-Oxley Act for its Chief Executive Officer and Chief Financial Officer.
ITEM 11.
EXECUTIVE COMPENSATION
The information called for by Item 11 is incorporated herein by reference to the definitive proxy statement referred to in Item 10.
ITEM 12.
SECURITY OWNERSHIP OF CERTAIN BENEFICIAL OWNERS AND MANAGEMENT AND RELATED STOCKHOLDER MATTERS
The information called for by Item 12 is incorporated herein by reference to the definitive proxy statement referred to in Item 10.
ITEM 13.
CERTAIN RELATIONSHIPS AND RELATED TRANSACTIONS AND DIRECTOR INDEPENDENCE
The information called for by Item 13 is incorporated herein by reference to the definitive proxy statement referred to in Item 10.
ITEM 14.
PRINCIPAL ACCOUNTING FEES AND SERVICES
The information called for by Item 14 is incorporated herein by reference to the definitive proxy statement referred to in Item 10.
ITEM 15.
EXHIBITS AND FINANCIAL STATEMENT SCHEDULES
|
(a)
|
Documents filed as a part of this report:
|
|
1.
|
See Index to Consolidated and Combined Financial Statements appearing on F-1 for a list of the financial statements filed as a part of this report.
|
|
2.
|
See Exhibit Index beginning on page 51 for a list of the exhibits filed or incorporated herein as a part of this report.
|
|
(b)
|
Financial Statement Schedules are omitted because of the absence of the conditions under which they are required or because the required information is included in the Consolidated and Combined Financial Statements filed as part of this report.
|
50
ITEM 8.
FINANCIAL STATEMENTS AND SUPPLEMENTARY DATA
VECTRUS, INC.
Index to Consolidated and Combined Financial Statements
|
Page No.
|
||
F-1
REPORT OF INDEPENDENT REGISTERED PUBLIC ACCOUNTING FIRM
To the Board of Directors and Shareholders of
Vectrus, Inc.
Colorado Springs, Colorado
We have audited the accompanying consolidated and combined balance sheets of Vectrus, Inc. (the "Company") as of December 31, 2014 and 2013, respectively, and the related consolidated and combined statements of income, comprehensive income, cash flows, and shareholders’ and parent company equity for each of the three years in the period ended December 31, 2014. These consolidated and combined financial statements are the responsibility of the Company's management. Our responsibility is to express an opinion on these financial statements based on our audits.
We conducted our audits in accordance with the standards of the Public Company Accounting Oversight Board (United States). Those standards require that we plan and perform the audit to obtain reasonable assurance about whether the financial statements are free of material misstatement. The Company is not required to have, nor were we engaged to perform, an audit of its internal control over financial reporting. Our audits included consideration of internal control over financial reporting as a basis for designing audit procedures that are appropriate in the circumstances, but not for the purpose of expressing an opinion on the effectiveness of the Company's internal control over financial reporting. Accordingly, we express no such opinion. An audit also includes assessing the accounting principles used and significant estimates made by management, as well as evaluating the overall financial statement presentation. We believe that our audits provide a reasonable basis for our opinion.
In our opinion, such consolidated and combined financial statements present fairly, in all material respects, the financial position of Vectrus, Inc. as of December 31, 2014 and 2013, and the results of its operations and its cash flows for each of the three years in the period ended December 31, 2014, in conformity with accounting principles generally accepted in the United States of America.
As described in Note 1 to the consolidated and combined financial statements, on and prior to September 26, 2014, the combined financial statements were prepared from the separate records maintained by the Company and may not necessarily be indicative of the conditions that would have existed or the results of operations of the Company had it been operated as an independent entity.
/s/ DELOITTE & TOUCHE LLP
Denver, Colorado
March 16, 2015
F-2
VECTRUS, INC.
|
Year Ended December 31,
|
||||||||||||
|
(In thousands, except per share data)
|
2014
|
2013
|
2012
|
|||||||||
|
Revenue
|
$
|
1,203,269
|
|
$
|
1,511,638
|
|
$
|
1,828,364
|
|
|||
|
Cost of revenue
|
1,084,512
|
|
1,297,089
|
|
1,635,697
|
|
||||||
|
Selling, general and administrative expenses
|
80,340
|
|
83,227
|
|
82,316
|
|
||||||
|
Operating income
|
38,417
|
|
131,322
|
|
110,351
|
|
||||||
|
Interest (expense) income, net
|
(1,526
|
)
|
111
|
|
45
|
|
||||||
|
Income from continuing operations before income taxes
|
36,891
|
|
131,433
|
|
110,396
|
|
||||||
|
Income tax expense
|
14,079
|
|
47,041
|
|
35,731
|
|
||||||
|
Net income
|
$
|
22,812
|
|
$
|
84,392
|
|
$
|
74,665
|
|
|||
|
Earnings Per Share ¹
|
||||||||||||
|
Basic
|
$
|
2.18
|
|
$
|
8.06
|
|
$
|
7.13
|
|
|||
|
Diluted
|
$
|
2.13
|
|
$
|
8.06
|
|
$
|
7.13
|
|
|||
|
Weighted average common shares outstanding - basic
|
10,476
|
|
10,474
|
|
10,474
|
|
||||||
|
Weighted average common shares outstanding - diluted
|
10,692
|
|
10,474
|
|
10,474
|
|
||||||
|
¹ For periods ended September 27, 2014 and prior, basic and diluted earnings per share are computed using the number of shares of Vectrus common stock outstanding on September 27, 2014, the date on which the Vectrus common stock was distributed to the shareholders of Exelis Inc.
|
||||||||||||
The accompanying notes are an integral part of the Consolidated and Combined Financial Statements.
F-3
VECTRUS, INC.
CONSOLIDATED AND COMBINED STATEMENTS OF COMPREHENSIVE INCOME
|
Year Ended December 31,
|
||||||||||||
|
(In thousands)
|
2014
|
2013
|
2012
|
|||||||||
|
Net income
|
$
|
22,812
|
|
$
|
84,392
|
|
$
|
74,665
|
|
|||
|
Other comprehensive income (loss), net of tax
|
||||||||||||
|
Foreign currency translation adjustments
|
(1,642
|
)
|
607
|
|
1,052
|
|
||||||
|
Total comprehensive income
|
$
|
21,170
|
|
$
|
84,999
|
|
$
|
75,717
|
|
|||
The accompanying notes are an integral part of the Consolidated and Combined Financial Statements.
F-4
VECTRUS, INC.
|
December 31,
|
||||||||
|
(in thousands, except share information)
|
2014
|
2013
|
||||||
|
Assets
|
||||||||
|
Current assets
|
||||||||
|
Cash
|
$
|
42,823
|
|
$
|
10,446
|
|
||
|
Receivables
|
202,732
|
|
227,534
|
|
||||
|
Costs incurred in excess of billings
|
7,112
|
|
6,199
|
|
||||
|
Other current assets
|
10,883
|
|
10,883
|
|
||||
|
Total current assets
|
263,550
|
|
255,062
|
|
||||
|
Plant, property and equipment, net
|
8,920
|
|
9,239
|
|
||||
|
Goodwill
|
216,930
|
|
222,460
|
|
||||
|
Long-term debt issuance costs, net
|
3,516
|
|
—
|
|
||||
|
Other non-current assets
|
6,575
|
|
2,403
|
|
||||
|
Total non-current assets
|
235,941
|
|
234,102
|
|
||||
|
Total Assets
|
$
|
499,491
|
|
$
|
489,164
|
|
||
|
Liabilities and Shareholders' Equity
|
||||||||
|
Current liabilities
|
||||||||
|
Accounts payable
|
$
|
114,487
|
|
$
|
109,701
|
|
||
|
Billings in excess of costs
|
5,806
|
|
12,706
|
|
||||
|
Compensation and other employee benefits
|
36,580
|
|
51,026
|
|
||||
|
Deferred tax liability
|
25,414
|
|
24,667
|
|
||||
|
Short-term debt
|
11,375
|
|
—
|
|
||||
|
Other accrued liabilities
|
37,073
|
|
10,086
|
|
||||
|
Total current liabilities
|
230,735
|
|
208,186
|
|
||||
|
Long-term debt
|
126,000
|
|
—
|
|
||||
|
Deferred tax liability
|
75,337
|
|
74,535
|
|
||||
|
Other non-current liabilities
|
13,544
|
|
15,111
|
|
||||
|
Total non-current liabilities
|
214,881
|
|
89,646
|
|
||||
|
Total liabilities
|
445,616
|
|
297,832
|
|
||||
|
Commitments and contingencies (Note 16)
|
|
|
||||||
|
Shareholders' Equity
|
||||||||
|
Preferred stock; $0.01 par value; 10,000,000 shares authorized; No shares issued and outstanding
|
—
|
|
—
|
|
||||
|
Common stock; $0.01 par value; 100,000,000 shares authorized; 10,484,974 shares issued and outstanding
|
105
|
|
—
|
|
||||
|
Additional paid in capital
|
52,967
|
|
—
|
|
||||
|
Retained earnings
|
3,331
|
|
—
|
|
||||
|
Parent company equity
|
—
|
|
192,218
|
|
||||
|
Accumulated other comprehensive loss
|
(2,528
|
)
|
(886
|
)
|
||||
|
Total shareholders' equity
|
53,875
|
|
191,332
|
|
||||
|
Total Liabilities and Shareholders' Equity
|
$
|
499,491
|
|
$
|
489,164
|
|
||
The accompanying notes are an integral part of the Consolidated and Combined Financial Statements.
F-5
VECTRUS, INC.
|
|
|
Year Ended December 31,
|
||||||||||
|
(In thousands)
|
|
2014
|
|
2013
|
|
2012
|
||||||
|
Operating activities
|
|
|
|
|
|
|
||||||
|
Net income
|
|
$
|
22,812
|
|
$
|
84,392
|
|
$
|
74,665
|
|
||
|
Adjustments to reconcile net income to net cash used in operating activities:
|
|
|||||||||||
|
Depreciation and amortization expense
|
|
2,149
|
|
2,631
|
|
3,035
|
|
|||||
|
Loss on disposal of property plant & equipment
|
|
103
|
|
40
|
|
—
|
|
|||||
|
Stock-based compensation
|
2,324
|
|
—
|
|
—
|
|
||||||
|
Amortization of debt issuance costs
|
185
|
|
—
|
|
—
|
|
||||||
|
Changes in assets and liabilities:
|
|
|||||||||||
|
Change in receivables
|
|
21,608
|
|
101,549
|
|
24,683
|
|
|||||
|
Change in other assets
|
|
(1,329
|
)
|
(3,770
|
)
|
(984
|
)
|
|||||
|
Change in accounts payable
|
|
6,169
|
|
(51,049
|
)
|
9,918
|
|
|||||
|
Change in billings in excess of costs
|
|
(5,266
|
)
|
(289
|
)
|
(5,285
|
)
|
|||||
|
Change in deferred taxes
|
|
11,282
|
|
(15,888
|
)
|
(7,197
|
)
|
|||||
|
Compensation and other employee benefits
|
|
(13,245
|
)
|
(20,053
|
)
|
7,871
|
|
|||||
|
Change in other liabilities
|
|
(3,813
|
)
|
(4,771
|
)
|
9,163
|
|
|||||
|
Net cash provided by operating activities
|
|
42,979
|
|
92,792
|
|
115,869
|
|
|||||
|
Investing activities
|
|
|||||||||||
|
Purchases of capital expenditures
|
|
(3,847
|
)
|
(2,429
|
)
|
(3,230
|
)
|
|||||
|
Proceeds from the disposition of assets
|
497
|
|
—
|
|
666
|
|
||||||
|
Net cash used in investing activities
|
|
(3,350
|
)
|
(2,429
|
)
|
(2,564
|
)
|
|||||
|
Financing activities
|
|
|||||||||||
|
Repayments of long-term debt
|
|
(2,625
|
)
|
—
|
|
—
|
|
|||||
|
Cash distribution to subsidiary of Exelis
|
|
(136,281
|
)
|
—
|
|
—
|
|
|||||
|
Proceeds from issuance of long-term debt
|
|
140,000
|
|
—
|
|
—
|
|
|||||
|
Payment of debt issuance costs
|
|
(3,701
|
)
|
—
|
|
—
|
|
|||||
|
Payment of employee withholding taxes on share-based compensation
|
(229
|
)
|
—
|
|
—
|
|
||||||
|
Working capital adjustment payment from Exelis
|
2,600
|
|
—
|
|
—
|
|
||||||
|
Transfer to Parent, net
|
|
(6,371
|
)
|
(94,924
|
)
|
(113,753
|
)
|
|||||
|
Net cash used in financing activities
|
|
(6,607
|
)
|
(94,924
|
)
|
(113,753
|
)
|
|||||
|
Exchange rate effect on cash
|
|
(645
|
)
|
607
|
|
1,052
|
|
|||||
|
Net change in cash
|
|
32,377
|
|
(3,954
|
)
|
604
|
|
|||||
|
Cash-beginning of year
|
|
10,446
|
|
14,400
|
|
13,796
|
|
|||||
|
Cash-end of year
|
|
$
|
42,823
|
|
$
|
10,446
|
|
$
|
14,400
|
|
||
|
Supplemental Disclosure of Cash Flow Information:
|
||||||||||||
|
Interest paid
|
$
|
1,201
|
|
$
|
—
|
|
$
|
—
|
|
|||
|
Income taxes paid
|
$
|
2,667
|
|
$
|
—
|
|
$
|
—
|
|
|||
|
Non-cash investing activities:
|
||||||||||||
|
Purchase of capital expenditures on account
|
$
|
92
|
|
$
|
277
|
|
$
|
—
|
|
|||
The accompanying notes are an integral part of the Consolidated and Combined Financial Statements.
F-6
VECTRUS, INC.
CONSOLIDATED AND COMBINED STATEMENTS OF SHAREHOLDERS' AND PARENT COMPANY EQUITY
|
Common Stock Issued
|
Additional Paid-in Capital
|
|
Accumulated Other Comprehensive Income
|
Net Parent Company Equity
|
Total Shareholders' Equity
|
||||||||||||||||||||||
|
(In thousands)
|
Shares
|
Amount
|
Retained Earnings
|
||||||||||||||||||||||||
|
Balance at December 31, 2011
|
—
|
|
$
|
—
|
|
$
|
—
|
|
$
|
—
|
|
$
|
(2,545
|
)
|
$
|
241,838
|
|
$
|
239,293
|
|
|||||||
|
Net income
|
—
|
|
—
|
|
—
|
|
—
|
|
—
|
|
74,665
|
|
74,665
|
|
|||||||||||||
|
Foreign currency translation adjustments
|
—
|
|
—
|
|
—
|
|
—
|
|
1,052
|
|
—
|
|
1,052
|
|
|||||||||||||
|
Transfer to parent, net
|
—
|
|
—
|
|
—
|
|
—
|
|
—
|
|
(113,753
|
)
|
(113,753
|
)
|
|||||||||||||
|
Balance at December 31, 2012
|
—
|
|
$
|
—
|
|
$
|
—
|
|
$
|
—
|
|
$
|
(1,493
|
)
|
$
|
202,750
|
|
$
|
201,257
|
|
|||||||
|
Net income
|
—
|
|
—
|
|
—
|
|
—
|
|
—
|
|
84,392
|
|
84,392
|
|
|||||||||||||
|
Foreign currency translation adjustments
|
—
|
|
—
|
|
—
|
|
—
|
|
607
|
|
—
|
|
607
|
|
|||||||||||||
|
Transfer to parent, net
|
—
|
|
—
|
|
—
|
|
—
|
|
—
|
|
(94,924
|
)
|
(94,924
|
)
|
|||||||||||||
|
Balance at December 31, 2013
|
—
|
|
$
|
—
|
|
$
|
—
|
|
$
|
—
|
|
$
|
(886
|
)
|
$
|
192,218
|
|
$
|
191,332
|
|
|||||||
|
Net income
|
—
|
|
—
|
|
—
|
|
3,331
|
|
—
|
|
19,481
|
|
22,812
|
|
|||||||||||||
|
Foreign currency translation adjustments
|
—
|
|
—
|
|
—
|
|
—
|
|
(1,642
|
)
|
—
|
|
(1,642
|
)
|
|||||||||||||
|
Transfer to parent, net
|
—
|
|
—
|
|
—
|
|
—
|
|
—
|
|
(6,371
|
)
|
(6,371
|
)
|
|||||||||||||
|
Distribution to subsidiary of Exelis
|
—
|
|
—
|
|
—
|
|
—
|
|
—
|
|
(136,281
|
)
|
(136,281
|
)
|
|||||||||||||
|
Spin-off related adjustments
|
—
|
|
—
|
|
—
|
|
—
|
|
—
|
|
(17,841
|
)
|
(17,841
|
)
|
|||||||||||||
|
Employee stock awards and stock options
|
11
|
|
—
|
|
(229
|
)
|
—
|
|
—
|
|
—
|
|
(229
|
)
|
|||||||||||||
|
Stock-based compensation
|
—
|
|
—
|
|
2,095
|
|
—
|
|
—
|
|
—
|
|
2,095
|
|
|||||||||||||
|
Reclassification of net parent equity to common stock and additional paid-in capital in conjunction with the Spin-off
|
10,474
|
|
105
|
|
51,101
|
|
—
|
|
—
|
|
(51,206
|
)
|
—
|
|
|||||||||||||
|
Balance at December 31, 2014
|
10,485
|
|
$
|
105
|
|
$
|
52,967
|
|
$
|
3,331
|
|
$
|
(2,528
|
)
|
$
|
—
|
|
$
|
53,875
|
|
|||||||
The accompanying notes are an integral part of the Consolidated and Combined Financial Statements.
F-7
NOTES TO CONSOLIDATED AND COMBINED FINANCIAL STATEMENTS
NOTE 1
DESCRIPTION OF BUSINESS AND SUMMARY OF SIGNIFICANT ACCOUNTING POLICIES
Our Business
Vectrus is a leading provider of services to the United States (U.S.) government worldwide. We operate in a single segment and offer services in three major capability areas: infrastructure asset management, logistics and supply chain management and information technology and network communication. Our infrastructure asset management services support the U.S. Army, Air Force and Navy and include infrastructure services, security, warehouse management and distribution, ammunition management, military base maintenance and operations, communications, emergency services, transportation, and life support activities at a number of critical global military installations. Our logistics and supply chain management services support and maintain the vehicle and equipment stocks of the U.S. Army and Marine Corps. Our information technology and network communication services consist of sustainment of communications systems, network security, systems installation and full life cycle management of information technology systems for the U.S. Army, Air Force and Navy.
Separation from Exelis Inc.
On September 27, 2014, Exelis completed the Spin-off of Vectrus, formerly Exelis' Mission Systems business, which was part of Exelis' Information and Technical Services segment. Effective as of 12:01 a.m., Eastern Time on September 27, 2014 (the Distribution Date), the common stock of Vectrus was distributed, on a pro rata basis, to Exelis shareholders of record as of the close of business on September 18, 2014 (the Record Date). On the Distribution Date, each of the shareholders of Exelis received
one
share of Vectrus common stock for every
18
shares of common stock of Exelis held on the Record Date. The Spin-off was completed pursuant to the Distribution Agreement, dated September 25, 2014, between Exelis and Vectrus (the Distribution Agreement). After the Distribution Date, Exelis does not beneficially own any shares of Vectrus common stock.
Vectrus' Registration Statement on Form 10 was declared effective by the SEC on September 8, 2014. Vectrus' common stock began trading “regular way” under the symbol "VEC" on the New York Stock Exchange (NYSE) on September 29, 2014.
In connection with the Spin-off, Vectrus entered in to a term loan agreement to fund a
$136.3 million
distribution to a subsidiary of Exelis that occurred on September 26, 2014. Specifically, on September 17, 2014, Vectrus entered into a
$140.0 million
term loan (See Note 6, "Debt"). As of
December 31, 2014
, Vectrus had cash of
$42.8 million
. In addition, certain assets and liabilities were transferred between Exelis and the Company in connection with the Spin-off (See Note 15, "Related Party Transactions and Parent Company Equity").
Unless the context otherwise requires, references in these notes to "Vectrus", "we," "us," "our," "the Company" and "our Company" refer to Vectrus, Inc. References in these notes to Exelis or "Parent" refer to Exelis Inc., an Indiana corporation, and its consolidated subsidiaries (other than Vectrus).
Principles of Consolidation
Vectrus consolidates companies in which it has a controlling financial interest. We account for investments in companies over which we have the ability to exercise significant influence, but do not hold a controlling interest under the equity method, and we record our proportionate share of income or losses in the Consolidated and Combined Statements of Operations. All intercompany transactions and balances between programs have been eliminated.
F-8
Principles of Combination and Basis of Presentation
The financial statements presented in this Annual Report on Form 10-K represent:
(i) periods prior to September 27, 2014 when we were part of Exelis (referred to as "Combined Financial Statements") and
(ii) the period as of and subsequent to September 27, 2014 when we became a separate publicly-traded company (referred to as "Consolidated Financial Statements").
The Consolidated and Combined Financial Statements reflect the consolidated operations of Vectrus as a separate stand-alone entity beginning on September 27, 2014. Our historical Consolidated and Combined Financial Statements have been prepared on a stand-alone basis and have been derived from the consolidated financial statements of Exelis and accounting records of Exelis. The Consolidated and Combined Financial Statements reflect our financial position, results of operations and cash flows as we were historically managed, in conformity with GAAP.
All intercompany transactions and balances between programs have been eliminated. Prior to September 26, 2014, all intercompany transactions between Vectrus and Exelis have been included in these Consolidated and Combined Financial Statements and were considered to be effectively settled for cash at the time the transaction was recorded. The total net effect of the settlement of these intercompany transactions is reflected in the Consolidated and Combined Statements of Cash Flows as a financing activity and in the Consolidated and Combined Balance Sheets as “Parent company equity.”
Prior to September 27, 2014, our Consolidated and Combined Financial Statements included expenses of Exelis allocated to us for certain functions provided by Exelis, including, but not limited to, general corporate expenses related to finance, legal, information technology, human resources, communications, ethics and compliance, shared services, employee benefits and incentives, insurance and stock-based compensation. These expenses were allocated to us on the basis of direct usage when identifiable, with the remainder allocated on the basis of revenue, headcount or other measures. We consider the basis on which the expenses had been allocated to be a reasonable reflection of the utilization of services provided to, or the benefit received by, us during the periods presented. The allocations may not, however, reflect the expense we would have incurred as an independent, publicly-traded company for the periods presented. Actual costs that may have been incurred if we had been a stand-alone company would depend on a number of factors, including the organization of our operations, what functions were outsourced or performed by employees and strategic decisions made in areas such as information technology and infrastructure. Following our Spin-off from Exelis, we are performing these functions using our own resources or purchased services. For an interim period, however, some of these functions will continue to be provided by Exelis under a transition services agreement, which generally has a term of
one
year or less for most services to be provided (See Note 15, "Related Party Transactions and Parent Company Equity"). In addition, in support of ongoing business, we have entered into subcontracts with Exelis whereby either we or Exelis serve as a subcontractor to the other on certain government contracts.
Exelis used a centralized approach to cash management and financing of its operations. Prior to the Spin-off, the majority of our cash was transferred to Exelis daily and Exelis funded our operating and investing activities as needed. Cash transfers to and from the cash management accounts of Exelis are reflected in the Consolidated and Combined Statements of Cash Flows as “Transfer to Parent, net.”
The Consolidated and Combined Financial Statements also include the push down of certain assets and liabilities that were historically held at the Exelis corporate level but were specifically identifiable or otherwise allocable to us. The cash and cash equivalents held by Exelis at the corporate level, prior to the Spin-off, were not specifically identifiable to the Company and therefore were not allocated to us for any of the periods presented. Cash in our Consolidated and Combined Balance Sheets represents cash held locally by entities included in our Consolidated and Combined Financial Statements. Third-party debt and the related interest expense of Exelis were not allocated to us for any of the periods presented as we are not the legal obligor of the debt and the Exelis borrowings were not directly attributable to our business.
Parent Company Equity
Parent company equity in the Consolidated and Combined Balance Sheets represents Exelis' historical investment in our accumulated net earnings after taxes and the net effect of the transactions with and allocations of general corporate expenses from Exelis and the transfer of assets and liabilities between Exelis and the Company in connection with the Spin-off.
F-9
Use of Estimates
The preparation of financial statements in conformity with GAAP requires management to make estimates and assumptions that affect the reported amounts of assets and liabilities, the disclosure of contingent assets and liabilities at the date of the financial statements and the reported amounts of revenue and expenses during the reporting periods. Estimates are revised as additional information becomes available. Estimates and assumptions are used for, but not limited to, revenue recognition, income tax contingency accruals, fair value and impairment of goodwill and valuation of assets and certain contingent liabilities. Actual results could differ from these estimates.
Revenue Recognition
As a defense contractor engaging in long-term contracts, the majority of our revenue is derived from long-term service contracts for which revenue is recognized under the percentage-of-completion method based on units of delivery or percentage of costs incurred to total costs. For units of delivery, revenue and profits are recognized based upon the ratio of actual units delivered to estimated total units to be delivered under the contract. Under the cost-to-total cost method, revenue is recognized based upon the ratio of costs incurred to estimated total costs at completion. Revenue under cost-reimbursement contracts is recorded as costs are incurred and includes estimated earned fees or profits calculated on the basis of the relationship between costs incurred and total estimated costs. Revenue and profits on time-and-material type contracts are recognized based on billable rates multiplied by direct labor hours incurred plus material and other reimbursable costs incurred. The completed contract method is utilized when reasonable and reliable cost estimates for a project cannot be made. Amounts invoiced to customers in excess of revenue recognized are recorded as deferred revenue, until the revenue recognition criteria are satisfied, and are recorded as Billings in excess of costs in the accompanying Consolidated and Combined Balance Sheets. Revenue that is earned and recognized in excess of amounts invoiced is recorded as a component of receivables.
During the performance of long-term sales contracts, estimated final contract prices and costs are reviewed periodically and revisions are made as required and recorded in income in the period in which they are determined. Additionally, the fees under certain contracts may be increased or decreased in accordance with cost or performance incentive provisions which measure actual performance against established targets or other criteria. Such incentive fee awards or penalties are included in revenue when there is sufficient information to reasonably assess anticipated contract performance. Amounts representing contract change orders, claims, requests for equitable adjustment, or limitations in funding on contracts are recorded only if it is probable the claim will result in additional contract revenue and the amounts can be reliably estimated. Provisions for estimated losses on uncompleted long-term contracts are made in the period in which such losses are determined and are recorded as a component of cost of revenue. Contract revenue and cost estimates are reviewed and reassessed periodically. Changes in these estimates could result in recognition of cumulative catch-up adjustments to the contract’s inception to date revenue, cost of revenue and profit in the period in which such changes are made, based on a contract’s percentage of completion. Changes in revenue and cost estimates could also result in a forward loss or an adjustment to a forward loss.
Cumulative catch-up adjustments are presented in the following table:
|
Year Ended December 31,
|
||||||||||||
|
(in thousands)
|
2014
|
2013
|
2012
|
|||||||||
|
Favorable adjustments
|
$
|
3,981
|
|
$
|
42,206
|
|
$
|
11,896
|
|
|||
|
Unfavorable adjustments ¹
|
(6,629
|
)
|
(3,906
|
)
|
(1,065
|
)
|
||||||
|
Net (unfavorable) favorable adjustments
|
$
|
(2,648
|
)
|
$
|
38,300
|
|
$
|
10,831
|
|
|||
|
¹ Of the $6.6 million unfavorable change in estimates in 2014, $2.5 million is due to the TARS program, which was retained by Exelis.
|
||||||||||||
For the
twelve
months ended
December 31, 2014
,
2013
and
2012
, we generated approximately
88%
,
92%
and
93%
, respectively, of our total revenue from the U.S. Army. Our
four
largest contracts amounted to approximately
$822.0 million
, or
68%
,
$1,037.6 million
, or
68.6%
, and
$1,246.2 million
, or
68.2%
, of our total revenue for the years ending
December 31, 2014
, 2013 and 2012, respectively.
Restructuring
We periodically initiate management approved restructuring activities to achieve cost savings through reduced operational redundancies and to strategically position ourselves in the market in response to prevailing economic conditions and associated customer demand. Costs associated with restructuring actions can include
F-10
severance and related benefit charges. For involuntary separation plans, a liability is recognized when it is probable and reasonably estimable. For voluntary separation plans, a liability is recognized when the employee irrevocably accepts the termination. For one-time termination benefits, such as additional severance pay or related benefit charges, the liability is measured and recognized initially at fair value in the period in which the liability is incurred, with subsequent changes to the liability recognized as adjustments in the period of change or if the employees are required to render services beyond a minimum retention period, the fair value of the severance or benefit payouts is recognized ratably over the future service period.
Income Taxes
We determine the provision for income taxes using the asset and liability approach. Under this approach, deferred income taxes represent the expected future tax consequences of temporary differences between the carrying amounts and tax basis of assets and liabilities.
We recognize tax benefits from uncertain tax positions only if it is more likely than not that the tax position will be sustained on examination by the taxing authorities, based on the technical merits of the position. The tax benefits recognized in the financial statements from such positions are measured based on the largest benefit that has a greater than
50%
likelihood of being realized upon ultimate settlement.
Prior to September 27, 2014, our income taxes as presented were calculated on a separate tax return basis, although our operations have historically been included in U.S. Federal and state tax returns or non-U.S. jurisdictions tax returns of Exelis. With the exception of certain dedicated foreign entities, we did not maintain taxes payable to or receivable from our parent and we were deemed to settle the annual current tax balances immediately with the legal tax-paying entities in the respective jurisdictions. These settlements were reflected as changes in parent company investment.
Foreign Currency Translation
The financial statements of programs for which the functional currency is not the U.S. dollar, are translated into U.S. dollars. Balance sheet accounts are translated at the exchange rate in effect at the end of each period; income statement accounts are translated at the average rates of exchange prevailing during the period. Gains and losses on foreign currency translations are recorded as translation adjustments to other comprehensive loss. Net gains or losses from foreign currency transactions are reported in Selling, General and Administrative (SG&A) expenses and have historically been immaterial.
Receivables
Receivables include amounts billed and currently due from customers, amounts unbilled, certain estimated contract change amounts, estimates related to expected award fees, claims or requests for equitable adjustment in negotiation that are probable of recovery, and amounts retained by the customer pending contract completion.
Plant, Property and Equipment, Net
Plant, property and equipment, net are stated at cost less accumulated depreciation. Major improvements are capitalized at cost while expenditures for maintenance, repairs and minor improvements are expensed. For asset sales or retirements, the assets and related accumulated depreciation and amortization are eliminated from the accounts and any resulting gain or loss is reflected in income.
Depreciation and amortization is generally computed using either an accelerated or straight-line method and is based on estimated useful lives or lease term as follows:
|
Years
|
||
|
Buildings and improvements
|
5 – 40
|
|
|
Machinery and equipment
|
3 – 10
|
|
|
Furniture, fixtures, and office equipment
|
3 – 7
|
|
F-11
Operating Leases
Many of our real property lease agreements contain incentives for tenant improvements, rent holidays, or rent escalation clauses. For incentives for tenant improvements, the Company records a deferred rent liability and amortizes the deferred rent over the term of the lease as a reduction to rent expense. For rent holidays and rent escalation clauses during the lease term, the Company records minimum rental expenses on a straight-line basis over the term of the lease. Leasehold improvements are amortized over the lesser of the remaining life of the lease or the estimated useful life of the improvement.
Long-Lived Asset Impairment
Long-lived assets are tested for impairment whenever events or changes in circumstances indicate their carrying value may not be recoverable. We assess the recoverability of long-lived assets based on the undiscounted future cash flow the assets are expected to generate and recognize an impairment loss when estimated undiscounted future cash flows expected to result from the use of the asset plus net proceeds expected from disposition of the asset, if any, are less than the carrying value of the asset. When an impairment is identified, we reduce the carrying value of the asset to its estimated fair value based on a discounted cash flow approach or, when available and appropriate, to comparable market values.
Goodwill
Goodwill represents purchase consideration paid in a business combination that exceeds the fair values assigned to the net assets of acquired businesses. Goodwill is not amortized, but instead is tested for impairment annually (or more frequently if impairment indicators arise, such as changes to the reporting unit structure or significant adverse changes in the business climate). We conduct our annual impairment testing on the first day of the fourth fiscal quarter. The impairment test is a two-step test. In the first step, the estimated fair value of the reporting unit is compared to the carrying value of the net assets assigned to the reporting unit. If the estimated fair value of the reporting unit exceeds its carrying value, goodwill is not impaired and the second step of the impairment test is not performed. If the carrying value of the reporting unit exceeds its estimated fair value, then the second step of the impairment test is performed in order to measure the impairment loss to be recorded. If the carrying value of the reporting unit's goodwill exceeds its implied fair value, then we record an impairment loss equal to the difference. We estimate the fair value of our reporting unit using an income approach and a market approach. Under the income approach, we estimate fair value based on the present value of estimated future cash flows. Under the market approach, we compare our company to select reasonably similar publicly traded companies.
Stock-Based Compensation
We recognize stock-based compensation expense primarily within SG&A expenses based on the grant date fair values, net of estimated forfeitures, for all share-based awards granted over the requisite service periods of the awards, which is generally equivalent to the vesting terms. Stock-based compensation expense from September 27, 2014 to
December 31, 2014
was
$2.3 million
. Prior to September 27, 2014, our employees and directors participated in equity incentive plans maintained by Exelis. Stock-based compensation expense related to the Exelis plans has historically been immaterial.
Fair Value Measurements
We determine fair value as the price that would be received to sell an asset or paid to transfer a liability in an orderly transaction between market participants at the measurement date. In measuring fair value, a fair value hierarchy is applied which categorizes and prioritizes the inputs used to estimate fair value into three levels. The fair value hierarchy is based on maximizing the use of observable inputs and minimizing the use of unobservable inputs when measuring fair value. Classification within the fair value hierarchy is based on the lowest level input that is significant to the fair value measurement. There are three levels of the fair value hierarchy. Level 1 inputs are quoted prices (unadjusted) in active markets for identical assets or liabilities. Level 2 inputs are other than quoted prices included within level 1 that are observable for the asset or liability, either directly or indirectly. Level 2 inputs include quoted prices (in nonactive markets or in active markets for similar assets or liabilities), inputs other than quoted prices that are observable, and inputs that are derived principally from or corroborated by observable market data by correlation or other means. Level 3 inputs are unobservable inputs for the assets or liabilities.
F-12
Segment Information
Management has concluded that the Company operates in one segment based upon the information used by the chief operating decision maker in evaluating the performance of the Company’s business and allocating resources and capital. While we perform services worldwide, all of our 2014 revenue was with the U.S. government.
Commitments and Contingencies
We record accruals for commitments and loss contingencies when they are probable of occurrence and the amounts can be reasonably estimated. In addition, legal fees are accrued for cases where a loss is probable and the related fees can be reasonably estimated. Significant judgment is required to determine both probability and the estimated amount of loss. We review these accruals quarterly and adjust the accruals to reflect the impact of negotiations, settlements, rulings, advice of legal counsel, and other updated information.
Accruals for environmental matters are recorded on a site by site basis when it is probable that a liability has been incurred and the amount of the liability can be reasonably estimated, based on current law and existing technologies. Our estimated liability is reduced to reflect the anticipated participation of other potentially responsible parties in those instances where it is probable that such parties are legally responsible and financially capable of paying their respective shares of the relevant costs. These accruals are adjusted quarterly as assessment and remediation efforts progress or as additional technical or legal information become available. Actual costs to be incurred at identified sites in future periods may vary from the estimates, given inherent uncertainties in evaluating environmental exposures. Accruals for environmental liabilities are included primarily in other non-current liabilities at undiscounted amounts and exclude claims for recoveries from insurance companies or other third parties. Recoveries from insurance companies or other third parties are included primarily in other non-current assets when the recovery is probable. Any environmental liabilities as of the date of the Spin-off were retained by Exelis as set forth in the Distribution Agreement and accordingly, after the Spin-off the Company eliminated the liability and recorded a contribution to capital.
Earnings Per Share
We compute earnings per common share on the basis of the weighted average number of common shares, and, where dilutive, common share equivalents, outstanding during the indicated periods.
F-13
NOTE 2
RECENT ACCOUNTING PRONOUNCEMENTS
|
Standard
|
Description
|
Date of issuance
|
Effect on the financial statements or other significant matters
|
|
Standards that are not yet adopted
|
|||
|
Accounting Standards Update (ASU) 2014-09,
Revenue from Contracts with Customers
|
The standard will replace existing revenue recognition standards and significantly expand the disclosure requirements for revenue arrangements. It may be adopted either retrospectively or on a modified retrospective basis to new contracts and existing contracts with remaining performance obligations as of the effective date. The standard is effective for the first interim period within annual reporting periods beginning after December 15, 2016. Early adoption is not permitted.
|
May 2014
|
We are currently evaluating the effect the standard is expected to have on the Company's financial statements and related disclosures.
|
|
Standards that were adopted
|
|||
|
ASU 2014-08,
Reporting Discontinued Operations and Disclosures of Disposals of Components of an Entity
|
The standard will reduce the frequency of disposals reported as discontinued operations by raising the threshold for a disposal to qualify as a discontinued operation, focusing on strategic shifts that have or will have a major effect on an entity's operations and financial results. The guidance is effective prospectively for annual periods beginning on or after December 15, 2014, with early adoption permitted, and would only apply to disposals completed subsequent to adoption.
|
April 2014
|
The Company adopted this guidance on September 27, 2014. The adoption of the standard had no impact on the Company’s financial statements.
|
Other new pronouncements issued but not effective until after
December 31, 2014
are not expected to have a material impact on our financial position, results of operations or cash flows.
NOTE 3
INCOME TAXES
Prior to September 27, 2014, our operating results were included in the consolidated U.S. Federal and state income tax returns of Exelis as well as in certain tax filings of Exelis for non-U.S. jurisdictions. Amounts presented in these Consolidated and Combined Financial Statements related to income taxes have been determined on a separate return basis. Prior to September 27, 2014, our contribution to the tax position of Exelis on a separate return basis has been included in these financial statements. Our separate return basis tax losses and tax credits may not reflect the tax positions taken or to be taken by Exelis. In many cases the tax losses and tax credits we generated have been available for use by Exelis and may remain with Exelis after the separation from Exelis.
F-14
The source of pre-tax income and the components of income tax expense at
December 31, 2014
,
2013
and
2012
, respectively, are as follows:
|
(In thousands)
|
2014
|
2013
|
2012
|
|||||||||
|
Total income components
|
||||||||||||
|
United States
|
$
|
36,377
|
|
$
|
132,655
|
|
$
|
107,787
|
|
|||
|
Foreign
|
514
|
|
(1,222
|
)
|
2,609
|
|
||||||
|
Total
|
$
|
36,891
|
|
$
|
131,433
|
|
$
|
110,396
|
|
|||
|
Income tax expense components
|
||||||||||||
|
Current income tax provision
|
||||||||||||
|
United States - Federal
|
$
|
2,385
|
|
$
|
62,102
|
|
$
|
42,093
|
|
|||
|
United States - state and local
|
29
|
|
1,190
|
|
611
|
|
||||||
|
Foreign
|
382
|
|
457
|
|
839
|
|
||||||
|
Total current income tax provision
|
2,796
|
|
63,749
|
|
43,543
|
|
||||||
|
Deferred income tax provision
|
||||||||||||
|
United States - Federal
|
10,385
|
|
(16,450
|
)
|
(2,211
|
)
|
||||||
|
United States - state and local
|
898
|
|
(258
|
)
|
(5,601
|
)
|
||||||
|
Total deferred income tax provision
|
11,283
|
|
(16,708
|
)
|
(7,812
|
)
|
||||||
|
Total income tax expense
|
$
|
14,079
|
|
$
|
47,041
|
|
$
|
35,731
|
|
|||
|
Effective tax rate
|
38.2
|
%
|
35.9
|
%
|
31.8
|
%
|
||||||
A reconciliation of the income tax provision at the U.S. statutory rate to the effective income tax rate as reported is as follows:
|
|
2014
|
2013
|
2012
|
||||||
|
Tax provision at U.S. statutory rate
|
35.0
|
%
|
35.0
|
%
|
35.0
|
%
|
|||
|
State and local income tax, net of Federal benefit
|
1.6
|
%
|
0.5
|
%
|
(2.9
|
)%
|
|||
|
Other
|
1.6
|
%
|
0.4
|
%
|
(0.3
|
)%
|
|||
|
Effective income tax rate
|
38.2
|
%
|
35.9
|
%
|
31.8
|
%
|
|||
F-15
Deferred tax assets and liabilities are determined based on temporary differences between the financial reporting and tax bases of assets and liabilities, applying enacted tax rates in effect for the year in which we expect the differences will reverse. Deferred tax assets and liabilities include the following:
|
(In thousands)
|
|
2014
|
|
2013
|
||||
|
Deferred Tax Assets:
|
|
|
|
|
||||
|
Costs incurred in excess of billings
|
|
$
|
1,867
|
|
$
|
4,067
|
|
|
|
Compensation and benefits
|
|
11,100
|
|
1,633
|
|
|||
|
Contingency reserves
|
|
1,995
|
|
1,834
|
|
|||
|
Other
|
|
1,931
|
|
3,324
|
|
|||
|
Net operating losses
|
224
|
|
—
|
|
||||
|
Total deferred tax assets
|
|
$
|
17,117
|
|
$
|
10,858
|
|
|
|
Deferred Tax Liabilities:
|
|
|||||||
|
Goodwill
|
|
$
|
(77,142
|
)
|
$
|
(74,629
|
)
|
|
|
Property, Plant and Equipment
|
|
(2,047
|
)
|
(2,577
|
)
|
|||
|
Unbilled receivables
|
|
(38,679
|
)
|
(32,854
|
)
|
|||
|
Total deferred tax liabilities
|
|
$
|
(117,868
|
)
|
$
|
(110,060
|
)
|
|
Deferred taxes are classified in the Consolidated and Combined Balance Sheets as follows:
|
(In thousands)
|
|
2014
|
|
2013
|
||||
|
Current liabilities
|
|
$
|
25,414
|
|
$
|
24,667
|
|
|
|
Non-current liabilities
|
|
75,337
|
|
74,535
|
|
|||
|
Net deferred tax liabilities
|
|
$
|
100,751
|
|
$
|
99,202
|
|
|
Uncertain Tax Position
A reconciliation of the beginning and ending amount of unrecognized tax benefits as of
December 31, 2014
,
2013
and
2012
is as follows:
|
(In thousands)
|
|
2014
|
|
2013
|
|
2012
|
||||||
|
Unrecognized tax benefits - January 1
|
|
$
|
8,541
|
|
$
|
12,682
|
|
$
|
1,361
|
|
||
|
Additions for:
|
|
|||||||||||
|
Current year tax positions
|
|
—
|
|
1,573
|
|
11,321
|
|
|||||
|
Prior year tax positions
|
6,954
|
|
—
|
|
—
|
|
||||||
|
Reductions for:
|
|
|||||||||||
|
Prior year tax positions
|
|
(7,891
|
)
|
(5,714
|
)
|
—
|
|
|||||
|
Unrecognized tax benefits - December 31
|
|
$
|
7,604
|
|
$
|
8,541
|
|
$
|
12,682
|
|
||
As of
December 31, 2014
, we anticipate that approximately
$6.9 million
of the unrecognized tax benefits would, if recognized, affect our effective tax rate. We believe the majority of our uncertain tax positions at
December 31, 2014
will significantly decrease within twelve months of the reporting date due to the resolution of examinations. The IRS is currently conducting an examination for tax years 2009 - 2012.
In many cases, unrecognized tax benefits are related to tax years that remain subject to examination by the relevant taxing authorities. The following table summarizes the earliest open tax years by major jurisdiction:
F-16
|
Jurisdiction
|
Earliest Open Year
|
|
|
United States
|
2009
|
|
We classify interest relating to tax matters as a component of interest expense and tax penalties as a component of income tax expense in our Consolidated and Combined Statement of Income. During
2014
,
2013
and
2012
, we did not recognize any expense related to tax matters. As of
December 31, 2014
,
2013
, and
2012
, we had interest accrued for tax matters of
$0.6 million
,
$0.3 million
and less than
$0.1 million
, respectively.
NOTE 4
EARNINGS PER SHARE
The following table sets forth the reconciliation of basic and diluted weighted average shares outstanding for our earnings per share calculations for the following:
|
|
|
Year Ended December 31,
|
|||||||
|
(In thousands)
|
|
2014
|
|
2013
|
|
2012
|
|||
|
Weighted average common shares outstanding ¹
|
|
10,476
|
|
10,474
|
|
10,474
|
|
||
|
Add: Dilutive impact of stock options
|
|
76
|
|
—
|
|
—
|
|
||
|
Add: Dilutive impact of restricted stock units
|
|
140
|
|
—
|
|
—
|
|
||
|
Diluted weighted average common shares outstanding ¹
|
|
10,692
|
|
10,474
|
|
10,474
|
|
||
|
|
|
|
|
|
|
|
|||
|
¹ For periods ended September 27, 2014 and prior, basic and diluted earnings per share are computed using the number of shares of Vectrus common stock outstanding on September 27, 2014, the date on which the Vectrus common stock was distributed to the shareholders of Exelis Inc.
|
|||||||||
The table below provides a summary of securities that could potentially dilute basic earnings per share in the future that were not included in the computation of diluted earnings per share because to do so would have been anti-dilutive for the period presented.
|
|
|
Year Ended December 31,
|
|||||||
|
(In thousands)
|
|
2014
|
|
2013
|
|
2012
|
|||
|
Anti-dilutive stock options
|
|
11
|
|
—
|
|
—
|
|
||
NOTE 5
RECEIVABLES
Receivables were comprised of the following:
|
December 31,
|
||||||||
|
(In thousands)
|
2014
|
2013
|
||||||
|
Billed receivables
|
$
|
41,997
|
|
$
|
68,508
|
|
||
|
Unbilled contract receivables
|
160,735
|
|
159,026
|
|
||||
|
Receivables
|
$
|
202,732
|
|
$
|
227,534
|
|
||
All billed receivables are due from the U.S. government, either directly as prime contractor to the government or as subcontractor to another prime contractor to the U.S. government, as of
December 31, 2014
and
December 31, 2013
, respectively. Because the Company’s billed receivables are with the U.S. government, the Company does not believe it has a material credit risk exposure.
F-17
As part of the Spin-off, Exelis indemnified Vectrus for a receivable of approximately
$11.4 million
. The Company recorded a corresponding liability as we are required to remit payment to Exelis for amounts collected related to the indemnified receivable.
Unbilled contract receivables represent revenue recognized on long-term contracts in excess of amounts billed as of the balance sheet date. We estimate that approximately
$4.8 million
of our unbilled contract receivables as of
December 31, 2014
may not be collected within the next
twelve
months. These amounts relate to requests for equitable adjustments and contract line item realignments with our customers.
NOTE 6
Credit Agreement
On September 17, 2014, Vectrus entered into a Credit Agreement (the Credit Agreement) by and among Vectrus, our 100% owned subsidiary Vectrus Systems Corporation (VSC), formerly known as Exelis Systems Corporation, as the Borrower, the Lenders and Issuing Banks party thereto and JPMorgan Chase Bank, N.A., as Administrative Agent. The Credit Agreement provided for
$215.0 million
in senior secured financing, consisting of a
$140.0 million
term loan facility (the Term Facility) and a
$75.0 million
revolving credit facility (the Revolver and, together with the Term Facility, the Senior Secured Credit Facilities). The net proceeds from the Term Facility were used to pay a
$136.3 million
distribution to a subsidiary of Exelis on September 26, 2014. The Revolver is available for working capital, capital expenditures, and other general corporate purposes. In connection with the Credit Agreement, the Company paid
$3.7 million
in debt financing fees, which were capitalized as debt issuance costs and are included in Long-term debt issuance costs, net on the Consolidated and Combined Balance Sheets. The debt issuance costs are being amortized as an adjustment to Interest expense over the remaining life of the Credit Agreement.
Term Facility
The Term Facility consists of a
five
-year term loan in an aggregate principal amount of
$140.0 million
. The full amount of the term loan was made in a single drawing on September 26, 2014. As of December 31, 2014, the balance outstanding for the Term Facility was
$137.4 million
. The Term Facility amortizes in quarterly installments at the following rates per annum:
7.5%
in year one;
10%
in each of years two and three,
15%
in year four and
57.5%
in year five. Amounts borrowed under the Term Facility that are repaid or prepaid may not be re-borrowed. Any unpaid amounts must be repaid by September 17, 2019.
The Company's aggregate scheduled maturities of the Term Facility as of
December 31, 2014
, are as follows:
|
(in thousands)
|
Payments due
|
|||
|
Year 1
|
$
|
11,375
|
|
|
|
Year 2
|
14,000
|
|
||
|
Year 3
|
15,750
|
|
||
|
Year 4
|
35,875
|
|
||
|
Year 5
|
60,375
|
|
||
|
Total
|
$
|
137,375
|
|
|
Revolver
The Revolver consists of a
five
-year senior secured revolving credit facility with aggregate commitments in an amount equal to
$75.0 million
, of which up to
$35.0 million
is available for the issuance of letters of credit, and includes a swingline facility in an amount equal to
$10.0 million
. The Revolver will mature and the commitments thereunder will terminate on September 17, 2019. As of
December 31, 2014
, there were
six
letters of credit outstanding in the aggregate amount of
$14.4 million
, which reduced our borrowing availability to
$60.6 million
under the Revolver.
F-18
Guarantees and Collateral
The indebtedness, obligations and liabilities under the Senior Secured Credit Facilities are unconditionally guaranteed jointly and severally on a senior secured basis by Vectrus and certain of its current and future restricted subsidiaries and are secured, subject to permitted liens and other exceptions and exclusions, by a first-priority lien on substantially all tangible and intangible assets of Vectrus, VSC and each domestic guarantor including (i) a perfected pledge of all of the capital stock of VSC and each direct, wholly-owned material restricted subsidiary held by VSC or any guarantor (subject to certain limitations with respect to foreign subsidiaries) and (ii) perfected security interests in and mortgages on, accounts, inventory, equipment, general intangibles, commercial tort claims, investment property, intellectual property, material fee-owned real property, letter of credit rights, deposit and securities accounts, intercompany notes and proceeds of the foregoing, except for certain excluded assets.
Mandatory Prepayments
The Term Facility requires the following amounts to be applied to prepay the Term Loan, subject to certain thresholds, exceptions and reinvestment rights:
|
•
|
100%
of the net cash proceeds from the incurrence of indebtedness by Vectrus and its restricted subsidiaries (other than permitted debt);
|
|
•
|
100%
of the net cash proceeds of all non-ordinary course asset sales or other dispositions of property by Vectrus and its restricted subsidiaries (including casualty insurance and condemnation proceeds, but with exceptions for sales of inventory and other ordinary course dispositions, obsolete or worn-out property, property no longer useful in the business and other exceptions);
|
|
•
|
50%
of excess cash flow with step-downs to
25%
and
0%
based on certain leverage ratios, commencing with fiscal year ending December 31, 2015.
|
Voluntary Prepayments
VSC may voluntarily prepay the Term Facility in whole or in part at any time without premium or penalty, subject to the payment of customary breakage costs, which we anticipate would be minimal, in the case of LIBOR rate loans as defined in the Credit Agreement. Optional prepayments of the Term Facility will be applied to the remaining installments thereof as directed by VSC.
Commitments under the Revolver may be reduced in whole or in part at any time without premium or penalty.
Covenants
The Senior Secured Credit Facilities contain certain covenants that, among other items, limit or restrict the ability of Vectrus and its restricted subsidiaries, including VSC, to (subject to certain qualifications and exceptions):
|
•
|
create liens and encumbrances;
|
|
•
|
incur additional indebtedness;
|
|
•
|
merge, dissolve, liquidate or consolidate;
|
|
•
|
make acquisitions, investments, advances or loans;
|
|
•
|
dispose of or transfer assets;
|
|
•
|
pay dividends or make other payments in respect of our capital stock;
|
|
•
|
amend certain material documents;
|
|
•
|
redeem or repurchase certain debt;
|
|
•
|
engage in certain transactions with affiliates;
|
|
•
|
enter into speculative hedging arrangements; and
|
|
•
|
enter into certain restrictive agreements.
|
F-19
As of December 31, 2014, the maximum amount of dividends the Company could distribute was
$5.0 million
. In addition, Vectrus is required to comply with (a) a maximum ratio of total consolidated indebtedness to consolidated Earnings Before Interest, Tax, Depreciation and Amortization (EBITDA) of
3.50
to
1.00
, with step-downs to
3.00
to
1.00
beginning with the third fiscal quarter of 2015 and
2.75
to
1.00
beginning with the first fiscal quarter of 2016 and (b) a minimum ratio of consolidated EBITDA to consolidated interest expense (net of cash interest income) of
4.50
to
1.00
. As of
December 31, 2014
, the Company had a total consolidated indebtedness to EBITDA of
2.46
to 1:00 and consolidated EBITDA to consolidated interest expense of
9.38
to 1:00. The Company was in compliance with all financial covenants related to the Senior Secured Credit Facilities as of
December 31, 2014
.
Interest Rates and Fees
Outstanding borrowings under the Senior Secured Credit Facilities accrue interest, at the option of VSC, at a per annum rate of (i) a LIBOR rate plus the applicable margin or (ii) a base rate plus the applicable margin. The applicable margin for borrowings under the Senior Secured Credit Facilities is subject to a leverage-based pricing grid with the LIBOR rate ranging from
2.50%
to
3.00%
. The interest rate under the Senior Secured Credit Facilities at
December 31, 2014
, was
2.92%
.
During an event of default, overdue principal under the Senior Secured Credit Facilities may bear interest at a rate of
2.00%
in excess of the otherwise applicable rate of interest. On and after the funding date, VSC pays a commitment fee on the undrawn portion of the Revolver ranging from
0.40%
to
0.50%
depending on the leverage ratio.
The fair value of the Company's long-term debt approximates the carrying value as of December 31, 2014 due to the short duration between the execution of the agreement and the balance sheet date and the term loan bears interest at a floating rate of interest. The fair value is based on observable inputs of interest rates that are currently available to the Company for debt with similar terms and maturities for non-public debt.
Carrying values and fair values of the Term Facility in the Consolidated and Combined Balance Sheets are as follows:
|
December 31, 2014
|
||||||||
|
(In thousands)
|
Carrying Amount
|
Fair Value
|
||||||
|
Long-term debt, including short term portion
|
$
|
137,375
|
|
$
|
137,375
|
|
||
NOTE 7
COMPOSITION OF CERTAIN FINANCIAL STATEMENT CAPTIONS
The following tables present financial information underlying certain balance sheet captions.
Compensation and other employee benefits
Compensation and other employee benefits were comprised of the following at December 31:
|
(In thousands)
|
2014
|
2013
|
|||||
|
Accrued salaries and wages
|
$
|
13,919
|
|
$
|
26,095
|
|
|
|
Accrued bonus
|
4,528
|
|
3,852
|
|
|||
|
Accrued employee benefits
|
18,133
|
|
21,079
|
|
|||
|
Total
|
$
|
36,580
|
|
$
|
51,026
|
|
|
F-20
Other accrued liabilities
Other accrued liabilities were comprised of the following at December 31:
|
(In thousands)
|
2014
|
2013
|
|||||
|
Workers' compensation, auto and general liability reserve
|
$
|
9,637
|
|
|
$
|
—
|
|
|
Exelis indemnified receivable obligation
|
11,411
|
|
|
—
|
|
||
|
Accrued liabilities
|
16,025
|
|
|
10,086
|
|
||
|
Total
|
$
|
37,073
|
|
|
$
|
10,086
|
|
NOTE 8
PLANT, PROPERTY AND EQUIPMENT, NET
Plant, property and equipment, net consisted of the following at
December 31
:
|
(In thousands)
|
|
2014
|
2013
|
|||||
|
Buildings and improvements
|
|
$
|
6,034
|
|
$
|
6,753
|
|
|
|
Machinery and equipment
|
|
11,034
|
|
11,888
|
|
|||
|
Furniture, fixtures and office equipment
|
|
3,900
|
|
1,212
|
|
|||
|
Plant, property and equipment, gross
|
|
20,968
|
|
19,853
|
|
|||
|
Less: accumulated depreciation and amortization
|
|
(12,048
|
)
|
(10,614
|
)
|
|||
|
Plant, property and equipment, net
|
|
$
|
8,920
|
|
$
|
9,239
|
|
|
Depreciation expense of plant, property and equipment was
$2.1 million
,
$2.6 million
and
$3.0 million
in 2014, 2013 and 2012, respectively.
NOTE 9
GOODWILL
Goodwill
Goodwill at
December 31, 2014
, of
$216.9 million
is
$5.5 million
less than total goodwill at
December 31, 2013
. This adjustment reflects the portion associated with a reallocation of goodwill by Exelis as a part of the Spin-off. There was
no
goodwill impairment in 2014 or 2013. We conduct our annual impairment testing as of the first day of the last fiscal quarter. There were
no
acquisitions during the years ended
December 31, 2014
and
2013
or any prior periods.
Changes in the carrying amount of goodwill for the periods ended
December 31, 2014
and
2013
are as follows:
|
(In thousands)
|
|
|||
|
Balance - January 1, 2012
|
$
|
222,460
|
|
|
|
Balance – December 31, 2013
|
$
|
222,460
|
|
|
|
Reallocation of goodwill by Exelis as part of the Spin-off
|
(5,530
|
)
|
||
|
Balance – December 31, 2014
|
$
|
216,930
|
|
|
F-21
NOTE 10
LEASES AND RENTALS
Operating Leases
The Company leases certain offices, buildings, automobiles, computers, land and other equipment under operating leases. Such leases expire at various dates through
2019
and may include renewal and payment escalation clauses. The Company often pays maintenance, insurance and tax expense related to leased assets. Rental expenses under our operating leases were
$9.9 million
,
$9.7 million
and
$9.1 million
for
2014
,
2013
and
2012
, respectively. Future operating lease payments under non-cancellable operating leases with an initial term in excess of one year as of
December 31, 2014
are shown below.
|
(In thousands)
|
|
Payments due
|
||
|
2015
|
|
$
|
2,590
|
|
|
2016
|
|
1,731
|
|
|
|
2017
|
|
1,639
|
|
|
|
2018
|
|
1,087
|
|
|
|
2019
|
|
44
|
|
|
|
Total minimum lease payments
|
|
$
|
7,091
|
|
Capital Leases
The Company acquired
$1.6 million
of vehicles and equipment using capital leases during both fiscal years 2014 and 2013. There was
$0.4 million
,
$0.2 million
and less than
$0.1 million
, of depreciation on capital leases during 2014, 2013 and 2012, respectively. Capital leases terms vary in length from twenty-four to sixty months. The liabilities for these capital leases are included in “Other accrued liabilities” and “Other long-term liabilities” in the Consolidated and Combined Balance Sheets.
The following is a schedule, by year, of future minimum lease payments under capital leases, together with the present value of the net minimum lease payments as of December 31, 2014:
|
(In thousands)
|
|
Amount
|
||
|
2015
|
|
$
|
399
|
|
|
2016
|
|
327
|
|
|
|
2017
|
|
82
|
|
|
|
Thereafter
|
|
132
|
|
|
|
Total minimum lease payments
|
|
940
|
|
|
|
Less: estimated executory costs
|
|
—
|
|
|
|
Net minimum lease payments
|
|
940
|
|
|
|
Less: amount representing interest
|
|
(30
|
)
|
|
|
Present value of minimum lease payments
|
|
$
|
910
|
|
Capital leases included in Plant, property and equipment,net (See Note 8):
|
|
|
December 31,
|
||||||
|
(In thousands)
|
|
2014
|
|
2013
|
||||
|
Machinery and equipment
|
|
$
|
1,625
|
|
$
|
1,586
|
|
|
|
Accumulated depreciation
|
|
(609
|
)
|
(257
|
)
|
|||
|
Machinery and equipment, net
|
|
$
|
1,016
|
|
$
|
1,329
|
|
|
F-22
Capital leases consisted of the following:
|
|
|
December 31,
|
||||||
|
(In thousands)
|
|
2014
|
|
2013
|
||||
|
Other accrued liabilities
|
|
$
|
380
|
|
$
|
476
|
|
|
|
Other long-term liabilities
|
|
543
|
|
889
|
|
|||
|
Total
|
|
$
|
923
|
|
$
|
1,365
|
|
|
NOTE 11
RESTRUCTURING
We have initiated various restructuring activities in our business during the past two years. The restructuring activities focus on various aspects of the operations, including closing certain facilities, rationalizing headcount, and aligning operations in the most strategic and cost efficient manner.
In 2013, we closed the administrative office in Doha, Qatar and initiated indirect staff reductions based in Colorado Springs, Colorado as we implemented a leaner headquarters operating model. Through involuntary employee reductions, we eliminated
thirty-four
positions.
During the fourth quarter of 2014, we further took action to reduce the size of our workforce and align our cost structure more closely to customer and market conditions. Through voluntary employee reductions, we eliminated
twelve
positions.
The Company expects substantially all remaining severance payments to be paid out by the third quarter of 2015 pursuant to agreements entered into with affected employees and we do not expect to incur significant additional charges related to these actions in future periods. We did not have any individually significant restructuring activities in 2012.
The severance and related benefit costs for the fiscal years ended
2014
and
2013
included in Selling, general and administrative expenses on the Consolidated and Combined Statements of Income are summarized in the table below:
|
(In thousands)
|
|
|
||
|
Balance, December 31, 2012
|
|
$
|
—
|
|
|
Severance and benefit related costs
|
|
2,597
|
|
|
|
Payments
|
|
(1,323
|
)
|
|
|
Balance, December 31, 2013
|
|
$
|
1,274
|
|
|
Severance and benefit related costs
|
|
732
|
|
|
|
Payments
|
|
(1,256
|
)
|
|
|
Balance, December 31, 2014
|
|
$
|
750
|
|
NOTE 12
POST EMPLOYMENT BENEFIT PLANS
Vectrus sponsors
one
defined contribution savings plan, which allows employees to contribute a portion of their pre-tax and/or after-tax income in accordance with specified guidelines. The plan requires us to match a percentage of the employee contributions up to certain limits of employee base pay. Our portion of the matching contributions charged to income amounted to
$2.8 million
and
$4.2 million
for the 12 months ended
December 31, 2014
and
2013
, respectively.
On September 11, 2014, the Board adopted and approved the Vectrus Systems Corporation Excess Savings Plan (the Excess Savings Plan). Since federal law limits the amount of compensation that can be used to determine employee and employer contribution amounts to the Company's tax-qualified plans, the Company established the Excess Savings Plan to allow for Company contributions based on an eligible employee's base salary in excess of
F-23
these limits. No employee contributions are permitted. All balances under the Excess Savings Plan are maintained on the books of the Company and credits and deductions are made to the accumulated savings under the plan based on the earnings or losses attributable to a stable value fund as defined in the Excess Savings Plan. Benefits will be paid in a lump sum generally in the seventh month following the date on which the employee's separation from service occurs. Employees are 100% vested at all times in any amounts credited to their accounts.
$0.2 million
of contributions were accrued by the Company as of
December 31, 2014
.
NOTE 13
STOCK-BASED COMPENSATION
On September 11, 2014, the Board of Directors of Vectrus (the Board) adopted and approved the Vectrus, Inc. 2014 Omnibus Incentive Plan (
the 2014 Omnibus Plan
). The purpose of the 2014 Omnibus Plan is to promote the long-term interests of the Company and its shareholders by strengthening the Company's ability to attract and retain employees of the Company and its affiliates and members of the Board upon whose judgment, initiative and efforts the financial success and growth of the business of the Company largely depend, and to provide an additional incentive for such individuals through share ownership and other rights that promote and recognize the financial success and growth of the Company and create value for shareholders. The 2014 Omnibus Plan permits the Compensation and Personnel Committee of the Board (the Committee) to grant to eligible employees and directors of the Company and its affiliates any of the following types of awards (or any combination thereof): nonqualified stock options (NQOs), incentive stock options, stock appreciation rights, restricted stock, restricted stock units (RSUs) and other awards that may include, without limitation, unrestricted shares, the payment of shares in lieu of cash, the payment of cash based on attainment of performance goals, service conditions or other goals established by the Committee and the payment of shares in lieu of cash under other Company incentive or bonus programs. Subject to adjustment, the maximum number of shares of the Company's common stock authorized for issuance under the 2014 Omnibus Plan is
2.6 million
shares. The 2014 Omnibus Plan also generally governs equity awards that were issued under equity plans of Exelis and converted into awards denominated in the Company's common stock, provided that such converted awards will generally continue to be subject to the material terms and conditions of the original equity incentive plans under which they were granted. As of
December 31, 2014
, there were
1.7 million
shares available under the 2014 Omnibus Plan.
Outstanding Exelis Awards
Vectrus awards granted prior to the Spin-off were denominated in Exelis common shares. Exelis' equity incentive plan governs awards granted to Exelis employees and directors including NQOs and incentive stock options, Restricted Stock and RSUs, target cash awards called Total Shareholder Return (TSR) awards and other awards. On September 29, 2014, Exelis converted or adjusted outstanding NQOs and RSUs to
514,941
replacement awards denominated in Vectrus common shares. The manner of conversion for each award reflected a mechanism intended to preserve the intrinsic value of each award and generally on terms which were in all material respects identical to the terms of the award replaced. The fair value of the converted Vectrus NQOs immediately following the Spin-off was higher than the fair value of the Exelis awards prior to the Spin-off. As a result, we will incur incremental compensation expense of approximately
$0.7 million
of which
$0.3 million
was recognized as of
December 31, 2014
. The remaining balance will be expensed over the remaining term of the specific award and recognized through 2017.
2014 Omnibus Plan Awards Granted Post Spin-off
Employee Grants
On September 29, 2014, the Committee approved the grant of
6,727
RSUs, to be effective October 10, 2014, to executives who had outstanding Exelis TSR awards under the Exelis plan. The RSUs will vest on December 4, 2015, subject to the participants' continued employment and the terms of the award agreement. The fair value of the RSUs is determined based on the closing price of Vectrus common stock on the date of grant, which was
$20.62
. Stock compensation expense will be recognized ratably over the vesting period of the awards.
F-24
Founders' Grants
On September 29, 2014, the Committee approved the grant of
175,606
RSUs and
171,298
NQOs, effective October 10, 2014, to employees in positions deemed critical to the establishment and success of Vectrus. These Founders' Grants were a special one-time award intended to closely align the economic interest of the recipients with the Vectrus shareholders. The RSUs vest in
one-third
increments on each of the
three
anniversary dates following the grant date. The fair value of the RSUs was determined based on the closing price of Vectrus common stock on the date of grant, which was
$20.62
. The NQOs expire ten years from the date of the grant and vest in
one-third
increments over
3 years
following the date of the grant. The fair value of each NQO grant was estimated as
$8.24
on the date of grant using the Black-Scholes option pricing model. Stock compensation expense will be recognized ratably over the vesting period of the awards.
Non-employee Director Grants
On September 29, 2014, the Committee approved the grant of
21,024
RSUs, effective October 10, 2014, as a portion of the directors' compensation, prorated for their service from the Spin-off through the day before the May 2015 annual meeting. The RSUs vest
one
day prior to the Vectrus 2015 annual meeting. The fair value of the RSUs is determined based on the closing price of Vectrus common stock on the date of grant, which was
$20.62
. Stock compensation expense will be recognized ratably over the vesting period of the awards.
Prior to September 27, 2014, our employees participated in equity incentive plans maintained by Exelis. Stock-based compensation amounts awarded under the Exelis plans have historically been immaterial, as such, amounts presented in the following tables include equity and liability awards issued under the Vectrus equity incentive plan after September 27, 2014.
|
(In thousands)
|
|
|||
|
Compensation costs for equity-based awards
|
|
$
|
2,095
|
|
|
Compensation costs for liability-based awards
|
|
229
|
|
|
|
Total compensation costs, pre-tax
|
|
$
|
2,324
|
|
|
Future tax benefit
|
|
$
|
827
|
|
At December 31, 2014, total unrecognized compensation costs related to equity-based awards and liability based awards were
$6.6 million
and
$0.3 million
, respectively, which are expected to be recognized ratably over a weighted average period of
1.89
years and
0.98
years, respectively.
We account for NQOs and RSUs as equity-based compensation awards. TSR and cash settled RSUs are accounted for as liability-based compensation awards.
Non-Qualified Stock Options
NQOs generally vest in
one-third
increments over
3 years
following the date of the grant and are exercisable for periods up to
10 years
from the date of grant at a price equal to the fair market value of common stock at the date of grant, except for Exelis awards that were outstanding on September 26, 2014 and converted to Company awards, which were revalued as a result of the Spin-off. The NQOs granted from 2011 through 2013 were awarded with a term of ten years and retained the vesting schedule of the original Exelis NQO awards.
F-25
The table below provides a roll-forward of outstanding NQOs subsequent to the Spin-off:
|
|
|
September 27, 2014 through
|
|||||
|
|
|
December 31, 2014
|
|||||
|
(In thousands, except per share data)
|
|
Shares
|
Weighted Average Exercise Price Per Share
|
||||
|
Outstanding at Spin-off
|
|
—
|
|
$
|
—
|
|
|
|
Conversion related to the Spin-off ¹
|
|
275
|
|
14.83
|
|
||
|
Post Spin-off activities
|
|
||||||
|
Granted
|
|
171
|
|
20.62
|
|
||
|
Exercised
|
|
—
|
|
—
|
|
||
|
Forfeited, canceled or expired
|
|
—
|
|
—
|
|
||
|
Outstanding at December 31,
|
|
446
|
|
$
|
17.43
|
|
|
|
Options exercisable at December 31, 2014
|
|
47
|
|
$
|
13.12
|
|
|
|
|
|
|
|
|
|||
|
¹ The weighted average grant date fair value of the stock options converted is equal to the weighted average grant date fair value of such stock options prior to the Spin-off, reduced by the Spin-off conversion adjustment.
|
|||||||
The following table summarizes information about NQOs outstanding and exercisable as of
December 31, 2014
:
|
(in thousands, except per share data)
|
Options Outstanding
|
Options Exercisable
|
|||||||||||||||||||||||||
|
Range of Exercise Prices Per Share
|
Number
|
Weighted Average Remaining Contractual Life (In Years)
|
Weighted Average Exercise Price Per Share
|
Aggregate Intrinsic Value
|
Number
|
Weighted Average Remaining Contractual Life (In Years)
|
Weighted Average Exercise Price Per Share
|
Aggregate Intrinsic Value
|
|||||||||||||||||||
|
$12.94 - $20.62
|
391
|
|
8.63
|
$
|
16.42
|
|
$
|
4,289
|
|
47
|
|
6.97
|
|
$
|
13.12
|
|
$
|
817
|
|
||||||||
|
$22.15 - $24.61
|
55
|
|
9.19
|
24.52
|
|
160
|
|
—
|
|
—
|
|
—
|
|
—
|
|
||||||||||||
|
Total options and aggregate intrinsic value
|
446
|
|
8.67
|
$
|
17.43
|
|
$
|
4,449
|
|
47
|
|
6.97
|
|
$
|
13.12
|
|
$
|
817
|
|
||||||||
The aggregate intrinsic value in the preceding table represents the total pre-tax intrinsic value, based on Vectrus' closing stock price of
$27.40
per share on
December 31, 2014
, which would have been received by the option holders had all option holders exercised their options as of that date. There were
no
exercisable options "out of the money" as of December 31, 2014.
As of December 31, 2014, the total number of stock options expected to vest (including those that have already vested) was
0.4 million
. These stock options have a weighted-average exercise price of
$17.58
per share, an aggregate intrinsic value of
$3.6 million
and a weighted average remaining contractual life of
8.7 years
.
F-26
The fair value of stock options is determined on the date of grant utilizing a Black-Scholes valuation model. The following assumptions were utilized in deriving the fair value for NQOs granted on October 10, 2014 under the Black-Scholes model:
|
Expected volatility
|
|
34.6
|
%
|
|
|
Expected life (in years)
|
|
7.0
|
|
|
|
Risk-free rates
|
|
2.07
|
%
|
|
|
Weighted-average grant date fair value per share
|
|
$
|
8.24
|
|
Black-Scholes model volatility is based on daily average volatility of our peer group over
7.0 years
, which is consistent with the expected term. Peer group companies were selected from companies within the aerospace and defense industry that most closely match our business, including size, diversification, and customer base. The expected term of the stock option represents the estimated period of time until exercise and is based on the vesting period of the award and the estimated exercise patterns of employees. The risk-free rate is based on the United States Treasury stripped coupon rates with maturities corresponding to the expected term of
seven
years, measured as of the grant date.
Restricted Stock Units
The fair value of RSUs is determined based on the closing price of Vectrus common stock on the date of the grant. Under the plan, RSUs awarded prior to
2014
typically cliff vest
3 years
from the date of grant. For RSUs granted in
2014
,
one-third
of the award vests on each of the
three
anniversary dates following the grant date. RSUs have no voting rights. If an employee leaves the Company prior to vesting, whether through resignation or termination for cause, the RSUs are forfeited. If an employee retires or is terminated by the Company other than for cause, all or a pro rata portion of the RSUs may vest. The RSUs outstanding at Spin-off retained the vesting schedule of the original Exelis awards.
The table below provides a roll-forward of outstanding RSUs subsequent to the Spin-off.
|
|
|
September 27, 2014 through
|
|||||
|
|
|
December 31, 2014
|
|||||
|
(In thousands, except per share data)
|
|
Shares
|
Weighted Average Grant Date Fair Value Per Share
|
||||
|
Outstanding at Spin-off
|
|
—
|
|
—
|
|
||
|
Conversion related to the Spin-off
|
|
240
|
|
$
|
17.61
|
|
|
|
Post Spin-off activities
|
|
||||||
|
Granted
|
|
203
|
|
20.62
|
|
||
|
Vested
|
|
(20
|
)
|
13.03
|
|
||
|
Forfeited or canceled
|
|
—
|
|
—
|
|
||
|
Outstanding at December 31,
|
|
423
|
|
$
|
19.28
|
|
|
Total Shareholder Return Awards
In connection with the Spin-off, outstanding Exelis TSR awards under the Exelis Omnibus Incentive Plan were replaced with Vectrus RSUs for the remaining uncompleted portion of the
2013
TSR award performance period. On October 10, 2014,
6,727
RSUs were granted at a fair value of
$20.62
. These RSUs will vest on December 4, 2015 subject to the participant's continued employment and award terms.
F-27
NOTE 14
SHAREHOLDERS' EQUITY
In connection with the Spin-off, each of the shareholders of Exelis received
one
share of Vectrus common stock for every
eighteen
shares of common stock of Exelis held on the Record Date resulting in the distribution of
10.5 million
shares of common stock to Exelis shareholders. As of
December 31, 2014
, our authorized capital was comprised of
100.0 million
shares of common stock and
10.0 million
shares of preferred stock. At
December 31, 2014
, there were
10.5 million
shares of common stock issued and outstanding.
No
preferred stock was issued and outstanding at
December 31, 2014
.
We issue shares of our common stock in connection with our 2014 Omnibus Plan. At
December 31, 2014
,
2.6 million
shares of common stock were reserved for issuance in connection with this Plan and we had a remaining balance of
1.7 million
shares of common stock available for future grants under this plan. Any shares related to awards that terminate by (i) expiration, (ii) forfeiture, (iii) cancellation, (iv) settling in cash in lieu of shares or otherwise without the issuance of such shares, (v) or are exchanged with the Committee's permission for awards not involving shares are available again for grant under the 2014 Omnibus Plan.
NOTE 15
RELATED PARTY TRANSACTIONS AND PARENT COMPANY EQUITY
The Consolidated and Combined Financial Statements have been prepared on a stand-alone basis. However, prior to September 27, 2014, they were derived from the consolidated and combined financial statements and accounting records of Exelis.
Allocation of General Corporate Expenses
Prior to September 27, 2014 these Consolidated and Combined Financial Statements included expense allocations for certain functions provided by Exelis as well as other Exelis employees not solely dedicated to the Company, including, but not limited to, general corporate expenses related to finance, legal, information technology, human resources, communications, ethics and compliance, shared services, employee benefits and incentives and stock-based compensation. These expenses have been allocated to us on the basis of direct usage when identifiable, with the remainder allocated on the basis of revenue, headcount or other measures. We were allocated
$23.3 million
,
$33.4 million
and
$36.4 million
for the nine months ended September 27, 2014 and the years ended
December 31, 2013
and
2012
, respectively, of general corporate expenses incurred by Exelis which are primarily included within Selling, general and administrative expenses in the Consolidated and Combined Statements of Income.
The expense allocations from Exelis discussed above include costs associated with defined benefit pension and other post-retirement benefit plans (the “Shared Plans”) sponsored by Exelis in which some of our employees participate. We accounted for such Shared Plans as multiemployer benefit plans. Accordingly, we did not record an asset or liability to recognize the funded status of the Shared Plans. Subsequent to September 27, 2014, the date the employees' benefits were frozen in the plans, we did not incur further costs for the Shared Plans and all assets and liabilities related to the Shared Plans remain with Exelis.
The expense allocations have been determined on a basis that we consider to be a reasonable reflection of the utilization of services provided or the benefit received by us during the periods presented. The allocations may not, however, reflect the expense we would have incurred as an independent, publicly-traded company for the periods presented. Actual costs that may have been incurred if we had been a stand-alone company would depend on a number of factors, including the chosen organizational structure, functions outsourced or performed by employees and strategic decisions made in areas such as information technology and infrastructure.
Distribution Agreement
We entered into a Distribution Agreement with Exelis which sets forth our agreements with Exelis regarding the principal actions needed to be taken in connection with our Spin-off. It also set forth other agreements that govern certain aspects of our relationship with Exelis following the Spin-off including, but not limited to, transfer of assets and assumption of liabilities, indemnification, and release of claims. Pursuant to the terms of the Distribution Agreement, (i) Vectrus and Exelis effected certain transfers of assets and assumed certain liabilities so that Vectrus and Exelis retained both the assets of and liabilities associated with their respective businesses, (ii) subject to certain exceptions, all agreements, arrangements, commitments and undertakings, including all intercompany accounts payable or
F-28
accounts receivable, including intercompany indebtedness were terminated, novated or otherwise satisfied, effective no later than the Distribution Date, and (iii) Vectrus effected a pro rata distribution of our common stock to Exelis shareholders.
Employee Matters Agreement
We entered into an Employee Matters Agreement with Exelis that governs the respective rights, responsibilities and obligations of Exelis and us after the Spin-off with respect to employee-related liabilities and among other things, our respective retirement plans, nonqualified deferred compensation plans, health and welfare benefit plans, and equity-based compensation plans (including the treatment of outstanding awards granted thereunder).
Tax Matters Agreement
We entered into a Tax Matters Agreement with Exelis that governs the respective rights, responsibilities and obligations of Exelis and us after the Spin-off with respect to tax liabilities and benefits, tax attributes, tax contests and other tax sharing regarding U.S. Federal, state, local and foreign income taxes, other tax matters and related tax returns. We have several liabilities with Exelis to the IRS for the consolidated U.S. Federal income taxes of the Exelis consolidated group relating to the taxable periods in which we were part of that group. However, the Tax Matters Agreement specifies the portion, if any, of this tax liability for which we bear responsibility, and Exelis agrees to indemnify us against any amounts for which we are not responsible. The Tax Matters Agreement also provides special rules for allocating tax liabilities in the event that the Spin-off is determined not to be tax-free. The Tax Matters Agreement provides for certain covenants that may restrict our ability to pursue strategic or other transactions that otherwise could maximize the value of our business and may discourage or delay a change of control. For example, unless we (or Exelis, as applicable) were to receive a supplemental private letter ruling from the IRS or an unqualified opinion from a nationally recognized tax advisor, or Exelis were to grant us a waiver, we would be restricted until
two
years after the Spin-off is consummated from entering into transactions which would result in an ownership shift in the Company of more than
35%
(measured by vote or value) or divestitures of certain businesses or entities which could impact the tax-free nature of the Spin-off. Under the Tax Matters Agreement we agree to indemnify Exelis for any tax resulting from any such transactions, whether or not Exelis consented to such transactions or we were otherwise permitted to enter into such transactions under the Tax Matters Agreement. Though valid as between the parties, the Tax Matters Agreement is not binding on the IRS.
Transition Services Agreement
We entered into a Master Transition Services Agreement with Exelis, under which Exelis or its respective affiliates provides us with certain services, and we provide Exelis certain services, including information technology, financial, procurement, human resource, benefits support and other specified services from Exelis and including information technology, human resources and other specified services to Exelis. We expect these services will be initially provided at a base amount with scheduled, escalating increases up to the base amount plus
10%
subject to adjustments for inflation and these services are planned to extend for a period of
3
to
24
months in most circumstances.
Intellectual Property License Agreement
We entered into a Transitional Trademark License Agreement with Exelis pursuant to which we will license on a non-exclusive basis the right to use the Exelis name and trademark in our business for a transitional period while we phase out the use of such trademark in the operation of our business. We also entered into a Technology License Agreement with Exelis pursuant to which we will license on a non-exclusive basis certain of our intellectual property (excluding trademarks) existing as of the Distribution Date to Exelis and its affiliates and in turn, Exelis and its affiliates will grant reciprocal licenses to us, each for use in our respective businesses.
Working Capital Adjustment
We entered into a C
ontribution Agreement with Exelis containing a two-way adjustment mechanism relating to the working capital and cash levels of Vectrus prior to the Spin-off. Pursuant to that agreement, payments were made by the applicable entity to the other, reflecting the difference between the actual level of working capital (including cash) of Vectrus prior to the Spin-off, adjusted for the indemnification of a receivable by Exelis, as compared to the target working capital (including cash) of
$64.4 million
. As a result, Vectrus received an initial payment of
$17.0 million
from Exelis on September 26, 2014. The final payment of
$2.6 million
was made to Vectrus by Exelis during the
F-29
quarter ended December 31, 2014. In addition, the contribution agreement states any cash collected on the indemnified receivable by the Company will be remitted to Exelis.
Parent Company Equity
Net transfers (to)/from the parent are included within parent company investment on the Consolidated and Combined Statements of Shareholders' and Parent Company Equity prior to September 27, 2014 and the years ended 2013 and 2012. The components of the net transfers (to)/from parent are as follows:
|
December 31,
|
||||||||||||
|
(In thousands)
|
2014
|
2013
|
2012
|
|||||||||
|
Cash pooling and general financing activities
|
$
|
(33,565
|
)
|
$
|
(182,184
|
)
|
$
|
(181,780
|
)
|
|||
|
Corporate allocations including income taxes
|
27,194
|
|
87,260
|
|
68,027
|
|
||||||
|
Total net transfers (to)/from parent
|
$
|
(6,371
|
)
|
$
|
(94,924
|
)
|
$
|
(113,753
|
)
|
|||
The components of net assets and liabilities transferred between Exelis and the Company in connection with the Spin-off were as follows:
|
(In thousands)
|
|
September 27, 2014
|
||
|
Receivables
|
|
$
|
(594
|
)
|
|
Prepaid expenses
|
|
(59
|
)
|
|
|
Plant, property and equipment, net
|
|
(19
|
)
|
|
|
Goodwill
|
|
(5,530
|
)
|
|
|
Other non-current assets
|
3,816
|
|
||
|
Total assets transferred to Exelis
|
|
$
|
(2,386
|
)
|
|
Accounts payable
|
|
(2,212
|
)
|
|
|
Advance payments and billings in excess of costs
|
|
(833
|
)
|
|
|
Compensation and other employee benefits
|
|
(1,201
|
)
|
|
|
Other accrued liabilities
|
|
31,044
|
|
|
|
Other non-current liabilities
|
|
(1,610
|
)
|
|
|
Deferred tax liabilities
|
(9,733
|
)
|
||
|
Total liabilities transferred to Vectrus
|
|
$
|
15,455
|
|
|
Net adjustment to parent company equity
|
|
$
|
17,841
|
|
NOTE 16
COMMITMENTS AND CONTINGENCIES
General
From time to time, we are involved in legal proceedings that are incidental to the operation of our businesses. Some of these proceedings seek remedies relating to environmental matters, employment matters and commercial or contractual disputes.
Although the ultimate outcome of any legal matter cannot be predicted with certainty, based on present information, including our assessment of the merits of each particular claim, we do not expect that any asserted or unasserted legal claims or proceedings, individually or in the aggregate, will have a material adverse effect on our cash flow, results of operations, or financial condition.
F-30
Environmental
Any environmental liabilities as of the date of the Spin-off were retained by Exelis as set forth in the Distribution Agreement and accordingly, after the Spin-off the Company eliminated the liability and recorded a contribution to capital. As of December 31, 2014, we were not aware of any material outstanding environmental liabilities.
U.S. Government Contracts, Investigations and Claims
The Company has U.S. government contracts that are funded incrementally on a year-to-year basis. Changes in government policies, priorities or funding levels through agency or program budget reductions by the U.S. Congress or executive agencies could materially adversely affect the Company’s financial condition or results of operations. Furthermore, contracts with the U.S. government may be terminated or suspended by the U.S. government at any time, with or without cause. Such contract suspensions or terminations could result in unreimbursable expenses or charges or otherwise adversely affect the Company’s financial condition and results of operations.
Departments and agencies of the U.S. government have the authority to investigate various transactions and operations of the Company, and the results of such investigations may lead to administrative, civil or criminal proceedings, the ultimate outcome of which could be fines, penalties, repayments or compensatory or treble damages. U.S. government regulations provide that certain findings against a contractor may lead to suspension or debarment from future U.S. government contracts or the loss of export privileges for a company or an operating division or subdivision. Suspension or debarment could have a material adverse effect on the Company because of its reliance on U.S. government contracts.
U.S. government agencies, including the Defense Contract Audit Agency, the Defense Contract Management Agency and others, routinely audit and review a contractor’s performance on government contracts, indirect rates and pricing practices, and compliance with applicable contracting and procurement laws, regulations and standards. Accordingly, costs billed or billable to the U.S. government customers are subject to potential adjustment upon audit by such agencies. The agencies also review the adequacy of the contractor’s compliance with government standards for its accounting and management internal control systems, including: control environment and accounting systems, general information technology systems, budget and planning systems, purchasing systems, material management systems, compensation systems, labor systems, indirect and other direct costs systems, property systems, billing systems and estimating systems. Audits currently underway include the Company’s control environment and accounting, billing, and indirect and other direct cost systems, as well as reviews of the Company’s compliance with certain U.S. government Cost Accounting Standards.
From time to time, U.S. government customers advise the Company of claims and penalties concerning certain potential disallowed costs. When such findings are presented, Vectrus and the U.S. government representatives engage in discussions to enable Vectrus to evaluate the merits of these claims as well as to assess the amounts being claimed. Where appropriate, provisions are made to reflect probable losses to the matters raised by the U.S. government representatives and such provisions are reviewed on a quarterly basis for sufficiency based on the most recent information available to us.
F-31
NOTE 17
SELECTED QUARTERLY FINANCIAL DATA (UNAUDITED)
The following table comprises selected financial data for the years ended
December 31, 2014
and
2013
:
|
|
|
2014 QUARTERS
|
2013 QUARTERS
|
|||||||||||||||||||||||||||||
|
(In thousands, except per share data)
|
|
1st
|
2nd
|
3rd
|
4th
|
1st
|
2nd
|
3rd
|
|
4th
|
||||||||||||||||||||||
|
Total revenue
|
|
$
|
303,951
|
|
$
|
312,902
|
|
$
|
300,651
|
|
$
|
285,765
|
|
$
|
414,312
|
|
$
|
421,041
|
|
$
|
349,211
|
|
$
|
327,074
|
|
|||||||
|
Operating income
|
|
17,556
|
|
9,422
|
|
3,291
|
|
8,149
|
|
28,256
|
|
49,027
|
|
28,889
|
|
25,150
|
|
|||||||||||||||
|
Net income
|
|
11,234
|
|
6,132
|
|
2,115
|
|
3,331
|
|
18,147
|
|
31,493
|
|
18,590
|
|
16,162
|
|
|||||||||||||||
|
Basic earnings per share
|
|
$
|
1.07
|
|
$
|
0.59
|
|
$
|
0.20
|
|
$
|
0.32
|
|
$
|
1.73
|
|
$
|
3.01
|
|
$
|
1.77
|
|
$
|
1.54
|
|
|||||||
|
Diluted earnings per share
|
|
$
|
1.07
|
|
$
|
0.59
|
|
$
|
0.20
|
|
$
|
0.31
|
|
$
|
1.73
|
|
$
|
3.01
|
|
$
|
1.77
|
|
$
|
1.54
|
|
|||||||
|
Weighted average number of shares outstanding¹
|
|
|||||||||||||||||||||||||||||||
|
Basic
|
|
10,474
|
|
10,474
|
|
10,474
|
|
10,476
|
|
10,474
|
|
10,474
|
|
10,474
|
|
10,474
|
|
|||||||||||||||
|
Diluted
|
|
10,474
|
|
10,474
|
|
10,474
|
|
10,692
|
|
10,474
|
|
10,474
|
|
10,474
|
|
10,474
|
|
|||||||||||||||
|
|
|
|||||||||||||||||||||||||||||||
|
¹ For periods ended September 27, 2014 and prior, basic and diluted earnings per share are computed using the number of shares of Vectrus common stock outstanding on September 27, 2014, the date on which the Vectrus common stock was distributed to the shareholders of Exelis Inc.
|
||||||||||||||||||||||||||||||||
NOTE 18
SUBSEQUENT EVENTS
On February 27, 2015, the Committee approved the grant of
67,929
RSUs,
53,834
NQOs and TSR awards at a target value of
$1.7 million
, effective March 4, 2015, to employees of Vectrus. The RSUs vest in
one-third
annual installments on the first, second and third anniversaries of the grant date. The fair value of the RSUs is determined based on the closing price of Vectrus common stock on the date of grant, which was
$32.04
. The NQOs vest in one-third cumulative annual installments on the first, second and third anniversaries of the grant date and expire
10
years from the grant date. The option exercise price is the closing price of Vectrus common shares on the grant date. The fair value of each NQO grant was estimated at
$12.65
, determined on the date of grant using the Black-Scholes valuation model. Stock compensation expense will be recognized ratably over the vesting period of the awards. The TSR awards are subject to four separate performance periods during the overall three-year performance period of January 1, 2015 to December 31, 2017 as follows:
|
•
|
January 1, 2015 to December 31, 2015
|
|
•
|
January 1, 2016 to December 31, 2016
|
|
•
|
January 1, 2017 to December 31, 2017
|
|
•
|
January 1, 2015 to December 31, 2017
|
Payment, if any, is based on the Company's TSR performance relative to that of the Aerospace and Defense companies in the S&P 1500 Index and following the end of the three-year performance period. Depending on the Company's performance during the three-year performance period, payment can range from
0%
to
200%
of the target value. At the end of the three-year performance period, any payment earned with respect to the TSR awards will be settled in cash.
F-32
SIGNATURES
Pursuant to the requirements of Section 13 or 15(d) of the Securities Exchange Act of 1934, the registrant has duly caused this report to be signed on its behalf by the undersigned, thereunto duly authorized.
|
VECTRUS, INC.
|
||
|
/s/ Kristi K. Correa
|
||
|
By: Kristi K. Correa
|
||
|
Corporate Vice President and Chief Accounting Officer
|
||
|
(Principal Accounting Officer)
|
||
|
Date: March 16, 2015
|
||
Pursuant to the requirements of the Securities Exchange Act of 1934, this report has been signed below by the following persons on behalf of the registrant and in the capacities and the dates indicated.
|
SIGNATURE
|
TITLE
|
DATE
|
|
/s/ Kenneth W. Hunzeker
Kenneth W. Hunzeker
|
Chief Executive Officer and President, Director
|
March 16, 2015
|
|
/s/ Matthew M. Klein
Matthew M. Klein
|
Senior Vice President and Chief Financial Officer
|
March 16, 2015
|
|
/s/ Kristi K. Correa
Kristi K. Correa
|
Corporate Vice President and Chief Accounting Officer
|
March 16, 2015
|
|
/s/ Louis J. Giuliano
Louis J. Giuliano
|
Director
|
March 16, 2015
|
|
/s/ Bradford J. Boston
Bradford J. Boston
|
Director
|
March 16, 2015
|
|
/s/ Mary L. Howell
Mary L. Howell
|
Director
|
March 16, 2015
|
|
/s/ William F. Murdy
William F. Murdy
|
Director
|
March 16, 2015
|
|
/s/ Melvin F. Parker
Melvin F. Parker
|
Director
|
March 16, 2015
|
|
/s/ Eric M. Pillmore
Eric M. Pillmore
|
Director
|
March 16, 2015
|
|
/s/ Stephen L. Waechter
Stephen L. Waechter
|
Director
|
March 16, 2015
|
|
/s/ Phillip C. Widman
Phillip C. Widman
|
Director
|
March 16, 2015
|
51
EXHIBIT INDEX
|
3.1
|
Amended and Restated Articles of Incorporation of Vectrus, Inc. (incorporated by reference to Exhibit 3.1 to Vectrus, Inc.’s Current Report on Form 8-K filed on September 16, 2014)
|
|
3.2
|
Amended and Restated By-laws of Vectrus, Inc. (incorporated by reference to Exhibit 3.2 to Vectrus, Inc.’s Current Report on Form 8-K filed on September 16, 2014)
|
|
10.1
|
Distribution Agreement by and between Vectrus, Inc. and Exelis Inc. dated as of September 25, 2014 (incorporated by reference to Exhibit 2.1 of Exelis Inc.’s Current Report on Form 8-K filed on September 29, 2014 (CIK No. 1524471, File No. 1-35228))
|
|
10.2
|
Employee Matters Agreement by and between Exelis Inc. and Vectrus, Inc. dated as of September 25, 2014 (incorporated by reference to Exhibit 10.1 of Exelis Inc.’s Form 8-K Current Report filed on September 29, 2014 (CIK No. 1524471, File No. 1-35228))*
|
|
10.3
|
Tax Matters Agreement between Vectrus, Inc. and Exelis Inc. dated as of September 25, 2014 (incorporated by reference to Exhibit 10.2 of Exelis Inc.’s Form 8-K Current Report filed on September 29, 2014 (CIK No. 1524471, File No. 1-35228))
|
|
10.4
|
Transition Services Agreement between Vectrus, Inc. and Exelis Inc. dated as of September 25, 2014 (incorporated by reference to Exhibit 10.3 of Exelis Inc.’s Form 8-K Current Report filed on September 29, 2014 (CIK No. 1524471, File No. 1-35228))
|
|
10.5
|
Transitional Trademark License Agreement between Vectrus, Inc. and Exelis Inc. dated as of September 25, 2014 (incorporated by reference to Exhibit 10.4 of Exelis Inc.’s Form 8-K Current Report filed on September 29, 2014 (CIK No. 1524471, File No. 1-35228))
|
|
10.6
|
Technology License Agreement between Vectrus, Inc. and Exelis Inc. dated as of September 25, 2014 (Incorporated by reference to Exhibit 10.5 of Exelis Inc.’s Form 8-K Current Report filed on September 29, 2014 (CIK No. 1524471, File No. 1-35228))
|
|
10.7
|
Employment Letter dated as of September 15, 2014, between Vectrus, Inc. and Kenneth W. Hunzeker (incorporated by reference to Exhibit 10.1 to Vectrus, Inc.’s Current Report on Form 8-K filed on September 16, 2014)*
|
|
10.8
|
Employment Letter Agreement with Janet L. Oliver, dated as of April 26, 2011 (incorporated by reference to Exhibit 10.4 to Amendment No. 3 to Vectrus, Inc.’s Registration Statement on Form 10 filed on August 14, 2014)*
|
|
10.9
|
Credit Agreement by and among Vectrus, Inc., Exelis Systems Corporation, as the Borrower, the Lenders and Issuing Banks party thereto, and JPMorgan Chase Bank, N.A., as Administrative Agent, dated September 17, 2014 (incorporated by reference to Exhibit 10.1 to Vectrus, Inc.’s Current Report on Form 8-K filed on September 19, 2014)
|
|
10.10
|
Form of Indemnification Agreement for Directors of Vectrus, Inc. (incorporated by reference to Exhibit 10.10 to Vectrus, Inc.’s Quarterly Report on Form 10-Q filed on November 10, 2014)*
|
|
10.11
|
Vectrus, Inc. 2014 Omnibus Incentive Plan*+
|
|
10.12
|
Vectrus, Inc. Annual Incentive Plan (incorporated by reference to Exhibit 10.12 to Vectrus, Inc.’s Quarterly Report on Form 10-Q filed on November 10, 2014)*
|
|
10.13
|
Vectrus, Inc. Annual Incentive Plan for Executive Officers (incorporated by reference to Exhibit 10.13 to Vectrus, Inc.’s Quarterly Report on Form 10-Q filed on November 10, 2014)*
|
|
10.14
|
Vectrus 401(k) Plan (incorporated by reference to Exhibit 10.14 to Vectrus, Inc.’s Quarterly Report on Form 10-Q filed on November 10, 2014)*
|
|
10.15
|
Vectrus Systems Corporation Excess Savings Plan*+
|
|
10.16
|
Vectrus, Inc. Severance Plan (incorporated by reference to Exhibit 10.16 to Vectrus, Inc.’s Quarterly Report on Form 10-Q filed on November 10, 2014)*
|
|
10.17
|
Vectrus, Inc. Enhanced Severance Pay Plan (incorporated by reference to Exhibit 10.17 to Vectrus, Inc.’s Quarterly Report on Form 10-Q filed on November 10, 2014)*
|
|
10.18
|
Vectrus, Inc. Senior Executive Severance Pay Plan (incorporated by reference to Exhibit 10.18 to Vectrus, Inc.’s Quarterly Report on Form 10-Q filed on November 10, 2014)*
|
|
10.19
|
Vectrus, Inc. Special Senior Executive Severance Pay Plan (incorporated by reference to Exhibit 10.19 to Vectrus, Inc.’s Quarterly Report on Form 10-Q filed on November 10, 2014)*
|
|
10.20
|
Form of Vectrus, Inc. 2014 Omnibus Incentive Plan - Restricted Stock Unit Award Agreement - Non-Management Director (Stock Settled) (incorporated by reference to Exhibit 10.20 to Vectrus, Inc.’s Quarterly Report on Form 10-Q filed on November 10, 2014)*
|
52
|
10.21
|
Form of Vectrus, Inc. 2014 Omnibus Incentive Plan - Restricted Stock Unit Agreement - General Grant - Stock Settled (incorporated by reference to Exhibit 10.21 to Vectrus, Inc.’s Quarterly Report on Form 10-Q filed on November 10, 2014)*
|
|
10.22
|
Form of Vectrus, Inc. 2014 Omnibus Incentive Plan - Restricted Unit Agreement - General Grant - Cash Settled (incorporated by reference to Exhibit 10.22 to Vectrus, Inc.’s Quarterly Report on Form 10-Q filed on November 10, 2014)*
|
|
10.23
|
Form of Vectrus, Inc. 2014 Omnibus Incentive Plan - Nonqualified Stock Option Award Agreement - General Grant (incorporated by reference to Exhibit 10.23 to Vectrus, Inc.’s Quarterly Report on Form 10-Q filed on November 10, 2014)*
|
|
10.24
|
Form of Vectrus, Inc. 2014 Omnibus Incentive Plan - Restricted Stock Unit Agreement - 2013 TSR Replacement Grant - Stock Settled (incorporated by reference to Exhibit 10.24 to Vectrus, Inc.’s Quarterly Report on Form 10-Q filed on November 10, 2014)*
|
|
10.25
|
Form of Vectrus, Inc. 2014 Omnibus Incentive Plan - TSR Award Agreement (incorporated by reference to Exhibit 10.1 to Vectrus, Inc.’s Current Report on Form 8-K filed on March 5, 2015)*
|
|
11
|
Statement re computation of per share earnings. Information required to be presented in Exhibit 11 is provided in Note 4 to the Consolidated and Combined Financial Statements in Part II, Item 8. “Financial Statements and Supplementary Data” of this Annual Report on Form 10-K in accordance with the provisions of Financial Accounting Standards Board Accounting Standards Codification 260,
Earnings Per Share
.
|
|
21
|
Subsidiaries of the Company+
|
|
23
|
Consent of Deloitte and Touche LLP+
|
|
31.1
|
Certification pursuant to Rule 13a-14(a)/15d-14(a) of the Securities Exchange Act of 1934, as adopted pursuant to Section 302 of the Sarbanes-Oxley Act of 2002 +
|
|
31.2
|
Certification pursuant to Rule 13a-14(a)/15d-14(a) of the Securities Exchange Act of 1934, as adopted pursuant to Section 302 of the Sarbanes-Oxley Act of 2002 +
|
|
32.1
|
Certification Pursuant to 18 U.S.C. Section 1350, as adopted pursuant to Section 906 of the Sarbanes-Oxley Act of 2002. This Exhibit is intended to be furnished in accordance with Regulation S-K Item 601(b)(32)(ii) and shall not be deemed to be filed for purposes of Section 18 of the Securities Exchange Act of 1934 or incorporated by reference into any future filing under the Securities Act of 1933 or the Securities Exchange Act of 1934, except as shall be expressly set forth by specific reference.
|
|
32.2
|
Certification Pursuant to 18 U.S.C. Section 1350, as adopted pursuant to Section 906 of the Sarbanes-Oxley Act of 2002. This Exhibit is intended to be furnished in accordance with Regulation S-K Item 601(b)(32)(ii) and shall not be deemed to be filed for purposes of Section 18 of the Securities Exchange Act of 1934 or incorporated by reference into any future filing under the Securities Act of 1933 or the Securities Exchange Act of 1934, except as shall be expressly set forth by specific reference.
|
|
101
|
The following materials from Vectrus Inc.’s Annual Report on Form 10-K for the fiscal year ended December 31, 2014, formatted in XBRL (Extensible Business Reporting Language): (i) Consolidated and Combined Statements of Operations, (ii) [Consolidated and Combined Statements of Income], (iii) Consolidated and Combined Statements of Comprehensive Income, (iv) Consolidated and Combined Balance Sheets, (v) Consolidated and Combined Statements of Cash Flows, (vi) Consolidated and Combined Statements of Shareholders’ and Parent Company Equity and (vii) Notes to Consolidated and Combined Financial Statements. #
|
*
Indicates management contract or compensatory plan or arrangement.
+ Indicates this document is filed as an exhibit herewith.
# Submitted electronically with this report.
The Company’s Commission File Number for Reports on Form 10-K, Form 10-Q and Form 8-K is 001-36341.
53
TABLE OF CONTENTS
Part IItem 1. Description Of BusinessItem 1A. Risk FactorsItem 1B. Unresolved Staff CommentsItem 2. PropertiesItem 3. Legal ProceedingsItem 4. Mine Safety DisclosuresPart IIItem 5. Market For Registrant S Common Equity, Related Stockholder Matters and Issuer Purchases Of Equity SecuritiesItem 6. Selected Financial DataItem 7. Management S Discussion and Analysis Of Financial Condition and Results Of OperationsItem 7A. Quantitative and Qualitative Disclosures About Market RiskItem 8. Financial Statements and Supplementary DataItem 9. Changes in and Disagreements with Accountants on Accounting and Financial DisclosureItem 9A. Controls and ProceduresItem 9B. Other InformationPart IIIItem 10. Directors, Executive Officers and Corporate GovernanceItem 11. Executive CompensationItem 12. Security Ownership Of Certain Beneficial Owners and Management and Related Stockholder MattersItem 13. Certain Relationships and Related Transactions and Director IndependenceItem 14. Principal Accounting Fees and ServicesPart IVItem 15. Exhibits and Financial Statement Schedules