WARNER BROS. DISCOVERY, INC.
10-Ks and 10-Qs
|
|
|
|
|
|
|
|
|
|
|
|
|
|
|
|
|
|
|
|
|
|
|
|
|
|
|
|
|
|
|
|
|
|
|
|
|
|
|
|
|
|
|
|
|
|
|
|
|
|
|
|
|
|
|
|
UNITED STATES
SECURITIES AND EXCHANGE COMMISSION
Washington, D.C. 20549
|
FORM 10-K
|
|
ý
|
ANNUAL REPORT PURSUANT TO SECTION 13 OR 15(d) OF THE SECURITIES EXCHANGE ACT OF 1934
|
For the fiscal year ended
December 31, 2015
OR
|
¨
|
TRANSITION REPORT PURSUANT TO SECTION 13 OR 15(d) OF THE SECURITIES EXCHANGE ACT OF 1934
|
For the transition period from to
Commission File Number: 001-34177

Discovery Communications, Inc.
(Exact name of Registrant as specified in its charter)
|
Delaware
|
|
35-2333914
|
|
(State or other jurisdiction of
incorporation or organization)
|
|
(I.R.S. Employer
Identification No.)
|
|
One Discovery Place
Silver Spring, Maryland
|
|
20910
|
|
(Address of principal executive offices)
|
|
(Zip Code)
|
(240) 662-2000
(Registrant’s telephone number, including area code)
Securities registered pursuant to Section 12(b) of the Act:
|
Title of Each Class
|
|
Name of Each Exchange on Which Registered
|
|
Series A Common Stock, par value $0.01 per share
|
|
The NASDAQ Global Select Market
|
|
Series B Common Stock, par value $0.01 per share
|
|
The NASDAQ Global Select Market
|
|
Series C Common Stock, par value $0.01 per share
|
|
The NASDAQ Global Select Market
|
Securities registered pursuant to Section 12(g) of the Act:
None
Indicate by check mark if the Registrant is a well-known seasoned issuer, as defined in Rule 405 of the Securities Act. Yes
ý
No
¨
Indicate by check mark if the Registrant is not required to file reports pursuant to Section 13 or Section 15(d) of the Act. Yes
¨
No
ý
Indicate by check mark whether the Registrant (1) has filed all reports required to be filed by Section 13 or 15(d) of the Securities Exchange Act of 1934 during the preceding 12 months (or for such shorter period that the Registrant was required to file such reports), and (2) has been subject to such filing requirements for the past 90 days. Yes
ý
No
¨
Indicate by check mark whether the Registrant has submitted electronically and posted on its corporate Web site, if any, every Interactive Data File required to be submitted and posted pursuant to Rule 405 of Regulation S-T (§232.405 of this chapter) during the preceding 12 months (or for such shorter period that the Registrant was required to submit and post such files). Yes
ý
No
¨
Indicate by check mark if disclosure of delinquent filers pursuant to Item 405 of Regulation S-K (§229.405 of this chapter) is not contained herein, and will not be contained, to the best of Registrant’s knowledge, in definitive proxy or information statements incorporated by reference in Part III of this Form 10-K or any amendment to this Form 10-K.
¨
Indicate by check mark whether the Registrant is a large accelerated filer, an accelerated filer, a non-accelerated filer, or a smaller reporting company. See the definitions of “large accelerated filer,” “accelerated filer” and “smaller reporting company” in Rule 12b-2 of the Exchange Act. (Check one):
|
Large accelerated filer
|
|
ý
|
|
Accelerated filer
|
|
¨
|
|
Non-accelerated filer
|
|
¨
(Do not check if a smaller reporting company)
|
|
Smaller reporting
company
|
|
¨
|
Indicate by check mark whether the Registrant is a shell company (as defined in Rule 12b-2 of the Exchange Act). Yes
¨
No
ý
The aggregate market value of voting and non-voting common stock held by non-affiliates of the Registrant computed by reference to the last sales price of such stock, as of the last business day of the Registrant’s most recently completed second fiscal quarter, which was
June 30, 2015
, was approximately
$13 billion
.
Total number of shares outstanding of each class of the Registrant’s common stock as of
February 12, 2016
was:
|
Series A Common Stock, par value $0.01 per share
|
150,092,266
|
|
|
Series B Common Stock, par value $0.01 per share
|
6,530,284
|
|
|
Series C Common Stock, par value $0.01 per share
|
253,176,880
|
|
DOCUMENTS INCORPORATED BY REFERENCE
Certain information required in Item 10 through Item 14 of Part III of this Annual Report on Form 10-K is incorporated herein by reference to the Registrant’s definitive Proxy Statement for its
2016
Annual Meeting of Stockholders, which shall be filed with the Securities and Exchange Commission pursuant to Regulation 14A of the Securities Exchange Act of 1934, as amended, within 120 days of the Registrant’s fiscal year end.
DISCOVERY COMMUNICATIONS, INC.
FORM 10-K
TABLE OF CONTENTS
|
|
Page
|
3
For convenience, the terms “Discovery,” “DCI,” the “Company,” “we,” “us” or “our” are used in this Annual Report on Form 10-K to refer to both Discovery Communications, Inc. and collectively to Discovery Communications, Inc. and one or more of its consolidated subsidiaries, unless the context otherwise requires.
We were formed on September 17, 2008 as a Delaware corporation in connection with Discovery Holding Company (“DHC”) and Advance/Newhouse Programming Partnership (“Advance/Newhouse”) combining their respective ownership interests in Discovery Communications Holding, LLC (“DCH”) and exchanging those interests with and into Discovery (the “Discovery Formation”). As a result of the Discovery Formation, DHC and DCH became wholly owned subsidiaries of Discovery, with Discovery becoming the successor reporting entity to DHC.
OVERVIEW
We are a global media company that provides content across multiple distribution platforms, including pay-TV, free-to-air and broadcast television, websites, digital distribution arrangements and content licensing agreements. As one of the world’s largest pay-TV programmers, we provide original and purchased content and live events to more than
2.8 billion
cumulative viewers worldwide through networks that we wholly or partially own. We distribute customized content in the U.S. and over
220
other countries and territories in over
40
languages. Our global portfolio of networks includes prominent television brands such as Discovery Channel, one of the first nonfiction networks and our most widely distributed global brand, TLC, Animal Planet, Investigation Discovery, Science and Velocity (known as Turbo outside of the U.S.). We also operate a diversified portfolio of production studios, websites and curriculum-based education products and services. In 2015, we acquired 100% control of Eurosport, a leading sports entertainment pay-TV programmer across Europe and Asia.
Our objectives are to invest in content for our networks to build viewership, optimize distribution revenue, capture advertising sales, and create or reposition branded channels and businesses that can sustain long-term growth and occupy a desired content niche with strong consumer appeal. Our strategy is to maximize the distribution, ratings and profit potential of each of our branded networks. In addition to growing distribution and advertising revenues for our branded networks, we are extending content distribution across new platforms, including brand-aligned websites, web-native networks, on-line streaming, mobile devices, video on demand (“VOD”) and broadband channels, which provide promotional platforms for our television content and serve as additional outlets for advertising and distribution revenue. Audience ratings are a key driver in generating advertising revenue and creating demand on the part of cable television operators, direct-to-home ("DTH") satellite operators, telecommunication service providers, and other content distributors who deliver our content to their customers.
Our content spans genres including survival, exploration, sports, lifestyle, general entertainment, heroes, adventure, crime and investigation, health and kids. We have an extensive library of content and own most rights to our content and footage, which enables us to exploit our library to launch brands and services into new markets quickly. Our content can be re-edited and updated in a cost-effective manner to provide topical versions of subject matter that can be utilized around the world. Substantially all of our content is produced in high definition (“HD”) format.
Subscriber statistics set forth in this Annual Report on Form 10-K include both wholly owned networks and networks operated by equity method investees. Domestic subscriber statistics are based on Nielsen Media Research. International subscriber and viewer statistics are derived from internal data coupled with external sources when available. As used herein, a “subscriber” is a single household that receives the applicable network from its cable television operator, DTH satellite operator, telecommunication service provider, or other television provider, including those who receive our networks from pay-TV providers without charge pursuant to various pricing plans that include free periods and/or free carriage. The term “cumulative subscribers” refers to the sum of the total number of subscribers to each of our networks or content services. By way of example, two households that each receive five of our networks from their pay television provider represent two subscribers, but 10 cumulative subscribers. The term "viewer" is a single household that receives the signal from one of our networks using the appropriate receiving equipment without a subscription to a pay television provider.
Although the Company utilizes certain brands and content globally, we classify our operations as follows: two reportable segments: U.S. Networks, consisting principally of domestic television networks and websites and International Networks, consisting primarily of international television networks and websites; and two combined operating segments referred to as Education and Other, consisting principally of curriculum-based product and service offerings and production studios. Our segment presentation is consistent with our management structure and the financial information management uses to make decisions about operating matters, such as the allocation of resources and business performance assessments. Financial information for our segments and the geographical areas in which we do business is set forth in Item 7, “Management’s Discussion and Analysis of
4
Financial Condition and Results of Operations” and Note 21 to the consolidated financial statements included in Item 8, “Financial Statements and Supplementary Data” in this Annual Report on Form 10-K. Our global brands are:

|
•
|
Discovery Channel reached approximately
94 million
subscribers in the U.S. and
7 million
subscribers through a licensing arrangement with partners in Canada included in the U.S. Networks segment as of
December 31, 2015
. Discovery Channel reached approximately
310 million
subscribers in international markets as of
December 31, 2015
including the Discovery HD Showcase brand.
|
|
•
|
Discovery Channel is dedicated to creating non-fiction content that informs and entertains its viewers about the world in all its wonder. The network offers a signature mix of high-end production values and cinematography across genres including science and technology, exploration, adventure and history and in-depth, behind-the-scenes glimpses at the people, places and organizations that shape and share our world.
|
|
•
|
Content on Discovery Channel includes
Gold Rush
,
Naked and Afraid
,
Deadliest Catch
,
Fast N' Loud
and
Street Outlaws.
Discovery Channel is also home to specials, including
Racing Extinction
and
Shark Week.
|
|
•
|
Target viewers are adults ages 25-54, particularly men.
|
|
•
|
Discovery Channel is simulcast in HD in the U.S. and certain international markets.
|

|
•
|
TLC reached approximately
93 million
subscribers in the U.S. and also reached
7 million
subscribers in Canada that are included in the U.S. Networks segment as of
December 31, 2015
.
|
|
•
|
TLC content reached approximately
347 million
viewers in international markets as of
December 31, 2015
. International viewers, with respect to TLC, refer to households that receive networks that carry TLC content and cater to similar demographics as the TLC network in the U.S. These networks include pay-TV and free-to-air networks branded TLC, Real Time, Travel and Living and Discovery Home & Health.
|
|
•
|
TLC celebrates extraordinary people and relatable life moments through innovative nonfiction programming and is a top 10 cable network in key female demographics.
|
|
•
|
Content on TLC includes
The Little Couple
,
90 Day Fiancé
,
Long Island Medium
and
Sister Wives
.
|
|
•
|
Target viewers are adults ages 25-54, particularly women.
|
|
•
|
TLC is simulcast in HD in the U.S. and certain international markets.
|
5

|
•
|
Animal Planet reached approximately
92 million
subscribers in the U.S. and
2 million
subscribers through a licensing arrangement with partners in Canada included in the U.S. Networks segment as of
December 31, 2015
. Animal Planet reached approximately
212 million
subscribers in international markets as of
December 31, 2015
.
|
|
•
|
Animal Planet immerses viewers in the full range of life in the animal kingdom with rich, deep content via multiple platforms and offers animal lovers and pet owners access to a centralized online, television and mobile community for immersive, engaging, high-quality entertainment, information and enrichment.
|
|
•
|
Content on Animal Planet includes
Puppy Bowl
,
River Monsters
,
Treehouse Masters
,
Pit Bulls & Parolees
and
The Last Alaskans.
|
|
•
|
Target viewers are adults ages 25-54.
|
|
•
|
Animal Planet is simulcast in HD in the U.S. and certain international markets.
|

|
•
|
Investigation Discovery ("ID") reached approximately
85 million
subscribers in the U.S. and
1 million
subscribers through a licensing arrangement with partners in Canada included in the U.S. Networks segment as of
December 31, 2015
. ID reached approximately
107 million
subscribers in international markets as of
December 31, 2015
.
|
|
•
|
ID is a leading mystery-and-suspense network. From harrowing crimes and salacious scandals to the in-depth investigation and heart-breaking mysteries that result, ID challenges our everyday understanding of culture, society and the human condition.
|
|
•
|
Content on ID includes
Deadline: Crime with Tamron Hall, On The Case With Paula Zahn, Injustice Files, Homicide Hunter: Lt. Joe Kenda
and
Wives With Knives
.
|
|
•
|
Target viewers are adults ages 25-54, particularly women.
|
|
•
|
ID is simulcast in HD in the U.S. and certain international markets.
|
6

|
•
|
Science Channel reached approximately
72 million
subscribers in the U.S. and
2 million
subscribers through a licensing arrangement with partners in Canada included in the U.S. Networks segment as of
December 31, 2015
. Science Channel reached approximately
91 million
subscribers in international markets as of
December 31, 2015
.
|
|
•
|
Science Channel is home for the thought provocateur and features programming willing to go beyond imagination to explore the unknown. Guided by curiosity, Science Channel looks at innovation in mysterious new worlds as well as in our own backyards.
|
|
•
|
Content on Science Channel includes
Through the Wormhole with Morgan Freeman
,
Oddities
,
NASA's Unexplained Files
and
How It's Made
.
|
|
•
|
Target viewers are adults ages 25-54.
|
|
•
|
Science Channel is simulcast in HD in the U.S. and certain international markets.
|
 &
&

|
•
|
Velocity reached approximately
66 million
subscribers in the U.S. as of
December 31, 2015
. Velocity reached approximately
71 million
combined subscribers and viewers in international markets, where the brand is known as Turbo, as of
December 31, 2015
.
|
|
•
|
Velocity engages viewers with a variety of high-octane, action-packed, intelligent programming. In addition to series and specials exemplifying the finest of the automotive, sports and leisure, adventure and travel genres, the network broadcasts hundreds of hours of live event coverage every year.
|
|
•
|
Content on Velocity includes
Wheeler Dealers,
Chasing Classic Cars, Overhaulin'
and
Inside West Coast Customs
.
|
|
•
|
Target viewers are adults ages 25-54, particularly men.
|
U.S. NETWORKS
U.S. Networks generated revenues of $
3.1 billion
and adjusted operating income before depreciation and amortization ("Adjusted OIBDA") of
$1.8 billion
during
2015
, which represented
49%
and
74%
of our total consolidated revenues and Adjusted OIBDA, respectively. Our U.S. Networks segment principally consists of national television networks. Our U.S. Networks segment owns and operates ten national television networks, including fully distributed television networks such as Discovery Channel, TLC and Animal Planet. Discovery Channel, TLC and Animal Planet collectively generated
67%
of U.S. Networks’ total revenue. In addition, this segment holds an equity method interest in OWN: Oprah Winfrey Network ("OWN").
U.S. Networks generates revenues from fees charged to distributors of our television networks’ first run content, which include cable, DTH satellite and telecommunication service providers, referred to as affiliate fees; fees from digital distributors for licensed content that was previously distributed on our television networks, referred to as digital distribution revenue; fees from advertising sold on our television networks and websites; fees from providing sales representation and network distribution services and content to equity method investee networks; and revenue from licensing our brands for consumer products.
7
Typically, our television networks are aired pursuant to multi-year carriage agreements that provide for the level of carriage that our networks will receive and for annual graduated rate increases. Carriage of our networks depends on package inclusion, such as whether networks are on the more widely distributed, broader packages or lesser-distributed, specialized packages, also referred to as digital tiers. In December 2015, we announced our first authenticated U.S. TV Everywhere product, Discovery GO, that is available to certain subscribers. Discovery GO connects viewers with live and on-demand access to award-winning shows and series from nine U.S. networks in the Discovery portfolio: Discovery Channel, TLC, Animal Planet, ID, Science Channel, Velocity, Destination America, American Heroes Channel ("AHC") and Discovery Life.
Advertising revenue is based on the price received for available advertising spots and is dependent upon a number of factors including the number of subscribers to our channels, viewership demographics, the popularity of our programming, and our ability to sell commercial time over a portfolio of channels. In the U.S., advertising time is sold in the upfront and scatter markets. In the upfront market, advertisers buy advertising time for upcoming seasons and, by committing to purchase in advance, lock in the advertising rates they will pay for the upcoming year. Many upfront advertising commitments include options whereby advertisers may reduce purchase commitments. In the scatter market, advertisers buy advertising closer to the time when the commercials will be run, which often results in a pricing premium compared to the upfront rates. The mix of upfront and scatter market advertising time sold is based upon the economic conditions at the time that upfront sales take place impacting the sell-out levels management is willing or able to obtain. The demand in the scatter market then impacts the pricing achieved for our remaining advertising inventory. Scatter market pricing can vary from upfront pricing and can be volatile.
In addition to the global networks described in the overview section above, we operate networks in the U.S. that utilize the following brands:

|
•
|
Discovery Family Channel reached approximately
67 million
subscribers in the U.S. as of
December 31, 2015
.
|
|
•
|
Discovery Family Channel provides enriching, cool, relevant, family-friendly entertainment experiences that children and parents can enjoy together, including animated and live-action series, as well as specials, game shows, and family-favorite movies.
|
|
•
|
On
September 23, 2014
, we purchased from Hasbro an additional
10%
ownership interest in Discovery Family Channel(formerly known as the Hub Network), which was previously a
50%
owned equity method investee, for
$64 million
. As a result, we now have a controlling financial interest in Discovery Family Channel and account for it as a consolidated subsidiary. The acquisition of Discovery Family Channel supports the Company's strategic priority of broadening the scope of the network to increase viewership, and the network was rebranded as the Discovery Family Channel on
October 13, 2014
.
|
|
•
|
Content on Discovery Family Channel includes
The Aquabats! Super Show!, The Haunting Hour: The Series, SheZow, Goosebumps
and
My Little Pony Friendship is Magic
.
|
|
•
|
Target viewers are children ages 2-11 and families.
|
|
•
|
Discovery Family Channel is simulcast in HD.
|
8

|
•
|
AHC reached approximately
58 million
subscribers in the U.S. as of
December 31, 2015
. AHC also reached approximately 1 million subscribers through a licensing arrangement with partners in Canada included in the U.S. Networks segment as of December 31, 2015.
|
|
•
|
AHC provides a rare glimpse into major events that shaped our world, visionary leaders and unexpected heroes who made a difference, and the great defenders of our freedom.
|
|
•
|
Content on AHC includes
Gunslingers
,
Apocalypse WWI
and
The American Revolution
.
|
|
•
|
Target viewers are adults ages 35-64, particularly men.
|

|
•
|
Destination America reached approximately
56 million
subscribers in the U.S. as of
December 31, 2015
.
|
|
•
|
Destination America celebrates the people, places and stories of the United States, and shows on television screens with the tenacity, honesty, work ethic, humor and adventurousness that characterize our nation.
|
|
•
|
Content on Destination America includes
Mountain Monsters, A Haunting, Railroad Alaska
and
Buying the Bayou
.
|
|
•
|
Target viewers are adults ages 18-54.
|
|
•
|
Destination America is simulcast in HD.
|

|
•
|
Rebranded from Discovery Fit & Health on January 15, 2015, Discovery Life reached approximately
47 million
subscribers in the U.S. as of
December 31, 2015
.
|
|
•
|
Discovery Life entertains viewers with gripping, real-life dramas, featuring storytelling that chronicles the human experience from cradle to grave, including forensic mysteries, amazing medical stories, emergency room trauma, baby and pregnancy programming, parenting challenges, and stories of extreme life conditions.
|
|
•
|
Content on Discovery Life includes
I Didn't Know I was Pregnant, Untold Stories of the E.R., Secret Sex Lives: Swingers
and
Bizarre E.R
.
|
|
•
|
Target viewers are adults ages 25-54.
|
9

|
•
|
Our U.S. Networks segment owns an equity investment interest in OWN. OWN reached approximately
79 million
subscribers in the U.S. as of
December 31, 2015
.
|
|
•
|
OWN is the first and only network named for, and inspired by, a single iconic leader. Oprah Winfrey's heart and creative instincts inform the brand and the magnetism of the channel. Ms. Winfrey provides leadership in programming and attracts superstar talent to join her in prime time, building a global community of like-minded viewers and leading that community to connect on social media and beyond.
|
|
•
|
Content on OWN includes Tyler Perry's original series
The Haves and Have Nots
and
Love Thy Neighbor
, as well as
Iyanla: Fix My Life
and
Welcome to Sweetie Pies
.
|
|
•
|
Target viewers are adults 25-54, particularly women.
|
|
•
|
OWN is simulcast in HD.
|
INTERNATIONAL NETWORKS
International Networks generated revenues of
$3.1 billion
and Adjusted OIBDA of
$1.0 billion
during
2015
, which represented
48%
and
40%
of our total consolidated revenues and Adjusted OIBDA, respectively. Our International Networks segment principally consists of national and pan-regional television networks. This segment generates revenue from operations in virtually every pay-TV market in the world through an infrastructure that includes operational centers in London, Warsaw, Milan, Singapore and Miami. Global brands include Discovery Channel, Animal Planet, TLC, ID, Science Channel and Turbo (known as Velocity in the U.S.), along with brands exclusive to International Networks, including Eurosport, Real Time, DMAX and Discovery Kids. International Networks has a large international distribution platform for its
36
networks, with as many as
14
networks distributed across more than
220
countries and territories around the world. Including all acquisitions through
December 31, 2015
, International Networks operated over
380
unique distribution feeds in over
40
languages with channel feeds customized according to language needs and advertising sales opportunities. International Networks also has free-to-air networks in Europe and the Middle East and broadcast networks in the Nordic countries, which we refer to as the Nordics and continues to pursue further international expansion. The penetration and growth rates of pay-TV services vary across the
220
countries and territories depending on the dominance of different television platforms in local markets. While pay-TV services have greater penetration in certain markets, free-to-air or broadcast television is dominant in others. International Networks pursues distribution across all television platforms based on the specific dynamics of local markets and relevant commercial agreements. In addition to the global networks described in the overview section above, we operate networks internationally that utilize the following brands:

|
•
|
Eurosport is a leading sports entertainment group with the following brands: Eurosport, Eurosport 2 and Eurosportnews, reaching viewers across Europe and Asia.
|
|
•
|
Viewing subscribers reached by each brand as of
December 31, 2015
were as follows: Eurosport:
161 million
; Eurosport 2:
72 million
; and Eurosportnews:
11 million
.
|
|
•
|
Eurosport telecasts sporting events with pan-regional appeal and its events focus on winter sports, cycling and tennis, including the Tour de France cycling tournament and the French and U.S. Open tennis tournaments.
|
|
•
|
In 2015, we committed to acquire the exclusive broadcast rights across all media platforms throughout Europe for the four Olympic Games between 2018 and 2024 for
€1.3 billion
(
$1.5 billion
as of
December 31, 2015
). The broadcast rights exclude the U.K. and France for the Olympic Games in 2018 and 2020, and exclude Russia. In addition to free-to-air broadcasts for the Olympic Games, many of these events are set to air on Eurosport's channels. On
February 2, 2016
, we announced that we will sub-license from the BBC exclusive pay-TV rights in the U.K. to the 2018 and 2020 Olympic Games.
|
|
•
|
Eurosport and Eurosport 2 are simulcast in HD.
|
10
|
•
|
Eurosport also operates the Eurosport Player, an over-the-top direct-to-consumer platform designed for mobile environments.
|

|
•
|
As of
December 31, 2015
, DMAX reached approximately
85 million
viewers through free-to-air networks, according to internal estimates.
|
|
•
|
DMAX is a men’s lifestyle channel in Asia and Europe.
|

|
•
|
Discovery Kids reached approximately
102 million
viewers, according to internal estimates, as of
December 31, 2015
.
|
|
•
|
Discovery Kids is a leading children's network in Latin America and Asia.
|
Our International Networks segment also owns and operates the following regional television networks, which reached the following number of subscribers and viewers via pay and free-to-air or broadcast networks, respectively as of
December 31, 2015
:
|
Television Service
|
International
Subscribers/Viewers
(millions)
|
||||
|
SBS Nordic Broadcast Networks
(a)
|
Broadcast
|
30
|
|||
|
Quest
|
Free-to-air
|
26
|
|||
|
Giallo
|
Free-to-air
|
25
|
|||
|
Frisbee
|
Free-to-air
|
25
|
|||
|
Focus
|
Free-to-air
|
25
|
|||
|
K2
|
Free-to-air
|
25
|
|||
|
DeeJay TV
|
Free-to-air
|
25
|
|||
|
Discovery Max
|
Free-to-air
|
19
|
|||
|
Discovery World
|
Pay
|
18
|
|||
|
Discovery HD World
|
Pay
|
19
|
|||
|
Shed
|
Pay
|
12
|
|||
|
Discovery History
|
Pay
|
13
|
|||
|
Discovery en Espanol (U.S.)
|
Pay
|
7
|
|||
|
Discovery Familia (U.S.)
|
Pay
|
6
|
|||
(a)
Number of subscribers corresponds to the sum of the subscribers to each of the SBS Nordic broadcast networks in Sweden, Norway, Finland and Denmark subject to retransmission agreements with pay television providers.
Similar to U.S. Networks, a significant source of revenue for International Networks relates to fees charged to operators who distribute our linear networks. Such operators primarily include cable and DTH satellite service providers. International television markets vary in their stages of development. Some markets, such as the U.K., are more advanced digital television markets, while
11
others remain in the analog environment with varying degrees of investment from operators to expand channel capacity or convert to digital technologies. Common practice in some markets results in long-term contractual distribution relationships, while customers in other markets renew contracts annually. Distribution revenue for our International Networks segment is largely dependent on the number of subscribers that receive our networks or content, the rates negotiated in the distributor agreements, and the market demand for the content that we provide.
The other significant source of revenue for International Networks relates to advertising sold on our television networks, similar to U.S. Networks. Advertising revenue is dependent upon a number of factors, including the development of pay and free-to-air television markets, the number of subscribers to and viewers of our channels, viewership demographics, the popularity of our programming, and our ability to sell commercial time over a group of channels. In certain markets, our advertising sales business operates with in-house sales teams, while we rely on external sales representation services in other markets. In developing television markets, we expect that advertising revenue growth will result from continued subscriber growth, our localization strategy, and the shift of advertising spending from traditional broadcast networks to channels in the multi-channel environment. In relatively mature markets, such as Western Europe, we anticipate that growth in advertising revenue will come from increasing viewership and advertising pricing on our existing television networks, launching new services and through acquisitions.
During
2015
, distribution, advertising and other revenues were
53%
,
44%
and
3%
, respectively, of total net revenues for this segment. While the Company has traditionally operated cable networks, an increasing portion of the Company's international ad revenue is generated by free-to-air or broadcast networks. Pay-TV networks and free-to-air or broadcast networks, which include the SBS networks, generated
47%
and
49%
of International Networks'
2015
advertising revenue, respectively. Radio networks generated
4%
of International Networks'
2015
advertising revenue.
On December 21, 2012, we acquired a
20%
ownership interest in Eurosport, which includes both Eurosport International and Eurosport France, which was accounted for as an equity method investment. On
May 30, 2014
, we acquired a controlling
31%
interest in Eurosport International for €
259 million
($
351 million
) and committed to acquire a similar controlling interest in Eurosport France upon resolution of certain regulatory matters. The outstanding regulatory matters in France were subsequently resolved, and on
March 31, 2015
, we completed our acquisition of an additional
31%
equity interest in Eurosport France for
€36 million
(
$38 million
), giving us a
51%
stake in Eurosport. (See Note 3 to the accompanying consolidated financial statements.) On October 1, 2015, we acquired the remaining
49%
of Eurosport for
€491 million
(
$548 million
). (See Note 11 to the accompanying consolidated financial statements.)
On April 9, 2013, we acquired the television and radio operations of SBS Nordic from Prosiebensat.1 Media AG for cash of approximately
€1.4 billion
($
1.8 billion
), including closing purchase price adjustments. As of the
year ended December 31, 2015
, we recorded a pre-tax loss of
$12 million
on the sale of our radio businesses in Northern Europe to Bauer Media Group ("Bauer") for total consideration, net of cash disposed, of
€60 million
(
$67 million
), which includes
€54 million
(
$61 million
) of net cash received at closing on
June 30, 2015
and
€6 million
(
$6 million
) for the fair value of contingent consideration. We determined that the disposal did not meet the definition of a discontinued operation because it does not represent a strategic shift that has a significant impact on our operations and consolidated financial results. (See Note 3 to the accompanying consolidated financial statements.)
On
October 7, 2015
, we recorded a pretax loss of
$5 million
for the contribution of our Russian business to a joint venture (the “New Russian Business”) with a Russian media company, National Media Group ("NMG"). We now hold a
20%
interest in the New Russian Business, which was established to comply with changes in Russian legislation limiting foreign ownership. We no longer consolidate the contributed Russian business, which was a component of our International Networks operating segment and we will account for our ownership interest in the New Russian Business as an equity method investment. (See Note 3 to the accompanying consolidated financial statements.)
In
2015
, we acquired a 100% equity interest in several other unrelated businesses for total cash and contingent consideration of
$91 million
, net of cash acquired. The acquisitions included a free-to-air network in Italy, cable networks in Denmark, a free-to-air network in Turkey and a pay-TV sports channel in Asia. (See Note 3 to the accompanying consolidated financial statements.) All acquired businesses are components of our International Networks operating segment.
On January 10, 2013, we purchased an additional
30%
ownership interest in Discovery Japan, which was previously a
50%
owned equity method investee. As a result, we now have a controlling financial interest in Discovery Japan and account for it as a consolidated subsidiary. We recognized a $
92 million
gain upon consolidation for the difference in the carrying value and the fair value of the previously held equity interest. (See Note 3 to the accompanying consolidated financial statements.)
Acquisitions are included in our operating results upon their acquisition date and dispositions are excluded from our operating results following their disposition date. (See Note 3 to the accompanying consolidated financial statements.)
Effective January 1, 2015, we realigned our International Networks management reporting structure into the following regions: Northern Europe, which includes primarily the Nordics and U.K.; Southern Europe, which primarily includes Italy and
12
Spain; Central and Eastern Europe, the Middle East, and Africa (“CEEMEA”), which has been expanded to include Germany; Latin America; Asia-Pacific; and Eurosport. Previously, International Networks’ regional operations reporting structure was segregated into the following regions: Western Europe, which included the U.K. and western European countries; Nordics; CEEMEA; Latin America; Asia-Pacific; and Eurosport. This realignment did not impact our consolidated financial statements other than to change the regions in which we describe our operating results for the International Networks segment.
EDUCATION AND OTHER
Education and Other generated revenues of $
173 million
during
2015
, which represented
3%
of our total consolidated revenues. Education is comprised of curriculum-based product and service offerings and generates revenues primarily from subscriptions charged to K-12 schools for access to an online suite of curriculum-based VOD tools, professional development services, digital textbooks and, to a lesser extent, student assessments and publication of hard copy curriculum-based content. Other is comprised of production studios that develop content for our networks and other television service providers throughout the world. Our wholly owned production studios provide services to our U.S. Networks and International Networks segments at cost. The revenues and offsetting expenses associated with these inter-segment production services are not reflected in the results of operations for Education and Other as they have been eliminated within the Production Studios operating segment.
On November 12, 2015, the Company acquired 5 million shares, or 3.4%, of Lions Gate Entertainment Corp. ("Lionsgate"), an entertainment company involved in the production of movies and television, for
$195 million
. (See Note 4 to the accompanying consolidated financial statements.)
On
September 23, 2014
, the Company acquired a
50%
equity method ownership interest in All3Media, a production studio company, with an enterprise value of
£556 million
(
$912 million
) as of
December 31, 2015
for a cash payment of approximately
£90 million
(
$147 million
). All3Media recapitalized its debt structure to effect the transaction. (See Note 4 to the accompanying consolidated financial statements.)
On February 28, 2014, we acquired Raw TV Limited, a factual entertainment production company in the U.K., to improve the sourcing of content for our networks. (See Note 3 to the accompanying consolidated financial statements.)
On
November 1, 2013
, we acquired an education business in the U.K. to complement our existing service offerings and expand our operations internationally. (See Note 3 to the accompanying consolidated financial statements.)
Our production studios are an operating segment that has been combined with our Education segment. Neither of these operating segments meet the quantitative thresholds for reporting as a separate reportable segment and are aggregated for reporting purposes to reconcile reporting segments to consolidated results.
CONTENT DEVELOPMENT
Our content development strategy is designed to increase viewership, maintain innovation and quality leadership, and provide value for our network distributors and advertising customers. Our content is sourced from a wide range of third-party producers, which include some of the world’s leading nonfiction production companies as well as independent producers, and wholly owned production studios.
Our production arrangements fall into three categories: produced, coproduced and licensed. Produced content includes content that we engage third parties or wholly owned production studios to develop and produce. We retain editorial control and own most or all of the rights, in exchange for paying all development and production costs. Coproduced content refers to program rights on which we have collaborated with third parties to finance and develop either because at times world-wide rights are not available for acquisition or we save costs by collaborating with third parties. Licensed content is comprised of films or series that have been produced by third parties. Payments for sports rights made in advance of the event are recognized as prepaid content license assets.
International Networks maximizes the use of content from our U.S. Networks. Much of our content tends to be culturally neutral and maintains its relevance for an extended period of time. As a result, a significant amount of our content translates well across international borders and is made even more accessible through extensive use of dubbing and subtitles in local languages. Our content can be re-edited and updated in a cost-effective manner to provide topical versions of subject matter that can be utilized around the world. International Networks executes a localization strategy by offering content from U.S. Networks, customized content and localized schedules via our distribution feeds. While our International Networks segment maximizes the use of content from U.S. Networks, we also develop local content that is tailored to individual market preferences and license the rights to air films, television series and sporting events from third-party producers.
Our largest single cost is content expense, which includes content amortization, content impairments and production costs. We amortize the cost of capitalized content rights based on the proportion that the current year's estimated revenues bear to the
13
estimated remaining total lifetime revenues, which normally results in an accelerated amortization method over the estimated useful lives. However, certain networks also utilize a straight-line method of amortization over the estimated useful lives of the content. Content is amortized primarily over periods of
three
to
four
years. The costs for multi-year sports programming arrangements are expensed when the event is broadcast based on the estimated relative value of each season in the arrangement. Content assets are reviewed for impairment when impairment indicators are present, such as low viewership or limited expected use. Impairment losses are recorded for content asset carrying value in excess of net realizable value.
REVENUES
We generate revenues principally from fees charged to operators who distribute our network content, which primarily include cable, DTH satellite, telecommunication and digital service providers and advertising sold on our networks and websites. Other transactions include curriculum-based products and services, affiliate and advertising sales representation services, production of content, content licenses and the licensing of our brands for consumer products. During
2015
, distribution, advertising and other revenues were
48%
,
47%
and
5%
, respectively, of consolidated revenues. No individual customer represented more than 10% of our total consolidated revenues for
2015
,
2014
or
2013
.
Distribution
Distribution revenue includes fees charged for the right to view Discovery's network branded content made available to customers through a variety of distribution platforms and viewing devices. The largest component of distribution revenue is comprised of linear distribution services for rights to our networks from cable, DTH satellite and telecommunication service providers. We have contracts with distributors representing most cable and satellite service providers around the world, including the largest operators in the U.S. and major international distributors. Typically, our television networks are aired pursuant to multi-year carriage agreements that provide for the level of carriage that Discovery’s networks will receive, and, if applicable, for scheduled graduated annual rate increases. Carriage of our networks depends upon package inclusion, such as whether networks are on the more widely distributed, broader packages or lesser-distributed, specialized packages. Distribution revenues are largely dependent on the rates negotiated in the agreements, the number of subscribers that receive our networks or content, and the market demand for the content that we provide. We have provided distributors launch incentives, in the form of cash payments or free periods, to carry our networks.
In the U.S., approximately
95%
of distribution revenues come from the top 10 distributors, with whom we have agreements that expire at various times from
2016 through 2021
. Outside of the U.S., approximately
45%
of distribution revenue comes from the top 10 distributors. Distribution fees are typically collected ratably throughout the year. International television markets vary in their stages of development. Some, notably the U.K., are more advanced digital multi-channel television markets, while others operate in the analog environment with varying degrees of investment from distributors in expanding channel capacity or converting to digital.
Distribution revenue also includes fees charged for bulk content arrangements and other subscription services for episodic content. These digital distribution agreements are impacted by the quantity, as well as the quality, of the content Discovery provides.
Advertising
Our advertising revenue consists of consumer advertising, which is sold primarily on a national basis in the U.S. and on a pan-regional or local-language feed basis outside the U.S. Advertising contracts generally have a term of one year or less.
In the U.S., we sell advertising time in the upfront and scatter markets. In the upfront market, advertisers buy advertising time for the upcoming season and by purchasing in advance often receive discounted rates. In the scatter market, advertisers buy advertising time close to the time when the commercials will be run and often pay a premium. The mix between the upfront and scatter markets is based upon a number of factors, such as pricing, demand for advertising time and economic conditions. Outside the U.S., advertisers typically buy advertising closer to the time when the commercials will be run. In developing pay television markets, we expect advertising revenue growth will result from subscriber growth, our localization strategy, and the shift of advertising spending from broadcast to pay television. In mature markets, such as the U.S. and Western Europe, high proportions of market penetration and distribution are unlikely to drive rapid revenue growth. Instead, growth in advertising sales comes from increasing viewership and pricing and launching new services, either in pay-TV, broadcast, or free-to-air television environments.
Advertising revenue is dependent upon a number of factors, including the stage of development of television markets, the popularity of free-to-air television, the number of subscribers to our channels, viewership demographics, the popularity of our content and our ability to sell commercial time over a group of channels. Revenue from advertising is subject to seasonality, market-based variations and general economic conditions. Advertising revenue is typically highest in the second and fourth
14
quarters. In some cases, advertising sales are subject to ratings guarantees that require us to provide additional advertising time if the guaranteed audience levels are not achieved.
We also generate revenue from the sale of advertising on our websites on a stand-alone basis and as part of advertising packages with our television networks.
Other
We also generate income associated with curriculum-based products and services, the licensing of our brands for consumer products and third-party content sales, and content production from our production studios.
COMPETITION
Providing television content across various distribution platforms is a highly competitive business worldwide. We experience competition for the development and acquisition of content, distribution of our content, sale of commercial time on our networks and viewership. Our networks compete with other production studios, other television networks, and the internet for the acquisition of content and creative talent such as writers, producers and directors. Our ability to produce and acquire popular content is an important competitive factor for the distribution of our networks, attracting viewers and the sale of advertising. Our success in securing popular content and creative talent depends on various factors such as the number of competitors providing content that targets the same genre and audience, the distribution of our networks, viewership, and the production, marketing and advertising support we provide.
Our networks compete with other television networks, including broadcast, cable and local, for the distribution of our content and fees charged to cable television operators, DTH satellite service providers, and other distributors that carry our network content. Our ability to secure distribution agreements is necessary to ensure the retention of our audiences. Our contractual agreements with distributors are renewed or renegotiated from time to time in the ordinary course of business. Growth in the number of networks distributed, consolidation and other market conditions in the cable and satellite distribution industry, and increased popularity of other platforms may adversely affect our ability to obtain and maintain contractual terms for the distribution of our content that are as favorable as those currently in place. The ability to secure distribution agreements is dependent upon the production, acquisition and packaging of original content, viewership, the marketing and advertising support and incentives provided to distributors, the product offering across a series of networks within a region, and the prices charged for carriage.
Our networks and websites compete for the sale of advertising with other television networks, including broadcast, cable and local networks, online and mobile outlets, radio content and print media. Our success in selling advertising is a function of the size and demographics of our audiences, quantitative and qualitative characteristics of the audience of each network, the perceived quality of the network and of the particular content, the brand appeal of the network and ratings as determined by third-party research companies, prices charged for advertising and overall advertiser demand in the marketplace.
Our networks and websites also compete for their target audiences with all forms of content and other media provided to viewers, including broadcast, cable and local networks, pay-per-view and VOD services, DVDs, online activities and other forms of news, information and entertainment.
Our education business competes with other providers of curriculum-based products and services to schools. Our production studios compete with other production and media companies for talent.
INTELLECTUAL PROPERTY
Our intellectual property assets include copyrights in television content, trademarks in brands, names and logos, websites, and licenses of intellectual property rights from third parties.
We are fundamentally a content company and the protection of our brands and content is of primary importance. To protect our intellectual property assets, we rely upon a combination of copyright, trademark, unfair competition, trade secret and Internet/domain name statutes and laws, and contract provisions. However, there can be no assurance of the degree to which these measures will be successful. Moreover, effective intellectual property protection may be either unavailable or limited in certain foreign territories. Policing unauthorized use of our products and services and related intellectual property is difficult and costly. We seek to limit unauthorized use of our intellectual property through a combination of approaches. However, the steps taken to prevent the infringement of our intellectual property by unauthorized third parties may not work.
Third parties may challenge the validity or scope of our intellectual property from time to time, and the success of any such challenges could result in the limitation or loss of intellectual property rights. Irrespective of their validity, such claims may result in substantial costs and diversion of resources which could have an adverse effect on our operations. In addition, piracy, which
15
encompasses the theft of our signal, and unauthorized use of our content, in the digital environment continues to present a threat to revenues from products and services based on our intellectual property.
REGULATORY MATTERS
Our businesses are subject to and affected by regulations of U.S. federal, state and local government authorities, and our international operations are subject to laws and regulations of the countries and international bodies, such as the European Union, in which we operate. Content networks, such as those owned by us, are regulated by the Federal Communications Commission (“FCC”) in certain respects if they are affiliated with a cable television operator. Other FCC regulations, although imposed on cable television operators and direct broadcast satellite ("DBS") operators, affect content networks indirectly. The rules, regulations, policies and procedures affecting our businesses are constantly subject to change. These descriptions are summary in nature and do not purport to describe all present and proposed laws and regulations affecting our businesses.
Program Access
The FCC’s program access rules prevent a satellite or cable content vendor in which a cable operator has an “attributable” ownership interest from discriminating against unaffiliated multichannel video programming distributors (“MVPDs”), such as cable and DBS operators, in the rates, terms and conditions for the sale or delivery of content. These rules also permit MVPDs to initiate complaints to the FCC against content networks if an MVPD claims it is unable to obtain rights to carry the content network on nondiscriminatory rates, terms or conditions. The FCC allowed a previous blanket prohibition on exclusive arrangements with cable operators to expire in October 2012, but will consider case-by-case complaints that exclusive contracts between cable operators and cable-affiliated programmers significantly hinder or prevent an unaffiliated MVPD from providing satellite or cable programming.
“Must-Carry”/Retransmission Consent
The Cable Television Consumer Protection and Competition Act of 1992 (the “Act”) imposes “must-carry” regulations on cable systems, requiring them to carry the signals of most local broadcast television stations in their market. DBS systems are also subject to their own must-carry rules. The FCC’s implementation of “must-carry” obligations requires cable operators and DBS providers to give broadcasters preferential access to channel space. This reduces the amount of channel space that is available for carriage of our networks by cable and DBS operators. The Act also established retransmission consent, which refers to a broadcaster’s right to require MVPDs, such as cable and satellite operators, to obtain the broadcaster's consent before distributing the broadcaster's signal to the MVPDs' subscribers. Broadcasters have traditionally used the resulting leverage from demand for their must-have broadcast content to obtain carriage for their affiliated networks. Increasingly, broadcasters are additionally seeking substantial monetary compensation for granting carriage rights for their must-have broadcast content. Such increased financial demands on distributors reduce the content funds available for independent programmers not affiliated with broadcasters, such as us.
Closed Captioning and Advertising Restrictions
Certain of our networks must provide closed-captioning of content. Our content and websites intended primarily for children 12 years of age and under must comply with certain limits on advertising, and commercials embedded in our networks’ content stream adhere to certain standards for ensuring that those commercials are not transmitted at louder volumes than our program material. The 21
st
Century Communications and Video Accessibility Act of 2010 requires us to provide closed captioning on certain IP-delivered video content that we offer.
Obscenity Restrictions
Network distributors are prohibited from transmitting obscene content, and our affiliation agreements generally require us to refrain from including such content on our networks.
Violent Programming
In 2007, the FCC issued a report on violence in programing that recommended Congress prohibit the availability of violent programming, including cable programming, during hours when children are likely to be watching. Recent events have led to a renewed interest by some members of Congress in the alleged effects of violent programming, which could lead to a renewal of interest in limiting the availability of such programming or prohibiting it.
Regulation of the Internet
We operate several websites that we use to distribute information about our programs and to offer consumers the opportunity to purchase consumer products and services. Internet services are now subject to regulation in the U.S. relating to the privacy and
16
security of personally identifiable user information and acquisition of personal information from children under 13, including the federal Children's Online Privacy Protection Act and the federal Controlling the Assault of Non-Solicited Pornography and Marketing Act. In addition, a majority of states have enacted laws that impose data security and security breach obligations. Additional federal and state laws and regulations may be adopted with respect to the Internet or other on-line services, covering such issues as user privacy, child safety, data security, advertising, pricing, content, copyrights and trademarks, access by persons with disabilities, distribution, taxation and characteristics and quality of products and services. In addition, to the extent we offer products and services to on-line consumers outside the U.S., the laws and regulations of foreign jurisdictions, including, without limitation, consumer protection, privacy, advertising, data retention, intellectual property, and content limitations, may impose additional compliance obligations on us.
Foreign Laws and Regulations
The foreign jurisdictions in which our networks are offered have, in varying degrees, laws and regulations governing our businesses.
EMPLOYEES
As of
December 31, 2015
, we had approximately
7,000
employees, including full-time and part-time employees of our wholly owned subsidiaries and consolidated ventures.
AVAILABLE INFORMATION
All of our filings with the U.S. Securities and Exchange Commission (the “SEC”), including reports on Form 10-K, Form 10-Q and Form 8-K, and all amendments to such filings are available free of charge at the investor relations section of our website, www.discoverycommunications.com, as soon as reasonably practicable after such material is filed with, or furnished to, the SEC. Our annual report, corporate governance guidelines, code of business ethics, audit committee charter, compensation committee charter, and nominating and corporate governance committee charter are also available on our website. In addition, we will provide a printed copy of any of these documents, free of charge, upon written request to: Investor Relations, Discovery Communications, Inc., 850 Third Avenue, 8th Floor, New York, NY 10022-7225. Additionally, the SEC maintains a website at http://www.sec.gov that contains quarterly, annual and current reports, proxy and information statements, and other information regarding issuers that file electronically with the SEC, including the Company. The public may also read and copy any materials that the Company files with the SEC at the SEC's Public Reference Room at 100 F Street, NE, Washington, DC 20549. Information on the operation of the Public Reference Room may be obtained by calling the SEC at 1-800-SEC-0330.
The information contained on our website is not part of this Annual Report on Form 10-K and is not incorporated by reference herein.
Investing in our securities involves risk. In addition to the other information contained in this report, you should consider the following risk factors before investing in our securities.
Consolidation among cable and satellite providers, both domestically and internationally, could have an adverse effect on our revenue and profitability.
Consolidation among cable and satellite operators has given the largest operators considerable leverage in their relationships with programmers, including us. In the U.S., approximately
95%
of our distribution revenues come from the top 10 distributors. We currently have agreements in place with the major U.S. cable and satellite operators which expire at various times through 2021. Some of our largest distributors are combining and have gained, or may gain, market power, which could affect our ability to maximize the value of our content through those platforms. In addition, many of the countries and territories in which we distribute our networks also have a small number of dominant distributors. Continued consolidation within the industry could reduce the number of distributors to carry our programming, subject our affiliate fee revenue to greater volume discounts, and further increase the negotiating leverage of the cable and satellite television system operators which could have an adverse effect on our financial condition or results of operations.
There has been a shift in consumer behavior as a result of technological innovations and changes in the distribution of content, which may affect our viewership and the profitability of our business in unpredictable ways.
Technology and business models in our industry continue to evolve rapidly. Consumer behavior related to changes in content distribution and technological innovation affect our economic model and viewership in ways that are not entirely predictable.
17
Consumers are increasingly viewing content on a time-delayed or on-demand basis from traditional distributors and from connected apps and websites and on a wide variety of screens, such as televisions, tablets, mobile phones and other devices. Additionally, devices that allow users to view television programs on a time-shifted basis and technologies that enable users to fast-forward or skip programming, including commercials, such as DVRs and portable digital devices and systems that enable users to store or make portable copies of content may affect the attractiveness of our offerings to advertisers and could therefore adversely affect our revenues. There is increased demand for short-form, user-generated and interactive content, which have different economic models than our traditional content offerings. Digital downloads, rights lockers, rentals and subscription services are competing for consumer preferences with each other and with traditional physical distribution of DVDs and Blu-ray discs. Each distribution model has different risks and economic consequences for us, so the rapid evolution of consumer preferences may have an economic impact that is not completely predictable. Distribution windows are also evolving, potentially affecting revenues from other windows. If we cannot ensure that our distribution methods and content are responsive to our target audiences, our business could be adversely affected.
The success of our business depends on the acceptance of our entertainment content by our U.S. and foreign viewers, which may be unpredictable and volatile.
The production and distribution of entertainment content are inherently risky businesses because the revenue we derive and our ability to distribute our content depend primarily on consumer tastes and preferences that often change in unpredictable ways. Our success depends on our ability to consistently create and acquire content that meets the changing preferences of viewers in general, in special interest groups, in specific demographic categories and in various international marketplaces. The commercial success of our content also depends upon the quality and acceptance of competing content available in the applicable marketplace. Other factors, including the availability of alternative forms of entertainment and leisure time activities, general economic conditions, piracy, and growing competition for consumer discretionary spending may also affect the audience for our content. Audience sizes for our media networks are critical factors affecting both the volume and pricing of advertising revenue that we receive, and the extent of distribution and the license fees we receive under agreements with our distributors. Consequently, reduced public acceptance of our entertainment content may decrease our audience share and adversely affect our results of operations.
We face cybersecurity and similar risks, which could result in the disclosure of confidential information, disruption of our programming services, damage to our brands and reputation, legal exposure and financial losses.
Our on-line, mobile and app offerings, as well as our internal systems, involve the storage and transmission of proprietary information, and we and our partners rely on various technology systems in connection with the production and distribution of our programming. Our systems may be breached due to employee error, computer malware, viruses, hacking and phishing attacks, or otherwise. Additionally, outside parties may attempt to fraudulently induce employees or users to disclose sensitive or confidential information in order to gain access to data. Because the techniques used to obtain unauthorized access, disable or degrade service, or sabotage systems change frequently and often are not recognized until launched against a target, we may be unable to anticipate these techniques or to implement adequate preventative measures. Any such breach or unauthorized access could result in a loss of our proprietary information, which may include user data, a disruption of our services or a reduction of the revenues we are able to generate from such services, damage to our brands and reputation, a loss of confidence in the security of our offerings and services, and significant legal and financial exposure, each of which could potentially have an adverse effect on our business.
Our businesses operate in highly competitive industries.
The entertainment and media programming industries in which we operate are highly competitive. We compete with other programming networks for distribution, viewers and advertising. We also compete for viewers with other forms of media entertainment, such as home video, movies, periodicals, on-line and mobile activities. In particular, websites and search engines have seen significant advertising growth, a portion of which is derived from traditional cable network and satellite advertisers. Businesses, including ours, that offer multiple services, or that may be vertically integrated and offer both video distribution and programming content, may face closer regulatory review from the competition authorities in the countries in which we currently have operations. If our distributors have to pay higher rates to holders of sports broadcasting rights, it might be difficult for us to negotiate higher rates for distribution of our networks. Our on-line businesses compete for users and advertising in the broad and diverse market of free and subscription Internet-delivered services. Our commerce business competes against a wide range of competitive retailers selling similar products. Our curriculum-based video business and digital textbook business compete with other providers of education products to schools. The ability for our businesses to compete successfully depends on a number of factors, including our ability to consistently supply high quality and popular content, access our niche viewership with appealing category-specific content, adapt to new technologies and distribution platforms and achieve widespread distribution. There can be no assurance that we will be able to compete successfully in the future against existing or new competitors, or that increasing competition will not have a material adverse effect on our business, financial condition or results of operations.
18
Failure to renew, renewal with less favorable terms, or termination of our affiliation agreements may cause a decline in our revenue.
Because our networks are licensed on a wholesale basis to distributors, such as cable and satellite operators, which in turn distribute them to consumers, we are dependent upon the maintenance of affiliation agreements with these operators. These affiliation agreements generally provide for the level of carriage our networks will receive, such as channel placement and programming package inclusion (widely distributed, broader programming packages compared to lesser distributed, specialized programming packages) and for payment of a license fee to us based on the number of subscribers that receive our networks. While the number of subscribers associated with our networks impacts our ability to generate advertising revenue, these per subscriber payments also represent a significant portion of our revenue. Our affiliation agreements generally have a limited term which varies by market and distributor, and there can be no assurance that these affiliation agreements will be renewed in the future, or renewed on terms that are favorable to us. A reduction in the license fees that we receive per subscriber or in the number of subscribers for which we are paid, including as a result of a loss or reduction in carriage for our networks, could adversely affect our distribution revenue. Such a loss or reduction in carriage could also decrease the potential audience for our programs thereby adversely affecting our advertising revenue. In addition, our affiliation agreements are complex and individually negotiated. If we were to disagree with one of our counterparties on the interpretation of an affiliation agreement, our relationship with that counterparty could be damaged and our business could be negatively affected.
Interpretation of some terms of our distribution agreements may have an adverse effect on the distribution payments we receive under those agreements.
Some of our distribution agreements contain “most favored nation” clauses. These clauses typically provide that if we enter into an agreement with another distributor which contains certain more favorable terms, we must offer some of those terms to our existing distributors. We have entered into a number of distribution agreements with terms that differ in some respects from those contained in other agreements. While we believe that we have appropriately complied with the most favored nation clauses included in our distribution agreements, these agreements are complex and other parties could reach a different conclusion that, if correct, could have an adverse effect on our financial condition or results of operations.
We are subject to risks related to our international operations.
We have operations through which we distribute programming outside the United States. As a result, our business is subject to certain risks inherent in international business, many of which are beyond our control. These risks include:
|
•
|
laws and policies affecting trade and taxes, including laws and policies relating to the repatriation of funds and withholding taxes, and changes in these laws;
|
|
•
|
changes in local regulatory requirements, including restrictions on content, imposition of local content quotas and restrictions on foreign ownership;
|
|
•
|
differing degrees of protection for intellectual property and varying attitudes towards the piracy of intellectual property;
|
|
•
|
significant fluctuations in foreign currency value;
|
|
•
|
currency exchange controls;
|
|
•
|
the instability of foreign economies and governments;
|
|
•
|
war and acts of terrorism;
|
|
•
|
anti-corruption laws and regulations such as the Foreign Corrupt Practices Act and the U.K. Bribery Act that impose stringent requirements on how we conduct our foreign operations and changes in these laws and regulations;
|
|
•
|
foreign privacy and data protection laws and regulation and changes in these laws; and
|
|
•
|
shifting consumer preferences regarding the viewing of video programming.
|
Events or developments related to these and other risks associated with international trade could adversely affect our revenues from non-U.S. sources, which could have a material adverse effect on our business, financial condition, operating results, liquidity and prospects.
Furthermore, some foreign markets where we and our partners operate may be more adversely affected by current economic conditions than the U.S. We also may incur substantial expense as a result of changes, including the imposition of new restrictions, in the existing economic or political environment in the regions where we do business. Acts of terrorism, hostilities, or financial, political, economic or other uncertainties could lead to a reduction in revenue or loss of investment, which could adversely affect our results of operations.
Global economic conditions may have an adverse effect on our business.
Our business is significantly affected by prevailing economic conditions and by disruptions to financial markets. We derive
19
substantial revenues from advertisers, and these expenditures are sensitive to general economic conditions and consumer buying patterns. Financial instability or a general decline in economic conditions in the U.S. and other countries where our networks are distributed could adversely affect advertising rates and volume, resulting in a decrease in our advertising revenues.
Decreases in consumer discretionary spending in the U.S. and other countries where our networks are distributed may affect cable television and other video service subscriptions, in particular with respect to digital service tiers on which certain of our programming networks are carried. This could lead to a decrease in the number of subscribers receiving our programming from multi-channel video programming distributors, which could have a negative impact on our viewing subscribers and affiliation fee revenues. Similarly, a decrease in viewing subscribers would also have a negative impact on the number of viewers actually watching the programs on our programming networks, which could also impact the rates we are able to charge advertisers.
Economic conditions affect a number of aspects of our businesses worldwide and impact the businesses of our partners who purchase advertising on our networks and might reduce their spending on advertising. Economic conditions can also negatively affect the ability of those with whom we do business to satisfy their obligations to us. The general worsening of current global economic conditions could adversely affect our business, financial condition or results of operations, and the worsening of economic conditions in certain parts of the world, specifically, could impact the expansion and success of our businesses in such areas.
Domestic and foreign laws and regulations could adversely impact our operation results.
Programming services like ours, and the distributors of our services, including cable operators, satellite operators and other multi-channel video programming distributors, are regulated by U.S. federal laws and regulations issued and administered by various federal agencies, including the FCC, as well as by state and local governments, in ways that affect the daily conduct of our video content business. See the discussion under “Business – Regulatory Matters” above. The U.S. Congress, the FCC and the courts currently have under consideration, and may adopt or interpret in the future, new laws, regulations and policies regarding a wide variety of matters that could, directly or indirectly, affect the operations of our U.S. media properties or modify the terms under which we offer our services and operate. For example, any changes to the laws and regulations that govern the services or signals that are carried by cable television operators or our other distributors may result in less capacity for other content services, such as our networks, which could adversely affect our revenue.
Similarly, the foreign jurisdictions in which our networks are offered have, in varying degrees, laws and regulations governing our businesses. Programming businesses are subject to regulation on a country-by-country basis. Changes in regulations imposed by foreign governments could also adversely affect our business, results of operations and ability to expand our operations beyond their current scope.
Financial markets are subject to volatility and disruptions that may affect our ability to obtain or increase the cost of financing our operations and our ability to meet our other obligations.
Increased volatility and disruptions in the U.S. and global financial and equity markets may make it more difficult for us to obtain financing for our operations or investments or increase the cost of obtaining financing. Our borrowing costs can be affected by short and long-term debt ratings assigned by independent rating agencies which are based, in significant part, on our performance as measured by credit metrics such as interest coverage and leverage ratios. A low rating could increase our cost of borrowing or make it more difficult for us to obtain future financing. Unforeseeable changes in foreign currencies could negatively impact our results of operations and calculations of interest coverage and leverage ratios.
Foreign exchange rate fluctuations may adversely affect our operating results and financial conditions.
We have significant operations in a number of foreign jurisdictions and certain of our operations are conducted and certain of our debt obligations are denominated in foreign currencies. As a result, there is exposure to foreign currency risk as the Company enters into transactions and makes investments denominated in multiple currencies. The value of these currencies fluctuates relative to the U.S. dollar. Our consolidated financial statements are denominated in U.S. dollars, and to prepare those financial statements we must translate the amounts of the assets, liabilities, net sales, other revenues and expenses of our operations outside of the U.S. from local currencies into U.S. dollars using exchange rates for the current period. As we have expanded our international operations, our exposure to exchange rate fluctuations has increased. This increased exposure could have an adverse effect on our reported results of operations and net asset balances. There is no assurance that downward trending currencies will rebound or that stable currencies will remain unchanged in any period or for any specific market.
Our inability to successfully acquire and integrate other businesses, assets, products or technologies could harm our operating results.
Our success may depend on opportunities to buy other businesses or technologies that could complement, enhance or expand our current business or products or that might otherwise offer us growth opportunities. We have acquired, and have made strategic investments in, a number of companies (including through joint ventures) in the past, and we expect to make additional
20
acquisitions and strategic investments in the future. Such transactions may result in dilutive issuances of our equity securities, use of our cash resources, and incurrence of debt and amortization expenses related to intangible assets. Any acquisitions and strategic investments that we are able to identify and complete may be accompanied by a number of risks, including:
|
•
|
the difficulty of assimilating the operations and personnel of acquired companies into our operations;
|
|
•
|
the potential disruption of our ongoing business and distraction of management;
|
|
•
|
the incurrence of additional operating losses and operating expenses of the businesses we acquired or in which we invested;
|
|
•
|
the difficulty of integrating acquired technology and rights into our services and unanticipated expenses related to such integration;
|
|
•
|
the failure to successfully further develop an acquired business or technology and any resulting impairment of amounts currently capitalized as intangible assets;
|
|
•
|
the failure of strategic investments to perform as expected or to meet financial projections;
|
|
•
|
the potential for patent and trademark infringement and data privacy and security claims against the acquired companies, or companies in which we have invested;
|
|
•
|
litigation or other claims in connection with acquisitions, acquired companies, or companies in which we have invested;
|
|
•
|
the impairment or loss of relationships with customers and partners of the companies we acquired or in which we invested or with our customers and partners as a result of the integration of acquired operations;
|
|
•
|
the impairment of relationships with, or failure to retain, employees of acquired companies or our existing employees as a result of integration of new personnel;
|
|
•
|
our lack of, or limitations on our, control over the operations of our joint venture companies;
|
|
•
|
the difficulty of integrating operations, systems, and controls as a result of cultural, regulatory, systems, and operational differences;
|
|
•
|
in the case of foreign acquisitions and investments, the impact of particular economic, tax, currency, political, legal and regulatory risks associated with specific countries; and
|
|
•
|
the impact of known potential liabilities or liabilities that may be unknown, including as a result of inadequate internal controls, associated with the companies we acquired or in which we invested.
|
Our failure to be successful in addressing these risks or other problems encountered in connection with our past or future acquisitions and strategic investments could cause us to fail to realize the anticipated benefits of such acquisitions or investments, incur unanticipated liabilities, and harm our business generally.
Our equity method investments' financial performance may differ from current estimates.
We have equity investments in certain entities and the accounting treatment applied for these investments varies depending on a number of factors, including, but not limited to, our percentage ownership and the level of influence or control we have over the relevant entity. Any losses experienced by these entities could adversely impact our results of operations and the value of our investment. In addition, if these entities were to fail and cease operations, we may lose the entire value of our investment and the stream of any shared profits. Some of our ventures may require additional uncommitted funding.
We have a significant amount of debt and may incur significant amounts of additional debt, which could adversely affect our financial health and our ability to react to changes in our business.
As of
December 31, 2015
, we had approximately
$7.7 billion
of consolidated debt, including capital leases. Our substantial level of indebtedness increases the possibility that we may be unable to generate cash sufficient to pay when due the principal of, interest on, or other amounts associated with our indebtedness. In addition, we have the ability to draw down our revolving credit facility in the ordinary course, which would have the effect of increasing our indebtedness. We are also permitted, subject to certain restrictions under our existing indebtedness, to obtain additional long-term debt and working capital lines of credit to meet future financing needs. This would have the effect of increasing our total leverage.
Our substantial leverage could have significant negative consequences on our financial condition and results of operations, including:
|
•
|
impairing our ability to meet one or more of the financial ratio covenants contained in our debt agreements or to generate cash sufficient to pay interest or principal, which could result in an acceleration of some or all of our outstanding debt in the event that an uncured default occurs;
|
21
|
•
|
increasing our vulnerability to general adverse economic and market conditions;
|
|
•
|
limiting our ability to obtain additional debt or equity financing;
|
|
•
|
requiring the dedication of a substantial portion of our cash flow from operations to service our debt, thereby reducing the amount of cash flow available for other purposes;
|
|
•
|
requiring us to sell debt or equity securities or to sell some of our core assets, possibly on unfavorable terms, to meet payment obligations;
|
|
•
|
limiting our flexibility in planning for, or reacting to, changes in our business and the markets in which we compete; and
|
|
•
|
placing us at a possible competitive disadvantage with less leveraged competitors and competitors that may have better access to capital resources.
|
Our ability to incur debt and the use of our funds could be limited by the restrictive covenants in the loan agreement for our revolving credit facility.
The loan agreement for our revolving credit facility contains restrictive covenants, as well as requirements to comply with certain leverage and other financial maintenance tests. These covenants and requirements could limit our ability to take various actions, including incurring additional debt, guaranteeing indebtedness and engaging in various types of transactions, including mergers, acquisitions and sales of assets. These covenants could place us at a disadvantage compared to some of our competitors, who may have fewer restrictive covenants and may not be required to operate under these restrictions. Further, these covenants could have an adverse effect on our business by limiting our ability to take advantage of financing, mergers and acquisitions or other opportunities.
Theft of our content, including digital copyright theft and other unauthorized exhibitions of our content, may decrease revenue received from our programming and adversely affect our businesses and profitability.
The success of our business depends in part on our ability to maintain the intellectual property rights to our entertainment content. We are fundamentally a content company, and piracy of our brands, television networks, digital content and other intellectual property has the potential to significantly and adversely affect us. Piracy is particularly prevalent in many parts of the world that lack copyright and other protections similar to existing law in the U.S. It is also made easier by technological advances allowing the conversion of content into digital formats, which facilitates the creation, transmission and sharing of high-quality unauthorized copies. Unauthorized distribution of copyrighted material over the Internet is a threat to copyright owners’ ability to protect and exploit their property. The proliferation of unauthorized use of our content may have an adverse effect on our business and profitability because it reduces the revenue that we potentially could receive from the legitimate sale and distribution of our content. Litigation may be necessary to enforce our intellectual property rights, protect trade secrets or to determine the validity or scope of proprietary rights claimed by others.
The loss of key personnel or talent could disrupt our business and adversely affect our revenue.
Our business depends upon the continued efforts, abilities and expertise of our corporate and divisional executive teams and entertainment personalities. We employ or contract with entertainment personalities who may have loyal audiences. These individuals are important to audience endorsement of our programs and other content. There can be no assurance that these individuals will remain with us or retain their current audiences. If we fail to retain key individuals or if our entertainment personalities lose their current audience base, our operations could be adversely affected.
As a holding company, we could be unable to obtain cash in amounts sufficient to meet our financial obligations or other commitments.
Our ability to meet our financial obligations and other contractual commitments will depend upon our ability to access cash. We are a holding company, and our sources of cash include our available cash balances, net cash from the operating activities of our subsidiaries, any dividends and interest we may receive from our investments, availability under our credit facility or any credit facilities that we may obtain in the future and proceeds from any asset sales we may undertake in the future. The ability of our operating subsidiaries, including Discovery Communications, LLC, to pay dividends or to make other payments or advances to us will depend on their individual operating results and any statutory, regulatory or contractual restrictions, including restrictions under our credit facility, to which they may be or may become subject. We are required to accrue and pay U.S. taxes for repatriation of certain cash balances held by foreign corporations. However, we intend to permanently reinvest these funds outside of the U.S. and our current plans do not demonstrate a need to repatriate them to fund our U.S. operations.
22
We have directors in common with those of Liberty Media Corporation (“Liberty Media”), Liberty Global plc (“Liberty Global”), Liberty Interactive Corporation (“Liberty Interactive”) and Liberty Broadband Corporation ("Liberty Broadband"), which may result in the diversion of business opportunities or other potential conflicts.
Liberty Media, Liberty Global, Liberty Interactive and Liberty Broadband (together, the "Liberty Entities") own interests in various U.S. and international companies that have subsidiaries that own or operate domestic or foreign content services that may compete with the content services we offer. We have no rights in respect of U.S. or international content opportunities developed by or presented to the subsidiaries of any Liberty Entities, and the pursuit of these opportunities by such subsidiaries may adversely affect our interests and those of our stockholders. Because we and the Liberty Entities have overlapping directors, the pursuit of business opportunities may serve to intensify the conflicts of interest or appearance of conflicts of interest faced by the respective management teams. Our charter provides that none of our directors or officers will be liable to us or any of our subsidiaries for breach of any fiduciary duty by reason of the fact that such individual directs a corporate opportunity to another person or entity (including any Liberty Entities), for which such individual serves as a director or officer, or does not refer or communicate information regarding such corporate opportunity to us or any of our subsidiaries, unless (x) such opportunity was expressly offered to such individual solely in his or her capacity as a director or officer of us or any of our subsidiaries and (y) such opportunity relates to a line of business in which we or any of our subsidiaries is then directly engaged.
We have directors that are also related persons of Advance/Newhouse Programming Partnership ("Advance/Newhouse") and that overlap with those of the Liberty Entities, which may lead to conflicting interests for those tasked with the fiduciary duties of our board.
Our ten-person board of directors includes three designees of Advance/Newhouse, including Robert J. Miron, who was the Chairman of Advance/Newhouse until December 31, 2010, and Steven A. Miron, the Chief Executive Officer of Advance/Newhouse. In addition, our board of directors includes two persons who are currently members of the board of directors of Liberty Media, three persons who are currently members of the board of directors of Liberty Global, two persons who are currently members of the board of directors of Liberty Interactive and two persons who are currently members of the board of directors of Liberty Broadband. John C. Malone is the Chairman of the boards of all of the Liberty Entities. The parent company of Advance/Newhouse and the Liberty entities own interests in a range of media, communications and entertainment businesses.
Advance/Newhouse will elect three directors annually for so long as it owns a specified minimum amount of our Series A convertible preferred stock. The Advance/Newhouse Series A convertible preferred stock, which votes with our common stock on all matters other than the election of directors, represents approximately
25%
of the voting power of our outstanding shares. The Series A convertible preferred stock also grants Advance/Newhouse consent rights over a range of our corporate actions, including fundamental changes to our business, the issuance of additional capital stock, mergers and business combinations and certain acquisitions and dispositions.
None of the Liberty Entities own any interest in us. Mr. Malone beneficially owns stock of Liberty Media representing approximately
47%
of the aggregate voting power of its outstanding stock, owns shares representing approximately
25%
of the aggregate voting power of Liberty Global, shares representing approximately
36%
of the aggregate voting power of Liberty Interactive, shares representing approximately 46% of the aggregate voting power of Liberty Broadband and shares representing approximately
21%
of the aggregate voting power (other than with respect to the election of the common stock directors) of our outstanding stock. Mr. Malone controls approximately
29%
of our aggregate voting power relating to the election of our seven common stock directors, assuming that the preferred stock owned by Advance/Newhouse has not been converted into shares of our common stock. Our directors who are also directors of the Liberty Entities own stock and stock incentives of the Liberty Entities and own our stock and stock incentives.
These ownership interests and/or business positions could create, or appear to create, potential conflicts of interest when these individuals are faced with decisions that could have different implications for us, Advance/Newhouse and/or the Liberty Entities. For example, there may be the potential for a conflict of interest when we, on the one hand, or Advance/Newhouse and/or one or more of the Liberty Entities, on the other hand, look at acquisitions and other corporate opportunities that may be suitable for the other.
The members of our board of directors have fiduciary duties to us and our stockholders. Likewise, those persons who serve in similar capacities at Advance/Newhouse or a Liberty Entity have fiduciary duties to those companies. Therefore, such persons may have conflicts of interest or the appearance of conflicts of interest with respect to matters involving or affecting both respective companies, and there can be no assurance that the terms of any transactions will be as favorable to us or our subsidiaries as would be the case in the absence of a conflict of interest.
It may be difficult for a third party to acquire us, even if such acquisition would be beneficial to our stockholders.
Certain provisions of our charter and bylaws may discourage, delay or prevent a change in control that a stockholder may consider favorable. These provisions include the following:
23
|
•
|
authorizing a capital structure with multiple series of common stock: a Series B that entitles the holders to ten votes per share, a Series A that entitles the holders to one vote per share and a Series C that, except as otherwise required by applicable law, entitles the holders to no voting rights;
|
|
•
|
authorizing the Series A convertible preferred stock with special voting rights, which prohibits us from taking any of the following actions, among others, without the prior approval of the holders of a majority of the outstanding shares of such stock:
|
|
•
|
increasing the number of members of the Board of Directors above ten;
|
|
•
|
making any material amendment to our charter or by-laws;
|
|
•
|
engaging in a merger, consolidation or other business combination with any other entity; and
|
|
•
|
appointing or removing our Chairman of the Board or our Chief Executive Officer;
|
|
•
|
authorizing the issuance of “blank check” preferred stock, which could be issued by our Board of Directors to increase the number of outstanding shares and thwart a takeover attempt;
|
|
•
|
classifying our common stock directors with staggered three-year terms and having three directors elected by the holders of the Series A convertible preferred stock, which may lengthen the time required to gain control of our Board of Directors;
|
|
•
|
limiting who may call special meetings of stockholders;
|
|
•
|
prohibiting stockholder action by written consent (subject to certain exceptions), thereby requiring stockholder action to be taken at a meeting of the stockholders;
|
|
•
|
establishing advance notice requirements for nominations of candidates for election to our Board of Directors or for proposing matters that can be acted upon by stockholders at stockholder meetings;
|
|
•
|
requiring stockholder approval by holders of at least 80% of our voting power or the approval by at least 75% of our Board of Directors with respect to certain extraordinary matters, such as a merger or consolidation, a sale of all or substantially all of our assets or an amendment to our charter;
|
|
•
|
requiring the consent of the holders of at least 75% of the outstanding Series B common stock (voting as a separate class) to certain share distributions and other corporate actions in which the voting power of the Series B common stock would be diluted by, for example, issuing shares having multiple votes per share as a dividend to holders of Series A common stock; and
|
|
•
|
the existence of authorized and unissued stock which would allow our Board of Directors to issue shares to persons friendly to current management, thereby protecting the continuity of our management, or which could be used to dilute the stock ownership of persons seeking to obtain control of us.
|
We have also adopted a shareholder rights plan in order to encourage anyone seeking to acquire us to negotiate with our Board of Directors prior to attempting a takeover. While the plan is designed to guard against coercive or unfair tactics to gain control of us, the plan may have the effect of making more difficult or delaying any attempts by others to obtain control of us.
Holders of any single series of our common stock may not have any remedies if any action by our directors or officers has an adverse effect on only that series of common stock.
Principles of Delaware law and the provisions of our charter may protect decisions of our Board of Directors that have a disparate impact upon holders of any single series of our common stock. Under Delaware law, the Board of Directors has a duty to act with due care and in the best interests of all of our stockholders, including the holders of all series of our common stock. Principles of Delaware law established in cases involving differing treatment of multiple classes or series of stock provide that a board of directors owes an equal duty to all common stockholders regardless of class or series and does not have separate or additional duties to any group of stockholders. As a result, in some circumstances, our directors may be required to make a decision that is adverse to the holders of one series of common stock. Under the principles of Delaware law referred to above, stockholders may not be able to challenge these decisions if our Board of Directors is disinterested and adequately informed with respect to these decisions and acts in good faith and in the honest belief that it is acting in the best interests of all of our stockholders.
If Advance/Newhouse were to exercise its registration rights, it may cause a significant decline in our stock price, even if our business is doing well.
Advance/Newhouse has been granted registration rights covering all of the shares of common stock issuable upon conversion of the convertible preferred stock held by Advance/Newhouse. Advance/Newhouse’s Series A convertible preferred stock is currently convertible into one share of our Series A common stock and one share of our Series C common stock and
24
Advance/Newhouse’s Series C convertible preferred stock is convertible into shares of our Series C common stock on a 2-for-1 basis, subject to certain anti-dilution adjustments. The registration rights, which are immediately exercisable, are transferable with the sale or transfer by Advance/Newhouse of blocks of shares representing 10% or more of the preferred stock it holds. The exercise of the registration rights, and subsequent sale of possibly large amounts of our common stock in the public market, could materially and adversely affect the market price of our common stock.
John C. Malone and Advance/Newhouse each have significant voting power with respect to corporate matters considered by our stockholders.
For corporate matters other than the election of directors, Mr. Malone and Advance/Newhouse each beneficially own shares of our stock representing approximately
21%
and
25%
, respectively, of the aggregate voting power represented by our outstanding stock. With respect to the election of directors, Mr. Malone controls approximately
29%
of the aggregate voting power relating to the election of the seven common stock directors (assuming that the convertible preferred stock owned by Advance/Newhouse (the “A/N Preferred Stock”) has not been converted into shares of our common stock). The A/N Preferred Stock carries with it the right to designate three preferred stock directors to our board (subject to certain conditions), but does not carry voting rights with respect to the election of the seven common stock directors. Also, under the terms of the A/N Preferred Stock, Advance/Newhouse has special voting rights as to certain enumerated matters, including material amendments to the restated charter and bylaws, fundamental changes in our business, mergers and other business combinations, certain acquisitions and dispositions and future issuances of capital stock. Although there is no stockholder agreement, voting agreement or any similar arrangement between Mr. Malone and Advance/Newhouse, by virtue of their respective holdings, Mr. Malone and Advance/Newhouse each have significant influence over the outcome of any corporate transaction or other matter submitted to our stockholders.
None.
We own and lease approximately 2 million square feet of building space for the conduct of our businesses at 83 locations throughout the world. In the U.S. alone, we own and lease approximately 597,000 and 610,000 square feet of building space, respectively, at 15 locations. Principal locations in the U.S. include: (i) our world headquarters located at One Discovery Place, Silver Spring, Maryland, where approximately 543,000 square feet is used for certain executive and corporate offices and general office space by our U.S. Networks and Education and Other segments, (ii) general office space at 850 Third Avenue, New York, New York, where approximately 189,000 square feet is primarily used for sales by our U.S. Networks segment and certain executive offices, (iii) general office space and a production and post-production facility located at 8045 Kennett Street, Silver Spring, Maryland, where approximately 149,000 square feet is primarily used by our U.S. Networks segment, (iv) general office space located at 10100 Santa Monica Boulevard, Los Angeles, California, where approximately 64,000 square feet is primarily used by our U.S. Networks segment, (v) general office space at 6505 Blue Lagoon Drive, Miami, Florida, where approximately 91,000 square feet is primarily used by our International Networks segment, and (vi) an origination facility at 45580 Terminal Drive, Sterling, Virginia, where approximately 54,000 square feet of space is used to manage the distribution of domestic network television content by our U.S. Networks segment.
We also lease over 827,000 square feet of building space at 68 locations outside of the U.S., including the U.K., France, Denmark, Italy, Singapore & Poland. Included in the non-US office figures are approximately 169,000 square feet of building space used for office, production and post-production for Eurosport.
Each property is considered to be in good condition, adequate for its purpose, and suitably utilized according to the individual nature and requirements of the relevant operations. Our policy is to improve and replace property as considered appropriate to meet the needs of the individual operation.
The Company is party to various lawsuits and claims in the ordinary course of business. However, a determination as to the amount of the accrual required for such contingencies is highly subjective and requires judgments about future events. Although the outcome of these matters cannot be predicted with certainty and the impact of the final resolution of these matters on the Company's results of operations in a particular subsequent reporting period is not known, management does not believe that the resolution of these matters will have a material adverse effect on our consolidated financial position, future results of operations or liquidity.
25
Not applicable.
26
Executive Officers of Discovery Communications, Inc.
Pursuant to General Instruction G(3) to Form 10-K, the information regarding our executive officers required by Item 401(b) of Regulation S-K is hereby included in Part I of this report. The following table sets forth the name and date of birth of each of our executive officers and the office held by such officer as of
February 18, 2016
.
|
Name
|
|
Position
|
|
David M. Zaslav
Born January 15, 1960
|
|
President, Chief Executive Officer and a common stock director. Mr. Zaslav has served as our President and Chief Executive Officer since January 2007. Mr. Zaslav served as President, Cable & Domestic Television and New Media Distribution of NBC Universal, Inc. ("NBC"), a media and entertainment company, from May 2006 to December 2006. Mr. Zaslav served as Executive Vice President of NBC, and President of NBC Cable, a division of NBC, from October 1999 to May 2006. Mr. Zaslav is a member of the board of Sirius XM Radio Inc., Grupo Televisa S.A.B and LionsGate Entertainment Corp.
|
|
Andrew Warren
Born September 8, 1966
|
|
Chief Financial Officer. Mr. Warren has served as our Senior Executive Vice President, Chief Financial Officer since March 2012. Mr. Warren served as Chief Financial Officer of Liz Claiborne, Inc. (now Fifth & Pacific Companies Inc.) a designer, marketer and retail supplier of premium lifestyle fashion brands, from 2007 to 2012.
|
|
Jean-Briac Perrette Born April 30, 1971
|
President of Discovery Networks International. Mr. Perrette became President of Discovery Networks International in March 2014. Prior to that, Mr. Perrette served as our Chief Digital Officer from October 2011 to February 2014. Mr. Perrette served in a number of roles at NBC Universal from March 2000 to October 2011, with the last being President of Digital and Affiliate Distribution.
|
|
|
Adria Alpert Romm
Born March 2, 1955
|
|
Chief Human Resources and Global Diversity Officer. Ms. Romm has served as our Chief Human Resources and Global Diversity Officer since March 2014. Prior to that, Ms. Romm has served as our Senior Executive Vice President of Human Resources from March 2007 to February 2014. Ms. Romm served as Senior Vice President of Human Resources of NBC from 2004 to 2007. Prior to 2004, Ms. Romm served as a Vice President in Human Resources for the NBC TV network and NBC staff functions.
|
|
Bruce L. Campbell
Born November 26, 1967
|
|
Chief Development, Distribution & Legal Officer. Mr. Campbell became our Chief Distribution Officer in October 2015, Chief Development Officer in August 2010 and our General Counsel in December 2010. Mr. Campbell served as Digital Media Officer from August 2014 through October 2015. Prior to that, Mr. Campbell served as our President, Digital Media & Corporate Development from March 2007 through August 2010. Mr. Campbell also served as our corporate secretary from December 2010 to February 2012. Mr. Campbell served as Executive Vice President, Business Development of NBC from December 2005 to March 2007, and Senior Vice President, Business Development of NBC from January 2003 to November 2005.
|
|
Paul Guagliardo "Guyardo" Born October 29, 1961
|
Chief Commercial Officer. Mr. Guagliardo has served as our Chief Commercial Officer since September 2015. Prior to that, Mr. Guagliardo served as the Executive Vice President, Chief Revenue and Marketing Officer for DIRECTV from October 2005 to August 2015. Mr. Guagliardo is a member of the board of Nutrisystem, Inc., a provider of weight management products and services, and serves on the compensation and corporate governance committees.
|
|
|
David Leavy
Born December 24, 1969
|
Chief Communications Officer and Senior Executive Vice President, Corporate Marketing and Business Operations. Mr. Leavy became Chief Communications Officer and Senior Executive Vice President, Corporate Marketing and Business Operations in August 2015. Prior to that, Mr. Leavy served as our Chief Communications Officer and Senior Executive Vice President, Corporate Marketing and Affairs from December 2011 to August 2015. Prior to that, Mr. Leavy served as our Executive Vice President, Communications and Corporate Affairs and has served in a number of other roles at Discovery since joining in March 2000.
|
|
|
Kurt T. Wehner
Born June 30, 1962
|
|
Executive Vice President and Chief Accounting Officer. Mr. Wehner joined the Company in September 2011 and has served as our Executive Vice President, Chief Accounting Officer since November 2012. Mr. Wehner was an Audit Partner at KPMG LLP from 2000 to 2011.
|
27
Our Series A common stock, Series B common stock and Series C common stock are listed and traded on The NASDAQ Global Select Market (“NASDAQ”) under the symbols “DISCA,” “DISCB” and “DISCK,” respectively. The following table sets forth, for the periods indicated, the range of high and low sales prices per share of our Series A common stock, Series B common stock and Series C common stock as reported on Yahoo! Finance (finance.yahoo.com).
|
|
Series A
Common Stock
|
Series B
Common Stock
|
Series C
Common Stock
|
|||||||||||||||||||||
|
|
High
|
Low
|
High
|
Low
|
High
|
Low
|
||||||||||||||||||
|
2015
|
||||||||||||||||||||||||
|
Fourth quarter
|
$
|
31.14
|
|
$
|
25.36
|
|
$
|
31.16
|
|
$
|
25.40
|
|
$
|
29.58
|
|
$
|
23.83
|
|
||||||
|
Third quarter
|
$
|
34.80
|
|
$
|
25.82
|
|
$
|
34.26
|
|
$
|
26.04
|
|
$
|
32.68
|
|
$
|
24.21
|
|
||||||
|
Second quarter
|
$
|
34.45
|
|
$
|
30.78
|
|
$
|
34.04
|
|
$
|
31.39
|
|
$
|
32.17
|
|
$
|
28.53
|
|
||||||
|
First quarter
|
$
|
34.48
|
|
$
|
28.99
|
|
$
|
36.10
|
|
$
|
28.08
|
|
$
|
33.44
|
|
$
|
27.88
|
|
||||||
|
2014
|
||||||||||||||||||||||||
|
Fourth quarter
|
$
|
37.24
|
|
$
|
31.86
|
|
$
|
39.00
|
|
$
|
34.12
|
|
$
|
37.05
|
|
$
|
31.38
|
|
||||||
|
Third quarter
|
$
|
44.83
|
|
$
|
37.71
|
|
$
|
46.92
|
|
$
|
37.92
|
|
$
|
43.61
|
|
$
|
37.19
|
|
||||||
|
Second quarter
|
$
|
43.03
|
|
$
|
36.96
|
|
$
|
42.91
|
|
$
|
37.26
|
|
$
|
39.41
|
|
$
|
33.47
|
|
||||||
|
First quarter
|
$
|
45.53
|
|
$
|
39.50
|
|
$
|
46.03
|
|
$
|
40.65
|
|
$
|
41.26
|
|
$
|
35.88
|
|
||||||
As of
February 12, 2016
, there were approximately
1,505
,
92
and
1,636
record holders of our Series A common stock, Series B common stock and Series C common stock, respectively. These amounts do not include the number of shareholders whose shares are held of record by banks, brokerage houses or other institutions, but include each such institution as one shareholder.
We have not paid any cash dividends on our Series A common stock, Series B common stock or Series C common stock, and we have no present intention to do so. Payment of cash dividends, if any, will be determined by our Board of Directors after consideration of our earnings, financial condition and other relevant factors such as our credit facility's restrictions on our ability to declare dividends in certain situations.
Purchases of Equity Securities
The following table presents information about our repurchases of common stock that were made through open market transactions during the three months ended
December 31, 2015
(in millions, except per share amounts).
|
Period
|
Total Number
of Series C Shares Purchased |
Average
Price Paid per Share: Series C (a) |
Total Number
of Shares
Purchased as
Part of Publicly
Announced
Plans or
Programs (a) |
Approximate
Dollar Value of
Shares that May
Yet Be Purchased
Under the Plans or Programs
(a)(b)
|
||||||||||
|
October 2015
|
—
|
|
$
|
—
|
|
—
|
|
$
|
2,416
|
|
||||
|
November 2015
|
5.6
|
|
$
|
28.75
|
|
5.6
|
|
$
|
2,256
|
|
||||
|
December 2015
|
7.8
|
|
$
|
27.44
|
|
7.8
|
|
$
|
2,041
|
|
||||
|
Total
|
13.4
|
|
|
|
13.4
|
|
$
|
2,041
|
|
|||||
(a)
The amounts do not give effect to any fees, commissions or other costs associated with repurchases of shares.
28
(b)
As of
December 31, 2015
, the total amount authorized under the stock repurchase program was
$7.5 billion
, and we had remaining authorization of approximately
$2.0 billion
for future repurchases under our common stock repurchase program, of which
$41 million
that was scheduled to expire on
February 3, 2016
was fully utilized for stock repurchases in 2016 and
$2.0 billion
that will expire on
October 8, 2017
.
Under the stock repurchase program, management is authorized to purchase shares of the Company's common stock from time to time through open market purchases or privately negotiated transactions at prevailing prices as permitted by securities laws and other legal requirements, and subject to stock price, business and market conditions and other factors. We have been funding and expect to continue to fund stock repurchases through a combination of cash on hand and cash generated by operations. In the future, we may also choose to fund our stock repurchase program under our revolving credit facility or future financing transactions. The Company first announced its stock repurchase program on August 3, 2010.
Stock Performance Graph
The following graph sets forth the cumulative total shareholder return on our Series A common stock, Series B common stock and Series C common stock as compared with the cumulative total return of the companies listed in the Standard and Poor’s 500 Stock Index (“S&P 500 Index”) and a peer group of companies comprised of CBS Corporation Class B common stock, Scripps Network Interactive, Inc., Time Warner, Inc., Twenty-First Century Fox, Inc. Class A common stock (News Corporation Class A Common Stock prior to June 2013), Viacom, Inc. Class B common stock and The Walt Disney Company. The graph assumes $100 originally invested on December 31, 2010 in each of our Series A common stock, Series B common stock and Series C common stock, the S&P 500 Index, and the stock of our peer group companies, including reinvestment of dividends, for the years ended December 31,
2011
,
2012
,
2013
,
2014
and
2015
.
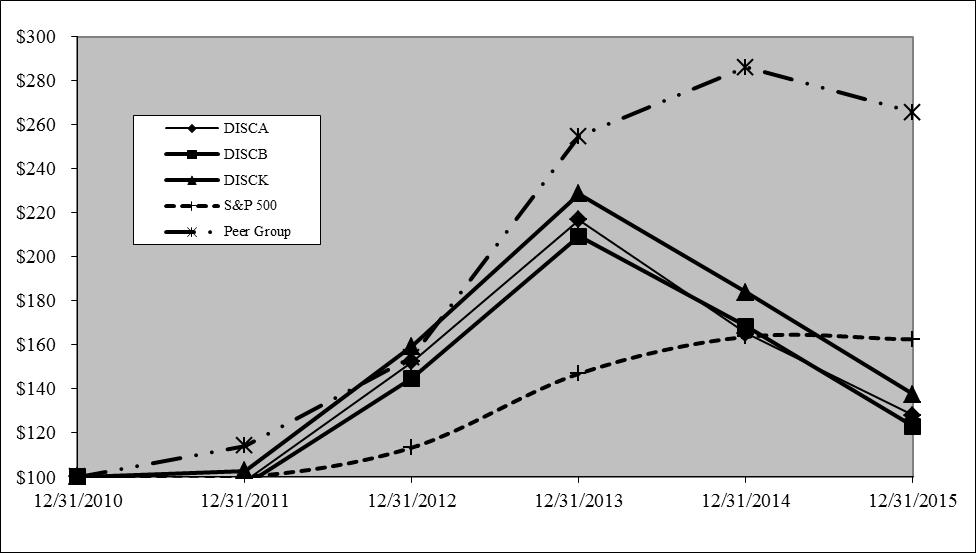
|
December 31,
2010
|
December 31,
2011
|
December 31,
2012
|
December 31,
2013
|
December 31,
2014
|
December 31,
2015
|
|||||||||||||||||||
|
DISCA
|
$
|
100.00
|
|
$
|
98.25
|
|
$
|
152.23
|
|
$
|
216.83
|
|
$
|
165.23
|
|
$
|
127.96
|
|
||||||
|
DISCB
|
$
|
100.00
|
|
$
|
96.27
|
|
$
|
144.79
|
|
$
|
209.24
|
|
$
|
168.50
|
|
$
|
123.03
|
|
||||||
|
DISCK
|
$
|
100.00
|
|
$
|
102.75
|
|
$
|
159.44
|
|
$
|
228.56
|
|
$
|
183.81
|
|
$
|
137.48
|
|
||||||
|
S&P 500
|
$
|
100.00
|
|
$
|
100.00
|
|
$
|
113.40
|
|
$
|
146.97
|
|
$
|
163.71
|
|
$
|
162.52
|
|
||||||
|
Peer Group
|
$
|
100.00
|
|
$
|
114.09
|
|
$
|
154.41
|
|
$
|
254.63
|
|
$
|
286.16
|
|
$
|
265.61
|
|
||||||
Equity Compensation Plan Information
Information regarding securities authorized for issuance under equity compensation plans will be set forth in our definitive Proxy Statement for our
2016
Annual Meeting of Stockholders under the caption “Securities Authorized for Issuance Under Equity Compensation Plans,” which is incorporated herein by reference.
29
The table set forth below presents our selected financial information for each of the past five years (in millions, except per share amounts). The selected statement of operations information for each of the three years ended
December 31, 2015
and the selected balance sheet information as of
December 31, 2015
and
2014
have been derived from and should be read in conjunction with the information in Item 7, “Management’s Discussion and Analysis of Financial Condition and Results of Operations,” the audited consolidated financial statements included in Item 8, “Financial Statements and Supplementary Data,” and other financial information included elsewhere in this Annual Report on Form 10-K. The selected statement of operations information for each of the two years ended December 31,
2012
and
2011
and the selected balance sheet information as of December 31,
2013
,
2012
and
2011
have been derived from financial statements not included in this Annual Report on Form 10-K.
|
2015
|
2014
|
2013
|
2012
|
2011
|
||||||||||||||||
|
Selected Statement of Operations Information:
|
||||||||||||||||||||
|
Revenues
|
$
|
6,394
|
|
$
|
6,265
|
|
$
|
5,535
|
|
$
|
4,487
|
|
$
|
4,168
|
|
|||||
|
Operating income
|
1,985
|
|
2,061
|
|
1,975
|
|
1,859
|
|
1,815
|
|
||||||||||
|
Income from continuing operations, net of taxes
|
1,048
|
|
1,137
|
|
1,077
|
|
956
|
|
1,136
|
|
||||||||||
|
(Loss) income from discontinued operations, net of taxes
|
—
|
|
—
|
|
—
|
|
(11
|
)
|
(3
|
)
|
||||||||||
|
Net income
|
1,048
|
|
1,137
|
|
1,077
|
|
945
|
|
1,133
|
|
||||||||||
|
Net income available to Discovery Communications, Inc.
|
1,034
|
|
1,139
|
|
1,075
|
|
943
|
|
1,132
|
|
||||||||||
|
Basic earnings per share available to Discovery Communications, Inc. Series A, B and C common stockholders:
|
||||||||||||||||||||
|
Continuing operations
|
$
|
1.59
|
|
$
|
1.67
|
|
$
|
1.50
|
|
$
|
1.27
|
|
$
|
1.42
|
|
|||||
|
Discontinued operations
|
—
|
|
—
|
|
—
|
|
(0.01
|
)
|
—
|
|
||||||||||
|
Net income
|
1.59
|
|
1.67
|
|
1.50
|
|
1.25
|
|
1.41
|
|
||||||||||
|
Diluted earnings per share available to Discovery Communications, Inc. Series A, B and C common stockholders:
|
||||||||||||||||||||
|
Continuing operations
|
$
|
1.58
|
|
$
|
1.66
|
|
$
|
1.49
|
|
$
|
1.26
|
|
$
|
1.40
|
|
|||||
|
Discontinued operations
|
—
|
|
—
|
|
—
|
|
(0.01
|
)
|
—
|
|
||||||||||
|
Net income
|
1.58
|
|
1.66
|
|
1.49
|
|
1.24
|
|
1.40
|
|
||||||||||
|
Weighted average shares outstanding:
|
||||||||||||||||||||
|
Basic
|
432
|
|
454
|
|
484
|
|
498
|
|
547
|
|
||||||||||
|
Diluted
|
656
|
|
687
|
|
722
|
|
759
|
|
810
|
|
||||||||||
|
Selected Balance Sheet Information:
|
||||||||||||||||||||
|
Cash and cash equivalents
|
$
|
390
|
|
$
|
367
|
|
$
|
408
|
|
$
|
1,201
|
|
$
|
1,048
|
|
|||||
|
Total assets
|
15,864
|
|
15,970
|
|
14,934
|
|
12,892
|
|
11,881
|
|
||||||||||
|
Long-term debt:
|
|
|
|
|
||||||||||||||||
|
Current portion
|
119
|
|
1,107
|
|
17
|
|
31
|
|
26
|
|
||||||||||
|
Long-term portion
|
7,616
|
|
6,002
|
|
6,437
|
|
5,174
|
|
4,187
|
|
||||||||||
|
Total liabilities
|
10,172
|
|
9,619
|
|
8,701
|
|
6,599
|
|
5,362
|
|
||||||||||
|
Redeemable noncontrolling interests
|
241
|
|
747
|
|
36
|
|
—
|
|
—
|
|
||||||||||
|
Equity attributable to Discovery Communications, Inc.
|
5,451
|
|
5,602
|
|
6,196
|
|
6,291
|
|
6,517
|
|
||||||||||
|
Total equity
|
$
|
5,451
|
|
$
|
5,604
|
|
$
|
6,197
|
|
$
|
6,293
|
|
$
|
6,519
|
|
|||||
|
•
|
Income per share amounts may not sum since each is calculated independently.
|
|
•
|
On
May 30, 2014
, the Company acquired a controlling interest in Eurosport International by increasing Discovery’s ownership stake from
20%
to
51%
. As a result, as of that date, the accounting for Eurosport was changed from an equity method investment to a consolidated subsidiary. On
March 31, 2015
the Company acquired a controlling interest in Eurosport France increasing Discovery's ownership stake by
31%
upon the resolution of certain regulatory matters and began accounting for Eurosport France as a consolidated subsidiary. On
October 1, 2015
, the Company acquired the remaining
49%
of Eurosport for
€491 million
(
$548 million
) upon TF1's exercise of its right to put. (See Note 11 to the accompanying consolidated financial statements.)
|
30
|
•
|
On
April 9, 2013
, we acquired the television and radio operations of SBS Nordic. The acquisition has been included in our operating results since the acquisition date. The radio operations of SBS Nordic were subsequently sold on June 30, 2015. (See Note 3 to the accompanying consolidated financial statements.)
|
|
•
|
Balance sheet amounts for prior years have been adjusted to reclassify debt issuance costs from other noncurrent assets to noncurrent portion of debt in accordance with ASU 2015-03. Amounts reclassified were $44 million, $45 million, $38 million and $32 million for 2014, 2013, 2012 and 2011, respectively.
|
|
•
|
On
September 23, 2014
, we acquired an additional
10%
ownership interest in Discovery Family. The purchase increased our ownership interest from
50%
to
60%
. As a result, the accounting for Discovery Family was changed from an equity method investment to a consolidated subsidiary. (See Note 3 to the accompanying consolidated financial statements.)
|
|
•
|
On September 17, 2012, we sold our postproduction audio business, the results of operations of which have been reclassified to discontinued operations for all periods presented.
|
|
•
|
Our results of operations for 2011 include a $112 million income tax benefit related to foreign tax credits and a $129 million gain on the disposition of the Discovery Health network as a contribution to OWN upon the launch of the network. As we continue to be involved in the operations of OWN subsequent to its launch, the results of operations of the Discovery Health network have not been presented as discontinued operations. Therefore, our results of operations for 2010 include the gross revenues and expenses of the Discovery Health network. For periods subsequent to January 1, 2011, our results of operations include only our proportionate share of OWN’s net operating results under the equity method of accounting. (See Note 4 to the accompanying consolidated financial statements.)
|
Management’s discussion and analysis of financial condition and results of operations is a supplement to and should be read in conjunction with the accompanying consolidated financial statements and related notes. This section provides additional information regarding our businesses, current developments, results of operations, cash flows, financial condition, contractual commitments and critical accounting policies.
CAUTIONARY NOTE CONCERNING FORWARD-LOOKING STATEMENTS
Certain statements in this Annual Report on Form 10-K constitute forward-looking statements within the meaning of the Private Securities Litigation Reform Act of 1995, including statements regarding our business, marketing and operating strategies, integration of acquired businesses, new service offerings, financial prospects, and anticipated sources and uses of capital. Words such as “anticipates,” “estimates,” “expects,” “projects,” “intends,” “plans,” “believes,” and terms of similar substance used in connection with any discussion of future operating or financial performance identify forward-looking statements. Where, in any forward-looking statement, we express an expectation or belief as to future results or events, such expectation or belief is expressed in good faith and believed to have a reasonable basis, but there can be no assurance that the expectation or belief will result or be accomplished. The following is a list of some, but not all, of the factors that could cause actual results or events to differ materially from those anticipated: continued consolidation of distribution customers and production studios; the inability of advertisers or affiliates to remit payment to us in a timely manner or at all; general economic and business conditions; industry trends, including the timing of, and spending on, feature film, television and television commercial production; spending on domestic and foreign television advertising; disagreements with our distributors over contract interpretation; fluctuations in foreign currency exchange rates and political unrest and regulatory changes in international markets; market demand for foreign first-run and existing content libraries; the regulatory and competitive environment of the industries in which we, and the entities in which we have interests, operate; uncertainties inherent in the development of new business lines and business strategies; uncertainties regarding the financial performance of our equity method investees; integration of acquired businesses; uncertainties associated with product and service development and market acceptance, including the development and provision of programming for new television and telecommunications technologies; changes in the distribution and viewing of television programming, including the expanded deployment of personal video recorders, VOD, internet protocol television, mobile personal devices and personal tablets and their impact on television advertising revenue; rapid technological changes; future financial performance, including availability, terms, and deployment of capital; the ability of suppliers and vendors to deliver products, equipment, software, and services; the outcome of any pending or threatened litigation; availability of qualified personnel; the possibility or duration of an industry-wide strike or other job action affecting a major entertainment industry union; changes in, or failure or inability to comply with, government regulations, including, without limitation, regulations of the Federal Communications Commission and adverse outcomes from regulatory proceedings; changes in income taxes due to regulatory changes or changes in our corporate structure; changes in the nature of key strategic relationships with partners, distributors and equity method investee partners; competitor responses to our products and services and the products and services of the entities in which we have interests; threatened terrorist attacks and
31
military action; reduced access to capital markets or significant increases in costs to borrow; a failure to secure affiliate agreements or renewal of such agreements on less favorable terms; and a reduction of advertising revenue associated with unexpected reductions in the number of subscribers. For additional risk factors, refer to Item 1A, “Risk Factors.” These forward-looking statements and such risks, uncertainties, and other factors speak only as of the date of this Annual Report on Form 10-K, and we expressly disclaim any obligation or undertaking to disseminate any updates or revisions to any forward-looking statement contained herein, to reflect any change in our expectations with regard thereto, or any other change in events, conditions or circumstances on which any such statement is based.
BUSINESS OVERVIEW
We are a global media company that provides content across multiple distribution platforms, including pay-TV, free-to-air and broadcast television, websites, digital distribution arrangements and content licensing agreements. Our portfolio of networks includes prominent television brands such as Discovery Channel, our most widely distributed global brand, TLC, Animal Planet, Investigation Discovery and Velocity (known as Turbo outside of the U.S.). In 2014, we took a controlling interest in Eurosport, a leading sports entertainment pay-TV programmer across Europe and Asia and in 2015, we acquired an additional 49% of and now own 100% of Eurosport. We also develop and sell curriculum-based education products and services and operate production studios.
Our objectives are to invest in content for our networks to build viewership, optimize distribution revenue, capture advertising sales and create or reposition branded channels and businesses that can sustain long-term growth and occupy a desired content niche with strong consumer appeal. Our strategy is to maximize the distribution, ratings and profit potential of each of our branded networks. In addition to growing distribution and advertising revenues for our branded networks, we are extending content distribution across new platforms, including brand-aligned websites, web-native networks, on-line streaming, mobile devices, VOD and broadband channels, which provide promotional platforms for our television content and serve as additional outlets for advertising and distribution revenue. Audience ratings are a key driver in generating advertising revenue and creating demand on the part of cable television operators, DTHsatellite operators, telecommunication service providers, and other content distributors, that deliver our content to their customers.
Our content spans genres including survival, exploration, sports, lifestyle, general entertainment, heroes, adventure, crime and investigation, health and kids. We have an extensive library of content and own rights to much of our content and footage, which enables us to exploit our library to launch brands and services into new markets quickly. Our content can be re-edited and updated in a cost-effective manner to provide topical versions of subject matter that can be utilized around the world. Substantially all of our content is produced in HD format.
Although the Company utilizes certain brands and content globally, we classify our operations in two reportable segments: U.S. Networks, consisting principally of domestic television networks and websites, and International Networks, consisting primarily of international television networks and websites; and two combined operating segments referred to as Education and Other, consisting principally of curriculum-based product and service offerings and production studios. For further discussion of our Company, segments in which we do business, and our content development activities and revenues, see our business overview set forth in Item 1, "Business" in this Annual Report on Form 10-K.
32
RESULTS OF OPERATIONS –
2015
vs.
2014
Items Impacting Comparability
Newly Acquired Businesses
On
May 30, 2014
, we acquired a controlling interest in Eurosport International. On
March 31, 2015
, we acquired a controlling interest in Eurosport France and integrated the business into Eurosport International, collectively referred to as
Eurosport
. (See Note 3 to the accompanying consolidated financial statements.) We included the operations of Eurosport International and Eurosport France in our consolidated financial statements as of their respective acquisition dates. As a result,
Eurosport
has impacted the comparability of our results of operations between
2015
and
2014
. Accordingly, to assist the reader in understanding the changes in our results of operations, the results of operations for the years ended December 31, 2015 and 2014 excluding Eurosport are presented in the tables below (in millions). The results of operations for Eurosport do not reflect the synergies from increased pan-European market penetration, which are reflected in the total Company excluding Eurosport amounts. Adjustments for Discovery Family, which was acquired on
September 23, 2014
, the Company's radio business in Northern Europe, which was disposed of on June 30, 2015, and other less significant acquisitions made during
2015
and
2014
, were not made in the comparability tables as their results did not materially impact the comparability of operations, except as otherwise noted within this Item. Adjusted OIBDA is defined and a reconciliation to operating income is presented below in "Segment Results of Operations
–
2015 vs. 2014."
|
Consolidated
|
Year Ended December 31,
|
|||||||||||||||||||||||||
|
2015
|
2014
|
|||||||||||||||||||||||||
|
Total Company As Reported
|
Eurosport
|
Total Company Ex-
Eurosport
|
Total Company As Reported
|
Eurosport
|
Total Company Ex-
Eurosport
|
% Change Ex-Eurosport
|
||||||||||||||||||||
|
Revenues:
|
||||||||||||||||||||||||||
|
Distribution
|
$
|
3,068
|
|
$
|
354
|
|
$
|
2,714
|
|
$
|
2,842
|
|
$
|
198
|
|
$
|
2,644
|
|
3
|
%
|
||||||
|
Advertising
|
3,004
|
|
|
98
|
|
|
2,906
|
|
3,089
|
|
69
|
|
3,020
|
|
(4
|
)%
|
||||||||||
|
Other
|
322
|
|
55
|
|
267
|
|
334
|
|
63
|
|
271
|
|
(1
|
)%
|
||||||||||||
|
Total Revenues
|
$
|
6,394
|
|
$
|
507
|
|
$
|
5,887
|
|
$
|
6,265
|
|
$
|
330
|
|
$
|
5,935
|
|
(1
|
)%
|
||||||
|
Adjusted OIBDA
|
$
|
2,398
|
|
$
|
37
|
|
$
|
2,361
|
|
$
|
2,491
|
|
$
|
68
|
|
$
|
2,423
|
|
(3
|
)%
|
||||||
|
International Networks
|
Year Ended December 31,
|
|||||||||||||||||||||||||
|
2015
|
2014
|
|||||||||||||||||||||||||
|
International Networks As Reported
|
Eurosport
|
International Networks Ex-
Eurosport
|
International
Networks
As Reported
|
Eurosport
|
International Networks Ex-
Eurosport |
% Change Ex-Eurosport
|
||||||||||||||||||||
|
Revenues:
|
||||||||||||||||||||||||||
|
Distribution
|
$
|
1,637
|
|
$
|
354
|
|
$
|
1,283
|
|
$
|
1,553
|
|
$
|
198
|
|
$
|
1,355
|
|
(5
|
)%
|
||||||
|
Advertising
|
1,353
|
|
|
98
|
|
1,255
|
|
1,483
|
|
69
|
|
1,414
|
|
(11
|
)%
|
|||||||||||
|
Other
|
102
|
|
55
|
|
47
|
|
121
|
|
63
|
|
58
|
|
(19
|
)%
|
||||||||||||
|
Total Revenues
|
$
|
3,092
|
|
$
|
507
|
|
$
|
2,585
|
|
$
|
3,157
|
|
$
|
330
|
|
$
|
2,827
|
|
(9
|
)%
|
||||||
|
Adjusted OIBDA
|
$
|
961
|
|
$
|
37
|
|
$
|
924
|
|
$
|
1,124
|
|
$
|
68
|
|
$
|
1,056
|
|
(13
|
)%
|
||||||
33
Consolidated Results of Operations –
2015
vs.
2014
Our consolidated results of operations for
2015
and
2014
were as follows (in millions).
|
Year Ended December 31,
|
|||||||||||
|
2015
|
2014
|
% Change
|
|||||||||
|
Revenues:
|
|||||||||||
|
Distribution
|
$
|
3,068
|
|
$
|
2,842
|
|
8
|
%
|
|||
|
Advertising
|
3,004
|
|
3,089
|
|
(3
|
)%
|
|||||
|
Other
|
322
|
|
334
|
|
(4
|
)%
|
|||||
|
Total revenues
|
6,394
|
|
6,265
|
|
2
|
%
|
|||||
|
Costs of revenues, excluding depreciation and amortization
|
2,343
|
|
2,124
|
|
10
|
%
|
|||||
|
Selling, general and administrative
|
1,669
|
|
1,692
|
|
(1
|
)%
|
|||||
|
Depreciation and amortization
|
330
|
|
329
|
|
—
|
%
|
|||||
|
Restructuring and other charges
|
50
|
|
90
|
|
(44
|
)%
|
|||||
|
Loss (gain) on disposition
|
17
|
|
(31
|
)
|
NM
|
|
|||||
|
Total costs and expenses
|
4,409
|
|
4,204
|
|
5
|
%
|
|||||
|
Operating income
|
1,985
|
|
2,061
|
|
(4
|
)%
|
|||||
|
Interest expense
|
(330
|
)
|
(328
|
)
|
1
|
%
|
|||||
|
Income from equity method investees, net
|
1
|
|
23
|
|
NM
|
|
|||||
|
Other expense, net
|
(97
|
)
|
(9
|
)
|
NM
|
|
|||||
|
Income before income taxes
|
1,559
|
|
1,747
|
|
(11
|
)%
|
|||||
|
Income taxes
|
(511
|
)
|
(610
|
)
|
(16
|
)%
|
|||||
|
Net income
|
1,048
|
|
1,137
|
|
(8
|
)%
|
|||||
|
Net income attributable to noncontrolling interests
|
(1
|
)
|
(2
|
)
|
(50
|
)%
|
|||||
|
Net (income) loss attributable to redeemable noncontrolling interests
|
(13
|
)
|
4
|
|
NM
|
|
|||||
|
Net income available to Discovery Communications, Inc.
|
$
|
1,034
|
|
$
|
1,139
|
|
(9
|
)%
|
|||
NM - Not meaningful
Revenues
Distribution revenue includes affiliate fees and digital distribution revenue and is largely dependent on the rates negotiated in our distribution agreements, the number of subscribers that receive our networks or content, and the market demand for the content that we provide. Excluding the impact of foreign currency fluctuations, the acquisition of Eurosport and the effect of the consolidation of Discovery Family, distribution revenue
increased
7%
as a result of increases of
7%
at our U.S. Networks segment and
7%
at our International Networks segment. For U.S. Networks, excluding the effect of the consolidation of Discovery Family, distribution revenue increased primarily due to annual contractual rate increases and, to a lesser extent, increases in digital distribution revenue, partially offset by slight declines in subscribers. The increase in our International Networks' distribution revenue, excluding the impact of foreign currency and the acquisition of Eurosport, was mostly due to increases in affiliate rates and subscribers, in equivalent amounts, in Latin America, and, a lesser extent, to increases in subscribers in CEEMEA and digital distribution revenue.
34
Advertising revenue is dependent upon a number of factors, including the stage of development of television markets, the number of subscribers to our channels, viewership demographics, the popularity of our content, our ability to sell commercial time over a group of channels, market demand, the mix of sales of commercial time between the upfront and scatter markets, and economic conditions. These factors impact the pricing and volume of our advertising inventory. Excluding the impact of foreign currency fluctuations, the acquisition of Eurosport, the effect of the consolidation of Discovery Family, and the disposition of the Company's radio business, advertising revenue
increased
6%
, primarily due to increases of
11%
at our International Networks segment and, to a lesser extent, increases of
2%
at our U.S. Networks segment. The increase at our International Networks segment was mostly driven by pricing and, to a lesser extent, ratings in Southern Europe and pricing, volume, and to a lesser extent, ratings in Latin America. Southern Europe and Latin America contributed to the increase in equivalent amounts. The increases were also, to a lesser extent, due to pricing in Northern Europe. These increases were partially offset by decreases due to changes in regulations involving advertising sales operations in Russia, as further described in Item 1, "Business" in this Annual Report on Form 10-K. U.S. Networks' advertising revenue increased due to increases in pricing, partially offset by lower audience delivery.
Excluding the impact of foreign currency fluctuations, the acquisition of Eurosport, the effect of the consolidation of Discovery Family, and the disposition of the Company's radio business, other revenue increased
4%
. This increase was primarily due to an increase at our Education and Other segments due to increased productions and, to a lesser extent, an increase at our International Networks segment as result of increased program sales. These increases were offset by a decrease at our U.S. Networks segment primarily due to the absence of representation service fees for Discovery Family, which have been eliminated since the Company began to consolidate Discovery Family.
Costs of Revenues
Excluding the impact of foreign currency fluctuations, the acquisitions of Eurosport, the effect of the consolidation of Discovery Family, and the disposition of the Company's radio business, costs of revenues
increased
11%
as result of increases of
12%
at our International Networks segment and
7%
at our U.S. Networks segment. The increases in costs of revenues were mostly due to our commitment to increased spending for content on our networks, which increased content amortization, and, to a lesser extent, increases in content impairments that were not included in restructuring and other charges. Excluding the impact of foreign currency fluctuations, the acquisition of Eurosport and the effect of the consolidation of Discovery Family, content amortization was
$1,458 million
and
$1,336 million
for the years ended
December 31, 2015
and
December 31, 2014
, respectively. Content amortization rates on our networks have been slightly accelerating.
Selling, General and Administrative
Selling, general and administrative expenses consist principally of employee costs, marketing costs, research costs, occupancy and back office support fees. Excluding the impact of foreign currency fluctuations, the acquisition of
Eurosport
, the consolidation of Discovery Family, and the disposition of the Company's radio business, selling, general and administrative expenses increased
3%
for the
year ended December 31, 2015
. The increase was primarily due to an increase in selling, general and administrative expense at our International Networks segment of
10%
mostly due to increased personnel and associated support costs and, to a lesser extent, increased marketing costs. The increase was also, to a lesser extent, due to slight increases at our U.S. Network segment due to an increase in research and, to a lesser extent, marketing costs. These increases were partially offset by a decrease in our equity-based compensation expense.
Depreciation and Amortization
Depreciation and amortization expense includes depreciation of fixed assets and amortization of finite-lived intangible assets. Excluding the impact of foreign currency fluctuations, business combinations and dispositions, depreciation and amortization remained consistent for the
year ended December 31, 2015
.
Restructuring and Other Charge
s
Restructuring and other charges decreased
$40 million
. The decrease was primarily due to a decrease in content impairments resulting from the post-acquisition rebranding of The Hub Network to Discovery Family in 2014 (See Note 6 and Note 15 to the accompanying consolidated financial statements.)
Loss (Gain) on Disposition
Loss on dispositions comprised
$12 million
for the sale of the SBS Radio business and
$5 million
for the contribution of the Russian business to a joint venture for the
year ended December 31, 2015
. Gain on disposition comprised
$31 million
for the sale of HowStuffWorks for the
year ended December 31, 2014
. (See Note 3 to the accompanying consolidated financial statements.)
35
Interest Expense
Interest expense remained consistent for the
year ended December 31, 2015
as compared to the year ended December 31, 2014
.
Income from Equity Investees, Net
Income from our equity method investees declined
$22 million
, mostly due to losses at All3Media related to the amortization of intangible assets for the step up in the fair value of assets acquired from the investment following its acquisition on
September 23, 2014
, interest expense for the recapitalization of debt for the transaction and losses on derivative instruments. The decline was also, to a lesser extent, due to the change in accounting for Discovery Family from an equity method investment to a consolidated subsidiary, as well as decreased income at various other equity method investees.
Other Expense, Net
The table below presents the details of other expense, net (in millions).
|
Year Ended December 31,
|
||||||||
|
2015
|
2014
|
|||||||
|
Foreign currency losses, net
|
$
|
(103
|
)
|
$
|
(22
|
)
|
||
|
Gain on derivative instruments
|
5
|
|
1
|
|
||||
|
Remeasurement gain on previously held equity interest
|
2
|
|
29
|
|
||||
|
Other expense, net
|
(1
|
)
|
(17
|
)
|
||||
|
Total other expense, net
|
$
|
(97
|
)
|
$
|
(9
|
)
|
||
Other expense, net increased
$88 million
in 2015. The increase was primarily due to foreign currency losses related to revaluation of our 1.90% euro-dominated senior notes due March 19, 2027, which expose Discovery to fluctuations in euro exchange rates, as well as the revaluation of monetary assets in Venezuela, due to changes in the bolivar exchange rate used to remeasure revenue and monetary asset balances (as further discussed in Item 7A, "Quantitative and Qualitative Disclosures about Market Risk" in this Annual Report on Form 10-K). The increase was further attributable to a decrease in remeasurement gain related to the acquisition of a controlling interest in Eurosport on May 30, 2014 of
$29 million
, and Eurosport France on March 31, 2015 of
$2 million
(See Note 3 to the accompanying consolidated financial statements). These increases were slightly offset by the attribution expense related to the put right held by TF1, the holder of the remaining interests in Eurosport and Eurosport France, as a component of other expense, net in 2014, for which there is no similar expense in the 2015.
Income Taxes
The following table reconciles the Company's effective income tax rate to the U.S. federal statutory income tax rate.
|
Year Ended December 31,
|
||||||
|
2015
|
2014
|
|||||
|
U.S. federal statutory income tax rate
|
35
|
%
|
35
|
%
|
||
|
State and local income taxes, net of federal tax benefit
|
2
|
%
|
2
|
%
|
||
|
Effect of foreign operations
|
1
|
%
|
2
|
%
|
||
|
Domestic production activity deductions
|
(3
|
)%
|
(3
|
)%
|
||
|
Change in uncertain tax positions
|
(1
|
)%
|
(1
|
)%
|
||
|
Other, net
|
(1
|
)%
|
—
|
%
|
||
|
Effective income tax rate
|
33
|
%
|
35
|
%
|
||
Income tax expense was
$511 million
and
$610 million
and the effective tax rate was
33%
and
35%
for
2015
and
2014
, respectively. The net
2%
decrease in the effective tax rate was attributable to a decrease in unrecognized tax benefits as a result of multiple audit resolutions and the lapse of the statute of limitations in foreign and domestic jurisdictions, favorable impact to deferred taxes due to various enacted foreign legislative changes and the allocation and taxation of income among multiple foreign and domestic jurisdictions.
36
Segment Results of Operations –
2015
vs.
2014
We evaluate the operating performance of our operating segments based on financial measures such as revenues and Adjusted OIBDA. Adjusted OIBDA is defined as operating income excluding: (i) mark-to-market equity-based compensation, (ii) depreciation and amortization, (iii) amortization of deferred launch incentives, (iv) restructuring and other charges, (v) certain impairment charges, (vi) gains and losses on business and asset dispositions, and (vii) certain inter-segment eliminations related to production studios. We use this measure to assess the operating results and performance of our segments, perform analytical comparisons, identify strategies to improve performance, and allocate resources to each segment. We believe Adjusted OIBDA is relevant to investors because it allows them to analyze the operating performance of each segment using the same metric management uses. We exclude mark-to-market equity-based compensation, restructuring and other charges, certain impairment charges, and gains and losses on business and asset dispositions from the calculation of Adjusted OIBDA due to their volatility. We also exclude the depreciation of fixed assets and amortization of intangible assets and deferred launch incentives as these amounts do not represent cash payments in the current reporting period. Additionally, certain corporate expenses and inter-segment eliminations related to production studios are excluded from segment results to enable executive management to evaluate segment performance based upon the decisions of segment executives. Adjusted OIBDA should be considered in addition to, but not a substitute for, operating income, net income and other measures of financial performance reported in accordance with U.S. generally accepted accounting principles (“GAAP”).
Additional financial information for our segments and geographical areas in which we do business is discussed in Note 21 to the accompanying consolidated financial statements included in Item 8, “Financial Statements and Supplementary Data” in this Annual Report on Form 10-K.
The table below presents the calculation of total Adjusted OIBDA (in millions).
|
Year Ended December 31,
|
|||||||||||
|
2015
|
2014
|
% Change
|
|||||||||
|
Revenue:
|
|||||||||||
|
U.S. Networks
|
$
|
3,131
|
|
$
|
2,950
|
|
6
|
%
|
|||
|
International Networks
|
3,092
|
|
3,157
|
|
(2
|
)%
|
|||||
|
Education and Other
|
173
|
|
160
|
|
8
|
%
|
|||||
|
Corporate and inter-segment eliminations
|
(2
|
)
|
(2
|
)
|
—
|
%
|
|||||
|
Total revenue
|
6,394
|
|
6,265
|
|
2
|
%
|
|||||
|
Costs of revenues, excluding depreciation and amortization
|
(2,343
|
)
|
(2,124
|
)
|
10
|
%
|
|||||
|
Selling, general and administrative
(a)
|
(1,669
|
)
|
(1,661
|
)
|
—
|
%
|
|||||
|
Add: Amortization of deferred launch incentives
(b)
|
16
|
|
11
|
|
45
|
%
|
|||||
|
Adjusted OIBDA
|
$
|
2,398
|
|
$
|
2,491
|
|
(4
|
)%
|
|||
(a)
Selling, general and administrative expenses exclude mark-to-market equity-based compensation, restructuring and other charges, and gains (losses) on dispositions.
(b)
Amortization of deferred launch incentives is included as a reduction of distribution revenue for reporting in accordance with GAAP but is excluded from Adjusted OIBDA.
37
The table below presents our Adjusted OIBDA by segment, with a reconciliation of total Adjusted OIBDA to consolidated operating income (in millions).
|
Year Ended December 31,
|
|||||||||||
|
2015
|
2014
|
% Change
|
|||||||||
|
Adjusted OIBDA:
|
|||||||||||
|
U.S. Networks
|
$
|
1,774
|
|
$
|
1,680
|
|
6
|
%
|
|||
|
International Networks
|
961
|
|
1,124
|
|
(15
|
)%
|
|||||
|
Education and Other
|
(2
|
)
|
6
|
|
NM
|
|
|||||
|
Corporate and inter-segment eliminations
|
(335
|
)
|
(319
|
)
|
5
|
%
|
|||||
|
Total Adjusted OIBDA
|
2,398
|
|
2,491
|
|
(4
|
)%
|
|||||
|
Amortization of deferred launch incentives
|
(16
|
)
|
(11
|
)
|
45
|
%
|
|||||
|
Mark-to-market equity-based compensation
|
—
|
|
(31
|
)
|
(100
|
)%
|
|||||
|
Depreciation and amortization
|
(330
|
)
|
(329
|
)
|
—
|
%
|
|||||
|
Restructuring and other charges
|
(50
|
)
|
(90
|
)
|
(44
|
)%
|
|||||
|
(Loss) gain on disposition
|
(17
|
)
|
31
|
|
NM
|
|
|||||
|
Operating income
|
$
|
1,985
|
|
$
|
2,061
|
|
(4
|
)%
|
|||
U.S. Networks
The table below presents, for our U.S. Networks operating segment, revenues by type, certain operating expenses, contra revenue amounts, Adjusted OIBDA and a reconciliation of Adjusted OIBDA to operating income (in millions).
|
Year Ended December 31,
|
|||||||||||
|
2015
|
2014
|
% Change
|
|||||||||
|
Revenues:
|
|||||||||||
|
Distribution
|
$
|
1,431
|
|
$
|
1,289
|
|
11
|
%
|
|||
|
Advertising
|
1,650
|
|
1,605
|
|
3
|
%
|
|||||
|
Other
|
50
|
|
56
|
|
(11
|
)%
|
|||||
|
Total revenues
|
3,131
|
|
2,950
|
|
6
|
%
|
|||||
|
Costs of revenues, excluding depreciation and amortization
|
(892
|
)
|
(815
|
)
|
9
|
%
|
|||||
|
Selling, general and administrative
|
(465
|
)
|
(455
|
)
|
2
|
%
|
|||||
|
Adjusted OIBDA
|
1,774
|
|
1,680
|
|
6
|
%
|
|||||
|
Depreciation and amortization
|
(29
|
)
|
(17
|
)
|
71
|
%
|
|||||
|
Restructuring and other charges
|
(33
|
)
|
(61
|
)
|
(46
|
)%
|
|||||
|
Gain on dispositions
|
—
|
|
31
|
|
(100
|
)%
|
|||||
|
Inter-segment eliminations
|
(8
|
)
|
(7
|
)
|
14
|
%
|
|||||
|
Operating income
|
$
|
1,704
|
|
$
|
1,626
|
|
5
|
%
|
|||
Revenues
Distribution revenue increased
11%
. Excluding the effect of the consolidation of Discovery Family, distribution revenue increased
7%
primarily due to contractual rate increases and, to a lesser extent, increases in digital distribution revenue, partially offset by slight declines in subscribers.
Advertising revenue increased
3%
. Excluding the effect of the consolidation of Discovery Family, advertising revenue increased
2%
as increases in pricing were partially offset by lower audience delivery.
Other revenue decreased
11%
. Excluding the effect of the consolidation of Discovery Family, other revenue decreased
24%
primarily due to the absence of representation service fees for Discovery Family, which have been eliminated since the Company began to consolidate Discovery Family. When Discovery Family was an equity method investment, these fees were not eliminated but disclosed as related party transactions in Note 19 to the accompanying consolidated financial statements.
38
Costs of Revenues
Costs of revenues increased
9%
. Excluding the effect of the consolidation of Discovery Family, costs of revenues increased
7%
. The increase was primarily attributable to our commitment to increased spending for content on our networks which increased content amortization, and, to a lesser extent, increases in content impairments that were not included in restructuring and other charges. Excluding the effect of the consolidation of Discovery Family, content amortization was
$719 million
and
$672 million
for
2015
and
2014
, respectively. Content amortization rates on our networks have been slightly accelerating.
Selling, General and Administrative
Selling, general and administrative expenses increased
2%
. Excluding the effect of the consolidation of Discovery Family, selling, general and administrative expenses increased slightly due to increases in research and, to a lesser extent, marketing costs.
Adjusted OIBDA
Adjusted OIBDA increased
6%
. Excluding the effect of the consolidation of Discovery Family, Adjusted OIBDA increased
3%
primarily driven by increases in distribution and advertising revenue, partially offset by increases in content amortization.
International Networks
The following table presents, for our International Networks operating segment, revenues by type, certain operating expenses, contra revenue amounts, Adjusted OIBDA, and a reconciliation of Adjusted OIBDA to operating income (in millions). In addition, see the International Networks' table in "Results of Operations –
2015
vs.
2014
-- Items Impacting Comparability" for more information on Eurosport.
|
Year Ended December 31,
|
||||||||||||
|
2015
|
2014
|
% Change
|
||||||||||
|
Revenues:
|
||||||||||||
|
Distribution
|
$
|
1,637
|
|
$
|
1,553
|
|
5
|
%
|
||||
|
Advertising
|
1,353
|
|
1,483
|
|
(9
|
)%
|
||||||
|
Other
|
102
|
|
121
|
|
(16
|
)%
|
||||||
|
Total revenues
|
3,092
|
|
3,157
|
|
(2
|
)%
|
||||||
|
Costs of revenues, excluding depreciation and amortization
|
(1,375
|
)
|
(1,250
|
)
|
10
|
%
|
||||||
|
Selling, general and administrative
|
(772
|
)
|
(794
|
)
|
(3
|
)%
|
||||||
|
Add: Amortization of deferred launch incentives
|
16
|
|
11
|
|
45
|
%
|
||||||
|
Adjusted OIBDA
|
961
|
|
1,124
|
|
(15
|
)%
|
||||||
|
Amortization of deferred launch incentives
|
(16
|
)
|
(11
|
)
|
45
|
%
|
||||||
|
Depreciation and amortization
|
(235
|
)
|
(247
|
)
|
(5
|
)%
|
||||||
|
Restructuring and other charges
|
(14
|
)
|
(24
|
)
|
(42
|
)%
|
||||||
|
Loss on disposition
|
(17
|
)
|
—
|
|
—
|
|
NM
|
|
||||
|
Inter-segment eliminations
|
(3
|
)
|
(2
|
)
|
50
|
%
|
||||||
|
Operating income
|
$
|
676
|
|
$
|
840
|
|
(20
|
)%
|
||||
Revenues
Excluding the impact of foreign currency fluctuations and the acquisition of Eurosport, distribution revenue
increased
7%
. The increase was mostly due to increases in affiliate rates and subscribers, in equivalent amounts, in Latin America and, to a lesser extent, increases in subscribers in CEEMEA and digital distribution revenue. Such growth is consistent with the continued development of the pay-TV markets in those regions.
Excluding the impact of foreign currency fluctuations, the acquisition of Eurosport, and the disposition of the Company's radio business, advertising revenue
increased
11%
. The increase was mostly driven by pricing and, to a lesser extent, ratings in Southern Europe and pricing, volume and, to a lesser extent, ratings in Latin America. Southern Europe and Latin America contributed to the increase in equivalent amounts. The increases were also, to a lesser extent, due to pricing in Northern Europe. These increases were partially offset by decreases due to changes in regulations involving advertising sales operations in Russia as further described in Item 1, "Business" in this Annual Report on Form 10-K.
39
Excluding the impact of foreign currency fluctuations, the acquisition of Eurosport, and the disposition of the Company's radio business, other revenue increased
13%
mostly as result of increased program sales.
Costs of Revenues
Excluding the impact of foreign currency fluctuations, the acquisition of Eurosport, and the disposition of the Company's radio business, costs of revenues
increased
12%
. The increase was mostly attributable to our commitment to increased spending on content on our networks, thereby increasing content amortization, and, to a lesser extent, increases in content impairments that were not included in restructuring and other charges. Excluding the impact of foreign currency fluctuations and Eurosport, content amortization was
$730 million
and
$658 million
for
2015
and
2014
, respectively. Content amortization rates on our networks have been slightly accelerating.
Selling, General and Administrative
Excluding the impact of foreign currency fluctuations, the acquisition of Eurosport, and the disposition of the Company's radio business, selling, general and administrative expenses
increased
10%
. The increase was mostly due to increased personnel and associated support costs and, to a lesser extent, increased marketing costs.
Adjusted OIBDA
Excluding the impact of foreign currency fluctuations, the acquisition of Eurosport, and the disposition of the Company's radio business, Adjusted OIBDA
increased
5%
. The increase was mostly due to an increase in advertising and distribution revenue, partially offset by higher content expense and, to a lesser extent, higher selling, general, and administrative costs.
Education and Other
The following table presents our Education and Other segments revenues, certain operating expenses, Adjusted OIBDA, and a reconciliation of Adjusted OIBDA to operating income (in millions).
|
Year Ended December 31,
|
|||||||||||
|
2015
|
2014
|
% Change
|
|||||||||
|
Revenues
|
$
|
173
|
|
$
|
160
|
|
8
|
%
|
|||
|
Costs of revenues, excluding depreciation and amortization
|
(75
|
)
|
(59
|
)
|
27
|
%
|
|||||
|
Selling, general and administrative
|
(100
|
)
|
(95
|
)
|
5
|
%
|
|||||
|
Adjusted OIBDA
|
(2
|
)
|
6
|
|
(133
|
)%
|
|||||
|
Depreciation and amortization
|
(7
|
)
|
(7
|
)
|
—
|
%
|
|||||
|
Restructuring and other charges
|
(2
|
)
|
(3
|
)
|
(33
|
)%
|
|||||
|
Inter-segment eliminations
|
11
|
|
9
|
|
22
|
%
|
|||||
|
Operating income
|
$
|
—
|
|
$
|
5
|
|
(100
|
)%
|
|||
Adjusted OIBDA decreased
$8 million
. The decrease was primarily due to activities associated with Education's digital textbooks partially offset by increases in production revenue.
Corporate and Inter-segment Eliminations
The following table presents our unallocated corporate amounts including revenue, certain operating expenses, Adjusted OIBDA and a reconciliation of Adjusted OIBDA to operating loss (in millions).
|
Year Ended December 31,
|
|||||||||||
|
2015
|
2014
|
% Change
|
|||||||||
|
Revenues
|
$
|
(2
|
)
|
$
|
(2
|
)
|
—
|
%
|
|||
|
Costs of revenues, excluding depreciation and amortization
|
(1
|
)
|
—
|
|
NM
|
|
|||||
|
Selling, general and administrative
|
(332
|
)
|
(317
|
)
|
5
|
%
|
|||||
|
Adjusted OIBDA
|
(335
|
)
|
(319
|
)
|
5
|
%
|
|||||
|
Mark-to-market equity-based compensation
|
—
|
|
(31
|
)
|
(100
|
)%
|
|||||
|
Depreciation and amortization
|
(59
|
)
|
(58
|
)
|
2
|
%
|
|||||
|
Restructuring and other charges
|
(1
|
)
|
(2
|
)
|
(50
|
)%
|
|||||
|
Operating loss
|
$
|
(395
|
)
|
$
|
(410
|
)
|
(4
|
)%
|
|||
40
Corporate operations primarily consist of executive management, administrative support services and substantially all of our equity-based compensation.
Adjusted OIBDA decreased
5%
, mostly attributable to higher personnel costs and, to a lesser extent, fees related to investments and other matters, partially offset by a decrease in equity-based compensation expense for equity-settled awards such as stock options and PRSUs that are recorded at fair value at grant date and amortized over the vesting period without mark-to-market adjustments.
The decrease in mark-to-market equity-based compensation expense was primarily attributable to a decrease in Discovery's stock price compared to
2014
. Changes in stock price are a key driver of fair value estimates used in the attribution of expense for SARs and unit awards. (See Note 13 to the accompanying consolidated financial statements.)
41
RESULTS OF OPERATIONS –
2014
vs.
2013
Items Impacting Comparability
On
May 30, 2014
, we acquired a controlling interest in Eurosport, and on
April 9, 2013
, we acquired SBS Nordic (see Note 3 to the accompanying consolidated financial statements). We included the operations of Eurosport and SBS Nordic ("Newly Acquired Businesses") in our consolidated financial statements as of their respective acquisition dates. As a result, Newly Acquired Businesses have impacted the comparability of our results of operations between 2014 and 2013. Accordingly, to assist the reader in understanding the changes in our results of operations, the following tables present the calculation of comparative adjusted operating income before depreciation and amortization ("Adjusted OIBDA") excluding the Newly Acquired Businesses, as reported within our consolidated financial statements (in millions). The comparability of the results of the U.S. Networks segment was not impacted by these acquisitions. The column Newly Acquired Businesses for the
year ended December 31, 2014
consists of the operating results of Eurosport since its acquisition on
May 30, 2014
and the results of SBS Nordic for the three months ended March 31, 2014. Newly Acquired Businesses do not include Discovery Family, which was acquired on
September 23, 2014
, the eight days of SBS Nordic's results from April 1, 2013 through April 9, 2013 or other, less significant, acquisitions made during
2014
, because their results did not materially impact the comparability of operations, except as otherwise noted within this Item. Adjusted OIBDA is defined and a reconciliation to operating income is presented below in "Segment Results of Operations
–
2014 vs. 2013."
|
Consolidated
|
Year Ended December 31,
|
|||||||||||||||||
|
2014
|
2014
|
2014
|
2013
|
|||||||||||||||
|
Total Company As Reported
|
Newly
Acquired
Businesses
|
Total Company Ex-
Acquisitions
|
Total Company As Reported
|
% Change Ex-Acquisitions
|
||||||||||||||
|
Revenues:
|
||||||||||||||||||
|
Distribution
|
$
|
2,842
|
|
$
|
244
|
|
$
|
2,598
|
|
$
|
2,536
|
|
2
|
%
|
||||
|
Advertising
|
3,089
|
|
|
197
|
|
|
2,892
|
|
2,739
|
|
6
|
%
|
||||||
|
Other
|
334
|
|
68
|
|
266
|
|
260
|
|
2
|
%
|
||||||||
|
Total Revenues
|
$
|
6,265
|
|
$
|
509
|
|
$
|
5,756
|
|
$
|
5,535
|
|
4
|
%
|
||||
|
Adjusted OIBDA
|
$
|
2,491
|
|
$
|
87
|
|
$
|
2,404
|
|
$
|
2,402
|
|
—
|
%
|
||||
|
International Networks
|
Year Ended December 31,
|
|||||||||||||||||
|
2014
|
2014
|
2014
|
2013
|
|||||||||||||||
|
International Networks As Reported
|
Newly
Acquired
Businesses
|
International Networks Ex-
Acquisitions
|
International
Networks
As Reported
|
% Change Ex-Acquisitions
|
||||||||||||||
|
Revenues:
|
||||||||||||||||||
|
Distribution
|
$
|
1,553
|
|
$
|
244
|
|
$
|
1,309
|
|
$
|
1,242
|
|
5
|
%
|
||||
|
Advertising
|
1,483
|
|
|
197
|
|
1,286
|
|
1,162
|
|
11
|
%
|
|||||||
|
Other
|
121
|
|
68
|
|
53
|
|
55
|
|
(4
|
)%
|
||||||||
|
Total Revenues
|
$
|
3,157
|
|
$
|
509
|
|
$
|
2,648
|
|
$
|
2,459
|
|
8
|
%
|
||||
|
Adjusted OIBDA
|
$
|
1,124
|
|
$
|
87
|
|
$
|
1,037
|
|
$
|
949
|
|
9
|
%
|
||||
42
Consolidated Results of Operations –
2014
vs.
2013
Our consolidated results of operations for
2014
and
2013
were as follows (in millions). The discussion of our results that follows reflects our management reporting structure for International Networks prior to January 1, 2015. Effective January 1, 2015, we realigned our International Networks management reporting structure into the following regions: Northern Europe, which includes primarily the Nordic countries, which we refer to as the Nordics, and U.K.; Southern Europe, which primarily includes Italy and Spain; Central and Eastern Europe, the Middle East, and Africa (“CEEMEA”), which has been expanded to include Germany; Latin America; Asia-Pacific; and Eurosport. Previously, International Networks’ regional operations reporting structure was segregated into the following regions: Western Europe, which included the U.K. and western European countries; Nordics; CEEMEA; Latin America; Asia-Pacific; and Eurosport. This realignment did not impact our consolidated financial statements other than to change the regions in which we describe our operating results for the International Networks segment from January 1, 2015.
|
Year Ended December 31,
|
|||||||||||
|
2014
|
2013
|
% Change
|
|||||||||
|
Revenues:
|
|||||||||||
|
Distribution
|
$
|
2,842
|
|
$
|
2,536
|
|
12
|
%
|
|||
|
Advertising
|
3,089
|
|
2,739
|
|
13
|
%
|
|||||
|
Other
|
334
|
|
260
|
|
28
|
%
|
|||||
|
Total revenues
|
6,265
|
|
5,535
|
|
13
|
%
|
|||||
|
Costs of revenues, excluding depreciation and amortization
|
2,124
|
|
1,689
|
|
26
|
%
|
|||||
|
Selling, general and administrative
|
1,692
|
|
1,598
|
|
6
|
%
|
|||||
|
Depreciation and amortization
|
329
|
|
276
|
|
19
|
%
|
|||||
|
Restructuring and other charges
|
90
|
|
16
|
|
NM
|
|
|||||
|
Gain on disposition
|
(31
|
)
|
(19
|
)
|
63
|
%
|
|||||
|
Total costs and expenses
|
4,204
|
|
3,560
|
|
18
|
%
|
|||||
|
Operating income
|
2,061
|
|
1,975
|
|
4
|
%
|
|||||
|
Interest expense
|
(328
|
)
|
(306
|
)
|
7
|
%
|
|||||
|
Income from equity method investees, net
|
23
|
|
18
|
|
28
|
%
|
|||||
|
Other income (expense), net
|
(9
|
)
|
49
|
|
NM
|
|
|||||
|
Income before income taxes
|
1,747
|
|
1,736
|
|
1
|
%
|
|||||
|
Income taxes
|
(610
|
)
|
(659
|
)
|
(7
|
)%
|
|||||
|
Net income
|
1,137
|
|
1,077
|
|
6
|
%
|
|||||
|
Net income attributable to noncontrolling interests
|
(2
|
)
|
(1
|
)
|
100
|
%
|
|||||
|
Net income attributable to redeemable noncontrolling interests
|
4
|
|
(1
|
)
|
NM
|
|
|||||
|
Net income available to Discovery Communications, Inc.
|
$
|
1,139
|
|
$
|
1,075
|
|
6
|
%
|
|||
NM - Not meaningful
Revenues
Distribution revenue includes affiliate fees and digital distribution revenue and is largely dependent on the rates negotiated in our distribution agreements, the number of subscribers that receive our networks or content, and the market demand for the content that we provide. Excluding the impact of foreign currency fluctuations, Newly Acquired Businesses and the effects of the consolidation of Discovery Family, distribution revenue increased 3% as a result of an increase of 9% at our International Networks segment, partially offset by a decrease of 2% at our U.S. Networks segment. The increase in our International Networks' distribution revenue, excluding the impact of foreign currency and Newly Acquired Businesses, was mostly attributable to revenue growth in Latin America and, to a lesser extent, to growth in CEEMEA. The revenue growth in Latin America was due to increases in subscribers and affiliate rates and in CEEMEA was due to increases in subscribers. For U.S. Networks, excluding declines in digital distribution resulting from lower content deliveries offset by an increase due to the consolidation of Discovery Family (see Note 3 to the accompanying consolidated financial statements), distribution revenue increased by 6% primarily due to contractual rate increases. Digital distribution revenue, which is earned under agreements to license programs, is recognized when the content has been delivered and is available for use by the customer. Digital distribution revenue is therefore prone to fluctuations based on the timing and volume of content deliveries.
43
Advertising revenue is dependent upon a number of factors, including the stage of development of television markets, the number of subscribers to our channels, viewership demographics, the popularity of our content, our ability to sell commercial time over a group of channels, and the mix of sales of commercial time between the upfront and scatter markets, which is based upon a number of factors, such as pricing, demand for advertising time and economic conditions. Excluding the impact of foreign currency fluctuations and Newly Acquired Businesses, advertising revenue increased 7% as a result of increases of 14% at our International Networks segment and 2% at our U.S. Networks segment. For our International Networks segment, the increase was mostly due to pricing and ratings increases on our free-to-air networks in Western Europe and, to a lesser extent, pricing increases in the Nordics and volume increases in Latin America. For our U.S. Networks segment, the increase was mostly due to increases in pricing and to a lesser extent, the volume of commercial units sold, partially offset by lower audience delivery.
Excluding the impacts of foreign currency fluctuations and Newly Acquired Businesses, other revenue increased 2%. The increase was primarily due to an increase in revenue at our Education and Other segments due to other business combinations in late 2013 and early 2014, offset by a decrease in representation fees at U.S. Networks
.
Costs of Revenues
Excluding the impact of foreign currency fluctuations, Newly Acquired Businesses, the effect of the consolidation of Discovery Family and digital distribution, costs of revenues increased 10%. The increase was the result of increases of 12% at our International Networks segment, 6% at our U.S. Networks segment and 20% at our Education and Other segments. The increase in costs of revenues at our International Networks segment was primarily attributable to increased investment in content acquired from U.S. Networks and locally acquired content, and to a lesser extent, an increase in sales commissions. The increase in costs of revenues at our U.S. Networks segment was primarily attributable to an increase in content expense due to additional spending on content in current and recent periods. These increases were partially offset by decreases in sales commissions.
Selling, General and Administrative
Selling, general and administrative expenses consist principally of employee costs, marketing costs, research costs, occupancy and back office support fees. Excluding the impact of foreign currency fluctuations and Newly Acquired Businesses, selling, general and administrative expenses decreased 3%. The decrease in selling, general and administrative expenses was primarily due to a decrease in equity-based compensation expense and, to a lesser extent, a decrease in marketing expenses. These decreases were partially offset by increases in personnel costs and, to a lesser extent, various other items. The decrease in equity-based compensation expense was due to decreases in our share price.
Depreciation and Amortization
Depreciation and amortization expense includes depreciation of fixed assets and amortization of finite-lived intangible assets. Depreciation and amortization expense increased $53 million. The increase was mostly attributable to amortization of intangible assets of businesses acquired during 2014. (See Note 3 to the accompanying consolidated financial statements.)
Restructuring and Other Charges
Restructuring and other charges increased $74 million in 2014. The increase was mostly related to content impairments resulting from the post acquisition rebranding of The Hub Network to Discovery Family, and the cancellation of certain high profile series due to legal circumstances pertaining to the associated talent, and, to a lesser extent, employee terminations associated with the integration of recent acquisitions. (See Note 6 and Note 15 to the accompanying consolidated financial statements.)
Gain on disposition
Gain on disposition was $31 million for the sale of HSW and $19 million for the sale of Petfinder for the years ended December 31, 2014 and 2013, respectively. (See Note 3 to the accompanying consolidated financial statements.)
Interest Expense
Interest expense increased $22 million due to an increase in outstanding debt.
44
Income from Equity Investees, Net
Income from our equity method investees increased $5 million in 2014, due to improved operating results at OWN offset by losses at All3Media related to economic hedges that did not receive hedge accounting and the amortization of intangibles for the step up in the fair value of assets acquired.
Other Income (Expense), Net
The table below presents the details of other income (expense), net (in millions).
|
Year Ended December 31,
|
||||||||
|
2014
|
2013
|
|||||||
|
Foreign currency (losses) gains, net
|
$
|
(22
|
)
|
$
|
23
|
|
||
|
Gain (loss) on derivative instruments
|
1
|
|
(56
|
)
|
||||
|
Remeasurement gain on previously held equity interest
|
29
|
|
92
|
|
||||
|
Other, net
|
(17
|
)
|
(10
|
)
|
||||
|
Total other income (expense), net
|
$
|
(9
|
)
|
$
|
49
|
|
||
Other (expense) income, net, decreased $58 million in 2014. The decrease was primarily due to a reduction in remeasurement gains recognized related to the acquisition of former equity method investees (see Note 3 of the accompanying consolidated financial statements) and foreign currency losses in 2014, offset by derivative losses related to the acquisition of SBS on
April 9, 2013
for which there is no similar item in the current period. The changes in foreign currency are primarily driven by the revaluation of monetary assets and liabilities in the Nordic region and Venezuela and, to a lesser extent, Russia.
Income Taxes
The following table reconciles the Company's effective income tax rate to the U.S. federal statutory income tax rate.
|
Year Ended December 31,
|
||||||
|
2014
|
2013
|
|||||
|
U.S. federal statutory income tax rate
|
35
|
%
|
35
|
%
|
||
|
State and local income taxes, net of federal tax benefit
|
2
|
%
|
3
|
%
|
||
|
Effect of foreign operations
|
2
|
%
|
2
|
%
|
||
|
Domestic production activity deductions
|
(3
|
)%
|
(2
|
)%
|
||
|
Change in uncertain tax positions
|
(1
|
)%
|
—
|
%
|
||
|
Remeasurement gain on previously held equity interest
|
—
|
%
|
(2
|
)%
|
||
|
Other, net
|
—
|
%
|
2
|
%
|
||
|
Effective income tax rate
|
35
|
%
|
38
|
%
|
||
Income tax expense was $610 million and $659 million and the effective tax rates was 35% and 38% for 2014 and 2013, respectively. The net 3% decrease in the effective tax rate was attributable to several factors, including a decline in other, net driven by nondeductible hedging losses associated with the acquisition of SBS Nordic on April 9, 2013 and the reduction in net deferred tax assets as a result of the change in tax rate in the United Kingdom in the prior year, for which no similar change took place in the current period. Additionally, the decrease for 2014 included a 1% decrease related to the domestic production activities deduction following certain legislative changes in 2013. These decreases were partially offset by an increase of 2% in the 2014 tax rate due to the $92 million remeasurement gain on the previously held equity interest in Discovery Japan recognized upon consolidation in 2013, which was not taxable because we intend to defer indefinitely the realization of this gain for tax purposes.
45
Segment Results of Operations –
2014
vs.
2013
The table below presents the calculation of total Adjusted OIBDA (in millions).
|
Year Ended December 31,
|
|||||||||||
|
2014
|
2013
|
% Change
|
|||||||||
|
Revenues:
|
|||||||||||
|
U.S. Networks
|
$
|
2,950
|
|
$
|
2,947
|
|
—
|
%
|
|||
|
International Networks
|
3,157
|
|
2,459
|
|
28
|
%
|
|||||
|
Education and Other
|
160
|
|
140
|
|
14
|
%
|
|||||
|
Corporate and inter-segment eliminations
|
(2
|
)
|
(11
|
)
|
(82
|
)%
|
|||||
|
Total revenues
|
6,265
|
|
5,535
|
|
13
|
%
|
|||||
|
Costs of revenues, excluding depreciation and amortization
|
(2,124
|
)
|
(1,689
|
)
|
26
|
%
|
|||||
|
Selling, general and administrative
(a)
|
(1,661
|
)
|
(1,462
|
)
|
14
|
%
|
|||||
|
Add: Amortization of deferred launch incentives
(b)
|
11
|
|
18
|
|
(39
|
)%
|
|||||
|
Adjusted OIBDA
|
$
|
2,491
|
|
$
|
2,402
|
|
4
|
%
|
|||
(a)
Selling, general and administrative expenses exclude mark-to-market equity-based compensation, restructuring and other charges and gains (losses) on dispositions.
(b)
Amortization of deferred launch incentives are included as a reduction of distribution revenue for reporting in accordance with GAAP but are excluded from Adjusted OIBDA.
The table below presents our Adjusted OIBDA, with a reconciliation of total Adjusted OIBDA to consolidated operating income (in millions).
|
Year Ended December 31,
|
|||||||||||
|
2014
|
2013
|
% Change
|
|||||||||
|
Adjusted OIBDA:
|
|||||||||||
|
U.S. Networks
|
$
|
1,680
|
|
$
|
1,712
|
|
(2
|
)%
|
|||
|
International Networks
|
1,124
|
|
949
|
|
18
|
%
|
|||||
|
Education and Other
|
6
|
|
30
|
|
(80
|
)%
|
|||||
|
Corporate and inter-segment eliminations
|
(319
|
)
|
(289
|
)
|
10
|
%
|
|||||
|
Total Adjusted OIBDA
|
2,491
|
|
2,402
|
|
4
|
%
|
|||||
|
Amortization of deferred launch incentives
|
(11
|
)
|
(18
|
)
|
(39
|
)%
|
|||||
|
Mark-to-market equity-based compensation
|
(31
|
)
|
(136
|
)
|
(77
|
)%
|
|||||
|
Depreciation and amortization
|
(329
|
)
|
(276
|
)
|
19
|
%
|
|||||
|
Restructuring and other charges
|
(90
|
)
|
(16
|
)
|
NM
|
|
|||||
|
Gain on disposition
|
31
|
|
19
|
|
63
|
%
|
|||||
|
Operating income
|
$
|
2,061
|
|
$
|
1,975
|
|
4
|
%
|
|||
46
U.S. Networks
The following table presents, for our U.S. Networks operating segment, revenues by type, certain operating expenses, contra revenue amounts, Adjusted OIBDA, and a reconciliation of Adjusted OIBDA to operating income (in millions).
|
Year Ended December 31,
|
|||||||||||
|
2014
|
2013
|
% Change
|
|||||||||
|
Revenues:
|
|||||||||||
|
Distribution
|
$
|
1,289
|
|
$
|
1,294
|
|
—
|
%
|
|||
|
Advertising
|
1,605
|
|
1,576
|
|
2
|
%
|
|||||
|
Other
|
56
|
|
77
|
|
(27
|
)%
|
|||||
|
Total revenues
|
2,950
|
|
2,947
|
|
—
|
%
|
|||||
|
Costs of revenues, excluding depreciation and amortization
|
(815
|
)
|
(767
|
)
|
6
|
%
|
|||||
|
Selling, general and administrative
|
(455
|
)
|
(475
|
)
|
(4
|
)%
|
|||||
|
Add: Amortization of deferred launch incentives
|
—
|
|
7
|
|
(100
|
)%
|
|||||
|
Adjusted OIBDA
|
1,680
|
|
1,712
|
|
(2
|
)%
|
|||||
|
Amortization of deferred launch incentives
|
—
|
|
(7
|
)
|
(100
|
)%
|
|||||
|
Depreciation and amortization
|
(17
|
)
|
(10
|
)
|
70
|
%
|
|||||
|
Restructuring and other charges
|
(61
|
)
|
(4
|
)
|
NM
|
|
|||||
|
Gain on disposition
|
31
|
|
19
|
|
63
|
%
|
|||||
|
Inter-segment eliminations
|
(7
|
)
|
—
|
|
NM
|
|
|||||
|
Operating income
|
$
|
1,626
|
|
$
|
1,710
|
|
(5
|
)%
|
|||
Revenues
Distribution revenue decreased $5 million. Excluding declines in digital distribution resulting from lower content deliveries and an increase due to the consolidation of Discovery Family, distribution revenue increased by 6% primarily due to contractual rate increases, as the subscriber base for the U.S. pay television market has declined slightly. Digital distribution revenue, which is earned under agreements to license selected library titles, is recognized when the content has been delivered and is available for use by the customer.
Advertising revenue increased 2%. The increase was mostly attributable to increases in pricing and, to a lesser extent, the volume of commercial units sold, partially offset by lower audience delivery.
Other revenue decreased 27%. The decrease was mostly attributable to lower representation fees, which have been eliminated now that Discovery Family has been consolidated, as well as decreases in various other items.
Costs of Revenues
Excluding the effect of the consolidation of Discovery Family and digital distribution, costs of revenues increased 6% in 2014. The increase was primarily attributable to an increase in content expense due to additional spending on content in current and prior years. These increases were partially offset by decreases in sales commissions.
Selling, General and Administrative
Selling, general and administrative expenses decreased 4% in 2014. The decrease was primarily attributable to decreases in marketing costs.
Adjusted OIBDA
Adjusted OIBDA decreased 2% in 2014. Revenue for 2014 was consistent with the prior period as increases in advertising revenue were largely offset by decreases in digital distribution revenue and other revenue. Higher costs in the current year were primarily due to increased content expense, which was partially offset by lower marketing costs.
47
International Networks
The following table presents, for our International Networks operating segment, revenues by type, certain operating expenses, contra revenue amounts, Adjusted OIBDA, and a reconciliation of Adjusted OIBDA to operating income (in millions).
|
Year Ended December 31,
|
|||||||||||
|
2014
|
2013
|
% Change
|
|||||||||
|
Revenues:
|
|||||||||||
|
Distribution
|
$
|
1,553
|
|
$
|
1,242
|
|
25
|
%
|
|||
|
Advertising
|
1,483
|
|
1,162
|
|
28
|
%
|
|||||
|
Other
|
121
|
|
55
|
|
NM
|
|
|||||
|
Total revenues
|
3,157
|
|
2,459
|
|
28
|
%
|
|||||
|
Costs of revenues, excluding depreciation and amortization
|
(1,250
|
)
|
(881
|
)
|
42
|
%
|
|||||
|
Selling, general and administrative
|
(794
|
)
|
(640
|
)
|
24
|
%
|
|||||
|
Add: Amortization of deferred launch incentives
|
11
|
|
11
|
|
—
|
%
|
|||||
|
Adjusted OIBDA
|
1,124
|
|
949
|
|
18
|
%
|
|||||
|
Amortization of deferred launch incentives
|
(11
|
)
|
(11
|
)
|
—
|
%
|
|||||
|
Depreciation and amortization
|
(247
|
)
|
(205
|
)
|
20
|
%
|
|||||
|
Restructuring and other charges
|
(24
|
)
|
(11
|
)
|
NM
|
|
|||||
|
Inter-segment eliminations
|
(2
|
)
|
—
|
|
NM
|
|
|||||
|
Operating income
|
$
|
840
|
|
$
|
722
|
|
16
|
%
|
|||
Revenues
Excluding the impact of foreign currency fluctuations and Newly Acquired Businesses, distribution revenue increased 9%. The increase was mostly attributable to revenue growth in Latin America, and to a lesser extent, to growth in CEEMEA. The revenue growth in Latin America was due to increases in subscribers and affiliate rates, while in CEEMEA it was due to increases in subscribers. Such growth is consistent with the continued development of the pay television markets in those regions.
Excluding the impact of foreign currency fluctuations and Newly Acquired Businesses, advertising revenue increased 14%. The increase was mostly due to pricing and ratings increases on our free-to-air networks in Western Europe and, to a lesser extent, pricing increases in the Nordics and volume increases in Latin America.
Excluding the impact of foreign currency fluctuations and Newly Acquired Businesses, other revenue was consistent with the prior period.
Costs of Revenues
Excluding the impact of foreign currency fluctuations and Newly Acquired Businesses, costs of revenues increased 12%. The increase was primarily attributable to increased investment in U.S. Networks' and locally acquired content in recent years, and to a lesser extent, an increase in sales commissions.
Selling, General and Administrative
Excluding the impact of foreign currency fluctuations and Newly Acquired Businesses, selling, general and administrative expenses remained comparable with the prior year. Cost reductions in marketing were offset by increased personnel costs to support a localization strategy as certain activities are transitioned out of regional hubs.
Adjusted OIBDA
Excluding the impact of foreign currency fluctuations and Newly Acquired Businesses, Adjusted OIBDA increased 16%. The increase was due to increases in advertising revenue and distribution revenue, partially offset by increased content expense, sales commissions and personnel costs.
48
Education and Other
The following table presents, for our Education and Other operating segments, revenue, certain operating expenses, Adjusted OIBDA, and a reconciliation of Adjusted OIBDA to operating (loss) income (in millions).
|
Year Ended December 31,
|
|||||||||||
|
2014
|
2013
|
% Change
|
|||||||||
|
Revenues
|
$
|
160
|
|
$
|
140
|
|
14
|
%
|
|||
|
Costs of revenues, excluding depreciation and amortization
|
(59
|
)
|
(49
|
)
|
20
|
%
|
|||||
|
Selling, general and administrative
|
(95
|
)
|
(61
|
)
|
56
|
%
|
|||||
|
Adjusted OIBDA
|
6
|
|
30
|
|
(80
|
)%
|
|||||
|
Depreciation and amortization
|
(7
|
)
|
(4
|
)
|
75
|
%
|
|||||
|
Restructuring and other charges
|
(3
|
)
|
—
|
|
NM
|
|
|||||
|
Inter-segment eliminations
|
9
|
|
—
|
|
NM
|
|
|||||
|
Operating income
|
$
|
5
|
|
$
|
26
|
|
(81
|
)%
|
|||
Adjusted OIBDA decreased $24 million. Increased revenue attributable to business combinations that took place late 2013 and early 2014 was more than offset by the operating costs of those businesses as well as contingent consideration recorded as a component of selling, general and administrative expense for earn outs at acquired businesses.
Corporate and Inter-segment Eliminations
The following table presents, for our unallocated corporate amounts, revenue, certain operating expenses, Adjusted OIBDA, and a reconciliation of Adjusted OIBDA to operating loss (in millions).
|
Year Ended December 31,
|
|||||||||||
|
2014
|
2013
|
% Change
|
|||||||||
|
Revenues
|
$
|
(2
|
)
|
$
|
(11
|
)
|
(82
|
)%
|
|||
|
Costs of revenues, excluding depreciation and amortization
|
—
|
|
8
|
|
NM
|
|
|||||
|
Selling, general and administrative
|
(317
|
)
|
(286
|
)
|
11
|
%
|
|||||
|
Adjusted OIBDA
|
(319
|
)
|
(289
|
)
|
10
|
%
|
|||||
|
Mark-to-market equity-based compensation
|
(31
|
)
|
(136
|
)
|
(77
|
)%
|
|||||
|
Depreciation and amortization
|
(58
|
)
|
(57
|
)
|
2
|
%
|
|||||
|
Restructuring and other charges
|
(2
|
)
|
(1
|
)
|
100
|
%
|
|||||
|
Operating loss
|
$
|
(410
|
)
|
$
|
(483
|
)
|
(15
|
)%
|
|||
Corporate operations primarily consist of executive management, administrative support services and substantially all of our equity-based compensation.
Adjusted OIBDA decreased 10% mostly attributable to increased personnel costs to support a broader corporate function for international operations.
The decrease in mark-to-market equity-based compensation expense was attributable to decreases in Discovery stock price during the year ended December 31, 2014 compared to the year ended December 31, 2013. Changes in stock price are a key driver of fair value estimates used in the attribution of expense for SARs and unit awards. (See Note 13 to the accompanying consolidated financial statements.)
LIQUIDITY AND CAPITAL RESOURCES
Liquidity
Sources of Cash
Historically, we have generated a significant amount of cash from operations. During the year ended
December 31, 2015
, we have funded our working capital needs primarily through cash flows from operations. As of
December 31, 2015
, we had
$390 million
of cash and cash equivalents on hand.
49
|
•
|
Senior Notes
|
As a public company, we may have access to other sources of capital such as the public bond and equity markets. On
March 2, 2015
, Discovery Communications, LLC ("DCL"), our wholly-owned subsidiary, issued $
300 million
principal amount of
3.45%
senior notes due
March 15, 2025
. Additionally, on
March 19, 2015
, DCL issued
€600 million
principal amount (
$637 million
, at issuance, based on the exchange rate of
$1.06
per euro at
March 19, 2015
) of
1.90%
senior notes due
March 19, 2027
. All of DCL's outstanding senior notes are fully and unconditionally guaranteed on an unsecured and unsubordinated basis by Discovery and contain certain nonfinancial covenants, events of default and other customary provisions.
We maintain an effective Registration Statement on Form S-3 that allows us to conduct registered offerings of securities, including debt securities, common stock and preferred stock. Access to sufficient capital from the public market is not assured.
|
•
|
Commercial Paper
|
Under our commercial paper program and subject to market conditions, DCL may issue unsecured commercial paper notes guaranteed by the Company from time to time up to an aggregate principal amount outstanding at any given time of $1.0 billion. The maturities of these notes will vary but may not exceed 397 days. The notes may be issued at a discount or at par, and interest rates will vary based on market conditions and the credit ratings assigned to the notes at the time of issuance. As of
December 31, 2015
, we had
$93 million
of commercial paper borrowings outstanding with a weighted average interest rate of approximately
1.10%
and maturities of less than 90 days.
|
•
|
Revolving Credit Facility
|
During the year ended December 31, 2015, we had access to a
$1.5 billion
revolving credit facility. In February 2016, the Company amended and restated the revolving credit facility to extend DCL's borrowing capacity to $2.0 billion, extend the maturity date to February 4, 2021 and provide the option for up to two additional 364-day renewal periods. Borrowing capacity under this agreement is reduced by the outstanding borrowings under the commercial paper program.
As of
December 31, 2015
, the Company had outstanding borrowings under the revolving credit facility of
$782 million
at a weighted average interest rate of
1.55%
. Borrowings under the revolving credit facility bear interest at rates that vary based on DCL’s periodic debt ratings. DCL also has the ability to request an increase of the revolving credit facility up to an aggregate additional
$1.0 billion
, upon the satisfaction of certain conditions. All obligations of DCL and the other borrowers under the revolving credit facility are unsecured and are fully and unconditionally guaranteed by Discovery. Borrowings may be used for general corporate purposes.
The credit agreement governing the revolving credit facility (the “Credit Agreement”) contains customary representations, warranties and events of default, as well as affirmative and negative covenants, including limitations on liens, investments, indebtedness, dispositions, affiliate transactions, dividends and restricted payments. DCL, its subsidiaries and Discovery are also subject to a limitation on mergers, liquidation and disposals of all or substantially all of their assets. The Credit Agreement also requires DCL to maintain a consolidated interest coverage ratio (as defined in the Credit Agreement) of no less than 3:00 to 1:00 and a consolidated leverage ratio (as defined in the Credit Agreement) of no more than 4:50 to 1:00. As of
December 31, 2015
, Discovery, DCL and the other borrowers were in compliance with all covenants and there were no events of default under the Credit Agreement.
|
•
|
Notes Receivable
|
We have an outstanding note receivable from OWN, our equity method investee, which totals
$384 million
including interest. During the
years ended December 31, 2015 and 2014
, the Company received net repayments from OWN of
$82 million
and
$56 million
, respectively. Borrowings are scheduled for repayment
four
years after the borrowing date to the extent that OWN has excess cash to repay the borrowings then due.
Uses of Cash
Our primary uses of cash include the creation and acquisition of new content, business acquisitions, repurchases of our capital stock, income taxes, personnel costs, principal and interest on our outstanding senior notes, and funding for various equity method and other investments.
50
|
•
|
Content Acquisition
|
We plan to continue to invest significantly in the creation and acquisition of new content. During the
year ended December 31, 2015
, we committed to acquire exclusive broadcast rights across all media platforms throughout Europe for the four Olympic Games between 2018 and 2024 for €1.3 billion ($1.5 billion as of
December 31, 2015
). The broadcast rights exclude the U.K. and France for the Olympic Games in 2018 and 2020, and exclude Russia. Additional information regarding contractual commitments to acquire content is set forth in “Commitments and Off-Balance Sheet Arrangements” in Item 7, “Management’s Discussion and Analysis of Financial Condition and Results of Operations” in this Annual Report on Form 10-K.
|
•
|
Business Combinations and Investments
|
In
2015
, our uses of cash have included business combinations (see Note 3 to the accompanying consolidated financial statements). Due to business combinations in current and prior years, we also have redeemable equity balances of
$241 million
, which may require the use of cash in the event holders of noncontrolling interests put their interests to the Company. On March 31, 2015, we acquired from TF1 a controlling interest in Eurosport France by increasing Discovery's ownership stake from
20%
to
51%
for cash of approximately
€36 million
(
$38 million
). On
July 22, 2015
, TF1 exercised its right to put the entirety of its remaining
49%
noncontrolling interest in Eurosport to the Company for
€491 million
($551 million as of September 30, 2015). On October 1, 2015, the Company closed the transaction for
€491 million
(
$548 million
). (See Note 11 to the accompanying consolidated financial statements.) The Company borrowed an additional
$525 million
under the revolving credit facility on October 1, 2015 in order to facilitate the transaction.
|
•
|
Equity Method Investments
|
We have interests in various equity method investees and provide funding to those equity method investees from time to time. As of
December 31, 2015
, we have outstanding advances to and a note receivable from OWN, our equity method investee, which totals
$384 million
including interest. We may provide additional funding to our equity method investees, if necessary, and expect to recoup amounts funded. (See Note 4 to the accompanying consolidated financial statements.)
|
•
|
Available-for-Sale Securities
|
In
2015
, our uses of cash included the acquisition of 5 million shares of an entertainment company for
$195 million
. As the shares have a readily determinable fair value and the Company has the intent to retain the investment, the shares are classified as available-for-sale ("AFS") securities. In connection with this transaction, we hedged 50% of the shares with an equity collar for $4 million. (See Note 4 to the accompanying consolidated financial statements.)
|
•
|
Common Stock Repurchase Program
|
Under the Company's stock repurchase program, management is authorized to purchase shares of the Company's common stock from time to time through open market purchases, privately negotiated transactions at prevailing prices, pursuant to one or more accelerated stock repurchase agreements, or other derivative arrangements as permitted by securities laws and other legal requirements, and subject to stock price, business and market conditions and other factors. As of
December 31, 2015
, the Company had repurchased over the life of the program
3 million
and
115 million
shares of Series A and Series C common stock, respectively, for the aggregate purchase price of
$171 million
and
$5.3 billion
, respectively. Over the life of the program, authorization under the stock repurchase program has totaled
$7.5 billion
. As of
December 31, 2015
, the Company had remaining authorization of approximately
$2.0 billion
for future repurchases under the existing stock repurchase program, of which
$41 million
and
$2.0 billion
will expire on
February 3, 2016
and
October 8, 2017
, respectively. (See Note 12 to the accompanying consolidated financial statements.) We have been funding our stock repurchases through a combination of cash on hand, cash generated by operations and the issuance of debt. In the future we may also choose to fund our stock repurchase program through borrowings under our revolving credit facility and future financing transactions.
|
•
|
Preferred Stock Conversion and Repurchase
|
We have an agreement with Advance/Newhouse to repurchase, on a quarterly basis, a number of shares of Series C convertible preferred stock convertible into 3/7 of the number of shares of Series C common stock purchased under the Company’s stock repurchase program during the then most recently completed fiscal quarter. The price paid per share is calculated as
99%
of the average price paid for the Series C common shares repurchased by the Company during the applicable fiscal quarter multiplied by the Series C conversion rate. The Advance/Newhouse repurchases are made outside of the Company’s publicly announced stock repurchase program. During
2015
, we converted and retired
4 million
shares of our Series C convertible preferred stock under the preferred stock conversion and
51
repurchase arrangement for an aggregate purchase price of
$253 million
. Based on the number of shares of Series C common stock purchased during the
three months ended December 31, 2015
, the Company expects Advance/Newhouse to effectively convert and sell to the Company
3 million
shares of its Series C convertible preferred stock for an aggregate purchase price of
$159 million
on or about
February 22, 2016
. (See Note 12 to the accompanying consolidated financial statements.)
|
•
|
Income Taxes and Interest
|
We expect to continue to make payments for income taxes and interest on our outstanding senior notes. During the
year ended December 31, 2015
, we made cash payments of
$653 million
and
$312 million
for income taxes and interest on our outstanding debt, respectively.
|
•
|
Equity-Based Compensation
|
We expect to continue to make payments for vested cash-settled equity awards. Actual amounts expensed and payable for cash-settled awards are dependent on future fair value calculations which are primarily affected by changes in our stock price or changes in the number of awards outstanding. During
2015
, we paid
$25 million
for cash-settled equity awards. As of
December 31, 2015
, we had accrued liabilities of
$54 million
for outstanding cash-settled equity awards, of which
$5 million
was classified as current. (See Note 13 to the accompanying consolidated financial statements.)
|
•
|
Debt Maturities
|
On March 31, 2015, we redeemed $
850 million
aggregate principal amount of
3.70%
senior notes that had an original maturity date of
June 1, 2015
. The repayments included a payment of $
1 million
for the original issue discount on the Company’s senior notes and resulted in a pretax loss on extinguishment of debt of $
5 million
for make-whole premiums.
Cash Flows
Changes in cash and cash equivalents were as follows (in millions).
|
Year Ended December 31,
|
||||||||||||
|
2015
|
2014
|
2013
|
||||||||||
|
Cash and cash equivalents, beginning of period
|
$
|
367
|
|
$
|
408
|
|
$
|
1,201
|
|
|||
|
Cash provided by operating activities
|
1,277
|
|
1,318
|
|
1,285
|
|
||||||
|
Cash used in investing activities
|
(301
|
)
|
(568
|
)
|
(1,987
|
)
|
||||||
|
Cash used in financing activities
|
(902
|
)
|
(734
|
)
|
(85
|
)
|
||||||
|
Effect of exchange rate changes on cash and cash equivalents
|
(51
|
)
|
(57
|
)
|
(6
|
)
|
||||||
|
Net change in cash and cash equivalents
|
23
|
|
(41
|
)
|
(793
|
)
|
||||||
|
Cash and cash equivalents, end of period
|
$
|
390
|
|
$
|
367
|
|
$
|
408
|
|
|||
Operating Activities
Cash provided by operating activities decreased
$41 million
for the year ended
December 31, 2015
as compared to the year ended
December 31, 2014
. The decrease was primarily attributable to negative foreign currency fluctuations that impacted the Company's operating performance, increased content investment of
$90 million
and decreases in working capital of
$182 million
due to decreases in accounts payable and accruals. These decreases were partially offset by a decrease in cash payments for equity-based compensation of
$56 million
.
Cash provided by operating activities increased
$33 million
for the year ended
December 31, 2014
as compared to the year ended
December 31, 2013
. The increase was primarily attributable to improved operating results and operating cash flows from acquired businesses partially offset by an increase in content investment of
$257 million
and taxes paid of $202 million.
Investing Activities
Cash flows used in investing activities decreased
$267 million
for the year ended
December 31, 2015
as compared to the year ended
December 31, 2014
. The decrease was primarily attributable to a decrease in cash paid for business combinations, net of cash acquired of
$292 million
and a decrease in investments in equity method investees of
$116 million
. These decreases were partially offset by an increase in investments in available-for-sale and cost method investments of
$208 million
.
52
Cash flows used in investing activities decreased
$1.4 billion
for the year ended
December 31, 2014
as compared to the year ended
December 31, 2013
. The decrease was primarily attributable to decreases in cash paid for business combinations of
$1.5 billion
, net of cash acquired (see Note 3 to the accompanying consolidated financial statements) and a decrease in realized losses for derivatives used to economically hedge business combinations of $55 million (see Note 10 to the accompanying consolidated financial statements), partially offset by an increase in investments in and advances to unconsolidated equity method investees of
$149 million
for the investment in a 50% ownership interest in All3Media, a production studio company during 2014 (see Note 4 to the accompanying consolidated financial statements).
Financing Activities
Cash flows used in financing activities increased
$168 million
for the year ended
December 31, 2015
as compared to the year ended
December 31, 2014
. The increase was primarily due to the purchase of TF1's
49%
noncontrolling interest in Eurosport for
$548 million
, an increase in net repayments of commercial paper of
$365 million
, an increase in cash distributions to redeemable noncontrolling interests of
$40 million
and payments on hedging instruments for derivatives in connection with the effective portion of our interest rate contracts of
$29 million
(see Note 10 to the accompanying consolidated financial statements). These increases were partially offset by increased borrowings under the revolving credit facility of
$318 million
and a decrease in the repurchases of stock of
$471 million
.
Cash flows used in financing activities increased
$649 million
for the year ended
December 31, 2014
as compared to the year ended
December 31, 2013
. The increase in cash used was primarily due to a reduction in the proceeds from borrowings on an aggregated, net basis from senior notes, commercial paper and the revolving credit facility of $516 million during 2014 as compared to 2013, as well as an increase in share repurchases of
$117 million
.
Capital Resources
As of
December 31, 2015
, capital resources were comprised of the following (in millions).
|
|
December 31, 2015
|
|||||||||||||||
|
|
Total
Capacity
|
Outstanding
Letters of
Credit
|
Outstanding
Indebtedness
|
Unused
Capacity
|
||||||||||||
|
Cash and cash equivalents
|
$
|
390
|
|
$
|
—
|
|
$
|
—
|
|
$
|
390
|
|
||||
|
Revolving credit facility and commercial paper program
(a)
|
1,500
|
|
1
|
|
875
|
|
624
|
|
||||||||
|
Senior notes
(b)
|
6,784
|
|
—
|
|
6,784
|
|
—
|
|
||||||||
|
Total
|
$
|
8,674
|
|
$
|
1
|
|
$
|
7,659
|
|
$
|
1,014
|
|
||||
(a)
Outstanding commercial paper borrowings of
$93 million
as of
December 31, 2015
are supported by unused committed capacity under the revolving credit facility and reduce unused capacity. There were
$782 million
in borrowings under the revolving credit facility outstanding as of
December 31, 2015
.
(b)
Interest on senior notes is paid annually or semi-annually. Our senior notes outstanding as of
December 31, 2015
had interest rates that ranged from 1.90% to 6.35% and will mature between 2019 and 2043.
We expect that our cash balance, cash generated from operations and availability under our revolving credit facility will be sufficient to fund our cash needs for the next twelve months. Our borrowing costs and access to the capital markets can be affected by short and long-term debt ratings assigned by independent rating agencies which are based, in part, on our performance as measured by credit metrics, such as interest coverage and leverage ratios.
As of
December 31, 2015
, we held
$95 million
of our
$390 million
of cash and cash equivalents in our foreign subsidiaries. We intend to permanently reinvest these funds outside of the U.S. Our current plans do not demonstrate a need to repatriate them to the U.S. However, if these funds are needed in the U.S., we would be required to accrue and pay U.S. taxes to repatriate them. The determination of the amount of unrecognized U.S. deferred income tax liability with respect to these undistributed foreign earnings is not practicable.
Additional information regarding the changes in our outstanding indebtedness and the significant terms and provisions of our revolving credit facility and outstanding indebtedness is discussed in Note 9 to the accompanying consolidated financial statements included in Item 8, “Financial Statements and Supplementary Data” in this Annual Report on Form 10-K.
53
COMMITMENTS AND OFF-BALANCE SHEET ARRANGEMENTS
Obligations
As of
December 31, 2015
, our significant contractual obligations, including related payments due by period, were as follows (in millions).
|
Payments Due by Period
|
||||||||||||||||||||
|
Total
|
Less than 1
Year
|
1-3 Years
|
3-5 Years
|
More than
5 Years
|
||||||||||||||||
|
Long-term debt:
|
||||||||||||||||||||
|
Principal payments
|
$
|
6,784
|
|
$
|
—
|
|
$
|
—
|
|
$
|
1,800
|
|
$
|
4,984
|
|
|||||
|
Interest payments
|
4,178
|
|
301
|
|
602
|
|
541
|
|
2,734
|
|
||||||||||
|
Capital lease obligations:
|
||||||||||||||||||||
|
Principal payments
|
142
|
|
33
|
|
35
|
|
42
|
|
32
|
|
||||||||||
|
Interest payments
|
33
|
|
6
|
|
10
|
|
10
|
|
7
|
|
||||||||||
|
Operating lease obligations
|
281
|
|
72
|
|
117
|
|
79
|
|
13
|
|
||||||||||
|
Purchase obligations:
|
||||||||||||||||||||
|
Content
|
3,375
|
|
768
|
|
771
|
|
815
|
|
1,021
|
|
||||||||||
|
Other
|
1,224
|
|
302
|
|
477
|
|
297
|
|
148
|
|
||||||||||
|
Total
|
$
|
16,017
|
|
$
|
1,482
|
|
$
|
2,012
|
|
$
|
3,584
|
|
$
|
8,939
|
|
|||||
The above table does not include certain long-term obligations as the timing or the amount of the payments cannot be predicted. For example, as of
December 31, 2015
, we have recorded
$241 million
for redeemable equity (see Note 11 to the accompanying consolidated financial statements), although we are unable to predict reasonably the ultimate amount or timing of any payment. The current portion of the liability for cash-settled equity-based compensation awards was
$5 million
as of
December 31, 2015
. Additionally, reserves for unrecognized tax benefits have been excluded from the above table because we are unable to predict reasonably the ultimate amount or timing of settlement. Our unrecognized tax benefits totaled
$173 million
as of
December 31, 2015
.
The above table also does not include DCL's revolving credit facility that, during the year ended December 31, 2015, allowed DCL and certain designated foreign subsidiaries of DCL to borrow up to
$1.5 billion
, including a
$750 million
sublimit for multi-currency borrowings, a
$100 million
sublimit for the issuance of standby letters of credit and a
$50 million
sublimit for swingline loans. Borrowing capacity under this agreement is reduced by the outstanding borrowings under the commercial paper program discussed below. DCL also had the ability to request an increase of the revolving credit facility up to an aggregate additional
$1.0 billion
, upon the satisfaction of certain conditions. As of December 31, 2015, the revolving credit facility agreement provided for a maturity date of
June 20, 2019
. In February 2016, the Company amended and restated the revolving credit facility to extend DCL's borrowing capacity up to
$2.0 billion
, to eliminate the multi-currency borrowing sublimit, to extend the maturity date to February 4, 2021 and to provide the option to request up to two additional 364-day renewal periods.
Lastly, such funding obligations include funding commitments to equity method investees.
Principal payments on long-term debt reflect the repayment of our outstanding senior notes, at face value, assuming repayment will occur upon maturity. Interest payments on our outstanding senior notes are projected based on their contractual rate and maturity.
Capital Lease Obligations
We acquire satellite transponders and other equipment through multi-year capital lease arrangements. Principal payments on capital lease obligations reflect amounts due under our capital lease agreements. Interest payments on our outstanding capital lease obligations are based on the stated or implied rate in our capital lease agreements.
Operating Lease Obligations
We obtain office space and equipment under multi-year lease arrangements. Most operating leases are not cancelable prior to their expiration. Payments for operating leases represent the amounts due under the agreements assuming the agreements are not canceled prior to their expiration.
54
Purchase Obligations
Content purchase obligations include commitments and liabilities associated with third-party producers and sports associations for content that airs on our television networks. Production contracts generally require: purchase of a specified number of episodes; payments over the term of the license; and include both programs that have been delivered and are available for airing and programs that have not yet been produced or sporting events that have not yet taken place. If the content is ultimately never produced, our commitments expire without obligation. The commitments disclosed above exclude content liabilities recognized on the consolidated balance sheet. We expect to enter into additional production contracts and content licenses to meet our future content needs.
Other purchase obligations include agreements with certain vendors and suppliers for the purchase of goods and services whereby the underlying agreements are enforceable, legally binding and specify all significant terms. Significant purchase obligations include transmission services, television rating services, marketing research, employment contracts, equipment purchases, and information technology and other services. The Company has contracts that do not require the purchase of fixed or minimum quantities and generally may be terminated with a 30-day to 60-day advance notice without penalty, and are not included in the table above past the 30-day to 60-day advance notice period. Amounts related to employment contracts include base compensation and do not include compensation contingent on future events.
Put Rights
The Company has granted put rights related to an equity method investment and certain consolidated subsidiaries. Harpo has the right to require the Company to purchase all or part of its interest in OWN for fair value during a 90-day window every
two and a half
years commencing January 1, 2016.
No
amounts have been recorded by the Company for the Harpo put right. (See Note 4 to the accompanying consolidated financial statements.) Hasbro and J:COM have the right to require the Company to purchase their remaining noncontrolling interests in Discovery Family and Discovery Japan, respectively. The Company recorded the value of the put rights for Discovery Family and Discovery Japan as a component of redeemable equity in the amounts of
$214 million
and
$26 million
, respectively. On July 22, 2015, TF1 exercised its right to put the entirety of its remaining
49%
noncontrolling interest in Eurosport to the Company for
€491 million
(
$551 million
as of the date redemption became mandatory). The transaction closed on October 1, 2015 for
$548 million
. (See Note 11 to the accompanying consolidated financial statements.)
Off-Balance Sheet Arrangements
We have no material off-balance sheet arrangements (as defined in Item 303(a)(4) of Regulation S-K) that have or are reasonably likely to have a current or future effect on our financial condition, changes in financial condition, revenues or expenses, results of operations, liquidity, capital expenditures or capital resources.
RELATED PARTY TRANSACTIONS
In the ordinary course of business we enter into transactions with related parties, primarily our equity method investees and Liberty Media and Liberty Global. Information regarding transactions and amounts with related parties is discussed in Note 19 to the accompanying consolidated financial statements included in Item 8, “Financial Statements and Supplementary Data” in this Annual Report on Form 10-K.
NEW ACCOUNTING AND REPORTING PRONOUNCEMENTS
We adopted certain accounting and reporting standards during
2015
. Information regarding our adoption of new accounting and reporting standards is discussed in Note 2 to the accompanying consolidated financial statements included in Item 8, “Financial Statements and Supplementary Data” in this Annual Report on Form 10-K.
CRITICAL ACCOUNTING POLICIES AND ESTIMATES
Our consolidated financial statements are prepared in accordance with GAAP, which requires management to make estimates, judgments and assumptions that affect the amounts reported in the consolidated financial statements included in this Annual Report on Form 10-K and accompanying notes. Management considers an accounting policy to be critical if it is important to reporting our financial condition and results of operations, and if it requires significant judgment and estimates on the part of management in its application. The development and selection of these critical accounting policies have been determined by management and the related disclosures have been reviewed with the Audit Committee of the Board of Directors of the Company. We consider policies relating to the following matters to be critical accounting policies:
|
•
|
Revenue recognition;
|
55
|
•
|
Goodwill and intangible assets;
|
|
•
|
Income taxes;
|
|
•
|
Content rights;
|
|
•
|
Equity-based compensation; and
|
|
•
|
Equity method investments.
|
With respect to our goodwill accounting policy, we clarify the following:
Goodwill is allocated to our reporting units, which are our operating segments or one level below our operating segments. Reporting units are determined by the discrete financial information available for the component and whether it is regularly reviewed by segment management. For goodwill impairment testing purposes, we aggregate certain components or reporting units based on an evaluation of the facts and circumstances, including the nature of products and services, the nature of production processes, the extent of shared assets and resources and similar financial performance. The extent of economic similarities between reporting units impacts the aggregation of these components into a reporting unit. We evaluate goodwill for impairment annually as of November 30 or earlier upon the occurrence of substantive unfavorable changes in economic conditions, industry trends, costs, cash flows, or ongoing declines in market capitalization. If we believe that as a result of our qualitative assessment it is more likely than not that the fair value of a reporting unit is greater than its carrying amount, a quantitative impairment test is not required. Prior to the aggregation of certain reporting units in 2015, our reporting units were as follows: U.S. Networks, Northern Europe, Southern Europe, CEEMEA, Eurosport, Latin America, Asia-Pacific, Education, Raw, betty, and U.S. Studios.
During 2015, we determined that our Northern Europe, Southern Europe, CEEMEA and Eurosport reporting units met the aggregation criteria and we aggregated them into one reporting unit, Europe. In the aggregation assessment, we considered various factors including the nature of the components' operations and the extent to which the components share assets. In 2015 there were significant operational and back-office integration activities with respect to recently acquired businesses such as Eurosport and SBS Nordic, as well as changes in management reporting. European components share content and uplink facilities as well as certain management personnel, and back-office support functions. Investment in research and development projects and the investment in the pan-European Olympics rights deal support the growth of all European components. Recently acquired businesses have been integrated into the European advertising and affiliate sales functions, which determine the selling strategies and revenue growth of the European businesses in the aggregate. We performed a goodwill impairment test on each reporting unit prior to aggregation. No impairments were identified.
During 2015, we determined that our production studios, Raw, betty and U.S. Studios, reporting units met the aggregation criteria and we aggregated them into one reporting unit. In 2015, the Studios businesses were realigned under a new, single management team to unify strategy. In the aggregation assessment, we considered various factors including the nature of the components' operations, the similarity of operating margins by production genre and the management structure of the components. Studios components are managed by the studios group executing a broader strategy, operate in a similar manner, and have similar products and customers. We performed a goodwill impairment test on each reporting unit prior to aggregation. No impairments were identified.
As a result of the European and Studios aggregations, we reduced the number of our reporting units from eleven to six.
For 2015, we performed qualitative assessments prior to aggregation for all but three of our reporting units. Each of these reporting units had a fair value that exceeded its respective carrying value by at least 45% as of the date of the last quantitative impairment assessment. Our qualitative assessment included, but was not limited to, consideration of the results of our most recent quantitative impairment test, macroeconomic conditions, industry and market conditions, cost factors, cash flows, changes in key personnel and our share price. Based on this assessment, we determined that it was more likely than not that the fair value of those reporting units exceeded their carrying values.
We performed a quantitative goodwill impairment assessment for our remaining three reporting units, Eurosport, Raw, and betty, which had aggregate goodwill of $763 million as of November 30, 2015. The first step of the assessment required the comparison of the fair value of a reporting unit with its carrying amount, including goodwill. In performing the first step, we determined the fair value of these reporting units by using a combination of a discounted cash flow (“DCF”) analyses and market-based valuation methodologies. Determining fair value requires the Company to make judgments about appropriate discount rates, perpetual growth rates, relevant comparable company earnings multiples and the amount and timing of expected future cash flows. The cash flows employed in the DCF analysis are based on the reporting unit's budget, long-term business plan, and recent operating performance. Discount rate assumptions are based on an assessment of the risk inherent in the future cash flows of the respective reporting unit and market conditions. In assessing the reasonableness of the determined fair values, we also evaluated the results against other value indicators, such as comparable analyst estimates and values observed in market transactions. The fair value of the reporting units exceeded the respective carrying value by 8% to 26%. The reporting unit with fair value in excess of
56
carrying value of less than 10% related to a recent acquisition, Eurosport, which was not integrated into another reporting unit prior to this quantitative assessment. Subsequent to this quantitative impairment assessment, the business was aggregated as a component of the Europe reporting unit. Significant assumptions used in the discounted cash flow analysis included discount rates that ranged from 9% to 15% and long-term growth rates that ranged from 2% to 3.5%.
Given the inherent uncertainty in determining the assumptions underlying a DCF analysis, actual results may differ from those used in our valuations.
For an in depth discussion of each of our significant accounting policies, including our critical accounting policies and further information regarding estimates and assumptions involved in their application, see Note 2 to the accompanying consolidated financial statements included in Item 8, “Financial Statements and Supplementary Data” in this Annual Report on Form 10-K.
Our financial position, earnings and cash flows are exposed to market risks and can be affected by, among other things, economic conditions, interest rate changes, foreign currency fluctuations, and changes in the market values of investments. We have established policies, procedures and internal processes governing our management of market risks and the use of financial instruments to manage our exposure to such risks.
Interest Rates
We are exposed to the impact of interest rate changes primarily through our potential borrowing activities. During the year ended December 31, 2015, we had access to a
$1.5 billion
revolving credit facility and a commercial paper program with outstanding borrowings of
$782 million
and
$93 million
, respectively, as of
December 31, 2015
. The interest rate on borrowings under the revolving credit facility is variable based on an underlying index and DCL's then-current credit rating for its publicly traded debt. In February 2016, the Company amended and restated the revolving credit facility to extend DCL's borrowing capacity to $2.0 billion, extend the maturity date to February 4, 2021 and add the ability to request up to two additional 364-day renewal periods. As of
December 31, 2015
, we had outstanding debt book balance of
$6.8 billion
under various public senior notes with fixed interest rates.
Our current objectives in managing exposure to interest rate changes are to limit the impact of interest rates on earnings and cash flows. To achieve these objectives, we may enter into variable interest rate swaps, effectively converting fixed rate borrowings to variable rate borrowings indexed to LIBOR, in order to reduce the amount of interest paid. As of
December 31, 2015
we have no outstanding interest rate swaps.
As of
December 31, 2015
, the fair value of our outstanding public senior notes was
$6.6 billion
. The fair value of our long-term debt may vary as a result of market conditions and other factors. A change in market interest rates will impact the fair market value of our fixed rate debt. The potential change in fair value of these senior notes from an adverse 100 basis-point change in quoted interest rates across all maturities, often referred to as a parallel shift in the yield curve, would be approximately
$542 million
as of
December 31, 2015
.
Foreign Currency Exchange Rates
We transact business globally and are subject to risks associated with changing foreign currency exchange rates. Market risk refers to the risk of loss arising from adverse changes in foreign currency exchange rates. The risk of loss can be assessed from the perspective of adverse changes in fair values, cash flows and future earnings. Through
December 31, 2015
, our International Networks segment is divided into the following five regions: Northern Europe, CEEMEA, Southern Europe, Latin America and Asia-Pacific. Cash is primarily managed from five global locations with net earnings reinvested locally and working capital requirements met from existing liquid funds. To the extent such funds are not sufficient to meet working capital requirements, draw downs in the appropriate local currency are available from intercompany borrowings or drawdowns from our revolving credit facility. The earnings of certain international operations are expected to be reinvested in those businesses indefinitely. Consequently, we do not hedge our investment in the net assets of those foreign operations.
The functional currency of most of our international subsidiaries is the local currency. We are exposed to foreign currency risk to the extent that we enter into transactions denominated in currencies other than our subsidiaries’ respective functional currencies ("non-functional currency risk"). Such transactions include affiliate and ad sales arrangements, content arrangements, equipment and other vendor purchases and intercompany transactions. Changes in exchange rates with respect to amounts recorded in our consolidated balance sheets related to these items will result in unrealized foreign currency transaction gains and losses based upon period-end exchange rates. We also record realized foreign currency transaction gains and losses upon settlement of the
57
transactions. Moreover, we will experience fluctuations in our revenues, costs and expenses solely as a result of changes in foreign currency exchange rates.
We also are exposed to unfavorable and potentially volatile fluctuations of the U.S. dollar, which is our reporting currency, against the currencies of our operating subsidiaries when their respective financial statements are translated into U.S. dollars for inclusion in our consolidated financial statements. Cumulative translation adjustments are recorded in accumulated other comprehensive (loss) income as a separate component of equity. Any increase or decrease in the value of the U.S. dollar against any foreign functional currency of one of our operating subsidiaries will cause us to experience unrealized foreign currency translation gains (losses) with respect to amounts already invested in such foreign currencies. Accordingly, we may experience a negative impact on our net income, other comprehensive income and equity with respect to our holdings solely as a result of changes in foreign currency.
We have operations in Venezuela and, as a result, hold monetary assets denominated in Venezuelan bolivars ("BsF"). Companies operating in Venezuela are required to obtain Venezuelan government approval to exchange BsF into U.S. dollars, and our ability to repatriate cash generated in Venezuela at the official exchange rate is uncertain. In 2014 we applied a devalued exchange rate of 10.7 BsF per U.S. dollar, as established by an alternative currency exchange mechanism known as Sistema Complementario de Administracion de Divisas ("SICAD I"), in remeasuring BsF denominated monetary assets. As of December 31, 2014, we held approximately
$30 million
in BsF denominated monetary assets, principally in cash and accounts receivable. In February 2015, the Venezuelan government created a new open market foreign exchange system, referred to as "SIMADI" which
allowed for trading bolivars at prices set by the market
and merged SICAD I with SICAD II (the “SICAD” exchange mechanism).
Beginning April 1, 2015,
we applied a devalued SICAD exchange rate
to remeasure revenue and monetary asset balances. Based upon facts and circumstances, the devalued SICAD rate was the most probable settlement rate for our transactions. As of
December 31, 2015
, the Company no longer believes it can successfully convert
BsF
at the devalued SICAD rate and remeasured BsF denominated monetary assets at the SIMADI exchange rate. The SIMADI rate on December 31, 2015 was 199.5 BsF per U.S. dollar. The changes in the BsF exchange rate used by the Company resulted in a foreign currency remeasurement loss of
$40 million
for BsF denominated monetary assets during the year ended
December 31, 2015
; BsF
denominated assets total
$3 million
as of December 31, 2015.
In addition to the Venezuelan bolivar, the Company has foreign currency exposure related to other currencies such as the Euro, the British pound, currencies in the Nordics, the Brazilian real, the Japanese yen and the Russian ruble. We may enter into spot, forward and option contracts that change in value as foreign currency exchange rates change to hedge certain exposures associated with affiliate revenue, the cost for producing or acquiring content, certain intercompany transactions or in connection with forecasted business combinations. These contracts hedge forecasted foreign currency transactions in order to mitigate fluctuations in our earnings and cash flows associated with changes in foreign currency exchange rates. Our objective in managing exposure to foreign currency fluctuations is to reduce volatility of earnings and cash flows. The net market value of our foreign currency derivative instruments held at
December 31, 2015
was an asset value of
$19 million
. Most of our non-functional currency risks related to our revenue, operating expenses and capital expenditures that were not hedged as of
December 31, 2015
. We generally do not hedge against the risk that we may incur non-cash losses upon the translation of the financial statements of our subsidiaries and affiliates into U.S. dollars.
Derivatives
We may use derivative financial instruments to modify our exposure to market risks from changes in interest rates, foreign currency exchange rates and the fair value of investments classified as available-for-sale securities. We do not use derivative financial instruments unless there is an underlying exposure. While derivatives are used to mitigate cash flow risk and the risk of declines in fair value, they also limit potential economic benefits to our business in the event of positive shifts in foreign currency exchange rates, interest rates and market values. We do not hold or enter into financial instruments for speculative trading purposes.
Market Values of Investments
In addition to derivatives, we had investments in entities accounted for using the equity method, available-for-sale securities and other highly liquid instruments, such as mutual funds, that are accounted for at fair value. The carrying values of investments in equity method investees, available-for-sale securities and mutual funds were
$567 million
,
$162 million
and
$149 million
, respectively, at
December 31, 2015
. Investments in mutual funds include both fixed rate and floating rate interest earning securities that carry a degree of interest rate risk. Fixed rate securities may have their fair market value adversely impacted due to a rise in interest rates, while floating rate securities may produce less income than predicted if interest rates fall. Due in part to these factors, our income from such investments may decrease in the future.
58
INDEX TO CONSOLIDATED FINANCIAL STATEMENTS AND SUPPLEMENTARY DATA
|
|
Page
|
|
Consolidated Financial Statements of Discovery Communications, Inc.:
|
|
|
Consolidated Balance Sheets as of December 31, 2015 and 2014.
|
|
|
Consolidated Statements of Operations for the Years Ended December 31, 2015, 2014 and 2013.
|
|
|
Consolidated Statements of Comprehensive Income for the Years Ended December 31, 2015, 2014 and 2013.
|
|
|
Consolidated Statements of Cash Flows for the Years Ended December 31, 2015, 2014 and 2013.
|
|
|
Consolidated Statements of Equity for the Years Ended December 31, 2015, 2014 and 2013.
|
|
59
MANAGEMENT’S REPORT ON INTERNAL CONTROL OVER FINANCIAL REPORTING
Management of Discovery Communications, Inc. (the “Company”) is responsible for establishing and maintaining adequate internal control over financial reporting, as such term is defined in Rule 13a-15(f) and Rule 15d-15(f) of the Securities Exchange Act of 1934, as amended. The Company’s internal control over financial reporting includes those policies and procedures that (i) pertain to the maintenance of records that, in reasonable detail, accurately and fairly reflect the transactions and disposition of the assets of the Company; (ii) provide reasonable assurance that transactions are recorded as necessary to permit preparation of financial statements in accordance with generally accepted accounting principles, and provide reasonable assurance that receipts and expenditures of the Company are being made only in accordance with authorizations of management and the directors of the Company; and (iii) provide reasonable assurance regarding prevention or timely detection of unauthorized acquisition, use, or disposition of the Company’s assets that could have a material effect on the consolidated financial statements.
Internal control over financial reporting is designed to provide reasonable assurance regarding the reliability of financial reporting and the preparation of financial statements prepared for external purposes in accordance with generally accepted accounting principles. Because of the inherent limitations in any internal control, no matter how well designed, internal control over financial reporting may not prevent or detect misstatements. Also, projections of any evaluation of effectiveness to future periods are subject to the risk that controls may become inadequate because of changes in conditions, or that the degree of compliance with the policies or procedures may deteriorate.
The Company’s management, with the participation of its Chief Executive Officer and Chief Financial Officer, conducted an evaluation of the effectiveness of the Company’s system of internal control over financial reporting as of
December 31, 2015
based on the framework set forth in
Internal Control – Integrated Framework (2013)
issued by the Committee of Sponsoring Organizations of the Treadway Commission. Based on its evaluation, management concluded that, as of
December 31, 2015
, the Company’s internal control over financial reporting was effective at a reasonable assurance level based on the specified criteria.
The effectiveness of the Company’s internal control over financial reporting as of
December 31, 2015
has been audited by PricewaterhouseCoopers LLP, an independent registered public accounting firm, as stated in their report in Item 8 of Part II of this Annual Report on Form 10-K under the caption “Report of Independent Registered Public Accounting Firm.”
60
REPORT OF INDEPENDENT REGISTERED PUBLIC ACCOUNTING FIRM
To the Board of Directors and
Stockholders of Discovery Communications, Inc.:
In our opinion, the accompanying consolidated balance sheets and the related consolidated statements of operations, of comprehensive income, of equity and of cash flows present fairly, in all material respects, the financial position of Discovery Communications, Inc. and its subsidiaries at
December 31, 2015
and
2014
, and the results of their operations and their cash flows for each of the three years in the period ended
December 31, 2015
, in conformity with accounting principles generally accepted in the United States of America. Also in our opinion, the Company maintained, in all material respects, effective internal control over financial reporting as of
December 31, 2015
, based on criteria established in
Internal Control - Integrated Framework (2013)
issued by the Committee of Sponsoring Organizations of the Treadway Commission (COSO). The Company's management is responsible for these financial statements, for maintaining effective internal control over financial reporting and for its assessment of the effectiveness of internal control over financial reporting, included in the accompanying Management's Report on Internal Control over Financial Reporting. Our responsibility is to express opinions on these financial statements and on the Company's internal control over financial reporting based on our integrated audits. We conducted our audits in accordance with the standards of the Public Company Accounting Oversight Board (United States). Those standards require that we plan and perform the audits to obtain reasonable assurance about whether the financial statements are free of material misstatement and whether effective internal control over financial reporting was maintained in all material respects. Our audits of the financial statements included examining, on a test basis, evidence supporting the amounts and disclosures in the financial statements, assessing the accounting principles used and significant estimates made by management, and evaluating the overall financial statement presentation. Our audit of internal control over financial reporting included obtaining an understanding of internal control over financial reporting, assessing the risk that a material weakness exists, and testing and evaluating the design and operating effectiveness of internal control based on the assessed risk. Our audits also included performing such other procedures as we considered necessary in the circumstances. We believe that our audits provide a reasonable basis for our opinions.
A company’s internal control over financial reporting is a process designed to provide reasonable assurance regarding the reliability of financial reporting and the preparation of financial statements for external purposes in accordance with generally accepted accounting principles. A company’s internal control over financial reporting includes those policies and procedures that (i) pertain to the maintenance of records that, in reasonable detail, accurately and fairly reflect the transactions and dispositions of the assets of the company; (ii) provide reasonable assurance that transactions are recorded as necessary to permit preparation of financial statements in accordance with generally accepted accounting principles, and that receipts and expenditures of the company are being made only in accordance with authorizations of management and directors of the company; and (iii) provide reasonable assurance regarding prevention or timely detection of unauthorized acquisition, use, or disposition of the company’s assets that could have a material effect on the financial statements.
Because of its inherent limitations, internal control over financial reporting may not prevent or detect misstatements. Also, projections of any evaluation of effectiveness to future periods are subject to the risk that controls may become inadequate because of changes in conditions, or that the degree of compliance with the policies or procedures may deteriorate.
/s/ PricewaterhouseCoopers LLP
McLean, Virginia
February 18, 2016
61
DISCOVERY COMMUNICATIONS, INC.
(in millions, except par value)
|
|
December 31,
|
|||||||
|
|
2015
|
2014
|
||||||
|
ASSETS
|
||||||||
|
Current assets:
|
||||||||
|
Cash and cash equivalents
|
$
|
390
|
|
$
|
367
|
|
||
|
Receivables, net
|
1,479
|
|
1,433
|
|
||||
|
Content rights, net
|
313
|
|
329
|
|
||||
|
Deferred income taxes
|
68
|
|
87
|
|
||||
|
Prepaid expenses and other current assets
|
346
|
|
275
|
|
||||
|
Total current assets
|
2,596
|
|
2,491
|
|
||||
|
Noncurrent content rights, net
|
2,030
|
|
1,973
|
|
||||
|
Property and equipment, net
|
488
|
|
554
|
|
||||
|
Goodwill
|
8,164
|
|
8,236
|
|
||||
|
Intangible assets, net
|
1,730
|
|
1,971
|
|
||||
|
Equity method investments
|
567
|
|
644
|
|
||||
|
Other noncurrent assets
|
289
|
|
101
|
|
||||
|
Total assets
|
$
|
15,864
|
|
$
|
15,970
|
|
||
|
LIABILITIES AND EQUITY
|
||||||||
|
Current liabilities:
|
||||||||
|
Accounts payable
|
$
|
282
|
|
$
|
225
|
|
||
|
Accrued liabilities
|
988
|
|
1,094
|
|
||||
|
Deferred revenues
|
190
|
|
178
|
|
||||
|
Current portion of debt
|
119
|
|
1,107
|
|
||||
|
Total current liabilities
|
1,579
|
|
2,604
|
|
||||
|
Noncurrent portion of debt
|
7,616
|
|
6,002
|
|
||||
|
Deferred income taxes
|
556
|
|
588
|
|
||||
|
Other noncurrent liabilities
|
421
|
|
425
|
|
||||
|
Total liabilities
|
10,172
|
|
9,619
|
|
||||
|
Commitments and contingencies (See Note 20.)
|
|
|
||||||
|
Redeemable noncontrolling interests
|
241
|
|
747
|
|
||||
|
Equity:
|
||||||||
|
Discovery Communications, Inc. stockholders’ equity:
|
||||||||
|
Series A convertible preferred stock: $0.01 par value; 75 shares authorized; 71 shares issued
|
1
|
|
1
|
|
||||
|
Series C convertible preferred stock: $0.01 par value; 75 shares authorized; 38 and 42 shares issued
|
1
|
|
1
|
|
||||
|
Series A common stock: $0.01 par value; 1,700 shares authorized; 153 and 151 shares issued
|
1
|
|
1
|
|
||||
|
Series B convertible common stock: $0.01 par value; 100 shares authorized; 7 shares issued
|
—
|
|
—
|
|
||||
|
Series C common stock: $0.01 par value; 2,000 shares authorized; 376 and 375 shares issued
|
4
|
|
4
|
|
||||
|
Additional paid-in capital
|
7,021
|
|
6,917
|
|
||||
|
Treasury stock, at cost
|
(5,461
|
)
|
(4,763
|
)
|
||||
|
Retained earnings
|
4,517
|
|
3,809
|
|
||||
|
Accumulated other comprehensive loss
|
(633
|
)
|
(368
|
)
|
||||
|
Total Discovery Communications, Inc. stockholders’ equity
|
5,451
|
|
5,602
|
|
||||
|
Noncontrolling interests
|
—
|
|
2
|
|
||||
|
Total equity
|
5,451
|
|
5,604
|
|
||||
|
Total liabilities and equity
|
$
|
15,864
|
|
$
|
15,970
|
|
||
The accompanying notes are an integral part of these consolidated financial statements.
62
DISCOVERY COMMUNICATIONS, INC.
(in millions, except per share amounts)
|
|
Year Ended December 31,
|
|||||||||||
|
|
2015
|
2014
|
2013
|
|||||||||
|
Revenues:
|
||||||||||||
|
Distribution
|
$
|
3,068
|
|
$
|
2,842
|
|
$
|
2,536
|
|
|||
|
Advertising
|
3,004
|
|
3,089
|
|
2,739
|
|
||||||
|
Other
|
322
|
|
334
|
|
260
|
|
||||||
|
Total revenues
|
6,394
|
|
6,265
|
|
5,535
|
|
||||||
|
Costs and expenses:
|
||||||||||||
|
Costs of revenues, excluding depreciation and amortization
|
2,343
|
|
2,124
|
|
1,689
|
|
||||||
|
Selling, general and administrative
|
1,669
|
|
1,692
|
|
1,598
|
|
||||||
|
Depreciation and amortization
|
330
|
|
329
|
|
276
|
|
||||||
|
Restructuring and other charges
|
50
|
|
90
|
|
16
|
|
||||||
|
Loss (gain) on disposition
|
17
|
|
(31
|
)
|
(19
|
)
|
||||||
|
Total costs and expenses
|
4,409
|
|
4,204
|
|
3,560
|
|
||||||
|
Operating income
|
1,985
|
|
2,061
|
|
1,975
|
|
||||||
|
Interest expense
|
(330
|
)
|
(328
|
)
|
(306
|
)
|
||||||
|
Income from equity investees, net
|
1
|
|
23
|
|
18
|
|
||||||
|
Other (expense) income, net
|
(97
|
)
|
(9
|
)
|
49
|
|
||||||
|
Income before income taxes
|
1,559
|
|
1,747
|
|
1,736
|
|
||||||
|
Income taxes
|
(511
|
)
|
(610
|
)
|
(659
|
)
|
||||||
|
Net income
|
1,048
|
|
1,137
|
|
1,077
|
|
||||||
|
Net income attributable to noncontrolling interests
|
(1
|
)
|
(2
|
)
|
(1
|
)
|
||||||
|
Net (income) loss attributable to redeemable noncontrolling interests
|
(13
|
)
|
4
|
|
(1
|
)
|
||||||
|
Net income available to Discovery Communications, Inc.
|
$
|
1,034
|
|
$
|
1,139
|
|
$
|
1,075
|
|
|||
|
Net income per share available to Discovery Communications, Inc. Series A, B and C common stockholders:
|
||||||||||||
|
Basic
|
$
|
1.59
|
|
$
|
1.67
|
|
$
|
1.50
|
|
|||
|
Diluted
|
$
|
1.58
|
|
$
|
1.66
|
|
$
|
1.49
|
|
|||
|
Weighted average shares outstanding:
|
||||||||||||
|
Basic
|
432
|
|
454
|
|
484
|
|
||||||
|
Diluted
|
656
|
|
687
|
|
722
|
|
||||||
The accompanying notes are an integral part of these consolidated financial statements.
63
DISCOVERY COMMUNICATIONS, INC.
CONSOLIDATED STATEMENTS OF COMPREHENSIVE INCOME
(in millions)
|
Year Ended December 31,
|
||||||||||||
|
2015
|
2014
|
2013
|
||||||||||
|
Net income
|
$
|
1,048
|
|
$
|
1,137
|
|
$
|
1,077
|
|
|||
|
Other comprehensive (loss) income, net of tax:
|
||||||||||||
|
Currency translation adjustments
|
(201
|
)
|
(399
|
)
|
(11
|
)
|
||||||
|
Market value adjustments
|
(25
|
)
|
(2
|
)
|
2
|
|
||||||
|
Derivative adjustments
|
(1
|
)
|
(11
|
)
|
6
|
|
||||||
|
Comprehensive income
|
821
|
|
725
|
|
1,074
|
|
||||||
|
Comprehensive income attributable to noncontrolling interests
|
(1
|
)
|
(2
|
)
|
(1
|
)
|
||||||
|
Comprehensive loss attributable to redeemable noncontrolling interests
|
10
|
|
44
|
|
2
|
|
||||||
|
Comprehensive income attributable to Discovery Communications, Inc.
|
$
|
830
|
|
$
|
767
|
|
$
|
1,075
|
|
|||
The accompanying notes are an integral part of these consolidated financial statements.
64
DISCOVERY COMMUNICATIONS, INC.
(in millions)
|
|
Year Ended December 31,
|
|||||||||||
|
|
2015
|
2014
|
2013
|
|||||||||
|
Operating Activities
|
||||||||||||
|
Net income
|
$
|
1,048
|
|
$
|
1,137
|
|
$
|
1,077
|
|
|||
|
Adjustments to reconcile net income to cash provided by operating activities:
|
||||||||||||
|
Equity-based compensation expense
|
35
|
|
78
|
|
190
|
|
||||||
|
Depreciation and amortization
|
330
|
|
329
|
|
276
|
|
||||||
|
Content amortization and impairment expense
|
1,709
|
|
1,557
|
|
1,190
|
|
||||||
|
Loss (gain) on disposition
|
17
|
|
(31
|
)
|
(19
|
)
|
||||||
|
Remeasurement gain on previously held equity interests
|
(2
|
)
|
(29
|
)
|
(92
|
)
|
||||||
|
Equity in earnings of investee companies, net of cash distributions
|
8
|
|
(1
|
)
|
(4
|
)
|
||||||
|
Deferred income taxes
|
2
|
|
(181
|
)
|
83
|
|
||||||
|
Realized loss from derivative instruments
|
5
|
|
—
|
|
55
|
|
||||||
|
Other, net
|
30
|
|
44
|
|
50
|
|
||||||
|
Changes in operating assets and liabilities, net of business combinations:
|
||||||||||||
|
Receivables, net
|
(44
|
)
|
6
|
|
(120
|
)
|
||||||
|
Content rights, net
|
(1,773
|
)
|
(1,683
|
)
|
(1,426
|
)
|
||||||
|
Accounts payable and accrued liabilities
|
11
|
|
138
|
|
106
|
|
||||||
|
Equity-based compensation liabilities
|
(25
|
)
|
(81
|
)
|
(64
|
)
|
||||||
|
Income taxes receivable and prepaid income taxes
|
(64
|
)
|
40
|
|
(5
|
)
|
||||||
|
Other, net
|
(10
|
)
|
(5
|
)
|
(12
|
)
|
||||||
|
Cash provided by operating activities
|
1,277
|
|
1,318
|
|
1,285
|
|
||||||
|
Investing Activities
|
||||||||||||
|
Purchases of property and equipment
|
(103
|
)
|
(120
|
)
|
(115
|
)
|
||||||
|
Business acquisitions, net of cash acquired
|
(80
|
)
|
(372
|
)
|
(1,861
|
)
|
||||||
|
Payments for derivative instruments, net
|
(9
|
)
|
—
|
|
(55
|
)
|
||||||
|
Proceeds from dispositions, net of cash disposed
|
61
|
|
45
|
|
28
|
|
||||||
|
Distributions from equity method investees
|
87
|
|
61
|
|
47
|
|
||||||
|
Investments in equity method investees, net
|
(61
|
)
|
(177
|
)
|
(28
|
)
|
||||||
|
Investments in available-for-sale and cost method investments
|
(211
|
)
|
(3
|
)
|
—
|
|
||||||
|
Other investing activities, net
|
15
|
|
(2
|
)
|
(3
|
)
|
||||||
|
Cash used in investing activities
|
(301
|
)
|
(568
|
)
|
(1,987
|
)
|
||||||
|
Financing Activities
|
||||||||||||
|
Commercial paper (repayments) borrowings, net
|
(136
|
)
|
229
|
|
—
|
|
||||||
|
Borrowings under revolving credit facility
|
1,016
|
|
698
|
|
—
|
|
||||||
|
Principal repayments of revolving credit facility
|
(265
|
)
|
(660
|
)
|
—
|
|
||||||
|
Borrowings from debt, net of discount
|
936
|
|
415
|
|
1,198
|
|
||||||
|
Principal repayments of debt
|
(849
|
)
|
—
|
|
—
|
|
||||||
|
Principal repayments of capital lease obligations
|
(27
|
)
|
(19
|
)
|
(32
|
)
|
||||||
|
Repurchases of stock
|
(951
|
)
|
(1,422
|
)
|
(1,305
|
)
|
||||||
|
Purchase of redeemable noncontrolling interests
|
(548
|
)
|
(1
|
)
|
—
|
|
||||||
|
Payments to redeemable noncontrolling interests
|
(42
|
)
|
(2
|
)
|
—
|
|
||||||
|
Equity-based plan proceeds, net
|
6
|
|
44
|
|
73
|
|
||||||
|
Hedge of borrowings from debt instruments
|
(29
|
)
|
—
|
|
—
|
|
||||||
|
Other financing activities, net
|
(13
|
)
|
(16
|
)
|
(19
|
)
|
||||||
|
Cash used in financing activities
|
(902
|
)
|
(734
|
)
|
(85
|
)
|
||||||
|
Effect of exchange rate changes on cash and cash equivalents
|
(51
|
)
|
(57
|
)
|
(6
|
)
|
||||||
|
Net change in cash and cash equivalents
|
23
|
|
(41
|
)
|
(793
|
)
|
||||||
|
Cash and cash equivalents, beginning of period
|
367
|
|
408
|
|
1,201
|
|
||||||
|
Cash and cash equivalents, end of period
|
$
|
390
|
|
$
|
367
|
|
$
|
408
|
|
|||
The accompanying notes are an integral part of these consolidated financial statements.
65
DISCOVERY COMMUNICATIONS, INC.
CONSOLIDATED STATEMENTS OF EQUITY
(in millions)
|
Preferred Stock
|
Common Stock
|
Additional
Paid-In Capital |
Treasury
Stock |
Retained
Earnings |
Accumulated
Other Comprehensive (Loss) / Income |
Discovery
Communications, Inc. Stockholders’ Equity |
Noncontrolling
Interests |
Total
Equity |
||||||||||||||||||||||||||||||||||
|
Shares
|
Par Value
|
Shares
|
Par Value
|
|||||||||||||||||||||||||||||||||||||||
|
December 31, 2012
|
120
|
|
$
|
2
|
|
304
|
|
$
|
3
|
|
$
|
6,689
|
|
$
|
(2,482
|
)
|
$
|
2,075
|
|
$
|
4
|
|
$
|
6,291
|
|
$
|
2
|
|
$
|
6,293
|
|
|||||||||||
|
Net income available to Discovery Communications, Inc. and attributable to noncontrolling interests
|
—
|
|
—
|
|
—
|
|
—
|
|
—
|
|
—
|
|
1,075
|
|
—
|
|
1,075
|
|
1
|
|
1,076
|
|
||||||||||||||||||||
|
Repurchases of stock
|
(4
|
)
|
—
|
|
—
|
|
—
|
|
—
|
|
(1,049
|
)
|
(256
|
)
|
—
|
|
(1,305
|
)
|
—
|
|
(1,305
|
)
|
||||||||||||||||||||
|
Equity-based compensation
|
—
|
|
—
|
|
—
|
|
—
|
|
67
|
|
—
|
|
—
|
|
—
|
|
67
|
|
—
|
|
67
|
|
||||||||||||||||||||
|
Excess tax benefits from equity-based compensation
|
—
|
|
—
|
|
—
|
|
—
|
|
44
|
|
—
|
|
—
|
|
—
|
|
44
|
|
—
|
|
44
|
|
||||||||||||||||||||
|
Tax settlements associated with equity-based compensation
|
—
|
|
—
|
|
—
|
|
—
|
|
(22
|
)
|
—
|
|
—
|
|
—
|
|
(22
|
)
|
—
|
|
(22
|
)
|
||||||||||||||||||||
|
Issuance of common stock in connection with equity-based plans
|
—
|
|
—
|
|
3
|
|
—
|
|
51
|
|
—
|
|
—
|
|
—
|
|
51
|
|
—
|
|
51
|
|
||||||||||||||||||||
|
Other adjustments for equity-based plans
|
—
|
|
—
|
|
—
|
|
—
|
|
(3
|
)
|
—
|
|
—
|
|
—
|
|
(3
|
)
|
—
|
|
(3
|
)
|
||||||||||||||||||||
|
Redeemable noncontrolling interest adjustments to redemption value
|
—
|
|
—
|
|
—
|
|
—
|
|
—
|
|
—
|
|
(2
|
)
|
—
|
|
(2
|
)
|
—
|
|
(2
|
)
|
||||||||||||||||||||
|
Cash distributions to noncontrolling interest
|
—
|
|
—
|
|
—
|
|
—
|
|
—
|
|
—
|
|
—
|
|
—
|
|
—
|
|
(2
|
)
|
(2
|
)
|
||||||||||||||||||||
|
Share conversion
|
(1
|
)
|
—
|
|
1
|
|
—
|
|
—
|
|
—
|
|
—
|
|
—
|
|
—
|
|
—
|
|
—
|
|
||||||||||||||||||||
|
December 31, 2013
|
115
|
|
2
|
|
308
|
|
3
|
|
6,826
|
|
(3,531
|
)
|
2,892
|
|
4
|
|
6,196
|
|
1
|
|
6,197
|
|
||||||||||||||||||||
|
Net income available to Discovery Communications, Inc. and attributable to noncontrolling interests
|
—
|
|
—
|
|
—
|
|
—
|
|
—
|
|
—
|
|
1,139
|
|
—
|
|
1,139
|
|
2
|
|
1,141
|
|
||||||||||||||||||||
|
Other comprehensive loss
|
—
|
|
—
|
|
—
|
|
—
|
|
—
|
|
—
|
|
—
|
|
(372
|
)
|
(372
|
)
|
—
|
|
(372
|
)
|
||||||||||||||||||||
|
Repurchases of stock
|
(2
|
)
|
—
|
|
—
|
|
—
|
|
—
|
|
(1,232
|
)
|
(190
|
)
|
—
|
|
(1,422
|
)
|
—
|
|
(1,422
|
)
|
||||||||||||||||||||
|
Stock split effected in the form of a share dividend
|
—
|
|
—
|
|
224
|
|
2
|
|
(2
|
)
|
—
|
|
—
|
|
—
|
|
—
|
|
—
|
|
—
|
|
||||||||||||||||||||
|
Equity-based compensation
|
—
|
|
—
|
|
—
|
|
—
|
|
50
|
|
—
|
|
—
|
|
—
|
|
50
|
|
—
|
|
50
|
|
||||||||||||||||||||
|
Excess tax benefits from equity-based compensation
|
—
|
|
—
|
|
—
|
|
—
|
|
30
|
|
—
|
|
—
|
|
—
|
|
30
|
|
—
|
|
30
|
|
||||||||||||||||||||
|
Tax settlements associated with equity-based compensation
|
—
|
|
—
|
|
—
|
|
—
|
|
(27
|
)
|
—
|
|
—
|
|
—
|
|
(27
|
)
|
—
|
|
(27
|
)
|
||||||||||||||||||||
|
Issuance of common stock in connection with equity-based plans
|
—
|
|
—
|
|
1
|
|
—
|
|
41
|
|
—
|
|
—
|
|
—
|
|
41
|
|
—
|
|
41
|
|
||||||||||||||||||||
|
Other adjustments for equity-based plans
|
—
|
|
—
|
|
—
|
|
—
|
|
(6
|
)
|
—
|
|
—
|
|
—
|
|
(6
|
)
|
—
|
|
(6
|
)
|
||||||||||||||||||||
|
Redeemable noncontrolling interest adjustments to redemption value
|
—
|
|
—
|
|
—
|
|
—
|
|
—
|
|
—
|
|
(31
|
)
|
—
|
|
(31
|
)
|
—
|
|
(31
|
)
|
||||||||||||||||||||
|
Purchase of redeemable noncontrolling interest
|
—
|
|
—
|
|
—
|
|
—
|
|
5
|
|
—
|
|
—
|
|
—
|
|
5
|
|
—
|
|
5
|
|
||||||||||||||||||||
|
Cash distributions to noncontrolling interests
|
—
|
|
—
|
|
—
|
|
—
|
|
—
|
|
—
|
|
—
|
|
—
|
|
—
|
|
(1
|
)
|
(1
|
)
|
||||||||||||||||||||
|
Other adjustments to stockholders' equity
|
—
|
|
—
|
|
—
|
|
—
|
|
—
|
|
—
|
|
(1
|
)
|
—
|
|
(1
|
)
|
—
|
|
(1
|
)
|
||||||||||||||||||||
|
December 31, 2014
|
113
|
|
2
|
|
533
|
|
5
|
|
6,917
|
|
(4,763
|
)
|
3,809
|
|
(368
|
)
|
5,602
|
|
2
|
|
5,604
|
|
||||||||||||||||||||
|
Net income available to Discovery Communications, Inc. and attributable to noncontrolling interests
|
—
|
|
—
|
|
—
|
|
—
|
|
—
|
|
—
|
|
1,034
|
|
—
|
|
1,034
|
|
1
|
|
1,035
|
|
||||||||||||||||||||
|
Other comprehensive loss
|
—
|
|
—
|
|
—
|
|
—
|
|
—
|
|
—
|
|
—
|
|
(204
|
)
|
(204
|
)
|
—
|
|
(204
|
)
|
||||||||||||||||||||
|
Repurchases of stock
|
(4
|
)
|
—
|
|
—
|
|
—
|
|
—
|
|
(698
|
)
|
(253
|
)
|
—
|
|
(951
|
)
|
—
|
|
(951
|
)
|
||||||||||||||||||||
|
Equity-based compensation
|
—
|
|
—
|
|
—
|
|
—
|
|
39
|
|
—
|
|
—
|
|
—
|
|
39
|
|
—
|
|
39
|
|
||||||||||||||||||||
|
Excess tax benefits from equity-based compensation
|
—
|
|
—
|
|
—
|
|
—
|
|
12
|
|
—
|
|
—
|
|
—
|
|
12
|
|
—
|
|
12
|
|
||||||||||||||||||||
|
Tax settlements associated with equity-based compensation
|
—
|
|
—
|
|
—
|
|
—
|
|
(27
|
)
|
—
|
|
—
|
|
—
|
|
(27
|
)
|
—
|
|
(27
|
)
|
||||||||||||||||||||
|
Issuance of common stock in connection with equity-based plans
|
—
|
|
—
|
|
3
|
|
—
|
|
21
|
|
—
|
|
—
|
|
—
|
|
21
|
|
—
|
|
21
|
|
||||||||||||||||||||
|
Other adjustments for equity-based plans
|
—
|
|
—
|
|
—
|
|
—
|
|
(2
|
)
|
—
|
|
—
|
|
—
|
|
(2
|
)
|
—
|
|
(2
|
)
|
||||||||||||||||||||
|
Redeemable noncontrolling interest adjustments to redemption value
|
—
|
|
—
|
|
—
|
|
—
|
|
—
|
|
—
|
|
(73
|
)
|
—
|
|
(73
|
)
|
—
|
|
(73
|
)
|
||||||||||||||||||||
|
Purchase of redeemable noncontrolling interest
|
—
|
|
—
|
|
—
|
|
—
|
|
61
|
|
—
|
|
—
|
|
(61
|
)
|
—
|
|
—
|
|
—
|
|
||||||||||||||||||||
|
Other adjustments to stockholders' equity
|
—
|
|
—
|
|
—
|
|
—
|
|
—
|
|
—
|
|
—
|
|
—
|
|
—
|
|
(3
|
)
|
(3
|
)
|
||||||||||||||||||||
|
December 31, 2015
|
109
|
|
$
|
2
|
|
536
|
|
$
|
5
|
|
$
|
7,021
|
|
$
|
(5,461
|
)
|
$
|
4,517
|
|
$
|
(633
|
)
|
$
|
5,451
|
|
$
|
—
|
|
$
|
5,451
|
|
|||||||||||
The accompanying notes are an integral part of these consolidated financial statements.
66
DISCOVERY COMMUNICATIONS, INC.
NOTES TO CONSOLIDATED FINANCIAL STATEMENTS
Description of Business
Discovery Communications, Inc. (“Discovery” or the “Company”) is a global media company that provides content across multiple distribution platforms, including pay-TV, free-to-air and broadcast television, websites, digital distribution arrangements and content licensing agreements. The Company also develops and sells curriculum-based education products and services and operates production studios. The Company classifies its operations in
two
reportable segments: U.S. Networks, consisting principally of domestic television networks and websites, and International Networks, consisting principally of international television networks and websites; and
two
combined operating segments referred to as Education and Other, consisting principally of curriculum-based product and service offerings and production studios. Financial information for Discovery’s reportable segments is discussed in Note 21.
Basis of Presentation
The consolidated financial statements include the accounts of Discovery and its majority-owned subsidiaries in which a controlling interest is maintained. For each non-wholly owned subsidiary, the Company evaluates its ownership and other interests to determine whether it should consolidate the entity or account for its ownership interest as an investment. As part of its evaluation, the Company makes judgments in determining whether the entity is a variable interest entity ("VIE") and, if so, whether it is the primary beneficiary of the VIE and is thus required to consolidate the entity. (See Note 4.) Inter-company accounts and transactions between consolidated entities have been eliminated in consolidation.
Accounting and Reporting Pronouncements Adopted
Accounting for Fees Paid in a Cloud Computing Arrangement
In April 2015, the Financial Accounting Standards Board ("FASB") issued explicit guidance on the recognition of fees paid by a customer for cloud computing arrangements as either the acquisition of a software license or a service contract. The Company adopted this guidance effective October 1, 2015, and there was no material effect on the consolidated financial statements.
Presentation of Debt Issuance Costs
In April 2015, the FASB issued guidance requiring all debt issuance costs to be presented in the balance sheet as a direct deduction from the carrying value of the debt instead of being presented as an asset on the balance sheet. The Company retrospectively adopted the new guidance effective April 1, 2015 and reclassified its unamortized debt issuance costs related to the Company's debt from other noncurrent assets to noncurrent portion of debt on the consolidated balance sheets for all periods presented. The balance of unamortized debt issuance costs reclassified as of
December 31, 2014
was
$44 million
. (See Note 9.)
Reporting Discontinued Operations
In April 2014, the FASB issued guidance that changes the criteria for reporting discontinued operations and requires additional disclosures about discontinued operations and disposals of components of an entity that do not qualify for discontinued operations reporting. Under the new pronouncement, disposal of a component of an entity representing a strategic shift with a major effect on its operations and financial results is a discontinued operation. The Company adopted the new guidance on July 1, 2014.
The component of an entity that has been disposed or meets the criteria to be classified as held for sale and is presented as a discontinued operation must represent a strategic shift that has or will have a major effect on the Company's operations and financial results. The results of operations of a component classified as discontinued operations, as well as any gain or loss on the disposal transaction, are aggregated for presentation apart from continuing operating results of the Company in the consolidated statements of operations for all periods presented. If a discontinued operation is classified as held for sale, the assets and liabilities of the discontinued operation will be presented separately in the statement of financial position for all periods presented. Cash flows from discontinued operations are combined with continuing operations on the consolidated statements of cash flow.
Presentation of Unrecognized Tax Benefits
In July 2013, the FASB issued guidance stating that a liability related to an unrecognized tax benefit should be presented as a reduction to a deferred tax asset for a net operating loss carryforward, a similar tax loss, or a tax credit carry forward to the extent such deferred tax asset is available at the reporting date to settle any additional income taxes that would result from the
67
DISCOVERY COMMUNICATIONS, INC.
NOTES TO CONSOLIDATED FINANCIAL STATEMENTS
disallowance of a tax position. The Company prospectively adopted the new guidance effective January 1, 2014. As of
December 31, 2014
, there were
no
unrecognized tax benefits reducing deferred tax assets on the consolidated balance sheet.
Accounting and Reporting Pronouncements Not Yet Adopted
Recognition and Measurement of Financial Instruments
In January 2016, the FASB issued guidance regarding the classification and measurement of financial instruments, which significantly revises the classification and measurement of investments in equity securities. This standard supersedes the guidance to classify equity securities with readily determinable fair values into different categories and requires equity securities to be measured at fair value with changes in the fair value recognized through net income. An entity's equity investments that are accounted for under the equity method of accounting or result in consolidation of an investee are not included within the scope of this update. The new standard will be effective for reporting periods after December 15, 2017. The Company is currently evaluating the impact that the pronouncement will have on the consolidated financial statements.
Balance Sheet Classification of Deferred Taxes
In November 2015, the FASB issued guidance to simplify the presentation of deferred income taxes, which removes the requirement to separate deferred tax liabilities and assets into current and noncurrent amounts and instead requires all such amounts be classified as noncurrent on the Company's consolidated balance sheets. The new requirement will be effective for financial statements issued for annual periods beginning after December 15, 2016 and can be adopted on either a retrospective or prospective basis. The Company is currently evaluating the impact that the pronouncement will have on the consolidated financial statements.
Business Consolidation
In February 2015, the FASB issued guidance that amends the analysis that a reporting entity performs to determine whether it should consolidate certain legal entities. The changes in this guidance include how related parties and de facto agents are considered in the primary beneficiary determination and the analysis for determining whether a fee paid to a decision maker or service provider is a variable interest. The new standard is effective for reporting periods beginning after December 15, 2015 and can be adopted either retrospectively or using a modified retrospective approach by recording a cumulative-effect adjustment to stockholders' equity as of the beginning of the fiscal year of adoption. Early adoption is permitted. The Company is currently evaluating the impact that the pronouncement will have on the consolidated financial statements.
Presentation of Financial Statements - Going Concern
In August 2014, the FASB issued guidance requiring management to
perform interim and annual assessments regarding conditions or events that raise substantial doubt about the Company's ability to continue as a going concern and to provide related disclosures, if
applicable. The new standard will be effective for reporting periods beginning after December 15, 2016, with early adoption permitted. The adoption of this standard is not expected to have a material effect on the Company's consolidated financial statements.
Revenue from Contracts with Customers
In May 2014, the FASB issued guidance which applies a single, comprehensive revenue recognition model for all contracts with customers. This standard contains principles with respect to the measurement of revenue and timing of recognition. The Company will recognize revenue to reflect the transfer of goods or services to customers at an amount that it expects to be entitled to receive in exchange for those goods or services. In August 2015, the FASB deferred the pronouncement's effective date to annual reporting periods beginning after December 15, 2017. However, reporting entities may choose to adopt the standard as of the original effective date of annual reporting periods beginning after December 15, 2016. The Company is required to apply the new revenue standard beginning in the first interim period within the year of adoption. The Company is currently evaluating the impact that the pronouncement will have on the consolidated financial statements.
Use of Estimates
The preparation of financial statements in accordance with U.S. generally accepted accounting principles (“GAAP”) requires management to make estimates, judgments and assumptions that affect the amounts and disclosures reported in the consolidated financial statements and accompanying notes. Management continually re-evaluates its estimates, judgments and assumptions and management’s evaluations could change. These estimates are sometimes complex, sensitive to changes in assumptions and require fair value determinations using Level 3 fair value measurements. Actual results may differ materially from those estimates.
Estimates inherent in the preparation of the consolidated financial statements include accounting for asset impairments, revenue recognition, allowances for doubtful accounts, content rights, depreciation and amortization, business combinations,
68
DISCOVERY COMMUNICATIONS, INC.
NOTES TO CONSOLIDATED FINANCIAL STATEMENTS
equity-based compensation, income taxes, other financial instruments, contingencies, and the determination of whether the Company is the primary beneficiary of entities in which it holds variable interests.
Consolidation
The Company has ownership and other interests in various entities, including corporations, partnerships, and limited liability companies. For each such entity, the Company evaluates its ownership and other interests to determine whether it should consolidate the entity or account for its ownership interest as an investment. As part of its evaluation, the Company initially determines whether the entity is a VIE and, if so, whether it is the primary beneficiary of the VIE. An entity is generally a VIE if it meets any of the following criteria: (i) the entity has insufficient equity to finance its activities without additional subordinated financial support from other parties, (ii) the equity investors cannot make significant decisions about the entity’s operations, or (iii) the voting rights of some investors are not proportional to their obligations to absorb the expected losses of the entity or receive the expected returns of the entity and substantially all of the entity’s activities involve or are conducted on behalf of the investor with disproportionately few voting rights. The Company consolidates VIEs for which it is the primary beneficiary, regardless of its ownership or voting interests. The primary beneficiary is the party involved with the VIE that (i) has the power to direct the activities of the VIE that most significantly impact the VIE’s economic performance, and (ii) has the obligation to absorb losses of the VIE that could potentially be significant to the VIE or the right to receive benefits from the VIE that could potentially be significant to the VIE. Upon inception of a variable interest or the occurrence of a reconsideration event, the Company makes judgments in determining whether entities in which it invests are VIEs. If so, the Company makes judgments to determine whether it is the primary beneficiary and is thus required to consolidate the entity.
If it is concluded that an entity is not a VIE, then the Company considers its proportional voting interests in the entity. The Company consolidates majority-owned subsidiaries in which a controlling financial interest is maintained. A controlling financial interest is determined by majority ownership and the absence of significant third-party participating rights.
Ownership interests in entities for which the Company has significant influence that are not consolidated under the Company’s consolidation policy are accounted for as equity method investments. Related party transactions between the Company and its equity method investees have not been eliminated. (See Note 19.)
Investments
The Company holds investments in equity method and cost method investees and other marketable securities.
Investments in equity method investees are those for which the Company has the ability to exercise significant influence but does not control and is not the primary beneficiary. Significant influence typically exists if the Company has a
20%
to
50%
ownership interest in the venture unless persuasive evidence to the contrary exists. Under this method of accounting, the Company records its proportionate share of the net earnings or losses of equity method investees and a corresponding increase or decrease to the investment balances. Cash payments to equity method investees such as additional investments, loans and advances and expenses incurred on behalf of investees, as well as payments from equity method investees such as dividends, distributions and repayments of loans and advances are recorded as adjustments to investment balances. The Company evaluates its equity method investments for impairment whenever events or changes in circumstances indicate that the carrying amounts of such investments may not be recoverable. (See "Asset Impairment Analysis" below.)
Investments in entities or other securities in which the Company has no control or significant influence and is not the primary beneficiary are accounted for at fair value or cost. Investments in equity securities with readily determinable fair values are accounted for at fair value, based on quoted market prices, and classified as either trading securities or available-for-sale securities. For investments classified as trading securities, which include securities held in a separate trust in connection with the Company’s deferred compensation plan, unrealized and realized gains and losses related to the investment and corresponding liability are recorded in earnings as a component of
other (expense) income, net
, on the consolidated statements of operations. For investments classified as available-for-sale securities, which include investments in common stock, unrealized gains and losses are recorded net of income taxes in other comprehensive (loss) income until the security is sold or considered impaired. If declines in the value of available-for-sale securities are determined to be other-than-temporary, a loss is recorded in earnings in the current period as a component of
other (expense) income, net
on the consolidated statements of operations. Impairments are determined based on, among other factors, the length of time the fair value of the investment has been less than the carrying value, future business prospects for the investee, and information regarding market and industry trends for the investee’s business, if available. For purposes of computing realized gains and losses, the Company determines cost on a specific identification basis. Cost method investments are recorded at the lower of cost or fair value. If declines in the value of cost method investments are determined to be other-than-temporary, a loss is recorded in earnings in the current period as a component of
other (expense) income, net
on the consolidated statements of operations.
69
DISCOVERY COMMUNICATIONS, INC.
NOTES TO CONSOLIDATED FINANCIAL STATEMENTS
Foreign Currency
The reporting currency of the Company is the U.S. dollar. The functional currency of most of the Company’s international subsidiaries is the local currency. Assets and liabilities, including inter-company balances for which settlement is anticipated in the foreseeable future, denominated in foreign currencies are translated at exchange rates in effect at the balance sheet date. Foreign currency equity balances are translated at historical rates. Revenues and expenses denominated in foreign currencies are translated at average exchange rates for the respective periods. Foreign currency translation adjustments are recorded in accumulated other comprehensive income.
Transactions denominated in currencies other than subsidiaries’ functional currencies are recorded based on exchange rates at the time such transactions arise. Changes in exchange rates with respect to amounts recorded in the consolidated balance sheets related to these items will result in unrealized foreign currency transaction gains and losses based upon period-end exchange rates. The Company also records realized foreign currency transaction gains and losses upon settlement of the transactions. Foreign currency transaction gains and losses are included in other (expense) income, net and totaled a
loss
of $
103 million
, a
loss
of $
22 million
, and a
gain
of $
23 million
for
2015
,
2014
and
2013
, respectively.
With the exception of certain material transactions, the cash flows from the Company's operations in foreign countries are translated at the weighted average rate for the applicable period in the consolidated statements of cash flows. The impacts of material transactions generally are recorded at the applicable spot rates in the consolidated statements of operations and cash flows. The effects of exchange rates on cash balances held in foreign currencies are separately reported in the Company's consolidated statements of cash flows.
Cash and Cash Equivalents
Cash and cash equivalents include cash on hand and highly liquid investments with original maturities of ninety days or less.
Receivables
Receivables include amounts billed and currently due from customers and are presented net of an estimate for uncollectible accounts. The Company evaluates outstanding receivables to assess collectability. In performing this evaluation, the Company analyzes market trends, economic conditions, the aging of receivables and customer specific risks. Using this information, the Company reserves an amount that it estimates may not be collected. The Company does not require collateral with respect to trade receivables.
Content Rights
Content rights principally consist of television series, specials and sporting events. Content aired on the Company’s television networks is sourced from a wide range of third-party producers, wholly owned and equity method investee production studios and sports associations. Content is classified either as produced, coproduced or licensed. The Company owns most or all of the rights to produced content. The Company collaborates with third parties to finance and develop coproduced content, and it retains significant rights to exploit the programs. Licensed content is comprised of films or series that have been previously produced by third parties and the Company retains limited airing rights over a contractual term. Prepaid licensed content includes advance payments for rights to air sporting events that will take place in the future and advance payments for acquired films and television series.
Costs of produced and coproduced content consist of development costs, acquired production costs, direct production costs, certain production overhead costs and participation costs. Costs incurred for produced and coproduced content are capitalized if the Company has previously generated revenues from similar content in established markets and the content will be used and revenues will be generated for a period of at least
one
year. The Company’s coproduction arrangements generally provide for the sharing of production costs. The Company records its costs, but does not record the costs borne by the other party as the Company does not share any associated economics of exploitation. Program licenses typically have fixed terms and require payments during the term of the license. The cost of licensed content is capitalized when the license period for the programs has commenced and the programs are available for air or the Company has paid for the programs. The Company pays in advance of delivery for television series, specials, films and sports rights. Payments made in advance of when the right to air the content is received are recognized as in-production produced or coproduced content or prepaid licensed content. Content distribution, advertising, marketing, general and administrative costs are expensed as incurred.
Content amortization expense for each period is recognized based on the revenue forecast model, which approximates the proportion that estimated distribution and advertising revenues for the current period represent in relation to the estimated remaining total lifetime revenues. The Company annually, or on an as needed basis, prepares analyses to support its content amortization expense by network and by region. Critical assumptions used in determining content amortization include: 1) the
70
DISCOVERY COMMUNICATIONS, INC.
NOTES TO CONSOLIDATED FINANCIAL STATEMENTS
application of a quantitative revenue forecast model based the adequacy of a network's historical data, 2) determining the appropriate historical periods to utilize and the relative weighting of those historical periods in the revenue forecast model, and 3) assessing the accuracy of the Company's revenue forecasts. The Company then considers the appropriate application of the quantitative assessment given forecasted content use, and expected content investment and market trends. Content use and future revenues may differ from estimates based on changes in expectations related to market acceptance, network affiliate fee rates, advertising demand, the number of cable and satellite television subscribers receiving the Company’s networks, and program usage. Accordingly, the Company continually reviews revenue estimates and planned usage and revises its assumptions if necessary. As part of the Company's annual assessment of the revenue forecast model, the Company compares the calculated amortization rates to those that have been utilized during the year. If the calculated rates do not deviate materially from the applied amortization rates, no adjustment is recorded for the current year amortization expense. The Company allocates the cost of multi-year sports programming arrangements over the contract period to each event or season based on the estimated relative value of each event or season.
The result of the revenue forecast model is either an accelerated method or a straight-line amortization method over the estimated useful lives of primarily
three
to
four
years for produced, coproduced and licensed content. Amortization of capitalized costs for produced and coproduced content begins when a program has been aired. Amortization of capitalized costs for licensed content commences when the license period begins and the program is available for use. Amortization of sports rights takes place when the content airs.
Capitalized content costs are stated at the lower of cost less accumulated amortization or net realizable value. The Company periodically evaluates the net realizable value of content by considering expected future revenue generation. Estimates of future revenues consider historical airing patterns and future plans for airing content, including any changes in strategy. Given the significant estimates and judgments involved, actual demand or market conditions may be less favorable than those projected, requiring a write-down to net realizable value. Development costs for programs that the Company has determined will not be produced, are fully expensed in the period the determination is made.
All produced and coproduced content is classified as long-term. The portion of the unamortized licensed content balance, including prepaid sports rights, that will be amortized within one year is classified as a current asset.
Property and Equipment
Property and equipment are stated at cost less accumulated depreciation and impairments. The cost of property and equipment acquired under capital lease arrangements represents the lesser of the present value of the minimum lease payments or the fair value of the leased asset as of the inception of the lease. The Company leases fixed assets and software. Capitalized software costs are for internal use. Capitalization of software costs occurs during the application development stage. Software costs incurred during the preliminary project and post implementation stages are expensed as incurred. Repairs and maintenance expenditures that do not enhance the use or extend the life of property and equipment are expensed as incurred.
Depreciation for most property and equipment is recognized using the straight-line method over the estimated useful lives of the assets, which is
15
to
39
years for buildings,
three
to
five
years for broadcast equipment,
two
to
five
years for capitalized software costs and
three
to
five
years for office equipment, furniture, fixtures and other property and equipment. Assets acquired under capital lease arrangements and leasehold improvements are amortized using the straight-line method over the lesser of the estimated useful lives of the assets or the terms of the related leases, which is
one
to
15
years. Depreciation commences when property or equipment is ready for its intended use.
Asset Impairment Analysis
Goodwill and Indefinite-lived Intangible Assets
Goodwill is allocated to the Company's reporting units, which are its operating segments or one level below its operating segments. The Company evaluates goodwill and other indefinite-lived intangible assets for impairment annually as of November 30 and earlier upon the occurrence of substantive changes in circumstances, such as a significant deterioration in economic conditions, industry changes, increases in costs, declining cash flows, or a significant, ongoing decline in market capitalization. If the Company believes that as a result of its qualitative assessment it is more likely than not that the fair value of a reporting unit or other indefinite-lived intangible asset is greater than its carrying amount, the quantitative impairment test is not required.
Following a qualitative assessment indicating that it is not more likely than not that the fair value of the reporting unit exceeds its carrying amount, goodwill impairment is determined using a two-step quantitative process. The first step of the process is to compare the fair value of a reporting unit with its carrying amount, including goodwill. In performing the first step, the Company determines the fair value of a reporting unit by using a combination of a discounted cash flow (“DCF”) analysis and, if
71
DISCOVERY COMMUNICATIONS, INC.
NOTES TO CONSOLIDATED FINANCIAL STATEMENTS
possible, market-based valuation methodologies. Determining fair value requires the Company to make judgments about appropriate discount rates, perpetual growth rates, relevant comparable company earnings multiples and the amount and timing of expected future cash flows. The cash flows employed in the DCF analysis are based on the Company’s budget, long-term business plan, and recent operating performance. Discount rate assumptions are based on an assessment of the risk inherent in future cash flows of the respective reporting unit and market conditions. In assessing the reasonableness of its determined fair values, the Company may also evaluate its results against other value indicators, such as comparable company public trading values, research analyst estimates and values observed in market transactions.
If the fair value of a reporting unit exceeds its carrying amount, goodwill of the reporting unit is not impaired and the second step of the quantitative impairment test is not necessary. If the carrying amount of a reporting unit exceeds its fair value, the second step of the quantitative goodwill impairment test is required to be performed to measure the amount of impairment loss, if any. The second step of the quantitative goodwill impairment test compares the implied fair value of the reporting unit’s goodwill with the carrying amount of that goodwill. The implied fair value of goodwill is determined in the same manner as the amount of goodwill recognized in a business combination. In other words, the estimated fair value of the reporting unit’s identifiable net assets excluding goodwill is compared to the fair value of the reporting unit as if the reporting unit had been acquired in a business combination and the fair value of the reporting unit was the purchase price paid. If the carrying amount of the reporting unit’s goodwill exceeds the implied fair value of that goodwill, an impairment loss is recognized in an amount equal to that excess.
Following a qualitative assessment indicating that it is not more likely than not that the fair value of the indefinite lived intangible asset exceeds its carrying amount, impairment of other intangible assets not subject to amortization involves a comparison of the estimated fair value of the intangible asset with its carrying value. If the carrying value of the intangible asset exceeds its fair value, an impairment loss is recognized in an amount equal to that excess. The estimates of fair value of intangible assets not subject to amortization are determined using a DCF valuation analysis, a market-based valuation analysis, or both. Determining fair value requires the exercise of judgment about appropriate discount rates, perpetual growth rates and the amount and timing of expected future cash flows.
Long-lived Assets
Long-lived assets such as amortizing trademarks, customer lists, other intangible assets, and property and equipment are not required to be tested for impairment annually. Instead, long-lived assets are tested for impairment whenever circumstances indicate that the carrying amount of the asset may not be recoverable, such as when the disposal of such assets is likely or there is an adverse change in the market involving the business employing the related assets. If an impairment analysis is required, the impairment test employed is based on whether the Company’s intent is to hold the asset for continued use or to hold the asset for sale. If the intent is to hold the asset for continued use, the impairment test first requires a comparison of undiscounted future cash flows to the carrying value of the asset. If the carrying value of the asset exceeds the undiscounted cash flows, the asset would not be deemed to be recoverable. Impairment would then be measured as the excess of the asset’s carrying value over its fair value. Fair value is typically determined by discounting the future cash flows associated with that asset. If the intent is to hold the asset for sale and certain other criteria are met, the impairment test involves comparing the asset’s carrying value to its fair value less costs to sell. To the extent the carrying value is greater than the asset’s fair value less costs to sell, an impairment loss is recognized in an amount equal to the difference. Significant judgments used for long-lived asset impairment assessments include identifying the appropriate asset groupings and primary assets within those groupings, determining whether events or circumstances indicate that the carrying amount of the asset may not be recoverable, determining the future cash flows for the assets involved and determining the proper discount rate to be applied in determining fair value.
Equity Method Investments
Equity method investments are reviewed for indicators of other-than-temporary impairment on a quarterly basis. An equity method investment is written down to fair value if there is evidence of a loss in value which is other-than-temporary. The Company may estimate the fair value of its equity method investments by considering recent investee equity transactions, discounted cash flow analysis, recent operating results, comparable public company operating cash flow multiples and in certain situations, balance sheet liquidation values. If the fair value of the investment has dropped below the carrying amount, management considers several factors when determining whether an other-than-temporary decline has occurred, such as: the length of the time and the extent to which the estimated fair value or market value has been below the carrying value, the financial condition and the near-term prospects of the investee, the intent and ability of the Company to retain its investment in the investee for a period of time sufficient to allow for any anticipated recovery in market value and general market conditions. The estimation of fair value and whether an other-than-temporary impairment has occurred requires the application of significant judgment and future results may vary from current assumptions. (See Note 4.)
72
DISCOVERY COMMUNICATIONS, INC.
NOTES TO CONSOLIDATED FINANCIAL STATEMENTS
Derivative Instruments
The Company uses derivative financial instruments from time to time to modify its exposure to market risks from changes in interest rates, foreign currency exchange rates and the fair value of investments classified as available-for-sale securities. The Company may designate derivative instruments as cash flow hedges or fair value hedges, as appropriate. The Company records all derivative instruments at fair value on a gross basis. For those derivative instruments designated as cash flow hedges that qualify for hedge accounting, gains or losses on the effective portion of derivative instruments are initially recorded in
accumulated other comprehensive loss
on the consolidated balance sheets and reclassified to the same account on the consolidated statements of operations in which the hedged item is recognized on the consolidated statements of operations. For those derivative instruments designated as fair value hedges that qualify for hedge accounting, the changes in the fair value of the derivative instruments, including offsetting changes in fair value of the hedged items and amounts excluded from the assessment of effectiveness are recorded in
other (expense) income, net
. The Company may also enter into derivative instruments that are not designated as hedges and do not qualify for hedge accounting. These contracts are intended to mitigate economic exposures of the Company. The changes in fair value of derivatives not designated as hedges and the ineffective portion of derivatives designated as hedging instruments are immediately recorded in
other (expense) income, net
.
Treasury Stock
When stock is acquired for purposes other than formal or constructive retirement, the purchase price of the acquired stock is recorded in a separate treasury stock account, which is separately reported as a reduction of equity.
When stock is retired or purchased for constructive retirement, the purchase price is initially recorded as a reduction to the par value of the shares repurchased, with any excess purchase price over par value recorded as a reduction to additional paid-in capital related to the series of shares repurchased and any remainder excess purchase price recorded as a reduction to retained earnings. If the purchase price exceeds the amounts allocated to par value and additional paid-in capital related to the series of shares repurchased and retained earnings, the remainder is allocated to additional paid-in capital related to other series of shares.
Revenue Recognition
The Company generates revenues principally from (i) fees charged to distributors of its network content, which include cable, direct-to-home ("DTH") satellite, telecommunications and digital service providers, (ii) advertising sold on its television networks and websites, (iii) transactions for curriculum-based products and services, (iv) production studios content development and services, (v) affiliate and advertising sales representation services and (vi) the licensing of the Company's brands for consumer products.
Revenue is recognized when persuasive evidence of a sales arrangement exists, services are rendered or delivery occurs, the sales price is fixed or determinable and collectability is reasonably assured. Revenues do not include taxes collected from customers on behalf of taxing authorities such as sales tax and value-added tax. However, certain revenues include taxes that customers pay to taxing authorities on the Company’s behalf, such as foreign withholding tax. Revenue recognition for each source of revenue is also based on the following policies.
Distribution
Cable operators, DTH satellite and telecommunications service providers typically pay a per-subscriber fee for the right to distribute the Company’s programming under the terms of distribution contracts. The majority of the Company’s distribution fees are collected monthly throughout the year and distribution revenue is recognized over the term of the contracts based on contracted programming rates and reported subscriber levels. The amount of distribution fees due to the Company are reported by distributors based on actual subscriber levels. Such information is generally not received until after the close of the reporting period. In these cases, the Company estimates the number of subscribers receiving the Company’s programming. Historical adjustments to recorded estimates have not been material.
Distribution revenues are recognized net of incentives the Company provides to operators in exchange for carrying its networks. Incentives include cash payments to operators (“launch incentives”). Launch incentives are capitalized as assets upon launch of the Company’s network by the operator and are amortized on a straight-line basis as a reduction of revenue over the term of the contract, including free periods. In instances where the distribution agreement is extended prior to the expiration of the original term, the Company evaluates the economics of the extended term and, if it is determined that the launch asset continues to benefit the Company over the extended term, then the Company will adjust the amortization period of the remaining launch incentives accordingly. Other incentives are recognized as a reduction of revenue as incurred. Amortization of launch incentives was $
16 million
, $
11 million
and $
18 million
for
2015
,
2014
and
2013
, respectively.
73
DISCOVERY COMMUNICATIONS, INC.
NOTES TO CONSOLIDATED FINANCIAL STATEMENTS
Revenues associated with digital distribution arrangements are recognized when the Company transfers control of the content and the rights to distribute the content to the customer. If multiple programs are included in the arrangement, the Company allocates the fee to each program based on its relative fair value.
Advertising
Advertising revenues are principally generated from the sale of bundled commercial time on television networks and websites. Advertising revenues are recognized net of agency commissions in the period advertising spots are aired. A substantial portion of the advertising contracts in the U.S. guarantee the advertiser a minimum audience level that either the program in which their advertisements are aired or the advertisement will reach. Revenues are recognized for the actual audience level delivered. The Company provides the advertiser with additional advertising spots in future periods if the guaranteed audience level is not delivered. Revenues are deferred for any shortfall in the guaranteed audience level until the guaranteed audience level is delivered or the rights associated with the guarantee lapse. Audience guarantees are initially developed internally based on planned programming, historical audience levels, the success of pilot programs, and market trends. In the U.S., actual audience and delivery information is published by independent ratings services. In certain instances, the independent ratings information is not received until after the close of the reporting period. In these cases, reported advertising revenue and related deferred revenue are based upon the Company’s estimates of the audience level delivered. Historical adjustments to recorded estimates have not been material.
Advertising revenues from online properties are recognized as impressions are delivered or the services are performed.
Other
Revenue for curriculum-based services is recognized ratably over the contract term as service is provided. Royalties from brand licensing arrangements are earned as products are sold by the licensee. Revenue from the production studios segment is recognized when the content is delivered and available for airing by the customer.
Deferred Revenue
Deferred revenue primarily consists of cash received for television advertising for which the advertising spots have not yet fully delivered the ratings guaranteed, product licensing arrangements and advanced billings to subscribers for access to the Company’s curriculum-based streaming services. The amounts classified as current are expected to be earned within the next year.
Equity-Based Compensation Expense
The Company has incentive plans under which unit awards, stock appreciation rights (“SARs”), performance based restricted stock units (“PRSUs”), service based restricted stock units (“RSUs”) and stock options are issued.
The Company measures the cost of employee services received in exchange for SARs and unit awards based on the fair value of the award less estimated forfeitures. Because certain SARs and all unit awards are cash-settled, the Company remeasures the fair value of these awards each reporting period until settlement. Compensation expense, including changes in fair value, for SARs and unit awards is recognized during the vesting period in proportion to the requisite service that has been rendered as of the reporting date. For awards with graded vesting, the Company measures fair value and records compensation expense separately for each vesting tranche.
Compensation expense for stock options is attributed to expense over the vesting period based on the fair value on the date of grant less estimated forfeitures. Compensation expense for stock options is recognized ratably during the vesting period.
The fair values of SARs, unit awards and stock options are estimated using the Black-Scholes option-pricing model. Because the Black-Scholes option-pricing model requires the use of subjective assumptions, changes in these assumptions can materially affect the fair value of awards. For SARs and unit awards the expected term is the period from the grant date to the end of the contractual term of the award unless the terms of the award allow for cash-settlement automatically on the date the awards vest, in which case the vesting date is used. For stock options the simplified method is utilized to calculate the expected term, since the Company does not have sufficient historical exercise data to provide a reasonable basis upon which to estimate the expected term. The simplified method considers the period from the date of grant through the mid-point between the vesting date and the end of the contractual term of the award. Expected volatility is based on a combination of implied volatilities from traded options on the Company’s common stock and historical realized volatility of the Company’s common stock. The dividend yield is assumed to be
zero
because the Company has no history of paying cash dividends and no present intention to pay dividends. The risk-free interest rate is based on U.S. Treasury zero-coupon issues with a remaining term equal to the expected term of the award.
Vesting for certain PRSUs is subject to satisfying objective operating performance conditions, while vesting for other PRSUs is based on the achievement of a combination of objective and subjective operating performance conditions. Compensation expense for PRSUs that vest based on achieving objective operating performance conditions is measured based on the fair value of the Company’s Series A and C common stock on the date of grant less estimated forfeitures. Compensation expense for PRSUs that vest, based on achieving subjective operating performance conditions or in situations where the executive is able to withhold taxes
74
DISCOVERY COMMUNICATIONS, INC.
NOTES TO CONSOLIDATED FINANCIAL STATEMENTS
in excess of the minimum statutory requirement, is remeasured at the fair value of the Company’s Series A and Series C common stock, as applicable, less estimated forfeitures each reporting period until the date of conversion. Compensation expense for all PRSUs is recognized ratably, following a graded vesting pattern during the vesting period only when it is probable that the operating performance conditions will be achieved. The Company records a cumulative adjustment to compensation expense for PRSUs if there is a change in the determination of whether or not it is probable the operating performance conditions will be achieved.
The Company measures the cost of employee services received in exchange for RSUs based on the fair value of the Company’s Series A common stock on the date of grant less estimated forfeitures. Compensation expense for RSUs is recognized ratably during the vesting period.
When recording compensation cost for equity-based awards, the Company is required to estimate the number of awards granted that are expected to be forfeited. In estimating forfeitures, the Company considers historical and expected forfeiture rates and anticipated events. On an ongoing basis, the Company adjusts compensation expense based on actual forfeitures and revises the forfeiture rate as necessary.
The Employee Stock Purchase Plan (the “DESPP”) enables eligible employees to purchase shares of the Company’s common stock through payroll deductions or other permitted means. The Company recognizes the fair value of the discount associated with shares purchased under the plan as equity-based compensation expense.
Equity-based compensation expense is recorded as a component of selling, general and administrative expense. The Company classifies the intrinsic value of SARs and unit awards that are vested or will become vested within one year as a current liability.
Excess tax benefits realized from the exercise of stock options and vested RSUs, PRSUs and the DESPP are reported as cash inflows from financing activities rather than as a reduction of taxes paid in cash flows from operating activities on the consolidated statements of cash flows.
Advertising Costs
Advertising costs are expensed as promotional services are delivered. Advertising costs paid to third parties totaled $
148 million
, $
145 million
and $
156 million
for
2015
,
2014
and
2013
, respectively.
Income Taxes
Income taxes are recorded using the asset and liability method of accounting for income taxes. Deferred income taxes reflect the net tax effect of temporary differences between the carrying amounts of assets and liabilities for financial reporting purposes and the amounts used for income tax purposes. Deferred taxes are measured using rates the Company expects to apply to taxable income in years in which those temporary differences are expected to reverse. A valuation allowance is provided for deferred tax assets if it is more likely than not such assets will be unrealized.
From time to time, the Company engages in transactions in which the tax consequences may be uncertain. Significant judgment is required in assessing and estimating the tax consequences of these transactions. The Company prepares and files tax returns based on its interpretation of tax laws and regulations. In the normal course of business, the Company's tax returns are subject to examination by various taxing authorities. Such examinations may result in future tax and interest assessments by these taxing authorities.
In determining the Company's tax provision for financial reporting purposes, the Company establishes a reserve for uncertain tax positions unless the Company determines that such positions are more likely than not to be sustained upon examination based on their technical merits, including the resolution of any appeals or litigations processes. There is considerable judgment involved in determining whether positions taken on the Company's tax returns are more likely than not to be sustained. The Company adjusts its tax reserve estimates periodically because of ongoing examinations by, and settlements with, various taxing authorities, as well as changes in tax laws, regulations and interpretations.
Concentrations Risk
Customers
The Company has long-term contracts with distributors around the world. For the U.S. Networks segment, approximately
95%
of distribution revenue comes from the top
10
distributors in the U.S. For the International Networks segment, approximately
45%
of distribution revenue comes from the top
10
distributors outside the U.S. Agreements in place with the major cable and satellite operators in the U.S. expire at various times beginning in
2016 through 2021
. Although the Company seeks to renew its agreements with its distributors, a delay in securing a renewal that results in a service disruption, a failure to secure a renewal or a
75
DISCOVERY COMMUNICATIONS, INC.
NOTES TO CONSOLIDATED FINANCIAL STATEMENTS
renewal on less favorable terms may have a material adverse effect on the Company’s financial condition and results of operations. Not only could the Company experience a reduction in distribution revenue, but it could also experience a reduction in advertising revenue, as viewership is impacted by affiliate subscriber levels.
No
individual customer accounted for more than
10%
of total consolidated revenues for
2015
,
2014
and
2013
. As of
December 31, 2015
and
2014
, the Company’s trade receivables do not represent a significant concentration of credit risk as the customers and markets in which the Company operates are varied and dispersed across many geographic areas.
Financial Institutions
Cash and cash equivalents are maintained with several financial institutions. The Company has deposits held with banks that exceed the amount of insurance provided on such deposits. Generally, these deposits may be redeemed upon demand and are maintained with financial institutions of reputable credit and, therefore, bear minimal credit risk. Additionally, the Company has cash and cash equivalents held by its foreign subsidiaries that would result in U.S. tax consequences should the Company decide it needs to repatriate these funds to the U.S.
Lender Counterparties
There is a risk that the counterparties associated with the Company’s revolving credit facility will not be available to fund as obligated under the terms of the facility and that the Company may, at the time of such unavailability to fund, have limited or no access to the commercial paper market. If funding under the revolving credit facility is unavailable, the Company may have to acquire a replacement credit facility from different counterparties at a higher cost or may be unable to find a suitable replacement. Typically, the Company seeks to manage such risks from its revolving credit facility by contracting with experienced large financial institutions and monitoring the credit quality of its lenders. As of
December 31, 2015
, the Company did not anticipate nonperformance by any of its counterparties.
Acquisitions
Eurosport
On December 21, 2012, the Company acquired a
20%
equity method investment in Eurosport, which includes both Eurosport International and Eurosport France. On
May 30, 2014
, the Company acquired an additional
31%
equity in Eurosport International to obtain a controlling interest in Eurosport International for €
259 million
($
351 million
) and committed to acquire a similar controlling interest in Eurosport France upon resolution of certain regulatory matters. The outstanding regulatory matters in France were subsequently resolved, and on
March 31, 2015
the Company completed its acquisition of an additional
31%
interest in Eurosport France for total consideration of
€36 million
(
$38 million
). These transactions gave the Company a
51%
controlling stake in Eurosport. The Company recognized gains of
$2 million
and
$29 million
for the
years ended December 31, 2015 and 2014
, respectively, to account for the difference between the carrying value and the fair value of the previously held
20%
equity method investments in Eurosport France and Eurosport International, respectively. The gains were included in
other (expense) income, net
in the Company's consolidated statements of operations. (See Note 18.) On
October 1, 2015
, TF1 put its remaining
49%
interest in Eurosport to the Company for
€491 million
(
$548 million
). (See Note 11.)
Eurosport is a leading pan-European sports media platform. The flagship Eurosport network focuses on regionally popular sports, such as tennis, skiing, cycling and motor sports. Eurosport’s brands and platforms also include Eurosport HD (high definition simulcast), Eurosport 2, Eurosport 2 HD (high definition simulcast) and Eurosportnews. The acquisitions are intended to increase the growth of Eurosport and enhance the Company's pay-TV offerings in Europe.
76
DISCOVERY COMMUNICATIONS, INC.
NOTES TO CONSOLIDATED FINANCIAL STATEMENTS
The Company used DCF analyses, which represent Level 3 fair value measurements, to assess certain components of the Eurosport purchase price allocations. The fair value of the assets acquired, liabilities assumed, noncontrolling interests recognized and the remeasurement gains recorded on the previously held equity interests is presented in the table below (in millions).
|
Eurosport
France
|
Eurosport International
|
|||||||
|
March 31, 2015
|
May 30, 2014
|
|||||||
|
Goodwill
|
$
|
69
|
|
$
|
785
|
|
||
|
Intangible assets
|
40
|
|
467
|
|
||||
|
Other assets acquired
|
25
|
|
169
|
|
||||
|
Cash
|
35
|
|
47
|
|
||||
|
Removal of TF1 put right
|
2
|
|
27
|
|
||||
|
Currency translation adjustment
|
(6
|
)
|
7
|
|
||||
|
Remeasurement gain on previously held equity interest
|
(2
|
)
|
(29
|
)
|
||||
|
Liabilities assumed
|
(30
|
)
|
(169
|
)
|
||||
|
Deferred tax liabilities
|
(14
|
)
|
(164
|
)
|
||||
|
Redeemable noncontrolling interest (Note 11)
|
(60
|
)
|
(558
|
)
|
||||
|
Carrying value of previously held equity interest
|
(21
|
)
|
(231
|
)
|
||||
|
Net assets acquired
|
$
|
38
|
|
$
|
351
|
|
||
The goodwill reflects the workforce and synergies expected from increased pan-European market penetration as the operations of Eurosport and the Company are combined. The goodwill recorded as part of this acquisition is included in the International Networks reportable segment and is not amortizable for tax purposes. Intangible assets primarily consist of distribution and advertising customer relationships, advertiser backlog and trademarks with a weighted average estimated useful life of
10
years.
Discovery Family (formerly known as the Hub Network)
On
September 23, 2014
, the Company acquired an additional
10%
ownership interest in Discovery Family from Hasbro, Inc. ("Hasbro") for $
64 million
and obtained financial operating control of the joint venture. Discovery Family is a pay television network in the U.S. that provides entertainment for children and families. The purchase increased the Company's ownership interest from
50%
to
60%
. As a result of acquiring a controlling interest, the Company changed its accounting for Discovery Family from an equity method investment to a consolidated subsidiary. There was
no
gain or loss recorded at the time of acquisition as the fair value of the Company's previously held equity interest in Discovery Family was equal to the carrying amount as of the acquisition date. The acquisition of Discovery Family supports the Company's strategic priority of broadening the scope of the network to increase viewership. The Company rebranded the network to Discovery Family on October 13, 2014.
The Company used DCF analyses, which represent Level 3 fair value measurements, to assess certain components of its purchase price allocation. The fair value of the assets acquired, liabilities assumed and noncontrolling interest recognized is presented in the table below (in millions).
|
September 23, 2014
|
||||
|
Goodwill
|
$
|
310
|
|
|
|
Intangible assets
|
301
|
|
||
|
Other assets acquired
|
96
|
|
||
|
Cash
|
33
|
|
||
|
Liabilities assumed
|
(125
|
)
|
||
|
Redeemable noncontrolling interest (Note 11)
|
(238
|
)
|
||
|
Carrying value of previously held equity interest
|
(313
|
)
|
||
|
Net assets acquired
|
$
|
64
|
|
|
The goodwill reflects the workforce and synergies expected from combining the operations of Discovery Family with the Company's existing U.S. Networks. The goodwill recorded as part of this acquisition is included in the U.S. Networks reportable
77
DISCOVERY COMMUNICATIONS, INC.
NOTES TO CONSOLIDATED FINANCIAL STATEMENTS
segment and is not amortizable for tax purposes. Intangible assets primarily consist of distribution customer relationships with an estimated useful life of
25
years, based on
three
renewals.
SBS Nordic
On
April 9, 2013
, the Company acquired the Nordic general entertainment television and radio business operations ("SBS Nordic") of Prosiebensat.1 Media AG for cash of approximately
€1.4 billion
(
$1.8 billion
) including closing purchase price adjustments. SBS Nordic has operations in Sweden, Norway, Denmark, Finland and England. The acquisition of SBS Nordic supports the Company’s strategic priority of increasing its presence in key international markets.
The Company used DCF analyses, which represent Level 3 fair value measurements, to assess the components of its purchase price allocation. The table below presents the fair value allocation of the purchase price to the assets acquired, liabilities assumed and noncontrolling interest recognized (in millions).
|
April 9, 2013
|
||||
|
Goodwill
|
$
|
779
|
|
|
|
Intangible assets
|
1,001
|
|
||
|
Content
|
248
|
|
||
|
Other assets acquired
|
212
|
|
||
|
Cash
|
106
|
|
||
|
Liabilities assumed
|
(278
|
)
|
||
|
Deferred tax liabilities
|
(243
|
)
|
||
|
Redeemable noncontrolling interest (Note 11)
|
(6
|
)
|
||
|
Net assets acquired
|
$
|
1,819
|
|
|
The goodwill reflects the workforce, synergies expected from combining the operations of SBS Nordic and the Company and the pricing benefits of increased Nordic region market penetration. The goodwill recorded as part of this acquisition is included in the International Networks reportable segment and is not amortizable for tax purposes. Intangible assets primarily consist of broadcast licenses, distribution and advertising customer relationships, advertiser backlog and trademarks with a weighted average estimated useful life of
8
years.
Discovery Japan
On
January 10, 2013
, the Company purchased an additional
30%
of Discovery Japan for $
53 million
. Discovery Japan operates Discovery Channel and Animal Planet in Japan. As of December 31, 2012, Discovery and Jupiter Telecommunications Co., Ltd ("J:COM") each owned a
50%
interest in Discovery Japan, and Discovery accounted for its
50%
interest using the equity method of accounting. Discovery consolidated Discovery Japan on
January 10, 2013
and recognized a gain of
$92 million
to account for the difference between the carrying value and the fair value of the previously held
50%
equity interest. The gain is included in
other (expense) income, net
in the Company's consolidated statements of operations. (See Note 18.)
The Company used a combination of a DCF analysis and market-based valuation methodology, which represent Level 3
fair value measurements, to measure the fair value of Discovery Japan and to perform its purchase price allocation. The table
below presents the allocation of the purchase price to the assets acquired, liabilities assumed, redeemable noncontrolling interest recognized and remeasurement gain recorded on consolidation of previously held equity interest (in millions).
78
DISCOVERY COMMUNICATIONS, INC.
NOTES TO CONSOLIDATED FINANCIAL STATEMENTS
|
January 10, 2013
|
||||
|
Goodwill
|
$
|
103
|
|
|
|
Intangible assets
|
100
|
|
||
|
Other assets acquired
|
25
|
|
||
|
Currency translation adjustment
|
6
|
|
||
|
Cash
|
4
|
|
||
|
Remeasurement gain on previously held equity interest
|
(92
|
)
|
||
|
Liabilities assumed
|
(55
|
)
|
||
|
Redeemable noncontrolling interest (Note 11)
|
(35
|
)
|
||
|
Carrying value of previously held equity interest
|
(3
|
)
|
||
|
Net assets acquired
|
$
|
53
|
|
|
The goodwill reflects the synergies and increased flexibility expected from controlling the operations of Discovery Japan. The goodwill recorded as part of this acquisition is included in the International Networks reportable segment and is not amortizable for tax purposes. Intangible assets are primarily distribution customer relationships with a useful life of
20
years.
Other
In
2015
, the Company acquired several other unrelated businesses for total cash and contingent consideration of
$91 million
, net of cash acquired. Total consideration, net of cash acquired includes contingent consideration of
$13 million
. The Company recorded
$54 million
and
$43 million
of goodwill and intangible assets, respectively, in connection with these acquisitions. The acquisitions included a free-to-air network in Turkey, a free-to-air network in Italy, cable networks in Denmark and a pay-TV sports channel in Asia. The goodwill reflects the synergies and regional market penetration from combining the operations of these acquisitions with the Company's operations.
In
2014
, the Company acquired several other unrelated businesses for total consideration of
$40 million
, net of cash acquired. Total consideration, net of cash acquired includes
$2 million
of consideration not yet paid. The Company recorded
$37 million
and
$10 million
of goodwill and intangible assets, respectively, in connection with these acquisitions. The acquisitions included a factual entertainment production company in the U.K. and cable networks in New Zealand. The goodwill reflects the synergies and market expansion from combining the operations of these acquisitions with the Company's operations.
In
2013
, the Company acquired several other unrelated businesses for total consideration of
$88 million
, net of cash acquired. Total consideration, net of cash acquired includes
$2 million
consideration that was paid in 2014. The Company recorded
$67 million
and
$24 million
of goodwill and intangible assets, respectively, in connection with these acquisitions. The acquisitions included a broadcast network in Sweden and an education business in the U.K. The goodwill reflects the synergies and market expansion expected from combining the operations of these acquisitions with the Company.
Pro Forma Financial Information
The following table presents the unaudited pro forma results of the Company as though all of the business combinations from 2014 had been made on January 1, 2013, and from 2013 had been made on January 1, 2012. The Company's 2015 business combinations are not material individually or in the aggregate and have not been included in the pro forma table. These pro forma results do not necessarily represent what would have occurred if all the business combinations had taken place on January 1, 2013 and 2012, nor do they represent the results that may occur in the future. This pro forma financial information includes the historical financial statement amounts of Discovery and its business combinations with the following adjustments: 1) the Company converted historical financial statements to GAAP, 2) the Company applied its accounting policies, 3) the Company adjusted for amortization expense assuming the fair value adjustments to intangible assets had been applied beginning January 1, 2013 and 2012, as applicable, 4) the Company removed content impairments resulting from the consolidation and subsequent rebranding of Discovery Family from 2014 and reclassified them to 2013, 5) the Company removed the gains recognized upon the consolidation of previously held equity interests in 2014 and 2013 and reclassified them to 2013 and 2012, as applicable, 6) the Company removed losses on derivative instruments and other market value adjustments recognized in connection with business combinations and previously held equity interests and reclassified them to 2013 and 2012, as applicable, 7) the Company adjusted for transaction costs of
$4 million
and
$3 million
incurred in 2014 and 2013 and reclassified them to 2013 and 2012, respectively, as applicable, and 8) the Company included adjustments for income taxes associated with these pro forma adjustments.
The pro forma adjustments were based on available information and upon assumptions that the Company believes are reasonable to reflect the impact of these acquisitions on the Company's historical financial information on a supplemental pro forma basis (in millions).
79
DISCOVERY COMMUNICATIONS, INC.
NOTES TO CONSOLIDATED FINANCIAL STATEMENTS
|
Pro Forma
|
||||||||
|
Year Ended December 31,
|
||||||||
|
2014
|
2013
|
|||||||
|
Revenues
|
$
|
6,559
|
|
$
|
6,413
|
|
||
|
Net income
|
$
|
1,168
|
|
$
|
1,084
|
|
||
Impact of Business Combinations
The operations of each of the business combinations discussed above were included in the consolidated financial statements as of each of their respective acquisition dates. The following table presents their revenue and earnings as reported within the consolidated financial statements for the
year ended December 31, 2015
,
2014
and
2013
(in millions).
|
Year Ended December 31,
|
||||||||||||
|
2015
|
2014
|
2013
|
||||||||||
|
Revenues:
|
||||||||||||
|
Distribution
|
$
|
624
|
|
$
|
449
|
|
$
|
184
|
|
|||
|
Advertising
|
587
|
|
687
|
|
414
|
|
||||||
|
Other
|
112
|
|
117
|
|
19
|
|
||||||
|
Total revenues
|
1,323
|
|
1,253
|
|
617
|
|
||||||
|
Net income
|
$
|
127
|
|
$
|
85
|
|
$
|
—
|
|
|||
Dispositions
Russia
On
October 7, 2015
, Discovery recorded a loss of
$5 million
, reflected as a component of loss (gain) on disposition on the consolidated statement of operations, for the contribution of its Russian business to a joint venture (the “New Russian Business”) with a Russian media company, National Media Group ("NMG"). The New Russian Business was established to comply with changes in Russian legislation that limit foreign ownership.
No
cash consideration was exchanged in the transaction. NMG contributed a free-to-air ("FTA") license which enables advertising for the New Russian Business. As part of the transaction, Discovery obtained a
20%
ownership interest, which is accounted for under the equity method of accounting. The loss on contribution of the Russian business included
$15 million
of goodwill allocated to the transaction based on the relative fair values of the Russian business disposed of and the portion of the reporting unit that was retained. Although Discovery no longer consolidates the Russian business, Discovery earns revenue by providing content and brands to the New Russian Business under long-term licensing arrangements. The Russian business was included in the International Networks reportable segment; the licensing arrangements are reported as distribution revenue in the International Networks reportable segment. (See Note 21.)
Radio
On
June 30, 2015
, Discovery sold its radio businesses in Northern Europe to Bauer Media Group ("Bauer") for total consideration, net of cash disposed of
€60 million
(
$67 million
), which includes
€54 million
(
$61 million
) of net cash received at closing and
€6 million
(
$6 million
) for the fair value of contingent consideration. The final amount of contingent consideration payable, up to a maximum of
€18 million
(
$19 million
), will be based on 2015 financial results of the radio business, which have not yet been finalized, and is subject to a dispute resolution process under the purchase agreement. Discovery recorded a pretax loss of
$12 million
upon completion of the sale, which includes adjustments to the fair value of contingent consideration receivable and working capital adjustments. The loss on the disposal of the radio business includes
$26 million
of goodwill allocated to the transaction based on the relative fair values of the radio business disposed of and the portion of the reporting unit that was retained.
The Company determined that the disposal did not meet the definition of a discontinued operation because it did not represent a strategic shift that had a significant impact on the Company's operations and consolidated financial results. The income before income taxes impact of the Company's radio businesses was
zero
and losses of
$5 million
and
$9 million
for the years ended
December 31,
2015
,
2014
and
2013
, respectively. The Company's radio businesses were included in the International Networks reportable segment.
80
DISCOVERY COMMUNICATIONS, INC.
NOTES TO CONSOLIDATED FINANCIAL STATEMENTS
HowStuffWorks, LLC
On May 30, 2014, Discovery sold HowStuffWorks, LLC ("HSW"), a commercial website which uses various media to explain complex concepts, terminology and mechanisms, to Blucora, Inc. (“Blucora”). Blucora paid Discovery
$45 million
, and Discovery recorded a pretax gain of
$31 million
upon completion of the sale. HSW was included in the U.S. Networks reportable segment. The Company determined that the disposal did not meet the definition of a discontinued operation due to the migration of sales to its remaining digital businesses.
Petfinder
On July 15, 2013, the Company sold the domain name and business operations of the Petfinder.com website ("Petfinder"). The sale of Petfinder resulted in a
$19 million
pretax gain, which has been reflected in gain on disposition in the consolidated statements of operations. Petfinder was included in the U.S. Networks reportable segment.
The Company’s investments consisted of the following (in millions).
|
|
|
December 31,
|
||||||||
|
Category
|
Balance Sheet Location
|
2015
|
2014
|
|||||||
|
Trading securities:
|
||||||||||
|
Mutual funds
|
Prepaid expenses and other current assets
|
$
|
149
|
|
$
|
147
|
|
|||
|
Equity method investments
|
Equity method investments
|
567
|
|
644
|
|
|||||
|
Available-for-sale securities:
|
||||||||||
|
Common stock
|
Other noncurrent assets
|
81
|
|
—
|
|
|||||
|
Common stock - pledged
|
Other noncurrent assets
|
81
|
|
—
|
|
|||||
|
Cost method investments
|
Other noncurrent assets
|
43
|
|
29
|
|
|||||
|
Total investments
|
$
|
921
|
|
$
|
820
|
|
||||
Trading Securities
Trading securities include investments in mutual funds held in a separate trust, which are owned as part of the Company’s supplemental retirement plan. (See Note 14.)
Equity Method Investments
In the normal course of business, the Company makes investments that support its underlying business strategy and enable it to enter new markets and develop programming. All equity method investees are privately owned. The carrying values of the Company’s equity method investments are consistent with its ownership in the underlying net assets of the investees, except for OWN because the Company has recorded losses in excess of its ownership interest. Certain of the Company's equity method investments are VIEs, for which the Company is not the primary beneficiary. As of
December 31, 2015
, the Company’s estimated risk of loss for all its VIEs including the investment carrying values, unfunded contractual commitments, and guarantees made on behalf of VIEs was approximately
$433 million
. The Company's estimated risk of loss excludes the non-contractual future funding of VIEs. The aggregate carrying values of these VIE equity method investments were
$423 million
and
$461 million
as of
December 31, 2015
and
2014
, respectively. The Company recognized its portion of net income and losses generated by VIEs of
$30 million
in income,
$45 million
in income and
$10 million
in losses for
2015
,
2014
and
2013
, respectively, in income from equity investees, net on the consolidated statements of operations.
OWN
OWN is a pay-TV network and website that provides adult lifestyle content, which is focused on self-discovery, self-improvement and entertainment. Since the initial equity was not sufficient to fund OWN's activities without additional subordinated financial support in the form of a note receivable held by the Company, OWN is a VIE. While the Company and Harpo, Inc. ("Harpo") are partners who share equally in voting control, power is not shared because Harpo holds operational rights related to programming and marketing, as well as selection and retention of key management, that significantly impact OWN’s economic performance. Accordingly, the Company has determined that it is not the primary beneficiary of OWN and accounts for
81
DISCOVERY COMMUNICATIONS, INC.
NOTES TO CONSOLIDATED FINANCIAL STATEMENTS
its investment in OWN using the equity method. However, the Company provides OWN content licenses and services, such as distribution, sales and administrative support, for a fee and has provided OWN funding. (See Note 19.)
The Company's combined advances to and note receivable from OWN, including accrued interest, were
$384 million
and
$457 million
as of
December 31, 2015
and
December 31, 2014
, respectively. On April 30, 2015, Oprah Winfrey agreed to extend her exclusivity agreement with OWN and the note receivable agreement was modified to reduce its interest rate, compounded annually, from
7.5%
to
5.0%
, retroactive to January 1, 2014. During
2015
, the Company received net repayments of
$82 million
from OWN, accrued interest on the note receivable of
$23 million
and reduced the note receivable by
$14 million
for the change in interest rate. During
2014
, the Company received net repayments of
$56 million
from OWN and accrued interest on the note receivable of
$33 million
.
The note receivable is secured by the net assets of OWN. While the Company has no further funding commitments, the Company will provide additional funding to OWN, if necessary, and expects to recoup amounts funded. There can be no event of default on the borrowing until 2023. However, borrowings are scheduled for repayment
four
years after the borrowing date to the extent that OWN has excess cash to repay the borrowings then due. Following such repayment, OWN’s subsequent cash distributions will be shared equally between the Company and Harpo. OWN began repaying amounts owed to the Company during 2013.
In accordance with the venture agreement, losses generated by OWN are allocated to both investors based on their proportionate ownership interests. However, the Company has recorded its portion of OWN’s losses based upon accounting policies for equity method investments. Prior to the contribution of the Discovery Health network to OWN at its launch, the Company had recognized
$104 million
, or
100%
, of OWN’s net losses. During the three months ended March 31, 2012, accumulated operating losses at OWN exceeded the equity contributed to OWN, and Discovery began again to record
100%
of OWN’s net losses. Although OWN has become profitable, the Company will record
100%
of any net losses to the extent they occur resulting from OWN's operations as long as Discovery has provided all funding to OWN and OWN’s accumulated losses continue to exceed the equity contributed. All of OWN's net income has been and will continue to be recorded by the Company until the Company recovers losses absorbed in excess of the Company's equity ownership interest.
The carrying value of the Company’s investment in OWN of
$373 million
and
$424 million
as of
December 31, 2015
and
December 31, 2014
, respectively, includes the Company's note receivable and accumulated investment losses. The Company monitors the financial results of OWN along with other relevant business information to assess the recoverability of the OWN note receivable. There has been
no
impairment of the OWN note receivable.
Harpo has the right to require the Company to purchase all or part of Harpo’s interest in OWN at fair market value up to a maximum put amount during a 90-day window every
two and a half
years commencing January 1, 2016. The maximum put amount ranges from
$100 million
on the first put exercise date up to a cumulative cap of
$400 million
on the fifth put exercise date. The Company has not recorded amounts for the put right because the fair value of this put right was
zero
as of
December 31, 2015
and
December 31, 2014
.
Other Equity Method Investments
On
September 23, 2014
, the Company acquired a
50%
equity method ownership interest in All3Media, a production studio company, for a cash payment of
£90 million
(
$147 million
) and with an enterprise value of
£556 million
(
$912 million
). All3Media recapitalized its debt structure to effect the transaction. All3Media is not a VIE.
On
March 31, 2015
and
May 30, 2014
, the Company acquired from TF1 a controlling interest in each of its Eurosport France and Eurosport International equity method investments, respectively, by increasing its ownership stake from
20%
to
51%
. As a result, the Company changed its accounting for Eurosport France and Eurosport International from equity method investments to consolidated subsidiaries as of their respective acquisition dates. (See Note 3.) On
October 1, 2015
, the Company acquired the remaining
49%
of Eurosport upon TF1's exercise of its right to put. (See Note 11.)
On
September 23, 2014
, the Company acquired an additional
10%
ownership interest in Discovery Family and obtained a controlling financial interest. The purchase increased the Company's interest from
50%
to
60%
. As a result, the Company changed its accounting for Discovery Family from an equity method investment to a consolidated subsidiary. (See Note 3.)
Available-for-Sale Securities
On November 12, 2015, the Company acquired
5 million
shares, or
3.4%
, of Lions Gate Entertainment Corp. ("Lionsgate"), an entertainment company, for
$195 million
. Lionsgate operates in the motion picture production and distribution, television programming and syndication, home entertainment, family entertainment and digital distribution businesses. As the shares have a readily determinable fair value and the Company has the intent to retain the investment, the shares are classified as available-for-sale ("AFS") securities.
82
DISCOVERY COMMUNICATIONS, INC.
NOTES TO CONSOLIDATED FINANCIAL STATEMENTS
In connection with this transaction, the Company hedged
50%
of the shares with an equity collar (the “Lionsgate Collar”). When the share price of Lionsgate is within the boundaries of the collar, the Company records the gains or losses on the Lionsgate AFS securities as a component of other comprehensive (loss) income. When the share price of the Lionsgate AFS is outside the boundaries of the collar, the Company records the gain or loss for the change in the fair value of the hedged portion of Lionsgate that is outside the boundaries of the collar as a component of other (expense) income to offset to the gain/ loss from the change in intrinsic value of the associated fair value hedge. For the year ended December 31, 2015, the Company recorded a temporary unrealized loss of
$33 million
related to this investment, of which
$31 million
was recorded as a component of other comprehensive (loss) income and
$2 million
was recorded as a component of other (expense) income. The Company has pledged to the derivative counterparty
2.5 million
shares as collateral for the Lionsgate Collar through the maturity dates of the Lionsgate Collar; the counterparty to the Lionsgate Collar has the right to re-use all of the pledged shares and collect dividends. (See Note 10.)
The components of the Company's available-for-sale investments, which are included in other non-current assets, are summarized in the table below.
|
December 31, 2015
|
||||||||||||
|
Cost
|
Unrealized Losses
|
Fair Market Value
|
||||||||||
|
Available-for sale securities
|
$
|
195
|
|
$
|
(33
|
)
|
$
|
162
|
|
|||
Cost Method Investments
Cost method investments include ownership rights in entities that do not provide the Company with control or significant influence in these investments and that have no readily determinable fair values. The Company's cost method investments as of
December 31, 2015
primarily include an educational website and Formula E racing. The Company's cost method investments as of
December 31, 2014
primarily included an educational website.
83
DISCOVERY COMMUNICATIONS, INC.
NOTES TO CONSOLIDATED FINANCIAL STATEMENTS
Fair value is defined as the amount that would be received for selling an asset or paid to transfer a liability in an orderly transaction between market participants. Assets and liabilities carried at fair value are classified in the following three categories:
|
Level 1
|
–
|
Quoted prices for identical instruments in active markets.
|
|
Level 2
|
–
|
Quoted prices for similar instruments in active markets; quoted prices for identical or similar instruments in markets that are not active; and model-derived valuations in which all significant inputs and significant value drivers are observable in active markets.
|
|
Level 3
|
–
|
Valuations derived from techniques in which one or more significant inputs are unobservable.
|
The table below presents assets and liabilities measured at fair value on a recurring basis (in millions).
|
|
|
December 31, 2015
|
||||||||||||||||
|
Category
|
Balance Sheet Location
|
Level 1
|
Level 2
|
Level 3
|
Total
|
|||||||||||||
|
Assets:
|
||||||||||||||||||
|
Trading securities - mutual funds
|
Prepaid expenses and other current assets
|
$
|
149
|
|
$
|
—
|
|
$
|
—
|
|
$
|
149
|
|
|||||
|
Available-for-sale securities:
|
||||||||||||||||||
|
Common stock
|
Other noncurrent assets
|
81
|
|
—
|
|
—
|
|
81
|
|
|||||||||
|
Common stock - pledged
|
Other noncurrent assets
|
81
|
|
—
|
|
—
|
|
81
|
|
|||||||||
|
Derivatives:
|
||||||||||||||||||
|
Foreign exchange
|
Prepaid expenses and other current assets
|
—
|
|
21
|
|
—
|
|
21
|
|
|||||||||
|
Foreign exchange
|
Other noncurrent assets
|
—
|
|
2
|
|
—
|
|
2
|
|
|||||||||
|
Equity (Lionsgate Collar)
|
Other noncurrent assets
|
—
|
|
15
|
|
—
|
|
15
|
|
|||||||||
|
Total
|
$
|
311
|
|
$
|
38
|
|
$
|
—
|
|
$
|
349
|
|
||||||
|
Liabilities:
|
||||||||||||||||||
|
Deferred compensation plan
|
Accrued liabilities
|
$
|
149
|
|
$
|
—
|
|
$
|
—
|
|
$
|
149
|
|
|||||
|
Derivatives:
|
||||||||||||||||||
|
Foreign exchange
|
Accrued liabilities
|
—
|
|
4
|
|
—
|
|
4
|
|
|||||||||
|
Total
|
$
|
149
|
|
$
|
4
|
|
$
|
—
|
|
$
|
153
|
|
||||||
|
December 31, 2014
|
||||||||||||||||||
|
Category
|
Balance Sheet Location
|
Level 1
|
Level 2
|
Level 3
|
Total
|
|||||||||||||
|
Assets:
|
||||||||||||||||||
|
Trading securities - mutual funds
|
Prepaid expenses and other current assets
|
$
|
147
|
|
$
|
—
|
|
$
|
—
|
|
$
|
147
|
|
|||||
|
Derivatives:
|
||||||||||||||||||
|
Foreign exchange
|
Prepaid expenses and other current assets
|
—
|
|
17
|
|
—
|
|
17
|
|
|||||||||
|
Foreign exchange
|
Other noncurrent assets
|
—
|
|
7
|
|
—
|
|
7
|
|
|||||||||
|
Total
|
$
|
147
|
|
$
|
24
|
|
$
|
—
|
|
$
|
171
|
|
||||||
|
Liabilities:
|
||||||||||||||||||
|
Deferred compensation plan
|
Accrued liabilities
|
$
|
147
|
|
$
|
—
|
|
$
|
—
|
|
$
|
147
|
|
|||||
|
Derivatives:
|
||||||||||||||||||
|
Foreign exchange
|
Accrued liabilities
|
—
|
|
1
|
|
—
|
|
1
|
|
|||||||||
|
Interest rate
|
Accrued liabilities
|
—
|
|
28
|
|
—
|
|
28
|
|
|||||||||
|
TFI Eurosport France put right
|
Accrued liabilities
|
—
|
|
—
|
|
4
|
|
4
|
|
|||||||||
|
Total
|
$
|
147
|
|
$
|
29
|
|
$
|
4
|
|
$
|
180
|
|
||||||
84
DISCOVERY COMMUNICATIONS, INC.
NOTES TO CONSOLIDATED FINANCIAL STATEMENTS
Trading securities are comprised of investments in mutual funds held in a separate trust which are owned as part of the Company’s deferred compensation plan. The fair value of Level 1 trading securities was determined by reference to the quoted market price per unit in active markets multiplied by the number of units held without consideration of transaction costs. The fair value of the related deferred compensation plan liability was determined based on the fair value of the related investments elected by employees.
Available-for-sale securities represent equity investments in highly liquid instruments. The fair value of Level 1 available-for-sale securities was determined by reference to the quoted market price per unit in active markets multiplied by the number of units held without consideration of transaction costs. (See Note 4).
Derivative financial instruments are comprised of foreign exchange contracts used by the Company to modify exposure to market risks from foreign exchange, interest rate contracts used to modify exposure to market risks from interest rates for forecasted issuances of debt and fair value hedges to modify exposure to AFS securities. (See Note 10.) The fair value of Level 2 derivative financial instruments was determined using a market-based approach. As of
December 31, 2014
, TF1 had the conditional right to require the Company to purchase its remaining shares in Eurosport France at various dates should Discovery complete its planned acquisition of a controlling interest in Eurosport France. The fair value measurement was determined through the use of a Monte Carlo simulation model. The Monte Carlo model simulates the various sources of uncertainty impacting the value of a financial instrument and uses those simulations to develop an estimated fair value for the instrument. The valuation methodology for the TF1 put for Eurosport France was based on unobservable estimates and judgments, and therefore represented a Level 3 fair value measurement. (See Note 3.)
In addition to the financial instruments listed in the tables above, the Company has other financial instruments, including cash deposits, accounts receivable, accounts payable, commercial paper, borrowings under the revolving credit facility, capital leases and senior notes. The carrying values for such financial instruments, other than senior notes, each approximated their fair values as of
December 31, 2015
and December 31, 2014. The estimated fair value of the Company’s outstanding senior notes using quoted prices from over the counter markets, considered Level 2 inputs, was
$6.6 billion
and $
7.2 billion
as of
December 31, 2015 and 2014
, respectively.
The following table presents the components of content rights (in millions).
|
|
December 31,
|
|||||||
|
|
2015
|
2014
|
||||||
|
Produced content rights:
|
||||||||
|
Completed
|
$
|
3,624
|
|
$
|
3,242
|
|
||
|
In-production
|
376
|
|
377
|
|
||||
|
Coproduced content rights:
|
||||||||
|
Completed
|
691
|
|
696
|
|
||||
|
In-production
|
62
|
|
83
|
|
||||
|
Licensed content rights:
|
||||||||
|
Acquired
|
1,078
|
|
949
|
|
||||
|
Prepaid
|
96
|
|
82
|
|
||||
|
Content rights, at cost
|
5,927
|
|
5,429
|
|
||||
|
Accumulated amortization
|
(3,584
|
)
|
(3,127
|
)
|
||||
|
Total content rights, net
|
2,343
|
|
2,302
|
|
||||
|
Current portion
|
(313
|
)
|
(329
|
)
|
||||
|
Noncurrent portion
|
$
|
2,030
|
|
$
|
1,973
|
|
||
85
DISCOVERY COMMUNICATIONS, INC.
NOTES TO CONSOLIDATED FINANCIAL STATEMENTS
Content expense is included in costs of revenues on the consolidated statements of operations and consisted of the following (in millions).
|
For the year ended December 31,
|
||||||||||||
|
2015
|
2014
|
2013
|
||||||||||
|
Content amortization
|
$
|
1,628
|
|
$
|
1,462
|
|
$
|
1,157
|
|
|||
|
Other production charges
|
231
|
|
155
|
|
100
|
|
||||||
|
Content impairments
(a)
|
81
|
|
95
|
|
33
|
|
||||||
|
Total content expense
|
$
|
1,940
|
|
$
|
1,712
|
|
$
|
1,290
|
|
|||
(a)
Content impairments are generally recorded as a component of costs of revenue. However during the years ended
December 31, 2015 and 2014
, content impairments of $
21 million
and
$55 million
, respectively, were reflected as a component of restructuring and other charges. These charges resulted from the cancellation of certain high profile series due to legal circumstances pertaining to the associated talent and from the consolidation and subsequent rebranding of The Hub Network to Discovery Family in 2014. There were
no
content impairments reflected as a component of restructuring and other charges for the year ended
December 31, 2013
. (See Note 15.)
As of
December 31, 2015
, the Company estimates that approximately
96%
of unamortized costs of content rights, excluding content in-production and prepaid licenses, will be amortized within the next
three
years. As of
December 31, 2015
, the Company will amortize $
963 million
of the above unamortized content rights, excluding content in-production and prepaid licenses, during the next twelve months.
Property and equipment consisted of the following (in millions).
|
|
December 31,
|
||||||
|
|
2015
|
2014
|
|||||
|
Land, buildings and leasehold improvements
|
$
|
338
|
|
$
|
340
|
|
|
|
Broadcast equipment
|
603
|
|
612
|
|
|||
|
Capitalized software costs
|
311
|
|
258
|
|
|||
|
Office equipment, furniture, fixtures and other
|
309
|
|
332
|
|
|||
|
Property and equipment, at cost
|
1,561
|
|
1,542
|
|
|||
|
Accumulated depreciation
|
(1,073
|
)
|
(988
|
)
|
|||
|
Property and equipment, net
|
$
|
488
|
|
$
|
554
|
|
|
Property and equipment includes assets acquired under capital lease arrangements, primarily satellite transponders classified as broadcast equipment, with gross carrying values of
$271 million
and
$274 million
as of
December 31, 2015
and
2014
, respectively. The related accumulated amortization for capital lease assets was
$142 million
and
$120 million
as of
December 31, 2015
and
2014
, respectively.
The net book value of capitalized software costs was
$90 million
and
$63 million
as of
December 31, 2015
and
2014
, respectively.
Depreciation expense for property and equipment, including amortization of capitalized software costs and capital lease assets, totaled
$138 million
,
$131 million
and
$111 million
for
2015
,
2014
and
2013
, respectively.
In addition to the capitalized property and equipment included in the above table, the Company rents certain facilities and equipment under operating lease arrangements. Rental expense for operating leases totaled
$134 million
,
$143 million
and
$94 million
for
2015
,
2014
and
2013
, respectively.
86
DISCOVERY COMMUNICATIONS, INC.
NOTES TO CONSOLIDATED FINANCIAL STATEMENTS
Goodwill
Changes in the carrying value of goodwill were as follows (in millions).
|
U.S.
Networks
|
International
Networks
|
Education and Other
|
Total
|
|||||||||||||
|
December 31, 2013
|
$
|
4,989
|
|
$
|
2,296
|
|
$
|
56
|
|
$
|
7,341
|
|
||||
|
Acquisitions (Note 3)
|
310
|
|
794
|
|
28
|
|
1,132
|
|
||||||||
|
Dispositions (Note 3)
|
(12
|
)
|
—
|
|
—
|
|
(12
|
)
|
||||||||
|
Foreign currency translation
|
—
|
|
(221
|
)
|
(4
|
)
|
(225
|
)
|
||||||||
|
December 31, 2014
|
5,287
|
|
2,869
|
|
80
|
|
8,236
|
|
||||||||
|
Acquisitions (Note 3)
|
—
|
|
123
|
|
—
|
|
123
|
|
||||||||
|
Dispositions (Note 3)
|
—
|
|
(41
|
)
|
—
|
|
(41
|
)
|
||||||||
|
Foreign currency translation
|
—
|
|
(151
|
)
|
(3
|
)
|
(154
|
)
|
||||||||
|
December 31, 2015
|
$
|
5,287
|
|
$
|
2,800
|
|
$
|
77
|
|
$
|
8,164
|
|
||||
The carrying amount of goodwill at the U.S. Networks segment included accumulated impairments of
$20 million
at each of
December 31, 2015
and
2014
.
Intangible Assets
Finite-lived intangible assets consisted of the following (in millions, except years).
|
|
Weighted
Average
Amortization
Period (Years)
|
December 31, 2015
|
December 31, 2014
|
||||||||||||||||||||||
|
Gross
|
Accumulated
Amortization
|
Net
|
Gross
|
Accumulated
Amortization
|
Net
|
||||||||||||||||||||
|
Intangible assets subject to amortization:
|
|||||||||||||||||||||||||
|
Trademarks
|
10
|
$
|
433
|
|
$
|
(130
|
)
|
$
|
303
|
|
$
|
489
|
|
$
|
(99
|
)
|
$
|
390
|
|
||||||
|
Customer relationships
|
17
|
1,664
|
|
(481
|
)
|
1,183
|
|
1,701
|
|
(370
|
)
|
1,331
|
|
||||||||||||
|
Other
|
15
|
105
|
|
(25
|
)
|
80
|
|
107
|
|
(21
|
)
|
86
|
|
||||||||||||
|
Total
|
$
|
2,202
|
|
$
|
(636
|
)
|
$
|
1,566
|
|
$
|
2,297
|
|
$
|
(490
|
)
|
$
|
1,807
|
|
|||||||
Indefinite-lived intangible assets not subject to amortization (in millions):
|
|
December 31,
|
|||||||
|
|
2015
|
2014
|
||||||
|
Intangible assets not subject to amortization:
|
||||||||
|
Trademarks
|
$
|
164
|
|
$
|
164
|
|
||
Amortization expense for finite-lived intangible assets reflects the pattern in which the assets' economic benefits are consumed over their estimated useful lives using the straight-line method. Amortization expense related to finite-lived intangible assets was
$192 million
,
$198 million
and
$165 million
for
2015
,
2014
and
2013
, respectively.
Amortization expense relating to intangible assets subject to amortization for each of the next five years and thereafter is estimated to be as follows (in millions).
|
2016
|
2017
|
2018
|
2019
|
2020
|
Thereafter
|
|||||||||||||||||||
|
Amortization expense
|
$
|
181
|
|
$
|
171
|
|
$
|
161
|
|
$
|
157
|
|
$
|
152
|
|
$
|
744
|
|
||||||
The amount and timing of the estimated expenses in the above table may vary due to future acquisitions, dispositions, impairments, changes in estimated useful lives or changes in foreign currency exchange rates.
87
DISCOVERY COMMUNICATIONS, INC.
NOTES TO CONSOLIDATED FINANCIAL STATEMENTS
Impairment Analysis
During the fourth quarter of
2015
, the Company performed a qualitative goodwill impairment assessment for all but three reporting units. This assessment included, but was not limited to, consideration of the results of the Company's most recent quantitative impairment test, macroeconomic conditions, industry and market conditions, cost factors, cash flows, changes in key personnel and the Company's share price. Based on this assessment, the Company determined that it was more likely than not that the fair value of those reporting units exceeded their carrying values. Therefore,
no
goodwill impairment was recorded during
2015
. The Company performed a quantitative goodwill impairment assessment for the remaining three reporting units. The estimated fair value of each reporting unit exceeded its carrying value and, therefore,
no
impairment was recorded. The fair values of the reporting units were determined using a combination of DCF and market-based valuation models. Cash flows were determined based on Company estimates of future operating results and discounted using an internal rate of return based on an assessment of the risk inherent in future cash flows of the respective reporting unit.
During the fourth quarter of
2014
, the Company performed a qualitative goodwill impairment assessment for all reporting units, and determined that it was more likely than not that the fair value of those reporting units exceeded their carrying values.
During the fourth quarter of
2013
, the Company performed a quantitative goodwill impairment assessment for all reporting units. Due to the period of time elapsed since the last quantitative impairment test in 2010, the Company elected to proceed to the first step of the quantitative goodwill impairment test for all reporting units. The estimated fair value of each reporting unit exceeded its carrying value and, therefore,
no
impairment was recorded. The fair values of the reporting units were determined using DCF and market-based valuation models. The market-based valuation models utilized multiples of earnings before interest, taxes, depreciation and amortization (“EBITDA”). Both the DCF and market-based models resulted in substantially similar fair values. Cash flows were determined based on Company estimates of future operating results and discounted using an internal rate of return based on an assessment of the risk inherent in future cash flows of the respective reporting unit.
88
DISCOVERY COMMUNICATIONS, INC.
NOTES TO CONSOLIDATED FINANCIAL STATEMENTS
The table below presents the components of outstanding debt (in millions).
|
December 31,
|
||||||||
|
2015
|
2014
|
|||||||
|
3.70% Senior notes, semi-annual interest, due June 2015
|
$
|
—
|
|
$
|
850
|
|
||
|
5.625% Senior notes, semi-annual interest, due August 2019
|
500
|
|
500
|
|
||||
|
5.05% Senior notes, semi-annual interest, due June 2020
|
1,300
|
|
1,300
|
|
||||
|
4.375% Senior notes, semi-annual interest, due June 2021
|
650
|
|
650
|
|
||||
|
2.375% Senior notes, euro denominated, annual interest, due March 2022
|
328
|
|
365
|
|
||||
|
3.30% Senior notes, semi-annual interest, due May 2022
|
500
|
|
500
|
|
||||
|
3.25% Senior notes, semi-annual interest, due April 2023
|
350
|
|
350
|
|
||||
|
3.45% Senior notes, semi-annual interest, due March 2025
|
300
|
|
—
|
|
||||
|
1.90% Senior notes, euro denominated, annual interest, due March 2027
|
656
|
|
—
|
|
||||
|
6.35% Senior notes, semi-annual interest, due June 2040
|
850
|
|
850
|
|
||||
|
4.95% Senior notes, semi-annual interest, due May 2042
|
500
|
|
500
|
|
||||
|
4.875% Senior notes, semi-annual interest, due April 2043
|
850
|
|
850
|
|
||||
|
Revolving credit facility
|
782
|
|
38
|
|
||||
|
Commercial paper
|
93
|
|
229
|
|
||||
|
Capital lease obligations
|
142
|
|
187
|
|
||||
|
Total debt
|
7,801
|
|
7,169
|
|
||||
|
Unamortized discount and debt issuance costs
|
(66
|
)
|
(60
|
)
|
||||
|
Debt, net
|
7,735
|
|
7,109
|
|
||||
|
Current portion of debt
|
(119
|
)
|
(1,107
|
)
|
||||
|
Noncurrent portion of debt
|
$
|
7,616
|
|
$
|
6,002
|
|
||
Senior Notes
On
March 19, 2015
, Discovery Communications, LLC ("DCL"), a wholly-owned subsidiary of the Company, issued
€600 million
principal amount (
$637 million
, at issuance based on the exchange rate of
$1.06
per euro at
March 19, 2015
) of
1.90%
senior notes due
March 19, 2027
(the "2015 Euro Notes"). The proceeds received by DCL from the offering were net of a
$1 million
issuance discount and
$5 million
of debt issuance costs. Interest on the 2015 Euro Notes is payable annually on
March 19
of each year. The 2015 Euro Notes are denominated in euro and expose Discovery to fluctuations in foreign exchange rates in that currency. The current balance of the 2015 Euro Notes reflects changes in exchange rates; there have been no other changes to the balance. Discovery has reported the change in remeasurement for these 2015 Euro Notes as a component of
other (expense) income, net
in the consolidated statements of operations.
On
March 2, 2015
, DCL issued $
300 million
principal amount of
3.45%
senior notes due
March 15, 2025
(the "2015 USD Notes"). The proceeds received by DCL from the offering were net of an immaterial discount and
$2 million
of debt issuance costs. Interest on the 2015 USD Notes is payable semi-annually on
March 15
and
September 15
of each year. In contemplation of the issuance of the 2015 USD Notes, the Company terminated and settled all interest rate forward contracts with its counterparties, which were designated as cash flow hedges used to hedge the pricing of the 2015 USD Notes. (See Note 10.)
DCL has the option to redeem some or all of the senior notes at any time prior to their maturity by paying a make-whole premium, if the redemption date is prior to three months from the maturity date or by paying their principal amount on or after such date, plus, in each case, accrued and unpaid interest, if any, through the date of repurchase. All of DCL's outstanding senior notes are fully and unconditionally guaranteed on an unsecured and unsubordinated basis by Discovery and contain certain nonfinancial covenants, events of default and other customary provisions. The Company and DCL were in compliance with all covenants and customary provisions under DCL's outstanding senior notes, and there were no events of default as of
December 31, 2015
.
On March 31, 2015, the Company redeemed $
850 million
aggregate principal amount of its
3.70%
senior notes that had an original maturity of
June 1, 2015
. The repayment included a payment of $
1 million
for the original issue discount on the
3.70%
senior notes and resulted in a pretax loss on extinguishment of debt of $
5 million
for make-whole premiums. The loss on extinguishment of debt was reflected as a component of interest expense in the consolidated statements of operations.
89
DISCOVERY COMMUNICATIONS, INC.
NOTES TO CONSOLIDATED FINANCIAL STATEMENTS
Revolving Credit Facility
During the year ended December 31, 2015, DCL's revolving credit facility allowed DCL and certain designated foreign subsidiaries of DCL to borrow up to
$1.5 billion
, including a
$750 million
sublimit for multi-currency borrowings, a
$100 million
sublimit for the issuance of standby letters of credit and a
$50 million
sublimit for swingline loans. Borrowing capacity under this agreement is reduced by the outstanding borrowings under the commercial paper program discussed below. DCL also had the ability to request an increase of the revolving credit facility up to an aggregate additional
$1.0 billion
, upon the satisfaction of certain conditions. As of December 31, 2015, the revolving credit facility agreement provided for a maturity date of
June 20, 2019
. In February 2016, the Company amended and restated the revolving credit facility to extend DCL's borrowing capacity up to
$2.0 billion
, to eliminate the multi-currency borrowing sublimit, to extend the maturity date to February 4, 2021 and to provide the option to request up to two additional 364-day renewal periods.
As of
December 31, 2015
, the Company had outstanding borrowings under the revolving credit facility of
$782 million
at a weighted average interest rate of
1.55%
, of which
$207 million
was denominated in foreign currencies. As of
December 31, 2014
, the Company had outstanding borrowings under the revolving credit facility of
$38 million
at a weighted average interest rate of
1.98%
. The interest rate on borrowings under the revolving credit facility is variable based on DCL's then-current credit ratings for its publicly traded debt and changes in financial index rates. For dollar-denominated borrowings, the interest rate is based, at the Company's option, on either adjusted LIBOR plus a margin, or an alternate base rate plus a margin. For borrowings denominated in foreign currencies, the interest rate is based on adjusted LIBOR, plus a margin. The current margins are
1.10%
and
0.10%
, respectively, per annum for adjusted LIBOR and alternate base rate borrowings. A monthly facility fee is charged based on the total capacity of the facility, and interest is charged based on the amount borrowed on the facility. The current facility fee rate is
0.15%
per annum and subject to change based on DCL's then-current credit ratings. All obligations of DCL and the other borrowers under the revolving credit facility are unsecured and are fully and unconditionally guaranteed by Discovery.
The credit agreement governing the revolving credit facility contains customary representations, warranties and events of default, as well as affirmative and negative covenants. As of
December 31, 2015
, the Company, DCL and the other borrowers were in compliance with all covenants, and there were no events of default under the revolving credit facility.
Commercial Paper
The Company's commercial paper program is supported by the revolving credit facility described above. Outstanding commercial paper borrowings were
$93 million
with a weighted average interest rate of approximately
1.10%
as of
December 31, 2015
and
$229 million
with a weighted average interest rate of approximately
0.60%
as of
December 31, 2014
. The Company's outstanding commercial paper borrowings as of
December 31, 2015 and 2014
had maturities of less than
90
days.
Long-term Debt Repayment Schedule
The following table presents a summary of scheduled and estimated debt payments, excluding the revolving credit facility, commercial paper borrowings and capital lease obligations, for the succeeding five years based on the amount of debt outstanding as of
December 31, 2015
(in millions).
|
2016
|
2017
|
2018
|
2019
|
2020
|
Thereafter
|
|||||||||||||||||||
|
Long-term debt repayments
|
$
|
—
|
|
$
|
—
|
|
$
|
—
|
|
$
|
500
|
|
$
|
1,300
|
|
$
|
4,984
|
|
||||||
Scheduled payments for capital lease obligations outstanding as of
December 31, 2015
are disclosed in Note 20.
The Company uses derivative financial instruments to modify its exposure to market risks from changes in foreign currency exchange rates, interest rates and the fair value of investments classified as AFS securities. The Company does not enter into or hold derivative financial instruments for speculative trading purposes.
The Company designates foreign currency forward contracts as cash flow hedges to mitigate foreign currency risk arising from third-party revenue and inter-company licensing agreements. The Company also designates interest rate contracts used to hedge the pricing for certain senior notes as cash flow hedges. Gains and losses on the effective portion of designated cash flow hedges are initially recorded in
accumulated other comprehensive loss
on the consolidated balance sheets and reclassified into the statements of operations in the same line item in which the hedged item is recorded in the same period as the hedged item affects earnings. If it becomes probable that a forecasted transaction will not occur, any related gains and losses recorded in
accumulated other comprehensive loss
on the consolidated balance sheets are reclassified to
other (expense) income, net
on the consolidated statements of operations in that period.
90
DISCOVERY COMMUNICATIONS, INC.
NOTES TO CONSOLIDATED FINANCIAL STATEMENTS
During the three months ended March 31, 2015, the Company terminated and settled its interest rate cash flow hedges following the pricing of the 2015 USD Notes. The total notional value of the interest rate forward contracts at the termination date was $
490 million
, which exceeded the
$300 million
principal amount of the 2015 USD Notes. (See Note 9.) Of the $
40 million
pretax loss recorded in
accumulated other comprehensive loss
at the termination date, $
29 million
was an effective cash flow hedge that will be amortized as an adjustment to interest expense over the ten year term of the 2015 USD Notes consistent with amortization of the debt discount. The remaining hedge ineffectiveness of $
11 million
was reclassified into
other (expense) income, net
on the consolidated statements of operations during the three months ended March 31, 2015, because the forecasted borrowing transaction was no longer probable.
The Company designates derivative instruments used to mitigate the risk of changes in the fair value of its AFS investments as fair value hedges. On November 12, 2015 the Company entered into the Lionsgate Collar, designed to mitigate the risk of market fluctuations with respect to 50% of the Lionsgate shares held by the Company. (See Note 4.) The collar, which qualifies for hedge accounting, settles in three tranches starting in 2019 and ending in 2022. Gains and losses from the Lionsgate Collar, including any ineffective portion and amounts excluded from the assessment of effectiveness, and the offsetting changes in fair value of the AFS investment outside the boundaries of the collar are recorded in
other (expense) income, net
on the consolidated statement of operations.
The Company may also enter into derivative instruments that are not designated as hedges and do not qualify for hedge accounting. During the three months ended September 30, 2015, the Company entered into foreign exchange forward contracts and a zero-cost collar in connection with the purchase of TF1's mandatorily redeemable noncontrolling interest in Eurosport that closed on
October 1, 2015
. (See Note 11.) These derivatives, which economically hedged the Company's exposure to fluctuations in foreign currency exchange rates, did not qualify for hedge accounting. Realized and unrealized gains and losses on contracts that do not qualify for hedge accounting are reflected in
other (expense) income, net
on the consolidated statements of operations.
The Company records all unsettled derivative contracts at their gross fair values on the consolidated balance sheets. (See Note 5.) There were
no
amounts eligible to be offset under master netting agreements as of
December 31, 2015
and
December 31, 2014
.
The cash flows from the effective portion of derivative instruments used as hedges are classified in the consolidated statements of cash flows in the same section as the cash flows from the hedged item. For example, the cash paid to settle the effective portion of interest rate derivatives intended to hedge the pricing of the 2015 USD Notes during the
year ended December 31, 2015
is reported as a financing activity in the consolidated statements of cash flows consistent with the classification of cash proceeds from borrowings of debt, net of discount. The cash flows from the ineffective portion of derivative instruments used as hedges and derivative contracts not designated as hedges are reported as investing activities in the consolidated statements of cash flows.
The following table summarizes the notional amount and fair value of the Company's derivative positions (in millions).
|
December 31, 2015
|
December 31, 2014
|
|||||||||||||||||
|
Balance Sheet Location
|
Notional
|
Fair Value
|
Notional
|
Fair Value
|
||||||||||||||
|
Derivatives designated as hedges:
|
||||||||||||||||||
|
Foreign exchange
|
Prepaid expenses and other current assets
|
$
|
523
|
|
$
|
21
|
|
$
|
425
|
|
$
|
17
|
|
|||||
|
Foreign exchange
|
Other noncurrent assets
|
$
|
55
|
|
$
|
2
|
|
$
|
20
|
|
$
|
7
|
|
|||||
|
Foreign exchange
|
Accrued liabilities
|
$
|
290
|
|
$
|
4
|
|
$
|
35
|
|
$
|
1
|
|
|||||
|
Interest rate
|
Accrued liabilities
|
$
|
—
|
|
$
|
—
|
|
$
|
475
|
|
$
|
28
|
|
|||||
|
Equity
|
Other noncurrent assets
|
$
|
97
|
|
$
|
15
|
|
$
|
—
|
|
$
|
—
|
|
|||||
|
Derivatives not designated as hedges:
|
||||||||||||||||||
|
Foreign exchange
|
Prepaid expenses and other current assets
|
$
|
—
|
|
$
|
—
|
|
$
|
3
|
|
$
|
—
|
|
|||||
91
DISCOVERY COMMUNICATIONS, INC.
NOTES TO CONSOLIDATED FINANCIAL STATEMENTS
The following table presents the pretax impact of derivatives designated as cash flow hedges on income and
other comprehensive (loss) income
(in millions).
|
|
Year Ended December 31,
|
|||||||||||
|
2015
|
2014
|
2013
|
||||||||||
|
Gains (losses) recognized in accumulated other comprehensive loss
|
||||||||||||
|
Foreign exchange
|
$
|
34
|
|
$
|
14
|
|
$
|
10
|
|
|||
|
Interest rate
|
$
|
(11
|
)
|
$
|
(28
|
)
|
$
|
—
|
|
|||
|
Gains reclassified into income from accumulated other comprehensive loss (effective portion)
|
||||||||||||
|
Foreign exchange - distribution revenue
|
$
|
23
|
|
$
|
—
|
|
$
|
—
|
|
|||
|
Foreign exchange - advertising revenue
|
$
|
2
|
|
$
|
—
|
|
$
|
—
|
|
|||
|
Foreign exchange - costs of revenues
|
$
|
9
|
|
$
|
1
|
|
$
|
—
|
|
|||
|
Foreign exchange - selling, general and administrative expense
|
$
|
—
|
|
$
|
—
|
|
$
|
1
|
|
|||
|
Foreign exchange - other (expense) income, net
|
$
|
4
|
|
$
|
3
|
|
$
|
—
|
|
|||
|
Interest rate - interest expense
|
$
|
(3
|
)
|
$
|
—
|
|
$
|
—
|
|
|||
|
Losses reclassified into income from accumulated other comprehensive loss (ineffective portion)
|
||||||||||||
|
Interest rate - other (expense) income, net
|
$
|
(11
|
)
|
$
|
—
|
|
$
|
—
|
|
|||
If current fair values as of
December 31, 2015
remained static over the next twelve months, the Company would reclassify
$12 million
of net deferred gains from
accumulated other comprehensive loss
into income in the next twelve months.
The following table presents the pretax impact of derivatives designated as fair value hedges on income, including offsetting changes in fair value of the hedged items and amounts excluded from the assessment of effectiveness (in millions). There were
no
amounts of ineffectiveness recognized on fair value hedges for the
year ended December 31, 2015
. The Company had no outstanding fair value hedges during the
years ended December 31, 2014 and December 31, 2013
.
|
|
Year Ended December 31,
|
|||||||||||
|
2015
|
2014
|
2013
|
||||||||||
|
Gains on changes in the intrinsic fair value of equity contracts
|
$
|
2
|
|
$
|
—
|
|
$
|
—
|
|
|||
|
Losses on changes in fair value of hedged AFS
|
(2
|
)
|
—
|
|
—
|
|
||||||
|
Fair value of equity contracts excluded from effectiveness assessment
|
10
|
|
—
|
|
—
|
|
||||||
|
Total in other (expense) income, net
|
$
|
10
|
|
$
|
—
|
|
$
|
—
|
|
|||
The following table presents the pretax gains (losses) on derivatives not designated as hedges and recognized in other (expense) income, net in the consolidated statements of operations (in millions).
|
Year Ended December 31,
|
||||||||||||
|
|
2015
|
2014
|
2013
|
|||||||||
|
Foreign exchange derivatives
|
$
|
6
|
|
$
|
1
|
|
$
|
(56
|
)
|
|||
Redeemable noncontrolling interests reflected as of the balance sheet date are the greater of the noncontrolling interest balances adjusted for comprehensive income items and distributions or the redemption values remeasured at the period end foreign exchange rates (i.e., the "floor"). Adjustments to the carrying amount of redeemable noncontrolling interests to redemption value as a result of changes in exchange rates are reflected in currency translation adjustments, a component of
other comprehensive (loss) income
; however, such currency translation adjustments to redemption value are allocated to Discovery stockholders only. Redeemable noncontrolling interest adjustments of redemption value to the floor are reflected in retained earnings. Any adjustment
92
DISCOVERY COMMUNICATIONS, INC.
NOTES TO CONSOLIDATED FINANCIAL STATEMENTS
of redemption value to the floor that reflects a redemption in excess of fair value is included as an adjustment to net income available to Discovery Communications, Inc. stockholders in the calculation of earnings per share. There were no current period adjustments to reflect a redemption in excess of fair value. (See Note 17.)
The table below presents the reconciliation of changes in redeemable noncontrolling interests (in millions).
|
December 31,
|
||||||||||||
|
2015
|
2014
|
2013
|
||||||||||
|
Beginning balance
|
$
|
747
|
|
$
|
36
|
|
$
|
—
|
|
|||
|
Initial fair value of redeemable noncontrolling interests of acquired businesses
|
60
|
|
796
|
|
41
|
|
||||||
|
Purchase of subsidiary shares at fair value
|
(551
|
)
|
(6
|
)
|
—
|
|
||||||
|
Cash distributions to redeemable noncontrolling interests
|
(42
|
)
|
(2
|
)
|
—
|
|
||||||
|
Comprehensive (loss) income adjustments:
|
||||||||||||
|
Net income (loss) attributable to redeemable noncontrolling interests
|
13
|
|
(4
|
)
|
1
|
|
||||||
|
Other comprehensive loss attributable to redeemable noncontrolling interests
|
(23
|
)
|
(40
|
)
|
(3
|
)
|
||||||
|
Currency translation on redemption values
|
(36
|
)
|
(64
|
)
|
(5
|
)
|
||||||
|
Retained earnings adjustments:
|
||||||||||||
|
Adjustments to redemption value
|
73
|
|
31
|
|
2
|
|
||||||
|
Ending balance
|
$
|
241
|
|
$
|
747
|
|
$
|
36
|
|
|||
Redeemable noncontrolling interests consist of the arrangements described below:
In connection with the acquisition of a controlling interest in Eurosport France on
March 31, 2015
and Eurosport International on
May 30, 2014
, the Company recognized
$60 million
and $
558 million
, respectively, for TF1's
49%
redeemable noncontrolling interest. On July 22, 2015, TF1 exercised its right to put the entirety of its remaining
49%
noncontrolling interest in Eurosport to the Company for
€491 million
(
$551 million
as of the date redemption became mandatory, and
$548 million
on October 1, 2015 when the transaction closed). The difference between the carrying amount of the redeemable noncontrolling interest and its fair value at the date of exercise resulted in a
€25 million
(
$28 million
) adjustment to retained earnings, recognized as a component of redeemable noncontrolling interest adjustments to redemption value on the consolidated statements of equity. Upon acquisition of TF1's noncontrolling interest, the Company adjusted the accumulated other comprehensive income balance of
$61 million
attributable to TF1 and allocated it to Discovery stockholders.
In connection with the acquisition of a controlling interest in Discovery Family on
September 23, 2014
, the Company recognized
$238 million
for Hasbro's redeemable noncontrolling interest in Discovery Family. Hasbro has the right to put the entirety of its remaining
40%
non-controlling interest to the Company for
one
year after December 31, 2021, or in the event a Discovery performance obligation related to Discovery Family is not met. Embedded in the redeemable noncontrolling interest is also a Discovery call right that is exercisable for one year after December 31, 2021. Upon the exercise of the put or call options, the price to be paid for the redeemable noncontrolling interest is a function of the then-current fair market value of the redeemable noncontrolling interest, to which certain discounts and floor values may apply in specified situations depending upon the party exercising the put or call and the basis for the exercise of the put or call. As Hasbro's put right is outside the control of the Company, Hasbro's
40%
noncontrolling interest is presented as redeemable noncontrolling interest outside of permanent equity on the Company's consolidated balance sheet.
In connection with the acquisition of SBS Nordic on
April 9, 2013
, the Company recognized
$6 million
redeemable noncontrolling interest for the fair value of a noncontrolling interest in one of its Danish subsidiaries. On November 19, 2014, the Company purchased the noncontrolling interest for $
1 million
. The difference between the consideration transferred and the recorded value of the previous redeemable noncontrolling interest was recorded to additional paid-in capital.
In connection with the acquisition of a controlling interest in Discovery Japan on
January 10, 2013
, J:COM obtained the right to put all, but not less than all, of its
20%
noncontrolling interest to Discovery at any time for cash. Through January 10, 2017, the redemption value is the
January 10, 2013
fair value denominated in Japanese yen; thereafter, the redemption value is the greater of the then-current fair value or the
January 10, 2013
fair value denominated in Japanese yen.
93
DISCOVERY COMMUNICATIONS, INC.
NOTES TO CONSOLIDATED FINANCIAL STATEMENTS
Common Stock
The Company has
three
series of common stock authorized, issued and outstanding as of
December 31, 2015
: Series A common stock, Series B common stock and Series C common stock. Holders of these
three
series of common stock have equal rights, powers and privileges, except as otherwise noted. Holders of Series A common stock are entitled to
one
vote per share and holders of Series B common stock are entitled to
ten
votes per share on all matters voted on by stockholders, except for directors to be elected by holders of the Company’s Series A convertible preferred stock. Holders of Series C common stock are not entitled to any voting rights, except as required by Delaware law. Generally, holders of Series A common stock and Series B common stock and Series A convertible preferred stock vote as one class, except for certain preferential rights afforded to holders of Series A convertible preferred stock.
Holders of Series A common stock, Series B common stock and Series C common stock will participate equally in cash dividends if declared by the Board of Directors, subject to preferential rights of outstanding preferred stock.
Each share of Series B common stock is convertible, at the option of the holder, into
one
share of Series A common stock. Series A and Series C common stock are not convertible.
Generally, distributions made in shares of Series A common stock, Series B common stock or Series C common stock will be made proportionally to all common stockholders. In the event of a reclassification, subdivision or combination of any series of common stock, the shares of the other series of common stock will be equally reclassified, subdivided or combined.
In the event of a liquidation, dissolution, or winding up of Discovery, after payment of Discovery’s debts and liabilities and subject to preferential rights of outstanding preferred stock, holders of Series A common stock, Series B common stock and Series C common stock and holders of Series A and Series C preferred stock will share equally in any assets available for distribution to holders of common stock.
On February 13, 2014, John C. Malone, a member of Discovery’s Board of Directors, entered into an agreement granting David Zaslav, the Company’s President and CEO, certain voting and purchase rights with respect to the approximately
6 million
shares of the Company’s Series B common stock owned by Mr. Malone. The agreement gives Mr. Zaslav the right to vote the Series B shares if Mr. Malone is not otherwise voting or directing the vote of those shares. The agreement also provides that if Mr. Malone proposes to sell the Series B shares, Mr. Zaslav will have the first right to negotiate for the purchase of the shares. If that negotiation is not successful and Mr. Malone proposes to sell the Series B shares to a third party, Mr. Zaslav will have the exclusive right to match that offer. The rights granted under the agreement will remain in effect for as long as Mr. Zaslav is either employed as the principal executive officer of the Company or serving on its Board of Directors.
Common Stock Repurchase Program
Under the Company's stock repurchase program, management is authorized to purchase shares of the Company's common stock from time to time through open market purchases, privately negotiated transactions at prevailing prices, pursuant to one or more accelerated stock repurchase agreements, or other derivative arrangements as permitted by securities laws and other legal requirements, and subject to stock price, business and market conditions and other factors. On
October 8, 2015
, the Company's Board of Directors approved an additional
$2.0 billion
under the Company's stock repurchase program, which will expire on
October 8, 2017
. Over the life of the program, authorization under the stock repurchase program has totaled
$7.5 billion
. As of
December 31, 2015
, the Company had remaining authorization of approximately
$2.0 billion
for future repurchases under the existing stock repurchase program, of which
$41 million
that was scheduled to expire on
February 3, 2016
was fully utilized for stock repurchases in 2016 and
$2.0 billion
that will expire on
October 8, 2017
.
All common stock repurchases during
2015
,
2014
and
2013
were made through open market transactions. As of
December 31, 2015
, the Company had repurchased over the life of the program
3 million
and
115 million
shares of Series A and Series C common stock, respectively, for the aggregate purchase price of
$171 million
and
$5.3 billion
, respectively.
94
DISCOVERY COMMUNICATIONS, INC.
NOTES TO CONSOLIDATED FINANCIAL STATEMENTS
The table below presents a summary of common stock repurchases (in millions).
|
Year Ended December 31,
|
||||||||||||
|
2015
|
2014
|
2013
|
||||||||||
|
Series A Common Stock:
|
||||||||||||
|
Shares repurchased
|
—
|
|
—
|
|
0.8
|
|
||||||
|
Purchase price
|
$
|
—
|
|
$
|
—
|
|
$
|
62
|
|
|||
|
Series C Common Stock:
|
||||||||||||
|
Shares repurchased
|
23.7
|
21.3
|
13.3
|
|||||||||
|
Purchase price
|
$
|
698
|
|
$
|
1,232
|
|
$
|
987
|
|
|||
|
Total shares repurchased
|
23.7
|
|
21.3
|
14.1
|
||||||||
|
Total purchase price
|
$
|
698
|
|
$
|
1,232
|
|
$
|
1,049
|
|
|||
Repurchased common stock is recorded as treasury stock on the consolidated balance sheet. The Company's
2
for 1 stock split in the form of a share dividend distributed on August 6, 2014 was not applied to the Company's treasury shares. Accordingly, the number of common shares repurchased under the common stock repurchase program has not been retroactively adjusted to give effect to the stock split.
Convertible Preferred Stock
The Company has
two
series of preferred stock authorized, issued and outstanding as of
December 31, 2015
: Series A convertible preferred stock and Series C convertible preferred stock. In addition to the
150 million
shares authorized for Series A and Series C convertible preferred stock (
75
million shares for each series) that is disclosed on the consolidated balance sheets, the Company has authorized
50
million shares of preferred stock that are undesignated and issuable in accordance with the provisions of the Company’s charter. In connection with the formation of Discovery, the Company issued shares of both its Series A convertible preferred stock and Series C convertible preferred stock to Advance/Newhouse Programming Partnership ("Advance/Newhouse"). As of
December 31, 2015
, all outstanding shares of Series A and Series C convertible preferred stock are held by Advance/Newhouse.
Holders of Series A and Series C convertible preferred stock have equal rights, powers and privileges, except as otherwise noted. Except for the election of common stock directors, the holders of Series A convertible preferred stock are entitled to vote on matters to which holders of Series A and Series B common stock are entitled to vote, and holders of Series C convertible preferred stock are entitled to vote on matters to which holders of Series C common stock are entitled to vote pursuant to Delaware law. Series A convertible preferred stockholders vote on an as converted to common stock basis together with the Series A and Series B common stockholders as a single class on all matters except the election of directors.
Additionally, through its ownership of the Series A convertible preferred stock, Advance/Newhouse has special voting rights on certain matters and the right to elect three directors. Holders of the Company’s common stock are not entitled to vote in the election of such directors. Advance/Newhouse retains these rights so long as it or its permitted transferees own or have the right to vote such shares that equal at least
80%
of the shares of Series A convertible preferred stock issued to Advance/Newhouse in connection with the formation of Discovery plus any Series A convertible preferred stock released from escrow, as may be adjusted for certain capital transactions (the “Base Amount”).
Subject to the prior preferences and other rights of any senior stock, holders of Series A and Series C convertible preferred stock will participate equally with common stockholders on an as converted to common stock basis in any cash dividends declared by the Board of Directors.
Each share of Series A preferred stock is convertible, at the option of the holder, following the August 2014 stock split in the form of a stock dividend, into
one
share of Series A common stock and
one
share of Series C common stock, subject to anti-dilution adjustments. The Series C preferred stock is convertible, at the option of the holder, into two shares of Series C common stock. Generally, each share of Series A and Series C convertible preferred stock will automatically convert into the applicable series of common stock if such shares are transferred from Advance/Newhouse to a third party and such transfer is not a permitted transfer. On April 5, 2013, Advance/Newhouse completed the transfer of
550
thousand shares of their Series C convertible preferred stock to a third party, and, pursuant to provisions in the Company's articles of incorporation, such shares of Series C convertible preferred stock automatically converted into an equal number of shares of Series C common stock. Upon conversion, Discovery derecognized the preferred stock based on its carrying value and allocated that amount to common stock.
No
gain or loss was recorded on the conversion. Additionally, all of the outstanding Series A and Series C convertible preferred stock will automatically convert into the applicable series of common stock at such time as the number of outstanding shares of Series A convertible preferred stock is less
95
DISCOVERY COMMUNICATIONS, INC.
NOTES TO CONSOLIDATED FINANCIAL STATEMENTS
than
80%
of the Base Amount. The Base Amount is the
70 million
shares of Series A and Series C Preferred Stock initially issued to Advance/Newhouse, plus any shares released from escrow as of the date the Base Amount is calculated.
In the event of a liquidation, dissolution or winding up of Discovery, after payment of Discovery’s debts and liabilities and subject to the prior payment with respect to any stock ranking senior to Series A and Series C convertible preferred stock, the holders of Series A and Series C convertible preferred stock will receive, before any payment or distribution is made to the holders of any common stock or other junior stock, an amount (in cash or property) equal to
$0.01
per share. Following payment of such amount and the payment in full of all amounts owing to the holders of securities ranking senior to Discovery’s common stock, holders of Series A and Series C convertible preferred stock will share equally on an as converted to common stock basis with the holders of common stock with respect to any assets remaining for distribution to such holders.
Preferred Stock Conversion and Repurchases
On May 22, 2014, the Company entered into an agreement with Advance/Newhouse to repurchase, on a quarterly basis, a number of shares of Series C convertible preferred stock convertible into a number of shares of Series C common stock equal to 3/7 of all shares of Series C common stock purchased under the Company’s stock repurchase program during the then most recently completed fiscal quarter. The price paid per share is calculated as
99%
of the average price paid for the Series C common shares repurchased by the Company during the applicable fiscal quarter multiplied by the Series C conversion rate. The Advance/Newhouse repurchases are made outside of the Company’s publicly announced stock repurchase program. The repurchase transactions are recorded as a decrease of par value of preferred stock and retained earnings upon settlement using cash on hand as there is no remaining additional paid-in capital for this class of stock.
The table below presents a summary of Series C convertible preferred stock repurchases made under the repurchase agreement (in millions).
|
Year Ended December 31,
|
|||||||
|
2015
|
2014
|
||||||
|
Series C Convertible Preferred Stock:
|
|||||||
|
Shares repurchased
|
3.9
|
|
2.4
|
|
|||
|
Purchase price
|
$
|
253
|
|
$
|
190
|
|
|
Based on the number of shares of Series C common stock purchased during the three months ended
December 31, 2015
, the Company expects Advance/Newhouse to effectively convert and sell to the Company
3 million
shares of its Series C convertible preferred stock for an aggregate purchase price of
$159 million
on or about
February 22, 2016
. The expected purchase of these shares has not been recognized as a liability on the Company's consolidated balance sheet as of
December 31, 2015
due to certain termination rights held by Discovery and Advance/Newhouse over the repurchase agreement.
On April 5, 2013, the Company repurchased
4 million
shares of its Series C convertible preferred stock from Advance/Newhouse for an aggregate purchase price of
$256 million
, which was recorded as a decrease of par value of preferred stock and retained earnings. The repurchase was made outside of the Company's publicly announced stock repurchase program, using cash on hand.
96
DISCOVERY COMMUNICATIONS, INC.
NOTES TO CONSOLIDATED FINANCIAL STATEMENTS
Other Comprehensive (Loss) Income
The table below presents the tax effects related to each component of other comprehensive (loss) income and reclassifications made into the consolidated statements of operations (in millions).
|
Year Ended December 31, 2015
|
Year Ended December 31, 2014
|
Year Ended December 31, 2013
|
|||||||||||||||||||||||||||||||||
|
Pretax
|
Tax
Benefit (Expense)
|
Net-of-tax
|
Pretax
|
Tax Benefit (Expense)
|
Net-of-tax
|
Pretax
|
Tax(Expense)
Benefit
|
Net-of-tax
|
|||||||||||||||||||||||||||
|
Currency translation adjustments:
|
|||||||||||||||||||||||||||||||||||
|
Unrealized (losses) gains
|
$
|
(249
|
)
|
$
|
19
|
|
$
|
(230
|
)
|
$
|
(401
|
)
|
$
|
9
|
|
$
|
(392
|
)
|
$
|
16
|
|
$
|
(21
|
)
|
$
|
(5
|
)
|
||||||||
|
Reclassifications:
|
|||||||||||||||||||||||||||||||||||
|
Gain on disposition
|
23
|
|
—
|
|
23
|
|
—
|
|
—
|
|
—
|
|
—
|
|
—
|
|
—
|
|
|||||||||||||||||
|
Other (expense)income, net
|
6
|
|
—
|
|
6
|
|
(7
|
)
|
—
|
|
(7
|
)
|
(9
|
)
|
3
|
|
(6
|
)
|
|||||||||||||||||
|
Total currency translation adjustments
|
(220
|
)
|
19
|
|
(201
|
)
|
(408
|
)
|
9
|
|
(399
|
)
|
7
|
|
(18
|
)
|
(11
|
)
|
|||||||||||||||||
|
Market value adjustments:
|
|||||||||||||||||||||||||||||||||||
|
Unrealized (losses)
gains
|
(33
|
)
|
6
|
|
(27
|
)
|
2
|
|
(1
|
)
|
1
|
|
3
|
|
(1
|
)
|
2
|
|
|||||||||||||||||
|
Reclassifications:
|
|||||||||||||||||||||||||||||||||||
|
Gain on disposition
|
—
|
|
—
|
|
—
|
|
(5
|
)
|
2
|
|
(3
|
)
|
—
|
|
—
|
|
—
|
|
|||||||||||||||||
|
Other (expense)income, net
|
2
|
|
—
|
|
2
|
|
—
|
|
—
|
|
—
|
|
—
|
|
—
|
|
—
|
|
|||||||||||||||||
|
Total market value adjustments
|
(31
|
)
|
6
|
|
(25
|
)
|
(3
|
)
|
1
|
|
(2
|
)
|
3
|
|
(1
|
)
|
2
|
|
|||||||||||||||||
|
Derivative adjustments:
|
|||||||||||||||||||||||||||||||||||
|
Unrealized gains (losses)
|
23
|
|
(8
|
)
|
15
|
|
(14
|
)
|
6
|
|
(8
|
)
|
10
|
|
(3
|
)
|
7
|
|
|||||||||||||||||
|
Reclassifications:
|
|||||||||||||||||||||||||||||||||||
|
Distribution revenue
|
(23
|
)
|
8
|
|
(15
|
)
|
—
|
|
—
|
|
—
|
|
—
|
|
—
|
|
—
|
|
|||||||||||||||||
|
Advertising revenue
|
(2
|
)
|
—
|
|
(2
|
)
|
—
|
|
—
|
|
—
|
|
—
|
|
—
|
|
—
|
|
|||||||||||||||||
|
Costs of revenues
|
(9
|
)
|
3
|
|
(6
|
)
|
(1
|
)
|
—
|
|
(1
|
)
|
—
|
|
—
|
|
—
|
|
|||||||||||||||||
|
Selling, general and administrative expense
|
—
|
|
—
|
|
—
|
|
—
|
|
—
|
|
—
|
|
(1
|
)
|
—
|
|
(1
|
)
|
|||||||||||||||||
|
Interest expense
|
3
|
|
(1
|
)
|
2
|
|
—
|
|
—
|
|
—
|
|
—
|
|
—
|
|
—
|
|
|||||||||||||||||
|
Other (expense)income, net
|
7
|
|
(2
|
)
|
5
|
|
(3
|
)
|
1
|
|
(2
|
)
|
—
|
|
—
|
|
—
|
|
|||||||||||||||||
|
Total derivative adjustments
|
(1
|
)
|
—
|
|
(1
|
)
|
(18
|
)
|
7
|
|
(11
|
)
|
9
|
|
(3
|
)
|
6
|
|
|||||||||||||||||
|
Other comprehensive (loss) income
|
$
|
(252
|
)
|
$
|
25
|
|
$
|
(227
|
)
|
$
|
(429
|
)
|
$
|
17
|
|
$
|
(412
|
)
|
$
|
19
|
|
$
|
(22
|
)
|
$
|
(3
|
)
|
||||||||
97
DISCOVERY COMMUNICATIONS, INC.
NOTES TO CONSOLIDATED FINANCIAL STATEMENTS
Accumulated Other Comprehensive Loss
The table below presents the changes in the components of accumulated other comprehensive loss, net of taxes (in millions).
|
Currency Translation Adjustments
|
Market
Value
Adjustments
|
Derivative
Adjustments
|
Accumulated
Other
Comprehensive Income (Loss)
|
|||||||||||||
|
December 31, 2012
|
$
|
(1
|
)
|
$
|
(2
|
)
|
$
|
7
|
|
$
|
4
|
|
||||
|
Other comprehensive (loss) income before reclassifications
|
(5
|
)
|
2
|
|
7
|
|
4
|
|
||||||||
|
Reclassifications from accumulated other comprehensive loss to net income
|
(6
|
)
|
—
|
|
(1
|
)
|
(7
|
)
|
||||||||
|
Other comprehensive (loss) income
|
(11
|
)
|
2
|
|
6
|
|
(3
|
)
|
||||||||
|
Other comprehensive loss (income) attributable to redeemable noncontrolling interests
|
4
|
|
—
|
|
(1
|
)
|
3
|
|
||||||||
|
December 31, 2013
|
(8
|
)
|
—
|
|
12
|
|
4
|
|
||||||||
|
Other comprehensive (loss) income before reclassifications
|
(392
|
)
|
1
|
|
(8
|
)
|
(399
|
)
|
||||||||
|
Reclassifications from accumulated other comprehensive loss to net income
|
(7
|
)
|
(3
|
)
|
(3
|
)
|
(13
|
)
|
||||||||
|
Other comprehensive loss
|
(399
|
)
|
(2
|
)
|
(11
|
)
|
(412
|
)
|
||||||||
|
Other comprehensive loss attributable to redeemable noncontrolling interests
|
40
|
|
—
|
|
—
|
|
40
|
|
||||||||
|
December 31, 2014
|
(367
|
)
|
(2
|
)
|
1
|
|
(368
|
)
|
||||||||
|
Other comprehensive (loss) income before reclassifications
|
(230
|
)
|
(27
|
)
|
15
|
|
(242
|
)
|
||||||||
|
Reclassifications from accumulated other comprehensive loss to net income
|
29
|
|
2
|
|
(16
|
)
|
15
|
|
||||||||
|
Other comprehensive loss
|
(201
|
)
|
(25
|
)
|
(1
|
)
|
(227
|
)
|
||||||||
|
Purchase of redeemable noncontrolling interest
|
(61
|
)
|
—
|
|
—
|
|
(61
|
)
|
||||||||
|
Other comprehensive loss attributable to redeemable noncontrolling interests
|
23
|
|
—
|
|
—
|
|
23
|
|
||||||||
|
December 31, 2015
|
$
|
(606
|
)
|
$
|
(27
|
)
|
$
|
—
|
|
$
|
(633
|
)
|
||||
The Company has various incentive plans under which stock options, RSUs, PRSUs, SARs and unit awards have been issued. As of
December 31, 2015
, the Company has reserved a total of
124 million
shares of its Series A and Series C common stock for future exercises of outstanding and future grants of stock options and stock-settled SARs and future vesting of outstanding and future grants of PRSUs and RSUs. Upon exercise of stock options and stock-settled SARs or vesting of PRSUs and RSUs, the Company issues new shares from its existing authorized but unissued shares. There were
91 million
shares of common stock in reserves that were available for future grant under the incentive plans as of
December 31, 2015
.
98
DISCOVERY COMMUNICATIONS, INC.
NOTES TO CONSOLIDATED FINANCIAL STATEMENTS
Equity-Based Compensation Expense
The table below presents the components of equity-based compensation expense (in millions).
|
|
Year Ended December 31,
|
|||||||||||
|
|
2015
|
2014
|
2013
|
|||||||||
|
Stock options
|
$
|
17
|
|
$
|
23
|
|
$
|
25
|
|
|||
|
RSUs
|
17
|
|
14
|
|
11
|
|
||||||
|
PRSUs
|
16
|
|
46
|
|
30
|
|
||||||
|
SARs
|
(14
|
)
|
(11
|
)
|
63
|
|
||||||
|
Unit awards
|
(2
|
)
|
5
|
|
60
|
|
||||||
|
ESPP
|
1
|
|
1
|
|
1
|
|
||||||
|
Total equity-based compensation expense
|
$
|
35
|
|
$
|
78
|
|
$
|
190
|
|
|||
|
Tax benefit recognized
|
$
|
13
|
|
$
|
27
|
|
$
|
51
|
|
|||
Compensation expense for all awards was recorded in selling, general and administrative expense on the consolidated statements of operations. The Company records expense for the fair value of cash-settled and other liability-classified equity-based compensation awards ratably over the graded vesting service period based on changes in fair value as well as the probability that performance targets will be met, if applicable, less estimated forfeitures. These liability-classified equity-based compensation awards include certain PRSUs, SARS and unit awards. The Company recorded total liabilities for cash-settled and other liability-classified equity-based compensation awards of
$54 million
and
$84 million
as of
December 31, 2015 and 2014
, respectively. The current portion of the liability for cash-settled awards was
$5 million
and
$32 million
as of
December 31, 2015 and 2014
, respectively.
Equity-Based Award Activity
Stock Options
The table below presents stock option activity (in millions, except years and weighted-average exercise price).
|
Stock Options
|
Weighted-
Average
Exercise
Price
|
Weighted-
Average
Remaining
Contractual
Term
(years)
|
Aggregate
Intrinsic
Value
|
||||||||||
|
Outstanding as of December 31, 2014
|
14.7
|
|
$
|
22.01
|
|
||||||||
|
Granted
|
3.2
|
|
$
|
31.81
|
|
||||||||
|
Exercised
|
(1.5
|
)
|
$
|
11.32
|
|
$
|
28
|
|
|||||
|
Forfeited
|
(1.1
|
)
|
$
|
37.59
|
|
||||||||
|
Outstanding as of December 31, 2015
|
15.3
|
|
$
|
24.01
|
|
3.7
|
$
|
88
|
|
||||
|
Vested and expected to vest as of December 31, 2015
|
14.8
|
|
$
|
23.69
|
|
3.7
|
$
|
88
|
|
||||
|
Exercisable as of December 31, 2015
|
9.9
|
|
$
|
18.66
|
|
2.8
|
$
|
88
|
|
||||
Stock options are granted with an exercise price equal to or in excess of the closing market price of the Company’s Series A or Series C common stock on the date of grant. Substantially all stock options vest ratably over
three
to
four
years from the grant date based on continuous service and expire
seven
to
ten
years from the date of grant. Stock option awards generally provide for accelerated vesting upon retirement or after reaching a specified age and years of service. The Company received cash payments from the exercise of stock options totaling
$16 million
,
$35 million
and
$46 million
during
2015
,
2014
and
2013
, respectively. As of
December 31, 2015
, there was
$31 million
of unrecognized compensation cost, net of expected forfeitures, related to stock options, which is expected to be recognized over a weighted-average period of
2.1 years
.
The fair value of stock options is estimated using the Black-Scholes option-pricing model. The weighted-average assumptions used to determine the fair value of stock options as of the date of grant during
2015
,
2014
and
2013
were as follows.
99
DISCOVERY COMMUNICATIONS, INC.
NOTES TO CONSOLIDATED FINANCIAL STATEMENTS
|
|
Year Ended December 31,
|
||||||||
|
|
2015
|
2014
|
2013
|
||||||
|
Risk-free interest rate
|
1.54
|
%
|
1.53
|
%
|
0.79
|
%
|
|||
|
Expected term (years)
|
5.00
|
|
4.97
|
|
4.97
|
|
|||
|
Expected volatility
|
26.78
|
%
|
26.20
|
%
|
35.97
|
%
|
|||
|
Dividend yield
|
—
|
|
—
|
|
—
|
|
|||
The weighted-average grant date fair value of options granted during
2015
,
2014
and
2013
was
$8.44
,
$19.73
and
$24.46
, respectively, per option. The total intrinsic value of options exercised during
2015
,
2014
and
2013
was
$28 million
,
$63 million
and
$130 million
, respectively.
RSUs
The table below presents RSU activity (in millions, except years and weighted-average grant price).
|
RSUs
|
Weighted-Average
Grant
Price
|
Weighted-Average
Remaining
Contractual
Term
(years)
|
Aggregate
Fair
Value
|
||||||||||
|
Outstanding as of December 31, 2014
|
1.6
|
|
$
|
34.16
|
|
||||||||
|
Granted
|
1.0
|
|
$
|
32.30
|
|
||||||||
|
Converted
|
(0.4
|
)
|
$
|
26.77
|
|
$
|
14
|
|
|||||
|
Forfeited
|
(0.2
|
)
|
$
|
35.93
|
|
||||||||
|
Outstanding as of December 31, 2015
|
2.0
|
|
$
|
34.62
|
|
2.3
|
$
|
51
|
|
||||
|
Vested and expected to vest as of December 31, 2015
|
1.8
|
|
$
|
34.58
|
|
2.3
|
$
|
46
|
|
||||
RSUs represent the contingent right to receive shares of the Company's Series A and C common stock, substantially all of which vest ratably each year over periods of
one
to
four
years based on continuous service. As of
December 31, 2015
, there was
$38 million
of unrecognized compensation cost, net of expected forfeitures, related to RSUs, which is expected to be recognized over a weighted-average period of
2.4 years
.
PRSUs
The table below presents PRSU activity (in millions, except years and weighted-average grant price).
|
PRSUs
|
Weighted-Average
Grant
Price
|
Weighted-Average
Remaining
Contractual
Term
(years)
|
Aggregate
Fair
Value
|
|||||||||||
|
Outstanding as of December 31, 2014
|
4.9
|
|
$
|
32.23
|
|
|||||||||
|
Granted
|
0.5
|
|
$
|
31.68
|
|
|||||||||
|
Converted
|
(1.2
|
)
|
$
|
22.44
|
|
$
|
39
|
|
||||||
|
Outstanding as of December 31, 2015
|
4.2
|
|
$
|
35.07
|
|
0.8
|
|
$
|
107
|
|
||||
|
Vested and expected to vest as of December 31, 2015
|
4.1
|
|
$
|
35.05
|
|
0.8
|
|
$
|
106
|
|
||||
|
Convertible as of December 31, 2015
|
1.3
|
|
$
|
26.74
|
|
—
|
|
$
|
34
|
|
||||
The Company has granted PRSUs to certain senior level executives. PRSUs represent the contingent right to receive shares of the Company’s Series A and C common stock, substantially all of which vest over
three
to
four
years based on continuous service and whether the Company achieves certain operating performance targets. The performance targets for substantially all PRSUs are cumulative measures of the Company’s adjusted operating income before depreciation and amortization (as defined in Note 21), free cash flows and revenues over a
three
year period. The number of PRSUs that vest principally range from
0%
to
100%
based on a sliding scale where achieving or exceeding the performance target will result in
100%
of the PRSUs vesting and achieving less than
80%
of the target will result in
no
portion of the PRSUs vesting. Additionally, for certain PRSUs the Company’s Compensation Committee has discretion in determining the final amount of
100
DISCOVERY COMMUNICATIONS, INC.
NOTES TO CONSOLIDATED FINANCIAL STATEMENTS
units that vest, but may not increase the amount of any PRSU award above
100%
. Upon vesting, each PRSU becomes convertible into one share of the Company’s Series A or Series C common stock as applicable. Holders of PRSUs do not receive payments of dividends in the event the Company pays a cash dividend until such PRSUs are converted into shares of the Company’s common stock.
The Company records compensation expense for PRSUs ratably over the graded vesting service period once it is probable that the performance targets will be achieved. In any period in which the Company determines that achievement of the performance targets is not probable, the Company ceases recording compensation expense and all previously recognized compensation expense for the award is reversed.
Compensation expense is separately recorded for each vesting tranche of PRSUs for a particular grant. For certain PRSUs, the Company measures the fair value and related compensation cost based on the closing price of the Company’s Series A or C common stock on the grant date. For PRSUs for which the Company’s Compensation Committee has discretion in determining the final amount of units that vest or in situations where the executive is able to withhold taxes in excess of the minimum statutory requirement, compensation cost is remeasured at each reporting date based on the closing price of the Company’s Series A or Series C common stock.
As of
December 31, 2015
, unrecognized compensation cost, net of expected forfeitures, related to PRSUs was
$28 million
, which is expected to be recognized over a weighted-average period of
1.1 years
based on the Company’s current assessment of the PRSUs that will vest, which may differ from actual results.
SARs
The table below presents SAR award activity (in millions, except years and weighted-average grant price).
|
SARs
|
Weighted-
Average
Grant
Price
|
Weighted-
Average
Remaining
Contractual
Term
(years)
|
Aggregate
Intrinsic
Value
|
||||||||||
|
Outstanding as of December 31, 2014
|
12.1
|
|
$
|
37.38
|
|
||||||||
|
Granted
|
2.0
|
|
$
|
32.68
|
|
||||||||
|
Settled
|
(1.8
|
)
|
$
|
26.44
|
|
$
|
11
|
|
|||||
|
Forfeited
|
(1.9
|
)
|
$
|
43.24
|
|
||||||||
|
Outstanding as of December 31, 2015
|
10.4
|
|
$
|
37.38
|
|
1.0
|
$
|
5
|
|
||||
|
Vested and expected to vest as of December 31, 2015
|
10.3
|
|
$
|
37.38
|
|
1.0
|
$
|
5
|
|
||||
SAR award grants include cash-settled SARs and stock-settled SARs. Cash-settled SARs entitle the holder to receive a cash payment for the amount by which the price of the Company’s Series A or Series C common stock exceeds the base price established on the grant date. Cash-settled SARs are granted with a base price equal to or greater than the closing market price of the Company’s Series A or Series C common stock on the date of grant. Stock-settled SARs entitle the holder to shares of Series A or Series C common stock in accordance with the award agreement terms.
The fair value of outstanding SARs is estimated using the Black-Scholes option-pricing model. The weighted-average assumptions used to determine the fair value of outstanding SARs were as follows.
|
|
Year Ended December 31,
|
||||||||
|
|
2015
|
2014
|
2013
|
||||||
|
Risk-free interest rate
|
0.83
|
%
|
0.59
|
%
|
0.45
|
%
|
|||
|
Expected term (years)
|
1.02
|
|
1.30
|
|
1.38
|
|
|||
|
Expected volatility
|
31.59
|
%
|
27.72
|
%
|
22.77
|
%
|
|||
|
Dividend yield
|
—
|
|
—
|
|
—
|
|
|||
As of
December 31, 2015
and 2014, the weighted-average fair value of SARs outstanding was
$1.15
and
$4.12
per award. The Company made cash payments of
$11 million
,
$29 million
and
$11 million
to settle exercised SARs during
2015
,
2014
and
2013
, respectively. As of
December 31, 2015
, there was
$4 million
of unrecognized compensation cost, net of estimated forfeitures, related to SARs, which is expected to be recognized over a weighted-average period of
0.9 years
.
101
DISCOVERY COMMUNICATIONS, INC.
NOTES TO CONSOLIDATED FINANCIAL STATEMENTS
Unit Awards
Unit awards represent the contingent right to receive a cash payment for the amount by which the vesting price exceeds the grant price. Because unit awards are cash-settled, the Company remeasures the fair value and compensation expense of outstanding unit awards each reporting date until settlement. During the year ended
December 31, 2015
, the Company made cash payments of
$14 million
to settle all
1.2 million
remaining unit awards, which had a weighted-average grant price of
$20.59
.
Employee Stock Purchase Plan
The DESPP enables eligible employees to purchase shares of the Company’s common stock through payroll deductions or other permitted means. Unless otherwise determined by the Company’s Compensation Committee, the purchase price for shares offered under the DESPP is
85%
of the closing price of the Company’s Series A common stock on the purchase date. The Company recognizes the fair value of the discount associated with shares purchased in selling, general and administrative expense on the consolidated statement of operations. The Company’s Board of Directors has authorized
9 million
shares of the Company’s common stock to be issued under the DESPP. During the years ended
December 31, 2015
,
2014
and
2013
the Company issued
208 thousand
,
191 thousand
and
141 thousand
shares under the DESPP, respectively, and received cash totaling
$5 million
, $
6 million
and
$5 million
, respectively.
The Company has defined contribution and other savings plans for the benefit of its employees that meet eligibility requirements. Eligible employees may contribute a portion of their compensation to the plans, which may be subject to certain statutory limitations. For these plans, the Company also makes contributions including discretionary contributions, subject to plan provisions, which vest immediately. The Company made total contributions of
$36 million
,
$33 million
and
$28 million
during
2015
,
2014
and
2013
, respectively. The Company's contributions were recorded in selling, general and administrative expense in the consolidated statements of operations.
The Company’s savings plans include a deferred compensation plan through which members of the Company’s executive team in the U.S. may elect to defer up to
50%
of their eligible compensation. The amounts deferred are invested in various mutual funds at the direction of the executive, which are used to finance payment of the deferred compensation obligation. Distributions from the deferred compensation plan are made upon termination or other events as specified in the plan. The Company has established a separate trust to hold the investments that finance the deferred compensation obligation. The accounts of the separate trust are included in the Company’s consolidated financial statements. The investments are included in prepaid expenses and other current assets and the deferred compensation obligation is included in accrued liabilities in the consolidated balance sheets. The values of the investments and deferred compensation obligation are recorded at fair value. Changes in the fair value of the investments are offset by changes in the fair value of the deferred compensation obligation. (See Note 5.)
Restructuring and other charges, by reportable segment were as follows (in millions).
|
|
Year Ended December 31,
|
|||||||||||
|
|
2015
|
2014
|
2013
|
|||||||||
|
U.S. Networks
|
$
|
33
|
|
$
|
61
|
|
$
|
4
|
|
|||
|
International Networks
|
14
|
|
24
|
|
11
|
|
||||||
|
Education and Other
|
2
|
|
3
|
|
—
|
|
||||||
|
Corporate
|
1
|
|
2
|
|
1
|
|
||||||
|
Total restructuring and other charges
|
$
|
50
|
|
$
|
90
|
|
$
|
16
|
|
|||
|
Year Ended December 31,
|
||||||||||||
|
2015
|
2014
|
2013
|
||||||||||
|
Restructuring charges
|
$
|
29
|
|
$
|
35
|
|
$
|
16
|
|
|||
|
Other charges
|
21
|
|
55
|
|
—
|
|
||||||
|
Total restructuring and other charges
|
$
|
50
|
|
$
|
90
|
|
$
|
16
|
|
|||
102
DISCOVERY COMMUNICATIONS, INC.
NOTES TO CONSOLIDATED FINANCIAL STATEMENTS
Restructuring charges relate to management changes, cost reduction efforts and contract terminations. Other charges during
2015
and
2014
result from content impairments primarily at the Company's U.S. Networks segment due to the cancellation of certain high profile series as a result of legal circumstances pertaining to the associated talent. Additionally, the consolidation and subsequent rebranding of Discovery Family resulted in content impairments in 2014 that were reflected as a component of restructuring and other (See Note 6).
Changes in restructuring and other liabilities by major category were as follows (in millions).
|
Contract
Terminations
|
Employee
Relocations/
Terminations
|
Total
|
||||||||||
|
December 31, 2012
|
$
|
3
|
|
$
|
3
|
|
$
|
6
|
|
|||
|
Net accruals
|
—
|
|
16
|
|
16
|
|
||||||
|
Cash paid
|
(1
|
)
|
(14
|
)
|
(15
|
)
|
||||||
|
December 31, 2013
|
2
|
|
5
|
|
7
|
|
||||||
|
Net accruals
|
3
|
|
32
|
|
35
|
|
||||||
|
Cash paid
|
(1
|
)
|
(22
|
)
|
(23
|
)
|
||||||
|
December 31, 2014
|
4
|
|
15
|
|
19
|
|
||||||
|
Net accruals
|
3
|
|
26
|
|
29
|
|
||||||
|
Cash paid
|
(5
|
)
|
(20
|
)
|
(25
|
)
|
||||||
|
December 31, 2015
|
$
|
2
|
|
$
|
21
|
|
$
|
23
|
|
|||
The domestic and foreign components of income from continuing operations before income taxes were as follows (in millions).
|
|
Year Ended December 31,
|
|||||||||||
|
|
2015
|
2014
|
2013
|
|||||||||
|
Domestic
|
$
|
1,281
|
|
$
|
1,251
|
|
$
|
1,104
|
|
|||
|
Foreign
|
278
|
|
496
|
|
632
|
|
||||||
|
Income before income taxes
|
$
|
1,559
|
|
$
|
1,747
|
|
$
|
1,736
|
|
|||
The components of the provision for income taxes were as follows (in millions).
|
|
Year Ended December 31,
|
|||||||||||
|
|
2015
|
2014
|
2013
|
|||||||||
|
Current:
|
||||||||||||
|
Federal
|
$
|
306
|
|
$
|
529
|
|
$
|
333
|
|
|||
|
State and local
|
57
|
|
64
|
|
68
|
|
||||||
|
Foreign
|
146
|
|
198
|
|
175
|
|
||||||
|
509
|
|
791
|
|
576
|
|
|||||||
|
Deferred:
|
||||||||||||
|
Federal
|
59
|
|
(112
|
)
|
113
|
|
||||||
|
State and local
|
(10
|
)
|
(16
|
)
|
(2
|
)
|
||||||
|
Foreign
|
(47
|
)
|
(53
|
)
|
(28
|
)
|
||||||
|
2
|
|
(181
|
)
|
83
|
|
|||||||
|
Income taxes
|
$
|
511
|
|
$
|
610
|
|
$
|
659
|
|
|||
The Company has a regional ownership structure for its international operations. The regional holding companies are foreign corporations whose earnings will not be taxed in the U.S. until the earnings are repatriated to the U.S. The Company has not recorded a provision for deferred U.S. tax expense on the undistributed earnings of these foreign subsidiaries since the Company intends to indefinitely reinvest the earnings of these foreign subsidiaries outside the U.S. The amount of such undistributed
103
DISCOVERY COMMUNICATIONS, INC.
NOTES TO CONSOLIDATED FINANCIAL STATEMENTS
earnings was approximately
$495 million
at
December 31, 2015
. The determination of the amount of unrecognized U.S. deferred income tax liability with respect to these undistributed earnings is not practicable.
The following table reconciles the Company's effective income tax rate to the U.S. federal statutory income tax rate of
35%
.
|
Year Ended December 31,
|
|||||||||
|
2015
|
2014
|
2013
|
|||||||
|
U.S. federal statutory income tax rate
|
35
|
%
|
35
|
%
|
35
|
%
|
|||
|
State and local income taxes, net of federal tax benefit
|
2
|
%
|
2
|
%
|
3
|
%
|
|||
|
Effect of foreign operations
|
1
|
%
|
2
|
%
|
2
|
%
|
|||
|
Domestic production activity deductions
|
(3
|
)%
|
(3
|
)%
|
(2
|
)%
|
|||
|
Change in uncertain tax positions
|
(1
|
)%
|
(1
|
)%
|
—
|
%
|
|||
|
Remeasurement gain on previously held equity interest
|
—
|
%
|
—
|
%
|
(2
|
)%
|
|||
|
Other, net
|
(1
|
)%
|
—
|
%
|
2
|
%
|
|||
|
Effective income tax rate
|
33
|
%
|
35
|
%
|
38
|
%
|
|||
Components of deferred income tax assets and liabilities were as follows (in millions).
|
|
December 31,
|
|||||||
|
|
2015
|
2014
|
||||||
|
Deferred income tax assets:
|
||||||||
|
Accounts receivable
|
$
|
2
|
|
$
|
3
|
|
||
|
Tax attribute carry-forward
|
46
|
|
30
|
|
||||
|
Unrealized loss on derivatives and foreign currency translation adjustments
|
(5
|
)
|
(16
|
)
|
||||
|
Accrued liabilities and other
|
223
|
|
243
|
|
||||
|
Total deferred income tax assets
|
266
|
|
260
|
|
||||
|
Valuation allowance
|
(19
|
)
|
(13
|
)
|
||||
|
Net deferred income tax assets
|
247
|
|
247
|
|
||||
|
Deferred income tax liabilities:
|
||||||||
|
Intangible assets
|
(460
|
)
|
(521
|
)
|
||||
|
Content rights
|
(143
|
)
|
(140
|
)
|
||||
|
Equity method investments
|
(88
|
)
|
(64
|
)
|
||||
|
Notes receivable
|
(8
|
)
|
(8
|
)
|
||||
|
Other
|
(18
|
)
|
(15
|
)
|
||||
|
Total deferred income tax liabilities
|
(717
|
)
|
(748
|
)
|
||||
|
Net deferred income tax liabilities
|
$
|
(470
|
)
|
$
|
(501
|
)
|
||
The Company’s deferred income tax assets and liabilities were reported on the consolidated balance sheets as follows (in millions).
|
|
December 31,
|
|||||||
|
|
2015
|
2014
|
||||||
|
Deferred income tax assets
(a)
|
$
|
86
|
|
$
|
87
|
|
||
|
Deferred income tax liabilities
|
(556
|
)
|
(588
|
)
|
||||
|
Net deferred income tax liabilities
|
$
|
(470
|
)
|
$
|
(501
|
)
|
||
(a)
As of
December 31, 2015
, deferred income tax assets include
$18 million
in noncurrent deferred income tax assets, which are reflected as a component of other noncurrent assets on the consolidated balance sheet.
104
DISCOVERY COMMUNICATIONS, INC.
NOTES TO CONSOLIDATED FINANCIAL STATEMENTS
The Company’s operating loss carry-forwards were reported on the consolidated balance sheets as follows (in millions).
|
Federal
(a)
|
State
|
Foreign
|
||||||||||
|
Operating loss carry-forwards
|
$
|
17
|
|
$
|
608
|
|
$
|
61
|
|
|||
|
Deferred tax asset related to loss carry-forwards
|
$
|
6
|
|
$
|
12
|
|
$
|
16
|
|
|||
|
Valuation allowance against loss carry-forwards
|
$
|
(3
|
)
|
$
|
(10
|
)
|
$
|
(6
|
)
|
|||
|
Earliest expiration date of loss carry-forwards
|
2028
|
|
2016
|
|
2016
|
|
||||||
(a)
The use of the federal operating loss carry-forwards is subject to annual limitations.
A reconciliation of the beginning and ending amounts of unrecognized tax benefits (without related interest and penalty amounts) is as follows (in millions).
|
|
Year Ended December 31,
|
|||||||||||
|
|
2015
|
2014
|
2013
|
|||||||||
|
Beginning balance
|
$
|
176
|
|
$
|
185
|
|
$
|
128
|
|
|||
|
Additions based on tax positions related to the current year
|
30
|
|
40
|
|
25
|
|
||||||
|
Additions for tax positions of prior years
|
17
|
|
82
|
|
36
|
|
||||||
|
Additions for tax positions acquired in business combinations
|
3
|
|
6
|
|
9
|
|
||||||
|
Reductions for tax positions of prior years
|
(21
|
)
|
(129
|
)
|
(8
|
)
|
||||||
|
Settlements
|
(16
|
)
|
—
|
|
(3
|
)
|
||||||
|
Reductions due to lapse of statutes of limitations
|
(13
|
)
|
(8
|
)
|
(2
|
)
|
||||||
|
Reductions due to foreign currency exchange rates
|
(3
|
)
|
—
|
|
—
|
|
||||||
|
Ending balance
|
$
|
173
|
|
$
|
176
|
|
$
|
185
|
|
|||
The balances as of
December 31, 2015
,
2014
and
2013
included
$173 million
,
$176 million
and
$131 million
, respectively, of unrecognized tax benefits that, if recognized, would reduce the Company’s income tax expense and effective tax rate after giving effect to interest deductions and offsetting benefits from other tax jurisdictions. For the
year ended December 31, 2015
, increases in unrecognized tax benefits related to the uncertainty of allocation and taxation of income among multiple jurisdictions was offset by the movements of tax positions as a result of multiple audit resolutions and lapse of statutes of limitations.
The Company and its subsidiaries file income tax returns in the U.S. and various state and foreign jurisdictions. The Company is currently under examination by the IRS for its 2009 and 2012 to 2014 consolidated federal income tax returns. The Company does not anticipate any material adjustments. With few exceptions, the Company is no longer subject to audit by any jurisdiction for years prior to 2006. Adjustments that arose from the completion of audits for certain tax years have been included in the change in uncertain tax positions in the Company's effective tax rate reconciliation table above.
It is reasonably possible that the total amount of unrecognized tax benefits related to certain of the Company's uncertain tax positions could decrease by as much as
$76 million
within the next twelve months as a result of ongoing audits, lapses of statutes of limitations or regulatory developments.
As of
December 31, 2015
,
2014
and
2013
, the Company had accrued approximately
$20 million
,
$17 million
and
$11 million
, respectively, of total interest and penalties payable related to unrecognized tax benefits. The Company recognizes interest and penalties related to unrecognized tax benefits as a component of income tax expense.
In calculating earnings per share, the Company follows the two-class method, which distinguishes between the classes of securities based on the proportionate participation rights of each security type in the Company's undistributed income. The Company's Series A, B and C common stock and the Series C convertible preferred stock are treated as one class for purposes of applying the two-class method, because they have substantially equal rights and share equally on an as converted basis with respect to income available to Discovery Communications, Inc. Any redeemable noncontrolling interests adjustments of redemption value to the floor that reflects a redemption in excess of fair value are included as an adjustment to net income available to Discovery Communications, Inc. stockholders in the calculation of earnings per share.
105
DISCOVERY COMMUNICATIONS, INC.
NOTES TO CONSOLIDATED FINANCIAL STATEMENTS
The table below sets forth the computation for income available to Discovery Communications, Inc. stockholders (in millions).
|
Year Ended December 31,
|
||||||||||||
|
2015
|
2014
|
2013
|
||||||||||
|
Numerator:
|
||||||||||||
|
Net income
|
$
|
1,048
|
|
$
|
1,137
|
|
$
|
1,077
|
|
|||
|
Less:
|
||||||||||||
|
Allocation of undistributed income to Series A convertible preferred stock
|
(224
|
)
|
(236
|
)
|
(212
|
)
|
||||||
|
Net income attributable to noncontrolling interests
|
(1
|
)
|
(2
|
)
|
(1
|
)
|
||||||
|
Net (income) loss attributable to redeemable noncontrolling interests
|
(13
|
)
|
4
|
|
(1
|
)
|
||||||
|
Redeemable noncontrolling interest adjustments to redemption value
|
—
|
|
(1
|
)
|
(2
|
)
|
||||||
|
Net income available to Discovery Communications, Inc. Series A, B and C common and Series C convertible preferred stockholders for basic net income per share
|
$
|
810
|
|
$
|
902
|
|
$
|
861
|
|
|||
|
Allocation of net income available to Discovery Communications Inc. Series A, B and C common stockholders and Series C convertible preferred stockholders for basic net income per share:
|
||||||||||||
|
Series A, B and C common stockholders
|
686
|
|
758
|
|
727
|
|
||||||
|
Series C convertible preferred stockholders
|
124
|
|
144
|
|
134
|
|
||||||
|
Total
|
810
|
|
902
|
|
861
|
|
||||||
|
Add:
|
||||||||||||
|
Allocation of undistributed income to Series A convertible preferred stockholders
|
224
|
|
236
|
|
212
|
|
||||||
|
Net income available to Discovery Communications, Inc. Series A, B and C common stockholders for diluted net income per share
|
$
|
1,034
|
|
$
|
1,138
|
|
$
|
1,073
|
|
|||
Net income available to Discovery Communications, Inc. Series C convertible preferred stockholders for diluted net income per share is included in net income available to Discovery Communications, Inc. Series A, B and C common stockholders for diluted net income per share. For the
years ended December 31, 2015 , 2014 and 2013
, net income available to Discovery Communications, Inc. Series C convertible preferred stockholders for diluted net income per share was
$123 million
,
$143 million
and
$133 million
, respectively.
The table below sets forth the weighted average number of shares outstanding utilized in determining the denominator for basic and diluted earnings per share (in millions).
|
Year Ended December 31,
|
|||||||||
|
2015
|
2014
|
2013
|
|||||||
|
Denominator:
|
|||||||||
|
Weighted average Series A, B and C common shares outstanding — basic
|
432
|
|
454
|
|
484
|
|
|||
|
Weighted average impact of assumed preferred stock conversion
|
219
|
|
227
|
|
231
|
|
|||
|
Weighted average dilutive effect of equity awards
|
5
|
|
6
|
|
7
|
|
|||
|
Weighted average Series A, B and C common shares outstanding — diluted
|
656
|
|
687
|
|
722
|
|
|||
|
Weighted average Series C convertible preferred stock outstanding — basic and diluted
|
39
|
|
43
|
|
45
|
|
|||
The weighted average number of diluted shares outstanding adjusts the weighted average number of shares of Series A, B and C common stock outstanding for the potential dilution that would occur if common stock equivalents, including convertible preferred stock and equity-based awards, were converted into common stock or exercised, calculated using the treasury stock method. Series A, B and C diluted common stock includes the impact of the conversion of Series A preferred stock, the impact of the conversion of Series C preferred stock, and the impact of equity-based compensation.
106
DISCOVERY COMMUNICATIONS, INC.
NOTES TO CONSOLIDATED FINANCIAL STATEMENTS
The table below sets forth the Company's calculated earnings per share.
|
Year Ended December 31,
|
||||||||||||
|
2015
|
2014
|
2013
|
||||||||||
|
Basic net income per share available to Discovery Communications, Inc. Series A, B and C common and Series C convertible preferred stockholders:
|
||||||||||||
|
Series A, B and C common stockholders
|
$
|
1.59
|
|
$
|
1.67
|
|
$
|
1.50
|
|
|||
|
Series C convertible preferred stockholders
|
$
|
3.18
|
|
$
|
3.34
|
|
$
|
3.00
|
|
|||
|
Diluted net income per share available to Discovery Communications, Inc. Series A, B and C common and Series C convertible preferred stockholders:
|
||||||||||||
|
Series A, B and C common stockholders
|
$
|
1.58
|
|
$
|
1.66
|
|
$
|
1.49
|
|
|||
|
Series C convertible preferred stockholders
|
$
|
3.16
|
|
$
|
3.32
|
|
$
|
2.98
|
|
|||
Series C convertible preferred earnings per share amounts may not recalculate due to rounding.
The table below presents the details of the equity-based awards and preferred shares that were excluded from the calculation of diluted earnings per share (in millions).
|
Year Ended December 31,
|
|||||||||
|
2015
|
2014
|
2013
|
|||||||
|
Anti-dilutive stock options and RSUs
|
6
|
|
4
|
|
2
|
|
|||
|
PRSUs whose performance targets are not achieved
|
3
|
|
3
|
|
2
|
|
|||
Only outstanding PRSUs whose performance targets have been achieved as of the last day of the most recent period are included in the dilutive effect calculation.
107
DISCOVERY COMMUNICATIONS, INC.
NOTES TO CONSOLIDATED FINANCIAL STATEMENTS
Valuation and Qualifying Accounts
Changes in valuation and qualifying accounts consisted of the following (in millions).
|
Beginning
of Year
|
Additions
|
Write-offs
|
Utilization
|
End
of Year
|
||||||||||||||||
|
2015
|
||||||||||||||||||||
|
Allowance for doubtful accounts
|
$
|
39
|
|
$
|
8
|
|
$
|
(7
|
)
|
$
|
—
|
|
$
|
40
|
|
|||||
|
Deferred tax valuation allowance
|
13
|
|
6
|
|
—
|
|
—
|
|
19
|
|
||||||||||
|
2014
|
||||||||||||||||||||
|
Allowance for doubtful accounts
|
16
|
|
28
|
|
(5
|
)
|
—
|
|
39
|
|
||||||||||
|
Deferred tax valuation allowance
|
18
|
|
1
|
|
(5
|
)
|
(1
|
)
|
13
|
|
||||||||||
|
2013
|
||||||||||||||||||||
|
Allowance for doubtful accounts
|
12
|
|
6
|
|
(2
|
)
|
—
|
|
16
|
|
||||||||||
|
Deferred tax valuation allowance
|
23
|
|
7
|
|
(11
|
)
|
(1
|
)
|
18
|
|
||||||||||
Accrued Liabilities
Accrued liabilities consisted of the following (in millions).
|
December 31,
|
|||||||
|
2015
|
2014
|
||||||
|
Accrued payroll and related benefits
|
$
|
449
|
|
$
|
441
|
|
|
|
Content rights payable
|
217
|
|
198
|
|
|||
|
Accrued interest
|
61
|
|
50
|
|
|||
|
Accrued income taxes
|
30
|
|
120
|
|
|||
|
Current portion of equity-based compensation liabilities
|
5
|
|
32
|
|
|||
|
Other accrued liabilities
|
226
|
|
253
|
|
|||
|
Total accrued liabilities
|
$
|
988
|
|
$
|
1,094
|
|
|
Other (Expense) Income, Net
Other (expense) income, net
, consisted of the following (in millions).
|
|
Year Ended December 31,
|
|||||||||||
|
|
2015
|
2014
|
2013
|
|||||||||
|
Foreign currency (losses) gains, net
|
$
|
(103
|
)
|
$
|
(22
|
)
|
$
|
23
|
|
|||
|
Gains (losses) on derivative instruments
|
5
|
|
1
|
|
(56
|
)
|
||||||
|
Remeasurement gain on previously held equity interest
|
2
|
|
29
|
|
92
|
|
||||||
|
Other expense, net
|
(1
|
)
|
(17
|
)
|
(10
|
)
|
||||||
|
Total other (expense) income, net
|
$
|
(97
|
)
|
$
|
(9
|
)
|
$
|
49
|
|
|||
108
DISCOVERY COMMUNICATIONS, INC.
NOTES TO CONSOLIDATED FINANCIAL STATEMENTS
Equity-Based Plan Proceeds, Net
Equity-based plan proceeds, net consisted of the following (in millions).
|
Year Ended December 31,
|
||||||||||||
|
2015
|
2014
|
2013
|
||||||||||
|
Tax settlements associated with equity-based plans
|
$
|
(27
|
)
|
$
|
(27
|
)
|
$
|
(22
|
)
|
|||
|
Proceeds from issuance of common stock in connection with equity-based plans
|
21
|
|
41
|
|
51
|
|
||||||
|
Excess tax benefits from equity-based compensation
|
12
|
|
30
|
|
44
|
|
||||||
|
Total equity-based plan proceeds, net
|
$
|
6
|
|
$
|
44
|
|
$
|
73
|
|
|||
Supplemental Cash Flow Information
|
|
Year Ended December 31,
|
|||||||||||
|
|
2015
|
2014
|
2013
|
|||||||||
|
Cash paid for taxes, net
|
$
|
653
|
|
$
|
686
|
|
$
|
484
|
|
|||
|
Cash paid for interest, net
|
312
|
|
315
|
|
299
|
|
||||||
|
Noncash investing and financing activities:
|
||||||||||||
|
Contingent consideration obligations from business acquisitions
|
13
|
|
—
|
|
—
|
|
||||||
|
Accrued purchases of property and equipment
|
12
|
|
13
|
|
11
|
|
||||||
|
Contingent consideration receivable from business dispositions
|
6
|
|
—
|
|
—
|
|
||||||
|
Assets acquired under capital lease arrangements
|
5
|
|
43
|
|
87
|
|
||||||
109
DISCOVERY COMMUNICATIONS, INC.
NOTES TO CONSOLIDATED FINANCIAL STATEMENTS
In the normal course of business, the Company enters into transactions with related parties. Related parties include entities that share common directorship, such as Liberty Global plc (“Liberty Global”), Liberty Broadband Corporation ("Liberty Broadband") and their subsidiaries and equity method investees (together the “Liberty Group”). Discovery’s Board of Directors includes Mr. Malone, who is Chairman of the Board of Liberty Global and beneficially owns approximately
25%
of the aggregate voting power with respect to the election of directors of Liberty Global. Mr. Malone is also Chairman of the Board of Liberty Broadband and beneficially owns approximately
46%
of the aggregate voting power with respect to the election of directors of Liberty Broadband. The majority of the revenue earned from the Liberty Group relates to multi-year network distribution arrangements.
Related party transactions also include revenues and expenses for content and services provided to or acquired from equity method investees, such as OWN and All3Media, or minority partners of consolidated subsidiaries. Following the Company's consolidation of Discovery Family on September 23, 2014, transactions with Hasbro Studios for content are reflected as related party expenses. Discovery Family has a seven year programming arrangement with Hasbro Studios.
The table below presents a summary of the transactions with related parties (in millions).
|
Year Ended December 31,
|
||||||||||||
|
2015
|
2014
|
2013
|
||||||||||
|
Revenues and service charges:
|
||||||||||||
|
Liberty Group
|
$
|
171
|
|
$
|
157
|
|
$
|
120
|
|
|||
|
Equity method investees
|
62
|
|
104
|
|
75
|
|
||||||
|
Other
|
35
|
|
34
|
|
28
|
|
||||||
|
Total revenues and service charges
|
$
|
268
|
|
$
|
295
|
|
$
|
223
|
|
|||
|
Interest income
(a)
|
$
|
23
|
|
$
|
33
|
|
$
|
35
|
|
|||
|
Expenses
|
$
|
(67
|
)
|
$
|
(37
|
)
|
$
|
(27
|
)
|
|||
(a)
The Company records interest earnings from loans to equity method investees as a component of income from equity method investees, net, in the consolidated statements of operations. (See Note 4.)
The table below presents receivables due from related parties (in millions).
|
December 31,
|
||||||||
|
2015
|
2014
|
|||||||
|
Receivables
|
$
|
37
|
|
$
|
42
|
|
||
|
Note receivable (See Note 4.)
|
384
|
|
457
|
|
||||
110
DISCOVERY COMMUNICATIONS, INC.
NOTES TO CONSOLIDATED FINANCIAL STATEMENTS
Contractual Commitments
As of
December 31, 2015
, the Company’s significant contractual commitments, including related payments due by period, were as follows (in millions).
|
Leases
|
||||||||||||||||||||
|
Year Ending December 31,
|
Operating
|
Capital
|
Content
|
Other
|
Total
|
|||||||||||||||
|
2016
|
$
|
72
|
|
$
|
39
|
|
$
|
768
|
|
$
|
302
|
|
$
|
1,181
|
|
|||||
|
2017
|
63
|
|
28
|
|
389
|
|
258
|
|
738
|
|
||||||||||
|
2018
|
55
|
|
17
|
|
382
|
|
219
|
|
673
|
|
||||||||||
|
2019
|
39
|
|
16
|
|
316
|
|
169
|
|
540
|
|
||||||||||
|
2020
|
39
|
|
36
|
|
498
|
|
128
|
|
701
|
|
||||||||||
|
Thereafter
|
13
|
|
39
|
|
1,022
|
|
148
|
|
1,222
|
|
||||||||||
|
Total minimum payments
|
281
|
|
175
|
|
3,375
|
|
1,224
|
|
5,055
|
|
||||||||||
|
Amounts representing interest
|
—
|
|
(33
|
)
|
—
|
|
—
|
|
(33
|
)
|
||||||||||
|
Total
|
$
|
281
|
|
$
|
142
|
|
$
|
3,375
|
|
$
|
1,224
|
|
$
|
5,022
|
|
|||||
The Company enters into multi-year lease arrangements for transponders, office space, studio facilities, and other equipment. Leases are not cancelable prior to their expiration.
Content purchase commitments are associated with third-party producers and sports associations for content that airs on the television networks. Production contracts generally require: purchase of a specified number of episodes; payments over the term of the license; and include both programs that have been delivered and are available for airing and programs that have not yet been produced or sporting events that have not yet taken place. If the content is ultimately never produced, the Company's commitments expire without obligation. The commitments disclosed above exclude content liabilities recognized on the consolidated balance sheet.
Other purchase obligations include agreements with certain vendors and suppliers for the purchase of goods and services whereby the underlying agreements are enforceable, legally binding and specify all significant terms. Significant purchase obligations include transmission services, television rating services, marketing research, employment contracts, equipment purchases, and information technology and other services. Some of these contracts do not require the purchase of fixed or minimum quantities and generally may be terminated with a 30-day to 60-day advance notice without penalty, and are not included in the table above past the 30-day to 60-day advance notice period. Amounts related to employment contracts include base compensation and do not include compensation contingent on future events.
Although the Company had limited funding commitments to equity method investees as of
December 31, 2015
, the Company may provide uncommitted additional funding to its equity method investments in the future. The Company also has the conditional obligation to issue or acquire additional shares of preferred stock. (See Note 12.)
Contingencies
Put Rights
The Company has granted put rights related to an equity method investment and certain consolidated subsidiaries. Harpo has the right to require the Company to purchase all or part of its interest in OWN for fair value at various dates.
No
amounts have been recorded by the Company for the Harpo put right. (See Note 4.) Hasbro and J:COM have the right to require the Company to purchase their remaining noncontrolling interests in Discovery Family and Discovery Japan, respectively. The Company recorded the value of the put rights for Discovery Family and Discovery Japan as a component of redeemable equity in the amounts of
$214 million
and
$26 million
, respectively. (See Note 11.) On July 22, 2015, TF1 exercised its right to put the entirety of its remaining
49%
noncontrolling interest in Eurosport to the Company for
€491 million
(
$551 million
as of the date redemption became mandatory). The transaction closed on October 1, 2015 for
$548 million
. (See Note 11.)
Legal Matters
The Company is party to various other lawsuits and claims in the ordinary course of business, including claims related to employees, vendors, other business partners or patent issues.
However, a determination as to the amount of the accrual required for such contingencies is highly subjective and requires judgment about future events. Although the outcome of these matters cannot be predicted with certainty and the impact of the final resolution of these matters on the Company's results of operations in a
111
DISCOVERY COMMUNICATIONS, INC.
NOTES TO CONSOLIDATED FINANCIAL STATEMENTS
particular subsequent reporting period is not known, management does not believe that the resolution of these other matters will
have a material adverse effect on the Company's consolidated financial position, future results of operations or cash flows.
Guarantees
There were
no
guarantees recorded as of
December 31, 2015
and
December 31, 2014
.
The Company may provide or receive indemnities intended to allocate business transaction risks. Similarly, the Company may remain contingently liable for certain obligations of a divested business in the event that a third party does not fulfill its obligations under an indemnification obligation. The Company records a liability for its indemnification obligations and other contingent liabilities when probable and estimable. There were
no
material amounts for indemnifications or other contingencies recorded as of
December 31, 2015
and
2014
.
The Company’s operating segments are determined based on (i) financial information reviewed by its chief operating decision maker ("CODM"), the Chief Executive Officer ("CEO"), (ii) internal management and related reporting structure, and (iii) the basis upon which the CEO makes resource allocation decisions.
The accounting policies of the reportable segments are the same as the Company’s, except that certain inter-segment transactions that are eliminated for consolidation are not eliminated at the segment level. Inter-segment transactions primarily include the purchase of advertising and content between segments.
The Company evaluates the operating performance of its segments based on financial measures such as revenues and adjusted operating income before depreciation and amortization (“Adjusted OIBDA”). Adjusted OIBDA is defined as operating income excluding: (i) mark-to-market equity-based compensation, (ii) depreciation and amortization, (iii) amortization of deferred launch incentives, (iv) restructuring and other charges, (v) certain impairment charges, (vi) gains and losses on business and asset dispositions, and (vii) certain inter-segment eliminations related to production studios. The Company uses this measure to assess the operating results and performance of its segments, perform analytical comparisons, identify strategies to improve performance and allocate resources to each segment. The Company believes Adjusted OIBDA is relevant to investors because it allows them to analyze the operating performance of each segment using the same metric management uses. The Company excludes mark-to-market equity-based compensation, restructuring and other charges, certain impairment charges, and gains and losses on business and asset dispositions from the calculation of Adjusted OIBDA due to their volatility. The Company also excludes depreciation of fixed assets, amortization of intangible assets and deferred launch incentives, as these amounts do not represent cash payments in the current reporting period. Certain corporate expenses are excluded from segment results to enable executive management to evaluate segment performance based upon the decisions of segment executives. Adjusted OIBDA should be considered in addition to, but not a substitute for, operating income, net income and other measures of financial performance reported in accordance with GAAP. The tables below present summarized financial information for each of the Company’s reportable segments, other operating segments and corporate and inter-segment eliminations (in millions).
Revenues by Segment
|
|
Year Ended December 31,
|
|||||||||||
|
|
2015
|
2014
|
2013
|
|||||||||
|
U.S. Networks
|
$
|
3,131
|
|
$
|
2,950
|
|
$
|
2,947
|
|
|||
|
International Networks
|
3,092
|
|
3,157
|
|
2,459
|
|
||||||
|
Education and Other
|
173
|
|
160
|
|
140
|
|
||||||
|
Corporate and inter-segment eliminations
|
(2
|
)
|
(2
|
)
|
(11
|
)
|
||||||
|
Total revenues
|
$
|
6,394
|
|
$
|
6,265
|
|
$
|
5,535
|
|
|||
112
DISCOVERY COMMUNICATIONS, INC.
NOTES TO CONSOLIDATED FINANCIAL STATEMENTS
Adjusted OIBDA by Segment
|
|
Year Ended December 31,
|
|||||||||||
|
|
2015
|
2014
|
2013
|
|||||||||
|
U.S. Networks
|
$
|
1,774
|
|
$
|
1,680
|
|
$
|
1,712
|
|
|||
|
International Networks
|
961
|
|
1,124
|
|
949
|
|
||||||
|
Education and Other
|
(2
|
)
|
6
|
|
30
|
|
||||||
|
Corporate and inter-segment eliminations
|
(335
|
)
|
(319
|
)
|
(289
|
)
|
||||||
|
Total Adjusted OIBDA
|
$
|
2,398
|
|
$
|
2,491
|
|
$
|
2,402
|
|
|||
Reconciliation of Total Adjusted OIBDA to Income before income taxes
|
|
Year Ended December 31,
|
|||||||||||
|
|
2015
|
2014
|
2013
|
|||||||||
|
Total Adjusted OIBDA
|
$
|
2,398
|
|
$
|
2,491
|
|
$
|
2,402
|
|
|||
|
Amortization of deferred launch incentives
|
(16
|
)
|
(11
|
)
|
(18
|
)
|
||||||
|
Mark-to-market equity-based compensation
|
—
|
|
(31
|
)
|
(136
|
)
|
||||||
|
Depreciation and amortization
|
(330
|
)
|
(329
|
)
|
(276
|
)
|
||||||
|
Restructuring and other charges
|
(50
|
)
|
(90
|
)
|
(16
|
)
|
||||||
|
(Loss) gain on disposition
|
(17
|
)
|
31
|
|
19
|
|
||||||
|
Operating income
|
1,985
|
|
2,061
|
|
1,975
|
|
||||||
|
Interest expense
|
(330
|
)
|
(328
|
)
|
(306
|
)
|
||||||
|
Income from equity investees, net
|
1
|
|
23
|
|
18
|
|
||||||
|
Other (expense) income, net
|
(97
|
)
|
(9
|
)
|
49
|
|
||||||
|
Income before income taxes
|
$
|
1,559
|
|
$
|
1,747
|
|
$
|
1,736
|
|
|||
Total Assets by Segment
|
|
December 31,
|
|||||||
|
|
2015
|
2014
|
||||||
|
U.S. Networks
|
$
|
3,295
|
|
$
|
3,315
|
|
||
|
International Networks
|
5,151
|
|
5,443
|
|
||||
|
Education and Other
|
520
|
|
320
|
|
||||
|
Corporate and inter-segment eliminations
|
6,898
|
|
6,892
|
|
||||
|
Total assets
|
$
|
15,864
|
|
$
|
15,970
|
|
||
Total assets for corporate and inter-segment eliminations include goodwill that is allocated to the Company's segments to account for goodwill. The presentation of segment assets in the table above is consistent with the financial reports that are reviewed by the Company's CEO. Goodwill allocated to the U.S. Networks and International Networks reporting segments to account for goodwill is disclosed in Note 8.
113
DISCOVERY COMMUNICATIONS, INC.
NOTES TO CONSOLIDATED FINANCIAL STATEMENTS
Content Amortization and Impairment Expense by Segment
|
|
Year Ended December 31,
|
|||||||||||
|
|
2015
|
2014
|
2013
|
|||||||||
|
U.S. Networks
|
$
|
771
|
|
$
|
732
|
|
$
|
626
|
|
|||
|
International Networks
|
931
|
|
826
|
|
564
|
|
||||||
|
Education and Other
|
7
|
|
4
|
|
3
|
|
||||||
|
Corporate and inter-segment eliminations
|
—
|
|
(5
|
)
|
(3
|
)
|
||||||
|
Total content amortization and impairment expense
|
$
|
1,709
|
|
$
|
1,557
|
|
$
|
1,190
|
|
|||
Content amortization and impairment expenses are generally included in costs of revenues on the consolidated statements of operations (see Note 6).
Revenues by Country
|
|
Year Ended December 31,
|
|||||||||||
|
|
2015
|
2014
|
2013
|
|||||||||
|
U.S.
|
$
|
3,261
|
|
$
|
3,081
|
|
$
|
3,071
|
|
|||
|
Non-U.S.
|
3,133
|
|
3,184
|
|
2,464
|
|
||||||
|
Total revenues
|
$
|
6,394
|
|
$
|
6,265
|
|
$
|
5,535
|
|
|||
Distribution and advertising revenues are attributed to each country based on viewer location. Other revenues are attributed to each country based on customer location.
Property and Equipment by Country
|
|
December 31,
|
|||||||
|
|
2015
|
2014
|
||||||
|
U.S.
|
$
|
252
|
|
$
|
261
|
|
||
|
U.K.
|
129
|
|
152
|
|
||||
|
Other non-U.S.
|
107
|
|
141
|
|
||||
|
Total property and equipment, net
|
$
|
488
|
|
$
|
554
|
|
||
Property and equipment balances are allocated to each country based on the location of the asset.
114
DISCOVERY COMMUNICATIONS, INC.
NOTES TO CONSOLIDATED FINANCIAL STATEMENTS
|
|
2015
(a)
|
|||||||||||||||
|
|
1
st
quarter
|
|
2
nd
quarter
|
|
3
rd
quarter
|
|
4
th
quarter
|
|||||||||
|
Revenues
|
$
|
1,537
|
|
$
|
1,654
|
|
$
|
1,557
|
|
$
|
1,646
|
|
||||
|
Operating income
|
482
|
|
557
|
|
505
|
|
441
|
|
||||||||
|
Net income
|
250
|
|
289
|
|
283
|
|
226
|
|
||||||||
|
Net income available to Discovery Communications, Inc.
|
250
|
|
286
|
|
279
|
|
219
|
|
||||||||
|
Earnings per share available to Discovery Communications, Inc. Series A, B and C common stockholders
|
||||||||||||||||
|
Basic
|
$
|
0.38
|
|
$
|
0.44
|
|
$
|
0.43
|
|
$
|
0.34
|
|
||||
|
Diluted
|
$
|
0.37
|
|
$
|
0.44
|
|
$
|
0.43
|
|
$
|
0.34
|
|
||||
|
2014
(a)(b)
|
||||||||||||||||
|
1
st
quarter
|
|
2
nd
quarter
|
|
3
rd
quarter
|
|
4
th
quarter
|
||||||||||
|
Revenues
|
$
|
1,411
|
|
$
|
1,610
|
|
$
|
1,568
|
|
$
|
1,676
|
|
||||
|
Operating income
|
434
|
|
640
|
|
511
|
|
476
|
|
||||||||
|
Net income
|
231
|
|
384
|
|
287
|
|
235
|
|
||||||||
|
Net income available to Discovery Communications, Inc.
|
230
|
|
379
|
|
280
|
|
250
|
|
||||||||
|
Earnings per share available to Discovery Communications, Inc. Series A, B and C common stockholders
|
||||||||||||||||
|
Basic
|
$
|
0.33
|
|
$
|
0.55
|
|
$
|
0.41
|
|
$
|
0.38
|
|
||||
|
Diluted
|
$
|
0.33
|
|
$
|
0.54
|
|
$
|
0.41
|
|
$
|
0.38
|
|
||||
(a)
On May 30, 2014, the Company acquired a controlling interest in Eurosport and, as a result, the accounting for Eurosport was changed from an equity method investment to a consolidated subsidiary. On March 31, 2015, the Company completed its acquisition of an additional
31%
interest in Eurosport France upon resolution of certain regulatory matters. On June 30, 2015, the Company disposed of its radio operations in SBS Nordic. (See Note 3.)
(b)
On September 23, 2014, the Company acquired an additional
10%
ownership interest in Discovery Family and, as a result, the accounting for Discovery Family was changed from an equity method investment to a consolidated subsidiary. (See Note 3.)
Overview
As of December 31,
2015
and
2014
, all of the outstanding senior notes have been issued by DCL, a wholly owned subsidiary of the Company, pursuant to one or more Registration Statements on Form S-3 filed with the U.S. Securities and Exchange Commission ("SEC"). (See Note 9.) The Company fully and unconditionally guarantees the senior notes on an unsecured basis. Each of the Company, DCL, and/or Discovery Communications Holding LLC (“DCH”) (collectively the “Issuers”) may issue additional debt securities under the Company's current Registration Statement on Form S-3 that are fully and unconditionally guaranteed by the other Issuers.
Set forth below are condensed consolidating financial statements presenting the financial position, results of operations and comprehensive income and cash flows of (i) the Company, (ii) DCH, (iii) DCL, (iv) the non-guarantor subsidiaries of DCL on a combined basis, (v) the other non-guarantor subsidiaries of the Company on a combined basis, and (vi) reclassifications and eliminations necessary to arrive at the consolidated financial statement balances for the Company. DCL and the non-guarantor subsidiaries of DCL are the primary operating subsidiaries of the Company. DCL primarily includes the Discovery Channel and TLC networks in the U.S. The non-guarantor subsidiaries of DCL include substantially all of the Company’s other U.S. and international networks, education businesses, and most of the Company’s websites and digital distribution arrangements. The non-guarantor subsidiaries of DCL are wholly owned subsidiaries of DCL with the exception of certain equity method investments. DCL is a wholly owned subsidiary of DCH. The Company wholly owns DCH through a 33 1/3% direct ownership interest and a 66 2/3% indirect ownership interest through Discovery Holding Company (“DHC”), a wholly owned subsidiary of the Company. DHC is included in the other non-guarantor subsidiaries of the Company.
115
DISCOVERY COMMUNICATIONS, INC.
NOTES TO CONSOLIDATED FINANCIAL STATEMENTS
Basis of Presentation
Solely for purposes of presenting the condensed consolidating financial statements, investments in the Company’s subsidiaries have been accounted for by their respective parent company using the equity method. Accordingly, in the following condensed consolidating financial statements the equity method has been applied to (i) the Company’s interests in DCH and the other non-guarantor subsidiaries of the Company, (ii) DCH’s interest in DCL, and (iii) DCL’s interests in the non-guarantor subsidiaries of DCL. Inter-company accounts and transactions have been eliminated to arrive at the consolidated financial statement amounts for the Company. The Company’s accounting bases in all subsidiaries, including goodwill and recognized intangible assets, have been “pushed down” to the applicable subsidiaries.
The operations of certain of the Company’s international subsidiaries are excluded from the Company’s consolidated U.S. income tax return. Tax expense related to permanent differences has been allocated to the entity that created the difference. Tax expense related to temporary differences has been allocated to the entity that created the difference, where identifiable. The remaining temporary differences are allocated to each entity included in the Company’s consolidated U.S. income tax return based on each entity’s relative pretax income. Deferred taxes have been allocated based upon the temporary differences between the carrying amounts of the respective assets and liabilities of the applicable entities.
The condensed consolidating financial statements should be read in conjunction with the consolidated financial statements of the Company.
116
DISCOVERY COMMUNICATIONS, INC.
NOTES TO CONSOLIDATED FINANCIAL STATEMENTS
CONDENSED CONSOLIDATING BALANCE SHEET
December 31, 2015
(in millions)
|
Discovery
|
DCH
|
DCL
|
Non-Guarantor
Subsidiaries of DCL |
Other Non-
Guarantor Subsidiaries of Discovery |
Reclassifications
and Eliminations |
Discovery and
Subsidiaries |
||||||||||||||||||||||
|
ASSETS
|
||||||||||||||||||||||||||||
|
Current assets:
|
||||||||||||||||||||||||||||
|
Cash and cash equivalents
|
$
|
—
|
|
$
|
—
|
|
$
|
3
|
|
$
|
387
|
|
$
|
—
|
|
$
|
—
|
|
$
|
390
|
|
|||||||
|
Receivables, net
|
—
|
|
—
|
|
435
|
|
1,044
|
|
—
|
|
—
|
|
1,479
|
|
||||||||||||||
|
Content rights, net
|
—
|
|
—
|
|
9
|
|
304
|
|
—
|
|
—
|
|
313
|
|
||||||||||||||
|
Deferred income taxes
|
—
|
|
—
|
|
36
|
|
32
|
|
—
|
|
—
|
|
68
|
|
||||||||||||||
|
Prepaid expenses and other current assets
|
47
|
|
26
|
|
163
|
|
110
|
|
—
|
|
—
|
|
346
|
|
||||||||||||||
|
Inter-company trade receivables, net
|
—
|
|
—
|
|
74
|
|
—
|
|
—
|
|
(74
|
)
|
—
|
|
||||||||||||||
|
Total current assets
|
47
|
|
26
|
|
720
|
|
1,877
|
|
—
|
|
(74
|
)
|
2,596
|
|
||||||||||||||
|
Investment in and advances to subsidiaries
|
5,406
|
|
5,381
|
|
7,539
|
|
—
|
|
3,618
|
|
(21,944
|
)
|
—
|
|
||||||||||||||
|
Noncurrent content rights, net
|
—
|
|
—
|
|
601
|
|
1,429
|
|
—
|
|
—
|
|
2,030
|
|
||||||||||||||
|
Goodwill
|
—
|
|
—
|
|
3,769
|
|
4,395
|
|
—
|
|
—
|
|
8,164
|
|
||||||||||||||
|
Intangible assets, net
|
—
|
|
—
|
|
290
|
|
1,440
|
|
—
|
|
—
|
|
1,730
|
|
||||||||||||||
|
Equity method investments
|
—
|
|
—
|
|
25
|
|
542
|
|
—
|
|
—
|
|
567
|
|
||||||||||||||
|
Other noncurrent assets
|
—
|
|
20
|
|
103
|
|
674
|
|
—
|
|
(20
|
)
|
777
|
|
||||||||||||||
|
Total assets
|
$
|
5,453
|
|
$
|
5,427
|
|
$
|
13,047
|
|
$
|
10,357
|
|
$
|
3,618
|
|
$
|
(22,038
|
)
|
$
|
15,864
|
|
|||||||
|
LIABILITIES AND EQUITY
|
||||||||||||||||||||||||||||
|
Current liabilities:
|
||||||||||||||||||||||||||||
|
Current portion of debt
|
$
|
—
|
|
$
|
—
|
|
$
|
98
|
|
$
|
21
|
|
$
|
—
|
|
$
|
—
|
|
$
|
119
|
|
|||||||
|
Other current liabilities
|
—
|
|
—
|
|
470
|
|
990
|
|
—
|
|
—
|
|
1,460
|
|
||||||||||||||
|
Inter-company trade payables, net
|
—
|
|
—
|
|
—
|
|
74
|
|
—
|
|
(74
|
)
|
—
|
|
||||||||||||||
|
Total current liabilities
|
—
|
|
—
|
|
568
|
|
1,085
|
|
—
|
|
(74
|
)
|
1,579
|
|
||||||||||||||
|
Noncurrent portion of debt
|
—
|
|
—
|
|
6,724
|
|
892
|
|
—
|
|
—
|
|
7,616
|
|
||||||||||||||
|
Other noncurrent liabilities
|
2
|
|
—
|
|
374
|
|
600
|
|
21
|
|
(20
|
)
|
977
|
|
||||||||||||||
|
Total liabilities
|
2
|
|
—
|
|
7,666
|
|
2,577
|
|
21
|
|
(94
|
)
|
10,172
|
|
||||||||||||||
|
Redeemable noncontrolling interests
|
—
|
|
—
|
|
—
|
|
241
|
|
—
|
|
—
|
|
241
|
|
||||||||||||||
|
Equity attributable to Discovery Communications, Inc.
|
5,451
|
|
5,427
|
|
5,381
|
|
7,539
|
|
3,597
|
|
(21,944
|
)
|
5,451
|
|
||||||||||||||
|
Total liabilities and equity
|
$
|
5,453
|
|
$
|
5,427
|
|
$
|
13,047
|
|
$
|
10,357
|
|
$
|
3,618
|
|
$
|
(22,038
|
)
|
$
|
15,864
|
|
|||||||
117
DISCOVERY COMMUNICATIONS, INC.
NOTES TO CONSOLIDATED FINANCIAL STATEMENTS
CONDENSED CONSOLIDATING BALANCE SHEET
December 31, 2014
(in millions)
|
Discovery
|
DCH
|
DCL
|
Non-Guarantor
Subsidiaries of DCL |
Other Non-
Guarantor Subsidiaries of Discovery |
Reclassifications
and Eliminations |
Discovery and
Subsidiaries |
||||||||||||||||||||||
|
ASSETS
|
||||||||||||||||||||||||||||
|
Current assets:
|
||||||||||||||||||||||||||||
|
Cash and cash equivalents
|
$
|
—
|
|
$
|
—
|
|
$
|
8
|
|
$
|
359
|
|
$
|
—
|
|
$
|
—
|
|
$
|
367
|
|
|||||||
|
Receivables, net
|
—
|
|
—
|
|
416
|
|
1,017
|
|
—
|
|
—
|
|
1,433
|
|
||||||||||||||
|
Content rights, net
|
—
|
|
—
|
|
8
|
|
321
|
|
—
|
|
—
|
|
329
|
|
||||||||||||||
|
Deferred income taxes
|
—
|
|
—
|
|
40
|
|
47
|
|
—
|
|
—
|
|
87
|
|
||||||||||||||
|
Prepaid expenses and other current assets
|
—
|
|
11
|
|
164
|
|
100
|
|
—
|
|
—
|
|
275
|
|
||||||||||||||
|
Inter-company trade receivables, net
|
—
|
|
—
|
|
151
|
|
—
|
|
—
|
|
(151
|
)
|
—
|
|
||||||||||||||
|
Total current assets
|
—
|
|
11
|
|
787
|
|
1,844
|
|
—
|
|
(151
|
)
|
2,491
|
|
||||||||||||||
|
Investment in and advances to subsidiaries
|
5,678
|
|
5,669
|
|
7,750
|
|
—
|
|
3,800
|
|
(22,897
|
)
|
—
|
|
||||||||||||||
|
Noncurrent content rights, net
|
—
|
|
—
|
|
613
|
|
1,360
|
|
—
|
|
—
|
|
1,973
|
|
||||||||||||||
|
Goodwill
|
—
|
|
—
|
|
3,769
|
|
4,467
|
|
—
|
|
—
|
|
8,236
|
|
||||||||||||||
|
Intangible assets, net
|
—
|
|
—
|
|
307
|
|
1,664
|
|
—
|
|
—
|
|
1,971
|
|
||||||||||||||
|
Equity method investments
|
—
|
|
—
|
|
21
|
|
623
|
|
—
|
|
—
|
|
644
|
|
||||||||||||||
|
Other noncurrent assets
|
—
|
|
20
|
|
106
|
|
549
|
|
—
|
|
(20
|
)
|
655
|
|
||||||||||||||
|
Total assets
|
$
|
5,678
|
|
$
|
5,700
|
|
$
|
13,353
|
|
$
|
10,507
|
|
$
|
3,800
|
|
$
|
(23,068
|
)
|
$
|
15,970
|
|
|||||||
|
LIABILITIES AND EQUITY
|
|
|
||||||||||||||||||||||||||
|
Current liabilities:
|
|
|
||||||||||||||||||||||||||
|
Current portion of debt
|
$
|
—
|
|
$
|
—
|
|
$
|
1,084
|
|
$
|
23
|
|
$
|
—
|
|
$
|
—
|
|
$
|
1,107
|
|
|||||||
|
Other current liabilities
|
73
|
|
—
|
|
433
|
|
991
|
|
—
|
|
—
|
|
1,497
|
|
||||||||||||||
|
Inter-company trade payables, net
|
—
|
|
—
|
|
—
|
|
151
|
|
—
|
|
(151
|
)
|
—
|
|
||||||||||||||
|
Total current liabilities
|
73
|
|
—
|
|
1,517
|
|
1,165
|
|
—
|
|
(151
|
)
|
2,604
|
|
||||||||||||||
|
Noncurrent portion of debt
|
—
|
|
—
|
|
5,824
|
|
178
|
|
—
|
|
—
|
|
6,002
|
|
||||||||||||||
|
Other noncurrent liabilities
|
3
|
|
—
|
|
343
|
|
665
|
|
22
|
|
(20
|
)
|
1,013
|
|
||||||||||||||
|
Total liabilities
|
76
|
|
—
|
|
7,684
|
|
2,008
|
|
22
|
|
(171
|
)
|
9,619
|
|
||||||||||||||
|
Redeemable noncontrolling interests
|
—
|
|
—
|
|
—
|
|
747
|
|
—
|
|
—
|
|
747
|
|
||||||||||||||
|
Equity attributable to Discovery Communications, Inc.
|
5,602
|
|
5,700
|
|
5,669
|
|
7,752
|
|
3,778
|
|
(22,899
|
)
|
5,602
|
|
||||||||||||||
|
Noncontrolling interests
|
—
|
|
—
|
|
—
|
|
—
|
|
—
|
|
2
|
|
2
|
|
||||||||||||||
|
Total equity
|
5,602
|
|
5,700
|
|
5,669
|
|
7,752
|
|
3,778
|
|
(22,897
|
)
|
5,604
|
|
||||||||||||||
|
Total liabilities and equity
|
$
|
5,678
|
|
$
|
5,700
|
|
$
|
13,353
|
|
$
|
10,507
|
|
$
|
3,800
|
|
$
|
(23,068
|
)
|
$
|
15,970
|
|
|||||||
118
DISCOVERY COMMUNICATIONS, INC.
NOTES TO CONSOLIDATED FINANCIAL STATEMENTS
CONDENSED CONSOLIDATING STATEMENT OF OPERATIONS
For the Year Ended
December 31, 2015
(in millions)
|
Discovery
|
DCH
|
DCL
|
Non-Guarantor
Subsidiaries of DCL |
Other Non-
Guarantor Subsidiaries of Discovery |
Reclassifications
and Eliminations |
Discovery and
Subsidiaries |
||||||||||||||||||||||
|
Revenues
|
$
|
—
|
|
$
|
—
|
|
$
|
1,909
|
|
$
|
4,498
|
|
$
|
—
|
|
$
|
(13
|
)
|
$
|
6,394
|
|
|||||||
|
Costs of revenues, excluding depreciation and amortization
|
—
|
|
—
|
|
500
|
|
1,847
|
|
—
|
|
(4
|
)
|
2,343
|
|
||||||||||||||
|
Selling, general and administrative
|
15
|
|
—
|
|
265
|
|
1,398
|
|
—
|
|
(9
|
)
|
1,669
|
|
||||||||||||||
|
Depreciation and amortization
|
—
|
|
—
|
|
35
|
|
295
|
|
—
|
|
—
|
|
330
|
|
||||||||||||||
|
Restructuring and other charges
|
—
|
|
—
|
|
28
|
|
22
|
|
—
|
|
—
|
|
50
|
|
||||||||||||||
|
Loss on disposition
|
—
|
|
—
|
|
—
|
|
17
|
|
—
|
|
—
|
|
17
|
|
||||||||||||||
|
Total costs and expenses
|
15
|
|
—
|
|
828
|
|
3,579
|
|
—
|
|
(13
|
)
|
4,409
|
|
||||||||||||||
|
Operating (loss) income
|
(15
|
)
|
—
|
|
1,081
|
|
919
|
|
—
|
|
—
|
|
1,985
|
|
||||||||||||||
|
Equity in earnings of subsidiaries
|
1,044
|
|
1,044
|
|
505
|
|
—
|
|
696
|
|
(3,289
|
)
|
—
|
|
||||||||||||||
|
Interest expense
|
—
|
|
—
|
|
(318
|
)
|
(12
|
)
|
—
|
|
—
|
|
(330
|
)
|
||||||||||||||
|
Income from equity investees, net
|
—
|
|
—
|
|
4
|
|
(3
|
)
|
—
|
|
—
|
|
1
|
|
||||||||||||||
|
Other income (expense), net
|
—
|
|
—
|
|
9
|
|
(106
|
)
|
—
|
|
—
|
|
(97
|
)
|
||||||||||||||
|
Income before income taxes
|
1,029
|
|
1,044
|
|
1,281
|
|
798
|
|
696
|
|
(3,289
|
)
|
1,559
|
|
||||||||||||||
|
Benefit from (provision for) income taxes
|
5
|
|
—
|
|
(237
|
)
|
(279
|
)
|
—
|
|
—
|
|
(511
|
)
|
||||||||||||||
|
Net income
|
1,034
|
|
1,044
|
|
1,044
|
|
519
|
|
696
|
|
(3,289
|
)
|
1,048
|
|
||||||||||||||
|
Net income attributable to noncontrolling interests
|
—
|
|
—
|
|
—
|
|
—
|
|
—
|
|
(1
|
)
|
(1
|
)
|
||||||||||||||
|
Net income attributable to redeemable noncontrolling interests
|
—
|
|
—
|
|
—
|
|
—
|
|
—
|
|
(13
|
)
|
(13
|
)
|
||||||||||||||
|
Net income available to Discovery Communications, Inc.
|
$
|
1,034
|
|
$
|
1,044
|
|
$
|
1,044
|
|
$
|
519
|
|
$
|
696
|
|
$
|
(3,303
|
)
|
$
|
1,034
|
|
|||||||
119
DISCOVERY COMMUNICATIONS, INC.
NOTES TO CONSOLIDATED FINANCIAL STATEMENTS
CONDENSED CONSOLIDATING STATEMENT OF OPERATIONS
For the Year Ended
December 31, 2014
(in millions)
|
Discovery
|
DCH
|
DCL
|
Non-Guarantor
Subsidiaries of DCL |
Other Non-
Guarantor Subsidiaries of Discovery |
Reclassifications
and Eliminations |
Discovery and
Subsidiaries |
||||||||||||||||||||||
|
Revenues
|
$
|
—
|
|
$
|
—
|
|
$
|
1,871
|
|
$
|
4,396
|
|
$
|
—
|
|
$
|
(2
|
)
|
$
|
6,265
|
|
|||||||
|
Costs of revenues, excluding depreciation and amortization
|
—
|
|
—
|
|
454
|
|
1,671
|
|
—
|
|
(1
|
)
|
2,124
|
|
||||||||||||||
|
Selling, general and administrative
|
15
|
|
—
|
|
223
|
|
1,455
|
|
—
|
|
(1
|
)
|
1,692
|
|
||||||||||||||
|
Depreciation and amortization
|
—
|
|
—
|
|
34
|
|
295
|
|
—
|
|
—
|
|
329
|
|
||||||||||||||
|
Restructuring and other charges
|
—
|
|
—
|
|
17
|
|
73
|
|
—
|
|
—
|
|
90
|
|
||||||||||||||
|
Gain on disposition
|
—
|
|
—
|
|
—
|
|
(31
|
)
|
—
|
|
—
|
|
(31
|
)
|
||||||||||||||
|
Total costs and expenses
|
15
|
|
—
|
|
728
|
|
3,463
|
|
—
|
|
(2
|
)
|
4,204
|
|
||||||||||||||
|
Operating (loss) income
|
(15
|
)
|
—
|
|
1,143
|
|
933
|
|
—
|
|
—
|
|
2,061
|
|
||||||||||||||
|
Equity in earnings of subsidiaries
|
1,148
|
|
1,148
|
|
561
|
|
—
|
|
765
|
|
(3,622
|
)
|
—
|
|
||||||||||||||
|
Interest expense
|
—
|
|
—
|
|
(319
|
)
|
(9
|
)
|
—
|
|
—
|
|
(328
|
)
|
||||||||||||||
|
Income from equity method investees, net
|
—
|
|
—
|
|
10
|
|
13
|
|
—
|
|
—
|
|
23
|
|
||||||||||||||
|
Other income (expense), net
|
—
|
|
—
|
|
36
|
|
(45
|
)
|
—
|
|
—
|
|
(9
|
)
|
||||||||||||||
|
Income before income taxes
|
1,133
|
|
1,148
|
|
1,431
|
|
892
|
|
765
|
|
(3,622
|
)
|
1,747
|
|
||||||||||||||
|
Benefit from (provision for) income taxes
|
6
|
|
—
|
|
(283
|
)
|
(333
|
)
|
—
|
|
—
|
|
(610
|
)
|
||||||||||||||
|
Net income
|
1,139
|
|
1,148
|
|
1,148
|
|
559
|
|
765
|
|
(3,622
|
)
|
1,137
|
|
||||||||||||||
|
Net income attributable to noncontrolling interests
|
—
|
|
—
|
|
—
|
|
—
|
|
—
|
|
(2
|
)
|
(2
|
)
|
||||||||||||||
|
Net income attributable to redeemable noncontrolling interests
|
—
|
|
—
|
|
—
|
|
—
|
|
—
|
|
4
|
|
4
|
|
||||||||||||||
|
Net income available to Discovery Communications, Inc.
|
$
|
1,139
|
|
$
|
1,148
|
|
$
|
1,148
|
|
$
|
559
|
|
$
|
765
|
|
$
|
(3,620
|
)
|
$
|
1,139
|
|
|||||||
120
DISCOVERY COMMUNICATIONS, INC.
NOTES TO CONSOLIDATED FINANCIAL STATEMENTS
CONDENSED CONSOLIDATING STATEMENT OF OPERATIONS
For the Year Ended
December 31, 2013
(in millions)
|
Discovery
|
DCH
|
DCL
|
Non-Guarantor
Subsidiaries of DCL |
Other Non-
Guarantor Subsidiaries of Discovery |
Reclassifications
and Eliminations |
Discovery and
Subsidiaries |
||||||||||||||||||||||
|
Revenues
|
$
|
—
|
|
$
|
—
|
|
$
|
1,867
|
|
$
|
3,678
|
|
$
|
—
|
|
$
|
(10
|
)
|
$
|
5,535
|
|
|||||||
|
Costs of revenues, excluding depreciation and amortization
|
—
|
|
—
|
|
445
|
|
1,252
|
|
—
|
|
(8
|
)
|
1,689
|
|
||||||||||||||
|
Selling, general and administrative
|
15
|
|
—
|
|
270
|
|
1,315
|
|
—
|
|
(2
|
)
|
1,598
|
|
||||||||||||||
|
Depreciation and amortization
|
—
|
|
—
|
|
36
|
|
240
|
|
—
|
|
—
|
|
276
|
|
||||||||||||||
|
Restructuring and other charges
|
—
|
|
—
|
|
1
|
|
15
|
|
—
|
|
—
|
|
16
|
|
||||||||||||||
|
Gain on disposition
|
—
|
|
—
|
|
—
|
|
(19
|
)
|
—
|
|
—
|
|
(19
|
)
|
||||||||||||||
|
Total costs and expenses
|
15
|
|
—
|
|
752
|
|
2,803
|
|
—
|
|
(10
|
)
|
3,560
|
|
||||||||||||||
|
Operating (loss) income
|
(15
|
)
|
—
|
|
1,115
|
|
875
|
|
—
|
|
—
|
|
1,975
|
|
||||||||||||||
|
Equity in earnings of subsidiaries
|
1,084
|
|
1,084
|
|
620
|
|
—
|
|
723
|
|
(3,511
|
)
|
—
|
|
||||||||||||||
|
Interest expense
|
—
|
|
—
|
|
(299
|
)
|
(7
|
)
|
—
|
|
—
|
|
(306
|
)
|
||||||||||||||
|
Income from equity investees, net
|
—
|
|
—
|
|
4
|
|
14
|
|
—
|
|
—
|
|
18
|
|
||||||||||||||
|
Other (expense) income, net
|
—
|
|
—
|
|
(50
|
)
|
99
|
|
—
|
|
—
|
|
49
|
|
||||||||||||||
|
Income before income taxes
|
1,069
|
|
1,084
|
|
1,390
|
|
981
|
|
723
|
|
(3,511
|
)
|
1,736
|
|
||||||||||||||
|
Benefit from (provision for) income taxes
|
6
|
|
—
|
|
(306
|
)
|
(359
|
)
|
—
|
|
—
|
|
(659
|
)
|
||||||||||||||
|
Net income
|
1,075
|
|
1,084
|
|
1,084
|
|
622
|
|
723
|
|
(3,511
|
)
|
1,077
|
|
||||||||||||||
|
Net income attributable to noncontrolling interests
|
—
|
|
—
|
|
—
|
|
—
|
|
—
|
|
(1
|
)
|
(1
|
)
|
||||||||||||||
|
Net income attributable to redeemable noncontrolling interests
|
—
|
|
—
|
|
—
|
|
—
|
|
—
|
|
(1
|
)
|
(1
|
)
|
||||||||||||||
|
Net income available to Discovery Communications, Inc.
|
$
|
1,075
|
|
$
|
1,084
|
|
$
|
1,084
|
|
$
|
622
|
|
$
|
723
|
|
$
|
(3,513
|
)
|
$
|
1,075
|
|
|||||||
121
DISCOVERY COMMUNICATIONS, INC.
NOTES TO CONSOLIDATED FINANCIAL STATEMENTS
CONDENSED CONSOLIDATING STATEMENT OF COMPREHENSIVE INCOME
For the Year Ended to
December 31, 2015
(in millions)
|
Discovery
|
DCH
|
DCL
|
Non-Guarantor
Subsidiaries of DCL |
Other Non-
Guarantor Subsidiaries of Discovery |
Reclassifications
and Eliminations |
Discovery and
Subsidiaries |
||||||||||||||||||||||
|
Net income
|
$
|
1,034
|
|
$
|
1,044
|
|
$
|
1,044
|
|
$
|
519
|
|
$
|
696
|
|
$
|
(3,289
|
)
|
$
|
1,048
|
|
|||||||
|
Other comprehensive (loss) income, net of tax:
|
||||||||||||||||||||||||||||
|
Currency translation adjustments
|
(201
|
)
|
(201
|
)
|
(201
|
)
|
(199
|
)
|
(134
|
)
|
735
|
|
(201
|
)
|
||||||||||||||
|
Market value adjustments
|
(25
|
)
|
(25
|
)
|
(25
|
)
|
(25
|
)
|
(17
|
)
|
92
|
|
(25
|
)
|
||||||||||||||
|
Derivative adjustments
|
(1
|
)
|
(1
|
)
|
(1
|
)
|
(3
|
)
|
(1
|
)
|
6
|
|
(1
|
)
|
||||||||||||||
|
Comprehensive income
|
807
|
|
817
|
|
817
|
|
292
|
|
544
|
|
(2,456
|
)
|
821
|
|
||||||||||||||
|
Comprehensive income attributable to noncontrolling interests
|
—
|
|
—
|
|
—
|
|
—
|
|
—
|
|
(1
|
)
|
(1
|
)
|
||||||||||||||
|
Comprehensive loss attributable to redeemable noncontrolling interests
|
23
|
|
23
|
|
23
|
|
23
|
|
15
|
|
(97
|
)
|
10
|
|
||||||||||||||
|
Comprehensive income attributable to Discovery Communications, Inc.
|
$
|
830
|
|
$
|
840
|
|
$
|
840
|
|
$
|
315
|
|
$
|
559
|
|
$
|
(2,554
|
)
|
$
|
830
|
|
|||||||
122
DISCOVERY COMMUNICATIONS, INC.
NOTES TO CONSOLIDATED FINANCIAL STATEMENTS
CONDENSED CONSOLIDATING STATEMENT OF COMPREHENSIVE INCOME
For the Year Ended to
December 31, 2014
(in millions)
|
Discovery
|
DCH
|
DCL
|
Non-Guarantor
Subsidiaries of DCL |
Other Non-
Guarantor Subsidiaries of Discovery |
Reclassifications
and Eliminations |
Discovery and
Subsidiaries |
||||||||||||||||||||||
|
Net income
|
$
|
1,139
|
|
$
|
1,148
|
|
$
|
1,148
|
|
$
|
559
|
|
$
|
765
|
|
$
|
(3,622
|
)
|
$
|
1,137
|
|
|||||||
|
Other comprehensive (loss) income, net of tax:
|
||||||||||||||||||||||||||||
|
Currency translation adjustments
|
(399
|
)
|
(399
|
)
|
(399
|
)
|
(397
|
)
|
(266
|
)
|
1,461
|
|
(399
|
)
|
||||||||||||||
|
Market value adjustments
|
(2
|
)
|
(2
|
)
|
(2
|
)
|
(2
|
)
|
(2
|
)
|
8
|
|
(2
|
)
|
||||||||||||||
|
Derivative adjustments
|
(11
|
)
|
(11
|
)
|
(11
|
)
|
10
|
|
(7
|
)
|
19
|
|
(11
|
)
|
||||||||||||||
|
Comprehensive income
|
727
|
|
736
|
|
736
|
|
170
|
|
490
|
|
(2,134
|
)
|
725
|
|
||||||||||||||
|
Comprehensive income attributable to noncontrolling interests
|
—
|
|
—
|
|
—
|
|
—
|
|
—
|
|
(2
|
)
|
(2
|
)
|
||||||||||||||
|
Comprehensive loss attributable to redeemable noncontrolling interests
|
40
|
|
40
|
|
40
|
|
40
|
|
27
|
|
(143
|
)
|
44
|
|
||||||||||||||
|
Comprehensive income attributable to Discovery Communications, Inc.
|
$
|
767
|
|
$
|
776
|
|
$
|
776
|
|
$
|
210
|
|
$
|
517
|
|
$
|
(2,279
|
)
|
$
|
767
|
|
|||||||
123
DISCOVERY COMMUNICATIONS, INC.
NOTES TO CONSOLIDATED FINANCIAL STATEMENTS
CONDENSED CONSOLIDATING STATEMENT OF COMPREHENSIVE INCOME
For the Year Ended to
December 31, 2013
(in millions)
|
Discovery
|
DCH
|
DCL
|
Non-Guarantor
Subsidiaries of DCL |
Other Non-
Guarantor Subsidiaries of Discovery |
Reclassifications
and Eliminations |
Discovery and
Subsidiaries |
||||||||||||||||||||||
|
Net income
|
$
|
1,075
|
|
$
|
1,084
|
|
$
|
1,084
|
|
$
|
622
|
|
$
|
723
|
|
$
|
(3,511
|
)
|
$
|
1,077
|
|
|||||||
|
Other comprehensive income (loss), net of tax:
|
||||||||||||||||||||||||||||
|
Currency translation adjustments
|
(11
|
)
|
(11
|
)
|
(11
|
)
|
(10
|
)
|
(7
|
)
|
39
|
|
(11
|
)
|
||||||||||||||
|
Market value adjustments
|
2
|
|
2
|
|
2
|
|
5
|
|
1
|
|
(10
|
)
|
2
|
|
||||||||||||||
|
Derivative adjustments
|
6
|
|
6
|
|
6
|
|
6
|
|
4
|
|
(22
|
)
|
6
|
|
||||||||||||||
|
Comprehensive income
|
1,072
|
|
1,081
|
|
1,081
|
|
623
|
|
721
|
|
(3,504
|
)
|
1,074
|
|
||||||||||||||
|
Comprehensive income attributable to noncontrolling interests
|
—
|
|
—
|
|
—
|
|
—
|
|
—
|
|
(1
|
)
|
(1
|
)
|
||||||||||||||
|
Comprehensive loss attributable to redeemable noncontrolling interests
|
3
|
|
3
|
|
3
|
|
3
|
|
2
|
|
(12
|
)
|
2
|
|
||||||||||||||
|
Comprehensive income attributable to Discovery Communications, Inc.
|
$
|
1,075
|
|
$
|
1,084
|
|
$
|
1,084
|
|
$
|
626
|
|
$
|
723
|
|
$
|
(3,517
|
)
|
$
|
1,075
|
|
|||||||
124
DISCOVERY COMMUNICATIONS, INC.
NOTES TO CONSOLIDATED FINANCIAL STATEMENTS
CONDENSED CONSOLIDATING STATEMENT OF CASH FLOWS
For the Year Ended
December 31, 2015
(in millions)
|
Discovery
|
DCH
|
DCL
|
Non-Guarantor
Subsidiaries of DCL |
Other Non-
Guarantor Subsidiaries of Discovery |
Reclassifications
and Eliminations |
Discovery and
Subsidiaries |
||||||||||||||||||||||
|
Operating Activities
|
||||||||||||||||||||||||||||
|
Cash (used in) provided by operating activities
|
$
|
(134
|
)
|
$
|
(15
|
)
|
$
|
422
|
|
$
|
1,004
|
|
$
|
—
|
|
$
|
—
|
|
$
|
1,277
|
|
|||||||
|
Investing Activities
|
||||||||||||||||||||||||||||
|
Purchases of property and equipment
|
—
|
|
—
|
|
(17
|
)
|
(86
|
)
|
—
|
|
—
|
|
(103
|
)
|
||||||||||||||
|
Business acquisitions, net of cash acquired
|
—
|
|
—
|
|
—
|
|
(80
|
)
|
—
|
|
—
|
|
(80
|
)
|
||||||||||||||
|
Payments for derivative instruments
|
—
|
|
—
|
|
(11
|
)
|
2
|
|
—
|
|
—
|
|
(9
|
)
|
||||||||||||||
|
Proceeds from dispositions, net of cash disposed
|
—
|
|
—
|
|
—
|
|
61
|
|
—
|
|
—
|
|
61
|
|
||||||||||||||
|
Distributions from equity method investees
|
—
|
|
—
|
|
—
|
|
87
|
|
—
|
|
—
|
|
87
|
|
||||||||||||||
|
Investments in equity method investees, net
|
—
|
|
—
|
|
(10
|
)
|
(51
|
)
|
—
|
|
—
|
|
(61
|
)
|
||||||||||||||
|
Investments in available-for-sale and cost method investments
|
—
|
|
—
|
|
—
|
|
(211
|
)
|
—
|
|
—
|
|
(211
|
)
|
||||||||||||||
|
Inter-company distributions
|
—
|
|
—
|
|
37
|
|
—
|
|
—
|
|
(37
|
)
|
—
|
|
||||||||||||||
|
Other investing activities, net
|
—
|
|
—
|
|
—
|
|
15
|
|
—
|
|
—
|
|
15
|
|
||||||||||||||
|
Cash (used in) provided by investing activities
|
—
|
|
—
|
|
(1
|
)
|
(263
|
)
|
—
|
|
(37
|
)
|
(301
|
)
|
||||||||||||||
|
Financing Activities
|
||||||||||||||||||||||||||||
|
Commercial paper repayments, net
|
—
|
|
—
|
|
(136
|
)
|
—
|
|
—
|
|
—
|
|
(136
|
)
|
||||||||||||||
|
Borrowings under revolving credit facility
|
—
|
|
—
|
|
—
|
|
1,016
|
|
—
|
|
—
|
|
1,016
|
|
||||||||||||||
|
Principal repayments of revolving credit facility
|
—
|
|
—
|
|
(13
|
)
|
(252
|
)
|
—
|
|
—
|
|
(265
|
)
|
||||||||||||||
|
Borrowings from debt, net of discount
|
—
|
|
—
|
|
936
|
|
—
|
|
—
|
|
—
|
|
936
|
|
||||||||||||||
|
Principal repayments of debt
|
—
|
|
—
|
|
(849
|
)
|
—
|
|
—
|
|
—
|
|
(849
|
)
|
||||||||||||||
|
Principal repayments of capital lease obligations
|
—
|
|
—
|
|
(5
|
)
|
(22
|
)
|
—
|
|
—
|
|
(27
|
)
|
||||||||||||||
|
Repurchases of stock
|
(951
|
)
|
—
|
|
—
|
|
—
|
|
—
|
|
—
|
|
(951
|
)
|
||||||||||||||
|
Purchase of redeemable noncontrolling interests
|
—
|
|
—
|
|
—
|
|
(548
|
)
|
—
|
|
—
|
|
(548
|
)
|
||||||||||||||
|
Payments to redeemable noncontrolling interests
|
—
|
|
—
|
|
—
|
|
(42
|
)
|
—
|
|
—
|
|
(42
|
)
|
||||||||||||||
|
Equity-based plan payments, net
|
6
|
|
—
|
|
—
|
|
—
|
|
—
|
|
—
|
|
6
|
|
||||||||||||||
|
Hedge of borrowings from debt instruments
|
—
|
|
—
|
|
(29
|
)
|
—
|
|
—
|
|
—
|
|
(29
|
)
|
||||||||||||||
|
Inter-company distributions
|
—
|
|
—
|
|
—
|
|
(37
|
)
|
—
|
|
37
|
|
—
|
|
||||||||||||||
|
Inter-company contributions and other financing activities, net
|
1,079
|
|
15
|
|
(330
|
)
|
(777
|
)
|
—
|
|
—
|
|
(13
|
)
|
||||||||||||||
|
Cash provided by (used in) financing activities
|
134
|
|
15
|
|
(426
|
)
|
(662
|
)
|
—
|
|
37
|
|
(902
|
)
|
||||||||||||||
|
Effect of exchange rate changes on cash and cash equivalents
|
—
|
|
—
|
|
—
|
|
(51
|
)
|
—
|
|
—
|
|
(51
|
)
|
||||||||||||||
|
Net change in cash and cash equivalents
|
—
|
|
—
|
|
(5
|
)
|
28
|
|
—
|
|
—
|
|
23
|
|
||||||||||||||
|
Cash and cash equivalents, beginning of period
|
—
|
|
—
|
|
8
|
|
359
|
|
—
|
|
—
|
|
367
|
|
||||||||||||||
|
Cash and cash equivalents, end of period
|
$
|
—
|
|
$
|
—
|
|
$
|
3
|
|
$
|
387
|
|
$
|
—
|
|
$
|
—
|
|
$
|
390
|
|
|||||||
125
DISCOVERY COMMUNICATIONS, INC.
NOTES TO CONSOLIDATED FINANCIAL STATEMENTS
CONDENSED CONSOLIDATING STATEMENT OF CASH FLOWS
For the Year Ended
December 31, 2014
(in millions)
|
Discovery
|
DCH
|
DCL
|
Non-Guarantor
Subsidiaries of DCL |
Other Non-
Guarantor Subsidiaries of Discovery |
Reclassifications
and Eliminations |
Discovery and
Subsidiaries |
||||||||||||||||||||||
|
Operating Activities
|
||||||||||||||||||||||||||||
|
Cash provided by (used in) operating activities
|
$
|
111
|
|
$
|
(17
|
)
|
$
|
269
|
|
$
|
955
|
|
$
|
—
|
|
$
|
—
|
|
$
|
1,318
|
|
|||||||
|
Investing Activities
|
||||||||||||||||||||||||||||
|
Purchases of property and equipment
|
—
|
|
—
|
|
(16
|
)
|
(104
|
)
|
—
|
|
—
|
|
(120
|
)
|
||||||||||||||
|
Business acquisitions, net of cash acquired
|
—
|
|
—
|
|
(64
|
)
|
(308
|
)
|
—
|
|
—
|
|
(372
|
)
|
||||||||||||||
|
Proceeds from disposition, net of cash disposed
|
—
|
|
—
|
|
—
|
|
45
|
|
—
|
|
—
|
|
45
|
|
||||||||||||||
|
Distribution from equity method investees
|
—
|
|
—
|
|
—
|
|
61
|
|
—
|
|
—
|
|
61
|
|
||||||||||||||
|
Investments in equity method investees, net
|
—
|
|
—
|
|
(5
|
)
|
(172
|
)
|
—
|
|
—
|
|
(177
|
)
|
||||||||||||||
|
Other investing activities, net
|
—
|
|
—
|
|
—
|
|
(5
|
)
|
—
|
|
—
|
|
(5
|
)
|
||||||||||||||
|
Cash used in investing activities
|
—
|
|
—
|
|
(85
|
)
|
(483
|
)
|
—
|
|
—
|
|
(568
|
)
|
||||||||||||||
|
Financing Activities
|
||||||||||||||||||||||||||||
|
Commercial paper borrowings, net
|
—
|
|
—
|
|
229
|
|
—
|
|
—
|
|
—
|
|
229
|
|
||||||||||||||
|
Borrowings under revolving credit facility
|
—
|
|
—
|
|
553
|
|
145
|
|
—
|
|
—
|
|
698
|
|
||||||||||||||
|
Principal repayments of revolving credit facility
|
—
|
|
—
|
|
(540
|
)
|
(120
|
)
|
—
|
|
—
|
|
(660
|
)
|
||||||||||||||
|
Borrowings from debt, net of discount
|
—
|
|
—
|
|
415
|
|
—
|
|
—
|
|
—
|
|
415
|
|
||||||||||||||
|
Principal repayments of capital lease obligations
|
—
|
|
—
|
|
(4
|
)
|
(15
|
)
|
—
|
|
—
|
|
(19
|
)
|
||||||||||||||
|
Repurchases of stock
|
(1,422
|
)
|
—
|
|
—
|
|
—
|
|
—
|
|
—
|
|
(1,422
|
)
|
||||||||||||||
|
Equity-based plan proceeds, net
|
44
|
|
—
|
|
—
|
|
—
|
|
—
|
|
—
|
|
44
|
|
||||||||||||||
|
Inter-company contributions and other financing activities, net
|
1,267
|
|
17
|
|
(952
|
)
|
(351
|
)
|
—
|
|
—
|
|
(19
|
)
|
||||||||||||||
|
Cash (used in) provided by financing activities
|
(111
|
)
|
17
|
|
(299
|
)
|
(341
|
)
|
—
|
|
—
|
|
(734
|
)
|
||||||||||||||
|
Effect of exchange rate changes on cash and cash equivalents
|
—
|
|
—
|
|
—
|
|
(57
|
)
|
—
|
|
—
|
|
(57
|
)
|
||||||||||||||
|
Net change in cash and cash equivalents
|
—
|
|
—
|
|
(115
|
)
|
74
|
|
—
|
|
—
|
|
(41
|
)
|
||||||||||||||
|
Cash and cash equivalents, beginning of period
|
—
|
|
—
|
|
123
|
|
285
|
|
—
|
|
—
|
|
408
|
|
||||||||||||||
|
Cash and cash equivalents, end of period
|
$
|
—
|
|
$
|
—
|
|
$
|
8
|
|
$
|
359
|
|
$
|
—
|
|
$
|
—
|
|
$
|
367
|
|
|||||||
126
DISCOVERY COMMUNICATIONS, INC.
NOTES TO CONSOLIDATED FINANCIAL STATEMENTS
CONDENSED CONSOLIDATING STATEMENT OF CASH FLOWS
For the Year Ended
December 31, 2013
(in millions)
|
Discovery
|
DCH
|
DCL
|
Non-Guarantor
Subsidiaries of DCL |
Other Non-
Guarantor Subsidiaries of Discovery |
Reclassifications
and Eliminations |
Discovery and
Subsidiaries |
||||||||||||||||||||||
|
Operating Activities
|
||||||||||||||||||||||||||||
|
Cash (used in) provided by operating activities
|
$
|
(16
|
)
|
$
|
(11
|
)
|
$
|
288
|
|
$
|
1,024
|
|
$
|
—
|
|
$
|
—
|
|
$
|
1,285
|
|
|||||||
|
Investing Activities
|
||||||||||||||||||||||||||||
|
Purchases of property and equipment
|
—
|
|
—
|
|
(19
|
)
|
(96
|
)
|
—
|
|
—
|
|
(115
|
)
|
||||||||||||||
|
Business acquisitions, net of cash acquired
|
—
|
|
—
|
|
—
|
|
(1,861
|
)
|
—
|
|
—
|
|
(1,861
|
)
|
||||||||||||||
|
Payments for derivative instruments
|
—
|
|
—
|
|
(55
|
)
|
—
|
|
—
|
|
—
|
|
(55
|
)
|
||||||||||||||
|
Proceeds from disposition, net of cash acquired
|
—
|
|
—
|
|
—
|
|
28
|
|
—
|
|
—
|
|
28
|
|
||||||||||||||
|
Distributions from equity method investees
|
—
|
|
—
|
|
—
|
|
47
|
|
—
|
|
—
|
|
47
|
|
||||||||||||||
|
Investments in equity method investees, net
|
—
|
|
—
|
|
(1
|
)
|
(27
|
)
|
—
|
|
—
|
|
(28
|
)
|
||||||||||||||
|
Other investing activities, net
|
—
|
|
—
|
|
—
|
|
(3
|
)
|
—
|
|
—
|
|
(3
|
)
|
||||||||||||||
|
Cash used in investing activities
|
—
|
|
—
|
|
(75
|
)
|
(1,912
|
)
|
—
|
|
—
|
|
(1,987
|
)
|
||||||||||||||
|
Financing Activities
|
||||||||||||||||||||||||||||
|
Borrowings from debt, net of discount
|
—
|
|
—
|
|
1,198
|
|
—
|
|
—
|
|
—
|
|
1,198
|
|
||||||||||||||
|
Principal repayments of capital lease obligations
|
—
|
|
—
|
|
(7
|
)
|
(25
|
)
|
—
|
|
—
|
|
(32
|
)
|
||||||||||||||
|
Repurchases of stock
|
(1,305
|
)
|
—
|
|
—
|
|
—
|
|
—
|
|
—
|
|
(1,305
|
)
|
||||||||||||||
|
Equity-based plan proceeds, net
|
73
|
|
—
|
|
—
|
|
—
|
|
—
|
|
—
|
|
73
|
|
||||||||||||||
|
Inter-company contributions and other financing activities, net
|
1,248
|
|
11
|
|
(2,303
|
)
|
1,025
|
|
—
|
|
—
|
|
(19
|
)
|
||||||||||||||
|
Cash provided (used in) by financing activities
|
16
|
|
11
|
|
(1,112
|
)
|
1,000
|
|
—
|
|
—
|
|
(85
|
)
|
||||||||||||||
|
Effect of exchange rate changes on cash and cash equivalents
|
—
|
|
—
|
|
—
|
|
(6
|
)
|
—
|
|
—
|
|
(6
|
)
|
||||||||||||||
|
Net change in cash and cash equivalents
|
—
|
|
—
|
|
(899
|
)
|
106
|
|
—
|
|
—
|
|
(793
|
)
|
||||||||||||||
|
Cash and cash equivalents, beginning of period
|
—
|
|
—
|
|
1,022
|
|
179
|
|
—
|
|
—
|
|
1,201
|
|
||||||||||||||
|
Cash and cash equivalents, end of period
|
$
|
—
|
|
$
|
—
|
|
$
|
123
|
|
$
|
285
|
|
$
|
—
|
|
$
|
—
|
|
$
|
408
|
|
|||||||
127
None.
Evaluation of Disclosure Controls and Procedures
Our management, with the participation of our Chief Executive Officer and Chief Financial Officer, has evaluated the effectiveness of our disclosure controls and procedures as of
December 31, 2015
. The term “disclosure controls and procedures,” as defined in Rules 13a-15(e) and 15d-15(e) of the Exchange Act of 1934, as amended (the “Exchange Act”), means controls and other procedures of a company that are designed to ensure that information required to be disclosed by a company in the reports that it files or submits under the Exchange Act is recorded, processed, summarized and reported, within the time periods specified in the SEC’s rules and forms. Disclosure controls and procedures include, without limitation, controls and procedures designed to ensure that information required to be disclosed by a company in the reports that it files or submits under the Exchange Act is accumulated and communicated to the company’s management, including its principal executive and principal financial officers, or persons performing similar functions, as appropriate to allow timely decisions regarding required disclosure. Management recognizes that any controls and procedures, no matter how well designed and operated, can provide only reasonable assurance of achieving their objectives and management necessarily applies its judgment in evaluating the cost-benefit relationship of possible controls and procedures. Based on the evaluation of our disclosure controls and procedures as of
December 31, 2015
, our Chief Executive Officer and Chief Financial Officer concluded that, as of such date, our disclosure controls and procedures were effective at the reasonable assurance level.
Management’s Annual Report on Internal Control Over Financial Reporting
Management’s report on internal control over financial reporting is set forth in Item 8 of this Annual Report on Form 10-K under the caption “Management’s Report on Internal Control over Financial Reporting,” which is incorporated herein by reference.
Attestation Report of the Independent Registered Public Accounting Firm
The attestation report of our independent registered public accounting firm regarding internal control over financial reporting is set forth in Item 8 of this Annual Report on Form 10-K under the caption “Report of Independent Registered Public Accounting Firm,” which is incorporated herein by reference.
Changes in Internal Control Over Financial Reporting
During the quarter ended
December 31, 2015
, there were no changes in our internal control over financial reporting, as defined in Exchange Act Rule 13a-15(f), that have materially affected, or are reasonably likely to materially affect, our internal control over financial reporting.
None.
128
Certain information required in Item 10 through Item 14 of Part III of this Annual Report on Form 10-K is incorporated herein by reference to our definitive Proxy Statement for our
2016
Annual Meeting of Stockholders (“
2016
Proxy Statement”), which shall be filed with the SEC pursuant to Regulation 14A of the Exchange Act within 120 days of our fiscal year end.
Information regarding our directors, compliance with Section 16(a) of the Exchange Act, and our Audit Committee, including committee members and its financial expert, will be set forth in our
2016
Proxy Statement under the captions “Proposal 1: Election of Directors,” “Section 16(a) Beneficial Ownership Reporting Compliance,” and “Corporate Governance – Committees of the Board of Directors – Audit Committee,” respectively, which are incorporated herein by reference.
Information regarding our executive officers is set forth in Part I of this Annual Report on Form 10-K under the caption “Executive Officers of Discovery Communications, Inc.” as permitted by General Instruction G(3) to Form 10-K.
We have adopted a Code of Business Conduct and Ethics (the “Code”) that is applicable to all of our directors, officers and employees. Our Board of Directors approved the Code in September 2008 and reviews it regularly. A copy of the Code and any amendments or waivers that would be required to be disclosed under applicable SEC rules are available free of charge at the investor relations section of our website, www.discoverycommunications.com. In addition, we will provide a printed copy of the Code, free of charge, upon written request to: Investor Relations, Discovery Communications, Inc., 850 Third Avenue, 8th Floor, New York, NY 10022-7225.
Information regarding executive compensation will be set forth in our
2016
Proxy Statement under the captions “Compensation Discussion and Analysis” and “Executive Compensation,” which are incorporated herein by reference.
Information regarding compensation policies and practices as they relate to our risk management, director compensation, and compensation committee interlocks and insider participation will be set forth in our
2016
Proxy Statement under the captions “Risk Considerations in our Compensation Programs,” “Board Compensation,” and “Corporate Governance – Committees of the Board of Directors – Compensation Committee,” respectively, which are incorporated herein by reference.
Information regarding compensation committee reports will be set forth in our
2016
Proxy Statement under the captions “Report of the Compensation Committee” and “Report of the Equity Compensation Subcommittee of the Compensation Committee,” which are incorporated herein by reference.
Information regarding securities authorized for issuance under equity compensation plans will be set forth in our
2016
Proxy Statement under the caption “Securities Authorized for Issuance Under Equity Compensation Plans,” which is incorporated herein by reference.
Information regarding security ownership of certain beneficial owners and management will be set forth in our
2016
Proxy Statement under the captions “Security Ownership Information of Certain Beneficial Owners and Management of Discovery – Security Ownership of Certain Beneficial Owners of Discovery” and “Security Ownership Information of Certain Beneficial Owners and Management of Discovery – Security Ownership of Discovery Management,” which are incorporated herein by reference.
Information regarding certain relationships and related transactions, and director independence will be set forth in our
2016
Proxy Statement under the captions “Certain Relationships and Related Person Transactions,” “Policy Governing Related Person Transactions,” and “Corporate Governance – Director Independence,” respectively, which are incorporated herein by reference.
Information regarding principal accountant fees and services will be set forth in our
2016
Proxy Statement under the captions “Ratification of Appointment of Independent Registered Public Accounting Firm – Description of Fees” and “Ratification of Appointment of Independent Registered Public Accounting Firm – Policy on Audit Committee Pre-Approval of Audit and Permissible Non-Audit Services of Independent Registered Public Accounting Firm,” which are incorporated herein by reference.
129
The following documents are filed as part of this Annual Report on Form 10-K:
1. The following consolidated financial statements of Discovery Communications, Inc. are filed as part of Item 8 of this Annual Report on Form 10-K:
|
|
Page
|
|
Consolidated Balance Sheets as of December 31, 2015 and 2014.
|
|
|
Consolidated Statements of Operations for the Years Ended December 31, 2015, 2014 and 2013.
|
|
|
Consolidated Statements of Comprehensive Income for the Years Ended December 31, 2015, 2014 and 2013.
|
|
|
Consolidated Statements of Cash Flows for the Years Ended December 31, 2015, 2014 and 2013.
|
|
|
Consolidated Statements of Equity for the Years Ended December 31, 2015, 2014 and 2013.
|
|
2. All financial statement schedules required to be filed pursuant to Item 8 and Item 15(c) of Form 10-K have been omitted as the required information is not applicable, not material, or is set forth in the consolidated financial statements or notes thereto.
3. The following exhibits are filed or furnished as part of this Annual Report on Form 10-K pursuant to Item 601 of SEC Regulation S-K and Item 15(b) of Form 10-K:
130
EXHIBITS INDEX
Exhibit No. Description
|
3.1
|
|
|
Form of Restated Certificate of Incorporation (incorporated by reference to Exhibit 3.1 to Amendment No. 2 to the Registration Statement on Form S-4, SEC File No. 333-151586 (“Amendment No. 2”))
|
|
3.2
|
|
|
Bylaws (incorporated by reference to Exhibit 3.2 to the Form 8-K filed on November 16, 2009 (SEC File No. 001-34177))
|
|
4.1
|
|
|
Specimen certificate for shares of the Registrant’s Series A common stock, par value $.01 per share (incorporated by reference to Exhibit 4.1 to the Registration Statement on Form S-4, SEC File No. 333-151586 (the “Registration Statement”))
|
|
4.2
|
|
|
Specimen certificate for shares of the Registrant’s Series B common stock, par value $.01 per share (incorporated by reference to Exhibit 4.2 to the Registration Statement (SEC File No. 333-151586))
|
|
4.3
|
|
|
Specimen certificate for shares of the Registrant’s Series C common stock, par value $.01 per share (incorporated by reference to Exhibit 4.3 to the Registration Statement (SEC File No. 333-151586))
|
|
4.4
|
|
|
Form of Registration Rights Agreement, by and between Discovery Communications, Inc. and Advance/Newhouse content Partnership (incorporated by reference to Exhibit 4.4 to the Registration Statement (SEC 333-151586))
|
|
4.5
|
|
|
Form of Rights Agreement, by and between Discovery Communications, Inc. and Computershare Trust Company, N.A., as rights agent (incorporated by reference to Exhibit 4.5 to the Registration Statement (SEC File No. 333-151586))
|
|
4.6
|
|
|
Amendment No. 1 to Rights Agreement between Discovery Communications, Inc. and Computershare Trust Company, N.A. dated December 10, 2008 (incorporated by reference to Exhibit 4.1 to the Form 8-K filed on December 11, 2008 (SEC File No. 001-34177))
|
|
4.7
|
|
|
Indenture dated as of August 19, 2009 among Discovery Communications, LLC, Discovery Communications, Inc. and U.S. Bank National Association, as trustee (incorporated by reference to Exhibit 4.1 to the Form 8-K filed on August 19, 2009 (SEC File No. 001-34177))
|
|
4.8
|
|
|
Supplemental Indenture dated as of August 19, 2009 among Discovery Communications, LLC, Discovery Communications, Inc. and U.S. Bank National Association, as trustee (incorporated by reference to Exhibit 4.2 to the Form 8-K filed on August 19, 2009 (SEC File No. 001-34177))
|
|
4.9
|
|
|
Second Supplemental Indenture dated as of June 3, 2010, among Discovery Communications LLC, Discovery Communications, Inc. and U.S. Bank National Association, as trustee (incorporated by reference to Exhibit 4.1 to the Form 8-K filed on June 3, 2010 (SEC File No. 001-34177))
|
|
4.10
|
|
|
Third Supplemental Indenture, dated as of June 20, 2011, among Discovery Communications, LLC, Discovery Communications, Inc. and U.S. Bank National Association, as trustee (incorporated by reference to Exhibit 4.1 to the Form 8-K filed on June 21, 2011 (SEC File No. 001-34177))
|
|
4.11
|
|
Fourth Supplemental Indenture, dated as of May 17, 2012, among Discovery Communications, LLC, Discovery Communications, Inc. and U.S. Bank National Association, as trustee (incorporated by reference to Exhibit 4.1 to the Form 8-K filed on May 17, 2012 (SEC File No. 001-34177))
|
|
|
4.12
|
|
Fifth Supplemental Indenture, dated as of March 19, 2013, among Discovery Communications, LLC, Discovery Communications, Inc. and U.S. Bank National Association, as trustee (incorporated by reference to Exhibit 4.1 to the Form 8-K filed on March 19, 2013 (SEC File No. 001-34177))
|
|
131
EXHIBITS INDEX
Exhibit No. Description
|
4.13
|
|
Sixth Supplemental Indenture, dated as of March 7, 2014, among Discovery Communications, LLC, Discovery Communications, Inc., U.S. Bank National Association, as trustee and Evalon Financial Services Limited, UK Branch, as London Paying Agent (incorporated by reference to Exhibit 4.1 to the Form 8-K/A filed on March 7, 2014 (SEC File No. 001-34177))
|
|
|
4.14
|
|
Seventh Supplemental Indenture, dated March 2, 2015, among Discovery Communications, LLC, Discovery Communications, Inc. and U.S. Bank National Association, as Trustee (incorporated by reference to Exhibit 4.1 to the Form 8-K filed on March 2, 2015 (SEC File No. 001-34177))
|
|
|
4.15
|
|
Eighth Supplemental Indenture, dated March 19, 2015, among Discovery Communications, LLC, Discovery Communications, Inc., U.S. Bank National Association, as Trustee, and Elavon Financial Services Limited, UK Branch, as London Paying Agent (incorporated by reference to Exhibit 4.1 to the Form 8-K filed on March 19, 2015 (SEC File No. 001-34177))
|
|
|
4.16
|
|
Credit Agreement, dated as of June 20, 2014, among Discovery Communications, LLC ("DCL"), certain wholly owned subsidiaries of DCL, as borrower, Discovery Communications, Inc., as facility guarantor, the lenders from time to time party thereto, and Bank of America, N.A., as administrative agent, Swing Line Lender and L/C Issuer (incorporated by reference to Exhibit 4.1 to the Form 8-K filed on June 23, 2014 (SEC File No. 001-34177))
|
|
|
10.1
|
|
|
Discovery Communications U.S. Executive Relocation Policy (incorporated by reference to Exhibit 10.1 to the Registration Statement (SEC File No. 333-151586))*
|
|
10.2
|
|
|
Discovery Communications Executive Benefit Summary (incorporated by reference to Exhibit 10.2 to the Registration Statement (SEC File No. 333-151586))*
|
|
10.3
|
|
|
Discovery Communications Incentive Compensation Plan (incorporated by reference to Exhibit 10.3 to the Registration Statement (SEC File No. 333-151586))*
|
|
10.4
|
|
|
Amended and Restated Discovery Communications, LLC Supplemental Deferred Compensation Plan (incorporated by reference to Exhibit 10.1 to the Form 8-K filed on November 19, 2009 (SEC File No. 001-34177))*
|
|
10.5
|
|
|
Amended and Restated Discovery Appreciation Plan (incorporated by reference to Exhibit 10.8 to the Form 8-K filed on October 7, 2008 (SEC File No. 001-34177))*
|
|
10.6
|
|
|
Discovery Communications, Inc. 2005 Incentive Plan (As Amended and Restated) (incorporated by reference to Exhibit 10.6 to Amendment No. 2 (SEC File No. 333-151586))*
|
|
10.7
|
|
2011 Employee Stock Purchase Plan (incorporated by reference to Exhibit 99.1 to the Form 8-K filed on May 19, 2011 (SEC File No. 001-34177))*
|
|
|
10.8
|
|
|
Discovery Communications, Inc. 2013 Incentive Plan (incorporated by reference to Exhibit 10.1 to the Form 8-K filed on May 16, 2013 (SEC File No. 001-34177))*
|
|
10.9
|
|
|
Discovery Communications, Inc. 2005 Non-Employee Director Incentive Plan (As Amended and Restated Effective May 20, 2015) (incorporated by reference to Exhibit 10.1 to the Form 8-K filed on May 22, 2015 (SEC File No. 001-34177))*
|
|
10.10
|
|
|
Discovery Holding Company Transitional Stock Adjustment Plan (As Amended and Restated Effective August 15, 2007) (incorporated by reference to Exhibit 10.3 to the Quarterly Report on Form 10-Q of Discovery Holding Company for the quarter ended September 30, 2007 (SEC File No. 000-51205) as filed on November 7, 2007)*
|
132
EXHIBITS INDEX
Exhibit No. Description
|
10.11
|
|
|
Form of Stock Option Agreement (incorporated by reference to Exhibit 10.5 to the Form 8-K filed on October 7, 2008 (SEC File No. 001-34177))*
|
|
10.12
|
|
|
Form of 7-year Stock Appreciation Right Agreement (incorporated by reference to Exhibit 10.7 to the Form 8-K filed on October 7, 2008 (SEC File No. 001-34177))*
|
|
10.13
|
|
|
Form of Stock Option Agreement (incorporated by reference to Exhibit 99.1 to the Form 8-K filed on March 9, 2009 (SEC File No. 001-34177))*
|
|
10.14
|
|
|
Form of Restricted Stock Unit Grant Agreement (incorporated by reference to Exhibit 10.1 to the Form 10-Q filed on August 4, 2009 (SEC File No. 001-34177))*
|
|
10.15
|
|
|
Form of Performance Restricted Stock Agreement (incorporated by reference to Exhibit 10.26 to the Form 10-K filed on February 22, 2010 (SEC File No. 001-34177))*
|
|
10.16
|
|
|
Form of Nonqualified Stock Option Grant Agreement (incorporated by reference to Exhibit 10.27 to the Form 10-K filed on February 22, 2010 (SEC File No. 001-34177))*
|
|
10.17
|
|
|
Form of Cash-Settled Stock Appreciation Right Agreement (incorporated by reference to Exhibit 10.28 to the Form 10-K filed on February 22, 2010 (SEC File No. 001-34177))*
|
|
10.18
|
|
|
Form of Restricted Stock Unit Grant Agreement (incorporated by reference to Exhibit 10.29 to the Form 10-K filed on February 22, 2010 (SEC File No. 001-34177))*
|
|
10.19
|
|
|
Form of Performance Restricted Stock Unit Grant Agreement (incorporated by reference to Exhibit 10.1 to the Form 8-K filed on March 1, 2011 (SEC File No. 001-34177))*
|
|
10.20
|
|
|
Form of Restricted Stock Unit Grant Agreement (incorporated by reference to Exhibit 10.2 to the Form 8-K filed on March 1, 2011 (SEC File No. 001-34177))*
|
|
10.21
|
|
|
Form of Stock Appreciation Right Grant Agreement (incorporated by reference to Exhibit 10.3 to the Form 8-K filed on March 1, 2011 (SEC File No. 001-34177))*
|
|
10.22
|
|
|
Form of Non-Qualified Stock Option Grant Agreement (incorporated by reference to Exhibit 10.4 to the Form 8-K filed on March 1, 2011 (SEC File No. 001-34177))*
|
|
10.23
|
|
|
Form of David Zaslav Cash-Settled Stock Appreciation Award Agreement (incorporated by reference to Exhibit 10.2 to the Form 8-K filed on December 21, 2011 (SEC File No. 001-34177))*
|
|
10.24
|
|
|
Form of Discovery Performance Equity Program Nonqualified Stock Option Agreement for Employees (incorporated by reference to Exhibit 10.2 to the Form 8-K filed on May 16, 2013 (SEC File No. 001-34177))*
|
|
10.25
|
|
|
Form of Discovery Communications, Inc. Restricted Stock Unit Agreement for Employees (incorporated by reference to Exhibit 10.3 to the Form 8-K filed on May 16, 2013 (SEC File No. 001-34177))*
|
133
EXHIBITS INDEX
Exhibit No. Description
|
10.26
|
|
|
Form of Discovery Communications, Inc. Performance Restricted Stock Unit Grant Agreement for Employees (incorporated by reference to Exhibit 10.4 to the Form 8-K filed on May 16, 2013 (SEC File No. 001-34177))*
|
|
10.27
|
|
|
Form of Discovery Performance Equity Program Cash-Settled Stock Appreciation Right Agreement for Employees (incorporated by reference to Exhibit 10.5 of the Form 8-K filed on May 16, 2013 (SEC File No. 001-34177))*
|
|
10.28
|
|
|
Form of Special Stock Appreciation Right Award Agreement (incorporated by reference to Exhibit 10.1 to the Form 8-K filed on January 3, 2014 (SEC File No. 001-34177))*
|
|
10.29
|
|
|
Form of David Zaslav One Year Performance Restricted Stock Unit (PRSU) Grant Agreement (incorporated by reference to Exhibit 10.45 to the Form 10-K filed on February 20, 2014 (SEC File No. 001-34177))*
|
|
10.30
|
|
|
Form of David Zaslav Three Year Performance Restricted Stock Unit (PRSU) Grant Agreement (incorporated by reference to Exhibit 10.46 to the Form 10-K filed on February 20, 2014 (SEC File No. 001-34177))*
|
|
10.31
|
|
Form of Stock Dividend Related Restricted Stock Unit Grant Agreement (incorporated by reference to Exhibit 10.2 to the Form 10-Q filed on July 31, 2014 (SEC File No. 001-34177))*
|
|
|
10.32
|
|
Form of Stock Dividend Related Performance Restricted Stock Unit Grant Agreement (incorporated by reference to Exhibit 10.3 to the Form 10-Q filed on July 31, 2014 (SEC File No. 001-34177))*
|
|
|
10.33
|
|
Form of Stock Dividend Related Stock Appreciation Right Agreement (incorporated by reference to Exhibit 10.4 to the Form 10-Q filed on July 31, 2014 (SEC File No. 001-34177))*
|
|
|
10.34
|
|
Form of Stock Dividend Related Nonqualified Stock Option Grant Agreement (incorporated by reference to Exhibit 10.5 to the Form 10-Q filed on July 31, 2014 (SEC File No. 001-34177))*
|
|
|
10.35
|
|
Form of David Zaslav's Stock Dividend Related Discovery Appreciation Plan Letter (incorporated by reference to Exhibit 10.6 to the Form 10-Q filed on July 31, 2014 (SEC File No. 001-34177))*
|
|
|
10.36
|
|
Form of David Zaslav's Stock Dividend Related Performance Restricted Stock Unit Grant Agreement (incorporated by reference to Exhibit 10.7 to the Form 10-Q filed on July 31, 2014 (SEC File No. 001-34177))*
|
|
|
10.37
|
|
Form of David Zaslav's Stock Dividend Related Stock Appreciation Right Agreement for Pre-2014 Awards (incorporated by reference to Exhibit 10.8 to the Form 10-Q filed on July 31, 2014 (SEC File No. 001-34177))*
|
|
|
10.38
|
|
Form of David Zaslav's Stock Dividend Related Stock Appreciation Right Agreement for the 2014 Award (incorporated by reference to Exhibit 10.9 to the Form 10-Q filed on July 31, 2014 (SEC File No. 001-34177))*
|
|
|
10.39
|
|
Employment Agreement, dated as of November 28, 2006, between David Zaslav and Discovery Communications, Inc. (incorporated by reference to Exhibit 10.9 to Amendment No. 1 to the Registration Statement on Form S-4, SEC File No. 333-151586 (“Amendment No. 1”))*
|
|
134
EXHIBITS INDEX
Exhibit No. Description
|
10.40
|
|
Addendum to Employment Agreement dated September 9, 2009 between David Zaslav and Discovery Communications, Inc. (incorporated by reference to Exhibit 10.2 to the Form 10-Q filed on November 3, 2009 (SEC File No. 001-34177))*
|
|
|
10.41
|
|
Second Addendum to Employment Agreement dated December 15, 2011 between David Zaslav and Discovery Communications, Inc. (incorporated by reference to Exhibit 10.1 to the Form 8-K filed on December 21, 2011 (SEC File No. 001-34177))*
|
|
|
10.42
|
|
Employment Agreement between Discovery Communications, Inc. and David Zaslav dated January 2, 2014 (incorporated by reference to Exhibit 10.44 to the Form 10-K filed on February 20, 2014 (SEC File No. 001-34177))*
|
|
|
10.43
|
|
Amended and Restated Employment Agreement, dated as of April 2, 2008, between Bruce Campbell and Discovery Communications, LLC (incorporated by reference to Exhibit 10.12 to the Amendment No. 1 (SEC File No. 333-151586))*
|
|
|
10.44
|
|
Amended and Restated Employment Agreement, dated as of July 21, 2010, between Bruce Campbell and Discovery Communications, LLC (incorporated by reference to Exhibit 10.1 to the Form 10-Q filed on November 2, 2010 (SEC File No. 001-34177))*
|
|
|
10.45
|
|
First Amendment to Employment Agreement, dated as of July 31, 2014, between Bruce Campbell and Discovery Communications, LLC (incorporated by reference to Exhibit 10.1 to the Form 10-Q filed on November 4, 2014 (SEC File No. 001-34177))*
|
|
|
10.46
|
|
Employment Agreement, dated as of August 8, 2014, between Bruce Campbell and Discovery Communications, LLC (incorporated by reference to Exhibit 10.2 to the Form 10-Q filed on November 4, 2014 (SEC File No. 001-34177))*
|
|
|
10.47
|
|
Amendment to Employment Agreement, dated September 24, 2015, between Bruce Campbell and Discovery Communications, LLC (incorporated by reference to Exhibit 10.1 to the Form 10-Q filed on November 3, 2015 (SEC File No. 001-34177))*
|
|
|
10.48
|
|
Employment Agreement dated as of January 9, 2012 between Andrew Warren and Discovery Communications, LLC (incorporated by reference to Exhibit 10.1 to the Form 10-Q filed on May 8, 2012 (SEC File No. 001-34177))*
|
|
|
10.49
|
|
Amendment to Employment Agreement dated as of June 1, 2012 between Andrew Warren and Discovery Communications, LLC (incorporated by reference to Exhibit 10.33 to the Form 10-K/A filed on February 19, 2013 (SEC File No. 001-34177))*
|
|
|
10.50
|
|
Employment Agreement, dated as of September 18, 2014, between Andrew Warren and Discovery Communications, LLC (incorporated by reference to Exhibit 10.4 to the Form 10-Q filed on November 4, 2014 (SEC File No. 001-34177))*
|
|
135
EXHIBITS INDEX
Exhibit No. Description
|
10.51
|
|
Employment Agreement, dated January 14, 2014, between Jean-Briac Perrette and Discovery Communications, LLC (incorporated by reference to Exhibit 10.54 to the Form 10-K filed on February 19, 2015 (SEC File No. 001-34177))*
|
|
|
10.52
|
|
Employment Agreement, dated as of March 1, 2014 between Adria Alpert Romm and Discovery Communications, LLC (incorporated by reference to Exhibit 10.1 to the Form 10-Q filed on May 5, 2015 (SEC File No. 001-34177))*
|
|
|
10.53
|
|
Form of Escrow Agreement, by and among Discovery Communications, Inc., Advance/Newhouse Programming Partnership, and the escrow agent (incorporated by reference to Exhibit 10.17 to Amendment No. 2 (SEC File No. 333-151586))
|
|
|
10.54
|
|
Share Repurchase Agreement, entered into as of May 22, 2014, by and between Discovery Communications, Inc. and Advance/Newhouse Programming Partnership (incorporated by reference to Exhibit 10.1 to the Form 8-K filed on May 22, 2014 (SEC File No. 001-34177))
|
|
|
10.57
|
|
Letter Amendment, dated August 25, 2014, between Discovery Communications, Inc. and Advance/Newhouse Programming Partnership (incorporated by reference to Exhibit 10.1 to the Form 8-K filed on August 26, 2014 (SEC File No. 001-34177))
|
|
|
12
|
|
|
Computation of Ratio of Earnings to Fixed Charges and Ratio of Earnings to Combined Fixed Charges and Preferred Stock Dividends (filed herewith)
|
|
14
|
|
Discovery Communications, Inc. Code of Ethics (incorporated by reference to Exhibit 14.1 to the Form 8-K filed on April 30, 2012 (SEC File No. 001-34177))
|
|
|
21
|
|
|
List of Subsidiaries of Discovery Communications, Inc. (filed herewith)
|
|
23
|
|
|
Consent of Independent Registered Public Accounting Firm (filed herewith)
|
|
31.1
|
|
|
Certification of Chief Executive Officer Pursuant to Rule 13a-14(a) and Rule 15d-14(a) of the Securities Exchange Act of 1934, as Amended, as Adopted Pursuant to Section 302 of the Sarbanes-Oxley Act of 2002 (filed herewith)
|
|
31.2
|
|
|
Certification of Chief Financial Officer Pursuant to Rule 13a-14(a) and Rule 15d-14(a) of the Securities Exchange Act of 1934, as Amended, as Adopted Pursuant to Section 302 of the Sarbanes-Oxley Act of 2002 (filed herewith)
|
|
32.1
|
|
|
Certification of Chief Executive Officer Pursuant to 18 U.S.C. Section 1350, as Adopted Pursuant to Section 906 of the Sarbanes-Oxley Act of 2002 (furnished herewith)
|
|
32.2
|
|
|
Certification of Chief Financial Officer Pursuant to 18 U.S.C. Section 1350, as Adopted Pursuant to Section 906 of the Sarbanes-Oxley Act of 2002 (furnished herewith)
|
136
EXHIBITS INDEX
Exhibit No. Description
|
101.INS
|
|
XBRL Instance Document†
|
|
101.SCH
|
|
XBRL Taxonomy Extension Schema Document†
|
|
101.CAL
|
|
XBRL Taxonomy Extension Calculation Linkbase Document†
|
|
101.DEF
|
|
XBRL Taxonomy Extension Definition Linkbase Document†
|
|
101.LAB
|
|
XBRL Taxonomy Extension Label Linkbase Document†
|
|
101.PRE
|
|
XBRL Taxonomy Extension Presentation Linkbase Document†
|
* Indicates management contract or compensatory plan, contract or arrangement.
†Attached as Exhibit 101 to this Annual Report on Form 10-K are the following formatted in XBRL (Extensible Business Reporting Language): (i) Consolidated Balance Sheets as of
December 31, 2015
and
December 31, 2014
, (ii) Consolidated Statements of Operations for the Years Ended
December 31,
2015
,
2014
, and
2013
, (iii) Consolidated Statements of Cash Flows for the Years Ended
December 31, 2015
,
2014
, and
2013
, (iv) Consolidated Statements of Equity for the Years Ended
December 31,
2015
,
2014
, and
2013
, and (v) Notes to Consolidated Financial Statements.
137
SIGNATURES
Pursuant to the requirements of Section 13 or 15(d) of the Securities Exchange Act of 1934, the registrant has duly caused this report to be signed on its behalf by the undersigned, thereunto duly authorized.
|
|
DISCOVERY COMMUNICATIONS, INC.
(Registrant)
|
|||
|
Date: February 18, 2016
|
|
By:
|
|
/s/ David M. Zaslav
|
|
|
|
David M. Zaslav
|
||
|
|
|
President and Chief Executive Officer
|
||
Pursuant to the requirements of the Securities Exchange Act of 1934, this report has been signed below by the following persons on behalf of the registrant and in the capacities and on the date indicated.
|
Signature
|
|
Title
|
|
Date
|
|
/s/ David M. Zaslav
|
|
President and Chief Executive Officer, and Director
(Principal Executive Officer)
|
|
February 18, 2016
|
|
David M. Zaslav
|
|
|
||
|
/s/ Andrew Warren
|
|
Senior Executive Vice President and
Chief Financial Officer (Principal Financial Officer)
|
|
February 18, 2016
|
|
Andrew Warren
|
|
|
||
|
/s/ Kurt T. Wehner
|
|
Executive Vice President and Chief Accounting Officer
(Principal Accounting Officer)
|
|
February 18, 2016
|
|
Kurt T. Wehner
|
|
|
||
|
/s/ S. Decker Anstrom
|
Director
|
February 18, 2016
|
||
|
S. Decker Anstrom
|
||||
|
/s/ Robert R. Beck
|
|
Director
|
|
February 18, 2016
|
|
Robert R. Beck
|
|
|
||
|
/s/ Robert R. Bennett
|
|
Director
|
|
February 18, 2016
|
|
Robert R. Bennett
|
|
|
||
|
/s/ Paul A. Gould
|
|
Director
|
|
February 18, 2016
|
|
Paul A. Gould
|
|
|
||
|
/s/ John C. Malone
|
|
Director
|
|
February 18, 2016
|
|
John C. Malone
|
|
|
||
|
/s/ Robert J. Miron
|
|
Director
|
|
February 18, 2016
|
|
Robert J. Miron
|
|
|
||
|
/s/ Steven A. Miron
|
|
Director
|
|
February 18, 2016
|
|
Steven A. Miron
|
|
|
||
|
/s/ M. LaVoy Robison
|
|
Director
|
|
February 18, 2016
|
|
M. LaVoy Robison
|
|
|
||
|
/s/ J. David Wargo
|
|
Director
|
|
February 18, 2016
|
|
J. David Wargo
|
|
|
||
TABLE OF CONTENTS
Part IItem 1. BusinessItem 1A. Risk FactorsItem 1B. Unresolved Staff CommentsItem 2. PropertiesItem 3. Legal ProceedingsItem 4. Mine Safety DisclosuresPart IIItem 5. Market For Registrant S Common Equity, Related Stockholder Matters and Issuer Purchases Of Equity SecuritiesItem 6. Selected Financial DataItem 7. Management S Discussion and Analysis Of Financial Condition and Results Of OperationsItem 7A. Quantitative and Qualitative Disclosures About Market RiskItem 8. Financial Statements and Supplementary DataNote 1. Description Of Business and Basis Of PresentationNote 2. Summary Of Significant Accounting PoliciesNote 3. Acquisitions and DispositionsNote 4. InvestmentsNote 5. Fair Value MeasurementsNote 6. Content RightsNote 7. Property and EquipmentNote 8. Goodwill and Intangible AssetsNote 9. DebtNote 10. Derivative Financial InstrumentsNote 11. Redeemable Noncontrolling InterestsNote 12. EquityNote 13. Equity-based CompensationNote 14. Retirement Savings PlansNote 15. Restructuring and Other ChargesNote 16. Income TaxesNote 17. Earnings Per ShareNote 18. Supplemental DisclosuresNote 19. Related Party TransactionsNote 20. Commitments and ContingenciesNote 21. Reportable SegmentsNote 22. Selected Quarterly Financial Data (unaudited)Note 23. Condensed Consolidating Financial InformationItem 9. Changes in and Disagreements with Accountants on Accounting and Financial DisclosureItem 9A. Controls and ProceduresItem 9B. Other InformationPart IIIItem 10. Directors, Executive Officers and Corporate GovernanceItem 11. Executive CompensationItem 12. Security Ownership Of Certain Beneficial Owners and Management and Related Stockholder MattersItem 13. Certain Relationships and Related Transactions, and Director IndependenceItem 14. Principal Accountant Fees and ServicesPart IVItem 15. Exhibits and Financial Statement Schedules