WARNER BROS. DISCOVERY, INC.
10-Ks and 10-Qs
|
|
|
|
|
|
|
|
|
|
|
|
|
|
|
|
|
|
|
|
|
|
|
|
|
|
|
|
|
|
|
|
|
|
|
|
|
|
|
|
|
|
|
|
|
|
|
|
|
|
|
|
|
|
|
|
UNITED STATES
SECURITIES AND EXCHANGE COMMISSION
Washington, D.C. 20549
|
FORM 10-K
|
|
ý
|
ANNUAL REPORT PURSUANT TO SECTION 13 OR 15(d) OF THE SECURITIES EXCHANGE ACT OF 1934
|
For the fiscal year ended
December 31, 2018
OR
|
¨
|
TRANSITION REPORT PURSUANT TO SECTION 13 OR 15(d) OF THE SECURITIES EXCHANGE ACT OF 1934
|
For the transition period from to
Commission File Number: 001-34177

Discovery, Inc.
(Exact name of Registrant as specified in its charter)
|
Delaware
|
|
35-2333914
|
|
(State or other jurisdiction of
incorporation or organization)
|
|
(I.R.S. Employer
Identification No.)
|
|
One Discovery Place
Silver Spring, Maryland
|
|
20910
|
|
(Address of principal executive offices)
|
|
(Zip Code)
|
(240) 662-2000
(Registrant’s telephone number, including area code)
Securities registered pursuant to Section 12(b) of the Act:
|
Title of Each Class
|
|
Name of Each Exchange on Which Registered
|
|
Series A Common Stock, par value $0.01 per share
|
|
The Nasdaq Global Select Market
|
|
Series B Common Stock, par value $0.01 per share
|
|
The Nasdaq Global Select Market
|
|
Series C Common Stock, par value $0.01 per share
|
|
The Nasdaq Global Select Market
|
Securities registered pursuant to Section 12(g) of the Act:
None
Indicate by check mark if the Registrant is a well-known seasoned issuer, as defined in Rule 405 of the Securities Act. Yes
ý
No
¨
Indicate by check mark if the Registrant is not required to file reports pursuant to Section 13 or Section 15(d) of the Act. Yes
¨
No
ý
Indicate by check mark whether the Registrant (1) has filed all reports required to be filed by Section 13 or 15(d) of the Securities Exchange Act of 1934 during the preceding 12 months (or for such shorter period that the Registrant was required to file such reports), and (2) has been subject to such filing requirements for the past 90 days. Yes
ý
No
¨
Indicate by check mark whether the Registrant has submitted electronically every Interactive Data File required to be submitted pursuant to Rule 405 of Regulation S-T (§232.405 of this chapter) during the preceding 12 months (or for such shorter period that the Registrant was required to submit such files). Yes
ý
No
¨
Indicate by check mark if disclosure of delinquent filers pursuant to Item 405 of Regulation S-K (§229.405 of this chapter) is not contained herein, and will not be contained, to the best of Registrant’s knowledge, in definitive proxy or information statements incorporated by reference in Part III of this Form 10-K or any amendment to this Form 10-K.
¨
Indicate by check mark whether the Registrant is a large accelerated filer, an accelerated filer, a non-accelerated filer, smaller reporting company or an emerging growth company. See the definitions of “large accelerated filer,” “accelerated filer” “smaller reporting company” and "emerging growth company" in Rule 12b-2 of the Exchange Act. (Check one):
|
Large accelerated filer
|
|
ý
|
|
Accelerated filer
|
|
¨
|
|
Non-accelerated filer
|
|
¨
|
|
Smaller reporting company
|
|
¨
|
|
Emerging growth company
|
¨
|
|||||
|
If an emerging growth company, indicate by check mark if the registrant has elected not to use the extended transition period for complying with any new or revised financial accounting standards provided pursuant to Section 13(a) of the Exchange Act.
¨
|
||||||
Indicate by check mark whether the Registrant is a shell company (as defined in Rule 12b-2 of the Exchange Act). Yes
¨
No
ý
The aggregate market value of voting and non-voting common stock held by non-affiliates of the Registrant computed by reference to the last sales price of such stock, as of the last business day of the Registrant’s most recently completed second fiscal quarter, which was
June 30, 2018
, was approximately
$12 billion
.
Total number of shares outstanding of each class of the Registrant’s common stock as of
February 19, 2019
was:
|
Series A Common Stock, par value $0.01 per share
|
157,023,114
|
|
|
Series B Common Stock, par value $0.01 per share
|
6,512,378
|
|
|
Series C Common Stock, par value $0.01 per share
|
360,442,568
|
|
DOCUMENTS INCORPORATED BY REFERENCE
Certain information required in Item 10 through Item 14 of Part III of this Annual Report on Form 10-K is incorporated herein by reference to the Registrant’s definitive Proxy Statement for its
2019
Annual Meeting of Stockholders, which shall be filed with the Securities and Exchange Commission pursuant to Regulation 14A of the Securities Exchange Act of 1934, as amended, within 120 days of the Registrant’s fiscal year end.
DISCOVERY, INC.
FORM 10-K
TABLE OF CONTENTS
|
|
Page
|
3
PART I
CAUTIONARY NOTE CONCERNING FORWARD-LOOKING STATEMENTS
Certain statements in this Annual Report on Form 10-K constitute forward-looking statements within the meaning of the Private Securities Litigation Reform Act of 1995, including statements regarding our business, marketing and operating strategies, integration of acquired businesses, new service offerings, financial prospects, and anticipated sources and uses of capital. Words such as “anticipates,” “estimates,” “expects,” “projects,” “intends,” “plans,” “believes,” and terms of similar substance used in connection with any discussion of future operating or financial performance identify forward-looking statements. Where, in any forward-looking statement, we express an expectation or belief as to future results or events, such expectation or belief is expressed in good faith and believed to have a reasonable basis, but there can be no assurance that the expectation or belief will result or be accomplished. The following is a list of some, but not all, of the factors that could cause actual results or events to differ materially from those anticipated: changes in the distribution and viewing of television programming, including the expanded deployment of personal video recorders, subscription video on demand (“SVOD”), internet protocol television, mobile personal devices and personal tablets and their impact on television advertising revenue; continued consolidation of distribution customers and production studios; a failure to secure affiliate agreements or renewal of such agreements on less favorable terms; rapid technological changes; the inability of advertisers or affiliates to remit payment to us in a timely manner or at all; general economic and business conditions; industry trends, including the timing of, and spending on, feature film, television and television commercial production; spending on domestic and foreign television advertising; disagreements with our distributors or other business partners over contract interpretation; fluctuations in foreign currency exchange rates and political unrest and regulatory changes in international markets, from events including Brexit; market demand for foreign first-run and existing content libraries; the regulatory and competitive environment of the industries in which we, and the entities in which we have interests, operate; uncertainties inherent in the development of new business lines and business strategies; uncertainties regarding the financial performance of our equity method investees; our ability to complete, integrate and obtain the anticipated benefits and synergies from our proposed business combinations and acquisitions on a timely basis or at all; uncertainties associated with product and service development and market acceptance, including the development and provision of programming for new television and telecommunications technologies; future financial performance, including availability, terms, and deployment of capital; the ability of suppliers and vendors to deliver products, equipment, software, and services; our ability to achieve the efficiencies, savings and other benefits anticipated from our cost-reduction initiative; the outcome of any pending or threatened litigation; availability of qualified personnel; the possibility or duration of an industry-wide strike or other job action affecting a major entertainment industry union; changes in, or failure or inability to comply with, government regulations, including, without limitation, regulations of the Federal Communications Commission and adverse outcomes from regulatory proceedings; changes in income taxes due to regulatory changes or changes in our corporate structure; changes in the nature of key strategic relationships with partners, distributors and equity method investee partners; competitor responses to our products and services and the products and services of the entities in which we have interests; threatened terrorist attacks and military action; our significant level of debt; reduced access to capital markets or significant increases in costs to borrow; and a reduction of advertising revenue associated with unexpected reductions in the number of subscribers. These risks have the potential to impact the recoverability of the assets recorded on our balance sheets, including goodwill or other intangibles. For additional risk factors, refer to Item 1A, “Risk Factors.” These forward-looking statements and such risks, uncertainties, and other factors speak only as of the date of this Annual Report on Form 10-K, and we expressly disclaim any obligation or undertaking to disseminate any updates or revisions to any forward-looking statement contained herein, to reflect any change in our expectations with regard thereto, or any other change in events, conditions or circumstances on which any such statement is based.
ITEM 1. Business.
For convenience, the terms “Discovery,” the “Company,” “we,” “us” or “our” are used in this Annual Report on Form 10-K to refer to both Discovery, Inc. and collectively to Discovery, Inc. and one or more of its consolidated subsidiaries, unless the context otherwise requires. On March 6, 2018, the Company acquired Scripps Networks Interactive, Inc. ("Scripps Networks") and changed its name from "Discovery Communications, Inc." to "Discovery, Inc." (See Note 3 to the accompanying consolidated financial statements.)
We were formed on September 17, 2008 as a Delaware corporation in connection with Discovery Holding Company (“DHC”) and Advance/Newhouse Programming Partnership (“Advance/Newhouse”) combining their respective ownership interests in Discovery Communications Holding, LLC (“DCH”) and exchanging those interests with and into Discovery (the “Discovery Formation”). As a result of the Discovery Formation, DHC and DCH became wholly-owned subsidiaries of Discovery, with Discovery becoming the successor reporting entity to DHC.
4
OVERVIEW
We are a global media company that provides content across multiple distribution platforms, including linear platforms such as pay-television ("pay-TV"), free-to-air ("FTA") and broadcast television, authenticated GO applications, digital distribution arrangements and content licensing arrangements. As one of the world’s largest pay-TV programmers, we provide original and purchased content and live events to approximately
4 billion
cumulative subscribers and viewers worldwide through networks that we wholly or partially own. We distribute customized content in the U.S. and over
220
other countries and territories in nearly
50
languages. Our global portfolio of networks includes prominent nonfiction television brands such as Discovery Channel, our most widely distributed global brand, TLC, Animal Planet, Investigation Discovery, Science Channel, and MotorTrend (previously known as Velocity domestically and currently known as Turbo internationally). As a result of the acquisition of Scripps Networks, we also added a portfolio of networks that include Food Network, HGTV, Travel Channel, and TVN, a Polish media company. Our portfolio also includes Eurosport, a leading sports entertainment provider and broadcaster of the Olympic Games (the "Olympics") across Europe, as well as Discovery Kids, a leading children's entertainment brand in Latin America. We participate in joint ventures including Group Nine Media ("Group Nine"), a digital media holding company home to top digital brands including NowThis News, the Dodo, Thrillist, and Seeker. We operate production studios, and prior to the sale of our Education Business on April 30, 2018, we sold curriculum-based education products and services (See Note 3 to the accompanying consolidated financial statements.)
Our objectives are to invest in high-quality content for our networks and brands to build viewership, optimize distribution revenue, capture advertising sales, and create or reposition branded channels and business to sustain long-term growth and occupy a desired content niche with strong consumer appeal. Our strategy is to maximize the distribution, ratings and profit potential of each of our branded networks. In addition to growing distribution and advertising revenues for our branded networks, we have extended content distribution across new platforms, including brand-aligned websites, online streaming, mobile devices, video on demand (“VOD”) and broadband channels, which provide promotional platforms for our television content and serve as additional outlets for advertising and distribution revenue. Audience ratings are a key driver in generating advertising revenue and creating demand on the part of cable television operators, direct-to-home ("DTH") satellite operators, telecommunication service providers, and other content distributors who deliver our content to their customers.
Our content spans genres including survival, exploration, sports, general entertainment, home, food and travel, heroes, adventure, crime and investigation, health and kids. We have an extensive library of content and own most rights to our content and footage, which enables us to leverage our library to quickly launch brands and services into new markets and on new platforms. Our content can be re-edited and updated in a cost-effective manner to provide topical versions of subject matter that can be utilized around the world on a variety of platforms.
Although the Company utilizes certain brands and content globally, we classify our operations in two reportable segments: U.S. Networks, consisting principally of domestic television networks and digital content services, and International Networks, consisting primarily of international television networks and digital content services. In addition, Education and Other consists principally of a production studio, and prior to the sale of the Education Business on April 30, 2018, also included curriculum-based product and service offerings. Our segment presentation aligns with our management structure and the financial information management uses to make decisions about operating matters, such as the allocation of resources and business performance assessments. Financial information for our segments and the geographical areas in which we do business is set forth in Item 7, “Management’s Discussion and Analysis of Financial Condition and Results of Operations” and Note 23 to the consolidated financial statements included in Item 8, “Financial Statements and Supplementary Data” in this Annual Report on Form 10-K.
Global Network Brands
Subscriber statistics set forth in this Annual Report on Form 10-K include both wholly-owned networks and networks operated by equity method investees. Domestic subscriber statistics are based on Nielsen Media Research. International subscriber and viewer statistics are derived from internal data coupled with external sources when available. As used herein, a “subscriber” is a single household that receives the applicable network from its cable television operator, DTH satellite operator, telecommunication service provider, or other television provider, including those who receive our networks from pay-TV providers without charge pursuant to various pricing plans that include free periods and/or free carriage. The term “cumulative subscribers” refers to the sum of the total number of subscribers to each of our networks or content services. By way of example, two households that each receive five of our networks from their pay-TV provider represent two subscribers, but 10 cumulative subscribers. The term "viewer" is a single household that receives the signal from one of our networks using the appropriate receiving equipment without a subscription to a pay-TV provider.
5
Our global brands are the following:

|
•
|
Discovery Channel reached approximately
88 million
subscribers in the U.S. and
6 million
subscribers through a licensing arrangement with partners in Canada included in the U.S. Networks segment as of
December 31, 2018
. Discovery Channel reached approximately
361 million
subscribers in international markets as of
December 31, 2018
including the Discovery HD Showcase brand.
|
|
•
|
Discovery Channel is dedicated to creating the highest quality non-fiction content that informs and entertains its viewers about the world in all its wonder, diversity and amazement. The network offers a signature mix of high-end production values and vivid cinematography across genres including science and technology, exploration, adventure, history and in-depth, behind-the-scenes glimpses at the people, places and organizations that shape and share our world.
|
|
•
|
In the U.S., Discovery Channel audiences can enjoy their favorite programming anytime, anywhere through Discovery GO app which features live and on-demand access.
|
|
•
|
Discovery Channel content includes
Gold Rush
,
Naked and Afraid
,
Deadliest Catch
,
Fast N' Loud, Street Outlaws, Alaskan Bush People, Diesel Brothers,
Expedition Unknown
, and
Cash Cab.
Discovery Channel is also home to
Shark Week
, the network's long-running annual summer TV event.
|
|
•
|
Discovery continues to work with some of the best storytellers in the documentary space. Recent projects include Oscar® nominated and Emmy® winner Rory Kennedy’s
Above and Beyond: NASA’s Journey to Tomorrow, Racing Extinction
from Oscar winners Louis Psihoyos
and Fisher Stevens, and the upcoming
Tigerland
directed by Oscar® winner Ross Kauffman.
|
|
•
|
Target viewers are adults aged 25-54, particularly men.
|

|
•
|
TLC reached approximately
86 million
subscribers in the U.S. and
6 million
subscribers in Canada that are included in the U.S. Networks segment as of
December 31, 2018
. TLC content reached approximately
417 million
subscribers in international markets as of
December 31, 2018
including the Home & Health, Real Time and Travel & Living brands.
|
|
•
|
Offering remarkable real-life stories without judgment, TLC shares everyday heart, humor, hope, and human connection with programming genres that include fascinating families, heartwarming transformations and life's milestone moments.
|
|
•
|
In the U.S., TLC audiences can enjoy their favorite programming anytime, anywhere through Discovery GO app which features live and on-demand access.
|
|
•
|
Content on TLC includes the
90 Day Fiancé
franchise,
Little People, Big World, Long Island Medium, Outdaughtered, Who Do You Think You Are?
and
Trading Spaces
.
|
|
•
|
Target viewers are adults aged 25-54, particularly women.
|
6

|
•
|
Animal Planet reached approximately
85 million
subscribers in the U.S. and
2 million
subscribers through a licensing arrangement with partners in Canada included in the U.S. Networks segment as of
December 31, 2018
. Animal Planet reached approximately
281 million
subscribers in international markets as of
December 31, 2018
.
|
|
•
|
Animal Planet, one of Discovery's great global brands, is dedicated to creating high quality content with global appeal delivering on its mission to keep the childhood joy and wonder of animals alive by bringing people up close in every way.
|
|
•
|
In the U.S., Animal Planet audiences can enjoy their favorite programming anytime, anywhere through Discovery GO
|
app which features live and on-demand access.
|
•
|
Content and talent on Animal Planet includes
Crikey! It's the Irwins
,
Amanda to the Rescue
,
Coyote Peterson
,
The Zoo
,
Pit Bulls & Parolees, Dr. Jeff: Rocky Mountain Vet,
and
Puppy Bowl.
|
|
•
|
Target viewers are adults aged 25-54.
|

|
•
|
Investigation Discovery ("ID") reached approximately
82 million
subscribers in the U.S. and
2 million
subscribers through a licensing arrangement with partners in Canada included in the U.S. Networks segment as of
December 31, 2018
. ID reached approximately
195 million
subscribers in international markets as of
December 31, 2018
.
|
|
•
|
ID is a leading mystery and suspense network. From harrowing crimes and salacious scandals to the in-depth investigation and heart-breaking mysteries behind these "real people, real stories," ID challenges our everyday understanding of culture, society and the human condition.
|
|
•
|
In the U.S., ID audiences can enjoy their favorite programming anytime, anywhere through Discovery GO app which features live and on-demand access.
|
|
•
|
ID content includes
On the Case with Paula Zahn, Homicide Hunter: Lt. Joe Kenda,
the
American Murder Mystery
franchise,
People Magazine Investigates,
and
Deadline: Crime with Tamron Hall.
|
|
•
|
Target viewers are adults aged 25-54, particularly women.
|
7

|
•
|
Science Channel reached approximately
60 million
subscribers in the U.S. and
2 million
subscribers through a licensing arrangement with partners in Canada included in the U.S. Networks segment as of
December 31, 2018
. Science Channel reached approximately
135 million
subscribers in international markets as of
December 31, 2018
.
|
|
•
|
Science Channel is home to all things science around the clock. Science Channel is the premiere TV, digital and social community for those with a passion for science, space, technology, archeology, and engineering.
|
|
•
|
In the U.S., Science Channel audiences can enjoy their favorite programming anytime, anywhere through Discovery GO app which features live and on-demand access.
|
|
•
|
Content on Science Channel includes
MythBusters
,
Mysteries of the Abandoned
,
Outrageous Acts of Science
,
What on Earth?
,
How the Universe Works
and
How It's Made
.
|
|
•
|
Target viewers are adults aged 25-54.
|
 &
&

|
•
|
MotorTrend reached approximately
73 million
subscribers in the U.S. as of
December 31, 2018
. MotorTrend reached approximately
161 million
combined subscribers and viewers in international markets, where the brand is known as Turbo (and known as Focus in Italy), as of
December 31, 2018
.
|
|
•
|
MotorTrend programming is engaging and informative, featuring the very best of the automotive world as told by top experts and personalities. In addition to series and specials exemplifying the very best of the automotive genre, the network broadcasts approximately 100 hours of live event coverage every year.
|
|
•
|
In the U.S., MotorTrend audiences can enjoy their favorite programming anytime, anywhere through Discovery GO app which features live and on-demand access.
|
|
•
|
Content on MotorTrend includes
Wheeler Dealers,
Texas Metal
,
Roadkill
,
Iron Resurrection
,
and
Barrett-Jackson Live
.
|
|
•
|
In 2017, Discovery formed a joint venture ("MTG", then known as "VTEN") with MotorTrend (then Velocity) and TEN (now MotorTrend Group) to create a leading automotive digital media company comprised of consumer automotive brands including MotorTrend, HOTROD, Automobile, and more. MotorTrend SVOD service, which is part of the transaction and is being enhanced with MotorTrend content, represents the Company's first direct-to-consumer opportunity in the U.S. Discovery has a
67.5%
ownership interest in the new joint venture. The joint venture is controlled and consolidated by Discovery. (See Note 3 to the accompanying consolidated financial statements.)
|
|
•
|
Target viewers are adults aged 25-54, particularly men.
|
8

|
•
|
HGTV was acquired as a result of the acquisition of Scripps Networks.
|
|
•
|
HGTV reached approximately
89 million
subscribers in the U.S. as of
December 31, 2018
. HGTV reached approximately
20 million
combined subscribers and viewers in international markets as of
December 31, 2018
.
|
|
•
|
HGTV programming content commands an audience interested specifically in home-related topics, such as decorating, interior design, home remodeling, landscape design and real estate.
|
|
•
|
In the U.S., HGTV audiences can enjoy their favorite programming anytime, anywhere through Discovery GO app which features live and on-demand access.
|
|
•
|
Content on HGTV includes
House Hunters
,
House Hunters International
,
Fixer Upper
,
Flip or Flop
,
The Property Brothers
,
Home Town
,
Good Bones
,
Restored by the Fords
,
Caribbean Life
and
Beachfront Bargain Hunt
.
|
|
•
|
Target viewers are female viewers with higher incomes in the 25 to 54 age range.
|

|
•
|
Food Network was acquired as a result of the acquisition of Scripps Networks.
|
|
•
|
The most distributed ad-supported cable network in the U.S., Food Network reached approximately
91 million
subscribers in the U.S. as of
December 31, 2018
and
110 million
combined subscribers and viewers in international markets as of
December 31, 2018
.
|
|
•
|
Food Network programming content attracts audiences interested specifically in food-related entertainment including competition and travel, as well as food-related topics such as recipes, food preparation, entertaining and dining out.
|
|
•
|
In the U.S., Food Network audiences can enjoy their favorite programming anytime, anywhere through Discovery GO app which features live and on-demand access.
|
|
•
|
Content on Food Network includes primetime series
Beat Bobby Flay
,
Chopped
,
Diners, Drive-ins and Dives
,
The Great
Food Truck Race, Guy’s Grocery Games
,
Worst Cooks in America
, and several seasonal baking championships, as well as daytime series
Barefoot Contessa
,
Cook Like a Pro
,
Giada Entertains
,
Girl Meets Farm
,
Guy's Ranch Kitchen
,
The Kitchen
,
The
Pioneer Woman, Trisha’s Southern Kitchen
and
Valerie's Home Cooking
.
|
|
•
|
Target viewers are female viewers with higher incomes in the 25 to 54 age range.
|
9

|
•
|
Travel Channel was acquired as a result of the acquisition of Scripps Networks.
|
|
•
|
Travel Channel reached approximately
83 million
subscribers in the U.S. as of
December 31, 2018
and
78 million
combined subscribers and viewers in international markets as of
December 31, 2018
.
|
|
•
|
Travel Channel is for the bold, daring and spontaneous: adventurers who embrace the thrill of the unexpected, risk-takers who aren’t afraid of a little mystery and anyone who loves a great story.
|
|
•
|
In the U.S., Travel Channel audiences can enjoy their favorite programming anytime, anywhere through Discovery GO app which features live and on-demand access.
|
|
•
|
Content on Travel Channel includes
Mysteries at the Museum
,
Expedition Unknown
,
Bizarre Foods with Andrew Zimmern
,
Ghost Adventures,
and
Legendary Locations
.
|
|
•
|
Target viewers are adults aged 25-54.
|
U.S. NETWORKS
U.S. Networks generated revenues of $
6.4 billion
and adjusted operating income before depreciation and amortization ("Adjusted OIBDA") of
$3.5 billion
during
2018
, which represented
60%
and
85%
of our total consolidated revenues and Adjusted OIBDA, respectively. Our U.S. Networks segment principally consists of national television networks. Our U.S. Networks segment owns and operates
18
national television networks, including fully distributed television networks such as Discovery Channel, TLC, Food Network, HGTV and Animal Planet.
On March 6, 2018, we completed the acquisition of Scripps Networks Interactive, Inc. (the "Scripps Acquisition"), and added HGTV, Food Network, Travel Channel, DIY Network, Cooking Channel and Great American Country to our U.S. Networks segment.
U.S. Networks generates revenues from fees charged to distributors of our television networks’ first run content, which includes cable, DTH satellite and telecommunication service providers, referred to as affiliate fees; fees from distributors for licensed content and content to equity method investee networks, referred to as other distribution revenue; fees from advertising sold on our television networks and digital products, which include our GO suite of TVE applications and our virtual reality product, Discovery VR; fees from providing sales representation, network distribution services; and revenue from licensing our brands for consumer products. During
2018
, distribution, advertising and other revenues were
39%
,
59%
and
2%
, respectively, of total net revenues for this segment.
Typically, our television networks are aired pursuant to multi-year carriage agreements that provide for the level of carriage that our networks will receive and for annual graduated rate increases. Carriage of our networks depends on package inclusion, such as whether networks are on the more widely distributed, broader packages or lesser-distributed, specialized packages, also referred to as digital tiers. We provide authenticated U.S. TV Everywhere streaming products that are available to pay-TV subscribers and connected viewers through GO applications with live and on-demand access to award-winning shows and series from
18
U.S. networks in the Discovery portfolio: Discovery Channel, HGTV, Food Network, TLC, ID, Animal Planet, Travel Channel, MotorTrend (previously known as Velocity), Science Channel, DIY Network, Cooking Channel, Discovery Family Channel, American Heroes Channel ("AHC"), Destination America, Discovery Life, Discovery en Espanol, Discovery Familia, and Great American Country. In addition, the Oprah Winfrey Network ("OWN"), a consolidated subsidiary as of
November 30, 2017
, is currently on the Watch OWN application. During
2018
, we achieved incremental increases in U.S. digital platform consumption. We also provide certain networks to consumers as part of subscription-based over-the-top services provided by DirectTV Now, AT&T Watch, Hulu, SlingTV, fuboTV, Sony Vue and Philo.
10
Advertising revenue is generated across multiple platforms and is based on the price received for available advertising spots and is dependent upon a number of factors including the number of subscribers to our channels, viewership demographics, the popularity of our programming, our ability to sell commercial time over a portfolio of channels and leverage multiple platforms to connect advertisers to target audiences. In the U.S., advertising time is sold in the upfront and scatter markets. In the upfront market, advertisers buy advertising time for upcoming seasons and, by committing to purchase in advance, lock in the advertising rates they will pay for the upcoming year. Many upfront advertising commitments include options whereby advertisers may reduce or increase purchase commitments. In the scatter market, advertisers buy advertising closer to the time when the commercials will be run, which often results in a pricing premium compared to the upfront rates. The mix of upfront and scatter market advertising time sold is based upon the economic conditions at the time that upfront sales take place, impacting the sell-out levels management is willing or able to obtain. The demand in the scatter market then impacts the pricing achieved for our remaining advertising inventory. Scatter market pricing can vary from upfront pricing and can be volatile.
In addition to the global networks described in the overview section above, we operate networks in the U.S. that utilize the following brands:

|
•
|
OWN reached approximately
74 million
subscribers in the U.S. as of
December 31, 2018
.
|
|
•
|
OWN is the first and only network named for, and inspired by, a single iconic leader. OWN is a leading destination for premium scripted and unscripted programming from today's most innovative storytellers, with popular series such as
Queen Sugar
,
Greenleaf
,
Iyanla: Fix My Life
, the anticipated dramas
Ambitions
and
David Makes Man.
|
|
•
|
On
November 30, 2017
, the Company acquired from Harpo, Inc. ("Harpo") a controlling interest in OWN, increasing Discovery’s ownership stake from
49.50%
to
73.75%
. As a result of the transaction on
November 30, 2017
, the accounting for OWN was changed from an equity method investment to a consolidated subsidiary.
|
|
•
|
Target viewers are African-American women aged 25-54
.
|

|
•
|
We have a 60% controlling financial interest in Discovery Family and account for it as a consolidated subsidiary. Hasbro, Inc. ("Hasbro") owns the remaining 40% of Discovery Family.
|
|
•
|
Discovery Family reached approximately
54 million
subscribers in the U.S. as of
December 31, 2018
.
|
|
•
|
Discovery Family reached approximately
8 million
viewers in international markets as of
December 31, 2018
.
|
|
•
|
Discovery Family is programmed with a mix of original series, family-friendly movies, and programming from Discovery’s nonfiction library and Hasbro Studios’ popular animation franchises.
|
|
•
|
In the U.S., Discovery Family audiences can enjoy their favorite programming anytime, anywhere through Discovery GO app which features live and on-demand access.
|
|
•
|
Content on Discovery Family includes
My Little Pony: Friendship is Magic
and
Equestria Girls, Transformers: Rescue Bots Academy, Littlest Pet Shop
, lifestyle programming and family-friendly movies.
|
|
•
|
Target viewers are children aged 2-11, family inclusive and adults aged 25-54.
|
11

|
•
|
AHC reached approximately
48 million
subscribers in the U.S. as of
December 31, 2018
. AHC also reached approximately
1 million
subscribers through a licensing arrangement with partners in Canada included in the U.S. Networks segment as of
December 31, 2018
.
|
|
•
|
AHC provides a rare glimpse into major events that shaped our world, visionary leaders and unexpected heroes who made a difference, and the great defenders of our freedom.
|
|
•
|
In the U.S., AHC audiences can enjoy their favorite programming anytime, anywhere through Discovery GO app which features live and on-demand access.
|
|
•
|
Content on AHC includes
Gunslingers
,
Apocalypse WWI
and
America: Fact vs. Fiction
.
|
|
•
|
Target viewers are adults aged 35-64, particularly men.
|

|
•
|
Destination America reached approximately
45 million
subscribers in the U.S. as of
December 31, 2018
.
|
|
•
|
Destination America celebrates the people, places and stories of the United States, showcasing programming about myths, legends, food, adventure, natural history, and iconic landscapes from Alaska to Appalachia.
|
|
•
|
In the U.S., Destination America audiences can enjoy their favorite programming anytime, anywhere through Discovery GO app which features live and on-demand access.
|
|
•
|
Content on Destination America includes
Ghosts of Shepherdstown, Paranormal Lockdown, Epic Log Homes, BBQ Pitmasters,
and
Buying Alaska
.
|
|
•
|
Target viewers are adults aged 25-54.
|
12

|
•
|
Discovery Life reached approximately
43 million
subscribers in the U.S. as of
December 31, 2018
.
|
|
•
|
Discovery Life reached approximately
8 million
subscribers in international markets as of
December 31, 2018
.
|
|
•
|
Discovery Life entertains viewers with gripping, real-life dramas, featuring storytelling that chronicles the human experience from cradle to grave, including forensic mysteries, amazing medical stories, emergency room trauma, baby and pregnancy programming, parenting challenges, and stories of extreme life conditions.
|
|
•
|
In the U.S., Discovery Life audiences can enjoy their favorite programming anytime, anywhere through Discovery GO app which features live and on-demand access.
|
|
•
|
Content on Discovery Life includes
Untold Stories of the E.R., Body Bizarre, My Strange Addiction, Emergency 24/7
and
Diagnose Me
.
|
|
•
|
Target viewers are adults aged 25-54, particularly women.
|

|
•
|
DIY Network was acquired as a result of the acquisition of Scripps Networks.
|
|
•
|
DIY Network reached approximately
54 million
subscribers in the U.S. as of
December 31, 2018
and
3 million
combined subscribers and viewers in international markets as of
December 31, 2018
.
|
|
•
|
In the U.S., DIY Network audiences can enjoy their favorite programming anytime, anywhere through Discovery GO app which features live and on-demand access.
|
|
•
|
Content on DIY Channel includes
Barnwood Builders
,
The
Vanilla Ice Project
,
Building Alaska
,
First Time Flippers
,
Tiny House Big Living
and
Texas Flip N Move
.
|
|
•
|
Target viewers are male viewers with higher incomes in the 25 to 54 age range.
|

|
•
|
Cooking Channel was acquired as a result of the acquisition of Scripps Networks.
|
|
•
|
Our U.S. Networks segment owns a controlling interest of
68.7%
of Cooking Channel. Cooking Channel reached approximately
60 million
subscribers in the U.S. as of
December 31, 2018
and
2 million
combined subscribers and viewers in international markets as of
December 31, 2018
.
|
|
•
|
In the U.S., Cooking Channel audiences can enjoy their favorite programming anytime, anywhere through Discovery GO app which features live and on-demand access.
|
|
•
|
Content on Cooking Channel includes
Beach Bites with Katie Lee
,
The
Best Thing I Ever Ate
,
Carnival Eats
,
Cheap Eats
,
Food Fact or Fiction?, Good Eats: Reloaded, Man Fire Food
and
Man's Greatest Food
.
|
|
•
|
Target viewers are female viewers with higher incomes in the 25 to 54 age range.
|
13

|
•
|
Great American Country was acquired as a result of the acquisition of Scripps Networks.
|
|
•
|
Great American Country reached approximately
50 million
subscribers in the U.S. as of
December 31, 2018
.
|
|
•
|
In the U.S., Great American Country audiences can enjoy their favorite programming anytime, anywhere through Discovery GO app which features live and on-demand access.
|
|
•
|
Content on Great American Country includes
Going RV
,
Flea Market Flip
,
Log Cabin Living
, and
Living Alaska
.
|
|
•
|
Target viewers are fans of country music and country lifestyle.
|
INTERNATIONAL NETWORKS
International Networks generated revenues of
$4.1 billion
and Adjusted OIBDA of
$1.1 billion
during
2018
, which represented
39%
and
26%
of our total consolidated revenues and Adjusted OIBDA, respectively. Our International Networks segment principally consists of national and pan-regional television networks and brands that are delivered across multiple distribution platforms. This segment generates revenue from operations in virtually every pay-TV market in the world through an infrastructure that includes operational centers in London, Warsaw, Milan, Singapore and Miami. Global brands include Discovery Channel, Food Network, HGTV, Animal Planet, TLC, ID, Science Channel and MotorTrend (previously known as Velocity and known as Turbo outside of the U.S.), along with brands exclusive to International Networks, including Eurosport, Discovery Kids, DMAX, Discovery Home & Health, and TVN. TVN was acquired in March 2018, as part of the Scripps Acquisition. As of
December 31, 2018
, International Networks operated over
400
unique distribution feeds in over
50
languages with channel feeds customized according to language needs and advertising sales opportunities. International Networks also has FTA networks in Europe and the Middle East and broadcast networks in Poland, Denmark, Norway and Sweden, and continues to pursue further international expansion. FTA and broadcast networks generate a significant portion of International Networks' revenue. The penetration and growth rates of television services vary across countries and territories depending on numerous factors including the dominance of different television platforms in local markets. While pay-TV services have greater penetration in certain markets, FTA or broadcast television is dominant in others. International Networks has a large international distribution platform for its
75
networks, with as many as
14
networks distributed in any particular country or territory across the more than
220
countries and territories around the world. International Networks pursues distribution across all television platforms based on the specific dynamics of local markets and relevant commercial agreements.
14
Effective January 1, 2018, we realigned our International Networks management reporting structure, which was not affected by the Scripps Acquisition. The table below represents the reporting structures during the periods presented in the consolidated financial statements.
|
Reporting Structure effective
January 1, 2018
|
Reporting Structure effective
January 1, 2017
|
|
|
Europe, Middle East and Africa ("EMEA"), includes the former Central Europe, the Middle East and Africa ("CEEMEA"), Southern Europe, Nordics and the U.K. Additionally, the grouping includes Australia and New Zealand, previously included as part of Asia-Pacific
|
CEEMEA, expanded to include Belgium, the Netherlands and Luxembourg
|
|
|
Nordics
|
||
|
U.K.
|
||
|
Southern Europe
|
||
|
Latin America
|
Latin America
|
|
|
Asia-Pacific now excludes Australia and New Zealand
|
Asia-Pacific
|
|
In addition to the global networks described in the overview section above, we operate networks internationally that utilize the following brands:

|
•
|
For 30 years, Eurosport has established itself as a household name for live sports entertainment, reaching millions of fans across Europe and Asia via Eurosport 1, Eurosport 2, the network's direct-to-consumer streaming service, "Eurosport Player" and Eurosport.com.
|
|
•
|
Viewing subscribers reached by each brand as of
December 31, 2018
were as follows: Eurosport 1:
157 million
and Eurosport 2:
86 million
.
|
|
•
|
Live, exclusive and premium sports is at the core of what Eurosport does, showcasing sporting events with both local and pan-regional appeal. Viewers across Europe can enjoy live action from some of the best sporting spectacles including the Tour de France and cycling's Grand Tours, all International Ski Federation World Cup and World Championship events as well as unrivaled coverage of all four Grand Slam tennis tournaments.
|
|
•
|
Increasingly, Eurosport is investing in more exclusive and localized rights to drive local audience and commercial relevance. Important local sports rights include the Bundesliga in Germany, Eliteserien in Norway, Europa League in Sweden and the ATP World Tour tennis in France.
|
|
•
|
Two-and-a-half years after securing the rights that led to Eurosport becoming the Home of the Olympics in Europe from 2018 through 2024, Eurosport delivered its first Olympic Games in PyeongChang. The PyeongChang Olympic Games in February represented an opportunity to engage sports fans across Europe as well as new and younger audiences. The Eurosport Player was the only place to watch every minute from South Korea while sub-license agreements with some of the biggest national broadcasters across Europe realized Eurosport’s objective to reach more people on more screens than ever before. These rights were acquired for
€1.3 billion
(
$1.5 billion
as of
December 31, 2018
).
|
15
|
•
|
As of
December 31, 2018
, DMAX reached approximately
149 million
viewers through FTA networks, according to internal estimates.
|
|
•
|
DMAX is a men’s factual entertainment channel in Asia and Europe.
|

|
•
|
Discovery Kids reached approximately
144 million
viewers, according to internal estimates, as of
December 31, 2018
.
|
|
•
|
Discovery Kids is a leading children's network in Latin America and Asia.
|

|
•
|
TVN was acquired as a result of the acquisition of Scripps Networks.
|
|
•
|
TVN operates a portfolio of free-to-air and pay-TV lifestyle, entertainment, and news networks in Poland, including TVN, TVN7, TTV, HGTV Home & Garden, TVN24, TVN Style, TVN Turbo, TVN24 BiS, TVN Fabu³a, Travel Channel, Food Network, iTVN, iTVNExtra & NTL.
|
|
•
|
TVN reached approximately
117 million
combined subscribers as of
December 31, 2018
.
|
16
Our International Networks segment also owns and operates the following regional television networks, which reached the following number of subscribers and viewers via pay and FTA or broadcast networks, respectively, as of
December 31, 2018
:
|
Television Service
|
International
Subscribers/Viewers
(millions)
|
||||
|
Food Network (excluding TVN)
|
Pay
|
102
|
|||
|
Quest
|
FTA
|
74
|
|||
|
Travel Channel (excluding TVN)
|
Pay
|
70
|
|||
|
Dsport
|
FTA
|
47
|
|||
|
Nordic broadcast networks
(a)
|
Broadcast
|
34
|
|||
|
Quest Red
|
FTA
|
27
|
|||
|
Giallo
|
FTA
|
25
|
|||
|
Frisbee
|
FTA
|
25
|
|||
|
K2
|
FTA
|
25
|
|||
|
Nove
|
FTA
|
25
|
|||
|
Discovery World
|
Pay
|
20
|
|||
|
DKISS
|
Pay
|
19
|
|||
|
Asian Food Channel
|
Pay
|
15
|
|||
|
Discovery HD Theater
|
Pay
|
15
|
|||
|
Fine Living Network
|
Pay
|
14
|
|||
|
Shed
|
Pay
|
12
|
|||
|
HGTV Home & Garden (excluding TVN)
|
Pay
|
11
|
|||
|
Discovery History
|
Pay
|
10
|
|||
|
Discovery Civilization
|
Pay
|
9
|
|||
|
Discovery Historia
|
Pay
|
6
|
|||
|
Discovery en Espanol (U.S.)
|
Pay
|
5
|
|||
|
Discovery Familia (U.S.)
|
Pay
|
5
|
|||
(a)
Number of subscribers corresponds to the sum of the subscribers to each of the Nordic broadcast networks in Sweden, Norway, Finland and Denmark subject to retransmission agreements with pay-TV providers. The Nordic broadcast networks include Kanal 5, Kanal 9, and Kanal 11 in Sweden, TV Norge, MAX, FEM and VOX in Norway, TV 5, Kutonen, and Frii in Finland, and Kanal 4, Kanal 5, 6'eren, and Canal 9 in Denmark.
Similar to U.S. Networks, a significant source of revenue for International Networks relates to fees charged to operators who distribute our linear networks. Such operators primarily include cable and DTH satellite service providers. International television markets vary in their stages of development. Some markets, such as the U.K., are more advanced digital television markets, while others remain in the analog environment with varying degrees of investment from operators to expand channel capacity or convert to digital technologies. Common practice in some markets results in long-term contractual distribution relationships, while customers in other markets renew contracts annually. Distribution revenue for our International Networks segment is largely dependent on the number of subscribers that receive our networks or content, the rates negotiated in the distributor agreements, and the market demand for the content that we provide.
The other significant source of revenue for International Networks relates to advertising sold on our television networks and across distribution platforms, similar to U.S. Networks. Advertising revenue is dependent upon a number of factors, including the development of pay and FTA television markets, the number of subscribers to and viewers of our channels, viewership demographics, the popularity of our programming, and our ability to sell commercial time over a portfolio of channels on multiple platforms. In certain markets, our advertising sales business operates with in-house sales teams, while we rely on external sales representation services in other markets.
During
2018
, distribution, advertising and other revenues were
50%
,
43%
and
7%
, respectively, of total net revenues for this segment. While the Company has traditionally operated cable networks, in recent years an increasing portion of the Company's international advertising revenue is generated by FTA or broadcast networks, unlike U.S. Networks. During
2018
, pay-TV networks generated
38%
of International Networks' advertising revenue and FTA or broadcast networks generated
62%
of International Networks' advertising revenue.
17
International Networks' largest cost is content expense for localized programming disseminated via more than
400
unique distribution feeds. While our International Networks segment maximizes the use of programming from U.S. Networks, we also develop local programming that is tailored to individual market preferences and license the rights to air films, television series and sporting events from third parties. International Networks amortizes the cost of capitalized content rights based on the proportion of current estimated revenues relative to the estimated remaining total lifetime revenues, which results in either an accelerated method or a straight-line method over the estimated useful lives of the content of up to five years. Content acquired from U.S. Networks and content developed locally airing on the same network is amortized similarly, as amortization rates vary by network. More than half of International Networks' content is amortized using an accelerated amortization method, while the remainder is amortized on a straight-line basis. The costs for multi-year sports programming arrangements are expensed when the event is broadcast based on the estimated relative value of each component of the arrangement.
While International Networks and U.S. Networks have similarities with respect to the nature of operations, the generation of revenue and the categories of expense, International Networks have a lower segment margin due to lower economies of scale from being in over
220
markets requiring additional cost for localization to satisfy market variations. International Networks also include sports and FTA broadcast channels, which drive higher costs from sports rights and production and investment in broad entertainment programming for broadcast networks.
On
June 23, 2016
, the U.K. held a referendum in which voters approved an exit from the European Union (“E.U.”), commonly referred to as “Brexit.” E.U. law provides for a departing member state to have a two-year notice period to negotiate a term of exit, which the U.K. triggered on March 27, 2017. On
November 22, 2018
, a draft withdrawal agreement was published detailing the framework of the future relationship between the U.K. and the E.U. This agreement has not yet been ratified by the U.K. and European Parliaments and negotiations continue to find a mutually acceptable text in time for the deadline of March 29, 2019. Brexit may have an adverse impact on advertising, subscribers, distributors and employees, as described in Item 1A, Risk Factors, below. We continue to monitor the situation for potential effects to our distribution and licensing agreements, unusual foreign currency exchange rate fluctuations, and changes to the legal and regulatory landscape.
EDUCATION AND OTHER
Education and Other generated revenues of $
54 million
during
2018
, which represented
1%
of our total consolidated revenues. Our Education Business was comprised of curriculum-based product and service offerings and generates revenues primarily from subscriptions charged to K-12 schools for access to an online suite of curriculum-based VOD tools, professional development services, digital textbooks and, to a lesser extent, student assessments and publication of hard copy curriculum-based content. On
April 30, 2018
, we sold an
88%
controlling equity stake in our Education Business to Francisco Partners for a sale price of
$113 million
, which resulted in a gain of $84 million upon disposition. We retained a
12%
ownership interest in the Education Business, which is accounted for as an equity method investment. (See Note 3 to the accompanying consolidated financial statements.) Other is comprised of a production studio that develops content for our networks and other television service providers throughout the world. Our wholly-owned production studio provides services to our U.S. Networks and International Networks segments at cost. The revenues and offsetting expenses associated with these inter-segment production services have been eliminated from the results of operations for Education and Other.
On
April 28, 2017
, the Company sold Raw and Betty LLC to All3Media. All3Media is a U.K. based television, film and digital production and distribution company. The Company owns
50%
of All3Media and accounts for its investment in All3Media under the equity method of accounting.
CONTENT DEVELOPMENT
Our content development strategy is designed to increase viewership, maintain innovation and quality leadership, and provide value for our network distributors and advertising customers. Our content is sourced from a wide range of third-party producers, which include some of the world’s leading nonfiction production companies, as well as independent producers and wholly-owned production studios.
Our production arrangements fall into three categories: produced, coproduced and licensed. Produced content includes content that we engage third parties or wholly owned production studios to develop and produce. We retain editorial control and own most or all of the rights, in exchange for paying all development and production costs. Production of digital-first content such as virtual reality and short-form video is typically done through wholly-owned production studios. Coproduced content refers to program rights on which we have collaborated with third parties to finance and develop either because world-wide rights are not available for acquisition or we save costs by collaborating with third parties. Licensed content is comprised of films or series that have been produced by third parties. Payments for sports rights made in advance of the event are recognized as prepaid content license assets.
18
International Networks maximizes the use of content from our U.S. Networks. Our non-fiction content tends to be culturally neutral and maintains its relevance for an extended period of time. As a result, a significant amount of our non-fiction content translates well across international borders and is made even more accessible through extensive use of dubbing and subtitles in local languages. Our content can be re-edited and updated in a cost-effective manner to provide topical versions of subject matter that can be utilized around the world. International Networks executes a localization strategy by offering content from U.S. Networks, customized content and localized schedules via our distribution feeds. While our International Networks segment maximizes the use of content from U.S. Networks, we also develop local content that is tailored to individual market preferences and license the rights to air films, television series and sporting events from third-party producers. To that end, during
2018
, we entered into a 12-year partnership with the PGA Tour that includes TV and online rights to the PGA Tour outside the United States. Effective
January 1, 2019
, we announced the launch of GOLFTV, a new live and on-demand international video streaming service providing over
2,000
hours of live golf programming each year and extensive premium content on-demand. Discovery plans to invest more than
$2 billion
over the course of the partnership, including licensing rights and building the GOLFTV platform.
Our largest single cost is content expense, which includes content amortization, content impairment and production costs. We amortize the cost of capitalized content rights based on the proportion that the current year's estimated revenues bear to the estimated remaining total lifetime revenues, which normally results in an accelerated amortization method over the estimated useful lives. However, certain networks also utilize a straight-line method of amortization over the estimated useful lives of the content. Content is amortized primarily over periods of
three
to
four
years. The costs for multi-year sports programming arrangements are expensed when the event is broadcast based on the estimated relative value of each season in the arrangement. Content assets are reviewed for impairment when impairment indicators are present, such as low viewership or limited expected use. Impairment losses are recorded when content asset carrying value exceeds net realizable value.
REVENUES
We generate revenues principally from the sale of advertising on our networks and digital products and from fees charged to distributors who distribute our network content, which primarily include cable, DTH satellite, telecommunication and digital service providers. Other transactions include curriculum-based products and services, affiliate and advertising sales representation services, production studios content development and services, content licenses and the licensing of our brands for consumer products. During
2018
, distribution, advertising and other revenues were
43%
,
52%
and
5%
, respectively, of consolidated revenues. No individual customer represented more than 10% of our total consolidated revenues for
2018
,
2017
or
2016
.
Distribution
Distribution revenue includes fees charged for the right to view Discovery's network branded content made available to customers through a variety of distribution platforms and viewing devices. The largest component of distribution revenue is comprised of linear distribution services for rights to our networks from cable, DTH satellite and telecommunication service providers. We have contracts with distributors representing most cable and satellite service providers around the world, including the largest operators in the U.S. and major international distributors. Typically, our television networks are aired pursuant to multi-year carriage agreements that provide for the level of carriage that Discovery’s networks will receive, and, if applicable, for scheduled graduated annual rate increases. Carriage of our networks depends upon package inclusion, such as whether networks are on the more widely distributed, broader packages or lesser-distributed, specialized packages. Distribution revenues are largely dependent on the rates negotiated in the agreements, the number of subscribers that receive our networks or content, the number of platforms covered in the distribution agreement, and the market demand for the content that we provide. From time to time, renewals of multi-year carriage agreements include significant year one market adjustments to re-set subscriber rates, which then increase at rates lower than the initial increase in the following years. In some cases, we have provided distributors launch incentives, in the form of cash payments or free periods, to carry our networks.
In the U.S., more than
96%
of distribution revenues come from the top 10 distributors, with whom we have agreements that expire at various times from
2019 through 2023
. Outside of the U.S., approximately
39%
of distribution revenue comes from the top 10 distributors. Distribution fees are typically collected ratably throughout the year. International television markets vary in their stages of development. Some, notably the U.K., are more advanced digital multi-channel television markets, while others operate in the analog environment with varying degrees of investment from distributors in expanding channel capacity or converting to digital.
Distribution revenue also includes fees charged for bulk content arrangements and other subscription services for episodic content. These digital distribution revenues are impacted by the quantity, as well as the quality, of the content Discovery provides.
19
Advertising
Our advertising revenue is generated across multiple platforms and consists of consumer advertising, which is sold primarily on a national basis in the U.S. and on a pan-regional or local-language feed basis outside the U.S. Advertising contracts generally have a term of one year or less.
In the U.S., we sell advertising time in the upfront and scatter markets. In the upfront market, advertisers buy advertising time for the upcoming season and by purchasing in advance often receive discounted rates. In the scatter market, advertisers buy advertising time close to the time when the commercials will be run and often pay a premium. The mix between the upfront and scatter markets is based upon a number of factors, such as pricing, demand for advertising time and economic conditions. Outside the U.S., advertisers typically buy advertising closer to the time when the commercials will be run. In developing pay-TV markets, we expect advertising revenue growth will result from subscriber growth, our localization strategy, and the shift of advertising spending from broadcast to pay-TV. In mature markets, such as the U.S. and Western Europe, high proportions of market penetration and distribution are unlikely to drive rapid revenue growth. Instead, growth in advertising sales comes from increasing viewership and pricing and launching new services, either in pay-TV, broadcast, or FTA television environments.
Advertising revenue is dependent upon a number of factors, including the stage of development of television markets, the popularity of FTA television, the number of subscribers to our channels, viewership demographics, the popularity of our content and our ability to sell commercial time over a group of channels. Revenue from advertising is subject to seasonality, market-based variations and general economic conditions. Advertising revenue is typically highest in the second and fourth quarters. In some cases, advertising sales are subject to ratings guarantees that require us to provide additional advertising time if the guaranteed audience levels are not achieved.
We also generate revenue from the sale of advertising through our digital products on a stand-alone basis and as part of advertising packages with our television networks.
Other
We also generate income associated with content production from our production studio. Prior to the sale of the Education Business on April 30, 2018, we generated income from curriculum-based products and services, the licensing of our brands for consumer products and third-party content sales.
COMPETITION
Providing content across various distribution platforms is a highly competitive business worldwide. We experience competition for the development and acquisition of content, distribution of our content, sale of commercial time on our networks and viewership. There is competition from other production studios, other television networks, and online-based content providers for the acquisition of content and creative talent such as writers, producers and directors. Our ability to produce and acquire popular content is an important competitive factor for the distribution of our content, attracting viewers and the sale of advertising. Our success in securing popular content and creative talent depends on various factors such as the number of competitors providing content that targets the same genre and audience, the distribution of our content, viewership, and the production, marketing and advertising support we provide.
Our networks compete with other television networks, including broadcast, cable and local, for the distribution of our content and fees charged to cable television operators, DTH satellite service providers, and other distributors that carry our content. Our ability to secure distribution agreements is necessary to ensure the retention of our audiences. Our contractual agreements with distributors are renewed or renegotiated from time to time in the ordinary course of business. Growth in the number of networks distributed, consolidation and other market conditions in the cable and satellite distribution industry, and increased popularity of other platforms may adversely affect our ability to obtain and maintain contractual terms for the distribution of our content that are as favorable as those currently in place. The ability to secure distribution agreements is dependent upon the production, acquisition and packaging of original content, viewership, the marketing and advertising support and incentives provided to distributors, the product offering across a series of networks within a region, and the prices charged for carriage.
Our networks and digital products compete for the sale of advertising with other television networks, including broadcast, cable, local networks, and other content distribution outlets for their target audiences and the sale of advertising. Our success in selling advertising is a function of the size and demographics of our audiences, quantitative and qualitative characteristics of the audience of each network, the perceived quality of the network and of the particular content, the brand appeal of the network and ratings as determined by third-party research companies, prices charged for advertising and overall advertiser demand in the marketplace.
20
Our networks and digital products also compete for their target audiences with all forms of content and other media provided to viewers, including broadcast, cable and local networks, pay-per-view and VOD services, DVDs, online activities and other forms of news, information and entertainment.
Our production studios compete with other production and media companies for talent. Prior to the sale of the Education Business on
April 30, 2018
, our education business competed with other providers of curriculum-based products and services to schools.
INTELLECTUAL PROPERTY
Our intellectual property assets include copyrights in content, trademarks in brands, names and logos, websites, and licenses of intellectual property rights from third parties.
We are fundamentally a content company and the protection of our brands and content is of primary importance. To protect our intellectual property assets, we rely upon a combination of copyright, trademark, unfair competition, trade secret and Internet/domain name statutes and laws, and contract provisions. However, there can be no assurance of the degree to which these measures will be successful. Moreover, effective intellectual property protection may be either unavailable or limited in certain foreign territories. Policing unauthorized use of our products and services and related intellectual property is difficult and costly. We seek to limit unauthorized use of our intellectual property through a combination of approaches. However, the steps taken to prevent the infringement of our intellectual property by unauthorized third parties may not work.
Third parties may challenge the validity or scope of our intellectual property from time to time, and the success of any such challenges could result in the limitation or loss of intellectual property rights. Irrespective of their validity, such claims may result in substantial costs and diversion of resources which could have an adverse effect on our operations. In addition, piracy, which encompasses the theft of our signal, and unauthorized use of our content, in the digital environment continues to present a threat to revenues from products and services based on our intellectual property.
REGULATORY MATTERS
Our businesses are subject to and affected by regulations of U.S. federal, state and local government authorities, and our international operations are subject to laws and regulations of the countries and international bodies, such as the E.U., in which we operate. Content networks, such as those owned by us, are regulated by the Federal Communications Commission (“FCC”) including some regulations that only apply to content networks affiliated with a cable television operator. Other FCC regulations, although imposed on cable television operators and direct broadcast satellite ("DBS") operators and other distributors, affect content networks indirectly. The rules, regulations, policies and procedures affecting our businesses are constantly subject to change. These descriptions are summary in nature and do not purport to describe all present and proposed laws and regulations affecting our businesses.
Program Access
The FCC’s program access rules prevent a satellite-delivered content vendor in which a cable operator has an “attributable” ownership interest from discriminating against unaffiliated multichannel video programming distributors (“MVPDs”), such as cable and DBS operators, in the rates, terms and conditions for the sale or delivery of content. These rules permit the unaffiliated MVPD to initiate a complaint to the FCC against content networks if it believes this rule has been violated. The FCC allowed a previous blanket prohibition on exclusive arrangements between content networks subject to these rules and cable operators to expire in October 2012, but will consider case-by-case complaints that exclusive contracts between cable operators and cable-affiliated programmers significantly hinder or prevent an unaffiliated MVPD from providing satellite or cable programming.
“Must-Carry”/Retransmission Consent
The Communications Act (the “Act”) imposes “must-carry” regulations on cable systems, requiring them to carry the signals of most local broadcast television stations in their market. DBS systems are also subject to their own must-carry rules. The FCC’s implementation of “must-carry” obligations requires cable operators and DBS providers to give broadcasters preferential access to channel space and favorable channel positions. This reduces the amount of channel space that is available for carriage of our networks by cable and DBS operators. The Act also gives broadcasters the choice of opting out of must-carry and invoking the right to retransmission consent, which refers to a broadcaster’s right to require MVPDs, such as cable and satellite operators, to obtain the broadcaster's consent before distributing the broadcaster's signal to the MVPDs' subscribers. Broadcasters have traditionally used the resulting leverage from demand for their must-have broadcast content to obtain carriage for their affiliated networks. Increasingly, broadcasters are additionally seeking substantial monetary compensation for granting carriage rights for their must-have broadcast content. Such increased financial demands on distributors reduce the content funds available for independent programmers not affiliated with broadcasters, such as us.
21
Accessibility and Advertising Restrictions
Certain of our content networks and some of our IP-delivered video content must provide closed-captioning and video description of some of their programming. Our content networks and digital products intended primarily for children 12 years of age and under must comply with certain limits on advertising. Commercials embedded in our networks’ content stream must adhere to certain standards for ensuring that those commercials are not transmitted at louder volumes than our program material.
Obscenity Restrictions
Network distributors are prohibited from transmitting obscene content, and our affiliation agreements generally require us to refrain from including such content on our networks.
Regulation of the Internet
We operate several digital products and websites that we use to distribute information about our programs and to offer consumers the opportunity to purchase consumer products and services. Internet services are now subject to regulation in the U.S. relating to the privacy and security of personally identifiable user information and acquisition of personal information from children under 13, including the federal Children's Online Privacy Protection Act and the federal Controlling the Assault of Non-Solicited Pornography and Marketing Act. In addition, a majority of states have enacted laws that impose data security and security breach obligations. Additional federal and state laws and regulations may be adopted with respect to the Internet or other on-line services, covering such issues as user privacy, child safety, data security, advertising, pricing, content, copyrights and trademarks, access by persons with disabilities, distribution, taxation and characteristics and quality of products and services. We must design and operate our digital products and websites in compliance with these laws and regulations. In addition, to the extent we offer products and services to on-line consumers outside the U.S., the laws and regulations of foreign jurisdictions, including, without limitation, consumer protection, privacy, advertising, data retention, intellectual property, and content limitations, may impose additional compliance obligations on us.
Foreign Laws and Regulations
The foreign jurisdictions in which our networks are offered have, in varying degrees, laws and regulations governing our businesses.
EMPLOYEES
As of
December 31, 2018
, we had approximately
9,000
employees, including full-time and part-time employees of our wholly-owned subsidiaries and consolidated ventures. Scripps Networks had approximately
4,000
employees at the date of the acquisition.
AVAILABLE INFORMATION
All of our filings with the U.S. Securities and Exchange Commission (the “SEC”), including reports on Form 10-K, Form 10-Q and Form 8-K, and all amendments to such filings are available free of charge at the investor relations section of our website, https://corporate.discovery.com, as soon as reasonably practicable after such material is filed with, or furnished to, the SEC. Our annual report, corporate governance guidelines, code of business ethics, audit committee charter, compensation committee charter, and nominating and corporate governance committee charter are also available on our website. In addition, we will provide a printed copy of any of these documents, free of charge, upon written request to: Investor Relations, Discovery, Inc., 850 Third Avenue, 8th Floor, New York, NY 10022-7225. Additionally, the SEC maintains a website at http://www.sec.gov that contains quarterly, annual and current reports, proxy and information statements, and other information regarding issuers that file electronically with the SEC, including the Company.
The information contained on our website is not part of this Annual Report on Form 10-K and is not incorporated by reference herein.
22
ITEM 1A. Risk Factors.
Investing in our securities involves risk. In addition to the other information contained in this report, you should consider the following risk factors before investing in our securities.
Risks Related to Our Business
There has been a shift in consumer behavior as a result of technological innovations and changes in the distribution of content, which may affect our viewership and the profitability of our business in unpredictable ways.
Technology and business models in our industry continue to evolve rapidly. Consumer behavior related to changes in content distribution and technological innovation affect our economic model and viewership in ways that are not entirely predictable.
Consumers are increasingly viewing content on a time-delayed or on-demand basis from traditional distributors and from connected apps and websites and on a wide variety of screens, such as televisions, tablets, mobile phones and other devices. Additionally, devices that allow users to view television programs on a time-shifted basis and technologies that enable users to fast-forward or skip programming, including commercials, such as DVRs and portable digital devices and systems that enable users to store or make portable copies of content may affect the attractiveness of our offerings to advertisers and could therefore adversely affect our revenues. There is increased demand for short-form, user-generated and interactive content, which have different economic models than our traditional content offerings. Likewise, distributors are offering smaller programming packages known as “skinny bundles,” which are delivered at a lower cost than traditional offerings and sometimes allow consumers to create a customized package of networks, that are gaining popularity among consumers. If our networks are not included in these packages or consumers favor alternative offerings, we may experience a decline in viewership and ultimately the demand for our programming, which could lead to lower distribution and advertising revenues. We have also seen declines in subscribers to the traditional cable bundle. In
2018
, total U.S. Networks portfolio subscribers declined
4%
while subscribers to our fully distributed networks
were consistent with the prior year
. Each distribution model has different risks and economic consequences for us, so the rapid evolution of consumer preferences may have an economic impact that is not completely predictable. Distribution windows are also evolving, potentially affecting revenues from other windows. If we cannot ensure that our distribution methods and content are responsive to our target audiences, our business could be adversely affected.
Consolidation among cable and satellite providers, both domestically and internationally, could have an adverse effect on our revenue and profitability.
Consolidation among cable and satellite operators has given the largest operators considerable leverage in their relationships with programmers, including us. In the U.S., approximately
96%
of our distribution revenues come from the top 10 distributors. For the International Networks segment, approximately
39%
of distribution revenue comes from the 10 largest distributors. We currently have agreements in place with the major cable and satellite operators in U.S. Networks and International Networks which expire at various times through
2023
. Some of our largest distributors have combined, and as a result, have gained, or may gain, market power, which could affect our ability to maximize the value of our content through those platforms. In addition, many of the countries and territories in which we distribute our networks also have a small number of dominant distributors. Continued consolidation within the industry could reduce the number of distributors to carry our programming, subject our affiliate fee revenue to greater volume discounts, and further increase the negotiating leverage of the cable and satellite television system operators which could have an adverse effect on our financial condition or results of operations.
The success of our business depends on the acceptance of our entertainment content by our U.S. and foreign viewers, which may be unpredictable and volatile.
The production and distribution of entertainment content are inherently risky businesses because the revenue we derive and our ability to distribute our content depend primarily on consumer tastes and preferences that often change in unpredictable ways. Our success depends on our ability to consistently create and acquire content that meets the changing preferences of viewers in general, in special interest groups, in specific demographic categories and in various international marketplaces. As the home of the Olympic Games in Europe until 2024, we have been developing and innovating new forms of content in connection with the Olympic Games. Our success with the Olympics depends on audience acceptance of this content. If viewers do not find our Olympic Games content acceptable, we could see low viewership, which could lead to low distribution and advertising revenues.
The commercial success of our content also depends upon the quality and acceptance of competing content available in the applicable marketplace. Other factors, including the availability of alternative forms of entertainment and leisure time activities, general economic conditions, piracy, and growing competition for consumer discretionary spending may also affect the audience for our content. Audience sizes for our media networks are critical factors affecting both the volume and pricing of advertising revenue that we receive, and the extent of distribution and the license fees we receive under agreements with our distributors. Consequently, reduced public acceptance of our entertainment content may decrease our audience share and adversely affect our results of operations.
23
As a company that has operations in the United Kingdom, the vote by the United Kingdom to leave the E.U. could have an adverse impact on our business, results of operations and financial position.
On June 23, 2016, the U.K. held a referendum in which voters approved an exit from the European Union (“E.U.”), commonly referred to as “Brexit.” As a result of the referendum, the British government has begun negotiating the terms of the U.K.’s future relationship with the E.U. Ratification should be finalized by March 29, 2019, although there is still considerable political uncertainty around the outcome. The effects of Brexit will depend on any agreements the U.K. makes to retain access to the E.U. markets either during a transitional period or more permanently. The measures could potentially disrupt the markets we serve and may cause us to lose subscribers, distributors and employees. If the U.K. loses access to the single E.U. market, it could have a detrimental impact on our U.K. growth. Such a decline could also make our doing business in Europe more complex, which could involve operational changes in order to protect, delay and reduce the scope of our distribution and licensing agreements. Without access to the single E.U. market, it may be more challenging and costly to obtain intellectual property rights for our content within the U.K. or distribute our services in Europe. Discovery, like many international media businesses, has sought to mitigate this risk by applying for broadcast licenses in remaining E.U. Member States. There can be no assurance that this will be successful. In addition, Brexit could lead to legal uncertainty and potentially divergent national laws and regulations as the U.K. determines which E.U. laws to replace and replicate. If there are changes to U.K. immigration policy as a result of Brexit, this could affect our employees and their ability to move freely between the E.U. member states for work-related matters.
The announcement of Brexit has caused significant volatility in global stock markets and currency exchange rate fluctuations. With the expansion of our international operations, our exposure to exchange rate fluctuation has increased. This increase in exposure could have an adverse effect on our results of operations and net asset balances, as there can be no assurance that the downward trend of the British pound and the Euro will rebound. Brexit may also create global uncertainty, which may cause a decrease in consumer discretionary spending. These decreases in consumer discretionary spending may affect cable television and other video service subscriptions where our networks are distributed. This could lead to a decrease in the number of subscribers receiving our programming, which could in turn have a negative impact on our viewing subscribers and distribution revenues. A decrease in our viewing subscribers would have a negative impact on the number of viewers watching our programming, possibly impacting the rates we are able to charge for advertising. Any of the foregoing factors may adversely affect our business, results of operations or financial position.
Foreign exchange rate fluctuations may adversely affect our operating results and financial conditions.
We have significant operations in a number of foreign jurisdictions and certain of our operations are conducted and certain of our debt obligations are denominated in foreign currencies. As a result, we have exposure to foreign currency risk as we enter into transactions and make investments denominated in multiple currencies. The value of these currencies fluctuates relative to the U.S. dollar. Our consolidated financial statements are denominated in U.S. dollars, and to prepare those financial statements we must translate the amounts of the assets, liabilities, net sales, other revenues and expenses of our operations outside of the U.S. from local currencies into U.S. dollars using exchange rates for the current period. As we have expanded our international operations, our exposure to exchange rate fluctuations has increased. This increased exposure could have an adverse effect on our reported results of operations and net asset balances. There is no assurance that downward trending currencies will rebound or that stable currencies will remain unchanged in any period or for any specific market.
Our businesses operate in highly competitive industries.
The entertainment and media programming industries in which we operate are highly competitive. We compete with other programming networks for distribution, viewers and advertising. We also compete for viewers with other forms of media entertainment, such as home video, movies, periodicals, on-line and mobile activities. In particular, websites and search engines have seen significant advertising growth, a portion of which has moved from traditional cable network and satellite advertisers. Businesses, including ours, that offer multiple services, or that may be vertically integrated and offer both video distribution and programming content, may face closer regulatory review from the competition authorities in the countries in which we currently have operations. If our distributors have to pay higher rates to holders of sports broadcasting rights, it might be difficult for us to negotiate higher rates for distribution of our networks. The ability of our businesses to compete successfully depends on a number of factors, including our ability to consistently supply high quality and popular content, access our niche viewership with appealing category-specific content, adapt to new technologies and distribution platforms and achieve widespread distribution. There can be no assurance that we will be able to compete successfully in the future against existing or new competitors, or that increasing competition will not have a material adverse effect on our business, financial condition or results of operations.
24
Failure to renew, renewal with less favorable terms, or termination of our affiliation agreements may cause a decline in our revenue.
Because our networks are licensed on a wholesale basis to distributors, such as cable and satellite operators, which in turn distribute them to consumers, we are dependent upon the maintenance of affiliation agreements with these operators. These affiliation agreements generally provide for the level of carriage our networks will receive, such as channel placement and programming package inclusion (widely distributed, broader programming packages compared to lesser distributed, specialized programming packages) and for payment of a license fee to us based on the number of subscribers that receive our networks. While the number of subscribers associated with our networks impacts our ability to generate advertising revenue, these per subscriber payments also represent a significant portion of our revenue. Our affiliation agreements generally have a limited term which varies by market and distributor, and there can be no assurance that these affiliation agreements will be renewed in the future or renewed on terms that are favorable to us. A reduction in the license fees that we receive per subscriber or in the number of subscribers for which we are paid, including as a result of a loss or reduction in carriage for our networks, could adversely affect our distribution revenue. Such a loss or reduction in carriage could also decrease the potential audience for our programs thereby adversely affecting our advertising revenue. In addition, our affiliation agreements are complex and individually negotiated. If we were to disagree with one of our counterparties on the interpretation of an affiliation agreement, our relationship with that counterparty could be damaged and our business could be negatively affected.
Interpretation of some terms of our distribution agreements may have an adverse effect on the distribution payments we receive under those agreements.
Some of our distribution agreements contain “most favored nation” clauses. These clauses typically provide that if we enter into an agreement with another distributor which contains certain more favorable terms, we must offer some of those terms to our existing distributors. We have entered into a number of distribution agreements with terms that differ in some respects from those contained in other agreements. While we believe that we have appropriately complied with the most favored nation clauses included in our distribution agreements, these agreements are complex and other parties could reach a different conclusion that, if correct, could have an adverse effect on our financial condition or results of operations.
We face cybersecurity and similar risks, which could result in the disclosure of confidential information, disruption of our programming services, damage to our brands and reputation, legal exposure and financial losses.
Our on-line, mobile and app offerings, as well as our internal systems, involve the storage and transmission of personal and proprietary information, and we and our partners rely on various technology systems in connection with the production and distribution of our programming. Our systems may be breached due to employee error, malicious code, hacking and phishing attacks, or otherwise. Additionally, outside parties may attempt to fraudulently induce employees or users to disclose sensitive or confidential information in order to gain access to data and systems. Because the techniques used to obtain unauthorized access, disable or degrade service, or sabotage systems change frequently and often are not recognized until launched against a target, we may be unable to anticipate these techniques or to implement adequate preventative measures, notwithstanding our ongoing efforts to develop and implement robust data security tools, practices, and protocols. Any such breach or unauthorized access could result in a loss of our proprietary information, which may include user data, a disruption of our services or a reduction of the revenues we are able to generate from such services, damage to our brands and reputation, a loss of confidence in the security of our offerings and services, and significant legal and financial exposure, each of which could potentially have an adverse effect on our business.
In addition, we face regulatory risk associated with the acquisition, storage, disclosure, use and protection of personal data, including under the European Union General Data Protection Regulation ("GDPR") and various other domestic and international privacy and data security laws and regulations, which are continually evolving. These evolving data protection laws may require Discovery to expend significant resources to implement additional data protection measures, and Discovery's actual or alleged failure to comply with such laws could result in legal claims, regulatory enforcement actions and significant fines and penalties.
Financial performance for our equity method investments and investments without readily determinable fair value may differ from current estimates.
We have equity investments in several entities and the accounting treatment applied for these investments varies depending on a number of factors, including, but not limited to, our percentage ownership and the level of influence or control we have over the relevant entity. Any losses experienced by these entities could adversely impact our results of operations and the value of our investment. In addition, if these entities were to fail and cease operations, we may lose the entire value of our investment and the stream of any shared profits. Some of our ventures may require additional uncommitted funding. We also have significant investments in entities that we have accounted for as investments without readily determinable fair value. If these entities experience significant losses or were to fail and cease operations, our investments could be subject to impairment and the loss of a part or all of our investment value.
25
We may not be able to successfully integrate the Scripps Networks business with our own, realize the anticipated benefits of the Scripps Networks acquisition or manage our expanded operations, any of which would adversely affect our results of operations.
We have devoted, and expect to continue to devote, significant management attention and resources to integrating our organization, procedures, and operations with those of Scripps Networks. Such integration efforts are costly due to the large number of processes, policies, procedures, locations, operations, technologies and systems to be integrated, including purchasing, accounting and finance, sales, service, operations, payroll, pricing, marketing and employee benefits. Integration expenses could, particularly in the short term, exceed the cost synergies we expect to achieve from the elimination of duplicative expenses and the realization of economies of scale, which could result in significant charges to earnings that we cannot currently quantify. Potential difficulties that we may encounter as part of the integration process include the following:
|
•
|
our inability to successfully combine our business with Scripps Networks in a manner that permits the combined company to achieve the full synergies and other benefits anticipated to result from the merger; and
|
|
•
|
complexities associated with managing the combined businesses, including difficulty addressing possible differences in corporate cultures and management philosophies and the challenge of integrating products, services, complex and different information technology systems, control and compliance processes, technology, networks and other assets of each of the companies in a cohesive manner.
|
Following the merger, the size and complexity of the business of the combined company increased significantly. Our future success depends, in part, upon our ability to manage this expanded business, which will pose substantial challenges for management, including challenges related to the management and monitoring of new operations and associated increased costs and complexity. There can be no assurances that we will be successful or that we will realize the expected synergies and benefits anticipated from the merger.
General Risks
Theft of our content, including digital copyright theft and other unauthorized exhibitions of our content, may decrease revenue received from our programming and adversely affect our businesses and profitability.
The success of our business depends in part on our ability to maintain the intellectual property rights to our entertainment content. We are fundamentally a content company, and piracy of our brands, television networks, digital content and other intellectual property has the potential to significantly and adversely affect us. Piracy is particularly prevalent in many parts of the world that lack copyright and other protections similar to existing law in the U.S. It is also made easier by technological advances allowing the conversion of content into digital formats, which facilitates the creation, transmission and sharing of high-quality unauthorized copies. Unauthorized distribution of copyrighted material over the Internet is a threat to copyright owners’ ability to protect and exploit their property. The proliferation of unauthorized use of our content may have an adverse effect on our business and profitability because it reduces the revenue that we potentially could receive from the legitimate sale and distribution of our content. Litigation may be necessary to enforce our intellectual property rights, protect trade secrets or to determine the validity or scope of proprietary rights claimed by others.
26
We are subject to risks related to our international operations.
We have operations through which we distribute programming outside the United States. As a result, our business is subject to certain risks inherent in international business, many of which are beyond our control. These risks include:
|
•
|
laws and policies affecting trade and taxes, including laws and policies relating to the repatriation of funds and withholding taxes, and changes in these laws;
|
|
•
|
changes in local regulatory requirements, including restrictions on content, imposition of local content quotas and restrictions on foreign ownership;
|
|
•
|
differing degrees of protection for intellectual property and varying attitudes towards the piracy of intellectual property;
|
|
•
|
significant fluctuations in foreign currency value;
|
|
•
|
currency exchange controls;
|
|
•
|
the instability of foreign economies and governments;
|
|
•
|
war and acts of terrorism;
|
|
•
|
anti-corruption laws and regulations such as the Foreign Corrupt Practices Act and the U.K. Bribery Act that impose stringent requirements on how we conduct our foreign operations and changes in these laws and regulations;
|
|
•
|
foreign privacy and data protection laws and regulation and changes in these laws; and
|
|
•
|
shifting consumer preferences regarding the viewing of video programming.
|
Events or developments related to these and other risks associated with international trade could adversely affect our revenues from non-U.S. sources, which could have a material adverse effect on our business, financial condition, operating results, liquidity and prospects.
Furthermore, some foreign markets where we and our partners operate may be more adversely affected by current economic conditions than the U.S. We also may incur substantial expense as a result of changes, including the imposition of new restrictions, in the existing economic or political environment in the regions where we do business. Acts of terrorism, hostilities, or financial, political, economic or other uncertainties could lead to a reduction in revenue or loss of investment, which could adversely affect our results of operations.
Global economic conditions may have an adverse effect on our business.
Our business is significantly affected by prevailing economic conditions and by disruptions to financial markets. We derive substantial revenues from advertisers, and these expenditures are sensitive to general economic conditions and consumer buying patterns. Financial instability or a general decline in economic conditions in the U.S. and other countries where our networks are distributed could adversely affect advertising rates and volume, resulting in a decrease in our advertising revenues.
Decreases in consumer discretionary spending in the U.S. and other countries where our networks are distributed may affect cable television and other video service subscriptions, in particular with respect to digital service tiers on which certain of our programming networks are carried. This could lead to a decrease in the number of subscribers receiving our programming from multi-channel video programming distributors, which could have a negative impact on our viewing subscribers and affiliation fee revenues. Similarly, a decrease in viewing subscribers would also have a negative impact on the number of viewers actually watching the programs on our programming networks, which could also impact the rates we are able to charge advertisers.
Economic conditions affect a number of aspects of our businesses worldwide and impact the businesses of our partners who purchase advertising on our networks and might reduce their spending on advertising. Economic conditions can also negatively affect the ability of those with whom we do business to satisfy their obligations to us. The general worsening of current global economic conditions could adversely affect our business, financial condition or results of operations, and the worsening of economic conditions in certain parts of the world, specifically, could impact the expansion and success of our businesses in such areas.
Domestic and foreign laws and regulations could adversely impact our operation results.
Programming services like ours, and the distributors of our services, including cable operators, satellite operators and other multi-channel video programming distributors, are regulated by U.S. federal laws and regulations issued and administered by various federal agencies, including the FCC, as well as by state and local governments, in ways that affect the daily conduct of our video content business. See the discussion under “Business – Regulatory Matters” above. The U.S. Congress, the FCC and the courts currently have under consideration, and may adopt or interpret in the future, new laws, regulations and policies regarding a wide variety of matters that could, directly or indirectly, affect the operations of our U.S. media properties or modify the terms under which we offer our services and operate.
27
Similarly, the foreign jurisdictions in which our networks are offered have, in varying degrees, laws and regulations governing our businesses. Programming businesses are subject to regulation on a country-by-country basis. Changes in regulations imposed by foreign governments could also adversely affect our business, results of operations and ability to expand our operations beyond their current scope.
Financial markets are subject to volatility and disruptions that may affect our ability to obtain or increase the cost of financing our operations and our ability to meet our other obligations.
Increased volatility and disruptions in the U.S. and global financial and equity markets may make it more difficult for us to obtain financing for our operations or investments or increase the cost of obtaining financing. Our borrowing costs can be affected by short and long-term debt ratings assigned by independent rating agencies which are based, in significant part, on our performance as measured by credit metrics such as interest coverage and leverage ratios. A low rating could increase our cost of borrowing or make it more difficult for us to obtain future financing. Unforeseeable changes in foreign currencies could negatively impact our results of operations and calculations of interest coverage and leverage ratios.
Acquisitions and other strategic transactions present many risks and we may not realize the financial and strategic goals that were contemplated at the time of any transaction.
From time to time we make acquisitions, investments and enter into other strategic transactions, including the transaction with Scripps Networks. In connection with such acquisitions and strategic transactions, we may incur unanticipated expenses, fail to realize anticipated benefits, have difficulty incorporating the acquired businesses, disrupt relationships with current and new employees, subscribers, affiliates and vendors, incur significant debt, or have to delay or not proceed with announced transactions. Additionally, regulatory agencies, such as the FCC or U.S. Department of Justice may impose additional restrictions on the operation of our business as a result of our seeking regulatory approvals for any significant acquisitions and strategic transactions. The occurrence of any of these events could have an adverse effect on our business.
Our inability to successfully acquire and integrate other businesses, assets, products or technologies could harm our operating results.
Our success may depend on opportunities to buy other businesses or technologies that could complement, enhance or expand our current business or products or that might otherwise offer us growth opportunities. We have acquired, and have made strategic investments in, a number of companies (including through joint ventures) in the past, and we expect to make additional acquisitions and strategic investments in the future. Such transactions may result in dilutive issuances of our equity securities, use of our cash resources, and incurrence of debt and amortization expenses related to intangible assets. Any acquisitions and strategic investments that we are able to identify and complete may be accompanied by a number of risks, including:
|
•
|
the difficulty of assimilating the operations and personnel of acquired companies into our operations;
|
|
•
|
the potential disruption of our ongoing business and distraction of management;
|
|
•
|
the incurrence of additional operating losses and operating expenses of the businesses we acquired or in which we invested;
|
|
•
|
the difficulty of integrating acquired technology and rights into our services and unanticipated expenses related to such integration;
|
|
•
|
the failure to successfully further develop an acquired business or technology and any resulting impairment of amounts currently capitalized as intangible assets;
|
|
•
|
the failure of strategic investments to perform as expected or to meet financial projections;
|
|
•
|
the potential for patent and trademark infringement and data privacy and security claims against the acquired companies, or companies in which we have invested;
|
|
•
|
litigation or other claims in connection with acquisitions, acquired companies, or companies in which we have invested;
|
|
•
|
the impairment or loss of relationships with customers and partners of the companies we acquired or in which we invested or with our customers and partners as a result of the integration of acquired operations;
|
|
•
|
the impairment of relationships with, or failure to retain, employees of acquired companies or our existing employees as a result of integration of new personnel;
|
|
•
|
our lack of, or limitations on our, control over the operations of our joint venture companies;
|
|
•
|
the difficulty of integrating operations, systems, and controls as a result of cultural, regulatory, systems, and operational differences;
|
28
|
•
|
in the case of foreign acquisitions and investments, the impact of particular economic, tax, currency, political, legal and regulatory risks associated with specific countries; and
|
|
•
|
the impact of known potential liabilities or liabilities that may be unknown, including as a result of inadequate internal controls, associated with the companies we acquired or in which we invested.
|
Our failure to be successful in addressing these risks or other problems encountered in connection with our past or future acquisitions and strategic investments could cause us to fail to realize the anticipated benefits of such acquisitions or investments, incur unanticipated liabilities, and harm our business generally.
The loss of key personnel or talent could disrupt our business and adversely affect our revenue.
Our business depends upon the continued efforts, abilities and expertise of our corporate and divisional executive teams and entertainment personalities. With respect to the Scripps Networks acquisition, our success depends in part upon our ability to retain key employees. Following the completion of a merger, like the Scripps Acquisition, current and prospective employees may experience uncertainty about their future roles with Discovery and choose to pursue other opportunities, which could have an adverse effect on Discovery. If key employees depart, the integration of Scripps Networks with Discovery may be more difficult and our business may be adversely affected. Additionally, we employ or contract with entertainment personalities who may have loyal audiences. These individuals are important to audience endorsement of our programs and other content. There can be no assurance that these individuals will remain with us or retain their current audiences. If we fail to retain key individuals or if our entertainment personalities lose their current audience base, our operations could be adversely affected.
US tax reform could adversely impact our international business and results of operations.
Recently enacted US tax reform could adversely impact our business and results of operations. On December 22, 2017, President Trump signed the 2017 Tax Cuts and Jobs Act ("TCJA"), which includes a broad range of tax reform regulations affecting businesses, including corporate tax rates, business deductions, and international tax provisions. Some of the changes, like the new tax on global intangible low-taxed income ("GILTI"), a deemed repatriation tax on previously deferred foreign income, has had an adverse impact to the results of our international operations. Others, like the reduction to the US corporate income tax rate from 35% to 21%, has had a positive impact to our overall tax liability. And some, like the base erosion and anti-abuse tax ("BEAT"), have resulted in little or no impact. Additional guidance continues to be issued through Treasury's proposed and final regulations and we continue to assess their impact.
Outside of the U.S., we continue to face the increasing complexity of operating in multiple non-US jurisdictions, many of which have increased scrutiny and have either changed, or plan to change, their international tax systems due to the Organisation for Economic Co-operation and Development’s (“OECD”) Base Erosion and Profit Shifting (“BEPS”) recommendations. The BEPS recommendations call for enhanced transparency and reporting relating to companies’ entity structures and transfer pricing policies. These have been implemented through various initiatives including the requirement for taxpayers to comply with global country-by-country reporting and the filing of a global master file as well as the introduction of the multilateral instrument (“MLI”) which allows taxing authorities to better take aim at multinational tax avoidance. We continue to address and comply with these compliance and reporting requirements.
Additional complexity has also arisen in state aid: state resources used to provide recipients an advantage on a selective basis that has or could distort competition and affect trade between European member states. In recent years the European Commission (“EC”) has increased their scrutiny on state aid and deviated from the historical European Union (“EU”) state aid practices. There is great uncertainty about the future of EU state aid practices based on the appeals of many significant EC rulings against multinational corporations that are currently being challenged. While any potential impact of these rulings is difficult to assess, we believe our transfer pricing analyses conducted pursuant to accepted OECD methodologies assist in mitigating risk associated with our past or current agreements.
In addition, the determination of our worldwide provision for income taxes and current and deferred tax assets and liabilities requires judgment and estimation. Our income taxes could also be materially adversely affected by earnings being lower than anticipated in jurisdictions that have lower statutory tax rates and higher than anticipated in jurisdictions that have higher statutory tax rates, by changes in the valuation of our deferred tax assets and liabilities, or by changes in worldwide tax laws, regulations, or accounting principles.
29
Risks Related to Our Debt
We have a significant amount of debt and may incur significant amounts of additional debt, which could adversely affect our financial health and our ability to react to changes in our business.
As of
December 31, 2018
, we had approximately
$17 billion
of consolidated debt, including capital leases, of which
$1.9 billion
is current. Our substantial level of indebtedness increases the possibility that we may be unable to generate cash sufficient to pay when due the principal of, interest on, or other amounts associated with our indebtedness. In addition, we have the ability to draw down our
$2.5 billion
revolving credit facility in the ordinary course, which would have the effect of increasing our indebtedness. We are also permitted, subject to certain restrictions under our existing indebtedness, to obtain additional long-term debt and working capital lines of credit to meet future financing needs. This would have the effect of increasing our total leverage.
Our substantial leverage could have significant negative consequences on our financial condition and results of operations, including:
|
•
|
impairing our ability to meet one or more of the financial ratio covenants contained in our debt agreements or to generate cash sufficient to pay interest or principal, which could result in an acceleration of some or all of our outstanding debt in the event that an uncured default occurs;
|
|
•
|
increasing our vulnerability to general adverse economic and market conditions;
|
|
•
|
limiting our ability to obtain additional debt or equity financing;
|
|
•
|
requiring the dedication of a substantial portion of our cash flow from operations to service our debt, thereby reducing the amount of cash flow available for other purposes;
|
|
•
|
requiring us to sell debt or equity securities or to sell some of our core assets, possibly on unfavorable terms, to meet payment obligations;
|
|
•
|
limiting our flexibility in planning for, or reacting to, changes in our business and the markets in which we compete; and
|
|
•
|
placing us at a possible competitive disadvantage with less leveraged competitors and competitors that may have better access to capital resources.
|
Our ability to incur debt and the use of our funds could be limited by the restrictive covenants in the loan agreement for our revolving credit facility.
The loan agreement for our revolving credit facility contains restrictive covenants, as well as requirements to comply with certain leverage and other financial maintenance tests. These covenants and requirements could limit our ability to take various actions, including incurring additional debt, guaranteeing indebtedness and engaging in various types of transactions, including mergers, acquisitions and sales of assets. These covenants could place us at a disadvantage compared to some of our competitors, who may have fewer restrictive covenants and may not be required to operate under these restrictions. Further, these covenants could have an adverse effect on our business by limiting our ability to take advantage of financing, mergers and acquisitions or other opportunities.
Risks Related to Corporate Structure
As a holding company, we could be unable to obtain cash in amounts sufficient to meet our financial obligations or other commitments.
Our ability to meet our financial obligations and other contractual commitments will depend upon our ability to access cash. We are a holding company, and our sources of cash include our available cash balances, net cash from the operating activities of our subsidiaries, any dividends and interest we may receive from our investments, availability under our credit facility or any credit facilities that we may obtain in the future and proceeds from any asset sales we may undertake in the future. The ability of our operating subsidiaries, including Discovery Communications, LLC, to pay dividends or to make other payments or advances to us will depend on their individual operating results and any statutory, regulatory or contractual restrictions, including restrictions under our credit facility, to which they may be or may become subject. Under the TCJA, we were subject to U.S. taxes for the deemed repatriation of certain cash balances held by foreign corporations. The Company intends to continue to permanently reinvest these funds outside of the U.S., and current plans do not demonstrate a need to repatriate them to fund our U.S. operations.
30
We have directors in common with those of Liberty Media Corporation (“Liberty Media”), Liberty Global plc (“Liberty Global”), Liberty Interactive Corporation (“Liberty Interactive”) and Liberty Broadband Corporation ("Liberty Broadband"), which may result in the diversion of business opportunities or other potential conflicts.
Liberty Media, Liberty Global, Liberty Interactive and Liberty Broadband (together, the "Liberty Entities") own interests in various U.S. and international companies, such as Charter Communications, Inc. ("Charter"), that have subsidiaries that own or operate domestic or foreign content services that may compete with the content services we offer. We have no rights in respect of U.S. or international content opportunities developed by or presented to the subsidiaries of any Liberty Entities, and the pursuit of these opportunities by such subsidiaries may adversely affect our interests and those of our stockholders. Because we and the Liberty Entities have overlapping directors, the pursuit of business opportunities may serve to intensify the conflicts of interest or appearance of conflicts of interest faced by the respective management teams. Our charter provides that none of our directors or officers will be liable to us or any of our subsidiaries for breach of any fiduciary duty by reason of the fact that such individual directs a corporate opportunity to another person or entity (including any Liberty Entities), for which such individual serves as a director or officer, or does not refer or communicate information regarding such corporate opportunity to us or any of our subsidiaries, unless (x) such opportunity was expressly offered to such individual solely in his or her capacity as a director or officer of us or any of our subsidiaries and (y) such opportunity relates to a line of business in which we or any of our subsidiaries is then directly engaged.
We have directors that are also related persons of Advance/Newhouse and that overlap with those of the Liberty Entities, which may lead to conflicting interests for those tasked with the fiduciary duties of our board.
Our twelve-person board of directors includes three designees of Advance/Newhouse, including Robert J. Miron, who was the Chairman of Advance/Newhouse until
December 31, 2010
, and Steven A. Miron, the Chief Executive Officer of Advance/Newhouse. In addition, our board of directors includes two persons who are currently members of the board of directors of Liberty Media, three persons who are currently members of the board of directors of Liberty Global, one person who is currently a member of the board of directors of Liberty Interactive, two persons who are currently members of the board of directors of Liberty Broadband and one person who is currently a member of the board of directors of Charter, of which Liberty Broadband owns an equity interest. John C. Malone is the Chairman of the boards of all of the Liberty Entities. The parent company of Advance/Newhouse and the Liberty Entities own interests in a range of media, communications and entertainment businesses.
Advance/Newhouse will elect three directors annually for so long as it owns a specified minimum amount of our Series A-1 convertible preferred stock. The Advance/Newhouse Series A-1 convertible preferred stock, which votes with our common stock on all matters other than the election of directors, represents approximately
24%
of the voting power of our outstanding shares.
The Series A-1 convertible preferred stock also grants Advance/Newhouse consent rights over a range of our corporate actions, including fundamental changes to our business, the issuance of additional capital stock, mergers and business combinations and certain acquisitions and dispositions.
None of the Liberty Entities own any interest in us. Mr. Malone beneficially owns stock of Liberty Media representing approximately
46%
of the aggregate voting power of its outstanding stock, owns shares representing approximately
28%
of the aggregate voting power of Liberty Global, shares representing approximately
38%
of the aggregate voting power of Liberty Interactive, shares representing approximately
46%
of the aggregate voting power of Liberty Broadband and shares representing approximately
21%
of the aggregate voting power (other than with respect to the election of the common stock directors) of our outstanding stock. Mr. Malone controls approximately
28%
of our aggregate voting power relating to the election of our eight common stock directors, assuming that the preferred stock owned by Advance/Newhouse has not been converted into shares of our common stock. Our directors who are also directors of the Liberty Entities own stock and stock incentives of the Liberty Entities and own our stock and stock incentives.
These ownership interests and/or business positions could create, or appear to create, potential conflicts of interest when these individuals are faced with decisions that could have different implications for us, Advance/Newhouse and/or the Liberty Entities. For example, there may be the potential for a conflict of interest when we, on the one hand, or Advance/Newhouse and/or one or more of the Liberty Entities, on the other hand, consider acquisitions and other corporate opportunities that may be suitable for the other.
The members of our board of directors have fiduciary duties to us and our stockholders. Likewise, those persons who serve in similar capacities at Advance/Newhouse or a Liberty Entity have fiduciary duties to those companies. Therefore, such persons may have conflicts of interest or the appearance of conflicts of interest with respect to matters involving or affecting both respective companies, and there can be no assurance that the terms of any transactions will be as favorable to us or our subsidiaries as would be the case in the absence of a conflict of interest.
31
It may be difficult for a third party to acquire us, even if such acquisition would be beneficial to our stockholders.
Certain provisions of our charter and bylaws may discourage, delay or prevent a change in control that a stockholder may consider favorable. These provisions include the following:
|
•
|
authorizing a capital structure with multiple series of common stock: a Series B that entitles the holders to ten votes per share, a Series A-1 that entitles the holders to one vote per share and a Series C that, except as otherwise required by applicable law, entitles the holders to no voting rights;
|
|
•
|
authorizing the Series A-1 convertible preferred stock with special voting rights, which prohibits us from taking any of the following actions, among others, without the prior approval of the holders of a majority of the outstanding shares of such stock:
|
|
•
|
increasing the number of members of the Board of Directors above ten;
|
|
•
|
making any material amendment to our charter or by-laws;
|
|
•
|
engaging in a merger, consolidation or other business combination with any other entity; and
|
|
•
|
appointing or removing our Chairman of the Board or our Chief Executive Officer;
|
|
•
|
authorizing the issuance of “blank check” preferred stock, which could be issued by our Board of Directors to increase the number of outstanding shares and thwart a takeover attempt;
|
|
•
|
classifying our common stock directors with staggered three-year terms and having three directors elected by the holders of the Series A convertible preferred stock, which may lengthen the time required to gain control of our Board of Directors;
|
|
•
|
limiting who may call special meetings of stockholders;
|
|
•
|
prohibiting stockholder action by written consent (subject to certain exceptions), thereby requiring stockholder action to be taken at a meeting of the stockholders;
|
|
•
|
establishing advance notice requirements for nominations of candidates for election to our Board of Directors or for proposing matters that can be acted upon by stockholders at stockholder meetings;
|
|
•
|
requiring stockholder approval by holders of at least
80%
of our voting power or the approval by at least
75%
of our Board of Directors with respect to certain extraordinary matters, such as a merger or consolidation, a sale of all or substantially all of our assets or an amendment to our charter;
|
|
•
|
requiring the consent of the holders of at least
75%
of the outstanding Series B common stock (voting as a separate class) to certain share distributions and other corporate actions in which the voting power of the Series B common stock would be diluted by, for example, issuing shares having multiple votes per share as a dividend to holders of Series A common stock; and
|
|
•
|
the existence of authorized and unissued stock which would allow our Board of Directors to issue shares to persons friendly to current management, thereby protecting the continuity of our management, or which could be used to dilute the stock ownership of persons seeking to obtain control of us.
|
We have also adopted a shareholder rights plan in order to encourage anyone seeking to acquire us to negotiate with our Board of Directors prior to attempting a takeover. While the plan is designed to guard against coercive or unfair tactics to gain control of us, the plan may have the effect of making more difficult or delaying any attempts by others to obtain control of us.
Holders of any single series of our common stock may not have any remedies if any action by our directors or officers has an adverse effect on only that series of common stock.
Principles of Delaware law and the provisions of our charter may protect decisions of our Board of Directors that have a disparate impact upon holders of any single series of our common stock. Under Delaware law, the Board of Directors has a duty to act with due care and in the best interests of all of our stockholders, including the holders of all series of our common stock. Principles of Delaware law established in cases involving differing treatment of multiple classes or series of stock provide that a board of directors owes an equal duty to all common stockholders regardless of class or series and does not have separate or additional duties to any group of stockholders. As a result, in some circumstances, our directors may be required to make a decision that is adverse to the holders of one series of common stock. Under the principles of Delaware law referred to above, stockholders may not be able to challenge these decisions if our Board of Directors is disinterested and adequately informed with respect to these decisions and acts in good faith and in the honest belief that it is acting in the best interests of all of our stockholders.
32
If Advance/Newhouse were to exercise its registration rights, it may cause a significant decline in our stock price, even if our business is doing well.
Advance/Newhouse has been granted registration rights covering all of the shares of common stock issuable upon conversion of the convertible preferred stock held by Advance/Newhouse. Advance/Newhouse’s Series A-1 convertible preferred stock is currently convertible into nine shares of our Series A common stock and Advance/Newhouse’s Series C-1 convertible preferred stock is convertible into
19.3648
shares of our Series C common stock, subject to certain anti-dilution adjustments. The registration rights, which are immediately exercisable, are transferable with the sale or transfer by Advance/Newhouse of blocks of shares representing 10% or more of the preferred stock it holds. The exercise of the registration rights, and subsequent sale of possibly large amounts of our common stock in the public market, could materially and adversely affect the market price of our common stock.
John C. Malone and Advance/Newhouse each have significant voting power with respect to corporate matters considered by our stockholders.
For corporate matters other than the election of directors, Mr. Malone and Advance/Newhouse each beneficially own shares of our stock representing approximately
21%
and
24%
, respectively, of the aggregate voting power represented by our outstanding stock. With respect to the election of directors, Mr. Malone controls approximately
28%
of the aggregate voting power relating to the election of the eight common stock directors (assuming that the convertible preferred stock owned by Advance/Newhouse (the “A/N Preferred Stock”) has not been converted into shares of our common stock). The A/N Preferred Stock carries with it the right to designate three preferred stock directors to our board (subject to certain conditions) but does not carry voting rights with respect to the election of the eight common stock directors. Also, under the terms of the A/N Preferred Stock, Advance/Newhouse has special voting rights as to certain enumerated matters, including material amendments to the restated charter and bylaws, fundamental changes in our business, mergers and other business combinations, certain acquisitions and dispositions and future issuances of capital stock. Although there is no stockholder agreement, voting agreement or any similar arrangement between Mr. Malone and Advance/Newhouse, by virtue of their respective holdings, Mr. Malone and Advance/Newhouse each have significant influence over the outcome of any corporate transaction or other matter submitted to our stockholders.
ITEM 1B. Unresolved Staff Comments.
None.
ITEM 2. Properties.
We own and lease approximately 3.93 million square feet of building space for the conduct of our businesses at 108 locations throughout the world, including properties acquired in connection with the Scripps Acquisition that comprise 1.53 million square feet and 39 locations. In the U.S. alone, we own and lease approximately 398,000 and 1.91 million square feet of building space, respectively, at 25 locations.
Principal locations in the U.S. include: (i) leased headquarters located at One Discovery Place, Silver Spring, Maryland, where approximately 543,000 square feet are used for corporate offices and general office space by our U.S. Networks and Other segments, (ii) 3 leased offices across New York, New York located at 850 3rd Avenue, 1180 6th Avenue and 75 9th Avenue where 481,000 square feet are collectively used primarily for sales by our U.S. Networks segment and creation of network television content by our U.S. Networks segment, as well as general office space, corporate offices, and certain executive offices, and a fourth office in New York, New York, where 362,000 square feet at 230 Park Avenue South are amidst planning for future occupancy as a global headquarters, (iii) 2 owned offices located at 9721 Sherrill Boulevard, Knoxville, Tennessee, where approximately 344,000 square feet are used for corporate offices, general office space and technology support space, (iv) leased general office space at 6505 Blue Lagoon Drive, Miami, Florida, where approximately 91,000 square feet are primarily used by our International Networks segment, (v) leased general office space located at 10100 Santa Monica Boulevard, Los Angeles, California, where approximately 64,000 square feet are primarily used by our U.S. Networks segment, and (vi) a leased origination facility at 45580 Terminal Drive, Sterling, Virginia, where approximately 54,000 square feet of space are used to manage the distribution of domestic network television content by our U.S. Networks segment.
We also own and lease approximately 299,000 and 1.32 million square feet of building space, respectively, at 83 locations outside of the U.S., including Poland, the U.K., France, Denmark, Norway, Italy, and Singapore. Included in the non-US office figures are approximately 138,000 square feet of building space used for office, production and post-production for Eurosport.
Each property is considered to be in good condition, adequate for its purpose, and suitably utilized according to the individual nature and requirements of the relevant operations. Our policy is to improve and replace property as considered appropriate to meet the needs of the individual operation.
33
On January 9, 2018, we issued a press release announcing a new real estate strategy with plans to relocate the Company's global headquarters from Silver Spring, Maryland to New York City in 2019. During the third quarter of 2018, the Company entered into a short-term sale-leaseback transaction for its Silver Spring property, which terminates March 31, 2019.
ITEM 3. Legal Proceedings.
The Company is party to various lawsuits and claims in the ordinary course of business. However, a determination as to the amount of the accrual required for such contingencies is highly subjective and requires judgments about future events. Although the outcome of these matters cannot be predicted with certainty and the impact of the final resolution of these matters on the Company's results of operations in a particular subsequent reporting period is not known, management does not believe that the resolution of these matters will have a material adverse effect on our consolidated financial position, future results of operations or liquidity.
ITEM 4. Mine Safety Disclosures.
Not
applicable.
34
Executive Officers of Discovery, Inc.
Pursuant to General Instruction G(3) to Form 10-K, the information regarding our executive officers required by Item 401(b) of Regulation S-K is hereby included in Part I of this report. The following table sets forth the name and date of birth of each of our executive officers and the office held by such officer as of
March 1, 2019
.
|
Name
|
|
Position
|
|
David M. Zaslav
Born January 15, 1960
|
|
President, Chief Executive Officer and a common stock director. Mr. Zaslav has served as our President and Chief Executive Officer since January 2007 and a common stock director since September 2008. Mr. Zaslav served as President, Cable & Domestic Television and New Media Distribution of NBC Universal, Inc. ("NBC"), a media and entertainment company, from May 2006 to December 2006. Mr. Zaslav served as Executive Vice President of NBC, and President of NBC Cable, a division of NBC, from October 1999 to May 2006. Mr. Zaslav is a member of the board of Sirius XM Radio Inc., Grupo Televisa S.A.B and LionsGate Entertainment Corp.
|
|
Gunnar Wiedenfels
Born September 6, 1977
|
|
Chief Financial Officer. Mr. Wiedenfels has served as our Chief Financial Officer since April 2017. Prior to joining Discovery, Mr. Wiedenfels served as Chief Financial Officer of ProSiebenSat.1 Media SE ("ProSieben") starting in 2015. Prior to that, he served as ProSieben's Deputy Chief Financial Officer from 2014 to 2015 and served as Chief Group Controller from 2013 to 2015. Previously, he served as ProSieben's Deputy Group Controller, responsible for group-wide budget planning, budget controlling, and management reporting and as Chief Financial Officer, National, where he had commercial responsibility for the group's German-speaking free TV segment. Before this, he worked as a management consultant and engagement manager at McKinsey & Company.
|
|
Jean-Briac Perrette
Born April 30,
1971
|
President and CEO of Discovery Networks International. Mr. Perrette became CEO of Discovery Networks International in June 2016 and President of Discovery Networks International in March 2014. Prior to that, Mr. Perrette served as our Chief Digital Officer from October 2011 to February 2014. Mr. Perrette served in a number of roles at NBC Universal from March 2000 to October 2011, with the last being President of Digital and Affiliate Distribution.
|
|
|
Adria Alpert Romm
Born March 2, 1955
|
|
Chief Human Resources and Global Diversity Officer. Ms. Romm has served as our Chief Human Resources and Global Diversity Officer since March 2014. Prior to that, Ms. Romm has served as our Senior Executive Vice President of Human Resources from March 2007 to February 2014. Ms. Romm served as Senior Vice President of Human Resources of NBC from 2004 to 2007. Prior to 2004, Ms. Romm served as a Vice President in Human Resources for the NBC TV network and NBC staff functions.
|
|
Bruce L. Campbell
Born November 26, 1967
|
|
Chief Development, Distribution & Legal Officer. Mr. Campbell became our Chief Distribution Officer in October 2015, Chief Development Officer in August 2010 and served as our General Counsel from December 2010 to April 2017. Mr. Campbell served as Digital Media Officer from August 2014 through October 2015. Prior to that, Mr. Campbell served as our President, Digital Media & Corporate Development from March 2007 through August 2010. Mr. Campbell also served as our corporate secretary from December 2010 to February 2012. Mr. Campbell served as Executive Vice President, Business Development of NBC from December 2005 to March 2007, and Senior Vice President, Business Development of NBC from January 2003 to November 2005.
|
|
Peter Faricy
Born September 7, 1966
|
Chief Executive Officer, Global Direct-To-Consumer. Mr. Faricy joined Discovery in September 2018. Prior to joining Discovery, Mr. Faricy served as Vice President of Amazon Marketplace and has over 20 years of leadership at the intersection of technology and media.
|
|
|
David Leavy
Born December 24, 1969
|
Chief Corporate Operations and Communications Officer. Mr. Leavy became Chief Corporate Operations and Communications Officer in March 2016. Prior to that, Mr. Leavy served as our Chief Communications Officer and Senior Executive Vice President, Corporate Marketing and Business Operations from August 2015 to March 2016. From December 2011 to August 2015, Mr. Leavy served as our Chief Communications Officer and Senior Executive Vice President, Corporate Marketing and Affairs. Prior to that, Mr. Leavy served as our Executive Vice President, Communications and Corporate Affairs and has served in a number of other roles at Discovery since joining in March 2000.
|
|
35
|
Name
|
|
Position
|
|
Savalle C. Sims
Born May 21, 1970
|
Executive Vice President and General Counsel. Ms. Sims became Executive Vice President and General Counsel in April 2017. Ms. Sims served as our Executive Vice President and Deputy General Counsel from December 2014 to April 2017. Prior to that, Ms. Sims served as our Senior Vice President, Litigation and Intellectual Property from August 2011 through December 2014. Prior to joining Discovery, Ms. Sims was a partner at the law firm of Arent Fox LLP.
|
|
|
Kurt T. Wehner
Born June 30, 1962
|
|
Executive Vice President and Chief Accounting Officer. Mr. Wehner joined the Company in September 2011 and has served as our Executive Vice President, Chief Accounting Officer since November 2012. Mr. Wehner was an Audit Partner at KPMG LLP from 2000 to 2011.
|
36
PART II
ITEM 5. Market for Registrant’s Common Equity, Related Stockholder Matters and Issuer Purchases of Equity Securities.
Our Series A common stock, Series B common stock and Series C common stock are listed and traded on The Nasdaq Global Select Market (“NASDAQ”) under the symbols “DISCA,” “DISCB” and “DISCK,” respectively.
As of
February 19, 2019
, there were approximately
1,217
,
68
and
1,816
record holders of our Series A common stock, Series B common stock and Series C common stock, respectively. These amounts do not include the number of shareholders whose shares are held of record by banks, brokerage houses or other institutions, but include each such institution as one shareholder.
We have not paid any cash dividends on our Series A common stock, Series B common stock or Series C common stock, and we have no present intention to do so. Payment of cash dividends, if any, will be determined by our Board of Directors after consideration of our earnings, financial condition and other relevant factors such as our credit facility's restrictions on our ability to declare dividends in certain situations.
37
Stock Performance Graph
The following graph sets forth the cumulative total shareholder return on our Series A common stock, Series B common stock and Series C common stock as compared with the cumulative total return of the companies listed in the Standard and Poor’s 500 Stock Index (“S&P 500 Index”) and a peer group of companies comprised of CBS Corporation Class B common stock, Scripps Network Interactive, Inc. (acquired by the Company in March 2018), Time Warner, Inc. (acquired by AT&T Inc. in June 2018), Twenty-First Century Fox, Inc. Class A common stock (News Corporation Class A Common Stock prior to June 2013), Viacom, Inc. Class B common stock and The Walt Disney Company. The graph assumes $100 originally invested on December 31, 2013 in each of our Series A common stock, Series B common stock and Series C common stock, the S&P 500 Index, and the stock of our peer group companies, including reinvestment of dividends, for the years ended December 31,
2014
,
2015
,
2016
,
2017
and
2018
. Two peer companies, Scripps Networks Interactive, Inc. and Time Warner, Inc., were acquired in 2018. The stock performance chart shows the peer group including Scripps Networks Interactive, Inc. and Time Warner, Inc. and excluding both acquired companies for the entire five year period.
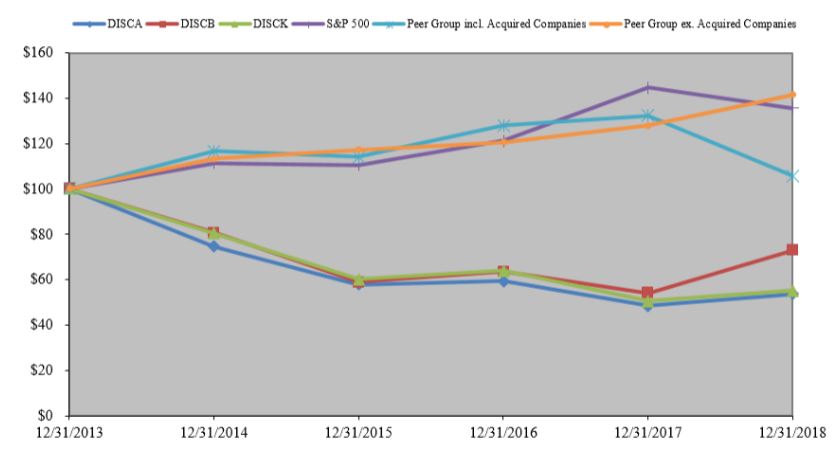
|
December 31,
2013 |
December 31,
2014
|
December 31,
2015
|
December 31,
2016
|
December 31,
2017
|
December 31,
2018
|
|||||||||||||||||||
|
DISCA
|
$
|
100.00
|
|
$
|
74.58
|
|
$
|
57.76
|
|
$
|
59.34
|
|
$
|
48.45
|
|
$
|
53.56
|
|
||||||
|
DISCB
|
$
|
100.00
|
|
$
|
80.56
|
|
$
|
58.82
|
|
$
|
63.44
|
|
$
|
53.97
|
|
$
|
72.90
|
|
||||||
|
DISCK
|
$
|
100.00
|
|
$
|
80.42
|
|
$
|
60.15
|
|
$
|
63.87
|
|
$
|
50.49
|
|
$
|
55.04
|
|
||||||
|
S&P 500
|
$
|
100.00
|
|
$
|
111.39
|
|
$
|
110.58
|
|
$
|
121.13
|
|
$
|
144.65
|
|
$
|
135.63
|
|
||||||
|
Peer Group incl. Acquired Companies
|
$
|
100.00
|
|
$
|
116.64
|
|
$
|
114.02
|
|
$
|
127.96
|
|
$
|
132.23
|
|
$
|
105.80
|
|
||||||
|
Peer Group ex. Acquired Companies
|
$
|
100.00
|
|
$
|
113.23
|
|
$
|
117.27
|
|
$
|
120.58
|
|
$
|
127.90
|
|
$
|
141.58
|
|
||||||
Equity Compensation Plan Information
Information regarding securities authorized for issuance under equity compensation plans will be set forth in our definitive Proxy Statement for our
2019
Annual Meeting of Stockholders under the caption “Securities Authorized for Issuance Under Equity Compensation Plans,” which is incorporated herein by reference.
38
ITEM 6. Selected Financial Data.
The table set forth below presents our selected financial information for each of the past five years (in millions, except per share amounts). The selected statement of operations information for each of the three years ended
December 31, 2018
and the selected balance sheet information as of
December 31, 2018
and
2017
have been derived from the audited consolidated financial statements included in Item 8, “Financial Statements and Supplementary Data,” and should be read in conjunction with the information in Item 7, “Management’s Discussion and Analysis of Financial Condition and Results of Operations” and other financial information included elsewhere in this Annual Report on Form 10-K. The selected statement of operations information for each of the two years ended December 31,
2015
and
2014
and the selected balance sheet information as of
December 31, 2016
,
2015
and
2014
have been derived from financial statements not included in this Annual Report on Form 10-K.
|
2018
|
2017
|
2016
|
2015
|
2014
|
||||||||||||||||
|
Selected Statement of Operations Information:
|
||||||||||||||||||||
|
Revenues
|
$
|
10,553
|
|
$
|
6,873
|
|
$
|
6,497
|
|
$
|
6,394
|
|
$
|
6,265
|
|
|||||
|
Operating income
|
1,934
|
|
713
|
|
2,058
|
|
1,985
|
|
2,061
|
|
||||||||||
|
Net income (loss)
|
681
|
|
(313
|
)
|
1,218
|
|
1,048
|
|
1,137
|
|
||||||||||
|
Net income (loss) available to Discovery, Inc.
|
594
|
|
(337
|
)
|
1,194
|
|
1,034
|
|
1,139
|
|
||||||||||
|
Basic earnings per share available to Discovery, Inc. Series A, B and C common stockholders:
|
||||||||||||||||||||
|
Net income (loss)
|
0.86
|
|
(0.59
|
)
|
1.97
|
|
1.59
|
|
1.67
|
|
||||||||||
|
Diluted earnings per share available to Discovery, Inc. Series A, B and C common stockholders:
|
||||||||||||||||||||
|
Net income (loss)
|
0.86
|
|
(0.59
|
)
|
1.96
|
|
1.58
|
|
1.66
|
|
||||||||||
|
Weighted average shares outstanding:
|
||||||||||||||||||||
|
Basic
|
498
|
|
384
|
|
401
|
|
432
|
|
454
|
|
||||||||||
|
Diluted
|
688
|
|
576
|
|
610
|
|
656
|
|
687
|
|
||||||||||
|
Selected Balance Sheet Information:
|
||||||||||||||||||||
|
Cash and cash equivalents
|
$
|
986
|
|
$
|
7,309
|
|
$
|
300
|
|
$
|
390
|
|
$
|
367
|
|
|||||
|
Total assets
|
32,550
|
|
22,555
|
|
15,672
|
|
15,864
|
|
16,014
|
|
||||||||||
|
Deferred income tax
|
1,811
|
|
319
|
|
467
|
|
556
|
|
588
|
|
||||||||||
|
Long-term debt:
|
|
|
|
|
||||||||||||||||
|
Current portion
|
1,860
|
|
30
|
|
82
|
|
119
|
|
1,107
|
|
||||||||||
|
Long-term portion
|
15,185
|
|
14,755
|
|
7,841
|
|
7,616
|
|
6,046
|
|
||||||||||
|
Total liabilities
|
22,033
|
|
17,532
|
|
10,262
|
|
10,172
|
|
9,663
|
|
||||||||||
|
Redeemable noncontrolling interests
|
415
|
|
413
|
|
243
|
|
241
|
|
747
|
|
||||||||||
|
Equity attributable to Discovery, Inc.
|
8,386
|
|
4,610
|
|
5,167
|
|
5,451
|
|
5,602
|
|
||||||||||
|
Total equity
|
$
|
10,102
|
|
$
|
4,610
|
|
$
|
5,167
|
|
$
|
5,451
|
|
$
|
5,604
|
|
|||||
|
•
|
On
March 6, 2018
, Discovery acquired Scripps Networks. Scripps Networks is a wholly-owned subsidiary whose total assets and total revenues represented approximately
55%
and
29%
, respectively, of the Company’s related consolidated financial statement amounts as of and for the year ended December 31, 2018. On
April 30, 2018
, Discovery sold an
88%
controlling equity stake in its Education Business to
Francisco Partners for a sale price of
$113 million
. The Company recorded a gain of
$84 million
based on net assets disposed of
$44 million
, including
$40 million
of goodwill. (See Note 3 to the accompanying consolidated financial statements.) For the year ended
December 31, 2018
, Discovery has incurred transaction and integration costs for the Scripps Networks acquisition of
$110 million
.
|
39
|
•
|
As of
December 31, 2017
, Discovery recognized a goodwill impairment charge totaling
$1.3 billion
for its European reporting unit. (See Note 8 to the accompanying consolidated financial statements.) On
November 30, 2017
, Discovery acquired a controlling interest in OWN from Harpo, increasing Discovery’s ownership stake from
49.50%
to
73.99%
. Discovery paid
$70 million
in cash and recognized a gain of
$33 million
to account for the difference between the carrying value and the fair value of the previously held
49.50%
equity interest. On September 25, 2017, Discovery acquired a
67.5%
controlling interest in MTG (then known as VTEN), a new joint venture with GoldenTree, in exchange for its contribution of the Velocity network. On
April 28, 2017
, Discovery sold Raw and Betty to All3Media and recorded a loss of
$4 million
upon disposition. (See Note 3 to the accompanying consolidated financial statements.) For the
year ended December 31, 2017
, Discovery has incurred transaction and integration costs for the Scripps Networks acquisition of
$79 million
, including the
$35 million
charge associated with the modification of Advance/Newhouse's preferred stock. (See Note 12 to the accompanying consolidated financial statements.) In conjunction with the Scripps Networks acquisition, Discovery executed a number of new derivative instruments which were settled during September 2017 resulting in a
$98 million
and
$12 million
loss in connection with interest rate and foreign exchange contracts, respectively. (See Note 10 to the accompanying consolidated financial statements.)
|
|
•
|
On
September 30, 2016
, Discovery recorded an other-than-temporary impairment of
$62 million
related to its investment in Lionsgate. On
December 2, 2016
, Discovery acquired a minority interest in and formed a new joint venture, Group Nine Media Inc. ("Group Nine Media"), in exchange for contributions of
$100 million
and Discovery's digital network businesses Seeker and SourceFed, resulting in a gain of
$50 million
upon deconsolidation of the businesses ("Group Nine Transaction"). As of
December 31, 2018
, Discovery owns a
42%
minority interest in Group Nine Media on an outstanding shares basis with a carrying value of
$212 million
. (See Note 4 to the accompanying consolidated financial statements.)
|
|
•
|
On
October 7, 2015
, Discovery recorded a loss of
$5 million
upon the deconsolidation of its Russian business following its contribution to a joint venture with a Russian media company, National Media Group (the "New Russian Business"). As part of the transaction, Discovery obtained a
20%
ownership interest in the New Russian Business, which is accounted for under the equity method of accounting. On
June 30, 2015
, Discovery sold its radio businesses in Northern Europe to Bauer Media Group for total consideration, net of cash disposed of
€72 million
(
$80 million
). The cumulative gain on the disposal is
$1 million
. Based on the final resolution and receipt of contingent consideration payable, Discovery recorded a pre-tax gain of
$13 million
for the
year ended December 31, 2016
. Discovery had previously recorded a
$12 million
loss including estimated contingent consideration as disclosed for the year ended
December 31, 2015
.
|
|
•
|
On
September 23, 2014
, we acquired an additional
10%
ownership interest in Discovery Family. The purchase increased our ownership interest from
50%
to
60%
. As a result, the accounting for Discovery Family was changed from an equity method investment to a consolidated subsidiary. (See Note 3 to the accompanying consolidated financial statements.) On
May 30, 2014
, Discovery acquired a controlling interest in Eurosport International by increasing Discovery’s ownership stake from
20%
to
51%
. As a result, as of that date, the accounting for Eurosport was changed from an equity method investment to a consolidated subsidiary. On
March 31, 2015
, Discovery acquired a controlling interest in Eurosport France increasing Discovery's ownership stake by
31%
upon the resolution of certain regulatory matters and began accounting for Eurosport France as a consolidated subsidiary. On
October 1, 2015
, Discovery acquired the remaining
49%
of Eurosport for
€491 million
(
$548 million
) upon TF1's exercise of its right to put. (See Note 11 to the accompanying consolidated financial statements.)
|
|
•
|
Balance sheet amounts for 2016, 2015 and 2014 have been adjusted to reclassify $86 million, $61 million, and $261 million, respectively, of deferred tax liabilities from current liabilities to non-current liabilities as a result of our adoption of ASU 2015-17. Additionally, balance sheet amounts for 2014 have been adjusted to reclassify $44 million of debt issuance costs from other noncurrent assets to noncurrent portion of debt as a result of our adoption of ASU 2015-03.
|
40
ITEM 7. Management’s Discussion and Analysis of Financial Condition and Results of Operations.
Management’s discussion and analysis of financial condition and results of operations is a supplement to and should be read in conjunction with the accompanying consolidated financial statements and related notes. This section provides additional information regarding our businesses, current developments, results of operations, cash flows, financial condition, contractual commitments and critical accounting policies.
BUSINESS OVERVIEW
We are a global media company that provides content across multiple distribution platforms, including pay-TV, free to air ("FTA") and broadcast television, authenticated applications, digital distribution arrangements and content licensing agreements. Our portfolio of networks includes prominent television brands such as Discovery Channel, our most widely distributed global brand, TLC, Animal Planet, Food Network, HGTV, ID, MotorTrend (previously known as Velocity and known as Turbo outside of the U.S.) and Eurosport, a leading sports entertainment pay-TV programmer across Europe and Asia. We operate production studios, and prior to the sale of our Education Business on April 30, 2018, we sold curriculum-based education products and services (See Note 3 to the accompanying consolidated financial statements.)
Our objectives are to invest in content for our networks to build viewership, optimize distribution revenue, capture advertising sales and create or reposition branded channels and businesses that can sustain long-term growth and occupy a desired content niche with strong consumer appeal. Our strategy is to maximize the distribution, ratings and profit potential of each of our branded networks. In addition to growing distribution and advertising revenues for our branded networks, we are extending content distribution across new platforms, including brand-aligned websites, on-line streaming, mobile devices, VOD and broadband channels, which provide promotional platforms for our television content and serve as additional outlets for advertising and distribution revenue. Audience ratings are a key driver in generating advertising revenue and creating demand on the part of cable television operators, DTH satellite operators, telecommunication service providers, and other content distributors, that deliver our content to their customers.
Our content spans genres including survival, exploration, sports, general entertainment, home, food and travel, heroes, adventure, crime and investigation, health and kids. We have an extensive library of high-definition content and own rights to much of our content and footage, which enables us to exploit our library to launch brands and services into new markets quickly. Our content can be re-edited and updated in a cost-effective manner to provide topical versions of subject matter that can be utilized around the world on a variety of platforms.
Although the Company utilizes certain brands and content globally, we classify our operations in two reportable segments: U.S. Networks, consisting principally of domestic television networks and digital distribution arrangements, and International Networks, consisting primarily of international television networks and digital distribution arrangements. In addition, Education and Other consists principally of a production studio, and prior to the sale of the Education Business on April 30, 2018, curriculum-based education products and services (See Note 3 to the accompanying consolidated financial statements.) Our segment presentation aligns with our management structure and the financial information management uses to make strategic and operating decisions, such as the allocation of resources and business performance assessments. For further discussion of our Company, segments in which we do business, and our content development activities and revenues, see our business overview set forth in Item 1, "Business" in this Annual Report on Form 10-K.
RESULTS OF OPERATIONS –
2018
vs.
2017
The discussion below compares our actual and pro forma combined results for the
twelve months ended December 31, 2018
to the
twelve months ended December 31, 2017
, respectively, as if the OWN and MTG transactions and the acquisition of Scripps Networks (collectively, "the Transactions") occurred on January 1, 2017. Management believes reviewing our actual operating results in addition to combined pro forma results is useful in identifying trends in, or reaching conclusions regarding, the overall operating performance of our businesses. This information has not been prepared in accordance with GAAP, is not intended to be a substitute for or superior to GAAP. Please see our consolidated financial statements included in this annual report on Form 10-K. Our combined U.S. Networks, International Networks and Corporate and Inter-Segment Eliminations pro forma information is based on the historical operating results of the respective businesses as applicable to each segment and includes adjustments directly attributable to the Transactions as if they had occurred on January 1, 2017, such as:
|
1.
|
The impact of the purchase price allocation to the fair value of assets, liabilities, and noncontrolling interests, such as intangible amortization;
|
|
2.
|
Adjustments to remove items associated with the Transactions that will not have a continuing impact on the combined entity, such as transaction costs and the impact of employee retention agreements; and
|
|
3.
|
Changes to align accounting policies
|
41
Adjustments do not include costs related to integration activities, cost savings or synergies that have been or may be achieved by the combined businesses. Pro forma amounts are not necessarily indicative of what our results would have been had we operated the acquired businesses since January 1, 2017 and should not be taken as indicative of the Company's future consolidated results of operations.
Actual amounts for the
years ended December 31, 2018 and 2017
include the results of operations for the Discovery and Scripps Networks, OWN and MTG businesses for the period since each respective transaction. Scripps Networks was acquired on
March 6, 2018
, OWN was consolidated on
November 30, 2017
and MTG was consolidated on
September 25, 2017
.
Consolidated Results of Operations –
2018
vs.
2017
Our consolidated results of operations for
2018
and
2017
were as follows (in millions).
|
Year Ended December 31,
|
||||||||||||||||||||||||||||||||
|
2018
|
2017
|
|||||||||||||||||||||||||||||||
|
Actual
|
Pro Forma Adjustments
|
Pro Forma Combined
|
Actual
|
Pro Forma Adjustments
|
Pro Forma Combined
|
Actual Change
|
Pro Forma Combined Change
|
|||||||||||||||||||||||||
|
$
|
%
|
$
|
%
|
|||||||||||||||||||||||||||||
|
Revenues:
|
||||||||||||||||||||||||||||||||
|
Distribution
|
$
|
4,538
|
|
$
|
178
|
|
$
|
4,716
|
|
$
|
3,474
|
|
$
|
1,090
|
|
$
|
4,564
|
|
$
|
1,064
|
|
31
|
%
|
$
|
152
|
|
3
|
%
|
||||
|
Advertising
|
5,514
|
|
425
|
|
5,939
|
|
3,073
|
|
2,677
|
|
5,750
|
|
2,441
|
|
79
|
%
|
189
|
|
3
|
%
|
||||||||||||
|
Other
|
501
|
|
20
|
|
521
|
|
326
|
|
150
|
|
476
|
|
175
|
|
54
|
%
|
45
|
|
9
|
%
|
||||||||||||
|
Total revenues
|
10,553
|
|
623
|
|
11,176
|
|
6,873
|
|
3,917
|
|
10,790
|
|
3,680
|
|
54
|
%
|
386
|
|
4
|
%
|
||||||||||||
|
Costs of revenues, excluding depreciation and amortization
|
3,935
|
|
205
|
|
4,140
|
|
2,656
|
|
1,391
|
|
4,047
|
|
1,279
|
|
48
|
%
|
93
|
|
2
|
%
|
||||||||||||
|
Selling, general and administrative
|
2,620
|
|
132
|
|
2,752
|
|
1,768
|
|
946
|
|
2,714
|
|
852
|
|
48
|
%
|
38
|
|
1
|
%
|
||||||||||||
|
Impairment of goodwill
|
—
|
|
—
|
|
—
|
|
1,327
|
|
—
|
|
1,327
|
|
(1,327
|
)
|
NM
|
|
(1,327
|
)
|
NM
|
|
||||||||||||
|
Depreciation and amortization
|
1,398
|
|
(76
|
)
|
1,322
|
|
330
|
|
1,241
|
|
1,571
|
|
1,068
|
|
NM
|
|
(249
|
)
|
(16
|
)%
|
||||||||||||
|
Restructuring and other charges
|
750
|
|
10
|
|
760
|
|
75
|
|
—
|
|
75
|
|
675
|
|
NM
|
|
685
|
|
NM
|
|
||||||||||||
|
(Gain) loss on disposition
|
(84
|
)
|
—
|
|
(84
|
)
|
4
|
|
—
|
|
4
|
|
(88
|
)
|
NM
|
|
(88
|
)
|
NM
|
|
||||||||||||
|
Total costs and expenses
|
8,619
|
|
271
|
|
8,890
|
|
6,160
|
|
3,578
|
|
9,738
|
|
2,459
|
|
40
|
%
|
(848
|
)
|
(9
|
)%
|
||||||||||||
|
Operating income
|
1,934
|
|
352
|
|
2,286
|
|
713
|
|
339
|
|
1,052
|
|
1,221
|
|
NM
|
|
1,234
|
|
NM
|
|
||||||||||||
|
Interest expense, net
|
(729
|
)
|
(475
|
)
|
(254
|
)
|
(53
|
)%
|
|
|
||||||||||||||||||||||
|
Loss on extinguishment of debt
|
—
|
|
(54
|
)
|
54
|
|
NM
|
|
|
|
||||||||||||||||||||||
|
Loss from equity investees, net
|
(63
|
)
|
(211
|
)
|
148
|
|
70
|
%
|
|
|
|
|||||||||||||||||||||
|
Other expense, net
|
(120
|
)
|
(110
|
)
|
(10
|
)
|
(9
|
)%
|
|
|
||||||||||||||||||||||
|
Income (loss) before income taxes
|
1,022
|
|
(137
|
)
|
1,159
|
|
NM
|
|
|
|
||||||||||||||||||||||
|
Income tax expense
|
(341
|
)
|
(176
|
)
|
(165
|
)
|
(94
|
)%
|
|
|
||||||||||||||||||||||
|
Net income (loss)
|
681
|
|
(313
|
)
|
994
|
|
NM
|
|
|
|
||||||||||||||||||||||
|
Net income attributable to noncontrolling interests
|
(67
|
)
|
—
|
|
(67
|
)
|
NM
|
|
|
|
||||||||||||||||||||||
|
Net income attributable to redeemable noncontrolling interests
|
(20
|
)
|
(24
|
)
|
4
|
|
17
|
%
|
|
|
||||||||||||||||||||||
|
Net income (loss) available to Discovery, Inc.
|
$
|
594
|
|
$
|
(337
|
)
|
$
|
931
|
|
NM
|
|
|
|
|||||||||||||||||||
NM - Not meaningful
42
Revenues
Distribution revenue consists principally of fees from affiliates for distributing our linear networks, supplemented by revenue earned from SVOD content licensing and other emerging forms of digital distribution. Distribution revenue
increase
d
31%
, primarily due to the impact of the Transactions. Excluding the impact of the Transactions and on a pro forma combined basis, excluding the impact of foreign currency fluctuations, distribution revenue
increase
d
3%
. Increases at International Networks were primarily driven by increases in subscribers to our linear networks and higher digital subscription revenues and increases in pricing in Europe and Latin America. Increases at U.S. Networks were principally attributable to an increase in contractual affiliate rates, which was partially offset by a decline in subscribers and, to a lesser extent, the timing of content deliveries under SVOD arrangements.
Advertising revenue is dependent upon a number of factors, including the stage of development of television markets, the number of subscribers to our channels, viewership demographics, the popularity of our content, our ability to sell commercial time over a group of channels, market demand, the mix in sales of commercial time between the upfront and scatter markets and economic conditions. These factors impact the pricing and volume of our advertising inventory. Advertising revenue
increase
d
79%
, primarily due to the impact of the Transactions. Excluding the impact of the Transactions and on a pro forma combined basis, excluding the impact of foreign currency fluctuations, advertising revenue
increase
d
3%
. The increases were due to continued monetization of our digital content offerings, an increase in pricing at U.S. Networks, and the Olympics.
Other revenue
increase
d
54%
, primarily due to the impact of the Transactions. Excluding the impact of the Transactions and on a pro forma combined basis, excluding the impact of foreign currency fluctuations, other revenue
increase
d
8%
. The increases were primarily due to sublicensing of Olympics sports rights to broadcast networks throughout Europe, partially offset by the Education and Other revenue that
decreased
66%
following the disposition of the Education Business on April 30, 2018. (See Note 3 to the accompanying consolidated financial statements.)
Revenue for our segments is discussed separately below under the heading “Segment Results of Operations.”
Costs of Revenues
Costs of revenues
increase
d
48%
, primarily due to the impact of the Transactions. The Company's principal component of costs of revenues is content expense. Content expense includes television series, television specials, films, sporting events and digital products. The costs of producing a content asset and bringing that asset to market consist of film costs, participation costs, exploitation costs and manufacturing costs. Content rights expense excluding the impact of foreign currency fluctuations was $
2.9 billion
and $
1.9 billion
for the
years ended December 31, 2018 and 2017
, respectively. Excluding the impact of the Transactions and foreign currency fluctuations, costs of revenue
increase
d
5%
. Excluding the impact of foreign currency fluctuations and on a pro forma combined basis, costs of revenues
increase
d
2%
. The increases were primarily due to spending on the Olympics at International Networks, partially offset by the impact of higher content impairment expenses recorded in the prior year at U.S. Networks and the impact of the disposition of the Education Business. On a pro forma combined basis and excluding the impacts of foreign currency fluctuations, content expense was
$3.0 billion
for each of the
years ended December 31, 2018 and 2017
. Content impairment is generally a component of costs of revenue on the consolidated statements of operations. However, during the
year ended December 31, 2018
, content impairments of $405 million were reflected as a component of restructuring and other charges as a result of the strategic programming changes following the acquisition of Scripps Networks. No content impairments were recorded as a component of restructuring and other charges during the
year ended December 31, 2017
.
Selling, General and Administrative
Selling, general and administrative expenses consist principally of employee costs, marketing costs, research costs, occupancy and back office support fees. Selling, general and administrative expenses
increase
d
48%
, primarily due to the impact of the Transactions. Excluding the impact of the Transactions, directly related third-party transaction and planned integration costs and foreign currency fluctuations, selling, general and administrative expenses
increase
d
6%
, primarily due to increased marketing spend at International Networks, increased share-based compensation expense, charge-backs to an equity method investee in the prior year that is now consolidated, and increases in technology costs and tax advisory fees, partially offset by decreases at Education and Other following the disposition of the Education Business on April 30, 2018. Excluding the impact of foreign currency fluctuations and on a pro forma combined basis, selling, general and administrative expenses were largely consistent with the prior year.
Impairment of Goodwill
No goodwill impairment expense was recorded during the
year ended December 31, 2018
. Goodwill impairment expense of $
1.3 billion
was recognized during the
year ended December 31, 2017
. (See Note 8 to the accompanying consolidated financial statements.)
43
Depreciation and Amortization
Depreciation and amortization expense includes depreciation of fixed assets and amortization of finite-lived intangible assets. Depreciation and amortization
increased
$1.1 billion
, primarily due to the impact of the Transactions. On a pro forma combined basis, depreciation and amortization expense decreased
$249 million
, primarily due to pro forma amortization in 2017 related to the ad revenue backlog intangible, which had a one-year useful life and was fully amortized on a pro forma basis in 2017.
Restructuring and Other Charges
Restructuring and other charges
increased
$
675 million
, primarily as a result of content impairments associated with changes in programming strategies, involuntary severance actions associated with the integration of Scripps Networks, costs associated with the termination of long-term programming arrangements, and lease exit costs. (See Note 17 to the accompanying consolidated financial statements.) On a pro forma combined basis, restructuring and other charges
increased
$
685 million
. We expect to incur additional restructuring and integration expenses related to employee and contract terminations, relocation from the Company's Silver Spring headquarters to New York City, and content costs.
(Gain) Loss on Disposition
We recorded an
$84 million
gain during the
year ended December 31, 2018
due to the sale of a controlling stake in the Education Business on April 30, 2018, compared with a loss of
$4 million
for the
year ended December 31, 2017
due to the disposition of the Raw and Betty production studios. (See Note 3 to the accompanying consolidated financial statements.)
Interest Expense
Interest expense increased $
254 million
, primarily due to interest accrued on higher debt balances, including the senior notes issued on
September 21, 2017
and term loans outstanding from
March 6, 2018
through September 30, 2018. The senior notes and term loans were used to effect the acquisition of Scripps Networks. (See Note 9 to the accompanying consolidated financial statements.)
Loss on Extinguishment of Debt
On
March 13, 2017
, we issued new senior notes in an aggregate principal amount of
$650 million
and used the proceeds to fund the repurchase of
$600 million
of combined aggregate principal amount of our then-outstanding senior notes through a cash tender offer that closed on
March 13, 2017
. As a result, we recognized a
$54 million
loss on extinguishment of debt, which included
$50 million
for premiums to par value,
$2 million
of non-cash write-offs of unamortized deferred financing costs,
$1 million
for the write-off of the original issue discount of these senior notes and
$1 million
accrued for other third-party fees. (See Note 9 to the accompanying consolidated financial statements.)
Loss from equity investees, net
The loss from our equity method investees decreased $
148 million
for the
year ended December 31, 2018
, primarily due to a reduction in losses from investments in limited liability companies that sponsor renewable energy projects related to solar energy, and to a lesser extent, inclusion of equity earnings as a result of the acquisition of Scripps Networks, partially offset by the absence of earnings from the Company's equity method investment in OWN and impairments of
$29 million
. (See Note 4 to the accompanying consolidated financial statements.)
Other Expense, Net
The table below presents the details of other income (expense), net (in millions).
|
Year Ended December 31,
|
||||||||
|
2018
|
2017
|
|||||||
|
Foreign currency losses, net
|
$
|
(93
|
)
|
$
|
(83
|
)
|
||
|
Gains (losses) on derivative instruments
|
50
|
|
(82
|
)
|
||||
|
Change in the value of common stock investments with readily determinable fair value
|
(88
|
)
|
—
|
|
||||
|
Remeasurement gain on previously held equity interest
|
—
|
|
33
|
|
||||
|
Interest income
|
15
|
|
21
|
|
||||
|
Other (expense) income, net
|
(4
|
)
|
1
|
|
||||
|
Total other income (expense), net
|
$
|
(120
|
)
|
$
|
(110
|
)
|
||
44
Total other expense, net increased $
10 million
in 2018 compared to 2017. During the
year ended December 31, 2018
we recorded losses on common stock investments with readily determinable fair value due to the adoption of the recognition and measurement of financial instruments guidance on January 1, 2018, which requires us to record gains and losses on equity investments with readily determinable fair values in other expense, net. Previously, unrealized gains and losses were recorded in other comprehensive income. The increase in foreign currency losses for the year ended December 31, 2018 was mostly related to remeasurement of net monetary assets and transactions associated with the Polish Zloty, the Euro and other European currencies, partially offset by a reduction in losses associated with the British Pound. We recorded gains on derivative instruments for the
year ended December 31, 2018
compared to losses for the
year ended December 31, 2017
, primarily due to losses of $98 million recorded during the prior year on interest rate contracts used to economically hedge the pricing for the issuance of a portion of the dollar-denominated senior notes on September 21, 2017 and, to a lesser extent, gains recorded in the current year on the equity collar used to mitigate the risk of market fluctuations with respect to
50%
of the Lionsgate shares held by the Company and foreign currency swaps. (See Note 10 to the accompanying consolidated financial statements.) On November 30, 2017, the Company acquired from Harpo a controlling interest in OWN. We recognized a remeasurement gain of $
33 million
to account for the difference between the carrying value and the fair value of previously held 49.50% equity interest. (See Note 3 to the accompanying consolidated financial statements.)
Income Taxes
The following table reconciles the Company's effective income tax rate to the U.S. federal statutory income tax rate.
|
Year Ended December 31,
|
||||||||||||||
|
2018
|
2017
|
|||||||||||||
|
U.S. federal statutory income tax provision
|
$
|
215
|
|
21
|
%
|
$
|
(48
|
)
|
35
|
%
|
||||
|
State and local income taxes, net of federal tax benefit
|
10
|
|
1
|
%
|
23
|
|
(18
|
)%
|
||||||
|
Effect of foreign operations
|
111
|
|
11
|
%
|
(35
|
)
|
25
|
%
|
||||||
|
Domestic production activity deductions
|
—
|
|
—
|
%
|
(52
|
)
|
39
|
%
|
||||||
|
Change in uncertain tax positions
|
37
|
|
3
|
%
|
60
|
|
(44
|
)%
|
||||||
|
Preferred stock modification
|
—
|
|
—
|
%
|
12
|
|
(9
|
)%
|
||||||
|
Goodwill impairment
|
—
|
|
—
|
%
|
458
|
|
(334
|
)%
|
||||||
|
Renewable energy investments tax credits (See Note 4)
|
(12
|
)
|
(1
|
)%
|
(195
|
)
|
142
|
%
|
||||||
|
Noncontrolling interest adjustment
|
(18
|
)
|
(2
|
)%
|
—
|
|
—
|
%
|
||||||
|
U.S. Legislative Changes
|
(19
|
)
|
(2
|
)%
|
(43
|
)
|
32
|
%
|
||||||
|
Non-deductible compensation
|
20
|
|
2
|
%
|
—
|
|
|
—
|
%
|
|||||
|
Other, net
|
(3
|
)
|
—
|
%
|
(4
|
)
|
4
|
%
|
||||||
|
Income tax expense
|
$
|
341
|
|
33
|
%
|
$
|
176
|
|
(128
|
)%
|
||||
Income tax expense was
$341 million
and
$176 million
and our effective tax rate was
33%
and
(128)%
for
2018
and
2017
, respectively.
During 2018, the increase in the income tax expense was primarily attributable to an increase in income, a reduction in benefits from investment tax credits from our renewable energy investments, the effect of foreign operations, which included the establishment of valuation allowances and write-offs of deferred tax assets, and elimination of the domestic production activity deduction, partially offset by the lower U.S. Federal statutory income tax rate, a decrease in expense for uncertain tax positions, and a tax benefit from TCJA rate change on the deferred tax liability recomputation as a result of U.S. legislative changes that extended the accelerated deduction of qualified film productions.
In connection with the acquisition of Scripps Networks, we recorded reserves in purchase accounting totaling $110 million for foreign tax matters claimed by tax authorities that are currently pending resolution. After the purchase accounting measurement period closes on March 5, 2019, any adjustment to these estimated amounts resulting from their resolution will affect net income in the period resolved.
45
Segment Results of Operations –
2018
vs.
2017
We evaluate the operating performance of our operating segments based on financial measures such as revenues and Adjusted OIBDA. Adjusted OIBDA is defined as operating income excluding: (i) mark-to-market share-based compensation, (ii) depreciation and amortization, (iii) restructuring and other charges, (iv) certain impairment charges, (v) gains and losses on business and asset dispositions, (vi) certain inter-segment eliminations related to production studios, and (vii) third-party transaction costs directly related to the acquisition and integration of Scripps Networks. We use this measure to assess the operating results and performance of our segments, perform analytical comparisons, identify strategies to improve performance, and allocate resources to each segment. We believe Adjusted OIBDA is relevant to investors because it allows them to analyze the operating performance of each segment using the same metric management uses. We exclude mark-to-market share-based compensation, restructuring and other charges, certain impairment charges, gains and losses on business and asset dispositions, and Scripps Networks acquisition and integration costs from the calculation of Adjusted OIBDA due to their impact on comparability between periods. We also exclude the depreciation of fixed assets and amortization of intangible assets and deferred launch incentives as these amounts do not represent cash payments in the current reporting period. Certain corporate expenses and inter-segment eliminations related to production studios are excluded from segment results to enable executive management to evaluate segment performance based upon the decisions of segment executives.
Adjusted OIBDA should be considered in addition to, but not a substitute for, operating income, net income and other measures of financial performance reported in accordance with U.S. generally accepted accounting principles (“GAAP”).
Additional financial information for our segments and geographical areas in which we do business is discussed in Note 23 to the accompanying consolidated financial statements included in Item 8, “Financial Statements and Supplementary Data” in this Annual Report on Form 10-K.
The table below presents our Adjusted OIBDA by segment, with a reconciliation of consolidated net income available to Discovery, Inc. to total Adjusted OIBDA (in millions).
|
Year Ended December 31,
|
|||||||||||
|
2018
|
2017
|
% Change
|
|||||||||
|
Net income (loss) available to Discovery, Inc.
|
$
|
594
|
|
$
|
(337
|
)
|
NM
|
|
|||
|
Net income attributable to redeemable noncontrolling interests
|
20
|
|
24
|
|
(17
|
)%
|
|||||
|
Net income attributable to noncontrolling interests
|
67
|
|
—
|
|
NM
|
|
|||||
|
Income tax expense
|
341
|
|
176
|
|
94
|
%
|
|||||
|
Income (loss) before income taxes
|
1,022
|
|
(137
|
)
|
NM
|
|
|||||
|
Other expense, net
|
120
|
|
110
|
|
9
|
%
|
|||||
|
Loss from equity investees, net
|
63
|
|
211
|
|
(70
|
)%
|
|||||
|
Loss on extinguishment of debt
|
—
|
|
54
|
|
NM
|
|
|||||
|
Interest expense, net
|
729
|
|
475
|
|
53
|
%
|
|||||
|
Operating income
|
1,934
|
|
713
|
|
NM
|
|
|||||
|
(Gain) loss on disposition
|
(84
|
)
|
4
|
|
NM
|
|
|||||
|
Restructuring and other charges
|
750
|
|
75
|
|
NM
|
|
|||||
|
Depreciation and amortization
|
1,398
|
|
330
|
|
NM
|
|
|||||
|
Impairment of goodwill
|
—
|
|
1,327
|
|
NM
|
|
|||||
|
Mark-to-market share-based compensation
|
31
|
|
3
|
|
NM
|
|
|||||
|
Scripps Networks transaction and integration costs
|
110
|
|
79
|
|
39
|
%
|
|||||
|
Total Adjusted OIBDA
|
$
|
4,139
|
|
$
|
2,531
|
|
64
|
%
|
|||
|
Adjusted OIBDA:
|
|||||||||||
|
U.S. Networks
|
3,500
|
|
2,026
|
|
73
|
%
|
|||||
|
International Networks
|
1,077
|
|
859
|
|
25
|
%
|
|||||
|
Education and Other
|
3
|
|
6
|
|
(50
|
)%
|
|||||
|
Corporate and inter-segment eliminations
|
(441
|
)
|
(360
|
)
|
(23
|
)%
|
|||||
|
Total Adjusted OIBDA
|
$
|
4,139
|
|
$
|
2,531
|
|
64
|
%
|
|||
46
The table below presents the calculation of total Adjusted OIBDA (in millions).
|
Year Ended December 31,
|
|||||||||||
|
2018
|
2017
|
% Change
|
|||||||||
|
Revenue:
|
|||||||||||
|
U.S. Networks
|
$
|
6,350
|
|
$
|
3,434
|
|
85
|
%
|
|||
|
International Networks
|
4,149
|
|
3,281
|
|
26
|
%
|
|||||
|
Education and Other
|
54
|
|
158
|
|
(66
|
)%
|
|||||
|
Corporate and inter-segment eliminations
|
—
|
|
—
|
|
—
|
%
|
|||||
|
Total revenue
|
10,553
|
|
6,873
|
|
54
|
%
|
|||||
|
Costs of revenues, excluding depreciation and amortization
|
(3,935
|
)
|
(2,656
|
)
|
(48
|
)%
|
|||||
|
Selling, general and administrative
(a)
|
(2,479
|
)
|
(1,686
|
)
|
(47
|
)%
|
|||||
|
Adjusted OIBDA
|
$
|
4,139
|
|
$
|
2,531
|
|
64
|
%
|
|||
(a)
Selling, general and administrative expenses exclude mark-to-market share-based compensation and Scripps Networks transaction and integration costs due to their impact on comparability between periods.
Effective January 1, 2019, our definition of Adjusted OIBDA was modified to exclude all share-based compensation, whereas only mark-to-market share-based compensation is excluded for each of the periods presented herein. During 2018, the Company began granting a higher percentage of equity classified awards (in lieu of liability classified awards, which require mark-to-market accounting) under its stock incentive plans, and expects to continue this action in future periods. Since most equity classified awards are non-cash expenses not entirely under management control, the Company has elected to exclude all share-based compensation from Adjusted OIBDA beginning in 2019. The revised definition of Adjusted OIBDA will be used by our chief operating decision maker in evaluating segment performance in 2019.
The following table presents Adjusted OIBDA as historically reported and under the revised definition:
|
Year Ended December 31, 2018
|
U.S. Networks
|
International Networks
|
Education and Other
|
Corporate and inter-segment eliminations
|
Total
|
|||||||||||||||
|
Adjusted OIBDA, as reported
|
$
|
3,500
|
|
|
$
|
1,077
|
|
|
$
|
3
|
|
|
$
|
(441
|
)
|
|
$
|
4,139
|
|
|
|
Deduct: Mark-to-market share-based compensation
|
(1
|
)
|
|
—
|
|
|
—
|
|
|
32
|
|
|
31
|
|
||||||
|
Add: Total share-based compensation
|
(1
|
)
|
|
—
|
|
|
—
|
|
|
81
|
|
|
80
|
|
||||||
|
Adjusted OIBDA, as revised
|
$
|
3,500
|
|
|
$
|
1,077
|
|
|
$
|
3
|
|
|
$
|
(392
|
)
|
|
$
|
4,188
|
|
|
|
Year Ended December 31, 2017
|
||||||||||||||||||||
|
Adjusted OIBDA, as reported
|
$
|
2,026
|
|
|
$
|
859
|
|
|
$
|
6
|
|
|
$
|
(360
|
)
|
$
|
2,531
|
|
||
|
Deduct: Mark-to-market share-based compensation
|
—
|
|
|
—
|
|
|
—
|
|
|
3
|
|
3
|
|
|||||||
|
Add: Total share-based compensation
|
—
|
|
|
—
|
|
|
—
|
|
|
39
|
|
|
39
|
|
||||||
|
Adjusted OIBDA, as revised
|
$
|
2,026
|
|
|
$
|
859
|
|
|
$
|
6
|
|
|
$
|
(324
|
)
|
|
$
|
2,567
|
|
|
|
Year Ended December 31, 2016
|
||||||||||||||||||||
|
Adjusted OIBDA, as reported
|
$
|
1,922
|
|
|
$
|
835
|
|
|
$
|
(10
|
)
|
|
$
|
(334
|
)
|
|
$
|
2,413
|
|
|
|
Deduct: Mark-to-market share-based compensation
|
—
|
|
|
—
|
|
|
—
|
|
|
38
|
|
|
38
|
|
||||||
|
Add: Total share-based compensation
|
—
|
|
|
—
|
|
|
—
|
|
|
69
|
|
|
69
|
|
||||||
|
Adjusted OIBDA, as revised
|
$
|
1,922
|
|
|
$
|
835
|
|
|
$
|
(10
|
)
|
|
$
|
(303
|
)
|
|
$
|
2,444
|
|
|
47
U.S. Networks
The table below presents, for our U.S. Networks segment, revenues by type, certain operating expenses, Adjusted OIBDA and a reconciliation of Adjusted OIBDA to operating income (in millions).
|
|
Year Ended December 31,
|
|||||||||||||||||||||||||||||||
|
|
2018
|
2017
|
||||||||||||||||||||||||||||||
|
Actual
|
Pro Forma Adjustments
|
Pro Forma Combined
|
Actual
|
Pro Forma Adjustments
|
Pro Forma Combined
|
Actual Change
|
Pro Forma Combined Change
|
|||||||||||||||||||||||||
|
Revenues:
|
$
|
%
|
$
|
%
|
||||||||||||||||||||||||||||
|
Distribution
|
$
|
2,456
|
|
$
|
156
|
|
$
|
2,612
|
|
$
|
1,612
|
|
$
|
974
|
|
$
|
2,586
|
|
$
|
844
|
|
52
|
%
|
$
|
26
|
|
1
|
%
|
||||
|
Advertising
|
3,749
|
|
356
|
|
4,105
|
|
1,740
|
|
2,261
|
|
4,001
|
|
2,009
|
|
NM
|
|
104
|
|
3
|
%
|
||||||||||||
|
Other
|
145
|
|
7
|
|
152
|
|
82
|
|
73
|
|
155
|
|
63
|
|
77
|
%
|
(3
|
)
|
(2
|
)%
|
||||||||||||
|
Total revenues
|
6,350
|
|
519
|
|
6,869
|
|
3,434
|
|
3,308
|
|
6,742
|
|
2,916
|
|
85
|
%
|
127
|
|
2
|
%
|
||||||||||||
|
Costs of revenues, excluding depreciation and amortization
|
(1,748
|
)
|
(153
|
)
|
(1,901
|
)
|
(917
|
)
|
(1,087
|
)
|
(2,004
|
)
|
(831
|
)
|
(91
|
)%
|
103
|
|
5
|
%
|
||||||||||||
|
Selling, general and administrative
|
(1,102
|
)
|
(111
|
)
|
(1,213
|
)
|
(491
|
)
|
(758
|
)
|
(1,249
|
)
|
(611
|
)
|
NM
|
|
36
|
|
3
|
%
|
||||||||||||
|
Total Adjusted OIBDA
|
3,500
|
|
255
|
|
3,755
|
|
2,026
|
|
1,463
|
|
3,489
|
|
1,474
|
|
73
|
%
|
266
|
|
8
|
%
|
||||||||||||
|
Mark-to-market share-based compensation
|
1
|
|
—
|
|
1
|
|
—
|
|
1
|
|
1
|
|
1
|
|
NM
|
|
—
|
|
—
|
%
|
||||||||||||
|
Depreciation and amortization
|
(985
|
)
|
95
|
|
(890
|
)
|
(35
|
)
|
(1,132
|
)
|
(1,167
|
)
|
(950
|
)
|
NM
|
|
277
|
|
24
|
%
|
||||||||||||
|
Restructuring and other charges
|
(322
|
)
|
(5
|
)
|
(327
|
)
|
(18
|
)
|
—
|
|
(18
|
)
|
(304
|
)
|
NM
|
|
(309
|
)
|
NM
|
|
||||||||||||
|
Scripps Networks transaction and integration costs
|
(14
|
)
|
—
|
|
(14
|
)
|
—
|
|
—
|
|
—
|
|
(14
|
)
|
NM
|
|
(14
|
)
|
NM
|
|
||||||||||||
|
Inter-segment eliminations
|
2
|
|
5
|
|
7
|
|
(12
|
)
|
27
|
|
15
|
|
14
|
|
NM
|
|
(8
|
)
|
(53
|
)%
|
||||||||||||
|
Operating income
|
$
|
2,182
|
|
$
|
350
|
|
$
|
2,532
|
|
$
|
1,961
|
|
$
|
359
|
|
$
|
2,320
|
|
$
|
221
|
|
11
|
%
|
$
|
212
|
|
9
|
%
|
||||
Revenues
Distribution revenue
increase
d
52%
, primarily due to the impact of the Transactions. Excluding the impact of the Transactions and on a pro forma combined basis, distribution revenue
increase
d
1%
reflecting the impact of an increase in contractual affiliate rates, partially offset by a decline in subscribers and to a lesser extent, the timing of content deliveries under SVOD arrangements. On a pro forma combined basis, total portfolio subscribers for December 2018 were
4%
lower than December 2017 and subscribers to our fully distributed networks
were consistent with the prior year
, due to additional carriage toward the end of the year, which offset the general trend of subscriber declines.
Advertising revenue
increase
d $
2.0 billion
, primarily due to the impact of the Transactions. Excluding the impact of the Transactions and on a pro forma combined basis, advertising revenue
increase
d
3%
. The increases were due to the continued monetization of our digital content offerings and an increase in pricing, partially offset by the impact of audience declines on our linear networks.
Other revenue
increase
d
77%
, primarily due to the impact of the Transactions. Excluding the impact of the Transactions, other revenue
decrease
d
27%
due to lower program and merchandising sales. On a pro forma combined basis, other revenue in 2018 was largely consistent with 2017.
Costs of Revenues
Costs of revenues
increase
d
91%
, primarily due to the impact of the Transactions. Excluding the impact of the Transactions, costs of revenues
decrease
d
4%
and on a pro forma combined basis, costs of revenues
decrease
d
5%
. The decreases were primarily due to higher content impairment expenses recorded in costs of revenues in 2017. Content expense was $
1.5 billion
and $
776 million
for the
years ended December 31, 2018 and 2017
, respectively. Pro forma combined content expense was $
1.6 billion
and $
1.7 billion
for the
years ended December 31, 2018 and 2017
, respectively. Content impairment is generally a component of costs of revenue on the consolidated statements of operations. However, during the
year ended December 31, 2018
, content impairments of $221 million were reflected as a component of restructuring and other charges as a result of the strategic programming changes following the acquisition of Scripps Networks. No content impairments were recorded as a component of restructuring and other charges during the
year ended December 31, 2017
.
48
Selling, General and Administrative
Selling, general and administrative expenses
increase
d $
611 million
in 2018 compared to 2017, primarily due to the impact of the Transactions. Excluding the impact of the Transactions, selling, general and administrative expenses
increase
d
4%
as expenses in the prior year were reduced by charge-backs to an equity method investee that is now consolidated. On a pro forma combined basis, selling, general and administrative expenses
decrease
d
3%
, primarily as a result of reductions in personnel costs due to restructuring.
Adjusted OIBDA
Adjusted OIBDA
increase
d
73%
, primarily due to the impact of the Transactions. Excluding the impact of the Transactions, Adjusted OIBDA
increase
d
3%
driven by an increase in revenues and decrease in costs of revenues, partially offset by an increase in selling, general and administrative expenses. On a pro forma combined basis, Adjusted OIBDA
increase
d
8%
, driven by an increase in revenues combined with decreases in costs of revenues and selling, general and administrative expenses.
International Networks
The following table presents, for our International Networks segment, revenues by type, certain operating expenses, Adjusted OIBDA and a reconciliation of Adjusted OIBDA to operating income (in millions).
|
|
Year Ended December 31,
|
|
||||||||||||||||||||||||||||||
|
|
2018
|
2017
|
||||||||||||||||||||||||||||||
|
Actual
|
Pro Forma Adjustments
|
Pro Forma Combined
|
Actual
|
Pro Forma Adjustments
|
Pro Forma Combined
|
Actual Change
|
Pro Forma Combined Change
|
|||||||||||||||||||||||||
|
Revenues:
|
$
|
%
|
$
|
%
|
||||||||||||||||||||||||||||
|
Distribution
|
$
|
2,082
|
|
$
|
22
|
|
$
|
2,104
|
|
$
|
1,862
|
|
$
|
116
|
|
$
|
1,978
|
|
$
|
220
|
|
12
|
%
|
$
|
126
|
|
6
|
%
|
||||
|
Advertising
|
1,765
|
|
69
|
|
1,834
|
|
1,332
|
|
416
|
|
1,748
|
|
433
|
|
33
|
%
|
86
|
|
5
|
%
|
||||||||||||
|
Other
|
302
|
|
13
|
|
315
|
|
87
|
|
77
|
|
164
|
|
215
|
|
NM
|
|
151
|
|
92
|
%
|
||||||||||||
|
Total revenues
|
4,149
|
|
104
|
|
4,253
|
|
3,281
|
|
609
|
|
3,890
|
|
868
|
|
26
|
%
|
363
|
|
9
|
%
|
||||||||||||
|
Costs of revenues, excluding depreciation and amortization
|
(2,169
|
)
|
(52
|
)
|
(2,221
|
)
|
(1,677
|
)
|
(304
|
)
|
(1,981
|
)
|
(492
|
)
|
(29
|
)%
|
(240
|
)
|
(12
|
)%
|
||||||||||||
|
Selling, general and administrative
|
(903
|
)
|
(27
|
)
|
(930
|
)
|
(745
|
)
|
(150
|
)
|
(895
|
)
|
(158
|
)
|
(21
|
)%
|
(35
|
)
|
(4
|
)%
|
||||||||||||
|
Total Adjusted OIBDA
|
1,077
|
|
25
|
|
1,102
|
|
859
|
|
155
|
|
1,014
|
|
218
|
|
25
|
%
|
88
|
|
9
|
%
|
||||||||||||
|
Depreciation and amortization
|
(315
|
)
|
(19
|
)
|
(334
|
)
|
(222
|
)
|
(107
|
)
|
(329
|
)
|
(93
|
)
|
(42
|
)%
|
(5
|
)
|
(2
|
)%
|
||||||||||||
|
Impairment of goodwill
|
—
|
|
—
|
|
—
|
|
(489
|
)
|
—
|
|
(489
|
)
|
489
|
|
NM
|
|
489
|
|
NM
|
|
||||||||||||
|
Restructuring and other charges
|
(307
|
)
|
(2
|
)
|
(309
|
)
|
(42
|
)
|
—
|
|
(42
|
)
|
(265
|
)
|
NM
|
|
(267
|
)
|
NM
|
|
||||||||||||
|
Scripps Networks transaction and integration costs
|
(3
|
)
|
—
|
|
(3
|
)
|
—
|
|
—
|
|
—
|
|
(3
|
)
|
NM
|
|
(3
|
)
|
NM
|
|
||||||||||||
|
Inter-segment eliminations
|
(18
|
)
|
(4
|
)
|
(22
|
)
|
—
|
|
(27
|
)
|
(27
|
)
|
(18
|
)
|
NM
|
|
5
|
|
19
|
%
|
||||||||||||
|
Operating income
|
$
|
434
|
|
$
|
—
|
|
$
|
434
|
|
$
|
106
|
|
$
|
21
|
|
$
|
127
|
|
$
|
328
|
|
NM
|
|
$
|
307
|
|
NM
|
|
||||
Revenues
Distribution revenue
increase
d
12%
, mostly due to the impact of the acquisition of Scripps Networks. Excluding the impact of the acquisition of Scripps Networks and on a pro forma combined basis, excluding the impact of foreign currency fluctuations, distribution revenue
increase
d
5%
. The
increase
s were primarily driven by increases in subscribers to our linear networks, higher digital subscription revenues in Europe and increases in pricing in Europe and Latin America.
Advertising revenue
increase
d
33%
, primarily due to the impact of the acquisition of Scripps Networks. Excluding the impact of the acquisition of Scripps Networks and foreign currency fluctuations, advertising revenue
increase
d
2%
. The increase was primarily attributable to the Olympics. On a pro forma combined basis, excluding the impact of foreign currency fluctuations, advertising revenue
increase
d
3%
. The increase was primarily attributable to the Olympics and strength in certain European markets, and to a lesser extent continued monetization of our digital distribution offerings, partially offset by linear viewership declines in Europe and Latin America.
Other revenue
increase
d $
215 million
. Excluding the impact of the acquisition of Scripps Networks and foreign currency fluctuations, other revenue
increase
d $
153 million
. On a pro forma combined basis, excluding the impact of foreign currency fluctuations, other revenue
increase
d $
147 million
. The increases were primarily due to sublicensing of Olympics sports rights to broadcast networks throughout Europe during 2018.
49
Costs of Revenues
Costs of revenues
increase
d
29%
, mostly due to the impact of the acquisition of Scripps Networks. Excluding the impact of the acquisition of Scripps Networks and foreign currency fluctuations, costs of revenues
increase
d
12%
. On a pro forma combined basis, excluding the impact of foreign currency fluctuations, costs of revenues
increase
d
11%
. The increases were primarily attributable to spending on the Olympics, partially offset by content synergies from the integration of Scripps Networks. Content rights expenses, excluding the impact of foreign currency fluctuations, was $
1.4 billion
and $
1.2 billion
for the
years ended December 31, 2018 and 2017
, respectively. On a pro forma combined basis, excluding the impact of foreign currency fluctuations, content rights expense was $
1.4 billion
and $
1.3 billion
for the
years ended December 31, 2018 and 2017
, respectively. Content impairment is generally a component of costs of revenue on the consolidated statements of operations. However, during the
year ended December 31, 2018
, content impairments of $184 million were reflected as a component of restructuring and other charges as a result of the strategic programming changes following the acquisition of Scripps Networks. No content impairments were recorded as a component of restructuring and other charges during the
year ended December 31, 2017
.
Selling, General and Administrative
Selling, general and administrative expenses
increase
d
21%
, mostly due to the impact of the acquisition of Scripps Networks. Excluding the impact of the acquisition of Scripps Networks and foreign currency fluctuations, selling, general and administrative expenses
increase
d
7%
. On a pro forma combined basis, excluding the impact of foreign currency fluctuations, selling, general and administrative expenses
increase
d
2%
. The increases were due to increased marketing spend, particularly related to our digital distribution offerings. On a pro forma combined basis, the increase in costs was partially offset by cost savings from the integration of Scripps Networks.
Adjusted OIBDA
Adjusted OIBDA
increase
d
25%
, primarily due to the acquisition of Scripps Networks. Excluding the impact of the acquisition of Scripps Networks and foreign currency fluctuations, Adjusted OIBDA
increase
d
2%
. On a pro forma combined basis, excluding the impact of foreign currency fluctuations, Adjusted OIBDA
increase
d
7%
. The increases reflect the growth in revenues, which outpaced the increases in costs of revenues and selling, general and administrative expenses.
The impairment of goodwill reflected above for International Networks is a portion of the total goodwill impairment recorded for the European reporting unit during 2017. The remaining portion of the impairment of $
838 million
is a component of corporate and inter-segment eliminations. The presentation of goodwill impairment is consistent with the financial reports that are reviewed by the Company's CEO. Goodwill has been allocated from corporate assets to reporting units within the International Networks segment.
Education and Other
The following table presents revenues, certain operating expenses, Adjusted OIBDA, and a reconciliation of Adjusted OIBDA to operating income (in millions) for Education and Other.
|
Year Ended December 31,
|
|||||||||||
|
2018
|
2017
|
% Change
|
|||||||||
|
Revenues
|
$
|
54
|
|
$
|
158
|
|
(66
|
)%
|
|||
|
Costs of revenues, excluding depreciation and amortization
|
(17
|
)
|
(60
|
)
|
72
|
%
|
|||||
|
Selling, general and administrative
|
(34
|
)
|
(92
|
)
|
63
|
%
|
|||||
|
Adjusted OIBDA
|
3
|
|
6
|
|
(50
|
)%
|
|||||
|
Depreciation and amortization
|
(2
|
)
|
(5
|
)
|
60
|
%
|
|||||
|
Restructuring and other charges
|
(1
|
)
|
(3
|
)
|
67
|
%
|
|||||
|
Gain (loss) on disposition
|
85
|
|
(4
|
)
|
NM
|
|
|||||
|
Inter-segment eliminations
|
12
|
|
12
|
|
NM
|
|
|||||
|
Operating income
|
$
|
97
|
|
$
|
6
|
|
NM
|
|
|||
Subsequent to the sale of an
88%
stake in the Education Business resulting in deconsolidation on
April 30, 2018
, Education and Other only includes activities associated with inter-company sales of productions for our U.S. Networks segment. Adjusted OIBDA
decreased
$
3 million
, primarily due to the sale of the Education Business.
50
Corporate and Inter-segment Eliminations
The following table presents our unallocated corporate amounts including revenue, certain operating expenses, Adjusted OIBDA and a reconciliation of Adjusted OIBDA to operating loss (in millions).
|
|
Year Ended December 31,
|
|
||||||||||||||||||||||||||||||
|
|
2018
|
2017
|
Actual Change
|
Pro Forma Combined Change
|
||||||||||||||||||||||||||||
|
Actual
|
Pro Forma Adjustments
|
Pro Forma Combined
|
Actual
|
Pro Forma Adjustments
|
Pro Forma Combined
|
$
|
%
|
$
|
%
|
|||||||||||||||||||||||
|
Costs of revenues, excluding depreciation and amortization
|
(1
|
)
|
—
|
|
(1
|
)
|
(2
|
)
|
—
|
|
(2
|
)
|
1
|
|
50
|
%
|
1
|
|
50
|
%
|
||||||||||||
|
Selling, general and administrative
|
(440
|
)
|
(21
|
)
|
(461
|
)
|
(358
|
)
|
(98
|
)
|
(456
|
)
|
(82
|
)
|
(23
|
)%
|
(5
|
)
|
(1
|
)%
|
||||||||||||
|
Adjusted OIBDA
|
(441
|
)
|
(21
|
)
|
(462
|
)
|
(360
|
)
|
(98
|
)
|
(458
|
)
|
(81
|
)
|
(23
|
)%
|
(4
|
)
|
(1
|
)%
|
||||||||||||
|
Mark-to-market share-based compensation
|
(32
|
)
|
(1
|
)
|
(33
|
)
|
(3
|
)
|
(9
|
)
|
(12
|
)
|
(29
|
)
|
NM
|
|
(21
|
)
|
NM
|
|
||||||||||||
|
Depreciation and amortization
|
(96
|
)
|
—
|
|
(96
|
)
|
(68
|
)
|
(2
|
)
|
(70
|
)
|
(28
|
)
|
(41
|
)%
|
(26
|
)
|
(37
|
)%
|
||||||||||||
|
Impairment of goodwill
|
—
|
|
—
|
|
—
|
|
(838
|
)
|
—
|
|
(838
|
)
|
838
|
|
NM
|
|
838
|
|
NM
|
|
||||||||||||
|
Restructuring and other charges
|
(120
|
)
|
(3
|
)
|
(123
|
)
|
(12
|
)
|
—
|
|
(12
|
)
|
(108
|
)
|
NM
|
|
(111
|
)
|
NM
|
|
||||||||||||
|
Scripps Networks transaction and integration costs
|
(93
|
)
|
28
|
|
(65
|
)
|
(79
|
)
|
68
|
|
(11
|
)
|
(14
|
)
|
(18
|
)%
|
(54
|
)
|
NM
|
|
||||||||||||
|
Loss on disposition
|
(1
|
)
|
—
|
|
(1
|
)
|
—
|
|
—
|
|
—
|
|
(1
|
)
|
NM
|
|
(1
|
)
|
NM
|
|
||||||||||||
|
Inter-segment eliminations
|
4
|
|
(1
|
)
|
3
|
|
—
|
|
—
|
|
—
|
|
4
|
|
NM
|
|
3
|
|
NM
|
|
||||||||||||
|
Operating loss
|
$
|
(779
|
)
|
$
|
2
|
|
$
|
(777
|
)
|
$
|
(1,360
|
)
|
$
|
(41
|
)
|
$
|
(1,401
|
)
|
$
|
581
|
|
43
|
%
|
$
|
624
|
|
45
|
%
|
||||
Corporate operations primarily consist of executive management, administrative support services, substantially all of our share-based compensation and transaction and integration costs related to the acquisition of Scripps Networks.
The Adjusted OIBDA loss increased
23%
in 2018 as compared to 2017. Excluding the impact of the Transactions and foreign currency fluctuations, the Adjusted OIBDA loss increased
16%
, due to an increase in selling, general and administrative costs driven by increases in technology costs, tax advisory fees, and share-based compensation. Excluding the impact of foreign currency fluctuations and on a pro forma combined basis, the Adjusted OIBDA loss was largely consistent with the prior year as the aforementioned increases were offset by a reduction in personnel costs as a result of restructuring and the integration of Scripps Networks.
The impairment of goodwill presented above for corporate and inter-segment eliminations is a portion of the total goodwill impairment recorded for the European reporting unit during 2017. The remaining portion of the impairment of $
489 million
is a component of our International Networks segment. The presentation of goodwill impairment is consistent with the financial reports that are reviewed by the Company's CEO. Goodwill has been allocated from corporate assets to reporting units within corporate and inter-segment eliminations.
Items Impacting Comparability
From time to time certain items may impact the comparability of our consolidated results of operations between two periods. In comparing the financial results for the years 2018 and 2017, in addition to the Transactions, the Company has identified foreign currency as one such item, as noted below.
Foreign Currency
The impact of exchange rates on our business is an important factor in understanding period-to-period comparisons of our results. For example, our international revenues are favorably impacted as the U.S. dollar weakens relative to other foreign currencies, and unfavorably impacted as the U.S dollar strengthens relative to other foreign currencies. We believe the presentation of results on a constant currency basis (ex-FX), in addition to results reported in accordance with GAAP provides useful information about our operating performance because the presentation ex-FX excludes the effects of foreign currency volatility and highlights our core operating results. The presentation of results on a constant currency basis should be considered in addition to, but not a substitute for, measures of financial performance reported in accordance with GAAP.
51
The ex-FX change represents the percentage change on a period-over-period basis adjusted for foreign currency impacts. The ex-FX change is calculated as the difference between the current year amounts translated at a baseline rate, which is a spot rate for each of our currencies determined early in the fiscal year as part of our forecasting process (the “2018 Baseline Rate”), and the prior year amounts translated at the same 2018 Baseline Rate. In addition, consistent with the assumption of a constant currency environment, our ex-FX results exclude the impact of our foreign currency hedging activities, as well as realized and unrealized foreign currency transaction gains and losses. Results on a constant currency basis, as we present them, may not be comparable to similarly titled measures used by other companies. Selling, general and administrative expense, as presented below, excludes mark-to-market share-based compensation and Scripps Networks transaction and integration costs due to their impact on comparability between periods.
The impact of foreign currency on the comparability of our consolidated results is as follows (dollar amounts in millions):
|
Consolidated
|
Year Ended December 31,
|
|||||||||||||
|
|
2018
|
2017
|
% Change
(Reported)
|
% Change
(ex-FX)
|
||||||||||
|
Revenues:
|
||||||||||||||
|
Distribution
|
$
|
4,538
|
|
$
|
3,474
|
|
31
|
%
|
29
|
%
|
||||
|
Advertising
|
5,514
|
|
3,073
|
|
79
|
%
|
78
|
%
|
||||||
|
Other
|
501
|
|
326
|
|
54
|
%
|
50
|
%
|
||||||
|
Total revenues
|
10,553
|
|
6,873
|
|
54
|
%
|
52
|
%
|
||||||
|
Costs of revenue, excluding depreciation and amortization
|
3,935
|
|
2,656
|
|
48
|
%
|
46
|
%
|
||||||
|
Selling, general and administrative expense
|
2,479
|
|
1,686
|
|
47
|
%
|
46
|
%
|
||||||
|
Adjusted OIBDA
|
$
|
4,139
|
|
$
|
2,531
|
|
64
|
%
|
62
|
%
|
||||
The impact of foreign currency on the comparability of our financial results for International Networks is as follows (dollar amounts in millions):
|
International Networks
|
Year Ended December 31,
|
|||||||||||||
|
|
2018
|
2017
|
% Change
(Reported)
|
% Change
(ex-FX)
|
||||||||||
|
Revenues:
|
||||||||||||||
|
Distribution
|
$
|
2,082
|
|
$
|
1,862
|
|
12
|
%
|
10
|
%
|
||||
|
Advertising
|
1,765
|
|
1,332
|
|
33
|
%
|
31
|
%
|
||||||
|
Other
|
302
|
|
87
|
|
NM
|
|
NM
|
|
||||||
|
Total revenues
|
4,149
|
|
3,281
|
|
26
|
%
|
24
|
%
|
||||||
|
Costs of revenue, excluding depreciation and amortization
|
2,169
|
|
1,677
|
|
29
|
%
|
27
|
%
|
||||||
|
Selling, general and administrative expenses
|
903
|
|
745
|
|
21
|
%
|
20
|
%
|
||||||
|
Adjusted OIBDA
|
$
|
1,077
|
|
$
|
859
|
|
25
|
%
|
23
|
%
|
||||
52
RESULTS OF OPERATIONS –
2017
vs.
2016
Consolidated Results of Operations –
2017
vs.
2016
Our consolidated results of operations for
2017
and
2016
were as follows (in millions).
|
Year Ended December 31,
|
|||||||||||
|
2017
|
2016
|
% Change
|
|||||||||
|
Revenues:
|
|||||||||||
|
Distribution
|
$
|
3,474
|
|
$
|
3,213
|
|
8
|
%
|
|||
|
Advertising
|
3,073
|
|
2,970
|
|
3
|
%
|
|||||
|
Other
|
326
|
|
314
|
|
4
|
%
|
|||||
|
Total revenues
|
6,873
|
|
6,497
|
|
6
|
%
|
|||||
|
Costs of revenues, excluding depreciation and amortization
|
2,656
|
|
2,432
|
|
9
|
%
|
|||||
|
Selling, general and administrative
|
1,768
|
|
1,690
|
|
5
|
%
|
|||||
|
Impairment of goodwill
|
1,327
|
|
—
|
|
NM
|
|
|||||
|
Depreciation and amortization
|
330
|
|
322
|
|
2
|
%
|
|||||
|
Restructuring and other charges
|
75
|
|
58
|
|
29
|
%
|
|||||
|
Loss (gain) on disposition
|
4
|
|
(63
|
)
|
NM
|
|
|||||
|
Total costs and expenses
|
6,160
|
|
4,439
|
|
39
|
%
|
|||||
|
Operating income
|
713
|
|
2,058
|
|
(65
|
)%
|
|||||
|
Interest expense
|
(475
|
)
|
(353
|
)
|
35
|
%
|
|||||
|
Loss on extinguishment of debt
|
(54
|
)
|
—
|
|
NM
|
|
|||||
|
Loss from equity method investees, net
|
(211
|
)
|
(38
|
)
|
NM
|
|
|||||
|
Other (expense) income, net
|
(110
|
)
|
4
|
|
NM
|
|
|||||
|
(Loss) income before income taxes
|
(137
|
)
|
1,671
|
|
NM
|
|
|||||
|
Income tax expense
|
(176
|
)
|
(453
|
)
|
(61
|
)%
|
|||||
|
Net (loss) income
|
(313
|
)
|
1,218
|
|
NM
|
|
|||||
|
Net income attributable to noncontrolling interests
|
—
|
|
(1
|
)
|
NM
|
|
|||||
|
Net income attributable to redeemable noncontrolling interests
|
(24
|
)
|
(23
|
)
|
4
|
%
|
|||||
|
Net (loss) income available to Discovery, Inc.
|
$
|
(337
|
)
|
$
|
1,194
|
|
NM
|
|
|||
NM - Not meaningful
Revenues
Distribution revenue increased 8% in 2017 compared to 2016. Excluding the impact of foreign currency fluctuations, distribution revenue increased 7%. U.S. Networks distribution revenue increases were driven by increases in affiliate fee rates and increases in SVOD revenue partially offset by a decline in affiliate subscribers. Total U.S. Networks portfolio subscribers declined 5% for the year ended December 31, 2017, while subscribers to our fully distributed networks declined 3% for the same period. International Networks' distribution revenue increase was mostly due to increases in contractual rates in Europe following further investment in sports content, and to a lesser extent increases in Latin America due to increases in rates offset by decreases in subscribers. Contributions from other distribution revenues also contributed slightly to growth. Other distribution revenues were comprised of content deliveries under licensing agreements. These increases were partially offset by decreases in contractual rates in Asia.
Advertising revenue increased 3% in 2017 compared to 2016. The increase for our U.S. Networks was primarily due to pricing increases and continued monetization of our GO platform, partially offset by lower audience delivery due to continued linear distribution audience universe declines. International Networks' increases were primarily due to increased volume across key markets in Europe, particularly Southern Europe and Germany, and Latin America. The increase was partially offset by declines in ad sales due to lower pricing and volume in Asia.
53
Other revenue increased 4% compared with the prior year, primarily due to the formation and consolidation of the MTG joint venture (then known as VTEN) during the third quarter of the current year. (See Note 3 to the accompanying consolidated financial statements.)
Costs of Revenues
Costs of revenues increased 9%. Excluding the impact of foreign currency fluctuations, OWN and MTG transactions and the Group Nine Transaction, costs of revenues increased 7% for the year ended December 31, 2017. The increase was primarily attributable to increased spending on content at our International Networks segment, particularly sports rights and associated production costs. Content amortization was $1.9 billion and $1.7 billion for the years ended December 31, 2017 and December 31, 2016, respectively.
Selling, General and Administrative
Selling, general and administrative expenses increased 5%. Excluding the impact of foreign currency fluctuations, OWN and MTG transactions, selling, general and administrative expenses increased 3% for the year ended December 31, 2017. The increase was primarily due to transaction costs for the Scripps Networks acquisition and integration costs of $79 million, including the $35 million charge associated with the modification of Advance/Newhouse's preferred stock. (See Note 12 to the accompanying consolidated financial statements.)
Impairment of Goodwill
Goodwill impairment expense of $1.3 billion was recognized during the year ended December 31, 2017. (See Note 8 to the accompanying consolidated financial statements.)
Depreciation and Amortization
Depreciation and amortization was consistent for the year ended December 31, 2017, compared with the prior period as capital spending has remained consistent over the periods.
Restructuring and Other Charge
s
Restructuring and other charges increased $17 million. The increase was primarily due to higher personnel-related termination costs for voluntary and involuntary severance actions. (See Note 17 to the accompanying consolidated financial statements.)
Loss (Gain) on Disposition
The change in loss (gain) on disposition was $67 million. We recorded a $4 million loss for the year ended December 31, 2017 due to the sale of the Raw and Betty production studios on April 28, 2017, compared with a gain of $63 million for the year ended December 31, 2016. The gain on disposition recorded for the year ended December 31, 2016 is comprised of the $50 million gain for the deconsolidation of our digital networks business Seeker and SourceFed Studios in connection with the Group Nine Transaction and the $13 million gain due to the disposition of our radio businesses in the Nordics. (See Note 3 to the accompanying consolidated financial statements.)
Interest Expense
Interest expense increased $122 million for the year ended December 31, 2017
primarily due to costs incurred for the unsecured bridge loan commitment as well as interest accrued on the senior notes issued on September 21, 2017 for the financing of the Scripps Networks acquisition. (See Note 9 to the accompanying consolidated financial statements.)
Loss on Extinguishment of Debt
On March 13, 2017, we issued new senior notes in an aggregate principal amount of $650 million and used the proceeds to fund the repurchase of $600 million of combined aggregate principal amount of our then-outstanding senior notes through a cash tender offer that closed on March 13, 2017. As a result, we recognized a $54 million loss on extinguishment of debt, which included $50 million for premiums to par value, $2 million of non-cash write-offs of unamortized deferred financing costs, $1 million for the write-off of the original issue discount of the existing senior notes and $1 million accrued for other third-party fees. (See Note 9 to the accompanying consolidated financial statements.)
54
Loss from Equity Investees, net
Losses from our equity method investees increased $173 million primarily due to losses from investments in limited liability companies that sponsor renewable energy projects related to solar energy, partially offset by increases in earnings at OWN and decreases in losses at All3Media. (See Note 4 to the accompanying consolidated financial statements.)
Other (Expense) Income, Net
The table below presents the details of other expense, net (in millions).
|
Year Ended December 31,
|
||||||||
|
2017
|
2016
|
|||||||
|
Foreign currency (losses) gains, net
|
$
|
(83
|
)
|
$
|
75
|
|
||
|
Losses on derivative instruments
|
(82
|
)
|
(12
|
)
|
||||
|
Remeasurement gain on previously held equity interest
|
33
|
|
—
|
|
||||
|
Interest income
|
21
|
|
—
|
|
||||
|
Other-than-temporary impairment of AFS investments
|
—
|
|
(62
|
)
|
||||
|
Other income, net
|
1
|
|
3
|
|
||||
|
Total other (expense) income, net
|
$
|
(110
|
)
|
$
|
4
|
|
||
Other expense increased $114 million in 2017. We recorded foreign currency losses during 2017 compared to foreign currency gains during 2016, mostly due to exchange rate changes on the U.S. dollar compared with the British pound that impacted foreign currency monetary assets. Increases in losses from derivative instruments primarily resulted from losses of $98 million on interest rate contracts used to economically hedge the pricing for the issuance of a portion of the dollar-denominated senior notes, which were settled on September 21, 2017. The interest rate contracts did not receive hedging designation. The losses were partially offset by various other items, including a gain of $17 million on previously settled interest rate contracts for which the hedged issuance of debt is considered remote following the issuance of the senior notes on September 21, 2017. (See Note 9 and Note 10 to the accompanying consolidated financial statements.) On November 30, 2017, the Company acquired from Harpo a controlling interest in OWN. We recognized a remeasurement gain to account for the difference between the carrying value and the fair value of our previously held 49.50% equity interest. (See Note 3 to the accompanying consolidated financial statements.)
Income Taxes
The following table reconciles the Company's effective income tax rate to the U.S. federal statutory income tax rate.
|
Year Ended December 31,
|
|||||||||||||||
|
2017
|
2016
|
||||||||||||||
|
U.S. federal statutory income tax provision
|
$
|
(48
|
)
|
35
|
%
|
$
|
585
|
|
35
|
%
|
|||||
|
State and local income taxes, net of federal tax benefit
|
23
|
|
(18
|
)%
|
(36
|
)
|
(2
|
)%
|
|||||||
|
Effect of foreign operations
|
(35
|
)
|
25
|
%
|
(17
|
)
|
(1
|
)%
|
|||||||
|
Domestic production activity deductions
|
(52
|
)
|
39
|
%
|
(62
|
)
|
(4
|
)%
|
|||||||
|
Change in uncertain tax positions
|
60
|
|
(44
|
)%
|
8
|
|
—
|
%
|
|||||||
|
Preferred stock modification
|
12
|
|
(9
|
)%
|
—
|
|
—
|
%
|
|||||||
|
Goodwill impairment
|
458
|
|
(334
|
)%
|
—
|
|
—
|
%
|
|||||||
|
Renewable energy investments tax credits (See Note 4)
|
(195
|
)
|
142
|
%
|
(17
|
)
|
(1
|
)%
|
|||||||
|
U.S. Legislative Changes
|
(43
|
)
|
32
|
%
|
—
|
|
—
|
%
|
|||||||
|
Other, net
|
(4
|
)
|
4
|
%
|
(8
|
)
|
—
|
%
|
|||||||
|
Income tax expense
|
$
|
176
|
|
(128
|
)%
|
$
|
453
|
|
27
|
%
|
|||||
55
Income tax expense was $176 million and $453 million and our effective tax rate was (128)% and 27% for 2017 and 2016, respectively. During 2017, the decrease in the effective tax rate was primarily attributable to the impact of non-cash goodwill impairment charges that are non-deductible for tax purposes. Thereafter, the decrease in the effective tax rate was primarily due to investment tax credits that we receive related to our renewable energy investments, and to a lesser extent, the domestic production activity deduction benefit, the allocation and taxation of income among multiple foreign and domestic jurisdictions, and the impact of the TCJA (see Note 18 to the accompanying consolidating financial statements). The benefits were partially offset by an increase in reserves for uncertain tax positions in 2017. In 2016, we favorably resolved multi-year state tax positions that resulted in a reduction of reserves related to uncertain tax positions that did not recur in 2017.
Segment Results of Operations –
2017
vs.
2016
The table below presents the calculation of total Adjusted OIBDA (in millions).
|
Year Ended December 31,
|
|||||||||||
|
2017
|
2016
|
% Change
|
|||||||||
|
Revenues:
|
|||||||||||
|
U.S. Networks
|
$
|
3,434
|
|
$
|
3,285
|
|
5
|
%
|
|||
|
International Networks
|
3,281
|
|
3,040
|
|
8
|
%
|
|||||
|
Education and Other
|
158
|
|
174
|
|
(9
|
)%
|
|||||
|
Corporate and inter-segment eliminations
|
—
|
|
(2
|
)
|
NM
|
|
|||||
|
Total revenues
|
6,873
|
|
6,497
|
|
6
|
%
|
|||||
|
Costs of revenues, excluding depreciation and amortization
|
(2,656
|
)
|
(2,432
|
)
|
9
|
%
|
|||||
|
Selling, general and administrative
(a)
|
(1,686
|
)
|
(1,652
|
)
|
2
|
%
|
|||||
|
Adjusted OIBDA
|
$
|
2,531
|
|
$
|
2,413
|
|
5
|
%
|
|||
(a)
Selling, general and administrative expenses exclude mark-to-market share-based compensation, restructuring and other charges, gains (losses) on dispositions and third-party transaction costs directly related to the Scripps Networks acquisition and planned integration.
56
The table below presents a reconciliation of consolidated net income available to Discovery, Inc. to total Adjusted OIBDA (in millions).
|
Year Ended December 31,
|
|||||||||||
|
2017
|
2016
|
% Change
|
|||||||||
|
Net (loss) income available to Discovery, Inc.
|
$
|
(337
|
)
|
$
|
1,194
|
|
(128
|
)%
|
|||
|
Net income attributable to redeemable noncontrolling interests
|
24
|
|
23
|
|
4
|
%
|
|||||
|
Net income attributable to noncontrolling interests
|
—
|
|
1
|
|
NM
|
|
|||||
|
Income tax expense
|
176
|
|
453
|
|
(61
|
)%
|
|||||
|
Other expense (income), net
|
110
|
|
(4
|
)
|
NM
|
|
|||||
|
Loss from equity investees, net
|
211
|
|
38
|
|
NM
|
|
|||||
|
Loss on extinguishment of debt
|
54
|
|
—
|
|
NM
|
|
|||||
|
Interest expense
|
475
|
|
353
|
|
35
|
%
|
|||||
|
Operating income
|
713
|
|
2,058
|
|
(65
|
)%
|
|||||
|
Loss (gain) on disposition
|
4
|
|
(63
|
)
|
NM
|
|
|||||
|
Restructuring and other charges
|
75
|
|
58
|
|
29
|
%
|
|||||
|
Depreciation and amortization
|
330
|
|
322
|
|
2
|
%
|
|||||
|
Impairment of goodwill
|
1,327
|
|
—
|
|
NM
|
|
|||||
|
Mark-to-market share-based compensation
|
3
|
|
38
|
|
NM
|
|
|||||
|
Scripps Networks transaction and integration costs
|
79
|
|
—
|
|
NM
|
|
|||||
|
Total Adjusted OIBDA
|
$
|
2,531
|
|
$
|
2,413
|
|
5
|
%
|
|||
|
Adjusted OIBDA:
|
|||||||||||
|
U.S. Networks
|
$
|
2,026
|
|
$
|
1,922
|
|
5
|
%
|
|||
|
International Networks
|
859
|
|
835
|
|
3
|
%
|
|||||
|
Education and Other
|
6
|
|
(10
|
)
|
NM
|
|
|||||
|
Corporate and inter-segment eliminations
|
(360
|
)
|
(334
|
)
|
8
|
%
|
|||||
|
Total Adjusted OIBDA
|
$
|
2,531
|
|
$
|
2,413
|
|
5
|
%
|
|||
U.S. Networks
The table below presents, for our U.S. Networks segment, revenues by type, certain operating expenses, Adjusted OIBDA and a reconciliation of Adjusted OIBDA to operating income (in millions).
|
Year Ended December 31,
|
|||||||||||
|
2017
|
2016
|
% Change
|
|||||||||
|
Revenues:
|
|||||||||||
|
Distribution
|
$
|
1,612
|
|
$
|
1,532
|
|
5
|
%
|
|||
|
Advertising
|
1,740
|
|
1,690
|
|
3
|
%
|
|||||
|
Other
|
82
|
|
63
|
|
30
|
%
|
|||||
|
Total revenues
|
3,434
|
|
3,285
|
|
5
|
%
|
|||||
|
Costs of revenues, excluding depreciation and amortization
|
(917
|
)
|
(891
|
)
|
3
|
%
|
|||||
|
Selling, general and administrative
|
(491
|
)
|
(472
|
)
|
4
|
%
|
|||||
|
Adjusted OIBDA
|
2,026
|
|
1,922
|
|
5
|
%
|
|||||
|
Depreciation and amortization
|
(35
|
)
|
(28
|
)
|
25
|
%
|
|||||
|
Restructuring and other charges
|
(18
|
)
|
(15
|
)
|
20
|
%
|
|||||
|
Gain on dispositions
|
—
|
|
50
|
|
NM
|
|
|||||
|
Inter-segment eliminations
|
(12
|
)
|
(14
|
)
|
(14
|
)%
|
|||||
|
Operating income
|
$
|
1,961
|
|
$
|
1,915
|
|
2
|
%
|
|||
57
Revenues
Distribution revenues increased 5%. Excluding the impact of the OWN transaction, distribution revenues increased 4%, primarily driven by increases in affiliate fee rates and increases in SVOD revenue due to the timing of content deliveries. These increases were partially offset by a decline in affiliate subscribers. Total portfolio subscribers declined 5% for the year ended December 31, 2017, while subscribers to our fully distributed networks declined 3% for the same period.
Advertising revenue increased 3%. Excluding the impact of the OWN and MTG transactions and the Group Nine Transaction, advertising revenue increased 2% for the year ended December 31, 2017. The increase was primarily due to pricing increases and continued monetization of our GO platform, partially offset by lower audience delivery due to continued linear distribution audience universe declines.
Other revenue increased 30% primarily due to the formation and consolidation of the MTG joint venture (then known as VTEN) during the third quarter of the current year. (See Note 3 to the accompanying consolidated financial statements.)
Costs of Revenues
Costs of revenues increased 3% for the year ended December 31, 2017. Excluding the impact of OWN and MTG transactions and the Group Nine Transaction, costs of revenue increased 1%. Content amortization was $752 million and $716 million for 2017 and 2016, respectively.
Selling, General and Administrative
Selling, general and administrative expenses increased 4%. Excluding the impact of OWN and MTG transactions and the Group Nine Transaction, selling, general and administrative expenses increased 1% for the year ended December 31, 2017. Increased spending on viewer research was offset by decreases in personnel and marketing costs.
Adjusted OIBDA
Adjusted OIBDA increased 5% primarily due to increases in distribution and advertising revenues, partially offset by increases in costs of revenues. Excluding the impact of the OWN and MTG transactions and the Group Nine Transaction, adjusted OIBDA also increased 5%.
International Networks
The following table presents, for our International Networks segment, revenues by type, certain operating expenses, Adjusted OIBDA and a reconciliation of Adjusted OIBDA to operating income (in millions).
|
Year Ended December 31,
|
|||||||||||
|
2017
|
2016
|
% Change
|
|||||||||
|
Revenues:
|
|||||||||||
|
Distribution
|
$
|
1,862
|
|
$
|
1,681
|
|
11
|
%
|
|||
|
Advertising
|
1,332
|
|
1,279
|
|
4
|
%
|
|||||
|
Other
|
87
|
|
80
|
|
9
|
%
|
|||||
|
Total revenues
|
3,281
|
|
3,040
|
|
8
|
%
|
|||||
|
Costs of revenues, excluding depreciation and amortization
|
(1,677
|
)
|
(1,462
|
)
|
15
|
%
|
|||||
|
Selling, general and administrative
|
(745
|
)
|
(743
|
)
|
—
|
%
|
|||||
|
Adjusted OIBDA
|
859
|
|
835
|
|
3
|
%
|
|||||
|
Depreciation and amortization
|
(222
|
)
|
(221
|
)
|
—
|
%
|
|||||
|
Impairment of goodwill
|
(489
|
)
|
—
|
|
NM
|
|
|||||
|
Restructuring and other charges
|
(42
|
)
|
(26
|
)
|
62
|
%
|
|||||
|
Gain on disposition
|
—
|
|
13
|
|
NM
|
|
|||||
|
Inter-segment eliminations
|
—
|
|
(4
|
)
|
NM
|
|
|||||
|
Operating income
|
$
|
106
|
|
$
|
597
|
|
(82
|
)%
|
|||
58
Revenues
Distribution revenue increased 11%. Excluding the impact of foreign currency fluctuations, distribution revenue increased 9%. The increase was mostly due to increases in contractual rates in Europe following further investment in sports content, and to a lesser extent increases in Latin America due to increases in rates offset by decreases in subscribers. Contributions from other distribution revenues also contributed slightly to growth. Other distribution revenues were comprised of content deliveries under licensing agreements. These increases were partially offset by decreases in contractual rates in Asia.
Advertising revenue increased 4%. Excluding the impact of foreign currency fluctuations, advertising revenue increased 3%. The increase was primarily driven by increases in volume across key markets in Europe, particularly Southern Europe and Germany, and Latin America. The increase was partially offset by declines in ad sales due to lower pricing and volume in Asia.
Other revenue remained consistent with the prior year.
Costs of Revenues
Costs of revenues increased 15%. Excluding the impact of foreign currency fluctuations, costs of revenues increased 12%. The increase was mostly attributable to increased spending on content, particularly sports rights and associated production costs. Content amortization was $1.1 billion and $976 million for 2017 and 2016, respectively.
Selling, General and Administrative
Selling, general and administrative expenses remained consistent with the prior year.
Adjusted OIBDA
Adjusted OIBDA increased 3% as increases in distribution and advertising revenues were offset by increases in costs of revenues, related to content expense.
The impairment of goodwill presented above for International Networks is a portion of the total goodwill impairment recorded for the European reporting unit during 2017. The remaining portion of the impairment of $838 million is a component of corporate and inter-segment eliminations. The presentation of goodwill impairment is consistent with the financial reports that are reviewed by the Company's CEO. Goodwill has been allocated from corporate assets to reporting units within the International Networks segment.
Education and Other
The following table presents our Education and Other operating segments' revenues, certain operating expenses, Adjusted OIBDA, and a reconciliation of Adjusted OIBDA to operating income (in millions).
|
Year Ended December 31,
|
|||||||||||
|
2017
|
2016
|
% Change
|
|||||||||
|
Revenues
|
$
|
158
|
|
$
|
174
|
|
(9
|
)%
|
|||
|
Costs of revenues, excluding depreciation and amortization
|
(60
|
)
|
(79
|
)
|
(24
|
)%
|
|||||
|
Selling, general and administrative
|
(92
|
)
|
(105
|
)
|
(12
|
)%
|
|||||
|
Adjusted OIBDA
|
6
|
|
(10
|
)
|
NM
|
|
|||||
|
Depreciation and amortization
|
(5
|
)
|
(7
|
)
|
(29
|
)%
|
|||||
|
Restructuring and other charges
|
(3
|
)
|
(3
|
)
|
—
|
%
|
|||||
|
Loss on disposition
|
(4
|
)
|
—
|
|
NM
|
|
|||||
|
Inter-segment eliminations
|
12
|
|
18
|
|
(33
|
)%
|
|||||
|
Operating income (loss)
|
$
|
6
|
|
$
|
(2
|
)
|
NM
|
|
|||
Adjusted OIBDA increased $16 million. The increase was primarily due to improved operating results for the education business and the disposition of the Raw and Betty production studios.
59
Corporate and Inter-segment Eliminations
The following table presents our unallocated corporate amounts including revenue, certain operating expenses, Adjusted OIBDA and a reconciliation of Adjusted OIBDA to operating loss (in millions).
|
Year Ended December 31,
|
|||||||||||
|
2017
|
2016
|
% Change
|
|||||||||
|
Revenues
|
$
|
—
|
|
$
|
(2
|
)
|
NM
|
|
|||
|
Costs of revenues, excluding depreciation and amortization
|
(2
|
)
|
—
|
|
NM
|
|
|||||
|
Selling, general and administrative
|
(358
|
)
|
(332
|
)
|
8
|
%
|
|||||
|
Adjusted OIBDA
|
(360
|
)
|
(334
|
)
|
8
|
%
|
|||||
|
Mark-to-market share-based compensation
|
(3
|
)
|
(38
|
)
|
NM
|
|
|||||
|
Depreciation and amortization
|
(68
|
)
|
(66
|
)
|
3
|
%
|
|||||
|
Impairment of goodwill
|
(838
|
)
|
—
|
|
NM
|
|
|||||
|
Restructuring and other charges
|
(12
|
)
|
(14
|
)
|
(14
|
)%
|
|||||
|
Scripps Networks transaction and integration costs
|
(79
|
)
|
—
|
|
NM
|
|
|||||
|
Operating loss
|
$
|
(1,360
|
)
|
$
|
(452
|
)
|
NM
|
|
|||
Adjusted OIBDA decreased 8% due to increased costs related to personnel, legal and technology for data security.
The impairment of goodwill presented above for corporate and inter-segment eliminations is a portion of the total goodwill impairment recorded for the European reporting unit during 2017. The remaining portion of the impairment of $489 million is a component of our International Networks segment. The presentation of goodwill impairment is consistent with the financial reports that are reviewed by the Company's CEO. Goodwill has been allocated from corporate assets to reporting units within corporate and inter-segment eliminations.
The decrease in mark-to-market share-based compensation expense was primarily attributable to a decrease in Discovery's stock price in 2017 compared to 2016. Changes in stock price are a key driver of fair value estimates used in the attribution of expense for stock appreciation rights ("SARs") and performance-based restricted stock units ("PRSUs"). By contrast, stock options and service-based restricted stock units ("RSUs") are fair valued at grant date and amortized over their vesting period without mark-to-market adjustments. The expense associated with stock options and RSUs is included in Adjusted OIBDA as a component of selling, general and administrative expense.
Items Impacting Comparability
From time to time certain items may impact the comparability of our consolidated results of operations between two periods. In comparing the financial results for the years 2017 and 2016, the Company has identified foreign currency as one such item, as noted below. The Company also has various acquisitions and dispositions that impact the comparability of our results. To the extent that the transaction materially impacts a particular item or segment, it may be discussed in the relevant section above (see Note 3 to the accompanying consolidating financial statements).
Foreign Currency
The impact of exchange rates on our business is an important factor in understanding period to period comparisons of our results. For example, our international revenues are favorably impacted as the U.S. dollar weakens relative to other foreign currencies, and unfavorably impacted as the U.S dollar strengthens relative to other foreign currencies. We believe the presentation of results on a constant currency basis ("ex-FX"), in addition to results reported in accordance with GAAP, provides useful information about our operating performance because the presentation ex-FX excludes the effects of foreign currency volatility and highlights our core operating results. The presentation of results on a constant currency basis should be considered in addition to, but not a substitute for, measures of financial performance reported in accordance with GAAP.
60
The ex-FX change represents the percentage change on a period-over-period basis adjusted for foreign currency impacts. The ex-FX change is calculated as the difference between the current year amounts translated at a baseline rate, a spot rate for each of our currencies determined early in the fiscal year as part of our forecasting process, (the “2016 Baseline Rate”) and the prior year amounts translated at the same 2016 Baseline Rate. In addition, consistent with the assumption of a constant currency environment, our ex-FX results exclude the impact of our foreign currency hedging activities as well as realized and unrealized foreign currency transaction gains and losses. The impact of foreign currency on the comparability of our results is reflected in the tables below (in millions). Results on a constant currency basis, as we present them, may not be comparable to similarly titled measures used by other companies.
|
Consolidated
|
Year Ended December 31,
|
|||||||||||||
|
|
2017
|
2016
|
% Change
(Reported)
|
% Change
(ex-FX)
|
||||||||||
|
Revenues:
|
||||||||||||||
|
Distribution
|
$
|
3,474
|
|
$
|
3,213
|
|
8
|
%
|
7
|
%
|
||||
|
Advertising
|
3,073
|
|
2,970
|
|
3
|
%
|
3
|
%
|
||||||
|
Other
|
326
|
|
314
|
|
4
|
%
|
6
|
%
|
||||||
|
Total revenues
|
6,873
|
|
6,497
|
|
6
|
%
|
5
|
%
|
||||||
|
Costs of revenue, excluding depreciation and amortization
|
(2,656
|
)
|
(2,432
|
)
|
9
|
%
|
8
|
%
|
||||||
|
Selling, general and administrative expense
|
(1,686
|
)
|
(1,652
|
)
|
2
|
%
|
2
|
%
|
||||||
|
Adjusted OIBDA
|
$
|
2,531
|
|
$
|
2,413
|
|
5
|
%
|
5
|
%
|
||||
|
International Networks
|
Year Ended December 31,
|
|||||||||||||
|
|
2017
|
2016
|
% Change
(Reported)
|
% Change
(ex-FX)
|
||||||||||
|
Revenues:
|
||||||||||||||
|
Distribution
|
$
|
1,862
|
|
$
|
1,681
|
|
11
|
%
|
9
|
%
|
||||
|
Advertising
|
1,332
|
|
1,279
|
|
4
|
%
|
3
|
%
|
||||||
|
Other
|
87
|
|
80
|
|
9
|
%
|
8
|
%
|
||||||
|
Total revenues
|
3,281
|
|
3,040
|
|
8
|
%
|
7
|
%
|
||||||
|
Costs of revenue, excluding depreciation and amortization
|
(1,677
|
)
|
(1,462
|
)
|
15
|
%
|
12
|
%
|
||||||
|
Selling, general and administrative expenses
|
(745
|
)
|
(743
|
)
|
—
|
%
|
—
|
%
|
||||||
|
Adjusted OIBDA
|
$
|
859
|
|
$
|
835
|
|
3
|
%
|
3
|
%
|
||||
LIQUIDITY AND CAPITAL RESOURCES
Liquidity
Sources of Cash
Historically, we have generated a significant amount of cash from operations. During the year ended
December 31, 2018
, we funded our working capital needs primarily through cash flows from operations. As of
December 31, 2018
, we had
$986 million
of cash and cash equivalents on hand. We are a well-known seasoned issuer and have demonstrated the ability to conduct registered offerings of securities, including debt securities, common stock and preferred stock, on short notice. Access to sufficient capital from the public market is not assured.
|
•
|
Debt
|
Senior Notes
In connection with the acquisition of Scripps Networks on
March 6, 2018
, the Company assumed
$2.5 billion
aggregate principal amount of Scripps Networks
2.750%
senior notes due 2019,
2.800%
senior notes due 2020,
3.500%
senior notes due 2022,
3.900%
senior notes due 2024 and
3.950%
senior notes due 2025 (the "Scripps Networks Senior Notes").
61
On
April 3, 2018
, pursuant to the Offering Memorandum and Consent Solicitation Statement to Exchange dated
March 5, 2018
, Discovery Communications, LLC ("DCL"), a wholly-owned subsidiary of the Company, completed the exchange of
$2.3 billion
aggregate principal amount of Scripps Networks Senior Notes, for
$2.3 billion
aggregate principal amount of DCL's
2.750%
senior notes due 2019 (the "2019 Notes"),
2.800%
senior notes due 2020 (the "2020 Notes"),
3.500%
senior notes due 2022 (the "2022 Notes"),
3.900%
senior notes due 2024 (the "2024 Notes") and
3.950%
senior notes due 2025 (the "2025 Notes"). Interest on the 2019 Notes and the 2024 Notes is payable semi-annually in arrears on
May 15
and
November 15
of each year. Interest on the 2020 Notes, the 2022 Notes and the 2025 Notes is payable semi-annually in arrears on
June 15
and
December 15
of each year commencing in
2018
. The exchange was accounted for as a debt modification and, as a result, third-party issuance costs were expensed as incurred.
On
September 21, 2017
, DCL issued
$500 million
principal amount of
2.200%
senior notes due 2019,
$1.20 billion
principal amount of
2.950%
senior notes due 2023,
$1.70 billion
principal amount of
3.950%
senior notes due 2028,
$1.25 billion
principal amount of
5.000%
senior notes due 2037,
$1.25 billion
principal amount of
5.200%
senior notes due 2047 (collectively, the “Senior Fixed Rate Notes”) and
$400 million
principal amount of floating rate senior notes due 2019 (the “Senior Floating Rate Notes” and, together with the Senior Fixed Rate Notes, the “USD Notes”). Interest on the Senior Fixed Rate Notes is payable on
March 20
and
September 20
of each year. Interest on the Senior Floating Rate Notes is payable on
March 20
,
June 20
,
September 20
and
December 20
of each year. The USD Notes are fully and unconditionally guaranteed by the Company. On
September 21, 2017
, DCL also issued
£400 million
principal amount (
$540 million
at issuance based on the exchange rate of
$1.35
per pound at
September 21, 2017
) of
2.500%
senior notes due 2024 (the “Sterling Notes”). Interest on the Sterling Notes is payable on
September 20
of each year. The proceeds received by DCL from the USD Notes and the Sterling Notes were net of a
$11 million
issuance discount and
$57 million
of debt issuance costs.
On
March 13, 2017
, DCL issued
$450 million
principal amount of
3.800%
senior notes due
March 13, 2024
(the "2017 USD Notes") and an additional
$200 million
principal amount of its existing
4.900%
senior notes due
March 11, 2026
(the "2016 USD Notes"). Interest on the 2017 USD Notes is payable semi-annually on
March 13
and
September 13
of each year. Interest on the 2016 USD Notes is payable semi-annually on
March 11
and
September 11
of each year. The proceeds received by DCL from the 2017 USD Notes were net of a
$1 million
issuance discount and
$4 million
of debt issuance costs. The proceeds received by DCL from the 2016 USD Notes included a
$10 million
issuance premium and were net of
$2 million
of debt issuance costs.
DCL used the proceeds from the offerings of the 2017 USD Notes and the 2016 USD Notes to repurchase
$600 million
aggregate principal amount of DCL's
5.050%
senior notes due 2020 and
5.625%
senior notes due 2019 in a cash tender offer. The repurchase resulted in a pretax loss on extinguishment of debt of
$54 million
for the three months ended
March 31, 2017
, which is presented as a separate line item on the Company's consolidated statements of operations and recognized as a component of financing cash outflows on the consolidated statements of cash flows. The loss included
$50 million
for premiums to par value,
$2 million
of non-cash write-offs of unamortized deferred financing costs,
$1 million
for the write-off of the original issue discount of these senior notes and
$1 million
accrued for other third-party fees.
Revolving Credit Facility
We have access to a
$2.5 billion
revolving credit facility, as amended on
August 11, 2017
. (See Note 9 to the accompanying consolidated financial statements.) Borrowing capacity under this agreement is reduced by the outstanding borrowings under our commercial paper program. As of
December 31, 2018
, the Company had outstanding borrowings under the revolving credit facility of
$225 million
at a weighted average interest rate of
3.82%
. The revolving credit facility agreement provides for a maturity date of
August 11, 2022
and the option for up to
two
additional
364
-day renewal periods. All obligations of DCL and the other borrowers under the revolving credit facility are unsecured and are fully and unconditionally guaranteed by Discovery.
The credit agreement governing the revolving credit facility (the “Credit Agreement”) contains customary representations, warranties and events of default, as well as affirmative and negative covenants, including limitations on liens, investments, indebtedness, dispositions, affiliate transactions, dividends and restricted payments. DCL, its subsidiaries and Discovery are also subject to a limitation on mergers, liquidation and disposals of all or substantially all of their assets. The Credit Agreement, as amended on
August 11, 2017
, continues to require DCL to maintain a consolidated interest coverage ratio (as defined in the Credit Agreement) of no less than 3:00 to 1:00 and now requires a consolidated leverage ratio of financial covenant of
5.50
to
1.00
, with step-downs to
5.00
to
1.00
in the first year after the closing of the acquisition of Scripps Networks and
4.50
to
1.00
in the second year after the closing. As of
December 31, 2018
, Discovery, DCL and the other borrowers were in compliance with all covenants and there were no events of default under the Credit Agreement.
62
Term Loans
On
August 11, 2017
, DCL entered into a delayed draw and unsecured term loan credit facility (the "Term Loans"), with a three-year tranche and a five-year tranche, each with a principal amount of up to
$1 billion
. The term of each delayed draw loan commenced on
March 6, 2018
when Discovery borrowed the full amount of both tranches to finance a portion of the acquisition of Scripps Networks. As of
December 31, 2018
, the Company had used cash from operations and borrowings under the commercial paper program to repay in full the Term Loan borrowings.
Commercial Paper
Under our commercial paper program and subject to market conditions, DCL may issue unsecured commercial paper notes guaranteed by the Company from time to time up to an aggregate principal amount outstanding at any given time of
$1 billion
. The maturities of these notes vary but may not exceed
397 days
. The notes may be issued at a discount or at par, and interest rates vary based on market conditions and the credit rating assigned to the notes at the time of issuance. As of
December 31, 2018
, we did not have outstanding commercial paper borrowings. Borrowings under the commercial paper program would reduce the borrowing capacity under the revolving credit facility arrangement referenced above.
We repay our senior notes, revolving credit facility, Term Loans, and commercial paper as required, and accordingly these sources of cash also require use of our cash.
|
•
|
Dispositions
|
On
April 30, 2018
, the Company sold an
88%
controlling equity stake in its Education Business to
Francisco Partners for cash of
$113 million
and recorded a gain of
$84 million
upon disposition. Discovery retained a
12%
ownership interest in the Education Business, which is accounted for as an equity method investment. (See Note 3 to the accompanying consolidated financial statements.)
|
•
|
Real Estate Strategy and Relocation of Global Headquarters
|
The Company enters into multi-year lease arrangements for transponders, office space, studio facilities and other equipment. Most leases are not cancelable prior to their expiration. On
January 9, 2018
, the Company announced plans to relocate its global headquarters from Silver Spring, Maryland ("the Silver Spring property") to New York City in
2019
. During the third quarter, the Company entered into a sale-lease back transaction for the Silver Spring property. The lease is classified as an operating lease. As a result of the sale, the Company received net proceeds of
$68 million
and recognized an impairment loss of
$12 million
for the
year ended December 31, 2018
which is reflected in depreciation and amortization on the consolidated statements of operations.
Uses of Cash
Our primary uses of cash include the creation and acquisition of new content, business acquisitions, repurchases of our capital stock, income taxes, personnel costs, principal and interest on our outstanding senior notes, and funding for various equity method and other investments.
|
•
|
Investments and Business Combinations
|
Scripps Networks Acquisition
On
March 6, 2018
, Discovery completed the acquisition of Scripps Networks (the "acquisition of Scripps Networks"). The Company elected to exercise in full the cash top-up option. The acquisition of Scripps Networks consideration consisted of (i) for Scripps Networks shareholders who did not make an election or elected the mixed consideration,
$65.82
in cash and
1.0584
shares of Discovery Series C common stock for each Scripps Networks share, (ii) for Scripps Networks shareholders that elected the cash consideration,
$90.00
in cash for each Scripps Networks share and (iii) for Scripps Networks shareholders that elected the stock consideration,
3.9392
shares of Discovery Series C common stock for each Scripps Networks share, subject to the terms and conditions set forth in the Agreement and Plan of Merger by and among Discovery, Scripps Networks and Skylight Merger Sub, Inc., dated July 30, 2017 (the "Merger Agreement").
The consideration for the acquisition of Scripps Networks totaled
$12 billion
, including cash of
$8.8 billion
and stock of
$3.2 billion
based on share prices as of
March 6, 2018
.
In addition, we assumed
$2.5 billion
aggregate principal amount of Scripps Networks
2.75%
senior notes due 2019,
2.8%
senior notes due 2020,
3.5%
senior notes due 2022,
3.9%
senior notes due 2024 and
3.95%
senior notes due 2025. On
April 3, 2018
, we completed a transaction in which most of Scripps Network outstanding debt was exchanged for DCL senior notes. In connection with that transaction, Scripps Networks Interactive, Inc., a wholly-owned subsidiary of the Company, fully and unconditionally guaranteed the DCL senior notes.
63
|
•
|
Other Investments
|
Our uses of cash have included investment in equity method investments and equity investments without readily determinable fair value. (See Note 4 to the accompanying consolidated financial statements.) We provide funding to our investees from time to time. During the year ended
December 31, 2018
, we contributed
$17 million
in limited liability companies that sponsor renewable energy projects related to solar energy.
|
•
|
Redeemable Noncontrolling Interest
|
Due to business combinations, we also have redeemable equity balances of
$415 million
, which may require the use of cash in the event holders of noncontrolling interests put their interests to us. (See Note 11 to the accompanying consolidated financial statements.)
|
•
|
Content Acquisition
|
We plan to continue to invest significantly in the creation and acquisition of new content. Additional information regarding contractual commitments to acquire content is set forth in Note 22 to the accompanying consolidated financial statements.
|
•
|
Common Stock Repurchases
|
The Company's stock repurchase program, which authorized management to purchase shares of the Company's common stock from time to time through open market purchases or privately negotiated transactions at prevailing market prices or pursuant to one or more accelerated stock repurchase or other derivative arrangements as permitted by securities laws and other legal requirements and subject to stock price, business and market conditions and other factors, expired on
October 8, 2017
, and we have not repurchased any shares of common stock since then. As of
December 31, 2018
, the Company had repurchased
3 million
and
164 million
shares of our Series A and Series C common stock over the life of the program for the aggregate purchase price of
$171 million
and
$6.6 billion
, respectively. We have funded our stock repurchases through a combination of cash on hand, cash generated by operations and the issuance of debt. In the future, should our board of directors authorize a new stock repurchase program, we may also choose to fund stock repurchases through borrowings under our revolving credit facility and future financing transactions. (See Note 12 to the accompanying consolidated financial statements).
|
•
|
Income Taxes and Interest
|
We expect to continue to make payments for income taxes and interest on our outstanding senior notes. During the year ended
December 31, 2018
, we made cash payments of
$389 million
and
$740 million
for income taxes and interest on our outstanding debt, respectively.
|
•
|
Debt
|
We have
$1.8 billion
of outstanding senior notes due in 2019, of which $411 million of our 5.625% senior notes due in August 2019 will be redeemed on March 21, 2019. (See Note 9 to the accompanying consolidated financial statements.) As of
December 31, 2018
, the Company had repaid in full
$2 billion
in Term Loans using cash from operations and borrowings under the Company's commercial paper program.
|
•
|
Restructuring and Other
|
Our uses of cash include restructuring and other charges related to contract terminations and employee terminations. These charges result from activities to integrate Scripps Networks and establish an efficient cost structure. As of
December 31, 2018
, we had restructuring liabilities of
$108 million
related to employee and contract terminations. (See Note 17 to the accompanying consolidated financial statements.) We expect to incur additional restructuring and integration expenses related to employee and contract terminations, relocation from the Silver Spring property to New York City, and costs related to content.
|
•
|
Share-Based Compensation
|
We expect to continue to make payments for vested cash-settled share-based awards. Actual amounts expensed and payable for cash-settled awards are dependent on future fair value calculations, which are primarily affected by changes in our stock price or changes in the number of awards outstanding. During 2018, no payments were made for cash-settled share-based awards. As of December 31, 2018, liabilities totaled
$54 million
for outstanding liability-classified share-based compensation awards, of which
$23 million
was classified as current. (See Note 15 to the accompanying consolidated financial statements.)
64
Cash Flows
Changes in cash and cash equivalents were as follows (in millions).
|
Year Ended December 31,
|
||||||||||||
|
2018
|
2017
|
2016
|
||||||||||
|
Cash and cash equivalents, beginning of period
|
$
|
7,309
|
|
$
|
300
|
|
$
|
390
|
|
|||
|
Cash provided by operating activities
|
2,576
|
|
1,629
|
|
1,380
|
|
||||||
|
Cash used in investing activities
|
(8,593
|
)
|
(633
|
)
|
(256
|
)
|
||||||
|
Cash (used in) provided by financing activities
|
(283
|
)
|
5,951
|
|
(1,184
|
)
|
||||||
|
Effect of exchange rate changes on cash and cash equivalents
|
(23
|
)
|
62
|
|
(30
|
)
|
||||||
|
Net change in cash and cash equivalents
|
(6,323
|
)
|
7,009
|
|
(90
|
)
|
||||||
|
Cash and cash equivalents, end of period
|
$
|
986
|
|
$
|
7,309
|
|
$
|
300
|
|
|||
Operating Activities
Cash provided by operating activities increased
$947 million
for the
twelve months ended December 31, 2018
as compared to the
twelve months ended December 31, 2017
. The increase was primarily attributable to increases in income following the acquisition of Scripps Networks, partially offset by cash paid for interest and spending on content, including sports rights.
Cash provided by operating activities increased $249 million for the year ended
December 31, 2017
as compared to the year ended
December 31, 2016
. The increase was primarily attributable to a $253 million decrease in cash paid for taxes. The decrease in cash paid for taxes, net, for the year ended December 31, 2017 is mostly due to the tax impact from our investments in limited liability companies that sponsor renewable energy projects related to solar energy. (See Note 5 and Note 22 to the accompanying consolidated financial statements.) Declines in working capital, primarily due to changes in accounts receivable, were offset by a decrease in the net negative effect of foreign currency and increases in payables.
Investing Activities
Cash flows used in investing activities increased
$8.0 billion
for the
twelve months ended December 31, 2018
as compared to the
twelve months ended December 31, 2017
. The increase was primarily attributable to the acquisition of Scripps Networks, partially offset by a reduction in payments for investments. See Note 3 to the accompanying consolidated financial statements.
Cash flows used in investing activities increased $377 million for the year ended
December 31, 2017
as compared to the year ended December 31, 2016. The increase was mostly attributable to an increase in payments for investments of $172 million, including renewable energy projects and payments for derivative instruments of $98 million that did not receive hedge accounting, but economically hedged pricing risk for the senior notes issued September 21, 2017.
Financing Activities
Cash flows provided by financing activities decreased
$6.2 billion
for the
twelve months ended December 31, 2018
as compared to the
twelve months ended December 31, 2017
. The decrease was primarily attributable to net borrowings in 2017 used to finance the acquisition of Scripps Networks, offset by decreases in cash used to buy back stock and increases in issuances of commercial paper.
Cash flows provided by financing activities increased $7.1 billion for the twelve months ended December 31, 2017 as compared to the twelve months ended December 31, 2016. The increase was primarily attributable to proceeds from the issuance of senior notes which were used to finance the acquisition of Scripps Networks (see Note 9 to the accompanying consolidated financial statements) and a decrease in repurchases of stock of $771 million, offset by an increase in principal repayments of debt.
65
Capital Resources
As of
December 31, 2018
, capital resources were comprised of the following (in millions).
|
|
December 31, 2018
|
|||||||||||||||
|
|
Total
Capacity
|
Outstanding
Letters of
Credit
|
Outstanding
Indebtedness
|
Unused
Capacity
|
||||||||||||
|
Cash and cash equivalents
|
$
|
986
|
|
$
|
—
|
|
$
|
—
|
|
$
|
986
|
|
||||
|
Revolving credit facility
|
2,500
|
|
1
|
|
225
|
|
2,274
|
|
||||||||
|
Senior notes
(a)
|
16,671
|
|
—
|
|
16,671
|
|
—
|
|
||||||||
|
Program financing line of credit
|
26
|
|
—
|
|
22
|
|
4
|
|
||||||||
|
Total
|
$
|
20,183
|
|
$
|
1
|
|
$
|
16,918
|
|
$
|
3,264
|
|
||||
(a)
Interest on senior notes is paid annually, semi-annually or quarterly. Our senior notes outstanding as of
December 31, 2018
had interest rates that ranged from 1.90% to 6.35% and will mature between 2019 and 2047.
We expect that our cash balance, cash generated from operations and availability under our revolving credit facility will be sufficient to fund our cash needs for the next twelve months. Our borrowing costs and access to the capital markets can be affected by short and long-term debt ratings assigned by independent rating agencies which are based, in part, on our performance as measured by credit metrics, such as interest coverage and leverage ratios.
As of
December 31, 2018
, we held
$242 million
of our
$986 million
of cash and cash equivalents in our foreign subsidiaries. The TCJA enacted on December 22, 2017 featured a participation exemption regime with current taxation of certain foreign income and imposes a mandatory repatriation tax on unremitted foreign earnings. The U.S. taxation of these amounts, notwithstanding, we intend to continue to reinvest these funds outside of the U.S. Our current plans do not demonstrate a need to repatriate them to the U.S. However, if these funds are needed in the U.S., we would be required to accrue and pay non-U.S. taxes to repatriate them. The determination of the amount of unrecognized deferred income tax liability with respect to these undistributed foreign earnings is not practicable.
Additional information regarding the changes in our outstanding indebtedness and the significant terms and provisions of our revolving credit facility and outstanding indebtedness is discussed in Note 9 to the accompanying consolidated financial statements included in Item 8, “Financial Statements and Supplementary Data” in this Annual Report on Form 10-K.
COMMITMENTS AND OFF-BALANCE SHEET ARRANGEMENTS
Obligations
As of
December 31, 2018
, our significant contractual obligations, including related payments due by period, were as follows (in millions).
|
Payments Due by Period
|
||||||||||||||||||||
|
Total
|
Less than 1
Year
|
1-3 Years
|
3-5 Years
|
More than
5 Years
|
||||||||||||||||
|
Long-term debt:
|
||||||||||||||||||||
|
Principal payments
|
$
|
16,671
|
|
$
|
1,811
|
|
$
|
2,038
|
|
$
|
2,779
|
|
$
|
10,043
|
|
|||||
|
Interest payments
|
7,762
|
|
665
|
|
1,134
|
|
954
|
|
5,009
|
|
||||||||||
|
Capital lease obligations:
|
||||||||||||||||||||
|
Principal payments
|
252
|
|
42
|
|
75
|
|
67
|
|
68
|
|
||||||||||
|
Interest payments
|
34
|
|
9
|
|
12
|
|
8
|
|
5
|
|
||||||||||
|
Operating lease obligations
|
944
|
|
89
|
|
182
|
|
109
|
|
564
|
|
||||||||||
|
Content
|
6,012
|
|
1,431
|
|
1,470
|
|
972
|
|
2,139
|
|
||||||||||
|
Other
|
1,363
|
|
523
|
|
552
|
|
199
|
|
89
|
|
||||||||||
|
Total
|
$
|
33,038
|
|
$
|
4,570
|
|
$
|
5,463
|
|
$
|
5,088
|
|
$
|
17,917
|
|
|||||
66
The above table does not include certain long-term obligations as the timing or the amount of the payments cannot be predicted. For example, as of
December 31, 2018
, we have recorded
$415 million
for redeemable equity (see Note 11 to the accompanying consolidated financial statements), although we are unable to predict reasonably the ultimate amount or timing of any payment. The current portion of the liability for cash-settled share-based compensation awards was
$23 million
as of
December 31, 2018
. Additionally, reserves for unrecognized tax benefits have been excluded from the above table because we are unable to predict reasonably the ultimate amount or timing of settlement. Our unrecognized tax benefits totaled
$378 million
as of
December 31, 2018
.
The above table also does not include DCL's revolving credit facility that, during the year ended
December 31, 2018
, allowed DCL and certain designated foreign subsidiaries of DCL to borrow up to
$2.5 billion
, including a
$100 million
sublimit for the issuance of standby letters of credit and a
$50 million
sublimit for swingline loans. Borrowing capacity under this agreement is reduced by the outstanding borrowings under the commercial paper program discussed below. As of
December 31, 2018
, the revolving credit facility agreement provided for a maturity date of
August 11, 2022
and the option for up to two additional 364-day renewal periods.
From time to time we may provide our equity method investees additional funding that has not been committed to as of
December 31, 2018
based on unforeseen investee opportunities or cash flow needs. (See Note 4 to the accompanying consolidated financial statements.)
Long-term Debt
Principal payments on long-term debt reflect the repayment of our outstanding senior notes, at face value, assuming repayment will occur upon maturity. Interest payments on our outstanding senior notes are projected based on their contractual rate and maturity.
Capital Lease Obligations
We acquire satellite transponders and other equipment through multi-year capital lease arrangements. Principal payments on capital lease obligations reflect amounts due under our capital lease agreements. Interest payments on our outstanding capital lease obligations are based on the stated or implied rate in our capital lease agreements.
Operating Lease Obligations
We obtain office space and equipment under multi-year lease arrangements. Most operating leases are not cancelable prior to their expiration. Payments for operating leases represent the amounts due under the agreements assuming the agreements are not canceled prior to their expiration.
Purchase Obligations
Content purchase obligations include commitments and liabilities associated with third-party producers and sports associations for content that airs on our television networks. Production contracts generally require: purchase of a specified number of episodes; payments over the term of the license; and include both programs that have been delivered and are available for airing and programs that have not yet been produced or sporting events that have not yet taken place. If the content is ultimately never produced, our commitments expire without obligation. The commitments disclosed above exclude content liabilities recognized on the consolidated balance sheet. We expect to enter into additional production contracts and content licenses to meet our future content needs.
Other purchase obligations include agreements with certain vendors and suppliers for the purchase of goods and services whereby the underlying agreements are enforceable, legally binding and specify all significant terms. Significant purchase obligations include transmission services, television rating services, marketing research, employment contracts, equipment purchases, and information technology and other services. The Company has contracts that do not require the purchase of fixed or minimum quantities and generally may be terminated with a 30-day to 60-day advance notice without penalty, and are not included in the table above past the 30-day to 60-day advance notice period. Amounts related to employment contracts include base compensation and do not include compensation contingent on future events.
67
Put Rights
The Company has granted put rights to certain consolidated subsidiaries. Harpo, GoldenTree, Hasbro, Inc. ("Hasbro") and J:COM have the right to require the Company to purchase their remaining noncontrolling interests in OWN, MTG, Discovery Family and Discovery Japan, respectively. The Company recorded the carrying value of the noncontrolling interest in the equity associated with the put rights for OWN, MTG, Discovery Family and Discovery Japan as a component of redeemable noncontrolling interest in the amounts of
$58 million
,
$121 million
,
$206 million
and
$30 million
, respectively. (See Note 11 to the accompanying consolidated financial statements.)
Pension Obligations
We sponsor a qualified defined benefit pension plan (“Pension Plan”) that covers certain U.S.-based employees. We also have a non-qualified Supplemental Executive Retirement Plan (“SERP”).
Contractual commitments summarized in the contractual obligations table include payments to meet minimum funding requirements of our Pension Plan in 2019 and estimated benefit payments for our SERP. We do not anticipate contributing any cash to fund our Pension Plan in 2019. Payments for the SERP have been estimated over a ten-year period. Accordingly, the amounts in the over five years column include estimated payments for the 2024 through 2028 periods. While benefit payments under these plans are expected to continue beyond 2028, we believe it is not practicable to estimate payments beyond this period.
Non-controlling Interest
The Food Network and Cooking Channel are operated and organized under the terms of the TV Food Network Partnership (the "Partnership"). The Company and a non-controlling owner hold interests in the Partnership. During the fourth quarter of 2016, the Partnership agreement was extended and specifies a dissolution date of December 31, 2020. If the term of the Partnership is not extended prior to that date, the Partnership agreement permits the Company, as holder of
80%
of the applicable votes, to reconstitute the Partnership and continue its business. If for some reason the Partnership is not continued, it will be required to limit its activities to winding up, settling debts, liquidating assets and distributing proceeds to the partners in proportion to their partnership interests.
Off-Balance Sheet Arrangements
We have no material off-balance sheet arrangements (as defined in Item 303(a)(4) of Regulation S-K) that have or are reasonably likely to have a current or future effect on our financial condition, changes in financial condition, revenues or expenses, results of operations, liquidity, capital expenditures or capital resources.
RELATED PARTY TRANSACTIONS
In the ordinary course of business, we enter into transactions with related parties, primarily our equity method investees and Liberty Media, Liberty Global, Liberty Interactive and Liberty Broadband (together, the "Liberty Entities"). Information regarding transactions and amounts with related parties is discussed in Note 21 to the accompanying consolidated financial statements included in Item 8, “Financial Statements and Supplementary Data” in this Annual Report on Form 10-K.
NEW ACCOUNTING AND REPORTING PRONOUNCEMENTS
We adopted certain accounting and reporting standards during
2018
. Information regarding our adoption of new accounting and reporting standards is discussed in Note 2 to the accompanying consolidated financial statements included in Item 8, “Financial Statements and Supplementary Data” in this Annual Report on Form 10-K.
68
CRITICAL ACCOUNTING POLICIES AND ESTIMATES
Our consolidated financial statements are prepared in accordance with GAAP, which requires management to make estimates, judgments and assumptions that affect the amounts reported in the consolidated financial statements included in Item 8, "Financial Statements and Supplementary Data" in this Annual Report on Form 10-K and accompanying notes. Management considers an accounting policy to be critical if it is important to reporting our financial condition and results of operations, and if it requires significant judgment and estimates on the part of management in its application. The development and selection of these critical accounting policies have been determined by management and the related disclosures have been reviewed with the Audit Committee of the Board of Directors of the Company. We consider policies relating to the following matters to be critical accounting policies:
|
•
|
Revenue recognition;
|
|
•
|
Goodwill and intangible assets;
|
|
•
|
Income taxes;
|
|
•
|
Business combinations (See Note 3);
|
|
•
|
Content rights; and
|
|
•
|
Equity method investments.
|
With respect to our accounting policy for goodwill, we further supplement disclosures in Note 2 with the following:
Goodwill is allocated to our reporting units, which are our operating segments or one level below our operating segments (the component level). Reporting units are determined by the discrete financial information available for the component and whether it is regularly reviewed by segment management. Components are aggregated into a single reporting unit if they share similar economic characteristics. Our reporting units are as follows: U.S. Networks, Europe, Latin America, and Asia-Pacific.
We evaluate our goodwill for impairment annually as of November 30 or earlier upon the occurrence of substantive unfavorable changes in economic conditions, industry trends, costs, cash flows, or ongoing declines in market capitalization. The impairment test requires judgment, including the identification of reporting units, the assignment of assets, liabilities and goodwill to reporting units, and the determination of fair value of each reporting unit if a quantitative test is performed. If we believe that as a result of our qualitative assessment it is more likely than not that the fair value of a reporting unit is greater than its carrying amount, a quantitative impairment test is not required.
During the fourth quarter of 2018, we performed a qualitative goodwill impairment assessment for all reporting units. This assessment included, but was not limited to, consideration of the results of the Company's most recent quantitative impairment test, consideration of macroeconomic conditions, industry and market conditions, cost factors, cash flows, changes in key personnel and the Company's share price. Based on this assessment, the Company determined that it was more likely than not that the fair value of those reporting units exceeded their carrying values, except for its Asia-Pacific reporting unit.
Based on the results of the qualitative assessment, the Company performed a quantitative step 1 impairment test (comparison of fair value to carrying value) for its Asia-Pacific reporting unit, which indicated limited headroom (the excess of fair value over carrying value) of 10%. In performing the step 1 test, the Company determined the fair value of its Asia-Pacific reporting unit by using a combination of discounted cash flow ("DCF") analyses and market-based valuation methodologies. The results of these valuation methodologies were weighted 50% towards the DCF analyses and 50% towards the market-based approach. The models relied on significant judgments and assumptions surrounding general market conditions, short-term growth rates, a terminal growth rate of 2.5%, and detailed management forecasts of future cash flow projections. Fair values were determined primarily by discounting estimated future cash flows at a weighted average cost of capital of 12%. During our annual impairment testing, we evaluated the sensitivity of our most critical assumption, the discount rate, and determined that a 100 basis point change in the discount rate selected would not have impacted the test results. Additionally, the Company could reduce the terminal growth rate from its current 2.5% to 2.0% and the fair value of the Asia-Pacific reporting unit would still exceed its carrying value. As of December 31, 2018, the carrying value of goodwill assigned to the Asia-Pacific reporting unit was $188 million. Management will continue to monitor this reporting unit for changes in the business environment that could impact recoverability. The recoverability of goodwill is dependent upon the continued growth of cash flows from our business activities. See Item 1A, "Risk Factors" for details on all significant risks that could impact the Company's ability to successfully grow its cash flows. Additionally, as the Asia-Pacific reporting unit operates in foreign markets with various functional currencies and has significant U.S. dollar denominated assets, changes in foreign exchange rates that result in strengthening of the U.S. dollar may negatively impact the fair value of the reporting unit and the calculation of excess carrying value.
69
For an in-depth discussion of each of our significant accounting policies, including our critical accounting policies and further information regarding estimates and assumptions involved in their application, see Note 2 to the accompanying consolidated financial statements included in Item 8, “Financial Statements and Supplementary Data” in this Annual Report on Form 10-K.
ITEM 7A. Quantitative and Qualitative Disclosures about Market Risk.
Our financial position, earnings and cash flows are exposed to market risks and can be affected by, among other things, economic conditions, interest rate changes, foreign currency fluctuations, and changes in the market values of investments. We have established policies, procedures and internal processes governing our management of market risks and the use of financial instruments to manage our exposure to such risks.
Interest Rates
We are exposed to the impact of interest rate changes primarily through our actual and potential borrowing activities. During the year ended
December 31, 2018
, we had access to a
$2.5 billion
revolving credit facility with outstanding borrowings of
$225 million
as of
December 31, 2018
. We also have access to a commercial paper program and had
no
outstanding borrowings as of
December 31, 2018
. The interest rate on borrowings under the revolving credit facility is variable based on an underlying index and DCL's then-current credit rating for its publicly traded debt. The revolving credit facility provides for a maturity date of
August 11, 2022
and the option for up to two additional 364-day renewal periods. As of
December 31, 2018
, we had outstanding debt with a book value of
$16.7 billion
under various public senior notes with fixed interest rates and
$400 million
with a floating interest rate.
In 2017, we entered into a delayed draw unsecured term loan credit facility, with three-year and five-year tranches, each with a principal amount of up to
$1 billion
. The Term Loans' interest rates were based, at the Company's option, on either adjusted LIBOR plus a margin, or an alternate base rate plus a margin. As of
December 31, 2018
, we had repaid the Term Loans in full.
Our current objectives in managing exposure to interest rate changes are to limit the impact of interest rates on earnings and cash flows. To achieve these objectives, we may enter into variable interest rate swaps, effectively converting fixed rate borrowings to variable rate borrowings indexed to LIBOR, in order to reduce the amount of interest paid. As of
December 31, 2018
, we have no outstanding interest rate swaps.
As of
December 31, 2018
, the fair value of our outstanding public senior notes was
$16.3 billion
. The fair value of our long-term debt may vary as a result of market conditions and other factors. A change in market interest rates will impact the fair market value of our fixed rate debt. The potential change in fair value of these senior notes from an adverse 100 basis-point change in quoted interest rates across all maturities, often referred to as a parallel shift in the yield curve, would be approximately
$1.1 billion
as of
December 31, 2018
.
Foreign Currency Exchange Rates
We transact business globally and are subject to risks associated with changing foreign currency exchange rates. Market risk refers to the risk of loss arising from adverse changes in foreign currency exchange rates. The risk of loss can be assessed from the perspective of adverse changes in fair values, cash flows and future earnings. Our International Networks segment operates from the following hubs: EMEA, Latin America and Asia. Cash is primarily managed from five global locations with net earnings reinvested locally and working capital requirements met from existing liquid funds. To the extent such funds are not sufficient to meet working capital requirements, drawdowns in the appropriate local currency are available from intercompany borrowings or drawdowns from our revolving credit facility. The earnings of certain international operations are expected to be reinvested in those businesses indefinitely.
The functional currency of most of our international subsidiaries is the local currency. We are exposed to foreign currency risk to the extent that we enter into transactions denominated in currencies other than our subsidiaries’ respective functional currencies ("non-functional currency risk"). Such transactions include affiliate and ad sales arrangements, content arrangements, equipment and other vendor purchases and intercompany transactions. Changes in exchange rates with respect to amounts recorded in our consolidated balance sheets related to these items will result in unrealized foreign currency transaction gains and losses based upon period-end exchange rates. We also record realized foreign currency transaction gains and losses upon settlement of the transactions. Moreover, we will experience fluctuations in our revenues, costs and expenses solely as a result of changes in foreign currency exchange rates.
70
We also are exposed to unfavorable and potentially volatile fluctuations of the U.S. dollar, which is our reporting currency, against the currencies of our operating subsidiaries when their respective financial statements are translated into U.S. dollars for inclusion in our consolidated financial statements. Cumulative translation adjustments are recorded in accumulated other comprehensive loss as a separate component of equity. Any increase or decrease in the value of the U.S. dollar against any foreign functional currency of one of our operating subsidiaries will cause us to experience unrealized foreign currency translation gains (losses) with respect to amounts already invested in such foreign currencies. Accordingly, we may experience a negative impact on our net income (loss), other comprehensive income (loss) and equity with respect to our holdings solely as a result of changes in foreign currency.
The majority of our foreign currency exposure is to the Euro, Polish zloty, and the Brazilian real. We may enter into spot, forward and option contracts that change in value as foreign currency exchange rates change to hedge certain exposures associated with affiliate revenue, the cost for producing or acquiring content, certain intercompany transactions or in connection with forecasted business combinations. These contracts hedge forecasted foreign currency transactions in order to mitigate fluctuations in our earnings and cash flows associated with changes in foreign currency exchange rates. Our objective in managing exposure to foreign currency fluctuations is to reduce volatility of earnings and cash flows. The net market value of our foreign currency derivative instruments intended to hedge future cash flows held at
December 31, 2018
was an asset value of
$10 million
. Most of our non-functional currency risks related to our revenue, operating expenses and capital expenditures were not hedged as of
December 31, 2018
. We generally do not hedge against the risk that we may incur non-cash losses upon the translation of the financial statements of our subsidiaries and affiliates into U.S. dollars.
Derivatives
We may use derivative financial instruments to modify our exposure to exogenous events and market risks from changes in foreign currency exchange rates, interest rates, and the fair value of investments with readily determinable fair values. We do not use derivative financial instruments unless there is an underlying exposure. While derivatives are used to mitigate cash flow risk and the risk of declines in fair value, they also limit potential economic benefits to our business in the event of positive shifts in foreign currency exchange rates, interest rates and market values. We do not hold or enter into financial instruments for speculative trading purposes.
Market Values of Investments
In addition to derivatives, we had investments in entities accounted as equity method investments, equity investments, and other highly liquid instruments, such as money market and mutual funds, that are accounted for at fair value. The carrying values of investments in equity method investees, equity investments, and equity securities were
$935 million
,
$456 million
, and
$502 million
, respectively, at
December 31, 2018
. Investments in mutual funds include both fixed rate and floating rate interest earning securities that carry a degree of interest rate risk. Fixed rate securities may have their fair market value adversely impacted due to a rise in interest rates, while floating rate securities may produce less income than predicted if interest rates fall. Due in part to these factors, our income from such investments may decrease in the future.
71
ITEM 8. Financial Statements and Supplementary Data.
|
|
Page
|
72
MANAGEMENT’S REPORT ON INTERNAL CONTROL OVER FINANCIAL REPORTING
Management of Discovery, Inc. (the “Company”) is responsible for establishing and maintaining adequate internal control over financial reporting, as such term is defined in Rule 13a-15(f) and Rule 15d-15(f) of the Securities Exchange Act of 1934, as amended. The Company’s internal control over financial reporting includes those policies and procedures that (i) pertain to the maintenance of records that, in reasonable detail, accurately and fairly reflect the transactions and disposition of the assets of the Company; (ii) provide reasonable assurance that transactions are recorded as necessary to permit preparation of financial statements in accordance with generally accepted accounting principles, and provide reasonable assurance that receipts and expenditures of the Company are being made only in accordance with authorizations of management and the directors of the Company; and (iii) provide reasonable assurance regarding prevention or timely detection of unauthorized acquisition, use, or disposition of the Company’s assets that could have a material effect on the consolidated financial statements.
Internal control over financial reporting is designed to provide reasonable assurance regarding the reliability of financial reporting and the preparation of financial statements prepared for external purposes in accordance with generally accepted accounting principles. Because of the inherent limitations in any internal control, no matter how well designed, internal control over financial reporting may not prevent or detect misstatements. Also, projections of any evaluation of effectiveness to future periods are subject to the risk that controls may become inadequate because of changes in conditions, or that the degree of compliance with the policies or procedures may deteriorate.
The Company’s management, with the participation of its Chief Executive Officer and Chief Financial Officer, conducted an evaluation of the effectiveness of the Company’s system of internal control over financial reporting as of
December 31, 2018
based on the framework set forth in
Internal Control – Integrated Framework (2013)
issued by the Committee of Sponsoring Organizations of the Treadway Commission. Based on its evaluation, management concluded that, as of
December 31, 2018
, the Company’s internal control over financial reporting was effective at a reasonable assurance level based on the specified criteria.
The Company’s management has excluded Scripps Networks Interactive, Inc. ("Scripps Networks") from its assessment of internal control over financial reporting as of December 31, 2018 because it was acquired by the Company in a purchase business combination in 2018. Scripps Networks is a wholly-owned subsidiary whose total assets and total revenues excluded from the assessment represented approximately
11%
and
29%
, respectively, of the Company’s related consolidated financial statement amounts as of and for the year ended December 31, 2018.
The effectiveness of the Company’s internal control over financial reporting as of
December 31, 2018
has been audited by PricewaterhouseCoopers LLP, an independent registered public accounting firm, as stated in their report in Item 8 of Part II of this Annual Report on Form 10-K under the caption “Report of Independent Registered Public Accounting Firm.”
73
Report of Independent Registered Public Accounting Firm
To the Board of Directors and Stockholders of Discovery, Inc.
Opinions on the Financial Statements and Internal Control over Financial Reporting
We have audited the accompanying consolidated balance sheets of Discovery, Inc. and its subsidiaries (the "Company") as of
December 31, 2018
and
2017
,
and the related consolidated statements of operations, of comprehensive income (loss), of equity and of cash flows for each of the three years in the period ended
December 31, 2018
, including the related notes (collectively referred to as the “consolidated financial statements”).
We also have audited the Company's internal control over financial reporting as of
December 31, 2018
, based on criteria established in
Internal Control - Integrated Framework
(2013)
issued by the Committee of Sponsoring Organizations of the Treadway Commission (COSO).
In our opinion, the consolidated
financial statements referred to above present fairly, in all material respects, the financial position of the Company as of
December 31, 2018
and
2017
,
and the results of its operations and its cash flows for each of the three years in the period ended
December 31, 2018
in conformity with accounting principles generally accepted in the United States of America. Also in our opinion, the Company maintained, in all material respects, effective internal control over financial reporting as of
December 31, 2018
, based on criteria established in
Internal Control - Integrated Framework
(2013)
issued by the COSO.
Change in Accounting Principle
As discussed in Note 2 to the consolidated financial statements, the Company changed the manner in which it accounts for revenue from contracts with customers in 2018.
Basis for Opinions
The Company's management is responsible for these consolidated financial statements, for maintaining effective internal control over financial reporting, and for its assessment of the effectiveness of internal control over financial reporting, included in the accompanying Management’s Report On Internal Control Over Financial Reporting. Our responsibility is to express opinions on the Company’s consolidated
financial statements and on the Company's internal control over financial reporting based on our audits. We are a public accounting firm registered with the Public Company Accounting Oversight Board (United States) (PCAOB) and are required to be independent with respect to the Company in accordance with the U.S. federal securities laws and the applicable rules and regulations of the Securities and Exchange Commission and the PCAOB.
We conducted our audits in accordance with the standards of the PCAOB. Those standards require that we plan and perform the audits to obtain reasonable assurance about whether the consolidated
financial statements are free of material misstatement, whether due to error or fraud, and whether effective internal control over financial reporting was maintained in all material respects.
Our audits of the consolidated
financial statements included performing procedures to assess the risks of material misstatement of the consolidated
financial statements, whether due to error or fraud, and performing procedures that respond to those risks. Such procedures included examining, on a test basis, evidence regarding the amounts and disclosures in the consolidated financial statements. Our audits also included evaluating the accounting principles used and significant estimates made by management, as well as evaluating the overall presentation of the consolidated
financial statements. Our audit of internal control over financial reporting included obtaining an understanding of internal control over financial reporting, assessing the risk that a material weakness exists, and testing and evaluating the design and operating effectiveness of internal control based on the assessed risk. Our audits also included performing such other procedures as we considered necessary in the circumstances. We believe that our audits provide a reasonable basis for our opinions.
As described in Management’s Report On Internal Control Over Financial Reporting, management has excluded Scripps Networks from its assessment of internal control over financial reporting as of December 31, 2018 because it was acquired by the Company in a purchase business combination during 2018. We have also excluded Scripps Networks from our audit of internal control over financial reporting. Scripps Networks is a wholly-owned subsidiary whose total assets and total revenues excluded from management’s assessment and our audit of internal control over financial reporting represent approximately 11% and approximately 29%, respectively, of the related consolidated financial statement amounts as of and for the year ended December 31, 2018.
74
Definition and Limitations of Internal Control over Financial Reporting
A company’s internal control over financial reporting is a process designed to provide reasonable assurance regarding the reliability of financial reporting and the preparation of financial statements for external purposes in accordance with generally accepted accounting principles. A company’s internal control over financial reporting includes those policies and procedures that (i) pertain to the maintenance of records that, in reasonable detail, accurately and fairly reflect the transactions and dispositions of the assets of the company; (ii) provide reasonable assurance that transactions are recorded as necessary to permit preparation of financial statements in accordance with generally accepted accounting principles, and that receipts and expenditures of the company are being made only in accordance with authorizations of management and directors of the company; and (iii) provide reasonable assurance regarding prevention or timely detection of unauthorized acquisition, use, or disposition of the company’s assets that could have a material effect on the financial statements.
Because of its inherent limitations, internal control over financial reporting may not prevent or detect misstatements. Also, projections of any evaluation of effectiveness to future periods are subject to the risk that controls may become inadequate because of changes in conditions, or that the degree of compliance with the policies or procedures may deteriorate.
/s/ PricewaterhouseCoopers LLP
McLean, Virginia
March 1, 2019
We have served as the Company’s auditor since 2008.
75
DISCOVERY, INC.
CONSOLIDATED BALANCE SHEETS
(in millions, except par value)
|
|
December 31,
|
|||||||
|
|
2018
|
2017
|
||||||
|
ASSETS
|
||||||||
|
Current assets:
|
||||||||
|
Cash and cash equivalents
|
$
|
986
|
|
$
|
7,309
|
|
||
|
Receivables, net
|
2,620
|
|
1,838
|
|
||||
|
Content rights, net
|
313
|
|
410
|
|
||||
|
Prepaid expenses and other current assets
|
312
|
|
434
|
|
||||
|
Total current assets
|
4,231
|
|
9,991
|
|
||||
|
Noncurrent content rights, net
|
3,069
|
|
2,213
|
|
||||
|
Property and equipment, net
|
800
|
|
597
|
|
||||
|
Goodwill
|
13,006
|
|
7,073
|
|
||||
|
Intangible assets, net
|
9,674
|
|
1,770
|
|
||||
|
Equity method investments, including note receivable (See Note 4)
|
935
|
|
335
|
|
||||
|
Other noncurrent assets
|
835
|
|
576
|
|
||||
|
Total assets
|
$
|
32,550
|
|
$
|
22,555
|
|
||
|
LIABILITIES AND EQUITY
|
||||||||
|
Current liabilities:
|
||||||||
|
Accounts payable
|
$
|
325
|
|
$
|
277
|
|
||
|
Accrued liabilities
|
1,563
|
|
1,309
|
|
||||
|
Deferred revenues
|
249
|
|
255
|
|
||||
|
Current portion of debt
|
1,860
|
|
30
|
|
||||
|
Total current liabilities
|
3,997
|
|
1,871
|
|
||||
|
Noncurrent portion of debt
|
15,185
|
|
14,755
|
|
||||
|
Deferred income taxes
|
1,811
|
|
319
|
|
||||
|
Other noncurrent liabilities
|
1,040
|
|
587
|
|
||||
|
Total liabilities
|
22,033
|
|
17,532
|
|
||||
|
Commitments and contingencies (See Note 22)
|
|
|
||||||
|
Redeemable noncontrolling interests
|
415
|
|
413
|
|
||||
|
Equity:
|
||||||||
|
Discovery, Inc. stockholders’ equity:
|
||||||||
|
Series A-1 convertible preferred stock: $0.01 par value; 8 shares authorized, issued, and outstanding
|
—
|
|
—
|
|
||||
|
Series C-1 convertible preferred stock: $0.01 par value; 6 shares authorized, issued, and outstanding
|
—
|
|
—
|
|
||||
|
Series A common stock: $0.01 par value; 1,700 shares authorized; 160 and 157 shares issued; and 157 and 154 shares outstanding
|
2
|
|
1
|
|
||||
|
Series B convertible common stock: $0.01 par value; 100 shares authorized; 7 shares issued and outstanding
|
—
|
|
—
|
|
||||
|
Series C common stock: $0.01 par value; 2,000 shares authorized; 524 and 383 shares issued; and 360 and 219 shares outstanding
|
5
|
|
4
|
|
||||
|
Additional paid-in capital
|
10,647
|
|
7,295
|
|
||||
|
Treasury stock, at cost: 167 shares
|
(6,737
|
)
|
(6,737
|
)
|
||||
|
Retained earnings
|
5,254
|
|
4,632
|
|
||||
|
Accumulated other comprehensive loss
|
(785
|
)
|
(585
|
)
|
||||
|
Total Discovery, Inc. stockholders’ equity
|
8,386
|
|
4,610
|
|
||||
|
Noncontrolling interests
|
1,716
|
|
—
|
|
||||
|
Total equity
|
10,102
|
|
4,610
|
|
||||
|
Total liabilities and equity
|
$
|
32,550
|
|
$
|
22,555
|
|
||
The accompanying notes are an integral part of these consolidated financial statements.
76
DISCOVERY, INC.
CONSOLIDATED STATEMENTS OF OPERATIONS
(in millions, except per share amounts)
|
|
Year Ended December 31,
|
|||||||||||
|
|
2018
|
2017
|
2016
|
|||||||||
|
Revenues:
|
||||||||||||
|
Distribution
|
$
|
4,538
|
|
$
|
3,474
|
|
$
|
3,213
|
|
|||
|
Advertising
|
5,514
|
|
3,073
|
|
2,970
|
|
||||||
|
Other
|
501
|
|
326
|
|
314
|
|
||||||
|
Total revenues
|
10,553
|
|
6,873
|
|
6,497
|
|
||||||
|
Costs and expenses:
|
||||||||||||
|
Costs of revenues, excluding depreciation and amortization
|
3,935
|
|
2,656
|
|
2,432
|
|
||||||
|
Selling, general and administrative
|
2,620
|
|
1,768
|
|
1,690
|
|
||||||
|
Impairment of goodwill
|
—
|
|
1,327
|
|
—
|
|
||||||
|
Depreciation and amortization
|
1,398
|
|
330
|
|
322
|
|
||||||
|
Restructuring and other charges
|
750
|
|
75
|
|
58
|
|
||||||
|
(Gain) loss on disposition
|
(84
|
)
|
4
|
|
(63
|
)
|
||||||
|
Total costs and expenses
|
8,619
|
|
6,160
|
|
4,439
|
|
||||||
|
Operating income
|
1,934
|
|
713
|
|
2,058
|
|
||||||
|
Interest expense, net
|
(729
|
)
|
(475
|
)
|
(353
|
)
|
||||||
|
Loss on extinguishment of debt
|
—
|
|
(54
|
)
|
—
|
|
||||||
|
Loss from equity investees, net
|
(63
|
)
|
(211
|
)
|
(38
|
)
|
||||||
|
Other (expense) income, net
|
(120
|
)
|
(110
|
)
|
4
|
|
||||||
|
Income (loss) before income taxes
|
1,022
|
|
(137
|
)
|
1,671
|
|
||||||
|
Income tax expense
|
(341
|
)
|
(176
|
)
|
(453
|
)
|
||||||
|
Net income (loss)
|
681
|
|
(313
|
)
|
1,218
|
|
||||||
|
Net income attributable to noncontrolling interests
|
(67
|
)
|
—
|
|
(1
|
)
|
||||||
|
Net income attributable to redeemable noncontrolling interests
|
(20
|
)
|
(24
|
)
|
(23
|
)
|
||||||
|
Net income (loss) available to Discovery, Inc.
|
$
|
594
|
|
$
|
(337
|
)
|
$
|
1,194
|
|
|||
|
Net income (loss) per share available to Discovery, Inc. Series A, B and C common stockholders:
|
||||||||||||
|
Basic
|
$
|
0.86
|
|
$
|
(0.59
|
)
|
$
|
1.97
|
|
|||
|
Diluted
|
$
|
0.86
|
|
$
|
(0.59
|
)
|
$
|
1.96
|
|
|||
|
Weighted average shares outstanding:
|
||||||||||||
|
Basic
|
498
|
|
384
|
|
401
|
|
||||||
|
Diluted
|
688
|
|
576
|
|
610
|
|
||||||
The accompanying notes are an integral part of these consolidated financial statements.
77
DISCOVERY, INC.
CONSOLIDATED STATEMENTS OF COMPREHENSIVE INCOME (LOSS)
(in millions)
|
Year Ended December 31,
|
||||||||||||
|
2018
|
2017
|
2016
|
||||||||||
|
Net income (loss)
|
$
|
681
|
|
$
|
(313
|
)
|
$
|
1,218
|
|
|||
|
Other comprehensive income (loss) adjustments, net of tax:
|
||||||||||||
|
Currency translation
|
(189
|
)
|
183
|
|
(191
|
)
|
||||||
|
Available-for-sale securities
|
—
|
|
15
|
|
38
|
|
||||||
|
Pension plan and SERP
|
3
|
|
—
|
|
—
|
|
||||||
|
Derivatives
|
12
|
|
(20
|
)
|
24
|
|
||||||
|
Comprehensive income (loss)
|
507
|
|
(135
|
)
|
1,089
|
|
||||||
|
Comprehensive income attributable to noncontrolling interests
|
(67
|
)
|
—
|
|
(1
|
)
|
||||||
|
Comprehensive income attributable to redeemable noncontrolling interests
|
(20
|
)
|
(25
|
)
|
(23
|
)
|
||||||
|
Comprehensive income (loss) attributable to Discovery, Inc.
|
$
|
420
|
|
$
|
(160
|
)
|
$
|
1,065
|
|
|||
The accompanying notes are an integral part of these consolidated financial statements.
78
DISCOVERY, INC.
CONSOLIDATED STATEMENTS OF CASH FLOWS
(in millions)
|
|
Year Ended December 31,
|
|||||||||||
|
|
2018
|
2017
|
2016
|
|||||||||
|
Operating Activities
|
||||||||||||
|
Net income (loss)
|
$
|
681
|
|
$
|
(313
|
)
|
$
|
1,218
|
|
|||
|
Adjustments to reconcile net income (loss) to cash provided by operating activities:
|
||||||||||||
|
Share-based compensation expense
|
80
|
|
39
|
|
69
|
|
||||||
|
Depreciation and amortization
|
1,398
|
|
330
|
|
322
|
|
||||||
|
Content rights amortization and impairment
|
3,288
|
|
1,910
|
|
1,773
|
|
||||||
|
Impairment of goodwill
|
—
|
|
1,327
|
|
—
|
|
||||||
|
(Gain) loss on disposition
|
(84
|
)
|
4
|
|
(63
|
)
|
||||||
|
Remeasurement gain on previously held equity interests
|
—
|
|
(34
|
)
|
—
|
|
||||||
|
Equity in earnings and distributions from equity method investee companies
|
138
|
|
223
|
|
44
|
|
||||||
|
Deferred income taxes
|
(131
|
)
|
(199
|
)
|
(27
|
)
|
||||||
|
Loss on extinguishment of debt
|
—
|
|
54
|
|
—
|
|
||||||
|
Realized loss from derivative instruments, net
|
—
|
|
98
|
|
3
|
|
||||||
|
Other-than-temporary impairment of AFS investments
|
—
|
|
—
|
|
62
|
|
||||||
|
Other, net
|
141
|
|
85
|
|
50
|
|
||||||
|
Changes in operating assets and liabilities, net of acquisitions and dispositions:
|
||||||||||||
|
Receivables, net
|
(84
|
)
|
(258
|
)
|
(25
|
)
|
||||||
|
Content rights and payables, net
|
(2,883
|
)
|
(1,947
|
)
|
(1,904
|
)
|
||||||
|
Accounts payable and accrued liabilities
|
(74
|
)
|
265
|
|
(10
|
)
|
||||||
|
Prepaid income taxes and income taxes receivable
|
57
|
|
20
|
|
(31
|
)
|
||||||
|
Foreign currency and other, net
|
49
|
|
25
|
|
(101
|
)
|
||||||
|
Cash provided by operating activities
|
2,576
|
|
1,629
|
|
1,380
|
|
||||||
|
Investing Activities
|
||||||||||||
|
Business acquisitions, net of cash acquired
|
(8,565
|
)
|
(60
|
)
|
—
|
|
||||||
|
Payments for investments, net
|
(61
|
)
|
(444
|
)
|
(272
|
)
|
||||||
|
Proceeds from dispositions, net of cash disposed
|
107
|
|
29
|
|
19
|
|
||||||
|
Proceeds from sale of assets
|
68
|
|
—
|
|
—
|
|
||||||
|
Purchases of property and equipment
|
(147
|
)
|
(135
|
)
|
(88
|
)
|
||||||
|
Distributions from equity method investees
|
1
|
|
77
|
|
87
|
|
||||||
|
Payments for derivative instruments, net
|
(2
|
)
|
(101
|
)
|
—
|
|
||||||
|
Other investing activities, net
|
6
|
|
1
|
|
(2
|
)
|
||||||
|
Cash used in investing activities
|
(8,593
|
)
|
(633
|
)
|
(256
|
)
|
||||||
|
Financing Activities
|
||||||||||||
|
Commercial paper repayments, net
|
(5
|
)
|
(48
|
)
|
(45
|
)
|
||||||
|
Borrowings under revolving credit facility
|
—
|
|
350
|
|
613
|
|
||||||
|
Principal repayments of revolving credit facility
|
(200
|
)
|
(475
|
)
|
(835
|
)
|
||||||
|
Borrowings under term loan facilities
|
2,000
|
|
—
|
|
—
|
|
||||||
|
Principal repayments of term loans
|
(2,000
|
)
|
—
|
|
—
|
|
||||||
|
Borrowings from debt, net of discount and including premiums
|
—
|
|
7,488
|
|
498
|
|
||||||
|
Principal repayments of debt, including discount payment and premiums to par value
|
(16
|
)
|
(650
|
)
|
—
|
|
||||||
|
Payments for bridge financing commitment fees
|
—
|
|
(40
|
)
|
—
|
|
||||||
|
Principal repayments of capital lease obligations
|
(50
|
)
|
(33
|
)
|
(28
|
)
|
||||||
|
Repurchases of stock
|
—
|
|
(603
|
)
|
(1,374
|
)
|
||||||
|
Cash settlement (prepayments) of common stock repurchase contracts
|
—
|
|
58
|
|
(57
|
)
|
||||||
|
Distributions to noncontrolling interests and redeemable noncontrolling interests
|
(76
|
)
|
(30
|
)
|
(22
|
)
|
||||||
|
Share-based plan proceeds, net
|
54
|
|
16
|
|
39
|
|
||||||
|
Borrowings under program financing line of credit
|
22
|
|
—
|
|
—
|
|
||||||
|
Hedge of borrowings from debt instruments
|
—
|
|
—
|
|
40
|
|
||||||
|
Other financing activities, net
|
(12
|
)
|
(82
|
)
|
(13
|
)
|
||||||
|
Cash (used in) provided by financing activities
|
(283
|
)
|
5,951
|
|
(1,184
|
)
|
||||||
|
Effect of exchange rate changes on cash and cash equivalents
|
(23
|
)
|
62
|
|
(30
|
)
|
||||||
|
Net change in cash and cash equivalents
|
(6,323
|
)
|
7,009
|
|
(90
|
)
|
||||||
|
Cash and cash equivalents, beginning of period
|
7,309
|
|
300
|
|
390
|
|
||||||
|
Cash and cash equivalents, end of period
|
$
|
986
|
|
$
|
7,309
|
|
$
|
300
|
|
|||
The accompanying notes are an integral part of these consolidated financial statements.
79
DISCOVERY, INC.
CONSOLIDATED STATEMENTS OF EQUITY
(in millions)
|
Preferred Stock
|
Common Stock
|
Additional
Paid-In Capital |
Treasury
Stock |
Retained
Earnings |
Accumulated
Other Comprehensive Loss |
Discovery,
Inc. Stockholders’ Equity |
Noncontrolling
Interests |
Total
Equity |
||||||||||||||||||||||||||||||||||
|
Shares
|
Par Value
|
Shares
|
Par Value
|
|||||||||||||||||||||||||||||||||||||||
|
December 31, 2015
|
109
|
|
$
|
2
|
|
536
|
|
$
|
5
|
|
$
|
7,021
|
|
$
|
(5,461
|
)
|
$
|
4,517
|
|
$
|
(633
|
)
|
$
|
5,451
|
|
$
|
—
|
|
$
|
5,451
|
|
|||||||||||
|
Net income available to Discovery, Inc. and attributable to noncontrolling interests
|
—
|
|
—
|
|
—
|
|
—
|
|
—
|
|
—
|
|
1,194
|
|
—
|
|
1,194
|
|
1
|
|
1,195
|
|
||||||||||||||||||||
|
Other comprehensive loss
|
—
|
|
—
|
|
—
|
|
—
|
|
—
|
|
—
|
|
—
|
|
(129
|
)
|
(129
|
)
|
—
|
|
(129
|
)
|
||||||||||||||||||||
|
Repurchases of stock and stock settlement of common stock repurchase contracts
|
(9
|
)
|
—
|
|
—
|
|
—
|
|
—
|
|
(895
|
)
|
(479
|
)
|
—
|
|
(1,374
|
)
|
—
|
|
(1,374
|
)
|
||||||||||||||||||||
|
Prepayments for common stock repurchase contracts
|
—
|
|
—
|
|
—
|
|
—
|
|
(57
|
)
|
—
|
|
—
|
|
—
|
|
(57
|
)
|
—
|
|
(57
|
)
|
||||||||||||||||||||
|
Share-based compensation
|
—
|
|
—
|
|
—
|
|
—
|
|
35
|
|
—
|
|
—
|
|
—
|
|
35
|
|
—
|
|
35
|
|
||||||||||||||||||||
|
Excess tax benefits from share-based compensation
|
—
|
|
—
|
|
—
|
|
—
|
|
7
|
|
—
|
|
—
|
|
—
|
|
7
|
|
—
|
|
7
|
|
||||||||||||||||||||
|
Tax settlements associated with share-based compensation
|
—
|
|
—
|
|
—
|
|
—
|
|
(11
|
)
|
—
|
|
—
|
|
—
|
|
(11
|
)
|
—
|
|
(11
|
)
|
||||||||||||||||||||
|
Issuance of stock in connection with share-based plans
|
—
|
|
—
|
|
5
|
|
—
|
|
51
|
|
—
|
|
—
|
|
—
|
|
51
|
|
—
|
|
51
|
|
||||||||||||||||||||
|
Cash distributions to noncontrolling interest
|
—
|
|
—
|
|
—
|
|
—
|
|
—
|
|
—
|
|
—
|
|
—
|
|
—
|
|
(1
|
)
|
(1
|
)
|
||||||||||||||||||||
|
Share conversion
|
(1
|
)
|
—
|
|
2
|
|
—
|
|
—
|
|
—
|
|
—
|
|
—
|
|
—
|
|
—
|
|
—
|
|
||||||||||||||||||||
|
December 31, 2016
|
99
|
|
2
|
|
543
|
|
5
|
|
7,046
|
|
(6,356
|
)
|
5,232
|
|
(762
|
)
|
5,167
|
|
—
|
|
5,167
|
|
||||||||||||||||||||
|
Net loss available to Discovery, Inc. and attributable to noncontrolling interests
|
—
|
|
—
|
|
—
|
|
—
|
|
—
|
|
—
|
|
(337
|
)
|
—
|
|
(337
|
)
|
—
|
|
(337
|
)
|
||||||||||||||||||||
|
Cumulative effect of accounting change - share-based payments
|
—
|
|
—
|
|
—
|
|
—
|
|
4
|
|
—
|
|
(4
|
)
|
—
|
|
—
|
|
—
|
|
—
|
|
||||||||||||||||||||
|
Other comprehensive income
|
—
|
|
—
|
|
—
|
|
—
|
|
—
|
|
—
|
|
—
|
|
177
|
|
177
|
|
—
|
|
177
|
|
||||||||||||||||||||
|
Preferred stock modification
|
(82
|
)
|
(2
|
)
|
—
|
|
—
|
|
37
|
|
—
|
|
—
|
|
—
|
|
35
|
|
—
|
|
35
|
|
||||||||||||||||||||
|
Repurchases of stock
|
(3
|
)
|
—
|
|
—
|
|
—
|
|
—
|
|
(381
|
)
|
(222
|
)
|
—
|
|
(603
|
)
|
—
|
|
(603
|
)
|
||||||||||||||||||||
|
Excess of fair value received over book value of equity contributed to redeemable noncontrolling interest in Velocity
|
—
|
|
—
|
|
—
|
|
—
|
|
57
|
|
—
|
|
—
|
|
—
|
|
57
|
|
—
|
|
57
|
|
||||||||||||||||||||
|
Cash settlement of common stock repurchase contracts
|
—
|
|
—
|
|
—
|
|
—
|
|
58
|
|
—
|
|
—
|
|
—
|
|
58
|
|
—
|
|
58
|
|
||||||||||||||||||||
|
Share-based compensation
|
—
|
|
—
|
|
—
|
|
—
|
|
44
|
|
—
|
|
—
|
|
—
|
|
44
|
|
—
|
|
44
|
|
||||||||||||||||||||
|
Tax settlements associated with share-based compensation
|
—
|
|
—
|
|
(1
|
)
|
—
|
|
(30
|
)
|
—
|
|
—
|
|
—
|
|
(30
|
)
|
—
|
|
(30
|
)
|
||||||||||||||||||||
|
Issuance of stock in connection with share-based plans
|
—
|
|
—
|
|
5
|
|
—
|
|
79
|
|
—
|
|
1
|
|
—
|
|
80
|
|
—
|
|
80
|
|
||||||||||||||||||||
|
Redeemable noncontrolling interest adjustments to redemption value
|
—
|
|
—
|
|
—
|
|
—
|
|
—
|
|
—
|
|
(38
|
)
|
—
|
|
(38
|
)
|
—
|
|
(38
|
)
|
||||||||||||||||||||
|
December 31, 2017
|
14
|
|
—
|
|
547
|
|
5
|
|
7,295
|
|
(6,737
|
)
|
4,632
|
|
(585
|
)
|
4,610
|
|
—
|
|
4,610
|
|
||||||||||||||||||||
|
Cumulative effect of accounting changes (See Note 2)
|
—
|
|
—
|
|
—
|
|
—
|
|
—
|
|
—
|
|
33
|
|
(26
|
)
|
7
|
|
—
|
|
7
|
|
||||||||||||||||||||
|
Net income available to Discovery, Inc. and attributable to noncontrolling interests
|
—
|
|
—
|
|
—
|
|
—
|
|
—
|
|
—
|
|
594
|
|
—
|
|
594
|
|
67
|
|
661
|
|
||||||||||||||||||||
|
Other comprehensive loss
|
—
|
|
—
|
|
—
|
|
—
|
|
—
|
|
—
|
|
—
|
|
(174
|
)
|
(174
|
)
|
—
|
|
(174
|
)
|
||||||||||||||||||||
|
Share-based compensation
|
—
|
|
—
|
|
—
|
|
—
|
|
82
|
|
—
|
|
—
|
|
—
|
|
82
|
|
—
|
|
82
|
|
||||||||||||||||||||
|
Tax settlements associated with share-based compensation
|
—
|
|
—
|
|
—
|
|
—
|
|
(18
|
)
|
—
|
|
—
|
|
—
|
|
(18
|
)
|
—
|
|
(18
|
)
|
||||||||||||||||||||
|
Issuance of stock and noncontrolling interest in connection with the acquisition of Scripps Networks Interactive, Inc. ("Scripps Networks")
|
—
|
|
—
|
|
139
|
|
1
|
|
3,217
|
|
—
|
|
—
|
|
—
|
|
3,218
|
|
1,700
|
|
4,918
|
|
||||||||||||||||||||
|
Dividends paid to noncontrolling interests
|
—
|
|
—
|
|
—
|
|
—
|
|
—
|
|
—
|
|
—
|
|
—
|
|
—
|
|
(51
|
)
|
(51
|
)
|
||||||||||||||||||||
|
Issuance of stock in connection with share-based plans
|
—
|
|
—
|
|
5
|
|
1
|
|
71
|
|
—
|
|
—
|
|
—
|
|
72
|
|
—
|
|
72
|
|
||||||||||||||||||||
|
Redeemable noncontrolling interest adjustments to redemption value
|
—
|
|
—
|
|
—
|
|
—
|
|
—
|
|
—
|
|
(5
|
)
|
—
|
|
(5
|
)
|
—
|
|
(5
|
)
|
||||||||||||||||||||
|
December 31, 2018
|
14
|
|
$
|
—
|
|
691
|
|
$
|
7
|
|
$
|
10,647
|
|
$
|
(6,737
|
)
|
$
|
5,254
|
|
$
|
(785
|
)
|
$
|
8,386
|
|
$
|
1,716
|
|
$
|
10,102
|
|
|||||||||||
The accompanying notes are an integral part of these consolidated financial statements.
80
DISCOVERY, INC.
NOTES TO CONSOLIDATED FINANCIAL STATEMENTS
NOTE 1. DESCRIPTION OF BUSINESS AND BASIS OF PRESENTATION
Description of Business
Discovery, Inc. (“Discovery”, the “Company”, "we", "us" or "our") is a global media company that provides content across multiple distribution platforms, including pay-television ("pay-TV"), free-to-air ("FTA") and broadcast, various digital distribution platforms and content licensing agreements. The Company also operates a portfolio of digital direct-to-consumer products and a production studio. As further discussed in Note 3, on March 6, 2018, the Company acquired Scripps Networks Interactive, Inc. ("Scripps Networks") and changed its name from "Discovery Communications, Inc." to "Discovery, Inc." The Company presents the following business units: U.S. Networks, consisting principally of domestic television networks and digital content services, and International Networks, consisting principally of international television networks and digital content services; and Education and Other, consisting of a production studio and previously consolidated curriculum-based education business that was sold on April 30, 2018. (See Note 3.) Financial information for Discovery’s reportable segments is discussed in Note 23.
Principles of Consolidation and Basis of Presentation
The consolidated financial statements include the accounts of Discovery and its majority-owned subsidiaries in which a controlling interest is maintained. For each non-wholly owned subsidiary, the Company evaluates its ownership and other interests to determine whether it should consolidate the entity or account for its ownership interest as an investment. As part of its evaluation, the Company makes judgments in determining whether the entity is a variable interest entity ("VIE") and, if so, whether it is the primary beneficiary of the VIE and is thus required to consolidate the entity. (See Note 4.) Inter-company accounts and transactions between consolidated entities have been eliminated in consolidation.
NOTE 2. SUMMARY OF SIGNIFICANT ACCOUNTING POLICIES
Accounting and Reporting Pronouncements Adopted
Targeted Improvements to Accounting for Hedging Activities
In August 2017, the FASB issued ASU 2017-12, which includes significant amendments that expand the eligibility for hedge accounting to more financial and nonfinancial hedging strategies. The guidance is intended to align hedge accounting with companies’ risk management strategies, simplify the application of hedge accounting, and increase transparency as to the scope and results of hedging programs. In addition, the guidance amends the presentation and disclosure requirements and changes how companies assess effectiveness. The updated guidance is effective for fiscal years beginning after December 15, 2018, with early adoption permitted. The Company early adopted the pronouncement on July 1, 2018. As a result, the Company changed the method by which it assesses effectiveness for net investment hedges from the forward-method to the spot-method.
The Company believes the spot method better matches the spot rate changes of the net investment. Previous net losses of
$87 million
incurred under the forward method related to net investment hedges will remain in other comprehensive loss under the currency translation adjustments component and will be reclassified to earnings when the net investment is sold or liquidated. The adoption of ASU 2017-12 did not result in a material impact to our consolidated results of operations; however, the Company has expanded its disclosures of its derivative activities in Note 10.
Recognition and Measurement of Financial Instruments
On January 1, 2018, the Company adopted ASU 2016-01 and ASU 2018-03, which enhance the reporting model for financial instruments. The guidance impacted the financial statements as follows:
|
•
|
Gains and losses on common stock investments with readily determinable fair values are now recorded in other expense, net. Previously, the Company recorded these gains and losses in other comprehensive income ("OCI"). The Company adopted this guidance on a modified retrospective basis and recorded a transition adjustment to reclassify accumulated other comprehensive income to retained earnings of
$26 million
, net of tax, as of January 1, 2018. The new guidance eliminates the available-for-sale ("AFS") classification for common stock investments. (See Note 4 and Note 12.)
|
|
•
|
Upon adoption of ASU 2016-01, the Lionsgate Collar, as defined in Note 4, no longer receives the hedge accounting designation. There is no change to the manner in which movements in fair value of these instruments are reflected in the financial statements, as gains and losses will continue to be recorded as a component of other (expense) income, net on the consolidated statements of operations. (See Note 10.)
|
81
DISCOVERY, INC.
NOTES TO CONSOLIDATED FINANCIAL STATEMENTS
|
•
|
For equity interests without readily determinable fair values previously accounted for under the cost method, the Company has elected to apply the "measurement alternative" prospectively. Under this election, investments are recorded at cost, less impairment, adjusted for subsequent observable price changes as of the date that an observable transaction takes place. The Company will recognize observable price changes as adjustments to fair values of these investments as a component of other (expense) income, net. (See Note 4 and Note 5.) In addition, companies are required to perform a qualitative assessment each reporting period to identify impairments under a single-step model. When a qualitative assessment indicates that an impairment exists, the Company will need to estimate the fair value of the investment and recognize in current earnings an impairment loss equal to the difference between the fair value and the carrying amount of the equity investment.
|
Revenue from Contracts with Customers
In May 2014, the FASB issued ASU 2014-09, Revenue from Contracts with Customers ("Topic 606"), which updates numerous requirements in U.S. GAAP, eliminates industry-specific guidance, and provides companies with a single model for recognizing revenue from contracts with customers. The core principle of the new standard is that a company should recognize revenue to depict the transfer of promised goods or services to customers in an amount that reflects the consideration to which the company expects to be entitled in exchange for those goods or services. The guidance also addresses the accounting for costs incurred as part of obtaining or fulfilling a contract with a customer by adding ASC Subtopic 340-40, Other Assets and Deferred Costs: Contracts with Customers, and requiring that costs of obtaining a contract be recognized as an asset and amortized as goods and services are transferred to the customer, as long as the costs are expected to be recovered.
On January 1, 2018, the Company adopted Topic 606 using the modified retrospective method applied to contracts not completed as of January 1, 2018. Results for reporting periods beginning after January 1, 2018, are presented under Topic 606, while prior period amounts have not been adjusted and continue to be reported in accordance with our historic accounting under Topic 605. Under Topic 605, revenue is recognized when persuasive evidence of a sales arrangement exists, services are rendered or delivery occurs, the sales price is fixed or determinable and collectability is reasonably assured. Revenues do not include taxes collected from customers on behalf of taxing authorities such as sales tax and value-added tax. However, certain revenues include taxes that customers pay to taxing authorities on the Company’s behalf, such as foreign withholding tax.
Following the modified retrospective approach for the adoption of this accounting guidance, the Company recorded an increase to opening retained earnings of
$7 million
as of January 1, 2018, due to the cumulative impact of adopting Topic 606. The impact relates to the capitalization of sales commissions for long-term education-based services for the Education Business, which was disposed of as of April 30, 2018. (See Note 3.) For the year ended
December 31, 2018
, the total amortization of capitalized sales commissions recorded as a component of cost of revenues was immaterial. The impact to revenue and costs of revenue as a result of applying Topic 606 was immaterial for the year ended
December 31, 2018
. (See Note 14.)
Income Taxes
In October 2016, the FASB issued ASU 2016-16, which simplifies the accounting for the income tax consequences of intra-entity transfers of assets other than inventory. The new guidance includes requirements to recognize the income tax consequences of an intra-entity transfer of an asset other than inventory when the transfer occurs, and therefore eliminates the exception for an intra-entity transfer of an asset other than inventory. The Company adopted the new standard effective January 1, 2018, and there was no material impact on the consolidated financial statements upon adoption.
Clarifying the Definition of a Business
In January 2017, the FASB issued ASU 2017-01, which amends the definition of a business and provides a threshold which must be considered to determine whether a transaction is an acquisition (or disposal) of an asset or a business. Under the previous accounting guidance, the minimum inputs and processes required for a “set” of assets and activities to meet the definition of a business was not specified. That lack of clarity led to broad interpretations of the definition of a business. Under the new guidance, when substantially all of the fair value of gross assets acquired is concentrated in a single asset (or group of similar assets), the assets acquired would not represent a business. In addition, in order to be considered a business, an acquisition would have to include at a minimum an input and a substantive process that together significantly contribute to the ability to create an output. This guidance also narrows the definition of outputs by more closely aligning it with how outputs are described in the revenue recognition guidance. The Company adopted the new standard effective January 1, 2018, and there was no material impact on the consolidated financial statements upon adoption.
82
DISCOVERY, INC.
NOTES TO CONSOLIDATED FINANCIAL STATEMENTS
Compensation - Retirement Benefits
In March 2017, the FASB issued ASU 2017-07, which requires employers sponsoring postretirement benefit plans to disaggregate the service cost component from the other components of net benefit cost. The standard also provides explicit guidance on how to present the service cost and other components of net benefit cost in the statement of operations and allows only the service cost component of net benefit cost to be eligible for capitalization. In conjunction with the acquisition of Scripps Networks, the Company evaluated the accounting for the Scripps Networks qualified defined benefit pension plan ("Pension Plan") and the Scripps Networks nonqualified unfunded Supplemental Executive Retirement Plan ("SERP"). As the Pension Plan was frozen effective December 31, 2009, and the plan sponsor no longer grants credits to participants for service costs, the updated guidance on service costs is not applicable. The presentation as required by this guidance is reflected within the employee benefit plans footnote disclosures. (See Note 16.)
Accounting and Reporting Pronouncements Not Yet Adopted
Reclassification of Certain Tax Effects from Accumulated Other Comprehensive Income
In February 2018, the FASB issued ASU 2018-02, which permits entities to reclassify tax effects stranded in accumulated other comprehensive income as a result of the 2017 Tax Cuts and Jobs Act ("TCJA") to retained earnings for each period in which the effect of the change is recorded. The update also requires entities to disclose their accounting policy for releasing income tax effects from accumulated other comprehensive income. The updated guidance is effective for interim and annual reporting periods beginning after December 15, 2018, with early adoption permitted. The Company is currently evaluating the impact that the pronouncement will have on the consolidated financial statements.
Goodwill
In January 2017, the FASB issued ASU 2017-04, which simplifies the subsequent measurement of goodwill. The new guidance eliminates Step 2 from the goodwill impairment test and eliminates the requirements for any reporting unit with a zero or negative carrying amount to perform a qualitative assessment. Therefore, an entity will recognize impairment charges for the amount by which the carrying amount exceeds the reporting unit's fair value, and the same impairment assessment applies to all reporting units. Early adoption is permitted for interim or annual goodwill impairment tests performed on testing dates after January 1, 2017. The amendments in this update must be adopted on a prospective basis for the annual or any interim goodwill impairment tests beginning after December 15, 2019. The Company is currently evaluating the impact that the pronouncement will have on the consolidated financial statements.
Financial Instruments - Credit Losses
In June 2016, the FASB issued ASU 2016-03, which changes the impairment model for most financial assets and certain other instruments, including trade and other receivables, held-to-maturity debt securities and loans, and that requires entities to use a new, forward-looking “expected loss” model that is expected to generally result in the earlier recognition of allowances for losses. The guidance is effective for annual periods beginning after December 15, 2019, including interim periods within those years, but early adoption is permitted. The Company is evaluating the effect that the pronouncement will have on the Company's consolidated financial statements.
83
DISCOVERY, INC.
NOTES TO CONSOLIDATED FINANCIAL STATEMENTS
Leases
In February 2016, the FASB issued ASU 2016-02, which will require lessees to recognize almost all of their leases on the balance sheet by recording a right-of-use asset and liability. The guidance also requires improved disclosures to help users of the financial statements better understand the amount, timing, and uncertainty of cash flows arising from leases. The new standard is effective for reporting periods beginning after December 15, 2018, and the new accounting guidance may be applied at the beginning of the earliest comparative period presented in the year of adoption or at the effective date without applying the provisions of the new guidance to comparative periods presented. During the year ended
December 31, 2018
, the Company determined a number of adoption elections. The Company will elect to apply the guidance at the effective date without recasting the comparative periods presented. Additionally, the Company will elect to apply practical expedients that will allow it to not reassess 1) whether any expired or existing contracts previously assessed as not containing leases are, or contain, leases; 2) the lease classification for any expired or existing leases; and 3) initial direct costs for any existing leases. The Company will also elect to not separate lease components from non-lease components across all lease categories. Instead, each separate lease component and non-lease component will be accounted for as a single lease component. The Company will not elect to apply the practical expedient to use hindsight in determining the lease term and in assessing the right-of-use assets for impairment. Additionally, the Company will not elect to apply the short-term lease scope exemption. The Company continues to evaluate the impact that the pronouncement will have on the Company's consolidated financial statements. It is expected that assets and liabilities will increase materially when operating leases are recorded on the consolidated balance sheets under the new standard. The Company's existing operating lease obligations are included in Note 22. The pattern of expense recognition within the consolidated statements of operations is not expected to change significantly. The adoption is not expected to have an impact on the Company's ability to meet its financial covenants.
Use of Estimates
The preparation of financial statements in accordance with U.S. generally accepted accounting principles (“GAAP”) requires management to make estimates, judgments and assumptions that affect the amounts and disclosures reported in the consolidated financial statements and accompanying notes. Management continually re-evaluates its estimates, judgments and assumptions, and management’s evaluations could change. These estimates are sometimes complex, sensitive to changes in assumptions and require fair value determinations using Level 3 fair value measurements. Actual results may differ materially from those estimates.
Estimates and judgments inherent in the preparation of the consolidated financial statements include accounting for asset impairments, revenue recognition, allowances for doubtful accounts, content rights, depreciation and amortization, business combinations, share-based compensation, defined benefit plans, income taxes, other financial instruments, contingencies, and the determination of whether the Company is the primary beneficiary of entities in which it holds variable interests.
Consolidation
The Company has ownership and other interests in various entities, including corporations, partnerships, and limited liability companies. For each such entity, the Company evaluates its ownership and other interests to determine whether it should consolidate the entity or account for its ownership interest as an investment. As part of its evaluation, the Company initially determines whether the entity is a VIE and, if so, whether it is the primary beneficiary of the VIE. An entity is generally a VIE if it meets any of the following criteria: (i) the entity has insufficient equity to finance its activities without additional subordinated financial support from other parties, (ii) the equity investors cannot make significant decisions about the entity’s operations, or (iii) the voting rights of some investors are not proportional to their obligations to absorb the expected losses of the entity or receive the expected returns of the entity and substantially all of the entity’s activities involve or are conducted on behalf of the investor with disproportionately few voting rights. The Company consolidates VIEs for which it is the primary beneficiary, regardless of its ownership or voting interests. The primary beneficiary is the party involved with the VIE that (i) has the power to direct the activities of the VIE that most significantly impact the VIE’s economic performance, and (ii) has the obligation to absorb losses of the VIE that could potentially be significant to the VIE or the right to receive benefits from the VIE that could potentially be significant to the VIE. Upon inception of a variable interest or the occurrence of a reconsideration event, the Company makes judgments in determining whether entities in which it invests are VIEs. If so, the Company makes judgments to determine whether it is the primary beneficiary and is thus required to consolidate the entity.
If it is concluded that an entity is not a VIE, then the Company considers its proportional voting interests in the entity. The Company consolidates majority-owned subsidiaries in which a controlling financial interest is maintained. A controlling financial interest is determined by majority ownership and the absence of significant third-party participating rights.
Ownership interests in entities for which the Company has significant influence that are not consolidated under the Company’s consolidation policy are accounted for as equity method investments. Related party transactions between the Company and its equity method investees have not been eliminated. (See Note 21.)
84
DISCOVERY, INC.
NOTES TO CONSOLIDATED FINANCIAL STATEMENTS
Investments
The Company holds investments in equity method investees and equity investments with and without readily determinable fair value.
Investments in equity method investees are those for which the Company has the ability to exercise significant influence but does not control and is not the primary beneficiary. Significant influence typically exists if the Company has a
20%
to
50%
ownership interest in the venture unless persuasive evidence to the contrary exists. Under this method of accounting, the Company typically records its proportionate share of the net earnings or losses of equity method investees and a corresponding increase or decrease to the investment balances. Cash payments to equity method investees such as additional investments, loans and advances and expenses incurred on behalf of investees, as well as payments from equity method investees such as dividends, distributions and repayments of loans and advances are recorded as adjustments to investment balances. For the Company's equity method investments in renewable energy limited liability companies where the capital structure of the equity investment results in different liquidation rights and priorities than what is reflected by the underlying percentage ownership interests, the Company's proportionate share of net earnings is accounted for using the Hypothetical Liquidation at Book Value ("HLBV") methodology available under the equity method of accounting. When applying HLBV, the Company determines the amount that would be received if the investment were to liquidate all of its assets and distribute the resulting cash to the investors based on contractually defined liquidation priorities. The change in the Company's claim on the investee's book value in accordance with GAAP at the beginning and the end of the reporting period, after adjusting for any contributions or distributions, is the Company's share of the earnings or losses for the period. The Company evaluates its equity method investments for impairment whenever events or changes in circumstances indicate that the carrying amounts of such investments may not be recoverable. (See "Asset Impairment Analysis" below.)
Equity investments without readily determinable fair value include ownership rights that either (i) do not meet the definition of in-substance common stock or (ii) do not provide the Company with control or significant influence and these investments do not have readily determinable fair values. Equity investments without readily determinable fair value are recorded at cost, less any impairment, and adjusted for subsequent observable price changes as of the date that an observable transaction takes place.
Investments in entities or other securities in which the Company has no control or significant influence, is not the primary beneficiary, and have a readily determinable fair value are recorded at fair value based on quoted market prices and are classified as equity securities or equity investments with readily determinable fair value. For equity securities with readily determinable fair value, realized gains and losses are recorded in other (expense) income, net. (See Note 4.)
Foreign Currency
The reporting currency of the Company is the U.S. dollar. The functional currency of most of the Company’s international subsidiaries is the local currency. Assets and liabilities, including inter-company balances for which settlement is anticipated in the foreseeable future, denominated in foreign currencies are translated at exchange rates in effect at the balance sheet date. Foreign currency equity balances are translated at historical rates. Revenues and expenses denominated in foreign currencies are translated at average exchange rates for the respective periods. Foreign currency translation adjustments are recorded in accumulated other comprehensive income.
Transactions denominated in currencies other than subsidiaries’ functional currencies are recorded based on exchange rates at the time such transactions arise. Changes in exchange rates with respect to amounts recorded in the consolidated balance sheets related to these items will result in unrealized foreign currency transaction gains and losses based upon period-end exchange rates. The Company also records realized foreign currency transaction gains and losses upon settlement of the transactions. Foreign currency transaction gains and losses are included in
other (expense) income, net
, and totaled a loss of $
93 million
, a loss of $
83 million
, and a gain of $
75 million
for
2018
,
2017
and
2016
, respectively.
Cash flows from the Company's operations in foreign countries are generally translated at the weighted average rate for the applicable period in the consolidated statements of cash flows. The impacts of material transactions are recorded at the applicable spot rates as of the transaction date in the consolidated statements of operations and cash flows. The effects of exchange rates on cash balances held in foreign currencies are separately reported in the Company's consolidated statements of cash flows.
Cash and Cash Equivalents
Cash and cash equivalents include cash on hand and highly liquid investments with original maturities of 90 days or less.
85
DISCOVERY, INC.
NOTES TO CONSOLIDATED FINANCIAL STATEMENTS
Receivables
Receivables include amounts billed and currently due from customers and are presented net of an estimate for uncollectible accounts. The Company evaluates outstanding receivables to assess collectability. In performing this evaluation, the Company analyzes market trends, economic conditions, the aging of receivables and customer specific risks. Using this information, the Company reserves an amount that it estimates may not be collected. The Company does not require collateral with respect to trade receivables.
Content Rights
Content rights principally consist of television series, specials, films and sporting events. Content aired on the Company’s television networks is sourced from a wide range of third-party producers, wholly-owned and equity method investee production studios and sports associations. Content is classified either as produced, coproduced or licensed. The Company owns most or all of the rights to produced content. The Company collaborates with third parties to finance and develop coproduced content, and it retains significant rights to exploit the programs. Licensed content is comprised of films or series that have been previously produced by third parties and the Company retains limited airing rights over a contractual term. Prepaid licensed content includes advance payments for rights to air sporting events that will take place in the future and advance payments for acquired films and television series.
Costs of produced and coproduced content consist of development costs, acquired production costs, direct production costs, certain production overhead costs and participation costs. Costs incurred for produced and coproduced content are capitalized if the Company has previously generated revenues from similar content in established markets and the content will be used and revenues will be generated for a period of at least
one
year. The Company’s coproduction arrangements generally provide for the sharing of production costs. The Company records its costs but does not record the costs borne by the other party as the Company does not share any associated economics of exploitation. Program licenses typically have fixed terms and require payments during the term of the license. The cost of licensed content is capitalized when the license period for the programs has commenced and the programs are available for air or the Company has paid for the programs. The Company pays in advance of delivery for television series, specials, films and sports rights. Payments made in advance of when the right to air the content is received are recognized as in-production produced, coproduced content or prepaid licensed content. Content distribution, advertising, marketing, general and administrative costs are expensed as incurred.
Content amortization expense for each period is recognized based on the revenue forecast model, which approximates the proportion that estimated distribution and advertising revenues for the current period represent in relation to the estimated remaining total lifetime revenues. Significant judgment is required to determine the useful lives of the Company’s content rights and the ultimate revenues to be derived from the exploitation of the individual content rights, which involves the use of significant estimates and assumptions with respect to the timing and frequency of forecasted future airings, the associated revenues to be derived from these airings, and revenues generated from service offerings other than traditional linear distribution. The Company annually, or on an as needed basis, prepares analyses to support its content amortization expense by network and by region. Critical assumptions used in determining content amortization include: (i) the grouping of content by network and or genre, (ii) the application of a quantitative revenue forecast model based on the adequacy of a network's historical data, (iii) determining the appropriate historical periods to utilize and the relative weighting of those historical periods in the revenue forecast model, (iv) assessing the accuracy of the Company's revenue forecasts and (v) incorporating secondary streams. The Company then considers the appropriate application of the quantitative assessment given forecasted content use, expected content investment and market trends. Content use and future revenues may differ from estimates based on changes in expectations related to market acceptance, network affiliate fee rates, advertising demand, the number of cable and satellite television subscribers receiving the Company’s networks, and program usage. Accordingly, the Company continually reviews revenue estimates and planned usage and revises its assumptions if necessary. As part of the Company's annual assessment in determining the film forecast model, the Company compares the calculated amortization rates to those that have been utilized during the year. If the calculated rates do not deviate materially from the applied amortization rates, no adjustment is recorded for the current year amortization expense. The Company allocates the cost of multi-year sports programming arrangements over the contract period to each event or season based on the estimated relative value of each event or season.
The result of the revenue forecast model is either an accelerated method or a straight-line amortization method over the estimated useful lives of primarily
three
to
four
years for produced, coproduced and licensed content. Amortization of capitalized costs for produced and coproduced content begins when a program has been aired. Amortization of capitalized costs for licensed content commences when the license period begins and the program is available for use. Amortization of sports rights takes place when the content airs.
86
DISCOVERY, INC.
NOTES TO CONSOLIDATED FINANCIAL STATEMENTS
Capitalized content costs are stated at the lower of cost less accumulated amortization or net realizable value. The Company periodically evaluates the net realizable value of content by considering expected future revenue generation. Estimates of future revenues consider historical airing patterns and future plans for airing content, including any changes in strategy. Given the significant estimates and judgments involved, actual demand or market conditions may be less favorable than those projected, requiring a write-down to net realizable value. Development costs for programs that the Company has determined will not be produced, are fully expensed in the period the determination is made.
All produced and coproduced content is classified as long-term. The portion of the unamortized licensed content balance, including prepaid sports rights, that will be amortized within one year is classified as a current asset. (See Note 6.)
Property and Equipment
Property and equipment are stated at cost less accumulated depreciation and impairments. The cost of property and equipment acquired under capital lease arrangements represents the lesser of the present value of the minimum lease payments or the fair value of the leased asset as of the inception of the lease. The Company leases fixed assets and licenses software. Capitalized software costs are for internal use. Capitalization of software costs occurs during the application development stage. Software costs incurred during the preliminary project and post implementation stages are expensed as incurred. Repairs and maintenance expenditures that do not enhance the use or extend the life of property and equipment are expensed as incurred.
Depreciation for most property and equipment is recognized using the straight-line method over the estimated useful lives of the assets, which is
15
to
39
years for buildings,
three
to
five
years for broadcast equipment,
two
to
five
years for capitalized software costs and
three
to
five
years for office equipment, furniture, fixtures and other property and equipment. Assets acquired under capital lease arrangements and leasehold improvements are amortized using the straight-line method over the lesser of the estimated useful lives of the assets or the terms of the related leases, which is
one
to
15
years. Depreciation commences when property or equipment is ready for its intended use.
Asset Impairment Analysis
Goodwill and Indefinite-lived Intangible Assets
Goodwill is allocated to the Company's reporting units, which are its operating segments or one level below its operating segments. The Company evaluates goodwill and other indefinite-lived intangible assets for impairment annually as of November 30 and earlier if an event or other circumstance indicates that we may not recover the carrying value of the asset. If the Company believes that, as a result of its qualitative assessment, it is more likely than not that the fair value of a reporting unit or other indefinite-lived intangible asset is greater than its carrying amount, the quantitative impairment test is not required. The Company performs a quantitative impairment test every three years, irrespective of the outcome of the Company's qualitative assessment.
The quantitative goodwill impairment test is performed using a two-step process. The first step of the process is to compare the fair value of a reporting unit with its carrying amount, including goodwill. If the fair value of a reporting unit exceeds its carrying amount, goodwill of the reporting unit is not impaired, and the second step of the quantitative impairment test is not necessary. If the carrying amount of a reporting unit exceeds its fair value, the second step of the quantitative goodwill impairment test is required to be performed to measure the amount of impairment loss, if any. The second step of the quantitative goodwill impairment test compares the implied fair value of the reporting unit’s goodwill with the carrying amount of that goodwill. The implied fair value of goodwill is determined in the same manner as the amount of goodwill recognized in a business combination. In other words, the estimated fair value of the reporting unit’s identifiable net assets excluding goodwill is compared to the fair value of the reporting unit as if the reporting unit had been acquired in a business combination and the fair value of the reporting unit was the purchase price paid. If the carrying amount of the reporting unit’s goodwill exceeds the implied fair value of that goodwill, an impairment loss is recognized in an amount equal to that excess.
Following a qualitative assessment indicating that it is not more likely than not that the fair value of the indefinite lived intangible asset exceeds its carrying amount, impairment of other intangible assets not subject to amortization involves a comparison of the estimated fair value of the intangible asset with its carrying value. If the carrying value of the intangible asset exceeds its fair value, an impairment loss is recognized in an amount equal to that excess. Determining fair value requires the exercise of judgment about appropriate discount rates, perpetual growth rates and the amount and timing of expected future cash flows. (See Note 8.)
87
DISCOVERY, INC.
NOTES TO CONSOLIDATED FINANCIAL STATEMENTS
Long-lived Assets
Long-lived assets such as amortizing trademarks, customer lists, other intangible assets, and property and equipment are not required to be tested for impairment annually. Instead, long-lived assets are tested for impairment whenever circumstances indicate that the carrying amount of the asset may not be recoverable, such as when the disposal of such assets is likely or there is an adverse change in the market involving the business employing the related assets. If an impairment analysis is required, the impairment test employed is based on whether the Company’s intent is to hold the asset for continued use or to hold the asset for sale. If the intent is to hold the asset for continued use, the impairment test first requires a comparison of undiscounted future cash flows to the carrying value of the asset. If the carrying value of the asset exceeds the undiscounted cash flows, the asset would not be deemed to be recoverable. Impairment would then be measured as the excess of the asset’s carrying value over its fair value. Fair value is typically determined by discounting the future cash flows associated with that asset. If the intent is to hold the asset for sale and certain other criteria are met, the impairment test involves comparing the asset’s carrying value to its fair value less costs to sell. To the extent the carrying value is greater than the asset’s fair value less costs to sell, an impairment loss is recognized in an amount equal to the difference. Significant judgments used for long-lived asset impairment assessments include identifying the appropriate asset groupings and primary assets within those groupings, determining whether events or circumstances indicate that the carrying amount of the asset may not be recoverable, determining the future cash flows for the assets involved and assumptions applied in determining fair value, which include reasonable discount rates, growth rates, market risk premiums and other assumptions about the economic environment.
Equity Method Investments and Equity Investments Without Readily Determinable Fair Value
Equity method investments are reviewed for indicators of other-than-temporary impairment on a quarterly basis. Equity method investments are written down to fair value if there is evidence of a loss in value that is other-than-temporary. The Company may estimate the fair value of its equity method investments by considering recent investee equity transactions, discounted cash flow analysis, recent operating results, comparable public company operating cash flow multiples and in certain situations, balance sheet liquidation values. If the fair value of the investment has dropped below the carrying amount, management considers several factors when determining whether an other-than-temporary decline has occurred, such as: the length of the time and the extent to which the estimated fair value or market value has been below the carrying value, the financial condition and the near-term prospects of the investee, the intent and ability of the Company to retain its investment in the investee for a period of time sufficient to allow for any anticipated recovery in market value and general market conditions. The estimation of fair value and whether an other-than-temporary impairment has occurred requires the application of significant judgment and future results may vary from current assumptions. If declines in the value of the equity method investments are determined to be other-than-temporary, a loss is recorded in earnings in the current period as a component of
loss from equity investees, net
on the consolidated statements of operations.
For equity investments without readily determinable fair value, the Company has elected to apply the measurement alternative. Under this election, investments are recorded at cost, less impairment, adjusted for subsequent observable price changes as of the date that an observable transaction takes place. The Company performs a qualitative assessment each reporting period to determine if an investment is impaired. If the qualitative assessment indicates that an investment is impaired, the Company is required to estimate the fair value of the investment and recognize an impairment loss equal to the difference between the fair value and carrying value in the current period as a component of
other (expense) income, net
. (See Note 4.)
Derivative Instruments
The Company uses derivative financial instruments to modify its exposure to market risks from changes in foreign currency exchange rates, interest rates and from market volatility related to certain equity investments measured at fair value. At the inception of a derivative contract, the Company designates the derivative as one of four types based on the Company's intentions and expectations as to the likely effectiveness as a hedge. These four types are: (i) a hedge of a forecasted transaction or the variability of cash flows to be received or paid related to a recognized asset or liability ("cash flow hedge"), (ii) a hedge of net investments in foreign operations ("net investment hedge"), (iii) a hedge of the fair value of a recognized asset or liability or of an unrecognized firm commitment ("fair value hedge"), or (iv) an instrument with no hedging designation. (See Note 10.)
Cash Flow Hedges
As a result of ASU 2017-12, for foreign exchange forward contracts accounted for as cash flow hedges, the ineffective portion (if any) will not be separately recorded, as the entire change in the fair value of the forward contract will be recorded in other comprehensive income (loss) and reclassified into the statement of operations in the same line item in which the hedged item is recorded and in the same period as the hedged item affects earnings.
88
DISCOVERY, INC.
NOTES TO CONSOLIDATED FINANCIAL STATEMENTS
Net Investment Hedges
Upon adoption of 2017-12 for those derivative instruments designated as net investment hedges, the Company changed the method by which it assesses their effectiveness from the forward-method to the spot-method. The entire change in the fair value of the derivatives is initially recorded in the currency translation adjustment component of
other comprehensive income (loss)
. While the change in fair value attributable to hedge effectiveness remains in
accumulated other comprehensive loss
until the net investment is sold or liquidated, the change in fair value attributable to components excluded from the assessment of hedge effectiveness (e.g., forward points, cross currency basis, etc.) is reflected as a component of interest expense, net in the current period.
Fair Value Hedges
For those derivative instruments designated as fair value hedges, the changes in the fair value of the derivative instruments, including offsetting changes in fair value of the hedged items and amounts excluded from the assessment of effectiveness are recorded in
other (expense) income, net
.
No Hedging Designation
The Company may also enter into derivative instruments that are not designated as hedges and do not qualify for hedge accounting. These contracts are intended to mitigate economic exposures of the Company. The changes in fair value of derivatives not designated as hedges and the ineffective portion of derivatives designated as hedging instruments are immediately recorded in
other (expense) income, net
.
Financial Statement Presentation
The Company records all unsettled derivative contracts at their gross fair values on the consolidated balance sheets. (See Note 5.) The portion of the fair value that represents cash flows occurring within one year are classified as current, and the portion related to cash flows occurring beyond one year are classified as noncurrent. The cash flows from the designated derivative instruments used as hedges are classified in the consolidated statements of cash flows in the same section as the cash flows of the hedged item.
The cash flows from the effective portion of derivative instruments used as hedges are classified in the consolidated statements of cash flows in the same section as the cash flows from the hedged item. For example, the cash paid or received to settle the effective portion of foreign exchange derivatives intended to hedge distribution revenue earned during the
year ended December 31, 2018
is reported as an operating activity in the consolidated statements of cash flows consistent with the classification of cash received from customers. Also, the cash flows related to our interest rate contracts used to hedge the pricing for certain senior notes are reported as a financing activity in the consolidated statements of cash flows consistent with the cash proceeds from our debt offerings. The cash flows from the ineffective portion of derivative instruments used as hedges, periodic settlement of interest on cross-currency swaps, and derivative contracts not designated as hedges are reported as investing activities in the consolidated statements of cash flows.
Treasury Stock
When stock is acquired for purposes other than formal or constructive retirement, the purchase price of the acquired stock is recorded in a separate treasury stock account, which is separately reported as a reduction of equity.
When stock is retired or purchased for formal or constructive retirement, the purchase price is initially recorded as a reduction to the par value of the shares repurchased, with any excess purchase price over par value recorded as a reduction to additional paid-in capital related to the series of shares repurchased and any remainder excess purchase price recorded as a reduction to retained earnings. If the purchase price exceeds the amounts allocated to par value and additional paid-in capital related to the series of shares repurchased and retained earnings, the remainder is allocated to additional paid-in capital related to other series of shares.
89
DISCOVERY, INC.
NOTES TO CONSOLIDATED FINANCIAL STATEMENTS
Common Stock Repurchase Contracts
Under common stock repurchase contracts, the Company makes up front cash payments for the future settlement of the contract in either shares or in cash based on the Company's Series C common stock price at settlement in relation to the strike price of the contract. If the Company's Series C common stock price is below the strike price at expiry, the Company receives a predetermined number of its Series C common stock. If the Company's Series C common stock price is above the strike price at expiry, the Company can elect to settle the transaction in either cash or the equivalent value in shares of Series C common stock at the then current market price upon settlement, based on the notional value of the repurchase contract. The contracts represent a hybrid instrument consisting of a debt instrument and an embedded equity-linked derivative that does not require bifurcation because it is linked to the Company’s own stock. The Company accounts for these contracts as equity transactions. Prepayments are recorded as a reduction in additional paid-in capital. If the contract settles in shares of Series C common stock, that amount will be reclassified to treasury stock. If the contract settles in cash, the cash receipt will be recorded as an increase to additional paid-in capital.
Revenue Recognition
The Company generates revenues principally from: (i) distribution revenues from fees charged to distributors of its network content, which include cable, direct-to-home ("DTH") satellite, telecommunications and digital service providers and bundled long-term content arrangements, (ii) advertising revenue from advertising sold on its television networks and websites and (iii) other revenue related to several items including: (a) unbundled rights to sales of network content, including sports rights, (b) production studios content development and services, (c) the licensing of the Company's brands for consumer products and (d) affiliate and advertising sales representation services.
Revenue is recognized upon transfer of control of promised services or goods to customers in an amount that reflects the consideration that the Company expects to receive in exchange for those services or goods. Revenues do not include taxes collected from customers on behalf of taxing authorities such as sales tax and value-added tax. However, certain revenues include taxes that customers pay to taxing authorities on the Company’s behalf, such as foreign withholding tax. Revenue recognition for each source of revenue is also based on the following policies.
Distribution
Cable operators, DTH satellite operators and telecommunications service providers typically pay royalties via a per-subscriber fee for the right to distribute the Company’s programming under the terms of distribution contracts. The majority of the Company’s distribution fees are collected monthly throughout the year and distribution revenue is recognized over the term of the contracts based on contracted programming rates and reported subscriber levels. The amount of distribution fees due to the Company is reported by distributors based on actual subscriber levels. Such information is generally not received until after the close of the reporting period. In these cases, the Company estimates the number of subscribers receiving the Company’s programming to estimate royalty revenue. Historical adjustments to recorded estimates have not been material. Distribution revenue from fixed-fee contracts is recognized over the contract term based on the continuous delivery of the content to the affiliate. Any monetary incentives provided to distributors are recognized as a reduction of revenue over the service term.
Although the delivery of linear feeds and digital direct-to-consumer products, such as video-on-demand (“VOD”) and digital distribution arrangements, are considered distinct performance obligations, on demand offerings generally match the programs that are airing on the linear network. Therefore, the Company recognizes revenue for licensing arrangements as the license fee is earned and based on continuous delivery for fixed fee contracts.
Revenues associated with digital distribution arrangements are recognized when the Company transfers control of the content and the rights to distribute the content to the customer.
90
DISCOVERY, INC.
NOTES TO CONSOLIDATED FINANCIAL STATEMENTS
Advertising
Advertising revenues are principally generated from the sale of commercial time on linear and digital platforms. A substantial portion of the advertising contracts in the U.S. and certain international markets guarantee the advertiser a minimum audience level that either the program in which their advertisements are aired or the advertisement will reach. The Company provides a service to deliver an advertising campaign which is satisfied by the provision of a minimum number of advertising spots in exchange for a fixed fee over a contract period of one year or less. The Company delivers spots in accordance with these contracts during a variety of day parts and programs. In the agreements governing these advertising campaigns, the Company has also promised to deliver to its customers a guaranteed minimum number of viewers (“impressions”) on a specific television network within a particular demographic (e.g. men aged 18-35). These advertising campaigns are considered to represent a single, distinct performance obligation. Revenues are recognized based on the audience level delivered multiplied by the average price per impression. The Company provides the advertiser with advertising until the guaranteed audience level is delivered, and invoiced advertising revenue receivables may exceed the value of the audience delivery. As such, revenues are deferred until the guaranteed audience level is delivered or the rights associated with the guarantee lapse, which is less than one year. Audience guarantees are initially developed internally, based on planned programming, historical audience levels, the success of pilot programs, and market trends. Actual audience and delivery information is published by independent ratings services. In certain instances, the independent ratings information is not received until after the close of the reporting period. In these cases, reported advertising revenue and related deferred revenue are based upon the Company’s estimates of the audience level delivered. Historical adjustments to previously reported estimates have not been material.
For contracts without an audience guarantee, advertising revenues are recognized as each spot airs. The airing of individual spots without a guaranteed audience level are each distinct, individual performance obligations. The Company allocates the consideration to each spot based on its relative standalone selling price. Advertising revenues from digital platforms are recognized as impressions are delivered or the services are performed.
Other
License fees from the sublicensing of sports rights are recognized when the rights become available for airing. Revenue from the production studios segment is recognized when the content is delivered and available for airing by the customer. Royalties from brand licensing arrangements are earned as products are sold by the licensee. Affiliate and ad sales representation services are recognized as services are provided.
Multiple Performance Obligations
Contracts with customers may include multiple distinct performance obligations. For example, advertising contracts may include sponsorship, production, or product integration in addition to the airing of spots and the satisfaction of an audience guarantee. For such contracts, the contract value is allocated to individual performance obligations and recorded as revenue when each performance obligation has been satisfied and value has been transferred to the customer. Distribution contracts also include multiple performance obligations. The Company also enters into certain distribution contracts that include promises to deliver content libraries. There are generally two types of such arrangements: 1) content licensing arrangements that include subscription video on demand (“SVOD”) licensing arrangements and 2) digital direct-to-consumer content (i.e., VOD) which includes a performance obligation within our linear distribution arrangements. These contracts vary by customer and in certain instances include a promise by the Company to deliver existing content and new content. For SVOD arrangements, revenue is allocated to each performance obligation based on that performance obligation's relative standalone selling price, which is determined based on the cost plus an expected margin. In the case of VOD and digital direct-to-consumer content, content is regularly refreshed over the term of the agreement, as new titles are added and older titles are removed. Consequently, satisfaction of the performance obligations generally occurs in the same pattern as the delivery of the linear feed.
Deferred Revenue
Deferred revenue consists of cash received for television advertising for which the guaranteed viewership has not been provided, product licensing arrangements in which fee collections are in excess of the license value provided, advanced fees received related to the sublicensing of Olympic rights and prior to the sale of the Education Business in 2018, advanced billings to subscribers for access to the Company’s curriculum-based streaming services. The amounts classified as current are expected to be earned within the next year.
Payment terms vary by the type and location of the customer and the products or services offered. The term between invoicing and when payment is due is not significant. For certain products or services and customer types, we require payment before the products or services are delivered to the customer. (See Note 14.)
91
DISCOVERY, INC.
NOTES TO CONSOLIDATED FINANCIAL STATEMENTS
Share-Based Compensation Expense
The Company has incentive plans under which performance-based restricted stock units (“PRSUs”), service-based restricted stock units (“RSUs”), stock options, and stock appreciation rights (“SARs”) are issued.
Vesting for certain PRSUs is subject to satisfying objective operating performance conditions, while vesting for other PRSUs is based on the achievement of a combination of objective and subjective operating performance conditions. Compensation expense for PRSUs that vest based on achieving objective operating performance conditions is measured based on the fair value of the Company’s Series A and C common stock on the date of grant less actual forfeitures. Compensation expense for PRSUs that vest based on achieving subjective operating performance conditions or in situations where the executive is able to withhold taxes in excess of the minimum statutory requirement, is remeasured at the fair value of the Company’s Series A and Series C common stock, as applicable, less actual forfeitures each reporting period until the date of conversion. Compensation expense for all PRSUs is recognized ratably, following a graded vesting pattern during the vesting period only when it is probable that the operating performance conditions will be achieved. The Company records a cumulative adjustment to compensation expense for PRSUs if there is a change in the determination of whether or not it is probable the operating performance conditions will be achieved.
The Company measures the cost of employee services received in exchange for RSUs based on the fair value of the Company’s Series A common stock on the date of grant less actual forfeitures. Compensation expense for RSUs is recognized ratably during the vesting period.
Compensation expense for stock options is attributed to expense over the vesting period based on the fair value on the date of grant less actual forfeitures. Compensation expense for stock options is recognized ratably during the vesting period.
The Company measures the cost of employee services received in exchange for SARs based on the fair value of the award less actual forfeitures. Because certain SARs are cash-settled, the Company remeasures the fair value of these awards each reporting period until settlement. Compensation expense, including changes in fair value, for SARs is recognized during the vesting period in proportion to the requisite service that has been rendered as of the reporting date. For awards with graded vesting, the Company measures fair value and records compensation expense separately for each vesting tranche.
The fair values of SARs and stock options are estimated using the Black-Scholes option-pricing model. Because the Black-Scholes option-pricing model requires the use of subjective assumptions, changes in these assumptions can materially affect the fair value of awards. For SARs, the expected term is the period from the grant date to the end of the contractual term of the award unless the terms of the award allow for cash-settlement automatically on the date the awards vest, in which case the vesting date is used. For stock options the simplified method is utilized to calculate the expected term, since the Company does not have sufficient historical exercise data to provide a reasonable basis upon which to estimate the expected term. The simplified method considers the period from the date of grant through the mid-point between the vesting date and the end of the contractual term of the award. Expected volatility is based on a combination of implied volatilities from traded options on the Company’s common stock and historical realized volatility of the Company’s common stock. The dividend yield is assumed to be
zero
because the Company has no history of paying cash dividends and no present intention to pay dividends. The risk-free interest rate is based on U.S. Treasury zero-coupon issues with a remaining term equal to the expected term of the award.
The Employee Stock Purchase Plan (the “ESPP”) enables eligible employees to purchase shares of the Company’s common stock through payroll deductions or other permitted means. The Company recognizes the fair value of the discount associated with shares purchased under the plan as share-based compensation expense.
Share-based compensation expense is recorded as a component of selling, general and administrative expense. The Company classifies the intrinsic value of SARs that are vested or will become vested within one year as a current liability.
Excess tax benefits realized from the exercise of stock options and vested RSUs, PRSUs and the ESPP are reported as cash inflows from operating activities on the consolidated statements of cash flows.
Advertising Costs
Advertising costs are expensed as promotional services are delivered in selling, general and administrative expenses. Advertising costs paid to third parties totaled $
355 million
, $
162 million
and $
166 million
for
2018
,
2017
and
2016
, respectively.
92
DISCOVERY, INC.
NOTES TO CONSOLIDATED FINANCIAL STATEMENTS
Income Taxes
Income taxes are recorded using the asset and liability method of accounting for income taxes. Deferred income taxes reflect the net tax effect of temporary differences between the carrying amounts of assets and liabilities for financial reporting purposes and the amounts used for income tax purposes. Deferred taxes are measured using rates the Company expects to apply to taxable income in years in which those temporary differences are expected to reverse. A valuation allowance is provided for deferred tax assets if it is more likely than not such assets will be unrealized. The Company also engages in transactions that make the Company eligible for federal investment tax credits. The Company accounts for federal investment tax credits under the flow-through method, under which the tax benefit generated from an investment tax credit is recorded in the period the credit is generated.
From time to time, the Company engages in transactions in which the tax consequences may be uncertain. Significant judgment is required in assessing and estimating the tax consequences of these transactions. The Company prepares and files tax returns based on its interpretation of tax laws and regulations. In the normal course of business, the Company's tax returns are subject to examination by various taxing authorities. Such examinations may result in future tax and interest assessments by these taxing authorities.
In determining the Company's tax provision for financial reporting purposes, the Company establishes a reserve for uncertain tax positions unless the Company determines that such positions are more likely than not to be sustained upon examination based on their technical merits, including the resolution of any appeals or litigation processes. The Company includes interest and where appropriate, penalties, in its tax reserves. There is significant judgment involved in determining the amount of reserve and whether positions taken on the Company's tax returns are more likely than not to be sustained, which involve the use of significant estimates and assumptions with respect to the potential outcome of positions taken on tax returns that may be reviewed by tax authorities. The Company adjusts its tax reserve estimates periodically because of ongoing examinations by, and settlements with, various taxing authorities, as well as changes in tax laws, regulations and interpretations.
The Company has elected to treat tax on GILTI income as a period cost.
Concentrations Risk
Customers
The Company has long-term contracts with distributors around the world. For the U.S. Networks segment, more than
96%
of distribution revenue comes from the
10
largest distributors. For the International Networks segment, approximately
39%
of distribution revenue comes from the
10
largest distributors. Agreements in place with the 10 largest cable and satellite operators with the U.S. Networks and International Networks expire at various times from
2019 through 2023
. Although the Company seeks to renew its agreements with its distributors prior to expiration of a contract, a delay in securing a renewal that results in a service disruption, a failure to secure a renewal or a renewal on less favorable terms may have a material adverse effect on the Company’s financial condition and results of operations. Not only could the Company experience a reduction in distribution revenue, but it could also experience a reduction in advertising revenue, as viewership is impacted by affiliate subscriber levels.
No
individual customer accounted for more than
10%
of total consolidated revenues for
2018
,
2017
or
2016
. As of
December 31, 2018
and
2017
, the Company’s trade receivables do not represent a significant concentration of credit risk as the customers and markets in which the Company operates are varied and dispersed across many geographic areas.
Financial Institutions
Cash and cash equivalents are maintained with several financial institutions. The Company has deposits held with banks that exceed the amount of insurance provided on such deposits. Generally, these deposits may be redeemed upon demand and are maintained with financial institutions of reputable credit and, therefore, bear minimal credit risk. Additionally, the Company has cash and cash equivalents held by its foreign subsidiaries. Under the TCJA, the Company was subjected to U.S. taxes for the deemed repatriation of certain cash balances held by foreign corporations. The Company continues to permanently reinvest these funds outside of the U.S., and current plans do not demonstrate a need to repatriate them to fund our U.S. operations.
Lender Counterparties
There is a risk that the counterparties associated with the Company’s revolving credit facility will not be available to fund as obligated under the terms of the facility and that the Company may, at the time of such unavailability to fund, have limited or no access to the commercial paper market. If funding under the revolving credit facility is unavailable, the Company may have to acquire a replacement credit facility from different counterparties at a higher cost or may be unable to find a suitable replacement. Typically, the Company seeks to manage such risks from its revolving credit facility by contracting with experienced large financial institutions and monitoring the credit quality of its lenders. As of
December 31, 2018
, the Company did not anticipate nonperformance by any of its counterparties.
93
DISCOVERY, INC.
NOTES TO CONSOLIDATED FINANCIAL STATEMENTS
Counterparty Credit Risk
The Company is exposed to the risk that the counterparties to outstanding derivative financial instruments will default on their obligations. The Company manages these credit risks through the evaluation and monitoring of the creditworthiness of, and concentration of risk with, the respective counterparties. In this regard, credit risk associated with outstanding derivative financial instruments is spread across a relatively broad counterparty base of banks and financial institutions. In connection with the Company's hedge of certain investments classified as available-for-sale securities, the Company has pledged shares as collateral to the derivative counterparty. (See Note 5.) The Company also has a limited number of arrangements where collateral is required to be posted in the instance that certain fair value thresholds are exceeded. As of
December 31, 2018
,
no
collateral has been posted by either party under these arrangements. As of
December 31, 2018
, our exposure to counterparty credit risk included derivative assets with an aggregate fair value of
$107 million
. (See Note 10.)
NOTE 3. ACQUISITIONS AND DISPOSITIONS
Acquisitions
Scripps Networks
On
March 6, 2018
, Discovery acquired Scripps Networks pursuant to the Agreement and Plan of Merger (the "Merger Agreement") by and among Discovery, Scripps Networks and Skylight Merger Sub, Inc. dated
July 30, 2017
(the "acquisition of Scripps Networks"). The acquisition of Scripps Networks allows the Company to offer complementary brands with an extensive library of original programming to consumers and to become a scale player with the ability to compete for audiences and advertising revenue. The acquisition is intended to extend Scripps Networks' content to a broader international audience through Discovery's global distribution infrastructure. Finally, the acquisition of Scripps Networks is expected to create cost synergies for the Company.
The consideration paid for the acquisition of Scripps Networks consisted of (i) for Scripps Networks shareholders that did not make an election or elected to receive the mixed consideration,
$65.82
in cash and
1.0584
shares of Discovery Series C common stock for each Scripps Networks share, (ii) for Scripps Networks shareholders that elected to receive the cash consideration,
$90.00
in cash for each Scripps Networks share, (iii) for Scripps Networks shareholders that elected to receive the stock consideration,
3.9392
shares of Discovery Series C common stock for each Scripps Networks share, subject to the terms and conditions set forth in the Merger Agreement and (iv) transaction costs that Discovery paid for costs incurred by Scripps Networks in conjunction with the acquisition.
94
DISCOVERY, INC.
NOTES TO CONSOLIDATED FINANCIAL STATEMENTS
The following table summarizes the components of the aggregate consideration paid for the acquisition of Scripps Networks (in millions of dollars and shares, except for per share amounts, share conversion ratio and stock option conversion ratio) as of
March 6, 2018
.
|
Scripps Networks equity
|
||||
|
Scripps Networks shares outstanding
|
131
|
|
||
|
Cash consideration per Scripps Networks share
|
$
|
65.82
|
|
|
|
Cash portion of consideration
|
$
|
8,590
|
|
|
|
Scripps Networks shares outstanding
|
131
|
|
||
|
Share conversion ratio per Scripps Networks share
|
1.0584
|
|
||
|
Discovery Series C common stock
|
138
|
|
||
|
Discovery Series C common stock price per share
|
$
|
23.01
|
|
|
|
Equity portion of consideration
|
$
|
3,179
|
|
|
|
Shares awarded under Scripps Networks share-based compensation programs
|
3
|
|
||
|
Scripps Networks share-based compensation awards converting to cash
|
2
|
|
||
|
Average cash consideration per share awarded less applicable exercise price
|
$
|
46.90
|
|
|
|
Cash portion of consideration
|
$
|
88
|
|
|
|
Scripps Networks share-based compensation awards
|
1
|
|
||
|
Share-based compensation conversion ratio (based on intrinsic value per award)
|
3
|
|
||
|
Discovery Series C common stock issued (1) or share-based compensation converted (2)
|
3
|
|
||
|
Average equity value (intrinsic value of Discovery Series C common stock or options to be issued)
|
$
|
15.19
|
|
|
|
Share-based compensation equity value
|
$
|
51
|
|
|
|
Less: post-combination compensation expense
|
(12
|
)
|
||
|
Equity portion of consideration
|
39
|
|
||
|
Scripps Networks transaction costs paid by Discovery
|
117
|
|
||
|
Total consideration paid
|
$
|
12,013
|
|
|
Balances reflect rounding of dollar and share amounts to millions, which may result in differences for recalculated standalone amounts compared with the amounts presented above.
The Company applied the acquisition method of accounting to Scripps Networks' business, whereby the excess of the fair value of the business over the fair value of identifiable net assets was allocated to goodwill. Goodwill reflects workforce and synergies expected from cost savings, operations and revenue enhancements of the combined company that are expected to result from the acquisition. The goodwill recorded as part of this acquisition has been provisionally allocated to the U.S. Networks and International Networks reportable segments in the amounts of
$5.3 billion
and
$802 million
, respectively, and is not amortizable for tax purposes.
95
DISCOVERY, INC.
NOTES TO CONSOLIDATED FINANCIAL STATEMENTS
The preliminary opening balance sheet is subject to adjustment based on final assessment of the fair values of certain acquired assets and assumed liabilities. The Company used discounted cash flow ("DCF") analyses, which represent Level 3 fair value measurements, to assess certain components of its purchase price allocation. The fair value of equity interests previously held by Scripps Networks was determined using the DCF and market value methods. The fair value of tradenames and trademarks was determined using an income approach based on the relief from royalty method. The remaining intangibles were determined using an income approach based on the excess earnings method. The fair value of interest-bearing debt was determined using publicly-traded prices. For the fair value estimates, the Company used: (i) projected discounted cash flows, (ii) historical and projected financial information, (iii) synergies including cost savings, and (iv) attrition rates, as relevant, that market participants would consider when estimating fair values. As the Company continues to finalize the fair value of assets acquired and liabilities assumed, purchase price adjustments have been recorded and additional purchase price adjustments may be recorded during the measurement period. The Company reflects measurement period adjustments in the period in which the adjustments occur. The adjustments for the
year ended December 31, 2018
resulted from the receipt of additional financial projections associated with certain equity method investments, contingent liability estimates, deferred income tax adjustments, and true-ups for estimated working capital balances. These adjustments did not impact the Company's statements of operations. As of December 31, 2018, certain tax exposures are subject to further adjustment. The Company estimates the total remaining exposure relative to these matters to be approximately
$110 million
in the aggregate as of December 31, 2018.
The preliminary fair value of assets acquired and liabilities assumed, measurement period adjustments, as well as a reconciliation to consideration paid is presented in the table below (in millions).
|
Preliminary
March 6, 2018
|
Measurement Period Adjustments
|
Updated Preliminary
March 6, 2018
|
||||||||||
|
Accounts receivable
|
$
|
783
|
|
$
|
—
|
|
$
|
783
|
|
|||
|
Other current assets
|
421
|
|
(9
|
)
|
412
|
|
||||||
|
Content rights
|
1,088
|
|
—
|
|
1,088
|
|
||||||
|
Property and equipment
|
315
|
|
—
|
|
315
|
|
||||||
|
Goodwill
|
6,003
|
|
118
|
|
6,121
|
|
||||||
|
Intangible assets
|
9,175
|
|
—
|
|
9,175
|
|
||||||
|
Equity method investments, including note receivable
|
870
|
|
(157
|
)
|
713
|
|
||||||
|
Other noncurrent assets
|
111
|
|
3
|
|
114
|
|
||||||
|
Current liabilities assumed
|
(494
|
)
|
(105
|
)
|
(599
|
)
|
||||||
|
Debt assumed
|
(2,481
|
)
|
—
|
|
(2,481
|
)
|
||||||
|
Deferred income taxes
|
(1,695
|
)
|
93
|
|
(1,602
|
)
|
||||||
|
Other noncurrent liabilities
|
(383
|
)
|
57
|
|
(326
|
)
|
||||||
|
Noncontrolling interests
|
(1,700
|
)
|
—
|
|
(1,700
|
)
|
||||||
|
Total consideration paid
|
$
|
12,013
|
|
$
|
—
|
|
$
|
12,013
|
|
|||
The table below presents a summary of intangible assets acquired and weighted average estimated useful life of these assets.
|
Fair Value
|
Weighted Average Useful Life in Years
|
|||||
|
Trademarks and trade names
|
$
|
1,225
|
|
10
|
||
|
Advertiser relationships
|
4,995
|
|
10
|
|||
|
Advertising backlog
|
280
|
|
1
|
|||
|
Affiliate relationships
|
2,455
|
|
12
|
|||
|
Broadcast licenses
|
220
|
|
6
|
|||
|
Total intangible assets acquired
|
$
|
9,175
|
|
|||
96
DISCOVERY, INC.
NOTES TO CONSOLIDATED FINANCIAL STATEMENTS
OWN
On
November 30, 2017
, the Company acquired a controlling interest in the Oprah Winfrey Network ("OWN") from Harpo, Inc. ("Harpo"), increasing Discovery’s ownership stake from
49.50%
to
73.75%
. OWN is a pay-TV network and website that provides adult lifestyle and entertainment content that is focused on African American viewers. Discovery paid
$70 million
in cash and recognized a gain of
$33 million
to account for the difference between the carrying value and the fair value of the previously held
49.50%
equity method investment. The fair value of the equity interest in the network is subject to the impact of the note payable to Discovery. Discovery consolidated OWN under the VIE consolidation model upon closing of the transaction. Following the acquisition of the incremental equity interest and change to governance provisions, the Company has determined that it is now the primary beneficiary of OWN as Discovery obtained control of the Board of Directors and operational rights that significantly impact the economic performance of the business such as programming and marketing, and selection of key personnel. As a result, the accounting for OWN was changed from an equity method investment to a consolidated subsidiary. As the primary beneficiary, Discovery includes OWN's assets, liabilities and results of operations in the Company's consolidated financial statements. As of
December 31, 2018
, the carrying amounts of assets and liabilities of the consolidated VIE were
$667 million
and
$235 million
, respectively.
The Company applied the acquisition method of accounting to OWN’s business, whereby the excess of the fair value of the business over the fair value of identifiable net assets was allocated to goodwill. The goodwill reflects the workforce and synergies expected from broader exposure to the self-discovery and self-improvement entertainment sector. The goodwill recorded as part of this acquisition is included in the U.S. Networks reportable segment and is not amortizable for tax purposes. Intangible assets consist of advertiser backlog, advertiser relationships and affiliate relationships with a weighted average estimated useful life of
9
years.
The Company used DCF analyses, which represent Level 3 fair value measurements, to assess certain components of its purchase price allocation. The fair value of intangibles was determined using an income approach based on the excess earnings method. For the fair value estimates, the Company used: (i) projected discounted cash flows, (ii) historical and projected financial information, (iii) synergies including cost savings and (iv) attrition rates, as relevant, that market participants would consider when estimating fair values. The Company reflected measurement period adjustments, in the period in which the adjustment occurred. The fair value of assets acquired and liabilities assumed, measurement period adjustments, as well as a reconciliation to cash consideration transferred is presented in the table below (in millions).
|
Preliminary
November 30, 2017
|
Measurement Period Adjustments
|
Final November 30, 2017
|
||||||||||
|
Intangible assets
|
$
|
295
|
|
$
|
—
|
|
$
|
295
|
|
|||
|
Content rights
|
176
|
|
—
|
|
176
|
|
||||||
|
Accounts receivable
|
84
|
|
—
|
|
84
|
|
||||||
|
Other assets
|
26
|
|
—
|
|
26
|
|
||||||
|
Other liabilities
|
(230
|
)
|
12
|
|
(218
|
)
|
||||||
|
Net assets acquired
|
$
|
351
|
|
$
|
12
|
|
$
|
363
|
|
|||
|
Goodwill
|
136
|
|
(12
|
)
|
124
|
|
||||||
|
Remeasurement gain on previously held equity interest
|
(33
|
)
|
—
|
|
(33
|
)
|
||||||
|
Carrying value of previously held equity interest
|
(329
|
)
|
—
|
|
(329
|
)
|
||||||
|
Redeemable noncontrolling interest
|
(55
|
)
|
—
|
|
(55
|
)
|
||||||
|
Cash consideration transferred
|
$
|
70
|
|
$
|
—
|
|
$
|
70
|
|
|||
Harpo has the right to require the Company to purchase its remaining noncontrolling interest at fair value during
90-day
windows beginning on
July 1, 2018
and every
two and a half
years thereafter through January 1, 2026. Harpo exercised the first of such remaining put rights on August 20, 2018. On November 6, 2018, the Company and Harpo entered into an amendment to the limited liability company agreement whereby Harpo agreed to withdraw its August 20, 2018 put notice and upon any succeeding redemption the put payment value will equal the fair value of Harpo's equity interest in OWN plus an incremental
9.337%
per annum for the
2.5
year period between the July 1, 2018 put right date and the January 1, 2021 put right date. As Harpo’s put right is outside the Company's control, Harpo’s noncontrolling interest is presented as redeemable noncontrolling interest outside of permanent equity on the Company's consolidated balance sheet. (See Note 11.)
97
DISCOVERY, INC.
NOTES TO CONSOLIDATED FINANCIAL STATEMENTS
MotorTrend Group
On
September 25, 2017
, the Company contributed its linear cable network focused on cars and motor sports, Velocity, to a new joint venture MotorTrend Group, LLC ("MTG"), formally VTEN with GoldenTree Asset Management L.P. ("GoldenTree"). GoldenTree's contributions to the joint venture included businesses from The Enthusiast Network, Inc. ("TEN"), primarily MotorTrend.com, the MotorTrend YouTube channel and the MotorTrend OnDemand OTT service. TEN did not contribute its print businesses to the joint venture. The joint venture has a portfolio of digital content, social groups, live events and original content focused on the automotive audience. In exchange for their contributions, Discovery and GoldenTree received
67.5%
and
32.5%
ownership of the new joint venture, respectively.
Upon the closing of the transaction, Discovery consolidated the joint venture under the voting interest consolidation model. As the Company controlled Velocity and continues to control Velocity after the transaction, the change in the value of the Company's ownership interest was accounted for as an equity transaction and
no
gain or loss was recognized in the Company's consolidated statements of operations, but was reflected as a component of additional paid-in capital in the consolidated statement of equity. The Company applied the acquisition method of accounting to TEN's contributed businesses, whereby the excess of the fair value of the contributed business over the fair value of identifiable net assets was allocated to goodwill. The goodwill reflects the workforce and synergies expected from broader exposure to the automotive entertainment sector. The goodwill recorded as part of this acquisition is included in the U.S. Networks reportable segment and is not amortizable for tax purposes. Intangible assets primarily consist of trade names, licensing agreements and customer relationships with a weighted average estimated useful life of
16 years
.
The Company used DCF analyses, which represent Level 3 fair value measurements, to assess certain components of its purchase price allocation. The fair value of the assets acquired and liabilities assumed is presented in the table below (in millions).
|
Preliminary
September 25, 2017
|
Measurement Period Adjustments
|
Final
September 25, 2017
|
||||||||||
|
Goodwill
|
$
|
59
|
|
$
|
16
|
|
$
|
75
|
|
|||
|
Intangible assets
|
71
|
|
(18
|
)
|
53
|
|
||||||
|
Property plant and equipment, net
|
16
|
|
1
|
|
17
|
|
||||||
|
Other assets acquired
|
6
|
|
—
|
|
6
|
|
||||||
|
Liabilities assumed
|
(8
|
)
|
1
|
|
(7
|
)
|
||||||
|
Net assets acquired
|
$
|
144
|
|
$
|
—
|
|
$
|
144
|
|
|||
Discovery has a fair value call right exercisable during
30-day
windows beginning on each of
March 25, 2021
,
September 25, 2022
and
March 25, 2024
, that requires Discovery to either purchase all of GoldenTree's noncontrolling
32.5%
interest in the joint venture at fair value or participate in an initial public offering for the joint venture. GoldenTree's
32.5%
noncontrolling interest in the joint venture is presented as redeemable noncontrolling interest outside of permanent equity on the Company's consolidated balance sheet. The opening balance sheet value of redeemable noncontrolling interest recognized upon closing was
$82 million
based on GoldenTree's ownership interest in the book value of Velocity and fair value of GoldenTree's contribution. The balance was subsequently increased by
$38 million
to adjust the redemption value to fair value of
$120 million
. (See Note 11.)
Other
On
March 2, 2018
, the Company acquired a sports broadcaster in Turkey for
$5 million
. On
September 1, 2017
, the Company exercised its call right for the remaining outstanding equity in an equity method investment in a FTA company in Poland for
$4 million
. The operations of these entities were consolidated upon their acquisition dates.
98
DISCOVERY, INC.
NOTES TO CONSOLIDATED FINANCIAL STATEMENTS
Pro Forma Financial Information
The following unaudited pro forma information has been presented as if the acquisition of Scripps Networks occurred on
January 1, 2017
and the OWN and MTG transactions occurred on
January 1, 2016
. The information is based on the historical results of operations of the acquired businesses, adjusted for:
|
1.
|
The allocation of purchase price and related adjustments, including adjustments to amortization expense related to the fair value of intangible assets acquired and the recognition of the noncontrolling interests;
|
|
2.
|
Impacts of debt financing, including interest for debt issued and amortization associated with the fair value adjustments of debt assumed;
|
|
3.
|
The movement and allocation of all acquisition-related costs incurred during the
twelve months ended December 31, 2018
to the
twelve months ended December 31, 2017
;
|
|
4.
|
Associated tax-related impacts of adjustments; and
|
|
5.
|
Changes to align accounting policies.
|
The pro forma results do not necessarily represent what would have occurred if the transactions had taken place on
January 1, 2017
for Scripps Networks or
January 1, 2016
for OWN or MTG, nor do they represent the results that may occur in the future. The pro forma adjustments were based on available information and upon assumptions that the Company believes are reasonable to reflect the impact of these acquisitions on the Company's historical financial information on a supplemental pro forma basis (in millions). The following table presents the Company's pro forma combined revenues and net income (in millions, except per share value). The Company's 2017 OWN and MTG transactions were not material individually or in the aggregate, therefore no pro forma information is presented for 2016.
|
Year Ended December 31,
|
||||||||
|
2018
|
2017
|
|||||||
|
Revenues
|
$
|
11,176
|
|
$
|
10,790
|
|
||
|
Net income (loss) available to Discovery, Inc.
|
823
|
|
(329
|
)
|
||||
|
Net income (loss) per share - basic
|
1.15
|
|
(0.46
|
)
|
||||
|
Net income (loss) per share - diluted
|
1.15
|
|
(0.47
|
)
|
||||
Impact of Business Combinations
The operations of each of the business combinations discussed above were included in the consolidated financial statements as of each of their respective acquisition dates. The following table presents their revenue and earnings as reported within the consolidated financial statements (in millions).
|
Year Ended December 31,
|
||||||||
|
2018
|
2017
|
|||||||
|
Revenues:
|
||||||||
|
Distribution
|
$
|
961
|
|
$
|
14
|
|
||
|
Advertising
|
2,377
|
|
25
|
|
||||
|
Other
|
156
|
|
19
|
|
||||
|
Total revenues
|
$
|
3,494
|
|
$
|
58
|
|
||
|
Net income (loss) available to Discovery, Inc.
|
$
|
203
|
|
$
|
(1
|
)
|
||
Dispositions
Education Business
On
April 30, 2018
, the Company sold an
88%
controlling equity stake in its Education Business to
Francisco Partners for a sale price of
$113 million
. The Company recorded a gain of
$84 million
based on net assets disposed of
$44 million
, including
$40 million
of goodwill. The impact of the Education Business on the Company's income before income taxes was a loss of
$2 million
for the
year ended December 31, 2018
. Discovery retained a
12%
ownership interest in the Education Business, which is accounted for as an equity method investment. (See Note 4.) Discovery has long-term trade name license agreements with the Education Business that are royalty arrangements at fair value.
99
DISCOVERY, INC.
NOTES TO CONSOLIDATED FINANCIAL STATEMENTS
Raw and Betty Studios, LLC
On
April 28, 2017
, the Company sold Raw and Betty to All3Media. All3Media is a U.K. based television, film and digital production and distribution company. The Company owns
50%
of All3Media and accounts for its investment in All3Media under the equity method of accounting. The Company recorded a loss of
$4 million
for the disposition of these businesses for the
year ended December 31, 2017
. The loss on disposition of Raw and Betty resulted from the disposition of net assets of
$38 million
, including
$30 million
of goodwill. The impact to the Company's income before income taxes for Raw and Betty through the date of sale was a loss of
$4 million
for the
year ended December 31, 2017
. Raw and Betty were components of the studios operating segment reported with Education and Other.
Group Nine Transaction
On
December 2, 2016
, the Company recorded a pre-tax gain of
$50 million
upon disposition of its digital network Seeker and production studio SourceFed, following its contribution of the businesses and
$100 million
in cash for the formation of a new joint venture, Group Nine Media, Inc. ("Group Nine Media"), on December 2, 2016 ("Group Nine Transaction"). Group Nine Media includes Thrillist Media Group, NowThis Media and TheDodo.com. As a result of the transaction, Discovery obtained a noncontrolling ownership interest in the preferred stock of Group Nine Media, which is accounted for as an equity investment without readily determinable fair value. As of
December 31, 2018
, the Company owns a
42%
minority interest in Group Nine Media on an outstanding shares basis with a carrying value of
$212 million
. (See Note 4.) The gain on contribution of the digital networks business included the disposition of
$32 million
in net assets, including
$22 million
of goodwill allocated to the transaction based on the relative fair values of the digital networks business disposed of and the portion of the U.S. Networks reporting unit that was retained.
The Company determined that these disposals did not meet the definition of a discontinued operation because they did not represent a strategic shift that has a significant impact on the Company's operations and consolidated financial results.
NOTE 4. INVESTMENTS
The Company’s investments consisted of the following (in millions).
|
Category
|
Balance Sheet Location
|
December 31, 2018
|
December 31, 2017
|
|||||||
|
Time deposits
|
Cash and cash equivalents
|
$
|
—
|
|
$
|
1,305
|
|
|||
|
Equity securities:
|
||||||||||
|
Money market funds
|
Cash and cash equivalents
|
286
|
|
2,707
|
|
|||||
|
Mutual funds and company-owned life insurance contracts
|
Prepaid and other current assets
|
28
|
|
182
|
|
|||||
|
Mutual funds and company-owned life insurance contracts
|
Other noncurrent assets
|
188
|
|
—
|
|
|||||
|
Equity method investments:
|
||||||||||
|
Equity investments
|
Equity method investment
|
841
|
|
335
|
|
|||||
|
Note receivable
|
Equity method investment
|
94
|
|
—
|
|
|||||
|
Equity Investments:
|
||||||||||
|
Common stock investments with readily determinable fair values
|
Other noncurrent assets
|
77
|
|
164
|
|
|||||
|
Equity investments without readily determinable fair value
|
Other noncurrent assets
|
379
|
|
295
|
|
|||||
|
Total investments
|
$
|
1,893
|
|
$
|
4,988
|
|
||||
Money Market Funds and Time Deposits
During
2017
, the Company issued
$6.8 billion
in senior notes to fund the
March 6, 2018
acquisition of Scripps Networks. (See Note 3 and Note 9.) A portion of the proceeds was invested in various short-term investments with original maturities of 90 days or less prior to the acquisition of Scripps Networks and was classified as cash and cash equivalents on the consolidated balance sheet. As of
December 31, 2018
, the decrease in these funds is the result of funding the acquisition of Scripps Networks.
100
DISCOVERY, INC.
NOTES TO CONSOLIDATED FINANCIAL STATEMENTS
Mutual Funds
Equity securities include investments in mutual funds held in separate trusts, which are owned as part of the Company’s supplemental retirement plans. (See Note 5 and Note 16.)
Equity Method Investments
The Company makes investments that support its underlying business strategy and enable it to enter new markets and develop programming. Certain of the Company's equity method investments are VIEs, for which the Company is not the primary beneficiary. As of
December 31, 2018
, the Company’s maximum exposure for all its unconsolidated VIEs, including the investment carrying values, unfunded contractual commitments, and guarantees made on behalf of VIEs, was approximately
$570 million
. The Company's maximum estimated exposure excludes the non-contractual future funding of VIEs. The aggregate carrying values of these VIE investments, including a note receivable of
$94 million
, were
$528 million
and
$181 million
as of
December 31, 2018
and
December 31, 2017
, respectively. The Company recognized its portion of VIE operating results with net losses and impairments of
$52 million
, net losses of
$182 million
and net earnings of
$7 million
for
2018
,
2017
and
2016
, respectively, in loss from equity investees, net on the consolidated statements of operations.
UKTV
In connection with the acquisition of Scripps Networks, the Company acquired a
50%
ownership interest in UKTV, a British multi-channel broadcaster jointly owned with BBC Studios (“BBC”). UKTV was formed on
March 26, 1992
, through a joint venture arrangement between BBC and Virgin Media Inc. ("VMED"). On
August 11, 2011
, Scripps Networks acquired VMED's
50%
equity interest in UKTV along with a note receivable for debt instruments provided by VMED to UKTV. The Company has determined that UKTV is a VIE as the entity is unable to fund its activities without additional subordinated financial support provided by the note receivable. While the Company and BBC have equal voting rights in the management committee, which is the governing body of UKTV, power is not shared because BBC holds operational rights related to programming and creative development that significantly impact UKTV’s economic performance. Therefore, Discovery is not the primary beneficiary. The Company determined that its
50%
equity interest in UKTV gives the Company the ability to exercise significant influence over the entity's operating and financial policies. Accordingly, the Company accounts for its investment in UKTV using the equity method. As of
December 31, 2018
, the Company’s investment in UKTV totaled
$386 million
, including a note receivable of
$94 million
.
nC+
In connection with the acquisition of Scripps Networks, the Company acquired a
32%
ownership interest in nC+, a Polish satellite distributor of television content. nC+ is controlled by Group Canal+ S.A, a French broadcaster. The Company applies the equity method of accounting to its
32%
investment in nC+ ordinary shares, which provide the ability to exercise significant influence over the entity's operating and financial policies. The Company's investment in nC+ totaled
$180 million
as of
December 31, 2018
.
Renewable Energy Investments
The Company invested
$17 million
,
$322 million
and
$63 million
in limited liability companies that sponsor renewable energy projects related to solar energy during the
years ended December 31, 2018, December 31, 2017 and December 31, 2016
, respectively. The Company expects these investments to result in tax benefits that reduce the Company's tax liability, and increase cash flows from the operations. These investments are considered VIEs of the Company. The Company accounts for these investments under the equity method of accounting. While the Company possesses rights that allow it to exercise significant influence over the investments, the Company does not have the power to direct the activities that will most significantly impact their economic performance, such as the investee's ability to obtain sufficient customers or control solar panel assets. Once a stipulated return on investment is earned by the Company, the investment allocations to the Company are significantly reduced. Accordingly, the Company applies the Hypothetical Liquidation at Book Value ("HLBV") methodology for allocating earnings, which is a generally accepted method under the equity method of accounting when a substantive profit sharing arrangement exists.
101
DISCOVERY, INC.
NOTES TO CONSOLIDATED FINANCIAL STATEMENTS
The following table presents renewable energy investments losses and associated tax benefits (in millions).
|
Consolidated Statements of Operations Classification
|
Year Ended December 31,
|
||||||||||||
|
Renewable Energy Investments
|
2018
|
2017
|
2016
|
||||||||||
|
Loss on renewable energy investments
|
Loss from equity investees, net
|
$
|
(11
|
)
|
$
|
(251
|
)
|
$
|
(24
|
)
|
|||
|
Tax benefit:
|
|||||||||||||
|
Equity passive loss
|
Income tax expense
|
$
|
2
|
|
$
|
83
|
|
$
|
9
|
|
|||
|
Investment tax credits
|
Income tax expense
|
12
|
|
211
|
|
17
|
|
||||||
|
Total tax benefit
|
$
|
14
|
|
$
|
294
|
|
$
|
26
|
|
||||
The Company accounts for investment tax credits utilizing the flow through method. As of
December 31, 2018
and
December 31, 2017
, the carrying value of the Company's renewable energy investments was
$89 million
and
$98 million
, respectively. The Company has
$4 million
of future funding commitments for these investments as of
December 31, 2018
, which are cancelable under limited circumstances. The Company has concluded that losses incurred on these investments to-date are not indicative of an other-than-temporary impairment due to the nature of these investments. Losses in the early stages of investments in companies that sponsor renewable energy projects are not uncommon, and the Company expects improved performance from these investments in future periods.
Other Equity Method Investments
At
December 31, 2018
and
December 31, 2017
, the Company's other equity method investments included production companies such as All3Media, a Russian cable television business, Mega TV in Chile and certain joint ventures in Canada. Other equity method investments acquired in conjunction with the acquisition of Scripps Networks include joint ventures in Canada, and HGTV and Food Network Magazines. The Company recorded impairment losses of
$29 million
for the
year ended December 31, 2018
because the carrying amount of certain investments was not recoverable. The impairment losses are reflected as a component of loss from equity investees, net on the Company's consolidated statement of operations.
Investor Basis Differential
With the exception of the OWN investment prior to the Company's
November 30, 2017
consolidation (see Note 3), UKTV, nC+, and certain investments in renewable energy projects for which the Company uses the HLBV methodology for allocating earnings, the carrying values of the Company’s remaining equity method investments are consistent with its ownership in the underlying net assets of the investees. A portion of the purchase prices associated with UKTV and nC+ was attributed to amortizable intangible assets, which are included in their carrying values. Earnings from our equity investees were reduced by the amortization of these intangibles by
$27 million
during the period from
March 6, 2018
to
December 31, 2018
. Amortization that reduces the Company's equity in earnings of equity method investees for future periods is expected to be approximately
$291 million
.
102
DISCOVERY, INC.
NOTES TO CONSOLIDATED FINANCIAL STATEMENTS
Significant Subsidiaries
The table set forth below presents selected financial information for investments accounted for under the equity method. Because renewable energy projects discussed above are accounted for under the HLBV equity method of accounting, the Company's equity method losses do not directly correlate with the GAAP results of the investees presented below. The selected statement of operations information for each of the three years ended
December 31, 2018
,
2017
, and
2016
and the selected balance sheet information as of
December 31, 2018
and
2017
(in millions) is summarized in the table below.
|
2018
|
2017
|
2016
|
||||||||||
|
Selected Statement of Operations Information:
|
||||||||||||
|
Revenues
|
$
|
3,140
|
|
$
|
1,780
|
|
$
|
1,617
|
|
|||
|
Cost of sales
|
1,973
|
|
1,100
|
|
998
|
|
||||||
|
Operating income
|
847
|
|
76
|
|
83
|
|
||||||
|
Pre-tax income (loss) from continuing operations before extraordinary items
|
180
|
|
16
|
|
(78
|
)
|
||||||
|
After-tax net loss
|
96
|
|
(27
|
)
|
(98
|
)
|
||||||
|
Net loss attributable to the entity
|
96
|
|
(27
|
)
|
(99
|
)
|
||||||
|
Selected Balance Sheet Information:
|
||||||||||||
|
Current assets
|
$
|
1,855
|
|
$
|
1,002
|
|
|
|||||
|
Noncurrent assets
|
2,465
|
|
1,946
|
|
|
|||||||
|
Current liabilities
|
1,398
|
|
701
|
|
|
|||||||
|
Noncurrent liabilities
|
1,334
|
|
1,008
|
|
|
|||||||
|
Redeemable preferred stock
|
438
|
|
476
|
|
|
|||||||
|
Non-controlling interests
|
267
|
|
6
|
|
|
|||||||
Common Stock Investments with Readily Determinable Fair Value
The Company owns
5 million
shares of common stock, or approximately
3%
, of Lions Gate Entertainment Corp. ("Lionsgate"), an entertainment company. Lionsgate operates in the motion picture production and distribution, television programming and syndication, home entertainment and digital distribution business. Upon the adoption of ASU 2016-01, the shares are measured at fair value, with realized gains and losses recorded in other (expense) income, net, as the shares have a readily determinable fair value and the Company has the intent to retain the investment. The Company recorded a transition adjustment to reclassify accumulated other comprehensive income associated with Lionsgate shares in the amount of
$32 million
pre-tax (
$26 million
, net of tax) to retained earnings. Previously, amounts were recorded as a component of other comprehensive income.
The accumulated amounts associated with the components of the Company's common stock investments with readily determinable fair values, which are included in other non-current assets, are summarized in the table below (in millions).
|
December 31, 2018
|
December 31, 2017
|
|||||||
|
Cost
|
$
|
195
|
|
$
|
195
|
|
||
|
Accumulated change in the value of:
|
||||||||
|
Equity securities recognized in other expense, net
|
(88
|
)
|
(1
|
)
|
||||
|
Unhedged equity securities recorded in other comprehensive income
|
—
|
|
32
|
|
||||
|
Reclassification of accumulated other comprehensive income to retained earnings
|
32
|
|
—
|
|
||||
|
Other-than-temporary impairment
|
(62
|
)
|
(62
|
)
|
||||
|
Carrying value
|
$
|
77
|
|
$
|
164
|
|
||
103
DISCOVERY, INC.
NOTES TO CONSOLIDATED FINANCIAL STATEMENTS
The Company hedged
50%
of the Lionsgate shares with an equity collar (the “Lionsgate Collar”) and pledged those shares as collateral to the derivative counterparty. Prior to adoption of ASU 2016-01, when the share price of Lionsgate was within the boundaries of the collar and the hedge had no intrinsic value, the Company recorded the gains or losses on the Lionsgate shares as a component of
other comprehensive income (loss)
. When the share price of the Lionsgate shares was outside the boundaries of the collar and the hedge had intrinsic value, the Company recorded the gains or losses resulting from a change in the fair value of the hedged portion of Lionsgate shares that correspond to the change in intrinsic value of the hedge as a component of
other (expense) income, net
. Upon adoption of ASU 2016-01, the Lionsgate Collar no longer receives the hedge accounting designation. Although there is a change in the hedging designation, all changes to the fair value of the Lionsgate Collar continue to be reflected in the financial statements as a component of
other (expense) income, net
on the consolidated statements of operations (See Note 2, Note 5 and Note 10).
In
2016
, the Company determined that the decline in value of equity securities related to its investment in Lionsgate was other-than-temporary in nature and, as such, the cost basis was adjusted to fair value. The impairment determination was based on the sustained decline in the stock price of Lionsgate in relation to the purchase price and the prolonged length of time the fair value of the investment had been less than the carrying value. Based on the other-than-temporary impairment determination, unrealized pre-tax losses of
$62 million
previously recorded as a component of
other comprehensive income (loss)
were recognized as an impairment charge that was included as a component of
other (expense) income, net
for the
year ended December 31, 2016
.
Equity investments without readily determinable fair values assessed under the measurement alternative
The Company's equity investments without readily determinable fair values assessed under the measurement alternative as of
December 31, 2018
primarily include its
42%
minority interest in Group Nine Media on an outstanding shares basis recorded at
$212 million
. Discovery has significant influence through its voting rights in the preferred stock of Group Nine Media, however, this ownership interest has liquidation preferences that do not allow the investment to meet the definition of in-substance common stock. The Company accounts for its ownership interest in Group Nine Media as an equity investment without a readily determinable fair value assessed under the measurement alternative. The Company also has similar investments in an educational website, an electric car racing series and certain investments to enhance the Company's digital distribution strategies, such as a
$35 million
investment in Refinery29. The Company performs its qualitative assessment quarterly and concluded that its other equity investments without readily determinable fair values had no indicators that a change in fair value had taken place as of
December 31, 2018
.
NOTE 5. FAIR VALUE MEASUREMENTS
Fair value is defined as the amount that would be received for selling an asset or paid to transfer a liability in an orderly transaction between market participants. Assets and liabilities carried at fair value are classified in the following three categories:
|
Level 1
|
–
|
Quoted prices for identical instruments in active markets.
|
|
Level 2
|
–
|
Quoted prices for similar instruments in active markets; quoted prices for identical or similar instruments in markets that are not active; and model-derived valuations in which all significant inputs and significant value drivers are observable in active markets.
|
|
Level 3
|
–
|
Valuations derived from techniques in which one or more significant inputs are unobservable.
|
104
DISCOVERY, INC.
NOTES TO CONSOLIDATED FINANCIAL STATEMENTS
The table below presents assets and liabilities measured at fair value on a recurring basis (in millions).
|
|
|
December 31, 2018
|
||||||||||||||||
|
Category
|
Balance Sheet Location
|
Level 1
|
Level 2
|
Level 3
|
Total
|
|||||||||||||
|
Assets
|
||||||||||||||||||
|
Equity securities:
|
||||||||||||||||||
|
Money market funds
|
Cash and cash equivalents
|
$
|
286
|
|
$
|
—
|
|
$
|
—
|
|
$
|
286
|
|
|||||
|
Mutual funds
|
Prepaid expenses and other current assets
|
13
|
|
—
|
|
—
|
|
13
|
|
|||||||||
|
Company-owned life insurance contracts
|
Prepaid expenses and other current assets
|
—
|
|
15
|
|
—
|
|
15
|
|
|||||||||
|
Mutual funds
|
Other noncurrent assets
|
158
|
|
—
|
|
—
|
|
158
|
|
|||||||||
|
Company-owned life insurance contracts
|
Other noncurrent assets
|
—
|
|
30
|
|
—
|
|
30
|
|
|||||||||
|
Equity investments with readily determinable fair value:
|
||||||||||||||||||
|
Common stock
|
Other noncurrent assets
|
77
|
|
—
|
|
—
|
|
77
|
|
|||||||||
|
Derivatives:
|
||||||||||||||||||
|
Cash flow hedges:
|
||||||||||||||||||
|
Foreign exchange
|
Prepaid expenses and other current assets
|
—
|
|
13
|
|
—
|
|
13
|
|
|||||||||
|
Net investment hedges:
|
||||||||||||||||||
|
Cross-currency swaps
|
Other noncurrent assets
|
—
|
|
41
|
|
—
|
|
41
|
|
|||||||||
|
Foreign exchange
|
Other noncurrent assets
|
—
|
|
1
|
|
—
|
|
1
|
|
|||||||||
|
No hedging designation:
(a)
|
||||||||||||||||||
|
Equity (Lionsgate Collar)
|
Prepaid expenses and other current assets
|
—
|
|
14
|
|
—
|
|
14
|
|
|||||||||
|
Equity (Lionsgate Collar)
|
Other noncurrent assets
|
—
|
|
27
|
|
—
|
|
27
|
|
|||||||||
|
Foreign exchange
|
Other noncurrent assets
|
—
|
|
11
|
|
—
|
|
11
|
|
|||||||||
|
Total
|
$
|
534
|
|
$
|
152
|
|
$
|
—
|
|
$
|
686
|
|
||||||
|
Liabilities
|
||||||||||||||||||
|
Deferred compensation plan
|
Accrued liabilities
|
$
|
37
|
|
$
|
—
|
|
$
|
—
|
|
$
|
37
|
|
|||||
|
Deferred compensation plan
|
Other noncurrent liabilities
|
178
|
|
—
|
|
—
|
|
178
|
|
|||||||||
|
Derivatives:
|
||||||||||||||||||
|
Cash flow hedges:
|
||||||||||||||||||
|
Foreign exchange
|
Accrued liabilities
|
—
|
|
3
|
|
—
|
|
3
|
|
|||||||||
|
Net investment hedges:
|
||||||||||||||||||
|
Cross-currency swaps
|
Accrued liabilities
|
—
|
|
39
|
|
—
|
|
39
|
|
|||||||||
|
Cross-currency swaps
|
Other noncurrent liabilities
|
—
|
|
81
|
|
—
|
|
81
|
|
|||||||||
|
No hedging designation:
|
||||||||||||||||||
|
Cross-currency swaps
|
Accrued liabilities
|
—
|
|
1
|
|
—
|
|
1
|
|
|||||||||
|
Total
|
$
|
215
|
|
$
|
124
|
|
$
|
—
|
|
$
|
339
|
|
||||||
105
DISCOVERY, INC.
NOTES TO CONSOLIDATED FINANCIAL STATEMENTS
|
December 31, 2017
|
||||||||||||||||||
|
Category
|
Balance Sheet Location
|
Level 1
|
Level 2
|
Level 3
|
Total
|
|||||||||||||
|
Assets
|
||||||||||||||||||
|
Cash equivalents:
|
||||||||||||||||||
|
Time deposits
|
Cash and cash equivalents
|
$
|
—
|
|
$
|
1,305
|
|
$
|
—
|
|
$
|
1,305
|
|
|||||
|
Equity securities:
|
||||||||||||||||||
|
Money market funds
|
Cash and cash equivalents
|
2,707
|
|
—
|
|
—
|
|
2,707
|
|
|||||||||
|
Mutual funds
|
Prepaid expenses and other current assets
|
182
|
|
—
|
|
—
|
|
182
|
|
|||||||||
|
Equity investments with readily determinable fair value:
(a)
|
||||||||||||||||||
|
Common stock
|
Other noncurrent assets
|
82
|
|
—
|
|
—
|
|
82
|
|
|||||||||
|
Common stock - pledged
|
Other noncurrent assets
|
82
|
|
—
|
|
—
|
|
82
|
|
|||||||||
|
Derivatives:
|
||||||||||||||||||
|
Cash flow hedges:
|
||||||||||||||||||
|
Foreign exchange
|
Prepaid expenses and other current assets
|
—
|
|
7
|
|
—
|
|
7
|
|
|||||||||
|
Net investment hedges:
|
||||||||||||||||||
|
Cross-currency swaps
|
Other noncurrent assets
|
—
|
|
3
|
|
—
|
|
3
|
|
|||||||||
|
Foreign exchange
|
Prepaid expenses and other current assets
|
—
|
|
2
|
|
—
|
|
2
|
|
|||||||||
|
Fair value hedges:
(a)
|
||||||||||||||||||
|
Equity (Lionsgate Collar)
|
Other noncurrent assets
|
—
|
|
13
|
|
—
|
|
13
|
|
|||||||||
|
Total
|
$
|
3,053
|
|
$
|
1,330
|
|
$
|
—
|
|
$
|
4,383
|
|
||||||
|
Liabilities
|
||||||||||||||||||
|
Deferred compensation plan
|
Accrued liabilities
|
$
|
182
|
|
$
|
—
|
|
$
|
—
|
|
$
|
182
|
|
|||||
|
Derivatives:
|
||||||||||||||||||
|
Cash flow hedges:
|
||||||||||||||||||
|
Foreign exchange
|
Accrued liabilities
|
—
|
|
12
|
|
—
|
|
12
|
|
|||||||||
|
Net investment hedges:
|
||||||||||||||||||
|
Cross-currency swaps
|
Accrued liabilities
|
—
|
|
13
|
|
—
|
|
13
|
|
|||||||||
|
Cross-currency swaps
|
Other noncurrent liabilities
|
—
|
|
98
|
|
—
|
|
98
|
|
|||||||||
|
Foreign exchange
|
Accrued liabilities
|
—
|
|
8
|
|
—
|
|
8
|
|
|||||||||
|
No hedging designation:
|
||||||||||||||||||
|
Credit contracts
|
Other noncurrent liabilities
|
—
|
|
1
|
|
—
|
|
1
|
|
|||||||||
|
Cross-currency swaps
|
Other noncurrent liabilities
|
—
|
|
6
|
|
—
|
|
6
|
|
|||||||||
|
Total
|
$
|
182
|
|
$
|
138
|
|
$
|
—
|
|
$
|
320
|
|
||||||
(a)
Prior to
January 1, 2018
, and the adoption of ASU 2016-01, the Company applied hedge accounting to the Lionsgate Collar. (See Note 2 and Note 10.)
Cash obtained as a result of the issuance of senior notes to fund a portion of the purchase price of the acquisition of Scripps Networks was invested in money market funds, time deposit accounts, U.S. Treasury securities, and highly liquid short-term instruments that qualify as cash and cash equivalents. Any accrued interest received after maturity was reinvested into additional short-term instruments. (See Note 4.) The Company values cash and cash equivalents using quoted market prices. As of
December 31, 2018
, following the acquisition of Scripps Networks, the Company no longer holds these investments as these investments were liquidated and utilized in the acquisition of Scripps Networks.
The fair value of Level 1 equity securities was determined by reference to the quoted market price per share in active markets multiplied by the number of shares held without consideration of transaction costs. (See Note 4.) The fair value of the deferred compensation plan liability was determined based on the fair value of the related investments elected by employees. Changes in the fair value of the investments are offset by changes in the fair value of the deferred compensation obligation. (See Note 16.)
106
DISCOVERY, INC.
NOTES TO CONSOLIDATED FINANCIAL STATEMENTS
Common stock investments with readily determinable fair values are recorded by reference to the quoted market price per unit in active markets multiplied by the number of units held without consideration of transaction costs. (See Note 4.) As of January 1, 2018, the Company adopted ASU 2016-01, which eliminates the AFS classification. (See Note 2 and Note 4.)
Company-owned life insurance contracts are recorded at their cash surrender value. (See Note 4 and 16.)
Derivative financial instruments are comprised of foreign exchange, interest rate, credit and equity contracts. (See Note 10.) The fair value of Level 2 derivative financial instruments was determined using a market-based approach.
In addition to the financial instruments listed in the tables above, the Company holds other financial instruments, including cash deposits, accounts receivable, accounts payable, commercial paper, borrowings under the revolving credit facility, capital leases and senior notes. The carrying values for such financial instruments, other than the senior notes, each approximated their fair values as of
December 31, 2018
and
December 31, 2017
. The estimated fair value of the Company’s outstanding senior notes using quoted prices from over the counter markets, considered Level 2 inputs, was
$16.3 billion
and
$14.8 billion
as of
December 31, 2018
and
December 31, 2017
, respectively.
NOTE 6. CONTENT RIGHTS
The following table presents the components of content rights (in millions).
|
|
December 31,
|
|||||||
|
|
2018
|
2017
|
||||||
|
Produced content rights:
|
||||||||
|
Completed
|
$
|
5,609
|
|
$
|
4,355
|
|
||
|
In-production
|
612
|
|
442
|
|
||||
|
Coproduced content rights:
|
||||||||
|
Completed
|
682
|
|
745
|
|
||||
|
In-production
|
53
|
|
27
|
|
||||
|
Licensed content rights:
|
||||||||
|
Acquired
|
1,007
|
|
1,070
|
|
||||
|
Prepaid
(a)
|
154
|
|
181
|
|
||||
|
Content rights, at cost
|
8,117
|
|
6,820
|
|
||||
|
Accumulated amortization
|
(4,735
|
)
|
(4,197
|
)
|
||||
|
Total content rights, net
|
3,382
|
|
2,623
|
|
||||
|
Current portion
|
(313
|
)
|
(410
|
)
|
||||
|
Noncurrent portion
|
$
|
3,069
|
|
$
|
2,213
|
|
||
a)
Prepaid licensed content rights includes payments for rights to the Olympic Games of
$65 million
that are reflected as noncurrent content rights and
$83 million
that are reflected as current content rights on the consolidated balance sheet as of
December 31, 2018 and 2017
, respectively.
Content expense consisted of the following (in millions).
|
For the year ended December 31,
|
||||||||||||
|
2018
|
2017
|
2016
|
||||||||||
|
Content amortization
|
$
|
2,858
|
|
$
|
1,878
|
|
$
|
1,701
|
|
|||
|
Other production charges
|
471
|
|
310
|
|
272
|
|
||||||
|
Content impairments
|
430
|
|
32
|
|
72
|
|
||||||
|
Total content expense
|
$
|
3,759
|
|
$
|
2,220
|
|
$
|
2,045
|
|
|||
107
DISCOVERY, INC.
NOTES TO CONSOLIDATED FINANCIAL STATEMENTS
Content expense is generally a component of costs of revenue on the consolidated statements of operations. Content impairments of
$405 million
for the year ended
December 31, 2018
, were due to the strategic programming changes following the acquisition of Scripps Networks and are reflected in restructuring and other charges as further described in Note 17.
No
content impairments were recorded as a component of restructuring and other during the year ended
December 31, 2017
, and content impairments of $
7 million
were recorded as a component of restructuring and other charges for the year ended
December 31, 2016
.
As of
December 31, 2018
, the Company estimates that approximately
96%
of unamortized costs of content rights, excluding content in-production and prepaid licenses, will be amortized within the next
three
years. As of
December 31, 2018
, the Company will amortize $
1.5 billion
of the above unamortized content rights, excluding content in-production and prepaid licenses, during the next twelve months.
NOTE 7. PROPERTY AND EQUIPMENT
Property and equipment consisted of the following (in millions).
|
|
December 31,
|
||||||
|
|
2018
|
2017
|
|||||
|
Land, buildings and leasehold improvements
|
$
|
365
|
|
$
|
363
|
|
|
|
Broadcast equipment
|
730
|
|
728
|
|
|||
|
Capitalized software costs
|
440
|
|
379
|
|
|||
|
Office equipment, furniture, fixtures and other
|
458
|
|
431
|
|
|||
|
Property and equipment, at cost
|
1,993
|
|
1,901
|
|
|||
|
Accumulated depreciation
|
(1,193
|
)
|
(1,304
|
)
|
|||
|
Property and equipment, net
|
$
|
800
|
|
$
|
597
|
|
|
Property and equipment includes assets acquired under capital lease arrangements, primarily satellite transponders classified as broadcast equipment, with gross carrying values of
$369 million
and
$358 million
as of
December 31, 2018
and
2017
, respectively. The related accumulated amortization for capital lease assets was
$181 million
and
$154 million
as of
December 31, 2018
and
2017
, respectively.
Capitalized software costs are for internal use. The net book value of capitalized software costs was
$136 million
and
$86 million
as of
December 31, 2018
and
2017
, respectively. The related accumulated amortization was
$304 million
and
$293 million
as of
December 31, 2018
and
2017
, respectively.
Depreciation expense for property and equipment, including amortization of capitalized software costs and capital lease assets, totaled
$229 million
,
$150 million
and
$139 million
for
2018
,
2017
and
2016
, respectively.
In addition to the capitalized property and equipment included in the above table, the Company rents certain facilities and equipment under operating lease arrangements. Rental expense for operating leases totaled
$205 million
,
$127 million
and
$122 million
for
2018
,
2017
and
2016
, respectively.
108
DISCOVERY, INC.
NOTES TO CONSOLIDATED FINANCIAL STATEMENTS
NOTE 8. GOODWILL AND INTANGIBLE ASSETS
Goodwill
The carrying value and changes in the carrying value of goodwill attributable to each business unit were as follows (in millions).
|
U.S.
Networks
|
International
Networks
|
Education and Other
|
Total
|
|||||||||||||
|
December 31, 2016
|
$
|
5,265
|
|
$
|
2,708
|
|
$
|
67
|
|
$
|
8,040
|
|
||||
|
Acquisitions (Note 3)
|
211
|
|
7
|
|
—
|
|
218
|
|
||||||||
|
Dispositions (Note 3)
|
—
|
|
—
|
|
(30
|
)
|
(30
|
)
|
||||||||
|
Impairment of goodwill
|
—
|
|
(1,327
|
)
|
—
|
|
(1,327
|
)
|
||||||||
|
Foreign currency translation
|
2
|
|
167
|
|
3
|
|
172
|
|
||||||||
|
December 31, 2017
|
5,478
|
|
1,555
|
|
40
|
|
7,073
|
|
||||||||
|
Acquisitions (Note 3)
|
5,319
|
|
802
|
|
—
|
|
6,121
|
|
||||||||
|
Dispositions (Note 3)
|
—
|
|
—
|
|
(40
|
)
|
(40
|
)
|
||||||||
|
Foreign currency translation and other adjustments
|
$
|
(12
|
)
|
$
|
(136
|
)
|
$
|
—
|
|
(148
|
)
|
|||||
|
December 31, 2018
|
$
|
10,785
|
|
$
|
2,221
|
|
$
|
—
|
|
$
|
13,006
|
|
||||
The carrying amount of goodwill at the International Networks segment included accumulated impairments of
$1.3 billion
as of each of
December 31, 2018
and
December 31, 2017
. The carrying amount of goodwill at the U.S. Networks segment included accumulated impairments of
$20 million
as of
December 31, 2018
and
2017
.
Intangible Assets
Finite-lived intangible assets consisted of the following (in millions, except years).
|
|
Weighted
Average
Amortization
Period (Years)
|
December 31, 2018
|
December 31, 2017
|
||||||||||||||||||||||
|
Gross
|
Accumulated
Amortization
|
Net
|
Gross
|
Accumulated
Amortization
|
Net
|
||||||||||||||||||||
|
Intangible assets subject to amortization:
|
|||||||||||||||||||||||||
|
Trademarks
|
10
|
$
|
1,669
|
|
$
|
(342
|
)
|
$
|
1,327
|
|
$
|
494
|
|
$
|
(224
|
)
|
$
|
270
|
|
||||||
|
Customer relationships
|
10
|
9,455
|
|
(1,501
|
)
|
7,954
|
|
2,026
|
|
(758
|
)
|
1,268
|
|
||||||||||||
|
Other
|
9
|
314
|
|
(85
|
)
|
229
|
|
118
|
|
(50
|
)
|
68
|
|
||||||||||||
|
Total
|
$
|
11,438
|
|
$
|
(1,928
|
)
|
$
|
9,510
|
|
$
|
2,638
|
|
$
|
(1,032
|
)
|
$
|
1,606
|
|
|||||||
Indefinite-lived intangible assets not subject to amortization (in millions):
|
|
December 31,
|
|||||||
|
|
2018
|
2017
|
||||||
|
Trademarks
|
$
|
164
|
|
$
|
164
|
|
||
Straight-line amortization expense for finite-lived intangible assets reflects the pattern in which the assets' economic benefits are consumed over their estimated useful lives. Amortization expense related to finite-lived intangible assets was
$1.2 billion
,
$180 million
and
$183 million
for
2018
,
2017
and
2016
, respectively.
109
DISCOVERY, INC.
NOTES TO CONSOLIDATED FINANCIAL STATEMENTS
Amortization expense relating to intangible assets subject to amortization for each of the next five years and thereafter is estimated to be as follows (in millions).
|
2019
|
2020
|
2021
|
2022
|
2023
|
Thereafter
|
|||||||||||||||||||
|
Amortization expense
|
$
|
1,120
|
|
$
|
1,065
|
|
$
|
1,042
|
|
$
|
1,015
|
|
$
|
986
|
|
$
|
4,282
|
|
||||||
The amount and timing of the estimated expenses in the above table may vary due to future acquisitions, dispositions, impairments, changes in estimated useful lives or changes in foreign currency exchange rates.
Impairment Analysis
As of November 30, 2018, the Company performed a qualitative goodwill impairment assessment for all reporting units and determined that it was more likely than not that the fair value of those reporting units exceeded their carrying values, except for its Asia-Pacific reporting unit. Based on the results of the qualitative assessment, the Company performed a quantitative step 1 impairment test (comparison of fair value to carrying value) for its Asia-Pacific reporting unit, which indicated that the estimated fair value exceeded its carrying value by approximately 10% and, therefore, no impairment was recorded. The fair value of the Asia-Pacific reporting unit was determined using DCF and market-based valuation models. Cash flows were determined based on Company estimates of future operating results and were discounted using an internal rate of return based on an assessment of the risk inherent in future cash flows of the respective reporting unit. The market-based valuation models utilized multiples of revenue and earnings before interest, taxes, depreciation and amortization. Both the DCF and market-based models resulted in substantially similar fair values. As of December 31, 2018, the carrying value of goodwill assigned to the Asia-Pacific reporting unit was
$188 million
. Management will continue to monitor this reporting unit for changes in the business environment that could impact recoverability.
As of November 30, 2017, the Company performed a qualitative goodwill impairment assessment for all reporting units and determined that it was more likely than not that the fair value of those reporting units exceeded their carrying values, except for its DNI-Europe reporting unit. Based on the results of the qualitative assessment, the Company performed a quantitative step 1 impairment test for its European reporting unit as of November 30, 2017, using the same methodology as in 2016, noting potential impairment (approximately
$100 million
or
3%
deficit). Given these results, the Company then applied the hypothetical purchase price analysis required by the step 2 test and recognized a pre-tax goodwill impairment charge of
$1.3 billion
as of November 30, 2017, for the European reporting unit. The impairment charge of
$1.3 billion
significantly exceeded the deficit of fair value to carrying value of approximately
$100 million
because of significant intangible assets that were not recognized on the Company's consolidated balance sheet (i.e., excluded from book carrying value) but were considered in the step 2 calculation on a fair value basis.
After the impairment charge was recorded, the carrying value of remaining goodwill assigned to the European reporting unit was
$1.1 billion
and the net assets of the reporting unit were approximately
$2.7 billion
, which resulted in
$1.2 billion
headroom based on the estimated fair value of
$3.9 billion
. The determination of fair value of the Company's DNI-Europe reporting unit represented a Level 3 fair value measurement in the fair value hierarchy due to its use of internal projections and unobservable measurement inputs. Changes in significant judgments and estimates could significantly impact the concluded fair value of the reporting unit or the valuation of intangible assets. The goodwill impairment charge did not have an impact on the calculation of the Company's financial covenants under the Company's debt arrangements.
As of
November 30, 2016
, the Company performed a quantitative goodwill impairment assessment for all reporting units consistent with the Company's accounting policy. The estimated fair value of each reporting unit exceeded its carrying value and, therefore, no impairment was recorded. The fair values of the reporting units were determined using DCF and market-based valuation models. Cash flows were determined based on Company estimates of future operating results and discounted using an internal rate of return based on an assessment of the risk inherent in future cash flows of the respective reporting unit. The market-based valuation models utilized multiples of earnings before interest, taxes, depreciation and amortization. Both the DCF and market-based models resulted in substantially similar fair values.
110
DISCOVERY, INC.
NOTES TO CONSOLIDATED FINANCIAL STATEMENTS
NOTE 9. DEBT
The table below presents the components of outstanding debt (in millions).
|
December 31,
|
||||||||
|
2018
|
2017
|
|||||||
|
5.625% Senior notes, semi-annual interest, due August 2019
|
$
|
411
|
|
$
|
411
|
|
||
|
2.200% Senior notes, semi-annual interest, due September 2019
|
500
|
|
500
|
|
||||
|
Floating rate notes, quarterly interest, due September 2019
|
400
|
|
400
|
|
||||
|
2.750% Senior notes, semi-annual interest, due November 2019
|
500
|
|
—
|
|
||||
|
2.800% Senior notes, semi-annual interest, due June 2020
|
600
|
|
—
|
|
||||
|
5.050% Senior notes, semi-annual interest, due June 2020
|
789
|
|
789
|
|
||||
|
4.375% Senior notes, semi-annual interest, due June 2021
|
650
|
|
650
|
|
||||
|
2.375% Senior notes, euro denominated, annual interest, due March 2022
|
344
|
|
358
|
|
||||
|
3.300% Senior notes, semi-annual interest, due May 2022
|
500
|
|
500
|
|
||||
|
3.500% Senior notes, semi-annual interest, due June 2022
|
400
|
|
—
|
|
||||
|
2.950% Senior notes, semi-annual interest, due March 2023
|
1,185
|
|
1,200
|
|
||||
|
3.250% Senior notes, semi-annual interest, due April 2023
|
350
|
|
350
|
|
||||
|
3.800% Senior notes, semi-annual interest, due March 2024
|
450
|
|
450
|
|
||||
|
2.500% Senior notes, sterling denominated, annual interest, due September 2024
|
507
|
|
538
|
|
||||
|
3.900% Senior notes, semi-annual interest, due November 2024
|
497
|
|
—
|
|
||||
|
3.450% Senior notes, semi-annual interest, due March 2025
|
300
|
|
300
|
|
||||
|
3.950% Senior notes, semi-annual interest, due June 2025
|
500
|
|
—
|
|
||||
|
4.900% Senior notes, semi-annual interest, due March 2026
|
700
|
|
700
|
|
||||
|
1.900% Senior notes, euro denominated, annual interest, due March 2027
|
688
|
|
717
|
|
||||
|
3.950% Senior notes, semi-annual interest, due March 2028
|
1,700
|
|
1,700
|
|
||||
|
5.000% Senior notes, semi-annual interest, due September 2037
|
1,250
|
|
1,250
|
|
||||
|
6.350% Senior notes, semi-annual interest, due June 2040
|
850
|
|
850
|
|
||||
|
4.950% Senior notes, semi-annual interest, due May 2042
|
500
|
|
500
|
|
||||
|
4.875% Senior notes, semi-annual interest, due April 2043
|
850
|
|
850
|
|
||||
|
5.200% Senior notes, semi-annual interest, due September 2047
|
1,250
|
|
1,250
|
|
||||
|
Revolving credit facility
|
225
|
|
425
|
|
||||
|
Program financing line of credit
|
22
|
|
—
|
|
||||
|
Capital lease obligations
|
252
|
|
225
|
|
||||
|
Total debt
|
17,170
|
|
14,913
|
|
||||
|
Unamortized discount, premium and debt issuance costs, net
|
(125
|
)
|
(128
|
)
|
||||
|
Debt, net of unamortized discount, premium and debt issuance costs
|
17,045
|
|
14,785
|
|
||||
|
Current portion of debt
|
(1,860
|
)
|
(30
|
)
|
||||
|
Noncurrent portion of debt
|
$
|
15,185
|
|
$
|
14,755
|
|
||
Senior Notes
On February 19, 2019, Discovery Communications, LLC (“DCL”), a wholly owned subsidiary of Discovery, Inc., issued a notice for the redemption in full of all
$411 million
aggregate principal amount outstanding of its
5.625%
senior notes due August 2019 in accordance with the terms of the indenture governing the notes. The notes will be redeemed on March 21, 2019 (the “Redemption Date”), at a redemption price with respect to each note equal to the greater of (i)
100%
of the principal amount of the notes being redeemed and (ii) the sum of the present values of the remaining scheduled payments of principal and interest thereon (exclusive of interest accrued to the Redemption Date) discounted to the Redemption Date on a semi-annual basis at a comparable treasury rate plus 30 basis points, plus accrued interest thereon to the Redemption Date.
111
DISCOVERY, INC.
NOTES TO CONSOLIDATED FINANCIAL STATEMENTS
In connection with the acquisition of Scripps Networks on
March 6, 2018
, the Company assumed
$2.5 billion
aggregate principal amount of Scripps Networks
2.750%
senior notes due 2019,
2.800%
senior notes due 2020,
3.500%
senior notes due 2022,
3.900%
senior notes due 2024 and
3.950%
senior notes due 2025 (the "Scripps Networks Senior Notes"). As part of accounting for the acquisition of Scripps Networks, the Scripps Networks Senior Notes were adjusted to fair value using observable trades as of the acquisition date. (See Note 3.) The fair value adjustment resulted in an opening balance sheet carrying value that was
$19 million
less than the face amount of the senior notes. As of December 31, 2018, fair value adjustments of
$4 million
were amortized to interest expense.
On
April 3, 2018
, pursuant to an Offering Memorandum and Consent Solicitation Statement to Exchange dated
March 5, 2018
, Discovery Communications, LLC ("DCL"), a wholly-owned subsidiary of the Company, completed the exchange of
$2.3 billion
aggregate principal amount of Scripps Networks Senior Notes, for
$2.3 billion
aggregate principal amount of DCL's
2.750%
senior notes due 2019 (the "2019 Notes"),
2.800%
senior notes due 2020 (the "2020 Notes"),
3.500%
senior notes due 2022 (the "2022 Notes"),
3.900%
senior notes due 2024 (the "2024 Notes") and
3.950%
senior notes due 2025 (the "2025 Notes"). Interest on the 2019 Notes and the 2024 Notes is payable semi-annually in arrears on
May 15
and
November 15
of each year. Interest on the 2020 Notes, the 2022 Notes and the 2025 Notes is payable semi-annually in arrears on
June 15
and
December 15
of each year. The exchange was accounted for as a debt modification and, as a result, third-party issuance costs were expensed as incurred.
On
September 21, 2017
, DCL issued
$500 million
principal amount of
2.200%
senior notes due 2019,
$1.20 billion
principal amount of
2.950%
senior notes due 2023,
$1.70 billion
principal amount of
3.950%
senior notes due 2028,
$1.25 billion
principal amount of
5.000%
senior notes due 2037,
$1.25 billion
principal amount of
5.200%
senior notes due 2047 (collectively, the “Senior Fixed Rate Notes”) and
$400 million
principal amount of floating rate senior notes due 2019 (the “Senior Floating Rate Notes” and, together with the Senior Fixed Rate Notes, the “USD Notes”). Interest on the Senior Fixed Rate Notes is payable on
March 20
and
September 20
of each year. Interest on the Senior Floating Rate Notes is payable on
March 20
,
June 20
,
September 20
and
December 20
of each year. The USD Notes are fully and unconditionally guaranteed by the Company. On
September 21, 2017
, DCL also issued
£400 million
principal amount (
$540 million
at issuance based on the exchange rate of
$1.35
per pound at
September 21, 2017
) of
2.500%
senior notes due 2024 (the “Sterling Notes”). Interest on the Sterling Notes is payable on
September 20
of each year. The proceeds received by DCL from the USD Notes and the Sterling Notes were net of an
$11 million
issuance discount and
$57 million
of debt issuance costs. The net proceeds from the issuance of these senior notes were used to finance a portion of the Scripps Networks acquisition. (See Note 3.)
On
March 13, 2017
, DCL issued
$450 million
principal amount of
3.800%
senior notes due
March 13, 2024
(the "2017 USD Notes") and an additional
$200 million
principal amount of its existing
4.900%
senior notes due
March 11, 2026
(the "2016 USD Notes"). Interest on the 2017 USD Notes is payable semi-annually on
March 13
and
September 13
of each year. Interest on the 2016 USD Notes is payable semi-annually on
March 11
and
September 11
of each year. The proceeds received by DCL from the 2017 USD Notes were net of a
$1 million
issuance discount and
$4 million
of debt issuance costs. The proceeds received by DCL from the 2016 USD Notes included a
$10 million
issuance premium and were net of
$2 million
of debt issuance costs.
DCL used the proceeds from the offerings of the 2017 USD Notes and the 2016 USD Notes to repurchase
$600 million
aggregate principal amount of DCL's
5.050%
senior notes due 2020 and
5.625%
senior notes due 2019 in a cash tender offer. The repurchase resulted in a pretax loss on extinguishment of debt of
$54 million
for the three months ended
March 31, 2017
, which is presented as a separate line item on the Company's consolidated statements of operations and recognized as a component of financing cash outflows on the consolidated statements of cash flows. The loss included
$50 million
for premiums to par value,
$2 million
of non-cash write-offs of unamortized deferred financing costs,
$1 million
for the write-off of the original issue discount of these senior notes and
$1 million
accrued for other third-party fees.
As of
December 31, 2018
, all senior notes are fully and unconditionally guaranteed by the Company and Scripps Networks, except for
$243 million
of un-exchanged Scripps Networks Senior Notes acquired in conjunction with the acquisition of Scripps Networks. (See Note 25.)
Term Loans
On
August 11, 2017
, DCL entered into a delayed draw and unsecured term loan credit facility (the "Term Loans"), with a
three
-year tranche and a
five
-year tranche, each with a principal amount of up to
$1 billion
. The term of each delayed draw loan commenced on
March 6, 2018
when Discovery used these funds to finance a portion of the Scripps Networks acquisition. The Term Loans' interest rates were based, at the Company's option, on either adjusted LIBOR plus a margin, or an alternate base rate plus a margin. The Company paid a commitment fee of
20
basis points per annum for each loan, based on its then-current credit rating, beginning
September 28, 2017
through
March 6, 2018
. As of
December 31, 2018
, the Company had used cash from operations and borrowings under the commercial paper program to fully repay the Term Loans.
112
DISCOVERY, INC.
NOTES TO CONSOLIDATED FINANCIAL STATEMENTS
Unsecured Bridge Loan Commitment
On
July 30, 2017
, the Company obtained a commitment letter from a financial institution for a
$9.6 billion
unsecured bridge term loan facility that could have been used to complete the Scripps Networks acquisition. No amounts were drawn under the bridge loan commitment and, following the execution of the Term Loans and the issuance of the USD Notes and the Sterling Notes on
September 21, 2017
, the commitment was terminated. The Company incurred
$40 million
of debt issuance costs, which were fully amortized as a component of interest expense following the issuance of the USD Notes and Sterling Notes on
September 21, 2017
. The associated cash payment was classified as a component of financing activity in the consolidated statements of cash flows.
Revolving Credit Facility
On
August 11, 2017
, DCL amended its
$2.0 billion
revolving credit facility to allow DCL and certain designated foreign subsidiaries of DCL to borrow up to
$2.5 billion
, including a
$100 million
sublimit for the issuance of standby letters of credit and a
$50 million
sublimit for Euro-denominated swing line loans. Borrowing capacity under this credit facility is reduced by any outstanding borrowings under the commercial paper program. The revolving credit facility agreement amendment extended the maturity date from
February 4, 2021
to
August 11, 2022
. The original agreement included the option for up to
two
additional
364
-day renewal periods.
The credit agreement governing the revolving credit facility contains customary representations, warranties and events of default, as well as affirmative and negative covenants. In addition to the change in the revolver's capacity on
August 11, 2017
, the financial covenants were modified to increase the maximum consolidated leverage ratio financial covenant to
5.50
to
1.00
, with step-downs to
5.00
to
1.00
and to
4.50
to
1.00
, one year and two years after the closing of the Scripps Networks acquisition, respectively. As of
December 31, 2018
, the Company's subsidiary, DCL, was in compliance with all covenants and there were no events of default under the revolving credit facility.
As of
December 31, 2018
, the Company had outstanding U.S. dollar-denominated borrowings under the revolving credit facility of
$225 million
at a weighted average interest rate of
3.820%
. As of
December 31, 2017
, the Company had outstanding U.S. dollar-denominated borrowings under the revolving credit facility of
$425 million
at a weighted average interest rate of
2.690%
. The interest rate on borrowings under the revolving credit facility is variable based on DCL's then-current credit ratings for its publicly traded debt and changes in financial index rates. For U.S. dollar-denominated borrowings, the interest rate is based, at the Company's option, on either adjusted LIBOR plus a margin, or an alternate base rate plus a margin. The Company may also borrow foreign currencies under the credit facility, at an interest rate based on adjusted LIBOR, plus a margin. The current margins are
1.300%
and
0.300%
, respectively, per annum for adjusted LIBOR and alternate base rate borrowings. The Company had
no
borrowings under the credit facility in foreign currencies as of
December 31, 2018 and 2017
. A monthly facility fee is charged based on the total capacity of the facility, and interest is charged based on the amount borrowed on the facility. The current facility fee rate is
0.200%
per annum and subject to change based on DCL's then-current credit ratings. All obligations of DCL and the other borrowers under the revolving credit facility are unsecured and are fully and unconditionally guaranteed by Discovery.
Commercial Paper
The Company's commercial paper program is supported by the revolving credit facility described above. The Company had
no
outstanding borrowings as of
December 31, 2018 and 2017
.
Program Financing Line of Credit
On
January 12, 2018
, the Company entered into a secured line of credit for an aggregate principal amount of
$26 million
to finance content production costs. Interest rates on this line of credit are based on the Company’s option to elect either an adjusted LIBOR or a variable prime rate. Interest on the outstanding balance is due quarterly commencing on
October 15, 2018
with a final payment due on
October 15, 2020
. As of
December 31, 2018
, the Company has an outstanding balance of
$22 million
.
113
DISCOVERY, INC.
NOTES TO CONSOLIDATED FINANCIAL STATEMENTS
Long-term Debt Repayment Schedule
The following table presents a summary of scheduled and estimated debt payments, excluding the revolving credit facility, commercial paper borrowings and capital lease obligations, for the next five years based on the amount of the Company's debt outstanding as of
December 31, 2018
(in millions).
|
2019
|
2020
|
2021
|
2022
|
2023
|
Thereafter
|
|||||||||||||||||||
|
Long-term debt repayments
|
$
|
1,811
|
|
$
|
1,388
|
|
$
|
650
|
|
$
|
1,244
|
|
$
|
1,535
|
|
$
|
10,043
|
|
||||||
Scheduled payments for capital lease obligations outstanding as of
December 31, 2018
are disclosed in Note 22.
NOTE 10. DERIVATIVE FINANCIAL INSTRUMENTS
The Company uses derivative financial instruments to modify its exposure to exogenous events and market risks from changes in foreign currency exchange rates and interest rates. At the inception of a derivative contract, the Company designates the derivative as one of four types based on the Company's intentions and belief as to its likely effectiveness as a hedge. These four types are: (i) a cash flow hedge, (ii) a net investment hedge, (iii) a fair value hedge, or (iv) an instrument with no hedging designation. The Company does not enter into or hold derivative financial instruments for speculative trading purposes.
Effective July 1, 2018, the Company early adopted ASU 2017-12. As a result, the Company changed the method by which it assesses effectiveness for net investment hedges from the forward-method to the spot-method. Management believes the spot method better matches the spot rate changes of the net investment. The entire change in the fair value of derivatives that qualify as net investment hedges is initially recorded in the currency translation adjustment component of other comprehensive income. While the change in fair value attributable to hedge effectiveness remains in accumulated other comprehensive income (loss) until the net investment is sold or liquidated, the change in fair value attributable to components excluded from the assessment of hedge effectiveness (e.g., forward points, cross currency basis, etc.) is reflected as a component of interest expense, net in the current period. Previous net losses of
$87 million
incurred under the forward method related to net investment hedges will remain in other comprehensive loss under the currency translation adjustments component and will be reclassified to earnings when the net investment is sold or liquidated. Additionally, as a result of ASU 2017-12, for foreign exchange forward contracts accounted for as cash flow hedges, the ineffective portion (if any) will not be separately recorded, as the entire change in the fair value of the forward contract will be recorded in other comprehensive income (loss) and reclassified into the statement of operations in the same line item in which the hedged item is recorded and in the same period as the hedged item affects earnings.
Cash Flow Hedges
The Company designates foreign currency forward and option contracts as cash flow hedges to mitigate foreign currency risk arising from third-party revenue and inter-company licensing agreements. The Company also designates interest rate contracts used to hedge the pricing for certain senior notes as cash flow hedges. As of December 31, 2018 there were no interest rate contracts outstanding.
During the year ended
December 31, 2016
, the Company terminated and settled its outstanding interest rate cash flow hedges which resulted in a
$40 million
pretax gain. As the hedges were considered to be effective and the forecasted transactions were considered probable of occurring, the gain remained in
accumulated other comprehensive loss
and will be amortized as a reduction to interest expense over the term of the forecasted senior notes. The Company reclassified
$17 million
of the gains from accumulated other comprehensive loss to other (expense) income, net, in the Company's consolidated statements of operations, as the forecasted transaction was considered remote following the issuance of the USD Notes on September 21, 2017.
Net Investment Hedges
The Company designates cross-currency swaps and foreign currency forward contracts as hedges of net investments in foreign operations. Under ASU 2017-12, changes in the fair value of these instruments related to changes in spot rates are included in other comprehensive income (i.e., cumulative translation adjustment), while excluded components (i.e., anything other than the change in fair value due to changes in spot rates such as cross currency basis spread and forward points) are recorded as part of interest expense.
On December 6, 2018, Discovery Networks SL (Spain) entered into a foreign currency forward contract with a notional value of
35.6 billion
Chilean Pesos (equivalent to
$53 million
) at execution date and with a due date of December 15, 2021. This was designated a net investment hedge, hedging against changes in the foreign currency-equivalent of the net investment in the foreign operation due to movements in exchange rates. As of December 31, 2018 the Company recorded an unrealized gain of
$1 million
as a cumulative translation adjustment under other comprehensive income (loss).
114
DISCOVERY, INC.
NOTES TO CONSOLIDATED FINANCIAL STATEMENTS
On December 18, 2018, DNI Europe Holdings Limited entered into
three
fixed cross-currency swaps that were all designated as net investment hedges, which had a notional amount of
€750 million
(equivalent to
$853 million
), and due dates in 2022 and 2027. Also on December 18, 2018, Discovery Luxembourg Holdings 1 S.A.R.L. entered into
three
fixed cross-currency swaps that were all designated as net investment hedges, which had an aggregate notional amount of
£674 million
(equivalent to
$853 million
), and due dates in 2022 and 2027. The objective of these swaps is to protect the companies against the risk of changes in the foreign currency-equivalent of net investments in the foreign operations due to movements in foreign currency. As of December 31, 2018, the Company has recorded an unrealized loss of
$10 million
in connection with these contracts which has been recorded as a cumulative translation adjustment in other comprehensive income (loss).
On
September 21, 2017
, in conjunction with the Scripps Networks acquisition (see Note 3 and Note 9), DCL issued
£400 million
(equivalent to
$543 million
) principal amount of
2.500%
senior notes due 2024. The Sterling Notes were designated as net investment hedges, hedging against fluctuations in foreign currency exchange rates on a portion of the Company's investments in foreign subsidiaries. Prior to issuance of the Sterling Notes, the Company also entered into a series of foreign exchange contracts designated as net investment hedges on a portion of the Company's investments in foreign subsidiaries. These foreign exchange contracts were settled on the date of issuance of the Sterling Notes and resulted in a
$12 million
loss, which has been reflected as a component of currency translation adjustments on the Company's consolidated balance sheets as of
December 31, 2017
.
Fair Value Hedges
Prior to the adoption of ASU 2016-01, the Company designated derivative instruments used to mitigate the risk of changes in the fair value of its AFS securities as fair value hedges. On
November 12, 2015
, the Company entered into the Lionsgate Collar, designed to mitigate the risk of market fluctuations with respect to
50%
of the Lionsgate shares held by the Company. (See Note 4.) The collar settles in
three
tranches starting in 2019 and ending in 2022.
Effective January 1, 2018, upon adoption of ASU 2016-01, the Company no longer applies hedge accounting to the Lionsgate Collar. There is no change to the manner in which the Company accounts for the collar as movements in its fair value will continue to be recorded as a component of
other (expense) income, net
on the consolidated statements of operations. (See Note 2 and Note 5.)
No Hedging Designation
The Company may also enter into derivative financial instruments that do not qualify for hedge accounting and are not designated as hedges. These instruments are intended to mitigate economic exposures due to exogenous events and changes in foreign currency exchange rates and interest rates.
On December 18, 2018, Discovery, Inc. entered into
three
foreign exchange forwards contracts with a notional value of
$860 million
. The objective of these contracts is to protect the Company against adverse revaluation impact on its Euro denominated debt. As of December 31, 2018, the Company has recorded a gain of
$11 million
as part of
other (expense) income, net
on the consolidated statements of operations.
On October 17, 2018, DNI Global LLP and Discovery Communications Europe entered into
four
foreign exchange forwards contracts with a notional value of
$300 million
. The objective of these contracts was to protect the companies against volatility in the revaluation of foreign accounts receivable and accounts payable. These contracts were settled on November 30, 2018, and in connection with these transactions a total gain of
$7 million
was recorded as part of
other (expense) income, net
on the consolidated statements of operations.
During the year ended
December 31, 2017
, in conjunction with the Scripps Networks acquisition (see Note 3 and Note 9), the Company entered into
$4 billion
notional amount of interest rate contracts used to economically hedge a portion of the pricing of the
2017
USD Notes. These interest rate contracts were settled on
September 21, 2017
and did not receive hedging designation. The Company recognized a
$98 million
loss in connection with these interest rate contracts, which has been reflected as a component of other (expense) income, net on the Company's consolidated statements of operations.
Financial Statement Presentation
The Company records all unsettled derivative contracts at their gross fair values on the consolidated balance sheets. (See Note 5.) The portion of the fair value that represents cash flows occurring within one year are classified as current, and the portion related to cash flows occurring beyond one year are classified as noncurrent.
115
DISCOVERY, INC.
NOTES TO CONSOLIDATED FINANCIAL STATEMENTS
The following table summarizes the impact of derivative financial instruments on the Company's consolidated balance sheets (in millions). There were
no
amounts eligible to be offset under master netting agreements as of
December 31, 2018
and
December 31, 2017
.
|
December 31, 2018
|
December 31, 2017
|
||||||||||||||||||||||||||||||||||||||
|
Fair Value
|
Fair Value
|
||||||||||||||||||||||||||||||||||||||
|
Notional
|
Prepaid expenses and other current assets
|
Other non-
current assets
|
Accrued liabilities
|
Other non-
current liabilities
|
Notional
|
Prepaid expenses and other current assets
|
Other non-
current assets
|
Accrued liabilities
|
Other non-
current liabilities
|
||||||||||||||||||||||||||||||
|
Cash flow hedges:
|
|||||||||||||||||||||||||||||||||||||||
|
Foreign exchange
|
$
|
267
|
|
$
|
13
|
|
$
|
—
|
|
$
|
3
|
|
$
|
—
|
|
$
|
817
|
|
$
|
7
|
|
$
|
—
|
|
$
|
12
|
|
$
|
—
|
|
|||||||||
|
Net investment hedges:
(a)
|
|||||||||||||||||||||||||||||||||||||||
|
Cross-currency swaps
|
3,387
|
|
—
|
|
41
|
|
39
|
|
81
|
|
1,708
|
|
—
|
|
3
|
|
13
|
|
98
|
|
|||||||||||||||||||
|
Foreign exchange
|
52
|
|
—
|
|
1
|
|
—
|
|
—
|
|
303
|
|
2
|
|
—
|
|
8
|
|
—
|
|
|||||||||||||||||||
|
Fair value hedges:
|
|||||||||||||||||||||||||||||||||||||||
|
Equity (Lionsgate collar)
(b)
|
—
|
|
—
|
|
—
|
|
—
|
|
—
|
|
97
|
|
—
|
|
13
|
|
—
|
|
—
|
|
|||||||||||||||||||
|
No hedging designation:
|
|||||||||||||||||||||||||||||||||||||||
|
Foreign exchange
|
860
|
|
—
|
|
11
|
|
—
|
|
—
|
|
—
|
|
—
|
|
—
|
|
—
|
|
—
|
|
|||||||||||||||||||
|
Interest rate swaps
|
25
|
|
—
|
|
—
|
|
—
|
|
—
|
|
25
|
|
—
|
|
—
|
|
—
|
|
—
|
|
|||||||||||||||||||
|
Cross-currency swaps
|
64
|
|
—
|
|
—
|
|
1
|
|
—
|
|
64
|
|
—
|
|
—
|
|
—
|
|
6
|
|
|||||||||||||||||||
|
Equity (Lionsgate collar)
(b)
|
97
|
|
14
|
|
27
|
|
—
|
|
—
|
|
—
|
|
—
|
|
—
|
|
—
|
|
—
|
|
|||||||||||||||||||
|
Credit contracts
|
—
|
|
—
|
|
—
|
|
—
|
|
—
|
|
665
|
|
—
|
|
—
|
|
—
|
|
1
|
|
|||||||||||||||||||
|
Total
|
$
|
27
|
|
$
|
80
|
|
$
|
43
|
|
$
|
81
|
|
$
|
9
|
|
$
|
16
|
|
$
|
33
|
|
$
|
105
|
|
|||||||||||||||
(a)
Excludes
£400 million
of sterling notes (
$507 million
equivalent at
December 31, 2018
) designated as a net investment hedge. (See Note 9.)
(b)
Upon adoption of ASU 2016-01 on
January 1, 2018
, the Lionsgate Collar no longer receives hedge accounting designation. (See Note 2 and Note 5.)
116
DISCOVERY, INC.
NOTES TO CONSOLIDATED FINANCIAL STATEMENTS
The following table presents the pretax impact of derivatives designated as cash flow hedges on income and
other comprehensive income (loss)
(in millions).
|
|
Year Ended December 31,
|
|||||||||||
|
2018
|
2017
|
2016
|
||||||||||
|
Gains (losses) recognized in accumulated other comprehensive loss
(a)
:
|
||||||||||||
|
Foreign exchange - derivative adjustments
|
$
|
34
|
|
$
|
(41
|
)
|
$
|
(1
|
)
|
|||
|
Interest rate - derivative adjustments
|
—
|
|
—
|
|
40
|
|
||||||
|
Gains (losses) reclassified into income from accumulated other comprehensive loss:
|
||||||||||||
|
Foreign exchange - distribution revenue
|
9
|
|
(22
|
)
|
(25
|
)
|
||||||
|
Foreign exchange - advertising revenue
|
(1
|
)
|
(3
|
)
|
(2
|
)
|
||||||
|
Foreign exchange - costs of revenues
|
11
|
|
—
|
|
27
|
|
||||||
|
Foreign exchange - other income, net
|
—
|
|
—
|
|
3
|
|
||||||
|
Interest rate - interest expense
|
—
|
|
(1
|
)
|
(3
|
)
|
||||||
|
Amount of gain recognized in income on derivative (amount excluded from effectiveness testing)
(b)
:
|
||||||||||||
|
Foreign exchange - other income, net
|
—
|
|
—
|
|
1
|
|
||||||
|
Interest rate - other income, net
|
—
|
|
17
|
|
—
|
|
||||||
|
Fair value excluded from effectiveness assessment:
|
||||||||||||
|
Foreign exchange - other income, net
|
—
|
|
—
|
|
(5
|
)
|
||||||
(a)
For periods prior to the Company's adoption of ASU 2017-12 on July 1, 2018, the amount of gain or (loss) represents only the effective portion of the hedging relationship. Effective with the adoption of ASU 2017-12, gains and losses resulting from the change in the fair value of the hedging relationship are recognized as components of accumulated other comprehensive loss.
(b)
For periods prior to the Company's adoption of ASU 2017-12 on July 1, 2018, amounts reflect the change in the fair value of the ineffective portion of the hedging relationship. No hedging instruments for which ineffectiveness was recognized directly into income in 2017 or in years prior were outstanding at the date of adoption of ASU 2017-12.
If current fair values of designated cash flow hedges as of
December 31, 2018
remained static over the next twelve months, the Company would reclassify
$10 million
of net deferred gains from
accumulated other comprehensive loss
into income in the next twelve months.
117
DISCOVERY, INC.
NOTES TO CONSOLIDATED FINANCIAL STATEMENTS
Effective with the Company’s initial application of ASU 2017-12, net periodic interest settlements and accruals on the cross-currency swaps (which would include any cross-currency basis spread adjustment) are reported directly in interest expense, net. Changes in the fair value of the cross-currency swaps resulting from changes in the foreign exchange spot rate will continue to be recorded within the cumulative translation component of AOCI. The following table presents the pretax impact of derivatives designated as net investment hedges on
other comprehensive income (loss)
(in millions). Other than amounts excluded from effectiveness testing, there were no other gains (losses) reclassified from
accumulated other comprehensive loss
to income during the years ended
December 31, 2018, 2017 and 2016
.
|
Year Ended December 31,
|
||||||||||||||||||||||||||
|
Amount of gain (loss) recognized in AOCI
|
Location of gain (loss) recognized in income on derivative (amount excluded from effectiveness testing)
|
Amount of gain (loss) recognized in income on derivative (amount excluded from effectiveness testing)
|
||||||||||||||||||||||||
|
2018
|
2017
|
2016
|
2018
|
2017
|
2016
|
|||||||||||||||||||||
|
Gains (losses) recognized in AOCI:
|
||||||||||||||||||||||||||
|
Cross currency swaps
|
$
|
43
|
|
$
|
(96
|
)
|
$
|
3
|
|
Interest expense, net
|
$
|
14
|
|
$
|
—
|
|
$
|
—
|
|
|||||||
|
Foreign exchange contracts
(a)
|
—
|
|
(18
|
)
|
—
|
|
N/A
|
—
|
|
—
|
|
—
|
|
|||||||||||||
|
Sterling notes (foreign denominated debt)
(a)
|
30
|
|
2
|
|
—
|
|
N/A
|
—
|
|
—
|
|
—
|
|
|||||||||||||
|
Total
|
$
|
73
|
|
$
|
(112
|
)
|
$
|
3
|
|
$
|
14
|
|
$
|
—
|
|
$
|
—
|
|
||||||||
(a)
There are no existing components that are eligible for exclusion from effectiveness testing under ASU 2017-12. There were no forward exchange contracts outstanding at the date of adoption of ASU 2017-12.
The following table presents the pretax impact of derivatives designated as fair value hedges on income, including offsetting changes in fair value of the hedged items and amounts excluded from the assessment of effectiveness (in millions). Upon adoption of ASU 2016-01 on
January 1, 2018
, the Company no longer designates any of its derivatives as fair value hedges. As a result, there was no activity related to derivatives designated as fair value hedges for the
year ended December 31, 2018
. There were no amounts of ineffectiveness recognized on fair value hedges for the
year ended December 31, 2018
. As this hedge relationship was not active as of the date of adoption of ASU 2017-12, no transition adjustment was required.
|
|
Year Ended December 31,
|
|||||||
|
2017
|
2016
|
|||||||
|
Gains (losses) on changes in fair value of hedged AFS
|
$
|
18
|
|
$
|
(17
|
)
|
||
|
(Losses) gains on changes in the intrinsic value of equity contracts
|
(17
|
)
|
16
|
|
||||
|
Fair value of equity contracts excluded from effectiveness assessment
|
5
|
|
(6
|
)
|
||||
|
Total in other income (expense), net
|
$
|
6
|
|
$
|
(7
|
)
|
||
118
DISCOVERY, INC.
NOTES TO CONSOLIDATED FINANCIAL STATEMENTS
The following table presents the pretax gains (losses) on derivatives not designated as hedges and recognized in other expense, net in the consolidated statements of operations (in millions).
|
Year Ended December 31,
|
||||||||||||
|
|
2018
|
2017
|
2016
|
|||||||||
|
Interest rate swaps
|
$
|
—
|
|
$
|
(98
|
)
|
$
|
—
|
|
|||
|
Cross-currency swaps
|
4
|
|
(6
|
)
|
—
|
|
||||||
|
Foreign exchange
|
18
|
|
—
|
|
(1
|
)
|
||||||
|
Credit contracts
|
(1
|
)
|
(1
|
)
|
—
|
|
||||||
|
Equity
|
29
|
|
—
|
|
—
|
|
||||||
|
Total in other income (expense), net
|
$
|
50
|
|
$
|
(105
|
)
|
$
|
(1
|
)
|
|||
NOTE 11. REDEEMABLE NONCONTROLLING INTERESTS
Redeemable noncontrolling interests reflected as of the balance sheet date are the greater of the noncontrolling interest balances adjusted for comprehensive income items and distributions or the redemption values remeasured at the period end foreign exchange rates (i.e., the "floor"). Adjustments to the carrying amount of redeemable noncontrolling interests to redemption value as a result of changes in exchange rates are reflected in currency translation adjustments, a component of
other comprehensive income (loss)
; however, such currency translation adjustments to redemption value are allocated to Discovery stockholders only. Redeemable noncontrolling interest adjustments of redemption value to the floor are reflected in retained earnings. The adjustment of redemption value to the floor that reflects a redemption in excess of fair value is included as an adjustment to income from continuing operations available to Discovery, Inc. stockholders in the calculation of earnings per share. (See Note 19.) The table below summarizes the Company's redeemable noncontrolling interests balances (in millions).
|
December 31,
|
||||||||
|
2018
|
2017
|
|||||||
|
OWN
|
$
|
58
|
|
$
|
56
|
|
||
|
MTG
|
121
|
|
120
|
|
||||
|
Discovery Family
|
206
|
|
210
|
|
||||
|
Discovery Japan
|
30
|
|
27
|
|
||||
|
Total
|
$
|
415
|
|
$
|
413
|
|
||
The table below presents the reconciliation of changes in redeemable noncontrolling interests (in millions).
|
December 31,
|
||||||||||||
|
2018
|
2017
|
2016
|
||||||||||
|
Beginning balance
|
$
|
413
|
|
$
|
243
|
|
$
|
241
|
|
|||
|
Initial fair value of redeemable noncontrolling interests of acquired businesses
|
—
|
|
137
|
|
—
|
|
||||||
|
Cash distributions to redeemable noncontrolling interests
|
(25
|
)
|
(30
|
)
|
(22
|
)
|
||||||
|
Comprehensive income (loss) adjustments:
|
||||||||||||
|
Net income attributable to redeemable noncontrolling interests
|
20
|
|
24
|
|
23
|
|
||||||
|
Other comprehensive earnings attributable to redeemable noncontrolling interests
|
—
|
|
1
|
|
—
|
|
||||||
|
Currency translation on redemption values
|
2
|
|
—
|
|
1
|
|
||||||
|
Retained earnings adjustments:
|
||||||||||||
|
Adjustments to redemption value
|
3
|
|
38
|
|
—
|
|
||||||
|
Interest adjustment
|
2
|
|
—
|
|
—
|
|
||||||
|
Ending balance
|
$
|
415
|
|
$
|
413
|
|
$
|
243
|
|
|||
119
DISCOVERY, INC.
NOTES TO CONSOLIDATED FINANCIAL STATEMENTS
Redeemable noncontrolling interests consist of the arrangements described below:
In connection with its noncontrolling interest in OWN, Harpo has the right to require the Company to purchase Harpo's remaining noncontrolling interest at fair value during
four
90-day
windows beginning on
July 1, 2018
and every
two and a half
years thereafter through
January 1, 2026
. Harpo exercised the first of such remaining put rights on
August 20, 2018
. On
November 6, 2018
, the Company and Harpo entered into an amendment to the limited liability company agreement whereby Harpo agreed to withdraw its
August 20, 2018
put notice and upon any succeeding redemption the put payment value will equal the fair value of Harpo's equity interest in OWN plus an incremental
9.337%
per annum for the
2.5
year period between the
July 1, 2018
put right date and the
January 1, 2021
put right date. As Harpo’s put right is outside the control of the Company, Harpo’s noncontrolling interest is presented as redeemable noncontrolling interest outside of permanent equity on the Company's consolidated balance sheet.
In connection with the MTG joint venture between Discovery and GoldenTree created on
September 25, 2017
, GoldenTree acquired a put right exercisable during
30-day
windows beginning on each of
March 25, 2021
,
September 25, 2022
and
March 25, 2024
, that requires Discovery to either purchase all of GoldenTree's noncontrolling
32.5%
interest in the joint venture at fair value or participate in an initial public offering for the joint venture. As the put right is outside of the Company's control, GoldenTree's
32.5%
noncontrolling interest is presented as redeemable noncontrolling interest outside of permanent equity on the Company's consolidated balance sheet.
In connection with its non-controlling interest in Discovery Family, Hasbro Inc ("Hasbro") has the right to put the entirety of its remaining
40%
interest in the company to Discovery at any time during the
one
-year period beginning
December 31, 2021
, or in the event a Discovery performance obligation related to Discovery Family is not met. Embedded in the redeemable noncontrolling interest is also a Discovery call right that is exercisable for
one
year after
December 31, 2021
. Upon the exercise of the put or call options, the price to be paid for the redeemable noncontrolling interest is a function of the then-current fair market value of the redeemable noncontrolling interest, to which certain discounts and floor values may apply in specified situations depending upon the party exercising the put or call and the basis for the exercise of the put or call and the basis for the exercise of the put or call. As Hasbro's put right is outside the control of the Company, Hasbro's
40%
noncontrolling interest is presented as redeemable noncontrolling interest outside of permanent equity on the Company's consolidated balance sheet.
In connection with its non-controlling interest in Discovery Japan, Jupiter Telecommunications Co., Ltd. ("J:COM") has the right to put all, but not less than all, of its
20%
noncontrolling interest to Discovery at any time for cash. As amended, through
January 10, 2019
, the redemption value is the
January 10, 2013
fair value denominated in Japanese yen; thereafter, as chosen by J:COM, the redemption value is the then-current fair value or the
January 10, 2013
, fair value denominated in Japanese yen.
NOTE 12. EQUITY
Common Stock
Common Stock Issued in Connection with Scripps Networks Acquisition
On March 6, 2018, the Company issued
139 million
shares of Series C common stock as part of the consideration paid for the acquisition of Scripps Networks, inclusive of the conversion of
1 million
Scripps Networks share-based compensation awards. (See Note 3.)
Common Stock
The Company has
three
series of common stock authorized, issued and outstanding as of
December 31, 2018
: Series A common stock, Series B common stock and Series C common stock. Holders of these
three
series of common stock have equal rights, powers and privileges, except as otherwise noted. Holders of Series A common stock are entitled to
one
vote per share and holders of Series B common stock are entitled to
ten
votes per share on all matters voted on by stockholders, except for directors to be elected by holders of the Company’s Series A-1 convertible preferred stock. Holders of Series C common stock are not entitled to any voting rights, except as required by Delaware law. Generally, holders of Series A common stock and Series B common stock and Series A-1 convertible preferred stock vote as one class, except for certain preferential rights afforded to holders of Series A-1 convertible preferred stock.
Holders of Series A common stock, Series B common stock and Series C common stock will participate equally in cash dividends if declared by the Board of Directors, subject to preferential rights of outstanding preferred stock.
Each share of Series B common stock is convertible, at the option of the holder, into
one
share of Series A common stock. Series A and Series C common stock are not convertible.
120
DISCOVERY, INC.
NOTES TO CONSOLIDATED FINANCIAL STATEMENTS
Generally, distributions made in shares of Series A common stock, Series B common stock or Series C common stock will be made proportionally to all common stockholders. In the event of a reclassification, subdivision or combination of any series of common stock, the shares of the other series of common stock will be equally reclassified, subdivided or combined.
In the event of a liquidation, dissolution, or winding up of Discovery, after payment of Discovery’s debts and liabilities and subject to preferential rights of outstanding preferred stock, holders of Series A common stock, Series B common stock and Series C common stock and holders of Series A-1 and Series C-1 convertible preferred stock will share equally in any assets available for distribution to holders of common stock.
On
February 13, 2014
, John C. Malone, a member of Discovery’s Board of Directors, entered into an agreement granting David Zaslav, the Company’s President and CEO, certain voting and purchase rights with respect to the approximately
6 million
shares of the Company’s Series B common stock owned by Mr. Malone. The agreement gives Mr. Zaslav the right to vote the Series B shares if Mr. Malone is not otherwise voting or directing the vote of those shares. The agreement also provides that if Mr. Malone proposes to sell the Series B shares, Mr. Zaslav will have the first right to negotiate for the purchase of the shares. If that negotiation is not successful and Mr. Malone proposes to sell the Series B shares to a third party, Mr. Zaslav will have the exclusive right to match that offer. The rights granted under the agreement will remain in effect for as long as Mr. Zaslav is either employed as the principal executive officer of the Company or serving on its Board of Directors.
Repurchase Programs
Common Stock
On August 10, 2010, the Company implemented a stock repurchase program. Under the Company's stock repurchase program, management was authorized to purchase shares of the Company's common stock from time to time through open market purchases, privately negotiated transactions at prevailing prices, pursuant to one or more accelerated stock repurchase agreements, or other derivative arrangements as permitted by securities laws and other legal requirements, and subject to stock price, business and market conditions and other factors. The Company's authorization under the program expired on October 8, 2017.
All common stock repurchases, including prepaid common stock repurchase contracts, were made through open market transactions in
2017
and
2016
. There were
no
common stock repurchases during
2018
. As of
December 31, 2018
and over the life of the program, the Company had repurchased
3 million
and
164 million
shares of Series A and Series C common stock, respectively, for the aggregate purchase price of
$171 million
and
$6.6 billion
, respectively.
The table below presents a summary of common stock repurchases (in millions).
|
Year Ended December 31,
|
||||||||
|
2017
|
2016
|
|||||||
|
Series C Common Stock:
|
||||||||
|
Shares repurchased
|
14.3
|
34.8
|
||||||
|
Purchase price
(a)
|
$
|
381
|
|
$
|
895
|
|
||
(a)
The purchase price for Series C common stock in
2016
includes repurchases made pursuant to a common stock repurchase contract that was executed on
August 22, 2016
and settled on
December 2, 2016
at a cost of
$71 million
, resulting in the receipt of
2.8 million
shares of Series C common stock at the then current market price equal to
$75 million
. See below for additional details.
Convertible Preferred Stock and Preferred Stock Modification
The Company has
two
series of preferred stock authorized, issued and outstanding as of
December 31, 2018
: Series A-1 convertible preferred stock and Series C-1 convertible preferred stock. There are
8 million
shares authorized for Series A-1 convertible preferred stock and
6 million
shares authorized for Series C-1 convertible preferred stock.
121
DISCOVERY, INC.
NOTES TO CONSOLIDATED FINANCIAL STATEMENTS
On
August 7, 2017
, Discovery completed the transactions contemplated by the Exchange Agreement with Advance/Newhouse. Under the Exchange Agreement, Discovery issued a number of shares of newly designated Series A-1 and Series C-1 convertible preferred stock (collectively, the "New Preferred Stock") to Advance/Newhouse in exchange for all outstanding shares of Discovery Series A and Series C convertible participating preferred stock (the "Exchange"). The terms of the Exchange Agreement resulted in Advance/Newhouse's aggregate voting and economic rights before the exchange being equal to its aggregate voting and economic rights after the exchange. Immediately following the Exchange, Advance/Newhouse’s beneficial ownership of the aggregate number of shares of Discovery’s Series A common stock and Series C common stock into which the New Preferred Stock received by Advance/Newhouse in the Exchange are convertible, remained unchanged. The terms of the exchange agreement also provide that certain of the shares of Discovery Series C-1 convertible preferred stock received by Advance/Newhouse in the Exchange (including the Discovery Series C common stock into which such shares are convertible) are subject to transfer restrictions on the terms set forth in the Exchange Agreement. While subject to transfer restrictions, such shares may be pledged in certain bona fide financing transactions, but may not be pledged in connection with hedging or similar transactions.
The following table summarizes the preferred shares issued at the time of the Exchange.
|
Pre-Exchange
|
Post-Exchange
|
|||||||||
|
Shares Held Prior to the Amendment
|
Converts into Common Stock
|
Shares Issued Subsequent to the Amendment
|
Converts into Common Stock
|
|||||||
|
Series A Preferred Stock
|
70,673,242
|
Common A
|
70,673,242
|
Series A-1 Preferred Stock
|
7,852,582
|
Common A
|
70,673,242
|
|||
|
Common C
|
70,673,242
|
Series C-1 Preferred Stock
|
3,649,573
|
Common C
|
70,673,242
|
|||||
|
Series C Preferred Stock
|
24,874,370
|
Common C
|
49,748,740
|
Series C-1 Preferred Stock
|
2,569,020
|
Common C
|
49,748,740
|
|||
Prior to the Exchange, each share of Series A preferred stock was convertible into
one
share of Series A common stock and
one
share of Series C common stock (referred to as the “embedded Series C common stock”). Through its ownership of the Series A convertible preferred stock, Advance/Newhouse had the right to elect
three
directors (the “preferred directors”) and maintained special voting rights on certain matters, including but not limited to blocking rights for material acquisitions, the issuance of debt securities and the issuance of equity securities (collectively, the “preferred rights”). Additionally, Advance/Newhouse was subject to certain transfer restrictions with respect to its governance rights. Prior to the Exchange, the Series C convertible preferred stock was considered the economic equivalent of Series C common stock.
Following the Exchange, shares of Series A-1 preferred stock and Series C-1 preferred stock are convertible into Series A common stock and Series C common stock, respectively. The aforementioned preferred rights and transfer restrictions are retained as features of the Series A-1 preferred stock, and holders of Series A-1 preferred stock are now subject to a right of first offer in favor of Discovery should Advance/Newhouse desire to sell
80%
or more of the Series A-1 shares in a “Permitted Transfer” (as defined in the Discovery charter). Following the Exchange, Series C-1 convertible preferred stock is considered the economic equivalent of Series C common stock and is subject to certain transfer restrictions.
Discovery considers the Exchange of the Series A convertible preferred stock for Series A-1 convertible preferred stock and Series C-1 convertible preferred stock to be a modification to the conversion option of the Series A convertible preferred stock. Previously, conversion of Series A preferred stock required simultaneous conversion into Series A common stock and Series C common stock. The Exchange, however, allows for the independent conversion of the Series C-1 convertible preferred stock into Series C common stock without the conversion of Series A-1 convertible preferred stock. Advance/Newhouse’s aggregate voting, economic and preferred rights before the Exchange are equal to its aggregate voting, economic and preferred rights after the Exchange.
Discovery valued the securities immediately prior to and immediately after the Exchange and determined that the Exchange increased the fair value of Advance/Newhouse’s preferred stock by
$35 million
from
$3.340 billion
to
$3.375 billion
, or
1.05%
, which was not considered significant in the context of the total value of the Company's preferred stock. On the basis of the qualitative and quantitative factors noted above, Discovery does not believe the Exchange is considered significant and does not reflect an extinguishment of the previously issued preferred stock for accounting purposes. Accordingly, Discovery has accounted for the exchange of the previously issued preferred stock as a modification, which is measured as the increase in fair value of the preferred stock held by Advance/Newhouse, or
$35 million
.
122
DISCOVERY, INC.
NOTES TO CONSOLIDATED FINANCIAL STATEMENTS
In connection with the Exchange Agreement, Advance/Newhouse also entered into the Advance/Newhouse Voting Agreement. The Advance/Newhouse Voting Agreement requires that Advance/Newhouse vote its shares of Discovery Series A-1 convertible preferred stock to approve the issuance of shares of Series C common stock in connection with the Scripps Networks acquisition as contemplated by the Merger Agreement. As the
$35 million
of incremental value was transferred to Advance/Newhouse in exchange for consent with respect to the Scripps Networks acquisition, the Company determined that the incremental amount should be expensed as acquisition transaction costs, which are reported as a component of selling, general and administrative expense.
As of
December 31, 2018
, all outstanding shares of Series A-1 and Series C-1 convertible preferred stock were held by Advance/Newhouse. Consistent with the terms of the arrangement prior to the Exchange, holders of Series A-1 and Series C-1 convertible preferred stock have equal rights, powers and privileges, except as otherwise noted. Except for the election of common stock directors, the holders of Series A-1 convertible preferred stock are entitled to vote on matters to which holders of Series A and Series B common stock are entitled to vote, and holders of Series C-1 convertible preferred stock are entitled to vote on matters to which holders of Series C common stock, which is generally non-voting, are entitled to vote pursuant to Delaware law. Series A-1 convertible preferred stockholders vote on an as converted to common stock basis together with the Series A and Series B common stockholders as a single class on all matters except the election of directors.
Additionally, through its ownership of the Series A-1 convertible preferred stock, Advance/Newhouse has special voting rights on certain matters and the right to elect three directors. Holders of the Company’s common stock are not entitled to vote in the election of such directors. Advance/Newhouse retains these rights so long as it or its permitted transferees own or have the right to vote such shares that equal at least
80%
of the shares of Series A convertible preferred stock issued to Advance/Newhouse in connection with the formation of Discovery, as converted to Series A-1 convertible preferred stock, plus any Series A-1 convertible preferred stock released from escrow, as may be adjusted for certain capital transactions.
Subject to the prior preferences and other rights of any senior stock, holders of Series A-1 and Series C-1 convertible preferred stock will participate equally with common stockholders on an as converted to common stock basis in any cash dividends declared by the Board of Directors.
In the event of a liquidation, dissolution or winding up of Discovery, after payment of Discovery’s debts and liabilities and subject to the prior payment with respect to any stock ranking senior to Series A-1 and Series C-1 convertible preferred stock, the holders of Series A-1 and Series C-1 convertible preferred stock will receive, before any payment or distribution is made to the holders of any common stock or other junior stock, an amount (in cash or property) equal to
$0.01
per share. Following payment of such amount and the payment in full of all amounts owing to the holders of securities ranking senior to Discovery’s common stock, holders of Series A-1 and Series C-1 convertible preferred stock will share equally on an as converted to common stock basis with the holders of common stock with respect to any assets remaining for distribution to such holders.
Preferred Stock Conversion and Repurchases
Prior to the Exchange, the Company had an agreement with Advance/Newhouse to repurchase, on a quarterly basis, a number of shares of Series C convertible preferred stock convertible into Series C common stock based on the number of shares of Series C common stock purchased under the Company’s stock repurchase program during the then most recently completed fiscal quarter. The price paid per share is calculated as
99%
of the average price paid for the Series C common shares repurchased by the Company during the applicable fiscal quarter multiplied by the Series C conversion rate. The Advance/Newhouse repurchases are made outside of the Company’s publicly announced stock repurchase program. The repurchase transactions are recorded as a decrease of par value of preferred stock and retained earnings upon settlement as there is no remaining additional paid-in capital ("APIC") for this class of stock and the shares are retired upon repurchase. The Advance/Newhouse repurchase agreement was amended on August 7, 2017 to conform the terms of the previous agreement, as detailed above, to the conversion ratio of the newly issued Series C-1 convertible preferred stock. During 2017 there were
2.3 million
shares of Series C convertible preferred stock and
0.2 million
shares of Series C-1 convertible preferred stock repurchased for
$120 million
and
$102 million
, respectively. There were
no
preferred stock repurchases during
2018
.
Common Stock Repurchase Contracts
On
March 15, 2017
, the Company settled a
December 15, 2016
common stock repurchase contract through the receipt of
$58 million
of cash. The Company had prepaid
$57 million
for the common stock repurchase contract in
2016
with the option to settle the contract in cash or Series C common stock in March 2017. The Company elected to receive a cash settlement inclusive of a
$1 million
premium, which is reflected as an adjustment to APIC.
123
DISCOVERY, INC.
NOTES TO CONSOLIDATED FINANCIAL STATEMENTS
On
December 2, 2016
, the Company settled an
August 22, 2016
common stock repurchase contract with a net notional value of
$71 million
whose strike price of
$25.86
was below the Series C common stock price at expiry. The Company elected to settle the contract through receipt of
2.8 million
shares of Series C common stock at the then current market price equal to
$75 million
. The receipt of shares is reflected as a component of treasury stock and reclassified from additional paid-in capital at the prepaid cost of
$71 million
.
Other Comprehensive (Loss) Income
The table below presents the tax effects related to each component of other comprehensive (loss) income and reclassifications made into the consolidated statements of operations (in millions).
|
Year Ended December 31, 2018
|
Year Ended December 31, 2017
|
Year Ended December 31, 2016
|
|||||||||||||||||||||||||||||||||
|
Pretax
|
Tax Benefit (Expense)
|
Net-of-tax
|
Pretax
|
Tax Benefit (Expense)
|
Net-of-tax
|
Pretax
|
Tax Benefit (Expense)
|
Net-of-tax
|
|||||||||||||||||||||||||||
|
Currency translation adjustments:
|
|||||||||||||||||||||||||||||||||||
|
Unrealized (losses) gains:
|
|||||||||||||||||||||||||||||||||||
|
Foreign currency
|
$
|
(246
|
)
|
$
|
(6
|
)
|
$
|
(252
|
)
|
$
|
280
|
|
$
|
3
|
|
$
|
283
|
|
$
|
(234
|
)
|
$
|
41
|
|
$
|
(193
|
)
|
||||||||
|
Net investment hedges
|
59
|
|
—
|
|
59
|
|
(112
|
)
|
—
|
|
(112
|
)
|
3
|
|
(1
|
)
|
2
|
|
|||||||||||||||||
|
Reclassifications:
|
|||||||||||||||||||||||||||||||||||
|
Gain on disposition
|
4
|
|
—
|
|
4
|
|
12
|
|
—
|
|
12
|
|
—
|
|
—
|
|
—
|
|
|||||||||||||||||
|
Total currency translation adjustments
|
(183
|
)
|
(6
|
)
|
(189
|
)
|
180
|
|
3
|
|
183
|
|
(231
|
)
|
40
|
|
(191
|
)
|
|||||||||||||||||
|
AFS adjustments
(a)
:
|
|||||||||||||||||||||||||||||||||||
|
Unrealized gains (losses)
- AFS securities
|
—
|
|
—
|
|
—
|
|
36
|
|
(6
|
)
|
30
|
|
(34
|
)
|
6
|
|
(28
|
)
|
|||||||||||||||||
|
Reclassifications to other expense, net:
|
|||||||||||||||||||||||||||||||||||
|
Other-than-temporary-impairment AFS securities
|
—
|
|
—
|
|
—
|
|
—
|
|
—
|
|
—
|
|
62
|
|
(10
|
)
|
52
|
|
|||||||||||||||||
|
Hedged portion of AFS securities
|
—
|
|
—
|
|
—
|
|
(18
|
)
|
3
|
|
(15
|
)
|
17
|
|
(3
|
)
|
14
|
|
|||||||||||||||||
|
Total equity investment adjustments
|
—
|
|
—
|
|
—
|
|
18
|
|
(3
|
)
|
15
|
|
45
|
|
(7
|
)
|
38
|
|
|||||||||||||||||
|
Derivative adjustments:
|
|||||||||||||||||||||||||||||||||||
|
Unrealized gains (losses)
|
34
|
|
(8
|
)
|
26
|
|
(41
|
)
|
15
|
|
(26
|
)
|
39
|
|
(14
|
)
|
25
|
|
|||||||||||||||||
|
Reclassifications:
|
|||||||||||||||||||||||||||||||||||
|
Distribution revenue
|
(9
|
)
|
2
|
|
(7
|
)
|
22
|
|
(8
|
)
|
14
|
|
25
|
|
(7
|
)
|
18
|
|
|||||||||||||||||
|
Advertising revenue
|
1
|
|
—
|
|
1
|
|
3
|
|
(1
|
)
|
2
|
|
2
|
|
—
|
|
2
|
|
|||||||||||||||||
|
Costs of revenues
|
(11
|
)
|
3
|
|
(8
|
)
|
—
|
|
—
|
|
—
|
|
(27
|
)
|
7
|
|
(20
|
)
|
|||||||||||||||||
|
Interest expense
|
—
|
|
—
|
|
—
|
|
1
|
|
—
|
|
1
|
|
3
|
|
(1
|
)
|
2
|
|
|||||||||||||||||
|
Other (expense) income, net
|
—
|
|
—
|
|
—
|
|
(17
|
)
|
6
|
|
(11
|
)
|
(4
|
)
|
1
|
|
(3
|
)
|
|||||||||||||||||
|
Total derivative adjustments
|
15
|
|
(3
|
)
|
12
|
|
(32
|
)
|
12
|
|
(20
|
)
|
38
|
|
(14
|
)
|
24
|
|
|||||||||||||||||
|
Pension Plan and SERP Liability:
|
|||||||||||||||||||||||||||||||||||
|
Unrealized gains
|
3
|
|
—
|
|
3
|
|
—
|
|
—
|
|
—
|
|
—
|
|
—
|
|
—
|
|
|||||||||||||||||
|
Total Pension Plan and SERP Liability adjustments
|
3
|
|
—
|
|
3
|
|
—
|
|
—
|
|
—
|
|
—
|
|
—
|
|
—
|
|
|||||||||||||||||
|
Other comprehensive (loss) income adjustments
|
$
|
(165
|
)
|
$
|
(9
|
)
|
$
|
(174
|
)
|
$
|
166
|
|
$
|
12
|
|
$
|
178
|
|
$
|
(148
|
)
|
$
|
19
|
|
$
|
(129
|
)
|
||||||||
124
DISCOVERY, INC.
NOTES TO CONSOLIDATED FINANCIAL STATEMENTS
Accumulated Other Comprehensive Loss
The table below presents the changes in the components of accumulated other comprehensive loss, net of taxes (in millions).
|
Currency Translation Adjustments
|
AFS Adjustments
(a)
|
Derivative
Adjustments
|
Pension Plan and SERP Liability
|
Accumulated
Other
Comprehensive Income (Loss)
|
||||||||||||||||
|
December 31, 2015
|
$
|
(606
|
)
|
$
|
(27
|
)
|
$
|
—
|
|
$
|
—
|
|
$
|
(633
|
)
|
|||||
|
Other comprehensive (loss) income before reclassifications
|
(191
|
)
|
(28
|
)
|
25
|
|
—
|
|
(194
|
)
|
||||||||||
|
Reclassifications from accumulated other comprehensive loss to net income
|
—
|
|
66
|
|
(1
|
)
|
—
|
|
65
|
|
||||||||||
|
Other comprehensive loss
|
(191
|
)
|
38
|
|
24
|
|
—
|
|
(129
|
)
|
||||||||||
|
December 31, 2016
|
(797
|
)
|
11
|
|
24
|
|
—
|
|
(762
|
)
|
||||||||||
|
Other comprehensive income (loss) before reclassifications
|
171
|
|
30
|
|
(26
|
)
|
—
|
|
175
|
|
||||||||||
|
Reclassifications from accumulated other comprehensive loss to net income
|
12
|
|
(15
|
)
|
6
|
|
—
|
|
3
|
|
||||||||||
|
Other comprehensive income (loss)
|
183
|
|
15
|
|
(20
|
)
|
—
|
|
178
|
|
||||||||||
|
Other comprehensive loss attributable to redeemable noncontrolling interests
|
(1
|
)
|
—
|
|
—
|
|
—
|
|
(1
|
)
|
||||||||||
|
December 31, 2017
|
(615
|
)
|
26
|
|
4
|
|
—
|
|
(585
|
)
|
||||||||||
|
Other comprehensive (loss) income before reclassifications
|
(193
|
)
|
—
|
|
26
|
|
3
|
|
(164
|
)
|
||||||||||
|
Reclassifications from accumulated other comprehensive loss to net income
|
4
|
|
—
|
|
(14
|
)
|
—
|
|
(10
|
)
|
||||||||||
|
Other comprehensive (loss) income
|
(189
|
)
|
—
|
|
12
|
|
3
|
|
(174
|
)
|
||||||||||
|
Reclassifications to retained earnings resulting from the adoption of ASU 2016-01
|
—
|
|
(26
|
)
|
—
|
|
—
|
|
(26
|
)
|
||||||||||
|
December 31, 2018
|
$
|
(804
|
)
|
$
|
—
|
|
$
|
16
|
|
$
|
3
|
|
$
|
(785
|
)
|
|||||
(a)
Effective
January 1, 2018
, unrealized gains and losses on equity investments with readily determinable fair values are recorded in other (expense) income, net. (See Note 2 and Note 4.)
NOTE 13. NONCONTROLLING INTEREST
In conjunction with the acquisition of Scripps Networks, the Company acquired a controlling interest in the TV Food Network Partnership, which is jointly owned with Tribune Media Company (the "Tribune Company"). Food Network and Cooking Channel are operated and organized under the terms of the Partnership. The Company holds
80%
of the voting interest and
68.7%
of the economic interest in the Partnership. Under the terms of the Partnership, the Partnership has a dissolution date of December 31, 2020. If the term of the Partnership is not extended prior to that date, the Partnership agreement permits the Company, as holder of
80%
of the applicable votes, to reconstitute the Partnership and continue its business. If for some reason the Partnership is not continued, it will be required to limit its activities to winding up, settling debts, liquidating assets and distributing proceeds to the partners in proportion to their partnership interests. Ownership interests attributable to the Tribune Company are presented as noncontrolling interests on the Company's consolidated financial statements. Under the terms of the Partnership agreement, Tribune Company cannot force a redemption outside of the Company's control. As such, the noncontrolling interests in the Partnership are reflected as a component of permanent equity in the Company's consolidated financial statements.
125
DISCOVERY, INC.
NOTES TO CONSOLIDATED FINANCIAL STATEMENTS
NOTE 14. REVENUES
Disaggregated Revenue
The following table presents the Company’s revenues disaggregated by revenue source (in millions). Management uses these categories of revenue to evaluate the performance of its businesses and to assess its financial results and forecasts.
|
Year Ended December 31, 2018
|
|||||||||||||||
|
U.S. Networks
|
International Networks
|
Education and Other
|
Corporate and inter-segment
|
Total
|
|||||||||||
|
Revenues:
|
|||||||||||||||
|
Distribution
|
$
|
2,456
|
|
$
|
2,082
|
|
$
|
—
|
|
$
|
—
|
|
$
|
4,538
|
|
|
Advertising
|
3,749
|
|
1,765
|
|
—
|
|
—
|
|
5,514
|
|
|||||
|
Other
|
145
|
|
302
|
|
54
|
|
—
|
|
501
|
|
|||||
|
Totals
|
$
|
6,350
|
|
$
|
4,149
|
|
$
|
54
|
|
$
|
—
|
|
$
|
10,553
|
|
|
Year Ended December 31, 2017
|
|||||||||||||||
|
U.S. Networks
|
International Networks
|
Education and Other
|
Corporate and inter-segment
|
Total
|
|||||||||||
|
Revenues:
|
|||||||||||||||
|
Distribution
|
$
|
1,612
|
|
$
|
1,862
|
|
$
|
—
|
|
$
|
—
|
|
$
|
3,474
|
|
|
Advertising
|
1,740
|
|
1,332
|
|
1
|
|
—
|
|
3,073
|
|
|||||
|
Other
|
82
|
|
87
|
|
157
|
|
—
|
|
326
|
|
|||||
|
Totals
|
$
|
3,434
|
|
$
|
3,281
|
|
$
|
158
|
|
$
|
—
|
|
$
|
6,873
|
|
|
Year Ended December 31, 2016
|
|||||||||||||||
|
U.S. Networks
|
International Networks
|
Education and Other
|
Corporate and inter-segment
|
Total
|
|||||||||||
|
Revenues:
|
|||||||||||||||
|
Distribution
|
$
|
1,532
|
|
$
|
1,681
|
|
$
|
—
|
|
$
|
—
|
|
$
|
3,213
|
|
|
Advertising
|
1,690
|
|
1,279
|
|
1
|
|
—
|
|
2,970
|
|
|||||
|
Other
|
63
|
|
80
|
|
173
|
|
(2
|
)
|
314
|
|
|||||
|
Totals
|
$
|
3,285
|
|
$
|
3,040
|
|
$
|
174
|
|
$
|
(2
|
)
|
$
|
6,497
|
|
Transaction Price Allocated to Remaining Performance Obligations
Most of the Company's distribution contracts are licenses of functional intellectual property where revenue is derived from royalty-based arrangements, for which the guidance allows the application of a practical expedient to record revenues as a function of royalties earned to date instead of estimating incremental royalty contract revenue. Accordingly, in these instances revenue is recognized based upon the royalties earned to date. However, there are certain other distribution arrangements that are fixed price or contain minimum guarantees that extend beyond one year. The Company recognizes revenue for fixed fee distribution contracts on a monthly basis based on minimum monthly fees or by calculating one twelfth of annual license fees specified in its distribution contracts. The transaction price allocated to remaining performance obligations within these fixed price or minimum guarantee distribution revenue contracts was
$1.7 billion
as of
December 31, 2018
, and is expected to be recognized over the next
nine
years.
The Company's content licensing contracts and sports sublicensing deals are licenses of functional intellectual property. Certain of these arrangements extend beyond
one
year. The transaction price allocated to remaining performance obligations on these long-term contracts was
$511 million
as of
December 31, 2018
, and is expected to be recognized over the next
six
years.
The Company's brand licensing contracts are licenses of symbolic intellectual property. Certain of these arrangements extend beyond
one
year. The transaction price allocated to remaining performance obligations on these long-term contracts was
$86 million
as of
December 31, 2018
, and is expected to be recognized over the next
fourteen
years.
126
DISCOVERY, INC.
NOTES TO CONSOLIDATED FINANCIAL STATEMENTS
Due to the use of the practical expedients noted below, the above disclosure does not include information related to advertising since the duration of these arrangements is less than one year.
Contract Balances
A receivable is recorded when there is an unconditional right to consideration based on a contract with a customer. A contract liability, i.e. deferred revenue, is recorded when cash is received in advance of the Company's performance. The following table presents (in millions) the Company’s opening and closing balances of receivables and deferred revenues, as well as activity since the beginning of the period.
|
December 31, 2017
|
Additions
(b)
|
Reductions
(c)
|
Foreign Currency
|
December 31, 2018
|
||||||||
|
Accounts receivable
|
$
|
1,838
|
|
11,321
|
|
(10,527
|
)
|
(12
|
)
|
$
|
2,620
|
|
|
Deferred revenues:
|
||||||||||||
|
Current
|
255
|
|
1,378
|
|
(1,371
|
)
|
(13
|
)
|
249
|
|
||
|
Long term
(a)
|
109
|
|
38
|
|
(27
|
)
|
—
|
|
120
|
|
||
|
December 31, 2016
|
Additions
(d)
|
Reductions
(e)
|
Foreign Currency
|
December 31, 2017
|
||||||||
|
Accounts receivable
|
$
|
1,495
|
|
7,074
|
|
(6,747
|
)
|
16
|
|
$
|
1,838
|
|
|
Deferred revenues:
|
||||||||||||
|
Current
|
163
|
|
936
|
|
(875
|
)
|
31
|
|
255
|
|
||
|
Long term
(a)
|
122
|
|
26
|
|
(43
|
)
|
4
|
|
109
|
|
||
(a)
Long term deferred revenues is a component of other noncurrent liabilities on the consolidated balance sheets.
(b)
This column includes Scripps Networks accounts receivable and deferred revenues balances of
$783 million
and
$122 million
, respectively, as of
March 6, 2018
, the date of the acquisition. (See Note 3.)
(c)
This column includes the impact of the sale of the Education Business on
April 30, 2018
. (See Note 3.) As of the sale date, accounts receivable and deferred revenue balances were
$32 million
and
$74 million
, respectively.
(d)
This column includes OWN accounts receivable and deferred revenues balances of
$84 million
and
$5 million
, respectively, as of November 30, 2017, the acquisition date, and TEN deferred revenues balance of
$8 million
as of September 25, 2017, the acquisition date. (See Note 3.)
(e)
This column includes the impact of the sale of Raw and Betty on
April 28, 2017
. (See Note 3.) As of the sale date, accounts receivable and deferred revenue balances were
$6 million
and
$17 million
, respectively.
Practical Expedients and Exemptions
Sales commissions are generally expensed as incurred because contracts for which the sales commission are generated are
one
year or less or are not material. Sales commissions are recorded as a component of cost of revenues on the consolidated statements of operations. The financing component of content licensing arrangements is not capitalized, because the period between delivery of the license and customer payment is one
year
or less or is not material.
The value of unsatisfied performance obligations is not disclosed for: (i) contracts involving variable consideration for which revenues are recognized in accordance with the usage-based royalty exception, and (ii) contracts with an original expected length of
one
year or less, such as advertising contracts.
NOTE 15. SHARE-BASED COMPENSATION
The Company has various incentive plans under which stock options, RSUs, PRSUs and SARs have been issued. As of
December 31, 2018
, the Company has reserved a total of
123 million
shares of its Series A and Series C common stock for future exercises of outstanding and future grants of stock options and stock-settled SARs and future vesting of outstanding and future grants of PRSUs and RSUs. Upon exercise of stock options and stock-settled SARs or vesting of PRSUs and RSUs, the Company issues new shares from its existing authorized but unissued shares. There were
83 million
shares of common stock in reserves that were available for future grant under the incentive plans as of
December 31, 2018
.
127
DISCOVERY, INC.
NOTES TO CONSOLIDATED FINANCIAL STATEMENTS
Share-Based Compensation Expense
The table below presents the components of share-based compensation expense (in millions).
|
|
Year Ended December 31,
|
|||||||||||
|
|
2018
|
2017
|
2016
|
|||||||||
|
PRSUs
|
$
|
24
|
|
$
|
6
|
|
$
|
34
|
|
|||
|
RSUs
|
27
|
|
23
|
|
17
|
|
||||||
|
Stock options
|
22
|
|
12
|
|
13
|
|
||||||
|
SARs
|
8
|
|
(3
|
)
|
4
|
|
||||||
|
ESPP and other
|
(1
|
)
|
1
|
|
1
|
|
||||||
|
Total share-based compensation expense
|
$
|
80
|
|
$
|
39
|
|
$
|
69
|
|
|||
|
Tax benefit recognized
|
$
|
13
|
|
$
|
9
|
|
$
|
25
|
|
|||
Compensation expense for all awards was recorded in selling, general and administrative expense on the consolidated statements of operations. Liability-classified share-based compensation awards include certain PRSUs and SARs. The Company recorded total liabilities for cash-settled and other liability-classified share-based compensation awards of
$54 million
and
$47 million
as of
December 31, 2018 and 2017
, respectively. The current portion of the liability for cash-settled awards was
$23 million
and
$12 million
as of
December 31, 2018 and 2017
, respectively.
Share-Based Award Activity
PRSUs
The table below presents PRSU activity (in millions, except years and weighted-average grant price).
|
PRSUs
|
Weighted-
Average
Grant
Date Fair Value
|
Weighted-Average
Remaining
Contractual
Term
(years)
|
Aggregate
Fair
Value
|
||||||||||
|
Outstanding as of December 31, 2017
|
3.5
|
|
$
|
33.41
|
|
0.9
|
$
|
76
|
|
||||
|
Granted
|
0.6
|
|
$
|
24.06
|
|
||||||||
|
Converted
|
(1.1
|
)
|
$
|
40.21
|
|
$
|
25
|
|
|||||
|
Forfeited
|
(0.1
|
)
|
$
|
26.98
|
|
||||||||
|
Outstanding as of December 31, 2018
|
2.9
|
|
$
|
28.98
|
|
0.8
|
$
|
69
|
|
||||
|
Vested and expected to vest as of December 31, 2018
|
2.9
|
|
$
|
28.98
|
|
0.8
|
$
|
69
|
|
||||
|
Convertible as of December 31, 2018
|
0.5
|
|
$
|
39.96
|
|
0.0
|
$
|
13
|
|
||||
The Company has granted PRSUs to certain senior level executives. PRSUs represent the contingent right to receive shares of the Company’s Series A and C common stock, substantially all of which vest over
three
to
four
years based on continuous service and whether the Company achieves certain operating performance targets. The performance targets for substantially all PRSUs are cumulative measures of the Company’s adjusted operating income before depreciation and amortization (as defined in Note 23), free cash flows and revenues over a
three
-year period. The number of PRSUs that vest principally range from
0%
to
100%
based on a sliding scale where achieving or exceeding the performance target will result in
100%
of the PRSUs vesting and achieving less than
80%
of the target will result in
no
portion of the PRSUs vesting. Additionally, for certain PRSUs, the Company’s Compensation Committee has discretion in determining the final amount of units that vest, but may not increase the amount of any PRSU award above
100%
. Upon vesting, each PRSU becomes convertible into one share of the Company’s Series A or Series C common stock as applicable. Holders of PRSUs do not receive payments of dividends in the event the Company pays a cash dividend until such PRSUs are converted into shares of the Company’s common stock.
The Company records compensation expense for PRSUs ratably over the graded vesting service period once it is probable that the performance targets will be achieved. In any period in which the Company determines that achievement of the performance targets is not probable, the Company ceases recording compensation expense and all previously recognized compensation expense for the award is reversed.
128
DISCOVERY, INC.
NOTES TO CONSOLIDATED FINANCIAL STATEMENTS
Compensation expense is separately recorded for each vesting tranche of PRSUs for a particular grant. For certain PRSUs, the Company measures the fair value and related compensation cost based on the closing price of the Company’s Series A or C common stock on the grant date. For PRSUs for which the Company’s Compensation Committee has discretion in determining the final amount of units that vest or in situations where the executive is able to withhold taxes in excess of the maximum statutory requirement, compensation cost is remeasured at each reporting date based on the closing price of the Company’s Series A or Series C common stock.
As of
December 31, 2018
, unrecognized compensation cost related to PRSUs was
$16 million
, which is expected to be recognized over a weighted-average period of
1.0 year
based on the Company’s current assessment of the PRSUs that will vest, which may differ from actual results.
RSUs
The table below presents RSU activity (in millions, except years and weighted-average grant price).
|
RSUs
|
Weighted-
Average
Grant
Date Fair Value
|
Weighted-Average
Remaining
Contractual
Term
(years)
|
Aggregate
Fair
Value
|
||||||||||
|
Outstanding as of December 31, 2017
|
3.4
|
|
$
|
28.78
|
|
2.6
|
$
|
77
|
|
||||
|
Granted
|
3.6
|
|
$
|
23.85
|
|
||||||||
|
Converted
|
(1.2
|
)
|
$
|
26.68
|
|
$
|
30
|
|
|||||
|
Forfeited
|
(0.9
|
)
|
$
|
27.38
|
|
||||||||
|
Outstanding as of December 31, 2018
|
4.9
|
|
$
|
25.95
|
|
2.6
|
$
|
120
|
|
||||
|
Vested and expected to vest as of December 31, 2018
|
4.9
|
|
$
|
25.95
|
|
2.6
|
$
|
120
|
|
||||
RSUs represent the contingent right to receive shares of the Company's Series A and C common stock, substantially all of which vest ratably each year over periods of
one
to
four
years based on continuous service. As of
December 31, 2018
, there was
$78 million
of unrecognized compensation cost related to RSUs, which is expected to be recognized over a weighted-average period of
2.7 years
.
Stock Options
The table below presents stock option activity (in millions, except years and weighted-average exercise price).
|
Stock Options
|
Weighted-
Average
Exercise
Price
|
Weighted-
Average
Remaining
Contractual
Term
(years)
|
Aggregate
Intrinsic
Value
|
||||||||||
|
Outstanding as of December 31, 2017
|
12.3
|
|
$
|
27.46
|
|
3.5
|
$
|
14
|
|
||||
|
Granted
(a)
|
15.1
|
|
$
|
27.51
|
|
||||||||
|
Exercised
|
(3.9
|
)
|
$
|
18.14
|
|
$
|
30
|
|
|||||
|
Forfeited
|
(2.4
|
)
|
$
|
30.47
|
|
||||||||
|
Outstanding as of December 31, 2018
|
21.1
|
|
$
|
28.86
|
|
5.3
|
$
|
9
|
|
||||
|
Vested and expected to vest as of December 31, 2018
|
21.1
|
|
$
|
28.86
|
|
5.3
|
$
|
9
|
|
||||
|
Exercisable as of December 31, 2018
|
5.1
|
|
$
|
29.92
|
|
2.6
|
$
|
7
|
|
||||
(a) Stock options granted during the year ended December 31, 2018 include
2 million
awards granted in connection with the acquisition of Scripps Networks.
Stock options are granted with an exercise price equal to or in excess of the closing market price of the Company’s Series A or Series C common stock on the date of grant. Substantially all stock options vest ratably over
three
to
four
years from the grant date based on continuous service and expire
seven
to
ten
years from the date of grant. Stock option awards generally provide for accelerated vesting upon retirement or after reaching a specified age and years of service. The Company received cash payments from the exercise of stock options totaling
$68 million
,
$42 million
and
$46 million
during
2018
,
2017
and
2016
, respectively. As of
December 31, 2018
, there was
$107 million
of unrecognized compensation cost related to stock options, which is expected to be recognized over a weighted-average period of
3.7 years
.
129
DISCOVERY, INC.
NOTES TO CONSOLIDATED FINANCIAL STATEMENTS
The fair value of stock options is estimated using the Black-Scholes option-pricing model. The weighted-average assumptions used to determine the fair value of stock options as of the date of grant during
2018
,
2017
and
2016
were as follows.
|
|
Year Ended December 31,
|
||||||||
|
|
2018
|
2017
|
2016
|
||||||
|
Risk-free interest rate
|
2.74
|
%
|
1.87
|
%
|
1.26
|
%
|
|||
|
Expected term (years)
|
5.5
|
|
5.0
|
|
5.0
|
|
|||
|
Expected volatility
|
29.57
|
%
|
27.52
|
%
|
28.74
|
%
|
|||
|
Dividend yield
|
—
|
|
—
|
|
—
|
|
|||
The weighted-average grant date fair value of options granted during
2018
,
2017
and
2016
was
$7.95
,
$7.99
and
$7.09
, respectively, per option. The total intrinsic value of options exercised during
2018
,
2017
and
2016
was
$30 million
,
$26 million
and
$42 million
, respectively.
SARs
The table below presents SAR award activity (in millions, except years and weighted-average grant price).
|
SARs
|
Weighted-
Average
Grant
Price
|
Weighted-
Average
Remaining
Contractual
Term
(years)
|
Aggregate
Intrinsic
Value
|
||||||||||
|
Outstanding as of December 31, 2017
|
7.7
|
|
$
|
31.58
|
|
1.0
|
$
|
—
|
|
||||
|
Granted
|
3.7
|
|
$
|
22.37
|
|
||||||||
|
Settled
|
(0.1
|
)
|
$
|
26.80
|
|
$
|
—
|
|
|||||
|
Forfeited
|
(3.7
|
)
|
$
|
35.75
|
|
||||||||
|
Outstanding as of December 31, 2018
|
7.6
|
|
$
|
25.10
|
|
1.2
|
$
|
6
|
|
||||
|
Vested and expected to vest as of December 31, 2018
|
7.6
|
|
$
|
25.10
|
|
1.2
|
$
|
6
|
|
||||
SAR award grants include cash-settled SARs and stock-settled SARs. Cash-settled SARs entitle the holder to receive a cash payment for the amount by which the price of the Company’s Series A or Series C common stock exceeds the base price established on the grant date. Cash-settled SARs are granted with a base price equal to or greater than the closing market price of the Company’s Series A or Series C common stock on the date of grant. Stock-settled SARs entitle the holder to shares of Series A or Series C common stock in accordance with the award agreement terms.
The fair value of outstanding SARs is estimated using the Black-Scholes option-pricing model. The weighted-average assumptions used to determine the fair value of outstanding SARs were as follows.
|
|
Year Ended December 31,
|
||||||||
|
|
2018
|
2017
|
2016
|
||||||
|
Risk-free interest rate
|
2.53
|
%
|
1.74
|
%
|
0.95
|
%
|
|||
|
Expected term (years)
|
1.2
|
|
1.0
|
|
0.9
|
|
|||
|
Expected volatility
|
36.52
|
%
|
31.37
|
%
|
29.46
|
%
|
|||
|
Dividend yield
|
—
|
|
—
|
|
—
|
|
|||
As of
December 31, 2018 and 2017
, the weighted-average fair value of SARs outstanding was
$3.31
and
$1.01
per award. The Company made
no
cash payments to settle exercised SARs during
2018
. The Company made cash payments of
$1 million
and
$5 million
to settle exercised SARs during
2017
and
2016
, respectively. As of
December 31, 2018
, there was
$13 million
of unrecognized compensation cost related to SARs, which is expected to be recognized over a weighted-average period of
1.1 years
.
130
DISCOVERY, INC.
NOTES TO CONSOLIDATED FINANCIAL STATEMENTS
Employee Stock Purchase Plan
The ESPP enables eligible employees to purchase shares of the Company’s common stock through payroll deductions or other permitted means. Unless otherwise determined by the Company’s Compensation Committee, the purchase price for shares offered under the ESPP is
85%
of the closing price of the Company’s Series A common stock on the purchase date. The Company recognizes the fair value of the discount associated with shares purchased in selling, general and administrative expense on the consolidated statement of operations. The Company’s Board of Directors has authorized
9 million
shares of the Company’s common stock to be issued under the ESPP. During the years ended
December 31, 2018
,
2017
and
2016
the Company issued
133 thousand
,
179 thousand
and
191 thousand
shares under the ESPP, respectively, and received cash totaling
$3 million
, $
4 million
and
$4 million
, respectively.
NOTE 16. RETIREMENT SAVINGS PLANS
The Company has defined contribution and other savings plans for the benefit of its employees that meet eligibility requirements. In addition to these plans, as a result of the acquisition of Scripps Networks on
March 6, 2018
, the Company assumed the following employee defined benefit plans previously sponsored by Scripps Networks: (i) a qualified defined benefit pension plan ("Pension Plan") that covers certain U.S. based employees and (ii) a non-qualified unfunded Supplemental Executive Retirement Plan ("SERP"), which in addition to the Pension Plan provides defined pension benefits to eligible executives, (iii) defined contribution plan and (iv) executive deferred compensation plan.
Defined Contribution Plans
Eligible employees may contribute a portion of their compensation to the plans, which may be subject to certain statutory limitations. For these plans, the Company also makes contributions including discretionary contributions, subject to plan provisions, which vest immediately. The Company made total contributions of
$41 million
,
$30 million
and
$29 million
during
2018
,
2017
and
2016
, respectively. The Company's contributions were recorded in cost of revenues and selling, general and administrative expense in the consolidated statements of operations.
Employees of TVN and their subsidiaries are covered by state managed defined contribution plans. The Company made total contributions of
$3 million
in
2018
. The Company's contributions were recorded in cost of revenues and selling, general and administrative expense in the consolidated statements of operations.
Executive Deferred Compensation Plans
The Company’s savings plans also include a deferred compensation plan through which members of the Company’s executive team in the U.S. may elect to defer a portion of their eligible compensation. The amounts deferred are invested in various mutual funds at the direction of the executive, which are used to finance payment of the deferred compensation obligation. Distributions from the deferred compensation plan are made upon termination or other events as specified in the plan. The Company has established separate rabbi trusts to hold the investments that finance the deferred compensation obligation. The accounts of the separate rabbi trusts are included in the Company’s consolidated financial statements. The investments are included in prepaid expenses and other current assets and other noncurrent assets. The deferred compensation obligation is included in accrued liabilities and other noncurrent liabilities in the consolidated balance sheets. The values of the investments and deferred compensation obligation are recorded at fair value. Changes in the fair value of the investments are offset by changes in the fair value of the deferred compensation obligation and are recorded in earnings as a component of other (expense) income, net, on the consolidated statements of operations. (See Note 5.)
Defined Benefit Plans
Pension Plan and SERP
Expense recognized in relation to the Pension Plan and SERP is based upon actuarial valuations. Inherent in those valuations are key assumptions including discount rates and, where applicable, expected returns on assets and projected future salary rates. Benefits are generally based on the employee’s compensation and years of service. Since
December 31, 2009
, no additional service benefits have been earned by participants under the Pension Plan. The amount of eligible compensation that is used to calculate a plan participant’s pension benefit includes compensation earned by the employee through
December 31, 2019
, after which time all plan participants will have a frozen pension benefit.
131
DISCOVERY, INC.
NOTES TO CONSOLIDATED FINANCIAL STATEMENTS
The following table presents the components of the net periodic pension cost for the Pension Plan and SERP (in millions). The components of net periodic pension costs are reflected in other expense, net in the consolidated statements of operations.
|
Year Ended December 31, 2018
|
||||||||
|
Pension Plan
|
SERP
|
|||||||
|
Interest cost
|
$
|
3
|
|
$
|
1
|
|
||
|
Expected return on plan assets, net of expenses
|
(4
|
)
|
—
|
|
||||
|
Settlement charges
|
—
|
|
(2
|
)
|
||||
|
Net periodic pension cost
|
$
|
(1
|
)
|
$
|
(1
|
)
|
||
During the period
March 6, 2018
to
December 31, 2018
, the Company contributed
$21
million to the Pension Plan and made
$31
million SERP benefit payments. Of the
$21
million contributed to the Pension Plan during the period,
$3
million was considered required funding. The Company does
no
t anticipate contributing any cash to fund the Pension Plan and anticipates contributing
$8
million to fund SERP benefit payments in 2019.
Assumptions used in determining the Pension Plan and SERP expense as of December 31, 2018.
|
December 31, 2018
|
||||||
|
Pension Plan
|
SERP
|
|||||
|
Discount rate
|
3.84
|
%
|
3.41
|
%
|
||
|
Long-term rate of return on plan assets
|
7.50
|
%
|
N/A
|
|
||
|
Rate of compensation increases
|
3.57
|
%
|
3.21
|
%
|
||
|
Assumption
|
|
Description
|
|
Discount rate
|
|
Based on a bond portfolio approach that includes high-quality debt instruments with maturities matching the Company's expected benefit payments from the plans.
|
|
Long-term rate of return on plan assets
|
|
Based on the weighted-average expected rate of return and capital market forecasts for each asset class employed and also considers the Company's historical compounded return on plan assets for 10 and 15-year periods.
|
|
Increase in compensation levels
|
Based on past experience and the near-term outlook.
|
|
|
Mortality
|
RP 2014 mortality tables adjusted and projected using the scale MP-2018 mortality improvement rates.
|
|
132
DISCOVERY, INC.
NOTES TO CONSOLIDATED FINANCIAL STATEMENTS
Obligations and Funded Status
The following table presents information about plan assets and obligations of the Pension Plan and SERP based upon a valuation as of December 31, 2018.
|
Year Ended December 31, 2018
|
||||||||
|
Pension Plan
|
SERP
|
|||||||
|
Accumulated benefit obligation
|
$
|
81
|
|
$
|
24
|
|
||
|
Change in projected benefit obligation:
|
||||||||
|
Projected benefit obligation at beginning of year
|
$
|
96
|
|
$
|
62
|
|
||
|
Interest cost
|
3
|
|
1
|
|
||||
|
Benefits paid
|
(1
|
)
|
—
|
|
||||
|
Actuarial gains
|
(5
|
)
|
(5
|
)
|
||||
|
Curtailments
|
(1
|
)
|
—
|
|
||||
|
Settlement charges
(a)
|
(8
|
)
|
(32
|
)
|
||||
|
Projected benefit obligation at end of year
|
84
|
|
26
|
|
||||
|
Plan assets:
|
|
|
|
|
||||
|
Fair value at beginning of year
|
60
|
|
—
|
|
||||
|
Actual return on plan assets
|
(2
|
)
|
—
|
|
||||
|
Company contributions
|
21
|
|
32
|
|
||||
|
Benefits paid
|
(1
|
)
|
—
|
|
||||
|
Settlement charges
(a)
|
(8
|
)
|
(32
|
)
|
||||
|
Fair value at end of year
|
70
|
|
—
|
|
||||
|
Underfunded status
|
$
|
(14
|
)
|
$
|
(26
|
)
|
||
|
Amounts recognized as assets and liabilities in the consolidated balance sheets:
|
||||||||
|
Current liabilities
|
$
|
—
|
|
$
|
(7
|
)
|
||
|
Non-current liabilities
|
(14
|
)
|
(19
|
)
|
||||
|
Total
|
$
|
(14
|
)
|
$
|
(26
|
)
|
||
|
Amounts recognized in accumulated other comprehensive
loss consist of:
|
||||||||
|
Net gain
|
$
|
—
|
|
$
|
(3
|
)
|
||
(a)
In 2018, Discovery incurred pension settlement charges primarily related to former employees impacted by the restructuring plan.
Other changes in plan assets and benefit obligations recognized in net periodic benefit cost and other comprehensive loss for the defined benefit plans, following the acquisition of Scripps Networks, consist of the following.
|
Year Ended December 31, 2018
|
||||||||
|
Pension Plan
|
SERP
|
|||||||
|
Net actuarial loss (gain)
|
$
|
1
|
|
$
|
(5
|
)
|
||
|
Curtailments
|
(1
|
)
|
—
|
|
||||
|
Settlement charges
|
—
|
|
2
|
|
||||
|
Total recognized in other comprehensive (income) loss
|
—
|
|
(3
|
)
|
||||
|
Net periodic benefit cost
|
(1
|
)
|
(1
|
)
|
||||
|
Total recognized in net periodic benefit cost and other comprehensive loss
|
$
|
(1
|
)
|
$
|
(4
|
)
|
||
The Company does not expect to amortize any amounts related to the Pension Plan or SERP from accumulated other comprehensive loss into net periodic benefit cost for the net actuarial gain during 2019.
133
DISCOVERY, INC.
NOTES TO CONSOLIDATED FINANCIAL STATEMENTS
Assumptions used in determining benefit obligations for the defined benefit plans were as follows.
|
December 31, 2018
|
||||||
|
Pension Plan
|
SERP
|
|||||
|
Discount rate
|
3.93
|
%
|
3.77
|
%
|
||
|
Rate of compensation increases
|
3.23
|
%
|
2.89
|
%
|
||
Plan Assets
The Company's investment policy is to maximize the total rate of return on plan assets to meet the long-term funding obligations of the Pension Plan. There are no restrictions on types of investments held in the Pension Plan, which are invested using a combination of active management and passive investment strategies. Risk is controlled through diversification among multiple asset classes, managers, styles and securities. Risk is further controlled both at the manager and asset class level by assigning return targets and evaluating performance against these targets. The following table presents Pension Plan asset allocations by asset category.
|
Investment Type
|
Target Allocations for 2019
|
December 31, 2018
|
||||
|
Debt securities
|
90
|
%
|
89
|
%
|
||
|
U.S. equity securities
|
10
|
%
|
8
|
%
|
||
|
Cash
|
—
|
%
|
3
|
%
|
||
|
Total
|
100
|
%
|
100
|
%
|
||
|
Investment Type
|
Description
|
|
|
Debt securities
|
Includes securities issued or guaranteed by the U.S. government and corporate debt obligations.
|
|
|
U.S. equity securities
|
Includes common stocks of large, medium and small companies that are
predominantly U.S.-based.
|
|
|
Cash
|
||
Fair Value Measurements
Fair value is an exit price, representing the amount that would be received to sell an asset or paid to transfer a liability in an orderly transaction between market participants at the measurement date.
|
December 31, 2018
|
||||||||||||||||
|
Total
|
Level 1
|
Level 2
|
Level 3
|
|||||||||||||
|
Debt securities
|
||||||||||||||||
|
Mutual funds
|
$
|
62
|
|
$
|
62
|
|
—
|
|
—
|
|
||||||
|
U.S. equity securities
|
||||||||||||||||
|
Mutual funds
|
6
|
|
6
|
|
—
|
|
—
|
|
||||||||
|
Cash
|
2
|
|
2
|
|
—
|
|
—
|
|
||||||||
|
Total
|
$
|
70
|
|
$
|
70
|
|
$
|
—
|
|
$
|
—
|
|
||||
134
DISCOVERY, INC.
NOTES TO CONSOLIDATED FINANCIAL STATEMENTS
Estimated Benefit Payments
The following table presents the estimated future benefit payments expected to be paid out for the defined benefits plans over the next ten years.
|
Pension Plan
|
SERP
|
|||||||
|
2019
|
$
|
5
|
|
$
|
8
|
|
||
|
2020
|
5
|
|
2
|
|
||||
|
2021
|
4
|
|
2
|
|
||||
|
2022
|
5
|
|
2
|
|
||||
|
2023
|
7
|
|
2
|
|
||||
|
Thereafter
|
29
|
|
7
|
|
||||
NOTE 17. RESTRUCTURING AND OTHER CHARGES
Restructuring and other charges by reportable segment, education and other, and corporate and inter-segment eliminations were as follows (in millions).
|
|
Year Ended December 31,
|
|||||||||||
|
|
2018
|
2017
|
2016
|
|||||||||
|
U.S. Networks
|
$
|
322
|
|
$
|
18
|
|
$
|
15
|
|
|||
|
International Networks
|
307
|
|
42
|
|
26
|
|
||||||
|
Education and Other
|
1
|
|
3
|
|
3
|
|
||||||
|
Corporate and inter-segment eliminations
|
120
|
|
12
|
|
14
|
|
||||||
|
Total restructuring and other charges
|
$
|
750
|
|
$
|
75
|
|
$
|
58
|
|
|||
|
Year Ended December 31,
|
||||||||||||
|
2018
|
2017
|
2016
|
||||||||||
|
Restructuring charges
|
$
|
345
|
|
$
|
68
|
|
$
|
55
|
|
|||
|
Other charges
|
405
|
|
7
|
|
3
|
|
||||||
|
Total restructuring and other charges
|
$
|
750
|
|
$
|
75
|
|
$
|
58
|
|
|||
Restructuring charges include contract terminations, employee terminations and facility closures. For the
year ended December 31, 2018
, these charges result from activities to integrate Scripps Networks and establish an efficient cost structure. Contract-related restructuring charges include costs to terminate certain production commitments, life of series production and content licensing contracts. Employee terminations relate to cost reduction efforts and management changes. Facility-related restructuring charges are recognized upon exiting all or a portion of a leased facility after meeting cease-use requirements. Other charges relate to content write-offs that resulted from strategic programming changes following the acquisition of Scripps Networks. Charges incurred in
2017
and
2016
resulted from management changes and cost reduction efforts, including employee terminations, intended to enable the Company to more efficiently operate in a leaner and more directed cost structure and invest in growth initiatives, including digital services and content creation.
135
DISCOVERY, INC.
NOTES TO CONSOLIDATED FINANCIAL STATEMENTS
Changes in restructuring and other liabilities recorded in accrued liabilities and other noncurrent liabilities by reportable segment, education and other, and corporate and inter-segment eliminations were as follows (in millions).
|
U.S. Networks
|
International Networks
|
Education and Other
|
Corporate and inter-segment eliminations
|
Total
|
||||||||||||||||
|
December 31, 2016
|
$
|
11
|
|
$
|
11
|
|
$
|
—
|
|
$
|
17
|
|
$
|
39
|
|
|||||
|
Net contract termination accruals
|
3
|
|
—
|
|
—
|
|
—
|
|
3
|
|
||||||||||
|
Net employee relocation/termination accruals
|
12
|
|
42
|
|
4
|
|
7
|
|
65
|
|
||||||||||
|
Cash paid
|
(21
|
)
|
(28
|
)
|
(3
|
)
|
(12
|
)
|
(64
|
)
|
||||||||||
|
December 31, 2017
|
5
|
|
25
|
|
1
|
|
12
|
|
43
|
|
||||||||||
|
Net contract termination accruals
|
12
|
|
67
|
|
—
|
|
14
|
|
93
|
|
||||||||||
|
Net employee relocation/termination accruals
|
89
|
|
56
|
|
1
|
|
99
|
|
245
|
|
||||||||||
|
Cash paid
|
(90
|
)
|
(102
|
)
|
(2
|
)
|
(79
|
)
|
(273
|
)
|
||||||||||
|
December 31, 2018
|
$
|
16
|
|
$
|
46
|
|
$
|
—
|
|
$
|
46
|
|
$
|
108
|
|
|||||
Net accruals for the
year ended December 31, 2018
do not include
$7 million
of Scripps Networks share-based awards exchanged for Discovery shares as of
March 6, 2018
recorded in APIC and included in restructuring charges for the
year ended December 31, 2018
.
NOTE 18. INCOME TAXES
The domestic and foreign components of income (loss) before income taxes were as follows (in millions).
|
|
Year Ended December 31,
|
|||||||||||
|
|
2018
|
2017
|
2016
|
|||||||||
|
Domestic
|
$
|
1,125
|
|
$
|
815
|
|
$
|
1,414
|
|
|||
|
Foreign
|
(103
|
)
|
(952
|
)
|
257
|
|
||||||
|
Income (loss) before income taxes
|
$
|
1,022
|
|
$
|
(137
|
)
|
$
|
1,671
|
|
|||
The components of the provision for income taxes were as follows (in millions).
|
|
Year Ended December 31,
|
|||||||||||
|
|
2018
|
2017
|
2016
|
|||||||||
|
Current:
|
||||||||||||
|
Federal
|
$
|
323
|
|
$
|
177
|
|
$
|
384
|
|
|||
|
State and local
|
30
|
|
45
|
|
(56
|
)
|
||||||
|
Foreign
|
119
|
|
153
|
|
152
|
|
||||||
|
472
|
|
375
|
|
480
|
|
|||||||
|
Deferred:
|
||||||||||||
|
Federal
|
(113
|
)
|
(124
|
)
|
45
|
|
||||||
|
State and local
|
(21
|
)
|
(7
|
)
|
—
|
|
||||||
|
Foreign
|
3
|
|
(68
|
)
|
(72
|
)
|
||||||
|
(131
|
)
|
(199
|
)
|
(27
|
)
|
|||||||
|
Income taxes
|
$
|
341
|
|
$
|
176
|
|
$
|
453
|
|
|||
136
DISCOVERY, INC.
NOTES TO CONSOLIDATED FINANCIAL STATEMENTS
On December 22, 2017, new federal tax reform legislation was enacted in the United States, resulting in significant changes from previous tax law. The TCJA revised the U.S. corporate income tax by among other things, lowering the statutory corporate tax rate from 35% to 21% and reinstating bonus depreciation that will allow for full expensing of qualified property, for property placed in service before 2023, including qualified film, such as content produced by the Company. The TCJA also eliminated or significantly amended certain deductions (interest, domestic production activities deduction and executive compensation). The TCJA fundamentally changed taxation of multinational entities by moving from a system of worldwide taxation with deferral to a hybrid territorial system, featuring a participation exemption regime with current taxation of certain foreign income. Included in the international provisions was the enactment of a minimum tax on low-taxed foreign earnings, and new measures to deter base erosion and promote U.S. production. In addition, the TCJA imposed a mandatory repatriation toll tax on unremitted foreign earnings. The U.S. taxation of these amounts notwithstanding, we intend to continue to invest most or all of these earnings, as well as our capital in these subsidiaries, indefinitely outside of the U.S.
Based on our preliminary assessment of the TCJA impact, we recognized a one-time, provisional net tax benefit of
$44 million
in the fourth quarter of 2017 related to: the deemed repatriation tax on post-1986 accumulated earnings and profits, the deferred tax rate change effect of the new law, gross foreign tax credit carryforwards and related valuation allowances to offset foreign tax credit carryforwards. Our 2017 U.S. federal income tax return was filed in October 2018 and there were no material adjustments related to TCJA.
The SEC staff issued Staff Accounting Bulletin No. 118 (“SAB 118”) to address the application of U.S. GAAP in situations when a registrant did not have the necessary information available, prepared, or analyzed in reasonable detail to complete the accounting for certain income tax effects of the TCJA. The Company recognized provisional tax impacts related to the deemed repatriated earnings and the revaluation of deferred tax assets and liabilities in its consolidated financial statements for the year ended December 31, 2017. Adjustments made to the provisional amounts allowed under SAB 118 were identified and recorded as discrete adjustments during the year ended December 31, 2018. The Company has completed its accounting for all TCJA tax effects and there were no material adjustments to the provisional net tax benefit recognized in 2017.
The following table reconciles the Company's effective income tax rates to the U.S. federal statutory income tax rates.
|
Year Ended December 31,
|
|||||||||||||||||||||
|
2018
|
2017
|
2016
|
|||||||||||||||||||
|
U.S. federal statutory income tax provision
|
$
|
215
|
|
21
|
%
|
$
|
(48
|
)
|
35
|
%
|
$
|
585
|
|
35
|
%
|
||||||
|
State and local income taxes, net of federal tax benefit
|
10
|
|
1
|
%
|
23
|
|
(18
|
)%
|
(36
|
)
|
(2
|
)%
|
|||||||||
|
Effect of foreign operations
|
111
|
|
11
|
%
|
(35
|
)
|
25
|
%
|
(17
|
)
|
(1
|
)%
|
|||||||||
|
Domestic production activity deductions
|
—
|
|
—
|
%
|
(52
|
)
|
39
|
%
|
(62
|
)
|
(4
|
)%
|
|||||||||
|
Change in uncertain tax positions
|
37
|
|
3
|
%
|
60
|
|
(44
|
)%
|
8
|
|
—
|
%
|
|||||||||
|
Preferred stock modification
|
—
|
|
—
|
%
|
12
|
|
(9
|
)%
|
—
|
|
—
|
%
|
|||||||||
|
Goodwill impairment
|
—
|
|
—
|
%
|
458
|
|
(334
|
)%
|
—
|
|
—
|
%
|
|||||||||
|
Renewable energy investments tax credits (See Note 4)
|
(12
|
)
|
(1
|
)%
|
(195
|
)
|
142
|
%
|
(17
|
)
|
(1
|
)%
|
|||||||||
|
Noncontrolling interest adjustment
|
(18
|
)
|
(2
|
)%
|
—
|
|
—
|
%
|
—
|
|
—
|
%
|
|||||||||
|
U.S. Legislative Changes
|
(19
|
)
|
(2
|
)%
|
(43
|
)
|
32
|
%
|
—
|
|
—
|
%
|
|||||||||
|
Non-deductible compensation
|
20
|
|
2
|
%
|
—
|
|
|
—
|
%
|
—
|
|
—
|
%
|
||||||||
|
Other, net
|
(3
|
)
|
—
|
%
|
(4
|
)
|
4
|
%
|
(8
|
)
|
—
|
%
|
|||||||||
|
Income tax expense
|
$
|
341
|
|
33
|
%
|
$
|
176
|
|
(128
|
)%
|
$
|
453
|
|
27
|
%
|
||||||
Income tax expense was
$341 million
and
$176 million
, and our effective tax rate was
33%
and
(128)%
for
2018
and
2017
, respectively.
During 2018, the increase in the income tax expense was primarily attributable to an increase in income, a reduction in benefits from investment tax credits from our renewable energy investments, the effect of foreign operations, which included establishment of valuation allowances and write-offs of deferred tax assets, and elimination of the domestic production activity deduction, partially offset by the lower U.S. Federal statutory income tax rate, a decrease in expense for uncertain tax positions, and a tax benefit from TCJA rate change on the deferred tax liability recomputation as a result of U.S. legislative changes that extended the accelerated deduction of qualified film productions.
137
DISCOVERY, INC.
NOTES TO CONSOLIDATED FINANCIAL STATEMENTS
Income tax expense was
$176 million
and
$453 million
and our effective tax rate was
(128)%
and
27%
for 2017 and 2016, respectively. During 2017, the decrease in the effective tax rate was primarily attributable to the impact of a goodwill impairment charge that is non-deductible for tax purposes. Thereafter, the decrease in the effective tax rate was primarily due to investment tax credits that the Company received related to its renewable energy investments, and to a lesser extent, the domestic production activity deduction benefit, the allocation and taxation of income among multiple foreign and domestic jurisdictions, and the impact of the TCJA. The benefits were partially offset by an increase in reserves for uncertain tax positions in 2017. In 2016, the Company favorably resolved multi-year state tax positions that resulted in a reduction of reserves related to uncertain tax positions that did not recur in 2017.
Components of deferred income tax assets and liabilities were as follows (in millions).
|
|
December 31,
|
|||||||
|
|
2018
|
2017
|
||||||
|
Deferred income tax assets:
|
||||||||
|
Accounts receivable
|
$
|
11
|
|
$
|
5
|
|
||
|
Tax attribute carry-forward
|
321
|
|
151
|
|
||||
|
Accrued liabilities and other
|
302
|
|
190
|
|
||||
|
Total deferred income tax assets
|
634
|
|
346
|
|
||||
|
Valuation allowance
|
(336
|
)
|
(105
|
)
|
||||
|
Net deferred income tax assets
|
298
|
|
241
|
|
||||
|
Deferred income tax liabilities:
|
||||||||
|
Intangible assets
|
(1,418
|
)
|
(315
|
)
|
||||
|
Content rights
|
(107
|
)
|
(82
|
)
|
||||
|
Equity method investments in partnerships
|
(488
|
)
|
(68
|
)
|
||||
|
Other
|
(15
|
)
|
(31
|
)
|
||||
|
Total deferred income tax liabilities
|
(2,028
|
)
|
(496
|
)
|
||||
|
Net deferred income tax liabilities
|
$
|
(1,730
|
)
|
$
|
(255
|
)
|
||
The Company’s net deferred income tax assets and liabilities were reported on the consolidated balance sheets as follows (in millions).
|
|
December 31,
|
|||||||
|
|
2018
|
2017
|
||||||
|
Noncurrent deferred income tax assets (included within other noncurrent assets)
|
$
|
81
|
|
$
|
64
|
|
||
|
Deferred income tax liabilities (classified on the balance sheet)
|
(1,811
|
)
|
(319
|
)
|
||||
|
Net deferred income tax liabilities
|
$
|
(1,730
|
)
|
$
|
(255
|
)
|
||
The Company’s loss carry-forwards were reported on the consolidated balance sheets as follows (in millions).
|
State
|
Foreign
|
|||||||
|
Loss carry-forwards
|
$
|
322
|
|
$
|
1,727
|
|
||
|
Deferred tax asset related to loss carry-forwards
|
16
|
|
249
|
|
||||
|
Valuation allowance against loss carry-forwards
|
(17
|
)
|
(201
|
)
|
||||
|
Earliest expiration date of loss carry-forwards
|
2019
|
|
2019
|
|
||||
138
DISCOVERY, INC.
NOTES TO CONSOLIDATED FINANCIAL STATEMENTS
A reconciliation of the beginning and ending amounts of unrecognized tax benefits (without related interest and penalty amounts) is as follows (in millions).
|
|
Year Ended December 31,
|
|||||||||||
|
|
2018
|
2017
|
2016
|
|||||||||
|
Beginning balance
|
$
|
189
|
|
$
|
117
|
|
$
|
173
|
|
|||
|
Additions based on tax positions related to the current year
|
43
|
|
27
|
|
13
|
|
||||||
|
Additions for tax positions of prior years
|
52
|
|
57
|
|
19
|
|
||||||
|
Additions for tax positions acquired in business combinations
|
169
|
|
—
|
|
—
|
|
||||||
|
Reductions for tax positions of prior years
|
(9
|
)
|
—
|
|
(60
|
)
|
||||||
|
Settlements
|
(6
|
)
|
(8
|
)
|
(16
|
)
|
||||||
|
Reductions due to lapse of statutes of limitations
|
(52
|
)
|
(6
|
)
|
(9
|
)
|
||||||
|
(Reductions) additions due to foreign currency exchange rates
|
(8
|
)
|
2
|
|
(3
|
)
|
||||||
|
Ending balance
|
$
|
378
|
|
$
|
189
|
|
$
|
117
|
|
|||
The balances as of
December 31, 2018
,
2017
and
2016
included
$378 million
,
$189 million
and
$117 million
, respectively, of unrecognized tax benefits that, if recognized, would reduce the Company’s income tax expense and effective tax rate after giving effect to interest deductions and offsetting benefits from other tax jurisdictions. For the
year ended December 31, 2018
, increases in unrecognized tax benefits related to the uncertainty of allocation and taxation of income among multiple jurisdictions was offset by the movements of tax positions as a result of multiple audit resolutions and lapse of statutes of limitations. The uncertain tax positions balance as of
December 31, 2018
includes tax additions of
$169 million
(prior to current year activity) related to Scripps Networks upon the acquisition
The Company and its subsidiaries file income tax returns in the U.S. and various state and foreign jurisdictions. The Internal Revenue Service recently completed audit procedures for its
2008
to
2011
tax years, the results of which should be finalized in the coming year. The Company is currently under audit by the Internal Revenue Service for its
2012
to
2014
consolidated federal income tax returns. It is difficult to predict the final outcome or timing of resolution of any particular tax matter. Accordingly, an estimate of any related impact to the reserve for uncertain tax positions cannot currently be determined. With few exceptions, the Company is no longer subject to audit by any jurisdiction for years prior to
2006
. Adjustments that arose from the completion of audi
ts for certain tax years have been included in the change in uncertain tax positions in the table above.
It is reasonably possible that the total amount of unrecognized tax benefits related to certain of the Company's uncertain tax positions could decrease by as much as
$101 million
within the next twelve months as a result of ongoing audits, foreign judicial proceedings, lapses of statutes of limitations or regulatory developments.
As of
December 31, 2018
,
2017
and
2016
, the Company had accrued approximately
$51 million
,
$21 million
and
$11 million
, respectively, of total interest and penalties payable related to unrecognized tax benefits. The Company recognizes interest and penalties related to unrecognized tax benefits as a component of income tax expense.
In connection with the acquisition of Scripps Networks, the Company recorded reserves in purchase accounting totaling
$110 million
for foreign tax matters claimed by tax authorities that are currently pending resolution. After the purchase accounting measurement period closes on March 5, 2019, any adjustment to these estimated amounts resulting from their resolution will affect net income in the period resolved.
NOTE 19. EARNINGS PER SHARE
In calculating earnings per share, the Company follows the two-class method, which distinguishes between classes of securities based on the proportionate participation rights of each security type in the Company's undistributed income (loss). The Company's Series A, B and C common stock and the Series C-1 convertible preferred stock are treated as one class for purposes of applying the two-class method, because they have substantially equal rights and share equally on an as converted basis with respect to income (loss) available to Discovery, Inc. The Company's Series A-1 convertible preferred stock is treated as a separate class for purposes of applying the two-class method.
139
DISCOVERY, INC.
NOTES TO CONSOLIDATED FINANCIAL STATEMENTS
The table below sets forth the computation for income (loss) available to Discovery, Inc. stockholders (in millions).
|
Year Ended December 31,
|
||||||||||||
|
2018
|
2017
|
2016
|
||||||||||
|
Numerator:
|
||||||||||||
|
Net income (loss)
|
$
|
681
|
|
$
|
(313
|
)
|
$
|
1,218
|
|
|||
|
Less:
|
||||||||||||
|
Allocation of undistributed income to Series A-1 convertible preferred stock
|
(60
|
)
|
41
|
|
(139
|
)
|
||||||
|
Net income attributable to noncontrolling interests
|
(67
|
)
|
—
|
|
(1
|
)
|
||||||
|
Net income attributable to redeemable noncontrolling interests
|
(20
|
)
|
(24
|
)
|
(23
|
)
|
||||||
|
Redeemable noncontrolling interest adjustments to redemption value
|
(5
|
)
|
—
|
|
—
|
|
||||||
|
Net income (loss) available to Discovery, Inc. Series A, B and C common and Series C-1 convertible preferred stockholders for basic net income per share
|
$
|
529
|
|
$
|
(296
|
)
|
$
|
1,055
|
|
|||
|
Allocation of net income (loss) available to Discovery, Inc. Series A, B and C common stockholders and Series C-1 convertible preferred stockholders for basic net income per share:
|
||||||||||||
|
Series A, B and C common stockholders
|
429
|
|
(225
|
)
|
789
|
|
||||||
|
Series C-1 convertible preferred stockholders
|
100
|
|
(71
|
)
|
266
|
|
||||||
|
Total
|
529
|
|
(296
|
)
|
1,055
|
|
||||||
|
Add:
|
||||||||||||
|
Allocation of undistributed income to Series A-1 convertible preferred stockholders
|
60
|
|
(41
|
)
|
139
|
|
||||||
|
Net income (loss) available to Discovery, Inc. Series A, B and C common stockholders for diluted net income per share
|
$
|
589
|
|
$
|
(337
|
)
|
$
|
1,194
|
|
|||
Net income (loss) allocated to Discovery, Inc. Series C-1 convertible preferred stockholders for diluted net income (loss) per share is included in net income (loss) allocated to Discovery, Inc. Series A, B and C common stockholders for diluted net income (loss) per share. For the
year ended December 31, 2018
, net income allocated to Discovery, Inc. Series C-1 convertible preferred stockholders used to calculate diluted income per share was
$100 million
. For the years ended
years ended December 31, 2017 and December 31, 2016
, net (loss) income allocated to Discovery, Inc. Series C-1 convertible preferred stockholders used to calculate diluted net (loss) income per share were
$(71) million
and
$265 million
, respectively.
The table below sets forth the weighted average number of shares outstanding utilized in determining the denominator for basic and diluted earnings per share (in millions).
|
Year Ended December 31,
|
|||||||||
|
2018
|
2017
|
2016
|
|||||||
|
Denominator — weighted average:
|
|||||||||
|
Series A, B and C common shares outstanding — basic
|
498
|
|
384
|
|
401
|
|
|||
|
Impact of assumed preferred stock conversion
|
187
|
|
192
|
|
206
|
|
|||
|
Dilutive effect of share-based awards
|
3
|
|
—
|
|
3
|
|
|||
|
Series A, B and C common shares outstanding — diluted
|
688
|
|
576
|
|
610
|
|
|||
|
Series C-1 convertible preferred stock outstanding — basic and diluted
|
6
|
|
6
|
|
7
|
|
|||
The weighted average number of diluted shares outstanding adjusts the weighted average number of shares of Series A, B and C common stock outstanding for the potential dilution that would occur if common stock equivalents, including convertible preferred stock and share-based awards, were converted into common stock or exercised, calculated using the treasury stock method. Series A, B and C diluted common stock includes the impact of the conversion of Series A-1 preferred stock, the impact of the conversion of Series C-1 preferred stock, and the impact of share-based compensation to the extent it is not anti-dilutive. For
2017
, the weighted average number of shares outstanding for the computation of diluted loss per share does not include
2 million
of share-based awards, as the effects of these potentially outstanding shares would have been anti-dilutive.
140
DISCOVERY, INC.
NOTES TO CONSOLIDATED FINANCIAL STATEMENTS
The table below sets forth the Company's calculated earnings (loss) per share.
|
Year Ended December 31,
|
||||||||||||
|
2018
|
2017
|
2016
|
||||||||||
|
Basic net income (loss) per share available to Discovery, Inc. Series A, B and C common and Series C-1 convertible preferred stockholders:
|
||||||||||||
|
Series A, B and C common stockholders
|
$
|
0.86
|
|
$
|
(0.59
|
)
|
$
|
1.97
|
|
|||
|
Series C-1 convertible preferred stockholders
|
$
|
16.65
|
|
$
|
(11.33
|
)
|
$
|
38.07
|
|
|||
|
Diluted net income (loss) per share available to Discovery, Inc. Series A, B and C common and Series C-1 convertible preferred stockholders:
|
||||||||||||
|
Series A, B and C common stockholders
|
$
|
0.86
|
|
$
|
(0.59
|
)
|
$
|
1.96
|
|
|||
|
Series C-1 convertible preferred stockholders
|
$
|
16.58
|
|
$
|
(11.33
|
)
|
$
|
37.88
|
|
|||
Earnings (loss) per share amounts may not recalculate due to rounding. The computation of the diluted earnings (loss) per share of Series A, B and C common stockholders assumes the conversion of Series A-1 and C-1 convertible preferred stock, while the diluted earnings per share amounts of Series C-1 convertible preferred stock does not assume conversion of those shares.
The table below presents the details of share-based awards that were excluded from the calculation of diluted earnings per share (in millions).
|
Year Ended December 31,
|
|||||||||
|
2018
|
2017
|
2016
|
|||||||
|
Anti-dilutive share-based awards
|
15
|
|
19
|
|
8
|
|
|||
|
PRSUs whose performance targets have not yet been achieved
|
1
|
|
2
|
|
4
|
|
|||
|
Anti-dilutive common stock repurchase contracts
|
—
|
|
—
|
|
2
|
|
|||
Only outstanding PRSUs whose performance targets have been achieved as of the last day of the most recent period are included in the dilutive effect calculation.
Pursuant to the Exchange Agreement with Advance/Newhouse on July 30, 2017, Discovery issued newly designated shares of Series A-1 and Series C-1 preferred stock in exchange for all outstanding shares of Discovery's Series A and Series C convertible participating preferred stock. (See Note 12). The Exchange was treated as a reverse stock split and the Company has recast historical basic and diluted earnings per share available to Series C-1 preferred stockholders (previously Series C preferred stockholders). Prior to the Exchange, Series C convertible preferred stock was convertible into Series C common stock at a conversion rate of
2.0
shares of Series C common stock for each share of Series C convertible preferred stock. Following the exchange, the Series C-1 preferred stock may be converted into Series C common stock at a conversion rate of
19.3648
shares of Series C common stock for each share of Series C-1 preferred stock. As such, the Company has retrospectively restated basic and diluted earnings per share information for Discovery's Series C preferred stock for the
year ended December 31, 2016
in order to conform with earnings per share that would have been available for Series C-1 preferred stock. The Exchange did not impact historical basic and diluted earnings per share attributable to the Company's Series A, B and C common stockholders.
141
DISCOVERY, INC.
NOTES TO CONSOLIDATED FINANCIAL STATEMENTS
The table below sets forth the impact of the preferred stock modification to the Company's calculated basic earnings per share:
|
Year Ended December 31,
|
||||
|
2016
|
||||
|
Pre-Exchange: Basic net income per share available to:
|
||||
|
Series A, B and C common stockholders
|
$
|
1.97
|
|
|
|
Series C-1 convertible preferred stockholders
|
$
|
3.94
|
|
|
|
Post-Exchange: Basic net income per share available to:
|
||||
|
Series A, B and C common stockholders
|
$
|
1.97
|
|
|
|
Series C-1 convertible preferred stockholders
|
$
|
38.07
|
|
|
NOTE 20. SUPPLEMENTAL DISCLOSURES
Valuation and Qualifying Accounts
Changes in valuation and qualifying accounts consisted of the following (in millions):
|
Beginning
of Year
|
Additions
|
Write-offs
|
End
of Year
|
|||||||||||||
|
2018
|
||||||||||||||||
|
Allowance for doubtful accounts
|
$
|
55
|
|
$
|
6
|
|
$
|
(15
|
)
|
$
|
46
|
|
||||
|
Deferred tax valuation allowance
(a)
|
105
|
|
283
|
|
(52
|
)
|
336
|
|
||||||||
|
2017
|
||||||||||||||||
|
Allowance for doubtful accounts
|
47
|
|
12
|
|
(4
|
)
|
55
|
|
||||||||
|
Deferred tax valuation allowance
|
25
|
|
84
|
|
(4
|
)
|
105
|
|
||||||||
|
2016
|
||||||||||||||||
|
Allowance for doubtful accounts
|
40
|
|
13
|
|
(6
|
)
|
47
|
|
||||||||
|
Deferred tax valuation allowance
|
19
|
|
9
|
|
(3
|
)
|
25
|
|
||||||||
(a) Additions to the valuation allowance for deferred tax assets of
$195 million
relate to balances acquired through acquisitions in the current year, with the remainder charged to income tax expense.
Accrued Liabilities
Accrued liabilities consisted of the following (in millions):
|
December 31,
|
|||||||
|
2018
|
2017
|
||||||
|
Accrued payroll and related benefits
|
$
|
484
|
|
$
|
535
|
|
|
|
Content rights payable
|
384
|
|
219
|
|
|||
|
Accrued interest
|
154
|
|
148
|
|
|||
|
Other accrued liabilities
|
541
|
|
407
|
|
|||
|
Total accrued liabilities
|
$
|
1,563
|
|
$
|
1,309
|
|
|
142
DISCOVERY, INC.
NOTES TO CONSOLIDATED FINANCIAL STATEMENTS
Other Expense, net
Other (expense) income, net
, consisted of the following (in millions):
|
|
Year Ended December 31,
|
|||||||||||
|
|
2018
|
2017
|
2016
|
|||||||||
|
Foreign currency (losses) gains, net
|
$
|
(93
|
)
|
$
|
(83
|
)
|
$
|
75
|
|
|||
|
Gains (losses) on derivative instruments
|
50
|
|
(82
|
)
|
(12
|
)
|
||||||
|
Remeasurement gain on previously held equity interest
|
—
|
|
33
|
|
—
|
|
||||||
|
Change in the value of common stock investments with readily determinable fair value
(a)
|
(88
|
)
|
—
|
|
—
|
|
||||||
|
Interest income
(b)
|
15
|
|
21
|
|
—
|
|
||||||
|
Other-than-temporary impairment of AFS investments
|
—
|
|
—
|
|
(62
|
)
|
||||||
|
Other (expense) income, net
|
(4
|
)
|
1
|
|
3
|
|
||||||
|
Total other (expense) income, net
|
$
|
(120
|
)
|
$
|
(110
|
)
|
$
|
4
|
|
|||
(a)
As of
January 1, 2018
, upon adoption of ASU 2016-01, equity investments with readily determinable fair value for which the Company has the intent to retain the investment are measured at fair value, with unrealized gains and losses recorded in other expense, net. (See Notes 2 and 4).
(b)
Interest income for the
years ended December 31, 2018 and 2017
is comprised primarily of interest on proceeds from the issuance of senior notes used to fund the acquisition of Scripps Networks. As of
December 31, 2018
, the Company had liquidated and utilized the proceeds in the acquisition of Scripps Networks.
Share-Based Plan Proceeds, Net
Share-based plan proceeds, net in the statement of cash flows consisted of the following (in millions):
(a)
|
Year Ended December 31,
|
||||||||||||
|
2018
|
2017
|
2016
|
||||||||||
|
Tax settlements associated with share-based plans
|
$
|
(18
|
)
|
$
|
(30
|
)
|
$
|
(11
|
)
|
|||
|
Proceeds from issuance of common stock in connection with share-based plans
|
72
|
|
46
|
|
50
|
|
||||||
|
Total share-based plan proceeds, net
|
$
|
54
|
|
$
|
16
|
|
$
|
39
|
|
|||
(a)
Share-based plan payments, net includes the retrospective reclassification of windfall tax benefits or deficiencies from financing activities or operating activities in the statement of cash flows presentation pursuant to the adoption of the guidance on share-based payments on
January 1, 2017
. There were
$7 million
in net windfall tax adjustments for the year ended
December 31, 2016
reclassified from financing activities to operating activities. (See Note 2).
143
DISCOVERY, INC.
NOTES TO CONSOLIDATED FINANCIAL STATEMENTS
Supplemental Cash Flow Information
|
|
Year Ended December 31,
|
|||||||||||
|
|
2018
|
2017
|
2016
|
|||||||||
|
Cash paid for taxes, net
(a)
|
$
|
389
|
|
$
|
274
|
|
$
|
527
|
|
|||
|
Cash paid for interest
|
740
|
|
357
|
|
343
|
|
||||||
|
Non-cash investing and financing activities:
|
||||||||||||
|
Fair value of assets and liabilities of business received in exchange for redeemable noncontrolling interests
(b)
|
—
|
|
144
|
|
—
|
|
||||||
|
Fair value of investment received, net of cash paid
|
—
|
|
—
|
|
82
|
|
||||||
|
Net asset value of contributed business
|
—
|
|
—
|
|
32
|
|
||||||
|
Equity issued for the acquisition of Scripps Networks
|
3,218
|
|
—
|
|
—
|
|
||||||
|
Accrued purchases of property and equipment
|
39
|
|
24
|
|
42
|
|
||||||
|
Assets acquired under capital lease arrangements
|
58
|
|
103
|
|
37
|
|
||||||
(a)
The increase in cash paid for taxes, net, between 2017 and 2018 is mostly due to non-recurring tax benefits from the Company's investments in limited liability companies that sponsor renewable energy projects in 2017 (See Note 4), partially offset by the lower tax rate enacted as part of the TCJA, in addition to higher foreign tax payments, and a decrease in refunds.
(b)
Amount relates to the Company's MTG joint venture. (See Note 3.) The joint venture was affected via DCL's contribution of the Velocity network to a newly formed entity, MTG, which is a non-guarantor subsidiary of the Company and is reflected as a non-cash contribution in the condensed consolidating financial statements. (See Note 25.)
The table above does not include the
November 30, 2017
, acquisition of a controlling interest in OWN from Harpo. The Company increased its ownership stake from
49.50%
to
73.75%
. Upon consolidation, a cash payment for a portion of this business resulted in inclusion of the fair value of all of the net assets and liabilities of OWN in Discovery's consolidated financial statements. (See Note 3.)
NOTE 21. RELATED PARTY TRANSACTIONS
In the normal course of business, the Company enters into transactions with related parties. Related parties include entities that share common directorship, such as Liberty Global plc (“Liberty Global”), Liberty Broadband Corporation ("Liberty Broadband") and their subsidiaries and equity method investees (together the “Liberty Group”). Discovery’s Board of Directors includes Mr. Malone, who is Chairman of the Board of Liberty Global and beneficially owns approximately
28%
of the aggregate voting power with respect to the election of directors of Liberty Global. Mr. Malone is also Chairman of the Board of Liberty Broadband and beneficially owns approximately
46%
of the aggregate voting power with respect to the election of directors of Liberty Broadband. The majority of the revenue earned from the Liberty Group relates to multi-year network distribution arrangements. Related party transactions also include revenues and expenses for content and services provided to or acquired from equity method investees, such as All3Media, UKTV, nC+ and a Russian cable television business, or minority partners of consolidated subsidiaries, such as Hasbro and the Tribune Company.
The table below presents a summary of the transactions with related parties, including OWN, prior to the November 30, 2017 acquisition (in millions).
|
Year Ended December 31,
|
||||||||||||
|
2018
|
2017
|
2016
|
||||||||||
|
Revenues and service charges:
|
||||||||||||
|
Liberty Group
|
$
|
627
|
|
$
|
476
|
|
$
|
387
|
|
|||
|
Equity method investees
|
289
|
|
145
|
|
129
|
|
||||||
|
Other
|
69
|
|
46
|
|
32
|
|
||||||
|
Total revenues and service charges
|
$
|
985
|
|
$
|
667
|
|
$
|
548
|
|
|||
|
Interest income
|
$
|
4
|
|
$
|
13
|
|
$
|
17
|
|
|||
|
Expenses
|
$
|
(321
|
)
|
$
|
(178
|
)
|
$
|
(102
|
)
|
|||
144
DISCOVERY, INC.
NOTES TO CONSOLIDATED FINANCIAL STATEMENTS
The table below presents receivables due from related parties (in millions).
|
December 31,
|
||||||||
|
2018
|
2017
|
|||||||
|
Receivables
|
$
|
167
|
|
$
|
105
|
|
||
|
Note receivable (See Note 4.)
(a)
|
94
|
|
—
|
|
||||
(a)
Amount relates to a note receivable with UKTV, an equity method investee acquired in conjunction with the acquisition of Scripps Networks. (See Note 4.)
NOTE 22. COMMITMENTS AND CONTINGENCIES
Contractual Commitments
The Company’s undiscounted contractual commitments increased significantly following the acquisition of Scripps Networks. As of
December 31, 2018
, the Company’s significant contractual commitments, including related payments due by period, were as follows (in millions).
|
Leases
|
||||||||||||||||||||
|
Year Ending December 31,
|
Operating
|
Capital
|
Content
|
Other
|
Total
|
|||||||||||||||
|
2019
|
$
|
89
|
|
$
|
51
|
|
$
|
1,431
|
|
$
|
523
|
|
$
|
2,094
|
|
|||||
|
2020
|
90
|
|
46
|
|
960
|
|
352
|
|
1,448
|
|
||||||||||
|
2021
|
92
|
|
41
|
|
510
|
|
200
|
|
843
|
|
||||||||||
|
2022
|
58
|
|
34
|
|
554
|
|
123
|
|
769
|
|
||||||||||
|
2023
|
51
|
|
41
|
|
418
|
|
76
|
|
586
|
|
||||||||||
|
Thereafter
|
564
|
|
73
|
|
2,139
|
|
89
|
|
2,865
|
|
||||||||||
|
Total minimum payments
|
944
|
|
286
|
|
6,012
|
|
1,363
|
|
8,605
|
|
||||||||||
|
Amounts representing interest
|
—
|
|
(34
|
)
|
—
|
|
—
|
|
(34
|
)
|
||||||||||
|
Total
|
$
|
944
|
|
$
|
252
|
|
$
|
6,012
|
|
$
|
1,363
|
|
$
|
8,571
|
|
|||||
The Company enters into multi-year lease arrangements for transponders, office space, studio facilities, and other equipment. Most leases are not cancelable prior to their expiration. On
January 9, 2018
, the Company announced plans to relocate its global headquarters from Silver Spring, Maryland (the "Silver Spring property") to New York City in
2019
. Included in the table above are the undiscounted future lease payments for the New York City headquarters totaling approximately
$535 million
. Portions of the lease are expected to commence on various dates throughout 2019 as each floor becomes available for use by the Company. During the third quarter, the Company entered into a sale-lease back transaction for the Silver Spring property. The lease is classified as an operating lease. As a result of the sale, the Company received net proceeds of
$68 million
and recognized an impairment loss of
$12 million
for the
year ended December 31, 2018
which is reflected in depreciation and amortization on the consolidated statements of operations.
Content purchase commitments are associated with third-party producers and sports associations for content that airs on the television networks. Production contracts generally require the purchase of a specified number of episodes with payments over the term of the license. Production contracts include both programs that have been delivered and are available for airing and programs that have not yet been produced or sporting events that have not yet taken place. If the content is ultimately never produced, the Company's commitments expire without obligation. The commitments disclosed above exclude content liabilities recognized on the consolidated balance sheet.
Other purchase obligations include agreements with certain vendors and suppliers for the purchase of goods and services whereby the underlying agreements are enforceable, legally binding and specify all significant terms. Significant purchase obligations include transmission services, television rating services, marketing research, employment contracts, equipment purchases, and information technology services. Some of these contracts do not require the purchase of fixed or minimum quantities and generally may be terminated with a
30-day
to
60-day
advance notice without penalty, and are not included in the table above past the
30-day
to
60-day
advance notice period. Amounts related to employment contracts include base compensation, but do not include compensation contingent on future events.
Although the Company had funding commitments to equity method investees as of
December 31, 2018
, the Company may also provide uncommitted additional funding to its equity method investments in the future. (See Note 4.)
145
DISCOVERY, INC.
NOTES TO CONSOLIDATED FINANCIAL STATEMENTS
Contingencies
Put Rights
The Company has granted put rights to certain consolidated subsidiaries. Harpo, GoldenTree, Hasbro and J:COM have the right to require the Company to purchase their remaining noncontrolling interests in OWN, MTG, Discovery Family and Discovery Japan, respectively. The Company recorded the carrying value of the noncontrolling interest in the equity associated with the put rights for OWN, MTG, Discovery Family and Discovery Japan as a component of redeemable noncontrolling interest in the amounts of
$58 million
,
$121 million
,
$206 million
and
$30 million
, respectively. (See Note 11.)
Legal Matters
The Company is party to various other lawsuits and claims in the ordinary course of business, including claims related to employees, vendors, other business partners or patent issues. However, a determination as to the amount of the accrual required for such contingencies is highly subjective and requires judgment about future events. Although the outcome of these matters cannot be predicted with certainty and the impact of the final resolution of these matters on the Company's results of operations in a particular subsequent reporting period is not known, management does not believe that the resolution of these other matters will have a material adverse effect on the Company's consolidated financial position, future results of operations or cash flows.
During the quarter ended June 30, 2018, the Company received written notification from tax authorities of an indirect tax claim stemming from an audit that commenced in 2017. A liability of
$40 million
has been recorded as a measurement period adjustment to the provisional Scripps Networks purchase accounting. The Company intends to defend the matter vigorously and believes that the potential for material loss beyond the amount already provided is remote.
Guarantees
There were no guarantees recorded as of
December 31, 2018
and
December 31, 2017
.
The Company may provide or receive indemnities intended to allocate business transaction risks. Similarly, the Company may remain contingently liable for certain obligations of a divested business in the event that a third party does not fulfill its obligations under an indemnification obligation. The Company records a liability for its indemnification obligations and other contingent liabilities when probable and estimable. There were
no
material amounts for indemnifications or other contingencies recorded as of
December 31, 2018
and
2017
.
NOTE 23. REPORTABLE SEGMENTS
The Company’s operating segments are determined based on (i) financial information reviewed by its chief operating decision maker ("CODM"), the Chief Executive Officer ("CEO"), (ii) internal management and related reporting structure, and (iii) the basis upon which the CEO makes resource allocation decisions. The Company's operating segments did not change as a result of the acquisition of Scripps Networks.
The accounting policies of the reportable segments are the same as the Company’s, except that certain inter-segment transactions that are eliminated for consolidation are not eliminated at the segment level. Inter-segment transactions primarily include advertising and content purchases.
The Company evaluates the operating performance of its segments based on financial measures such as revenues and adjusted operating income before depreciation and amortization (“Adjusted OIBDA”). Adjusted OIBDA is defined as operating income excluding: (i) mark-to-market share-based compensation, (ii) depreciation and amortization, (iii) restructuring and other charges, (iv) certain impairment charges, (v) gains and losses on business and asset dispositions, (vi) certain inter-segment eliminations related to production studios, and (vii) third-party transaction costs directly related to the acquisition and integration of Scripps Networks. The Company uses this measure to assess the operating results and performance of its segments, perform analytical comparisons, identify strategies to improve performance and allocate resources to each segment. The Company believes Adjusted OIBDA is relevant to investors because it allows them to analyze the operating performance of each segment using the same metric management uses. The Company excludes mark-to-market share-based compensation, restructuring and other charges, certain impairment charges, gains and losses on business and asset dispositions and Scripps Networks transaction and integration costs from the calculation of Adjusted OIBDA due to their impact on comparability between periods. The Company also excludes depreciation of fixed assets and amortization of intangible assets, as these amounts do not represent cash payments in the current reporting period. Certain corporate expenses are excluded from segment results to enable executive management to evaluate segment performance based upon the decisions of segment executives. Total Adjusted OIBDA should be considered in addition to, but not a substitute for, operating income, net income and other measures of financial performance reported in accordance with GAAP. The tables below present summarized financial information for each of the Company’s reportable segments, education and other, and corporate and inter-segment eliminations (in millions).
146
DISCOVERY, INC.
NOTES TO CONSOLIDATED FINANCIAL STATEMENTS
Revenues
|
|
Year Ended December 31,
|
|||||||||||
|
|
2018
|
2017
|
2016
|
|||||||||
|
U.S. Networks
|
$
|
6,350
|
|
$
|
3,434
|
|
$
|
3,285
|
|
|||
|
International Networks
|
4,149
|
|
3,281
|
|
3,040
|
|
||||||
|
Education and Other
|
54
|
|
158
|
|
174
|
|
||||||
|
Corporate and inter-segment eliminations
|
—
|
|
—
|
|
(2
|
)
|
||||||
|
Total revenues
|
$
|
10,553
|
|
$
|
6,873
|
|
$
|
6,497
|
|
|||
Adjusted OIBDA
|
|
Year Ended December 31,
|
|||||||||||
|
|
2018
|
2017
|
2016
|
|||||||||
|
U.S. Networks
|
$
|
3,500
|
|
$
|
2,026
|
|
$
|
1,922
|
|
|||
|
International Networks
|
1,077
|
|
859
|
|
835
|
|
||||||
|
Education and Other
|
3
|
|
6
|
|
(10
|
)
|
||||||
|
Corporate and inter-segment eliminations
|
(441
|
)
|
(360
|
)
|
(334
|
)
|
||||||
|
Total Adjusted OIBDA
|
$
|
4,139
|
|
$
|
2,531
|
|
$
|
2,413
|
|
|||
Reconciliation of Net Income (Loss) Available to Discovery, Inc. to Total Adjusted OIBDA
|
|
Year Ended December 31,
|
|||||||||||
|
|
2018
|
2017
|
2016
|
|||||||||
|
Net income (loss) available to Discovery, Inc.
|
$
|
594
|
|
$
|
(337
|
)
|
$
|
1,194
|
|
|||
|
Net income attributable to redeemable noncontrolling interests
|
20
|
|
24
|
|
23
|
|
||||||
|
Net income attributable to noncontrolling interests
|
67
|
|
—
|
|
1
|
|
||||||
|
Income tax expense
|
341
|
|
176
|
|
453
|
|
||||||
|
Income (loss) before income taxes
|
1,022
|
|
(137
|
)
|
1,671
|
|
||||||
|
Other expense (income), net
|
120
|
|
110
|
|
(4
|
)
|
||||||
|
Loss from equity investees, net
|
63
|
|
211
|
|
38
|
|
||||||
|
Loss on extinguishment of debt
|
—
|
|
54
|
|
—
|
|
||||||
|
Interest expense, net
|
729
|
|
475
|
|
353
|
|
||||||
|
Operating income
|
1,934
|
|
713
|
|
2,058
|
|
||||||
|
(Gain) loss on disposition
|
(84
|
)
|
4
|
|
(63
|
)
|
||||||
|
Restructuring and other charges
|
750
|
|
75
|
|
58
|
|
||||||
|
Depreciation and amortization
|
1,398
|
|
330
|
|
322
|
|
||||||
|
Impairment of goodwill
|
—
|
|
1,327
|
|
—
|
|
||||||
|
Mark-to-market share-based compensation
|
31
|
|
3
|
|
38
|
|
||||||
|
Scripps Networks transaction and integration costs
|
110
|
|
79
|
|
—
|
|
||||||
|
Total Adjusted OIBDA
|
$
|
4,139
|
|
$
|
2,531
|
|
$
|
2,413
|
|
|||
147
DISCOVERY, INC.
NOTES TO CONSOLIDATED FINANCIAL STATEMENTS
Total Assets
|
|
December 31,
|
|||||||
|
|
2018
|
2017
|
||||||
|
U.S. Networks
|
$
|
18,683
|
|
$
|
4,127
|
|
||
|
International Networks
|
7,208
|
|
5,187
|
|
||||
|
Education and Other
|
227
|
|
394
|
|
||||
|
Corporate and inter-segment eliminations
|
6,432
|
|
12,847
|
|
||||
|
Total assets
|
$
|
32,550
|
|
$
|
22,555
|
|
||
The presentation of segment assets in the table above is consistent with the financial reports that are reviewed by the Company's CEO. Total assets for corporate and inter-segment eliminations include goodwill that is allocated to the Company's segments. The goodwill allocated from corporate assets to U.S. Networks and International Networks is included in the goodwill balances disclosed in Note 8. The goodwill recorded as a result of the acquisition of Scripps Networks is
$6.1 billion
(see Note 3).
Content Amortization and Impairment Expense
|
|
Year Ended December 31,
|
|||||||||||
|
|
2018
|
2017
|
2016
|
|||||||||
|
U.S. Networks
|
$
|
1,702
|
|
$
|
776
|
|
$
|
756
|
|
|||
|
International Networks
|
1,584
|
|
1,126
|
|
1,008
|
|
||||||
|
Education and Other
|
2
|
|
8
|
|
9
|
|
||||||
|
Total content amortization and impairment expense
|
$
|
3,288
|
|
$
|
1,910
|
|
$
|
1,773
|
|
|||
Content amortization and impairment expense are generally included in costs of revenues on the consolidated statements of operations (see Note 6). Content impairments of
$405 million
for the year ended
December 31, 2018
, were due to strategic program changes following the acquisition of Scripps Networks and are reflected in restructuring and other charges as further described in Note 17.
No
content impairments were recorded as a component of restructuring and other during the year ended
December 31, 2017
, and content impairments of $
7 million
were recorded as a component of restructuring and other charges for the year ended
December 31, 2016
.
Revenues by Geography
|
|
Year Ended December 31,
|
|||||||||||
|
|
2018
|
2017
|
2016
|
|||||||||
|
U.S.
|
$
|
6,415
|
|
$
|
3,560
|
|
$
|
3,411
|
|
|||
|
Non-U.S.
|
4,138
|
|
3,313
|
|
3,086
|
|
||||||
|
Total revenues
|
$
|
10,553
|
|
$
|
6,873
|
|
$
|
6,497
|
|
|||
Distribution and advertising revenues are attributed to each country based on viewer location. Other revenues are attributed to each country based on customer location.
Property and Equipment by Geography
|
|
December 31,
|
|||||||
|
|
2018
|
2017
|
||||||
|
U.S.
|
$
|
350
|
|
$
|
309
|
|
||
|
Poland
|
185
|
|
—
|
|
||||
|
U.K.
|
160
|
|
173
|
|
||||
|
Other non-U.S.
|
105
|
|
115
|
|
||||
|
Total property and equipment, net
|
$
|
800
|
|
$
|
597
|
|
||
148
DISCOVERY, INC.
NOTES TO CONSOLIDATED FINANCIAL STATEMENTS
NOTE 24. SELECTED QUARTERLY FINANCIAL DATA (UNAUDITED)
|
|
2018
(a)(e)
|
|||||||||||||||
|
|
1
st
quarter
|
|
2
nd
quarter
|
|
3
rd
quarter
|
|
4
th
quarter
|
|||||||||
|
Revenues
|
$
|
2,307
|
|
$
|
2,845
|
|
$
|
2,592
|
|
$
|
2,809
|
|
||||
|
Operating income
|
204
|
|
650
|
|
369
|
|
711
|
|
||||||||
|
Net income
|
3
|
|
244
|
|
135
|
|
299
|
|
||||||||
|
Net (loss) income available to Discovery, Inc.
|
(8
|
)
|
216
|
|
117
|
|
269
|
|
||||||||
|
Earnings (loss) per share available to Discovery, Inc. Series A, B and C common stockholders:
|
||||||||||||||||
|
Basic
|
$
|
(0.01
|
)
|
$
|
0.30
|
|
$
|
0.16
|
|
$
|
0.38
|
|
||||
|
Diluted
|
$
|
(0.01
|
)
|
$
|
0.30
|
|
$
|
0.16
|
|
$
|
0.38
|
|
||||
|
2017
(b)(c)(d)(e)
|
||||||||||||||||
|
1
st
quarter
|
|
2
nd
quarter
|
|
3
rd
quarter
|
|
4
th
quarter
|
||||||||||
|
Revenues
|
$
|
1,613
|
|
$
|
1,745
|
|
$
|
1,651
|
|
$
|
1,864
|
|
||||
|
Operating income (loss)
|
487
|
|
630
|
|
433
|
|
(837
|
)
|
||||||||
|
Net income (loss)
|
221
|
|
380
|
|
223
|
|
(1,137
|
)
|
||||||||
|
Net income (loss) available to Discovery, Inc.
|
215
|
|
374
|
|
218
|
|
(1,144
|
)
|
||||||||
|
Earnings (loss) per share available to Discovery, Inc. Series A, B and C common stockholders:
|
||||||||||||||||
|
Basic
|
$
|
0.37
|
|
$
|
0.65
|
|
$
|
0.38
|
|
$
|
(1.99
|
)
|
||||
|
Diluted
|
$
|
0.37
|
|
$
|
0.64
|
|
$
|
0.38
|
|
$
|
(1.99
|
)
|
||||
(a)
On
March 6, 2018
, Discovery acquired Scripps Networks pursuant to the Merger Agreement. On
April 30, 2018
, the Company sold an
88%
controlling equity stake in its Education Business to Francisco Partners for a sale price of
$113 million
. The Company recorded a gain of
$84 million
based on net assets disposed of
$44 million
, including
$40 million
of goodwill. (See Note 3.)
(b)
Goodwill impairment expense of
$1.3 billion
was recognized during the fourth quarter of
2017
. (See Note 8.)
(c)
On
September 25, 2017
, the Company acquired a
67.5%
controlling interest in MTG, a new joint venture with GoldenTree, in exchange for its contribution of the MotorTrend (previously known as Velocity). On
November 30, 2017
, the Company acquired a controlling interest in OWN from Harpo, increasing Discovery’s ownership stake from
49.50%
to
73.75%
. Discovery paid
$70 million
in cash and recognized a gain of
$33 million
to account for the difference between the carrying value and the fair value of the previously held
49.50%
equity interest. On
April 28, 2017
, the Company sold Raw and Betty to All3Media and recorded a loss of
$4 million
upon disposition. (See Note 3.) As of
December 31, 2017
, the Company had incurred transaction and integration costs for the Scripps Networks acquisition of
$79 million
, including the
$35 million
charge associated with the modification of Advance/Newhouse's preferred stock. (See Note 12.)
(d)
In
March 2017
, DCL completed a cash tender offer for
$600 million
aggregate principal amount of DCL's
5.050%
senior notes due 2020 and
5.625%
senior notes due 2019. This transaction resulted in a pretax loss on extinguishment of debt of
$54 million
for the year ended
December 31, 2017
, which is presented as a separate line item on the Company's consolidated statements of operations and recognized as a component of financing cash outflows on the consolidated statements of cash flows. The loss included
$50 million
for premiums to par value,
$2 million
of non-cash write-offs of unamortized deferred financing costs,
$1 million
for the write-off of the original issue discount of these senior notes and
$1 million
accrued for other third-party fees. (See Note 9.)
(e)
Earnings (loss) per share amounts may not sum to annual total since each is calculated independently.
149
DISCOVERY, INC.
NOTES TO CONSOLIDATED FINANCIAL STATEMENTS
NOTE 25. CONDENSED CONSOLIDATING FINANCIAL INFORMATION
Overview
As of December 31,
2018
and
2017
, most of the outstanding senior notes have been issued by DCL, a wholly owned subsidiary of the Company, pursuant to one or more Registration Statements on Form S-3 filed with the U.S. Securities and Exchange Commission ("SEC"). (See Note 9.) Each of the Company, DCL and/or Discovery Communications Holding LLC (“DCH”) (collectively the “Issuers”) have the ability to conduct registered offerings of debt securities.
Set forth below are condensed consolidating financial statements presenting the financial position, results of operations and comprehensive income and cash flows of (i) the Company, (ii) Scripps Networks, (iii) DCH, (iv) DCL, (v) the non-guarantor subsidiaries of DCL, (vi) the non-guarantor subsidiaries of Discovery which includes Discovery Holding Company ("DHC") and Scripps Networks on a combined basis, and (vii) reclassifications and eliminations necessary to arrive at the consolidated financial statement balances for the Company. DCL primarily includes the Discovery Channel and TLC networks in the U.S. The non-guarantor subsidiaries of DCL include substantially all of the Company’s other U.S. and international networks, production companies and most of the Company’s websites and digital distribution arrangements. The non-guarantor subsidiaries of DCL are wholly owned subsidiaries of DCL with the exception of certain equity method investments. DCL is a wholly owned subsidiary of DCH. The Company wholly owns DCH through a 33 1/3% direct ownership interest and a 66 2/3% indirect ownership interest through Discovery Holding Company (“DHC”), a wholly owned subsidiary of the Company. DHC is included in the other non-guarantor subsidiaries of the Company along with the operations of Scripps Networks.
On April 3, 2018, the Company completed a non-cash transaction in which
$2.3 billion
aggregate principal amount of Scripps Networks outstanding debt was exchanged for Discovery senior notes (See Note 9). The exchanged Scripps Networks senior notes are fully and unconditionally guaranteed by Scripps Networks and the Company. During the three months ended June 30, 2018, the Company completed a series of senior note guaranty transactions and as a result as of June 30, 2018, the Company and Scripps Networks fully and unconditionally guarantee all of Discovery's senior notes on an unsecured basis, except for the
$243 million
un-exchanged Scripps Networks Senior Notes. (See Note 9.) The condensed consolidated financial statements presented below reflect the addition of Scripps Networks as a guarantor as of December 31, 2018. Prior to the debt exchange and for the quarter ended March 31, 2018, the Company presented Scripps Networks combined with its non-guarantor subsidiaries separately as other non-guarantor subsidiaries of Discovery.
On
September 25, 2017
, the Company acquired a
67.5%
controlling interest in MTG, a new joint venture with GoldenTree, in exchange for its contribution of the Velocity network. The MTG non-cash transaction and all related financial activity is included within the non-guarantor subsidiaries of DCL. (See Note 3.) The Company's
2016
minority investment in Group Nine Media and all related financial activity is included within the DCL issuer entity in the accompanying condensed consolidated financial statements. (See Note 4.)
Basis of Presentation
Solely for purposes of presenting the condensed consolidating financial statements, investments in the Company’s subsidiaries have been accounted for by their respective parent company using the equity method. Accordingly, in the following condensed consolidating financial statements the equity method has been applied to (i) the Company’s interests in DCH, Scripps Networks, and the other non-guarantor subsidiaries of the Company, including the non-guarantor subsidiaries of Scripps Networks, (ii) DCH’s interest in DCL, and (iii) DCL’s interests in the non-guarantor subsidiaries of DCL. Inter-company accounts and transactions have been eliminated to arrive at the consolidated financial statement amounts for the Company. The Company’s accounting bases in all subsidiaries, including goodwill and recognized intangible assets, have been “pushed down” to the applicable subsidiaries.
The operations of certain of the Company’s international subsidiaries are excluded from the Company’s consolidated U.S. income tax return. Tax expense related to permanent differences has been allocated to the entity that created the difference. Tax expense related to temporary differences has been allocated to the entity that created the difference, where identifiable. The remaining temporary differences are allocated to each entity included in the Company’s consolidated U.S. income tax return based on each entity’s relative pretax income. Deferred taxes have been allocated based upon the temporary differences between the carrying amounts of the respective assets and liabilities of the applicable entities.
The condensed consolidating financial statements should be read in conjunction with the consolidated financial statements of the Company.
150
DISCOVERY, INC.
NOTES TO CONSOLIDATED FINANCIAL STATEMENTS
CONDENSED CONSOLIDATING BALANCE SHEET
December 31, 2018
(in millions)
|
Discovery
|
Scripps Inc.
|
DCH
|
DCL
|
Non-Guarantor
Subsidiaries of DCL |
Other Non-
Guarantor Subsidiaries of Discovery |
Reclassifications
and Eliminations |
Discovery and
Subsidiaries |
|||||||||||||||||||||||||
|
ASSETS
|
||||||||||||||||||||||||||||||||
|
Current assets:
|
||||||||||||||||||||||||||||||||
|
Cash and cash equivalents
|
$
|
—
|
|
$
|
315
|
|
$
|
—
|
|
$
|
61
|
|
$
|
475
|
|
$
|
135
|
|
$
|
—
|
|
$
|
986
|
|
||||||||
|
Receivables, net
|
—
|
|
—
|
|
—
|
|
405
|
|
1,305
|
|
910
|
|
—
|
|
2,620
|
|
||||||||||||||||
|
Content rights, net
|
—
|
|
—
|
|
—
|
|
1
|
|
250
|
|
62
|
|
—
|
|
313
|
|
||||||||||||||||
|
Prepaid expenses and other current assets
|
21
|
|
18
|
|
22
|
|
49
|
|
134
|
|
68
|
|
—
|
|
312
|
|
||||||||||||||||
|
Inter-company trade receivables, net
|
—
|
|
—
|
|
—
|
|
151
|
|
—
|
|
—
|
|
(151
|
)
|
—
|
|
||||||||||||||||
|
Total current assets
|
21
|
|
333
|
|
22
|
|
667
|
|
2,164
|
|
1,175
|
|
(151
|
)
|
4,231
|
|
||||||||||||||||
|
Investment in and advances to subsidiaries
|
8,367
|
|
13,248
|
|
—
|
|
6,290
|
|
—
|
|
—
|
|
(27,905
|
)
|
—
|
|
||||||||||||||||
|
Noncurrent content rights, net
|
—
|
|
—
|
|
—
|
|
607
|
|
1,501
|
|
961
|
|
—
|
|
3,069
|
|
||||||||||||||||
|
Goodwill
|
—
|
|
—
|
|
—
|
|
3,678
|
|
3,298
|
|
6,030
|
|
—
|
|
13,006
|
|
||||||||||||||||
|
Intangible assets, net
|
—
|
|
—
|
|
—
|
|
246
|
|
1,261
|
|
8,167
|
|
—
|
|
9,674
|
|
||||||||||||||||
|
Equity method investments, including note receivable
|
—
|
|
94
|
|
—
|
|
23
|
|
291
|
|
527
|
|
—
|
|
935
|
|
||||||||||||||||
|
Other noncurrent assets, including property and equipment, net
|
—
|
|
35
|
|
20
|
|
537
|
|
607
|
|
456
|
|
(20
|
)
|
1,635
|
|
||||||||||||||||
|
Total assets
|
$
|
8,388
|
|
$
|
13,710
|
|
$
|
42
|
|
$
|
12,048
|
|
$
|
9,122
|
|
$
|
17,316
|
|
$
|
(28,076
|
)
|
$
|
32,550
|
|
||||||||
|
LIABILITIES AND EQUITY
|
||||||||||||||||||||||||||||||||
|
Current liabilities:
|
||||||||||||||||||||||||||||||||
|
Current portion of debt
|
$
|
—
|
|
$
|
106
|
|
$
|
—
|
|
$
|
1,709
|
|
$
|
35
|
|
$
|
10
|
|
$
|
—
|
|
$
|
1,860
|
|
||||||||
|
Other current liabilities
|
—
|
|
30
|
|
—
|
|
394
|
|
1,243
|
|
470
|
|
—
|
|
2,137
|
|
||||||||||||||||
|
Inter-company trade payables, net
|
—
|
|
—
|
|
—
|
|
—
|
|
151
|
|
—
|
|
(151
|
)
|
—
|
|
||||||||||||||||
|
Total current liabilities
|
—
|
|
136
|
|
—
|
|
2,103
|
|
1,429
|
|
480
|
|
(151
|
)
|
3,997
|
|
||||||||||||||||
|
Noncurrent portion of debt
|
—
|
|
134
|
|
—
|
|
14,641
|
|
375
|
|
35
|
|
—
|
|
15,185
|
|
||||||||||||||||
|
Negative carrying amount in subsidiaries, net
|
—
|
|
—
|
|
5,183
|
|
—
|
|
—
|
|
3,427
|
|
(8,610
|
)
|
—
|
|
||||||||||||||||
|
Other noncurrent liabilities
|
2
|
|
56
|
|
—
|
|
487
|
|
613
|
|
1,713
|
|
(20
|
)
|
2,851
|
|
||||||||||||||||
|
Total liabilities
|
2
|
|
326
|
|
5,183
|
|
17,231
|
|
2,417
|
|
5,655
|
|
(8,781
|
)
|
22,033
|
|
||||||||||||||||
|
Redeemable noncontrolling interests
|
—
|
|
—
|
|
—
|
|
—
|
|
415
|
|
—
|
|
—
|
|
415
|
|
||||||||||||||||
|
Total Discovery, Inc. stockholders’ equity
|
8,386
|
|
13,384
|
|
(5,141
|
)
|
(5,183
|
)
|
6,290
|
|
11,661
|
|
(21,011
|
)
|
8,386
|
|
||||||||||||||||
|
Noncontrolling interests
|
—
|
|
—
|
|
—
|
|
—
|
|
—
|
|
—
|
|
1,716
|
|
1,716
|
|
||||||||||||||||
|
Total equity
|
8,386
|
|
13,384
|
|
(5,141
|
)
|
(5,183
|
)
|
6,290
|
|
11,661
|
|
(19,295
|
)
|
10,102
|
|
||||||||||||||||
|
Total liabilities and equity
|
$
|
8,388
|
|
|
$
|
13,710
|
|
$
|
42
|
|
$
|
12,048
|
|
$
|
9,122
|
|
$
|
17,316
|
|
$
|
(28,076
|
)
|
$
|
32,550
|
|
|||||||
151
DISCOVERY, INC.
NOTES TO CONSOLIDATED FINANCIAL STATEMENTS
CONDENSED CONSOLIDATING BALANCE SHEET
December 31, 2017
(in millions)
|
Discovery
|
DCH
|
DCL
|
Non-Guarantor
Subsidiaries of DCL |
Other Non-
Guarantor Subsidiaries of Discovery |
Reclassifications
and Eliminations |
Discovery and
Subsidiaries |
||||||||||||||||||||||
|
ASSETS
|
||||||||||||||||||||||||||||
|
Current assets:
|
||||||||||||||||||||||||||||
|
Cash and cash equivalents
|
$
|
—
|
|
$
|
—
|
|
$
|
6,800
|
|
$
|
509
|
|
$
|
—
|
|
$
|
—
|
|
$
|
7,309
|
|
|||||||
|
Receivables, net
|
—
|
|
—
|
|
410
|
|
1,428
|
|
—
|
|
—
|
|
1,838
|
|
||||||||||||||
|
Content rights, net
|
—
|
|
—
|
|
4
|
|
406
|
|
—
|
|
—
|
|
410
|
|
||||||||||||||
|
Prepaid expenses and other current assets
|
49
|
|
32
|
|
204
|
|
149
|
|
—
|
|
—
|
|
434
|
|
||||||||||||||
|
Inter-company trade receivables, net
|
—
|
|
—
|
|
205
|
|
—
|
|
—
|
|
(205
|
)
|
—
|
|
||||||||||||||
|
Total current assets
|
49
|
|
32
|
|
7,623
|
|
2,492
|
|
—
|
|
(205
|
)
|
9,991
|
|
||||||||||||||
|
Investment in and advances to subsidiaries
|
4,563
|
|
4,532
|
|
6,951
|
|
—
|
|
3,056
|
|
(19,102
|
)
|
—
|
|
||||||||||||||
|
Noncurrent content rights, net
|
—
|
|
—
|
|
672
|
|
1,541
|
|
—
|
|
—
|
|
2,213
|
|
||||||||||||||
|
Goodwill
|
—
|
|
—
|
|
3,677
|
|
3,396
|
|
—
|
|
—
|
|
7,073
|
|
||||||||||||||
|
Intangible assets, net
|
—
|
|
—
|
|
259
|
|
1,511
|
|
—
|
|
—
|
|
1,770
|
|
||||||||||||||
|
Equity method investments, including note receivable
|
—
|
|
—
|
|
25
|
|
310
|
|
—
|
|
—
|
|
335
|
|
||||||||||||||
|
Other noncurrent assets, including property and equipment, net
|
—
|
|
20
|
|
364
|
|
809
|
|
—
|
|
(20
|
)
|
1,173
|
|
||||||||||||||
|
Total assets
|
$
|
4,612
|
|
$
|
4,584
|
|
$
|
19,571
|
|
$
|
10,059
|
|
$
|
3,056
|
|
$
|
(19,327
|
)
|
$
|
22,555
|
|
|||||||
|
LIABILITIES AND EQUITY
|
|
|
||||||||||||||||||||||||||
|
Current liabilities:
|
|
|
||||||||||||||||||||||||||
|
Current portion of debt
|
$
|
—
|
|
$
|
—
|
|
$
|
7
|
|
$
|
23
|
|
$
|
—
|
|
$
|
—
|
|
$
|
30
|
|
|||||||
|
Other current liabilities
|
—
|
|
—
|
|
572
|
|
1,269
|
|
—
|
|
—
|
|
1,841
|
|
||||||||||||||
|
Inter-company trade payables, net
|
—
|
|
—
|
|
—
|
|
205
|
|
—
|
|
(205
|
)
|
—
|
|
||||||||||||||
|
Total current liabilities
|
—
|
|
—
|
|
579
|
|
1,497
|
|
—
|
|
(205
|
)
|
1,871
|
|
||||||||||||||
|
Noncurrent portion of debt
|
—
|
|
—
|
|
14,163
|
|
592
|
|
—
|
|
—
|
|
14,755
|
|
||||||||||||||
|
Other noncurrent liabilities
|
2
|
|
—
|
|
297
|
|
606
|
|
21
|
|
(20
|
)
|
906
|
|
||||||||||||||
|
Total liabilities
|
2
|
|
—
|
|
15,039
|
|
2,695
|
|
21
|
|
(225
|
)
|
17,532
|
|
||||||||||||||
|
Redeemable noncontrolling interests
|
—
|
|
—
|
|
—
|
|
413
|
|
—
|
|
—
|
|
413
|
|
||||||||||||||
|
Total equity
|
4,610
|
|
4,584
|
|
4,532
|
|
6,951
|
|
3,035
|
|
(19,102
|
)
|
4,610
|
|
||||||||||||||
|
Total liabilities and equity
|
$
|
4,612
|
|
$
|
4,584
|
|
$
|
19,571
|
|
$
|
10,059
|
|
$
|
3,056
|
|
$
|
(19,327
|
)
|
$
|
22,555
|
|
|||||||
152
DISCOVERY, INC.
NOTES TO CONSOLIDATED FINANCIAL STATEMENTS
CONDENSED CONSOLIDATING STATEMENT OF OPERATIONS
For the Year Ended
December 31, 2018
(in millions)
|
Discovery
|
Scripps Inc.
|
DCH
|
DCL
|
Non-Guarantor
Subsidiaries of DCL |
Other Non-
Guarantor Subsidiaries of Discovery |
Reclassifications
and Eliminations |
Discovery and
Subsidiaries |
|||||||||||||||||||||||||
|
Revenues
|
$
|
—
|
|
$
|
—
|
|
$
|
—
|
|
$
|
1,950
|
|
$
|
5,597
|
|
$
|
3,047
|
|
$
|
(41
|
)
|
$
|
10,553
|
|
||||||||
|
Costs of revenues, excluding depreciation and amortization
|
—
|
|
—
|
|
—
|
|
445
|
|
2,558
|
|
956
|
|
(24
|
)
|
3,935
|
|
||||||||||||||||
|
Selling, general and administrative
|
41
|
|
—
|
|
—
|
|
315
|
|
1,694
|
|
587
|
|
(17
|
)
|
2,620
|
|
||||||||||||||||
|
Depreciation and amortization
|
—
|
|
1
|
|
—
|
|
53
|
|
365
|
|
979
|
|
—
|
|
1,398
|
|
||||||||||||||||
|
Restructuring and other charges
|
8
|
|
—
|
|
—
|
|
118
|
|
407
|
|
217
|
|
—
|
|
750
|
|
||||||||||||||||
|
Gain on disposition
|
—
|
|
—
|
|
—
|
|
—
|
|
(84
|
)
|
—
|
|
—
|
|
(84
|
)
|
||||||||||||||||
|
Total costs and expenses
|
49
|
|
1
|
|
—
|
|
931
|
|
4,940
|
|
2,739
|
|
(41
|
)
|
8,619
|
|
||||||||||||||||
|
Operating (loss) income
|
(49
|
)
|
(1
|
)
|
—
|
|
1,019
|
|
657
|
|
308
|
|
—
|
|
1,934
|
|
||||||||||||||||
|
Equity in earnings of subsidiaries
|
637
|
|
198
|
|
473
|
|
209
|
|
—
|
|
315
|
|
(1,832
|
)
|
—
|
|
||||||||||||||||
|
Interest expense, net
|
—
|
|
(6
|
)
|
—
|
|
(693
|
)
|
(29
|
)
|
(1
|
)
|
—
|
|
(729
|
)
|
||||||||||||||||
|
Income (loss) from equity investees, net
|
—
|
|
—
|
|
—
|
|
4
|
|
(91
|
)
|
24
|
|
—
|
|
(63
|
)
|
||||||||||||||||
|
Other (expense) income, net
|
(5
|
)
|
12
|
|
—
|
|
71
|
|
(145
|
)
|
(53
|
)
|
—
|
|
(120
|
)
|
||||||||||||||||
|
Income before income taxes
|
583
|
|
203
|
|
473
|
|
610
|
|
392
|
|
593
|
|
(1,832
|
)
|
1,022
|
|
||||||||||||||||
|
Income tax benefit (expense)
|
11
|
|
—
|
|
—
|
|
(137
|
)
|
(163
|
)
|
(52
|
)
|
—
|
|
(341
|
)
|
||||||||||||||||
|
Net income
|
594
|
|
203
|
|
473
|
|
473
|
|
229
|
|
541
|
|
(1,832
|
)
|
681
|
|
||||||||||||||||
|
Net income attributable to noncontrolling interests
|
—
|
|
—
|
|
—
|
|
—
|
|
—
|
|
—
|
|
(67
|
)
|
(67
|
)
|
||||||||||||||||
|
Net income attributable to redeemable noncontrolling interests
|
—
|
|
—
|
|
—
|
|
—
|
|
—
|
|
—
|
|
(20
|
)
|
(20
|
)
|
||||||||||||||||
|
Net income available to Discovery, Inc.
|
$
|
594
|
|
$
|
203
|
|
$
|
473
|
|
$
|
473
|
|
$
|
229
|
|
$
|
541
|
|
$
|
(1,919
|
)
|
$
|
594
|
|
||||||||
153
DISCOVERY, INC.
NOTES TO CONSOLIDATED FINANCIAL STATEMENTS
CONDENSED CONSOLIDATING STATEMENT OF OPERATIONS
For the Year Ended
December 31, 2017
(in millions)
|
Discovery
|
DCH
|
DCL
|
Non-Guarantor
Subsidiaries of DCL |
Other Non-
Guarantor Subsidiaries of Discovery |
Reclassifications
and Eliminations |
Discovery and
Subsidiaries |
||||||||||||||||||||||
|
Revenues
|
$
|
—
|
|
$
|
—
|
|
$
|
1,988
|
|
$
|
4,897
|
|
$
|
—
|
|
$
|
(12
|
)
|
$
|
6,873
|
|
|||||||
|
Costs of revenues, excluding depreciation and amortization
|
—
|
|
—
|
|
467
|
|
2,191
|
|
—
|
|
(2
|
)
|
2,656
|
|
||||||||||||||
|
Selling, general and administrative
|
53
|
|
—
|
|
309
|
|
1,416
|
|
—
|
|
(10
|
)
|
1,768
|
|
||||||||||||||
|
Impairment of goodwill
|
—
|
|
—
|
|
—
|
|
1,327
|
|
—
|
|
—
|
|
1,327
|
|
||||||||||||||
|
Depreciation and amortization
|
—
|
|
—
|
|
42
|
|
288
|
|
—
|
|
—
|
|
330
|
|
||||||||||||||
|
Restructuring and other charges
|
—
|
|
—
|
|
35
|
|
40
|
|
—
|
|
—
|
|
75
|
|
||||||||||||||
|
Loss on disposition
|
—
|
|
—
|
|
—
|
|
4
|
|
—
|
|
—
|
|
4
|
|
||||||||||||||
|
Total costs and expenses
|
53
|
|
—
|
|
853
|
|
5,266
|
|
—
|
|
(12
|
)
|
6,160
|
|
||||||||||||||
|
Operating (loss) income
|
(53
|
)
|
—
|
|
1,135
|
|
(369
|
)
|
—
|
|
—
|
|
713
|
|
||||||||||||||
|
Equity in loss of subsidiaries
|
(288
|
)
|
(288
|
)
|
(541
|
)
|
—
|
|
(192
|
)
|
1,309
|
|
—
|
|
||||||||||||||
|
Interest expense, net
|
—
|
|
—
|
|
(448
|
)
|
(27
|
)
|
—
|
|
—
|
|
(475
|
)
|
||||||||||||||
|
Loss on extinguishment of debt
|
—
|
|
—
|
|
(54
|
)
|
—
|
|
—
|
|
—
|
|
(54
|
)
|
||||||||||||||
|
Loss from equity method investees, net
|
—
|
|
—
|
|
(3
|
)
|
(208
|
)
|
—
|
|
—
|
|
(211
|
)
|
||||||||||||||
|
Other (expense) income, net
|
—
|
|
—
|
|
(204
|
)
|
94
|
|
—
|
|
—
|
|
(110
|
)
|
||||||||||||||
|
Loss before income taxes
|
(341
|
)
|
(288
|
)
|
(115
|
)
|
(510
|
)
|
(192
|
)
|
1,309
|
|
(137
|
)
|
||||||||||||||
|
Income tax benefit (expense)
|
4
|
|
—
|
|
(173
|
)
|
(7
|
)
|
—
|
|
—
|
|
(176
|
)
|
||||||||||||||
|
Net loss
|
(337
|
)
|
(288
|
)
|
(288
|
)
|
(517
|
)
|
(192
|
)
|
1,309
|
|
(313
|
)
|
||||||||||||||
|
Net income attributable to redeemable noncontrolling interests
|
—
|
|
—
|
|
—
|
|
—
|
|
—
|
|
(24
|
)
|
(24
|
)
|
||||||||||||||
|
Net loss available to Discovery, Inc.
|
$
|
(337
|
)
|
$
|
(288
|
)
|
$
|
(288
|
)
|
$
|
(517
|
)
|
$
|
(192
|
)
|
$
|
1,285
|
|
$
|
(337
|
)
|
|||||||
154
DISCOVERY, INC.
NOTES TO CONSOLIDATED FINANCIAL STATEMENTS
CONDENSED CONSOLIDATING STATEMENT OF OPERATIONS
For the Year Ended
December 31, 2016
(in millions)
|
Discovery
|
DCH
|
DCL
|
Non-Guarantor
Subsidiaries of DCL |
Other Non-
Guarantor Subsidiaries of Discovery |
Reclassifications
and Eliminations |
Discovery and
Subsidiaries |
||||||||||||||||||||||
|
Revenues
|
$
|
—
|
|
$
|
—
|
|
$
|
1,963
|
|
$
|
4,547
|
|
$
|
—
|
|
$
|
(13
|
)
|
$
|
6,497
|
|
|||||||
|
Costs of revenues, excluding depreciation and amortization
|
—
|
|
—
|
|
466
|
|
1,970
|
|
—
|
|
(4
|
)
|
2,432
|
|
||||||||||||||
|
Selling, general and administrative
|
14
|
|
—
|
|
292
|
|
1,393
|
|
—
|
|
(9
|
)
|
1,690
|
|
||||||||||||||
|
Depreciation and amortization
|
—
|
|
—
|
|
41
|
|
281
|
|
—
|
|
—
|
|
322
|
|
||||||||||||||
|
Restructuring and other charges
|
—
|
|
—
|
|
28
|
|
30
|
|
—
|
|
—
|
|
58
|
|
||||||||||||||
|
Gain on disposition
|
—
|
|
—
|
|
(50
|
)
|
(13
|
)
|
—
|
|
—
|
|
(63
|
)
|
||||||||||||||
|
Total costs and expenses
|
14
|
|
—
|
|
777
|
|
3,661
|
|
—
|
|
(13
|
)
|
4,439
|
|
||||||||||||||
|
Operating (loss) income
|
(14
|
)
|
—
|
|
1,186
|
|
886
|
|
—
|
|
—
|
|
2,058
|
|
||||||||||||||
|
Equity in earnings of subsidiaries
|
1,203
|
|
1,203
|
|
602
|
|
—
|
|
802
|
|
(3,810
|
)
|
—
|
|
||||||||||||||
|
Interest expense, net
|
—
|
|
—
|
|
(332
|
)
|
(21
|
)
|
—
|
|
—
|
|
(353
|
)
|
||||||||||||||
|
Loss from equity method investees, net
|
—
|
|
—
|
|
(3
|
)
|
(35
|
)
|
—
|
|
—
|
|
(38
|
)
|
||||||||||||||
|
Other income (expense), net
|
—
|
|
—
|
|
40
|
|
(36
|
)
|
—
|
|
—
|
|
4
|
|
||||||||||||||
|
Income before income taxes
|
1,189
|
|
1,203
|
|
1,493
|
|
794
|
|
802
|
|
(3,810
|
)
|
1,671
|
|
||||||||||||||
|
Income tax benefit (expense)
|
5
|
|
—
|
|
(290
|
)
|
(168
|
)
|
—
|
|
—
|
|
(453
|
)
|
||||||||||||||
|
Net income
|
1,194
|
|
1,203
|
|
1,203
|
|
626
|
|
802
|
|
(3,810
|
)
|
1,218
|
|
||||||||||||||
|
Net income attributable to noncontrolling interests
|
—
|
|
—
|
|
—
|
|
—
|
|
—
|
|
(1
|
)
|
(1
|
)
|
||||||||||||||
|
Net income attributable to redeemable noncontrolling interests
|
—
|
|
—
|
|
—
|
|
—
|
|
—
|
|
(23
|
)
|
(23
|
)
|
||||||||||||||
|
Net income available to Discovery, Inc.
|
$
|
1,194
|
|
$
|
1,203
|
|
$
|
1,203
|
|
$
|
626
|
|
$
|
802
|
|
$
|
(3,834
|
)
|
$
|
1,194
|
|
|||||||
155
DISCOVERY, INC.
NOTES TO CONSOLIDATED FINANCIAL STATEMENTS
CONDENSED CONSOLIDATING STATEMENT OF COMPREHENSIVE INCOME
For the Year Ended
December 31, 2018
(in millions)
|
Discovery
|
Scripps Inc.
|
DCH
|
DCL
|
Non-Guarantor
Subsidiaries of DCL |
Other Non-
Guarantor Subsidiaries of Discovery |
Reclassifications
and Eliminations |
Discovery and
Subsidiaries |
|||||||||||||||||||||||||
|
Net income
|
$
|
594
|
|
$
|
203
|
|
$
|
473
|
|
$
|
473
|
|
$
|
229
|
|
$
|
541
|
|
$
|
(1,832
|
)
|
$
|
681
|
|
||||||||
|
Other comprehensive (loss) income, net of tax:
|
||||||||||||||||||||||||||||||||
|
Currency translation
|
(189
|
)
|
(204
|
)
|
15
|
|
15
|
|
(15
|
)
|
(194
|
)
|
383
|
|
(189
|
)
|
||||||||||||||||
|
Pension and SERP
|
3
|
|
3
|
|
—
|
|
—
|
|
—
|
|
—
|
|
(3
|
)
|
3
|
|
||||||||||||||||
|
Derivatives
|
12
|
|
—
|
|
12
|
|
12
|
|
12
|
|
8
|
|
(44
|
)
|
12
|
|
||||||||||||||||
|
Comprehensive income
|
420
|
|
2
|
|
500
|
|
500
|
|
226
|
|
355
|
|
(1,496
|
)
|
507
|
|
||||||||||||||||
|
Comprehensive income attributable to noncontrolling interests
|
—
|
|
—
|
|
—
|
|
—
|
|
—
|
|
—
|
|
(67
|
)
|
(67
|
)
|
||||||||||||||||
|
Comprehensive income attributable to redeemable noncontrolling interests
|
—
|
|
—
|
|
—
|
|
—
|
|
—
|
|
—
|
|
(20
|
)
|
(20
|
)
|
||||||||||||||||
|
Comprehensive income attributable to Discovery, Inc.
|
$
|
420
|
|
$
|
2
|
|
$
|
500
|
|
$
|
500
|
|
$
|
226
|
|
$
|
355
|
|
$
|
(1,583
|
)
|
$
|
420
|
|
||||||||
156
DISCOVERY, INC.
NOTES TO CONSOLIDATED FINANCIAL STATEMENTS
CONDENSED CONSOLIDATING STATEMENT OF COMPREHENSIVE LOSS
For the Year Ended
December 31, 2017
(in millions)
|
Discovery
|
DCH
|
DCL
|
Non-Guarantor
Subsidiaries of DCL |
Other Non-
Guarantor Subsidiaries of Discovery |
Reclassifications
and Eliminations |
Discovery and
Subsidiaries |
||||||||||||||||||||||
|
Net loss
|
$
|
(337
|
)
|
$
|
(288
|
)
|
$
|
(288
|
)
|
$
|
(517
|
)
|
$
|
(192
|
)
|
$
|
1,309
|
|
$
|
(313
|
)
|
|||||||
|
Other comprehensive (loss) income, net of tax:
|
||||||||||||||||||||||||||||
|
Currency translation
|
183
|
|
183
|
|
183
|
|
186
|
|
122
|
|
(674
|
)
|
183
|
|
||||||||||||||
|
Available-for-sale securities
|
15
|
|
15
|
|
15
|
|
15
|
|
10
|
|
(55
|
)
|
15
|
|
||||||||||||||
|
Derivatives
|
(20
|
)
|
(20
|
)
|
(20
|
)
|
(9
|
)
|
(13
|
)
|
62
|
|
(20
|
)
|
||||||||||||||
|
Comprehensive loss
|
(159
|
)
|
(110
|
)
|
(110
|
)
|
(325
|
)
|
(73
|
)
|
642
|
|
(135
|
)
|
||||||||||||||
|
Comprehensive income attributable to redeemable noncontrolling interests
|
(1
|
)
|
(1
|
)
|
(1
|
)
|
(1
|
)
|
(1
|
)
|
(20
|
)
|
(25
|
)
|
||||||||||||||
|
Comprehensive loss attributable to Discovery, Inc.
|
$
|
(160
|
)
|
$
|
(111
|
)
|
$
|
(111
|
)
|
$
|
(326
|
)
|
$
|
(74
|
)
|
$
|
622
|
|
$
|
(160
|
)
|
|||||||
157
DISCOVERY, INC.
NOTES TO CONSOLIDATED FINANCIAL STATEMENTS
CONDENSED CONSOLIDATING STATEMENT OF COMPREHENSIVE INCOME
For the Year Ended
December 31, 2016
(in millions)
|
Discovery
|
DCH
|
DCL
|
Non-Guarantor
Subsidiaries of DCL |
Other Non-
Guarantor Subsidiaries of Discovery |
Reclassifications
and Eliminations |
Discovery and
Subsidiaries |
||||||||||||||||||||||
|
Net income
|
$
|
1,194
|
|
$
|
1,203
|
|
$
|
1,203
|
|
$
|
626
|
|
$
|
802
|
|
$
|
(3,810
|
)
|
$
|
1,218
|
|
|||||||
|
Other comprehensive (loss) income, net of tax:
|
||||||||||||||||||||||||||||
|
Currency translation
|
(191
|
)
|
(191
|
)
|
(191
|
)
|
(190
|
)
|
(127
|
)
|
699
|
|
(191
|
)
|
||||||||||||||
|
Available-for-sale securities
|
38
|
|
38
|
|
38
|
|
38
|
|
25
|
|
(139
|
)
|
38
|
|
||||||||||||||
|
Derivatives
|
24
|
|
24
|
|
24
|
|
22
|
|
16
|
|
(86
|
)
|
24
|
|
||||||||||||||
|
Comprehensive income
|
1,065
|
|
1,074
|
|
1,074
|
|
496
|
|
716
|
|
(3,336
|
)
|
1,089
|
|
||||||||||||||
|
Comprehensive income attributable to noncontrolling interests
|
—
|
|
—
|
|
—
|
|
—
|
|
—
|
|
(1
|
)
|
(1
|
)
|
||||||||||||||
|
Comprehensive income attributable to redeemable noncontrolling interests
|
(23
|
)
|
(23
|
)
|
(23
|
)
|
(23
|
)
|
(15
|
)
|
84
|
|
(23
|
)
|
||||||||||||||
|
Comprehensive income attributable to Discovery, Inc.
|
$
|
1,042
|
|
$
|
1,051
|
|
$
|
1,051
|
|
$
|
473
|
|
$
|
701
|
|
$
|
(3,253
|
)
|
$
|
1,065
|
|
|||||||
158
DISCOVERY, INC.
NOTES TO CONSOLIDATED FINANCIAL STATEMENTS
CONDENSED CONSOLIDATING STATEMENT OF CASH FLOWS
For the Year Ended
December 31, 2018
(in millions)
|
Discovery
|
Scripps Inc.
|
DCH
|
DCL
|
Non-Guarantor
Subsidiaries of DCL |
Other Non-
Guarantor Subsidiaries of Discovery |
Reclassifications
and Eliminations |
Discovery and
Subsidiaries |
|||||||||||||||||||||||||
|
Operating Activities
|
||||||||||||||||||||||||||||||||
|
Cash (used in) provided by operating activities
|
$
|
(15
|
)
|
$
|
(85
|
)
|
$
|
11
|
|
$
|
(111
|
)
|
$
|
1,543
|
|
$
|
1,233
|
|
$
|
—
|
|
$
|
2,576
|
|
||||||||
|
Investing Activities
|
||||||||||||||||||||||||||||||||
|
Purchases of property and equipment
|
—
|
|
—
|
|
—
|
|
(24
|
)
|
(94
|
)
|
(29
|
)
|
—
|
|
(147
|
)
|
||||||||||||||||
|
(Payments) receipts for investments, net
|
—
|
|
—
|
|
—
|
|
(10
|
)
|
(59
|
)
|
8
|
|
—
|
|
(61
|
)
|
||||||||||||||||
|
Business (acquisitions) dispositions, net of cash (acquired) disposed
|
(8,714
|
)
|
54
|
|
—
|
|
—
|
|
—
|
|
95
|
|
—
|
|
(8,565
|
)
|
||||||||||||||||
|
Payments for derivative instruments
|
—
|
|
—
|
|
—
|
|
—
|
|
(2
|
)
|
—
|
|
—
|
|
(2
|
)
|
||||||||||||||||
|
Proceeds from dispositions, net of cash disposed
|
—
|
|
—
|
|
—
|
|
—
|
|
107
|
|
—
|
|
—
|
|
107
|
|
||||||||||||||||
|
Distributions from equity method investees
|
—
|
|
—
|
|
—
|
|
—
|
|
1
|
|
—
|
|
—
|
|
1
|
|
||||||||||||||||
|
Proceeds from sale of assets
|
—
|
|
—
|
|
—
|
|
—
|
|
68
|
|
—
|
|
—
|
|
68
|
|
||||||||||||||||
|
Intercompany distributions, and other investing activities, net
|
—
|
|
11
|
|
—
|
|
12
|
|
4
|
|
(9
|
)
|
(12
|
)
|
6
|
|
||||||||||||||||
|
Cash (used in) provided by investing activities
|
(8,714
|
)
|
|
65
|
|
|
—
|
|
|
(22
|
)
|
|
25
|
|
|
65
|
|
|
(12
|
)
|
(8,593
|
)
|
||||||||||
|
Financing Activities
|
||||||||||||||||||||||||||||||||
|
Commercial paper repayments, net
|
—
|
|
—
|
|
—
|
|
(5
|
)
|
—
|
|
—
|
|
—
|
|
(5
|
)
|
||||||||||||||||
|
Principal repayment of revolving credit facility
|
—
|
|
—
|
|
—
|
|
—
|
|
(200
|
)
|
—
|
|
—
|
|
(200
|
)
|
||||||||||||||||
|
Borrowings under term loan facilities
|
—
|
|
—
|
|
—
|
|
2,000
|
|
—
|
|
—
|
|
—
|
|
2,000
|
|
||||||||||||||||
|
Principal repayments of term loans
|
—
|
|
—
|
|
—
|
|
(2,000
|
)
|
—
|
|
—
|
|
—
|
|
(2,000
|
)
|
||||||||||||||||
|
Principal repayment of long term debt
|
—
|
|
—
|
|
—
|
|
(16
|
)
|
—
|
|
—
|
|
—
|
|
(16
|
)
|
||||||||||||||||
|
Principal repayments of capital lease obligations
|
—
|
|
—
|
|
—
|
|
(10
|
)
|
(28
|
)
|
(12
|
)
|
—
|
|
(50
|
)
|
||||||||||||||||
|
Distributions to noncontrolling interests and redeemable noncontrolling interests
|
—
|
|
—
|
|
—
|
|
—
|
|
(26
|
)
|
(50
|
)
|
—
|
|
(76
|
)
|
||||||||||||||||
|
Share-based plan proceeds, net
|
51
|
|
—
|
|
—
|
|
—
|
|
3
|
|
—
|
|
—
|
|
54
|
|
||||||||||||||||
|
Borrowings under program financing line of credit
|
—
|
|
—
|
|
—
|
|
22
|
|
—
|
|
—
|
|
—
|
|
22
|
|
||||||||||||||||
|
Inter-company contributions and other financing activities, net
|
8,678
|
|
335
|
|
(11
|
)
|
(6,597
|
)
|
(1,336
|
)
|
(1,093
|
)
|
12
|
|
(12
|
)
|
||||||||||||||||
|
Cash provided by (used in) financing activities
|
8,729
|
|
|
335
|
|
|
(11
|
)
|
|
(6,606
|
)
|
|
(1,587
|
)
|
|
(1,155
|
)
|
|
12
|
|
(283
|
)
|
||||||||||
|
Effect of exchange rate changes on cash and cash equivalents
|
—
|
|
—
|
|
—
|
|
—
|
|
(15
|
)
|
(8
|
)
|
—
|
|
(23
|
)
|
||||||||||||||||
|
Net change in cash and cash equivalents
|
—
|
|
|
315
|
|
—
|
|
(6,739
|
)
|
(34
|
)
|
135
|
|
—
|
|
(6,323
|
)
|
|||||||||||||||
|
Cash and cash equivalents, beginning of period
|
—
|
|
—
|
|
—
|
|
6,800
|
|
509
|
|
—
|
|
—
|
|
7,309
|
|
||||||||||||||||
|
Cash and cash equivalents, end of period
|
$
|
—
|
|
$
|
315
|
|
$
|
—
|
|
$
|
61
|
|
$
|
475
|
|
$
|
135
|
|
$
|
—
|
|
$
|
986
|
|
||||||||
159
DISCOVERY, INC.
NOTES TO CONSOLIDATED FINANCIAL STATEMENTS
CONDENSED CONSOLIDATING STATEMENT OF CASH FLOWS
For the Year Ended
December 31, 2017
(in millions)
|
Discovery
|
DCH
|
DCL
|
Non-Guarantor
Subsidiaries of DCL |
Other Non-
Guarantor Subsidiaries of Discovery |
Reclassifications
and Eliminations |
Discovery and
Subsidiaries |
||||||||||||||||||||||
|
Operating Activities
|
||||||||||||||||||||||||||||
|
Cash (used in) provided by operating activities
|
$
|
(3
|
)
|
$
|
3
|
|
$
|
476
|
|
$
|
1,153
|
|
$
|
—
|
|
$
|
—
|
|
$
|
1,629
|
|
|||||||
|
Investing Activities
|
||||||||||||||||||||||||||||
|
Business acquisitions, net of cash acquired
|
—
|
|
—
|
|
—
|
|
(60
|
)
|
—
|
|
—
|
|
(60
|
)
|
||||||||||||||
|
Payments for investments, net
|
—
|
|
—
|
|
(45
|
)
|
(399
|
)
|
—
|
|
—
|
|
(444
|
)
|
||||||||||||||
|
Proceeds from dispositions, net of cash disposed
|
—
|
|
—
|
|
—
|
|
29
|
|
—
|
|
—
|
|
29
|
|
||||||||||||||
|
Purchases of property and equipment
|
—
|
|
—
|
|
(43
|
)
|
(92
|
)
|
—
|
|
—
|
|
(135
|
)
|
||||||||||||||
|
Distributions from equity method investees
|
—
|
|
—
|
|
—
|
|
77
|
|
—
|
|
—
|
|
77
|
|
||||||||||||||
|
Payments (receipts) for derivative instruments, net
|
—
|
|
—
|
|
(111
|
)
|
10
|
|
—
|
|
—
|
|
(101
|
)
|
||||||||||||||
|
Other investing activities, net
|
—
|
|
—
|
|
(1
|
)
|
2
|
|
—
|
|
—
|
|
1
|
|
||||||||||||||
|
Inter-company contributions (distributions)
|
—
|
|
—
|
|
42
|
|
—
|
|
—
|
|
(42
|
)
|
—
|
|
||||||||||||||
|
Cash used in investing activities
|
—
|
|
—
|
|
(158
|
)
|
(433
|
)
|
—
|
|
(42
|
)
|
(633
|
)
|
||||||||||||||
|
Financing Activities
|
||||||||||||||||||||||||||||
|
Commercial paper repayments, net
|
—
|
|
—
|
|
(48
|
)
|
—
|
|
—
|
|
—
|
|
(48
|
)
|
||||||||||||||
|
Borrowings under revolving credit facility
|
—
|
|
—
|
|
350
|
|
|
|
—
|
|
—
|
|
350
|
|
||||||||||||||
|
Principal repayments of revolving credit facility
|
—
|
|
—
|
|
(475
|
)
|
|
|
—
|
|
—
|
|
(475
|
)
|
||||||||||||||
|
Borrowings from debt, net of discount and including premiums to par value
|
—
|
|
—
|
|
7,488
|
|
—
|
|
—
|
|
—
|
|
7,488
|
|
||||||||||||||
|
Principal repayments of debt, including discount payment and premiums to par value
|
—
|
|
—
|
|
(650
|
)
|
—
|
|
—
|
|
—
|
|
(650
|
)
|
||||||||||||||
|
Payments for bridge financing commitment fees
|
—
|
|
—
|
|
(40
|
)
|
—
|
|
—
|
|
—
|
|
(40
|
)
|
||||||||||||||
|
Principal repayments of capital lease obligations
|
—
|
|
—
|
|
(7
|
)
|
(26
|
)
|
—
|
|
—
|
|
(33
|
)
|
||||||||||||||
|
Repurchases of stock
|
(603
|
)
|
—
|
|
—
|
|
—
|
|
—
|
|
—
|
|
(603
|
)
|
||||||||||||||
|
Cash settlement of common stock repurchase contracts
|
58
|
|
—
|
|
—
|
|
—
|
|
—
|
|
—
|
|
58
|
|
||||||||||||||
|
Distributions to redeemable noncontrolling interests
|
—
|
|
—
|
|
—
|
|
(30
|
)
|
—
|
|
—
|
|
(30
|
)
|
||||||||||||||
|
Share-based plan proceeds, net
|
16
|
|
—
|
|
—
|
|
—
|
|
—
|
|
—
|
|
16
|
|
||||||||||||||
|
Inter-company distributions
|
—
|
|
—
|
|
—
|
|
(42
|
)
|
—
|
|
42
|
|
—
|
|
||||||||||||||
|
Inter-company contributions and other financing activities, net
|
532
|
|
(3
|
)
|
(156
|
)
|
(455
|
)
|
—
|
|
—
|
|
(82
|
)
|
||||||||||||||
|
Cash provided by (used in) financing activities
|
3
|
|
(3
|
)
|
6,462
|
|
(553
|
)
|
—
|
|
42
|
|
5,951
|
|
||||||||||||||
|
Effect of exchange rate changes on cash and cash equivalents
|
—
|
|
—
|
|
—
|
|
62
|
|
—
|
|
—
|
|
62
|
|
||||||||||||||
|
Net change in cash and cash equivalents
|
—
|
|
—
|
|
6,780
|
|
229
|
|
—
|
|
—
|
|
7,009
|
|
||||||||||||||
|
Cash and cash equivalents, beginning of period
|
—
|
|
—
|
|
20
|
|
280
|
|
—
|
|
—
|
|
300
|
|
||||||||||||||
|
Cash and cash equivalents, end of period
|
$
|
—
|
|
$
|
—
|
|
$
|
6,800
|
|
$
|
509
|
|
$
|
—
|
|
$
|
—
|
|
$
|
7,309
|
|
|||||||
160
DISCOVERY, INC.
NOTES TO CONSOLIDATED FINANCIAL STATEMENTS
CONDENSED CONSOLIDATING STATEMENT OF CASH FLOWS
For the Year Ended
December 31, 2016
(in millions)
|
Discovery
|
DCH
|
DCL
|
Non-Guarantor
Subsidiaries of DCL |
Other Non-
Guarantor Subsidiaries of Discovery |
Reclassifications
and Eliminations |
Discovery and
Subsidiaries |
||||||||||||||||||||||
|
Operating Activities
|
||||||||||||||||||||||||||||
|
Cash (used in) provided by operating activities
|
$
|
(20
|
)
|
$
|
(9
|
)
|
$
|
249
|
|
$
|
1,160
|
|
$
|
—
|
|
$
|
—
|
|
$
|
1,380
|
|
|||||||
|
Investing Activities
|
||||||||||||||||||||||||||||
|
Payments for investments, net
|
—
|
|
—
|
|
(124
|
)
|
(148
|
)
|
—
|
|
—
|
|
(272
|
)
|
||||||||||||||
|
Proceeds from dispositions, net of cash disposed
|
—
|
|
—
|
|
—
|
|
19
|
|
—
|
|
—
|
|
19
|
|
||||||||||||||
|
Purchases of property and equipment
|
—
|
|
—
|
|
(18
|
)
|
(70
|
)
|
—
|
|
—
|
|
(88
|
)
|
||||||||||||||
|
Distributions from equity method investees
|
—
|
|
—
|
|
—
|
|
87
|
|
—
|
|
—
|
|
87
|
|
||||||||||||||
|
Inter-company distributions
|
—
|
|
—
|
|
30
|
|
—
|
|
—
|
|
(30
|
)
|
—
|
|
||||||||||||||
|
Other investing activities, net
|
—
|
|
—
|
|
—
|
|
(2
|
)
|
—
|
|
—
|
|
(2
|
)
|
||||||||||||||
|
Cash used in investing activities
|
—
|
|
—
|
|
(112
|
)
|
(114
|
)
|
—
|
|
(30
|
)
|
(256
|
)
|
||||||||||||||
|
Financing Activities
|
||||||||||||||||||||||||||||
|
Commercial paper repayments, net
|
—
|
|
—
|
|
(45
|
)
|
—
|
|
—
|
|
—
|
|
(45
|
)
|
||||||||||||||
|
Borrowings under revolving credit facility
|
—
|
|
—
|
|
350
|
|
263
|
|
—
|
|
—
|
|
613
|
|
||||||||||||||
|
Principal repayments of revolving credit facility
|
—
|
|
—
|
|
(225
|
)
|
(610
|
)
|
—
|
|
—
|
|
(835
|
)
|
||||||||||||||
|
Borrowings from debt, net of discount and including premiums
|
—
|
|
—
|
|
498
|
|
—
|
|
—
|
|
—
|
|
498
|
|
||||||||||||||
|
Principal repayments of capital lease obligations
|
—
|
|
—
|
|
(5
|
)
|
(23
|
)
|
—
|
|
—
|
|
(28
|
)
|
||||||||||||||
|
Repurchases of stock
|
(1,374
|
)
|
—
|
|
—
|
|
—
|
|
—
|
|
—
|
|
(1,374
|
)
|
||||||||||||||
|
Prepayments of common stock repurchase contracts
|
(57
|
)
|
—
|
|
—
|
|
—
|
|
—
|
|
—
|
|
(57
|
)
|
||||||||||||||
|
Distributions to redeemable noncontrolling interests
|
—
|
|
—
|
|
—
|
|
(22
|
)
|
—
|
|
—
|
|
(22
|
)
|
||||||||||||||
|
Share-based plan proceeds, net
|
39
|
|
—
|
|
—
|
|
—
|
|
—
|
|
—
|
|
39
|
|
||||||||||||||
|
Hedge of borrowings from debt instruments
|
—
|
|
|
—
|
|
40
|
|
—
|
|
—
|
|
—
|
|
40
|
|
|||||||||||||
|
Intercompany distributions
|
—
|
|
—
|
|
—
|
|
(30
|
)
|
—
|
|
30
|
|
—
|
|
||||||||||||||
|
Inter-company contributions and other financing activities, net
|
1,412
|
|
9
|
|
(733
|
)
|
(701
|
)
|
—
|
|
—
|
|
(13
|
)
|
||||||||||||||
|
Cash provided by (used in) financing activities
|
20
|
|
9
|
|
(120
|
)
|
(1,123
|
)
|
—
|
|
30
|
|
(1,184
|
)
|
||||||||||||||
|
Effect of exchange rate changes on cash and cash equivalents
|
—
|
|
—
|
|
—
|
|
(30
|
)
|
—
|
|
—
|
|
(30
|
)
|
||||||||||||||
|
Net change in cash and cash equivalents
|
—
|
|
—
|
|
17
|
|
(107
|
)
|
—
|
|
—
|
|
(90
|
)
|
||||||||||||||
|
Cash and cash equivalents, beginning of period
|
—
|
|
—
|
|
3
|
|
387
|
|
—
|
|
—
|
|
390
|
|
||||||||||||||
|
Cash and cash equivalents, end of period
|
$
|
—
|
|
$
|
—
|
|
$
|
20
|
|
$
|
280
|
|
$
|
—
|
|
$
|
—
|
|
$
|
300
|
|
|||||||
161
ITEM 9. Changes in and Disagreements With Accountants on Accounting and Financial Disclosure.
None.
ITEM 9A. Controls and Procedures.
Evaluation of Disclosure Controls and Procedures
Our management, with the participation of our Chief Executive Officer and Chief Financial Officer, has evaluated the effectiveness of our disclosure controls and procedures as of
December 31, 2018
. The term “disclosure controls and procedures,” as defined in Rules 13a-15(e) and 15d-15(e) of the Exchange Act of 1934, as amended (the “Exchange Act”), means controls and other procedures of a company that are designed to ensure that information required to be disclosed by a company in the reports that it files or submits under the Exchange Act is recorded, processed, summarized and reported, within the time periods specified in the SEC’s rules and forms. Disclosure controls and procedures include, without limitation, controls and procedures designed to ensure that information required to be disclosed by a company in the reports that it files or submits under the Exchange Act is accumulated and communicated to the company’s management, including its principal executive and principal financial officers, or persons performing similar functions, as appropriate to allow timely decisions regarding required disclosure. Management recognizes that any controls and procedures, no matter how well designed and operated, can provide only reasonable assurance of achieving their objectives and management necessarily applies its judgment in evaluating the cost-benefit relationship of
possible controls and procedures. Based on the evaluation of our disclosure controls and procedures as of
December 31, 2018
, our Chief Executive Officer and Chief Financial Officer concluded that, as of such date, our disclosure controls and procedures were effective.
Management’s Annual Report on Internal Control Over Financial Reporting
Management’s report on internal control over financial reporting is set forth in Item 8 of this Annual Report on Form 10-K under the caption “Management’s Report on Internal Control over Financial Reporting,” which is incorporated herein by reference.
Report of the Independent Registered Public Accounting Firm
The report of our independent registered public accounting firm regarding internal control over financial reporting is set forth in Item 8 of this Annual Report on Form 10-K under the caption “Report of Independent Registered Public Accounting Firm,” which is incorporated herein by reference.
Changes in Internal Control Over Financial Reporting
During the three months ended
December 31, 2018
, there were no changes in our internal control over financial reporting, as defined in Exchange Act Rule 13a-15(f), that have materially affected, or are reasonably likely to materially affect, our internal control over financial reporting. On
March 6, 2018
, the Company acquired Scripps Networks. See Note 3 to the accompanying consolidated financial statements. We are currently integrating policies, processes, people, technology and operations for the combined company and assessing the impact to our internal control over financial reporting. Management will continue to evaluate our internal control over financial reporting as we execute integration activities.
ITEM 9B. Other Information.
None.
162
PART III
Certain information required in Item 10 through Item 14 of Part III of this Annual Report on Form 10-K is incorporated herein by reference to our definitive Proxy Statement for our
2019
Annual Meeting of Stockholders (“
2019
Proxy Statement”), which shall be filed with the SEC pursuant to Regulation 14A of the Exchange Act within 120 days of our fiscal year end.
ITEM 10. Directors, Executive Officers and Corporate Governance.
Information regarding our directors, compliance with Section 16(a) of the Exchange Act, and our Audit Committee, including committee members and its financial expert, will be set forth in our
2019
Proxy Statement under the captions “Proposal 1: Election of Directors,” “Section 16(a) Beneficial Ownership Reporting Compliance,” and “Corporate Governance – Committees of the Board of Directors – Audit Committee,” respectively, which are incorporated herein by reference.
Information regarding our executive officers is set forth in Part I of this Annual Report on Form 10-K under the caption “Executive Officers of Discovery, Inc.” as permitted by General Instruction G(3) to Form 10-K.
We have adopted a Code of Ethics (the “Code”) that is applicable to all of our directors, officers and employees. Our Board of Directors approved the Code in September 2008 and reviews it regularly. A copy of the Code and any amendments or waivers that would be required to be disclosed under applicable SEC rules are available free of charge at the investor relations section of our website, https://corporate.discovery.com. In addition, we will provide a printed copy of the Code, free of charge, upon written request to: Investor Relations, Discovery, Inc., 850 Third Avenue, 8th Floor, New York, NY 10022-7225.
ITEM 11. Executive Compensation.
Information regarding executive compensation will be set forth in our
2019
Proxy Statement under the captions “Compensation Discussion and Analysis” and “Executive Compensation,” which are incorporated herein by reference.
Information regarding compensation policies and practices as they relate to our risk management, director compensation, and compensation committee interlocks and insider participation will be set forth in our
2019
Proxy Statement under the captions “Risk Considerations in our Compensation Programs,” “Board Compensation,” and “Corporate Governance – Committees of the Board of Directors – Compensation Committee,” respectively, which are incorporated herein by reference.
Information regarding the compensation committee report will be set forth in our
2019
Proxy Statement under the caption “Report of the Compensation Committee” which is incorporated herein by reference.
ITEM 12. Security Ownership of Certain Beneficial Owners and Management and Related Stockholder Matters.
Information regarding securities authorized for issuance under equity compensation plans will be set forth in our
2019
Proxy Statement under the caption “Securities Authorized for Issuance Under Equity Compensation Plans,” which is incorporated herein by reference.
Information regarding security ownership of certain beneficial owners and management will be set forth in our
2019
Proxy Statement under the captions “Security Ownership Information of Certain Beneficial Owners and Management of Discovery – Security Ownership of Certain Beneficial Owners of Discovery” and “Security Ownership Information of Certain Beneficial Owners and Management of Discovery – Security Ownership of Discovery Management,” which are incorporated herein by reference.
ITEM 13. Certain Relationships and Related Transactions, and Director Independence.
Information regarding certain relationships and related transactions, and director independence will be set forth in our
2019
Proxy Statement under the captions “Certain Relationships and Related Person Transactions,” “Policy Governing Related Person Transactions,” and “Corporate Governance – Director Independence,” respectively, which are incorporated herein by reference.
ITEM 14. Principal Accountant Fees and Services.
Information regarding principal accountant fees and services will be set forth in our
2019
Proxy Statement under the captions “Ratification of Appointment of Independent Registered Public Accounting Firm – Description of Fees” and “Ratification of Appointment of Independent Registered Public Accounting Firm – Policy on Audit Committee Pre-Approval of Audit and Permissible Non-Audit Services of Independent Registered Public Accounting Firm,” which are incorporated herein by reference.
163
PART IV
ITEM 15. Exhibits and Financial Statement Schedules.
The following documents are filed as part of this Annual Report on Form 10-K:
1. The following consolidated financial statements of Discovery, Inc. are filed as part of Item 8 of this Annual Report on Form 10-K:
|
|
Page
|
2. All financial statement schedules required to be filed pursuant to Item 8 and Item 15(c) of Form 10-K have been omitted as the required information is not applicable, not material, or is set forth in the consolidated financial statements or notes thereto.
3. The following exhibits are filed or furnished as part of this Annual Report on Form 10-K pursuant to Item 601 of SEC Regulation S-K and Item 15(b) of Form 10-K:
|
EXHIBITS INDEX
|
|||
|
Exhibit No.
|
Description
|
||
|
2.1
|
|
||
|
3.1
|
|
|
|
|
3.2
|
|
||
|
3.3
|
|
|
|
|
3.4
|
|
||
164
|
EXHIBITS INDEX
|
|||
|
Exhibit No.
|
Description
|
||
|
3.5
|
|
||
|
4.1
|
|
|
|
|
4.2
|
|
|
|
|
4.3
|
|
|
|
|
4.4
|
|
|
|
|
4.5
|
|
||
|
4.6
|
|
||
|
4.7
|
|
|
|
|
4.8
|
|
|
|
|
4.9
|
|
||
|
4.10
|
|
|
|
|
4.11
|
|
|
|
|
4.12
|
|
|
|
165
|
EXHIBITS INDEX
|
|||
|
Exhibit No.
|
Description
|
||
|
4.13
|
|
|
|
|
4.14
|
|
||
|
4.15
|
|
||
|
4.16
|
|
||
|
4.17
|
|
||
|
4.18
|
|
||
|
4.19
|
|
||
|
4.20
|
|
||
|
4.21
|
|
||
|
4.22
|
|
||
|
4.23
|
|
||
|
4.24
|
|
||
166
|
EXHIBITS INDEX
|
|||
|
Exhibit No.
|
Description
|
||
|
4.25
|
|
||
|
4.26
|
|
||
|
4.27
|
|
||
|
4.28
|
|
||
|
4.29
|
|
||
|
10.1
|
|
|
|
|
10.2
|
|
||
|
10.3
|
|
||
|
10.4
|
|
|
|
|
10.5
|
|
|
|
|
10.6
|
|
|
|
|
10.7
|
|
|
|
167
|
EXHIBITS INDEX
|
|||
|
Exhibit No.
|
Description
|
||
|
10.8
|
|
||
|
10.9
|
|
|
|
|
10.10
|
|
||
|
10.11
|
|
|
|
|
10.12
|
|
|
|
|
10.13
|
|
|
|
|
10.14
|
|
|
|
|
10.15
|
|
|
|
168
|
EXHIBITS INDEX
|
|||
|
Exhibit No.
|
Description
|
||
|
10.16
|
|
|
|
|
10.17
|
|
|
|
|
10.18
|
|
|
|
|
10.19
|
|
|
|
|
10.20
|
|
|
|
|
10.21
|
|
|
|
|
10.22
|
|
|
|
|
10.23
|
|
|
|
|
10.24
|
|
|
|
|
10.25
|
|
|
|
|
10.26
|
|
|
|
|
10.27
|
|
|
|
|
10.28
|
|
|
|
|
10.29
|
|
|
|
169
|
EXHIBITS INDEX
|
|||
|
Exhibit No.
|
Description
|
||
|
10.30
|
|
|
|
|
10.31
|
|
|
|
|
10.32
|
|
||
|
10.33
|
|
||
|
10.34
|
|
||
|
10.35
|
|
||
|
10.36
|
|
||
|
10.37
|
|
||
|
10.38
|
|
||
|
10.39
|
|
||
|
10.4
|
|
||
|
10.41
|
|
||
|
10.42
|
|
||
|
10.43
|
|
||
170
|
EXHIBITS INDEX
|
|||
|
Exhibit No.
|
Description
|
||
|
10.44
|
|
||
|
10.45
|
|
||
|
10.46
|
|
||
|
10.47
|
|
||
|
10.48
|
|
||
|
10.49
|
|
||
|
10.50
|
|
||
|
10.51
|
|
||
|
10.52
|
|
||
|
10.53
|
|
||
|
10.54
|
|
||
|
10.55
|
|
||
171
|
EXHIBITS INDEX
|
|||
|
Exhibit No.
|
Description
|
||
|
10.56
|
|
||
|
10.57
|
|
||
|
14
|
|
||
|
21
|
|
|
|
|
23
|
|
|
|
|
31.1
|
|
|
|
|
31.2
|
|
|
|
|
32.1
|
|
|
|
|
32.2
|
|
|
|
|
101.INS
|
|
XBRL Instance Document†
|
|
101.SCH
|
|
XBRL Taxonomy Extension Schema Document†
|
|
101.CAL
|
|
XBRL Taxonomy Extension Calculation Linkbase Document†
|
|
101.DEF
|
|
XBRL Taxonomy Extension Definition Linkbase Document†
|
|
101.LAB
|
|
XBRL Taxonomy Extension Label Linkbase Document†
|
|
101.PRE
|
|
XBRL Taxonomy Extension Presentation Linkbase Document†
|
* Indicates management contract or compensatory plan, contract or arrangement.
†Attached as Exhibit 101 to this Annual Report on Form 10-K are the following formatted in XBRL (Extensible Business Reporting Language): (i) Consolidated Balance Sheets as of
December 31, 2018
and
December 31, 2017
, (ii) Consolidated Statements of Operations for the Years Ended
December 31,
2018
,
2017
, and
2016
, (iii) Consolidated Statements of Cash Flows for the Years Ended
December 31, 2018
,
2017
, and
2016
, (iv) Consolidated Statements of Equity for the Years Ended
December 31,
2018
,
2017
, and
2016
, and (v) Notes to Consolidated Financial Statements.
172
ITEM 16. Form 10-K Summary
Not Applicable.
173
SIGNATURES
Pursuant to the requirements of Section 13 or 15(d) of the Securities Exchange Act of 1934, the registrant has duly caused this report to be signed on its behalf by the undersigned, thereunto duly authorized.
|
|
DISCOVERY, INC.
(Registrant)
|
|||
|
Date: March 1, 2019
|
|
By:
|
|
/s/ David M. Zaslav
|
|
|
|
David M. Zaslav
|
||
|
|
|
President and Chief Executive Officer
|
||
174
Pursuant to the requirements of the Securities Exchange Act of 1934, this report has been signed below by the following persons on behalf of the registrant and in the capacities and on the date indicated.
|
Signature
|
|
Title
|
|
Date
|
|
/s/ David M. Zaslav
|
|
President and Chief Executive Officer, and Director
(Principal Executive Officer)
|
|
March 1, 2019
|
|
David M. Zaslav
|
|
|
||
|
/s/ Gunnar Wiedenfels
|
|
Senior Executive Vice President and
Chief Financial Officer
(Principal Financial Officer)
|
|
March 1, 2019
|
|
Gunnar Wiedenfels
|
|
|
||
|
/s/ Kurt T. Wehner
|
|
Executive Vice President and Chief Accounting Officer
(Principal Accounting Officer)
|
|
March 1, 2019
|
|
Kurt T. Wehner
|
|
|
||
|
/s/ S. Decker Anstrom
|
Director
|
March 1, 2019
|
||
|
S. Decker Anstrom
|
||||
|
/s/ Robert R. Beck
|
|
Director
|
|
March 1, 2019
|
|
Robert R. Beck
|
|
|
||
|
/s/ Robert R. Bennett
|
|
Director
|
|
March 1, 2019
|
|
Robert R. Bennett
|
|
|
||
|
/s/ Paul A. Gould
|
|
Director
|
|
March 1, 2019
|
|
Paul A. Gould
|
|
|
||
|
/s/ Ken Lowe
|
|
Director
|
|
March 1, 2019
|
|
Ken Lowe
|
|
|
||
|
/s/ John C. Malone
|
|
Director
|
|
March 1, 2019
|
|
John C. Malone
|
|
|
||
|
/s/ Robert J. Miron
|
|
Director
|
|
March 1, 2019
|
|
Robert J. Miron
|
|
|
||
|
/s/ Steven A. Miron
|
|
Director
|
|
March 1, 2019
|
|
Steven A. Miron
|
|
|
||
|
/s/ Susan M. Swain
|
Director
|
March 1, 2019
|
||
|
Susan M. Swain
|
||||
|
/s/ Daniel E. Sanchez
|
|
Director
|
|
March 1, 2019
|
|
Daniel E. Sanchez
|
|
|
||
|
/s/ J. David Wargo
|
|
Director
|
|
March 1, 2019
|
|
J. David Wargo
|
|
|
||
TABLE OF CONTENTS
Part IItem 1. BusinessItem 1A. Risk FactorsItem 1B. Unresolved Staff CommentsItem 2. PropertiesItem 3. Legal ProceedingsItem 4. Mine Safety DisclosuresPart IIItem 5. Market For Registrant S Common Equity, Related Stockholder Matters and Issuer Purchases Of Equity SecuritiesItem 6. Selected Financial DataItem 7. Management S Discussion and Analysis Of Financial Condition and Results Of OperationsItem 7A. Quantitative and Qualitative Disclosures About Market RiskItem 8. Financial Statements and Supplementary DataNote 1. Description Of Business and Basis Of PresentationNote 2. Summary Of Significant Accounting PoliciesNote 3. Acquisitions and DispositionsNote 4. InvestmentsNote 5. Fair Value MeasurementsNote 6. Content RightsNote 7. Property and EquipmentNote 8. Goodwill and Intangible AssetsNote 9. DebtNote 10. Derivative Financial InstrumentsNote 11. Redeemable Noncontrolling InterestsNote 12. EquityNote 13. Noncontrolling InterestNote 14. RevenuesNote 15. Share-based CompensationNote 16. Retirement Savings PlansNote 17. Restructuring and Other ChargesNote 18. Income TaxesNote 19. Earnings Per ShareNote 20. Supplemental DisclosuresNote 21. Related Party TransactionsNote 22. Commitments and ContingenciesNote 23. Reportable SegmentsNote 24. Selected Quarterly Financial Data (unaudited)Note 25. Condensed Consolidating Financial InformationItem 9. Changes in and Disagreements with Accountants on Accounting and Financial DisclosureItem 9A. Controls and ProceduresItem 9B. Other InformationPart IIIItem 10. Directors, Executive Officers and Corporate GovernanceItem 11. Executive CompensationItem 12. Security Ownership Of Certain Beneficial Owners and Management and Related Stockholder MattersItem 13. Certain Relationships and Related Transactions, and Director IndependenceItem 14. Principal Accountant Fees and ServicesPart IVItem 15. Exhibits and Financial Statement SchedulesItem 16. Form 10-k Summary