UNITED STATES
SECURITIES AND EXCHANGE COMMISSION
Washington, D.C. 20549
FORM
20-F
(Mark One)
|
|
REGISTRATION STATEMENT PURSUANT TO SECTION 12(b) OR (g) OF THE SECURITIES EXCHANGE ACT OF 1934
|
OR
|
|
ANNUAL REPORT PURSUANT TO SECTION 13 OR 15(d) OF THE SECURITIES EXCHANGE ACT OF 1934
|
For the fiscal year ended
December 31
,
2021
OR
|
|
TRANSITION REPORT PURSUANT TO SECTION 13 OR 15(d) OF THE SECURITIES EXCHANGE ACT OF 1934
|
For the transition period from to
OR
|
|
SHELL COMPANY REPORT PURSUANT TO SECTION 13 OR 15(d) OF THE SECURITIES EXCHANGE ACT OF 1934
|
Date of event requiring this shell company report
Commission file number
001-40865
(Exact name of Registrant as specified in its charter)
Not Applicable
(Translation of Registrant’s name into English)
The
Netherlands
(Jurisdiction of incorporation or organization)
(Address of principal executive offices)
General Counsel
Telephone:
+1
(
404
)
574-1504
Wallbox N.V.
(Name, Telephone,
E-mail
and /or Facsimile number and Address of Company Contact Person) Securities registered or to be registered, pursuant to Section 12(b) of the Act
|
Title of each class
|
|
Trading Symbol(s)
|
|
Name of each exchange on which registered
|
|
|
|
|
|
|
|
|
|
|
|
|
Securities registered or to be registered pursuant to Section 12(g) of the Act: None
Securities for which there is a reporting obligation pursuant to Section 15(d) of the Act: None
Indicate the number of outstanding shares of each of the issuer’s classes of capital or common stock as of the close of the period covered by the annual report. As of December 31, 2021, the registrant had
138,158,783
Class A Shares and
23,250,793
Class B Shares outstanding.
Indicate by check mark if the registrant is a well-known seasoned issuer, as defined in Rule 405 of the Securities Act. Yes ☐
No
☒
If this report is an annual or transition report, indicate by check mark if the registrant is not required to file reports pursuant to Section 13 or 15(d) of the Securities Exchange Act of 1934. Yes ☐
No
☒
Note—Checking the box above will not relieve any registrant required to file reports pursuant to Section 13 or 15(d) of the Securities Exchange Act of 1934 from their obligations under those Sections.
Indicate by check mark whether the registrant (1) has filed all reports required to be filed by Section 13 or 15(d) of the Securities Exchange Act of 1934 during the preceding 12 months (or for such shorter period that the registrant was required to file such reports), and (2) has been subject to such filing requirements for the past 90 days.
Yes
☒ No ☐
Indicate by check mark whether the registrant has submitted electronically every Interactive Data File required to be submitted pursuant to Rule 405 of Regulation
Yes
☒ No ☐
S-T
(§ 232.405 of this chapter) during the preceding 12 months (or for such shorter period that the registrant was required to submit such files).
Indicate by check mark whether the registrant is a large accelerated filer, an accelerated filer, a
non-accelerated
filer, or an emerging growth company. See the definitions of “large accelerated filer,” “accelerated filer,” and “emerging growth company” in Rule
12b-2
of the Exchange Act.
|
Large accelerated filer
|
|
☐
|
|
Accelerated filer
|
|
☐
|
|
|
|
☒
|
|
|
|
|
|
|
|
|||||
|
|
|
|
|
|
|
|
|
Emerging growth company
|
|
|
If an emerging growth company that prepares its financial statements in accordance with U.S. GAAP, indicate by check mark if the registrant has elected not to use the extended transition period for complying with any new or revised financial accounting standards † provided pursuant to Section 13(a) of the Exchange Act.
☐
† The term “new or revised financial accounting standard” refers to any update issued by the Financial Accounting Standards Board to its Accounting Standards Codification after April 5, 2012.
Indicate by check mark whether the registrant has filed a report on and attestation to its management’s assessment of the effectiveness of its internal control over financial reporting under Section 404(b) of the Sarbanes-Oxley Act (15 U.S.C. 7262(b)) by the registered public accounting firm that prepared or issued its audit report.
☐
Indicate by check mark which basis of accounting the registrant has used to prepare the financial statements included in this filing:
|
U.S. GAAP ☐
|
|
|
|
|
|
|
|
Other ☐
|
|
|
|
by the International Accounting Standards Board
|
|
☒
|
|
|
|
|
If “Other” has been checked in response to the previous question indicate by check mark which financial statement item the registrant has elected to follow. Item 17 ☐ Item 18 ☐
If this is an annual report, indicate by check mark whether the registrant is a shell company (as defined in Rule
☒
12b-2
of the Exchange Act). Yes ☐ No
TABLE OF CONTENTS
|
|
|
1
|
|
|
|
|
|
5
|
|
|
|
|
|
7
|
|
|
|
|
|
8
|
|
|
|
|
|
8
|
|
|
|
|
|
8
|
|
|
|
|
|
8
|
|
|
|
|
|
43
|
|
|
|
|
|
60
|
|
|
|
|
|
60
|
|
|
|
|
|
84
|
|
|
|
|
|
100
|
|
|
|
|
|
105
|
|
|
|
|
|
106
|
|
|
|
|
|
106
|
|
|
|
|
|
113
|
|
|
|
|
|
114
|
|
|
|
|
|
115
|
|
|
|
|
|
115
|
|
|
|
|
|
115
|
|
|
|
|
|
115
|
|
|
|
|
|
116
|
|
|
|
|
|
116
|
|
|
|
|
|
116
|
|
|
|
|
|
117
|
|
|
|
|
|
117
|
|
|
|
|
|
117
|
|
|
|
|
|
117
|
|
|
|
|
|
118
|
|
|
|
|
|
118
|
|
|
|
|
|
118
|
|
|
|
|
|
119
|
|
|
|
|
|
119
|
|
|
|
|
|
119
|
|
|
|
|
|
119
|
|
|
|
|
|
121
|
|
|
|
|
|
F-1
|
|
PRESENTATION OF FINANCIAL AND OTHER INFORMATION
We report under International Financial Reporting Standards ( IFRS) as issued by the International Accounting Standards Board (IASB)
General Information
Our consolidated financial statements are reported in the reporting currency of the Euro (€), which are denoted “Euros,” “EUR” or “€” throughout this Annual Report on Form
20-F
(“Annual Report”). Also, throughout this Annual Report:
| • |
except where the context otherwise requires or where otherwise indicated, the terms “Wallbox,” the “Company,” “we,” “us,” “our,” “our Company” and “our business” refer to Wallbox N.V., a Dutch public limited liability company (
naamloze vennootschap
|
| • |
the terms “€,” “EUR,” “Euro” or “euro” refer to the currency introduced at the start of the third stage of European economic and monetary union pursuant to the treaty establishing the European Community, as amended; and
|
| • |
the terms “dollars,” “USD” or “$” refer to U.S. dollars.
|
Certain figures in this Annual Report may not recalculate exactly due to rounding. This is because percentages and/or figures contained herein are calculated based on actual numbers and not the rounded numbers presented.
Segments
Management determined that we have three reportable operating segments: (i) Europe-Middle East Asia (EMEA), (ii) North America (NORAM), and (iii) Asia-Pacific (APAC) given our organizational structure and the manner in which our business is reviewed and managed. Our reportable operating segments reflect the principal geographies for our commercial activities around the world, and how we are allocating resources and evaluating operating performance. Refer to Item 5. “Operating and Financial Review and Prospects — A. Operating Results — Operating Results by Segment” and Note 7, “
, to our consolidated financial statements included elsewhere in this Annual Report for additional information about these segments. Information presented in this Annual Report for periods prior to this segment change has been revised to reflect this segment realignment.
Operating Segments”
Defined Terms and Key Performance Indicators in this Annual Report
Throughout this Annual Report, we use a number of defined terms and provide information about a number of key performance indicators used by management. Definitions are as follows, and additional information about our key performance indicators is discussed in more detail in Item 5 “Operating and Financial Review and Prospects — Key Operating and Financial Metrics.”
“Board” means the board of directors of Wallbox.
“Business Combination” means the transactions contemplated by the Business Combination Agreement.
“Business Combination Agreement” means the Business Combination Agreement, dated June 9, 2021, as may be amended from time to time, by and among Wallbox B.V., Merger Sub, Kensington and Wallbox Chargers S.L.
“Class A Shares” means the ordinary shares A, nominal value €0.12 per share, of Wallbox.
1
“Class B Shares” means the ordinary shares B, nominal value €1.20 per share, of Wallbox.
“Closing” means the closing of the transactions contemplated by the Business Combination Agreement.
“Closing Date” means October 1, 2021.
“Code” means the U.S. Internal Revenue Code of 1986, as amended.
“COVID-19”
means the novel coronavirus known as
SARS-CoV-2
COVID-19,
and any evolutions, mutations thereof or related or associated epidemics, pandemic or disease outbreaks.
“DCGC” means the Dutch Corporate Governance Code.
“ESPP” means the Wallbox N.V. 2021 Employee Share Purchase Plan.
“Exchange Act” means the U.S. Securities Exchange Act of 1934, as amended.
“FCPA” means the U.S. Foreign Corrupt Practices Act.
“General Meeting” means the general meeting (
) of the Company, being the corporate body, or where the context so requires, the physical meeting of shareholders of the Company.
algemene vergadering
“IAS” means the International Accounting Standard.
“IFRS” means the International Financial Reporting Standards as issued by the International Accounting Standards Board.
“Incentive Plan” means the Wallbox N.V. 2021 Equity Incentive Plan.
“JOBS Act” means the Jumpstart Our Business Startups Act of 2012.
“Kensington” means Kensington Capital Acquisition Corp. II, a Delaware corporation.“Kensington Class A Common Stock” means Kensington’s Class A common stock, par value $0.0001 per share.
“Kensington Class B Common Stock” means Kensington’s Class B common stock, par value $0.0001 per share.
“Kensington Common Stock” means the Kensington Class A Common Stock and Kensington Class B Common Stock.
“Merger Sub” means Orion Merger Sub Corp., a Delaware corporation.
“NYSE” means the New York Stock Exchange.
“PIPE Financing” means the subscription for and purchase by the PIPE Investors of an aggregate of 11,100,000 Shares at $10.00 per share for gross proceeds of $111,000,000 pursuant to the Subscription Agreements.
“PIPE Investors” mean the investors in the PIPE Financing pursuant to the Subscription Agreements.
“Private Warrants” means the 8,933,333 warrants held by certain former Kensington shareholders at the Closing, purchased by such holders in the private placement that occurred concurrently with the closing of Kensington’s IPO and converted into warrants to purchase one Class A Share at a price of $11.50 per share, subject to adjustment, at the closing of the Business Combination.
2
“Public Warrants” means the 5,750,000 warrants to purchase one Class A Share at a price of $11.50, subject to adjustment, held by certain former Kensington shareholders.
“Sarbanes-Oxley Act” means the Sarbanes-Oxley Act of 2002.
“SEC” means the United States Securities and Exchange Commission.
“Shares” means the shares of Wallbox.
“Subscription Agreements” means the Subscription Agreements, dated June 9, 2021 and September 29, 2021, by and among Wallbox B.V., Kensington and each of the PIPE Investors.
Non-IFRS
and Other Financial and Operating Metrics
We have included in this Annual Report certain financial measures not based on IFRS, including EBITDA and Adjusted EBITDA (together, the
“Non-IFRS
Measures”), as well as operating metrics, including Gross Margin See the definitions set forth below for a further explanation of these terms.
Management uses the
Non-IFRS
Measures:
| • |
as measurements of operating performance because they assist us in comparing our operating performance on a consistent basis, as they remove the impact of items not directly resulting from our core operations;
|
| • |
for planning purposes, including the preparation of our internal annual operating budget and financial projections;
|
| • |
to evaluate the performance and effectiveness of our strategic initiatives; and
|
| • |
to evaluate our capacity to fund capital expenditures and expand our business.
|
The
operations of our business. By providing the
Non-IFRS
Measures may not be comparable to similar measures disclosed by other companies, because not all companies and analysts calculate these measures in the same manner. We present the
Non-IFRS
Measures because we consider them to be important supplemental measures of our performance, and we believe they are frequently used by securities analysts, investors and other interested parties in the evaluation of companies. Management believes that investors’ understanding of our performance is enhanced by including the
Non-IFRS
Measures as a reasonable basis for comparing our ongoing results of operations. Many investors are interested in understanding the performance of our business by comparing our results from ongoing operations period over period and would ordinarily add back
non-cash
expenses such as depreciation, amortization and items that are not part of normal
day-to-day
Non-IFRS
Measures, together with reconciliations to IFRS, we believe we are enhancing investors’ understanding of our business and our results of operations, as well as assisting investors in evaluating how well we are executing our strategic initiatives.
Items excluded from the
Non-IFRS
Measures are significant components in understanding and assessing financial performance. The
Non-IFRS
Measures have limitations as analytical tools and should not be considered in isolation, or as an alternative to, or a substitute for loss for the year, revenue or other financial statement data presented in our consolidated financial statements as indicators of financial performance. Some of the limitations are:
| • |
such measures do not reflect revenue related to fulfilment, which is necessary to the operation of our business;
|
| • |
such measures do not reflect our expenditures, or future requirements for capital expenditures or contractual commitments;
|
| • |
such measures do not reflect changes in our working capital needs;
|
3
| • |
such measures do not reflect our share based payments, income tax benefit/(expense) or the amounts necessary to pay our taxes;
|
| • |
although depreciation and amortization are not included in the calculation of Adjusted EBITDA, the assets being depreciated and amortized will often have to be replaced in the future and such measures do not reflect any costs for such replacements; and
|
| • |
other companies may calculate such measures differently than we do, limiting their usefulness as comparative measures.
|
Due to these limitations, EBITDA and Adjusted EBITDA should not be considered as measures of discretionary cash available to us to invest in the growth of our business and are in addition to, not a substitute for or superior to, measures of financial performance prepared in accordance with IFRS. In addition, the
Non-IFRS
Measures we use may differ from the
non-IFRS
financial measures used by other companies and are not intended to be considered in isolation or as a substitute for the financial information prepared and presented in accordance with IFRS. Furthermore, not all companies or analysts may calculate similarly titled measures in the same manner. We compensate for these limitations by relying primarily on our IFRS results and using the
Non-IFRS
Measures only as supplemental measures.
We define our
non-IFRS
Measures and other financial and operating metrics as follows:
“Gross Margin” is defined as revenue less changes in inventory, raw materials and other consumables used.
“EBITDA” is defined as loss for the year before income tax credit, financial income, interest expenses, amortization and depreciation.
“Adjusted EBITDA” is defined as loss for the year before depreciation and amortization, income tax credits, and financial income and interest expense further adjusted to take account of the impact of certain non-cash and other items that we do not consider in our evaluation of ongoing operating performance. These non-cash and other items include, but not are limited to; change in fair value of convertible bonds and derivative warrants, share listing expenses, foreign exchange gains and losses, share based payments expense and other one-off expenses/income related to special operations.
Adjusted EBITDA provides a basis for comparison of our business operations between current, past and future periods by excluding items that we do not believe are indicative of our core operating performance. Adjusted EBITDA may not be comparable to other similarly titled metrics of other companies.
Refer to Item 5. “Operating and Financial Review and Prospects — A. Operating Results — Reconciliations of
Non-IFRS
and Other Financial and Operating Metrics” included elsewhere in this Annual Report for reconciliations of our
Non-IFRS
measures to the most directly comparable IFRS financial measures.
Market and Industry Data
We obtained industry, market and competitive position data in this Annual Report from our own internal estimates, surveys and research as well as from publicly available information, industry and general publications and research, surveys and studies conducted by third-parties, such as reports by Bloomberg New Energy Finance’s 1Q 2022 Electrified Transport Market Outlook published on March 10
th
, 2022 and the public 2021 BNEF EV Outlook 2021.
4
CAUTIONARY STATEMENT REGARDING FORWARD-LOOKING STATEMENTS
This Annual Report contains statements that constitute “forward-looking statements” within the meaning of the U.S. Private Securities Litigation Reform Act of 1995. These statements are neither historical facts nor assurances of future performance. Although we believe that these estimates and forward-looking statements are based upon reasonable assumptions, they are subject to numerous known and unknown risks and uncertainties, some of which are beyond our control, and are made in light of the information currently available to us. Our actual results or performance may differ materially from any future results or performance expressed or implied by these forward-looking statements.
The risks and uncertainties include, but are not limited to:
| • |
Wallbox’s ability to realize grow and manage growth, which may be affected by, among other things, competition;
|
| • |
risks relating to the outcome and timing of Wallbox’s development of its charging and energy management technology and related manufacturing processes;
|
| • |
the possibility that the expected timeframe for, and other expectations regarding the development and performance of, Wallbox products will differ from current assumptions;
|
| • |
intense competition in the electric vehicle charging space;
|
| • |
risks related to health pandemics, including the
COVID-19
pandemic, which could have a material adverse effect on its business, operating results and financial condition;
|
| • |
failure to attract and retain key employees and hire qualified management, technical, engineering and sales and business development personnel;
|
| • |
legal proceedings;
|
| • |
compliance with the continued listing standards of the NYSE;
|
| • |
volatility in the market price of Wallbox’s ordinary shares;
|
| • |
a loss or disruption with respect to Wallbox’s supply or manufacturing partners;
|
| • |
delays in the development of new products and product innovations;
|
| • |
the war between Russia and Ukraine;
|
| • |
Wallbox’s internal control over financial reporting;
|
| • |
product recalls or withdrawals, litigation or regulatory enforcement actions and/or material product liability claims;
|
| • |
the inability to obtain patents or otherwise protect Wallbox’s technology and intellectual property from unauthorized use by third parties;
|
| • |
governmental regulation and other legal obligations related to privacy, data protection and information security, and related governmental enforcement actions, litigation, fines and penalties or adverse publicity; and
|
| • |
other economic, business, and/or competitive factors.
|
Forward-looking statements are subject to known and unknown risks and uncertainties and are based on potentially inaccurate assumptions that could cause actual results to differ materially from those expected or implied by the forward-looking statements. Actual results could differ materially from those anticipated in forward-looking statements for many reasons, including the factors described in “
” herein. Accordingly, you should not rely on these forward-looking statements, which speak only as of the date hereof.
Risk Factors
5
Wallbox undertakes no obligation to publicly revise any forward-looking statement to reflect circumstances or events after the date hereof or to reflect the occurrence of unanticipated events.
In addition, statements that “Wallbox believes” and similar statements reflect Wallbox’s beliefs and opinions on the relevant subject. These statements are based on information available to Wallbox as of the date hereof. And while Wallbox believes that information provides a reasonable basis for these statements, that information may be limited or incomplete. Wallbox’s statements should not be read to indicate that it has conducted an exhaustive inquiry into, or review of, all relevant information. These statements are inherently uncertain, and you are cautioned not to unduly rely on these statements.
Although Wallbox believes the expectations reflected in the forward-looking statements were reasonable at the time made, it cannot guarantee future results, level of activity, performance or achievements. Moreover, neither Wallbox nor any other person assumes responsibility for the accuracy or completeness of any of these forward-looking statements. You should carefully consider the cautionary statements contained or referred to in this section in connection with the forward-looking statements contained herein and any subsequent written or oral forward-looking statements that may be issued by Wallbox or persons acting on its behalf.
6
RISK FACTOR SUMMARY
Our business is subject to numerous risks and uncertainties, including those described in Item 3. “Key Information — D. Risk Factors” included elsewhere in this Annual Report. You should carefully consider these risks and uncertainties when investing in our ordinary shares. Principal risks and uncertainties affecting our business include the following.
| • |
Wallbox is an early stage company with a history of operating losses, and expects to incur significant expenses and continuing losses at least for the near and medium-term.
|
| • |
Wallbox’s growth and success is highly correlated with and thus dependent upon the continuing rapid adoption of, and demand for EVs, as well as, availability of critical components needed for EVs and our products. Among other things, changes to fuel economy standards or the success of alternative fuels, or changes to rebates, tax credits and other financial incentives from governments, utilities and others to offset the purchase or operating cost of EVs and EV charging technology, may negatively impact the EV market and, thus, the demand for Wallbox’s products and services.
|
| • |
Wallbox has experienced rapid growth and expects to invest in its growth for the foreseeable future. If Wallbox fails to manage growth effectively, its business, operating results and financial condition would be adversely affected.
|
| • |
Wallbox currently faces competition from a number of companies and expects to continue to face significant competition in each of its markets in the future.
|
| • |
A loss or disruption with respect to Wallbox’s supply or manufacturing partners could negatively affect Wallbox’s business.
|
| • |
Wallbox expects to expend resources to maintain consumer awareness of its brands, build brand loyalty and generate interest in its products. Failure to effectively expand Wallbox’s sales and marketing capabilities could harm its ability to increase or maintain its customer base and achieve broader market acceptance of its products.
|
| • |
Wallbox is dependent on consumer adoption of its products. If Wallbox does not continue to offer a high quality product and user experience, its business, brand and reputation will suffer.
|
| • |
Growing Wallbox’s customer base depends upon the effective operation of Wallbox’s mobile applications with mobile operating systems, networks and standards that are beyond its control.
|
| • |
Wallbox may have to initiate product recalls or withdrawals or may be subject to litigation or regulatory enforcement actions and/or incur material product liability claims, which could increase its costs and harm Wallbox’s brand, reputation and adversely affect its business.
|
| • |
Wallbox has a significant presence in international markets and plans to continue to expand its international operations, which exposes it to a number of risks that could affect its future growth.
|
| • |
The ongoing military action between Russia and Ukraine could adversely affect Wallbox’s business, financial condition and results of operations.
|
| • |
Joint ventures that Wallbox is party to or that Wallbox enters into, including its joint venture in China, present a number of challenges that could have a material adverse effect on its business, operating results and financial condition.
|
| • |
Wallbox has acquired businesses and may acquire other businesses and/or companies, which could require significant management attention, disrupt its business, dilute shareholder value, and adversely affect its results of operations.
|
7
Part I
|
Item 1.
|
Identity of Directors, Senior Management and Advisers
|
Not applicable.
|
Item 2.
|
Offer Statistics and Expected Timetable
|
Not applicable.
|
Item 3.
|
Key Information
|
A. [Reserved]
B. Capitalization and Indebtedness
Not applicable.
C. Reasons for the Offer and Use of Proceeds
Not applicable.
D. Risk Factors
An investment in our Class A Shares involves a certain level of risk. You should carefully consider the risks and uncertainties described below, together with all of the other information in this Annual Report, including our audited consolidated financial statements and related notes, before deciding to invest in our Class A Shares. Additional risks not presently known to us or that we currently deem immaterial may also impair our business and operations. Our business, financial condition or results of operations could be materially and adversely affected by any of these risks. In addition to the effects of the
COVID-19
pandemic, current geopolitical unrest and the potential global supply disruptions included elsewhere in this Annual Report and in the important factors below, additional or unforeseen effects from the
COVID-19
pandemic and the global economic climate may give rise to or amplify many of the risks discussed below. The trading price of our Class A Shares could decline due to any of these risks, and you could lose all or part of your investment.
Risks Related to Wallbox’s Business
Wallbox is an early stage company with a history of operating losses, and expects to incur significant expenses and continuing losses at least for the near and medium-term.
Wallbox has a history of operating losses and negative operating cash flows. Wallbox incurred a net loss of €223.8 million and €11.4 million for the years ended December 31, 2021 and 2020, respectively. Wallbox believes it will continue to incur operating and net losses at least for the medium term. A significant portion of Wallbox’s operating expenses are fixed. Wallbox anticipates, due to, among other things, increased administrative expenses associated with Wallbox’s US listing and related regulations, it will again operate at a loss. Additional losses would impair Wallbox’s liquidity and may require us to raise additional capital or to curtail certain of Wallbox’s operations in an effort to preserve capital. Incurring additional losses could also erode investor confidence in Wallbox’s ability to manage Wallbox’s business effectively and result in a decline in the price of Shares. Even if Wallbox achieves profitability, there can be no assurance that it will be able to maintain profitability in the future. Wallbox may need to raise additional financing through loans, securities offerings or additional investments in order to fund its ongoing operations. There is no assurance that Wallbox will be able to obtain such additional financing or that it will be able to obtain such additional financing on favorable terms.
8
Wallbox’s growth and success is highly correlated with and thus dependent upon the continuing rapid adoption of, and demand for EVs, as well as, availability of critical components needed for EVs and our products. Among other things, changes to fuel economy standards or the success of alternative fuels, or changes to rebates, tax credits and other financial incentives from governments, utilities and others to offset the purchase or operating cost of EVs and EV charging technology, may negatively impact the EV market and, thus, the demand for Wallbox’s products and services.
Wallbox’s potential profitability and growth is highly dependent upon the continued adoption of Electric Vehicles (“EVs”) by consumers, businesses, and fleet operators continued support from regulatory programs and in each case, the use of Wallbox’s chargers and charging stations, any of which may not occur at the levels Wallbox currently anticipates or at all. The market for EVs is still rapidly evolving, characterized by rapidly changing technologies, increasing consumer choice as it relates to available EV models, their pricing and performance, evolving government regulation and industry standards, changing consumer preferences and behaviors, intensifying levels of concern related to environmental issues, and governmental initiatives related to climate change and the environment generally. Although demand for EVs has grown in recent years, there is no guarantee of continuing future demand. Residential, commercial and public charging may not develop as expected and may fail to attract projected market share of total EV charging. If the market for EVs develops more slowly than expected, or if demand for EVs decreases, Wallbox’s growth would be reduced and its business, prospects, financial condition and operating results would be harmed. The market for EVs could be affected by numerous factors, such as:
| • |
perceptions about EV features, quality, driver experience, safety, performance and cost;
|
| • |
perceptions about the limited range over which EVs may be driven on a single battery charge and about availability and access to sufficient public EV charging stations;
|
| • |
competition, including from other types of alternative fuel vehicles (such as hydrogen fuel cell vehicles),
plug-in
hybrid EVs and high fuel-economy internal combustion engine (“ICE”) vehicles;
|
| • |
increases in fuel efficiency in legacy ICE and hybrid vehicles;
|
| • |
volatility in the price of gasoline and diesel at the pump;
|
| • |
EV supply chain disruptions including but not limited to availability of certain components (such as semiconductors, microchips and lithium), ability of EV OEMs to
ramp-up
EV production, availability of batteries, and battery materials;
|
| • |
concerns regarding the stability of the electrical grid;
|
| • |
the decline of an EV battery’s ability to hold a charge over time;
|
| • |
availability of service for EVs;
|
| • |
consumers’ perception about the convenience, speed, and cost of EV charging;
|
| • |
government regulations and economic incentives, including adverse changes in, or expiration of, favorable tax incentives related to EVs, EV charging stations or decarbonization generally;
|
| • |
relaxation of government mandates or quotas regarding the sale of EVs;
|
| • |
the number, price and variety of EV models available for purchase; and
|
| • |
concerns about the future viability of EV manufacturers.
|
In addition, sales of vehicles in the automotive industry can be cyclical, which may affect growth in acceptance of EVs. It is uncertain how macroeconomic factors will impact demand for EVs, particularly since they can be more expensive than traditional gasoline-powered vehicles, when the automotive industry globally has been experiencing a recent decline in sales. Furthermore, because fleet operators often make large purchases of EVs, this cyclicality and volatility in the automotive industry may be more pronounced with commercial purchasers, and any significant decline in demand from these customers could reduce demand for EV charging and Wallbox’s products and services in particular.
9
While many global OEMs and several new market entrants have announced plans for new EV models, the lineup of EV models, with increasing charging needs, expected to come to market over the next several years may not materialize in that timeframe or may fail to attract sufficient customer demand. Demand for EVs may also be affected by factors directly impacting automobile prices or the cost of purchasing and operating automobiles, such as sales and financing incentives, prices of raw materials and parts and components, cost of fuel and governmental regulations, including tariffs, import regulation and other taxes. Volatility in demand may lead to lower vehicle unit sales, which may result in reduced demand for EV charging solutions and therefore adversely affect Wallbox’s business, financial condition and operating results.
As regulatory initiatives have required an increase in the mileage capabilities of cars and consumption of renewable transportation fuels, such as ethanol and biodiesel, consumer acceptance of EVs and other alternative vehicles has been increasing. However, the EV fueling model is different from gasoline and other fuel models, requiring behavior changes and education of businesses, consumers, regulatory bodies, local utilities, and other stakeholders. Further developments in, and improvements in affordability of, alternative technologies, such as renewable diesel, biodiesel, ethanol, hydrogen fuel cells or compressed natural gas, proliferation of hybrid powertrains involving such alternative fuels, or improvements in the fuel economy of the ICE vehicles, whether as the result of regulation or otherwise, may materially and adversely affect demand for EVs and EV charging stations in some market verticals. Regulatory bodies may also adopt rules that substantially favor certain alternatives to petroleum-based propulsion over others, which may not necessarily be EVs. Local jurisdictions may also impose restrictions on urban driving due to congestion, which may prioritize and accelerate micromobility trends and slow EV adoption growth. If any of the above cause or contribute to automakers reducing the availability of EV models or cause or contribute to consumers or businesses to no longer purchase EVs or purchase fewer of them, it would materially and adversely affect Wallbox’s business, operating results, financial condition and prospects.
The U.S. federal government, European states and some state and local governments provide incentives to end users and purchasers of EVs and EV charging stations in the form of rebates, tax credits, and other financial and behavioral incentives, such as payments for regulatory credits. The EV market relies on these governmental rebates, tax credits, and other financial incentives to significantly lower the effective price of EVs and EV charging stations. However, these incentives may expire on a particular date, end when the allocated funding is exhausted, or be reduced or terminated as a matter of regulatory or legislative policy. Any reduction in rebates, tax credits or other financial incentives could negatively affect the EV market and adversely impact Wallbox’s business operations and expansion potential. Furthermore, new tariffs and policy incentives could be put in place by the Biden Administration that favor equipment manufactured by or assembled at American factories, which may put Wallbox at a competitive disadvantage if it is not able to develop its U.S. manufacturing capacity on the timelines it currently expects or at all, including by increasing the cost or delaying the availability of charging equipment, by challenging or eliminating Wallbox’s ability to apply or qualify for grants and other government incentives, or by disqualifying Wallbox from the ability to compete for certain charging infrastructure buildout solicitations and programs, including those initiated by federal government agencies.
Similarly, even if new legislation incentivizes EV adoption, Wallbox cannot predict what form such incentives may take at this time. If Wallbox is not eligible for grants or other incentives under such programs, while Wallbox’s competitors are, it may adversely affect Wallbox’s competitiveness or results of operation.
Wallbox has experienced rapid growth and expects to invest in its growth for the foreseeable future. If Wallbox fails to manage growth effectively, its business, operating results and financial condition would be adversely affected.
Wallbox has experienced rapid growth in recent periods. For example, Wallbox’s revenues for the year ended December 31, 2021 have grown 263.8% as compared to the year ended December 31, 2020. The expected continued growth and expansion of Wallbox’s business may place a significant strain on management, business operations, financial condition and infrastructure and corporate culture.
10
With continued growth, Wallbox’s information technology systems and Wallbox’s internal control over financial reporting and procedures may not be adequate to support its operations and may allow data security incidents that may interrupt business operations and allow third parties to obtain unauthorized access to business information misappropriate funds. Wallbox may also face risks to the extent such third parties infiltrate the information technology infrastructure of its contractors.
To manage growth in operations and personnel, Wallbox will need to continue to improve its operational, financial and management controls and reporting systems and procedures. Failure to manage growth effectively could result in difficulty or delays in attracting new customers, declines in quality or customer satisfaction, increases in costs, difficulties in introducing new products and services or enhancing existing products and services, loss of customers, information security vulnerabilities or other operational difficulties, any of which could adversely affect Wallbox’s business performance and operating results. Wallbox’s strategy is based on a combination of growth and maintenance of strong performance, and any inability to scale, maintain customer experience related to its charging products or charging stations may impact Wallbox’s growth trajectory and results of operations.
Wallbox’s estimates of market opportunity and forecasts of market growth may prove to be inaccurate.
Market opportunity estimates and growth forecasts, whether obtained from third-party sources or developed internally, are subject to significant uncertainty and are based on assumptions and estimates that may prove to be inaccurate. This is especially so at the present time due to the uncertain and rapidly changing projections of the severity, magnitude and duration of the
COVID-19
pandemic. The estimates and forecasts included in this Annual Report relating to the size and expected growth of the target market, market demand and EV adoption may also prove to be inaccurate. In particular, estimates regarding the current and projected market opportunity for public and residential charging or Wallbox’s market share related to that opportunity are difficult to predict. The estimated addressable market may not materialize in the timeframe of the projections included herein, if ever, and even if the markets meet the size estimates and growth estimates presented in this Annual Report, Wallbox’s business could fail to grow at similar rates.
Wallbox currently faces competition from a number of companies and expects to continue to face significant competition in each of its markets in the future.
The EV charging market is relatively new and Wallbox currently faces competition from a number of EV charging companies and may face increasing competition from other competitors that may enter the space including but not limited to OEMs, utilities, tech companies, solar companies that branch into EV charging, and other new entrants. The principal competitive factors in the industry include consumer awareness and brand recognition of Wallbox’s residential charging products; technical features of chargers in respect of both hardware and software; relationships with localities and utilities; charger connectivity to EVs and ability to charge all standards; software-enabled services offering and overall customer experience; brand, track record and reputation; access to component vendors and OEMs, service providers, installation professionals; and policy incentives and pricing.
Wallbox has varying levels of penetration in its markets and those markets are characterized by unique competitive dynamics. For example, the European EV charging market can be characterized as fragmented.
There are many small and local players, with only a limited number of parties having sufficient scale and funding to be competitive in the long term. Especially due to the strong government incentives currently in place, EV sales are expected to increase rapidly in Europe. From a competitive perspective, the North American market has high barriers to entry due to strict certification and validation requirements. Therefore, this market differs from Europe as the market is less fragmented with only a few large players. Similar to the European market, the APAC market can be characterized as a highly fragmented market with less than a handful of players that have gained significant scale in the industry. From a technology and pricing perspective, EV charging solutions in
11
APAC are cost-competitive as they can be manufactured at a lower cost point. Wallbox’s growth in each of its markets requires differentiating itself as compared to its competition. If Wallbox is unable to penetrate, or further penetrate, the market in each of the geographies in which it operates or intends to operate, its future revenue growth and profits may be impacted. In addition, there are competitors, in particular those with limited funding, experience or commitment to quality assurance, which could cause poor experiences, hampering overall EV adoption or trust in any particular provider. Further, Wallbox’s current or potential competitors may be acquired by third parties with different commercial objectives and imperatives and greater available resources.
Additionally, future changes in charging preferences; the development of inductive EV charging capabilities; battery chemistries, ultralong-range batteries or energy storage technologies, industry standards or applications; driver behavior or battery EV efficiency may develop in ways that limit Wallbox’s future share gains in certain high promising markets or slow the growth of Wallbox’s addressable market. Wallbox may face competition from other EV charging technologies, such as battery swapping technology or wireless / inductive charging, or technologies which may be developed in the future. Competitors may be able to respond more quickly and effectively than Wallbox to new or changing opportunities, technologies, standards or customer requirements, and may be better equipped to initiate or withstand substantial price competition.
The EV charging business may become more competitive, pressuring future increases in utilization and margins. Competition is still developing and is expected to increase as the number of EVs sold increases. New competitors or alliances may emerge in the future that secure greater market share, have proprietary technologies that drivers prefer, more effective marketing abilities and/or face different financial hurdles, which could put Wallbox at a competitive disadvantage.
Further, Wallbox’s current strategic initiatives may fail to result in a sustainable competitive advantage for Wallbox. Future competitors could also be better positioned to serve certain segments of Wallbox’s current or future target markets, which could create price pressure or erode Wallbox’s market share. In light of these factors, current or potential customers may utilize charging services of competitors. If Wallbox fails to adapt to changing market conditions or continue to compete successfully with current charging product providers or new competitors, its growth will be inhibited, adversely affecting its business and results of operations.
Wallbox faces risks related to health pandemics, including the
COVID-19
pandemic, which could have a material adverse effect on its business, operating results and financial condition.
On March 11, 2020, the World Health Organization upgraded the emergency public healthcare situation triggered by the outbreak of Coronavirus disease 2019
(COVID-19)
to an international pandemic. The unfolding of events in Spain and worldwide, has led to an unprecedented health crisis, which has had an impact on the macroeconomic climate and on business performance. In order to confront this situation, a series of measures were adopted in 2020 to address the economic and social impacts of
COVID-19
which have led to mobility restrictions on the population. In particular, amongst other measures, governments worldwide have declared states of emergency or similar measures that have imposed restrictions on the movement of people and on the opening hours of businesses, severely impacting local economies. These kinds of restrictions continue to be applied in the majority of the countries in which Wallbox operates.
The impact of
COVID-19,
including changes in consumer and business behavior, pandemic fears and market downturns and restrictions on business and individual activities, has created significant volatility in the global and domestic economies and led to reduced economic activity. Additionally, the spread of
COVID-19
has created charging equipment supply chain and shipping constraints.
COVID-19
has also disrupted the manufacturing, delivery and overall supply chain of vehicle manufacturers and suppliers and has led to a decrease in vehicle sales, including EV sales, in markets around the world, and the accompanying demand for Wallbox charging products and services. Any sustained downturn in demand for EVs would harm Wallbox’s business and negatively impact growth.
12
The pandemic has resulted in government authorities implementing numerous measures to try to contain
or
orders, and business shutdowns. These measures adversely impact Wallbox’s employees and operations and the operations of its customers, suppliers, vendors and business partners and negatively impact demand for EV charging. These measures by government authorities may remain in place for a significant period of time and may adversely affect manufacturing and building plans, sales and marketing activities, business and results of operations.
COVID-19,
such as travel bans and restrictions, quarantines,
stay-at-home
shelter-in-place
Wallbox may take further actions as may be required by government authorities or that it determines are in the best interests of its employees, customers, suppliers, vendors and business partners. There is no certainty that such actions will be sufficient to mitigate the risks posed by
COVID-19
or otherwise be satisfactory to government authorities. If significant portions of Wallbox’s workforce are unable to work effectively, including due to illness, quarantines, social distancing, government actions or other restrictions in connection with the
COVID-19
pandemic, its operations will be negatively impacted. Furthermore, if significant portions of its customers are subject to stay at home orders or otherwise work remotely or are not traveling via EV for sustained periods of time, user demand for charging and services will decline.
The extent to which the
COVID-19
pandemic impacts Wallbox’s business, prospects and results of operations will depend on future developments, which are highly uncertain and cannot be predicted, including, but not limited to, the duration, spread and severity of the pandemic, the actions to contain
COVID-19
or treat its impact, and when and to what extent normal economic and operating activities can resume. The
COVID-19
pandemic could limit the ability of customers, suppliers, vendors, OEMs, utilities and business partners to perform, including third party suppliers’ ability to provide components and materials used in charging products and stations or in providing installation or maintenance services. Even after the
COVID-19
pandemic has subsided, Wallbox may continue to experience an adverse impact to its business as a result of the pandemic’s global economic impact, including any recession that has occurred or may occur in the future. Specifically, difficult macroeconomic conditions, such as decreases in per capita income and level of disposable income, increased and prolonged unemployment or a decline in consumer confidence as a result of the
COVID-19
pandemic, as well as reduced spending by businesses, could each have a material adverse effect on the demand for Wallbox’s products and services.
A loss or disruption with respect to Wallbox’s supply or manufacturing partners could negatively affect Wallbox’s business.
Wallbox relies on a limited number of vendors and OEMs for manufacturing of components of its charging products which at this stage of the industry is unique to each supplier and thus singularly sourced with respect to components. This reliance on a limited number of vendors and OEMs increases Wallbox’s risks, since, for a select number of its components, it does not currently have proven reliable alternative or replacement vendors beyond these key parties. In the event of production interruptions or supply chain disruptions including but not limited to availability of certain key components such as semiconductors, which have recently experienced supply shortages that have significantly affected the overall automotive industry, Wallbox may not be able to take advantage of increased production from other sources or develop alternate or secondary vendors without incurring material additional costs and substantial delays. Thus, Wallbox’s business would be adversely affected if one or more of its vendors or OEMs is impacted by any interruption at a particular location.
As the demand for EV charging increases, vendors and OEMs may not be able to dedicate sufficient supply chain, production, or sales channel capacity to keep up with the required pace of charging product and infrastructure expansion. Global supply chains continue to experience a period of unprecedented disruption, in addition to which, as the EV market grows, the industry may be exposed to deteriorating design requirements, undetected faults or the erosion of testing standards by charging equipment and component suppliers, which may adversely impact the performance, reliability and lifecycle cost of the chargers. If Wallbox or its suppliers experience a significant increase in demand, or if Wallbox needs to replace an existing supplier, it may not be possible to supplement service or replace them on acceptable terms, which may undermine its ability to make
13
sales and timely deliveries of chargers. For example, it may take a significant amount of time to identify a vendor that has the capability and resources to supply components in sufficient volume. Identifying and approving suitable vendors could be an extensive process that requires Wallbox to become satisfied with their quality control, technical capabilities, responsiveness and service, financial stability, regulatory compliance, and labor and other ethical practices. Accordingly, a loss of any significant vendor or OEM would have an adverse effect on Wallbox’s business, financial condition and operating results.
Further, should the U.S. Government require that charging equipment be manufactured in the U.S. in order to access federal financial support or secure contracts with the federal government, Wallbox may have to source components from alternative vendors or OEMs or work with current vendors and OEMs to develop additional manufacturing capacity in the U.S. to participate in the covered federal programs.
Wallbox is dependent upon the efforts of certain key personnel. If Wallbox is unable to attract and retain key employees and hire qualified management, technical, engineering and sales and business development personnel, its ability to compete and successfully grow its business would be harmed. Furthermore, the loss of such key personnel could negatively impact the operations and financial results of Wallbox’s business.
Wallbox’s success is dependent on the continued services of certain key personnel, particularly Wallbox’s
co-founders,
Enric Asunción Escorsa and Eduard Castañeda, Jordi Lainz, Wallbox’s Chief Financial Officer and Oriol Riba, Wallbox’s Chief Operations Officer. From time to time, there may be changes in Wallbox’s executive management team resulting from the hiring or departure of executives, which could disrupt Wallbox’s business. The replacement of one or more of Wallbox’s executive officers or other key employees may involve significant time and costs and may significantly delay or prevent the achievement of Wallbox’s business objectives. Wallbox also does not maintain any key person life insurance policies.
To continue to execute Wallbox’s growth strategy, it also must attract and retain highly skilled personnel. Competition is intense for qualified professionals. Wallbox may experience difficulty in hiring and retaining highly skilled personnel with appropriate qualifications. The pool of qualified personnel with experience working in Wallbox’s market is limited overall. In addition, many of the companies with which Wallbox competes for experienced personnel have greater resources.
Volatility in the price of shares may, therefore, negatively impact Wallbox’s ability to attract or retain highly skilled personnel. Further, the requirement to expense stock options and other equity-based compensation may discourage Wallbox from granting the size or type of stock option or equity awards that job candidates require to join Wallbox. Failure to attract new personnel or failure to retain and motivate Wallbox’s current personnel, could harm Wallbox’s business.
Additionally, Wallbox’s future success depends on its ability to continue to attract, retain and motivate highly skilled employees, software engineers and other employees with the technical skills in design and engineering that will enable us to deliver quality EV charging products and energy management solutions. Competition for highly skilled employees in Wallbox’s industry is intense, and it expects certain of its key competitors, who generally are larger than Wallbox and have access to more substantial resources, to pursue top talent even more aggressively.
Wallbox’s success depends, in part, on its continuing ability to identify, attract, hire, train and develop, and retain highly qualified personnel. The inability to do so effectively would adversely affect its business. Competition for employees can be intense and the ability to attract, hire and retain them depends on Wallbox’s ability to provide meaningful work at competitive compensation. Wallbox may not be able to attract, assimilate, develop or retain qualified personnel in the future, and failure to do so would adversely affect its business, including the execution of its global business strategy.
14
Wallbox’s customers are not under long-term contract and its customer orders may fluctuate.
Wallbox does not have commitments greater than one year from any of its customers, and it may not be able to retain customers or attract new customers that provide it with revenue that is comparable to the revenue generated by any customers it may lose. The duration of the contracts Wallbox does have with its distribution partners is typically one year and such contracts may contain termination clauses and do not provide for minimum volumes or other commitments to purchase Wallbox’s chargers. Additionally, many of the orders for future deliveries of Wallbox’s Supernova charging station are currently under
non-binding
letters of intent and may not provide the same level of certainty as if such orders were under binding contracts. Wallbox’s distributor, reseller, and installer customers, which accounted for approximately 46% of its sales, as of December 31, 2021, place orders with it on an ad hoc basis and direct sales made directly through Wallbox’s website or via Amazon accounted for approximately 11% of its sales as of December 31, 2021. Because Wallbox’s customers do not have long-term contracts, it may be difficult for Wallbox to accurately predict future revenue streams. Wallbox cannot provide assurance that current customers will continue to use its products or services or that it will be able to replace departing customers with new customers that provide it with comparable revenue. Wallbox also has in the past experienced customer concentration, with Iberdrola representing greater than 16% of its revenues for fiscal 2019, 8% for fiscal 2020 and 6% for fiscal 2021. The loss of a key customer, including but not limited to Iberdrola, could have a material impact on Wallbox’s business.
Wallbox expects to expend resources to maintain consumer awareness of its brands, build brand loyalty and generate interest in its products. Failure to effectively expand Wallbox’s sales and marketing capabilities could harm its ability to increase or maintain its customer base and achieve broader market acceptance of its products.
Wallbox’s ability to grow its customer base, achieve broader market acceptance, grow revenue, and achieve and sustain profitability will depend, to a significant extent, on its ability to effectively expand its sales and marketing operations and activities, which will require significant investment. Wallbox had €7.3 and €1.4 million, respectively, in marketing expenses in each of the years ended December 31, 2021 and 2020, and expects to expend more resources in the future in order to build consumer awareness of its brands. Wallbox relies on its business development, sales and marketing teams to obtain new customers and grow its retail business. Wallbox plans to continue to expand in these functional areas but it may not be able to recruit and hire a sufficient number of competent personnel with requisite skills, technical expertise and experience, which may adversely affect its ability to expand its sales capabilities. The hiring process can be costly and time-consuming, and new employees may require significant training and time before they achieve full productivity. Recent hires and planned hires may not become as productive as quickly as anticipated, and Wallbox may be unable to hire or retain sufficient numbers of qualified individuals. Wallbox’s ability to achieve significant revenue growth in the future will depend, in large part, on its success in recruiting, training, incentivizing and retaining a sufficient number of qualified personnel attaining desired productivity levels within a reasonable time. Wallbox’s business will be harmed if investment in personnel related to business development and related company activities does not generate a significant increase in revenue.
Wallbox relies on third-parties that Wallbox does not control for many aspects of its business, marketing and distribution channels, and its failure to manage and maintain relationships with such third-parties, or any failure by such third-parties to promote or maintain the brand and quality of Wallbox products, could harm its brand, reputation and adversely affect its business. Furthermore, Wallbox is dependent on third parties for installations, which are subject to risks associated with cost overruns and delays. Third parties may improperly install our products, which may result in additional costs to Wallbox and may adversely affect Wallbox’s brand, reputation and business.
Wallbox sells its EV charging solutions through various channels. Wallbox has built and maintains an ecosystem of partner channels including, installers, resellers and
value-add
distributors. Wallbox provides marketing materials, training and support to its partners to improve sales and enters into contracts with such
15
parties governing certain aspects of their conduct; however, Wallbox does not ultimately control such parties. Wallbox’s failure to manage and maintain relationships with such third-parties, or any failure by such third-parties to promote or maintain the brand and quality of Wallbox products, could harm its brand, reputation and adversely affect its business.
Additionally, Wallbox does not typically install its charging products or charging stations. Wallbox offers installation service through its certified installer network that is intended to ensure installation according to local governmental and industrial standards; however, these installation services are often offered through third parties that Wallbox does not control. The installation of charging products, particularly its charging stations, is generally subject to oversight and regulation in accordance with state and local laws and ordinances. Installations are subject to risks associated with cost overruns and delays. Third parties may improperly install Wallbox’s products, which may damage or break Wallbox products and give the
end-user
the perception the product is faulty and may adversely affect Wallbox’s brand, reputation and business.
Wallbox’s business model is predicated on the presence of qualified and capable installation professionals in the new markets it intends to enter. There is no guarantee that there will be an adequate supply of such partners.
A shortage in the number of qualified contractors may impact the viability of the business plan, increase risks around the quality of works performed and increase costs if outside contractors are brought into a new market.
Negative publicity or product quality issues, whether real or perceived, could tarnish Wallbox’s reputation and its brand image. Failure to maintain, enhance and protect Wallbox’s brand image could have a material adverse effect on its results of operations. In addition, any failure to meet customer specifications could result in reduced net sales and income.
Wallbox is dependent on consumer adoption of its products. If Wallbox does not continue to offer a high quality product and user experience, its business, brand and reputation will suffer.
A failure or inability by Wallbox to meet customer specifications or consumer expectations could damage its reputation and adversely affect its ability to attract new business and result in delayed or lost sales. Wallbox’s ability to create, maintain, enhance and protect its brand image and reputation and consumers’ connection to its brand depends in part on its design and marketing efforts. Negative publicity or product quality issues, whether real or perceived, could tarnish Wallbox’s reputation and brand image. Failure to maintain, enhance and protect Wallbox’s brand image could have a material adverse effect on its results of operations. In addition, any failure to meet customer specifications could result in reduced revenues and increased net losses.
Computer malware, viruses, ransomware, hacking, phishing attacks and other network disruptions could result in security and privacy breaches, loss of proprietary information and interruption in service, which would harm Wallbox’s business.
Computer malware, viruses, physical or electronic
break-ins
and similar disruptions could lead to interruption and delays in Wallbox’s services and operations and loss, misuse or theft of data. Computer malware, viruses, ransomware, hacking, phishing attacks or denial of service, against online networks have become more prevalent and may occur on Wallbox’s systems. Any attempts by cyber attackers to disrupt Wallbox’s services or systems, if successful, could harm its business, introduce liability to data subjects, result in the misappropriation of funds, be expensive to remedy and damage its reputation or brand. Insurance may not be sufficient to cover significant expenses and losses related to cyber-attacks. Even with the security measures implemented by Wallbox, Wallbox’s facilities and systems, and those of Wallbox’s third-party service providers, could be vulnerable to security breaches, computer viruses, lost or misplaced data, programming errors, scams, burglary, human errors, acts of vandalism, or other events. Efforts to prevent cyber attackers from entering computer systems are expensive to implement, and Wallbox may not be able to cause the implementation or
16
enforcement of such preventions with respect to its third-party vendors. Though it is difficult to determine what, if any, harm may directly result from any specific interruption or attack, any failure to maintain performance, reliability, security and availability of systems and technical infrastructure may, in addition to other losses, harm Wallbox’s reputation, brand and ability to attract customers, even if such actions do not result in any actual security breach or loss of data.
There are several factors ranging from human error to data corruption that could materially impact the efficacy of any processes and procedures designed to enable Wallbox to recover from a disaster or catastrophe, including by lengthening the time services are partially or fully unavailable to customers and users. It may be difficult or impossible to perform some or all recovery steps and continue normal business operations due to the nature of a particular cyber-attack, disaster or catastrophe or other disruption, especially during peak periods, which could cause additional reputational damages, or loss of revenues, any of which would adversely affect its business and financial results.
Growing Wallbox’s customer base depends upon the effective operation of Wallbox’s mobile applications with mobile operating systems, networks and standards that are beyond its control.
Wallbox is dependent on the interoperability of its mobile applications with popular mobile operating systems that Wallbox does not control, such as Google’s Android and Apple’s iOS, and any changes in such systems that degrade Wallbox’s products’ functionality or give preferential treatment to competitive products could adversely affect the usage of Wallbox’s applications on mobile devices. Additionally, in order to deliver high quality mobile products, it is important that Wallbox’s products work well with a range of mobile technologies, systems, networks and standards that Wallbox does not control. Wallbox may not be successful in developing relationships with key participants in the mobile industry or in developing products that operate effectively with these technologies, systems, networks or standards.
In addition, a significant portion of Wallbox’s software platform depends on its interest in and partnership with Electromaps, an electromobility and EV charging management platform. Wallbox is dependent on Electromaps for a portion of its revenues and to build consumer awareness of its brand and products. Widespread adoption of charging payment mobile platforms or other charging solutions as a competitor with, or an alternative to, Electromaps may negatively impact its business, operating results and financial condition. In order to execute on its business model, Electromaps will need to develop a network of operators of charging stations with integrated payment infrastructure and generate sufficient downloads of its mobile application to take advantage of network effects.
Disruption of operations, including as a result of natural disasters, at Wallbox’s manufacturing sites or those of third-party suppliers could prevent Wallbox from filling customer orders on a timely basis and adversely affect its reputation and results of operations.
Events beyond Wallbox’s control could have an adverse effect on its business, financial condition, results of operations and cash flows. Disruption to Wallbox’s platform resulting from natural disasters, political events, war, terrorism, pandemics or other reasons could impair its ability to continue to provide its products and services. Similarly, disruptions in the operations of its key third-parties, such as data centers, servers or other technology providers, could have a material adverse effect on its business. If any of these events were to occur, Wallbox’s business, results of operations, or financial condition could be adversely affected.
Wallbox’s business is significantly dependent on its ability to meet labor needs, and Wallbox may be subject to work stoppages at its facilities or at the facilities of its supply and manufacturing partners, which could negatively impact the profitability of Wallbox’s business.
The success of Wallbox’s business depends significantly on its ability to hire and retain quality employees, including at its manufacturing and distribution facilities, many of whom are skilled. Wallbox may be unable to
17
meet its labor needs and control its costs due to external factors such as the availability of a sufficient number of qualified persons in the workforce of the markets in which it operates, unemployment levels, demand for certain labor expertise, prevailing wage rates, wage inflation, changing demographics, health and other insurance costs, adoption of new or revised employment and labor laws and regulations, and the impacts of
man-made
or natural disasters, such as tornadoes, hurricanes, and the
COVID-19
pandemic. Should Wallbox fail to increase its wages competitively in response to increasing wage rates, the quality of its workforce could decline. Any increase in the cost of labor could have an adverse effect on Wallbox’s operating costs, financial condition and results of operations. If Wallbox is unable to hire and retain skilled employees, its business could be materially adversely affected.
If Wallbox’s employees or the employees of its manufacturing and supply partners were to engage in a strike, work stoppage or other slowdown in the future, it could experience a significant disruption of its operations, which could interfere with its ability to deliver products on a timely basis and could have other negative effects, such as decreased productivity and increased labor costs. Any interruption in the delivery of Wallbox’s products could reduce demand for its products and could have a material adverse effect on Wallbox.
Wallbox may have to initiate product recalls or withdrawals or may be subject to litigation or regulatory enforcement actions and/or incur material product liability claims, which could increase its costs and harm Wallbox’s brand, reputation and adversely affect its business.
As a manufacturer, marketer and retailer, Wallbox may initiate product recalls or withdrawals, or may be subject to seizures, product liability or other litigation claims and adverse public relations if its products are defective or alleged to cause injury, or if Wallbox is alleged to have violated governmental regulations in the manufacture, sale or distribution of any products, whether caused by it or someone in its manufacturing or supply chain. Wallbox also offers warranties on many of its products which may result in additional payments in the future if its products prove to be defective.
A product recall, withdrawal or seizure could result in destruction of product inventory and inventory
write-off,
negative publicity, temporary facility closings for Wallbox or its contract manufacturers or OEMs, supply chain interruption, fines, substantial and unexpected expenditures, which would reduce operating profit and cash flow. In addition, a product recall, withdrawal or seizure may require significant management attention. Product recalls may materially and adversely affect consumer confidence in Wallbox’s brands, hurt the value of its brands and lead to decreased demand for its products and decline in price charged for its products. Product recalls, withdrawals or seizures also may lead to increased scrutiny by federal, state or international regulatory agencies of Wallbox’s operations and increased litigation and could have a material adverse effect on its business, results of operations, financial condition and cash flows.
Wallbox may be subject to various product liability claims, particularly as it expands in the United States. Any such product liability claims may also include allegations of defects in manufacturing, defects in design, a failure to warn of dangers inherent in the product, negligence, strict liability, or a breach of warranties. Claims could also be asserted under state consumer protection laws. If Wallbox cannot successfully defend itself against product liability claims, it may incur substantial liabilities or be required to limit commercialization of its existing products. Even successful defense would require significant financial and management resources. In addition, Wallbox’s inability to obtain or maintain sufficient insurance coverage at an acceptable cost or to otherwise protect against potential product liability claims could prevent or inhibit the development and commercial production and sale of its products, which could adversely affect its business, financial condition, results of operations, and prospects.
Wallbox is subject to extensive environmental, health and safety laws and regulations which, if not met, could have a material adverse effect on its business, financial condition and results of operations.
Wallbox and its operations, as well as those of Wallbox’s contractors, suppliers, and customers, are subject to certain environmental laws and regulations, including laws related to the use, handling, storage, transportation,
18
and disposal of hazardous substances and wastes as well as electronic wastes and hardware, whether hazardous or not. These laws may require Wallbox or others in Wallbox’s value chain to obtain permits and comply with procedures that impose various restrictions and obligations that may have material effects on Wallbox’s operations. If key permits and approvals cannot be obtained on acceptable terms, or if other operational requirements cannot be met in a manner satisfactory for Wallbox’s operations or on a timeline that meets Wallbox’s commercial obligations, it may adversely impact its business.
Throughout the world, electrical appliances are subject to various mandatory and voluntary standards, including requirements in some jurisdictions, including the United States, that products be listed by Underwriters’ Laboratories, Inc. or other similar recognized laboratories. In the United States, Wallbox is required to undergo certification and testing of compliance with UL standards, as well as other national and industry specific standards. Wallbox endeavors to have its products designed to meet the certification requirements of, and to be certified in, each of the jurisdictions in which they are sold. Compliance with such certifications could be costly and if Wallbox or its products were to fail to comply with any such certifications, it could be limited in its ability to sell and market its products, which would have a material adverse effect on its business financial condition and results of operations.
Environmental and health and safety laws and regulations can be complex and may be subject to change, such as through new requirements enacted at the supranational, national,
sub-national,
and/or local level or new or modified regulations that may be implemented under existing law. The nature and extent of any changes in these laws, rules, regulations and permits may be unpredictable and may have material effects on Wallbox’s business. Future legislation and regulations or changes in existing legislation and regulations, or interpretations thereof, including those relating to hardware manufacturing, electronic waste, or batteries, could cause additional expenditures, restrictions and delays in connection with Wallbox’s operations as well as other future projects, the extent of which cannot be predicted. California may adopt more stringent regulation for DC fast charging by 2024.
Further, Wallbox currently relies on third parties to ensure compliance with certain environmental laws, including those related to the disposal of hazardous and
non-hazardous
wastes. Wallbox generally does not manufacture the components of its charging products. Rather, its employees and contractors engage in assembly of charging products at its facilities primarily using components manufactured by OEMs. Nonetheless, any failure to properly handle or dispose of wastes, regardless of whether such failure is Wallbox’s or its contractors, may result in liability under environmental laws in the United States, including, but not limited to, the Comprehensive Environmental Response, Compensation and Liability Act (“CERCLA”) and state analogs, under which liability may be imposed without regard to fault or degree of contribution for the investigation and
clean-up
of contaminated sites, as well as impacts to human health and damages to natural resources. Wallbox may also generate or dispose of solid wastes, which may include hazardous wastes that are subject to the requirements of the Resource Conservation and Recovery Act (“RCRA”), and comparable state statutes. While RCRA regulates both solid and hazardous wastes, it imposes strict requirements on the generation, storage, treatment, transportation and disposal of hazardous wastes. Certain components of Wallbox’s chargers may be excluded from RCRA’s hazardous waste regulations, provided certain requirements are met. However, if these components do not meet all of the established requirements for the exclusion, or if the requirements for the exclusion change, Wallbox may be required to treat such products as hazardous waste, which are subject to more rigorous and costly disposal requirements. Any such changes in the laws and regulations, or Wallbox’s ability to qualify the materials it uses for exclusions under such laws and regulations, could adversely affect Wallbox’s operating expenses. Additionally, Wallbox may not be able to secure contracts with third parties to continue their key supply chain and disposal services for its business, which may result in increased costs for compliance with environmental laws and regulations.
19
Wallbox has a significant presence in international markets and plans to continue to expand its international operations, which exposes it to a number of risks that could affect its future growth.
Expansion into new international markets requires additional management attention and resources in order to tailor Wallbox’s solutions to the unique aspects of each country. In addition, Wallbox faces the following additional risks associated with Wallbox’s expansion into international locations:
| • |
challenges caused by distance, language and cultural differences;
|
| • |
longer payment cycles in some countries;
|
| • |
credit risk and higher levels of payment fraud;
|
| • |
compliance with applicable foreign laws and regulations, including laws and regulations with respect to privacy, consumer protection, spam and content, and the risk of penalties to Wallbox’s customers and individual members of management if its practices are deemed to be out of compliance;
|
| • |
compliance with changing energy, electrical, and power regulations;
|
| • |
unique or different market dynamics or business practices;
|
| • |
currency exchange rate fluctuations;
|
| • |
foreign exchange controls;
|
| • |
political and economic instability and export restrictions;
|
| • |
potentially adverse tax consequences; and
|
| • |
higher costs associated with doing business internationally.
|
These risks could harm Wallbox’s international expansion efforts, which could have a materially adverse effect on its business, financial condition or results of operations.
Joint ventures that Wallbox is party to or that Wallbox enters into, including its joint venture in China, present a number of challenges that could have a material adverse effect on its business, operating results and financial condition.
Wallbox has entered into joint ventures, including Wallbox’s FAWSN JV in China. These transactions typically involve a number of risks and present financial, managerial and operational challenges, including the existence of unknown potential disputes, liabilities or contingencies that arise after entering into the joint venture related to the counterparties to such joint ventures, with whom it shares control. Wallbox could experience financial or other setbacks if transactions encounter unanticipated problems due to challenges, including problems related to execution or integration. In some cases, Wallbox’s joint venture partner may have a contractual commitment to provide funding to the joint venture, although Wallbox does not have assurances that they will satisfy such obligations. With respect to Wallbox’s JV in China, economic uncertainty in China could also cause delays or make financing of operations more difficult. Any of these risks could reduce Wallbox’s revenues or increase Wallbox’s expenses, which could adversely affect Wallbox’s results of operations and cash flows.
Sustained uncertainty about, or worsening of, current global economic conditions and further escalation of trade tensions between the U.S. and its trading partners, especially China, could result in a global economic slowdown and long-term changes to global trade, including retaliatory trade restrictions that could further restrict Wallbox’s ability to operate in China. The Chinese economic, legal, and political landscape also differs from other countries in many respects, including the level of government involvement and regulation, control of foreign exchange and allocation of resources and uncertainty regarding the enforceability and scope of protection for intellectual property rights. The laws, regulations and legal requirements in China are also subject to frequent changes and the exact obligations under and enforcement of laws and regulations are often subject to unpublished
20
internal government interpretations and policies which makes it challenging to ascertain compliance with such laws. For example, the current government-imposed lockdown in Shanghai could result in a delay in our receipt of certain raw materials and components, as well as delays in customer deliveries.
Wallbox has acquired businesses and may acquire other businesses and/or companies, which could require significant management attention, disrupt its business, dilute shareholder value, and adversely affect its results of operations.
As part of Wallbox’s business strategy, it has made and may make future investments in or acquisitions of complementary companies, products or technologies. These activities involve significant risks to its business. Wallbox may not be able to find suitable acquisition candidates, and it may not be able to complete such acquisitions on favorable terms, if at all. If Wallbox does complete acquisitions, they may not ultimately strengthen its competitive position. Any acquisitions Wallbox completes could be viewed negatively by its partners and clients, which could have an adverse impact on its business. In addition, if Wallbox is unsuccessful at integrating employees or technologies acquired, its financial condition and results of operations, including revenue growth, could be adversely affected. Any acquisition and subsequent integration will require significant time and resources. Wallbox may not be able to successfully evaluate and use the acquired technology or employees, or otherwise manage the acquisition and integration processes successfully. Wallbox will be required to pay cash, incur debt and/or issue equity securities to pay for any such acquisition, each of which could adversely affect its financial condition. Wallbox’s use of cash to pay for acquisitions would limit other potential uses of its cash, including investments in sales and marketing and product development organizations, and in infrastructure to support scalability. The issuance or sale of equity or convertible debt securities to finance any such acquisitions would result in dilution to shareholders. If Wallbox incurs debt, it would result in increased fixed obligations and could also impose covenants or other restrictions that could impede its ability to manage its operations.
Wallbox’s results of operations may fluctuate due to variability in its revenues.
Wallbox’s results may fluctuate in the future due to a variety of factors, many of which are beyond its control.
In addition to the other risks described herein, the following factors could also cause Wallbox’s results of operations to fluctuate:
| • |
the timing and volume of new sales;
|
| • |
fluctuations in costs;
|
| • |
the timing of new product rollouts;
|
| • |
weaker than anticipated demand for charging products and stations, whether due to changes in government incentives and policies or due to other conditions;
|
| • |
fluctuations in sales and marketing, business development or research and development expenses;
|
| • |
supply chain interruptions and manufacturing or delivery delays;
|
| • |
the timing and availability of new products relative to customers’ and investors’ expectations;
|
| • |
the impact of
COVID-19
on Wallbox’s workforce, or those of its customers, suppliers, vendors or business partners;
|
| • |
disruptions in sales, production, service or other business activities or Wallbox’s inability to attract and retain qualified personnel;
|
| • |
unanticipated changes in federal, state, local, or foreign government incentive programs, which can affect demand for EVs; and
|
| • |
seasonal fluctuations in EV purchases.
|
21
Fluctuations in operating results and cash flow could, among other things, give rise to short-term liquidity issues. In addition, revenue, and other operating results may fall short of the expectations of investors and financial analysts, which could have an adverse effect on the price of Class A Shares.
Exchange rate fluctuations between the Euro and other currencies may negatively affect Wallbox’s earnings.
Wallbox currently has sales denominated in currencies other than the Euro. Any fluctuation in the exchange rates of these foreign currencies could negatively impact its business, financial condition and results of operations. Wallbox has not previously engaged in foreign currency hedging. If Wallbox decides to hedge its foreign currency exposure, it may not be able to hedge effectively due to lack of experience, unreasonable costs or illiquid markets. In addition, those activities may be limited in the protection they provide Wallbox from foreign currency fluctuations and can themselves result in losses.
Wallbox and other group companies may be significantly impacted by changes in tax laws and regulations or their interpretation.
Governments in the various jurisdictions in which Wallbox and other group companies are established and/ or operate continue to review, reform and modify tax laws, regulations, treaties, interpretations, policy initiatives and tax authority practices, and how we are treated for tax purposes is subject to changes. We are unable to predict whether a tax reform may be proposed or enacted in the future (including with retroactive effect) or whether such changes would have a significant impact on our business, but such changes could result in material changes to the taxes that we are required to provide for and pay in various jurisdictions.
When tax laws and regulations change, or when new tax laws and regulations are introduced and implemented, such changes or new laws and regulations may be unclear in certain respects and could be subject to further potential amendments and technical corrections, and may be subject to interpretations and implementing regulations by the relevant governmental authorities, any of which could mitigate or increase certain adverse effects of the tax changes or of the new tax laws and regulations. Existing tax laws and regulations could also be interpreted or applied in a manner adverse to Wallbox or other group companies.
We have incurred and are likely to continue incurring significant tax losses, the use of which may be limited under Spanish and other tax laws, and may be further limited in the future in case of changes in the applicable tax laws or their interpretation by the competent tax authorities. Similarly, we expect to obtain future tax savings from tax credits generated in Spain and in other jurisdictions we operate, and such tax losses and credits may eventually be rendered unavailable should a change in tax laws (or in their interpretation) take place. In particular, we are entitled to a significant amount of tax credits with respect to R&D costs under Spanish tax laws. We expect to be able to use such R&D tax credits in future fiscal years to reduce our cash tax liabilities. If the Spanish tax laws and regulations with respect to such R&D credits change in a manner that is detrimental to our position (e.g. by limiting the amount of tax credits that may be applied in a given fiscal year, by amending the criteria currently used to assess the amount of tax credits that may be claimed, or even by derogating the current tax regime), our overall tax expenses may increase. Any increase in our tax expenses due to a forfeiture, limitation or
non-availability
of tax losses and credits could have a material and adverse effect on our financial condition and results of operations.
We may also be subject to reviews or audits by tax authorities in the various jurisdictions in which we operate, and although we believe our tax estimates are reasonable, if the applicable taxing authorities disagree with the positions taken on our tax returns or if they deem us not be otherwise compliant with all applicable tax laws and regulations, tax authorities may carry out enforcement actions against us. Enforcement actions may be administrative, civil or criminal in nature, and could result in litigation, payments of additional taxes, penalties, interest or other sanctions. Any such
non-compliance
with applicable tax laws and regulations and their consequences to us may impact our operations, or even our ability to operate in such jurisdictions, and may adversely affect our business, prospects, financial condition and results of operations.
22
We are subject to the FCPA and other anti-corruption laws, as well as export control laws, import and customs laws, trade and economic sanctions laws and other laws governing our international operations.
We are subject to the FCPA and other anti-bribery laws in countries where we conduct activities, including the U.K. Bribery Act 2010 (“Bribery Act”). These laws generally prohibit companies their employees, and third-party intermediaries acting on their behalf from promising, authorizing, offering, or providing, directly or indirectly, improper payments of anything of value to government officials, political parties, and private-sector recipients for the purpose of obtaining or retaining business, directing business to any person, or securing any improper advantage. In addition, the FCPA requires U.S. issuers to maintain books and records that accurately and fairly represent their transactions and to implement a system of internal accounting controls. Other anti-corruption laws, including the Bribery Act, prohibit commercial bribery of private parties as well as the acceptance of bribes. We operate a global business and may have direct or indirect interactions with officials and employees of government agencies or state-owned or government controlled entities, including in jurisdictions that pose a heightened risk of anti-corruption violations, and we may participate in relationships with third parties whose conduct could potentially subject us to liability under the FCPA other anti-corruption laws, even if we do not explicitly authorize or have actual knowledge of such activities.
We are also subject to other laws and regulations governing our international operations, including regulations administered by the governments of the U.S., U.K. and authorities in the European Union and its member states, including applicable export control regulations, economic sanctions and embargoes on certain countries, regions, and persons, import and customs requirements, collectively referred to as the Trade Control laws. Trade Control Laws are often the subject of frequent change and compliance with these laws regarding the import and export of our products may create delays in the introduction of our products in international markets, and, in some cases, prevent the export of our products to some countries altogether.
We have implemented an anti-corruption compliance program, including policies and procedures designed to promote compliance with anti-bribery and Trade Control Laws. However, we cannot provide assurance that our internal controls and compliance systems will always protect us from liability for acts committed by employees, agents or business partners. If we are not in compliance these laws, we may be subject to criminal and civil fines and penalties, disgorgement, injunctions, debarment from debarment from government contracts, collateral litigation, as well as other sanctions and remedial measures. These consequences could have an adverse impact on our business, financial condition, results of operations and liquidity. Likewise, any investigation of potential violations of these laws could also have an adverse impact on our reputation, our business, results of operations and financial condition. In addition, responding to any enforcement action may result in a significant diversion of management’s attention and resources and significant defense costs and other professional fees.
The ongoing military action between Russia and Ukraine could adversely affect our business, financial condition and results of operations.
On February 24, 2022, Russian military forces launched a military action in Ukraine, and sustained conflict and disruption in the region is likely. Although the length, impact and outcome of the ongoing military conflict in Ukraine is highly unpredictable, this conflict could lead to significant market and other disruptions, including significant volatility in commodity prices and supply of energy resources, instability in financial markets, supply chain interruptions, political and social instability, changes in consumer or purchaser preferences as well as increase in cyberattacks and espionage.
Russia’s recognition of two separatist republics in the Donetsk and Luhansk regions of Ukraine and subsequent military action against Ukraine have led to an unprecedented expansion of sanction programs imposed by the United States, the European Union, the United Kingdom, Canada, Switzerland, Japan and other countries against Russia, Belarus, the Crimea Region of Ukraine, the
so-called
Donetsk People’s Republic and the
so-called
Luhansk People’s Republic, including, among others:
| • |
blocking sanctions against some of the largest state-owned and private Russian financial institutions (and their subsequent removal from the Society for Worldwide Interbank Financial Telecommunication
|
23
|
(“SWIFT”) payment system) and certain Russian businesses, some of which have significant financial and trade ties to the European Union;
|
| • |
blocking sanctions against Russian and Belarusian individuals, including the Russian President, other politicians and those with government connections or involved in Russian military activities; and
|
| • |
blocking of Russia’s foreign currency reserves as well as expansion of sectoral sanctions and export and trade restrictions, limitations on investments and access to capital markets and bans on various Russian imports.
|
The situation is rapidly evolving as a result of the conflict in Ukraine, and the United States, the European Union, the United Kingdom and other countries may implement additional sanctions, export controls or other measures against Russia, Belarus and other countries, regions, officials, individuals or industries in the respective territories. Such sanctions and other measures, as well as the existing and potential further responses from Russia or other countries to such sanctions, tensions and military actions, could adversely affect the global economy and financial markets and could adversely affect our business, financial condition and results of operations. Our operations could be particularly vulnerable to potential interruptions in the supply of certain critical materials, such as nickel, palladium, semiconductors, and wire harnesses, which are used in assembly of automobiles and/or the assembly of our chargers. Any interruption to the delivery or the availability of these materials could significantly impact our ability to conduct our operations.
Prior to the war, in 2021, we had net sales of €18.4 thousand in Ukraine and Russia. As a result, of the conflict in Ukraine, we stopped selling our products in Russia and Ukraine. Although the effect of our total net sales is insignificant, the extent, length and impact of the ongoing military conflict are highly unpredictable, and could cause additional disruptions to our business in the region.
We are actively monitoring the situation in Ukraine and assessing its impact on our business, including our business partners and customers. To date we have not experienced any material interruptions in our infrastructure, supplies, technology systems or networks needed to support our operations. We have no way to predict the progress or outcome of the conflict in Ukraine or its impacts in Ukraine, Russia or Belarus as the conflict, and any resulting government reactions, are rapidly developing and beyond our control. The extent and duration of the military action, sanctions and resulting market disruptions could be significant and could potentially have substantial impact on the global economy and our business for an unknown period of time. Any of the abovementioned factors could affect our business, financial condition and results of operations. Any such disruptions may also magnify the impact of other risks described in this Annual Report.
Our business may be affected by sanctions, export controls and similar measures targeting Russia and other countries and territories as well as other responses to Russia’s military conflict in Ukraine
As a result of Russia’s military conflict in Ukraine, governmental authorities in the United States, the European Union and the United Kingdom, among others, launched an expansion of coordinated sanctions and export control measures, including:
| • |
blocking sanctions on some of the largest state-owned and private Russian financial institutions (and their subsequent removal from SWIFT);
|
| • |
blocking sanctions against Russian and Belarusian individuals, including the Russian President, other politicians and those with government connections or involved in Russian military activities;
|
| • |
blocking sanctions against certain Russian businessmen and their businesses, some of which have significant financial and trade ties to the European Union;
|
| • |
blocking of Russia’s foreign currency reserves and prohibition on secondary trading in Russian sovereign debt and certain transactions with the Russian Central Bank, National Wealth Fund and the Ministry of Finance of the Russian Federation;
|
24
| • |
expansion of sectoral sanctions in various sectors of the Russian and Belarusian economies and the defense sector;
|
| • |
United Kingdom sanctions introducing restrictions on providing loans to, and dealing in securities issued by, persons connected with Russia;
|
| • |
restrictions on access to the financial and capital markets in the European Union, as well as prohibitions on aircraft leasing operations;
|
| • |
sanctions prohibiting most commercial activities of U.S. and EU persons in Crimea and Sevastopol;
|
| • |
enhanced export controls and trade sanctions targeting Russia’s imports of technological goods as a whole, including tighter controls on exports and reexports of
dual-use
items, stricter licensing policy with respect to issuing export licenses, and/or increased use of
“end-use”
controls to block or impose licensing requirements on exports, as well as higher import tariffs and a prohibition on exporting luxury goods to Russia and Belarus;
|
| • |
closure of airspace to Russian aircraft; and
|
| • |
ban on imports of Russian oil, liquefied natural gas and coal to the United States.
|
As the conflict in Ukraine continues, there can be no certainty regarding whether the governmental authorities in the United States, the European Union, the United Kingdom or other counties will impose additional sanctions, export controls or other measures targeting Russia, Belarus or other territories. Furthermore, in retaliation against new international sanctions and as part of measures to stabilize and support the volatile Russian financial and currency markets, the Russian authorities also imposed significant currency control measures aimed at restricting the outflow of foreign currency and capital from Russia, imposed various restrictions on transacting with
non-Russian
parties, banned exports of various products and other economic and financial restrictions.
Our business must be conducted in compliance with applicable economic and trade sanctions laws and regulations. We must be ready to comply with the existing and any other potential additional measures imposed in connection with the conflict in Ukraine. The imposition of such measures could adversely impact our business, including preventing us from performing existing contracts, recognizing revenue, pursuing new business opportunities or receiving payment for products already supplied or services already performed with customers.
Risks Related to Wallbox’s Technology, Intellectual Property and Infrastructure
Wallbox may need to defend against intellectual property infringement or misappropriation claims, which may be time-consuming and expensive, and its business could be adversely affected.
From time to time, the holders of intellectual property rights may assert their rights and urge Wallbox to take licenses, and/or may bring suits alleging infringement or misappropriation of such rights. There can be no assurance that Wallbox will be able to mitigate the risk of potential suits or other legal demands by competitors or other third parties. Accordingly, Wallbox may consider entering into licensing agreements with respect to such rights, although no assurance can be given that such licenses can be obtained on acceptable terms or that litigation will not occur, and such licenses and associated litigation could significantly increase Wallbox’s operating expenses. In addition, if Wallbox is determined to have or believes there is a high likelihood that it has infringed upon or misappropriated a third party’s intellectual property rights, it may be required to cease making, selling or incorporating certain key components or intellectual property into the products and services it offers, to pay substantial damages and/or royalties, to redesign its products and services, and/or to establish and maintain alternative branding. In addition, to the extent that Wallbox’s customers and business partners become the subject of any allegation or claim regarding the infringement or misappropriation of intellectual property rights related to Wallbox’s products and services, Wallbox may be required to indemnify such customers and business partners. The scope of these indemnity obligations varies, but may, in some instances, include indemnification
25
for damages and expenses, including attorneys’ fees. Even if Wallbox is not a party to any litigation between a customer or business partner and a third party relating to infringement by its products, an adverse outcome in any such litigation could make it more difficult for Wallbox to defend its products against intellectual property infringement claims in any subsequent litigation in which it is a named party. If Wallbox were required to take one or more such actions, its business, prospects, brand, operating results and financial condition could be materially and adversely affected. In addition, any litigation or claims, whether or not valid, could result in substantial costs, negative publicity, reputational harm and diversion of resources and management attention.
Wallbox’s business may be adversely affected if it is unable to obtain patents or otherwise protect its technology and intellectual property from unauthorized use by third parties.
Wallbox’s success depends, at least in part, on Wallbox’s ability to protect its core technology and intellectual property. To accomplish this, Wallbox relies on, and plans to continue relying on, a combination of trade secrets (including
know-how),
employee and third-party nondisclosure agreements, copyright, trademarks, intellectual property licenses and other contractual rights to retain ownership of, and protect, its technology. As of December 31, 2021, Wallbox had two European patents and two pending international patent applications. Failure to adequately protect its technology and intellectual property could result in competitors offering similar products, potentially resulting in the loss of some of Wallbox’s competitive advantage and a decrease in revenue which would adversely affect its business, prospects, financial condition and operating results.
The measures Wallbox takes to protect its technology intellectual property from unauthorized use by others may not be effective for various reasons, including the following:
| • |
the scope of any issued patents that may result from the pending patent application may not be broad enough to protect proprietary rights;
|
| • |
the costs associated with enforcing patents, trademarks, confidentiality and invention agreements or other intellectual property rights may make enforcement impracticable;
|
| • |
current and future competitors may circumvent patents or independently develop similar inventions, trade secrets or works of authorship, such as software;
|
| • |
know-how
and other proprietary information Wallbox purports to hold as a trade secret may not qualify as a trade secret under applicable laws; and
|
| • |
proprietary designs and technology embodied in Wallbox’s products may be discoverable by third parties through means that do not constitute violations of applicable laws.
|
Intellectual property and trade secret laws vary significantly throughout the world. Some foreign countries do not protect intellectual property rights to the same extent as do the laws of the United States. Further, policing the unauthorized use of its intellectual property in foreign jurisdictions may be costly, difficult or even impossible. Therefore, Wallbox’s intellectual property rights may not be as strong or as easily enforced outside of the United States.
Any issued patent which may result from the pending patent application may come to be considered “standards essential.” If this is the case, it may be required to license certain technology on “fair, reasonable and
non-discriminatory”
terms, decreasing revenue. Further, competitors, vendors, or customers may, in certain instances, be free to create variations or derivative works of Wallbox technology and intellectual property, and those derivative works may become directly competitive with Wallbox’s offerings. Finally, Wallbox may not be able to leverage, or obtain ownership of, all technology and intellectual property developed by Wallbox’s vendors in connection with design and manufacture of Wallbox’s products, thereby jeopardizing Wallbox’s ability to obtain a competitive advantage over its competitors.
26
The EV industry is new and evolving as are the standards governing EV charging and the current lack of industry standards could result in future incompatibilities and issues that could require significant resources and or time to remedy.
The EV industry is new and evolving as are the standards governing EV charging which have not had the benefit of time-tested use cases. These immature industry standards could result in future incompatibilities and issues that could require significant resources and or time to remedy. Utilities and other large market participants also mandate their own adoption of specifications that have not become widely adopted in the industry, which may hinder innovation or slow new product or new feature introduction.
In addition, automobile manufacturers may choose to develop and promulgate their own proprietary charging standards and systems, which could lock out competition for EV chargers, or may produce proprietary chargers that compete with our chargers. Such automobile manufacturers may use their size and market position to influence the market, which could limit Wallbox’s market and reach to customers, negatively impacting its business.
Further, should regulatory bodies later impose a standard that is not compatible with Wallbox’s infrastructure or products, it may incur significant costs to adapt its business model to the new regulatory standard, which may require significant time and expense and, as a result, may have a material adverse effect on its revenues or results of operations.
Wallbox’s technology, or the technology of Electromaps, could have undetected defects, errors or bugs in hardware or software which could reduce market adoption, damage its reputation with current or prospective customers, and/or expose it to product liability and other claims that could materially and adversely affect its business.
Wallbox may be subject to claims that chargers have malfunctioned and persons were injured or purported to be injured due to latent defects. Any insurance that Wallbox carries may not be sufficient or it may not apply to all situations. Similarly, to the extent that such malfunctions are related to components obtained from third-party vendors, such vendors may not assume responsibility for such malfunctions. Any of these events could adversely affect Wallbox’s brand, reputation, operating results or financial condition.
Wallbox’s software platform is complex and includes a number of licensed third-party commercial and open-source software libraries. Wallbox’s software may contain latent defects or errors that may be difficult to detect and remediate. Wallbox is continuing to evolve the features and functionality of its platform through updates and enhancements, and as it does, it may introduce additional defects or errors that may not be detected until after deployment to customers. In addition, if Wallbox’s products and services, including any updates or patches, are not implemented or used correctly or as intended, inadequate performance and disruptions in service may result.
Any defects or errors in product or services offerings, or the perception of such defects or errors, or other performance problems could result in any of the following, each of which could adversely affect Wallbox’s business and results of its operations:
| • |
expenditure of significant financial and product development resources, including recalls, in efforts to analyze, correct, eliminate or work around errors or defects;
|
| • |
loss of existing or potential customers or partners;
|
| • |
interruptions or delays in sales;
|
| • |
equipment replacements;
|
| • |
delayed or lost revenue;
|
| • |
delay or failure to attain market acceptance;
|
27
| • |
delay in the development or release of new functionality or improvements;
|
| • |
negative publicity and reputational harm;
|
| • |
warranties, sales credits or refunds;
|
| • |
exposure of confidential or proprietary information;
|
| • |
diversion of development and customer service resources;
|
| • |
breach of warranty claims;
|
| • |
legal claims under applicable laws, rules and regulations; and
|
| • |
the expense and risk of litigation.
|
Wallbox also faces the risk that any contractual protections it seeks to include in its agreements with customers are rejected, not implemented uniformly or may not fully or effectively protect from claims by customers, reseller, business partners or other third parties. In addition, any insurance coverage or indemnification obligations of suppliers for the benefit of Wallbox may not adequately cover all such claims, or cover only a portion of such claims. A successful product liability, warranty, or other similar claim could have an adverse effect on Wallbox’s business, operating results, and financial condition. In addition, even claims that ultimately are unsuccessful could result in expenditure of funds in litigation, divert management’s time and other resources and cause reputational harm.
Interruptions, delays in service, communications outages or inability to increase capacity at third-party data center facilities could impair the use or functionality of Wallbox’s subscription services, harm its business and subject it to liability.
Wallbox currently serves customers from third-party data center facilities operated by Amazon Web Services as well as others. Wallbox services are housed in third-party data. Any outage or failure of such data centers could negatively affect Wallbox’s product connectivity and performance. Wallbox’s primary environments are operated by Amazon, and any interruptions of these primary and backup data centers could negatively affect Wallbox’s product connectivity and performance. Any incident affecting a data center facility’s infrastructure or operations, whether caused by fire, flood, storm, earthquake, power loss, telecommunications failures, breach of security protocols, computer viruses and disabling devices, failure of access control mechanisms, natural disasters, war, criminal act, military actions, terrorist attacks and other similar events could negatively affect the use, functionality or availability of Wallbox’s services.
Any damage to, or failure of, Wallbox’s systems, or those of its third-party providers, could interrupt or hinder the use or functionality of its services. Impairment of or interruptions in Wallbox’s services may reduce revenue, subject it to claims and litigation, cause customers to terminate their subscriptions, and adversely affect renewal rates and its ability to attract new customers. Wallbox’s business will also be harmed if customers and potential customers believe its products and services are unreliable.
The EV charging market is characterized by rapid technological change, which requires Wallbox to continue to develop new products and product innovations. Any delays in such development could adversely affect market adoption of its products and Wallbox’s financial results.
Continuing technological changes in battery and other EV technologies could adversely affect adoption of current EV charging technology, continuing and increasing reliance on EV charging infrastructure and/or the use of Wallbox’s products and services. Wallbox’s future success will depend in part upon its ability to develop and introduce a variety of new capabilities and innovations to its existing product offerings, as well as introduce a variety of new product offerings to address the changing needs of the EV charging market.
28
As EV technologies change, Wallbox may need to upgrade or adapt its charger technology and introduce new products and services in order to serve vehicles that have the latest technology, in particular battery technology, which could involve substantial costs. Even if Wallbox is able to keep pace with changes in technology and develop new products and services, its research and development expenses could increase, its gross margins could be adversely affected in some periods and its prior products could become obsolete more quickly than expected.
Wallbox cannot guarantee that any new products will be released in a timely manner, or at all, or achieve market acceptance. Delays in delivering new products that meet customer requirements could damage Wallbox’s relationships with customers and lead them to seek alternative products or services. Delays in introducing products and innovations or the failure to offer innovative products or services at competitive prices may cause existing and potential customers to use Wallbox’s competitors’ products or services.
If Wallbox is unable to devote adequate resources to develop products or cannot otherwise successfully develop products or services that meet customer requirements on a timely basis or that remain competitive with technological alternatives, its products and services could lose market share, its revenue will decline, it may experience higher operating losses and its business and prospects will be adversely affected.
Wallbox expects to incur research and development costs and devote significant resources to developing new products, which could significantly reduce its profitability.
Wallbox’s future growth depends on penetrating new markets, adapting existing products to new applications and customer requirements, and introducing new products that achieve market acceptance. Wallbox plans to incur significant research and development costs in the future as part of its efforts to design, develop, manufacture and introduce new products and enhance existing products. Further, Wallbox’s research and development program may not produce successful results, and its new products may not achieve market acceptance, create additional revenue or become profitable.
Wallbox may be unable to leverage customer data in all geographic locations, and this limitation may impact research and development operations.
Wallbox relies on data collected through its mobile application. Wallbox uses this data in connection with, among other things, determining the placement for its charging stations. Wallbox’s inability to obtain necessary rights to use this data or freely transfer this data could result in delays or otherwise negatively impact Wallbox’s research and development and expansion efforts and limit Wallbox’s ability to derive revenues from
value-add
customer products and services.
Wallbox is subject to governmental regulation and other legal obligations related to privacy, data protection and information security and may be subject to governmental enforcement actions, litigation, fines and penalties or adverse publicity if it is unable to comply with such obligations.
State and local governments and agencies in the jurisdictions in which Wallbox operates, and in which customers operate, have adopted, are considering adopting, or may adopt laws and regulations regarding the collection, use, storage, processing, and disclosure of information regarding consumers and other individuals, which could impact its ability to offer services in certain jurisdictions. Laws and regulations relating to the collection, use, disclosure, security, and other processing of individuals’ information can vary significantly from jurisdiction to jurisdiction. The costs of compliance with, and other burdens imposed by, laws, regulations, standards, and other obligations relating to privacy, data protection, and information security are significant. In addition, some companies, particularly larger enterprises, often will not contract with vendors that do not meet these rigorous standards. Accordingly, the failure, or perceived inability, to comply with these laws, regulations, standards, and other obligations may limit the use and adoption of Wallbox’s products and services, reduce overall demand, lead to regulatory investigations, litigation, and significant fines, penalties, or liabilities for
29
actual or alleged noncompliance, or slow the pace at which Wallbox closes sales transactions, any of which could harm its business. Moreover, if Wallbox or any of its employees or contractors fail or are believed to fail to adhere to appropriate practices regarding customers’ data, it may damage its reputation and brand.
Additionally, existing laws, regulations, standards, and other obligations may be interpreted in new and differing manners in the future, and may be inconsistent among jurisdictions. Future laws, regulations, standards, and other obligations, and changes in the interpretation of existing laws, regulations, standards, and other obligations could result in increased regulation, increased costs of compliance and penalties for
non-compliance,
and limitations on data collection, use, disclosure, and transfer for Wallbox and its customers. Further, California adopted the California Consumer Privacy Protection Act (“CCPA”) and the California State Attorney General has begun enforcement actions. Further, on November 3, 2020, California voters approved the California Privacy Rights Act (“CPRA”). The costs of compliance with, and other burdens imposed by, laws and regulations relating to privacy, data protection, and information security that are applicable to the businesses of customers may adversely affect ability and willingness to process, handle, store, use, and transmit certain types of information, such as demographic and other personal information.
In addition to government activity, privacy advocacy groups, the technology industry, and other industries have established or may establish various new, additional, or different self-regulatory standards that may place additional burdens on technology companies. Customers may expect that Wallbox will meet voluntary certifications or adhere to other standards established by them or third parties. If Wallbox is unable to maintain these certifications or meet these standards, it could reduce demand for its solutions and adversely affect its business.
Wallbox relies on the Apple App Store and the Google Play Store to offer and promote its apps. If such platform providers change their terms and conditions to Wallbox’s detriment, Wallbox’s business may be adversely affected.
The Apple App Store and the Google Play Store are the primary distribution, marketing, promotion and payment platforms for Wallbox’s apps, including myWallbox and Electromaps. Any deterioration in Wallbox’s relationship with Google or Apple could harm its business and adversely affect the value of Wallbox’s shares.
Wallbox is subject to these platforms’ standard terms and conditions for app developers, which govern the promotion, distribution and operation of apps. These platforms have policies governing, for example, treatment of virtual credits and gifts, use of user data, personal and sensitive information and advertising identifiers, as well as ones relating to advertising (including deceptive, disruptive and inappropriate ads) and interference with app and device functionality. Each platform has broad discretion to change and interpret its terms of service and other policies with respect to Wallbox and those changes may be unfavorable to Wallbox. A platform provider may also change its fee structure, add fees associated with access to and use of its platform, alter how Wallbox is able to advertise on the platform, change how the personal information of its users is made available to app developers on the platform or limit the use of personal information for advertising purposes. Wallbox’s business could be harmed if a platform provider modifies its current terms of service or other policies, including fees, in a manner adverse to it.
If Wallbox violates, or if a platform provider believes it has violated, these terms and conditions (or if there is any change or deterioration in its relationship with these platform providers), the particular platform provider may discontinue or limit Wallbox’s access to that platform, which could prevent Wallbox from making its apps available to or otherwise from serving its mobile customers. Any limit or discontinuation of Wallbox’s access to any platform could adversely affect its business, financial condition or results of operations.
30
Risks Related to Being a Public Company
Wallbox’s management team has limited experience managing a public company.
Some members of Wallbox’s management team have limited experience managing a publicly traded company, interacting with public company investors, and complying with the increasingly complex laws, rules and regulations that govern public companies. As a public company, we are subject to significant obligations relating to reporting, procedures and internal controls, and Wallbox’s management team may not successfully or efficiently manage such obligations. These obligations and scrutiny will require significant attention from Wallbox’s management and could divert their attention away from the
management of Wallbox’s business, which could adversely affect Wallbox’s business, financial condition and results of operations.
day-to-day
Wallbox will continue to incur increased costs as a result of operating as a public company, and Wallbox’s management will be required to devote substantial time to new compliance initiatives and corporate governance practices.
As a public company, we incur significant legal, accounting and other expenses that we did not incur as a private company. The Sarbanes-Oxley Act, the Dodd-Frank Wall Street Reform and Consumer Protection Act, the listing requirements of the NYSE and other applicable securities rules and regulations impose various requirements on public companies, including establishment and maintenance of effective disclosure and financial controls and corporate governance practices. Our management and other personnel continue to devote a substantial amount of time to these compliance initiatives. Moreover, these rules and regulations will continue to increase our legal and financial compliance costs and will make some activities more time-consuming and costly. For example, we expect that these rules and regulations may make it more difficult and more expensive for us to obtain director and officer liability insurance, and could also make it more difficult for us to attract and retain qualified members of our board.
We cannot predict or estimate the amount of additional costs we may incur or the timing of such costs. These rules and regulations are often subject to varying interpretations, in many cases due to their lack of specificity, and, as a result, their application in practice may evolve over time as new guidance is provided by regulatory and governing bodies. This could result in continuing uncertainty regarding compliance matters and higher costs necessitated by ongoing revisions to disclosure and governance practices.
We are required to comply with the SEC’s rules implementing Sections 302 and 404 of the Sarbanes-Oxley Act, which will require management to certify financial and other information in our annual reports and provide an annual management report on the effectiveness of control over financial reporting. Though we will be required to disclose material changes in internal control over financial reporting on an annual basis, we will not be required to make our first annual assessment of our internal control over financial reporting pursuant to Section 404 until the year following our first annual report required to be filed with the SEC. To achieve compliance with Section 404 within the prescribed period, we will be engaged in a process to document and evaluate our internal control over financial reporting, which is both costly and challenging. In this regard, we will need to continue to dedicate internal resources, potentially engage outside consultants and adopt a detailed work plan to assess and document the adequacy of internal control over financial reporting, continue steps to improve control processes as appropriate, validate through testing that controls are functioning as documented and implement a continuous reporting and improvement process for internal control over financial reporting.
We currently have limited accounting personnel and we have begun the process of evaluating the adequacy of our accounting personnel staffing level and other matters related to our internal control over financial reporting. Despite our efforts, there is a risk that we will not be able to conclude, within the prescribed timeframe or at all, that our internal control over financial reporting is effective as required by Section 404. We have identified material weaknesses in the past and if we identify one or more material weaknesses in the future, it could result in an adverse reaction in the financial markets due to a loss of confidence in the reliability of our financial statements. As a result, the market price of Wallbox’s shares could be negatively affected, and we could
31
become subject to litigation including shareholder suits or investigations by the stock exchange on which our securities are listed, the SEC or other regulatory authorities, which could require additional financial and management resources.
Wallbox identified material weaknesses in connection with its internal control over financial reporting. Wallbox’s efforts to remediate these material weaknesses may not be successful in a timely manner, or at all, and Wallbox may identify other material weaknesses.
In connection with the audits of Wallbox’s consolidated financial statements for each of the years ended December 31, 2020 and 2021, included elsewhere in this Annual Report, Wallbox’s management and independent registered public accounting firm identified material weaknesses in Wallbox’s internal control over financial reporting. The material weaknesses related to: (i) insufficient personnel in the finance team with an appropriate level of knowledge and experience in the application of International Financial Reporting Standards as issued by the IASB, relating to both complex accounting transactions, such as accounting for the Transaction and related listing expenses, share-based payments and also in the application of other IFRS matters such as goodwill impairment testing and purchase price allocation; (ii) IT general controls have not been sufficiently designed or were not operating effectively, and (iii) policies and procedures with respect to the review, supervision and monitoring of the accounting and reporting functions were not operating effectively. As a result, a number of significant adjustments to Wallbox’s consolidated financial statements for each of the years ended December 31, 2020 and 2021 were identified and made during the course of the audit.
Wallbox is currently not required to comply with Section 404 of the Sarbanes-Oxley Act and is, therefore not required to make an assessment of the effectiveness of its internal control over financial reporting. Further, Wallbox’s independent registered public accounting firm has not been engaged to express, nor have they expressed, an opinion on the effectiveness of Wallbox’s internal control over financial reporting. We are currently in the process of remediating these material weaknesses and we are taking steps that we believe will address their underlying causes. We have enlisted the help of external advisors to provide assistance in the areas of internal controls and IFRS accounting in the short term, and are evaluating the longer-term resource needs of our accounting staff, including GAAP expertise. These remediation measures may be time-consuming and costly, and might place significant demands on our financial, accounting and operational resources. In addition, there is no assurance that we will be successful in hiring any necessary finance and accounting personnel in a timely manner, or at all.
Assessing Wallbox’s procedures to improve its internal control over financial reporting is an ongoing process. Any material weaknesses Wallbox identifies will be assessed and remediated by implementing the proper operating control. Detective and preventive internal controls are being designed by external advisors and implemented by Wallbox’s experienced new hires. Wallbox can provide no assurance that its remediation efforts described herein will be successful and that Wallbox will not have material weaknesses in the future. Any material weaknesses Wallbox identifies could result in an adverse reaction in the financial markets due to a loss of confidence in the reliability of Wallbox’s consolidated financial statements.
It is possible that Wallbox’s internal control over financial reporting is not effective because it cannot detect or prevent material errors at a reasonable level of assurance. Wallbox’s past or future financial statements may not be accurate and Wallbox may not be able to timely report its financial condition or results of operations, which may adversely affect investor confidence in Wallbox and the price of Class A Shares.
As a private company, Wallbox has not been required to evaluate our internal control over financial reporting in a manner that meets the standards of publicly traded companies required by Section 404(a) of the Sarbanes Oxley Act, or Section 404. As a public company, Wallbox will have significant requirements for enhanced financial reporting and internal controls. The process of designing, implementing, testing and maintaining effective internal controls is a continuous effort that will require us to anticipate and react to changes in our business and the economic and regulatory environments. In this regard, we will need to continue to dedicate internal resources, potentially engage outside consultants, adopt a detailed work plan to assess and
32
document the adequacy of internal control over financial reporting, continue steps to improve control processes as appropriate, validate through testing whether such controls are functioning as documented, and implement a continuous reporting and improvement process for internal control over financial reporting.
It is possible that our internal control over financial reporting is not effective because it cannot detect or prevent material errors at a reasonable level of assurance. If we are unable to establish or maintain appropriate internal financial reporting controls and procedures, it could cause us to fail to meet our reporting obligations on a timely basis, result in material misstatements in our consolidated financial statements and adversely affect our operating results. In addition, we will be required, pursuant to Section 404, to furnish a report by our management on, among other things, the effectiveness of our internal control over financial reporting in the second annual report filed with the SEC. This assessment will need to include disclosure of any material weaknesses identified by our management in our internal control over financial reporting. The rules governing the standards that must be met for our management to assess our internal control over financial reporting are complex and require significant documentation and testing. Testing and maintaining internal controls may divert our management’s attention from other matters that are important to our business. In addition, pursuant to Section 404, we will be required to include in the annual reports that we file with the SEC an attestation report on our internal control over financial reporting issued by our independent registered public accounting firm.
Furthermore, as a public company, we may, during the course of our testing of our internal controls over financial reporting, or during the subsequent testing by our independent registered public accounting firm, identify deficiencies which would have to be remediated to satisfy the SEC rules for certification of our internal controls over financial reporting. As a consequence, we may have to disclose in periodic reports we file with the SEC significant deficiencies or material weaknesses in our system of internal controls. The existence of a material weakness would preclude management from concluding that our internal controls over financial reporting are effective, and would preclude our independent auditors from issuing an unqualified opinion that our internal controls over financial reporting are effective. In addition, disclosures of this type in our SEC reports could cause investors to lose confidence in the accuracy and completeness of our financial reporting and may negatively affect the trading price of Class A Shares, and we could be subject to sanctions or investigations by regulatory authorities. Moreover, effective internal controls are necessary to produce reliable financial reports and to prevent fraud. If we have deficiencies in our disclosure controls and procedures or internal controls over financial reporting, it could negatively impact our business, results of operations and reputation.
Wallbox’s failure to timely and effectively implement controls and procedures required by Section 404(a) of the Sarbanes-Oxley Act could have a material adverse effect on its business.
Following the consummation of the Business Combination, Wallbox is required to provide management’s attestation on internal controls, however we have a transition period established by rules of the Securities and Exchange Commission for newly public companies. The standards required for a public company under Section 404(a) of the SOX are significantly more stringent than those required of Wallbox as a privately-held company. Management may not be able to effectively and timely implement controls and procedures that adequately respond to the increased regulatory compliance and reporting requirements that will be applicable after the Business Combination. If Wallbox is not able to implement the additional requirements of Section 404(a) in a timely manner or with adequate compliance, it may not be able to assess whether its internal controls over financial reporting are effective, which may subject it to adverse regulatory consequences and could harm investor confidence and the market price of its securities.
Risks Related to Class A Shares
The market price of Class A Shares may be volatile, and you may lose all or part of your investment.
The market price of Class A Shares could be highly volatile and may fluctuate substantially as a result of many factors, including:
| • |
actual or anticipated fluctuations in Wallbox’s results of operations;
|
33
| • |
variance in Wallbox’s financial performance from the expectations of market analysts or others;
|
| • |
announcements by Wallbox or Wallbox’s competitors of significant business developments, changes in significant customers, acquisitions or expansion plans;
|
| • |
Wallbox’s involvement in litigation;
|
| • |
Wallbox’s sale of Shares or other securities in the future;
|
| • |
market conditions in Wallbox’s industry;
|
| • |
changes in key personnel;
|
| • |
the trading volume of Wallbox’s Class A Shares;
|
| • |
changes in the estimation of the future size and growth rate of Wallbox’s markets; and
|
| • |
general economic, industry and market conditions, including, for example, the effects of recession or slow economic growth in the U.S. and abroad, interest rates, fuel prices, international currency fluctuations, corruption, political instability, acts of war, including the Russia/Ukraine conflict and the ongoing
COVID-19
pandemic or other public health crises.
|
In addition, the stock markets have experienced extreme price and volume fluctuations. Broad market and industry factors may materially harm the market price of Class A Shares, regardless of Wallbox’s operating performance. In the past, following periods of volatility in the market price of a company’s securities, securities class action litigation has often been instituted against that company. If Wallbox was involved in any similar litigation, Wallbox could incur substantial costs and Wallbox’s management’s attention and resources could be diverted.
An active trading market for s Class A Shares may not be sustained to provide adequate liquidity.
An active trading market may not be sustained for Class A Shares. The lack of an active market may impair your ability to sell your shares at the time you wish to sell them or at a price that you consider reasonable. An inactive market may also impair Wallbox’s ability to raise capital by selling Shares and may impair Wallbox’s ability to acquire other companies by using Wallbox’s shares as consideration.
The market price of s Class A Shares could be negatively affected by future sales of Shares.
Sales by Wallbox or Wallbox’s shareholders of a substantial number of Shares, the issuance of Shares as consideration for acquisitions, or the perception that these sales might occur, could cause the market price of Class A Shares to decline or could impair Wallbox’s ability to raise capital through a future sale of, or pay for acquisitions using, Wallbox’s equity securities.
Wallbox does not expect to pay any dividends in the foreseeable future.
Wallbox has never declared or paid any dividends on the Shares. Wallbox does not anticipate paying any dividends in the foreseeable future. Wallbox currently intends to retain future earnings, if any, to finance operations and expand their business.
The Board may determine which part of the profits shall be reserved, with due observance of Wallbox’s policy on reserves and dividends. The general meeting of Wallbox may resolve to distribute any part of the profits remaining after reservation. If the Board decides to make a part of the profits available for distribution of dividends, the form, frequency and amount will depend upon Wallbox’s future operations and earnings, capital requirements and surplus, general financial condition, contractual restrictions and other factors that Wallbox’s directors may deem relevant. In addition, the Dutch law imposes restrictions on Wallbox’s ability to declare and pay dividends. Payment of dividends may also be subject to Dutch withholding taxes.
34
The number of issued Shares, additional issues of Shares and outstanding Warrants may fluctuate substantially, which could lead to adverse tax consequences for the holders thereof.
It may be that the number of issued and outstanding Shares and outstanding Warrants fluctuates substantially. This may have an impact on interests and certain thresholds that are relevant for investors’ tax purposes and positions, also dependent on their respective circumstances. The potential tax consequences in this regard could potentially be material, and therefore, investors should seek their own tax advice with respect to the tax consequences in connection with the acquisition, ownership and disposal of the Shares and/or Warrants.
If securities or industry analysts do not publish research or reports about Wallbox’s business, or if they issue an adverse or misleading opinion regarding Class A Shares, the market price and trading volume of Class A Shares could decline.
The trading market for Class A Shares can be influenced by the research and reports that industry or securities analysts publish about Wallbox or Wallbox’s business. If industry analysts cease coverage of Wallbox, the trading price for Class A Shares would be negatively impacted. If any of the analysts who cover Wallbox issue an adverse or misleading opinion regarding Wallbox, Wallbox’s business model, Wallbox’s intellectual property or Wallbox’s stock performance, or if Wallbox’s results of operations fail to meet the expectations of analysts, Wallbox’s stock price would likely decline. If one or more of these analysts cease coverage of Wallbox or fail to publish reports on Wallbox regularly, Wallbox could lose visibility in the financial markets, which in turn could cause Wallbox’s stock price or trading volume to decline.
The dual class structure of Shares has the effect of concentrating voting control with certain shareholders of Wallbox and limiting its other shareholders’ ability to influence corporate matters and could discourage others from pursuing any change of control transactions that holders of Class A Shares may view as beneficial.
Class B Shares have ten (10) votes per share, while Class A Shares have one (1) vote per share. Wallbox’s
co-founders,
Enric Asunción Escorsa and Eduard Castañeda, own all of the Class B Shares and collectively control approximately 62% of the voting power of Wallbox’s capital stock. Even though Wallbox’s
co-founders
are not party to any agreement that requires them to vote together, they may have interests that differ from yours and may vote in a way with which you disagree and which may be adverse to your interests. This concentrated control may have the effect of delaying, preventing or deterring a change in control of Wallbox, could deprive its shareholders of an opportunity to receive a premium for their capital stock as part of a sale of Wallbox, and might ultimately affect the market price of shares of Class A Shares.
We cannot predict whether Wallbox’s dual class structure will result in a lower or more volatile market price of Class A Shares or in adverse publicity or other adverse consequences. For example, certain index providers have announced restrictions on including companies with multiple-class share structures in certain of their indexes. S&P Dow Jones and FTSE Russell have announced changes to their eligibility criteria for inclusion of shares of public companies on certain indices, including the S&P 500, pursuant to which companies with multiple classes of shares of common stock are excluded. In addition, several stockholder advisory firms have announced their opposition to the use of multiple class structures. As a result, Wallbox’s dual class structure may cause stockholder advisory firms to publish negative commentary about Wallbox’s corporate governance practices or otherwise seek to cause Wallbox to change its capital structure. Any such exclusion from indices or any actions or publications by stockholder advisory firms critical of Wallbox’s corporate governance practices or capital structure could adversely affect the value and trading market of Class A Shares.
Wallbox is a “controlled company” within the meaning of the NYSE rules and is exempt from certain corporate governance requirements as a result.
Enric Asunción Escorsa and Eduard Castañeda together control a majority of the voting power of Wallbox’s outstanding common stock.
35
As a result, Wallbox is a “controlled company” within the meaning of the corporate governance standards of NYSE. Under these rules, a company of which more than 50% of the voting power is held by an individual, group or another company is a “controlled company” and may elect not to comply with certain corporate governance requirements, including:
| • |
the requirement that a majority of Wallbox’s board of directors consist of “independent directors” as defined under the rules of NYSE;
|
| • |
the requirement that Wallbox have a compensation committee that is composed entirely of independent directors with a written charter addressing the committee’s purpose and responsibilities;
|
| • |
the requirement that Wallbox have a nominating and corporate governance committee that is composed entirely of independent directors with a written charter addressing the committee’s purpose and responsibilities; and
|
| • |
the requirement for an annual performance evaluation of the compensation and nominating and corporate governance committees.
|
Wallbox intends to utilize some or all of these exemptions. As a result, Wallbox’s nominating and corporate governance committee and compensation committee may not consist entirely of independent directors and such committees will not be subject to annual performance evaluations. Accordingly, you may not have the same protections afforded to stockholders of companies that are subject to all of the corporate governance requirements of NYSE.
Wallbox is a foreign private issuer and, as a result, Wallbox will not be subject to U.S. proxy rules and will be subject to Exchange Act reporting obligations that, to some extent, are more lenient and less frequent than those of a U.S. domestic public company.
Because Wallbox qualifies as a foreign private issuer under the Exchange Act, Wallbox is exempt from certain provisions of the Exchange Act that are applicable to U.S. domestic public companies, including (1) the sections of the Exchange Act regulating the solicitation of proxies, consents or authorizations in respect of a security registered under the Exchange Act, (2) the sections of the Exchange Act requiring insiders to file public reports of their share ownership and trading activities and liability for insiders who profit from trades made in a short period of time and (3) the rules under the Exchange Act requiring the filing with the SEC of quarterly reports on Form
10-Q
containing unaudited financial and other specified information. In addition, foreign private issuers are not required to file their annual report on Form
20-F
until 120 days after the end of each fiscal year, while U.S. domestic issuers that are accelerated filers are required to file their annual report on Form
10-K
within 75 days after the end of each fiscal year and U.S. domestic issuers that are large accelerated filers are required to file their annual report on Form
10-K
within 60 days after the end of each fiscal year. Foreign private issuers are also exempt from Regulation FD, which is intended to prevent issuers from making selective disclosures of material information. As a result of all of the above, you may not have the same protections afforded to shareholders of a company that is not a foreign private issuer.
As a foreign private issuer, and as permitted by the listing requirements of the NYSE, Wallbox follows certain home country governance practices rather than the corporate governance requirements of the NYSE.
As a foreign private issuer, Wallbox has the option to follow certain home country corporate governance practices rather than those of the NYSE, provided that Wallbox discloses the requirements it is not following and describe the home country practices it is following. Wallbox intends to rely on this “foreign private issuer exemption” with respect to NYSE rules requiring shareholder approval. Wallbox may in the future elect to follow home country practices with regard to other matters. As a result, Wallbox’s shareholders may not have the same protections afforded to shareholders of companies that are subject to all NYSE corporate governance requirements.
36
Wallbox may lose its foreign private issuer status in the future, which could result in significant additional costs and expenses.
As discussed above, Wallbox is a foreign private issuer, and therefore, Wallbox is not required to comply with all of the periodic disclosure and current reporting requirements of the Exchange Act. The determination of foreign private issuer status is made annually on the last business day of an issuer’s most recently completed second fiscal quarter, and, accordingly, the next determination will be made with respect to Wallbox on June 30, 2022. In the future, Wallbox would lose its foreign private issuer status if (1) more than 50% of Wallbox’s outstanding voting securities are owned by U.S. residents and (2) a majority of Wallbox’s directors or executive officers are U.S. citizens or residents, or Wallbox fails to meet additional requirements necessary to avoid loss of foreign private issuer status. If Wallbox loses its foreign private issuer status, Wallbox will be required to file with the SEC periodic reports and registration statements on U.S. domestic issuer forms including financial statements prepared in accordance with generally accepted accounting principles in the United States of America, which are more detailed and extensive than the forms available to a foreign private issuer. Wallbox will also have to mandatorily comply with U.S. federal proxy requirements, and Wallbox’s officers, directors, and principal shareholders will become subject to the short-swing profit disclosure and recovery provisions of Section 16 of the Exchange Act. In addition, Wallbox will lose its ability to rely upon exemptions from certain corporate governance requirements under the listing rules of the NYSE. As a U.S. listed public company that is not a foreign private issuer, Wallbox will incur significant additional legal, accounting and other expenses that Wallbox will not incur as a foreign private issuer.
Wallbox is an “emerging growth company” and you cannot be certain whether the reduced disclosure requirements applicable to emerging growth companies will make Class A Shares less attractive to investors.
Wallbox is an emerging growth company (“EGC”) as defined in the JOBS Act, and it intends to take advantage of certain exemptions from various reporting requirements that are applicable to other public companies that are not EGCs, including not being required to comply with the auditor attestation requirements of Section 404 of the Sarbanes-Oxley Act of 2002 reduced disclosure obligations regarding executive compensation in periodic reports and proxy statements, and exemptions from the requirements of holding a nonbinding advisory vote on executive compensation and stockholder approval of any golden parachute payments not previously approved. Investors may find the common stock less attractive because Wallbox will continue to rely on these exemptions. If some investors find the common stock less attractive as a result, there may be a less active trading market for their common stock, and the stock price may be more volatile.
An EGC may elect to delay the adoption of new or revised accounting standards. With Wallbox making this election, Section 102(b)(2) of the JOBS Act allows Wallbox to delay adoption of new or revised accounting standards until those standards apply to
non-public
business entities. As a result, the financial statements contained herein and those that Wallbox will file in the future may not be comparable to companies that comply with public business entities revised accounting standards effective dates.
As Wallbox is a holding company with no operations it relies on operating subsidiaries to provide it with funds necessary to meet its financial obligations.
Wallbox is a holding company that does not conduct any business operations of its own. As a result, Wallbox is largely dependent upon cash dividends and distributions and other transfers, including for dividends or payments in respect of any indebtedness Wallbox may incur, from our subsidiaries to meet its obligations. Any agreements governing the indebtedness of Wallbox’s subsidiaries may impose restrictions on its subsidiaries’ ability to pay dividends or other distributions to Wallbox. Each of Wallbox’s subsidiaries is a distinct legal entity, and under certain circumstances legal and contractual restrictions may limit Wallbox’s ability to obtain cash from such subsidiaries and Wallbox may be limited in its ability to cause any joint ventures to distribute their earnings to it. The deterioration of the earnings from, or other available assets of, Wallbox’s subsidiaries for any reason could also limit or impair their ability to pay dividends or other distributions to Wallbox.
37
Investors may suffer adverse tax consequences in connection with the acquisition, ownership and disposal of the Shares and/or Public Warrants.
The tax consequences in connection with the acquisition, ownership and disposal of the Shares and/or Warrants may differ from the tax consequences in connection with the acquisition, ownership and disposal of securities in another entity and may also differ depending on such an investor’s respective circumstances including, without limitation, where such an investor is a tax resident. Any such tax consequences could be materially adverse to such an investor and also therefore, such an investor should seek its own tax advice in respect of the tax consequences in connection with acquisition, ownership and disposal of the Shares and/or Warrants.
Risks Relating to Wallbox’s Incorporation in the Netherlands
Wallbox is a public company with limited liability (naamloze vennootschap) incorporated under the laws of the Netherlands. The rights of Wallbox shareholders may be different from the rights of stockholders in companies governed by the laws of U.S. jurisdictions and may not protect investors in a similar fashion afforded by incorporation in a U.S. jurisdiction.
Wallbox is a public limited liability company incorporated under Dutch law. Wallbox’s corporate affairs are governed by our articles of association, internal rules and policies and by the laws governing companies incorporated in the Netherlands. The rights of shareholders may be different from the rights and obligations of shareholders in companies governed by the laws of U.S. jurisdictions. The role of the management board in a Dutch company is also materially different, and cannot be compared to, the role of a board of directors in a corporation incorporated in the United States. In the performance of their duties, our management board is required by Dutch law to consider the interests of our company and the sustainable success of its business, with an aim to creating long-term value, taking into account the interests of its shareholders, its employees and other stakeholders of the company, in all cases with due observation of the principles of reasonableness and fairness. It is possible that some of these parties will have interests that are different from, or in addition to, your interests as a shareholder.
Provisions of Dutch law and Wallbox’s amended and restated articles of association may delay, prevent or make undesirable an acquisition of all or a significant portion of Wallbox’s shares or assets.
Under Dutch law, various protective measures are possible and permissible within the boundaries set by Dutch law and Dutch case law, among which, in accordance with the DCGC, shareholders having the right to put an item on the agenda under the rules described above shall exercise such right only after consulting the Board in that respect. If one or more shareholders intend to request that an item be put on the agenda that may result in a change in Wallbox’s strategy (for example, the dismissal of Directors), the Board must be given the opportunity to invoke a reasonable period to respond to such intention. Such period shall not exceed 180 (hundred eighty) days (or such other period as may be stipulated for such purpose by Dutch law and/or the DCGC from time to time). If invoked, the Board must use such response period for further deliberation and constructive consultation, in any event with the shareholders(s) concerned, and must explore the alternatives. At the end of the response time, the Board must report on this consultation and the exploration of alternatives to the general meeting. The response period may be invoked only once for any given general meeting and shall not apply: (a) in respect of a matter for which a response period has been previously invoked; or (b) if a shareholder holds at least 75% of Wallbox’s issued share capital as a consequence of a successful public bid. The response period may also be invoked in response to shareholders or others with meeting rights under Dutch law requesting that a General Meeting be convened, as described above.
Pursuant to Dutch law, one or more shareholders and/or other persons with meeting rights under Dutch law who individually or jointly represent at least 10% (ten percent) of Wallbox’s issued share capital, may request the Board to convene a General Meeting setting out in detail the matters to be discussed. If the Board has not taken the steps necessary to ensure that such meeting can be held within 6 (six) weeks after the request, the requesting
38
shareholder(s) and or other persons with meeting rights may at their request be authorized by the competent Dutch court in preliminary relief proceedings to convene a General Meeting. The court shall refuse the application if it does not appear that the applicant(s) has/have previously requested the Board to convene a General Meeting and the Board has not taken the necessary steps so that the General Meeting could be held within 6 (six) weeks after the request. Such a request to the Board is subject to certain additional requirements. Additionally, the applicant must have a reasonable interest in the meeting being held.
Further thereto, on 1 May 2021, a bill came into force that introduces a statutory
cooling-off
period of up to 250 days during which the General Meeting would not be able to dismiss, suspend or appoint members of the Board (or amend the provisions in the Articles of Association governing these matters) unless these matters were proposed by the Board. This
cooling-off
period could be invoked by the Board in the event:
| • |
shareholders, using either their shareholder proposal right or their right to request a General Meeting, propose an agenda item for the General Meeting to dismiss, suspend or appoint a Director (or to amend any provision in the Articles of Association dealing with those matters); or
|
| • |
a public offer for has been announced or made without agreement having been reached with on such offer,
|
provided, in each case, that in the opinion of the Board such proposal or offer materially conflicts with the interests of and its business.
The
cooling-off
period, if invoked, ends upon the earliest of the following events:
the expiration of 250 days from:
| • |
in case of shareholders using their shareholder proposal right, the day after the deadline for making such proposal for the next General Meeting has expired;
|
| • |
in case of Shareholders using their right to request a General Meeting, the day when they obtain court authorization to do so; or
|
| • |
in case of a public offer as described above being made without agreement having been reached with on such offer, the first following day;
|
the day after a public offer without agreement having been reached with Wallbox on such offer, having been declared unconditional; or
| • |
the Board deciding to end the
cooling-off
period earlier.
|
In addition, one or more shareholders that may (jointly) exercise the shareholder proposal right at the time that the
) of the Amsterdam Court of Appeals (
) for early termination of the
cooling-off
period is invoked, may request the Enterprise Chamber (
Ondernemingskamer
Gerechtshof Amsterdam
cooling-off
period. The Enterprise Chamber must rule in favor of the request if the shareholders can demonstrate that:
| • |
the Board, in light of the circumstances at hand when the
cooling-off
period was invoked, could not reasonably have come to the conclusion that the relevant shareholder proposal or hostile offer constituted a material conflict with the interests of and its business;
|
| • |
the Board cannot reasonably believe that a continuation of the
cooling-off
period would contribute to careful policy-making;
|
| • |
if other defensive measures, having the same purpose, nature and scope as the
cooling-off
period, have been activated during the
cooling-off
period and are not terminated or suspended at the relevant shareholders’ written request within a reasonable period following the request (i.e., no ‘stacking’ of defensive measures).
|
39
During the
cooling-off
period, if invoked, the Board must gather all relevant information necessary for a careful decision-making process. In this context, the Board must at least consult with shareholders representing at least 3% of Wallbox’s issued share capital at the time the
cooling-off
period was invoked and with the Wallbox’s works council (if applicable). Formal statements expressed by these stakeholders during such consultations must be published on Wallbox’s website to the extent these stakeholders have approved that publication.
Ultimately one week following the last day of the
cooling-off
period, the Board must publish a report in respect of its policy and conduct of affairs during the
cooling-off
period on the Wallbox website. This report must also remain available for inspection by Wallbox’s shareholders and others with meeting rights under Dutch law at Wallbox’s office and must be tabled for discussion at the next general meeting.
Finally, in this respect, certain provisions of the Articles of Association may also make it more difficult for a third-party to acquire control of Wallbox or effect a change in the composition of the Board, including that suspension or dismissal of directors other than at the proposal of the Board will require a
two-thirds
majority of the votes cast, representing more than one half of the issued capital of Wallbox.
Shareholders may not be able to participate in future issues of Shares.
Under Dutch law, the General Meeting is authorized to issue Shares or to grant rights to subscribe for Shares and to restrict and/or exclude statutory
pre-emptive
rights in relation to the issuance of Shares or the granting of rights to subscribe for Shares. The General Meeting may designate the Board competent to issue Shares (or grant rights to subscribe for Shares) and to determine the issue price and other conditions of the issue for a specified period not exceeding five years (which period can be extended from time to time for further periods not exceeding five years) and, for a period of 5 years commencing on the date of completion of the Business Combination, the Board has been irrevocably authorized to issue Shares (and to grant rights to subscribe for Shares).
Further thereto, each shareholder has a
pre-emptive
right in proportion to the aggregate amount of its Shares upon the issuance of Shares (or the granting of rights to subscribe for Shares). This
pre-emptive
right does not apply to: (i) Shares issued to employees of Wallbox or a group company of Wallbox as referred to in Section 2:24b Dutch Civil Code, (ii) Shares that are issued against payment other than in cash; and (iii) Shares issued to a person exercising a previously granted right to subscribe for Shares.
The
pre-emptive
rights in respect of newly issued Shares or the granting of rights to subscribe for Shares may be restricted or excluded by a resolution of the general meeting of Wallbox.
Pre-emptive
rights may also be limited or excluded by a resolution of the Board if the Board has been designated thereto by the general meeting of Wallbox for a specific period and with due observance of applicable statutory provisions, and the Board has also been designated to issue Shares. A resolution of the general meeting of Wallbox to limit or exclude
pre-emptive
rights or a resolution to designate the Board thereto, can only be adopted at the proposal of the Board, and requires a majority of at least
two-thirds
of the votes cast, if less than half of the issued share capital of Wallbox is present or represented at the general meeting. Unless otherwise stipulated at its grant the designation may not be withdrawn.
If the resolution of the general meeting of Wallbox to issue Shares or to designate the authority to issue Shares to the Board is detrimental to the rights of holders of a specific class of Shares, the validity of such resolution of the general meeting of Wallbox requires a prior or simultaneous approval by the group of holders of such class of Shares.
For a period of 5 years commencing on the date of completion of the Business Combination, the Board has been irrevocably authorized to limit or exclude
pre-emptive
rights in respect of Shares.
40
Wallbox is not obligated to and may not comply (but will then explain such
non-compliance)
with all the best practice provisions of the Dutch Corporate Governance Code. This may affect your rights as a shareholder.
Wallbox will be subject to the DGCG. The DCGC contains both principles and best practice provisions on corporate governance that regulate relations between the management board and the general meeting of shareholders and matters in respect of financial reporting, auditors, disclosure, compliance and enforcement standards. The DCGC is based on a “comply or explain” principle. Accordingly, companies are required to disclose in their annual reports (which are filed in the Netherlands) whether they comply with the provisions of the DCGC. If they do not comply with those provisions (for example, because of a conflicting NYSE requirement), the company is required to give the reasons for such noncompliance. The DCGC applies to Dutch companies listed on a regulated Market in the EU or a comparable other system, such as the NYSE.
Wallbox acknowledges the importance of good corporate governance. However, Wallbox does not comply with all the provisions of the DCGC, to a large extent because such provisions conflict with or are inconsistent with the corporate governance rules of the NYSE and U.S. securities laws, or because Wallbox believes such provisions do not reflect customary practices of global companies listed on the NYSE. Any such noncompliance may affect your rights as a shareholder, and you may not have the same level of protection as a shareholder in a Dutch company that fully complies with the DCGC.
Wallbox is organized and existing under the laws of the Netherlands, and, as such, the rights of shareholders and the civil liability of Wallbox’s directors and executive officers will be governed in certain respects by the laws of the Netherlands. The ability of shareholders to bring actions or enforce judgments against Wallbox or its directors and executive officers may be limited. Claims of U.S. civil liabilities may not be enforceable against Wallbox.
Wallbox is organized and existing under the laws of the Netherlands, and, as such, the rights of Wallbox’s shareholders and the civil liability of Wallbox’s directors and executive officers are governed in certain respects by the laws of the Netherlands. The ability of Wallbox’s shareholders in certain countries other than the Netherlands to bring an action against Wallbox, its directors and executive officers may be limited under applicable law. In addition, substantially all of Wallbox’s assets are located outside the United States. As a result, it may not be possible for shareholders to effect service of process within the United States upon Wallbox or its directors and executive officers or to enforce judgments against Wallbox or them in U.S. courts, including judgments predicated upon the civil liability provisions of the federal securities laws of the United States. In addition, it is not clear whether a Dutch court would impose civil liability on Wallbox or any of its directors and executive officers in an original action based solely upon the federal securities laws of the United States brought in a court of competent jurisdiction in the Netherlands.
As of the date of this Annual Report, the United States and the Netherlands do not have a treaty providing for the reciprocal recognition and enforcement of judgments, other than arbitration awards, in civil and commercial matters. Accordingly, a judgment rendered by any federal or state court in the United States, whether or not predicated solely upon U.S. securities laws, would not automatically be recognized and enforced by the competent Dutch courts. However, if a person has obtained a final and conclusive judgment for the payment of money rendered by a court in the United States that is enforceable in the United States and files a claim with the competent Dutch court, the Dutch court will generally give binding effect to such foreign judgment insofar as it finds that (i) the jurisdiction of the U.S. court has been based on a ground of jurisdiction that is generally acceptable according to international standards, (ii) the judgment by the U.S. court was rendered in legal proceedings that comply with the Dutch standards of proper administration of justice including sufficient safeguards (
) and (iii) the judgment by the U.S. court is not incompatible with a decision rendered between the same parties by a Dutch court, or with a previous decision rendered between the same parties by a foreign court in a dispute that concerns the same subject and is based on the same cause, provided that the previous decision qualifies for acknowledgment in the Netherlands and except to the extent that the foreign judgment contravenes Dutch public policy (
).
behoorlijke rechtspleging
openbare orde
41
Based on the lack of a treaty as described above, U.S. investors may not be able to enforce against Wallbox or its directors, representatives or certain experts named herein who are residents of the Netherlands or countries other than the United States any judgments obtained in U.S. courts in civil and commercial matters, including judgments under the U.S. federal securities laws.
Under the Articles of Association, and certain other contractual arrangements between Wallbox and its directors, Wallbox indemnifies and holds its directors harmless against all claims and suits brought against them, subject to limited exceptions. There is doubt, however, as to whether U.S. courts would enforce such indemnity provisions in an action brought against one of Wallbox’s Directors in the United States under U.S. securities laws.
Dutch, Spanish and European insolvency laws are substantially different from U.S. insolvency laws and may offer Wallbox shareholders less protection than they would have under U.S. insolvency laws.
Pursuant to European Regulation (EU) 2015/848 of the European Parliament and of the Council, of 20 May 2015, on insolvency proceedings, which forms part of both Dutch and Spanish insolvency laws, Spanish courts will have jurisdiction to entertain the main insolvency proceeding of a Dutch public limited liability company that, such as Wallbox, has its “centre of main interest” located in Spain. If Spanish courts declare the opening of the main insolvency proceeding of a Dutch public limited liability company, Dutch courts will have to recognize such declaration and Spanish insolvency law will apply, subject to the exceptions set forth under the European Regulation (EU) 2015/848, as interpreted by the Court of Justice of the European Union. Dutch courts could have jurisdiction to try a
non-main
insolvency proceeding following Wallbox’s operations in The Netherlands. Depending on the status of the declaration on insolvency in Spain, the Dutch insolvency proceeding would be secondary or autonomous. Under Spanish law, substantive consolidation is exceptional. As a result, if Wallbox was declared insolvent, it would likely not consolidate their assets and liabilities, subject to the coordination of both insolvency proceedings and the rules established for insolvency proceedings of members of a group of companies under the European Regulation (EU) 2015/848.
Wallbox’s tax residency might change if the tax residency of dual resident entities is, in the new Dutch-Spanish Tax Treaty, determined by way of reaching mutual agreement.
Wallbox intends to be managed and operate so as to be treated exclusively as a resident of Spain for tax purposes as from its date of incorporation, on the basis that Wallbox has its place of effective management in Spain. As a result of its incorporation under Dutch law, Wallbox will however also remain a tax resident of the Netherlands for Dutch corporate income tax and dividend withholding tax purposes and, thus, will be considered tax resident in both the Netherlands and Spain (i.e. a
so-called
‘dual resident entity’). By virtue of the current convention between the government of the Kingdom of the Netherlands and the government of the Kingdom of Spain for the avoidance of double taxation with respect to taxes on income and on capital (the “Dutch-Spanish Tax Treaty”), in such case Wallbox will be considered a resident for purposes of the Dutch-Spanish Tax Treaty in the country where Wallbox is effectively managed. As noted above, Wallbox expects to have its tax residency since its incorporation (and to maintain it afterwards) in Spain. The Dutch-Spanish Tax Treaty is currently being renegotiated and may include a provision pursuant to which the tax residency of dual resident entities is determined by way of the Netherlands and Spain reaching mutual agreement, in line with the criterion applied in the OECD-sponsored Multilateral Convention to Implement Tax Treaty Related Measures to Prevent Base Erosion and Profit Shifting (“MLI”). The current Dutch-Spanish Tax Treaty is not a “Covered Tax Agreement” (as defined under the MLI) and it is therefore uncertain whether the Dutch and Spanish Tax Authorities may favor such an approach under the new Dutch-Spanish Tax Treaty. Such outcome can nevertheless not be ruled out. In such case, the competent authorities of the Netherlands and Spain would endeavor to determine by mutual agreement the sole tax residency of Wallbox. During the period in which a mutual agreement between both states is absent, Wallbox may not be entitled to any relief or exemption from tax provided by the new Dutch-Spanish Tax Treaty. During such period, there would also be a risk that both Spain and the Netherlands would levy dividend withholding tax on distributions by Wallbox, in addition to the risk of double taxation on the profits of Wallbox.
42
Both Spanish and Dutch dividend withholding tax may have to be withheld in case of distributions to unidentified Wallbox Shareholders.
As noted above under “
,” Wallbox does not expect to distribute dividends in the foreseeable future. However, should that happen, the Netherlands will not — regardless of the fact that Wallbox is intended to be a tax resident of Spain on the grounds of its place of effective management — be prevented from levying Dutch dividend withholding tax if Wallbox distributes profits to Dutch resident shareholders and to
Risk Factors — Risks Related to Class
A Shares — Wallbox does not expect to pay any dividends in the foreseeable future
non-Dutch
resident shareholders that have a permanent establishment in the Netherlands to which their respective shareholding is attributable. In order to avoid levying Dutch dividend withholding tax on such future dividend distributions, Wallbox may set up procedures to identify its shareholders, in order to assess whether there are Wallbox Shareholders in respect of which Dutch dividend withholding tax may have to be withheld. If the identification cannot be assessed upon the payment of a distribution, both Spanish and Dutch dividend withholding tax may have to be withheld on payments made to Wallbox Shareholders that fail to provide Wallbox, on a timely basis, with the information that may be required in order to prevent the applicability of Dutch dividend withholding taxes. Likewise, there is no guarantee that the procedure that Wallbox may put in place to identify its shareholders (which shall be required in order to assess the applicability of both Spanish and Dutch withholding taxes) will be fully effective.
Risks Related to U.S. Federal Income Taxation
If Wallbox is a passive foreign investment company for United States federal income tax purposes for any taxable year, U.S. holders of Class A Shares could be subject to adverse United States federal income tax consequences.
If Wallbox is or becomes a “passive foreign investment company,” or a PFIC, within the meaning of Section 1297 of the Code for any taxable year during which a U.S. holder holds Class A Shares or Public Warrants, certain adverse U.S. federal income tax consequences may apply to such U.S. holder. A
non-U.S.
corporation, such as Wallbox, will be classified as a PFIC for U.S. federal income tax purposes for any taxable year in which, after applying certain look-through rules, either (i) 75% or more of its gross income for such year consists of certain types of “passive” income or (ii) 50% or more of the value of its assets (determined on the basis of a quarterly average) during such year produce or are held for the production of passive income. Passive income generally includes dividends, interest, royalties, rents, annuities, net gains from the sale or exchange of property producing such income and net foreign currency gains. Wallbox does not believe that it will be treated as a PFIC for its current taxable year and does not expect to become one in the near future. However, PFIC status depends on the composition of a company’s income and assets and the fair market value of its assets from time to time, as well as on the application of complex statutory and regulatory rules that are subject to potentially varying or changing interpretations.
If Wallbox is treated as a PFIC, a U.S. holder of Class A Shares or Public Warrants may be subject to adverse U.S. federal income tax consequences, such as taxation at the highest marginal ordinary income tax rates on capital gains and on certain actual or deemed distributions, interest charges on certain taxes treated as deferred, and additional reporting requirements. See Item 10. “
” U.S. holders of Class A Shares and Public Warrants should consult with their tax advisors regarding the potential application of these rules.
Additional Information—Taxation—Material U.S. Federal Income Tax Consequences.
|
Item 4.
|
Information on the Company
|
A. History and Development of the Company
Corporate Information
Wall Box Chargers, S.L. was incorporated as a Spanish limited liability company (
) on May 22, 2015. Wallbox B.V. was incorporated as a Dutch private limited liability company (
sociedad limitada
besloten
43
vennootschap met beperkte aansprakelijkheid
On October 1, 2021 we closed the Business Combination pursuant to the Business Combination Agreement, dated as of June 9, 2021, as amended, by and among Wallbox B.V., Merger Sub, Kensington and Wallbox Chargers S.L. In connection with the closing of the Business Combination, we converted into a Dutch public limited liability company (
) and changed our legal name to Wallbox N.V. Our commercial name is “Wallbox.” In October 2021, we listed our shares and warrants on NYSE under the symbol “WBX” and “WBXWS” respectively.
naamloze vennootschap
On the Closing Date, (i) each outstanding Class A Share of Wallbox (including each such share resulting from the conversion of Wallbox’s convertible loans prior to the Closing by the noteholders thereof), and each outstanding Class B Ordinary Share was exchanged by means of a contribution in kind in exchange for the issuance of a number of Wallbox Class A Shares or Wallbox Class B Shares, as applicable, determined in each case by reference to an “Exchange Ratio,” calculated in accordance with the Business Combination Agreement, and (ii) each share of Kensington Class A Common Stock and Kensington Class B Common Stock outstanding immediately prior to the effective time of the merger (the “Merger Effective Time”) (other than certain customarily excluded shares) was converted into and become one share of new Kensington common stock, and each such share of new Kensington common stock was immediately thereafter exchanged by means of a contribution in kind in exchange for the issuance of Wallbox Class A Shares, whereby Wallbox issued one Wallbox Class A Share for each share of new Kensington common stock exchanged. All Wallbox shareholders, other than Enric Asunción Escorsa and Eduard Castañeda, received Wallbox Class A Shares in the exchange. Each of Enric Asunción Escorsa and Eduard Castañeda received class B ordinary shares in the share capital of Wallbox.
In connection with the foregoing and concurrently with the execution of the Business Combination Agreement and again on September 29, 2021, Kensington and Wallbox entered into the Subscription Agreements with the PIPE Investors, pursuant to which the PIPE Investors agreed to subscribe for, and Wallbox agreed to issue to such PIPE Investors, an aggregate of 11,100,000 Wallbox Class A Shares at $10.00 per share for gross proceeds of $111,000,000, also known as the PIPE Financing on the date on which the Closing occurs. The Wallbox Class A Shares issued pursuant to the Subscription Agreements have not been registered under the Securities Act in reliance upon the exemption provided in Section 4(a)(2) of the Securities Act. Wallbox has agreed to grant the PIPE Investors certain registration rights in connection with the PIPE Financing. The PIPE Financing was contingent upon, among other things, the closing of the Business Combination.
We are registered in the Commercial Register of the Netherlands Chamber of Commerce (
) under number 83012559. Our official seat (
) is in Amsterdam, the Netherlands and the mailing and business address of our principal executive office is Carrer del Foc 68, 08038 Barcelona, Spain. Our telephone number is +34 930 181 668. Our agent for service of process in the United States is:
Kamer van Koophandel
statutaire zetel
Wallbox USA Inc.
800 W. El Camino Real, Suite 180
Mountain View, CA 94040
Our website address is www.Wallbox.com. We may use our website as a means of disclosing material
non-public
information. Such disclosures will be included on our website in the “Investor Relations” section or at investors.wallbox.com. Accordingly, investors should monitor such sections of our website, in addition to following our press releases, SEC filings and public conference calls and webcasts. Information contained on, or that can be accessed through, our website does not constitute a part of this Annual Report and is not incorporated by reference herein. We have included our website address in thi Annual Report solely for informational purposes. Our SEC filings are available to you on the SEC’s website at http://www.sec.gov. This site contains reports and other information regarding issuers that file electronically with the SEC. The information on that website is not part of this Annual Report and is not incorporated by reference herein.
44
For a discussion of our principal capital expenditures and divestitures, refer to Item 5. “Operating and Financial Review and Prospects — Liquidity and Capital Resources,” Item 4. “Information on the Company — Property, Plant and Equipment” and Note 8, “
, included within our consolidated financial statements included elsewhere in this Annual Report.
Property, plant and equipment”
B. Business Overview
Overview
Wallbox is a global leader in smart electric vehicle charging and energy management. Founded in 2015, Wallbox creates smart charging systems that combine innovative technology with outstanding design and that manage the communication between user, vehicle, grid, building and charger.
Wallbox’s mission is to facilitate the adoption of electric vehicles today to make more sustainable use of energy tomorrow. By designing, manufacturing, and distributing charging solutions for residential, business, and public use, Wallbox is laying the infrastructure required to meet the demands of mass electric vehicles (“EV”) ownership everywhere. Wallbox’s customer-centric approach to its holistic hardware, software, and service offering has allowed Wallbox to solve barriers to EV adoption today as well as anticipate opportunities soon to come. Wallbox is creating solutions that will not only allow for faster, simpler EV charging but that will also change the way the world uses energy.
Its smart charging product portfolio includes Level 2 alternating current (“AC”) chargers (“Pulsar Plus”, “Commander 2” and “Copper SB”) for home and business applications, and direct current (“
”) fast chargers (“Supernova” and “Hypernova”) for public applications. The Company also offers the world’s first
DC
bi-directional
DC charger for the home (“Quasar”), which allows users to both charge their electric vehicle and use the energy from the car’s battery to power their home or business, or send stored energy back to the grid. The Company’s proprietary residential and business software (“myWallbox”) gives users and charge point owners complete control over their private charging and energy management activities. Meanwhile, Wallbox’s dedicated semi-public and public charging software platform, (“Electromaps”) enables drivers to locate and transact with all public charging stations registered to its brand-agnostic charger database and also allows charge point operators to manage their public charging stations at scale.
As of the fiscal year ended December 31, 2021, Wallbox had offices across three continents and sold over 191,000 units across 98 countries. Its products are currently manufactured in Spain and China, with plans to add a U.S. manufacturing facility in Arlington, Texas in the second half of 2022. Through its vertically-integrated model, Wallbox keeps development cycles short, enabling an accelerated time to market. Furthermore, Wallbox’s compliance with complex certification requirements paired with its focus on engineering excellence is powering its rapid growth as the global supplier of first-class charging products.
For geographical and segmental revenue, see Item 5. “
” and Note 7,
, included within our consolidated financial statements included elsewhere in this Annual Report.
Operating and Financial Review and Prospects — Segment Results
Operating Segments
Industry Overview / Market Opportunity
Electric Vehicles
Driven by a global focus on the energy transition and the decreasing manufacturing costs, the world of transportation is experiencing an accelerated shift towards electrification. According to the 2021 edition of the BNEF Electric Vehicle Outlook, on June 9, 2021, BNEF increased its projections of the EV fleet size by 2030 significantly from 116 million vehicles to 169 million vehicles; more than 14 times the current EV fleet size. Key drivers for this increase are various stakeholders’ responses to
COVID-19,
additional government support, further improvements of unit economics related to batteries, and more and more commitments from carmakers. Global passenger electric vehicle sales more than doubled in 2021 compared to 2020, reaching over 6.5 million”, which is expected to be surpassed in the near future as the demand for EVs continues to grow significantly.
45
Cumulative number of electric vehicles per region
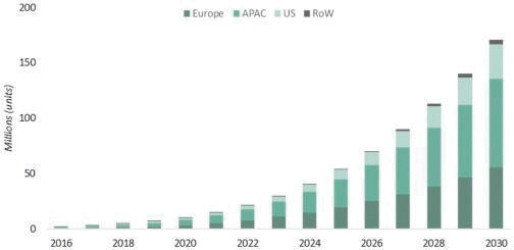
Source: BNEF Electric Vehicle Outlook 2021
An important driver of car fleet electrification is the financial and legal support governments are providing for the deployment of EVs and charging infrastructure. Several countries are banning the sales of internal combustion engine (“ICE”) vehicles over the period from 2030 or 2035, stimulated notably by bonus-malus tax systems in numerous European countries to make EVs more affordable while charging higher tax rates on polluting ICE vehicles. Globally, there are regulatory support packages that will boost the sector significantly, including the European Green Deal — a stimulus package of at least EUR 1 trillion for investments in the climate-neutral and circular economy in Europe. Overall, these commitments should contribute significantly to the CO2 emission reduction goals as part of the Paris Agreement to cut emissions by at least 55% in Europe by 2030. In the United States, the Biden administration has committed $174 billion towards investments in EVs, consisting of sale rebates and tax incentives for consumers and grant and incentive programs for state and local governments to expand the charging infrastructure across the country significantly. Furthermore, according to state-owned media, China will invest up to $900 billion between 2021 and 2025 in the development of the power grids with a focus on EV charging and smart infrastructure.
Due to these drivers, Wallbox believes the global automotive industry is transforming and committing to rapidly invest in expansion of their EV offering range — more than 100 new models have been announced to hit the market by 2024 — while simultaneously being able to produce them at lower prices. Certain automakers, such as Jaguar, Volvo, and GM, aim to stop selling ICE vehicles by 2025, 2030, and 2035, respectively. This is induced, among other factors, by a similar development in the battery manufacturing industry, which is continuously competing to develop more efficient batteries at lower costs. By 2024, BNEF believes the price of
lithium-ion
battery packs will drop below $100 per kWh as a result of reduced costs, improvements in energy density and more efficient production. At this price point, EVs will be able to better compete with ICE vehicles, thus further advancing the demand.
Regionally, the United States is behind Europe and China in terms of EV penetration, but is expected to accelerate quickly due to the improving unit economics of EVs, the high number of households with two or more vehicles and access to home charging, and the climate change initiatives of the Biden Administration. The EV uptake in the rest of the world will take longer due to limited policy support and
low-cost
ICE vehicles, but sales are expected by BNEF to grow rapidly in the 2030s. To get back on track for a
net-zero
emission system by 2050 — an objective at the heart of the European Green Deal and in line with the Paris Agreement, International Energy Agency (“IEA”) forecasted that it would require
zero-emission
vehicles to represent almost 60% of global new passenger vehicles sales by 2030.
46
EV Charging Infrastructure
To support this shift towards EVs, the global EV charging network will need to ramp up its capacity, presenting a significant, industry-wide market opportunity for EV charging infrastructure with a projected total addressable market (“TAM”) of $102 billion by 2030. The projected TAM, which was based on the 2021 version of the BNEF Electric Vehicle Outlook prior to BNEF increasing its projections of the EV fleet size, consists of charging hardware, installations, software, and energy management solutions. In total, we expect approximately 309 million chargers will be needed across the globe by 2040 to facilitate the mass adoption of EVs. This total will constitute over 270 million chargers designated for usage at home and workplace, 24 million chargers placed in strategic public locations, 12 million for workplaces, and over 4 million allocated for the global bus and trucking fleet. In order to reach this ambitious target, a cumulative investment of over $589 billion is forecasted to be required.
Home charging remains the largest charging segment, which is expected to make up 40% of total investment. Within the overall charging demand,
at-home
and
at-work
will, according to BNEF account for 70% of all charging. We believe the public DC charging infrastructure will play an important role to facilitate long-distance driving, fleet charging, and semi-public charging. In the longer term, we anticipate most semi-public charging infrastructure will convert to
60-100kW
charge points and replace the slow AC chargers
(7-22kW),
due to advancements and cost reductions in the technology. The movement is underpinned by the large share of total investment contributing to public fast charging infrastructure by 2040 — BNEF forecasts that public fast charging will be the second largest category, with almost half of the total investment, after home charging (40%). This will enable a faster and more convenient charging experience for EV drivers.
Cumulative number of global charge points installed

Source: BNEF Electric Vehicle Outlook 2021
Due to the increasing demand for electricity and the goal to unburden the grid in an efficient and effective manner, additional energy storage could play a role in decentralizing the grid, helping to reduce peak rates and unbalanced loads. At the end of 2020, electric vehicles with a total battery capacity of 482 GWh, already had over 13 times more storage capacity than stationary grid-scale batteries installed globally. With an estimated energy capacity of 8,500 GWh stored in the batteries of EVs by 2030, smart charging solutions and
bi-directional
charging with the capabilities to support energy management at home and on the grid will play an essential role in the decentralization of the grid. V2G has the potential to become a major tool for grid operators in managing peak energy demand and vehicle to home has the potential to generate significant savings for individuals. IEA
47
forecasted in its EV Outlook 2020 that EVs could provide about 600 GW of flexible capacity through V2G applications during peak times across Europe, the US, and China by 2030.
We believe intelligent EV charging software will be the key enabler of smart charging and energy management solutions for homes, businesses, and fleets, utilizing and monetizing valuable data on charging behavior, vehicles, and the grid. Use cases where the electricity need is the highest, including commercial fleets and the destination charging segment (e.g., grocery stores, universities, and hotels), provide meaningful opportunity for smart charging and energy management software solutions, such as energy balancing, grid management, renewable energy integration, energy trading, and storage. In addition, we expect EV charging software will also play a fundamental role in the connectivity of and interoperability between charge points, ensuring a public network accessible to everybody along with the opportunity to connect the charge points in the field for energy management solutions.
The Wallbox Model
Since its inception, Wallbox has been progressively building a charging solutions ecosystem enabling users worldwide to seamlessly manage their energy needs through a combination of hardware, software, and service. During this journey, Wallbox has been closely following the EV user and catering to their needs.
The first phase of this journey started in 2016 with the launching of the Pulsar and Commander AC chargers. The company’s founders analyzed the EV charging market and saw an unserved demand for compact, smart, and efficient residential charging products, based on an estimated 70% charging happening at home. After providing the residential market these innovative AC chargers, Wallbox launched its complementary software, myWallbox, which enabled users to monitor in real time their EV charging status and program the charger to charge during
off-peak
hours permitting cost savings.
In 2019, as EV’s started to become widely adopted and the demand for parking spaces with
EV-charging
solutions increased, Wallbox added the Copper charger to its AC charging portfolio and launched a second generation of its Pulsar and Commander chargers. This new generation of semi-public chargers included multi-user capabilities for fleets, offices, and condominiums, including: local load balancing, power sharing, security-locking and payment options for monthly individual invoices, amongst others.
Also in 2019, Wallbox launched its first DC bidirectional charger, Quasar. Quasar enables users to make flexible use of the energy saved in the battery and discharge the EV battery during peak hours when energy costs are high, sell it back to the grid where regulations allow or discharge the energy stored in their vehicle to power their home during blackouts. Moreover, Quasar allows EV owners producing solar or other renewable energy to store that clean energy in their vehicle, when not being fully utilized by the home. Quasar is a compact, affordable and
product that is revolutionizing home charging and energy management.
easy-to-use
Wallbox believes the demand for public charging will continue to grow with the overall increasing presence of EVs. As EVs become cheaper and therefore penetrate a broader customer demographic, including those who are less likely to own a private parking space, the need for public charging facilities will be further heightened. Wallbox aims to address this demand through the commercialization of its first DC fast charger for public use, Supernova. Supernova, which we first introduced in late 2020, is DC fast charger to be used in semi-public and public environments. The first generation version is designed to be able to charge at speeds of 60 kW and the second generation version is expected to be able to charge at speeds of 120 kW. Supernova offers an internal design intended to make it light and easy to install by integrating multiple elements of Wallbox’s bidirectional charger Quasar.
Expanding its product portfolio for the DC fast charging space, Wallbox announced its newest product, Hypernova at the IAA Mobility fair in 2021. Hypernova is designed to deliver up to 350 kW that allows it to fully charge an electric car in the time it takes to make a rest stop and make it substantially faster than most other
48
ultrafast chargers on the market. It also employs advanced software that allows it to optimize available power and adapt to the number of EVs connected, making it an ideal option for public charging along highways and transcontinental road networks.
Wallbox’s offering of public charging solutions is complemented through Electromaps, an online platform that enables users to find publicly available charging ports and pay for its use. The data obtained through this platform is highly valuable given it allows Wallbox to monitor public charging trends and analyze opportunities for the future deployment of Supernova.
Since 2015, Wallbox has been enhancing its hardware and software ecosystem, providing the EV charger user a full suite of EV charging solutions and energy management solutions, catalyzing the EV adoption and sustainable energy use. During these last 6 years, Wallbox has based its user-centric business model on the following five key pillars:
1.
: Wallbox’s goal is to make every person feel confident and comfortable using a Wallbox product; therefore, even Wallbox’s most advanced technology is easy to use.
Make charging technology simple
2.
: From embedded intelligence that balances the energy use between customer’s car and home, to breakthroughs in
(“V2G”) and
(“V2H”) energy management, Wallbox products bring together the best in EV charging technology.
Smart solutions
vehicle-to-grid
vehicle-to-home
3.
: Innovation is at Wallbox’s core, focusing not just on customers’ needs today, but their needs in the future.
Innovative technology
4.
: Wallbox believes that design is a necessity, not a luxury. A well-designed product makes for a better experience, and this is what Wallbox strives for across its entire product portfolio.
Design-centric solutions
5.
: Wallbox equipment is compatible with all hybrid and electric car manufacturers across the globe, and Wallbox sells its products in countries across six continents.
Highly compatible charging solutions
This business model materializes into revenues through the: (i) sale of hardware (chargers & accessories); (ii) hardware installation services; and (iii) software services (subscription fees from businesses and fleets through myWallbox and commissions obtained from every charging transaction carried out through Electromaps).
Portfolio
Wallbox offers a broad range of EV charging hardware, software, and services to users in the home, business and public domains. All Wallbox chargers integrate
intelligent software features, which positions the company as one of the smartest and most user-friendly solutions on the market. The company’s software platforms
and
allow users to seamlessly manage their energy and make EV charging a seamless, simple experience.
out-of-the-box
myWallbox
Electromaps
49

| • |
Home
& Business
|
| • |
EV Charging Hardware:
|
| • |
Pulsar Plus:
Wi-Fi
and Bluetooth connectivity, the smart features available on the myWallbox app, and compatibility with OCPP communication protocols.
|
| • |
Commander 2:
7-inch
touchscreen display that provides a personalized and secure user interface for multiple users. It has up to 22 kW of charging capacity and allows user access through the use of password protection, RFID cards or the myWallbox app. Commander 2 key characteristics include 4G, WiFi, Ethernet and Bluetooth connectivity, the smart features available on the myWallbox app, and compatibility with OCPP communication protocols.
|
| • |
Copper SB:
Wi-Fi,
Ethernet and Bluetooth connectivity, the smart features available on the myWallbox app, and compatibility with OCPP communication protocols.
|
| • |
Quasar:
bi-directional
charger for
home-use
that allows users to charge and discharge their electric vehicle, enabling them to use their car battery to power their home or sell energy back to the grid. Its V2H
(vehicle-to-home)
(vehicle-to-grid)
Wi-Fi,
Ethernet and Bluetooth connectivity, and the smart features available on the myWallbox app.
|
50

| • |
EV Charging Software
|
| • |
The myWallbox platform:
|
| • |
Manage charging status and information from smart devices
|
| • |
Real-time status, notifications and statistics of Wallbox chargers
|
| • |
Remote locking and unlocking Wallbox chargers on the myWallbox app
|
| • |
Manage multiple users and chargers using the myWallbox portal
|
| • |
Accessing an integrated payment system to manage charging fees
|
| • |
Accessing a range of intelligent energy management features such as:
|
| • |
Schedules that take advantage of
off-peak
utility rates
|
| • |
Power Sharing, that allows connecting multiple chargers to the same electrical circuit and balances the power distribution based on each vehicle’s need for power
|
| • |
Dynamic Power Sharing, that measures the live energy usage at home or in the building and automatically adjusts the charge to all connected EVs in harmony with the local grid’s capacity, avoiding blackouts and costly energy bills.
|

51
| • |
Public
|
| • |
EV Charging Hardware
|
| • |
Supernova:
round-the-clock
on-site
maintenance, reducing costs and simplifying planning and operations. Equipped with CCS & CHAdeMO charging cables, OCPP compatibility and
over-the-air
|
| • |
Hypernova
|
| • |
EV Charging Software
|
| • |
Electromaps:
e-mobility
service provider (eMSP) and charger management software with more than 100,000 users which is connected to more than 400,000 charge points worldwide and enables users to find publicly available charging ports. In addition, Wallbox has established partnerships in Europe with operators of charging points that allow users to pay for their charging directly via Electromaps. For these charging points, Wallbox earns an approximately 10% commission for each of the charging sessions carried out through the app. Wallbox intends to extend these relationships with charging operators outside of Europe and enable this payment feature globally.
|
52

| • |
Building Energy Management Software
|
| • |
Sirius:
on-site
batteries and other renewable energy sources. Sirius is capable of managing various energy sources and can automatically choose the greenest or cheapest one available to meet the building’s demand, as well as storing energy surpluses in EVs or battery walls plugged to the system. With its automated intelligence, Sirius is designed to increase a building’s renewable energy consumption significantly. It is also designed to help solve one of the biggest challenges of large-scale use of most green energy sources: its weather-dependent availability, which often results in supply/demand imbalances and consumption inefficiencies.
|
| • |
Sirius is currently in beta testing and is being used to power Wallbox’s headquarters in Barcelona. In its first six months of use, Sirius increased the building’s renewable energy consumption by 20% and reduced grid dependency by 50%. In this setting, the smart management system uses a fleet of 23 Nissan LEAF cars and Wallbox’s bidirectional Quasar chargers, as well as 750 square meters (approximately 7,500 square feet) of solar panels. This is integrated with 560 kWh of onsite energy storage and the city’s electric grid.
|
| • |
Upgrades
& Accessories
|
| • |
Wallbox provides upgrade options that combine the myWallbox platform different subscription plans with our energy meters and accessories, enabling advanced energy management features and seamless charges:
|
| • |
Energy meter:
|
| • |
EV charging cables:
|
| • |
Pedestals:
|
| • |
RFID cards:
|
| • |
Services
|
| • |
Wallbox offers necessary services to provide tailored
end-to-end
|
| • |
Installation:
in-depth
acquired knowledge of Wallbox products
|
53
|
ensure installations according to local governmental and industrial standards. This also allows Wallbox to sell charger and installation bundles through its ecommerce website and on 3rd party marketplaces like Amazon. Wallbox chargers a percentage of the total installation cost to the installer for providing any installation opportunity.
|
| • |
Maintenance:
|
| • |
Charging network management:
|
Manufacturing
Wallbox designs and manufactures its products
in-house
across its 2 factories located in Catalonia, Spain (Sant Andreu de la Barca) and Suzhou, China (Wallbox FAWSN). In addition, Wallbox opened its third factory in Barcelona, Spain (Zona Franca) in December 2021, which is expected to have a production capacity of 10,000 Supernova chargers per year by mid of 2022. Wallbox will open a factory in the U.S. in Arlington, Texas in the second half of 2022 to address the North American EV charging market. All chargers manufactured across Wallbox facilities are certified to be sold across the United States, the European Union and China.
Wallbox’s manufacturing capabilities are supported by its supply chain control. CEO Enric Asunción Escorsa brought his previous charging certification expertise from Tesla and made it a core focus for Wallbox; mitigating difficulties that many competitors experience when navigating the stringent certification procedures present in many jurisdictions. Combining this certification expertise with Wallbox’s
validation capabilities helps result in an agile production environment which facilitates efficient adaption to unexpected market changes and shortages, such as during
in-house
testing and
end-of-line
COVID-19
and ability to manage and address the lack of critical components like microchips or lithium .
Customers and Strategic Partnerships
Wallbox has established and maintained strong long-term relationships with a broad range of partners in order to broaden its sales channels across a wide range of customers and geographies. Some of the key types of partners Wallbox seeks to work with include automotive manufacturers, utility companies, distributors, resellers, installers, enterprises, and eCommerce companies. Some of the key clients Wallbox has previously worked with include automotive OEMs and dealerships, energy companies, value-added distributors and resellers, installers, enterprises, and
e-commerce.
Of these companies, in the fiscal year 2021, approximately 40% of Wallbox’s revenues come from automotive manufacturers and utility companies, such as Nissan, Hyundai, and Mercedes, and Iberdrola, Electricity Generating Authority of Thailand (“EGAT”), and Compañia de Petroleos de Chile (“COPEC”). Wallbox has a longstanding partnership with Iberdrola, a large multinational electric utility and Wallbox’s largest institutional investor. In July 2020, Iberdrola entered into a
-
.” Wallbox intends to leverage its partnership with Iberdrola to assist with global expansion and accelerate the market entrance of its Supernova product.
non-binding
letter of intent with Wallbox expressing its interest in purchasing 6,500 Supernova chargers through 2022. Additionally, in June 2021, Iberdrola announced the intention to acquire the first 1,000 Wallbox Supernova fast chargers as part of its five-year sustainable mobility plan to deploy more than 150,000 chargers in homes, businesses, and public road networks. For a description of the
non-binding
letter of intent, see “Item 7. “
Major Shareholders and Related Party Transactions
Related Party Transactions
Roughly 40% of Wallbox’s sales during fiscal year 2021 were due to distributors, resellers, and installers such as Uber, Sunpower, MediaMarkt, Ingram Micro, Crowd Charge, IZI by EDF, and Saltoki. The remaining 20% of sales during 2021 were from direct sales, split almost evenly between sales to enterprises and
54
e-commerce
sales made directly through Wallbox’s website or via Amazon, where Wallbox achieved the distinction of number one bestseller and “Amazon’s Choice” in the US for its category, just three months after launch.
Go-to-Market
Wallbox’s product focus follows the user. Given that 70% of EV charging happens at home, Wallbox predominantly focuses on home and business solutions, but starting in the first quarter of 2022 also expects to sell its first units of Supernova for public charging.
One of the many ways in which Wallbox differentiates itself in the EV charging market is the consumer-focused approach of its product offering. Unlike many of the more traditional industrials-type EV charging products, Wallbox places a particular focus on compact and appealing product designs and
for the customers across their whole product experience — from purchase — to installation — to usage.
ease-of-use
Wallbox sells its EV charging solutions through various channels. The most logical point of sale of a charger is at automotive OEMs and utility companies. The Company has built and maintains an ecosystem of partner channels including, installers, resellers and
value-add
distributors. Additionally, Wallbox also sells directly to enterprises and end consumers though
e-commerce
sales.
Wallbox offers the best customer purchasing experience across all its channels:
Own channels — Customers can purchase the charger and installation as a bundle with delivery within 48 hours. Customers can also pay in installments.
Partner channels — Wallbox provides marketing materials, training and support to its partners to improve sales. The Company, through Wallbox Academy, offers training and educational materials to installers to improve sales performance.
Home & Business
Strategy:
Go-to-Market
Wallbox sells EV charging solutions in 98 countries and has successfully penetrated several markets that previously had limited EV charging presence.
Wallbox intends to enter new markets through partnering with local companies that offer geography specific knowledge, strong installation and charge point operations (CPO) capabilities, and relationships with potential future clients. By leveraging the partner’s local expertise combined with Wallbox’s differentiated solution, it pursues various customers, such as, national utilities, OEMs, auto dealerships, and importers. This will help Wallbox build out a network of installation partners,
value-add
resellers and distributors in the region. Wallbox accelerates growth in each region through qualified leads, channel marketing and advertising, installation and commercial training. After achieving scale in the market Wallbox then establishes field offices and continues to seek other B2B opportunities for further expansion.
Public
Strategy:
Go-To-Market
Wallbox began the
roll-out
of its first public charger, Supernova, in the first half of 2022 through a
two-phase
approach:
| • |
Partnerships with utilities and local distributors:
non-binding
letters of intent to collaborate with some of the world’s biggest utility companies such as Iberdrola, EGAT, COPEC and Jetcharge.
|
55
| • |
Building a sales network:
roll-out
comprises the development of a set of commercial agreements with trusted partners that might be interested in acquiring the Supernova to deliver a fast-charging solution to either their fleets (e.g. a supermarket which has EVs for their delivery service), or for their customers (e.g. a shopping mall that wants to provide users with the ability to charge their parked car while shopping). Wallbox will leverage its already existing commercial agreements on Home & Business chargers to offer these enterprises its new public fast charging solution, Supernova.
|
Competition
Wallbox is approaching the market with a differentiated, user-focused philosophy: it started its journey within the home segment, built out a strong and compelling brand, and subsequently added the business and public segments to its product portfolio, empowering users everywhere they go. With only a very few companies operating globally, Wallbox has a competitive position to support the EV driver on the full spectrum of EV charging. The company owns the entire process
in-house
— from design to manufacturing and certification — allowing Wallbox to adapt and respond quickly with a product that fits different customer needs across borders and on a global scale. With their product portfolio of smart charging solutions for residential and work use and fast DC chargers and EMP solution, Wallbox is poised to be a leader in the industry.
Europe
The European EV charging market is characterized as fragmented. There are many small and local players, with only a limited number of parties having sufficient scale and funding to be competitive in the long term. The European market is important as it is expected to grow rapidly, following leading European markets such as Norway and the Netherlands. Even though there are many local parties with a solution for public charging, we believe Wallbox offers more stylish, compact, lighter, and feature-rich products, which is appealing for residential charging and caters to the entire continent. In addition to the superior charging solutions and important energy management capabilities, the company is well-positioned in Europe with local offices in several countries complemented by a European-wide partnership with installers, OEMs, and distributors.
North America
Although the North American market is still in development from an EV penetration perspective, it is an important market for Wallbox to position itself early. Namely, as one of the largest car countries globally, we believe the North American market has a significant sales volume potential. Especially due to the strong government incentives currently in place, the EV sales are expected to increase rapidly. From a competitive perspective, the North American market has high barriers to entry due to strict certification and validation requirements. Therefore, this market differs from Europe as the market is less fragmented with only a few large players: a dynamic that Wallbox sees as ripe for disruption. With its residential offering, we believe Wallbox is well-positioned to gain market share as it can capitalize well on the consumer-driven characteristics of this market. Also, the company expects to open a manufacturing facility in the second half of 2022 to produce and distribute DC Supernova chargers to the North American market.
APAC
The APAC market continues to be one of the leading EV charging markets in the coming years. China is currently, by far the market leader in public charging in terms of the number of public charge points installed. Yet, similar to the European market, the rest of APAC market can be characterized as a highly fragmented market with less than a handful of players that have gained significant scale in the industry. From a technology and pricing perspective, the EV charging solutions are cost-competitive as they can be manufactured at a lower cost point. However, the charge points in the APAC region tend to have inferior technology in terms of quality, functionalities, and capabilities. With its innovative, advanced, smart, and seamlessly connected EV charging
56
solution technology with
functionalities and embedded software, Wallbox has developed a differentiated solution for the APAC market. In addition, Wallbox has bolstered its position with an office in Shanghai covering China and APAC regions and a joint venture with Changchun FAWSN, one of the largest auto OEMs globally.
easy-to-use
Competitive Strengths
Strong global brand
Wallbox has built a brand by taking a very consumer centric approach. Wallbox does not white label its products, which allows it to keep margins high and create a recognizable brand entity. The Company’s award winning product portfolio is third-party validated by highly regarded international trade organizations, including Winner of Good Design (2021), Best of CES (2020), and Fast World Changing Ideas finalist (2020) amongst others.
Large global total addressable market
Wallbox believes the EV market is at an inflection point and is experiencing substantial growth. Mass EV adoption translates to significant charging infrastructure growth. The total addressable market for Wallbox is projected to be $102 billion by 2030. We believe Wallbox is positioned to capture and control a large share of this market by leveraging smart charging technology to enable mass EV adoption, fast time to market and robust supply chain to meet demand, global operations and local certifications.
Full-service technology provider
Wallbox has a full suite of EV charging solutions spanning proprietary hardware, software, and services for domestic, business and public charging. The Company’s enterprise grade software platform seamlessly connects across all of the chargers. Today, through MyWallbox and Electromaps, Wallbox has managed over 9.9 million charging sessions and over 125 GWH charged. Additionally, we believe Wallbox offers the most innovative features on the market, such as Bluetooth, PV match, gesture control, facial recognition, V2H/V2G, which allows Wallbox to maintain high margins.
Powerful business model
Wallbox has consistently achieved over 100% revenue growth rates year over year due to its scalable business model and ability to successfully implement its sales strategy into new geographies. Wallbox’s
in-house
design and manufacturing capability enables Wallbox to have very fast development cycles, adapt to the ever-changing global supply chain and never run out of stock.
In-house
certification allows Wallbox to expand to new countries and adapt to new local requirements.
Truly global business with strong blue-chip customers
Wallbox serves a variety of customers and has established channel distribution in more than 98 countries. Customers include automotive manufacturers, utility companies, resellers, distributors and installers. Wallbox also sells direct to consumers via enterprise or
e-commerce
sales through its website or via Amazon.
Uniquely positioned at the intersection of energy and mobility markets
EV owners typically double their home’s energy consumption through charging. Wallbox’s embedded software across all its products enables customers to control charging and manage energy. For example, Wallbox’s DC
bi-directional
charger for the home, Quasar, allows the battery of an EV to discharge the energy stored in the vehicle and power a home for up to five days. Quasar also allows EV owners producing renewable energy to store the energy in their vehicles when not fully utilized by their home.
57
Founder-led
company, experienced management team and high-profile investors
Wallbox is led by a management team with expertise across technology, energy, industrial and financial organizations. As of December 31, 2021, the Company had a team of over 775 individuals, which consist of mostly software and hardware engineers and a global salesforce. Since its founding in 2015, Wallbox has been able to demonstrate its capabilities in expanding the EV charging business in Europe, North America and Asia. Wallbox is backed by global leading strategic and financial investors, including Iberdrola.
Seasonality
For a description of our business seasonality, see Item 5. “Operating and Financial Review and Prospects.”
Intellectual Property
Wallbox relies on a combination of patent, trademark, copyright, unfair competition and trade secret laws, as well as confidentiality procedures and contractual restrictions, to establish, maintain and protect its proprietary rights. Wallbox’s success depends in part upon its ability to obtain and maintain proprietary protection for Wallbox’s products, technology and
know-how,
to operate without infringing the proprietary rights of others, and to prevent others from infringing Wallbox’s proprietary rights.
As of December 31, 2021, Wallbox had two European patents and two pending international patent applications. Wallbox continues to regularly assess opportunities for seeking patent protection for those aspects of its technology, designs and methodologies that it believes provide a meaningful competitive advantage.
Wallbox intends to continue to regularly assess opportunities for seeking patent protection for those aspects of its technology, designs and methodologies that Wallbox believes provide a meaningful competitive advantage. If Wallbox is unable to do so, its ability to protect its intellectual property or prevent others from infringing its proprietary rights may be impaired.
Government Regulation
Product Certifications
Throughout the world, electrical appliances are subject to various mandatory and voluntary standards, including requirements in some jurisdictions, including the United States, that products be listed by Underwriters’ Laboratories, Inc. (“UL”) or other similar recognized laboratories. In the United States, Wallbox is required to undergo certification and testing of compliance with UL standards, as well as other national and industry specific standards. Wallbox endeavors to have its products designed to meet the certification requirements of, and to be certified in, each of the jurisdictions in which they are sold. Wallbox provides many of its certifications
in-house
depending on the local requirements; although, the requirements for certification vary from jurisdiction to jurisdiction and may require third party certifications in certain jurisdictions.
CPSC
As a marketer and distributor of consumer products, Wallbox is subject to the Consumer Products Safety Act and the Federal Hazardous Substances Act, which empower the U.S. Consumer Product Safety Commission (“
”) to seek to exclude products that are found to be unsafe or hazardous from the market. Under certain circumstances, the CPSC could require Wallbox to repair, replace or refund the purchase price of one or more of Wallbox’s products, or Wallbox may voluntarily do so.
CPSC
OSHA
Wallbox is subject to the Occupational Safety and Health Act of 1970, as amended (“OSHA”). OSHA establishes certain employer responsibilities, including maintenance of a workplace free of recognized hazards
58
likely to cause death or serious injury, compliance with standards promulgated by the Occupational Safety and Health Administration and various record keeping, disclosure and procedural requirements. Various standards, including standards for notices of hazards, safety in excavation and demolition work and the handling of asbestos, may apply to Wallbox’s operations.
NEMA
The National Electrical Manufacturers Association (“NEMA”) is the association of electrical equipment and medical imaging manufacturers. NEMA provides a forum for the development of technical standards that are in the best interests of the industry and users, advocacy of industry policies on legislative and regulatory matters, and collection, analysis, and dissemination of industry data.
Waste Handling and Disposal
Wallbox generally does not manufacture the components of its charging products. Rather, its employees and contractors engage in assembly of charging products at its facilities primarily using components manufactured by OEMs. Nonetheless, Wallbox may be subject to laws and regulations regarding the handling and disposal of hazardous substances and solid wastes, including electronic wastes and batteries. These laws generally regulate the generation, storage, treatment, transportation and disposal of solid and hazardous waste, and may impose strict, joint and several liability for the investigation and remediation of areas where hazardous substances may have been released or disposed. For instance, CERCLA, also known as the Superfund law, in the United States and comparable state laws impose liability, without regard to fault or the legality of the original conduct, on certain classes of persons that contributed to the release of a hazardous substance into the environment. These persons include current and prior owners or operators of the site where the release occurred as well as companies that disposed or arranged for the disposal of hazardous substances found at the site. Under CERCLA, these persons may be subject to joint and several strict liability for the costs of cleaning up the hazardous substances that have been released into the environment, for damages to natural resources and for the costs of certain health studies. CERCLA also authorizes the EPA and, in some instances, third parties to act in response to threats to the public health or the environmental and to seek to recover from the responsible classes of persons the costs they incur. Wallbox may handle hazardous substances within the meaning of CERCLA, or similar state statutes, in the course of ordinary operations and, as a result, may be jointly and severally liable under CERCLA for all or part of the costs required to clean up sites at which these hazardous substances have been released into the environment.
Wallbox also generate solid wastes, which may include hazardous wastes that are subject to the requirements of the Resource Conservation and Recovery Act (“RCRA”) and comparable state statutes. While RCRA regulates both solid and hazardous wastes, it imposes strict requirements on the generation, storage, treatment, transportation and disposal of hazardous wastes. Certain components of Wallbox’s products are excluded from RCRA’s hazardous waste regulations, provided certain requirements are met. However, if these components do not meet all of the established requirements for the exclusion, or if the requirements for the exclusion change, Wallbox may be required to treat such products as hazardous waste, which are subject to more rigorous and costly disposal requirements. Any such changes in the laws and regulations, or Wallbox’s ability to qualify the materials it uses for exclusions under such laws and regulations, could adversely affect Wallbox’s operating expenses.
Similar laws exist in other jurisdictions where Wallbox operates. Additionally, in the EU, Wallbox is subject to the Waste Electrical and Electronic Equipment Directive (“WEEE Directive”). The WEEE Directive provides for the creation of collection scheme where consumers return waste electrical and electronic equipment to merchants, such as Wallbox. If Wallbox fails to properly manage such waste electrical and electronic equipment, it may be subject to fines, sanctions, or other actions that may adversely affect Wallbox’s financial operations.
59
General
Environmental and health and safety laws and regulations can be complex and may be subject to change, such as through new requirements enacted at the supranational, national,
sub-national,
and/or local level or new or modified regulations that may be implemented under existing law. The nature and extent of any changes in these laws, rules, regulations and permits may be unpredictable and may have material effects on Wallbox’s business. Future legislation and regulations or changes in existing legislation and regulations, or interpretations thereof, including those relating to hardware manufacturing, electronic waste, or batteries, could cause additional expenditures, restrictions and delays in connection with Wallbox’s operations as well as other future projects, the extent of which cannot be predicted. For instance, California may adopt more stringent regulation for DC fast charging by 2024.
C. Organizational Structure
Please refer to Note 28, “
,” within our consolidated financial statements included elsewhere in this Annual Report for a listing of our significant subsidiaries, including name, country of incorporation, and proportion of ownership interest.
Details of Wallbox Group Subsidiaries
D. Property, Plant and Equipment
Our Facilities
Wallbox designs and manufactures its products
in-house
across its two factories located in Catalonia, Spain (Sant Andreu de la Barca) and Suzhou, China (Wallbox FAWSN). In addition, in December 2021, Wallbox opened its third factory in Barcelona, Spain (Zona Franca). Wallbox expects to open a factory in the U.S. in second half 2022 in Arlington, Texas, to address the North American EV charging market. All chargers manufactured across Wallbox facilities are certified to be sold across the United States, the European Union and China.
Wallbox’s headquarters are located in Barcelona, Spain where it currently leases approximately 11,000 square meters of office space. Wallbox believes this space is sufficient to meet its needs for its headquarters in the foreseeable future and that any additional space Wallbox may require will be available on commercially reasonable terms. Wallbox also maintains two factories in Sant Andreu de la Barca, Barcelona and Zona Franca, Barcelona that combined have 16,800 square meters of space. In addition, Wallbox has an American headquarters located in Mountain View, California, and a research and development lab in San Jose, California. Wallbox has manages its Asia Pacific operations from an office in Shanghai and through its joint venture with FAWSN, maintains a factory located in Suzhou, China that has a manufacturing capacity of 100,000 units per year.
|
Item 4A.
|
Unresolved Staff Comments
|
None.
|
Item 5.
|
Operating and Financial Review and Prospects
|
You should read the following discussion in conjunction with our consolidated financial statements included elsewhere in this Annual Report. This discussion contains forward-looking statements and involves numerous risks and uncertainties, including, but not limited to, those described in Item 3. “Key Information — D. Risk Factors.” Actual results could differ materially from those contained in any forward-looking statements.
On October 1, 2021, Wallbox became the holding company of Wall Box Chargers, S.L. and its subsidiaries as part of a group reorganization. When we refer to the “Consolidated Group” or “Group” we are referring to Wallbox N.V. and its consolidated subsidiaries.
60
Business Overview
We are a global leader in smart electric vehicle charging and energy management. Founded in 2015, we create smart charging systems that combine innovative technology with outstanding design and that manage the communication between user, vehicle, grid, building and charger.
Our mission is to facilitate the adoption of electric vehicles today to make more sustainable use of energy tomorrow. By designing, manufacturing, and distributing charging solutions for residential, business, and public use, we are laying the infrastructure required to meet the demands of mass electric vehicles ownership everywhere. Our customer-centric approach to its holistic hardware, software, and service offering has allowed us to solve barriers to EV adoption today as well as anticipate opportunities soon to come. We are creating solutions that will not only allow for faster, simpler EV charging but that will also change the way the world uses energy.
Reporting Segments
For management purposes, we are organized into business units based on geographical areas and therefore have three existing reportable business segments and one reportable business segment under development. Our existing business segments are:
| • |
EMEA: Europe-Middle East Asia
|
| • |
NORAM: North America
|
| • |
APAC: Asia-Pacific
|
We expect to add a fourth reportable segment for Latin America during 2022. NORAM and APAC segments had limited revenues during 2020. Refer to Note 7. “
, included within our consolidated financial statements for further details.
Operating
Segments
”
Key Factors Affecting Operating Results
We believe our performance and future success depend on several factors that present significant opportunities for it but also pose risks and challenges, including those discussed below and in the section of this Annual Report titled “
”
Risk Factors.
Growth in EV Adoption
Our revenue growth is directly tied to the continued acceptance of passenger and commercial EVs sold, which it believes drives the demand for charging products and infrastructure. The market for EVs is still rapidly evolving and although demand for EVs has grown in recent years, there is no guarantee such demand will continue into the future. Factors impacting the adoption of EVs include but are not limited to: perceptions about EV features, quality, safety, performance and cost; perceptions about the limited range over which EVs may be driven on a single battery charge; volatility in the cost of oil and gasoline; availability of services for EVs; consumers’ perception about the convenience and cost of charging EVs; government subsidies for EVs and electricity; the development, prevalence and market adoption of EV fleets; and increases in fuel efficiency of
non-EV
transportation. In addition, macroeconomic factors could impact demand for EVs, particularly since EVs can be more expensive than traditional gasoline-powered vehicles and the automotive industry globally has been experiencing a recent decline in sales. If the market for EVs does not develop as expected or if there is any slow-down or delay in overall EV adoption rates, this would impact our ability to increase its revenue or grow its business.
Competition
We are currently one of the market leaders in Europe in residential EV charging solutions based number of charging units sold compared to EVs sold on a country by country basis. We also provide installation services
61
and derive revenue from Electromaps, our online platform that enables users to find and pay for publicly available charging ports and manage their charging fleet. We intend to expand our market share over time in our product categories, including public charging stations, leveraging the network effect of its products, our partnership with Iberdrola and the Electromaps platform. Additionally, we intend to expand and grow our revenues via the rollout of the Supernova public charging station. Nonetheless, existing competitors may expand their product offerings and sales strategies, and new competitors may enter the market. Furthermore, our competition includes competition resulting from acceptance of other types of alternative fuel vehicles,
plug-in
hybrid electric vehicles and high fuel-economy gasoline powered vehicles. If our market share decreases due to increased competition, our revenue and ability to generate profits in the future may be impacted.
Global Expansion
We operate in Europe, North America and APAC and intend to expand into Latin America. Europe and North America are expected to be significant contributors to our revenue in future years with manufacturing capacity expected in North America by the second half 2022. We used a portion of the proceeds from the Business Combination to increase our product development and manufacturing capacity as we expand sales globally.
The European EV charging market can be characterized as fragmented. There are many small and local players, with only a limited number of parties having sufficient scale and funding to be competitive in the long term. Especially due to the strong government incentives currently in place, the EV sales are expected to increase rapidly in Europe. From a competitive perspective, the North American market has high barriers to entry due to strict certification and validation requirements. Therefore, this market differs from Europe as the market is less fragmented with only a few large players.
Similar to the European market, the APAC market can be characterized as a highly fragmented market with less than a handful of players that have gained significant scale in the industry. From a technology and pricing perspective, EV charging solutions in APAC are cost-competitive as they can be manufactured at a lower cost point. Our growth in each of our markets requires differentiating itself as compared to its competition. If we are unable to penetrate, or further penetrate, the market in each of the geographies in which we operate or intend to operate, our future revenue growth and profits may be impacted.
Impact of New Product Releases
As we introduce new products, such as the market introduction of our Supernova and Hypernova public charging stations, our profitability may be temporarily impacted by launch costs until our supply chain achieves targeted cost reductions. In addition, we may accelerate our operating expenditures where we see growth opportunities which may impact profitability until upfront costs and inefficiencies are absorbed and normalized operations are achieved. We also continuously evaluate and may adjust our operating expenditures based on our launch plans for our new products, as well as other factors including the pace and prioritization of current projects under development and the addition of new projects. As we attain higher revenue, we expect operating expenses as a percentage of total revenue to continue to decrease in the future as we focus on increasing operational efficiency and process automation.
Government Mandates, Incentives and Programs
The U.S. federal government, European member states, China, and some U.S. state and local governments provide incentives to end users and purchasers of EVs and EV charging products in the form of rebates, tax credits and other financial incentives. These governmental rebates, tax credits and other financial incentives significantly lower the effective price of EVs and EV charging products or stations to customers. However, these incentives may expire on specified dates, end when the allocated funding is no longer available, or be reduced or terminated as a matter of regulatory or legislative policy. Any reduction in rebates, tax credits or other financial incentives could reduce the demand for EVs and for charging infrastructure, including infrastructure offered by us.
62
Penetration into the Public Market
We commenced commercialization of the Supernova, our first DC fast charger for public use, during the first quarter of 2022. We already signed letter of intents (“LOI”) to collaborate with some of the world’s biggest utility companies for deliveries of the Supernova, and expect in the future to expand beyond utilities into additional distribution channels. In June 2021, Iberdrola announced its intention to acquire the first 1,000 of our Supernova fast chargers as part of its five-year sustainable mobility plan to deploy more than 150,000 chargers in homes, businesses and public road networks and entered into a
non-binding
letter of intent with us in July 2021 expressing its interest in purchasing 6,500 Supernova chargers through 2022. There were no Supernova fast chargers sold to Iberdrola during 2021. Our offering of public charging solutions is complemented through Electromaps, an online platform that enables users to find publicly available charging ports and pay for their use. We have established partnerships in Europe with operators of charging points that allow users to pay for their charging directly via Electromaps. For these charging points, we earn a commission of approximately ~10 % for each of the charging sessions carried out through the app. We intend to extend these relationships with charging operators outside of Europe and enable this payment feature globally.
Seasonality
Our business is seasonal in nature. Typically consumers purchase more EVs in the second half of the year, particularly in the fourth quarter, and the seasonal variation in the timing of sales of our residential products tend to be correlated with sales of EVs. As a result, sales in the second half, and particularly in the fourth quarter, would, after controlling for our growth, be higher than in the first half of the fiscal year and our results of operations may be subject to seasonal fluctuations as a result.
Impact of
COVID-19
On March 11, 2020, the World Health Organization upgraded the emergency public healthcare situation triggered by the outbreak of Coronavirus disease 2019
(COVID-19)
to an international pandemic. The unfolding of events in Spain and worldwide, has led to an unprecedented health crisis, which has had an impact on the macroeconomic climate and on business performance. In order to confront this situation, a series of measures were adopted in 2020 to address the economic and social impacts which, amongst other aspects, have led to mobility restrictions on the population. In particular, amongst other measures, governments worldwide have declared states of emergency or similar measures that have imposed restrictions on the movement of people and on the opening hours of businesses, severely impacting the economies. These kinds of restrictions continue to be applied in the majority of the countries in which we operate; however, they have been gradually lifted along with fewer limitations on operating activity.
However, we have continued to implement our growth plans and, although the pandemic has caused certain delays to these plans, they have not significantly impacted our equity and liquidity position. Furthermore, the pandemic has shown some of the benefits of electric vehicles, with the lowest levels of pollution for the last decade. This industry acceleration has had a significant impact on us, as it has to keep investing in new technologies to be deployed in the following year, as well as investing in the our team to be able to continue our growth with the most talented professionals.
While the ultimate duration and extent of the
COVID-19
pandemic depends on future developments that cannot be accurately predicted, such as the extent and effectiveness of containment actions, it has already had an adverse effect on the global economy and the ultimate societal and economic impact of the
COVID-19
pandemic remains unknown, all of which could adversely affect our business, results of operations and financial condition. For example, the current government-imposed lockdown in Shanghai could result in a delay in our receipt of certain raw materials and components, as well as delays in customer deliveries.
63
Impact of the war between Russia and Ukraine
As a result of the war between Russia and Ukraine as well as escalating tensions along the U.S. and certain allies in Europe imposed sanctions on Russia and could impose further sanctions against it. Russia could respond in kind. Sanctions imposed by any of these countries could disrupt our supply of critical components among our manufacturing facilities in Barcelona as well as our production and the sales of EVs. As a result of the war, we stopped selling our products in Ukraine and Russia, and are not able to pursue new deals with customers in those countries. Although such sales were insignificant to our business (€18 thousand in 2021), if the war were to be extended worldwide, this could cause additional disruptions to our operations. Such disruptions could negatively affect our ability to provide critical components to affiliates or produce finished goods for customers, which could increase our costs, require capital expenditures and harm our results of operations and financial condition. We continue to monitor the situation closely.
The Global Economic Environment
Certain factors in the global economic environment that may impact our global operations include, among other things currency fluctuations, capital and exchange controls, global economic conditions including inflation, restrictive government actions, changes in intellectual property, legal protections and remedies, trade regulations, tax laws and regulations and procedures and actions affecting approval, production, pricing, and marketing of, reimbursement for and access to our products, as well as impacts of political or civil unrest or military action, including the current conflict between Russia and Ukraine, tensions between China and the U.S., the U.K., the EU, India and other countries that were heightened during 2021, terrorist activity, unstable governments and legal systems, inter-governmental disputes, public health outbreaks, epidemics, pandemics, natural disasters or disruptions related to climate change. We continue to monitor the situation closely.
Key Components of Results of Operations
Revenue
Our revenue consists of retail sales of charging solutions for EVs, which includes electronic chargers and other services. We recognize revenue from contracts with customers when control of the goods or services are transferred to the customer at an amount that reflects the consideration to which we expect to be entitled in exchange for those goods or services.
Sale of Chargers
Revenue related to the sale of chargers consists of sales of public and home & business charging devices, as well as accessories. Revenue from the sale of goods is recognized at the point in time when control of the asset is transferred to the customer, generally when the charger leaves our warehouse.
Sales of Public chargers will be fully commercialized in 2022. In 2022 we will continue expanding our sales in Europe, our most mature market, and focus on the expansion in NORAM and APAC.
Sale of Services
Revenue related to the rendering of services consists of installation services and software services, including subscription fees from businesses and fleets through “myWallbox” and commissions obtained from every charging transaction carried out through Electromaps; although, at this time, such revenue consists primarily of installation services.
Revenue from contracts with customers for installation services is recognized when control of the services are transferred to the customer (at a point in time given the short period for being rendered) at an amount that reflects the consideration to which we expect to be entitled in exchange for those services.
64
Changes in Inventories and Raw Materials and Consumables Used
Changes to inventory are recorded in consumption of finished goods, raw materials and other consumables. Inventory is comprised of electric chargers and related parts, which are available for sale or for warranty requirements. Inventories are stated at the lower of cost or market. Cost is determined by the
first-in,
first-out
method. Inventory that is sold to third parties is included within changes in inventories and raw materials and consumables used. We periodically review for slow-moving, excess or obsolete inventories. Products that are determined to be obsolete, if any, are written down to net realizable value.
Employee Benefits
Employee benefits consists primarily of wages and salaries, share-based payment plans expenses and social security. We record share-based payments based on the estimated fair value of the award at the grant date and is recognized as an expense in the consolidated statements of profit or loss over the requisite service period. The estimated fair value of the award granted after the Business Combination is based on the estimated market price of our common stock listed in the New York Stock Exchange on the date of grant.
Other Operating Expenses
Other operating expenses primarily consist of professional services, marketing expenses, external temporary workers expense, delivery expense, insurance premiums and other expenses, including leases of machinery with lease terms of twelve months or less and leases of office equipment with low value, including IT equipment. We expect our operating expenses to increase in absolute euro amounts as we continue to grow our business but to decrease over time as a percentage of revenue. Since the Business Combination, we have incurred and expect to continue incurring additional expenses as a result of operating as a public company, including expenses necessary to comply with the rules and regulations applicable to companies listed on a national securities exchange and related to compliance and reporting obligations pursuant to the rules and regulations of the SEC, as well as higher expenses for general and director and officer insurance, investor relations and other professional services.
Amortization and Depreciation
Depreciation, amortization and accretion relates to our intangible assets,
assets, property and equipment.
right-of-use
Net Other income
Other income consists of all other income and expenses linked to activities that are outside the core of our operating activities and may include income or losses related to gain or loss of assets, liabilities, and grants.
Operating Loss
Operating loss consists of our revenue and net other income less changes in inventories and raw materials and consumables used, employee benefits, other operating expenses and amortization and depreciation.
Finance Income and Finance Expenses
Net Finance income and finance expenses consist of interest income on outstanding cash positions and interest expense on loan and borrowings including fair value adjustments on the convertible bonds and the unwinding effect on the put option liabilities. During 2021 we began implementing the cash pool system within our subsidiaries and plan to finish during 2022, which will reduce our net finance cost.
65
Change in fair value of derivative warrant liabilities
Public and Private Warrants originally issued by Kensington to its public shareholders and its sponsors were converted on the closing date of the Business Combination Agreement, into a right to acquire one Class A ordinary share of Wallbox N.V. (a “Wallbox Warrant”) on substantially the same terms as were in effect immediately prior to the closing date. These warrants were considered part of the net assets of Kensington at the time of the Transaction.
According to management’s assessment, both the Public and Private Warrants fall within the scope of IAS 32 and have been classified as a derivative financial liability. In accordance with IFRS 9 guidance, derivatives that are classified as financial liabilities shall be measured at fair value with subsequent changes in fair value to be recognized in profit and loss.
Share listing expense
The contribution in kind of Kensington shares has been accounted for within the scope of IFRS 2. Therefore, Kensington has been treated as the “acquired” company for financial reporting purposes and its net assets have been recognized at historical cost, with no goodwill or other intangible assets recorded. Based on IFRS 2, and from an analysis of the transaction, it has been considered that the excess of fair value of Wallbox shares issued over the fair value of Kensington’s identifiable net assets acquired represents compensation for the service of stock exchange listing for its shares and has been expensed as incurred.
Foreign Exchange Gains /(Losses)
Foreign exchange gains (losses) consist of realized and unrealized gains (losses) on foreign currency transactions and outstanding balances at
year-end.
Share of Loss of Equity-Accounted Investees
Share of loss of equity-accounted investees consists of recognized losses attributable to our 50% interest in Wallbox-Fawsn New Energy Vehicle Charging Technology (Suzhou) Co., Ltd., a joint venture incorporated on June 15, 2019, and over which we have joint control and a 50% economic interest. The principal activity of the joint venture in China is the manufacture and sale of charging solutions with a clear focus on the automotive sector. The joint venture has orders signed for production volumes. Due to the losses realized by the JV, the investment value has been zero since the year ended December 31, 2020.
Income Tax Credit
Income tax credit relates to a percentage of research and development related expenses that are expected to be eligible for tax deductions. The tax credit is available as a deduction as a result of our tax residency in Spain for certain eligible R&D expenses, including IT and product development. The year ended December 31, 2020 was the first year in which we applied for such tax deductions, but we expect we will continue to apply similar tax deductions in subsequent years.
Loss for the Year
Loss for the year consists of our operating loss, net financial loss, share of loss of equity-accounted investees and income tax credit.
66
A. Operating Results
Comparison of the years ended December 31, 2021 and 2020
The results of operations presented below should be reviewed in conjunction with our consolidated financial statements and the notes thereto included elsewhere in this Annual Report. The following table sets forth our consolidated results of operations data for the years ended December 31, 2021 and 2020:
|
Year Ended December 31,
|
Variance
|
|||||||||||||||
|
2021
|
2020
|
€
|
%
|
|||||||||||||
|
(€ in thousands, except percentages)
|
||||||||||||||||
|
Sales of goods
|
€ | 69,105 | € | 18,516 | € | 50,589 | 273.2 | % | ||||||||
|
Sales of services
|
2,473 | 1,161 | 1,312 | 113.0 | % | |||||||||||
|
|
|
|
|
|
|
|
|
|||||||||
|
Revenue
|
€ | 71,578 | € | 19,677 | € | 51,901 | 263.8 | % | ||||||||
|
|
|
|
|
|
|
|
|
|||||||||
|
Changes in inventories and raw materials and consumables used
|
€ | (44,253 | ) | € | (10,574 | ) | € | (33,679 | ) | 318.5 | % | |||||
|
Employee benefits
|
(29,666 | ) | (9,805 | ) | (19,861 | ) | 202.6 | % | ||||||||
|
Other operating expenses
|
(43,405 | ) | (8,192 | ) | (35,213 | ) | 429.8 | % | ||||||||
|
Amortization and depreciation
|
(8,483 | ) | (2,379 | ) | (6,104 | ) | 256.6 | % | ||||||||
|
Net other income
|
656 | 289 | 367 | 127.0 | % | |||||||||||
|
|
|
|
|
|
|
|
|
|||||||||
|
Operating Loss
|
€ | (53,573 | ) | € | (10,984 | ) | € | (42,589 | ) | 387.7 | % | |||||
|
|
|
|
|
|
|
|
|
|||||||||
|
Financial income
|
€ | 155 | € | 6 | € | 149 | n/m | |||||||||
|
Financial expenses
|
(32,067 | ) | (1,011 | ) | (31,056 | ) | n/m | |||||||||
|
Change in fair value of derivative warrant liabilities
|
(68,953 | ) | — | (68,953 | ) | n/m | ||||||||||
|
Share listing expense
|
(72,172 | ) | — | (72,172 | ) | n/m | ||||||||||
|
Foreign exchange gains/(losses)
|
1,026 | (70 | ) | 1,096 | n/m | |||||||||||
|
|
|
|
|
|
|
|
|
|||||||||
|
Net Financial Loss
|
€ | (172,011 | ) | € | (1,075 | ) | € | (170,936 | ) | n/m | ||||||
|
|
|
|
|
|
|
|
|
|||||||||
|
Share of loss of equity-accounted investees
|
— | (253 | ) | 253 | (100.0 | %) | ||||||||||
|
|
|
|
|
|
|
|
|
|||||||||
|
Loss before Tax
|
€ | (225,584 | ) | € | (12,312 | ) | € | (213,272 | ) | n/m | ||||||
|
|
|
|
|
|
|
|
|
|||||||||
|
Income tax credit
|
1,807 | 910 | 897 | 98.6 | % | |||||||||||
|
|
|
|
|
|
|
|
|
|||||||||
|
Loss for the year
|
€ | (223,777 | ) | € | (11,402 | ) | € | (212,375 | ) | n/m | ||||||
|
|
|
|
|
|
|
|
|
|||||||||
n/m = not meaningful
Revenues
Sales of goods revenue increased by €50,589 thousand, or 273.2%, for the year ended December 31, 2021 as compared to the year ended December 31, 2020, primarily due to increased sales of our residential chargers, primarily our Pulsar Plus, which sales growth is directly correlated to growth in consumer adoption of EVs.
Sales of services revenue increased by €1,312 thousand, or 113.0%, for the year ended December 31, 2021 as compared to the year ended December 31, 2020, primarily due to an increase in fees from installation services offered by us, including in connection of the launch of our installation team in the third quarter of 2020, as well as installation revenues in Norway resulting from the acquisition of our interest in Wallbox AS, or Intelligent Solutions, in February 2020.
Operating Loss
Expenses related to changes in inventories and raw materials and consumables used increased by €33,679 thousand, or 318.5%, for the year ended December 31, 2021 as compared to the year ended
67
December 31, 2020. These expenses increased at a higher rate than our revenues, primarily as a result of expenses associated with the accelerated launch of new products and changes in product mix. We also experienced increased expenses related to costs of outsourcing production to third parties as a result of the growth in sales.
Employee benefits expense increased by €19,861 thousand, or 202.6%, for the year ended December 31, 2021 as compared to the year ended December 31, 2020, primarily due to an increase in personnel expenses stemming from hiring of employees to support the growth of Wallbox.
Other operating expenses increased by €35,213 thousand, or 429.8%, for the year ended December 31, 2021 as compared to the year ended December 31, 2020, primarily due to increases of (i) €15,224 thousand of professional services and fees which includes €8,046 thousands corresponding to the
non-incremental
or directly attributable costs to the issuance of shares per the Transaction , (ii) marketing of €5,977 thousand related to the high investment and publication of the Transaction, and (iii) €2,702 thousand related to increased delivery costs in connection with increases in sales and production.
Amortization and depreciation increased by €6,104 thousand, or 256.6%, for the year ended December 31, 2021 as compared to the year ended December 31, 2020, primarily due to investments in leasehold improvements to the leased headquarters in Barcelona and capitalization of internally developed intangibles with respect to EV chargers.
Net other income increased by €367 thousand, or 127.0%, for the year ended December 31, 2021 as compared to the year ended December 31, 2020, primarily due to government subsidies recognized.
Net Financial Loss
Financial income increased by €149 thousand for the year ended December 31, 2021 as compared to the year ended December 31, 2020, primarily due to additional interest over loans to the Joint Venture (€55 thousand) and €83 thousand of investments fair valuation at year end.
Financial expenses increased by €31,056 thousand for the year ended December 31, 2021 as compared to the year ended December 31, 2020, primarily due to a fair value loss incurred on a newly issued convertible loan during the year and the incurrence of new bank loans and working capital credit lines.
Change in fair value of derivative warrant liabilities increased by €68,953 thousand for the year ended December 31, 2021 as compared to the year ended December 31, 2020, primarily due to the increase in price per warrant from the amounts as of the Transaction date.
A
one-time,
non-cash
listing expense of €72,172 thousand was recognized in accordance with IFRS2 as part of the Transaction for the year ended December 31, 2021.
Foreign exchange gains increased by €1,096 thousand for the year ended December 31, 2021 as compared to the year ended December 31, 2020, primarily due to fluctuations in GBP, USD and the Norwegian Krone against the Euro.
Share of Loss of Equity-Accounted Investees
Share of loss of equity-accounted investees decreased by €253 thousand, or 100%, for the year ended December 31, 2021 as compared to the year ended December 31, 2020, as a result of a net book value of the Joint Venture at zero as of December 31, 2021. For the year ended December 31, 2020, the Joint Venture losses were limited to the amount of the net book value (€253 thousand) of such Joint Venture.
68
Income Tax Credit
Income tax credit increased by €897 thousand, or 98.6%, for the year ended December 31, 2021 as compared to the year ended December 31, 2020, primarily due to the recognition of a tax credit receivable of €1,665 thousand for certain R&D expenses. No deferred tax assets were recorded for losses carried forward and hence that no regular corporate income charge is recorded in both years
Comparison of the years ended December 31, 2020 and 2019
The results of operations presented below should be reviewed in conjunction with our consolidated financial statements and the notes thereto included elsewhere in this Annual Report. The following table sets forth our consolidated results of operations data for the years ended December 31, 2020 and 2019:
|
Year Ended
December 31, |
Variance
|
|||||||||||||||
|
2020
|
2019
|
€
|
%
|
|||||||||||||
|
(€ in thousands, except percentages)
|
||||||||||||||||
|
Sales of goods
|
€ | 18,516 | € | 7,333 | € | 11,183 | 152.5 | % | ||||||||
|
Sales of services
|
1,161 | 687 | 474 | 69.0 | % | |||||||||||
|
|
|
|
|
|
|
|
|
|||||||||
|
Revenue
|
€ | 19,677 | € | 8,020 | € | 11,657 | 145.3 | % | ||||||||
|
|
|
|
|
|
|
|
|
|||||||||
|
Changes in inventories and raw materials and consumables used
|
€ | (10,574 | ) | € | (3,664 | ) | € | (6,910 | ) | 188.6 | % | |||||
|
Employee benefits
|
(9,805 | ) | (3,917 | ) | (5,888 | ) | 150.3 | % | ||||||||
|
Other operating expenses
|
(8,192 | ) | (5,125 | ) | (3,067 | ) | 59.8 | % | ||||||||
|
Amortization and depreciation
|
(2,379 | ) | (762 | ) | (1,617 | ) | 212.2 | % | ||||||||
|
Net other income
|
289 | 80 | 209 | 261.3 | % | |||||||||||
|
|
|
|
|
|
|
|
|
|||||||||
|
Operating loss
|
€ | (10,984 | ) | € | (5,368 | ) | € | (5,616 | ) | 104.6 | % | |||||
|
|
|
|
|
|
|
|
|
|||||||||
|
Financial income
|
€ | 6 | € | 9 | € | (3 | ) | (33.3 | %) | |||||||
|
Financial expenses
|
(1,011 | ) | (266 | ) | (745 | ) | 280.1 | % | ||||||||
|
Foreign exchange gains/(losses)
|
(70 | ) | (103 | ) | 33 | (32.0 | %) | |||||||||
|
|
|
|
|
|
|
|
|
|||||||||
|
Net Financial Loss
|
€ | (1,075 | ) | € | (360 | ) | € | (715 | ) | 198.6 | % | |||||
|
|
|
|
|
|
|
|
|
|||||||||
|
Share of loss of
equity-accounted
investees
|
(253 | ) | (408 | ) | 155 | (38.0 | %) | |||||||||
|
|
|
|
|
|
|
|
|
|||||||||
|
Loss before Tax
|
€ | (12,312 | ) | € | (6,136 | ) | € | (6,176 | ) | 100.7 | % | |||||
|
|
|
|
|
|
|
|
|
|||||||||
|
Income tax credit
|
910 | — | 910 | n/m | ||||||||||||
|
|
|
|
|
|
|
|
|
|||||||||
|
Loss for the year
|
€ | (11,402 | ) | € | (6,136 | ) | € | (5,266 | ) | 85.8 | % | |||||
|
|
|
|
|
|
|
|
|
|||||||||
n/m = not meaningful
Revenues
Sales of goods revenue increased by €11,183 thousand, or 152.5%, for the year ended December 31, 2020 as compared to the year ended December 31, 2019, primarily due to increased sales of our residential chargers, primarily our Pulsar Plus, which sales growth is directly correlated to growth in consumer adoption of EVs.
Sales of services revenue increased by €474 thousand, or 69.0%, for the year ended December 31, 2020 as compared to the year ended December 31, 2019, primarily due to an increase in fees from installation services offered by us, including in connection of the launch of our installation team in the third quarter of 2020, as well as installation revenues in Norway resulting from the acquisition of our interest in Wallbox AS, or Intelligent Solutions, in February 2020.
69
Operating Loss
Expenses related to changes in inventories and raw materials and consumables used increased by €6,910 thousand, or 188.6%, for the year ended December 31, 2020 as compared to the year ended December 31, 2019. These expenses increased at a higher rate than our revenues, primarily as a result of expenses associated with the launch of new products and changes in product mix. We also experienced increased expenses related to costs of outsourcing production to third parties as a result of the growth in sales.
Employee benefits expense increased by €5,888 thousand, or 150.3%, for the year ended December 31, 2020 as compared to the year ended December 31, 2019, primarily due to the growth in the head count of 207 new employees, including senior level employees, and the implementation of the Legacy Stock Option Program for management which resulted in an increase in personnel expenses of €632 thousand and the Legacy Stock Option Program for employees which resulted in an increase in personnel expenses of €1,593 thousand, in each case, for the year ended December 31, 2020 as compared to the year ended December 31, 2019.
Other operating expenses increased by €3,067 thousand, or 59.8%, for the year ended December 31, 2020 as compared to the year ended December 31, 2019, primarily due to an increase of €1,397 thousand related to the cost of temporary workers, €659 thousand related to increased delivery costs in connection with increases in sales and production, an increase in professional services and fees of €474 thousand, which were partially offset by a decrease in travel expenses of €650 thousand as a result of
COVID-19
restrictions.
Amortization and depreciation increased by €1,617 thousand, or 212.2%, for the year ended December 31, 2020 as compared to the year ended December 31, 2019, primarily due to investments in leasehold improvements to the leased headquarters in Barcelona and R&D capitalization of internally developed intangibles with respect to EV chargers.
Net other income increased by €209 thousand, or 261.3%, for the year ended December 31, 2020 as compared to the year ended December 31, 2019, primarily due to recovered trade payables.
Net Finance Loss
Financial income decreased by €3 thousand, or 33.3%, for the year ended December 31, 2020 as compared to the year ended December 31, 2019, primarily due to lower interest rates during the year.
Financial expenses increased by €745 thousand, or 280.1%, for the year ended December 31, 2020 as compared to the year ended December 31, 2019, primarily due to the issuance of our convertible loans and the incurrence of new bank loans and working capital credit lines.
Foreign exchange losses decreased by €33 thousand, or 32.0%, for the year ended December 31, 2020 as compared to the year ended December 31, 2019, primarily due to fluctuations in GBP, USD and the Norwegian Krone against the Euro.
Share of Loss of Equity-Accounted Investees
Share of loss of equity-accounted investees decreased by €155 thousand, or 38.0%, for the year ended December 31, 2020 as compared to the year ended December 31, 2019, primarily due to Joint Venture losses, which losses were limited to the amount of the net book value of such Joint Venture in the year ended December 31, 2020.
Income Tax Credit
We recognized an income tax credit of €910 thousand for the year ended December 31, 2020, primarily in connection with the recognition of a tax credit receivable of €923 thousand for certain R&D expenses, which we had not previously recognized.
70
No deferred tax assets were recorded for losses carried forward and hence that no regular corporate income charge is recorded in both years.
Segment Results
EMEA Segment
Comparison of the years ended December 31, 2021 and 2020
The following table presents our results of operations at a segment level for EMEA for the years ending December 31, 2021 and 2020:
|
Year Ended
December 31, |
Variance
|
|||||||||||||||
|
2021
|
2020
|
€
|
%
|
|||||||||||||
|
(€ in thousands, except percentages)
|
||||||||||||||||
|
Revenue
|
€ | 74,279 | € | 19,673 | € | 54,606 | 277.6 | % | ||||||||
|
|
|
|
|
|
|
|
|
|||||||||
|
Changes in inventories and raw materials and consumables used
|
€ | (47,056 | ) | € | (10,557 | ) | € | (36,499 | ) | 345.7 | % | |||||
|
Employee benefits
|
(27,130 | ) | (9,128 | ) | (18,002 | ) | 197.2 | % | ||||||||
|
Other operating expenses
|
(42,273 | ) | (7,765 | ) | (34,508 | ) | 444.4 | % | ||||||||
|
Amortization and depreciation
|
(8,214 | ) | (2,264 | ) | (5,950 | ) | 262.8 | % | ||||||||
|
Net other income/(expense)
|
961 | 288 | 673 | 233.8 | % | |||||||||||
|
|
|
|
|
|
|
|
|
|||||||||
|
Operating loss
|
€ | (49,432 | ) | € | (9,753 | ) | € | (39,679 | ) | 406.8 | % | |||||
|
|
|
|
|
|
|
|
|
|||||||||
n/m = not meaningful
Revenue increased by €54,606 thousand, or 277.6%, for the year ended December 31, 2021 as compared to the year ended December 31, 2020, primarily due to increased sales of residential chargers and increased revenue from installation services in connection with the acquisition of Wallbox SA in February 2020.
Operating loss increased by €39,679 thousand, or 406.8%, for the year ended December 31, 2021 as compared to the year ended December 31, 2020, primarily due to the accelerated launch of new products and changes in product mix.
Comparison of the years ended December 31, 2020 and 2019
The following table presents our results of operations at a segment level for EMEA for the years ending December 31, 2020 and 2019:
|
Year Ended
December 31, |
Variance
|
|||||||||||||||
|
2020
|
2019
|
€
|
%
|
|||||||||||||
|
(€ in thousands, except percentages)
|
||||||||||||||||
|
Revenue
|
€ | 19,673 | € | 8,334 | € | 11,339 | 136.1 | % | ||||||||
|
|
|
|
|
|
|
|
|
|||||||||
|
Changes in inventories and raw materials and consumables used
|
€ | (10,557 | ) | € | (3,673 | ) | € | (6,884 | ) | 187.4 | % | |||||
|
Employee benefits
|
(9,128 | ) | (3,875 | ) | (5,253 | ) | 135.6 | % | ||||||||
|
Other operating expenses
|
(7,765 | ) | (4,964 | ) | (2,801 | ) | 56.4 | % | ||||||||
|
Amortization and depreciation
|
(2,264 | ) | (695 | ) | (1,569 | ) | 225.8 | % | ||||||||
|
Net other income/(expense)
|
288 | 80 | 208 | 260.0 | % | |||||||||||
|
|
|
|
|
|
|
|
|
|||||||||
|
Operating loss
|
€ | (9,753 | ) | € | (4,793 | ) | € | (4,960 | ) | 103.5 | % | |||||
|
|
|
|
|
|
|
|
|
|||||||||
Revenue increased by €11,339 thousand, or 136.1%, for the year ended December 31, 2020 as compared to the year ended December 31, 2019, primarily due to increased sales of residential chargers and increased revenue from installation services in connection with the acquisition of Wallbox SA in February 2020.
71
Operating loss increased by €4,960 thousand, or 103.5%, for the year ended December 31, 2020 as compared to the year ended December 31, 2019, primarily due to marketing and expansion investment, our acquisition of our interest in Wallbox AS, implementation of the Legacy Stock Option Program for management and expenses associated with increases in sales and production.
NORAM Segment
Comparison of the years ended December 31, 2021 and 2020
The following table presents our results of operations at a segment level for NORAM for the years ending December 31, 2021 and 2020:
|
Year Ended
December 31, |
Variance
|
|||||||||||||||
|
2021
|
2020
|
€
|
%
|
|||||||||||||
|
(€ in thousands, except percentages)
|
||||||||||||||||
|
Revenue
|
€ | 4,687 | € | 1 | € | 4,686 | n/m | |||||||||
|
|
|
|
|
|
|
|
|
|||||||||
|
Changes in inventories and raw materials and consumables used
|
€ | (3,345 | ) | € | (13 | ) | € | (3,332 | ) | n/m | ||||||
|
Employee benefits
|
(2,309 | ) | (617 | ) | (1,692 | ) | 274.2 | % | ||||||||
|
Other operating expenses
|
(1,778 | ) | (427 | ) | (1,351 | ) | 316.4 | % | ||||||||
|
Amortization and depreciation
|
(268 | ) | (114 | ) | (154 | ) | 135.1 | % | ||||||||
|
Net other income/(expense)
|
(306 | ) | — | (306 | ) | n/m | ||||||||||
|
|
|
|
|
|
|
|
|
|||||||||
|
Operating loss
|
€ | (3,319 | ) | € | (1,170 | ) | € | (2,149 | ) | 183.7 | % | |||||
|
|
|
|
|
|
|
|
|
|||||||||
n/m = not meaningful
The increase in revenues of €4,686 thousand for the year ended December 31, 2021 as compared to the year ended December 31, 2020 is driven by the expansion of our sales presence across the region.
Operating loss increased by €2,149 thousand, or 183.7%, for the year ended December 31, 2021 as compared to the year ended December 31, 2020, primarily due to headcount for regional expansion efforts and market penetration.
Comparison of the years ended December 31, 2020 and 2019
The following table presents our results of operations at a segment level for NORAM for the years ending December 31, 2020 and 2019:
|
Year Ended
December 31, |
Variance
|
|||||||||||||||
|
2020
|
2019
|
€
|
%
|
|||||||||||||
|
(€ in thousands, except percentages)
|
||||||||||||||||
|
Revenue
|
€ | 1 | € | — | € | 1 | n/m | |||||||||
|
|
|
|
|
|
|
|
|
|||||||||
|
Changes in inventories and raw materials and consumables used
|
€ | (13 | ) | € | — | € | (13 | ) | n/m | |||||||
|
Employee benefits
|
(617 | ) | (41 | ) | (576 | ) | n/m | |||||||||
|
Other operating expenses
|
(427 | ) | (461 | ) | 34 | (7.4 | %) | |||||||||
|
Amortization and depreciation
|
(114 | ) | (68 | ) | (46 | ) | 67.6 | % | ||||||||
|
Net other income/(expense)
|
— | — | — | n/m | ||||||||||||
|
|
|
|
|
|
|
|
|
|||||||||
|
Operating loss
|
€ | (1,170 | ) | € | (570 | ) | € | (600 | ) | 105.3 | % | |||||
|
|
|
|
|
|
|
|
|
|||||||||
n/m = not meaningful
We had revenue of €1 thousand for the year ended December 31, 2020 and did not have revenue in the year ended December 31, 2019.
72
Operating loss increased by €600 thousand, or 105.3%, for the year ended December 31, 2020 as compared to the year ended December 31, 2019, primarily due to the opening of new locations and headcount for regional expansion efforts and market penetration.
APAC Segment
Comparison of the years ended December 31, 2021 and 2020
The following table presents our results of operations at a segment level for APAC for the years ended December 31, 2021 and 2020:
|
Year Ended
December 31, |
Variance
|
|||||||||||||||
|
2021
|
2020
|
€
|
%
|
|||||||||||||
|
(€ in thousands, except percentages)
|
||||||||||||||||
|
Revenue
|
€ | 298 | € | 57 | € | 241 | 422.8 | % | ||||||||
|
|
|
|
|
|
|
|
|
|||||||||
|
Changes in inventories and raw materials and consumables used
|
€ | (19 | ) | € | (20 | ) | € | 1 | (5.0 | %) | ||||||
|
Employee benefits
|
(227 | ) | (61 | ) | (166 | ) | 272.1 | % | ||||||||
|
Other operating expenses
|
(63 | ) | (37 | ) | (26 | ) | 70.3 | % | ||||||||
|
Amortization and depreciation
|
(1 | ) | — | (1 | ) | n/m | ||||||||||
|
Net other income/(expense)
|
1 | 1 | — | 0.0 | % | |||||||||||
|
|
|
|
|
|
|
|
|
|||||||||
|
Operating loss
|
€ | (11 | ) | € | (60 | ) | € | 49 | (81.7 | %) | ||||||
|
|
|
|
|
|
|
|
|
|||||||||
n/m = not meaningful
We had revenue of €298 thousand for the year ended December 31, 2021 and €57 thousand the year ended December 31, 2020, as a result of the recent incorporation of its Shanghai entity in June 2019.
Operating loss decreased by €49 thousand, or 81.7%, for the year ended December 31, 2021 as compared to the year ended December 31, 2020, primarily due to increase in revenues, partially offset by the increase in operating expenses.
Comparison of the years ended December 31, 2020 and 2019
The following table presents our results of operations at a segment level for APAC for the years ending December 31, 2020 and 2019:
|
Year Ended
December 31, |
Variance
|
|||||||||||||||
|
2020
|
2019
|
€
|
%
|
|||||||||||||
|
(€ in thousands, except percentages)
|
||||||||||||||||
|
Revenue
|
€ | 57 | € | — | € | 57 | n/m | |||||||||
|
|
|
|
|
|
|
|
|
|||||||||
|
Changes in inventories and raw materials and consumables used
|
€ | (20 | ) | € | 9 | € | (29 | ) | (322.2 | %) | ||||||
|
Employee benefits
|
(61 | ) | — | (61 | ) | n/m | ||||||||||
|
Other operating expenses
|
(37 | ) | (14 | ) | (23 | ) | 164.3 | % | ||||||||
|
Amortization and depreciation
|
— | — | — | n/m | ||||||||||||
|
Net other income/(expense)
|
1 | — | 1 | n/m | ||||||||||||
|
|
|
|
|
|
|
|
|
|||||||||
|
Operating loss
|
€ | (60 | ) | € | (5 | ) | € | (55 | ) | n/m | ||||||
|
|
|
|
|
|
|
|
|
|||||||||
n/m = not meaningful
We had revenue of €57 thousand for the year ended December 31, 2020 and did not have revenue in the year ended December 31, 2019, as a result of the recent incorporation of its Shanghai entity in June 2019.
73
Operating loss increased by €55 thousand for the year ended December 31, 2020 as compared to the year ended December 31, 2019, primarily due to increased employee benefit expenses and office expenses.
Reconciliations of
Non-IFRS
and Other Financial and Operating Metrics
The following table reconciles Adjusted EBITDA to the most directly comparable IFRS financial measures, which is loss for the year:
For additional information about our use of Adjusted EBITDA, see “
.”
Presentation of Financial and Other Information
|
€ in thousands
|
2021
|
2020
|
2019
|
|||||||||
|
Loss for the year
|
€ | (223,777 | ) | € | (11,402 | ) | € | (6,136 | ) | |||
|
Income tax credit
|
€ | (1,807 | ) | € | (910 | ) | € | — | ||||
|
Amortization and depreciation
|
€ | 8,483 | € | 2,379 | € | 762 | ||||||
|
Financial income
|
€ | (155 | ) | € | (6 | ) | € | (9 | ) | |||
|
Interest expenses*
|
€ | 6,576 | € | 1,011 | € | 266 | ||||||
|
EBITDA
|
€
|
(210,680
|
)
|
€
|
(8,928
|
)
|
€
|
(5,117
|
)
|
|||
|
Fair value adjustment of convertible bonds-(1)
|
€ | 25,491 | € | — | € | — | ||||||
|
Change in fair value of derivative warrant liabilities-(2)
|
€ | 68,953 | € | — | € | — | ||||||
|
Share listing expense-(3)
|
€ | 72,172 | € | — | € | — | ||||||
|
Foreign exchange gains/(losses)
|
€ | (1,026 | ) | € | 70 | € | 103 | |||||
|
Share based payment plan expenses-(4)
|
€ | 2,455 | € | 2,785 | € | 560 | ||||||
|
Transaction costs relating to the Business Combination-(5)
|
€ | 8,046 | € | — | € | — | ||||||
|
Net other income-(6)
|
€ | (656 | ) | € | (289 | ) | € | (80 | ) | |||
|
|
|
|
|
|
|
|||||||
|
Adjusted EBITDA
|
€
|
(35,245
|
)
|
€
|
(6,362
|
)
|
€
|
(4,534
|
)
|
|||
|
|
|
|
|
|
|
|||||||
| (1) |
See Note 13 to our consolidated financial statements include elsewhere in this Annual Report
|
| (2) |
See Note 14 to our consolidated financial statements include elsewhere in this Annual Report
|
| (3) |
See Note 6 to our consolidated financial statements include elsewhere in this Annual Report
|
| (4) |
See Note 21 to our consolidated financial statements include elsewhere in this Annual Report
|
| (5) |
Expenses related to the SPAC transaction
|
| (6) |
Net other income consists of all other income and expenses linked to activities that are outside the core of our operating activities and may include income or losses related to gain or loss of assets, liabilities, and grants
|
* Interest expenses is comprised of interest and fees on bank loans, interest on lease liabilities, interest on shareholder and other borrowings, interest on convertible bonds, accretion of discount on put option liabilities and other finance costs.
B. Liquidity and Capital Resources
Sources of Liquidity
We have a history of operating losses and negative operating cash flows. We have experienced net losses and significant cash outflows from cash used in operating activities over the past years as it has been investing significantly in the development of its EV charging products. During the year ended December 31, 2021, we incurred a loss for the year of €223.8 million and net cash used in operating activities of €69.6 million, and for the fiscal year ended December 31, 2020, we incurred a loss for the year of €11.4 million and net cash used in
operating activities of €11.6 million. Additionally, for the fiscal year ended December 31, 2019, we incurred a loss for the year of €6.1 million and net cash used in operating activities of €5.4 million.
74
As of December 31, 2021 and 2020, we had cash and cash equivalents of €113.9 million and €22.3 million, respectively, and an accumulated deficit of €243.9 million and €20.1 million, respectively. Our current working capital needs relate mainly to the growth of the current business and continuing operations. Our ability to expand and grow our business will depend on many factors, including our working capital needs and the evolution of our operating cash flows. From inception to the date of this Annual Report, we have raised aggregate net cash proceeds of over €60.4 million from convertible loans and €95.9 million from the PIPE. Our management believes that cash on hand, together with cash generated from sales to customers, as well as financing as a result of the Business Combination, will satisfy our working capital and capital requirements for at least the next two years from December 31, 2021.
To date, our primary sources of liquidity have been in the form of issuance of equity instruments, convertible loans and other bank loans and PIPE. In particular, in April 2021, we entered into a loan agreement with Banco Santander, S.A. for a loan in the amount of €12.6 million with a maturity of 2027 to finance the investments for a new factory in Zona Franca, Barcelona. Among other things, this loan originally prohibited the payment of dividends and the incurrence of liens without equally and ratably securing such loan, although in September 2021 we obtained a waiver of the loan’s prohibition of the payment of dividends. During 2020, convertible bonds were issued for an amount of €25.8 million, and in 2021 issued convertible bonds in an amount of €34.5 million. Refer to the Measurement of the Convertible Bonds section below for further detail. Our primary cash requirements include operating expenses, satisfaction of commitments to various counterparties and suppliers, and capital expenditures (including property and equipment). Our principal uses of cash in recent periods have been funding of its operations and development of intangibles with respect to EV chargers and energy management software.
Liquidity Policy
As an early-stage company, we maintain a strong focus on liquidity and define our liquidity risk tolerance based on sources and use to maintain a sufficient liquidity position to meet our obligations under both normal and stressed conditions. We manage our liquidity to provide access to sufficient funding to meet our business needs and financial obligations, as well as capital allocation and growth objectives.
Cash Flow Summary
The following table summarizes our cash flows for the years ended December 31, 2021 and 2020:
|
Year Ended
December 31, |
Variance
|
|||||||||||||||
|
2021
|
2020
|
€
|
%
|
|||||||||||||
|
(€ in thousands, except percentages)
|
||||||||||||||||
|
Net cash used in operating activities
|
€ | (69,631 | ) | € | (11,628 | ) | € | (58,003 | ) | 498.8 | % | |||||
|
Net cash used in investing activities
|
€ | (88,297 | ) | € | (19,318 | ) | € | (68,979 | ) | 357.1 | % | |||||
|
Net cash from financing activities
|
€ | 246,925 | € | 46,745 | € | 200,180 | 428.2 | % | ||||||||
Operating Activities
Net cash used in operating activities increased by €58,003 thousand, or 498.8%, for the year ended December 31, 2021 as compared to year ended December 31, 2020, primarily due to the increase in loss of €212,375 thousand which is partially offset by the following
non-cash
expenses, which were not incurred during the prior year, of €72,172 thousand in listing expense, €68,953 thousand change in fair value of warrants and €25,491 thousand change in fair value of bonds. Main drivers of the working capital related to the cash outflows were an increase in inventories, receivables, and other assets and partially offset by an increase in trade and other financial payables.
75
Investing Activities
Net cash used in investing activities increased by €68,979 thousand, or 357.1%, for year ended December 31, 2021 as compared to the year ended December 31, 2020, primarily due to increases in the acquisition of financial assets at fair value through profit or loss of €57,344 thousand, property, plant and equipment of €6,563 thousand, intangible assets of €4,990 thousand, loans granted to joint venture of €302 thousand, partially offset by proceeds from sale of assets of €1,098 thousand.
Financing Activities
Net cash from financing activities increased by €200,180 thousand, or 428.2%, for the year ended December 31, 2021 as compared to the year ended December 31, 2020, primarily due to the increase of proceeds from issuing equity instruments of €181,958 thousand, proceeds from loans net of repayments of €17,459 thousand, and proceeds from convertible bonds of €8,670 thousand and partially offset by payments of interest, principal balances, put option liabilities, and other payments for €6,637 thousand.
The following table summarizes our cash flows for the years ended December 31, 2020 and 2019:
|
Year Ended
December 31, |
Variance
|
|||||||||||||||
|
2020
|
2019
|
€
|
%
|
|||||||||||||
|
(€ in thousands, except percentages)
|
||||||||||||||||
|
Net cash used in operating activities
|
€ | (11,628 | ) | € | (5,421 | ) | € | (6,207 | ) | 114.5 | % | |||||
|
Net cash used in investing activities
|
€ | (19,318 | ) | € | (7,904 | ) | € | (11,414 | ) | 144.4 | % | |||||
|
Net cash from financing activities
|
€ | 46,745 | € | 17,505 | € | 29,240 | 167.0 | % | ||||||||
Operating Activities
Net cash used in operating activities increased by €6,207 thousand, or 114.5%, for the year ended December 31, 2020 as compared to the year ended December 31, 2019, primarily due to an increase in working capital requirements to meet our growth. Main drivers of the working capital related to the cash outflows were an increase in trade and other financial receivables and inventories, partially offset by an increase in trade and other financial payables.
Investing Activities
Net cash used in investing activities increased by €11,414 thousand, or 144.4%, for the year ended December 31, 2020 as compared to the year ended December 31, 2019, primarily due to product development and investments in leasehold improvements in the leased headquarters in Barcelona.
Financing Activities
Net cash from financing activities increased by €29,240 thousand, or 167.0%, for the year ended December 31, 2020 as compared to the year ended December 31, 2019, primarily due to convertible note and new bank financing.
C. Research and Development, Patents and Licenses, etc.
For information regarding research and development policies, see Item 4. “
.” and Item 5. “
.”
Information on the Company
— Business Overview
Operating and Financial Review and Prospects
76
D. Trend Information
Other than as disclosed elsewhere in this Annual Report, we are not aware of any trends, uncertainties, demands, commitments or events since December 31, 2020 that are reasonably likely to have a material adverse effect on our revenues, income, profitability, liquidity or capital resources, or that would cause the disclosed financial information to be not necessarily indicative of future operating results or financial conditions.
E. Critical Accounting Estimates
Our discussion and analysis of our financial condition and results of operations is based on our consolidated financial statements, which have been prepared in accordance with IFRS. The preparation of these financial statements requires us to make estimates, assumptions and judgements that affect the reported amounts of assets, liabilities, revenues, costs and expenses. We evaluate our estimates and judgements on an ongoing basis, and our actual results may differ from these estimates. We base our estimates on historical experience, known trends and events, contractual milestones and other various factors that are believed to be reasonable under the circumstances, the results of which form the basis for making judgments about the carrying value of assets and liabilities that are not readily apparent from other sources.
Our critical accounting estimates and judgments are described in Note 3, “Use of Judgements and Estimates”, within our consolidated financial statements included elsewhere in this Annual Report. Actual results may differ from these estimates.
Going concern
Our consolidated financial statements included elsewhere in this Annual Report have been prepared assuming we will continue as a going concern. The going concern basis of presentation assumes that we. will continue in operation for at least a period of one year after the date such financial statements are issued and contemplates the realization of assets and the satisfaction of liabilities in the normal course of business.
We experienced net losses and significant cash outflows from cash used in operating activities over the past years as it has been investing significantly in the development of EV charging products. During the year ended December 31, 2021, we incurred a consolidated net loss of €223.8 million (€72.2 million of this amount resulted from share listing expenses (See Note 6, included within our consolidated financial statements), €69.0 million to change in fair value of derivative warrant liabilities (See note 22), €25.5 million to fair value adjustments of convertible bonds (see note 22) and €8.0 million corresponded to the
non-incremental
or directly attributable costs for the issuance of new shares (See Note 20), and cash used in operations of €69.6 million, and during the year ended December 31, 2020, we incurred a loss for the year of €11.4 million and net cash used in operating activities of €11.6 million. As of December 31, 2021, we had an accumulated deficit of €243.9 million and cash and cash equivalents of €113.9 million.
In assessing the going concern basis of preparation of the consolidated financial statements, we had to estimate the expected cash flows for the next twelve months, including the compliance with covenants, exercise of warrants and availability of other financial funding from banks .
Based on the above, our management believes that we are able to continue in operational existence, meet our liabilities as they fall due, operate within its existing facilities, and meet the business plan for a period of at least twelve months from the date of issuance of our consolidated financial statements.
As a result, the financial statements included elsewhere in this Annual Report have been presented on a going concern basis, which contemplates the realization of assets and the satisfaction of liabilities in the normal course of business. Accordingly, we continue to adopt the going concern basis in preparing its consolidated financial statements for the year ended December 31, 2021.
77
Impairment of
non-current
assets (including Goodwill)
Goodwill is tested for impairment at cash-generating-unit level (“CGU”) on an annual basis or if an event occurs or circumstances change that could reduce the recoverable amount of a CGU below its carrying value. These events or circumstances could include a significant change in the business climate, legal factors, operating performance indicators, competition, or sale or disposition of a significant portion of a reporting unit.
We make judgments about the recoverability of
non-current
assets with finite lives whenever events or changes in circumstances indicate that an impairment may exist. Recoverability of these assets with finite lives is measured by comparing the carrying amount of the asset to the future undiscounted cash flows the asset is expected to generate. If the asset is considered to be impaired, the amount of any impairment is measured as the difference between the carrying value and the recoverable amount of the impaired asset. Assumptions and estimates about future values and remaining useful lives of our
non-current
assets are complex and subjective. They can be affected by a variety of factors, including external factors such as industry and economic trends, and internal factors such as changes in our business strategy and our internal forecasts.
In order to determine the recoverable amount, we estimate expected future cash flows from the assets and apply an appropriate discount rate to calculate the present value of these cash flows. Future cash flows are dependent on whether the budgets and forecasts for the next five years are achieved, whereas the discount rates depend on the interest rate and risk premium associated with each of the companies.
As described in Note 11 to the consolidated financial statements included elsewhere in this Annual Report the recoverable amount of the Nordics CGU has been determined based on a value in use calculation using cash flow projections from financial budgets approved by senior management covering a five-year period. The projected cash flows have been built to reflect the increasing demand for EV chargers and associated services in this region. The
pre-tax
discount rate applied to cash flow projections is 10% and 11.4% for the years ended December 31, 2021 and 2020, and cash flows beyond the five-year period are extrapolated using a 1.5% growth rate for the years ended December 31, 2021 and 2020, that is slightly below the long-term average growth rate for consolidated European economies, which is 2% for the years ended December 31, 2021 and 2020. Key assumptions used in value in use calculations and sensitivity to changes in assumptions for this unit are the discount rate and growth rates.
The recoverable amount of the Electromaps/Software CGU has been determined based on a value in use calculation using cash flow projections from financial budgets approved by senior management covering a five-year period. The projected cash flows have been built to reflect increased demand for the software and services associated with EV sales. The
pre-tax
discount rate applied to the cash flow projections are 9.04% and 11.9% for the years ended December 31, 2021 and 2020, respectively, and cash flows beyond the five-year period are extrapolated using a 1.5% growth rate for the years ended December 31, 2021 and 2020, that is slightly below the long-term average growth rate for consolidated European economies, which is 2% for the years ended December 31, 2021 and 2020. Key assumptions used in value in use calculations and sensitivity to changes in assumptions for this unit are the number of future users and market share during the forecast period, gross margins, discount rates and growth rates used to extrapolate cash flows beyond the forecast period.
There was no impairment of goodwill or
non-current
assets for the years ended December 31, 2021 and 2020.
Capitalization of development costs and determination of the useful life of intangible assets
We review expenditures, including wages and benefits for employees, incurred on development activities and based on their judgment of the costs incurred assesses whether the expenditure meets the capitalization criteria set out in IAS 38 and the intangible assets accounting policy within Note 5. We specifically consider if additional expenditure on projects relates to maintenance or new development projects with only the new developments qualifying to be capitalized.
78
The useful life of capitalized development costs is determined by management at the time the newly developed charger is brought into use and is regularly reviewed for appropriateness. For unique charger products controlled and developed by us, the life is based on historical experience with similar products as well as anticipation of future events, which may impact their useful economic life, such as changes in technology.
Measurement of the convertible bonds
At December 31, 2021, compound financial instruments issued by us comprise the convertible bonds issued during 2020 for an amount of €25,880,000 with a nominal interest rate of 8%. In addition, in the first half of 2021, convertible bonds were issued for an amount of Euros 7,000,000 with the same conditions as the loan issued in 2020. Also during the first six months of 2021 Wall Box Chargers, S.L. issued a new convertible financial instrument for an amount of €27,550,000 with a nominal interest rate of 5%.
The first two convertible bonds (€25,880,000 and €7,000,000) were recognized against amortized cost after the initial recognition, and only the third convertible financial instrument (Euros 27,550,000) were recognized at fair value All these financial instruments were recognized at fair value until 16 September 2021, the date of conversion which lead to the issue of 147,443 Class A ordinary shares by Wallbox Chargers, S.L. with a par value of €0.50 each and share premium (see Note 13).
The liability component of the first two convertible bonds was initially recognized at the fair value of a similar liability that did not have an equity conversion option. The determination of this fair value was based on an estimated incremental rate which reflected the risk of the country where the company was located, the currency of payments, the specific risk of the sector and the Company’s particular situation, in order to determine the discount factor estimates needed to be made in respect of the risk-free rate, the country risk premium and the credit spread are considered.
The equity component was initially recognized as the difference between the fair value of the compound financial instrument as a whole and the fair value of the liability component. The equity component at issue date was estimated to be nil as the fair value of the liability component was calculated to be close to the fair value of the compound financial instrument as a whole.
Based on the analysis performed, we concluded that the third convertible bond was a hybrid instrument that contained a
non-derivative
financial instrument which comprised an obligation for the issuer to settle in cash or by a way of delivering a variable amount of its own equity instruments and embedded derivatives with different probabilities of contingent events occurring. So, we elected to measure the hybrid contract at fair value through profit or loss since its inception. The fair value at issue date equaled the nominal value. Afterwards the convertible bond was valued at fair value through profit or loss. The fair value implied judgement in relation to the whether the bond will convert or be paid in cash, the conversion price and the number of shares to be issued in exchange for the bonds.
The convertible bonds were converted prior to the closing of the Business Combination on October 1, 2021.
Business Combinations (including put option liabilities)
We account for Business Combinations using the acquisition method when the acquired set of activities and assets meets the definition of a business and control is transferred to us. In determining whether a particular set of activities and assets is a business, we assess whether the set of assets and activities acquired includes, at a minimum, an input and substantive process and whether the acquired set has the ability to produce outputs.
We determine and allocate the purchase price of an acquired business to the assets acquired and liabilities assumed as of the business combination date. The purchase price allocation process requires us to use significant estimates and assumptions with respect to the identification of assets previously not recognized such as customer relations, brand name and intangible assets and the determination of the fair value of assets and liabilities acquired.
79
As part of the business combinations of Intelligent Solutions and Electromaps put options to
non-controlling
entities to be settled in cash have been granted. At acquisition date a financial liability for the present value of the expected exercise price of the option has been recognized. Significant estimates are made in order to determine the expected exercise price of the option, which are based on a predefined contractual formula calculated on the future sales of the acquired companies.
The liability for the redemption amount of Electromaps has been estimated discounting the contractual strike price of €4 million as of three months after the approval of the 2023 statutory accounts of Electromaps at an annual rate of 2.69%. The value of the put option liability at December 31, 2021 and 2020 is €3,776,438 and €3,677,513, respectively. The estimated payment date is March 31, 2024.
We have elected to apply a policy choice that allows it to recognize the acquisition of 100% of the interests in the subsidiary (therefore, it does not recognize
non-controlling
interests) against the consideration paid, reflected by the financial liability derived from the put option.
Share-Based Payment
We measure equity settled share-based payments at fair value at the date of grant and expenses the cost over the vesting period, based upon management’s estimate of equity instruments that will eventually vest, along with a corresponding increase in equity and record solely within general and administrative expenses. At each statement of financial position date, management revises its estimate of the number of equity instruments expected to vest as a result of the effect of
non-market-based
vesting conditions. The impact of the revision of the original estimates, if any, is recognized in profit or loss such that the cumulative expense reflects the revised estimate, with a corresponding adjustment to equity reserves.
Prior to completion of the Business Combination, as our ordinary shares were not listed on a public marketplace, the calculation of the fair value of its ordinary shares was subject to a greater degree of estimation in determining the basis for share-based options that it issued. Given the absence of a public market, we were required to estimate the fair value of the ordinary shares at the time of each grant.
We determined the value of our ordinary shares based on interpolating from the valuations in our most recent external equity financing rounds and, subject to discounts for the probability and timing of an exit event and lack of marketability, among other factors.
The assumptions underlying the valuations represent our best estimates, which involve inherent uncertainties and the application of management judgment. After the closing of the Business Combination, our board of directors determined the fair value of each ordinary share underlying stock-based awards based on the closing price of our ordinary shares as reported by NYSE as the basis for the valuation of future grants.
Refer to Note 21, “
”, included within our consolidated financial statements included elsewhere in this Annual Report for the outstanding common stock options and related activity from December 31, 2019 to December 31, 2021 and assumptions used in calculating the stock option awards granted during this period.
Employee Benefits
Income Taxes
Deferred tax assets are recognized to the extent that it is probable future taxable profits will be available against which the temporary differences can be utilized. In order to determine the amount of the deferred tax assets to be recognized, we consider the amounts and dates on which future taxable profits will be obtained and the reversal period for taxable temporary differences. We have not recognized deferred tax assets as of December 31, 2021, 2020, and 2019. The key area of judgement is therefore an assessment of whether it is probable that there will be suitable taxable profits against which any deferred tax assets can be utilized. We
80
operate in a number of international tax jurisdictions. Further details of our accounting policy in relation to deferred tax assets are discussed in Note 5.
Research and development tax credit is recognized as an asset once it is considered that there is sufficient assurance that any amount claimable will be received. The key judgement therefore arises in respect of the likelihood of a claim being successful when a claim has been quantified but has not been received. In making this judgement we consider the nature of the claim and in particular the track record of success of previous claims.
We are subject to income taxes in numerous jurisdictions and there are transactions for which the ultimate tax determination cannot be assessed with certainty in the ordinary course of business. We recognize a provision for situations that might arise in the foreseeable future based on an assessment of the probabilities as to whether additional taxes will be due. An uncertain tax position is recognized as a benefit only if it is “more likely than not” that the tax position would be sustained in a tax examination, with a tax examination being presumed to occur. The amount recognized is the largest amount of tax benefit that is greater than 50% likely of being realized on examination. For tax positions not meeting the “more likely than not” test, no tax benefit is recorded. Penalties and interest incurred related to underpayment of income tax are classified as income tax expense in the period incurred. See Note 24 “Tax credit and other receivables/Other payables” included within our consolidated financial statements included elsewhere in this Annual Report.
Critical judgements derived from the Business Combination Agreement and the Transaction
On 1 October 2021 (the “Closing Date”), Wallbox closed a denominated business combination (the “Business Combination”) pursuant to the Business Combination Agreement, dated 9 June 2021, (the “Business Combination Agreement”), entered into by and between Wallbox, Orion Merger Sub Corp., Kensington Capital Acquisition Corp. II, (hereinafter Kensington), and Wallbox Chargers.
Regarding this transaction the Group has considered the following main estimations and judgements:
Wallbox Chargers acquisition
From an accounting perspective, the contribution in kind of Wallbox Chargers and subsidiaries qualifies as a ‘business combination involving entities or businesses under common control’ which is not in the scope of IFRS 3. IFRS has currently no guidance yet on how to account for these kind of transactions.
After analyzing all the factors involving the Transaction, and based on main interpretations used by other issuers, management has concluded that Wallbox N.V. cannot be considered as a separate entity acting in its own right as an acquirer in a business combination (it acts on behalf of the same shareholders of Wallbox Chargers) and the economic substance of its incorporation and the holding of the shares of Wallbox Chargers is intended only for a reorganization of the group with the sole purpose to realize an IPO and attract new investors.
Consequently, management has decided that Wallbox N.V. recognizes in its consolidated financial statements the net assets of Wallbox Chargers and its subsidiaries as per their previous carrying amounts (book value/pooling of interests (carry-over basis) accounting) and will apply this accounting treatment to similar transactions in the future.
Acquisition of Kensington Acquisition Corp. II
The contribution in kind of Kensington is not within the scope of IFRS 3 as Kensington does not meet the definition of a business in accordance with IFRS 3.
Therefore, Wallbox has not acquired a business through the contribution in kind but accounted for the Kensington shares in accordance with IFRS Share-based payments. Kensington has been treated as the
81
“acquired” company for financial reporting purposes and its net assets have been recognized at historical cost, with no goodwill or other intangible assets recorded.
As a result of this Transaction Kensington shareholders became shareholders of Wallbox,
Based on IFRS 2, and from an analysis of the transaction, it has been considered that the excess of fair value of Wallbox shares issued over the fair value of Kensington’s identifiable net assets acquired represents compensation for the service of stock exchange listing for its shares and has been expensed as incurred.
In this regard, the fair value of Kensington’s net assets at the closing date amounts to USD 115,243,682 or Euros 99,524,444 (comprised of cash and cash equivalents of Euros 114,015,290 and derivative warrant liabilities of Euros 14,490,846) plus the cash proceeds to be received from PIPE Investors amounting USD 111,000,000 or Euros 95,859,600, totaling Euros 195,384,044.
The fair value of the Wallbox Chargers business agreed between the independent parties involved in the Transaction amounted to $1,400,000,000 (Euros 1,209,040,000) in accordance with the Business Combination Agreement. Therefore, based on an 18.1% equity interest in Wallbox issued to Kensington shareholders, the fair value of the Wallbox shares provided to the Kensington shareholders has been estimated at €267,555,606.
Consequently, the difference between the fair value of the Wallbox shares provided (€267,555,606) and Kensington’s net assets (€195,384,044), amounted to €72,171,562, and has been considered as a finance expense in the statement of profit or loss of Wallbox at closing date, representing the value of the stock exchange listing services rendered by Kensington and its shareholders.
Comparative information
There is no approved guidance in IFRS regarding the presentation of comparatives when applying the pooling of interests method for business combinations between entities under common control.
Considering this lack of guidance and IAS 8, Management has determined that Wallbox restates its comparatives and adjust its current reporting period before the date of the transaction as if the combination has occurred at the start of the earliest period presented.
Wallbox has decided to
re-present
comparatives as the consolidated financial statements of Wallbox are considered to be a continuation of those of Wallbox Chargers, S.L.
Consequently, Wallbox N.V. is considered the parent of the Wallbox Group at January 1, 2019, and has included comparatives for a period of two years in the consolidated financial statements for the year ended December 31, 2021. From this date, Wallbox’s consolidated financial statements will be the continuation of those issued by Wallbox Chargers, recognizing the incorporation of Kensington as of October 1, 2021. See more detail about the values considered in Note 6.
Treatment of transaction costs
In accordance with IAS 32, Wallbox has analyzed the total costs incurred in the Transaction to determine which were incremental and directly attributable to the issue of new shares, and hence are to be deducted from equity directly rather than being expenses through profit or loss.
Some costs have been considered 100% attributable to the issuance of the new shares in exchange for cash, while other costs incurred related to a combination of the issuance of new shares and obtaining the listing. For this latter group of costs, only the part that could be attributed to the issuance of new shares in exchange for cash are deducted from equity, which percentage was determined as the ratio of the number of new shares issued in exchange for cash compared to the total number of outstanding shares after the Transaction.
82
A total amount of €17,397,322 (Note 16) of incremental and directly attributable costs for the issuance of new shares has been deducted from share premium directly.
Non-incremental
and not directly attributable costs for the issuance of shares in the amount of €8,046,158 (Note 20) are expensed in profit or loss.
Warrants
Public and Private Warrants originally issued by Kensington to its public shareholders and its sponsors were converted on the closing date of the Business Combination Agreement, into a right to acquire one Class A ordinary share of Wallbox N.V. (a “Wallbox Warrant”) on substantially the same terms as were in effect immediately prior to the closing date. These warrants were considered part of the net assets of Kensington at the time of the Transaction.
On the closing date of the Business Combination Agreement, Wallbox N.V. issued Warrants to registered holders of Kensington’s Public and Private Warrants in exchange for the originally issued Warrants. Wallbox N.V. assumed and continues to hold these warrants on the same terms as before (to the extent applicable).
According to management’s assessment, both the Public and Private Warrants fall within the scope of IAS32 and have been classified as a derivative financial liability. In accordance with IFRS9 guidance, derivatives that are classified as financial liabilities shall be measured at fair value with subsequent changes in fair value to be recognized in profit and loss.
JOBS Act
The JOBS Act permits an emerging growth company (“EGC”) such as us to take advantage of an extended transition period to comply with new or revised accounting standards applicable to public companies. We have elected to use the extended transition period under the JOBS Act until the earlier of the date we (1) are no longer an emerging growth company or (2) affirmatively and irrevocably opt out of the extended transition period provided in the JOBS Act. As a result, our consolidated financial statements may not be comparable to companies that comply with new or revised accounting pronouncements as of public company effective dates.
We will remain an emerging growth company until the earliest to occur of: (1) the last day of the fiscal year in which we have more than $1.07 billion in annual revenue; (2) the date on which we are deemed to be a “large accelerated filer,” which would occur if the market value of our equity securities held by nonaffiliates exceeds US$700 million as of the last business day of our most recently completed second fiscal quarter; (3) the date on which we have issued more than $1.0 billion in
non-convertible
debt securities during the prior three-year period; and (4) the last day of the fiscal year ending after the fifth anniversary of Kensington’s initial public offering, or March 2, 2026.
Recent Accounting Pronouncements
See Notes 4 and 5 of our consolidated financial statements included elsewhere in this Annual Report for more information regarding recently issued accounting pronouncements and discussion of the impact of recent accounting pronouncements, respectively.
Contractual Obligations and Commitments
As of December 31, 2021 there are contractual obligations to purchase, construct or develop Property, plant and equipment Assets, for an amount of €8,108,621 and commitments for the acquisition of intangible assets of €1,024,487.The minimum commitment is for the amount of Euros 11,438,281 (€3,000,000 at December 31, 2020) of which an amount of €3,329,660 has been invested during 2021 (€2,933,279 at December 31, 2020), leaving a pending commitment to invest of €8,108,621 at 31 December 2021 (€66,722 at December 31, 2020). These commitments mainly correspond to the works that as of December 31, 2021 are being executed in the new plant located in the Zona Franca, as well as leasehold improvements in the Headquarters located in Barcelona.
83
See Notes 8 and 10 of the consolidated financial statements included elsewhere in this Annual Report for more information. On 24 September 2021 the Group has signed a new lease agreement of land and buildings for the construction of the facility in Arlington – Texas (USA). This contract has been effective in the beginning of 2022.
As of December 31, 2020, our contractual obligations and commitments consisted of (A) a pending commitment to invest as of December 31, 2020 of €66,722 relating to a minimum commitment to improve a leased property in the amount of €3,000,000 of which an amount of €2,933,279 has been already invested during 2020 and (B) a pending commitment amounting to €159,093 of a loan with Wallbox-Fawsn New Energy Vehicle Charging Technology (Suzhou) Co., Ltd., Wallbox’s our joint venture incorporated on June 15, 2019 over which the Group has a joint control and a 50% interest. See Notes 28 and 812, respectively, of our consolidated financial statements included elsewhere in this Annual Report for more information.
|
Item 6.
|
Directors, Senior Management and Employees
|
A. Directors and Senior Management
Wallbox will have a
one-tier
board, consisting of one or more executive directors and one or more
non-executive
directors.
The number of executive directors and the number of
non-executive
directors shall be determined by the Board. The executive directors and
non-executive
directors shall be appointed as such by the general meeting of Wallbox at the nomination of the Wallbox Board.
A director shall be appointed for a term of approximately one year, which term of office shall lapse immediately after the close of the annual general meeting held in the year after his or her appointment. A director may be reappointed with due observance of the preceding sentence. A
non-executive
director may be in office for a period not exceeding twelve (12) years, which period may or may not be interrupted, unless at the proposal of the Board the general meeting of Wallbox resolves otherwise. In the event of reappointment of a
non-executive
director after an eight-year period (or any reappointment thereafter), the Wallbox’s management report shall include the reasons for such reappointment, in accordance with the principles and best practice provisions of the DCGC.
The general meeting of Wallbox may at all times suspend or dismiss any director. The Board may at all times suspend an executive director.
The Board is comprised of six directors.
The Board shall adopt written rules and regulations dealing with,
, its internal organization, the manner in which decisions are taken, the composition, duties and organization of committees and any other matters concerning the Board, the executive directors, the
inter alia
non-executive
directors and committees established by the Board.
84
The following table lists the names, ages and positions of those individuals who serve as our directors and executive officers as of December 31, 2021. The Board is comprised of eight directors. The Board consists of an executive director and seven
non-executive
directors. We anticipate appointing one additional
non-executive
director in the future.
|
Name
|
Age
|
Position
|
||||
|
Executive Officers
|
||||||
|
Enric Asunción Escorsa
|
37 | Chief Executive Officer, Director | ||||
|
Jordi Lainz
|
53 | Chief Financial Officer | ||||
|
Eduard Castañeda
|
36 | Chief Product Officer | ||||
|
Board
|
||||||
|
Enric Asunción Escorsa
|
37 | Executive Director | ||||
|
Beatriz González Ordóñez
|
46 |
Non-executive
Director
|
||||
|
Francisco Riberas
|
57 |
Non-executive
Director
|
||||
|
Anders Pettersson
|
62 |
Non-executive
Director
|
||||
|
Diego Díaz Pilas
|
41 |
Non-executive
Director
|
||||
|
Pol Soler
|
40 |
Non-executive
Director
|
||||
Executive Officers
Enric Asunción Escorsa
co-founder
and has served as Wallbox’s Chief Executive Officer and as a member of the Wallbox board since 2015. Previously, Mr. Asunción served as Program Manager of Charging Installations at Telsa, Inc., an American electric vehicle and clean energy company, from June 2014 to June 2015. Prior to Telsa, Inc., Mr. Asunción worked as an engineer at Applus+ IDIADA, an engineering company providing design, testing, engineering and homologation services to the automotive industry, from July 2011 to June 2014. Mr. Asunción holds an Engineering degree from Universitat Politecnica de Catalunya (DNF). We believe Mr. Asunción is well qualified to serve on Wallbox’s board due to the perspective and experience he brings as Wallbox’s Chief Executive Officer and
co-founder
and his extensive experience in the automotive industry.
Jordi Lainz
Eduard Castañeda
co-founder
and has served as Wallbox’s Chief Product Officer since 2020, and was formerly Chief Technology Officer from 2018 to 2020. Mr. Castañeda also served on Wallbox’s board of directors as a technical director from 2015 to 2020. Prior to Wallbox, Mr. Castañeda served as a Track Engineering at TPV Racing, a company that introduced telemetry data into real-time motorsports racing teams, from 2005 to 2015. Mr. Castañeda holds an Industrial Engineering degree from the School of Industrial Engineering of Barcelona.
The Board
Anders Pettersson
.
85
businesses around the world. Mr. Pettersson has served as Chairman of Brink Group B.V., a leading towing hitch business in Europe, since 2014, and has served as a director at ZetaDisplay AB since 2014, at KlaraBo Sverige AB since 2014, at Skabholmen Invest AB since 2009 and at PS Enterprise AB since 2005. As noted above,
Mr. Pettersson served as Chief Executive Officer of Thule from 2002 to 2010, where he oversaw international expansion through the strategic acquisitions of Konig, Omnistor, Case Logic, TrackRac and Sportrack.
Mr. Pettersson has also served as Chief Executive Officer of Hilding Anders AB from 2011 to 2014 and Capital Safety Group Inc. from 2010 to 2012, and previously held executive and managerial positions with AkzoNobel N.V. and Trelleborg AB. Mr. Pettersson served as a director of Pure Safety from 2010 to 2020, a director of Pure Power from 2016 to 2019, a director of Alite International AB from 2014 to 2019, a director of Victoria Park AB from 2011 to 2019, Chairman of the board of directors of Hilding Anders AB from 2012 to 2014 and a member of the operating review board of Arle Capital Partners Limited from 2012 to 2014. Mr. Pettersson holds a Master of Science in Civil Engineering and Bachelor of Science in Business and Economics from Lund University. We believe Mr. Pettersson is qualified to serve on the board because his extensive experience in the automotive industry. We believe Mr. Pettersson is well qualified to serve on our board of directors based on his extensive experience sourcing, evaluating and acquiring automotive businesses.
Diego Díaz Pilas
.
start-ups
worldwide, and he also leads the Technology Prospective Analysis unit in charge of assessing the potential of key technologies for the future of the energy sector. Prior to joining Iberdrola in 2008, he worked at Telefonica, a Spanish multinational telecommunications company, from August 2007 to August 2008, Eir, a mobile and broadband telecommunications company, from August 2005 to August 2007 and Iberdrola Engineering from March 2004 to August 2005. He holds a Master of Science in Engineering from the Universidad Politécnica de Madrid and an executive in Venture Capital from the Walter A. Haas School of Business in the University of California at Berkeley. We believe Mr. Díaz is qualified to serve on the board because of his extensive experience in the electric utility industry.
Pol Soler
Francisco Riberas
Beatriz González Ordóñez
86
and Toqio, since 2014, 2016, 2020, 2016, 2020, 2015, 2019, and 2021, respectively. She also serves as an Independent Board member of Endeavor Spain and Idealista. Prior to founding Seaya in 2012, Ms. González worked at Morgan Stanley, in the finance and investment industry, from 1998 to 2000, Darby Overseas Investments, a private equity firm, from 2002 to 2003, Excel Partners, a private equity firm, from 2003 to 2004, and Fonditel, the largest pension fund in Spain, from 2005 to 2011. Ms. González holds a Business and Economics degree from CUNEF and an MBA from Columbia Business School. We believe Ms. González is qualified to serve on the board based on her extensive experience managing funds in the technology sector.
There are no family relationships among any of Wallbox’s executive officers or directors.
B. Compensation
We set out below the amount of compensation paid and benefits in kind provided by us or our subsidiaries to our executive officers and members of our Board of Directors for services in all capacities to us or our subsidiaries for the year ended December 31, 2021, as well as the amount contributed by us or our subsidiaries to retirement benefit plans for our executive officers and members of our Board of Directors.
Compensation of Wallbox’s executive officers
The amount of compensation, including benefits in kind, accrued or paid to Wallbox’s executive officers with respect to the year ended December 31, 2021 is described in the table below:
|
(Euros)
|
All executives
|
|||
|
Periodically-paid remuneration
|
€ | 366,238 | ||
|
Bonuses
|
€ | 404,000 | ||
|
Additional benefit payments
(1)
|
— | |||
|
Total cash compensation
|
€ | 770,238 | ||
| (1) |
No amounts were set aside or accrued by Wallbox in 2021 to provide pension, retirement or similar benefits for Wallbox’s executive officers.
|
Remuneration policy for members of the Board
The compensation of the executive directors shall be determined by the Board with observance of the remuneration policy adopted by the general meeting of Wallbox at the proposal of the Wallbox Board. The executive directors shall not participate in the deliberations and decision-making regarding the determination of the remuneration of the executive directors. The compensation of the
non-executive
directors shall be determined by the Wallbox Board with observance of the remuneration policy adopted by the general meeting of Wallbox.
Any compensation in the form of shares in the capital of Wallbox or rights to subscribe for shares in the capital of Wallbox will be subject to the approval of the general meeting of Wallbox. Such proposal shall state at least the maximum number of shares in the capital of Wallbox or rights to subscribe for shares in the capital of Wallbox that may be granted to directors and the criteria for making or amending such grants.
Our remuneration policy authorizes the Wallbox Board to determine the amount, level and structure of the compensation packages of our directors at the recommendation of our compensation committee. These compensation packages may consist of a mix of fixed and variable compensation components, including base salary, short-term incentives, long-term incentives, fringe benefits, severance pay and pension arrangements, as determined by our Board.
With respect to the year ended December 31, 2021, our
non-executive
directors are entitled to receive the following compensation: €70,500, in cash compensation.
87
Equity Awards
Wallbox’s founders, directors and executive officers held the following Wallbox options (both vested and unvested) as of December 31, 2021:
|
Beneficiary
|
Grant date |
Number of
options outstanding |
Strike
price |
|||||||||
|
Enric Asunción Escorsa (*)
|
N/A | N/A | N/A | |||||||||
|
Jordi Lainz
|
October 1, 2021 | 2,161,447 | € | 0.0021 | ||||||||
|
Eduard Castañeda (*)
|
N/A | N/A | N/A | |||||||||
| (*) |
As of December 31, 2021, both Enric Asuncion Escorsa and Eduard Castaneda were already participating in the Founders Stock Option Plan as discussed in Note 21 of the consolidated financial statements included elsewhere in this Annual Report. On April 6, 2002, Enric Asuncion Escorsa was granted 777,267 options and Eduard Castaneda was granted 258,342, in each case, with a strike price of €1.93.
|
Wallbox Legacy Employee Stock Option Programs
Prior to the Business Combination, certain beneficiaries were given the opportunity to participate in an Employee Stock Option Program (the “Legacy Stock Option Program”) as part of a long-term equity incentive scheme. The Legacy Stock Option Program consists of three different programs: one for founders, one for management and one for other employees. The Legacy Stock Option Program for founders was adopted by Wallbox shareholders in June 2021. The Legacy Stock Option Program for management was adopted by Wallbox shareholders in July 2018. The Legacy Stock Option Program for employees was adopted by Wallbox shareholders in May 2020.
Under the Legacy Stock Option Program for founders, Wallbox has reserved for issuance to the beneficiaries 1,033,610 stock options to purchase Wallbox shares at a per share exercise price equal to €1.93. Stock options granted under the Legacy Stock Option Program for founders will, for a period of 3 years, only become exercisable in equal monthly installments, determined by pro rating the options (i.e. 1/36th per month) over such 3 year period, on the last day of each calendar month and will be freely exercisable thereafter; provided all such options will expire after 5 years from the grant date. Founders who terminate employment with Wallbox may retain any stock options vested as of the applicable termination date. No options have been granted pursuant to this plan as of the date of this Annual Report.
Under the Legacy Stock Option Program for management, the beneficiaries received 7,253,823 stock options to purchase Wallbox shares at a per share exercise price equal to €0.0021. Stock options granted under the Legacy Stock Option Program for managers generally vest in equal yearly instalments on the last day of each year over a 3 year period and expire 2 years from the last of such vesting dates. Managers who terminate employment with Wallbox may retain any stock options vested.
Under the Legacy Stock Option Program for employees, the beneficiaries received 1,626,206 stock options to purchase Wallbox shares at a per share exercise price equal to €0.0021. Wallbox has agreed to reimburse such employees for the amount of any exercise price paid in connection the exercise of such options. Stock options granted under the Legacy Stock Option Program for employees generally vest in equal monthly instalments on the last day of each calendar month over an 8 month period. Employees who terminate employment with Wallbox may retain any stock options vested as of the applicable termination date.
In accordance with the terms of the Legacy Stock Option Programs for employees, participants will be entitled to execute their vested shares at the occurrence of an “Exit Event” and will not be exercisable until an “Exit Event” occurs Notwithstanding the foregoing, subject to the consent of each individual award holder, this “Exit Event” requirement will be waived and the stock options will instead become vested and exercisable based
88
on the conditions applicable to such stock options as of immediately prior to the Business Combination without regard to the “Exit Event” condition. As of the date of this Annual Report all of the holders of options under this plan have granted such consent.
Wallbox N.V. 2021 Equity Incentive Plan
The Board adopted the Incentive Plan (an omnibus equity incentive plan) in order to facilitate the grant of equity awards to attract, retain and incentivize employees (including Wallbox’s executive officers), independent contractors and directors of the combined company and its affiliates, which is essential to Wallbox’s long term success. The material terms of the Incentive Plan are summarized below.
Eligibility and Administration
Wallbox’s employees, consultants and directors, and employees and consultants of any of Wallbox’s subsidiaries, are eligible to receive awards under the Incentive Plan. The basis for participation in the Incentive Plan by eligible persons is the selection of such persons for participation by the plan administrator in its discretion. The Incentive Plan will be generally administered by board of directors, which may delegate its duties and responsibilities to committees of H board of directors and/or officers (referred to collectively as the plan administrator below), subject to certain limitations that may be imposed under the Incentive Plan and/or stock exchange rules, as applicable. The plan administrator will have the authority to make all determinations and interpretations under, and adopt rules for the administration of, the Incentive Plan, subject to its express terms and conditions. The plan administrator will also set the terms and conditions of all awards under the Incentive Plan, including any vesting and vesting acceleration conditions. The plan administrator may also institute and determine the terms and conditions of an “exchange program,” which could provide for the surrender or cancellation, transfer, or reduction or increase of exercise price, of outstanding awards, subject to the limitations provided for in the Incentive Plan. The plan administrator’s determinations under the Incentive Plan are in its sole discretion and will be final and binding on all persons having or claiming any interest in the Incentive Plan or any award thereunder.
Limitation on Awards and Shares Available
The number of shares initially available for issuance under awards granted pursuant to the Incentive Plan will 17,090,419. The number of shares initially available for issuance will be increased on January 1 of each calendar year beginning in 2022 and ending in 2031, by an amount equal to the lesser of (a) 2.5% of the shares of Class A Shares outstanding on the final day of the immediately preceding calendar year and (b) such smaller number of shares as determined by Wallbox’s board of directors. No more than ten percent (10%) of the fully diluted Shares as determined at the closing of the Business Combination, may be issued upon the exercise of incentive stock options under the Incentive Plan. Shares issued under the Incentive Plan may be newly issued shares, shares purchased in the open market or treasury shares.
If an award under the Incentive Plan expires, lapses or is terminated, exchanged for cash, surrendered to an exchange program, repurchased, cancelled without having been fully exercised or forfeited, then any shares subject to such award will, as applicable, become or again be available for new grants under the Incentive Plan. Shares delivered to Wallbox by a participant to satisfy the applicable exercise price or purchase price of an award and/or satisfy any applicable tax withholding obligation (including shares retained by Wallbox from the award being exercised or purchased and/or creating the tax obligation), will become or again be available for award grants under the Incentive Plan. The payment of dividend equivalents in cash in conjunction with any outstanding awards will not count against the number of shares available for issuance under the Incentive Plan. Awards granted under the Incentive Plan upon the assumption of, or in substitution or exchange for, awards authorized or outstanding under a qualifying equity plan maintained by an entity with which we enter into a merger, consolidation, acquisition or similar corporate transaction will not reduce the shares available for grant under the Incentive Plan. The plan administrator may, in its discretion, make adjustments to the maximum number and
89
kind of shares which may be issued under the Incentive Plan upon the occurrence of a merger, reorganization, consolidation, combination, amalgamation, recapitalization, liquidation, dissolution, or sale, transfer, exchange or other disposition of all or substantially all of the assets of Wallbox, or sale or exchange of common stock or other securities of Wallbox, change in control, issuance of warrants or other rights to purchase common stock or other securities of Wallbox or similar corporate transaction or event.
Awards
The Incentive Plan provides for the grant of stock options, including incentive stock options, or ISOs, and nonqualified stock options, or NSOs; restricted stock; dividend equivalents; restricted stock units, or RSUs; stock appreciation rights, or SARs; and other stock or cash-based awards. Certain awards under the Incentive Plan may constitute or provide for a deferral of compensation, subject to Section 409A of the Code, which may impose additional requirements on the terms and conditions of such awards. All awards under the Incentive Plan will be set forth in award agreements, which will detail the terms and conditions of the awards, including any applicable vesting and payment terms and post-termination exercise limitations. A brief description of each award type follows.
Stock Options.
SARs
Restricted stock and RSUs
Other stock or cash-based awards
90
annual or other periodic or long-term cash bonus awards (whether based on specified performance criteria or otherwise). Such awards may be paid in Class A Shares, cash or other property, as the administrator determines. Other stock or cash-based awards may be granted to participants and may also be available as a payment form in the settlement of other awards, as standalone payments and as payment in lieu of compensation payable to any individual who is eligible to receive awards. The plan administrator will determine the terms and conditions of other stock or cash-based awards, which may include vesting conditions based on continued service, performance and/or other conditions.
Performance Awards
Performance awards include any of the foregoing awards that are granted subject to vesting and/or payment based on the attainment of specified performance goals or other criteria the plan administrator may determine, which may or may not be objectively determinable. Performance criteria upon which performance goals are established by the plan administrator may include: net earnings or losses (either before or after one or more of interest, taxes, depreciation, amortization and
non-cash
equity-based compensation expense); gross or net sales or revenue or sales or revenue growth; net income (either before or after taxes) or adjusted net income; profits (including, but not limited to, gross profits, net profits, profit growth, net operation profit or economic profit), profit return ratios or operating margin; budget or operating earnings (either before or after taxes or before or after allocation of corporate overhead and bonus); cash flow (including operating cash flow and free cash flow or cash flow return on capital); return on assets; return on capital or invested capital; cost of capital; return on shareholders’ equity; total shareholder return; return on sales; costs, reductions in costs and cost control measures; expenses; working capital; earnings or loss per share; adjusted earnings or loss per share; price per share or dividends per share (or appreciation in or maintenance of such price or dividends); regulatory achievements or compliance; implementation, completion or attainment of objectives relating to research, development, regulatory, commercial or strategic milestones or developments; market share; economic value or economic value added models; division, group or corporate financial goals; customer satisfaction/growth; customer service; employee satisfaction; recruitment and maintenance of personnel; human resources management; supervision of litigation and other legal matters; strategic partnerships and transactions; financial ratios (including those measuring liquidity, activity, profitability or leverage); debt levels or reductions; sales-related goals; financing and other capital raising transactions; cash on hand; acquisition activity; investment sourcing activity; marketing initiatives; and other measures of performance selected by Wallbox’s board of directors or its applicable committee, any of which may be measured in absolute terms or as compared to any incremental increase or decrease. Such performance goals also may be based solely by reference to Wallbox’s performance or the performance of its subsidiary, division, business segment or business unit, or based upon performance relative to performance of other companies or upon comparisons of any of the indicators of performance relative to performance of other companies. When determining performance goals, the plan administrator may provide for exclusion of the impact of an event or occurrence which the plan administrator determines should appropriately be excluded, including, without limitation,
non-recurring
charges or events, acquisitions or divestitures, changes in the corporate or capital structure, events not directly related to the business or outside of the reasonable control of management, foreign exchange gains or losses, and legal, regulatory, tax or accounting changes.
Provisions of the Incentive Plan Relating to Director Compensation
The Incentive Plan provides that the plan administrator may establish compensation for
non-employee
directors from time to time subject to the Incentive Plan’s limitations. The plan administrator may, subject to the limitations in the Incentive Plan, Dutch law, and Wallbox’s remuneration policy as may be in existence from time to time, in each case, as applicable, establish the terms, conditions and amounts of all such
non-employee
director compensation in its discretion and in the exercise of its business judgment, taking into account such factors, circumstances and considerations as it shall deem relevant from time to time, provided that the sum of any cash compensation or other compensation and the grant date fair value (as determined in accordance with ASC 718, or any successor thereto) of any equity awards granted as compensation for services as a
91
non-employee
director during any calendar year may not exceed $1,000,000. The plan administrator may make exceptions to this limits for individual
non-employee
directors in extraordinary circumstances, as the plan administrator may determine in its discretion, provided that the
non-employee
director receiving such additional compensation may not participate in the decision to award such compensation or in other contemporaneous compensation decisions involving
non-employee
directors.
Certain Transactions
In connection with certain transactions and events affecting Class A Shares, including, without limitation, any dividend or other distribution, reorganization, merger, consolidation, recapitalization, or sale of all or substantially all of the assets of Wallbox, or sale or exchange of common stock or other securities of Wallbox, a change in control, or issuance of warrants or other rights to purchase common stock or other securities of Wallbox, or similar corporate transaction or event, or change in any applicable laws or accounting principles, the plan administrator has broad discretion to take action under the Incentive Plan to prevent the dilution or enlargement of intended benefits, facilitate such transaction or event, or give effect to such change in applicable laws or accounting principles. This includes canceling awards in exchange for either an amount in cash or other property with a value equal to the amount that would have been obtained upon exercise or settlement of the vested portion of such award or realization of the participant’s rights under the vested portion of such award, accelerating the vesting of awards, providing for the assumption or substitution of awards by a successor entity, adjusting the number and type of shares available, replacing awards with other rights or property and/or terminating awards under the Incentive Plan.
For purposes of the Incentive Plan, a “change in control” means and includes each of the following:
| • |
a transaction or series of transactions whereby any “person” or related “group” of “persons” (as such terms are used in Sections 13(d) and 14(d)(2) of the Exchange Act) (other than Wallbox or its subsidiaries or any employee benefit plan maintained by Wallbox or any of its subsidiaries or a “person” that, prior to such transaction, directly or indirectly controls, is controlled by, or is under common control with, us) directly or indirectly acquires beneficial ownership (within the meaning of Rule
13d-3
under the Exchange Act) of Wallbox’s securities possessing more than 50% of the total combined voting power of Wallbox’s securities outstanding immediately after such acquisition; or
|
| • |
during any period of two consecutive years, individuals who, at the beginning of such period, constitute the Wallbox board of directors together with any new directors (other than a director designated by a person who shall have entered into an agreement with Wallbox to effect a change in control transaction) whose election by the Wallbox board of directors or nomination for election by Wallbox’s shareholders was approved by a vote of at least
two-thirds
of the directors then still in office who either were directors at the beginning of the
two-year
period or whose election or nomination for election was previously so approved, cease for any reason to constitute a majority thereof; or
|
| • |
the consummation by Wallbox (whether directly or indirectly) of (x) a merger, consolidation, reorganization, or business combination or (y) a sale or other disposition of all or substantially all of Wallbox’s assets in any single transaction or series of related transactions or (z) the acquisition of assets or stock of another entity, in each case other than a transaction:
|
| • |
which results in Wallbox’s voting securities outstanding immediately before the transaction continuing to represent either by remaining outstanding or by being converted into voting securities of the company or the person that, as a result of the transaction, controls, directly or indirectly, the company or owns, directly or indirectly, all or substantially all of Wallbox’s assets or otherwise succeeds to Wallbox’s business, directly or indirectly, at least a majority of the combined voting power of the successor entity’s outstanding voting securities immediately after the transaction, and
|
| • |
after which no person or group beneficially owns voting securities representing 50% or more of the combined voting power of the successor entity; provided, however, that no person or group
|
92
|
shall be treated as beneficially owning 50% or more of the combined voting power of the successor entity solely as a result of the voting power held in Wallbox prior to the consummation of the transaction.
|
Foreign Participants, Claw-back Provisions, Transferability and Participant Payments
With respect to foreign participants, the plan administrator may modify award terms, establish subplans and/ or adjust other terms and conditions of awards, subject to the share limits described above. All awards will be subject to the provisions of any claw-back policy implemented by Wallbox to the extent set forth in such claw-back policy or in the applicable award agreement. With limited exceptions for estate planning, domestic relations orders, certain beneficiary designations and the laws of descent and distribution, awards under the Incentive Plan are generally
non-transferable
prior to vesting and are exercisable only by the participant. With regard to tax withholding obligations arising in connection with awards under the Incentive Plan and exercise price obligations arising in connection with the exercise of stock options under the Incentive Plan, the plan administrator may, in its discretion and subject to any applicable blackout or
lock-up
periods, accept cash, wire transfer, or check, shares of Class A Shares that meet specified conditions (a market sell order) or such other consideration as it deems suitable or any combination of the foregoing.
Plan Amendment and Termination
Wallbox’s board of directors may amend, suspend or terminate the Incentive Plan at any time. However, no amendment, other than an increase in the number of shares available under the Incentive Plan, in excess of the initial pool and annual increase as described above, may materially and adversely affect any award outstanding at the time of such amendment without the affected participant’s consent. Wallbox’s board of directors will obtain stockholder approval for any plan amendment to the extent necessary to comply with applicable laws. The plan administrator will have the authority, without the approval of Wallbox’s shareholders, to amend any outstanding award, including by substituting another award of the same or different type, changing the exercise or settlement date, converting an ISO to an NSO and institute any such exchange program. No award may be granted pursuant to the Incentive Plan after the expiration of the Incentive Plan. The Incentive Plan is scheduled to remain in effect until the earlier of (i) the tenth anniversary of the date on which Wallbox’s board of directors adopts the Incentive Plan and (ii) the earliest date as of which all awards granted under the Incentive Plan have been satisfied in full or terminated and no shares approved for issuance under the Incentive Plan remain available to be granted under new awards.
Securities Laws
The Incentive Plan is intended to conform to all provisions of the Securities Act, the Exchange Act and any and all regulations and rules promulgated by the SEC thereunder. The Incentive Plan will be administered, and awards will be granted and may be exercised, only in such a manner as to conform to such laws, rules and regulations.
Wallbox N.V. 2021 Employee Stock Purchase Plan
In connection with the Business Combination, the Board adopted the ESPP (an employee stock purchase plan) in order to facilitate employees of Wallbox and its affiliates to purchase Class A Shares at a discount through payroll deductions and to benefit from share price appreciation, thus enhancing the alignment of employee and shareholder interests, which is essential to Wallbox’s long term success. The material terms of the ESPP are summarized below.
Summary of the ESPP
This section summarizes certain principal features of the ESPP. The summary is qualified in its entirety by reference to the complete text of the ESPP.
93
The ESPP is comprised of two distinct components in order to provide increased flexibility to grant the right to purchase shares of Class A Shares under the ESPP to U.S. and to
non-U.S.
employees. Specifically, the ESPP authorizes (1) the grant of the right to purchase shares of Class A Shares by U.S. employees that are intended to qualify as rights granted pursuant to an “employee stock purchase plan” under Section 423 of the Code (the “Section 423 Component”), and (2) the grant of the right to purchase shares of Class A Shares that are not intended to qualify as rights granted pursuant to an “employee stock purchase plan” under Section 423 of the Code to facilitate participation for employees located outside of the U.S. who do not benefit from favorable U.S. federal tax treatment or who otherwise are not eligible or not intended to participate in the Section 423 Component and to provide flexibility to comply with
non-U.S.
law and other considerations (the
“Non-Section
423 Component”). Where permitted under local law and custom, we expect that the
Non-Section
423 Component will generally be operated and administered on terms and conditions similar to the Section 423 Component.
Shares Available for Awards; Administration
8,545,209 shares will initially be reserved for issuance under the ESPP. In addition, the number of shares available for issuance under the ESPP will be annually increased on January 1 of each calendar year beginning in 2022 and ending on and including January 31, 2031, by an amount equal to the lesser of (A) 1% of the aggregate number of shares of Class A Shares outstanding on the final day of the immediately preceding calendar year and (B) such smaller number of shares as is determined by Wallbox’s board of directors. The number of shares that may be issued or transferred pursuant to the rights granted under the Section 423 Component of the ESPP will not exceed an aggregate of 25,000 shares. Wallbox’s board of directors or the compensation committee of Wallbox’s board of directors will administer and will have authority to interpret the terms of the ESPP and determine eligibility of participants.
Eligibility
We expect that substantially all of Wallbox’s employees will be eligible to participate in the ESPP.
However, an employee may not be granted rights to purchase stock under the ESPP if the employee, immediately after the grant, would own (directly or through attribution) stock possessing 5% or more of the total combined voting power or value of all classes of stock and other securities of Wallbox, or a parent or subsidiary corporation of Wallbox. Directors who are not employees are not eligible to participate. Employees who choose not to participate, or are not eligible to participate at the start of an offering period but who become eligible thereafter, may enroll in any subsequent offering period. Additionally, the plan administrator may provide that an employee will not be eligible to participate in an offering period under the Section 423 Component if (i) such employee is a highly compensated employee under Section 414(q) of the Code, (ii) such employee has not met a service requirement designated by the plan administrator, (iii) such employee’s customary employment is for twenty hours per week or less, (iv) such employee’s customary employment is for less than five months in any calendar year and/or (v) such employee is a citizen or resident of a
non-U.S.
jurisdiction or the grant of a right to purchase shares of Class A Shares under the ESPP to such employee would be prohibited under the laws of such
non-U.S.
jurisdiction or the grant of a right to purchase such shares under the ESPP to such employee in compliance with the laws of such
non-U.S.
jurisdiction would cause the ESPP to violate the requirements of Section 423 of the Code.
Grant of Rights
Stock will be offered under the ESPP during offering periods. The length of the offering periods under the ESPP will be determined by the plan administrator and may be up to twenty-seven months long. The plan administrator will establish one or more purchase periods within each offering period. The number of purchase periods within, and purchase dates during each offering period, will be established by the plan administrator prior to the commencement of each offering period. The length of the purchase periods will be determined by the plan administrator and may be up to twenty-seven months long. Employee payroll deductions will be used to purchase
94
shares on each purchase date during an offering period. The purchase dates for each offering period will be the final trading day of the purchase period or such other date as determined by the plan administrator. Payroll deductions for each offering periods under the ESPP will commence for a participant on the first regular payday following the applicable enrollment date of an offering period and will end on the last such payday in the offering period to which such participant’s authorization is applicable, unless sooner terminated or suspended by the participant or plan administrator under the ESPP. The plan administrator may, in its discretion, modify the terms of future offering periods. In
non-U.S.
jurisdictions where participation in the ESPP through payroll deductions is prohibited, the plan administrator may provide that an eligible employee may elect to participate through contributions to the participant’s account under the ESPP in a form acceptable to the plan administrator in lieu of or in addition to payroll deductions.
The ESPP permits participants to purchase Class A Shares through payroll deductions of a specified percentage or a fixed dollar amount of their eligible compensation, which, in either event, may not be less than 1% and may not be more than the maximum percentage specified by the plan administrator for the applicable offering period or purchase period. In the absence of a contrary designation, such maximum percentage will be 20%. The plan administrator will establish a maximum number of shares that may be purchased by a participant during any offering period or purchase period. In addition, no employee will be permitted to accrue the right to purchase stock under the Section 423 Component at a rate in excess of $25,000 worth of shares during any calendar year during which such a purchase right is outstanding (based on the fair market value per share of Class A Shares as of the first day of the offering period).
On the first trading day of each offering period, each participant will be granted the right to purchase shares of Class A Shares. The right will expire on the earlier of, the end of the applicable offering period, the last purchase date of the offering period, and the date on which the participant withdraws from the ESPP, and will be exercised at that time to the extent of the payroll deductions (or contributions) accumulated during the offering period. The purchase price of the shares, in the absence of a contrary designation, with respect to the Section 423 Component will be 85% of the lower of the fair market value of Class A Shares on the first trading day of the offering period or on the purchase date. Participants may voluntarily end their participation in the ESPP at any time during a specified period prior to the end of the applicable offering period, and will be paid their accrued payroll deductions (and contributions, if applicable) that have not yet been used to purchase shares of Class A Shares. If a participant withdraws from the ESPP during an offering period, the participant cannot rejoin until the next offering period. Participation ends automatically upon a participant’s termination of employment.
A participant may not transfer rights granted under the ESPP other than by will or the laws of descent and distribution, and are generally exercisable only by the participant.
Certain Transactions
In the event of certain
non-reciprocal
transactions or events affecting Class A Shares, including, without limitation, any dividend or other distribution, change in control, reorganization, merger, repurchase, redemption, recapitalization, liquidation, dissolution, sale of all or substantially all of our assets or sale or exchange of our shares of Class A Shares, or other similar corporate transaction or event, the plan administrator will make equitable adjustments to the ESPP and outstanding rights. In the event of any events or transactions set forth in the immediately preceding sentence or any unusual or
non-recurring
events or transactions, the plan administrator may provide for (1) either the replacement of outstanding rights with other rights or property or termination of outstanding rights in exchange for cash, (2) the assumption or substitution of outstanding rights by the successor or survivor corporation or parent or subsidiary thereof, if any, (3) the adjustment in the number and type of shares of stock subject to outstanding rights, (4) the use of participants’ accumulated payroll deductions to purchase stock on a new purchase date prior to the next scheduled purchase date and termination of any rights under ongoing offering periods or (5) the termination of all outstanding rights.
95
Plan Amendment; Termination
The plan administrator may amend, suspend or terminate the ESPP at any time. However, shareholder approval will be obtained for any amendment that increases the aggregate number or changes the type of shares that may be sold pursuant to rights under the ESPP, in excess of the initial pool and annual increase as described above, or changes the corporations or classes of corporations whose employees are eligible to participate in the ESPP. The ESPP will continue until terminated by Wallbox’s board of directors.
C. Board Practices
Director and Officer Qualifications
Wallbox is not expected to formally establish any specific, minimum qualifications that must be met by each of its officers. However, Wallbox expects generally to evaluate the following qualities: educational background, diversity of professional experience, including whether the person is a current or was a former chief executive officer or chief financial officer of a public company or the head of a division of a prominent international organization, knowledge of Wallbox’s business, integrity, professional reputation, independence, wisdom, and ability to represent the best interests of Wallbox’s shareholders.
The Nominating Committee of the Board will prepare policies regarding director qualification requirements (including a diversity policy) and the process for identifying and evaluating director candidates for adoption by the Board.
Corporate Governance Practices
DCGC
As a listed Dutch public limited liability company (
), we will be subject to the DCGC. The DCGC contains both principles and best practice provisions on corporate governance that regulate relations between the board and the general meeting and matters in respect of financial reporting, auditors, disclosure, compliance and enforcement standards. The DCGC is based on a “comply or explain” principle. Accordingly, companies are required to disclose in their statutory management report, filed in the Netherlands, whether they comply with the provisions of the DCGC. For further information and the full text of the DCGC please refer to: www.mccg.nl.
naamloze vennootschap
Wallbox acknowledges the importance of good corporate governance. However, Wallbox does not comply with all the provisions of the DCGC, to a large extent because such provisions conflict with or are inconsistent with the corporate governance rules of the NYSE and U.S. securities laws, or because Wallbox believes such provisions do not reflect customary practices of global companies listed on the NYSE. Except as set out below, during the fiscal year to which this report relates, the Company complied with the principles and best practice provisions of the DCGC, to the extent that these are directed at our Board.
Except as set out below, during the fiscal year to which this report relates, the Company complied with the principles and best practice provisions of the DCGC, to the extent that these are directed at our Board.
Compensation (best practice provisions 3.1.2, 3.2.3, 3.3.2, 3.3.3 and 3.4.1)
Consistent with market practice in the United States, and for as 1ongs as that is the trading jurisdiction of our Class A Shares, and in order to further support our ability to attract and retain the right highly qualified candidates for our Board:
| • |
options awarded to our executive directors as part of their compensation could (subject to the terms of the option awards) vest and become exercisab1e during the first three years after the date of grant;
|
| • |
though individual and Company performance are considered when granting any variable pay, no
pre-defined
measurable performance criteria apply, and no scenario analyses have been performed in relation to variable pay;
|
96
| • |
our directors may generally sell our Class A Shares held by them at any point in time, subject to applicable law, Company policy and applicable
lock-up
arrangements;
|
| • |
our
non-executive
directors may be granted compensation in the form of shares, options and/or other equity-based compensation; and
|
| • |
our executive directors may be entitled to a severance payment in excess of their respective annual base salaries.
|
The
non-executive
directors confirm that the statements required to be made pursuant to best practice provision 5.1.5 of the DCGC, to the extent applicable, are included in this management report and for the purposes of this best practice provision should be regarded as statements made by the
non-executive
directors.
Committees of the Board of Directors
Upon the completion of the Business Combination, Wallbox’s Board established three standing committees from among its
non-executive
directors, including an Audit Committee, Compensation Committee and Nominating and Corporate Governance Committee. The Board shall remain collectively responsible for decisions prepared by the committees.
Audit Committee
Audit committee members are
non-executive
directors of the Board and are Beatriz González, Francisco J. Riberas, and Pol Soler. Beatriz González serves as chairman of the audit committee.
Each member of the audit committee is expected to be financially literate and at least one member is expected to qualify as an “audit committee financial expert” as defined in applicable SEC rules.
The audit committee advises the Board in relation to its responsibilities, undertakes preparatory work for the Board’s decision-making regarding the supervision of the integrity and quality of Wallbox’s financial reporting and the effectiveness of Wallbox’s internal risk management and control systems and shall prepare resolutions of the Board in relation thereto. The Wallbox’s Board adopted an audit committee charter, which details the principal functions of the audit committee, including, among other things:
| • |
meeting with our independent registered public accounting firm regarding, among other issues, audits, and adequacy of Wallbox’s accounting and control systems;
|
| • |
monitoring the independence of Wallbox’s independent registered public accounting firm;
|
| • |
verifying the rotation of the lead (or coordinating) audit partner having primary responsibility for the audit and the audit partner responsible for reviewing the audit as required by law;
|
| • |
inquiring and discussing with management Wallbox’s compliance with applicable laws and regulations;
|
| • |
pre-approving
all audit services and permitted
non-audit
services to be performed by Wallbox’s independent registered public accounting firm, including the fees and terms of the services to be performed;
|
| • |
appointing or replacing Wallbox’s independent registered public accounting firm;
|
| • |
determining the compensation and oversight of the work of Wallbox’s independent registered public accounting firm (including resolution of disagreements between management and the independent auditor regarding financial reporting) for the purpose of preparing or issuing an audit report or related work;
|
97
| • |
establishing procedures for the receipt, retention and treatment of complaints received by Wallbox regarding accounting, internal accounting controls or reports which raise material issues regarding Wallbox’s financial statements or accounting policies; and
|
| • |
reviewing and approving related party transactions in accordance with Wallbox’s Related Party Transaction Policy and Procedures.
|
Compensation Committee
Compensation committee members are
non-executive
directors of the Board are Francisco Riberas, Pol Soler and Andres Pettersson. Francisco Riberas serves as chairman of the compensation committee.
The compensation committee advises the Board in relation to its responsibilities and shall prepare resolutions of the Board in relation thereto. Wallbox’s Board adopted a compensation committee charter which details the principal functions of the compensation committee, including, among other things:
| • |
reviewing and approving on an annual basis the corporate goals and objectives relevant to Wallbox’s Chief Executive Officer’s compensation, evaluating the Chief Executive Officer’s performance in light of such goals;
|
| • |
reviewing and approving the compensation of all of its other executive officers;
|
| • |
reviewing its executive compensation policies and plans;
|
| • |
implementing and administering its incentive compensation equity-based remuneration plans;
|
| • |
assisting management in complying with its annual report disclosure requirements;
|
| • |
approving all special perquisites, special cash payments and other special compensation and benefit arrangements for its executive officers and employees; and
|
| • |
reviewing, evaluating and recommending changes, if appropriate, to the remuneration for directors.
|
The charter will also provide that the compensation committee may, in its sole discretion, retain or obtain the advice of a compensation consultant, legal counsel or other adviser and is directly responsible for the appointment, compensation and oversight of the work of any such adviser. However, before engaging or receiving advice from a compensation consultant, external legal counsel or any other adviser, the compensation committee will consider the independence of each such adviser, including the factors required by the New York Stock Exchange and the SEC.
Nominating and Corporate Governance Committee
Nominating and corporate governance committee members are
non-executive
directors of the Board and are Diego Díaz, Pol Soler and Beatriz González Ordóñez. Diego Díaz serves as chairman of the nominating and corporate governance committee.
The nominating and corporate governance committee advises the Board in relation to its responsibilities and shall prepare resolutions of the Board in relation thereto. The nominating and corporate governance committee will be responsible for overseeing the selection of persons to be nominated to serve on Wallbox’s Board. The nominating and corporate governance committee will consider persons identified by its members, management, shareholders, investment bankers and others.
Wallbox’s Board adopted a nominating and corporate governance committee charter, which includes guidelines for selecting nominees and provide that person to be nominated:
| • |
should have demonstrated notable or significant achievements in business, education or public service;
|
98
| • |
should possess the requisite intelligence, education and experience to make a significant contribution to the board of directors and bring a range of skills, diverse perspectives and backgrounds to its deliberations; and
|
| • |
should have the highest ethical standards, a strong sense of professionalism and intense dedication to serving the interests of the shareholders.
|
The nominating and corporate governance committee will consider a number of qualifications relating to management and leadership experience, background and integrity and professionalism in evaluating a person’s candidacy for membership on the Wallbox’s Board. The nominating and corporate governance committee may require certain skills or attributes, such as financial or accounting experience, to meet specific board needs that arise from time to time and will also consider the overall experience and makeup of its members to obtain a broad and diverse mix of board members. The nominating and corporate governance committee will not distinguish among nominees recommended by shareholders and other persons.
The nominating and corporate governance committee will also take a leadership role in shaping the corporate governance of Wallbox. The nominating and corporate governance committee charter will provide that it develops and recommends to Wallbox’s Board a set of corporate governance guidelines and other policies and practices applicable to Wallbox and continuously reviews the adequacy of the Articles of Association and other practices and positions of Wallbox.
Duties of Board Members and Conflicts of Interest
The Board shall be entrusted with the management of Wallbox and shall for such purpose have all the powers within the limits of the law that are not granted by our Articles of Association to others. Wallbox will have a
one-tier
board, consisting of one or more executive directors and one or more
non-executive
directors.
The executive directors are primarily responsible for all
operations of Wallbox. The
day-to-day
non-executive
directors supervise (i) the executive directors’ policy and performance of duties and (ii) Wallbox’s general affairs and its business, and render advice and direction to the executive directors. The executive directors shall timely provide the
non-executive
directors with the information they need to carry out their duties. The directors furthermore perform any duties allocated to them under or pursuant to the law or Articles of Association. Each director has a duty to Wallbox to properly perform its duties. In the performance of their tasks, the directors shall be guided by the interests of Wallbox and the enterprise connected with it. Under Dutch law, the interests of Wallbox and the enterprise connected with it extend to the interests of all stakeholders, such as shareholders, creditors, employees, customers and suppliers.
Pursuant to our Articles of Association and the regulations of our Board (the “Board Regulations”), a Director shall not participate in the discussions and/or decision-making process on a subject or transaction in relation to which he/she has a direct or indirect personal conflict of interest with the Company within the meaning of Article 13.2 of the Board Regulations or Section 2:140 paragraph 5 DCC (“Conflict of Interest”). Such transaction must be concluded on terms which are customary in the market concerned and be approved by the Board.
During the fiscal year ended December 31, 2021, there were no transactions where there was a Conflict of Interest.
Executive Officer Employment Agreements and Board Member Service Agreements
We have entered into management services agreements with each of our executive management team members, including our executive director. The management services agreements contain a termination notice period for us and the executive directors. All of the management services agreements provide that the manager or
99
executive director, as the case might be, may be terminated in the event of an urgent cause (dringende reden) without advance notice. The management services agreements contain post-termination restrictive covenants, including confidentiality, and post-termination
non-competition
and
non-solicitation
covenants.
Additionally, the shareholders approved a remuneration policy for
non-executive
directors that provides for compensation, including an annual cash fee, an annual equity grant, an annual fee for membership on a committee of the board of directors, an annual fee for acting as a chairperson of the board of directors and annual fee for acting as a chairperson of a committee of the board of directors. The remuneration policy was adopted by
non-executive
directors.
Board Observer
N/A
D. Employees
Average number of employees in the last 3 years is:
|
(Average number of employees)
|
2021
|
2020
|
2019
|
|||||||||
|
Directives
|
22 | 20 | 10 | |||||||||
|
Administrative
|
261 | 79 | 30 | |||||||||
|
Commercials
|
117 | 55 | 14 | |||||||||
|
Operators
|
23 | 11 | 6 | |||||||||
|
Engineers
|
177 | 107 | 42 | |||||||||
|
|
|
|
|
|
|
|||||||
|
Total
|
|
600
|
|
|
272
|
|
|
102
|
|
|||
|
|
|
|
|
|
|
|||||||
Wallbox strives to offer competitive employee compensation and benefits in order to attract and retain a skilled and diverse work force. As of December 31, 2021, Wallbox have 775 employees, more than 339 of whom were hardware engineers, more than 196 of whom were software developers and more than 213 of whom were focused on product sales. Most of Wallbox’s employees are located in Spain, although its global footprint has employees working in offices across seven European countries, an office in China and another in the United States. As a result of the
COVID-19
pandemic, most of Wallbox’s employees were working remotely, however, many of the Wallbox employees have returned to its facilities as the
COVID-19
pandemic has started to subside. Wallbox has never experienced a work stoppage and believes it maintains positive relationships with its employees. Wallbox believes it maintains good relations with its employees. The employment terms and conditions of the employees based in Spain are governed by the collective bargaining agreement of the metal sector applied at a regional sector in Madrid and in Barcelona (published within the Official Gazette of Madrid and Barcelona on February 14, 2019 and January 18, 2021, respectively).
E. Share Ownership
For information regarding the share ownership of Directors and officers, refer to Item 7 “
” included elsewhere in this Annual Report. For information regarding our equity incentive plans, refer to Item 6 “
included elsewhere in this Annual Report.
Major Shareholders and Related Party Transactions – Major Shareholders
Directors, Senior Management and Employees Compensation – Long-Term Incentive Plans”
|
Item 7.
|
Major Shareholders and Related Party Transactions
|
A. Major Shareholders
The following table sets forth information relating to the beneficial ownership of our Class A Shares and Class B Shares as of April 28, 2022, for:
| • |
each person, or group of affiliated persons, known by us to beneficially own 5% or more of our outstanding Class A Shares or Class B Shares;
|
100
| • |
each of our current executive officers and our Directors; and
|
| • |
all of our current executive officers and our Directors as a group.
|
For further information regarding material transactions between us and principal shareholders, see “Related Party Transactions” below.
The number of Class A Shares and/or Class B Shares beneficially owned by each entity, person, executive officer or Board member is determined in accordance with the rules of the SEC, and the information is not necessarily indicative of beneficial ownership for any other purpose. Under such rules, beneficial ownership includes any shares over which the individual has sole or shared voting power or investment power as well as any shares that the individual has the right to acquire within 60 days of April 28, 2022 through the exercise of any option, warrant or other right. Except as otherwise indicated, and subject to applicable community property laws, the persons named in the table have sole voting and investment power with respect to all Class A Shares or Class B Shares held by that person.
Unless otherwise indicated, the address of each person named below is c/o Wallbox N.V. Carrer del Foc, 68 Barcelona, Spain 08038.
|
Class B Shares
(1)
|
Class A Shares
(including Class B on a post-conversion basis) |
|||||||||||||||
|
Beneficial Owner
|
Number
|
Voting %
|
Number
|
Economic %
|
||||||||||||
|
Executive Officers and Directors of Wallbox
|
||||||||||||||||
|
Enric Asunción Escorsa
(2)
|
18,618,950 | 50.28 | % | 18,618,950 | 11.56 | % | ||||||||||
|
Jordi Lainz
|
291,116 | * | % | |||||||||||||
|
Eduard Castañeda
(2)
|
4,631,843 | 12.51 | % | 4,631,843 | 2.88 | % | ||||||||||
|
Anders Pettersson
|
1,545,000 | * | % | |||||||||||||
|
Francisco Riberas
(12)
|
4,278,142 | 2.66 | % | |||||||||||||
|
Pol Soler
(6)
|
13,240,274 | 8.22 | % | |||||||||||||
|
Beatriz González Ordóñez
(8)
|
11,505,865 | 7.14 | % | |||||||||||||
|
Diego Díaz Pilas
(13)
|
— | — | % | |||||||||||||
|
All executive officers and directors of Wallbox as a group (8 persons)
|
54,111,190 | 33.60 | % | |||||||||||||
|
5% and Greater Shareholders
|
||||||||||||||||
|
KARIEGA VENTURES, S.L.
(3)
|
18,618,950 | 11.56 | % | |||||||||||||
|
Mingkiri, S.L. (Eurofred Spain, S.L.)
(5)(5)
|
15,404,538 | 9.57 | % | |||||||||||||
|
Infisol 3000, S.L.
(6)
|
13,240,274 | 8.22 | % | |||||||||||||
|
Inversiones Financieras Perseo, S.L.
(4)
|
16,697,530 | 10.37 | % | |||||||||||||
|
Seaya Ventures II, Fondo De Capital Riesgo
(8)
|
11,505,865 | 7.14 | % | |||||||||||||
|
Black Label Equity I SCR SA
(9)
|
9,110,175 | 5.66 | % | |||||||||||||
|
AM Gestió, S.L.
(10)
|
8,469,293 | 5.26 | % | |||||||||||||
|
Cathay Innovation SAS
(11)
|
8,732,888 | 5.42 | % | |||||||||||||
| * |
Indicates a shareholding of less than 1%.
|
| (1) |
Each Class B Share entitles the holder to 10 votes per share subject to sunset provisions. Each Class B Share is convertible at any time at the option of the holder into one Class A Share and one Conversion Share. See Exhibit 2.1 to this Annual Report for information regarding our share capital.
|
| (2) |
1,033,610 stock options to purchase Wallbox shares have been reserved for issuance to Mr. Asunción and Mr. Castañeda. It is expected that Mr. Asunción will be granted 775,267 options and Mr. Castañeda will be granted 258,342 options pursuant to such plans.
|
| (3) |
Based on a Schedule 13G filed on February 10, 2022, KARIEGA VENTURES, S.L. and Enric Asunción Escorsa has shared voting power and shared investment power over 18,618,950 Class B Shares. The address
|
101
| of KARIEGA VENTURES, S.L. is Av. Diagonal 419, 4 Planta, Barcelona, Spain 08008. Enric Asunción Escorsa is the Chief Executive Officer and a member of the Board of Directors of Wallbox. |
| (4) |
Based solely on a Schedule 13G filed on February 11, 2022, Iberdrola, S.A., Iberdrola Participaciones S.A.U. and Inversiones Financieras Perseo S.L have shared voting power and shared investment power over 16,697,530 Class A Shares. The address of the foregoing beneficial owners is Plaza Euskadi, 5, Bilbao (Bizkaia), Spain 48009.
|
| (5) |
Based on a Schedule 13G filed on February 10, 2022, MINGKIRI, S.L. has shared voting power and shared investment power over 15,304,538 Class A Shares and Marta Santacana Gri has shared voting power and shared investment power over 15,404,538 Class A Shares. Marta Santacana Gri may be deemed the beneficial owner of 15,404,538 Class A Ordinary Shares, which consist of (i) 15,304,538 Class A Ordinary Shares held of record by MINGKIRI, S.L. and (ii) 100,000 Class A Ordinary Shares held of record by Anangu Grup S.L. Marta Santacana Gri has sole investment and dispositive power over the securities held of record by MINGKIRI, S.L. and shares investment and dispositive power over the securities held of record by Anangu Grup S.L. The address of the foregoing named reporting persons is Marquest de Sentmenat 97, Barcelona, Spain 08029.
|
| (6) |
Based solely on a Schedule 13D filed on February 14, 2022, Infisol 3000, S.L. has sole voting power and sole investment over 13,240,274 Class A Shares, and Mesrrs. Juan Manuel Soler Pujol, Lluis Soler Masferrer, Daniel Soler Masferrer and Pol Soler Masferrer may be deemed to have shared voting power and shared dispositive power over such shares. The address of the foregoing named beneficial owners Calle Josep Irla i Bosch, numeros 1-3, Barcelona, Spain 08034. Pol Soler Masferrer is a member of the board of directors of Wallbox N.V.
|
| (8) |
Based solely on a Schedule 13G filed on February 11, 2022, Seaya Ventures II, Fondo De Capital Riesgo, Beatriz González Ordóñez and José Marĺa Múgica Murga have shared voting power and shared dispositive power over 11,505,865 Class A Shares. Seaya Ventures II, Fondo De Capital Riesgo is the record holder, and Ms. Beatriz González Ordóñez and Mr. José Marĺa Múgica Murga share investment and dispositive power over the securities held of record by Seaya.The address of the foregoing named beneficial owners is Calle Alcala, numero 54, Madrid, Spain 28014. Ms. González Ordóñez is a member of our Board of Directors
|
| (9) |
Based solely on a Schedule 13G filed on February 9, 2022, Black Label Equity I SCR, S.A. and Alexandre Pierron-Darbonne have shared voting power and shared investment power over 9,110,175 Class A Shares. All investment and voting decisions with respect to the shares held by Black Label Equity I SCR SA are made by Mr. Alexandre Pierron Darbonne. The address of the foregoing named beneficial owners is Plaza de la Independencia 6, Madrid, Spain 28001.
|
| (10) |
Based solely on a Schedule 13G filed on March 9, 2022. AM Gestió, S.L. has sole voting power over 8,469,293 Class A Shares. The address of the foregoing named beneficial owner Rossello Street 224, 3. Barcelona, Spain 08008.
|
| (11) |
Based solely on a Schedule 13G filed on February 1, 2022, Cathay Innovation SAS has sole voting power and sole dispositive power over 8,732,888 Class A Shares. The address of the foregoing named beneficial owner is 52 Rue d’Anjou, Paris, France 75008.
|
| (12) |
Francisco Jose Rideras Mera is the Sole Administrator of Orilla Asset Management, S.L., which holds 4,278,142 Class A Shares. The address of Orilla Asset Management, S.L. is C/ Prolongacion De Embapadres, S/N 28053, Madrid, Spain. Investment and voting decisions with respect to the shares held by Orilla Asset Management are made by Francisco Jose Riberas Mera who has sole dispositive power over such shares.
|
| (13) |
On October 5, 2021, Enric Asunción Escorsa furnished a letter to Inversiones Financieras Perseo, S.L. Pursuant to such letter, Mr. Asunción agreed to take best efforts to support the election of Diego Dĺaz Pilas, or such other director as Perseo may designate, to the board of directors of Wallbox N.V. for so long as Perseo owns shares representing 3% of the share capital outstanding of Wallbox N.V.
|
To our knowledge, other than as provided in the table above, our other filings with the SEC, public disclosure and this Annual Report, there has been no significant change in the percentage ownership held by any major shareholder since January 1, 2017.
102
As of April 25, 2022, there were 138,245,139 of our Class A Shares outstanding. To our knowledge, 32,204,115 Class A Shares, representing approximately 23.29% of our total outstanding Class A Shares, were held by 49 record shareholders with registered addresses in the United States.
We are not aware of any arrangement that may at a subsequent date result in a change of control of Wallbox.
B. Related Party Transactions
The following includes, among other information, a description of related party transactions, as defined under Item 7.B of Form
20-F,
since January 1, 2021.
Shareholder Agreement
Certain executive officers, directors and 5% shareholders of Wallbox, including Enric Asunción Escorsa, Jordi Lainz, Eduard Castañeda, and affiliates of Eurofred Spain, S.L., Infisol 3000, S.L., Inversiones Financieras Perso, S.L., Seaya Ventures II, Fondo De Capital Riesgo, Black Label Equity I SCR SA and AM Gestió, S.L., were party to the Shareholder Agreement dated March 13, 2020. The Shareholder Agreement terminated concurrently with the closing of the Business Combination.
Loan with an affiliate of Eurofred Spain, S.L.
A loan was received from an affiliate of Eurofred Spain, S.L. in 2018 with an initial balance of €250,000 and a new loan received of €1 million in 2019. After that, part of the balance was compensated in several capital increases for €837,367 in 2019 and €364,233 in 2020. The remaining €48,400 is expected to be compensated as an additional capital increase. The loan bears an interest rate of 8%.
Loan with Wallbox-FAWSN
At December 31, 2021 the Group has loans of €1,250,921 (€474,174 at December 31,2020. These loans bear an interest rate of 5%. The group has booked an interest income of €60,709 (€0 in 2020). In addition, the outstanding trade receivables as of December 31, 2021 and 2020 amount €535,268 and €475,565 respectively.
Convertible Loan Financings
Convertible Loan Financing.
The table below sets forth the aggregate principal amount of convertible loans issued to our related parties:
|
Participants
|
Aggregate Principal
Amount |
|||
|
Greater than 5% Stockholders
(1)
|
||||
|
Infisol 3000, S.L.
|
€ | 4,650,000 | ||
|
Inversiones Financieras Perso, S.L.
|
€ | 11,000,000 | ||
|
Seaya Ventures II, Fondo De Capital Riesgo
|
€ | 7,000,000 | ||
|
Black Label Equity I SCR SA
|
€ | 4,000,000 | ||
|
AM Gestió, S.L.
|
€ | 3,300,000 | ||
|
Cathay Innovation SAS
|
€ | 13,000,000 | ||
| (1) |
Additional details regarding these stockholders and their equity holdings are provided in this Annual Report under the caption “
Major Shareholders and Related Party Transactions.
|
103
PIPE Financing
Eurofred Spain, S.L. and Infisol 3000, S.L. each agreed to purchase 412,500 and 287,500 Class A Shares in the PIPE Financing, respectively, AM Gestió, S.L. agreed to purchase 780,000 Class A Shares in the PIPE Financing and Cathay Innovation SAS agreed to purchase 1,220,000 Class A Shares in the PIPE Financing, in each case on the same terms as other PIPE Investors.
Iberdrola
Iberdrola S.A. (together with its affiliates, “Iberdrola”) is the indirect owner of 100% of the interests in Inversiones Financieras Perseo, S.L., a greater than 5% shareholder of Wallbox.
Iberdrola and Wallbox are in discussions regarding the entry into a long-term
on-site
Power Purchase Agreement to produce, consume and reuse energy from the production of a plant and its offices in Barcelona’s Zona Franca.
In June 4, 2021 the Group has entered into a contract with a subsidiary of Iberdrola group for the arrangement of offices in Barcelona. This contract has impacted in the financial statements as a Right of Use Asset totaling €4,848,142 at 31 December 2021 and lease liabilities totaling €5,055,498 at 31 December 2021
In July 2021, Iberdrola entered into letter of intent to purchase Supernova charging stations from Wallbox. The terms of this letter of intent, in which Iberdrola expressed its interest in purchasing 6,500 Supernova chargers through 2022 once the product has been tested and certified as necessary, are
non-binding.
The letter of intent has been filed as an exhibit to this Annual Report.
In the normal course of business, Wallbox enters into transactions and commercial arrangements with affiliates of Iberdrola, which in the aggregate accounted for €1.6 million and GBP 0.3 million in sales in the year ended December 31, 2020 and €3.2 million and GBP 0.7 million in sales from January 1 to December 31, 2021.
On September 27, 2021, Wallbox will entered into a Price Purchase Agreement (PPA on site) with Iberdrola Clientes, S.A.U. (“Iberdrola Clientes”), a Spanish limited liability company, as the seller, for the supply of renewable energy to meet the energy demand of the Group’s premises located in Pol´lgono Industrial Zona Franca Calle D, 26—08040 Barcelona, Spain (the “Premises”). To such end, Iberdrola Clientes will undertake to construct, install, commission and operate certain photovoltaic facilities (the “Facilities”). The Facilities will be considered a “selfconsumption” facility and hence, Iberdrola Clientes is entitled to market the excess of the energy generated by the Facilities to the extent the Group’s energy consumption needs have been covered first.
The agreement will have an initial term of fifteen (15) years, renewable for an additional period of ten (10) years. The price payable by the Group during the initial term will be 65.00 €/MWh and 20.00 €/MWh thereafter.
On October 5, 2021, Enric Asunción Escorsa furnished a letter to Inversiones Financieras Perseo, S.L. Pursuant to such letter, Mr. Asunción agreed to take best efforts to support the election of Diego Díaz Pilas, or such other director as Perseo may designate, for so long as Perseo owns shares representing 3% of the share capital outstanding of Wallbox N.V.
Remuneration Agreements with Wallbox Board Members and Senior Management
For a description of our remuneration agreements with members of the Board and senior management, see Item6. “
”.
Directors, Senior
Management and Employees—Compensation.
104
Indemnification
Wallbox’s Articles of Association provides for certain indemnification rights for Wallbox’s directors relating to claims, suits or proceedings arising from his or her service to Wallbox or, at Wallbox’s request, service to other entities, as directors or officers to the maximum extent permitted by Dutch law.
Review, Approval or Ratification of Transactions with Related Persons
While Wallbox does not yet have a formal written policy or procedure for the review, approval or ratification of related party transactions, the Wallbox Board intends to review and consider the interests of its directors, executive officers and principal shareholders in its review and consideration of transactions and intends to obtain the approval of
non-interested
directors when it determines that such approval is appropriate under the circumstances.
In addition to the conflict of interest rules included in the Wallbox Board Regulations, Wallbox adopted a Code of Ethics & Conduct that applies to all of its employees, officers and directors, including those officers responsible for financial reporting, relating to, inter alia, conflicts of interest and transactions that may result in a conflict of interest with Wallbox. Wallbox’s Code of Ethics & Conduct is available on its website. Wallbox intends to disclose any amendment to the code, or any waivers of its requirements, on its website to the extent required under applicable law, rules, regulations or stock exchange requirements.
C. Interests of Experts and Counsel
Not applicable.
|
Item 8.
|
Financial Information
|
Consolidated Statements and Other Financial Information
Consolidated financial statements
Refer to Item 18. “Financial statements” included elsewhere in this Annual Report.
Legal and Arbitration Proceedings
Wallbox is not party to any material legal proceedings. From time to time, Wallbox may be involved in legal proceedings or subject to claims incident to the ordinary course of business. Regardless of the outcome, such proceedings or claims can have an adverse impact on Wallbox because of defense and settlement costs, diversion of resources and other factors, and there can be no assurances that favorable outcomes will be obtained.
Dividend Policy
Wallbox has not paid any cash dividends on the Wallbox shares to date and does not intend to pay cash dividends. For the foreseeable future, we intend to retain all available funds and any future earnings to fund the development and expansion of our business. The payment of cash dividends in the future will be dependent upon Wallbox’s revenues and earnings, if any, capital requirements and general financial condition subsequent to completion of the Business Combination. Under Dutch law, Wallbox may only pay dividends to the extent Wallbox’s equity (
) exceeds the sum of its paid up and called up part of its issued capital and the reserves which must be maintained pursuant to the law and (if it concerns a distribution of profits) after adoption by the general meeting of the annual accounts from which it appears that such distribution is permitted. Subject to such restrictions, any future determination to pay dividends will be at the discretion of the Board. The Board may decide that all or part of the remaining profits shall be added to the reserves. After such reservation, any remaining profit will be at the disposal of the general meeting of Wallbox. The Board may resolve to make
eigen vermogen
105
interim distributions on Shares, subject to certain requirements, and with observance of (other) applicable statutory provisions, without the approval of the general meeting. However, Wallbox does not anticipate paying any dividends on the Wallbox shares for the foreseeable future.
We have not declared or paid dividends in the years ended December 31, 2019, 2020 and 2021.
Significant Changes
Please refer to Note 27,
, within our consolidated financial statements included elsewhere in this Annual Report for details regarding events subsequent to the reporting period.
“Events after the reporting period”
|
Item 9.
|
The Offer and Listing
|
A. Offer and Listing Details
Our Class A Shares commenced trading on the NYSE on October 4, 2021 under the symbol “WBX.” Our Warrants commenced trading on the NYSE on October 4, 2021 under the symbol “WBXWS.” Prior to this, no public market existed for our Class A Shares or our Warrants. Our Class B ordinary shares are not listed to trade on any securities market.
B. Plan of Distribution
Not applicable.
C. Markets
Our Class A Shares commenced trading on the NYSE on October 4, 2021 under the symbol “WBX.”
Our Warrants commenced trading on the NYSE on October 4, 2021 under the symbol “WBXWS.”
D. Selling Shareholders
Not applicable.
E. Dilution
Not applicable
F. Expenses of the Issue
Not applicable.
|
Item 10.
|
Additional Information
|
A. Share Capital
Not applicable.
B. Memorandum and Articles of Association
A copy of our Articles is incorporated by reference as Exhibit 1.1 to this Annual Report. The information called for by this Item is set forth in Exhibit 2.2 to this Annual Report and is incorporated by reference into this Annual Report.
106
C. Material Contracts
Except as otherwise disclosed in this Annual Report (including the Exhibits), we are not currently, nor have we been for the past two years, party to any material contract, other than contracts entered into in the ordinary course of business.
D. Exchange Controls
There are currently no Netherlands/Spanish exchange control regulations that would affect the import or export of capital or the remittance of dividends, interest or other payments to
non-resident
holders of our shares.
E Taxation United States Federal Income Taxation
The following discussion is a summary of the material U.S. federal income tax consequences to U.S. Holders and
Non-U.S.
Holders (each as defined below) of the purchase, ownership and disposition of Class A Shares and Warrants and does not purport to be a complete analysis of all potential tax effects. The effects of other U.S. federal tax laws, such as estate and gift tax laws, and any applicable state, local, or
non-U.S.
tax laws are not discussed. This discussion is based on the Code, Treasury regulations promulgated thereunder, judicial decisions, and published rulings and administrative pronouncements of the U.S. Internal Revenue Service (the “IRS”), in each case in effect as of the date hereof. These authorities may change or be subject to differing interpretations. Any such change or differing interpretation may be applied retroactively in a manner that could adversely affect a holder. We have not sought and will not seek any rulings from the IRS regarding the matters discussed below. There can be no assurance the IRS or a court will not take a contrary position to that discussed below regarding the tax consequences discussed below.
This discussion does not address all U.S. federal income tax consequences that may be relevant to a holder’s particular circumstances, including the impact of the Medicare contribution tax on net investment income. In addition, it does not address consequences relevant to holders subject to special rules, including, without limitation:
| • |
regulated investment companies (“RICs”) or real estate investment trusts (“REITs”);
|
| • |
brokers, dealers, or traders in securities;
|
| • |
tax-exempt
organizations or governmental organizations;
|
| • |
U.S. expatriates and former citizens or long-term residents of the United States;
|
| • |
persons subject to the alternative minimum tax;
|
| • |
persons holding Class A Shares and/or Warrants, as the case may be, as part of a hedge, straddle, constructive sale, or other risk reduction strategy or as part of a conversion transaction or other integrated investment;
|
| • |
banks, insurance companies, and other financial institutions;
|
| • |
persons subject to special tax accounting rules as a result of any item of gross income with respect to Class A Shares or Warrants being taken into account in an applicable financial statement;
|
| • |
persons that actually or constructively own 10% or more (by vote or value) of our common stock;
|
| • |
“controlled foreign corporations,” “passive foreign investment companies,” and corporations that accumulate earnings to avoid U.S. federal income tax;
|
| • |
S corporations, partnerships or other entities or arrangements treated as partnerships or other flow-through entities for U.S. federal income tax purposes (and investors therein);
|
| • |
U.S. Holders (as defined below) whose functional currency is not the U.S. dollar;
|
107
| • |
persons who hold or received Class A Shares and/or Warrants, as the case may be, pursuant to the exercise of any employee stock option or otherwise as compensation; and
|
| • |
tax-qualified
retirement plans.
|
If an entity or arrangement treated as a partnership for U.S. federal income tax purposes holds Class A Shares or Warrants, the tax treatment of a partner in the partnership will depend on the status of the partner, the activities of the partnership, and certain determinations made at the partner level. Accordingly, partnerships holding Class A Shares or Warrants and the partners in such partnerships should consult their tax advisors regarding the U.S. federal income tax consequences to them.
THIS DISCUSSION IS FOR INFORMATIONAL PURPOSES ONLY AND IS NOT TAX ADVICE. INVESTORS SHOULD CONSULT THEIR TAX ADVISORS WITH RESPECT TO THE APPLICATION OF THE U.S. FEDERAL INCOME TAX LAWS TO THEIR PARTICULAR SITUATIONS AS WELL AS ANY TAX CONSEQUENCES OF THE PURCHASE, OWNERSHIP, AND DISPOSITION OF THE CLASS A SHARES OR WARRANTS ARISING UNDER THE U.S. FEDERAL ESTATE OR GIFT TAX LAWS OR UNDER THE LAWS OF ANY STATE, LOCAL, OR
NON-U.S.
TAXING JURISDICTION OR UNDER ANY APPLICABLE INCOME TAX TREATY.
Definition of a U.S. Holder
For purposes of this discussion, a “U.S. Holder” is any beneficial owner of Class A Shares and/or Warrants, as the case may be, that is for U.S. federal income tax purposes:
| • |
an individual who is a citizen or resident of the United States;
|
| • |
a corporation (or other entity taxable as a corporation) created or organized under the laws of the United States, any state thereof, or the District of Columbia;
|
| • |
an estate, the income of which is subject to U.S. federal income tax regardless of its source; or
|
| • |
a trust that (1) is subject to the primary supervision of a U.S. court and the control of one or more “United States persons” (within the meaning of Section 7701(a)(30) of the Code), or (2) has a valid election in effect to be treated as a United States person for U.S. federal income tax purposes.
|
U.S. Holders
Distributions on Class A Shares
If Wallbox makes distributions of cash or property on the Class A Shares, the gross amount of such distributions (including any amount of foreign taxes withheld) will be treated for U.S. federal income tax purposes first as a dividend to the extent of Wallbox’s current or accumulated earnings and profits (as determined for U.S. federal income tax purposes), and then as a
tax-free
return of capital to the extent of the U.S. Holder’s tax basis, with any excess treated as capital gain from the sale or exchange of the shares. If Wallbox does not provide calculations of its earnings and profits under U.S. federal income tax principles, a U.S. Holder should expect all cash distributions to be reported as dividends for U.S. federal income tax purposes. Any dividend will not be eligible for the dividends received deduction allowed to corporations in respect of dividends received from U.S. corporations.
Subject to the discussion below under “–Passive Foreign Investment Company Rules,” dividends received by certain
non-corporate
U.S. Holders (including individuals) may be “qualified dividend income,” which is taxed at the lower applicable capital gains rate, provided that:
| • |
either (a) the shares are readily tradable on an established securities market in the United States, or (b) Wallbox is eligible for the benefits of a qualifying income tax treaty with the United States that includes an exchange of information program;
|
108
| • |
Wallbox is neither a PFIC (as discussed below under “ –Passive Foreign Investment Company Rules”) nor treated as such with respect to a U.S. Holder in Wallbox’s taxable year in which the dividend is paid or the preceding taxable year;
|
| • |
the U.S. Holder satisfies certain holding period requirements; and
|
| • |
the U.S. Holder is not under an obligation to make related payments with respect to positions in substantially similar or related property.
|
There can be no assurance that Wallbox will be eligible for the benefits of an applicable comprehensive income tax treaty. In addition, there also can be no assurance that ordinary shares will be considered “readily tradable” on an established securities market in the United States in accordance with applicable legal authorities. U.S. Holders should consult their own tax advisors regarding the availability of the lower rate for dividends paid with respect to Class A Shares. Subject to certain exceptions, dividends on Class A Shares will constitute foreign source income for foreign tax credit limitation purposes. If such dividends are qualified dividend income (as discussed above), the amount of the dividend taken into account for purposes of calculating the foreign tax credit limitation will be limited to the gross amount of the dividend, multiplied by a fraction, the numerator of which is the reduced rate applicable to qualified dividend income and the denominator of which is the highest rate of tax normally applicable to dividends. The limitation on foreign taxes eligible for credit is calculated separately with respect to specific classes of income. For this purpose, dividends distributed by Wallbox with respect to the Class A Shares generally will constitute “passive category income” but could, in the case of certain U.S. Holders, constitute “general category income.”
Sale, Exchange, Redemption or Other Taxable Disposition of Class A Shares and Warrants.
Subject to the discussion below under “—
,” a U.S. Holder generally will recognize gain or loss on any sale, exchange, redemption or other taxable disposition of Class A Shares or Warrants in an amount equal to the difference between (i) the amount realized on the disposition and (ii) such U.S. Holder’s adjusted tax basis in such Class A Shares and/or Warrants. Any gain or loss recognized by a U.S. Holder on a taxable disposition of Class A Shares or Warrants generally will be capital gain or loss. A
Passive Foreign Investment Company Rules
non-corporate
U.S. Holder, including an individual, who has held the Class A Shares and/or Warrants for more than one year generally will be eligible for reduced tax rates for such long-term capital gains. The deductibility of capital losses is subject to limitations.
Any such gain or loss recognized generally will be treated as U.S. source gain or loss. Accordingly, in the event any foreign tax (including withholding tax) is imposed upon such sale or other disposition, a U.S. Holder may not be able to utilize foreign tax credits unless such U.S. Holder has foreign source income or gain in the same category from other sources. Moreover, an applicable income tax treaty may impact a U.S. Holder’s ability to claim a foreign tax credit. U.S. Holders are urged to consult their own tax advisor regarding the ability to claim a foreign tax credit and the application of any applicable income tax treaty to such U.S. Holder’s particular circumstances.
Exercise or Lapse of Warrants
Except as discussed below with respect to the cashless exercise of Warrants, a U.S. Holder generally will not recognize gain or loss upon the acquisition of Class A Shares on the exercise of Warrants for cash. A U.S. Holder’s tax basis in Class A Shares received upon the exercise of Warrants generally should be an amount equal to the sum of the U.S. Holder’s tax basis in the Warrants exercised therefore and the exercise price. The U.S. Holder’s holding period for Class A Shares received upon the exercise of Warrants will begin on the date following the date of exercise (or possibly the date of exercise) of the Warrants and will not include the period during which the U.S. Holder held the Warrants. If Warrants are allowed to lapse unexercised, a U.S. Holder that has otherwise received no proceeds with respect to the Warrants generally will recognize a capital loss equal to such U.S. Holder’s tax basis in the Warrants.
109
The tax consequences of a cashless exercise of Warrants are not clear under current U.S. federal income tax law. A cashless exercise may be
tax-deferred,
either because the exercise is not a realization event or because the exercise is treated as a recapitalization for U.S. federal income tax purposes. In either situation, a U.S. Holder’s basis in the Class A Shares received would equal the U.S. Holder’s basis in the Warrants exercised, therefore. If the cashless exercise is not treated as a realization event, a U.S. Holder’s holding period in the Class A Shares would be treated as commencing on the date following the date of exercise (or possibly the date of exercise) of the Warrants. If the cashless exercise were treated as a recapitalization, the holding period of the Class A Shares would include the holding period of the Warrants exercised, therefore.
It is also possible that a cashless exercise of Warrants could be treated in part as a taxable exchange in which gain or loss would be recognized in the manner set forth above under “—
.” In such event, a U.S. Holder could be deemed to have surrendered Warrants equal to the number of Class A Shares having an aggregate fair market value equal to the exercise price for the total number of Warrants to be exercised. The U.S. Holder would recognize capital gain or loss in an amount generally equal to the difference between (i) the fair market value of the Warrants deemed surrendered and (ii) the U.S. Holder’s tax basis in such Warrants deemed surrendered. In this case, a U.S. Holder’s tax basis in the Class A Shares received would equal the sum of the U.S. Holder’s tax basis in the Warrants deemed exercised and the exercise price of such Warrants. A U.S. Holder’s holding period for the Class A Shares received in such case generally would begin on the date following the date of exercise (or possibly the date of exercise) of the Warrants.
Sale, Exchange, Redemption or Other Taxable Disposition of Class
A Shares and Warrants
Due to the absence of authority on the U.S. federal income tax treatment of a cashless exercise of the Warrants, there can be no assurance which, if any, of the alternative tax consequences and holding periods described above would be adopted by the IRS or a court of law. Accordingly, U.S. Holders should consult their own tax advisors regarding the tax consequences of a cashless exercise of Warrants.
Possible Constructive Distributions
The terms of each Warrant provide for an adjustment to the number of Class A Shares for which the Warrant may be exercised or to the exercise price of the Warrant in certain events. An adjustment which has the effect of preventing dilution generally is not taxable. A U.S. Holder of a Warrant would, however, be treated as receiving a constructive distribution from Wallbox if, for example, the adjustment increases the holder’s proportionate interest in Wallbox’s assets or earnings and profits (for instance, through an increase in the number of Class A Shares that would be obtained upon exercise of such Warrant) as a result of a distribution of cash or other property such as other securities to the holders of the Class A Shares which is taxable to the U.S. Holders of such shares as described under “—
” above. Such constructive distribution would be subject to tax as described under that section in the same manner as if the U.S. Holder of such Warrant received a cash distribution from Wallbox equal to the fair market value of such increased interest.
Distributions on Class
A Shares
Passive Foreign Investment Company Rules
Wallbox will be classified as a passive foreign investment company (a “PFIC”) for any taxable year if either: (a) at least 75% of its gross income is “passive income” for purposes of the PFIC rules or (b) at least 50% of the value of its assets (determined on the basis of a quarterly average) is attributable to assets that produce or are held for the production of passive income. For this purpose, Wallbox will be treated as owning its proportionate share of the assets and earning its proportionate share of the income of any other corporation in which it owns, directly or indirectly, 25% or more (by value) of the stock.
Under the PFIC rules, if Wallbox were considered a PFIC at any time that a U.S. Holder owns Class A Shares, Wallbox would continue to be treated as a PFIC with respect to such investment unless (i) Wallbox ceases to be a PFIC and (ii) such U.S. Holder makes a “deemed sale” election under the PFIC rules.
110
Based on the recent, current and anticipated composition of the income, assets and operations of Wallbox and its subsidiaries, Wallbox does not expect to be treated as a PFIC in the current taxable year or in future taxable years. This is a factual determination, however, that depends on, among other things, the composition of the income and assets, and the market value of the shares and assets, of Wallbox and its subsidiaries from time to time, and thus the determination can only be made annually after the close of each taxable year. Therefore there can be no assurances that Wallbox will not be classified as a PFIC for the current taxable year or for any future taxable year.
If Wallbox is considered a PFIC at any time that a U.S. Holder owns Class A Shares, any gain such U.S. Holder recognizes on a sale or other disposition of the Class A Shares, as well as the amount of any “excess distribution” (defined below) such U.S. Holder receives, would be allocated ratably over such U.S. Holder’s holding period for the Class A Shares. The amounts allocated to the taxable year of the sale or other disposition (or the taxable year of receipt, in the case of an excess distribution) and to any year before the company became a PFIC would be taxed as ordinary income. The amount allocated to each other taxable year would be subject to tax at the highest rate in effect for individuals or corporations, as appropriate, for that taxable year, and an interest charge would be imposed. For purposes of these rules, an excess distribution is the amount by which any distribution received by a U.S. Holder on Class A Shares exceeds 125% of the average of the annual distributions on the Class A Shares received during the preceding three years or the U.S. Holder’s holding period, whichever is shorter. Certain elections may be available that would result in alternative treatments (such as qualified electing fund treatment or
treatment) of the Class A Shares if Wallbox is considered a PFIC. Wallbox does not intend to provide the information necessary for U.S. Holders of Class A Shares to make qualified electing fund elections, which, if available, would result in tax treatment different from the general tax treatment for an investment in a PFIC described above. If Wallbox is treated as a PFIC with respect to a U.S. Holder for any taxable year, such U.S. Holder will be deemed to own shares in any of Wallbox’s subsidiaries that are also PFICs. However, an election for
treatment would likely not be available with respect to any such subsidiaries.
mark-to-market
mark-to-market
If Wallbox is considered a PFIC, a U.S. Holder would also be subject to annual information reporting requirements. Failure to comply with such information reporting requirements may result in significant penalties and may suspend the running of the statute of limitations. U.S. Holders should consult their tax advisors about the potential application of the PFIC rules to an investment in Class A Shares.
Non-U.S.
Holders
The section applies to
Non-U.S.
Holders of Class A Shares and Warrants. For purposes of this discussion, a
non-U.S.
Holder means a beneficial owner (other than a partnership or an entity or arrangement so characterized for U.S. federal income tax purposes) of Class A Shares or Warrants that is not a U.S. Holder, including:
| • |
a nonresident alien individual, other than certain former citizens and residents of the United States;
|
| • |
a foreign corporation; or
|
| • |
a foreign estate or trust.
|
U.S. Federal Income Tax Consequences of the Ownership and Disposition of Class A Shares and Warrants
Any (i) distributions of cash or property paid to a
non-U.S.
Holder in respect of Class A Shares or (ii) gain realized upon the sale or other taxable disposition of Class A Shares and/or Warrants generally will not be subject to U.S. federal income taxation unless:
| • |
the gain or distribution is effectively connected with the
Non-U.S.
Holder’s conduct of a trade or business within the United States (and, if required by an applicable income tax treaty, the
Non-U.S.
Holder maintains a permanent establishment in the United States to which such gain is attributable); or
|
111
| • |
in the case of any gain, the
non-U.S.
Holder is a nonresident alien individual present in the United States for 183 days or more during the taxable year of the disposition and certain other requirements are met.
|
Gain or distributions described in the first bullet point above generally will be subject to U.S. federal income tax on a net income basis at the regular rates. A
Non-U.S.
Holder that is a corporation also may be subject to a branch profits tax at a rate of 30% (or such lower rate specified by an applicable income tax treaty) on such effectively connected gain, as adjusted for certain items.
Gain described in the second bullet point above will be subject to U.S. federal income tax at a rate of 30% (or such lower rate specified by an applicable income tax treaty), which may be offset by U.S. source capital losses of the
Non-U.S.
Holder (even though the individual is not considered a resident of the United States), provided the
Non-U.S.
Holder has timely filed U.S. federal income tax returns with respect to such losses.
The U.S. federal income tax treatment of a
,” above, although to the extent a cashless exercise or lapse results in a taxable exchange, the consequences would be similar to those described in the preceding paragraphs above for a
Non-U.S.
Holder’s exercise of a Warrant, or the lapse of a Warrant held by a
Non-U.S.
Holder, generally will correspond to the U.S. federal income tax treatment of the exercise or lapse of a warrant by a U.S. Holder, as described under “—
U.S. Holders—Exercise or Lapse of Warrants
Non-U.S.
Holder’s gain on the sale or other disposition of Class A Shares and Warrants.
Non-U.S.
Holders should consult their own tax advisors regarding potentially applicable income tax treaties that may provide for different rules.
Information Reporting and Backup Withholding
Information reporting requirements may apply to distributions received by U.S. Holders of Class A Shares, and the proceeds received on sale or other taxable the disposition of Class A Shares or Warrants effected within the United States (and, in certain cases, outside the United States), in each case other than U.S. Holders that are exempt recipients (such as corporations). Backup withholding (currently at a rate of 24%) may apply to such amounts if the U.S. Holder fails to provide an accurate taxpayer identification number (generally on an IRS Form
W-9
provided to the paying agent of the U.S. Holder’s broker) or is otherwise subject to backup withholding.
Any distributions with respect to Class A Shares and proceeds from the sale, exchange, redemption or other disposition of Class A Shares or Warrants may be subject to information reporting to the IRS and possible U.S. backup withholding. U.S. Holders should consult their own tax advisors regarding the application of the U.S. information reporting and backup withholding rules.
Information returns may be filed with the IRS in connection with, and
or IRS Form
Non-U.S.
Holders may be subject to backup withholding on amounts received in respect of, a
Non-U.S.
Holder’s Class A Shares or Warrants, unless the
Non-U.S.
Holder furnishes to the applicable withholding agent the required certification as to its
non-U.S.
status, such as by providing a valid IRS Form
W-8BEN,
IRS Form
W-8BEN-E
W-8ECI,
as applicable, or the
Non-U.S.
Holder otherwise establishes an exemption. Distributions paid with respect to Class A Shares and proceeds from the sale of other disposition of Class A Shares or Warrants received in the United States by a
Non-U.S.
Holder through certain U.S.-related financial intermediaries may be subject to information reporting and backup withholding unless such
Non-U.S.
Holder provides proof an applicable exemption or complies with certain certification procedures described above, and otherwise complies with the applicable requirements of the backup withholding rules.
Backup withholding is not an additional tax. Amounts withheld as backup withholding generally may be credited against the taxpayer’s U.S. federal income tax liability, and a taxpayer may obtain a refund of any excess amounts withheld under the backup withholding rules by timely filing the appropriate claim for a refund with the IRS and furnishing any required information.
112
FATCA Withholding Taxes
Certain provisions of the Code and Treasury regulations (commonly collectively referred to as “FATCA”) generally impose withholding at a rate of 30% on “foreign passthru payments” made by a “foreign financial institution” (as defined in the Code) (an “FFI”). If Wallbox were to be treated as an FFI, such withholding may be imposed on such payments to any other FFI (including an intermediary through which an investor may hold Wallbox Class A Shares) that is not a “participating FFI” (as defined under FATCA) or any other investor who does not provide information sufficient to establish that the investor is not subject to withholding under FATCA, unless such other FFI or investor is otherwise exempt from FATCA. In addition, under those circumstances, Wallbox may be required to report certain information regarding investors to the relevant tax authorities, which information may be shared with taxing authorities in the United States. Under current guidance, the term “foreign passthru payment” is not defined. Consequently, it is not clear whether or to what extent payments on Wallbox Class A Shares would be considered foreign passthru payments. Withholding on foreign passthru payments would not be required with respect to payments made before the date that is two years after the date of publication in the Federal Register of final regulations defining the term “foreign passthru payment.” Prospective investors should consult their tax advisors regarding the potential impact of FATCA, any applicable inter-governmental agreement relating to FATCA, and any
non-U.S.
legislation implementing FATCA on an investment in Wallbox.
F. Dividends and Paying Agents
Not applicable.
G. Statement by Experts
Not applicable.
H. Documents on Display
We are required to make certain filings with the SEC. The SEC maintains an internet website that contains reports, proxy statements and other information about issuers, like us, that file electronically with the SEC. The address of that site is www.sec.gov.
We also make available on our website, free of charge, our annual reports on Form
. The information contained on our website is not incorporated by reference into this Annual Report.
20-F
and the text of our reports on Form
6-K,
including any amendments to these reports, as well as certain other SEC filings, as soon as reasonably practicable after they are electronically filed with or furnished to the SEC. Our website address is
investors.wallbox.com
References made in this Annual Report to any contract or certain other documents are not necessarily complete and you should refer to the exhibits attached or incorporated by reference into this Annual Report for copies of the actual contract or documents.
I. Subsidiary Information
Not applicable.
|
Item 11.
|
Quantitative and Qualitative Disclosures About Market Risk
|
Refer to Note 26, “
”, of our audited consolidated financial statements included elsewhere in this Annual Report for more information.
Financial Risk Management
113
Interest Rate Risk
We are exposed to Interest rate risk from possible losses due to changes in the fair value or the future cash flows of a financial instrument because of fluctuations in market interest rates. A hypothetical 10% change in interest rates would mean an increase (decrease) in profit or loss as of December 31, 2021 and 2020 by €691 and €85 thousand, respectively.
Foreign Currency Risk
We have foreign currency risks related to its revenue and operating expenses denominated in currencies other than the Euro, causing both its revenue and its operating results to be impacted by fluctuations in the exchange rates.
Gains or losses from the revaluation of certain cash balances, accounts receivable balances and intercompany balances that are denominated in these currencies impact our net loss. A hypothetical decrease in all foreign currencies against the Euro of 10% would not result in a material foreign currency loss on foreign-denominated balances, for the years ended December 31, 2021, 2020, and 2019 except for the USD currency (see Note 26.b “Currency risk”). As our global operations expand, its results may be more materially impacted by fluctuations in the exchange rates of the currencies in which it does business.
At this time, we do not enter into financial instruments to hedge its foreign currency exchange risk, but it may in the future.
Other Market Price Risk
We held €56,930 thousand of investments in funds as of December 31, 2021 and zero as of December 31, 2020, that have been measured at fair value through profit or loss (see Note 13). We also hold investments in funds measured at fair value through other comprehensive income (see Note 13) that amounted to €210 thousand and €239 thousand as of December 31, 2021, and 2020, respectively, and therefore the exposure is evaluated as not significant. Additionally, we have derivative warrant liabilities (see Note 13) that were subject to an adjustment of €69 million and put option liabilities (see note 6).
|
Item 12.
|
Description of Securities Other than Equity Securities
|
Not applicable.
114
Part II
|
Item 13.
|
Defaults, Dividend Arrearages and Delinquencies
|
None.
|
Item 14.
|
Material Modifications to the Rights of Security Holders and Use of Proceeds
|
The information required has been previously disclosed in our Report on Form
6-K,
dated October 1, 2021, which information is incorporated herein by reference.
|
Item 15.
|
Controls and Procedures
|
Disclosure Controls and Procedures
We maintain disclosure controls and procedures (as that term is defined in Rules
13a-15(e)
and
15d-15(e)
under the Exchange Act) that are designed to ensure that information required to be disclosed in our reports under the Exchange Act is recorded, processed, summarized and reported within the time periods specified in the SEC’s rules and forms and that such information is accumulated and communicated to our management, including our Chief Executive Officer and Chief Financial Officer, as appropriate, to allow for timely decisions regarding required disclosures. Any controls and procedures, no matter how well designed and operated, can provide only reasonable assurance of achieving the desired control objectives. Our management, with the participation of our Chief Executive Officer and Chief Financial Officer, has evaluated the effectiveness of the design and operation of our disclosure controls and procedures as of December 31, 2021. Based upon that evaluation, our Chief Executive Officer and Chief Financial Officer concluded that, as a result of the material weakness in our internal control over financial reporting described below, the design and operation of our disclosure controls and procedures were not effective as of December 31, 2021.
Remediation of Material Weaknesses
The Company is working on the remediation of the material weaknesses, some of the measures and decisions taken are:
| (i) |
insufficient personnel in the finance team with an appropriate level of knowledge and experience in the application of International Financial Reporting Standards as issued by the IASB, relating to both complex accounting transactions, such as accounting for the Transaction and related listing expenses, share-based payments and also in the application of other IFRS matters such as goodwill impairment testing and purchase price allocation
|
New hirings took place at end of 2021 and during first quarter 2022 in the Finance Department to incorporate new knowledge in the Consolidation and IFRS area.
| (ii) |
IT general controls have not been sufficiently designed or were not operating effectively.
|
A Head of IT has been hired and we are working with external advisors to implement new procedures and ITGC controls. We expect to have all ITGC controls fully implemented by end 2022.
| (iii) |
policies and procedures with respect to the review, supervision and monitoring of the accounting and reporting functions were not operating effectively in some areas.
|
We have acquired and are implementing a new Saas tool to ensure the proper monitoring and supervision of the accounting and reporting procedures. In addition we are hiring more personnel in the Finance and Controlling areas.
To address the material weaknesses, the Company has undertaking remediation efforts that include:
| (i) |
To address insufficient personnel in the finance team with an appropriate level of knowledge and experience in the application of International Financial Reporting Standards as issued by the IASB,
|
115
| relating to both complex accounting transactions, such as accounting for the Transaction and related listing expenses, share-based payments and also in the application of other IFRS matters such as goodwill impairment testing and purchase price allocation, we hired personnel for the Finance Department at end of 2021 and during first quarter 2022 to incorporate new knowledge in the Consolidation and IFRS area. |
| (ii) |
To address IT general controls not being sufficiently designed or were not operating effectively, we hired a Head of IT and is working with external advisors to implement new procedures and ITGC controls. We expect to have all ITGC controls fully implemented by end 2022.
|
| (iii) |
To address policies and procedures with respect to the review, supervision and monitoring of the accounting and reporting functions were not operating effectively in some areas, we have acquired and are implementing a new Saas tool to ensure the proper monitoring and supervision of the accounting and reporting procedures. In addition, we are hiring more personnel in the Finance and Controlling areas.
|
The material weaknesses resulted in a number of significant adjustments in our financial statements or disclosures. Based on additional procedures and post-closing review, management concluded that the consolidated financial statements included in this report present fairly, in all material respects, our financial position, results of operations, and cash flows for the periods presented, in conformity with generally accounting principles under IFRS.
Management’s Annual Report on Internal Control over Financial Reporting
This Annual Report does not include a report of management’s assessment regarding internal control over financial reporting due to a transition period established by rules of the Securities and Exchange Commission for newly public companies.
Attestation Report of Independent Registered Public Accounting Firm
This Annual Report does not include an attestation report of the company’s registered public accounting firm due to an exemption by the JOBS act for “Emerging Companies”.
Changes in Internal Control over Financial Reporting
Except for the remediation efforts described above, being taken to address the material weaknesses, during the year ended December 31, 2021, there were no other changes in our internal control over financial reporting that occurred during the period covered by this Annual Report that have materially affected, or are reasonably likely to materially affect, our internal control over financial reporting.
|
Item 16.
|
[Reserved]
|
|
Item 16A.
|
Audit Committee Financial Expert
|
Our Board of Directors has determined that Pol Soler, Francisco Riberas and Beatriz González Ordóñez each satisfies the “independence” requirements set forth in Rule
10A-3
under the Exchange Act. Our Board of Directors has also determined that Beatriz González Ordóñez is considered an “audit committee financial expert” as defined in Item 16A of
Form 20-F
under the Exchange Act.
|
Item 16B.
|
Code of Ethics
|
Wallbox adopted a Code of Ethics & Conduct that applies to all of its employees, officers and directors, including those officers responsible for financial reporting. Wallbox’s Code of Ethics & Conduct is available on our website. Wallbox intends to disclose any amendment to the code, or any waivers of its requirements, on its
116
website to the extent required under applicable law, rules, regulations or stock exchange requirements. The information contained on our website is not incorporated by reference in this Annual Report. We granted no waivers under our Code of Business Conduct and Ethics in 2021.
|
Item 16C.
|
Principal Accountant Fees and Services
|
BDO Bedrijfsrevisoren BV (“BDO”) acted as the independent registered public accounting firm of Wall Box Chargers, S.L. and the Company for the fiscal years ended December 31, 2021 and 2020. The table below sets out the total amount incurred, for services performed in the years ended December 31, 2021 and 2020, and breaks down these amounts by category of service:
|
2021
|
2020
|
|||||||
|
(in thousands EUR)
|
||||||||
|
Audit Services
|
1,337 | 0 | ||||||
|
Other services
|
1 | 0 | ||||||
|
Tax Services
|
0 | 0 | ||||||
|
|
|
|
|
|||||
|
Total
|
1,338 | 0 | ||||||
|
|
|
|
|
|||||
Audit Services
Audit fees of 2021 for the years ended December 31, 2021 and 2020 were related to the audit of our consolidated financial statements and interim review services provided in connection with regulatory filings or engagements. There were no services performed by BDO or BDO Member Firms in 2020.
Other Services
Other fees in the year ended December 31, 2021 were related to assurance services in connection with
non-financial
information.
Tax Services
No tax services for the years ended December 31, 2021 and 2020 have been performed
Pre-Approval
Policies and Procedures
Pre-Approval
Policies and Procedures
The advance approval of the Audit Committee or members thereof, to whom approval authority has been delegated, is required for all audit and
non-audit
services provided by our auditors.
All services provided by our auditors are approved in advance by either the Audit Committee or members thereof, to whom authority has been delegated, in accordance with the Audit Committee’s
pre-approval
policy.
|
Item 16D.
|
Exemptions from the Listing Standards for Audit Committees
|
Not applicable.
|
Item 16E.
|
Purchases of Equity Securities by the Issuer and Affiliated Purchasers
|
None.
|
Item 16F.
|
Change in Registrant’s Certifying Accountant
|
None.
117
|
Item 16G.
|
Corporate Governance
|
We are a “foreign private issuer” (as such term is defined in Rule 3b–4 under the Exchange Act), and our Class A Shares are listed on the NYSE. We believe the following to be the significant differences between our corporate governance practices and those applicable to U.S. companies under the NYSE listing standards. Under the NYSE rules, NYSE-listed companies that are foreign private issuers are permitted to follow home country practice
in-lieu
of the corporate governance provisions specified by the NYSE, with limited exceptions. Accordingly, we follow certain corporate governance practices of our home country, the Netherlands,
in-lieu
of certain of the corporate governance requirements of the NYSE. In addition, under the NYSE rules, listed companies of which more than 50% of the voting power for the election of Directors is held by an individual, group or other entity are not required to have a majority of independent Directors, as defined by NYSE rules, or to comply with certain other requirements. Because Enric Asunción Escorsa beneficially owns more than 50% of our voting power, we are a “controlled company” within the meaning of the rules of the NYSE.
Under the NYSE rules, U.S. domestic listed,
non-controlled
companies are required to have a majority independent board, which is not required under the DGCG of the Netherlands, our home country. In addition, the NYSE rules require U.S. domestic listed,
non-controlled
companies to have a Compensation Committee and a Nominating and Corporate Governance Committee, each composed entirely of independent Directors, which are not required under our home country laws.
We currently follow and intend to continue to follow the foregoing governance practices and not avail ourselves of the exemptions afforded to foreign private issuers or controlled companies under the NYSE rules. We may in the future, however, decide to use other foreign private issuer exemptions with respect to some or all of the other NYSE listing requirements. Following our home country governance practices may provide less protection than is accorded to investors under the NYSE listing requirements applicable to domestic issuers.
The NYSE also requires that a listed company obtain, in specified circumstances, (1) shareholder approval to adopt or materially revise equity compensation plans, as well as (2) shareholder approval prior to an issuance (a) of more than 1% of its common stock (including derivative securities thereof) in either number or voting power to related parties, (b) of more than 20% of its outstanding common stock (including derivative securities thereof) in either number or voting power or (c) that would result in a change of control, none of which require shareholder approval under the laws of the Netherlands. We intend to follow home country law in determining whether shareholder approval is required.
Due to our status as a foreign private issuer and our intent to follow certain home country corporate governance practices, our shareholders do not have the same protections afforded to shareholders of companies that are subject to all the NYSE corporate governance standards and shareholder approval requirements.
For more information on our corporate governance practices, see Item 6. “
Directors, Senior Management, and Employees – Board Practices— Corporate Governance Practices.”
|
Item 16H.
|
Mine Safety Disclosure
|
Not applicable.
|
Item 16I.
|
Disclosure Regarding Foreign Jurisdictions that Prevent Inspections
|
Not applicable.
118
Part III
|
Item 17.
|
Financial Statements
|
We have provided consolidated financial statements pursuant to Item 18.
|
Item 18.
|
Financial Statements
|
The audited consolidated financial statements as required under Item 18 are attached hereto starting on
page F-1
of this Annual Report. The audit report of BDO Bedrijfsrevisoren BV, Zaventem, Belgium, PCAOB ID: 1432, an independent registered public accounting firm, is included herein preceding the audited consolidated financial statements.
|
Item 19.
|
Exhibits
|
119
|
Exhibit
No. |
Description
|
Form
|
File No.
|
Exhibit
No. |
Filing Date
|
Filed/
Furnished
|
||||||||||||
| 8.1 | List of Subsidiaries |
F-1
|
333-260652
|
21.1 | 11/01/2021 | |||||||||||||
| 12.1 | Principal Executive Officer Certification Pursuant to Section 302 of the Sarbanes-Oxley Act of 2002 | * | ||||||||||||||||
| 12.2 | Principal Financial Officer Certification Pursuant to Section 302 of the Sarbanes-Oxley Act of 2002 | * | ||||||||||||||||
| 13.1 | Principal Executive Officer Certification Pursuant to Section 906 of the Sarbanes-Oxley Act of 2002 | ** | ||||||||||||||||
| 13.2 | Principal Financial Officer Certification Pursuant to Section 906 of the Sarbanes-Oxley Act of 2002 | ** | ||||||||||||||||
| 15.1 | Consent of BDO Bedrijfsrevisoren BV | * | ||||||||||||||||
| 101.INS | Inline XBRL Instance Document | * | ||||||||||||||||
| 101.SCH | Incline XBRL Taxonomy Extension Schema Document | * | ||||||||||||||||
| 101.CAL | Inline XBRL Taxonomy Extension Calculation Linkbase Document | * | ||||||||||||||||
| 101.DEF | Inline XBRL Taxonomy Definition Linkbase Document | * | ||||||||||||||||
| 101.LAB | Inline XBRL Taxonomy Extension Label Linkbase Document | * | ||||||||||||||||
| 101.PRE | Inline XBRL Taxonomy Extension Presentation Linkbase Document | * | ||||||||||||||||
| 104 |
Inline XBRL for the cover page of this Annual Report on Form
20-F,
included in the Exhibit 101 Inline XBRL Document Set
|
* | ||||||||||||||||
| * |
Filed herewith.
|
| ** |
Furnished herewith.
|
| † |
This document has been identified as a management contract or compensatory plan or arrangement.
|
Certain agreements filed as exhibits to this Annual Report contain representations and warranties that the parties thereto made to each other. These representations and warranties have been made solely for the benefit of the other parties to such agreements and may have been qualified by certain information that has been disclosed to the other parties to such agreements and that may not be reflected in such agreements. In addition, these representations and warranties may be intended as a way of allocating risks among parties if the statements contained therein prove to be incorrect, rather than as actual statements of fact. Accordingly, there can be no reliance on any such representations and warranties as characterizations of the actual state of facts. Moreover, information concerning the subject matter of any such representations and warranties may have changed since the date of such agreements.
120
SIGNATURES
The registrant hereby certifies that it meets all of the requirements for filing on Form
20-F
and that it has duly caused and authorized the undersigned to sign this annual report on its behalf.
|
Wallbox N.V.
|
||||
| Date: April 29, 2022 | By: | /s/ Enric Asunción Escorsa | ||
| Enric Asunción Escorsa | ||||
| Chief Executive Officer | ||||
121
WALLBOX N.V.
Index to consolidated Financial Statements
|
|
|
F-2
|
|
|
|
|
|
F-3
|
|
|
|
|
|
F-4
|
|
|
|
|
|
F-5
|
|
|
|
|
|
F-6
|
|
|
|
|
|
F-8
|
|
F-1
Report of Independent Registered Public Accounting Firm
Shareholders and Board of Directors
Wallbox N.V.
Barcelona, Spain
Opinion on the Consolidated Financial Statements
We have audited the accompanying consolidated statements of financial position of Wallbox N.V. (the “Company”) as of December 31, 2021 and 2020, the related consolidated statements of profit or loss and other comprehensive income, changes in equity, and cash flows for each of three years in the period ended December 31, 2021, and the related notes (collectively referred to as the “consolidated financial statements”). In our opinion, the consolidated financial statements present fairly, in all material respects, the financial position of the Company at December 31, 2021 and 2020, and the results of its operations and its cash flows for each of the three years in the period ended December 31, 2021
in conformity with International Financial Reporting Standards as issued by the International Accounting Standards Boards.
,
Basis for Opinion
These consolidated financial statements are the responsibility of the Company’s management. Our responsibility is to express an opinion on the Company’s consolidated financial statements based on our audits. We are a public accounting firm registered with the Public Company Accounting Oversight Board (United States) (“PCAOB”) and are required to be independent with respect to the Company in accordance with the U.S. federal securities laws and the applicable rules and regulations of the Securities and Exchange Commission and the PCAOB.
We conducted our audits in accordance with the standards of the PCAOB. Those standards require that we plan and perform the audit to obtain reasonable assurance about whether the consolidated financial statements are free of material misstatement, whether due to error or fraud.
Our audits included performing procedures to assess the risks of material misstatement of the consolidated financial statements, whether due to error or fraud, and performing procedures that respond to those risks. Such procedures included examining, on a test basis, evidence regarding the amounts and disclosures in the consolidated financial statements. Our audits also included evaluating the accounting principles used and significant estimates made by management, as well as evaluating the overall presentation of the consolidated financial statements. We believe that our audits provide a reasonable basis for our opinion.
/s/ BDO Bedrijfsrevisoren BV
We have served as the Company’s auditor since 2021.
April
29
, 2022
F-2
WALLBOX N.V.
CONSOLIDATED STATEMENTS OF FINANCIAL POSITION AS AT 31 DECEMBER 2021 AND 2020
|
(In Euros)
|
|
Notes
|
|
31 December
2021 |
|
|
31 December
2020 (*) |
|
||
|
Assets
|
|
|
|
|||||||
|
Non-Current
Assets
|
|
|
|
|||||||
|
Property, plant and equipment
|
|
8
|
|
|
|
|
|
|
|
|
|
Right-of-use
|
|
9
|
|
|
|
|
|
|
|
|
|
Intangible assets
|
|
10 a)
|
|
|
|
|
|
|
|
|
|
Goodwill
|
|
10 b) and 11
|
|
|
|
|
|
|
|
|
|
Non-current
financial assets
|
|
13
|
|
|
|
|
|
|
|
|
|
Tax credit receivables
|
|
24
|
|
|
|
|
|
|
|
|
|
|
|
|
|
|
|
|
|
|
||
|
Total
Non-Current
Assets
|
|
|
|
|
|
|
|
|
|
|
|
Current Assets
|
|
|
|
|||||||
|
Inventories
|
|
14
|
|
|
|
|
|
|
|
|
|
Trade and other financial receivables
|
|
13
|
|
|
|
|
|
|
|
|
|
Other receivables
|
|
24
|
|
|
|
|
|
|
|
|
|
Other current financial assets
|
|
13
|
|
|
|
|
|
|
|
|
|
Other current assets / deferred charges
|
|
20
|
|
|
|
|
|
|
—
|
|
|
Advance payments
|
|
14
|
|
|
|
|
|
|
|
|
|
Cash and cash equivalents
|
|
13 and 15
|
|
|
|
|
|
|
|
|
|
|
|
|
|
|
|
|
|
|
||
|
Total Current Assets
|
|
|
|
|
|
|
|
|
|
|
|
|
|
|
|
|
|
|
|
|
||
|
Total Assets
|
|
|
|
|
|
|
|
|
|
|
|
|
|
|
|
|
|
|
|
|
||
|
Equity and Liabilities
|
|
|
|
|||||||
|
Equity
|
|
|
|
|||||||
|
Share capital
|
|
16
|
|
|
|
|
|
|
|
|
|
Share premium
|
|
16
|
|
|
|
|
|
|
|
|
|
Accumulated deficit
|
|
16
|
|
|
(
|
)
|
|
|
(
|
)
|
|
Other equity components
|
|
16
|
|
|
|
|
|
|
|
|
|
Foreign currency translation reserve
|
|
16
|
|
|
|
|
|
|
|
|
|
|
|
|
|
|
|
|
|
|
||
|
Total Equity attributable to owners of the Company
|
|
|
|
|
|
|
|
|
|
|
|
Liabilities
|
|
|
|
|||||||
|
Non-Current
Liabilities
|
|
|
|
|||||||
|
Loans and borrowings
|
|
13
|
|
|
|
|
|
|
|
|
|
Convertible bonds
|
|
13
|
|
|
—
|
|
|
|
|
|
|
Lease liabilities
|
|
9 and 13
|
|
|
|
|
|
|
|
|
|
Put option liabilities
|
|
6 and 13
|
|
|
|
|
|
|
|
|
|
Provisions
|
|
17
|
|
|
|
|
|
|
|
|
|
Government
grants
|
|
18
|
|
|
|
|
|
|
—
|
|
|
Deferred tax liabilities
|
|
24
|
|
|
|
|
|
|
|
|
|
|
|
|
|
|
|
|
|
|
||
|
Total
Non-Current
Liabilities
|
|
|
|
|
|
|
|
|
|
|
|
Current Liabilities
|
|
|
|
|||||||
|
Loans and borrowings
|
|
13
|
|
|
|
|
|
|
|
|
|
Derivative warrant liabilities
|
|
13
|
|
|
|
|
|
|
—
|
|
|
Lease liabilities
|
|
9 and 13
|
|
|
|
|
|
|
|
|
|
Trade and other financial payables
|
|
13
|
|
|
|
|
|
|
|
|
|
Other payables
|
|
24
|
|
|
|
|
|
|
|
|
|
Provisions
|
|
17
|
|
|
|
|
|
|
—
|
|
|
Government
grants
|
|
18
|
|
|
|
|
|
|
—
|
|
|
Contract liabilities
|
|
|
|
|
|
|
|
|
|
|
|
|
|
|
|
|
|
|
|
|
||
|
Total Current Liabilities
|
|
|
|
|
|
|
|
|
|
|
|
|
|
|
|
|
|
|
|
|
||
|
Total Liabilities
|
|
|
|
|
|
|
|
|
|
|
|
|
|
|
|
|
|
|
|
|
||
|
Total Equity and Liabilities
|
|
|
|
|
|
|
|
|
|
|
|
(*)
|
Restated amounts. Certain amounts included in the consolidated statements of financial position at 31 December 2020 do not correspond to those included in the consolidated financial statements of Wallbox Chargers S.L. for the year ended 31 December 2020, and reflect the adjustments described in Note 2.
|
The notes form an integral part of these
consolidated
financial statements.
F-
3
WALLBOX N.V.
CONSOLIDATED STATEMENTS OF PROFIT OR LOSS AND OTHER COMPREHENSIVE INCOME FOR THE YEARS ENDED 31 DECEMBER 2021, 2020 AND 2019
|
(In Euros)
|
Notes
|
31 December
2021 |
31 December
2020
(*)
|
31 December
2019
(*)
|
||||||||||||
|
Revenue
|
19 |
|
|
|
||||||||||||
|
Changes in inventories and raw materials and consumables used
|
20 |
(
|
) |
(
|
) |
(
|
) | |||||||||
|
Employee benefits
|
21 |
(
|
) |
(
|
) |
(
|
) | |||||||||
|
Other operating expenses
|
20 |
(
|
) |
(
|
) |
(
|
) | |||||||||
|
Amortization and depreciation
|
8, 9 and 10 |
(
|
) |
(
|
) |
(
|
) | |||||||||
|
Net other income
|
|
|
|
|||||||||||||
|
|
|
|
|
|
|
|||||||||||
|
Operating Loss
|
|
(
|
)
|
|
(
|
)
|
|
(
|
)
|
|||||||
|
Financial income
|
22 |
|
|
|
||||||||||||
|
Financial expenses
|
22 |
(
|
) |
(
|
) |
(
|
) | |||||||||
|
Change in fair value of derivative warrant liabilities
|
22 |
(
|
) | — | — | |||||||||||
|
Share listing expense
|
6
|
(
|
) | — | — | |||||||||||
|
Foreign exchange gains/(losses)
|
22 |
|
(
|
) |
(
|
) | ||||||||||
|
|
|
|
|
|
|
|||||||||||
|
Net
Financial
Loss
|
|
(
|
)
|
|
(
|
)
|
|
(
|
)
|
|||||||
|
Share of loss of equity-accounted investees
|
12 | — |
(
|
) |
(
|
) | ||||||||||
|
|
|
|
|
|
|
|||||||||||
|
Loss before Tax
|
|
(
|
)
|
|
(
|
)
|
|
(
|
)
|
|||||||
|
Income tax credit
|
24 |
|
|
— | ||||||||||||
|
|
|
|
|
|
|
|||||||||||
|
Loss for the Year
|
23 |
|
(
|
)
|
|
(
|
)
|
|
(
|
)
|
||||||
|
Earnings per
S
hare
|
||||||||||||||||
|
Basic and diluted losses per share
(euros per share)
|
23 |
|
(
|
)
|
|
(
|
)
|
|
(
|
)
|
||||||
|
|
|
|
|
|
|
|||||||||||
|
Loss for the Year
|
|
(
|
)
|
|
(
|
)
|
|
(
|
)
|
|||||||
|
Other comprehensive income/(loss)
|
||||||||||||||||
|
Other comprehensive income/(loss) that may be reclassified to profit or loss in subsequent periods
|
||||||||||||||||
|
Currency translation differences in foreign operations, net of tax
|
|
|
(
|
) | ||||||||||||
|
Changes in the fair value of debt instruments at fair value through other comprehensive income, net of tax
|
(
|
) |
|
|
||||||||||||
|
|
|
|
|
|
|
|||||||||||
|
Net other comprehensive income/(loss) that may be reclassified to profit or loss in subsequent periods
|
|
|
|
|
|
|
|
(
|
)
|
|||||||
|
|
|
|
|
|
|
|||||||||||
|
Other comprehensive income/(loss) for the year
|
|
|
|
|
|
|
|
(
|
)
|
|||||||
|
|
|
|
|
|
|
|||||||||||
|
Total comprehensive loss for the year
|
|
(
|
)
|
|
(
|
)
|
|
(
|
)
|
|||||||
|
|
|
|
|
|
|
|||||||||||
|
(*)
|
The amounts included in the consolidated statements of profit or loss and other comprehensive income for the year ended 31 December 2020 and 2019 have not been restated, with the exception of EPS, please see note 6.
|
The notes form an integral part of these consolidated financial statements.
F-
4
WALLBOX N.V.
CONSOLIDATED STATEMENTS OF CHANGES IN EQUITY FOR THE YEARS ENDED 31 DECEMBER 2021, 2020 AND 2019
|
|
|
|
|
Attributable to owners of the Company
|
||||||||||||||||||||||
|
(In Euros)
|
|
Notes
|
|
Share
capital |
|
|
Share
premium |
|
|
Accumulated
deficit |
|
|
Other
equity components |
|
|
Foreign
currency translation reserve |
|
|
Total equity
|
|
||||||
|
Balance at 1 January 2019
|
|
|
|
|
|
|
|
|
|
|
|
|
(
|
)
|
|
|
—
|
|
|
|
|
|
|
|
|
|
|
|
|
|
|
|
|
|
|
|
|
|
||||||||||||||||
|
Total comprehensive income/(loss) for the year
|
|
|
|
|
|
|
|
|
|
|
|
|
|
|
|
|
|
|
|
|
|
|
|
|
|
|
|
Loss for the year
|
|
|
|
|
—
|
|
|
|
—
|
|
|
|
(
|
)
|
|
|
—
|
|
|
|
—
|
|
|
|
(
|
)
|
|
Other Comprehensive income/(loss) for the year
|
|
|
|
|
—
|
|
|
|
—
|
|
|
|
—
|
|
|
|
|
|
|
|
(
|
)
|
|
|
(
|
)
|
|
|
|
|
|
|
|
|
|
|
|
|
||||||||||||||||
|
Total comprehensive income for the year
|
|
|
|
|
—
|
|
|
|
—
|
|
|
|
(
|
)
|
|
|
|
|
|
|
(
|
)
|
|
|
(
|
)
|
|
Transactions with owners of the Company
|
|
|
|
|
|
|
|
|
|
|
|
|
|
|
|
|
|
|
|
|
|
|
|
|
|
|
|
Contributions of equity
|
|
|
16
|
|
|
|
|
|
|
|
|
|
—
|
|
|
|
—
|
|
|
|
—
|
|
|
|
|
|
|
Share based payments
|
|
|
21
|
|
—
|
|
|
|
—
|
|
|
|
—
|
|
|
|
|
|
|
|
—
|
|
|
|
|
|
|
|
|
|
|
|
|
|
|
|
|
|
||||||||||||||||
|
Total contributions and distributions
|
|
|
|
|
|
|
|
|
|
|
|
|
—
|
|
|
|
|
|
|
|
—
|
|
|
|
|
|
|
|
|
|
|
|
|
|
|
|
|
|
||||||||||||||||
|
Total transactions with owners of the Company
|
|
|
|
|
|
|
|
|
|
|
|
|
(
|
)
|
|
|
|
|
|
|
(
|
)
|
|
|
|
|
|
|
|
|
|
|
|
|
|
|
|
|
||||||||||||||||
|
Balance at 31 December 2019
|
|
|
|
|
|
|
|
|
|
|
|
|
(
|
)
|
|
|
|
|
|
|
(
|
)
|
|
|
|
|
|
|
|
|
|
|
|
|
|
|
|
|
||||||||||||||||
|
Total comprehensive income/(loss) for the year
|
|
|
|
|
|
|
|
|
|
|
|
|
|
|
|
|
|
|
|
|
|
|
|
|
|
|
|
Loss for the year
|
|
|
|
|
—
|
|
|
|
—
|
|
|
|
(
|
)
|
|
|
—
|
|
|
|
—
|
|
|
|
(
|
)
|
|
Other Comprehensive income/(loss) for the year
|
|
|
|
|
—
|
|
|
|
—
|
|
|
|
—
|
|
|
|
|
|
|
|
|
|
|
|
|
|
|
|
|
|
|
|
|
|
|
|
|
|
||||||||||||||||
|
Total comprehensive income for the year
|
|
|
|
|
—
|
|
|
|
—
|
|
|
|
(
|
)
|
|
|
|
|
|
|
|
|
|
|
(
|
)
|
|
Transactions with owners of the Company
|
|
|
|
|
|
|
|
|
|
|
|
|
|
|
|
|
|
|
|
|
|
|
|
|
|
|
|
Contributions of equity
|
|
|
16
|
|
|
|
|
|
|
|
|
|
—
|
|
|
|
—
|
|
|
|
—
|
|
|
|
|
|
|
Share based payments
|
|
|
21
|
|
—
|
|
|
|
—
|
|
|
|
—
|
|
|
|
|
|
|
|
—
|
|
|
|
|
|
|
|
|
|
|
|
|
|
|
|
|
|
||||||||||||||||
|
Total contributions and distributions
|
|
|
|
|
|
|
|
|
|
|
|
|
—
|
|
|
|
|
|
|
|
—
|
|
|
|
|
|
|
|
|
|
|
|
|
|
|
|
|
|
||||||||||||||||
|
Total transactions with owners of the Company
|
|
|
|
|
|
|
|
|
|
|
|
|
(
|
)
|
|
|
|
|
|
|
|
|
|
|
|
|
|
|
|
|
|
|
|
|
|
|
|
|
||||||||||||||||
|
Balance at 31 December 2020
|
|
|
|
|
|
|
|
|
|
|
|
|
(
|
)
|
|
|
|
|
|
|
|
|
|
|
|
|
|
|
|
|
|
|
|
|
|
|
|
|
||||||||||||||||
|
Total comprehensive income/(loss) for the year
|
|
|
|
|
|
|
|
|
|
|
|
|
|
|
|
|
|
|
|
|
|
|
|
|
|
|
|
Loss for the year
|
|
|
|
|
—
|
|
|
|
—
|
|
|
|
(
|
)
|
|
|
—
|
|
|
|
—
|
|
|
|
(
|
)
|
|
Other Comprehensive income/(loss) for the year
|
|
|
|
|
—
|
|
|
|
—
|
|
|
|
—
|
|
|
|
(
|
)
|
|
|
|
|
|
|
|
|
|
|
|
|
|
|
|
|
|
|
|
|
||||||||||||||||
|
Total comprehensive income for the year
|
|
|
|
|
—
|
|
|
|
—
|
|
|
|
(
|
)
|
|
|
(
|
)
|
|
|
|
|
|
|
(
|
)
|
|
Transactions with owners of the Company
|
|
|
|
|
|
|
|
|
|
|
|
|
|
|
|
|
|
|
|
|
|
|
|
|
|
|
|
Contributions of equity (PIPE financing)
|
|
|
16
|
|
|
|
|
|
|
|
|
|
—
|
|
|
|
—
|
|
|
|
—
|
|
|
|
|
|
|
Contributions of equity (Kensington shareholders)
|
|
|
16
|
|
|
|
|
|
|
|
|
|
—
|
|
|
|
—
|
|
|
|
—
|
|
|
|
|
|
|
Contributions of equity (Wall Box Chargers shareholders)
|
|
|
16
|
|
|
|
|
|
(
|
)
|
|
|
—
|
|
|
|
—
|
|
|
|
—
|
|
|
|
—
|
|
|
Contributions of equity (
Convertible bonds and other
|
|
|
16
|
|
|
|
|
|
|
|
|
|
—
|
|
|
|
—
|
|
|
|
—
|
|
|
|
|
|
|
Issuance costs
|
|
|
16
|
|
—
|
|
|
|
(
|
)
|
|
|
—
|
|
|
|
—
|
|
|
|
—
|
|
|
|
(
|
|
|
Share based payments
|
|
|
21
|
|
—
|
|
|
|
—
|
|
|
|
—
|
|
|
|
|
|
|
|
—
|
|
|
|
|
|
|
|
|
|
|
|
|
|
|
|
|
|
||||||||||||||||
|
Total contributions and distributions
|
|
|
|
|
|
|
|
|
|
|
|
|
—
|
|
|
|
|
|
|
|
—
|
|
|
|
|
|
|
|
|
|
|
|
|
|
|
|
|
|
||||||||||||||||
|
Total transactions with owners of the Company
|
|
|
|
|
|
|
|
|
|
|
|
|
(
|
)
|
|
|
|
|
|
|
|
|
|
|
|
|
|
|
|
|
|
|
|
|
|
|
|
|
||||||||||||||||
|
Balance at 31 December 2021
|
|
|
|
|
|
|
|
|
|
|
|
|
(
|
)
|
|
|
|
|
|
|
|
|
|
|
|
|
|
|
|
|
|
|
|
|
|
|
|
|
||||||||||||||||
The amounts included in the consolidated statements of changes in equity for the year ended 31 December 2020 have not been restated. The notes form an integral part of these consolidated financial statements.
F-
5
WALLBOX N.V.
CONSOLIDATED STATEMENTS OF CASH FLOWS FOR THE YEARS ENDED 31 DECEMBER 2021, 2020 AND 2019
|
(In Euros)
|
|
Notes
|
|
31 December
2021 |
|
|
31 December
2020 (*) |
|
|
31 December
2019 |
|
|||
|
Cash flows from Operating Activities
|
|
|
|
|
||||||||||
|
Loss for the Year
|
|
|
|
(
|
)
|
|
|
(
|
)
|
|
|
(
|
)
|
|
|
Adjustments for:
|
|
|
|
|
||||||||||
|
Amortisation and depreciation
|
|
8, 9 and 10
|
|
|
|
|
|
|
|
|
|
|
|
|
|
Expected credit loss for trade and other receivables
|
|
13 and 20
|
|
|
|
|
|
|
|
|
|
|
|
|
|
Impairments of inventories
|
|
14 and 20
|
|
|
|
|
|
|
—
|
|
|
|
—
|
|
|
Fair value change of financial instruments
|
|
|
|
(
|
)
|
|
|
—
|
|
|
|
—
|
|
|
|
Others impairments and losses
|
|
20
|
|
|
—
|
|
|
|
|
|
|
|
|
|
|
Change in provisions
|
|
17
|
|
|
|
|
|
|
|
|
|
|
|
|
|
Government grants
|
|
18
|
|
|
(
|
)
|
|
|
(
|
)
|
|
|
—
|
|
|
Financial income
|
|
22
|
|
|
(
|
)
|
|
|
(
|
)
|
|
|
(
|
)
|
|
Financial expenses
|
|
22
|
|
|
|
|
|
|
|
|
|
|
|
|
|
Change in fair value of derivative warrant liabilities
|
|
22
|
|
|
|
|
|
—
|
|
—
|
||||
|
Share listing expense
|
|
22
|
|
|
|
|
|
—
|
|
—
|
||||
|
Exchange differences
|
|
22
|
|
|
(
|
)
|
|
|
|
|
|
|
|
|
|
Income tax benefit
|
|
24
|
|
|
(
|
)
|
|
|
(
|
)
|
|
|
—
|
|
|
Credit insurance warranty
|
|
13
|
|
|
—
|
|
|
|
|
|
|
|
—
|
|
|
Share based payments expense
|
|
21
|
|
|
|
|
|
|
|
|
|
|
|
|
|
Share of loss of equity accounted associates
|
|
12
|
|
|
—
|
|
|
|
|
|
|
|
|
|
|
Proceeds from government grants
|
|
18
|
|
|
|
|
|
|
—
|
|
|
|
—
|
|
|
Others paid
|
|
17
|
|
|
(
|
)
|
|
|
—
|
|
|
|
—
|
|
|
Changes in
|
|
|
|
|
||||||||||
|
- inventories
|
|
|
|
(
|
)
|
|
|
(
|
)
|
|
|
(
|
)
|
|
|
- trade and other financial receivables
|
|
|
|
(
|
)
|
|
|
(
|
)
|
|
|
(
|
)
|
|
|
- other assets
|
|
|
|
(
|
)
|
|
|
(
|
)
|
|
|
(
|
)
|
|
|
- trade and other financial payables
|
|
|
|
|
|
|
|
|
|
|
|
|
|
|
|
- other
non-current
assets and liabilities
|
|
|
|
|
|
|
|
(
|
)
|
|
|
—
|
|
|
|
- contract liabilities
|
|
|
|
|
|
|
|
|
|
|
|
—
|
|
|
|
|
|
|
|
|
|
|
|
|
|
|
|
|
||
|
|
|
|
|
|
|
|
|
|
|
|
|
|
||
|
Net cash used in operating activities
|
|
|
|
(
|
)
|
|
|
(
|
)
|
|
|
(
|
)
|
|
|
|
|
|
|
|
|
|
|
|
|
|
|
|
||
|
Cash flows from Investing Activities
|
|
|
|
|
||||||||||
|
Investment on Joint Venture
|
|
12
|
|
|
—
|
|
|
|
—
|
|
|
|
(
|
)
|
|
Loans granted to Joint Venture
|
|
13
|
|
|
(
|
)
|
|
|
(
|
)
|
|
|
—
|
|
|
Acquisition of intangible assets
|
|
10
|
|
|
(
|
)
|
|
|
(
|
)
|
|
|
(
|
)
|
|
Acquisition of property, plant and equipment
|
|
8
|
|
|
(
|
)
|
|
|
(
|
)
|
|
|
(
|
)
|
|
Acquisition of financial assets at amortized costs
|
|
13
|
|
|
(
|
)
|
|
|
—
|
|
|
|
—
|
|
|
Acquisition of financial assets at fair value through profit or loss
|
|
13
|
|
|
(
|
)
|
|
|
—
|
|
|
|
—
|
|
|
Other financial assets, net
|
|
13
|
|
|
(
|
)
|
|
|
(
|
)
|
|
|
(
|
)
|
|
Proceeds from sale of intangible assets
|
|
10
|
|
|
|
|
|
|
—
|
|
|
|
—
|
|
|
Proceeds from sale of property, plant and equipment
|
|
8
|
|
|
|
|
|
|
—
|
|
|
|
—
|
|
|
Proceeds from sale of financial assets at amortized costs
|
|
13
|
|
|
|
|
|
|
—
|
|
|
|
—
|
|
|
Proceeds from sale of financial assets at fair value through profit or loss
|
|
13
|
|
|
|
|
|
|
—
|
|
|
|
—
|
|
|
Proceeds from sale of financial assets at fair value through other comprehensive income
|
|
13
|
|
|
|
|
|
|
—
|
|
|
|
—
|
|
|
Interest received
|
|
22
|
|
|
—
|
|
|
|
|
|
|
|
|
|
|
Acquisition of subsidiaries, net of cash acquired
|
|
6
|
|
|
—
|
|
|
|
|
|
|
|
—
|
|
|
|
|
|
|
|
|
|
|
|
|
|
|
|
||
|
Net cash used in investing activities
|
|
|
|
(
|
)
|
|
|
(
|
)
|
|
|
(
|
)
|
|
|
|
|
|
|
|
|
|
|
|
|
|
|
|
||
|
(*)
|
Restated amounts. Certain amounts included in the consolidated statements of cash flows for the year ended 31 December 2020 do not correspond to those included in the consolidated financial statements of Wallbox Chargers S.L. for the year ended 31 December 2020, and reflect the adjustments described in Note 2.
|
|
(**)
|
The notes form an integral part of these consolidated financial statements.
|
F-
6
WALLBOX N.V.
CONSOLIDATED STATEMENTS OF CASH FLOWS FOR THE YEARS ENDED 31 DECEMBER 2021, 2020 AND 2019
|
(In Euros)
|
|
Notes
|
|
|
31 December
2021 |
|
|
31 December
2020 (*) |
|
|
31 December
2019 |
|
||||
|
Cash flows from Financing Activities
|
|
|
|
|
|
|
|
|
|
|
|
|
|
|
|
|
|
Proceeds from issuing equity instruments
|
|
|
16
|
|
|
|
—
|
|
|
|
|
|
|
|
|
|
|
Proceeds from issuing equity instruments (PIPE financing)
|
|
|
16
|
|
|
|
|
|
|
|
—
|
|
|
|
—
|
|
|
Proceeds from issuing equity instruments (Kensington shareholders)
|
|
|
16
|
|
|
|
|
|
|
|
—
|
|
|
|
—
|
|
|
Issuance costs
|
|
|
|
|
|
|
(
|
)
|
|
|
|
|
|
|
|
|
|
Proceeds from issuing equity instruments (Warrants conversion and other)
|
|
|
13 and 16
|
|
|
|
|
|
|
|
—
|
|
|
|
—
|
|
|
Purchase of share-based payments plan
|
|
|
21
|
|
|
|
(
|
)
|
|
|
—
|
|
|
|
—
|
|
|
Proceeds from government grants
|
|
|
|
|
|
|
—
|
|
|
|
|
|
|
|
—
|
|
|
Proceeds from borrowings
|
|
|
13
|
|
|
|
|
|
|
|
—
|
|
|
|
—
|
|
|
Proceeds from loans
|
|
|
13
|
|
|
|
|
|
|
|
|
|
|
|
|
|
|
Proceeds from convertible bonds
|
|
|
13
|
|
|
|
|
|
|
|
|
|
|
|
—
|
|
|
Proceeds from shareholders loan
|
|
|
13
|
|
|
|
—
|
|
|
|
—
|
|
|
|
|
|
|
Repayments of loans
|
|
|
13
|
|
|
|
(
|
)
|
|
|
(
|
)
|
|
|
(
|
)
|
|
Repayments of related parties loans
|
|
|
13
|
|
|
|
(
|
)
|
|
|
—
|
|
|
|
—
|
|
|
Interest paid of convertible bonds
|
|
|
13
|
|
|
|
(
|
)
|
|
|
—
|
|
|
|
—
|
|
|
Payment of principal portion of lease liabilities
|
|
|
9
|
|
|
|
(
|
)
|
|
|
(
|
)
|
|
|
(
|
)
|
|
Payment of interest on lease liabilities
|
|
|
9
|
|
|
|
(
|
)
|
|
|
(
|
)
|
|
|
(
|
)
|
|
Payment of put option liabilities
|
|
|
6
|
|
|
|
(
|
)
|
|
|
—
|
|
|
|
—
|
|
|
Interest and bank fees paid
|
|
|
22
|
|
|
|
(
|
)
|
|
|
(
|
)
|
|
|
(
|
)
|
|
Other payments
|
|
|
|
|
|
|
(
|
)
|
|
|
(
|
)
|
|
|
(
|
)
|
|
|
|
|
|
|
|
|
|
|
|
|
|
|
|
|
|
|
|
Net cash from financing activities
|
|
|
|
|
|
|
|
|
|
|
|
|
|
|
|
|
|
|
|
|
|
|
|
|
|
|
|
|
|
|
|
|
|
|
|
Net increase in cash and cash equivalents
|
|
|
|
|
|
|
|
|
|
|
|
|
|
|
|
|
|
Cash and cash equivalents at beginning of year
|
|
|
|
|
|
|
|
|
|
|
|
|
|
|
|
|
|
Exchange gains/(losses)
|
|
|
|
|
|
|
|
|
|
|
|
|
|
|
(
|
)
|
|
|
|
|
|
|
|
|
|
|
|
|
|
|
|
|
|
|
|
Cash and cash equivalents at 31 December
|
|
|
|
|
|
|
|
|
|
|
|
|
|
|
|
|
|
|
|
|
|
|
|
|
|
|
|
|
|
|
|
|
|
|
|
(*)
|
Restated amounts. Certain amounts included in the consolidated statements of cash flows for the year ended 31
|
|
(**)
|
The notes form an integral part of these consolidated financial statements.
|
F-
7
WALLBOX N.V.
Notes to the consolidated financial statements
|
1
.
|
REPORTING ENTITY
|
Wallbox N.V. (the “Company” or “Wallbox”) was incorporated as a Dutch
private limited liability company under the name Wallbox B.V. on
, and then converted into a Dutch public limited liability company. It is registered in the Commercial Registry of the Netherlands Chamber of Commerce under number 83012559.
Its headquarter is in Amsterdam, the Netherlands, and the mailing and business address of its principal executive office is Carrer del Foc 68, 08038 Barcelona, Spain.
These consolidated financial statements comprise the Company and its subsidiaries (together referred to as the “Group”). The Group is primarily involved in development, manufacture and retail innovative solutions for charging electric vehicles. Further information about the Group’s business activities, reportable segments and related party relationships is included in Note 19 on Revenue, Note 7 on Segment reporting and Note 25 on Related party transactions, respectively.
Wallbox is the Parent of the Group. The Group’s principal subsidiaries at 31 December 2021, 2020 and 2019 are set out in Note 28. Unless otherwise stated, they have share capital consisting solely of ordinary shares that are held directly by the Group, and the proportion of ownership interests held equals the voting rights held by the Group. The Group also has investments in a joint venture (see Notes 12 and 25). Reference is made to Note 2 and Note 3 for further disclosure on why the consolidated financial statements of Wallbox N.V. include comparative information despite only being incorporated on 7 June 2021.
Wallbox is listed on the New York Stock Exchange with the ticker WBX.
|
2
.
|
BASIS OF PREPARATION
|
These consolidated financial statements of the Group have been prepared in accordance with International Financial Reporting Standards (IFRS) as issued by the International Accounting Standards Board (IASB).
Wallbox was incorporated with the sole aim of reorganizing the previous group headed by Wall Box Chargers, S.L. (hereinafter “Wallbox Chargers”) and to execute an agreement with new investors (hereinafter the “Business Combination Agreement”) to effect an Initial Public Offering of shares to be listed on the New York Stock Exchange (hereinafter the “Transaction”).
As indicated in Note 3, Wallbox cannot be considered a separate entity acting in its own right, and the economic substance of its incorporation and the holding of Wallbox Chargers shares constitutes a reorganization of the Group for the sole purpose of the Initial Public Offering (hereinafter referred to as “IPO”) and integrating new investors. Consequently, management has decided that Wallbox should recognize in its consolidated financial statements the net assets of Wallbox Chargers and subsidiaries as per their preceding carrying amounts, and that comparatives should be represented, as the consolidated financial statements of Wallbox N.V. are a continuation of those of Wallbox Chargers. Certain prior period amounts have been reclassified to conform to the current period presentation with no material impact on previously reported net loss, cash flows or financial position.
Therefore, the comparable consolidated financial statements as of 31 December 2020 and for the years ended 31 December 2020 and 31 December 2019 represent consolidated financial statements of Wallbox Chargers
These consolidated financial statements will be approved and authorized for issue on 2
9
April 2022 in accordance with a resolution of the Company’s board of directors.
Details of the Group’s accounting policies are included in Note 5.
F-8
WALLBOX N.V.
Notes to the consolidated financial statements
Going concern:
The accompanying consolidated financial statements of the Company have been prepared assuming the Company will continue as a going concern. The going concern basis of presentation assumes that Wallbox will continue in operation for at least a period of one year after the date these financial statements are issued and contemplates the realization of assets and the settlement of liabilities in the normal course of business.
Wallbox has incurred net losses and significant cash outflows from cash used in operating activities over the past years, as it has been investing significantly in the development of its electric vehicle charging products. During the fiscal year ended 31 December 2021, the Company incurred a consolidated net loss of Euros
million of which Euros
million relates to the share listing expense (see Note 22), Euros
million to change in fair value of derivative warrant liabilities (See note 22), Euros
25.5
million to fair value adjustments of convertible bonds (see note 22) and Euros
8.0
million relates to non-incremental transaction costs that are not directly attributable to the issuance of new shares (see Note 20). Negative cash flows from operations amounted to Euros
million. At 31 December 2021, the Company had an accumulated deficit of Euros
million but a positive total equity balance of Euros
million. At 31 December 2021, it had cash and cash equivalents of Euros
In assessing the going concern basis of preparation of the consolidated financial statements, Wallbox had to estimate the expected cash flows for the next 12 months, including the compliance with covenants, exercise of warrants and availability of other financial funding from banks.
Based on these estimations management has asse
s
sed that Wallbox will be able to fund the expected cash outflows in the next 12 months. Although the expectation for the coming year is to continue to have net losses and the Company will continue to make investments, the cash and funding availability is sufficient for more than the next 12 months.
Wallbox has analyzed also the potential impacts of external factors as the Ukraine-Russia conflict, and considers that it will not affect significantly the normal course of the business.
Basis of measurement
These consolidated financial statements have been prepared mainly on a historical cost basis. The only exceptions to the application of the cost basis during their preparation have been the subsequent measurement of:
| • |
financial assets relating to related to investment (see Note 13) which are measured at fair value through other comprehensive income (FVTOCI);
|
| • |
financial investments related to investment funds with financial institutions (see Note 13) which are measured at fair value through profit or loss (FVTPL); and
|
| • |
the derivative warrant liabilities (see Note 13) and the put option liability associated with the business acquisitions (see Note 6), which are measured at fair value through profit or loss (FVTPL).
|
Basis of consolidation
These consolidated financial statements comprise the financial statements of the Company and its subsidiaries as at 31 December 2021. Control is achieved when the Group is exposed, or has rights to, variable returns from its involvement with the investee and has the ability to affect those returns through its power over the investee. Specifically, the Group controls an investee if, and only if, the Group has:
| • |
Power over the investee (i.e., existing rights that give it the current ability to direct the relevant activities of the investee).
|
F-
9
WALLBOX N.V.
Notes to the consolidated financial statements
| • |
Exposure, or rights, to variable returns from its involvement with the investee.
|
| • |
The ability to use its power over the investee to affect its returns.
|
| • |
Generally, there is a presumption that a majority of voting rights results in control. To support this presumption and when the Group has less than a majority of the voting or similar rights of an investee, the Group considers all relevant facts and circumstances in assessing whether it has power over an investee, including:
|
| • |
The contractual arrangement(s) with the other vote holders of the investee.
|
| • |
Rights arising from other contractual arrangements.
|
| • |
The Group’s voting rights and potential voting rights.
|
The Group
re-assesses
whether it controls an investee if facts and circumstances indicate that there are changes to one or more of the three elements of control. Consolidation of a subsidiary begins when the Group obtains control over the subsidiary and ceases when the Group loses control of the subsidiary. Assets, liabilities, income and expenses of a subsidiary acquired or disposed of during the year are included in the consolidated financial statements from the date the Group gains control until the date the Group ceases to control the subsidiary.
Profit or loss and each component of other comprehensive income (OCI) are attributed to the equity holders of the parent of the Group and to the
non-controlling
interests, even if this results in the
non-controlling
interests having a deficit balance. When necessary, adjustments are made to the financial statements of subsidiaries to bring their accounting policies in line with the Group’s accounting policies. All intra-group assets and liabilities, equity, income, expenses and cash flows relating to transactions between members of the Group are eliminated in full on consolidation.
A change in the ownership interest of a subsidiary, without a loss of control, is accounted for as an equity transaction.
If the Group loses control over a subsidiary, it derecognizes the related assets (including goodwill), liabilities,
non-controlling
interest and other components of equity, while any resulting gain or loss is recognized in the statement of profit or loss as profit or loss. Any investment retained is recognized at fair value.
Effects of the
COVID-19
pandemic on the Group’s activity
On 11 March 2020, the World Health Organization upgraded the emergency public healthcare situation triggered by the outbreak of Coronavirus disease 2019
(COVID-19)
to an international pandemic. The unfolding of events in Spain and worldwide, has led to an unprecedented health crisis, which has had an impact on the macroeconomic climate and on business performance. In order to confront this situation, a series of measures have been adopted in 2020 and 2021 to address the economic and social impacts which, amongst other aspects, have led to mobility restrictions on the population. In particular, amongst other measures, governments worldwide have declared states of emergency or similar measures that have imposed restrictions on the movement of people and on the opening hours of businesses, severely impacting the economies. At the date these consolidated financial statements are authorized for issue, this type of restriction has been significantly limited, allowing the companies that form part of the group to operate completely normally and ensuring the continuity of operations always within a stable regulatory framework.
The Group has continued implementing its growth plans and, although the pandemic has caused certain delays to these plans, they have not been significant. In this regard, the growth and capital increases from the Transaction
F-
10
WALLBOX N.V.
Notes to the consolidated financial statements
as explained in Note 16, reflect a solid equity and liquidity position. Furthermore, the pandemic has shown some of the benefits of electric vehicles with the lowest levels of pollution for the last decade. Across the world, public entities, governments, utilities and the automotive industry have accelerated their plans for the energy transition that was initially scheduled to start in 2022/2023. This industry acceleration has had a significant impact on the Company, as it has to keep investing in new technologies to be deployed in the following year, as well as investing in the Group team to be able to continue its growth with the most talented professionals.
Functional and presentation currency
These consolidated financial statements are presented in Euros, which is also the Company’s functional currency. All amounts have been rounded to the nearest unit of Euros, unless otherwise indicated.
Limitations on the distribution of dividends
Once the appropriations required by law or the
by-laws
of the Parent Company have been made, dividends may only be distributed with a charge to freely distributable reserves, provided that equity is not reduced to an amount below share capital. Profit recognized directly in equity cannot be distributed, either directly or indirectly. In the event of prior years’ losses causing the Company’s equity to be lower than share capital, profit will be used to offset these losses.
Impact from final allocation of the purchase price of the business combination of Electromaps, S.L. in fiscal year 2020
In accordance with IFRS 3, the comparative financial information corresponding to the 2020 financial year has been restated because of the final allocation of the purchase price of Electromaps, S.L., with the following new assets having been identified: customer relationships and trademark. Therefore, the fair value of the new identified intangible assets acquired has been allocated from goodwill (see Note 6), resulting in a restatement of the prior year statement of financial position.
F-
11
WALLBOX N.V.
Notes to the consolidated financial statements
A reconciliation of the consolidated financial statements for the year ended 31 December 2020, prepared before and after the value allocation exercise for the aforementioned acquisitions, is shown below:
|
(In Euros)
|
|
31 December
2020 |
|
|
Effect of
IFRS 3 |
|
|
31 December
2020 restated |
|
|||
|
Assets
|
|
|
|
|||||||||
|
Non-Current
Assets
|
|
|
|
|||||||||
|
Property, plant and equipment
|
|
— |
|
|||||||||
|
Right-of-use
|
|
— |
|
|||||||||
|
Intangible assets
|
|
|
|
|||||||||
|
Goodwill
|
|
(
|
) |
|
||||||||
|
Investment in joint venture
|
— | — | — | |||||||||
|
Non-current
financial assets
|
|
— |
|
|||||||||
|
Tax credit receivables
|
|
— |
|
|||||||||
|
|
|
|
|
|
|
|||||||
|
Total
Non-Current
Assets
|
|
|
|
|
|
|
|
|
|
|||
|
|
|
|
|
|
|
|||||||
|
Liabilities
|
||||||||||||
|
Non-Current
Liabilities
|
||||||||||||
|
Loans and borrowings
|
|
— |
|
|||||||||
|
Derivative warrant liabilities
|
— | — | — | |||||||||
|
Convertible bonds
|
|
— |
|
|||||||||
|
Lease liabilities
|
|
— |
|
|||||||||
|
Put option liabilities
|
|
— |
|
|||||||||
|
Provisions
|
|
— |
|
|||||||||
|
Goverment grants
|
— | — | — | |||||||||
|
Deferred tax liabilities
|
— |
|
|
|||||||||
|
|
|
|
|
|
|
|||||||
|
Total
Non-Current
Liabilities
|
|
|
|
|
|
|
|
|
|
|||
|
|
|
|
|
|
|
|||||||
|
3.
|
USE OF JUDGEMENTS AND ESTIMATES
|
The preparation of these consolidated financial statements in accordance with IFRS requires management to make judgements, estimates and assumptions that affect the application of accounting policies and the reported amounts of assets, liabilities, income and expenses. Actual results may differ from these estimates.
Critical judgement and estimates:
A summary is given below of the critical aspects that have also involved a greater degree of judgement or complexity, or those in which the assumptions and estimates have an influence on the preparation of these consolidated financial statements.
Key assumptions concerning the future and other relevant data on the estimation of uncertainty at the reporting date, which entail a considerable risk of significant changes in the value of the assets and liabilities in the coming year, are as follows:
|
|
•
|
|
Going concern
|
Disclosures related to the going concern have been included in Note 2 Basis of Preparation.
F-1
2
WALLBOX N.V.
Notes to the consolidated financial statements
| • |
Impairment of
non-current
assets (including goodwill)
|
Goodwill is tested for impairment at cash-generating unit level (“CGU”) on an annual basis or if an event occurs or circumstances change that could reduce the recoverable amount of a CGU below its carrying amount. These events or circumstances could include a significant change in the business climate, legal factors, operating performance indicators, competition, or sale or disposal of a significant portion of a reporting unit.
The Company makes judgements about the recoverability of
non-current
assets with finite lives whenever events or changes in circumstances indicate that impairment may exist. Recoverability of these assets with finite lives is measured by comparing the carrying amount of the asset to the future undiscounted cash flows the asset is expected to generate. If the asset is considered to be impaired, the amount of any impairment is measured as the difference between the carrying amount and the recoverable amount of the impaired asset. Assumptions and estimates about future values and remaining useful lives of its
non-current
assets are complex and subjective. They can be affected by a variety of factors, including external factors such as industry and economic trends, and internal factors such as changes in business strategy and internal forecasts.
In order to determine the recoverable amount, the Company estimates expected future cash flows from the assets and applies an appropriate discount rate to calculate the present value of these cash flows. Future cash flows are dependent on whether the budgets and forecasts for the next five years are achieved, whereas the discount rates depend on the interest rate and risk premium associated with each of the companies.
There was
no
impairment of goodwill or
the years ended 31 December 2021 and 2020. (See Note 11).
non-current
assets
for
|
|
•
|
|
Capitalization of development costs and determination of the useful life of intangible assets
|
The Company’s management reviews expenditures, including wages and benefits for employees, incurred on development activities and, based on its judgement of the costs incurred, assesses whether the expenditure meets the capitalization criteria set out in IAS 38 and the intangible assets accounting policy in Note 5. The Company’s management specifically considers whether additional expenditure on projects relates to maintenance or new development projects with only the new developments qualifying to be capitalized.
The useful life of capitalized development costs is determined by management at the time the newly developed charger is brought into use and is regularly reviewed for appropriateness. For unique charger products controlled and developed by the Company, the useful life is based on historical experience with similar products as well as anticipation of future events, which may impact their useful economic life, such as changes in technology. (See Note 10).
|
|
•
|
|
Measurement of convertible bonds
|
At 31 December 202
0, compound financial instruments issued by Wall Box Chargers, S.L. comprised the convertible bonds issued during 2020 for an amount of Euros
with a nominal interest rate of
%. In addition, in the first half of 2021, convertible bonds were issued for an amount of Euros
with the same conditions as the
bond
issued in 2020. Also during the first six months of 2021 Wall Box Chargers, S.L. issued a new convertible financial instrument for an amount of Euros
with a nominal interest rate of
%.
These convertible bonds were denominated in Euros and could be converted to ordinary shares at the discretion of the holder.
F-1
3
WALLBOX N.V.
Notes to the consolidated financial statements
The liability component of the first two convertible bonds was initially recognized at the fair value of a similar liability that did not have an equity conversion option. The determination of this fair value was based on an estimated incremental rate which reflected the risk of the country where the company was located, the currency of payments, the specific risk of the sector and the Company’s particular situation, in order to determine the discount factor estimates needed to be made in respect of the risk-free rate, the country risk premium and the credit spread are considered.
The equity component was initially recognized as the difference between the fair value of the compound financial instrument as a whole and the fair value of the liability component. The equity component at issue date was estimated to be nil as the fair value of the liability component was calculated to be close to the fair value of the compound financial instrument as a whole.
Based on the analysis performed, Wall Box Chargers, S.L. concluded that the third convertible bond was a hybrid instrument that contained a
non-derivative
financial instrument which comprised an obligation for the issuer to settle in cash or by a way of delivering a variable amount of its own equity instruments and embedded derivatives with different probabilities of contingent events occurring. Therefore, Wall Box Chargers, S.L. chose to measure the hybrid contract at fair value through profit or loss since its inception. The fair value at issue date was equal to the par value. Subsequently, the convertible bond was valued at fair value through profit or loss. The fair value implies judgement in relation to whether the bond will convert or be paid in cash, the conversion price and the number of shares to be issued in exchange for the bonds. It was also estimated that a conversion would take place. The share price was estimated based on the company value included in the Business Combination Agreement with Kensington Capital Acquisition II which was signed on 6 June 2021.
The first two convertible bonds (Euros
25,880,000
and Euros
7,000,000
)
were recognized at amortized cost after the initial recognition. The third convertible bond
(Euros
27,550,000
)
was recognized at fair value until 16 September 2021, the date of conversion. The conversion of the convertible bonds lead to the issue of
Class A ordinary shares by Wallbox Chargers, S.L. with a par value of Euros
each and share premium (see Note 13).
| • |
Business combinations (including put option liabilities)
|
The Company accounts for business combinations using the acquisition method when the acquired set of activities and assets meets the definition of a business and control is transferred to the Company. In determining whether a particular set of activities and assets is a business, the Company assesses whether the set of assets and activities acquired includes, at a minimum, an input and substantive process and whether the acquired set has the ability to produce outputs.
The Company determines and allocates the purchase price of an acquired business to the assets acquired and liabilities assumed as of the business combination date. The purchase price allocation process requires the Company to use significant estimates and assumptions with respect to the identification of assets previously not recognized such as customer relationships, brand name and intangible assets and the determination of the fair value of assets and liabilities acquired.
As part of the business combinations of Intelligent Solutions AS (renamed into Wallbox AS) and Electromaps, S.L., put options to
non-controlling
entities to be settled in cash were granted. At the acquisition date a financial liability for the present value of the expected exercise price of the option was recognized. Significant estimates are made in order to determine the expected exercise price of the option, which are based on a predefined contractual formula calculated on the future sales of the acquired companies.
The Company elected to apply a policy choice that allows it to recognize the acquisition of 100% of the interests in the subsidiary (therefore, it does not recognize
non-controlling
interests) against the consideration paid, reflected by the financial liability derived from the put option.
F-1
4
WALLBOX N.V.
Notes to the consolidated financial statements
Regarding Intelligent Solutions upon initial recognition, it had been estimated that such financial liability would be canceled in January 2023. However, in August 2021, the Group agreed with the former shareholders to cancel it during the second half of 2021, implying an adjustment of the present value of the liability at that date. Payments were made on 19 August, 2 September and 9 November 2021 (see Note 6).
|
|
•
|
|
Share
-
Based Payment
|
The Company’s management measures equity settled share-based payments at fair value at the date of grant and expenses the cost over the vesting period, based upon management’s estimate of equity instruments that will eventually vest, along with a corresponding increase in equity. At each statement of financial position date, management revises its estimate of the number of equity instruments expected to vest as a result of the effect of
non-market-based
vesting conditions. The impact of the revision of the original estimates, if any, is recognized in profit or loss such that the cumulative expense reflects the revised estimate, with a corresponding adjustment to equity reserves.
Prior to the completion of the Business Combination on 1 October 2021, as the ordinary shares of Wallbox Chargers, S.L. were not listed on a public marketplace, the calculation of the fair value of its ordinary shares was subject to a greater degree of estimation in determining the basis for share-based options that it issued. Given the absence of a public market during the first months of the year, management was required to estimate the fair value of the ordinary shares at the time of each grant.
The Company’s management determined the value of its ordinary shares based on interpolating from the valuations in its most recent external equity financing rounds and, subject to discounts for the probability and timing of an exit event and lack of marketability, among other factors.
The assumptions underlying the valuations represent the Company’s best estimates, which involve inherent uncertainties and the application of management judgement. (See Note 21).
|
|
•
|
|
Income taxes
|
Deferred tax assets are recognized to the extent that it is probable that future taxable profits will be available against which the temporary differences can be utilized. In order to determine the amount of the deferred tax assets to be recognized, the directors consider the amounts and dates on which future taxable profits will be obtained and the reversal period for taxable temporary differences. The Company has not recognized deferred tax assets at 31 December 2021 or at 31 December 2020. The key area of judgement is therefore an assessment of whether it is probable that there will be suitable taxable profits against which any deferred tax assets can be utilized. The Company operates in a number of international tax jurisdictions. Further details of the Company’s accounting policy in relation to deferred tax assets are discussed in Note 5.
Research and development tax credits are recognized as an asset once it is considered that there is sufficient assurance that any amount claimable will be received. The key judgement therefore arises in respect of the likelihood of a claim being successful when a claim has been quantified but has not been received. In making this judgement the Company considers the nature of the claim and in particular the track record of success of previous claims.
The Company is subject to income taxes in numerous jurisdictions and there are transactions for which the ultimate tax determination cannot be assessed with certainty in the ordinary course of business. The Company recognizes a provision for situations that might arise in the foreseeable future based on an assessment of the probabilities as to whether additional taxes will be due. An uncertain tax position is recognized as a benefit only if it is “more likely than not” that the tax position would be sustained in a tax examination, with a tax examination being presumed to occur. The amount recognized is the largest
F-1
5
WALLBOX N.V.
Notes to the consolidated financial statements
amount of tax benefit that is greater than 50% likely to be made on examination. For tax positions not meeting the “more likely than not” test, no tax benefit is recorded. Penalties and interest incurred related to underpayment of income tax are classified as income tax expense in the period incurred. (See Note 24).
|
|
•
|
|
Critical judgements derived from the Business Combination Agreement and the Transaction
|
On 1 October 2021 (the “Closing Date”), Wallbox closed a denominated business combination (the “Business Combination”) pursuant to the Business Combination Agreement, dated 9 June 2021, (the “Business Combination Agreement”), entered into by and between Wallbox, Orion Merger Sub Corp., Kensington Capital Acquisition Corp. II, (hereinafter Kensington), and Wallbox Chargers.
Regarding this transaction the Group has considered the following main estimations and judgements:
Wallbox Chargers acquisition
From an accounting perspective, the contribution in kind of Wallbox Chargers and subsidiaries qualifies as a ‘business combination involving entities or businesses under common control’ which is not in the scope of IFRS 3. IFRS has currently no guidance yet on how to account for these kind of transactions.
After analyzing all the factors involving the Transaction, and based on main interpretations used by other issuers, management has concluded that Wallbox N.V. cannot be considered as a separate entity acting in its own right as an acquirer in a business combination (it acts on behalf of the same shareholders of Wallbox Chargers) and the economic substance of its incorporation and the holding of the shares of Wallbox Chargers is intended only for a reorganization of the group with the sole purpose to realize an IPO and attract new investors.
Consequently, management has decided that Wallbox N.V. recognizes in its consolidated financial statements the net assets of Wallbox Chargers and its subsidiaries as per their previous carrying amounts (book value/pooling of interests (carry-over basis) accounting) and will apply this accounting treatment to similar transactions in the future.
Acquisition of Kensington Acquisition Corp. II
The contribution in kind of Kensington is not within the scope of IFRS 3 as Kensington does not meet the definition of a business in accordance with IFRS 3.
Therefore, Wallbox has not acquired a business through the contribution in kind but accounted for the Kensington shares in accordance with IFRS Share-based payments. Kensington has been treated as the “acquired” company for financial reporting purposes and its net assets have been recognized at historical cost, with no goodwill or other intangible assets recorded.
As a result of this Transaction Kensington shareholders became shareholders of Wallbox,
Based on IFRS 2, and from an analysis of the transaction, it has been considered that the excess of fair value of Wallbox shares issued over the fair value of Kensington’s identifiable net assets acquired represents compensation for the service of stock exchange listing for its shares and has been expensed as incurred.
In this regard, Kensington’s net assets at the closing date amounted to USD
115,243,682
or Euros
99,524,444
plus the cash proceeds to be received from PIPE Investors amounting USD
111,000,000
or Euros
95,859,600
, totaling Euros
195,384,044
.
F-16
WALLBOX N.V.
Notes to the consolidated financial statements
The fair value of the Wallbox Chargers business agreed between the independent parties involved in the Transaction amounted to USD
1,400,000,000
(Euros
1,209,040,000
) in accordance with the Business Combination Agreement. Therefore, based on an
18.1
% equity interest in Wallbox issued to Kensington shareholders, the fair value of the Wallbox shares provided to the Kensington shareholders has been estimated at Euros
267,555,606
.
Consequently, the difference between the fair value of the Wallbox shares provided (Euros
267,555,606
) and Kensington’s net assets (Euros
195,384,044
), amounted to Euros
72,171,562
, and has been considered as a finance expense in the statement of profit or loss of Wallbox at closing date, representing the value of the stock exchange listing services rendered by Kensington and its shareholders (see Note 22).
Comparative information
There is no approved guidance in IFRS regarding the presentation of comparatives when applying the pooling of interests method for business combinations between entities under common control.
Considering this lack of guidance and IAS 8, Management has determined that Wallbox restates its comparatives and adjust its current reporting period before the date of the transaction as if the combination has occurred at the start of the earliest period presented.
Wallbox has decided to
re-present
comparatives as the consolidated financial statements of Wallbox are considered to be a continuation of those of Wallbox Chargers.
Consequently, Wallbox N.V. is considered the parent of the Wallbox Group at 1 January 2019, and has included comparatives for a period of two years in the consolidated financial statements for the year ended 31 December 2021. From this date, Wallbox’ consolidated financial statements will be the continuation of those issued by Wallbox Chargers, recognizing the incorporation of Kensington as of 1 October 2021. See more detail about the values considered in Note 6.
Treatment of transaction costs
In accordance with IAS 32, Wallbox has analyzed the total costs incurred in the Transaction to determine which were incremental and directly attributable to the issue of new shares, and hence are to be deducted from equity directly rather than being expenses through profit or loss.
Some costs have been considered
100
% attributable to the issuance of the new shares in exchange for cash, while other costs incurred related to a combination of the issuance of new shares and obtaining the listing. For this latter group of costs, only the part that could be attributed to the issuance of new shares in exchange for cash are deducted from equity, which percentage was determined as the ratio of the number of new shares issued in exchange for cash compared to the total number of outstanding shares after the Transaction.
A total amount of Euros
17,397,322
(Note 16) of incremental and directly attributable costs for the issuance of new shares has been deducted from share premium directly.
8,046,158
(Note 20) are expensed in profit or loss.
Non-incremental
and not directly attributable costs for the issuance of shares in the amount of Euros
|
|
•
|
|
Warrants
|
Public and Private Warrants originally issued by Kensington to its public shareholders and its sponsors were converted on the closing date of the Business Combination Agreement, into a right to acquire one Class A ordinary share of Wallbox N.V. (a “Wallbox Warrant”) on substantially the same terms as were in effect immediately prior to the closing date. These warrants were considered part of the net assets of Kensington at the time of the Transaction.
F-17
WALLBOX N.V.
Notes to the consolidated financial statements
On the closing date of the Business Combination Agreement, Wallbox N.V. issued Warrants to registered holders of Kensington’s Public and Private Warrants in exchange for the originally issued Warrants. Wallbox N.V. assumed and continues to hold these warrants on the same terms as before (to the extent applicable).
According to management’s assessment, both the Public and Private Warrants fall within the scope of IAS 32 and have been classified as a derivative financial liability. In accordance with IFRS 9 guidance, derivatives that are classified as financial liabilities shall be measured at fair value with subsequent changes in fair value to be recognized in profit and loss.
Although these estimates made by the Company’s directors were based on the best information available at 31 December 2021, it is possible that events which might take place in the future would require their adjustment in future years.
|
4.
|
NEW IFRS AND IFRIC NOT YET EFFECTIVE
|
Standards and interpretations that will be effective after the reporting date are as follows:
The following amended standards and interpretations had no significant impact on the Group’s financial position and results of operations.
|
a)
|
New standards, amendments and interpretations effective
EU-endorsed
as of 1 January 2021
|
|
Interest Rate Benchmark Reform – Phase 2 (Amendments to IFRS 9, IAS 39, IFRS 7, IFRS 4 and IFRS 16
|
1 Jan 2021 | |||
|
COVID-19-Related
|
1 Apr 2021 |
The following amended standards and interpretations are not expected to have a significant impact on the future Group’s financial position and results of operations.
|
b)
|
New standards, amendments and interpretations effective
EU-endorsed
as of 1 January 2022
|
|
Onerous Contracts – Cost of Fulfilling a Contract (Amendments to IAS 37)
|
1 Jan 2022 | |||
|
Annual Improvements to IFRS Standards 2018-2020
|
1 Jan 2022 | |||
|
Property, Plant and Equipment: Proceeds before Intended Use (Amendments to IAS 16)
|
1 Jan 2022 | |||
|
Reference to the Conceptual Framework (Amendments to IFRS 3)
|
1 Jan 2022 |
|
c)
|
New standards, amendments and interpretations effective as of 1 January 2023
|
|
Classification of liabilities as current or
non-current
(Amendments to IAS 1)
|
1 Jan 2023 | (*) | ||
|
Disclosure of Accounting Policies (Amendments to IAS 1 and IFRS Practice Statement 2)
|
1 Jan 2023 | (*) | ||
|
Definition of Accounting Estimates (Amendments to IAS 8)
|
1 Jan 2023 | (*) | ||
|
Deferred Tax related to Assets and Liabilities arising from a Single Transaction (Amendments to IAS 12)
|
1 Jan 2023 | (*) |
| (*) |
Not yet endorsed by the EU.
|
F-18
WALLBOX N.V.
Notes to the consolidated financial statements
|
5.
|
SIGNIFICANT ACCOUNTING POLICIES
|
The Group has consistently applied the following significant accounting policies to all periods presented in these consolidated financial statements.
|
A.
|
Basis of consolidation
|
|
|
i.
|
Business combinations
|
The Group accounts for business combinations using the acquisition method when the acquired set of activities and assets meets the definition of a business and control is transferred to the Group (see (A)(ii)). In determining whether a particular set of activities and assets is a business, the Group assesses whether the set of assets and activities acquired includes, at a minimum, an input and substantive process and whether the acquired set has the ability to produce outputs.
The consideration transferred in the acquisition is generally measured at fair value, as are the identifiable net assets acquired. Any goodwill that arises is tested annually for impairment (see (M)(ii)). Any gain on a bargain purchase is recognized in profit or loss immediately. Transaction costs are expensed as incurred.
The consideration transferred does not include amounts related to the settlement of pre-existing relationships. Such amounts are generally recognized in profit or loss.
Any contingent consideration is measured at fair value at the date of acquisition. If an obligation to pay contingent consideration that meets the definition of a financial instrument is classified as equity, then it is not remeasured and settlement is accounted for within equity. Otherwise, other contingent consideration is remeasured at fair value at each reporting date and subsequent changes in the fair value of the contingent consideration are recognized in profit or loss.
When business combinations involve the granting of put options to
100
% of the interests in the subsidiary (therefore, it does not recognize
non-controlling
entities to be settled in cash, the Group recognizes at acquisition date a financial liability for the present value of the exercise price of the option, and it is remeasured at fair value until it is paid. In these cases, the Group has elected to apply a policy choice that allows it to recognize the acquisition of
non-controlling
interests) against the consideration paid, reflected by the financial liability derived from the put option.
Business combinations involving entities under common control are not within the scope of IFRS 3, and IFRS currently does not indicate how to recognize these transactions.
Following guidance of IAS 8, when a transaction is not regulated by a standard, entities shall develop an accounting policy that results in relevant and reliable information, and in this regard, the company has used the book value/pooling of interests (carry-over basis) accounting on the basis that the investment has simply been moved from one part of the group to another (reorganization or capital reorganization).The chosen accounting policy must be applied consistently to all similar common control transactions. If the transaction did not have economic substance, then it would have to be recognized at book value.
As indicated in Note 3, management has decided that Wallbox recognize in its consolidated financial statements the net assets of Wallbox Chargers and subsidiaries as per their previous carrying amounts (book value/pooling of interests (carry-over basis) accounting) and will apply this accounting treatment to similar transactions in the future.
|
|
ii.
|
Subsidiaries
|
Subsidiaries are entities controlled by the Group. The Group ‘controls’ an entity when it is exposed to, or has rights to, variable returns from its involvement with the entity and has the ability to affect those returns through its power over the entity. The financial statements of subsidiaries are included in the consolidated financial statements from the date on which control commences until the date on which control ceases.
F-19
WALLBOX N.V.
Notes to the consolidated financial statements
|
|
iii.
|
Non-controlling
interests
|
Non-controlling
interests (NCI) are measured initially at their proportionate share of the acquiree’s identifiable net assets at the date of acquisition.
Changes in the Group’s interest in a subsidiary that do not result in a loss of control are accounted for as equity transactions.
|
|
iv.
|
Loss of control
|
When the Group loses control over a subsidiary, it derecognizes the assets and liabilities of the subsidiary, and any related NCI and other components of equity. Any resulting gain or loss is recognized in profit or loss. Any interest retained in the former subsidiary is measured at fair value when control is lost.
|
|
v.
|
Interests in equity-accounted investees
|
Associates are those entities in which the Group has significant influence, but not control or joint control, over the financial and operating policies. A joint venture is an arrangement in which the Group has joint control, whereby the Group has rights to the net assets of the arrangement, rather than rights to its assets and obligations for its liabilities.
Interests in associates and joint ventures are accounted for using the equity method. They are initially recognized at cost, which includes transaction costs. Subsequent to initial recognition, the consolidated financial statements include the Group’s share of the profit or loss and other comprehensive income (OCI) of equity-accounted investees, until the date on which significant influence or joint control ceases.
As at 31 December 2021 and 31 December 2020, the Group’s interests in equity-accounted investees comprise its interest in one joint venture.
|
|
vi.
|
Transactions eliminated on consolidation
|
Intra-group balances and transactions, and any unrealized income and expenses (except for foreign currency transaction gains or losses) arising from intra-group transactions, are eliminated. Unrealized gains arising from transactions with equity-accounted investees are eliminated against the investment to the extent of the Group’s interest in the investee. Unrealized losses are eliminated in the same way as unrealized gains, but only to the extent that there is no evidence of impairment.
|
B.
|
Foreign currency
|
|
|
i.
|
Foreign currency transactions
|
Transactions in foreign currencies are translated into the respective functional currencies of Group companies at the exchange rates at the dates of the transactions.
Monetary assets and liabilities denominated in foreign currencies are translated into the functional currency at the exchange rate at the reporting date. Non-monetary assets and liabilities that are measured at fair value in a foreign currency are translated into the functional currency at the exchange rate when the fair value was determined. Non-monetary items that are measured based on historical cost in a foreign currency are translated at the exchange rate at the date of the transaction. Foreign currency differences are generally recognized in profit or loss and presented within finance costs.
F-20
WALLBOX N.V.
Notes to the consolidated financial statements
However, foreign currency differences arising from the translation of the following items are recognized in OCI:
|
|
•
|
|
an investment in equity securities designated as at FVTOCI (except on impairment, in which case foreign currency differences that have been recognized in OCI are reclassified to profit or loss);
|
|
|
•
|
|
a financial liability designated as a hedge of the net investment in a foreign operation to the extent that the hedge is effective; and
|
|
|
•
|
|
qualifying cash flow hedges to the extent that the hedges are effective.
|
|
|
ii.
|
Foreign currency operations
|
The assets and liabilities of foreign operations, including goodwill and fair value adjustments arising on acquisition, are translated into Euros at the exchange rates at the reporting date. The income and expenses of foreign operations are translated into Euros at the exchange rates at the dates of the transactions.
Foreign currency differences are recognized in OCI and accumulated in the translation reserve, except to the extent that the translation difference is allocated to NCI.
When a foreign operation is disposed of in its entirety or partially such that control, significant influence or joint control is lost, the cumulative amount in the translation reserve related to that foreign operation is reclassified to profit or loss as part of the gain or loss on disposal. If the Group disposes of part of its interest in a subsidiary but retains control, then the relevant proportion of the cumulative amount is reattributed to NCI. When the Group disposes of only part of an associate or joint venture while retaining significant influence or joint control, the relevant proportion of the cumulative amount is reclassified to profit or loss.
|
C.
|
Revenue from contracts with customers
|
The Company develops, manufactures and retails the charging solutions for EVs, which includes electronic chargers and other services.
Revenue from contracts with customers is recognized when control of the goods or services are transferred to the customer at an amount that reflects the consideration to which the Group expects to be entitled in exchange for those goods or services.
Sale of chargers
Revenue from the sale of chargers is recognized at the point in time when control of the asset is transferred to the customer, generally when the charger leaves the Company warehouse.
The Group considers whether there are other promises in the contract that are separate performance obligations to which a portion of the transaction price needs to be allocated (e.g., warranties). In determining the transaction price for the sale of chargers, the Group considers the effects of variable consideration (if any).
Contracts with customer do not include variable payments or significant financing components. There are no obligations for returns, refunds or similar, other than regular warrant liabilities for products that are working unproperly based on warranty laws and regulations in each country in which Wallbox operates. These warranties are not considered a separate performance obligation under the contract.
Sale of services
Revenue related to the rendering of services mainly consists of installation services.
F-21
WALLBOX N.V.
Notes to the consolidated financial statements
Revenue from contracts with customers for installation services is recognized when control of the services is transferred to the customer (at a point in time given the short period that the service is rendered) at an amount that reflects the consideration to which the Group expects to be entitled in exchange for those services.
The sale of installation services is always made in combination with the sale of a charger, although they are considered as distinct performance obligations. Delivery of the charger and the installation services does not always happen at the same time, leading, in some cases, to chargers being delivered to customers with the installation pending. Therefore, this is recognized as deferred revenue when invoicing both services prior to rendering the installation services (see contract liabilities below).
Extended warranties
As required by law, the Group typically provides warranties for the general repair of faults that existed at the time of sale. These assurance-type warranties are accounted for as warranty provisions. Refer to the accounting policy on warranty provisions in section n) Provisions.
The Group also provides extended warranties (beyond its legal obligation) for the repair of faults that existed at the time of sale. These service type warranties are sold either separately or bundled together with the sale of the charger.
Contracts for bundled sales of chargers and service-type warranties comprise two performance obligations because the charger and service-type warranty are both sold on a stand-alone basis and are distinct within the context of the contract. Using the relative stand-alone selling price method, a portion of the transaction price is allocated to the service-type warranty and recognized as a contract liability. Revenue for service-type warranties is recognized over the period in which the service is provided based on the time elapsed.
Contract liabilities
A contract liability is recognized if a payment is received or a payment is due (whichever is earlier) from a customer before the Group transfers the related goods or services. Contract liabilities are recognized as revenue when the Group performs under the contract (i.e., transfers control of the related goods or services to the customer).
|
D.
|
Employee benefits
|
|
i.
|
Short – term employee benefits
|
Short-term employee benefits are expensed as the related service is provided. A liability is recognized for the amount expected to be paid if the Group has a present legal or constructive obligation to pay this amount as a result of past service provided by the employee and the obligation can be estimated reliably.
|
ii.
|
Share-based payment arrangements
|
The grant-date fair value of equity-settled share-based payment arrangements granted to employees is generally recognized as an expense, with a corresponding increase in equity, over the vesting period of the awards. The amount recognized as an expense is adjusted to reflect the number of awards for which the related service and
non-market
performance conditions are expected to be met, such that the amount ultimately recognized is based on the number of awards that meet the related service and
non-market
performance conditions at the vesting date.
F-22
WALLBOX N.V.
Notes to the consolidated financial statements
|
iii.
|
Termination benefits
|
Termination benefits are expensed at the earlier of when the Group can no longer withdraw the offer of those benefits and when the Group recognizes costs for a restructuring process. If benefits are not expected to be settled wholly within 12 months of the reporting date, they are discounted.
|
E.
|
Finance income and finance costs
|
The Group´s finance income and finance costs include:
| • |
interest income;
|
| • |
interest expense;
|
| • |
the foreign currency gain or loss on financial assets and financial liabilities;
|
| • |
valuation of convertible bonds and derivatives warrant liabilities at FVTPL;
|
| • |
the net gain or loss on the disposal of investments in debt securities measured at FVTOCI;
|
| • |
impairment losses (and reversals) on investments in debt securities carried at amortized cost or FVTOCI.
|
Interest income or expense is recognized using the effective interest method. Dividend income is recognized in profit or loss on the date on which the Group’s right to receive payment is established.
The ‘effective interest rate’ is the rate that exactly discounts estimated future cash payments or receipts through the expected life of the financial instrument to:
| • |
the gross carrying amount of the financial asset; or
|
| • |
the amortized cost of the financial liability.
|
In calculating interest income and expense, the effective interest rate is applied to the gross carrying amount of the asset (when the asset is not credit-impaired) or to the amortized cost of the liability. However, for financial assets that have become credit-impaired subsequent to initial recognition, interest income is calculated by applying the effective interest rate to the amortized cost of the financial asset. If the asset is no longer credit-impaired, then the calculation of interest income reverts to the gross basis.
|
F.
|
Income tax
|
Income tax expense comprises current and deferred tax. It is recognized in profit or loss except to the extent that it relates to a business combination, or items recognized directly in equity or in OCI.
The Group has determined that interest and penalties related to income taxes, including uncertain tax treatments, do not meet the definition of income taxes, and has therefore accounted for them under IAS 37
.
Provisions, Contingent Liabilities and Contingent Assets
|
i.
|
Current tax
|
Current tax comprises the expected tax payable or receivable on the taxable income or loss for the year and any adjustment to the tax payable or receivable in respect of previous years. The amount of current tax payable or receivable is the best estimate of the tax amount expected to be paid or received that reflects any uncertainty related to income taxes. It is measured using tax rates enacted or substantively enacted at the reporting date. Current tax also includes any tax arising from dividends.
F-23
WALLBOX N.V.
Notes to the consolidated financial statements
Current tax assets and liabilities are offset only if certain criteria are met.
|
|
ii.
|
Deferred tax
|
Deferred tax is recognized in respect of temporary differences between the carrying amounts of assets and liabilities for financial reporting purposes and the amounts used for taxation purposes. Deferred tax is not recognized for:
|
|
•
|
|
temporary differences on the initial recognition of assets or liabilities in a transaction that is not a business combination and that affects neither accounting nor taxable profit or loss;
|
|
|
•
|
|
temporary differences related to investments in subsidiaries, associates and jointly-controlled entities to the extent that the Group is able to control the timing of the reversal of the temporary differences and it is probable that they will not reverse in the foreseeable future; and
|
|
|
•
|
|
taxable temporary differences arising on the initial recognition of goodwill.
|
Deferred tax assets are recognized for unused tax losses and deductible temporary differences to the extent that it is probable that future taxable profits will be available against which they can be used. Future taxable profits are determined based on the reversal of relevant taxable temporary differences. If the amount of taxable temporary differences is insufficient to recognize a deferred tax asset in full, then future taxable profits, adjusted for reversals of existing temporary differences, are considered, based on the business plans for individual subsidiaries in the Group. Deferred tax assets are reviewed at each reporting date and are reduced to the extent that it is no longer probable that the related tax benefit will be realized; such reductions are reversed when the probability of future taxable profits improves.
Unrecognized deferred tax assets are reassessed at each reporting date and recognized to the extent that it has become probable that future taxable profits will be available against which they can be used.
Deferred tax is measured at the tax rates that are expected to be applied to temporary differences when they reverse, using tax rates enacted or substantively enacted at the reporting date, and reflects any uncertainty related to income taxes, if any.
|
|
iii.
|
Tax credit receivables
|
As per the accounting policy choice, tax credit receivables derived from government incentive schemes delivered through the tax system are accounted for using IAS 12 by analogy, as it has been concluded that it reflects better the economic substance of the incentive (tax allowance for R&D investments) rather than applying IAS 20
. Consequently, these incentives are presented in profit or loss as a deduction from the current tax expense to the extent that the entity is entitled to claim the credit in the current reporting period, and as tax credit receivables in the statement of financial position.
Government Grants
|
G.
|
Inventories
|
Inventories are valued at the lower of cost and net realizable value. Costs incurred in bringing each product to its present location and condition are accounted for, as follows:
|
|
•
|
|
Raw materials: purchase cost on a
first-in/first-out
|
|
|
•
|
|
Finished goods and work in progress: cost of direct materials and labor and a proportion of manufacturing overheads based on the normal operating capacity but excluding borrowing costs.
|
Net realizable value is the estimated selling price in the ordinary course of business, less estimated costs of completion and the estimated costs necessary to make the sale.
F-24
WALLBOX N.V.
Notes to the consolidated financial statements
|
H.
|
Property, plant and equipment
|
|
|
i.
|
Recognition and measurement
|
Items of property, plant and equipment are measured at cost, which includes capitalized borrowing costs when their construction or manufacture takes more than a year, less accumulated depreciation and any accumulated impairment losses Assets under construction are also measured at cost plus capitalized borrowing costs when their construction or manufacture takes more than one year and are not depreciated until they are ready for use.
If significant parts of an item of property, plant and equipment have different useful lives, then they are accounted for as separate items (major components) of property, plant and equipment.
Any gain or loss on disposal of an item of property, plant and equipment is recognized in profit or loss.
|
|
ii.
|
Subsequent expenditure
|
Subsequent expenditure is capitalized only if it is probable that the future economic benefits associated with the expenditure will flow to the Group.
|
iii.
|
Depreciation
|
Depreciation is calculated to write off the cost of items of property, plant and equipment, less their estimated residual values using the straight-line method over their estimated useful lives and is generally recognized in profit or loss. Property, plant and equipment will be depreciated from the moment they are ready for use. Land is not depreciated.
The estimated useful lives of property, plant and equipment for current and comparative periods are as follows:
|
Useful life (years)
|
||
|
Buildings
|
|
|
|
Technical installations
|
|
|
|
Machinery
|
|
|
|
Equipment
|
|
|
|
Furniture
|
|
|
|
IT equipment
|
|
|
|
Motor vehicles
|
|
|
|
Leasehold improvements
|
(*) | |
|
Other property, plant and equipment
|
|
|
|
(*)
|
The shorter of the lease term or useful life of the asset.
|
Depreciation methods, useful lives and residual values are reviewed at each reporting date and adjusted if appropriate.
|
I.
|
Intangible assets and goodwill
|
|
|
i.
|
Recognition and measurement
|
Goodwill:
F-2
5
WALLBOX N.V.
Notes to the consolidated financial statements
Research and development:
Development expenditure is capitalized only if the expenditure can be measured reliably, the product or process is technically and commercially feasible, future economic benefits are probable, and the Group intends to and has sufficient resources to complete development and to use or sell the asset. Otherwise, it is recognized in profit or loss as incurred. Subsequent to initial recognition, development expenditure is measured at cost less accumulated amortization and any accumulated impairment losses.
Other intangible assets:
|
|
ii.
|
Subsequent expenditure
|
Subsequent expenditure is capitalized only when it increases the future economic benefits embodied in the specific asset to which it relates. All other expenditure, including expenditure on internally generated goodwill and brands, is recognized in profit or loss as incurred.
|
|
iii.
|
Amortization
|
Amortization is calculated to write off the cost of intangible assets less their estimated residual values using the straight-line method over their estimated useful lives and is generally recognized in profit or loss. Goodwill is not amortized.
The estimated useful lives for current and comparative periods are as follows:
|
Useful life (years)
|
||
|
Patents
|
(*) | |
|
Customer relationships
|
|
|
|
Trademarks
|
|
|
|
Computer software
|
6
|
|
|
Development
|
|
|
|
(*)
|
the shorter of legal or useful life of the asset.
|
Amortization methods, useful lives and residual values are reviewed at each reporting date and adjusted if appropriate.
|
J.
|
Financial instruments
|
|
i.
|
Recognition and initial measurement
|
Trade receivables and debt securities issued are initially recognized when they are originated. All other financial assets and financial liabilities are initially recognized when the Group becomes a party to the contractual provisions of the instrument.
A financial asset (unless it is a trade receivable without a significant financing component) or financial liability is initially measured at fair value plus or minus, for an item not at FVTPL, transaction costs that are directly attributable to its acquisition or issue. A trade receivable without a significant financing component is initially measured at the transaction price.
F-2
6
WALLBOX N.V.
Notes to the consolidated financial statements
|
|
ii.
|
Classification and subsequent measurement
|
Financial assets
On initial recognition, a financial asset is classified as measured at: amortized cost; FVTOCI – debt investment; FVTOCI – equity investment; or FVTPL.
Financial assets are not reclassified subsequent to their initial recognition unless the Group changes its business model for managing financial assets, in which case all affected financial assets are reclassified on the first day of the first reporting period following the change in the business model.
A financial asset is measured at amortized cost if it meets both of the following conditions and is not designated as at FVTPL:
|
|
•
|
|
it is held within a business model whose objective is to hold assets to collect contractual cash flows; and
|
|
|
•
|
|
its contractual terms give rise on specified dates to cash flows that are solely payments of principal and interest on the principal amount outstanding.
|
A hedge fund investment is measured at FVTOCI if it meets both of the following conditions and is not designated as at FVTPL:
|
|
•
|
|
it is held within a business model whose objective is achieved by both collecting contractual cash flows and selling financial assets; and
|
|
|
•
|
|
its contractual terms give rise on specified dates to cash flows that are solely payments of principal and interest on the principal amount outstanding.
|
On initial recognition of an equity investment that is not held for trading, the Group may irrevocably elect to present subsequent changes in the investment’s fair value in OCI. This election is made on an investment-by-investment basis.
All financial assets not classified as measured at amortized cost or FVTOCI as described above are measured at FVTPL. On initial recognition, the Group may irrevocably designate a financial asset that otherwise meets the requirements to be measured at amortized cost or at FVTOCI as at FVTPL if doing so eliminates or significantly reduces an accounting mismatch that would otherwise arise.
Financial assets – Business model assessment
The Group makes an assessment of the objective of the business model in which a financial asset is held at a portfolio level because this best reflects the way the business is managed and information is provided to management. The information considered includes:
|
|
•
|
|
the stated policies and objectives for the portfolio and the operation of those policies in practice. These include whether management’s strategy focuses on earning contractual interest income, maintaining a particular interest rate profile, matching the duration of the financial assets to the duration of any related liabilities or expected cash outflows or realizing cash flows through the sale of the assets;
|
|
|
•
|
|
how the performance of the portfolio is evaluated and reported to the Group’s management;
|
|
|
•
|
|
the risks that affect the performance of the business model (and the financial assets held within that business model) and how those risks are managed;
|
|
|
•
|
|
how managers of the business are compensated – e.g. whether compensation is based on the fair value of the assets managed or the contractual cash flows collected; and
|
|
|
•
|
|
the frequency, volume and timing of sales of financial assets in prior periods, the reasons for such sales and expectations about future sales activity.
|
F-27
WALLBOX N.V.
Notes to the consolidated financial statements
Transfers of financial assets to third parties in transactions that do not qualify for derecognition are not considered sales for this purpose, consistent with the Group’s continuing recognition of the assets.
Financial assets that are held for trading or are managed and whose performance is evaluated on a fair value basis are measured at FVTPL.
Financial assets – Assessment whether contractual cash flows are solely payments of principal and interest
For the purposes of this assessment, ‘principal’ is defined as the fair value of the financial asset on initial recognition. ‘Interest’ is defined as consideration for the time value of money and for the credit risk associated with the principal amount outstanding during a particular period of time and for other basic lending risks and costs (e.g. liquidity risk and administrative costs), as well as a profit margin.
In assessing whether the contractual cash flows are solely payments of principal and interest, the Group considers the contractual terms of the instrument. This includes assessing whether the financial asset contains a contractual term that could change the timing or amount of contractual cash flows such that it would not meet this condition. In making this assessment, the Group considers:
|
|
•
|
|
contingent events that would change the amount or timing of cash flows;
|
|
|
•
|
|
terms that may adjust the contractual coupon rate, including variable-rate features;
|
|
|
•
|
|
prepayment and extension features; and
|
|
|
•
|
|
terms that limit the Group’s claim to cash flows from specified assets (e.g. non-recourse features).
|
A prepayment feature is consistent with the solely payments of principal and interest criterion if the prepayment amount substantially represents unpaid amounts of principal and interest on the principal amount outstanding, which may include reasonable compensation for early termination of the contract. Additionally, for a financial asset acquired at a discount or premium to its contractual per par amount, a feature that permits or requires prepayment at an amount that substantially represents the contractual par amount plus accrued (but unpaid) contractual interest (which may also include reasonable compensation for early termination) is treated as consistent with this criterion if the fair value of the prepayment feature is insignificant at initial recognition.
Financial assets at FVTPL:
Financial assets at amortized cost:
Debt investments at FVTOCI:
Equity investments at FVTOCI:
Financial liabilities – Classification, subsequent measurement and gains and losses
F-28
WALLBOX N.V.
Notes to the consolidated financial statements
Financial liabilities are classified as measured at amortized cost or FVTPL. A financial liability is classified as at FVTPL if it is classified as held-for-trading, it is a derivative, or it is designated as such on initial recognition. Financial liabilities at FVTPL are measured at fair value and net gains and losses, including any interest expense, are recognized in profit or loss. Other financial liabilities are subsequently measured at amortized cost using the effective interest method. Interest expense and foreign exchange gains and losses are recognized in profit or loss. Any gain or loss on derecognition is also recognized in profit or loss.
The Group financial liabilities include trade and other financial payables, other payables, loans and borrowings, convertible bonds, put option liabilities and warrants.
Changes in the carrying amount of the put option liability recognized in a business combination (see policy choice explained in Note 5.A.i) are recognized in profit or loss. Any potential dividends paid to the other shareholders are recognized as an expense in the consolidated financial statements. If the put option liability is exercised, the financial liability is extinguished by the payment of the exercise price.
Warrants are accounted for as derivative financial instruments under financial liabilities at fair value through profit or loss (they are accounted as such if the characteristics of the warrant meet the definition of a derivative), as commented in Note 13. Such derivative financial instruments were initially recognized at fair value and subsequently remeasured at fair value through profit or loss.
|
iii.
|
Derecognition
|
Financial assets
The Group derecognizes a financial asset when:
| • |
the contractual rights to the cash flows from the financial asset expire; or
|
| • |
it transfers the rights to receive the contractual cash flows in a transaction in which either:
|
| 1. |
substantially all the risks and rewards of ownership of the financial asset are transferred; or
|
| 2. |
the Group neither transfers nor retains substantially all the risks and rewards of ownership and it does not retain control of the financial asset.
|
The Group enters into transactions whereby it transfers assets recognized in its statement of financial position but retains either all or substantially all the risks and rewards of the transferred assets. In these cases, the transferred assets are not derecognized.
Financial liabilities
The Group derecognizes a financial liability when its contractual obligations are discharged or cancelled or expire. The Group also derecognizes a financial liability when its terms are modified and the cash flows of the modified liability are substantially different, in which case a new financial liability based on the modified terms is recognized at fair value.
On derecognition of a financial liability, the difference between the carrying amount extinguished and the consideration paid (including any non-cash assets transferred or liabilities assumed) is recognized in profit or loss. The cashflows regarding financial liabilities are presented gross in the statement of cash flows regardless of their maturity date.
|
iv.
|
Offsetting
|
Financial assets and financial liabilities are offset and the net amount presented in the statement of financial position when, and only when, the Group currently has a legally enforceable right to set off the amounts and it intends either to settle them on a net basis or to realize the asset and settle the liability simultaneously.
F-29
WALLBOX N.V.
Notes to the consolidated financial statements
|
K.
|
Share capital
|
|
i.
|
Ordinary shares
|
Incremental costs directly attributable to the issue of ordinary shares are recognized as a deduction from equity. Income tax relating to transaction costs of an equity transaction is accounted for in accordance with IAS 12.
|
ii.
|
Repurchase and reissue of ordinary shares (treasury shares)
|
When shares recognized as equity are repurchased, the amount of the consideration paid, which includes directly attributable costs, is recognized as a deduction from equity. Repurchased shares are classified as treasury shares and are presented in the treasury share reserve. When treasury shares are sold or reissued subsequently, the amount received is recognized as an increase in equity and the resulting surplus or deficit on the transaction is presented within share premium.
|
L.
|
Compound financial instruments
|
Compound financial instruments issued by the Group comprise convertible bonds denominated in Euros that can be converted to ordinary shares at the option of the holder, when the number of shares to be issued is fixed and does not vary with changes in fair value.
The liability component of compound financial instruments is initially recognized at the fair value of a similar liability that does not have an equity conversion option. The equity component is initially recognized at the difference between the fair value of the compound financial instrument as a whole and the fair value of the liability component, and the equity component is nil. Any directly attributable transaction costs are allocated to the liability and equity components in proportion to their initial carrying amounts.
Subsequent to initial recognition, the liability component of a compound financial instrument is measured at amortized cost using the effective interest method. The equity component of a compound financial instrument is not remeasured.
Interest related to the financial liability is recognized in profit or loss. On conversion at maturity, the financial liability is reclassified to equity and no gain or loss is recognized.
|
M.
|
Impairment
|
|
i.
|
Non-derivative
financial assets
|
Financial instruments and contract assets
The Group recognizes loss allowances for ECLs on:
| • |
financial assets measured at amortized cost;
|
| • |
debt investments measured at FVTOCI; and
|
| • |
contract assets.
|
The Group measures loss allowances at an amount equal to lifetime ECLs, except for the following, which are measured at 12-month ECLs:
| • |
debt securities that are determined to have low credit risk at the reporting date; and
|
| • |
other debt securities and bank balances for which credit risk (i.e. the risk of default occurring over the expected life of the financial instrument) has not increased significantly since initial recognition.
|
F-30
WALLBOX N.V.
Notes to the consolidated financial statements
Loss allowances for trade receivables (including lease receivables) and contract assets are always measured at an amount equal to lifetime ECLs.
When determining whether the credit risk of a financial asset has increased significantly since initial recognition and when estimating ECLs, the Group considers reasonable and supportable information that is relevant and available without undue cost or effort. This includes both quantitative and qualitative information and analysis, based on the Group’s historical experience and informed credit assessment, that includes forward-looking information.
The Group assumes that the credit risk on a financial asset has increased significantly if it is more than 30 days past due.
The Group considers a financial asset to be in default when the debtor is unlikely to pay its credit obligations to the Group in full, without recourse by the Group to actions such as realizing security (if any is held).
Lifetime ECLs are the ECLs that result from all possible default events over the expected life of a financial instrument.
12-month ECLs are the portion of ECLs that result from default events that are possible within the 12 months after the reporting date (or a shorter period if the expected life of the instrument is less than 12 months). The maximum period considered when estimating ECLs is the maximum contractual period over which the Group is exposed to credit risk.
Measurement of ECLs
ECLs are a probability-weighted estimate of credit losses. Credit losses are measured as the present value of all cash shortfalls (i.e. the difference between the cash flows due to the entity in accordance with the contract and the cash flows that the Group expects to receive).
ECLs are discounted at the effective interest rate of the financial asset.
Credit-impaired financial assets
At each reporting date, the Group assesses whether financial assets carried at amortized cost and debt securities at FVTOCI are credit-impaired. A financial asset is ‘credit-impaired’ when one or more events that have a detrimental impact on the estimated future cash flows of the financial asset have occurred.
Evidence that a financial asset is credit-impaired includes the following observable data:
| • |
significant financial difficulty of the debtor;
|
| • |
a breach of contract such as a default or being more than 90 days past due;
|
| • |
the restructuring of a loan or advance by the Group on terms that the Group would not consider otherwise;
|
| • |
it is probable that the debtor will enter bankruptcy or other financial reorganization; or
|
| • |
the disappearance of an active market for a security because of financial difficulties.
|
Presentation of allowance for ECL in the statement of financial position
Loss allowances for financial assets measured at amortized cost are deducted from the gross carrying amount of the assets.
F-31
WALLBOX N.V.
Notes to the consolidated financial statements
Write-off
The gross carrying amount of a financial asset is written off when the Group has no reasonable expectations of recovering a financial asset in its entirety or a portion thereof. For individual customers, the Group has a policy of writing off the gross carrying amount when the financial asset is 180 days past due based on historical experience of recoveries of similar assets. For corporate customers, the Group individually makes an assessment with respect to the timing and amount of write-off based on whether there is a reasonable expectation of recovery. The Group expects no significant recovery from the amount written off. However, financial assets that are written off could still be subject to enforcement activities in order to comply with the Group’s procedures for recovery of amounts due.
|
ii.
|
Non-financial
assets
|
At each reporting date, the Group reviews the carrying amounts of its non-financial assets (other than inventories, contract assets and deferred tax assets) to determine whether there is any indication of impairment. If any such indication exists, then the asset’s recoverable amount is estimated. Goodwill is tested at least annually for impairment.
For impairment testing, assets are grouped together into the smallest group of assets that generates cash inflows from continuing use that are largely independent of the cash inflows of other assets or Cash Generating Units (CGUs). Goodwill arising from a business combination is allocated to CGUs or groups of CGUs that are expected to benefit from the synergies of the combination.
An impairment loss is recognized if the carrying amount of an asset or CGU exceeds its recoverable amount.
The recoverable amount of an asset or CGU is the higher of its fair value less costs of disposal and its value in use. Value in use is based on the estimated future cash flows, discounted to their present value using a pre-tax discount rate that reflects current market assessments of the time value of money and the risks specific to the asset or CGU.
Impairment losses are recognized in profit or loss. They are allocated first to reduce the carrying amount of any goodwill allocated to the CGU, and then to reduce the carrying amounts of the other assets in the CGU on a pro rata basis.
An impairment loss in respect of goodwill is not reversed. For other assets, an impairment loss is reversed only to the extent that the asset’s carrying amount does not exceed the carrying amount that would have been determined, net of depreciation or amortization, if no impairment loss had been recognized.
|
N.
|
Provisions
|
Provisions are determined by discounting the expected future cash flows at a pre-tax rate that reflects current market assessments of the time value of money and the risks specific to the liability. The unwinding of the discount is recognized as a finance cost.
Warranties
|
O.
|
Grants
|
Government grants are recognized where there is reasonable assurance that the grant will be received, and all attached conditions will be complied with. When the grant relates to an expense item, it is recognized as
F-32
WALLBOX N.V.
Notes to the consolidated financial statements
income on a systematic basis over the periods that the related costs it is intended to compensate, are expensed. When the grant relates to an asset, it is recognized as income in equal amounts over the expected useful life of the related asset.
When the Group receives grants of
non-monetary
assets, the asset and the grant are recorded at nominal amounts and released to profit or loss over the expected useful life of the asset, based on the pattern of consumption of the benefits of the underlying asset by equal annual instalments.
|
P.
|
Convertible bonds
|
For the convertible bonds issued in March 2020 and January 2021 their liability components were initially recognized at the fair value of a similar liability that did not have an equity conversion option. The determination of this fair value was based on an estimated incremental rate which reflects the risk of the country where the company is located, the currency of payments, the specific risk of the sector and the company’s particular situation, in order to determine the discount factor estimates needed to be made in respect of the risk-free rate, the country risk premium and the credit spread are considered.
The equity component was initially recognized as the difference between the fair value of the compound financial instrument as a whole and the fair value of the liability component. The equity component at issue date was estimated to be nil as the fair value of the liability component was calculated to be close to the fair value of the compound financial instrument as a whole.
Subsequent to initial recognition, the liability component of the compound financial instrument was measured at amortized cost using the effective interest method. The equity component was not remeasured in the following periods. (See Note 13).
Regarding the convertible bond issued in April 2021, the Company concluded that it was a hybrid instrument that contained a
non-derivative
financial instrument which comprised an obligation for the issuer to settle in cash or by a way of delivering a variable amount of its own equity instruments and embedded derivatives with different probabilities of contingent events occurring. The Company elected to measure the hybrid contract at fair value through profit or loss.
|
Q.
|
Leases (the Group as a lessee)
|
At inception of a contract, the Group assesses whether a contract is, or contains, a lease. A contract is, or contains, a lease if the contract conveys the right to control the use of an identified asset for a period of time in exchange for consideration.
At commencement or on modification of a contract that contains a lease component, the Group allocates the consideration in the contract to each lease component on the basis of its relative stand-alone prices. However, for the leases of property, the Group has elected not to separate non-lease components and account for the lease and non-lease components as a single lease component.
The Group recognizes a right-of-use asset and a lease liability at the lease commencement date. The right-of-use asset is initially measured at cost, which comprises the initial amount of the lease liability adjusted for any lease payments made at or before the commencement date, plus any initial direct costs incurred and an estimate of costs to dismantle and remove the underlying asset or to restore the underlying asset or the site on which it is located, less any lease incentives received.
The right-of-use asset is subsequently depreciated using the straight-line method from the commencement date to the end of the lease term, unless the lease transfers ownership of the underlying asset to the Group by the end of the lease term or the cost of the right-of-use asset reflects that the Group will exercise a purchase
F-33
WALLBOX N.V.
Notes to the consolidated financial statements
option. In that case the right-of-use asset will be depreciated over the useful life of the underlying asset, which is determined on the same basis as that of property, plant and equipment. In addition, the right-of-use asset is periodically reduced by impairment losses, if any, and adjusted for certain remeasurements of the lease liability.
The lease liability is initially measured at the present value of the lease payments that are not paid at the commencement date, discounted using the interest rate implicit in the lease or, if that rate cannot be readily determined, the Group’s incremental borrowing rate. Generally, the Group uses its incremental borrowing rate as the discount rate.
The Group determines its incremental borrowing rate by obtaining interest rates from various external financing sources and makes certain adjustments to reflect the terms of the lease and type of the asset leased.
Lease payments included in the measurement of the lease liability comprise the following:
| • |
fixed payments, including in-substance fixed payments;
|
| • |
variable lease payments that depend on an index or a rate, initially measured using the index or rate as at the commencement date;
|
| • |
amounts expected to be payable under a residual value guarantee; and
|
| • |
the exercise price under a purchase option that the Group is reasonably certain to exercise, lease payments in an optional renewal period if the Group is reasonably certain to exercise an extension option, and penalties for early termination of a lease unless the Group is reasonably certain not to terminate early.
|
The lease liability is measured at amortized cost using the effective interest method. It is remeasured when there is a change in future lease payments arising from a change in an index or rate, if there is a change in the Group’s estimate of the amount expected to be payable under a residual value guarantee, if the Group changes its assessment of whether it will exercise a purchase, extension or termination option or if there is a revised in-substance fixed lease payment.
When the lease liability is remeasured in this way, a corresponding adjustment is made to the carrying amount of the right-of-use asset or it is recorded in profit or loss if the carrying amount of the right-of-use asset has been reduced to zero.
Short-term leases and leases of
low-value
assets
The Group has elected not to recognize right-of-use assets and lease liabilities for leases of low-value assets and short-term leases, including IT equipment. The Group recognizes the lease payments associated with these leases as an expense on a straight-line basis over the lease term.
|
R.
|
Fair value measurement
|
‘Fair value’ is the price that would be received to sell an asset or paid to transfer a liability in an orderly transaction between market participants at the measurement date in the principal or, in its absence, the most advantageous market to which the Group has access at that date. The fair value of a liability reflects its non-performance risk.
Several of the Group’s accounting policies and disclosures require the measurement of fair values, for both financial and non-financial assets and liabilities.
F-34
WALLBOX N.V.
Notes to the consolidated financial statements
The Group measures the fair value of an instrument using the quoted price in an active market for that instrument, if that price is available. A market is regarded as ‘active’ if transactions for the asset or liability take place with sufficient frequency and volume to provide pricing information on an ongoing basis.
If there is no quoted price in an active market, then the Group uses valuation techniques that maximize the use of relevant observable inputs and minimize the use of unobservable inputs. The chosen valuation technique incorporates all the factors that market participants would take into account in pricing a transaction.
If an asset or a liability measured at fair value has a bid price and an ask price, then the Group measures assets and long positions at a bid price and liabilities and short positions at an ask price.
The best evidence of the fair value of a financial instrument on initial recognition is normally the transaction price – i.e. the fair value of the consideration given or received. If the Group determines that the fair value on initial recognition differs from the transaction price and the fair value is evidenced neither by a quoted price in an active market for an identical asset or liability nor based on a valuation technique for which any unobservable inputs are judged to be insignificant in relation to the measurement, then the financial instrument is initially measured at fair value, adjusted to defer the difference between the fair value on initial recognition and the transaction price. Subsequently, that difference is recognized in profit or loss on an appropriate basis over the life of the instrument but no later than when the valuation is wholly supported by observable market data or the transaction is closed out.
The Group uses observable market data as far as possible. Fair values are categorized into different levels in a fair value hierarchy based on the inputs used in the valuation techniques as follows.
Level 1: quoted prices (unadjusted) in active markets for identical assets or liabilities.
Level 2: inputs other than quoted prices included in Level 1 that are observable for the asset or liability, either directly (i.e. as prices) or indirectly (i.e. derived from prices).
Level 3: inputs for the asset or liability that are not based on observable market data (unobservable inputs).
If the inputs used to measure the fair value of an asset or a liability fall into different levels of the fair value hierarchy, then the fair value measurement is categorized in its entirety in the same level of the fair value hierarchy as the lowest level input that is significant to the entire measurement.
The Group recognizes transfers between levels of the fair value hierarchy at the end of the reporting period during which the change has occurred.
Further information about the assumptions made in measuring fair values is included in the following notes:
Note 21 – Employee benefits (share-based payment arrangements);
Note 13 – Financial assets and financial liabilities; and
Note 6 – Business combinations.
|
S.
|
Cash and cash equivalents
|
Cash and cash equivalents comprise cash balances and call deposits with an original maturity of three months or less.
|
6.
|
BUSINESS COMBINATIONS AND CAPITAL REORGANIZATION
|
A – Transaction with Wallbox Chargers and Kensington
The Business Combination Agreement involved the execution of the following steps agreed between the parties with the sole aim of performing an Initial Public Offering (IPO) to list on the New York Stock
F-35
WALLBOX N.V.
Notes to the consolidated financial statements
Exchange (NYSE) and integrating new investors, and does not qualify as business combination under IFRS 3, as explained further on:
| a) |
Incorporating up Wallbox B.V. in the Netherlands on 7 June 2021;
|
| b) |
Converting Wallbox Chargers convertible bonds into shares of Wallbox Chargers on 16 September 2021;
|
| c) |
Converting Wallbox B.V. into Wallbox N.V.;
|
| d) |
Reverse subsidiary merger between Orion Merger Sub Corp. with Kensington Capital Acquisition Corp. II (Kensington);
|
| e) |
Share-for-share
|
| f) |
Share-for-share
|
| g) |
PIPE investment;
|
| h) |
Listing;
|
Steps c to g took place at the same time at the Closing date of 1 October 2021. Listing on the NYSE started on 4 October 2021. Regarding steps e to g, on the Closing Date of 1 October 2021:
| i. |
each outstanding Class A ordinary share of Wallbox Chargers, S.L. (including each such share resulting from the conversion of convertible bonds of Wallbox Chargers, S.L. prior to the Closing Date by the noteholders thereof), and each outstanding Class B ordinary share was exchanged by means of a contribution in kind in exchange for the issuance of a number of Class A Shares or Wallbox Class B Shares by Wallbox N.V., as applicable, determined in each case by reference to an “Exchange Ratio,” calculated in accordance with the Business Combination Agreement (240.990795184659). All Wallbox shareholders, other than Enric Asunción Escorsa and Eduard Castañeda, received Wallbox Class A Shares in the exchange. Both Enric Asunción Escorsa and Eduard Castañeda received Class B Shares in the share capital of Wallbox;
|
| ii. |
each share of Kensington Class A Common Stock and Kensington Class B Common Stock outstanding immediately prior to the effective date of the merger with Orion Merger Sub Corp. (the “Merger Effective Time”) was converted into and become one share of new Kensington common stock, and each such share of new Kensington common stock was immediately thereafter exchanged by means of a contribution in kind in exchange for the issuance of Class A Shares of Wallbox N.V., whereby Wallbox N.V. issued one Class A Share for each share of new Kensington common stock exchanged;
|
| iii. |
In connection with the foregoing and concurrently with the execution of the Business Combination Agreement on 29 September 2021, Kensington and Wallbox N.V. entered into Subscription Agreements (the “Subscription Agreements”) with certain investors (the “PIPE Investors”), pursuant to which the PIPE Investors agreed to subscribe to, and Wallbox N.V. agreed to issue to such PIPE Investors, an aggregate of
|
Wallbox N.V. had been incorporated on 7 June 2021, with ten shares of Euros 0.12, with the sole aim of reorganizing the previous group headed by Wallbox Chargers and to execute the Business Combination Agreement to implement the IPO of shares (new and old shares) to be listed on the NYSE. Consequently, all the steps were designed as a single transaction with a single aim (listing Wallbox Chargers’ business on the NYSE and integrating new investors), and this purpose has been considered as the basis of the accounting treatment to be provided to present an accurate account in Wallbox’s consolidated financial statements. In this regard, Wallbox N.V. became the parent of the group as per the contribution in kind of the shares of Wallbox Chargers and Kensington shares at 1 October 2021.
F-36
WALLBOX N.V.
Notes to the consolidated financial statements
Wallbox Chargers acquisition
As per the Business Combination Agreement, Wallbox N.V. became the new parent of the Wallbox Group as per a contribution in kind of the shares of Wallbox Chargers, S.L. at 1 October 2021.
From an accounting perspective, the contribution in kind of Wallbox Chargers and subsidiaries qualifies as a ‘business combination involving entities or businesses under common control’ which are not in the scope of IFRS 3. IFRS has currently no guidance yet on how to account for these kind of transactions.
After analyzing all the factors involving the Transaction management has concluded that Wallbox N.V. cannot be considered as a separate entity acting in its own right as an acquirer in a business combination (it acts on the behalf of the same shareholders of Wallbox Chargers) and the economic substance of its incorporation and the holding of the shares of Wallbox Chargers is considered to be intended only for a reorganization of the group for the sole purpose of the IPO and integrating new investors.
Consequently, management has decided that Wallbox N.V. recognizes in its consolidated financial statements the net assets of Wallbox Chargers and its subsidiaries as per their previous carrying amounts (book value/pooling of interests (carry-over basis) accounting) and will apply this accounting treatment to similar transactions in the future.
Acquisition of Kensington Acquisition Corp. II
The contribution in kind of Kensington is not within the scope of IFRS 3 as Kensington does not meet the definition of a business in accordance with IFRS 3.
Therefore, Wallbox has not acquired a business through the contribution in kind. Kensington is only an acquired company whose net assets were integrated into Wallbox at the closing date, thus allowing Kensington shareholders to become part of the transaction and capture part of the value of the IPO of Wallbox to be compensated for their “services” in the process of listing Wallbox.
Consequently, the contribution in kind of Kensington shares has been accounted for within the scope of IFRS 2. Therefore, Kensington has been treated as the “acquired” company for financial reporting purposes and its net assets have been recognized at historical cost, with no goodwill or other intangible assets recorded.
Based on IFRS 2, and from an analysis of the transaction, it has been considered that the excess of fair value of Wallbox shares issued over the fair value of Kensington’s identifiable net assets acquired represents compensation for the service of stock exchange listing for its shares and has been expensed as incurred.
In this regard, the fair value of Kensington’s net assets at the closing date amounts to USD
115,243,682
or Euros
99,524,444
(comprised of cash and cash equivalents of Euros
114,015,290
and derivative warrant liabilities of Euros
14,490,846
) plus the cash proceeds to be received from PIPE Investors amounting USD
111,000,000
or Euros
95,859,600
, totaling Euros
195,384,044
.
The fair value of the Wallbox Chargers business agreed between the independent parties involved in the Transaction amounts to USD
1,400,000,000
(Euros
1,209,040,000
) in accordance with the Business Combination Agreement. Therefore, based on an
18.1
% equity interest in Wallbox issued to Kensington shareholders, the fair value of the Wallbox shares exchanged in the transaction has been estimated at Euros
267,555,606
.
Consequently, the difference between the fair value of the Wallbox shares exchanged (Euros 267,555,606) and the fair value of Kensington’s net assets (Euros 195,384,044), amounting to Euros
72,171,562
, has been considered as an expense in the statement of profit or loss of Wallbox at closing date, as the representation of the value of the stock exchange listing services rendered by Kensington and its shareholders (see Note 22).
F-37
WALLBOX N.V.
Notes to the consolidated financial statements
Comparative information
There is no approved guidance in IFRS regarding the presentation of comparatives when applying the pooling of interests method for business combinations between entities under common control.
Considering this lack of guidance and IAS 8, Management has determined that Wallbox restates its comparatives and adjust its current reporting period before the date of the transaction as if the combination has occurred at the start of the earliest period presented.
Wallbox has decided to
re-present
comparatives as the consolidated financial statements of Wallbox are considered to be a continuation of those of Wallbox Chargers.
Consequently, Wallbox N.V. is considered the parent of the Wallbox Group at 1 January 2019, and has included comparatives for a period of two years in the consolidated financial statements for the year ended 31 December 2021. From this date, Wallbox’s consolidated financial statements will be the continuation of those issued by Wallbox Chargers, recognizing the incorporation of Kensington as of 1 October 2021.
Therefore, and under the pooling of interest method, the equity of Wallbox at 1 January 2019 is considered to be the accounting value of the net assets of the Wallbox Chargers Group per that date:
|
(In Euros)
|
|
1 January 2019
|
|
|
|
Share capital
|
|
|
|
|
|
Share premium
|
|
|
|
|
|
Accumulated deficit
|
|
|
(
|
)
|
|
Foreign currency translation reserve
|
|
|
|
|
|
|
|
|
|
|
|
Total Equity attributable to owners of the Company
|
|
|
|
|
|
|
|
|
|
|
From that date and until 1 October 2021, the structure of Wallbox’s equity and net assets remains the same as in Wallbox Chargers. On 1 October 2021, considering the share capital increases in Wallbox N.V. due to the legal contribution in kind of Wallbox Chargers and Kensington, certain adjustments were made to estimate the net equity and to present the share capital of Wallbox, considering that the Wallbox Group’s losses for the period until 30 September 2021 include those for Wallbox N.V. as of its date of incorporation (7 June 2021) and those for the Wall Box Chargers Group from 1 January 2021 to 30 September 2021:
|
(In Euros)
|
|
1 October 2021
|
|
|
|
Share capital
|
|
|
|
|
|
Share premium
|
|
|
|
|
|
Loss for the period
|
|
|
(
|
)
|
|
Other equity components
|
|
|
|
|
|
Foreign currency translation reserve
|
|
|
|
|
|
|
|
|
|
|
|
Total Equity attributable to owners of the Company
|
|
|
|
|
|
|
|
|
|
|
Treatment of transaction costs
In accordance with IAS 32, Wallbox has analyzed the total costs incurred in the Transaction to determine which were incremental and directly attributable to the issue of new shares, and hence are to be deducted from equity directly rather than being expenses through profit or loss.
Some costs have been considered 100% attributable to the issuance of the new shares in exchange for cash, while other costs incurred related to a combination of the issuance of new shares and obtaining the listing. For this latter group of costs, only the part that could be attributed to the issuance of new shares in exchange
F-3
8
WALLBOX N.V.
Notes to the consolidated financial statements
for cash are deducted from equity, which percentage was determined as the ratio of the number of new shares issued in exchange for cash compared to the total number of outstanding shares after the Transaction.
A total amount of Euros 17,397,322 (Note 16) of incremental and directly attributable costs for the issuance of new shares has been deducted from share premium directly. Non-incremental and not directly attributable costs for the issuance of shares in the amount of Euros 8,046,158 (Note 20) are expensed in profit or loss.
Impact of the Transaction on
(the EPS)
earnings-per-share
The contribution in kind of the shares of Wallbox Chargers has not changed the number of ordinary shares without a change in resources. Since Wallbox N.V. would be considered the parent of the Wallbox Group at 1 January 2019 for comparison purposes, it has been considered reasonable to apply the same Exchange Ratio of 240.990795184659 used at 1 October 2021.
The contribution in kind of Kensington shares modified the number of ordinary shares with a change in resources (the net assets of Kensington are new in the Wallbox Group and are considered a change in resources). Therefore, such new shares would impact the weighted average number of ordinary shares outstanding from 1 October 2021.
Consequently, the weighted average number of ordinary shares outstanding for basic and diluted EPS for the prior periods is as follows:
|
|
|
1 January
2019 |
|
|
31 December
2019
|
|
|
31 December
2020
|
|
|||
|
|
|
|
|
|
|
|
|
|
|
|||
|
Shares
|
|
Ourstanding shares
|
|
|||||||||
|
Class A
|
|
|
2,436
|
|
|
|
258,800
|
|
|
|
280,737
|
|
|
Class B
|
|
|
—
|
|
|
|
78,500
|
|
|
|
111,381
|
|
|
|
|
|
|
|
|
|
|
|
|
|
|
|
|
Total
|
|
|
2,436
|
|
|
|
337,300
|
|
|
|
392,118
|
|
|
|
|
|
|
|
|
|
|
|
|
|
|
|
|
Shares for Basic EPS Wallbox Chargers
|
|
|
243,600
|
|
|
|
337,300
|
|
|
|
392,118
|
|
|
Exchange ratio
|
|
|
240.99
|
|
|
|
240.99
|
|
|
|
240.99
|
|
|
|
|
|
|
|
|
|
|
|
|
|
|
|
|
Adjusted number of shares
|
|
|
58,705,363
|
|
|
|
81,286,202
|
|
|
|
94,496,837
|
|
|
|
|
|
|
|
|
|
|
|
|
|
|
|
B – Intelligent Solutions AS
On 19 February 2020, the Group acquired Intelligent Solutions AS (renamed into Wallbox AS), incorporated in Norway, a marketer of charging solutions for electric vehicles that exclusively distributed Wallbox products, in addition to offering other related services such as the installation of charging points. The Group agreed to pay fo
r
% of the
non-controlling
interests). The fair value of the put options granted to sellers amounted to Euros
Wallbox decided to acquire Intelligent Solutions AS because it gives the Group access to the European market of countries in which EV demand is most developed.
F-39
WALLBOX N.V.
Notes to the consolidated financial statements
Details of the purchase consideration are as follows:
|
(In Euros)
|
||||
|
Purchase consideration:
|
||||
|
Amount paid
|
|
|||
|
Put option liability
|
|
|||
|
|
|
|||
|
Total
|
|
|
|
|
|
|
|
|||
The Purchase Price Allocation (PPA) was finalized without identifying any asset with a fair value that differs from its carrying amount. Therefore, the difference between the consideration paid and the fair value of the net assets acquired was assigned to goodwill.
The resulting residual goodwill from the acquisition of Intelligent Solutions AS includes:
|
|
i.
|
Premium paid by Wallbox to enter Norway and Sweden (existing platform in these countries) in order to speedily expand the Wallbox brand into the leading markets in Europe;
|
|
|
ii.
|
Gain control of the entire value chain (Intelligent Solutions AS exclusively distributed Wallbox products in Norway and Sweden);
|
|
|
iii.
|
Wallbox’s ability to attract new customers in the most mature electric vehicle market in Europe;
|
|
|
iv.
|
Improvement in expected performance of the business (i.e.: revenue growth, profitability margins) through the
know-how
of Wallbox management; and
|
|
|
v.
|
Other potential synergies with Wallbox;
|
|
|
vi.
|
Includes the value of the workforce in the place acquired.
|
Upon initial recognition, it had been estimated that the put option liability would be exercised in January 2023. However, in August 2021, the Group agreed with the former shareholders to settle the put option liability during the second half of 2021. This led to an adjustment of the present value of the liability on that date. Payment was finally made on 19 August 2021, September 2nd 2021 and 9 November 2021 for the amount of Euros
1,000,000
, Euros
125,000
and Euros
1,750,000
, respectively, generating an impact of Euros
156,619
in the net finance costs heading.
F-
40
WALLBOX N.V.
Notes to the consolidated financial statements
Assets and liabilities recognized at fair value as a result of the acquisition were as follows:
|
(In Euros)
|
|
|
|
|
|
Property, plant and equipment
|
|
|||
|
Deferred tax assets
|
|
|||
|
Inventories
|
|
|||
|
Trade and other financial receivables
|
|
|||
|
Cash and cash equivalents
|
|
|||
|
|
|
|||
|
Total Assets
|
|
|
|
|
|
|
|
|||
|
Trade and other financial payables
|
(
|
) | ||
|
Loans and borrowings
|
(
|
) | ||
|
Other payables
|
(
|
) | ||
|
|
|
|||
|
Total Liabilities
|
|
(
|
)
|
|
|
|
|
|||
|
Identifiable net assets acquired
|
|
|
|
|
|
|
|
|||
|
Cash consideration transferred
|
|
|||
|
Put option liability
|
|
|||
|
|
|
|||
|
Goodwill arising on acquisition
|
|
|
|
|
|
|
|
|||
The
contribution in 2021 of the acquired business to the consolidated revenue has been Euros
9,214,357
(Euros
3,903,890
in 2020), and the consolidated
541,534
(Euros
96,909
in 2020). The acquisition occurred early in 2020, and the contribution of the business for the whole calendar year would not have significantly differed from thes
loss has been
Euros
e
numbers.
C
–
Electromaps, S.L.
On 3 September 2020 the Group assumed control of Electromaps, S.L., incorporated in Spain, a software company that develops a leading platform for the management of public infrastructure for electric vehicles, through a capital increase of Euros
500,000
, representing
51
% of share-capital. The Group also granted call and put options for
49
% of the share
capital held by the
100
% of the interests in the subsidiary and has not recognized
3,645,117
at the acquisition date. The value of the call was
nil
at the acquisition date and has remained
nil
subsequently.
non-controlling
interests. As per the policy choice referred to in the Significant Accounting Policies (5.A.i), the Group has recognized the acquisition of
non-controlling
interests. The fair value of the put option granted to sellers amounted to Euros
Wallbox decided to acquire Electromaps as it provides the Group with a leading platform which is complementary to its business and has significant synergies for revenue and costs.
Details of the purchase consideration were as follows:
|
(In Euros)
|
||||
|
Purchase consideration:
|
||||
|
Amount paid
|
|
|||
|
Put option liability
|
|
|||
|
|
|
|||
|
Total
|
|
|
|
|
|
|
|
|||
F-
41
WALLBOX N.V.
Notes to the consolidated financial statements
The initial accounting for the Electromaps, S.L. business combination has been restated once the Purchase Price Allocation procedures have been considered definitive, as additional information has been made available during this year that has allowed it to carry out a more precise exercise (see Note 2). The purchase price allocation has identified customer relationships and trademarks as new assets. Therefore, the fair value of these new identified intangible assets acquired has been allocated from goodwill (see Note 6), resulting in a restatement of the prior year statement of financial position.
The liability for the redemption amount has been estimated discounting the contractual strike price of Euros
4,000,000
as of three months after the approval of the 2023 statutory accounts of Electromaps at an annual rate of
2.69
%. This has resulted in a finance cost of Euros
98,925
during 2021 (Euros
32,396
during 2020). The value of the put option liability at 31 December 2021 is Euros
3,776,438
(Euros
3,677,513
at 31 December 2020). The estimated payment date is 31 March 2024.
As a result of the completion of the PPA, the assets and liabilities recognized at fair value as a result of the acquisition are as follows:
|
(In Euros)
|
|
Acquisition
date |
|
|
Effect of
IFRS 3
|
|
|
Acquisition
date restated |
|
|||
|
Property, plant and equipment
|
|
— |
|
|||||||||
|
Intangible assets
|
|
|
|
|||||||||
|
Investments
|
|
— |
|
|||||||||
|
Trade and other financial receivables
|
|
— |
|
|||||||||
|
Cash and cash equivalents
|
|
— |
|
|||||||||
|
|
|
|
|
|
|
|||||||
|
Total Assets
|
|
|
|
|
|
|
|
|
|
|||
|
|
|
|
|
|
|
|||||||
|
Trade and other financial payables
|
(
|
) | — |
(
|
) | |||||||
|
Loans and borrowings
|
(
|
) | — |
(
|
) | |||||||
|
Other payables
|
(
|
) | — |
(
|
) | |||||||
|
Deferred tax liabilities
|
— |
(
|
) |
(
|
) | |||||||
|
|
|
|
|
|
|
|||||||
|
Total Liabilities
|
|
(
|
)
|
|
(
|
)
|
|
(
|
)
|
|||
|
|
|
|
|
|
|
|||||||
|
Identifiable net assets acquired
|
|
|
|
|
|
|
|
|
|
|||
|
|
|
|
|
|
|
|||||||
|
Cash consideration transferred
|
|
— |
|
|||||||||
|
Put option liability
|
|
— |
|
|||||||||
|
|
|
|
|
|
|
|||||||
|
Goodwill arising on acquisition
|
|
|
|
|
(
|
)
|
|
|
|
|||
|
|
|
|
|
|
|
|||||||
Due to the change in the fair values of assets and liabilities recognized in the business combination, intangible assets, goodwill and deferred tax liabilities have been restated for Euros
162,543
, Euros
121,907
and Euros
40,636
, respectively.
F-4
2
WALLBOX N.V.
Notes to the consolidated financial statements
The
contribution in 2021 of the acquired business to the consolidated revenue has amounted to Euros
354,077
(Euros
125,196
in 2020),
and the consolidated loss has been Euro
s
420,108
(Euros
51,003
in 2020).
363,000
and Euros
3,000
, respectively.
If the business combination had taken place at 1 January 2020, the contribution to consolidated revenue and the consolidated loss for the year would have amounted to Eur
os
|
(In Euros)
|
|
Cash flows
on acquisitions |
|
|
|
Cash consideration
|
|
|
|
|
|
Cash and cash equivalents
|
|
|
(
|
)
|
|
|
|
|
|
|
|
Net cash flow on acquisition
|
|
|
(
|
)
|
|
|
|
|
|
|
Costs related to business combinations during 2020 amounted to Euros
15,450
and have been recognized as operating expenses in the statement of profit or loss.
|
7.
|
OPERATING SEGMENTS
|
Basis for segmentation
The Group’s business segment information included in this note is presented in accordance with the disclosure requirements set forth in IFRS 8. Segment reporting is a basic tool used for monitoring and
managing the Group’s different activities. Segment reporting is prepared based on the lowest level units, that are aggregated in line with the structure established by Group management to set up higher level units and, finally, the actual business segments.
The Group has consistently aligned the information from this item with the information used internally for the top management reports (Group top management consists of all Chief Officers acting as decision makers). The Group’s operating segments reflect its organizational and management structures. Group management reviews the Group’s internal reports, using these segments to assess its performance and allocate resources.
The segments are differentiated by geographical areas from which revenue is or will be generated. The financial information for each segment is prepared by aggregating figures from the different geographical areas and business units existing in the Group. This information links both the accounting data from the units included in each segment and that provided by the management reporting systems. In all these cases, the same general principles are applied as those used in the Group.
For management purposes, the Group is organized into business units based on geographical areas and therefore has four reportable business segments. The business segments are:
| • |
EMEA: Europe-Middle East Asia
|
| • |
NORAM: North America
|
| • |
APAC: Asia-Pacific
|
| • |
LATAM: Latin America (currently under development)
|
Transfer prices between operating segments are on an
arm’s-length
basis in a manner similar to transactions with third parties.
Information on reportable segments
Information related to each reportable segment is set out below. Segment operating profit (loss) is used to measure performance because management believes that this information is the most relevant in evaluating the results of the respective segments relating to other entities that operate in the same industries.
F-4
3
WALLBOX N.V.
Notes to the consolidated financial statements
Reconciliations of information on reportable segments with the amounts reported in the financial statements for the years ended 31 December 2021 and 2020.
|
|
31 December 2021
|
|
||||||||||||||||||||||
|
(In Euros)
|
|
EMEA
|
|
|
NORAM
|
|
|
APAC
|
|
|
Total
segments |
|
|
Consolidated
adjustments and eliminations |
|
|
Consolidated
|
|
||||||
|
Revenue
|
|
|
|
|
(
|
) |
|
|||||||||||||||||
|
Changes in inventories and raw materials and consumables used
|
(
|
) |
(
|
) |
(
|
) |
(
|
) |
|
(
|
) | |||||||||||||
|
Employee benefits
|
(
|
) |
(
|
) |
(
|
) |
(
|
) | — |
(
|
) | |||||||||||||
|
Other operating expenses
|
(
|
) |
(
|
) |
(
|
) |
(
|
) |
|
(
|
) | |||||||||||||
|
Amortization and depreciation
|
(
|
) |
(
|
) |
(
|
) |
(
|
) | — |
(
|
) | |||||||||||||
|
Net Other Income/(Expense)
|
|
(
|
) |
|
|
— |
|
|||||||||||||||||
|
|
|
|
|
|
|
|
|
|
|
|
|
|||||||||||||
|
Operating Loss
|
|
(
|
)
|
|
(
|
)
|
|
(
|
)
|
|
(
|
)
|
|
(
|
)
|
|
(
|
)
|
||||||
|
|
|
|
|
|
|
|
|
|
|
|
|
|||||||||||||
|
Total Assets
|
|
|
|
|
|
|
|
|
|
|
|
|
|
(
|
)
|
|
|
|
||||||
|
|
|
|
|
|
|
|
|
|
|
|
|
|||||||||||||
|
Total Liabilities
|
|
|
|
|
|
|
|
|
|
|
|
|
|
(
|
)
|
|
|
|
||||||
|
|
|
|
|
|
|
|
|
|
|
|
|
|||||||||||||
|
|
31 December 2020
|
|
||||||||||||||||||||||
|
(In Euros)
|
|
EMEA
|
|
|
NORAM
|
|
|
APAC
|
|
|
Total
segments |
|
|
Consolidated
adjustments and eliminations |
|
|
Consolidated
|
|
||||||
|
Revenue
|
|
|
|
|
(
|
) |
|
|||||||||||||||||
|
Changes in inventories and raw materials and consumables used
|
(
|
) |
(
|
) |
(
|
) |
(
|
) |
|
(
|
) | |||||||||||||
|
Employee benefits
|
(
|
) |
(
|
) |
(
|
) |
(
|
) | — |
(
|
) | |||||||||||||
|
Other operating expenses
|
(
|
) |
(
|
) |
(
|
) |
(
|
) |
|
(
|
) | |||||||||||||
|
Amortization and depreciation
|
(
|
) |
(
|
) |
(
|
) |
(
|
) | — |
(
|
) | |||||||||||||
|
Net Other Income/(Expense)
|
|
— |
|
|
— |
|
||||||||||||||||||
|
|
|
|
|
|
|
|
|
|
|
|
|
|||||||||||||
|
Operating Loss
|
|
(
|
)
|
|
(
|
)
|
|
(
|
)
|
|
(
|
)
|
|
—
|
|
|
(
|
)
|
||||||
|
|
|
|
|
|
|
|
|
|
|
|
|
|||||||||||||
|
Total Assets
|
|
|
|
|
|
|
|
|
|
|
|
|
|
(
|
)
|
|
|
|
||||||
|
|
|
|
|
|
|
|
|
|
|
|
|
|||||||||||||
|
Total Liabilities
|
|
|
|
|
|
|
|
|
|
|
|
|
|
(
|
)
|
|
|
|
||||||
|
|
|
|
|
|
|
|
|
|
|
|
|
|||||||||||||
F-4
4
WALLBOX N.V.
Notes to the consolidated financial statements
|
|
|
31 December 2019
|
|
|||||||||||||||||||||
|
(In Euros)
|
|
EMEA
|
|
|
NORAM
|
|
|
APAC
|
|
|
Total
segments |
|
|
Consolidated
adjustments and eliminations |
|
|
Consolidated
|
|
||||||
|
Revenue
|
|
|
|
|
|
|
—
|
|
|
|
—
|
|
|
|
|
|
|
|
(
|
)
|
|
|
|
|
|
Changes in inventories and raw materials and consumables used
|
|
|
(
|
)
|
|
|
—
|
|
|
|
|
|
|
|
(
|
)
|
|
|
—
|
|
|
|
(
|
)
|
|
Employee benefits
|
|
|
(
|
)
|
|
|
(
|
)
|
|
|
—
|
|
|
|
(
|
)
|
|
|
—
|
|
|
|
(
|
)
|
|
Other operating expenses
|
|
|
(
|
)
|
|
|
(
|
)
|
|
|
(
|
)
|
|
|
(
|
)
|
|
|
|
|
|
|
(
|
)
|
|
Amortization and depreciation
|
|
|
(
|
)
|
|
|
(
|
)
|
|
|
—
|
|
|
|
(
|
)
|
|
|
—
|
|
|
|
(
|
)
|
|
Net Other Income/(Expense)
|
|
|
|
|
|
|
—
|
|
|
|
|
|
|
|
|
|
|
|
—
|
|
|
|
|
|
|
|
|
|
|
|
|
|
|
|
|
|
|
|
|
|
|
|
|
|
|
|
|
|
|
|
|
Operating Loss
|
|
|
(
|
)
|
|
|
(
|
)
|
|
|
(
|
)
|
|
|
(
|
)
|
|
|
—
|
|
|
|
(
|
)
|
|
|
|
|
|
|
|
|
|
|
|
|
|
|
|
|
|
|
|
|
|
|
|
|
|
|
|
Total Assets
|
|
|
|
|
|
|
|
|
|
|
|
|
|
|
|
|
|
|
(
|
)
|
|
|
|
|
|
|
|
|
|
|
|
|
|
|
|
|
|
|
|
|
|
|
|
|
|
|
|
|
|
|
|
Total Liabilities
|
|
|
|
|
|
|
|
|
|
|
|
|
|
|
|
|
|
|
(
|
)
|
|
|
|
|
|
|
|
|
|
|
|
|
|
|
|
|
|
|
|
|
|
|
|
|
|
|
|
|
|
|
Eliminations and unallocated items
There have been no significant transactions between segments for the years ended 31 December 2021, 2020 and 2019 except for inter-segment revenues which are eliminated in the column ‘Consolidated adjustments and eliminations’. The elimination of revenue and changes in inventories and raw materials and consumables used mainly relates to eliminating the intercompany sales of EMEA to NORAM and APAC. The impact of this elimination on consolidated operating loss relates to the elimination of profit on stock of inventories held by the NORAM segment.
Certain financial assets and liabilities are not allocated to those segments as they are also managed on a Group basis. These are mentioned in the ‘Consolidated adjustments and eliminations’ column. All finance income and expenses are considered to be part of the Corporate segment and hence not further allocated to the operating segments EMEA, NORAM and APAC.
F-4
5
WALLBOX N.V.
Notes to the consolidated financial statements
External revenue by location of customers
|
(In Euros)
|
|
2021
|
|
|
2020
|
|
|
2019
|
|
|||||||||||||||
|
Country
|
|
Revenue
|
|
|
%
|
|
|
Revenue
|
|
|
%
|
|
|
Revenue
|
|
|
%
|
|
||||||
|
Germany
|
|
|
% |
|
|
% |
|
|
% | |||||||||||||||
|
Italy
|
|
|
% |
|
|
% |
|
|
% | |||||||||||||||
|
Spain
|
|
|
% |
|
|
% |
|
|
% | |||||||||||||||
|
United Kingdom
|
|
|
% |
|
|
% |
|
|
% | |||||||||||||||
|
Netherlands
|
|
|
% |
|
|
% |
|
|
% | |||||||||||||||
|
Norway
|
|
|
% |
|
|
% |
|
|
% | |||||||||||||||
|
United States
|
|
|
% |
|
|
% |
|
|
% | |||||||||||||||
|
France
|
|
|
% |
|
|
% |
|
|
% | |||||||||||||||
|
Sweden
|
|
|
% |
|
|
% |
|
|
% | |||||||||||||||
|
Belgium
|
|
|
% |
|
|
% |
|
|
% | |||||||||||||||
|
Ireland
|
|
|
% |
|
|
% |
|
|
% | |||||||||||||||
|
Australia
|
|
|
% |
|
|
% |
|
|
% | |||||||||||||||
|
Israel
|
|
|
% |
|
|
% |
|
|
% | |||||||||||||||
|
Other Countries
|
|
|
% |
|
|
% |
|
|
% | |||||||||||||||
|
|
|
|
|
|
|
|
|
|
|
|
|
|||||||||||||
|
Total
|
|
|
|
|
|
%
|
|
|
|
|
|
%
|
|
|
|
|
|
%
|
||||||
|
|
|
|
|
|
|
|
|
|
|
|
|
|||||||||||||
F-4
6
WALLBOX N.V.
Notes to the consolidated financial statements
|
8.
|
PROPERTY, PLANT AND EQUIPMENT
|
A. Reconciliation of carrying amount
|
(In Euros)
|
|
Buildings
|
|
|
Fixtures and
fittings |
|
|
Plant and
equipment |
|
|
Assets
under construction |
|
|
Total
|
|
|||||
|
|
|
|
|
|
|
|
|
|
|
|
|
|
|
|
|
|||||
|
Balance at 31 December 2019
|
|
|
|
|
|
|
|
|
|
|
|
|
|
|
|
|
|
|
|
|
|
|
|
|
|
|
|
|
|
|
|
|
|
|
|
|
|
|
|
|
|
|
|
Business combinations
|
|
|
—
|
|
|
|
—
|
|
|
|
|
|
|
|
—
|
|
|
|
|
|
|
Additions
|
|
|
|
|
|
|
|
|
|
|
|
|
|
|
|
|
|
|
|
|
|
Transfers
|
|
|
|
|
|
|
—
|
|
|
|
—
|
|
|
|
(
|
)
|
|
|
—
|
|
|
Depreciation
for the year
|
|
|
(
|
)
|
|
|
(
|
)
|
|
|
(
|
)
|
|
|
—
|
|
|
|
(
|
)
|
|
Translation differences
|
|
|
—
|
|
|
|
(
|
)
|
|
|
—
|
|
|
|
—
|
|
|
|
(
|
)
|
|
|
|
|
|
|
|
|
|
|
|
|
|
|
|
|
|
|
|
|
|
|
|
Balance at 31 December 2020
|
|
|
|
|
|
|
|
|
|
|
|
|
|
|
|
|
|
|
|
|
|
|
|
|
|
|
|
|
|
|
|
|
|
|
|
|
|
|
|
|
|
|
|
Additions
|
|
|
|
|
|
|
|
|
|
|
|
|
|
|
|
|
|
|
|
|
|
Disposals
|
|
|
(
|
)
|
|
|
(
|
)
|
|
|
—
|
|
|
|
—
|
|
|
|
(
|
)
|
|
Transfers
|
|
|
|
|
|
|
|
|
|
|
|
|
|
|
(
|
)
|
|
|
|
|
|
Depreciation
for the year
|
|
|
(
|
)
|
|
|
(
|
)
|
|
|
(
|
)
|
|
|
—
|
|
|
|
(
|
)
|
|
Translation differences
|
|
|
—
|
|
|
|
|
|
|
|
—
|
|
|
|
—
|
|
|
|
|
|
|
|
|
|
|
|
|
|
|
|
|
|
|
|
|
|
|
|
|
|
|
|
|
Balance at 31 December 2021
|
|
|
|
|
|
|
|
|
|
|
|
|
|
|
|
|
|
|
|
|
|
|
|
|
|
|
|
|
|
|
|
|
|
|
|
|
|
|
|
|
|
|
|
Cost
|
|
|
|
|
|
|||||||||||||||
|
At 31 December 2019
|
|
|
|
|
|
|
|
|
|
|
|
|
|
|
|
|
|
|
|
|
|
|
|
|
|
|
|
|
|
|
|
|
|
|
|
|
|
|
|
|
|
|
|
At 31 December 2020
|
|
|
|
|
|
|
|
|
|
|
|
|
|
|
|
|
|
|
|
|
|
|
|
|
|
|
|
|
|
|
|
|
|
|
|
|
|
|
|
|
|
|
|
At 31 December 2021
|
|
|
|
|
|
|
|
|
|
|
|
|
|
|
|
|
|
|
|
|
|
|
|
|
|
|
|
|
|
|
|
|
|
|
|
|
|
|
|
|
|
|
|
Accumulated
d
epreciation
|
|
|
|
|
|
|||||||||||||||
|
At 31 December 2019
|
|
|
(
|
)
|
|
|
(
|
)
|
|
|
(
|
)
|
|
|
—
|
|
|
|
(
|
)
|
|
|
|
|
|
|
|
|
|
|
|
|
|
|
|
|
|
|
|
|
|
|
|
At 31 December 2020
|
|
|
(
|
)
|
|
|
(
|
)
|
|
|
(
|
)
|
|
|
—
|
|
|
|
(
|
)
|
|
|
|
|
|
|
|
|
|
|
|
|
|
|
|
|
|
|
|
|
|
|
|
At 31 December 2021
|
|
|
(
|
)
|
|
|
(
|
)
|
|
|
(
|
)
|
|
|
—
|
|
|
|
(
|
)
|
|
|
|
|
|
|
|
|
|
|
|
|
|
|
|
|
|
|
|
|
|
|
Additions of property, plant and equipment for 2021 in the amount of Euros
20,106,923
mainly reflect works in the Barcelona office located at Carrer del Foc 68, and the purchase of machinery for the new plant in the Zona Franca (Euros
3,374,972
in 2020 for leasehold improvements to some of the wings of the leased headquarters located in Barcelona).
At 31 December 2021, additions of property, plant and equipment
amounted to Euros
10,512,492
(Euros
271,031
at 31 December 2020).
pending of payment
There are no items in use that are fully depreciated for the years ended 31 December 2021 and 2020.
Other information
The Group has taken out insurance policies that cover the carrying amount of its property, plant and equipment. There are no tangible assets pledged or used as guarantees for loans and borrowings.
The minimum commitment is for the amount of Euros
11,438,281
(Euros
3,000,000
at 31 December 2020) of which an amount of Euros
3,329,660
has been invested during 2021 (Euros
2,933,279
at 31 December 2020),
F-
4
7
WALLBOX N.V.
Notes to the consolidated financial statements
leaving a pending commitment to invest of Euros
8,108,621
at 31 December 2021 (Euros
66,722
at 31 December 2020)
. These commitments mainly correspond to the works that as of 31 December 2021 are being executed in the new plant located in the Zona Franca, as well as leasehold improvements in the Headquarters located in Barcelona.
At 31 December 2021, total interest costs of Euros
272,890
were capitalized to assets under construction at a rate of
7.75
% (Euros
71,834
at 31 December 2020, applying a rate of
4.75
%).
There are no other significant contractual obligations to purchase, construct or develop property, plant and equipment assets.
The Group has no restrictions on the sale of its property, plant and equipment and no pledge exists on these assets, at 31 December 2021 and 2020, except for the leasehold improvement which cannot be realized and amounts to Euros
12,423,934
at 31 December 2021 (Euros
1,912,644
at 31 December 2020).
|
9.
|
ASSETS FOR RIGHTS OF USE AND LEASE LIABILITIES
|
Group as a lessee
The Group has lease contracts for various items of plant, machinery, vehicles and other equipment used in its operations. Leases of plant and machinery generally have lease terms between
3
and
20
years, while motor vehicles and other equipment generally have lease terms between
3
and
5
years. The Group’s obligations under its leases are secured by the lessor’s title to the leased assets. Generally, the Group is restricted from assigning and subleasing the leased assets.
The Group also has certain leases of machinery, office equipment and offices with lease terms of 12 months or less and leases of office equipment with a low value. The Group applies the ‘short-term lease’ and ‘lease of
5,000
) recognition exemptions for these kinds of
low-value
assets’ (less than Euros
leases.
|
a)
|
Set out below are the carrying amounts of
right-of-use
|
|
(In Euros)
|
Buildings
|
Vehicles
|
Other assets
|
Total
|
||||||||||||
|
Balance at 31 December 2019
|
|
|
|
|
|
|
|
|
|
|
|
|
||||
|
|
|
|
|
|
|
|
|
|||||||||
|
Additions
|
— |
|
|
|
|
|
||||||||||
|
Depreciation for the year
|
(
|
) |
(
|
) |
(
|
) |
|
(
|
)
|
|||||||
|
Translation differences
|
(
|
) | — | — |
|
(
|
)
|
|||||||||
|
|
|
|
|
|
|
|
|
|||||||||
|
Balance at 31 December 2020
|
|
|
|
|
|
|
|
|
|
|
|
|
||||
|
|
|
|
|
|
|
|
|
|||||||||
|
Additions
|
|
|
|
|
|
|
||||||||||
|
Depreciation for the year
|
(
|
) |
(
|
) |
(
|
) |
|
(
|
)
|
|||||||
|
Translation differences
|
(
|
) |
|
|
|
(
|
)
|
|||||||||
|
|
|
|
|
|
|
|
|
|||||||||
|
Balance at 31 December 2021
|
|
|
|
|
|
|
|
|
|
|
|
|
||||
|
|
|
|
|
|
|
|
|
|||||||||
Main additions in 2021 correspond to the
”, and the leased offices in France and the United States of America. In August 2021, a
10
-year
lease was agreed for the new offices located in Barcelona.
20-year
agreement with “
Consorcio de la Zona Franca de Barcelona
F-
4
8
WALLBOX N.V.
Notes to the consolidated financial statements
| b) |
Set out below are the carrying amounts of lease liabilities and the movements during the periods:
|
|
(In Euros)
|
|
Buildings
|
|
|
Vehicles
|
|
|
Other assets
|
|
|
Total
|
|
||||
|
Balance at 31 December 2019
|
|
|
|
|
|
|
|
|
|
|
|
|
||||
|
|
|
|
|
|
|
|
|
|||||||||
|
Additions to liabilities
|
— |
|
|
|
|
|
||||||||||
|
Interest on lease liabilities
|
|
|
|
|
|
|
||||||||||
|
Lease payments
|
(
|
) |
(
|
) |
(
|
) |
|
(
|
)
|
|||||||
|
Translation differences
|
(
|
) | — | — |
|
(
|
)
|
|||||||||
|
|
|
|
|
|
|
|
|
|||||||||
|
Balance at 31 December 2020
|
|
|
|
|
|
|
|
|
|
|
|
|
||||
|
|
|
|
|
|
|
|
|
|||||||||
|
Additions to liabilities
|
|
|
|
|
|
|
||||||||||
|
Interest on lease liabilities
|
|
|
|
|
|
|
||||||||||
|
Lease payments
|
(
|
) |
(
|
) |
(
|
) |
|
(
|
)
|
|||||||
|
Translation differences
|
(
|
) |
|
|
|
(
|
)
|
|||||||||
|
|
|
|
|
|
|
|
|
|||||||||
|
Balance at 31 December 2021
|
|
|
|
|
|
|
|
|
|
|
|
|
||||
|
|
|
|
|
|
|
|
|
|||||||||
An analysis of the contractual maturity of lease liabilities, including future interest payable, is as follows:
|
(In Euros)
|
31
|
31
|
||||||
|
6 months or less
|
|
|
||||||
|
6 months to 1 year
|
|
|
||||||
|
From 1 to 2 years
|
|
|
||||||
|
From 2 to 5 years
|
|
|
||||||
|
More than 5 years
|
|
|
||||||
|
|
|
|
|
|||||
|
Total
|
|
|
|
|
|
|
||
|
|
|
|
|
|||||
Amounts
recognized in profit or loss derived from lease liabilities and expenses on short-term and low value leases (IFRS
16
exemption applied) are as follows:
|
(In Euros)
|
2021
|
2020
|
||||||
|
Interest on lease liabilities (see note 22)
|
|
|
||||||
|
Expenses relating to short-term and low value leases (see note 20)
|
|
|
||||||
Of the leasing contracts, those related to vehicle rental do not have extension options, while WBX Towers and Zona France buildings included extension options that have been considered from the leasing start.
F-
4
9
WALLBOX N.V.
Notes to the consolidated financial statements
|
10.
|
INTANGIBLE ASSETS AND GOODWILL
|
a) Intangible assets
Details of and movement in items comprising intangible assets are as follows:
|
(In Euros)
|
|
Software
|
|
|
Patents and
customer relationships |
|
|
Development
costs |
|
|
Other
|
|
|
Total
|
|
|||||
|
Balance at 31 December 2019
|
|
|
|
|
|
|
|
|
|
|
|
|
|
|
|
|
|
|
|
|
|
|
|
|
|
|
|
|
|
|
|
|
|
|
|
|
|
|
|
|
|
|
|
Acquired through business combination
|
|
|
|
|
|
|
|
|
|
|
|
|
|
|
|
|
|
|
|
|
|
Additions
|
|
|
|
|
|
|
|
|
|
|
|
|
|
|
|
|
|
|
|
|
|
Amortization for the year
|
|
|
(
|
)
|
|
|
(
|
)
|
|
|
(
|
)
|
|
|
|
|
|
|
(
|
)
|
|
|
|
|
|
|
|
|
|
|
|
|
|
|
|
|
|
|
|
|
|
|
|
Balance at 31 December 2020
|
|
|
|
|
|
|
|
|
|
|
|
|
|
|
|
|
|
|
|
|
|
|
|
|
|
|
|
|
|
|
|
|
|
|
|
|
|
|
|
|
|
|
|
Additions
|
|
|
|
|
|
|
|
|
|
|
|
|
|
|
|
|
|
|
|
|
|
Disposals
|
|
|
(
|
)
|
|
|
|
|
|
|
(
|
)
|
|
|
|
|
|
|
(
|
)
|
|
Transfers
|
|
|
|
|
|
|
|
|
|
|
(
|
)
|
|
|
|
|
|
|
(
|
)
|
|
Amortization for the year
|
|
|
(
|
)
|
|
|
(
|
)
|
|
|
(
|
)
|
|
|
|
|
|
|
(
|
)
|
|
Translation differences
|
|
|
|
|
|
|
|
|
|
|
|
|
|
|
|
|
|
|
|
|
|
|
|
|
|
|
|
|
|
|
|
|
|
|
|
|
|
|
|
|
|
|
|
Balance at 31 December 2021
|
|
|
|
|
|
|
|
|
|
|
|
|
|
|
|
|
|
|
|
|
|
|
|
|
|
|
|
|
|
|
|
|
|
|
|
|
|
|
|
|
|
|
|
Cost
|
|
|
|
|
|
|||||||||||||||
|
At 31 December 2019
|
|
|
|
|
|
|
|
|
|
|
|
|
|
|
|
|
|
|
|
|
|
|
|
|
|
|
|
|
|
|
|
|
|
|
|
|
|
|
|
|
|
|
|
At 31 December 2020
|
|
|
|
|
|
|
|
|
|
|
|
|
|
|
|
|
|
|
|
|
|
|
|
|
|
|
|
|
|
|
|
|
|
|
|
|
|
|
|
|
|
|
|
At 31 December 2021
|
|
|
|
|
|
|
|
|
|
|
|
|
|
|
|
|
|
|
|
|
|
|
|
|
|
|
|
|
|
|
|
|
|
|
|
|
|
|
|
|
|
|
|
Accumulated amortization
|
|
|
|
|
|
|||||||||||||||
|
At 31 December 2019
|
|
|
(
|
)
|
|
|
(
|
)
|
|
|
(
|
)
|
|
|
|
|
|
|
(
|
)
|
|
|
|
|
|
|
|
|
|
|
|
|
|
|
|
|
|
|
|
|
|
|
|
At 31 December 2020
|
|
|
(
|
)
|
|
|
(
|
)
|
|
|
(
|
)
|
|
|
|
|
|
|
(
|
)
|
|
|
|
|
|
|
|
|
|
|
|
|
|
|
|
|
|
|
|
|
|
|
|
At 31 December 2021
|
|
|
(
|
)
|
|
|
(
|
)
|
|
|
(
|
)
|
|
|
|
|
|
|
(
|
)
|
|
|
|
|
|
|
|
|
|
|
|
|
|
|
|
|
|
|
|
|
|
|
During
, the Group made investments in several development projects, including both capitalized payroll expenses and acquired development amounting to Euros
(Euros
in
2020)
, corresponding to development expenditure that meets the requirements for capitalization.
From
the total development expenditure, Euros
11,685,528
(Euros
10,670,450
in 2020) corresponds to the capitalization
of internal payroll costs
On
the other hand, additions of patents, licenses and similar, and computer software have totaled Euros
(Euros
in
2020)
due mainly to the implementation of new software applications. This item also includes the registration of brands, logos, and design patents for different chargers.
At
31 December 2021, additions of intangible assets
pending of payment
amounted to Euros
375,733
(Euros
55,124
at 31 December 2020). The Group has
no
restrictions on the realizability of its intangible assets and
no
pledge exists on these assets, at 31 December 2021 and
2020.
F-
50
WALLBOX N.V.
Notes to the consolidated financial statements
The
Group has
at
31
December
2021
and
2020
.
At
December
2021
, there are commitments for the acquisition of intangible assets for Euros
(
commitments at
31
December
2020)
.
b) Goodwill
The
goodwill recognized at
31
December
2021
for an amount of
corresponds to the acquisition of Wallbox Norway AS (previously named Intelligent Solutions AS) and Electromaps, S.L. (Euros
at
31
December
2020)
.
|
11.
|
IMPAIRMENT TESTING OF GOODWILL
|
For impairment testing purposes, goodwill acquired through business combinations is allocated to the Nordics and Electromaps/Software CGUs. These have been considered as different cash-generating units as:
|
|
•
|
|
they generate cash flows in a country with insignificant presence of the Group, and from activities not previously performed, respectively, and
|
|
|
•
|
|
because they are monitored independently from the rest.
|
The carrying amount of the goodwill at 31 December is as follows:
|
(In Euros)
|
|
Nordics
|
|
|
Electromaps/
Software |
|
|
Total
|
|
|||
|
2020
|
|
|
|
|||||||||
|
Goodwill
|
|
|
|
|
|
|
|
|
|
|||
|
|
|
|
|
|
|
|
|
|
|
|||
|
2021
|
|
|
|
|
|
|
|
|
|
|||
|
|
|
|
|
|
|
|
|
|
|
|
|
|
|
Goodwill
|
|
|
|
|||||||||
|
|
|
|
|
|
|
|||||||
The
Group performed its annual impairment testing on
31
December
2021
.
Nordics
Nordics
is the cash-generating unit focused on the development of the electric charger market for the Group in Scandinavia, taking advantage of the customer base and
know-how
as the installation provider of Intelligent Solutions. The recoverable amount of the Nordics CGU has been determined based on a value in use calculation using cash flow projections from financial budgets approved by senior management covering a
five
-year period.
The
projected cash flows have been built to reflect the increasing demand for EV chargers and associated services in this region. The
pre-tax
discount rate applied to cash flow projections is
% and cash flows beyond the
five
-year period are extrapolated using a
% growth rate that is slightly below the long-term average growth rate for consolidated European economies (
%). As a result of this analysis,
no
impairment has been recognized, as there is
sufficient
headroom available.
Key
assumptions used in value in use calculations and sensitivity to changes in assumptions for this unit are:
| • |
Discount rates:
|
Discount
rates represent the current market assessment of the risks specific to each CGU, taking into consideration the time value of money and individual risks of the underlying assets that have not been incorporated in the cash flow
estimates.
F-
51
WALLBOX N.V.
Notes to the consolidated financial statements
The discount rate calculation is based on the specific circumstances of the Group and its CGUs and is derived from its weighted average cost of capital (WACC). The WACC takes into account both debt and equity. The cost of equity is derived from the expected return on investment by the Group’s investors. The cost of debt is based on the interest-bearing borrowings the Group is obliged to service.
Business-specific risk is incorporated by applying individual beta factors. The beta factors have been evaluated annually based on publicly available market data.
Alpha
factor adjustments to the discount rate are made to consider unit specific factors such as the size, liquidity, market, and others, in order to reflect a
pre-tax
discount rate.
A
rise in the unit’
s
pre-tax
discount rate to
% (i.e., +
%) would not result in impairment either, given the existing headroom.
| • |
Growth rates used to extrapolate cash flows beyond the forecast period:
|
Potential
growth rates in this business could be higher than that used in the impairment test, but it has been considered prudent to use a rate slightly below the long-term average growth rate for consolidated European economies (2%), given that significant market gross margins have already been considered. A reduction of this rate to
% would not mean in an impairment either, given the existing headroom.
Electromaps/Software
Electromaps
/Software is the cash-generating unit focused on the development and sale of software for the electric chargers. The recoverable amount of the Electromaps/Software CGU has been determined based on a value in use calculation using cash flow projections from financial budgets approved by senior management covering a five-year period.
The
projected cash flows have been built to reflect increased demand for the software and services associated with EV sales. The
pre-tax
discount rate applied to the cash flow projections is
%. and cash flows beyond the five-year period are extrapolated using a
% growth rate that is slightly below the long-term average growth rate for consolidated European economies (
%). As a result of this analysis, no impairment has been recognized, as there is
sufficient
headroom available.
Key
assumptions used in value in use calculations and sensitivity to changes in assumptions for this unit are:
|
|
•
|
|
Number of future users and market share during the forecast period:
|
The
number of future users in this CGUs is increasing fast and the unit has
share in the Spanish market. Even a slight reduction of the market share could be easily compensated for the increase in the number of users that will take
place in this market.
|
|
•
|
|
Gross margins:
|
Gross
margins are based on average values achieved in the last quarters preceding the beginning of the budget period and based on peers in the software business. The gross margins for this CGU are currently around
% and are expected to grow in the future to reach approximately
%. Remote reductions of up to
% in the gross margin in the long term would allow the present value of the net assets to
be
recovered.
|
|
•
|
|
Discount rates:
|
Discount rates represent the current market assessment of the risks specific to each CGU, taking into consideration the time value of money and individual risks of the underlying assets that have not been incorporated in the cash flow estimates.
F-
5
2
WALLBOX N.V.
Notes to the consolidated financial statements
The discount rate calculation is based on the specific circumstances of the Group and its CGUs and is derived from its weighted average cost of capital (WACC). The WACC takes into account both debt and equity. The cost of equity is derived from the expected return on investment by the Group’s investors. The cost of debt is based on the interest-bearing borrowings the Group is obliged to service.
Business-specific risk is incorporated by applying individual beta factors. The beta factors have been evaluated based on publicly available market data.
Alpha factor adjustments to the discount rate are made to consider unit specific factors such as the size, liquidity, market, and others, in order to reflect a
pre-tax
discount rate.
A
rise in the unit’s
pre-tax
discount rate to 11.04% (i.e., +2%) would not result in an impairment either, given the existing significant headroom.
|
|
•
|
|
Growth rates used to extrapolate cash flows beyond the forecast period:
|
Potential
growth rates in this business could be higher than that used in the impairment test, but it has been considered prudent to use a rate slightly below the long-term average growth rate for consolidated European economies (2%), given that significant market gross margins have already been considered. A reduction of this rate
to
% would not mean in an impairment either given the existing
sufficient
headroom.
|
12.
|
EQUITY-ACCOUNTED INVESTEES
|
Joint venture
is a joint venture incorporated on
over which the Group has joint control and a
% interest. This company is not quoted on the stock exchange.
Wallbox
Fawsn is structured as a separate vehicle and the Group has a residual interest in its net assets. Consequently, the Group has classified its investment in Wallbox Fawsn as a joint venture, pursuant to the agreement for the incorporation of Wallbox Fawsn.
The
principal activity of the joint venture in
is the
The joint venture has orders signed for production volumes.
F-
5
3
WALLBOX N.V.
Notes to the consolidated financial statements
The table below provides a summary of the financial information of Wallbox Fawsn, as included in its financial statements. The table also reconciles the summarized financial information with the carrying amount of the Group’s investment in Wallbox Fawsn (it also includes movement in the value of these investments using the equity method during 2021 and 2020):
The summarized statement of financial position of Wallbox Fawsn is as follows:
|
|
|
Wallbox Fawsn
|
|
|||||
|
(In Euros)
|
|
31 Dec 2021
|
|
|
31 Dec 2020
|
|
||
|
Property, plant and equipment
|
|
|
|
|
|
|
|
|
|
Non-current
financial assets
|
|
|
|
|
|
|
|
|
|
|
|
|
|
|
|
|
|
|
|
Non-Current
Assets
|
|
|
|
|
|
|
|
|
|
Inventories
|
|
|
|
|
|
|
|
|
|
Trade and other financial receivables
|
|
|
|
|
|
|
|
|
|
Advance payments
|
|
|
|
|
|
|
|
|
|
Cash and cash equivalents
|
|
|
|
|
|
|
|
|
|
|
|
|
|
|
|
|
|
|
|
Current Assets
|
|
|
|
|
|
|
|
|
|
|
|
|
|
|
|
|
|
|
|
Total Assets
|
|
|
|
|
|
|
|
|
|
|
|
|
|
|
|
|
|
|
|
Loans and borrowings
|
|
|
|
|
|
|
|
|
|
|
|
|
|
|
|
|
|
|
|
Non-Current
Liabilities
|
|
|
|
|
|
|
|
|
|
Trade and other financial payables
|
|
|
|
|
|
|
|
|
|
Loans and borrowings
|
|
|
|
|
|
|
|
|
|
|
|
|
|
|
|
|
|
|
|
Current Liabilities
|
|
|
|
|
|
|
|
|
|
|
|
|
|
|
|
|
|
|
|
Total Liabilities
|
|
|
|
|
|
|
|
|
|
|
|
|
|
|
|
|
|
|
|
Foreign currency translation reserve
|
|
|
|
|
|
|
|
|
|
|
|
|
|
|
|
|
|
|
|
Net Assets (Liabilities)
|
|
|
(
|
)
|
|
|
(
|
)
|
|
|
|
|
|
|
|
|
|
|
|
Group’s share in equity
-
|
|
|
|
|
|
|
|
|
|
Goodwill
|
|
|
|
|
|
|
|
|
|
|
|
|
|
|
|
|
|
|
|
Group’s carrying amount of the investment
|
|
|
|
|
|
|
|
|
|
|
|
|
|
|
|
|
|
|
As
of 31 December 2021, there is
F-5
4
WALLBOX N.V.
Notes to the consolidated financial statements
The summarized statement of profit and loss of Wallbox Fawsn at 31 December 2021, 2020 and 2019 is as follows:
|
Wallbox Fawsn
|
||||||||||||
|
(In Euros)
|
2021
|
2020
|
2019
|
|||||||||
|
Revenue
|
|
|
|
|||||||||
|
Changes in inventories and raw materials and consumables used
|
(
|
) |
(
|
) |
(
|
) | ||||||
|
Other operating expenses
|
(
|
) |
(
|
) |
(
|
) | ||||||
|
Amortization and depreciation
|
(
|
) |
(
|
) |
(
|
) | ||||||
|
|
|
|
|
|
|
|||||||
|
Operating Loss
|
|
(
|
)
|
|
(
|
)
|
|
(
|
)
|
|||
|
Finance (costs)/income
|
(
|
) |
(
|
) |
|
|||||||
|
|
|
|
|
|
|
|||||||
|
Loss before Tax
|
|
(
|
)
|
|
(
|
)
|
|
(
|
)
|
|||
|
Income tax expense
|
|
(
|
) |
(
|
) | |||||||
|
|
|
|
|
|
|
|||||||
|
Loss for the Year
|
|
(
|
)
|
|
(
|
)
|
|
(
|
)
|
|||
|
|
|
|
|
|
|
|||||||
|
Group’s share of loss for the year
-
|
|
(
|
)
|
|
(
|
)
|
|
(
|
)
|
|||
|
|
|
|
|
|
|
|||||||
Details and movement of equity-accounted investees are as follows:
|
(In Euros)
|
|
Group’s share
of loss for the year |
|
|
Equity-
Accounted Investees |
|
|
Unrecognized
share of losses |
|
|||
|
At 15 June 2019
|
|
—
|
|
|
|
|
|
|
|
|||
|
|
|
|
|
|
|
|||||||
|
Loss for the Year 2019
|
(
|
) |
(
|
) |
|
|||||||
|
|
|
|
|
|
|
|||||||
|
At 31 December 2019
|
|
|
|
|
|
|
||||||
|
|
|
|
|
|||||||||
|
Loss for the Year 2020
|
(
|
) |
(
|
) |
(
|
) | ||||||
|
|
|
|
|
|
|
|||||||
|
At 31 December 2020
|
|
|
|
|
(
|
)
|
||||||
|
|
|
|
|
|||||||||
|
Loss for the Year 2021
|
(
|
) |
|
(
|
) | |||||||
|
|
|
|
|
|
|
|||||||
|
At 31 December 2021
|
|
|
|
|
(
|
)
|
||||||
|
|
|
|
|
|||||||||
The Group’s share of the joint venture loss for the year ended 31 December 2021 was Euros
652,974
(Euros
422,216
and Euros
387,565
at 31 December 2020 and 2019, respectively), out of which
no
amount has been recognized during 2021 (Euros
253,486
and
387,565
at 31 December 2020 and 2019, respectively). In 2020 the Group ceased to recognize its share of losses when applying the equity method. The
821,704
.
cumulative
unrecognized share of losses of the joint venture
,
is Euros
There
will be
no significant restrictions
on the ability of the joint venture to transfer funds to the Wallbox Group in the form of cash dividends, or to repay loans or advances made by the Wallbox
Group.
|
13.
|
FINANCIAL ASSETS AND FINANCIAL LIABILITIES
|
The following table shows the carrying amounts and fair values of financial assets, including their levels in the fair value hierarchy.
F-5
5
WALLBOX N.V.
Notes to the consolidated financial statements
Financial assets
A breakdown of financial assets at 31 December is as follows:
|
A.
|
Current and
non-current
financial assets
|
|
|
|
31 December 2021
|
|
|
31 December 2020
|
|
||||||||||
|
(In Euros)
|
|
Non-current
|
|
|
Current
|
|
|
Non-current
|
|
|
Current
|
|
||||
|
Customer sales and services
|
— |
|
— |
|
||||||||||||
|
Other receivables
|
— |
|
— |
|
||||||||||||
|
Loans to employees
|
— |
|
— |
|
||||||||||||
|
Loans granted to Joint Venture
|
— |
|
— | — | ||||||||||||
|
Receivables from Joint Venture
|
— |
|
— |
|
||||||||||||
|
|
|
|
|
|
|
|
|
|||||||||
|
Trade and other financial receivables
|
|
—
|
|
|
|
|
|
—
|
|
|
|
|
||||
|
Loans granted to Joint Venture
|
|
— |
|
— | ||||||||||||
|
Guarantee deposit
|
|
— |
|
— | ||||||||||||
|
|
|
|
|
|
|
|
|
|||||||||
|
Non-current
financial assets
|
|
|
|
|
—
|
|
|
|
|
|
—
|
|
||||
|
Guarantee deposit
|
— |
|
— |
|
||||||||||||
|
Financial investments
|
— |
|
— |
|
||||||||||||
|
|
|
|
|
|
|
|
|
|||||||||
|
Other current financial assets
|
|
—
|
|
|
|
|
|
—
|
|
|
|
|
||||
|
|
|
|
|
|
|
|
|
|
|
|
|
|
|
|
|
|
|
Cash and cash equivalents
|
|
—
|
|
|
|
|
|
—
|
|
|
|
|
||||
|
|
|
|
|
|
|
|
|
|||||||||
|
Total
|
|
|
|
|
|
|
|
|
|
|
|
|
||||
|
|
|
|
|
|
|
|
|
|||||||||
Trade and other financial receivables are mainly amounts due from customers for goods sold or services performed in the ordinary course of business. They are due for settlement in the short term (less than 1 year) and therefore all are classified as current. Trade and other financial receivables are recognized initially at the amount of consideration that is unconditional, unless they contain significant financing components, when they are recognized at fair value. The Group holds the trade receivables with the objective of collecting the contractual cash flows and therefore measures them subsequently at amortized cost using the effective interest method.
The carrying amounts of the customer sales and services include receivables which are subject to a factoring arrangement. Under this arrangement, the Group has transferred the relevant receivables to the factor in exchange for cash and is prevented from selling or pledging the receivables. However, the Group has retained late payment and credit risk. The Group therefore continues to recognize the transferred assets in their entirety in its statement of financial position.
The amount repayable under the factoring agreement is presented as secured borrowing. The Group considers that the held to collect business model remains appropriate for these receivables and hence continues to measure them at amortized cost.
The
incorporation of new operating companies (Wallbox Italy S.r.l.; Wallbox Netherlands, B.V; and Wallbox Oy) as part of the Group resulted in an increase in customer sales and services. In addition, the growth of the Wallbox brand globally, as well as the creation of new products, has led to an increase in the sales of products and income from services invoiced during 2021.
The
Group applies the IFRS 9 simplified approach to measuring expected credit losses using a lifetime expected credit loss provision for trade receivables and contract assets. To measure expected credit losses on a collective basis, trade receivables and contract assets are grouped based on similar credit risk and aging. The contract assets have similar risk characteristics to the trade receivables for similar types of contracts.
F-5
6
WALLBOX N.V.
Notes to the consolidated financial statements
The
expected loss rates are based on the Group’s historical credit losses experienced over the three-year period prior to the period end.
At 31 December 2021, other current financial assets include financial investments such as investment funds in financial institutions amounting to Euros
56,930,049
(
no
amount at 31 December 2020).
These financial investments are deposits managed by financial institutions in investment funds to obtain profitability. The Group has considered their classification as current assets because it expects to liquidate these investments in the following 12 months.
During 2021, sales were made to the joint venture for an amount of Euros
535,268
(Euros
475,565
for the year 2020), which was outstanding at the reporting date and was reported as trade and other financial receivables.
The guarantee deposit corresponds mainly to leased buildings, whose
733,446
(Euros
390,598
at 31 December 2020), whilst the current term amounts to Euros
482,113
(Euros
118,945
at 31 December 2020).
non-current
term amounts to Euros
The joint venture also received a loan of Euros
1,250,921
, of which Euros
685,048
are recorded as current loans granted to Joint Venture and Euros
565,873
are recorded as
474,174
for 2020 are recorded as
non-current
loans granted to Joint Venture (Euros
non-current
loans granted to Joint Venture).
|
B.
|
Expected credit loss assessment for corporate customers at 31 December 2021, 2020 and 2019.
|
|
|
|
31 December 2021
|
|
|||||||||
|
(In Euros)
|
|
Weighted-average
loss rate |
|
|
Gross carrying
amount |
|
|
Loss allowance
|
|
|||
|
Key account
|
|
% |
|
|
||||||||
|
Mid Market
|
|
% |
|
|
||||||||
|
Other
|
|
% |
|
|
||||||||
|
|
|
|
|
|||||||||
|
|
|
|
|
|
|
|||||||
|
|
|
|
|
|||||||||
|
|
|
31 December 2020
|
|
|||||||||
|
(In Euros)
|
|
Weighted-average
loss rate |
|
|
Gross carrying
amount |
|
|
Loss allowance
|
|
|||
|
Key account
|
|
% |
|
|
||||||||
|
Mid Market
|
|
% |
|
|
||||||||
|
Other
|
|
% |
|
|
||||||||
|
|
|
|
|
|||||||||
|
|
|
|
|
|
|
|||||||
|
|
|
|
|
|||||||||
|
|
|
31 December 2019
|
|
|||||||||
|
(In Euros)
|
|
Weighted-average
loss rate |
|
|
Gross carrying
amount |
|
|
Loss allowance
|
|
|||
|
Key account
|
|
% |
|
|
||||||||
|
Mid Market
|
|
% |
|
|
||||||||
|
Other
|
|
% |
|
|
||||||||
|
|
|
|
|
|||||||||
|
|
|
|
|
|
|
|||||||
|
|
|
|
|
|
|
|
|
|
||||
The Group has also contracted credit insurance policies to cover this risk for certain customers. Operating expenses accrued for the use of these policies amounted to Euro
s
in
2021
and Euros
at
31
December
2020
.
F-5
7
WALLBOX N.V.
Notes to the consolidated financial statements
|
C.
|
Financial assets by class and category
|
|
|
|
31 December 2021
|
|
|||||||||||||
|
(In Euros)
|
|
Financial assets
measured at amortized cost |
|
|
Financial assets
measured at FVTPL |
|
|
Financial assets
measured at FVTOCI |
|
|
Total
|
|
||||
|
Customer sales and services
|
|
— | — |
|
||||||||||||
|
Other receivables
|
|
— | — |
|
||||||||||||
|
Loans to employees
|
|
— | — |
|
||||||||||||
|
Loans granted to Joint Venture
|
|
— | — |
|
||||||||||||
|
Receivables from Joint Venture
|
|
— | — |
|
||||||||||||
|
|
|
|
|
|
|
|
|
|||||||||
|
Trade and other financial receivables
|
|
|
|
|
—
|
|
|
—
|
|
|
|
|
||||
|
|
|
|
|
|
|
|
|
|
|
|
|
|
|
|
|
|
|
Loans granted to Joint Venture
|
|
— | — |
|
||||||||||||
|
Guarantee deposit
|
|
— | — |
|
||||||||||||
|
|
|
|
|
|
|
|
|
|||||||||
|
Non-current
financial assets
|
|
|
|
|
—
|
|
|
—
|
|
|
|
|
||||
|
|
|
|
|
|
|
|
|
|
|
|
|
|
|
|
|
|
|
Guarantee deposit
|
|
— | — |
|
||||||||||||
|
Financial investments
|
|
|
|
|
||||||||||||
|
|
|
|
|
|
|
|
|
|||||||||
|
Other current financial assets
|
|
|
|
|
|
|
|
|
|
|
|
|
||||
|
|
|
|
|
|
|
|
|
|
|
|
|
|
|
|
|
|
|
Cash and cash equivalents
|
|
|
|
|
—
|
|
|
—
|
|
|
|
|
||||
|
|
|
|
|
|
|
|
|
|||||||||
|
Total
|
|
|
|
|
|
|
|
|
|
|
|
|
||||
|
|
|
|
|
|
|
|
|
|||||||||
|
|
|
31 December 2020
|
|
|||||||||||||
|
(In Euros)
|
|
Financial assets
measured at amortized cost |
|
|
Financial assets
measured at FVTPL |
|
|
Financial assets
measured at FVTOCI |
|
|
Total
|
|
||||
|
Customer sales and services
|
|
— | — |
|
||||||||||||
|
Other receivables
|
|
— | — |
|
||||||||||||
|
Loans to employees
|
|
— | — |
|
||||||||||||
|
Receivables from Joint Venture
|
|
— | — |
|
||||||||||||
|
|
|
|
|
|
|
|
|
|||||||||
|
Trade and other financial receivables
|
|
|
|
|
—
|
|
|
—
|
|
|
|
|
||||
|
Loans granted to Joint Venture
|
|
— | — |
|
||||||||||||
|
Guarantee deposit
|
|
— | — |
|
||||||||||||
|
|
|
|
|
|
|
|
|
|||||||||
|
Non-current
financial assets
|
|
|
|
|
—
|
|
|
—
|
|
|
|
|
||||
|
Guarantee deposit
|
|
— | — |
|
||||||||||||
|
Financial investments
|
— | — |
|
|
||||||||||||
|
|
|
|
|
|
|
|
|
|||||||||
|
Other current financial assets
|
|
|
|
|
—
|
|
|
|
|
|
|
|
||||
|
Cash and cash equivalents
|
|
|
|
|
—
|
|
|
—
|
|
|
|
|
||||
|
|
|
|
|
|
|
|
|
|||||||||
|
Total
|
|
|
|
|
—
|
|
|
|
|
|
|
|
||||
|
|
|
|
|
|
|
|
|
|||||||||
Financial assets measured at FVOCI correspond to investments in hedge funds whose quotation is considered level 1 for fair value purposes.
In 2021, the Group has acquired financial investments as investment funds in financial institutions which have been valued at FVTPL. These financial assets are also considered level 1 for fair value purposes.
The rest of the financial assets (both current and
non-current)
are measured at their amortized cost, which does not materially differ from their fair value.
F-5
8
WALLBOX N.V.
Notes to the consolidated financial statements
Financial liabilities
|
A.
|
Loans and borrowings
|
|
|
|
31 December 2021
|
|
|
31 December 2020
|
|
||||||||||
|
(In Euros)
|
|
Non-
current
|
|
|
Current
|
|
|
Non-
current
|
|
|
Current
|
|
||||
|
Loans and borrowings
|
|
|
|
|
||||||||||||
|
Derivative warrant liabilities
|
|
|
|
|
||||||||||||
|
Convertible bonds
|
|
|
|
|
||||||||||||
|
Lease liabilities (see note 9)
|
|
|
|
|
||||||||||||
|
Put option liability (see note 6)
|
|
|
|
|
||||||||||||
|
|
|
|
|
|
|
|
|
|||||||||
|
Total
|
|
|
|
|
|
|
|
|
|
|
|
|
||||
|
|
|
|
|
|
|
|
|
|||||||||
Financial liabilities are measured at their amortized cost, which does not differ from their fair value (it is considered that the interest rates applicable to all of them still represent market spreads), except for the derivative warrant liabilities and the put option liability (Note 6) which are measured at FVTPL. Convertible bonds were also measured at fair value until their conversion into ordinary shares (Note 16).
Loans and borrowings
Details of loans and borrowings at 31 December 2021 and 2020 are as follows:
|
(In Euros)
|
|
|
|
|
|
|
31 December 2021
|
|
||||||||||||||
|
Company
|
|
Currency
|
|
|
Effective
interest rate
|
|
Less than
1 year |
|
|
1 to 3 years
|
|
|
Over 3 years
|
|
|
Total
|
|
|||||
|
Bank loans
|
|
|
|
|
|
|
||||||||||||||||
|
Fixed rate loan
|
|
|
|
|
|
|
|
|
||||||||||||||
|
Floating rate loan
|
|
Euribor +
%
-
|
|
|
— |
|
|
|
||||||||||||||
|
Covenant Loan
|
|
|
|
|
|
|
|
|
||||||||||||||
|
Covenant Loan
|
|
|
|
|
|
|
|
|
||||||||||||||
|
|
|
|
|
|
|
|
|
|||||||||||||||
|
Total
|
|
|
|
|
|
|
|
|
|
|
|
|
||||||||||
|
|
|
|
|
|
|
|
|
|||||||||||||||
|
Borrowings
|
||||||||||||||||||||||
|
Fixed rate loan
|
|
|
|
|
|
|
|
|
||||||||||||||
|
|
|
|
|
|
|
|
|
|||||||||||||||
|
Total
|
|
|
|
|
|
|
|
|
|
|
|
|
||||||||||
|
|
|
|
|
|
|
|
|
|||||||||||||||
|
Total
|
|
|
|
|
|
|
|
|
|
|
|
|
||||||||||
|
|
|
|
|
|
|
|
|
|||||||||||||||
F-5
9
WALLBOX N.V.
Notes to the consolidated financial statements
|
(In Euros)
|
|
|
|
|
|
|
31 December 2020
|
|
||||||||||||||
|
Company
|
|
Currency
|
|
|
Effective
interest rate
|
|
Less than
1 year |
|
|
1 to 3 years
|
|
|
Over 3 years
|
|
|
Total
|
|
|||||
|
Bank loans
|
|
|
|
|
|
|
||||||||||||||||
|
Fixed rate loan
|
|
-
|
|
|
|
|
|
|
||||||||||||||
|
Fixed rate loan
|
|
|
|
— | — |
|
|
|
||||||||||||||
|
Fixed rate loan
|
|
|
|
— | — |
|
|
|
||||||||||||||
|
Floating rate loan
|
|
Euribor +
-
|
|
|
|
|
|
|
||||||||||||||
|
Covenant Loan
|
|
Euribor +
|
|
|
|
|
|
|
||||||||||||||
|
|
|
|
|
|
|
|
|
|||||||||||||||
|
Total
|
|
|
|
|
|
|
|
|
|
|
|
|
||||||||||
|
|
|
|
|
|
|
|
|
|||||||||||||||
|
Borrowings
|
||||||||||||||||||||||
|
Fixed rate loan
|
|
-
|
— |
|
|
|
|
|
||||||||||||||
|
|
|
|
|
|
|
|
|
|||||||||||||||
|
Total
|
|
—
|
|
|
|
|
|
|
|
|
|
|
||||||||||
|
|
|
|
|
|
|
|
|
|||||||||||||||
|
Total
|
|
|
|
|
|
|
|
|
|
|
|
|
||||||||||
|
|
|
|
|
|
|
|
|
|||||||||||||||
Bank loans
At
31 December 2021, the Group had credit lines of Euros
(Euros
at 31 December 2020), of which a total of Euros
have been drawn down (Euros
at 31 December 2020).
Interest
expenses from bank loans amounted to Euros
at 31 December 2021 (Euros
at 31 December 2020) (See Note 22). At 31 December 2021, accrued interest payable totals Euros
(Euros
at 31
December 2020).
The group has loans which imply the compliance of certain conditions. On 31 December 2021, the Group received a waiver from Banco Santander to comply with the covenants for financial year 2021 as included in the loan agreement entered into on 21 April 2021. As such, management believes that the covenant loan can be presented as
non-current
liabilities in the consolidated statement of financial position, except for the repayment obligation of financial year 2022.
Borrowings
Loans
and borrowings include borrowings which correspond mainly to a loan from one of the Company’s shareholders amounting to Euros
48,400
at 31 December 2020. In 2021 this loan was
paid to the shareholder, which subsequently sold its interest to another Group shareholder. Part of the balance was offset by various capital increases totaling Euros
in 2020
.
At
31 December 2021, credit accounts with shareholders amount to Euros
(Euros
at 31 December 2020), and a loan from a Government entity (CDTI) totals Euros
(
at 31 December 2020).
Interest
expenses for borrowings amounted to Euros
2,864
at 31 December 2021 (Euros
7,578
at 31 December 2020)
(See Note 22).
F-
60
WALLBOX N.V.
Notes to the consolidated financial statements
Details of the maturities, by year, of the principals and interest of the loans and borrowings at 31 December are as follows:
|
(In Euros)
|
|
31 Dec 2021
|
|
|
31 Dec 2020
|
|
||
|
2021
|
— |
|
||||||
|
2022
|
|
|
||||||
|
2023
|
|
|
||||||
|
2024
|
|
|
||||||
|
2025
|
|
|
||||||
|
2026
|
|
— | ||||||
|
More than five years
|
|
|
||||||
|
|
|
|
|
|||||
|
Total
|
|
|
|
|
|
|
||
|
|
|
|
|
|||||
B. Derivative warrant liabilities
As mentioned
in Note
6
, as
part o
the Transaction,
f
Public Warrants and
Private Warrants issued by Kensington have been assumed by Wallbox.
At
31 December 2021, the Group had
5,705,972
Public Warrants and
8,933,333
Private Warrants outstanding,
after some warrant holders
had
exercised their options on 23 November and 21 December 2021 (see Note 16).
Public
Warrants entitle the holder to convert each warrant into one Class A ordinary share of Wallbox of Euros
par value at an exercise price of USD
.
Private
Warrants, on a cash-less basis, entitle their holder to convert the warrants into a number of Wallbox Class A ordinary share of
euros par value equal to
the
product of the number of warrants to convert multiplied by the quotient obtained by dividing the excess of ‘Sponsor’s Fair Market Value’ over the exercise price of USD
between the Sponsor’s Fair Market Value’.
The
Sponsor Fair Market Value shall mean the average last reported sale price of the ordinary shares for the ten (
) trading days ending on the
trading day prior to the date on which notice of exercise of the Private Warrant.
Until
warrant holders acquire the ordinary shares upon exercise of such warrants, they will have no voting or economic rights. The warrants
will
expire on
,
after the Transaction, or earlier upon redemption or liquidation in accordance with their terms.
As there are no elements in the warrant agreements that give Wallbox the possibility to prevent the warrant owners to convert their warrants within 12 months Wallbox has classified the derivative warrant liabilities as current liability.
Fair value measurements
The financial liability for the derivative warrants is accounted for at fair value through profit or loss. The Private Warrants have been measured at fair value using a Monte Carlo simulation (Level 3). The Public Warrants are listed and have been measured at fair value using the quoted price (Level 1).
The
fair value of the Pub
lic Warrants increased from USD
1.14
per warrant as of the
Transaction date (1 October 2021)
to USD
F-
61
WALLBOX N.V.
Notes to the consolidated financial statements
from
USD
per warrant as of the Transaction date to USD
per warrant at 31 December 2021. Consequently, for the year ended 31 December 2021, the Group has recognized a charge of Euros
in profit or loss, which has been presented as a change in the fair value of derivative warrant liabilities under net finance expenses (see Note 22).
Inherent
in a Monte Carlo simulation are assumptions related to expected stock-price volatility, expected life, risk-free interest rate and dividend yield. The Group estimates the volatility of its common stock warrants based on implied volatility from the Company’s traded warrants and from historical volatility of selected peer company’s common stock that matches the expected remaining life of the warrants. The expected life of the warrants is assumed to be equivalent to their remaining contractual term. The dividend rate is based on the historical rate, which the Company anticipates will remain at zero.
Movement in the derivative warrant liabilities for the year ended 31 December 2021 is summarized as follows:
|
|
|
Public Warrant
|
|
|
Private Warrant
|
|
|
Total
|
|
|||||||||||||||
|
|
|
Number of
warrants |
|
|
Euros
|
|
|
Number of
warrants |
|
|
Euros
|
|
|
Number of
warrants |
|
|
Euros
|
|
||||||
|
At 30 September 2021
|
|
|
|
|
|
|
|
|
|
|
|
|
|
|
|
|
|
|
||||||
|
Issuance of Public and Private Warrants on Transaction date
|
|
|
|
|
|
|
||||||||||||||||||
|
Public Warrants exercised on 23 November 2021
|
(
|
) |
(
|
) | — | — |
(
|
) |
(
|
) | ||||||||||||||
|
Public Warrants exercised on 21 December 2021
|
(
|
) |
(
|
) | — | — |
(
|
) |
(
|
) | ||||||||||||||
|
Change in fair value of derivative warrant liabilities
|
— |
|
— |
|
— |
|
||||||||||||||||||
|
|
|
|
|
|
|
|
|
|
|
|
|
|||||||||||||
|
At 31 December 2021
|
|
|
|
|
|
|
|
|
|
|
|
|
|
|
|
|
|
|
||||||
|
|
|
|
|
|
|
|
|
|
|
|
|
|||||||||||||
C. Convertible bonds
These
corresponded mainly to the bonds convertible into shares issued during 2020 for an amount of Euros
, most of which were held by shareholders. As per the analysis of the Group, these notes were considered a compound financial instrument (they had an equity component and a financial liability component), but the value of the equity component at issuance was estimated as nil (and it would not be remeasured in the future). Therefore, the value was only assigned to the financial liability. In January 2021 convertible bonds with the same features and maturity date as mentioned above were issued for an amount of Euros
. These loans bore interest at the rate of
% and had a maximum maturity date of
(this conferred the possibility of converting them prior to that date in case of any liquidity event).
Furthermore
, in April 2021, the Company successfully closed the issuance of a new convertible note of Euros
27,550,000
, with an interest rate of
5
% and a maximum maturity date at 30 September 2022 (this conferred the possibility of converting them prior to that date in case of any liquidity event).
Wallbox
measured this hybrid contract at FVTPL amounting to
Eu
r
os
25,490,981
, before capital increase of 16 September 2021 mentioned on the following paragraph (see Notes
1
3 and 22).
On
16 September 2021, convertible bonds and the convertible note were converted, including part of the accrued interest, for Euro
s
. As a consequence,
Class A ordinary shares with a par value of Euros
each were issued, leading to increases in share capital and share premium amounting to Euros
and Euros
, respectively (see Note 16).
F-6
2
WALLBOX N.V.
Notes to the consolidated financial statements
At
31 December 2021, accrued interest payable (net of applicable withholdings) amounted to Euros
(Euros
at 31 December 2020), as part of this interest was not
converted
in the conversion (Euros
).
Reconciliation of movements of liabilities to cash flows arising from financing activities
|
(In Euros)
|
|
Loans and
borrowings |
|
|
Derivative
warrant liabilities |
|
|
Lease
liabilities |
|
|
Convertible
bonds |
|
|
Total
|
|
|||||
|
Balance at 1 January 2021
|
|
|
|
|
|
|
|
|
|
|
|
|
|
|
|
|||||
|
|
|
|
|
|
|
|
|
|
|
|||||||||||
|
Proceeds from loans
|
|
— | — | — |
|
|
|
|||||||||||||
|
Proceeds from borrowings
|
|
— | — | — |
|
|
|
|||||||||||||
|
Proceeds from warrants (Public and Private)
|
— | — | — | — |
|
—
|
|
|||||||||||||
|
Proceeds from convertible bonds
|
— | — | — |
|
|
|
|
|||||||||||||
|
Principal paid on lease liabilities
|
— | — |
(
|
) | — |
|
(
|
)
|
||||||||||||
|
Interest paid on lease liabilities
|
— | — |
(
|
) | — |
|
(
|
)
|
||||||||||||
|
Repayments of loans
|
(
|
) | — | — | — |
|
(
|
)
|
||||||||||||
|
Repayments of borrowings
|
(
|
) | — | — | — |
|
(
|
)
|
||||||||||||
|
Interest and bank fees paid
|
(
|
) | — | — | — |
|
(
|
) | ||||||||||||
|
Interest paid on convertible bonds
|
— | — | — |
(
|
) |
|
(
|
) | ||||||||||||
|
Other payments
|
(
|
) | — | — | — |
|
(
|
)
|
||||||||||||
|
|
|
|
|
|
|
|
|
|
|
|||||||||||
|
Total changes from financing cash flows
|
|
|
|
|
—
|
|
|
(
|
)
|
|
|
|
|
|
|
|||||
|
|
|
|
|
|
|
|
|
|
|
|||||||||||
|
The effect of changes in foreign exchange rates
|
|
—
|
|
|
—
|
|
|
(
|
)
|
|
—
|
|
|
(
|
)
|
|||||
|
|
|
|
|
|
|
|
|
|
|
|||||||||||
|
Issuance of Public and Private
|
||||||||||||||||||||
|
Warrants on Transaction date
|
— |
|
— | — |
|
|
|
|||||||||||||
|
Public Warrants exercised
|
— |
(
|
) | — | — |
|
(
|
)
|
||||||||||||
|
Change in fair value of derivative warrant liabilities
|
— |
|
— | — |
|
|
|
|||||||||||||
|
Valuation of convertible bonds
|
— | — | — |
|
|
|
|
|||||||||||||
|
Conversion of convertible bonds and convertible note
|
— | — | — |
(
|
) |
|
(
|
)
|
||||||||||||
|
New leases
|
— | — |
|
— |
|
|
|
|||||||||||||
|
Interest accrual
|
|
|
|
|
|
|
—
|
|
|
|
—
|
|
|
|
(
|
)
|
|
|
—
|
|
|
Governmental loan to re
c
eive
|
|
— | — |
|
|
|
|
|||||||||||||
|
Capital Increases
|
— | — | — | — |
|
—
|
|
|||||||||||||
|
Interest and bank fees expenses
|
|
— |
|
|
|
|
|
|||||||||||||
|
|
|
|
|
|
|
|
|
|
|
|||||||||||
|
Total liability-related other changes
|
|
|
|
|
|
|
|
|
|
|
(
|
) |
|
|
|
|||||
|
|
|
|
|
|
|
|
|
|
|
|||||||||||
|
Balance at 31 December 2021
|
|
|
|
|
|
|
|
|
|
|
|
|
|
|
|
|||||
|
|
|
|
|
|
|
|
|
|
|
|||||||||||
F-
6
3
WALLBOX N.V.
Notes to the consolidated financial
statements
|
(In Euros)
|
|
Loans and
borrowings |
|
|
Derivative
warrant liabilities |
|
|
Lease
liabilities |
|
|
Convertible
bonds |
|
|
Total
|
|
|||||
|
Balance at 1 January 2020
|
|
|
|
|
|
|
—
|
|
|
|
|
|
|
|
—
|
|
|
|
|
|
|
|
|
|
|
|
|
|
|
|
|
|
|
|
|
|
|
|
|
|
|
|
|
Proceeds from loans and borrowings
|
|
|
|
|
|
|
—
|
|
|
|
—
|
|
|
|
—
|
|
|
|
|
|
|
Proceeds from convertible bonds
|
|
|
—
|
|
|
|
—
|
|
|
|
—
|
|
|
|
|
|
|
|
|
|
|
Principal paid on lease liabilities
|
|
|
—
|
|
|
|
—
|
|
|
|
(
|
)
|
|
|
—
|
|
|
|
(
|
)
|
|
Interest paid on lease liabilities
|
|
|
—
|
|
|
|
—
|
|
|
|
(
|
)
|
|
|
—
|
|
|
|
(
|
)
|
|
Repayments of loans and borrowings
|
|
|
(
|
)
|
|
|
—
|
|
|
|
—
|
|
|
|
—
|
|
|
|
(
|
)
|
|
Interest paid
|
|
|
(
|
)
|
|
|
—
|
|
|
|
—
|
|
|
|
—
|
|
|
|
(
|
)
|
|
Other payments
|
|
|
(
|
)
|
|
|
—
|
|
|
|
—
|
|
|
|
—
|
|
|
|
(
|
)
|
|
|
|
|
|
|
|
|
|
|
|
|
|
|
|
|
|
|
|
|
|
|
|
Total changes from financing cash flows
|
|
|
|
|
|
|
—
|
|
|
|
(
|
)
|
|
|
|
|
|
|
|
|
|
|
|
|
|
|
|
|
|
|
|
|
|
|
|
|
|
|
|
|
|
|
|
The effect of changes in foreign exchange rates
|
|
|
—
|
|
|
|
—
|
|
|
|
(
|
)
|
|
|
—
|
|
|
|
(
|
)
|
|
|
|
|
|
|
|
|
|
|
|
|
|
|
|
|
|
|
|
|
|
|
|
New leases
|
|
|
—
|
|
|
|
—
|
|
|
|
|
|
|
|
—
|
|
|
|
|
|
|
Capital Increases
|
|
|
(
|
)
|
|
|
—
|
|
|
|
—
|
|
|
|
—
|
|
|
|
(
|
)
|
|
Interest expenses
|
|
|
|
|
|
|
—
|
|
|
|
|
|
|
|
|
|
|
|
|
|
|
|
|
|
|
|
|
|
|
|
|
|
|
|
|
|
|
|
|
|
|
|
|
Total liability-related other changes
|
|
|
|
|
|
|
—
|
|
|
|
|
|
|
|
|
|
|
|
|
|
|
|
|
|
|
|
|
|
|
|
|
|
|
|
|
|
|
|
|
|
|
|
|
Balance at 31 December 2020
|
|
|
|
|
|
|
—
|
|
|
|
|
|
|
|
|
|
|
|
|
|
|
|
|
|
|
|
|
|
|
|
|
|
|
|
|
|
|
|
|
|
||
|
(In Euros)
|
|
Loans and
borrowings |
|
|
Warrants
|
|
|
Leases
|
|
|
Convertible
bonds |
|
|
Total
|
|
|||||
|
Balance at 1 January 2019
|
|
|
|
|
|
|
—
|
|
|
|
|
|
|
|
—
|
|
|
|
|
|
|
|
|
|
|
|
|
|
|
|
|
|
|
|
|
|
|
|
|
|
|
|
|
Proceeds from loans and borrowing
|
|
|
|
|
|
|
—
|
|
|
|
—
|
|
|
|
—
|
|
|
|
|
|
|
Proceeds from shareholders loan
|
|
|
|
|
|
|
—
|
|
|
|
—
|
|
|
|
—
|
|
|
|
|
|
|
Principal paid on lease liabilities
|
|
|
—
|
|
|
|
—
|
|
|
|
(
|
)
|
|
|
—
|
|
|
|
(
|
)
|
|
Interest paid on lease liabilities
|
|
|
—
|
|
|
|
—
|
|
|
|
(
|
)
|
|
|
—
|
|
|
|
(
|
)
|
|
Repayments of loans and borrowin
g
|
|
|
(
|
)
|
|
|
—
|
|
|
|
—
|
|
|
|
—
|
|
|
|
(
|
)
|
|
Interest paid
|
|
|
(
|
)
|
|
|
—
|
|
|
|
—
|
|
|
|
—
|
|
|
|
(
|
)
|
|
Other payments
|
|
|
(
|
)
|
|
|
—
|
|
|
|
—
|
|
|
|
—
|
|
|
|
(
|
)
|
|
|
|
|
|
|
|
|
|
|
|
|
|
|
|
|
|
|
|
|
|
|
|
Total changes from financing cash flows
|
|
|
|
|
|
|
—
|
|
|
|
(
|
)
|
|
|
—
|
|
|
|
|
|
|
|
|
|
|
|
|
|
|
|
|
|
|
|
|
|
|
|
|
|
|
|
|
New leases
|
|
|
—
|
|
|
|
—
|
|
|
|
|
|
|
|
—
|
|
|
|
|
|
|
Capital increases
|
|
|
(
|
|
|
|
—
|
|
|
|
—
|
|
|
|
—
|
|
|
|
(
|
)
|
|
Interest expenses
|
|
|
|
|
|
|
—
|
|
|
|
|
|
|
|
—
|
|
|
|
|
|
|
|
|
|
|
|
|
|
|
|
|
|
|
|
|
|
|
|
|
|
|
|
|
Total liability-related other changes
|
|
|
(
|
)
|
|
|
—
|
|
|
|
|
|
|
|
—
|
|
|
|
|
|
|
|
|
|
|
|
|
|
|
|
|
|
|
|
|
|
|
|
|
|
|
|
|
Balance at 31 December 2019
|
|
|
|
|
|
|
—
|
|
|
|
|
|
|
|
—
|
|
|
|
|
|
|
|
|
|
|
|
|
|
|
|
|
|
|
|
|
|
|
|
|
|
|
|
F-6
4
WALLBOX N.V.
Notes to the consolidated financial statements
Trade and other payables
Details of trade and other payables at 31 December 2021 and 2020 are as follows:
|
(In Euros)
|
|
31 Dec 2021
|
|
|
31 Dec 2020
|
|
||
|
Suppliers
|
|
|
||||||
|
Various payables
|
|
|
||||||
|
Personnel (salaries payable)
|
|
|
||||||
|
Customer advances
|
|
|
||||||
|
|
|
|
|
|||||
|
Total
|
|
|
|
|
|
|
||
|
|
|
|
|
|||||
Trade and other payables are unsecured and are usually paid in less than 12 months upon recognition. The carrying amounts of trade and other payables are considered equal to their fair values, due to their short-term nature.
|
14.
|
INVENTORIES
|
Details of inventories at 31 December 2021 and 2020 are as follows:
|
(In Euros)
|
|
31 Dec 2021
|
|
|
31 Dec 2020
|
|
||
|
Raw materials
|
|
|
||||||
|
Work in progress
|
|
|
||||||
|
Finished goods
|
|
|
||||||
|
|
|
|
|
|||||
|
Total
|
|
|
|
|
|
|
||
|
|
|
|
|
|||||
Based
on current information, the group has booked an inventory provision of Euros
at 31 December 2021 to cover the impact of slow-moving and accrual obsolescence inventories (No impairment losses have been recognized in 2020) (see Note 20).
There
were no commitments for the acquisition of inventories at the end of 2021 and 2020. Advance payments for the acquisition of inventories at 31 December 2021 total
(Euros
at 31 December 2020).
|
15.
|
CASH AND CASH EQUIVALENTS
|
Detail of cash and equivalents at 31 December 2021 and 2020 are as follows:
|
(In Euros)
|
|
31 Dec 2021
|
|
|
31 Dec 2020
|
|
||
|
Cash
|
|
|
|
|
|
|
|
|
|
Banks and other credit institutions
|
|
|
|
|
|
|
|
|
|
Banks and other credit institutions, foreign currency
|
|
|
|
|
|
|
|
|
|
Other cash equivalents
|
|
|
|
|
|
|
|
|
|
|
|
|
|
|
|
|
|
|
|
Total
|
|
|
|
|
|
|
|
|
|
|
|
|
|
|
|
|
|
|
The current accounts earn interest at applicable market rates and this interest is not significant.
F-6
5
WALLBOX N.V.
Notes to the consolidated financial statements
Details of banks and other credit institutions, foreign currency are as follows:
|
(In Euros)
|
|
31 Dec 2021
|
|
|
31 Dec 2020
|
|
||
|
USD
|
|
|
|
|
|
|
|
|
|
GBP
|
|
|
|
|
|
|
|
|
|
NOK
|
|
|
|
|
|
|
|
|
|
SEK
|
|
|
|
|
|
|
|
|
|
DKK
|
|
|
|
|
|
|
|
|
|
CNY
|
|
|
|
|
|
|
|
|
|
|
|
|
|
|
|
|
|
|
|
Total
|
|
|
|
|
|
|
|
|
|
|
|
|
|
|
|
|
|
|
Significant
non-cash
transactions from investing and financing activities are as follows:
|
(In Euros)
|
|
31 Dec 2021
|
|
|
|
Conversion of convertible bonds and convertible note (Note 13)
|
|
|
(
|
)
|
|
Contribution in kind of Kensington shares (Note 16)
|
|
|
|
|
|
|
|
|
|
|
|
Total
|
|
|
(
|
)
|
|
|
|
|
|
|
16. CAPITAL AND RESERVES
Share capital and share premium
On
31 December 2020 share capital of Wallbox Chargers amounted
t
o Euros
On
16 September 2021, convertible bonds and a convertible note were
f
converted
in a capital increase issuance o
Class A ordinary shares of Wallbox Chargers with a par value of Euro
s
each, leading to increases in the share capital and share premium amounting to Euros
and Euros
respectively (see Note
13)
.
As indicated
in Note
6
, on 1 October 2021, pursuant to the Business Combination Agreement each holder of Wallbox Chargers ordinary shares exchanged by means of a contribution in kind its Wallbox Chargers ordinary shares to Wallbox N.V. in exchange for the issuance of shares in accordance with the Exchange Ratio. Therefore, Wallbox Chargers became a wholly owned subsidiary of Wallbox N.V. Consequentl
y,
539,561
0.50
106,778,437
0.12
par value and
23,250,793
Class B ordinary shares of Euro
1,20
40 444 584
Wallbox Chargers ordinary shares of Euro
par value were exchanged for
Class A ordinary shares of Wallbox N.V. of Euro
par value. Consequently. share capital increased by
and the share premium decreased by the same amount.
Furthermore
, on 1 October 2021, each share of Kensington’s common stock was exchanged by means of a contribution in kind in exchange for the issuance of Class A Shares, whereby Wallbox issued
Class A Share for each share of new Kensington common stock exchanged, meaning the issuance of
Wallbox Class A ordinary shares of Euro
par value, and increasing share capital by Euros
and share premium by Euros
, which includes the impact of applying IFRS 2 for Euros
(see Note
6
and 22)
and the deduction of the net of the transaction costs amounting to Eur
o
s
(see Note
6
).
Concurrently with the execution of the Business Combination Agreement, Kensington and Wallbox entered into Subscription Agreements (the “Subscription Agreements”), dated 9 June 2021 and 29 September 2021,
F-6
6
WALLBOX N.V.
Notes to the consolidated financial statements
with
certain
investors (the “PIPE Investors”), pursuant to which the PIPE Investors agreed to subscribe to and purchase, and Wallbox agreed to issue and sell to such PIPE Investors, an aggregate of
Class A Shares (the “PIPE Shares”) at a price of USD
per share for an aggregate of USD
in proceeds (the “PIPE Financing”) on the Closing Date. Such
Class A Shares meant a capital increase of Euros
and a rise in share premium of Euros
.
In September
,
Wallbox Class A ordinary shares of Euro
par value were issued, increasing share capital by Euros
.
Finally
, as indicated in Note 13, on 23 November 2021 and 21 December 2021,
and
Public Warrants, respectively, were converted into
and
Wallbox Class A ordinary shares of Euro
par value, increasing share capital by Euros
and raising share premium by Euros
.
The share premium is freely distributable, provided that equity is not lower than the aggregate of share capital as a result of such distribution and the legal reserves.
As at 31 December 2021, issued share capital is as follows:
|
(In Euros)
|
|
Total
Shares |
|
|
Share
Capital |
|
||
|
Class A shares of euro
|
|
|
|
|
|
|
|
|
|
Class B shares of euro
|
|
|
|
|
|
|
|
|
|
|
|
|
|
|
|
|
|
|
|
Total
|
|
|
|
|
|
|
|
|
|
|
|
|
|
|
|
|
|
|
As at 31 December 2021, authorized share capital is as follows:
|
(In Euros)
|
|
Total
Shares |
|
|
Nominal
value |
|
|
Amount
|
|
|||
|
Class A
|
|
|
|
|
|
|
|
|
|
|
|
|
|
Class B
|
|
|
|
|
|
|
|
|
|
|
|
|
|
Conversion shares
|
|
|
|
|
|
|
|
|
|
|
|
|
|
|
|
|
|
|
|
|
|
|
||||
|
Total
|
|
|
|
|
|
|
|
|
|
|||
|
|
|
|
|
|
|
|
|
|
||||
F-6
7
WALLBOX N.V.
Notes to the consolidated financial statements
Movement of share capital and share premium are as follows:
|
(In Euros)
|
|
Shares
|
|
|
Price per
Share |
|
|
Share
Capital |
|
|
Share
Premium |
|
||||
|
At 1 January 2019
|
|
|
|
|
|
|
|
|
|
|||||||
|
|
|
|
|
|
|
|||||||||||
|
31 May 2019 share capital and share premium increase
|
|
|
|
|
||||||||||||
|
4 September 2019 share capital and share premium increase
|
|
|
|
|
||||||||||||
|
28 November 2019 share capital increase
|
|
|
|
— | ||||||||||||
|
28 November 2019 share capital split
|
(
|
) |
|
(
|
) | — | ||||||||||
|
28 November 2019 share capital split
|
|
|
|
— | ||||||||||||
|
|
|
|
|
|
|
|||||||||||
|
At 31 December 2019
|
|
|
|
|
|
|
|
|
|
|||||||
|
|
|
|
|
|
|
|||||||||||
|
|
|
|
|
|
|
|
|
|
|
|
|
|
|
|
|
|
|
17 March 2020 share capital and share premium increase
|
|
|
|
|
||||||||||||
|
|
|
|
|
|
|
|||||||||||
|
At 31 December 2020
|
|
|
|
|
|
|
|
|
|
|||||||
|
|
|
|
|
|
|
|||||||||||
|
16 September 2021 convertible bonds conversion (see note 13)
|
|
|
|
|
||||||||||||
|
1 October 2021 elimination old shares class A
an
B (see note 3)
d
|
(
|
) |
|
(
|
) |
(
|
) | |||||||||
|
1 October 2021 share capital Class A increase (see note 3)
|
|
|
|
|
||||||||||||
|
1 October 2021 share capital Class B increase (see note 3)
|
|
|
|
— | ||||||||||||
|
1 October 2021 share capital Class A for Kensington (see note 3)*
|
|
|
|
|
||||||||||||
|
1 October 2021 share capital Class A for PIPE (see note 3)
|
|
|
|
|
||||||||||||
|
1 October 2021 share capital Class A increase
|
|
|
|
— | ||||||||||||
|
23 November 2021 Warrant conversion (see note 13)
|
|
|
|
|
||||||||||||
|
21 December 2021 Warrant conversion (see note 13)
|
|
|
|
|
||||||||||||
|
|
|
|
|
|
|
|||||||||||
|
At 31 December 2021
|
|
|
|
|
|
|
|
|
|
|||||||
|
|
|
|
|
|
|
|||||||||||
|
|
*
|
Includes Euros
|
All the shares
issued have been fully paid at the date of the capital increase. Wallbox Class A ordinary shares and Wallbox Class B ordinary shares provide their holders with same economic rights, but
Nature and purpose of reserves
Consolidated prior years’ accumulated deficit
At
31 December 2021,
20,118,232
at 31 December
total
consolidated accumulated deficit amounts to Euros 243,895,696 (Euros
2020).
F-6
8
WALLBOX N.V.
Notes to the consolidated financial statements
Foreign currency translation reserve
The translation
reserve comprises all foreign currency differences arising from the translation of the financial statements of foreign operations, as well as the effective portion of any foreign currency differences arising from hedges of a net investment in a foreign operation. This legal reserve is not freely distributable. This reserve amounts to Euros
2,600,609
at 31 December 2021 (Euros
76,169
at 31 December 2020).
Other equity components
Share-based payments
The
share-based payments reserve is used to recognize the value of equity-settled share-based payments provided to employees, including key management personnel, as part of their remuneration. This reserve amounts to Euros
at 31 December 2021 (Euros
at 31 December 2020). Refer to Note 21 for further details of these plans.
Measurement adjustments to financial assets through OCI
Investments in hedge funds referred to in Note 13 are measured at fair value at year end. The change in their valuation is recognized as other equity components through other comprehensive income.
|
17.
|
PROVISIONS
|
Details of this item are as
follows:
|
31 December 2021
|
|
Non-current
|
|
|
Total
Non-current
|
|
|
Current
|
|
|||||||
|
(In Euros)
|
|
Provision of
compliance |
|
|
Service
warranties |
|
|
Service
warranties |
|
|||||||
|
Carrying amount at the beginning of the year
|
|
|
|
|
||||||||||||
|
Charge / (Credit) to results:
|
(
|
) |
|
|
|
|||||||||||
|
(+) additional provisions recognized (net)
|
|
|
|
|
|
|
|
|
|
|
|
|
||||
|
(+/-) Short-term transferred
|
|
|
|
|
(
|
)
|
|
(
|
)
|
|
|
|
||||
|
(-) Amounts used during the year
|
|
(
|
)
|
|
|
|
|
(
|
)
|
|
(
|
)
|
||||
|
|
|
|
|
|
|
|
|
|||||||||
|
Carrying amount at year end
|
|
|
|
|
|
|
|
|
|
|
|
|
||||
|
|
|
|
|
|
|
|
|
|||||||||
|
31 December 2020
|
|
Non-current
|
|
|
Total
Non-current
|
|
|
Current
|
|
|||||||
|
(In Euros)
|
|
Provision of
compliance |
|
|
Service
warranties |
|
|
Service
warranties |
|
|||||||
|
Carrying amount at the beginning of the year
|
|
|
|
|
||||||||||||
|
Charge / (Credit) to results:
|
|
|
|
|
||||||||||||
|
(+) additional provisions recognized (net)
|
|
|
|
|
|
|
|
|
|
|
|
|
||||
|
(-) Amounts used during the year
|
|
|
|
|
|
|
|
|
|
|
|
|
||||
|
|
|
|
|
|
|
|
|
|||||||||
|
Carrying amount at year end
|
|
|
|
|
|
|
|
|
|
|
|
|
||||
|
|
|
|
|
|
|
|
|
|||||||||
S
ervice warranties
Products developed and sold by the Group are under warranty for a period of two years and, therefore, a provision is made annually to cover the estimated costs that could be incurred in relation to projects and products under warranty at year end. This provision is calculated based on an estimate of warranty costs incurred and their relation to the volume of sales under warranty.
F-6
9
WALLBOX N.V.
Notes to the consolidated financial statements
18. GOVERNMENT GRANTS
Details of Government grants at 31 December 2021 are as follows (At 31 December 2020 was nil):
|
(In Euros)
|
|
|
|
31 December 2021
|
|
|||||
|
Grants
|
|
Government Entity
|
|
Non-current
liability |
|
|
Current
liability |
|
||
|
Movilidad 2030
|
|
|
|
|
|
|
|
|||
|
Flexener
|
|
|
|
|
|
|
|
|||
|
Magnetor
|
|
|
|
|
|
|
|
|||
|
Zeus Ptas
|
|
|
|
|
|
|
|
|||
|
Alt impacte
|
|
|
|
|
|
|
|
|||
|
|
|
|
|
|
|
|
||||
|
Total
|
|
|
|
|
|
|
|
|||
|
|
|
|
|
|
|
|
||||
Government
grants include the grants assigned to the Group during 2021 by the “Centro para el Desarrollo Tecnológico Industrial, E.P.E. (CDTI)” and “Agencia para la Competitividad de la Empresa de la Generalitat de Cataluña (ACCIÓ)” for an amount of Euros
and Euros
, respectively, to develop new technologies and promote smart mobility solutions.
T
he impact in the statement of profit or loss (recognized in the “Other income”) for 2021 amounts to Euros
, as a result of the established conditions agreed with the aforementioned entities. During 2021, Euros
have been received from government entities, therefore, at 31 December 2021, Euros
are pending receipt (see Note 24).
|
19.
|
REVENUE FROM CONTRACTS WITH CUSTOMERS
|
Disaggregation of revenue from contracts with customers
The Group’s revenues that derive from the transfer of goods and services are recognized at a point in time. Revenues are shown below based on product lines and geographical segments:
|
(In Euros)
|
|
2021
|
|
|
2020
|
|
|
2019
|
|
|||
|
Lines:
|
||||||||||||
|
Sales of goods
|
|
|
|
|||||||||
|
Sales of services
|
|
|
|
|||||||||
|
|
|
|
|
|
|
|||||||
|
Total
|
|
|
|
|
|
|
|
|
|
|||
|
|
|
|
|
|
|
|||||||
|
|
|
|
|
|
|
|
|
|
|
|
|
|
|
Geographical markets:
|
||||||||||||
|
EMEA
|
|
|
|
|||||||||
|
NORAM
|
|
|
|
|||||||||
|
APAC
|
|
|
|
|||||||||
|
|
|
|
|
|
|
|||||||
|
Total
|
|
|
|
|
|
|
|
|
|
|||
|
|
|
|
|
|
|
|||||||
There is no customer exceeding
segments
that
represent more than
respectively.
F-
70
WALLBOX N.V.
Notes to the consolidated financial statements
|
20.
|
EXPENSES
|
|
A.
|
Changes in inventories and raw materials and consumables used
|
Details of changes in inventories and raw materials and consumables used are as follows:
|
(In Euros)
|
|
2021
|
|
|
2020
|
|
|
2019
|
|
|||
|
Consumption of finished goods, raw materials and other consumables
|
|
|
|
|||||||||
|
Scrap stock, slow moving & obsolete accrual
|
|
|
|
|||||||||
|
Work carried out by other companies
|
|
|
|
|||||||||
|
|
|
|
|
|
|
|||||||
|
Total
|
|
|
|
|
|
|
|
|
|
|||
|
|
|
|
|
|
|
|||||||
Changes to inventories are recorded under consumption of finished goods, raw materials and other
consumables.
|
B.
|
Operating expenses
|
Operating expenses are mainly as follows:
|
(In Euros)
|
|
2021
|
|
|
2020
|
|
|
2019
|
|
|||
|
Professional services
|
|
|
|
|||||||||
|
Marketing expenses
|
|
|
|
|||||||||
|
Delivery
|
|
|
|
|||||||||
|
External temporary workers
|
|
|
|
|||||||||
|
Office expense
|
|
|
|
|||||||||
|
Insurance premium
|
|
|
|
|||||||||
|
Utilities and similar expenses
|
|
|
|
|||||||||
|
Fees
|
|
|
|
|||||||||
|
Customs duty tax
|
|
|
|
|||||||||
|
Travel expenses
|
|
|
|
|||||||||
|
Short-term and low value leases (see note 9)
|
|
|
|
|||||||||
|
Bank Services
|
|
|
|
|||||||||
|
Expected credit loss for trade and other receivables
|
|
|
|
|||||||||
|
Repairs
|
|
|
|
|||||||||
|
Other impairment and losses
|
|
|
|
|||||||||
|
Other
|
|
|
|
|||||||||
|
|
|
|
|
|
|
|||||||
|
Total
|
|
|
|
|
|
|
|
|
|
|||
|
|
|
|
|
|
|
|||||||
Professional services include Euros
8,046,158
corresponding to the
non-incremental
or
in
directly attributable costs to the issuance of shares for the Transaction as mentioned in Note
6
.
In addition to the marketing expenses and insurance premium recognized in the consolidated profit
9,130,320
or
loss statements and other comprehensive income, there are Euros
of expenses paid in advance which will be recognized in the consolidated profit
loss statement and other comprehensive income during the year 2022 (there ar
and
e
no
expenses paid in advance at 31 December 2020). This prepayment is specifically recognized in other current assets/deferred charges as part of the consolidated statements of financial position.
F-
71
WALLBOX N.V.
Notes to the consolidated financial statements
21. EMPLOYEE BENEFITS
Details of employee benefits for the years ended 31 December 2021, 2020 and 2019 are as follows:
|
(In Euros)
|
|
2021
|
|
|
2020
|
|
|
2019
|
|
|||
|
Wages and salaries
|
|
|
|
|||||||||
|
Share-based payment plan expenses
|
|
|
|
|||||||||
|
Social Security
|
|
|
|
|||||||||
|
|
|
|
|
|
|
|||||||
|
Total
|
|
|
|
|
|
|
|
|
|
|||
|
|
|
|
|
|
|
|||||||
The notable rise in personnel expenses compared to 2020 is mainly explained because of the significant growth of the Wallbox Group, which required the hiring of extra personnel. Furthermore, this growth is also explained by the share-based payment plan for management (known as the Management Stock Option Plan) as a consequence for an accelerated vested for all options of this
plan. The Group has not entered into any defined contribution or defined benefit plans for which pensions costs are incurred.
Management Stock Option Plan
At a meeting held on 25 July 2018, the shareholders agreed to implement a share-based payment plan to strengthen management’s link with Wallbox Chargers and to boost their motivation (2021 Management Stock Option Plan).
This arrangement was an equity-settled plan. Consequently, the Group has recognized a personnel expense against an increase in equity based on the fair value of the options at grant date, i.e., the day on which the 2021 Management Stock Option Plan contract is signed by the Company and the member of management.
A first tranche of
5,369
options
were granted
in 2019,
in 2020
were granted
and during 2021 tranches
were granted
for a total of
options.
Each of the tranches had vesting conditions linked to the employment of the beneficiaries and to their performance.
In
accordance with the terms and conditions of the Transaction, these options will be available to be executed in exchange for Wallbox shares of Euro
0.12
par value (previously Euros
0.50
) in a period of
10
years from the Closing date, and each outstanding option has been converted into
240.990795184659
options based on the Exchange Ratio.
During 2021, the personnel expense recognized in the statement of profit or loss derived from this Plan has amounted to Euros
2,381,993
(Euros
1,191,757
and Euros
559,609
for 2020 and 2019, respectively).
Employee Stock Option Plan
During the
COVID-19
pandemic shareholders agreed to offer all employees of Wall Box Chargers (the “Beneficiaries” or, individually, the “Beneficiary”) the possibility of participating in a share-based payment plan over shares (the “Options”) which gave all Beneficiaries the opportunity to acquire a certain number of ordinary shares (the “Shares”) of the Wallbox Chargers. Participation in this Plan was voluntary and it was created as a cash saving measure, as it was offered in exchange for a reduction in the salaries of the Beneficiaries, which has resulted in strategic cash maintenance during the uncertain period caused by the
COVID-19
pandemic, although in exchange, the exercise price of the options is E
uro
.
Furthermore, because of these savings, the Company has been able to continue with its strategic plans and continues to hire the best professionals from the industry to exit the COVID-19 period with a stronger position with regard to competitors.
F-
7
2
WALLBOX N.V.
Notes to the consolidated financial statements
This arrangement was an equity-settled plan. Consequently, the Group has recognized a personnel expense against an increase in equity based on the fair value of the options at grant date, that in this case was
1 May 2020
.
The Employee Stock Option Plan vesting period finished at the end of 2020 and all the options granted were available for execution when one of the liquidity events defined in this Plan took place. In accordance with the terms and conditions of the Transaction, these options will be available for execution in exchange for Wallbox shares of Euros
0.12
par value (previously Euros
0.50
) in a period of
10
years from the Closing date, and each outstanding option has been converted into
240.990795184659
options based on the Exchange Ratio.
During January 2021 there was an agreement with some employees to settle their options held in exchange for cash (
1,254
options were settled at fair value on the settlement date). Additionally, it was agreed with the
same employees to pay an additional benefit amounting to Euros
73,222
for the sale of the options. As a consequence, the Group has recognized this effect as a reduction amounting to Euros
239,150
and Euros
626
in equity and in liabilities, respectively, and has recognized personnel expenses amounting to Euros
73,222
(Euros
1,593,212
in 2020), for a total cash payment of Euros
312,998
.
Founders Stock Option Plan
At a meeting held at 30 June 2021, the shareholders agreed to implement a share- based payment plan (Legacy Stock Option Program) to strengthen the bond of the founders of Wallbox in order to aligning the interests of the founders with the creation of additional value for the Company with a strike price at a valuation equal to or even higher than current market value and allowing the founders to benefit from more liquid Options which are fully vested and transferable from their date of concession.
The maximum number of Shares that shall underlie all of the Options included in this Plan shall be, at the Effective Date, equivalent to
4.289
shares (
1,033,610
shares after applying the Exchange Ratio). Options under this Plan shall be granted over Class A ordinary shares of the Company.
The Board of Directors of the Company, shall deliver a personal notice to each Beneficiary, with an invitation to participate in the Plan, which shall contain, among others, the number of Options granted to each Beneficiary; and, where appropriate, the individual conditions governing the participation of the Beneficiary in the Plan. For the purposes of this Plan, the date of concession shall be that date indicated in the Invitation Notice.
In accordance with the terms and conditions of the Plan, these options will be available to be executed in exchange for Wallbox shares of Euro
0.12
par value (previously Euros
0.50
), the
1.93
per share after applying the Exchange Ratio of
240.990795184659
(previously Euros
per share).
exercise
price of the options will be equivalent to Euros
Compliance with each and every one of the following conditions shall be an essential requisite for a Beneficiary to exercise the Options:
| i. |
The Beneficiary will have a
lock-up
period of
|
|
|
| ii. |
That the Company has not initiated a Temporary Suspension of exercise; and
|
| iii. |
That any other particular conditions included in the Beneficiary’s Invitation Notice have been fulfilled.
|
During 2021,
no
personnel expense recognized in the
statement
of profit or loss derived from this Plan because the Beneficiary’s Invitation Notice established by the plan agreement has not been sent.
F-
7
3
WALLBOX N.V.
Notes to the consolidated financial statements
Summary of share-based payment arrangements
The Company recorded share- based payments based on the estimated fair value of the award at the grant date and they are recognized as an expense in the consolidated statements of profit and loss over the requisite service period. The estimated fair value of the award was based on the estimated market price of the Parent’s stock on the grant date.
Details of the personnel expenses recognized for share-based payment transactions are as follows:
|
(In Euros)
|
2021
|
2020
|
2019
|
|||||||||
|
Management stock option plan
|
|
|
|
|||||||||
|
Employee stock option plan
|
|
|
|
|||||||||
|
|
|
|
|
|
|
|||||||
|
Total
|
|
|
|
|
|
|
|
|
|
|||
|
|
|
|
|
|
|
|||||||
The contractual life of the options outstanding at
year-end
is between
-
3
years.
Movements during the year
The following table illustrates the movements in stock options at 31 December:
|
Number of options
|
|
2021
|
|
|
2020
|
|
|
2019
|
|
|||
|
Outstanding at the beginning of the year
|
|
|
|
|
|
|
|
|
|
|||
|
Granted during the year
|
|
|
|
|||||||||
|
Management stock option plan
|
|
|
|
|
|
|
|
|
|
|||
|
Employee stock option plan
|
|
|
|
|
|
|
|
|
|
|||
|
Settled during the year
|
(
|
) |
|
|
||||||||
|
Management stock option plan
|
|
|
|
|||||||||
|
Employee stock option plan
|
|
(
|
) |
|
|
|
|
|
|
|||
|
Forfeited during the year
|
(
|
) |
|
|
||||||||
|
Management stock option plan
|
|
|
|
|||||||||
|
Employee stock option plan
|
-
|
|
|
|||||||||
|
Outstanding before applying the conversion ratio
|
|
|
|
|
|
|
|
|
|
|||
|
|
|
|
|
|
|
|||||||
As per the Transaction, outstanding options were converted into options to be executed in exchange for Class A shares of Wallbox, as per the Exchange Ratio (
240.990795184659
). Consequently, at 31 December 2021 outstanding options amount to
8,880,029
. Added to the options of the Founder Stock Option Plan that are not outstanding, the total options at 31 December 2021 amount to
9,913,639
.
The fair value of the options granted was determined based on the value of the shares issued in the closest financing rounds (share capital increases) that have taken place during 2020 and 2021.
The fair value of the options granted as part of
122.64
the
Management Stock Option plan in April 2019 was determined at Euros
to the value of the shares issued on 31 March 2019, Euros
123.14
(for one Wallbox Chargers S.L. share) reduced
for the exercise price of Euros
0.5
(the par value of the
shares of Wallbox Chargers, S.L.)
.
The fair value of the second tranche of options granted in January 2020 was determined at Euros
190.71
reference to the capital increase transaction of Euros
207.54
(for one Wallbox Chargers S.L. share) in
March 2020, corrected for the dilutive effect of the options and further reduced for the exercise price of Euros
The fair value of the options granted as
207.54
(for one Wallbox Chargers S.L. share) in
part
of the Employee Stock Option Plan was also based on the closest financing round of share capital issued, of Euros
F-7
4
WALLBOX N.V.
Notes to the consolidated financial statements
March 2020, corrected for the dilutive effect of the options. As no exercise price needed to be paid by the beneficiaries of this plan the fair value amounts to Euros
191.71
(for one Wallbox Chargers S.L. option).
As from 1 October 2021, all existing options of Wallbox Chargers S.L. were converted into Wallbox NV options with the same conditions at a conversion rate of
1 option of Wallbox Chargers S.L. for 240.990795184659 options
of Wallbox NV.
All options from 1 October 2021 were valued at €
8.63
per option (for one Wallbox NV option), reflecting the fair value at that moment on the Company’s share price.
The weighted average fair value of the options (after applying the conversion ratio) was Euros
at 31 December
2021 and Euros
at 31 December
2020, for the Management Stock Option Plan, and Euros
at 31 December
2021 and 2020 for the Employee Stock Option Plan.
The weighted average exercise price for both share-based payment plans is Euros
0.0021
, calculated as follows:
|
|
|
Options
(units) |
|
|
Execise price
(Euros) |
|
||
|
Management stock option plan
|
|
|
|
|
|
|
|
|
|
Employees stock option plan
|
|
|
|
|
|
|
|
|
|
|
|
|
|
|
||||
|
Average
|
|
|
|
|
|
|||
|
|
|
|
|
|
||||
22. NET FINANCIAL EXPENSES
Details of financial income and
expenses
are as follows:
|
(In Euros)
|
|
Note
|
|
|
2021
|
|
|
2020
|
|
|
2019
|
|
||||
|
Financial income
|
||||||||||||||||
|
Interest on shareholder and other loans
|
|
13
|
|
|
|
|
||||||||||
|
Valuation of financial instruments
|
|
|
|
|||||||||||||
|
Other finance income
|
|
|
|
|||||||||||||
|
|
|
|
|
|
|
|||||||||||
|
Total financial income
|
|
|
|
|
|
|
|
|
|
|||||||
|
|
|
|
|
|
|
|||||||||||
|
Fair Value adjustment of the Warrants
|
|
13
|
|
|
|
|
|
|
|
|
|
|
||||
|
|
|
|
|
|
|
|||||||||||
|
Financial expenses
|
||||||||||||||||
|
Fair value adjustment of convertible bonds
|
|
13
|
|
|
|
|
||||||||||
|
Interest and fees on bank loans
|
|
13
|
|
|
|
|
||||||||||
|
Interest on lease liabilities
|
|
9
|
|
|
|
|
||||||||||
|
Interest on shareholder and other borrowings
|
|
13
|
|
|
|
|
||||||||||
|
Interest on convertible bonds
|
|
13
|
|
|
|
|
||||||||||
|
Accretion of discount on put option liabilities
|
|
6
|
|
|
|
|
||||||||||
|
Other finance costs
|
|
|
|
|||||||||||||
|
|
|
|
|
|
|
|||||||||||
|
Total financial expenses
|
|
|
|
|
|
|
|
|
|
|||||||
|
|
|
|
|
|
|
|||||||||||
F-7
5
WALLBOX N.V.
Notes to the consolidated financial statements
Details of other financial income (expenses) are as follows:
|
(In Euros)
|
2021
|
2020
|
2019
|
|||||||||
|
Exchange differences
|
|
(
|
) |
(
|
) | |||||||
|
|
|
|
|
|
|
|||||||
|
Total
|
|
|
|
|
(
|
)
|
|
(
|
)
|
|||
|
|
|
|
|
|
|
|||||||
| 23. |
EARNINGS PER SHARE
|
Basic earnings per share are calculated by
dividing
the profit/(loss) for the year attributable to equity holders of the Parent by the weighted average number of ordinary shares outstanding during the year (see explanations regarding the impact of the Transaction over the weighted average number of ordinary shares in Note 3).
As the Company has losses in all three periods, potential ordinary shares from Management Stock Options, Employee Stock Options and Warrants are not dilutive (losses per share would be less and anti-dilution would exist), Hence, these shares are not considered in the calculation of losses per diluted share.
Details of the calculation of basic and diluted
earnings
/loss per share are as follows:
|
(In Euros)
|
31 Dec 2021
|
31 Dec 2020
|
31 Dec 2019
|
|||||||||
|
Loss for the year
|
(
|
) |
(
|
) |
(
|
) | ||||||
|
Dilutive effects on earnings per share
|
|
|
|
|||||||||
|
|
|
|
|
|
|
|||||||
|
Total loss for basic and diluted earnings per share
|
|
(
|
) |
|
(
|
)
|
|
(
|
)
|
|||
|
|
|
|
|
|
|
|||||||
|
Number of shares
|
31 Dec 2021
|
31 Dec 2020
|
31 Dec 2019
|
|||||||||
|
Weighted average number of ordinary shares for basic and diluted earnings per share
|
|
|
|
|
|
|
|
|
|
|||
|
|
|
|
|
|
|
|||||||
|
(Euros)
|
31 Dec 2021
|
31 Dec 2020
|
31 Dec 2019
|
|||||||||
|
Basic and diluted losses per share
|
|
(
|
)
|
|
(
|
)
|
|
(
|
)
|
|||
|
|
|
|
|
|
|
|||||||
See note
6
for further details on the impact of
the
Transaction
over the EPS.
F-7
6
WALLBOX N.V.
Notes to the consolidated financial statements
|
24.
|
TAX CREDIT AND OTHER RECEIVABLES/OTHER PAYABLES
|
|
A.
|
Tax credit and other receivables/Other
payables
|
|
|
|
(In Euros)
|
|
31 Dec 2021
|
|
|
31 Dec 2020
|
|
||
|
VAT receivable
|
|
|
||||||
|
Government grants receivable
|
|
|
||||||
|
Tax credit receivable
|
|
|
||||||
|
|
|
|
|
|||||
|
Total
|
|
|
|
|
|
|
||
|
|
|
|
|
|||||
|
(In Euros)
|
31 Dec 2021
|
31 Dec 2020
|
||||||
|
VAT payable
|
|
|
||||||
|
Social Security payable
|
|
|
||||||
|
Personal Income Tax payable
|
|
|
||||||
|
Deferred tax liabilities
|
|
|
||||||
|
|
|
|
|
|||||
|
Total
|
|
|
|
|
|
|
||
|
|
|
|
|
|||||
|
B.
|
Amounts recognized in profit or loss
|
|
(In Euros)
|
2021
|
2020
|
2019
|
|||||||||
|
Loss before Tax
|
|
(
|
) |
|
(
|
)
|
|
(
|
)
|
|||
|
|
|
|
|
|
|
|||||||
|
Tax income (at 25%)
|
|
|
|
|||||||||
|
Unrecognized deferred tax assets on tax losses
|
(
|
) |
(
|
) |
(
|
) | ||||||
|
Deductions and credits generated
|
(
|
) |
(
|
) |
|
|||||||
|
Amortization of intangible assets identified
|
(
|
) |
|
|
||||||||
|
Other adjustments
|
(
|
) |
|
|
||||||||
|
|
|
|
|
|
|
|||||||
|
Income tax credit
|
|
(
|
)
|
|
(
|
)
|
|
|
|
|||
|
|
|
|
|
|
|
|||||||
The nominal tax income is calculated at
25
%, being the corporate tax rate of Spain.
Deductible
temporary and perman
ent differences for which no deferred tax asset has been recognized in the statement of financial position at 31 December 2021 amounts to Euros
and Euros
, respectively (Euros
for deductible temporary differences at 31 December 2020).
The amount of Euros
101,920,506
relating to deductible temporary differences mainly corresponds to the fair value adjustment of the warrants, the share-based payment plan
The amount of Euros
54,756,984
reflecting deductible permanent differences corresponds mainly to deductible expenses recognized against share premium and listing expenses for the services provided by Kensington.
provision and part of the financial expenses.
As a result of the definitive allocation of the purchase price of Electromaps, S.L., the comparative financial information for the 2020 financial year has been restated (see Notes 2 and 6). This has led to the recognition of intangible assets to the detriment of the goodwill recognized in the consolidated annual accounts for 2020. The impact of this adjustment has led to the recognition of a deferred tax liability amounting to Euros
40,636
at 31 December 2020.
F-7
7
WALLBOX N.V.
Notes to the consolidated financial statements
During
originated
a release of the deferred tax liability for Euros
At 31 December, details of the tax losses to be offset are as follows:
|
(In Euros)
|
|
31 Dec 2021
|
|
|
31 Dec 2020
|
|
|
31 Dec
2019 |
|
|||
|
2015
|
|
|
|
|||||||||
|
2016
|
|
|
|
|||||||||
|
2017
|
|
|
|
|||||||||
|
2018
|
|
|
|
|||||||||
|
2019
|
|
|
|
|||||||||
|
2020
|
|
|
— | |||||||||
|
2021
|
|
— | — | |||||||||
|
|
|
|
|
|
|
|||||||
|
Total
|
|
|
|
|
|
|
|
|
|
|||
|
|
|
|
|
|
|
|||||||
Tax losses may be offset indefinitely in the future.
The existence of unused tax losses is strong evidence that future taxable profit may not be available to the Group. Having considered all evidence available, management determined that there was
evidence outweighing existing negative evidence to support that it is probable that future taxable profits will be available against which to offset the tax losses. Accordingly,
no
deferred tax asset is recognized in the financial statements.
insufficient
positive
|
25.
|
GROUP INFORMATION
|
|
A.
|
Related
parties
|
Details of transactions and balances with related parties are as follows:
|
|
|
31 December 2021
|
|
|||||||||||||
|
(Euros)
|
|
Shareholders
|
|
|
Joint Venture
|
|
|
Key
management
|
|
|
Total
|
|
||||
|
Expenses
|
||||||||||||||||
|
Interest on convertible bonds (see note 13 and 22)
|
|
— | — |
|
|
|
||||||||||
|
Valuations of convertible bonds (see note 13 and 22)
|
|
— | — |
|
|
|
||||||||||
|
Interest on shareholder and other loans (see note 22)
|
|
|
— |
|
|
|
||||||||||
|
Professional services
|
— | — | — |
|
—
|
|
||||||||||
|
Statement of financial position
|
||||||||||||||||
|
Non-current loans granted to Joint Venture (see note 13)
|
— |
|
— |
|
|
|
||||||||||
|
Current loans granted to Joint Venture (see note 13)
|
— |
|
— |
|
|
|
||||||||||
|
Receivables from Joint Venture (see note 13)
|
— |
|
— |
|
|
|
||||||||||
|
Borrowings (see note 13)
|
(
|
) | — | — |
|
(
|
)
|
|||||||||
F-7
8
WALLBOX N.V.
Notes to the consolidated financial statements
|
|
|
31 December 2020
|
|
|||||||||||||
|
(Euros)
|
|
Shareholders
|
|
|
Joint Venture
|
|
|
Key
management
|
|
|
Total
|
|
||||
|
Expenses
|
|
|
|
|
||||||||||||
|
Interest on convertible bonds (see note 13 and 22)
|
|
|
|
|
|
|
—
|
|
|
|
—
|
|
|
|
|
|
|
Interest on shareholder and other loans (see note 22)
|
|
|
|
|
|
|
—
|
|
|
|
—
|
|
|
|
|
|
|
Other financial interest
|
|
|
—
|
|
|
|
—
|
|
|
|
|
|
|
|
|
|
|
Professional services
|
|
|
—
|
|
|
|
—
|
|
|
|
|
|
|
|
|
|
|
Statement of financial position
|
|
|
|
|
||||||||||||
|
Current loans granted to Joint Venture (see note 13)
|
|
|
—
|
|
|
|
|
|
|
|
—
|
|
|
|
|
|
|
Receivables from Joint Venture (see note 13)
|
|
|
—
|
|
|
|
|
|
|
|
—
|
|
|
|
|
|
|
Convertible bonds (see note 13)
|
|
|
(
|
)
|
|
|
—
|
|
|
|
—
|
|
|
|
(
|
)
|
|
Borrowings (see note 13)
|
|
|
(
|
)
|
|
|
—
|
|
|
|
—
|
|
|
|
(
|
)
|
|
Trade and other financial payables (see note 13)
|
|
|
(
|
)
|
|
|
—
|
|
|
|
—
|
|
|
|
(
|
)
|
|
|
|
|
|
|
|
|
|
|
|
|
|
|
|
|
|
|
In June 4, 2021 the Group has entered into a contract with a subsidiary of Iberdrola group for the arrangement of offices in Barcelona. This contract has impacted in the financial statements as a Right of Use totaling at 31 December 2021 €
4,848,142
and lease liabilities totaling at 31 December 2021 €
5,055,498
.
At 31 December 2020, convertible bonds amounted to Euros
26,145,982
and the nominal amount stood at Euros
25,880,000
at 31 December 2020) (Note 13). Part of this convertible bond was signed with its current shareholders for a total amount of Euros
17,880,000
at 31 December 2020. The remaining convertible bonds were signed with two third party investors.
Furthermore, in April 2021, the Company
27,550,000
.
of this convertible bond was signed with its current shareholders for a total amount of Euros
20,550,000
. The remaining convertible bonds were signed with two third party investors.
successfully
closed the issuance of a new convertible bond of Euros
Part
On 16 September 2021, convertible bonds and a convertible note were converted, including part of the accrued interest, for Euros
87,031,625
.
38,430,000
and Euros
1,651,255
for capitalizable interest. The remaining convertible bonds correspond to three third party investors who from that moment on become shareholders of the Group.
All
of this convertible bond was
converted
, including a nominal amount of Euros
Finally, from interest expenses amounting to Euro
s
(Notes 13 and 21), Euro
s
are with shareholders and the rest with third party investors (Euro
for total interest expenses and Euros
interest with shareholders at 31
December 2020).
There were
no
write-offs of receivables on related parties during the financial years 2021, 2020 and 2019.
No
credit loss provisions were recognized for receivables on related parties as at 31 December 2021, 31 December 2020 and 31 December 2019.
F-7
9
WALLBOX N.V.
Notes to the consolidated financial statements
|
B.
|
Remuneration of Directors and Key Management
|
Details of the remuneration accrued by the members of the Company’s senior management are as follows:
|
(Euros)
|
2021
|
2020
|
2019
|
|||||||||
|
Salaries and similar
|
|
|
|
|||||||||
|
Share-based payment plan expenses
|
|
|
|
|||||||||
|
|
|
|
|
|
|
|||||||
|
Total
|
|
|
|
|
|
|
|
|
|
|||
|
|
|
|
|
|
|
|||||||
Remuneration received for executive functions corresponds to those individuals who exercise senior management functions in the Company, including the directors, details of which are shown in the table above.
At 31 December 2021 and 2020 the Company has
no
pension or life insurance obligations with members of senior management.
At 31 December 2021 and 2020
no
advances or loans have been granted to members of senior management, nor has the Company extended any
guarantees on their behalf.
During
2021 public liability insurance premiums of Euros
3,646
(Euros
3,510
at 31
December 2020)
have been paid for damages or losses incurred by directors in the performance of their duties.
26. FINANCIAL RISK MANAGEMENT
Risk management policies are established by management, having previously been approved by the Company’s directors. Based on these policies, the Finance department has established a number
of
procedures
and controls to identify, measure and manage risks deriving from the activity involving financial instruments. These policies, inter alia, prohibit the Company from speculating with derivatives.
Any
activity involving financial instruments exposes the Company to credit risk, market risk and liquidity risk.
|
a)
|
Credit risk
|
Credit risk arises from possible losses deriving from failure to comply with contractual obligations on the part of the Group’s counterparties, i.e., the possibility of not recovering financial assets at the amount recognized and within the established term.
F-
80
WALLBOX N.V.
Notes to the consolidated financial statements
The maximum credit risk exposure is as follows:
|
|
|
31 December 2021
|
|
|
31 December 2020
|
|
||||||||||
|
(In Euros)
|
|
Non-current
|
|
|
Current
|
|
|
Non-current
|
|
|
Current
|
|
||||
|
Customer sales and services
|
|
|
—
|
|
|
|
|
|
|
|
—
|
|
|
|
|
|
|
Other receivables
|
|
|
—
|
|
|
|
|
|
|
|
—
|
|
|
|
|
|
|
Loans to employees
|
|
|
—
|
|
|
|
|
|
|
|
—
|
|
|
|
|
|
|
Loans granted to Joint Venture
|
|
|
—
|
|
|
|
|
|
|
|
—
|
|
|
|
—
|
|
|
Receivables from Joint Venture
|
|
|
—
|
|
|
|
|
|
|
|
—
|
|
|
|
|
|
|
|
|
|
|
|
|
|
|
|
|
|
|
|
|
|
|
|
|
Trade and other financial receivables
|
|
|
—
|
|
|
|
|
|
|
|
—
|
|
|
|
|
|
|
Loans granted to Joint Venture
|
|
|
|
|
|
|
—
|
|
|
|
|
|
|
|
—
|
|
|
|
|
|
|
|
|
|
|
|
|
|
|
|
|
|
|
|
|
Non-current
financial assets
|
|
|
|
|
|
|
—
|
|
|
|
|
|
|
|
—
|
|
|
Financial investments
|
— |
|
— |
|
|
|||||||||||
|
|
|
|
|
|
|
|
|
|
|
|
|
|
|
|
|
|
|
Other current financial assets
|
|
—
|
|
|
|
|
|
—
|
|
|
|
|
||||
|
Cash and cash equivalents
|
|
—
|
|
|
|
|
|
—
|
|
|
|
|
||||
|
Total
|
|
|
|
|
|
|
|
|
|
|
|
|
|
|
|
|
|
|
|
|
|
|
|
|
|
|
|
|
|
|
|
|
||
The
Sales and Finance departments establish credit limits for each customer based on information received from an entity specializing in company solvency analysis. Refer to Note 13B for a further disclosure on the expected credit loss of customer sales and services.
|
b)
|
Market risk
|
Market risk arises from possible losses deriving from fluctuations in the
fair
value or in future cash flows of financial instruments because of changes in market prices. Market risk includes interest rate, currency and other price risks.
Interest rate risk
Interest rate risk arises from possible losses due to changes in the fair value or the future cash flows of a financial instrument because of fluctuations in market interest
rates.
|
(In Euros)
|
|
Currency
|
|
|
31 Dec 2021
|
|
|
31 Dec 2020
|
|
|
31 Dec 2019
|
|
||||
|
Fixed rate Loan
|
|
|
EUR
|
|
|
|
|
|
|
|
|
|
|
|
|
|
|
Fixed rate Loan
|
|
|
NOK
|
|
|
|
—
|
|
|
|
|
|
|
|
—
|
|
|
Fixed rate Loan
|
|
|
USD
|
|
|
|
—
|
|
|
|
|
|
|
|
—
|
|
|
Floating rate loan
|
|
|
EUR
|
|
|
|
|
|
|
|
|
|
|
|
|
|
|
|
|
|
|
|
|
|
|
|
|
|
|
|
||||
|
Total
|
|
|
|
|
|
|
|
|
|
|
|
|
|
|||
|
|
|
|
|
|
|
|
|
|
|
|
|
|
||||
A
basis points change in interest rates would mean an increase (decrease) in profit or loss at 31 December 2021 amounting to Euros
(Euros
at 31 December 2020). This calculation assumes that the change occurred on the date of the report applied to the risk exposures existing on that date.
|
|
|
2021
|
|
|
2020
|
|
||||||||||
|
|
|
Profit or loss
|
|
|
Profit or loss
|
|
||||||||||
|
(In Euros)
|
|
100 bp
increase |
|
|
100 bp
decrease |
|
|
100 bp
increase |
|
|
100 bp
decrease |
|
||||
|
Floating rate loan
|
|
|
(
|
)
|
|
|
(
|
)
|
|
|
(
|
)
|
|
|
|
|
|
|
|
|
|
|
|
|
|
|
|
|
|
|
|
|
|
|
F-
81
WALLBOX N.V.
Notes to the consolidated financial statements
Currency risk
Currency risk is the risk of possible losses due to changes in the fair value of and future cash flows from financial instruments as a result of exchange rate fluctuations.
Cash
and cash equivalents, trade and other financial receivables and other current assets / deferred charges are mainly the items included within the Group’s assets and liabilities that are denominated in a currency other than the functional currency.
The following table shows the sensitivity of a reasonably possible strengthening (weakening) of the Euro in each of the foreign currencies at 31 December of monetary assets and liabilities. This analysis assumes that all other variables, particularly interest rates, remain constant and ignores any impact from anticipated sales and purchases. The Group’s exposure to foreign currency exchange for all other currencies is not significant.
|
|
|
2021
|
|
|
2020
|
|
||||||||||
|
|
|
Profit or loss
|
|
|
Profit or loss
|
|
||||||||||
|
(In Euros)
|
|
Strengthening
|
|
|
Weakening
|
|
|
Strengthening
|
|
|
Weakening
|
|
||||
|
USD (10% movement)
|
|
|
(
|
)
|
|
|
|
|
|
|
|
|
|
|
(
|
)
|
|
GBP (10% movement)
|
|
|
(
|
)
|
|
|
|
|
|
|
(
|
)
|
|
|
|
|
Other market price risk
The Group has acquired financial investments as investment funds in financial institutions which have been measured at FVTPL (see Note 13). These investments amount to Euros
56,930,049
at 31 December 2021 (
No
investments at 31 December 2020). The Group also holds investments in funds measured at FVTOC
I
(see Note 13)
. These investments amount to Euros
209,951
at 31 December 2021 (Euros
239,379
at 31 December 2020) and therefore the exposure is evaluated as not significant.
The Group has derivative warrant liabilities (see Note 13) and put option liabilities (see Note 6) which are measured at FVTPL.
The derivative warrant liabilities amount to Euros
83,251,712
at 31 December 2021 including a fair value adjustment of Euros
68,953,503
compared to the Transaction date.
The put option liabilities amount to Euros
3,776,438
at 31 December 2021 (Euros
6,338,520
at 31 December 2020).
|
c)
|
Liquidity risk
|
Liquidity risk arises where the Group might not hold, or have access to, sufficient liquid funds at an appropriate cost to settle its payment obligations at any given
time.
Details of working capital are as follows:
|
(In Euros)
|
|
31 Dec 2021
|
|
|
31 Dec 2020
|
|
||
|
Current assets
|
|
|
|
|
|
|
|
|
|
Current liabilities
|
|
|
|
|
|
|
|
|
|
|
|
|
|
|
|
|
|
|
|
Total
|
|
|
|
|
|
|
|
|
|
|
|
|
|
|
|
|
|
|
The
working capital presented by the Group is sufficient to cover the various commitments arising from its activity.
F-8
2
WALLBOX N.V.
Notes to the consolidated financial statements
Details of the maturities, by year, of the principals of the loans and borrowings at 31 December are as follows:
|
|
|
31 December 2021
|
|
|||||||||
|
(In Euros)
|
|
Capital
|
|
|
Interest
|
|
|
Total
|
|
|||
|
2022
|
|
|
|
|
|
|
|
|
|
|
|
|
|
2023
|
|
|
|
|
|
|
|
|
|
|
|
|
|
2024
|
|
|
|
|
|
|
|
|
|
|
|
|
|
2025
|
|
|
|
|
|
|
|
|
|
|
|
|
|
2026
|
|
|
|
|
|
|
|
|
|
|
|
|
|
More than five years
|
|
|
|
|
|
|
|
|
|
|
|
|
|
|
|
|
|
|
|
|
|
|
|
|
|
|
|
Total
|
|
|
|
|
|
|
|
|
|
|
|
|
|
|
|
|
|
|
|
|
|
|
|
|
|
|
|
|
|
31 December 2020
|
|
|||||||||
|
(In Euros)
|
|
Capital
|
|
|
Interest
|
|
|
Total
|
|
|||
|
2021
|
|
|
|
|
|
|
|
|
|
|
|
|
|
2022
|
|
|
|
|
|
|
|
|
|
|
|
|
|
2023
|
|
|
|
|
|
|
|
|
|
|
|
|
|
2024
|
|
|
|
|
|
|
|
|
|
|
|
|
|
2025
|
|
|
|
|
|
|
|
|
|
|
|
|
|
More than five years
|
|
|
|
|
|
|
|
|
|
|
|
|
|
|
|
|
|
|
|
|
|
|
|
|
|
|
|
Total
|
|
|
|
|
|
|
|
|
|
|
|
|
|
|
|
|
|
|
|
|
|
|
|
|
|
|
|
d)
|
Capital management
|
For the purpose of the Group’s capital management, capital includes issued capital, share premium and all other equity reserves attributable to the equity holders of the Parent. The primary objective of the Group’s capital management is to maximize the shareholder value. The Group manages its capital structure and makes adjustments in light of changes in economic conditions and its financial requirements to roll out its business plans. The Group may also issue new shares or issue/repay debt financial instruments to maintain or adjust the capital structure. The Group monitors capital management to ensure that it meets its financial needs to achieve its business objectives while maintaining its solvency.
2020.
|
27.
|
EVENTS AFTER THE REPORTING PERIOD
|
After the reporting date of 31 December 2021, holders
of Public warrants have converted
warrants into
Class A ordinary shares of
euros of par value, meaning an increase of share capital of Euros
and a share-premium of Euros
, at a price of USD
On 12 January 2022, some holders of Private Warrants, have converted
50,000
warrants on
14,891
Class A ordinary shares on a cash-less basis, considering a ‘Sponsor’s Fair Market Value’ of USD
16.38
(the excess over the ‘Sponsor’s Fair Market Value’ amounted to USD
16.38
minus USD
11.50
). This has meant an increase of share capital Euros
1,787
and a share-premium of Euros
324,607
.
On 21 April 2022, a member of the key management of the group converted
100
options (as part of the management stock option plan) into 100 Class A ordinary shares of
0.12
euros of par value, meaning an increase of share capital of Euros
12
.
F-8
3
WALLBOX N.V.
Notes to the consolidated financial statements
As a result of escalating tensions along the Russia-Ukraine border, the U.S. and certain allies in Europe imposed sanctions on Russia and could impose further sanctions against it. Russia could respond in kind. Sanctions imposed by any of these countries could disrupt our supply of critical components among our manufacturing facilities in Europe. Such disruptions could negatively affect our ability to provide critical components to affiliates or produce finished goods for customers, which could increase our costs, require capital expenditures and harm our results of operations and financial condition. Wallbox has analyzed also the potential impacts of external factors as the Ukraine-Russia conflict, and considers that it will not affect significantly the normal course of the business. However, we continue to monitor the situation closely.
On 24 September 2021 the Group has signed a new lease agreement of land and buildings for the construction of the facility in Arlington – Texas (USA). This contract has been effective in the beginning of 2022.
F-
8
4
WALLBOX N.V.
Notes to the consolidated financial statements
|
28.
|
DETAILS OF WALLBOX GROUP SUBSIDIARIES
|
|
|
|
|
|
|
|
|
|
% Equity interest
|
|
|
|
|
||||||||||
|
Company name
|
|
Registered office
|
|
Activity
|
|
Company
holding investment |
|
31 December
2021 |
|
|
31 December
2020 |
|
|
31 December
2019 |
|
|
|
|
Consolidation
method |
|||
|
Chargers, S.L. |
|
|
|
|
|
|
|
|
|
%
|
|
|
|
%
|
|
|
|
%
|
|
*
|
|
|
|
Capital Acquisition Corp. II |
|
|
|
|
|
|
|
|
|
%
|
|
|
|
%
|
|
|
|
%
|
|
*
|
|
|
|
|
|
|
|
|
|
|
|
|
|
%
|
|
|
|
%
|
|
|
|
%
|
|
—
|
|
|
|
|
|
|
|
|
|
|
|
|
|
%
|
|
|
|
%
|
|
|
|
%
|
|
—
|
|
|
|
|
|
|
|
|
|
|
|
|
|
%
|
|
|
|
%
|
|
|
|
%
|
|
—
|
|
|
|
Chargers Deutschland GmbH |
|
|
|
|
|
|
|
|
|
%
|
|
|
|
%
|
|
|
|
%
|
|
—
|
|
|
|
|
|
|
|
|
|
|
|
|
|
%
|
|
|
|
%
|
|
|
|
%
|
|
—
|
|
|
|
Netherlands B.V. |
|
|
|
|
|
|
|
|
|
%
|
|
|
|
%
|
|
|
|
%
|
|
—
|
|
|
|
|
|
|
|
|
|
|
|
|
|
%
|
|
|
|
%
|
|
|
|
%
|
|
—
|
|
|
|
|
|
|
|
|
|
|
|
|
|
%
|
|
|
|
%
|
|
|
|
%
|
|
—
|
|
|
|
(Intelligent
Solution AS ) |
|
|
|
|
|
|
|
|
|
%
|
|
|
|
%
|
|
|
|
%
|
|
—
|
|
|
|
|
|
|
|
|
|
|
|
|
|
%
|
|
|
|
%
|
|
|
|
%
|
|
—
|
|
|
|
(Intelligent
Solution Sweden AB ) |
|
|
|
|
|
|
|
|
|
%
|
|
|
|
%
|
|
|
|
%
|
|
—
|
|
|
|
|
|
|
|
|
|
|
|
|
|
%
|
|
|
|
%
|
|
|
|
%
|
|
—
|
|
|
|
|
|
|
|
|
|
|
|
|
|
%
|
|
|
|
%
|
|
|
|
%
|
|
—
|
|
|
|
(*)
|
direct ownership
|
|
(-)
|
indirect ownership
|
As commen
te
d in Note 6, all business combinations have been accounted for as if the Group had obtained a
% interest in the acquired entities on the basis that all shares subject to
non-controlling
interest puts have been acquired. However, in the table above the
of
legal ownership has been disclosed.
F-8
5
TABLE OF CONTENTS
Part IItem 1. Identity Of Directors, Senior Management and AdvisersItem 2. Offer Statistics and Expected TimetableItem 3. Key InformationItem 4. Information on The CompanyItem 4A. Unresolved Staff CommentsItem 5. Operating and Financial Review and ProspectsItem 6. Directors, Senior Management and EmployeesItem 7. Major Shareholders and Related Party TransactionsItem 8. Financial InformationItem 9. The Offer and ListingItem 10. Additional InformationItem 11. Quantitative and Qualitative Disclosures About Market RiskItem 12. Description Of Securities Other Than Equity SecuritiesPart IIItem 13. Defaults, Dividend Arrearages and DelinquenciesItem 14. Material Modifications To The Rights Of Security Holders and Use Of ProceedsItem 15. Controls and ProceduresItem 16. [reserved]Item 16A. Audit Committee Financial ExpertItem 16B. Code Of EthicsItem 16C. Principal Accountant Fees and ServicesItem 16D. Exemptions From The Listing Standards For Audit CommitteesItem 16E. Purchases Of Equity Securities By The Issuer and Affiliated PurchasersItem 16F. Change in Registrant S Certifying AccountantItem 16G. Corporate GovernanceItem 16H. Mine Safety DisclosureItem 16I. Disclosure Regarding Foreign Jurisdictions That Prevent InspectionsPart IIIItem 17. Financial StatementsItem 18. Financial StatementsItem 19. ExhibitsNote 21 Employee Benefits (share-based Payment Arrangements);Note 13 Financial Assets and Financial Liabilities; andNote 6 Business CombinationsPart Of