WORKDAY, INC.
10-Ks and 10-Qs
|
|
|
|
|
|
|
|
|
|
|
|
|
|
|
|
|
|
|
|
|
|
|
|
|
|
|
|
|
|
|
|
|
|
|
|
|
|
|
|
|
|
|
|
|
|
|
UNITED STATES
SECURITIES AND EXCHANGE COMMISSION
Washington, D.C. 20549
Form 10-K
(Mark One)
|
x
|
ANNUAL REPORT PURSUANT TO SECTION 13 OR 15(d) OF THE SECURITIES EXCHANGE ACT OF 1934
|
For the fiscal year ended
January 31, 2019
or
|
¨
|
TRANSITION REPORT PURSUANT TO SECTION 13 OR 15(d) OF THE SECURITIES EXCHANGE ACT OF 1934
|
For transition period from
to
Commission File Number 001-35680
Workday, Inc.
(Exact name of registrant as specified in its charter)
|
Delaware
|
20-2480422
|
|
(State or other jurisdiction of
incorporation or organization)
|
(I.R.S. Employer
Identification No.)
|
|
6110 Stoneridge Mall Road
Pleasanton, California
|
94588
|
|
(Address of principal executive offices)
|
(Zip Code)
|
(925) 951-9000
(Registrant’s telephone number, including area code)
Securities registered pursuant to Section 12(b) of the Act:
|
Title of each class
|
Name of each exchange on which registered
|
|
Class A Common Stock, par value $0.001
|
The Nasdaq Stock Market LLC
|
|
(Nasdaq Global Select Market)
|
|
Securities registered pursuant to section 12(g) of the Act:
None
Indicate by a check mark if the registrant is a well-known seasoned issuer, as defined in Rule 405 of the Securities Act. Yes
x
No
¨
Indicate by check mark if the registrant is not required to file reports pursuant to Section 13 or Section 15(d) of the Act. Yes
¨
No
x
Indicate by check mark whether the registrant (1) has filed all reports required to be filed by Section 13 or 15(d) of the Securities Exchange Act of 1934 (the
“
Exchange Act
”
) during the preceding 12 months (or for such shorter period that the registrant was required to file such reports), and (2) has been subject to such filing requirements for the past 90 days: Yes
x
No
¨
Indicate by check mark whether the registrant has submitted electronically every Interactive Data File required to be submitted pursuant to Rule 405 of Regulation S-T during the preceding 12 months (or for such shorter period that the registrant was required to submit such files). Yes
x
No
¨
Indicate by check mark if disclosure of delinquent filers pursuant to Item 405 of Regulation S-K is not contained herein, and will not be contained, to the best of registrant’s knowledge, in definitive proxy or information statements incorporated by reference in Part III of this Form 10-K or any amendment to this Form 10-K.
¨
Indicate by check mark whether the registrant is a large accelerated filer, an accelerated filer, a non-accelerated filer, a smaller reporting company, or an emerging growth company. See the definitions of large accelerated filer, accelerated filer, smaller reporting company, and emerging growth company in Rule 12b-2 of the Exchange Act.
|
Large accelerated filer
|
x
|
Accelerated filer
|
¨
|
|
Non-accelerated filer
|
¨
|
Smaller reporting company
|
¨
|
|
Emerging growth company
|
¨
|
||
If an emerging growth company, indicate by check mark if the registrant has elected not to use the extended transition period for complying with any new or revised financial accounting standards provided pursuant to Section 13(a) of the Exchange Act.
¨
Indicate by check mark whether the registrant is a shell company (as defined in Rule 12b-2 of the Exchange Act). Yes
¨
No
x
The aggregate market value of the voting and non-voting stock of the registrant as of July 31,
2018
(based on a closing price of $124.02 per share) held by non-affiliates was approximately
$18.6 billion
. As of
February 28, 2019
, there were approximately
157 million
shares of the registrant’s Class A common stock and
65 million
shares of the registrant’s Class B common stock outstanding.
DOCUMENTS INCORPORATED BY REFERENCE
Information required in response to Part III of Form 10-K (Items 10, 11, 12, 13 and 14) is hereby incorporated by reference to portions of the registrant’s Proxy Statement for the Annual Meeting of Stockholders to be held in
2019
. The Proxy Statement will be filed by the registrant with the Securities and Exchange Commission no later than 120 days after the end of the registrant’s fiscal year ended
January 31, 2019
.
TABLE OF CONTENTS
|
|
PART I
|
|
|
Item 1.
|
||
|
Item 1A.
|
||
|
Item 1B.
|
||
|
Item 2.
|
||
|
Item 3.
|
||
|
Item 4.
|
||
|
PART II
|
||
|
Item 5.
|
||
|
Item 6.
|
||
|
Item 7.
|
||
|
Item 7A.
|
||
|
Item 8.
|
||
|
Item 9.
|
||
|
Item 9A.
|
||
|
Item 9B.
|
||
|
PART III
|
||
|
Item 10.
|
||
|
Item 11.
|
||
|
Item 12.
|
||
|
Item 13.
|
||
|
Item 14.
|
||
|
PART IV
|
||
|
Item 15.
|
||
|
Item 16.
|
||
PART I
SPECIAL NOTE REGARDING FORWARD-LOOKING STATEMENTS
This report contains forward-looking statements, which are subject to safe harbor protection under the Private Securities Litigation Reform Act of 1995. All statements contained in this report other than statements of historical fact, including statements regarding our future results of operations and financial position, our business strategy and plans, and our objectives for future operations, are forward-looking statements. The words
“
believe,
”
“
may,
”
“
will,
”
“
estimate,
”
“
continue,
”
“
anticipate,
”
“
intend,
”
“
expect,
”
“
seek,
”
“
plan,
”
and similar expressions are intended to identify forward-looking statements. We have based these forward-looking statements largely on our current expectations and projections about future events and trends that we believe may affect our financial condition, results of operations, business strategy, short-term and long-term business operations and objectives, and financial needs. These forward-looking statements are subject to a number of risks, uncertainties, and assumptions, including those described in the
“
Risk Factors
”
section, which we encourage you to read carefully. Moreover, we operate in a very competitive and rapidly changing environment. New risks emerge from time to time. It is not possible for our management to predict all risks, nor can we assess the impact of all factors on our business or the extent to which any factor, or combination of factors, may cause actual results to differ materially from those contained in any forward-looking statements we may make. In light of these risks, uncertainties, and assumptions, the future events and trends discussed in this report may not occur and actual results could differ materially and adversely from those anticipated or implied by the forward-looking statements.
You should not rely upon forward-looking statements as predictions of future events. The events and circumstances reflected in the forward-looking statements may not be achieved or occur. Although we believe that the expectations reflected in the forward-looking statements are reasonable, we cannot guarantee future results, levels of activities, performance, or achievements. We are under no duty to update any of these forward-looking statements after the date of this report or to conform these statements to actual results or revised expectations.
As used in this report, the terms
“
Workday,
”
“
registrant,
”
“
we,
”
“
us,
”
and
“
our
”
mean Workday, Inc. and its subsidiaries unless the context indicates otherwise.
Our fiscal year ends on January 31. References to fiscal
2019
, for example, refer to the year ended
January 31, 2019
.
ITEM 1. BUSINESS
Overview
Workday is a leading provider of enterprise cloud applications for finance and human resources. Founded in 2005, Workday delivers financial management, human capital management, planning, and analytics applications designed for the world’s largest companies, educational institutions, and government agencies. Organizations ranging from medium-sized businesses to Fortune 50 enterprises have selected Workday. We achieved this leadership position through our innovative and adaptable technology, and commitment to customer satisfaction.
Organizations today operate in environments that are highly complex and changing at an increasing rate. Managers and employees must quickly synthesize vast amounts of information and react to rapid changes in global business and regulatory environments. To be successful, they need highly functional and flexible software that enables informed decision-making about the enterprise-wide allocation of their resources. Additionally, managers and employees expect to interact with enterprise systems in an open, intuitive, and collaborative way, including real-time access through a wide range of mobile and computing devices.
Workday is leading the way in helping organizations better manage their financial and human capital resources. As part of our applications, we provide embedded analytics that capture the content and context of everyday business events, facilitating fast and informed decision-making from wherever users are working. In addition, we provide an intuitive user experience similar to those of leading consumer internet sites, reducing the time for training on our applications.
Since Workday is delivered in the cloud, organizations can embrace change in their operating environments with support for new regulatory requirements, increased performance, and enhancement of the user experience that we deliver through our rapid innovation cycle of frequent functionality-rich feature releases. We deliver continuous innovation with major feature releases delivered two times per year, in addition to weekly updates where smaller sets of features are delivered to customers with minimal downtime disruption. When the new feature releases are delivered, the prior version is fully replaced. As a result, all Workday customers are on the same version at all times. Feature releases are not subject to an additional fee. Workday customers benefit from the most current technologies without the burden of large upgrade costs typically associated with traditional on-premise software.
1
We deliver our cloud applications using an innovative technology foundation that leverages the most recent advances in cloud computing and data management and allows us to deliver applications that are highly functional, flexible, and fast. Our use of a multi-tenant architecture in which customers are on the same version of our software enables innovations to be deployed quickly. In addition, we use objects to represent real-world entities such as employees, benefits, budgets, charts of accounts, and organizations, combining business logic and data in one place and creating actionable analytics that are part of our core transactional systems of record. Our use of in memory data management allows rapid and efficient delivery of embedded business intelligence. Workday leverages machine learning in our applications to help customers make smarter financial and workforce decisions. We also provide open, standards-based web-services application programming interfaces and pre-built packaged integrations and connectors. This approach substantially reduces the need for our customers to buy and support a broad range of IT infrastructure, significantly reducing costs and complexity.
Our Products
Workday Financial Management
Workday Financial Management is a comprehensive, unified application built on a single, global core with a full range of financial capabilities, relevant analytics and metrics, and fully auditable process management built to help manage financial processes for global organizations.
Workday Financial Management provides the core finance functions (general ledger, accounting, accounts payable, accounts receivable, cash management, asset management, revenue management, and grants management). It also supports built-in financial, operational, and management reporting and analysis in real time without the use of complex and expensive bolt-on business intelligence systems.
Financial Management Complementary Solutions
Workday Expenses provides organizations with a user-friendly platform to capture, monitor, and control employee expenses on any device.
Workday Procurement provides a single solution to manage and provide complete visibility across the procure-to-pay process for both goods and services spend.
Workday Inventory helps organizations manage their internal supply chain with an end-to-end solution for all aspects of the materials management process for goods and supplies that are used internally.
Workday Professional Services Automation supports the complete billable projects lifecycle, including project and resource management, time and expense tracking, project billing, revenue recognition, financial reporting, and analytics within a single, unified solution.
Workday Human Capital Management
Designed for the largest organizations in the world, Workday Human Capital Management (“HCM”) allows an organization to staff, organize, and develop its global workforce. This unified application includes global human resources management (workforce lifecycle management, organization management, compensation, absence, and employee benefits administration) and global talent management (goal management, performance management, succession planning, and career and development planning).
HCM Complementary Solutions
Workday Recruiting supports the needs of candidates, hiring managers, the interview team, and recruiters.
Workday Time Tracking, our time and attendance application, is designed to automate workforce management processes and thereby reduce costs and compliance risks.
Workday Payroll is designed to address the full spectrum of enterprise payroll needs and provides control, accuracy, and flexibility, with native payroll offerings in the U.S., Canada, the United Kingdom (“UK”), and France, as well as a global payroll cloud partner program to support additional customer needs.
Workday Learning combines the capabilities of an enterprise-grade learning system with modern social content sharing and curation in one platform.
Business Planning, Analytics, and Other Solutions
Workday offers a variety of other solutions that are unified with Workday Financial Management and Workday HCM.
2
Adaptive Insights Business Planning Cloud is a solution with built-in intelligence for finance, human resources, and sales teams, with powerful and flexible modeling capabilities that enables collaborative, company-wide business planning.
Workday Prism Analytics enables customers to bring together any data, including Workday data and data from any outside source, with leading-edge analytics tools for enriched financial and people analytics to make better business decisions.
Workday Student is a student and faculty lifecycle information system to help colleges and universities advance their institutions and enable student success. The Workday Student application suite includes: Academic Foundation, Student Recruiting, Student Admissions, Curriculum Management, Student Records, Academic Advising, Financial Aid, Student Financials, and Student Recruiting.
Workday Data-as-a-Service (“DaaS”) is a cloud service that provides valuable data to customers to enable more informed decision-making. The first service delivered on the DaaS offering, Workday Benchmarking, provides key metrics to customers seeking a better understanding of their company’s relative performance in comparison to peers to help achieve optimal performance in their respective markets.
Customers
Our diverse customer base includes medium-sized and large, global companies, as well as smaller organizations that primarily use our planning product. Our customers span numerous industry categories, including technology, financial services, business and professional services, healthcare and life sciences, manufacturing, retail and hospitality, education, government, and non-profit. No individual customer represented more than 10% of our revenues during fiscal
2019
.
We have built a company culture centered around our customers’ success and satisfaction. We have developed several programs designed to provide customers with service options to enhance their experience with our applications. These services include 24x7 support; a professional services ecosystem that consists of our Workday consulting teams and system integrators that are trained on our applications; a Customer Success Management group to assist customers in production; and an online community to facilitate collaboration among customers and with the Workday product development teams.
Employees
As of
January 31, 2019
, we had approximately
10,500
employees. We also engage contractors and consultants. None of our employees are represented by a labor union. We have not experienced any work stoppages, and we consider our relations with our employees to be very good.
Backlog
Backlog, which is equivalent to our remaining performance obligations, represents our total contractual commitments for which services will be performed. Backlog generally increases with bookings and generally converts into revenue as contractual commitments are fulfilled. For further information, see Note 14 of the notes to consolidated financial statements.
Sales and Marketing
We sell Workday subscription services primarily through our direct sales organization, which is comprised of field sales and field sales support personnel. Workday’s field sales team is aligned by geography, industry, and/or prospect size.
We generate customer leads, accelerate sales opportunities, and build brand awareness through our marketing programs and through our strategic relationships. Our marketing programs target senior business leaders, including finance, human resources, and IT executives.
As a core part of our strategy, we have developed an ecosystem of partners to both broaden and complement our application offerings and to provide services that are outside of Workday’s areas of focus. These relationships include software and technology partners, consulting and implementation service providers, and business process outsourcing partners, which enable Workday to address the finance and human resources-related challenges our customers face while maintaining focus on executing against our strategy.
Product Development
Our ability to compete depends in large part on our continuous commitment to product development and our ability to rapidly introduce new products, technologies, features, and functionality. Our product development organization is responsible for the design, development, testing, and certification of our products. We focus our efforts on developing new products and core technologies as well as further enhancing the usability, functionality, reliability, performance, and flexibility of existing products.
3
Competition
The overall market for enterprise application software is rapidly evolving, highly competitive, and subject to changing technology, shifting customer needs, and frequent introductions of new products. We currently compete with large, well-established, enterprise application software vendors, such as SAP SE (“SAP”) and Oracle Corporation (“Oracle”). SAP and Oracle are established enterprise software companies that have greater name recognition, much longer operating histories, and significantly greater financial, technical, sales, marketing, and other resources than we have and are able to provide a broader scope of business applications than our current suite of applications. We also face competition from other enterprise software vendors and from vendors of specific applications, some of which offer cloud-based solutions. These vendors include The Ultimate Software Group, Inc., Automatic Data Processing, Inc., Infor, Inc., Ceridian HCM Holding Inc., Microsoft Corporation, and Anaplan, Inc. We may also face competition from a variety of vendors of cloud-based and on-premise software applications that address only one or a portion of our applications. In addition, other cloud companies that provide services in different markets may develop solutions in our target markets, and some potential customers may elect to develop their own internal solutions. However, the domain expertise that is required for a successful solution in the areas of financial management, HCM, and analytics may inhibit new entrants that are unable to invest the necessary capital to accurately reflect global requirements and regulations. We expect continued consolidation in our industry that could lead to significantly increased competition.
We believe the principal competitive factors in our market include the following:
|
•
|
level of customer satisfaction;
|
|
•
|
ease of deployment and use of applications;
|
|
•
|
breadth and depth of application functionality;
|
|
•
|
total cost of ownership;
|
|
•
|
brand awareness and reputation;
|
|
•
|
adaptive technology platform;
|
|
•
|
capability for configuration, integration, security, scalability, and reliability of applications;
|
|
•
|
operational excellence to ensure system availability, scalability, and performance;
|
|
•
|
ability to innovate and respond to customer needs rapidly;
|
|
•
|
domain expertise on financial, human resources, and payroll regulations;
|
|
•
|
size of customer base and level of user adoption;
|
|
•
|
customer confidence in financial stability and future viability; and
|
|
•
|
ability to integrate with legacy enterprise infrastructures and third-party applications.
|
We believe that we compete favorably on the basis of these factors. Our ability to remain competitive will largely depend on our ongoing performance in the areas of product development and customer support.
Intellectual Property
We rely on a combination of trade secrets, patents, copyrights, and trademarks, as well as contractual protections, to establish and protect our intellectual property rights. We require our employees, contractors, consultants, and other third parties to enter into confidentiality and proprietary rights agreements, and we control access to software, documentation, and other proprietary information. Although we rely on intellectual property rights, including trade secrets, patents, copyrights, and trademarks, as well as contractual protections and controls to establish and protect our proprietary rights, we believe that factors such as the technological and creative skills of our personnel, creation of new products, features and functionality, and frequent enhancements to our applications are more essential to establishing and maintaining our technology leadership position.
Despite our efforts to protect our proprietary technology and our intellectual property rights, unauthorized parties may attempt to copy or obtain and use our technology to develop applications with the same functionality as our applications. Policing unauthorized use of our technology and intellectual property rights is difficult.
We expect that software and other applications in our industry may be subject to third-party infringement claims as the number of competitors grows and the functionality of applications in different industry segments overlaps. Any of these third parties may make a claim of infringement against us at any time.
Corporate Information
We were incorporated in March 2005 in Nevada, and in June 2012 we reincorporated in Delaware. Our principal executive offices are located at 6110 Stoneridge Mall Road, Pleasanton, California 94588, and our telephone number is (877) WORKDAY. Our website address is www.workday.com. The information on, or that can be accessed through, our website is not part of this report. Workday, the Workday logo, our Built for the Future tagline, and other trademarks of ours are our registered intellectual property in the United States and elsewhere. Other trademarks, service marks, or trade names appearing in this report are the property of their respective owners.
4
Available Information
We file annual reports on Form 10-K, quarterly reports on Form 10-Q, current reports on Form 8-K, proxy and information statements, and amendments to reports filed or furnished pursuant to Sections 13(a), 14, and 15(d) of the Securities Exchange Act of 1934, as amended, (the “Exchange Act”). The public may obtain these filings from the Securities and Exchange Commission (“SEC”)’s website at http://www.sec.gov, which contains reports, proxy and information statements, and other information regarding Workday and other companies that file materials with the SEC electronically. Copies of Workday’s reports on Form 10-K, Forms 10-Q, and Forms 8-K, may be obtained, free of charge as soon as reasonably practicable after we file such material with, or furnish such material to, the SEC, electronically through our internet website, http://www.workday.com/company/investor_relations/sec_filings.php.
Workday uses its blogs.workday.com website as a means of disclosing material non-public information and for complying with its disclosure obligations under Regulation FD.
ITEM 1A. RISK FACTORS
Investing in our securities involves a high degree of risk. You should consider carefully the risks and uncertainties described below, together with all of the other information in this report, including the consolidated financial statements and the related notes included elsewhere in this report, before making an investment decision. The risks and uncertainties described below are not the only ones we face. Additional risks and uncertainties that we are unaware of, or that we currently believe are not material, may also become important factors that materially and adversely affect our business. If any of the following risks actually occurs, our business operations, financial condition, results of operations, and prospects could be materially and adversely affected. The market price of our securities could decline due to the materialization of these or any other risks, and you could lose part or all of your investment.
Risk Factors Related to Our Business
If our security measures are breached or unauthorized access to customer data is otherwise obtained, our applications may be perceived as not being secure, customers may reduce the use of or stop using our applications, and we may incur significant liabilities.
Our applications involve the storage and transmission of our customers’ sensitive and proprietary information, including personal or identifying information regarding their employees, customers, and suppliers, as well as their finance and payroll data, and other sensitive business information. As a result, unauthorized access or use of this data could expose us to regulatory actions, litigation, investigations, remediation obligations, damage to our reputation and brand, supplemental disclosure obligations, loss of customer and partner confidence in the security of our applications, destruction of information, indemnity obligations, and resulting fees, costs, expenses, loss of revenues, and other potential liabilities. We devote significant financial and personnel resources to implement and maintain security measures. While we have security measures in place designed to protect the integrity of customer information and prevent data loss, misappropriation, and other security breaches, if these measures are compromised as a result of third-party action, including intentional misconduct by computer hackers, employee error, malfeasance, or otherwise, and someone obtains unauthorized access to or use of our customers’ data, our reputation could be damaged, our business may suffer, and we could incur significant liabilities as well as incur significant costs to remediate any incidents.
Cybersecurity challenges, including threats to our own IT infrastructure or those of our customers or third-party providers, are often targeted at companies such as ours and may take a variety of forms ranging from individual and groups of hackers to sophisticated organizations, including state-sponsored actors. Key cybersecurity risks range from viruses, worms, and other malicious software programs to “mega breaches” targeted against cloud services and other hosted software, any of which can result in disclosure of confidential information and intellectual property, defective products, production downtimes, supply shortages, and compromised data. As the techniques used to obtain unauthorized access or sabotage systems change frequently and generally are not identified until they are launched against a target, we may be unable to anticipate these techniques or to implement adequate preventative measures.
Furthermore, we have acquired a number of companies, products, services, and technologies over the years. Although we devote significant resources to address any security issues with respect to such acquisitions, we may still inherit additional risks when we integrate these companies within Workday. In addition, if a high-profile security breach occurs with respect to an industry peer, our customers and potential customers may generally lose trust in the security of financial management and HCM applications, analytics platforms, or in cloud applications for enterprises in general. Any or all of these issues could negatively affect our ability to attract new customers, cause existing customers to elect to terminate or not renew their subscriptions, result in reputational damage, cause us to pay remediation costs and/or issue service credits or refunds to customers for prepaid and unused subscription services, require us to compensate our customers for certain losses, or result in lawsuits, regulatory fines, or other action or liabilities, which could adversely affect our business and operating results.
5
We depend on data centers and computing infrastructure operated by third parties, and any disruption in these operations could adversely affect our business.
We host our applications and serve our customers from data centers located in the United States, Europe, and Canada. While we control and have access to our servers and all of the components of our network that are located in our external data centers, we do not control the operation and security of these facilities. The owners of our data center facilities have limited or no obligation to renew their agreements with us on commercially reasonable terms, or at all. If we are unable to renew these agreements on commercially reasonable terms, or if one of our data center operators is acquired or ceases business, we may be required to transfer our servers and other infrastructure to new data center facilities, and we may incur significant costs and experience possible service interruption in connection with doing so.
In addition, we rely upon third-party hosted infrastructure partners globally, including Amazon Web Services (“AWS”) and Dimension Data, to serve customers and operate certain aspects of our services, such as environments for development testing, training, sales demonstrations, and production usage. Given this, any disruption of or interference at our hosted infrastructure partners would impact our operations and our business could be adversely impacted.
Problems faced by our third-party data center operations or hosted infrastructure partners, with the telecommunications network providers with whom we or they contract, or with the systems by which our telecommunications providers allocate capacity among their customers, including us, could adversely affect the experience of our customers. Our third-party data center operators or hosted infrastructure partners could decide to close their facilities without adequate notice. In addition, any financial difficulties, such as bankruptcy, faced by our third-party data center operators, our hosted infrastructure partners, or any of the other service providers with whom we or they contract may have negative effects on our business, the nature and extent of which are difficult to predict. Additionally, if our data centers or hosted infrastructure partners are unable to keep up with our needs for capacity, this could have an adverse effect on our business. Any changes in third-party service levels at our data centers or at our hosted infrastructure partners or any errors, defects, disruptions, or other performance problems with our applications or the hosted infrastructure on which they run could adversely affect our reputation and may damage our customers’ stored files or result in lengthy interruptions in our services. Interruptions in our services might adversely affect our reputation and operating results, cause us to issue refunds or service credits to customers for prepaid and unused subscription services, subject us to potential liabilities, result in contract terminations, or adversely affect our renewal rates.
Furthermore, our financial management application is essential to Workday’s and our customers’ financial projections, reporting, and compliance programs, particularly customers who are public reporting companies. Any interruption in our service may affect the availability, accuracy or timeliness of such projections, reporting and compliance programs and as a result could damage our reputation, cause our customers to terminate their use of our applications, require us to issue refunds for prepaid and unused subscription services, require us to compensate our customers for certain losses, and prevent us from gaining additional business from current or future customers as well as impact our ability to accurately and timely meet our reporting and other compliance obligations.
If we fail to manage our technical operations infrastructure or experience service outages or delays in the deployment of our applications, we may be subject to liabilities and our reputation and operating results may be adversely affected.
We have experienced significant growth in the number of users, transactions, and data that our operations infrastructure supports. We seek to maintain sufficient excess capacity in our operations infrastructure to meet the needs of all of our customers, as well as our own needs, and to ensure that our services and solutions are accessible within an acceptable load time. We also seek to maintain excess capacity to facilitate the rapid provision of new customer deployments and the expansion of existing customer deployments. In addition, we need to properly manage our technological operations infrastructure in order to support version control, changes in hardware and software parameters, updates, the evolution of our applications, and to reduce infrastructure latency associated with dispersed geographic locations. However, the provision of new hosting infrastructure requires significant lead time. If we do not accurately predict our infrastructure requirements, our existing customers may experience service outages. If our operations infrastructure fails to scale, new customers may experience delays as we seek to obtain additional capacity, and no assurance can be made that we will be able to secure such additional capacity at the same or similar terms we currently have, which could result in a significant increase in our operating costs. Furthermore, any failure to scale and secure additional capacity could result in delays in new feature rollouts, reduce the demand for our applications, result in customer dissatisfaction, and adversely affect our business and results of operations.
6
We have experienced, and may in the future experience, system disruptions, outages, and other performance problems. These problems may be caused by a variety of factors, including infrastructure changes, vendor issues, human or software errors, viruses, security attacks (internal and external), fraud, spikes in customer usage, and denial of service issues. In some instances, we may not be able to identify the cause or causes of these performance problems within an acceptable period of time. Our customer agreements typically provide service level commitments on a monthly basis. If we are unable to meet the stated service level commitments or suffer extended periods of unavailability for our applications, we may be contractually obligated to issue service credits or refunds to customers for prepaid and unused subscription services, our customers may make warranty or other claims against us, or we could face contract terminations, which would adversely affect our attrition rates. Any extended service outages could result in customer losses and adversely affect our reputation, business, and operating results.
Privacy concerns and domestic or foreign laws and regulations may reduce the effectiveness of our applications, result in significant costs and compliance challenges, and adversely affect our business.
Our customers can use our applications to collect, use, and store personal or identifying information regarding a variety of individuals in connection with their operations, including but not limited to their employees, contractors, students, job applicants, customers, and suppliers. National and local governments and agencies in the countries in which our customers operate have adopted, are considering adopting, or may adopt laws and regulations regarding the collection, use, storage, processing, and disclosure of personal information obtained from consumers and individuals, which could impact our ability to offer our services in certain jurisdictions or our customers’ ability to deploy our solutions globally. Privacy-related laws are particularly stringent in Europe. The costs of compliance with and other burdens imposed by privacy-related laws, regulations, and standards may limit the use and adoption of our services, reduce overall demand for our services, lead to significant fines, penalties, or liabilities for noncompliance, or slow the pace at which we close sales transactions, any of which could harm our business. Moreover, if we or our subprocessors fail to adhere to adequate data protection practices around the usage of our customers’ personal data, we may be liable for certain losses of our customers, and it may damage our reputation and brand.
Additionally, we expect that existing laws, regulations, and standards may be interpreted in new and differing manners in the future, and may be inconsistent among jurisdictions. Future laws, regulations, standards, and other obligations, and changes in the interpretation of existing laws, regulations, standards, and other obligations could result in increased regulation, increased costs of compliance and penalties for non-compliance, and limitations on data collection, use, disclosure, and transfer for Workday and our customers. In 2016, the European Union (“EU”) adopted a new regulation governing data privacy called the General Data Protection Regulation (“GDPR”), which became effective in May 2018. The GDPR establishes new requirements applicable to the handling of personal data and imposes penalties for non-compliance of up to 4% of worldwide revenue. Customers, particularly in the EU, are seeking assurances from their suppliers, including us, that their processing of personal data of EU nationals is in accordance with the GDPR. If we are unable to provide adequate assurances to such customers, demand for our applications could be adversely affected. In addition, we must continue to seek assurances from our subprocessors that they are handling personal data in accordance with GDPR requirements in order to meet our own obligations under the GDPR. In addition, in June 2018, the California Consumer Privacy Act (“CCPA”), which takes effect on January 1, 2020, was enacted. The CCPA gives California consumers certain rights similar to those provided by the GDPR, and customers may seek similar assurances from suppliers regarding compliance.
The costs of compliance with, and other burdens imposed by, privacy laws and regulations that are applicable to the businesses of our customers may adversely affect our customers’ ability and willingness to process, handle, store, use, and transmit demographic and personal data, which in turn could limit the use, effectiveness, and adoption of our applications and reduce overall demand. In addition, the other bases on which we and our customers rely on for the transfer of data, such as model contracts, continue to be subjected to regulatory and judicial scrutiny. In 2016, the EU and United States agreed to the Privacy Shield framework for data transferred from the EU to the United States, but this new framework has been challenged by private parties and may face additional challenges by national regulators or additional private parties. In 2017, another legal challenge to the validity of the EU Standard Contractual Clauses (a data transfer mechanism) was referred to the Court of Justice of the EU for review. If we or our customers are unable to transfer data between and among countries and regions in which we operate, it could decrease demand for our applications, require us to restrict our business operations, and impair our ability to maintain and grow our customer base and increase our revenue. Even the perception of privacy concerns, whether or not valid, may inhibit the adoption, effectiveness, or use of our applications.
In addition to government activity, privacy advocacy and other industry groups have established or may establish various new, additional, or different self-regulatory standards that may place additional burdens on us. Our customers may expect us to meet voluntary certifications or adhere to other standards established by third parties. If we are unable to maintain these certifications or meet these standards, it could reduce demand for our applications and adversely affect our business.
7
We have experienced rapid growth. If we fail to manage our growth effectively, we may be unable to execute our business plan, maintain high levels of service and operational controls, or adequately address competitive challenges.
We have experienced, and are continuing to experience, a period of rapid growth in our customers, headcount, and operations. In particular, we grew from approximately 1,550 employees at the time of our initial public offering (“IPO”) in October 2012 to approximately
10,500
employees as of
January 31, 2019
, and we have also significantly increased the size of our customer base. We anticipate that we will continue to expand our operations and headcount in the near term, and to expand our customer base. This growth has placed, and future growth will place, a significant strain on our management, general and administrative resources, and operational infrastructure. Our success will depend in part on our ability to manage this growth effectively and to scale our operations. To manage the expected growth of our operations and personnel, we will need to continue to improve our operational, financial, and management controls as well as our reporting systems and procedures. As we continue to grow, we also need to ensure that our policies and procedures evolve to reflect our current operations and are appropriately communicated to and observed by employees, and that we appropriately manage our corporate information assets, including confidential and proprietary information. Failure to effectively manage growth could result in difficulty or delays in deploying customers, declines in quality or customer satisfaction, increases in costs, difficulties in introducing new features, or other operational difficulties, and any of these difficulties could adversely impact our business performance and results of operations.
We depend on our senior management team and the loss of one or more key employees could adversely affect our business.
Our success and future growth depend largely upon the continued services of our executive officers and other key employees. We also rely on our leadership team in the areas of product development, marketing, sales, services, and general and administrative functions and on mission-critical individual contributors in product development. From time to time, there may be changes in our executive management team resulting from the hiring or departure of executives, which could disrupt our business. We do not have employment agreements with our executive officers or other key personnel that require them to continue to work for us for any specified period, and they could terminate their employment with us at any time. The loss of one or more of our executive officers or other key employees and any failure to develop an appropriate succession plan for these persons could have a serious adverse effect on our business and results of operations.
The failure to attract and retain highly skilled employees could adversely affect our business and our future growth prospects.
To execute our growth plan, we must attract and retain highly qualified personnel, and our managers must be successful in hiring employees who share our values and have the competencies to succeed at Workday. Competition for these personnel is intense, especially for engineers with high levels of experience in designing and developing software and internet-related services, and for senior sales executives. From time to time, we have experienced, and we expect to continue to experience, difficulty in hiring and retaining employees with appropriate qualifications, and we may not be able to fill positions in desired geographic areas or at all.
Many of the companies with which we compete for experienced personnel have greater resources than we have and some of these companies may offer more lucrative compensation packages. Particularly in the San Francisco Bay Area, job candidates and existing employees carefully consider the value of the equity awards they receive in connection with their employment. If the perceived value of our equity awards declines, or if the mix of equity and cash compensation that we offer is unattractive, it may adversely affect our ability to recruit and retain highly skilled employees. Job candidates may also be threatened with legal action under agreements with their existing employers if we attempt to hire them, which could have a chilling effect on hiring and result in a diversion of our time and resources. Additionally, laws and regulations, such as restrictive immigration laws, and restrictions on travel or availability of visas, may limit our ability to recruit internationally. We must also continue to retain and motivate existing employees through our compensation practices, company culture, and career development opportunities. If we fail to attract new personnel or to retain our current personnel, our business and future growth prospects could be adversely affected.
If we cannot maintain our corporate culture, we could lose the innovation, teamwork, and passion that we believe contribute to our success, and our business may be harmed.
We believe that a critical component of our success has been our corporate culture, as reflected in our core values: employees, customer service, innovation, integrity, fun, and profitability. We have invested substantial time and resources in building our team. As we continue to grow, both organically and through acquisitions of employee teams, and develop the infrastructure associated with being a more mature public company, we will need to maintain our corporate culture among a larger number of employees dispersed in various geographic regions. Any failure to preserve our culture could negatively affect our future success, including our ability to retain and recruit personnel and to effectively focus on and pursue our corporate objectives.
8
The markets in which we participate are intensely competitive, and if we do not compete effectively, our operating results could be adversely affected.
The markets for financial management and HCM applications are highly competitive, with relatively low barriers to entry for some applications or services. Our primary competitors are SAP and Oracle, well-established providers of financial management and HCM applications, which have long-standing relationships with many customers. Some customers may be hesitant to switch vendors or to adopt cloud applications such as ours and may prefer to maintain their existing relationships with competitors. SAP and Oracle are larger and have greater name recognition, significantly longer operating histories, larger marketing budgets, and significantly greater resources than we do. These vendors, as well as other competitors, could offer financial management and HCM applications on a standalone basis at a low price or bundled as part of a larger sale. In order to take advantage of customer demand for cloud applications, legacy vendors are expanding their cloud applications through acquisitions, strategic alliances, and organic development. We also face competition from vendors of specific applications, some of which offer cloud-based solutions. These vendors include, without limitation: The Ultimate Software Group, Inc., Automatic Data Processing, Inc., Infor, Inc., Ceridian HCM Holding Inc., Microsoft Corporation, and Anaplan, Inc. We may also face competition from a variety of vendors of cloud-based and on-premise software applications that address only one or a portion of our applications. In addition, other companies that provide cloud applications in different target markets may develop applications or acquire companies that operate in our target markets, and some potential customers may elect to develop their own internal applications. With the introduction of new technologies and market entrants, we expect this competition to intensify in the future.
Many of our competitors are able to devote greater resources to the development, promotion, and sale of their products and services. Furthermore, our current or potential competitors may be acquired by third parties with greater available resources and the ability to initiate or withstand substantial price competition. In addition, many of our competitors have established marketing relationships, access to larger customer bases, and major distribution agreements with consultants, system integrators, and resellers. Our competitors may also establish cooperative relationships among themselves or with third parties that may further enhance their offerings or resources. If our competitors’ products, services, or technologies become more accepted than our products, if they are successful in bringing their products or services to market earlier than ours, or if their products or services are more technologically capable than ours, then our revenues could be adversely affected. In addition, some of our competitors may offer their products and services at a lower price. If we are unable to achieve our target pricing levels, our operating results would be negatively affected. Pricing pressures and increased competition could result in reduced sales, reduced margins, losses, or a failure to maintain or improve our competitive market position, any of which could adversely affect our business.
We may expand the capabilities of our cloud applications, seek to operate in new markets, and/or seek to enter new lines of business. As a new entrant to these markets, we may not be effective in convincing prospective customers that our solutions will address their needs, and we may not accurately estimate our infrastructure needs, human resource requirements, or operating expenses. Also, we may not be able to properly price our solutions in these markets, which could negatively affect our ability to sell to customers or reach profitability. Furthermore, customers may demand more features and professional services, which may require us to devote greater research and development, sales, support, and professional services resources to these customers. This could strain our resources and result in increased costs. If we are not able to address these challenges, or if our investments in selling and marketing our solutions to new markets are unsuccessful, our business and results of operations will suffer.
If the market for enterprise cloud computing grows more slowly than in recent years, our business could be adversely affected.
Our success will depend to a substantial extent on the continued growth of cloud computing in general, and of financial management and HCM services in particular. Many enterprises have invested substantial personnel and financial resources to integrate traditional enterprise software into their businesses, and therefore may be reluctant or unwilling to migrate to cloud computing. It is difficult to predict customer adoption rates and demand for our applications, the future growth rate and size of the cloud computing market, or the entry of competitive applications. The continued expansion of the cloud computing market depends on a number of factors, including the cost, performance, and perceived value associated with cloud computing as well as the ability of cloud computing companies to address security and privacy concerns. Further, the cloud computing market is less developed in many jurisdictions outside of the United States. If we or other cloud computing providers experience security incidents, loss of customer data, disruptions in delivery, or other problems, the market for cloud computing applications as a whole, including our applications, may be negatively affected. If there is a reduction in demand for cloud computing caused by a lack of customer acceptance, technological challenges, weakening economic conditions, security or privacy concerns, competing technologies and applications, decreases in corporate spending, or otherwise, it could result in decreased revenues or growth rates and our business could be adversely affected.
9
If we are not able to provide successful enhancements, new features, and modifications, our business and results of operations could be adversely affected.
If we are unable to provide enhancements and new features for our existing applications or new applications that achieve market acceptance or that keep pace with rapid technological developments, our business and results of operations could be adversely affected. For example, we are focused on enhancing the features and functionality of our applications to improve their utility to larger customers with complex, dynamic, and global operations. The success of enhancements, new features, and applications depends on several factors, including their timely completion, introduction, and market acceptance as well as access to the technologies required to build and improve our applications, such as the datasets required to train our machine learning models. Failure in this regard may significantly impair our revenue growth by negatively impacting customer renewal rates or result in an inability to attract new customers.
Our applications must integrate with or incorporate a variety of third-party technologies, and if we are unable to ensure that our solutions integrate with or incorporate such technologies, demand for our applications and our operating results could be adversely affected.
Our applications must integrate with and operate on a variety of systems. Therefore, we will need to continuously modify and enhance our applications to keep pace with changes in internet-related hardware, iOS, Android, and other mobile-related technologies and software, communication, browser, and database technologies. We may not be successful in either developing these modifications and enhancements or in bringing them to market in a timely fashion. We must also appropriately balance the application capability demands of our current customers with the capabilities required to address the broader market. Furthermore, uncertainties about the timing and nature of new network platforms or technologies, or modifications to existing platforms or technologies, could increase our product development expenses. Any failure of our applications to operate effectively with future network platforms and technologies could reduce the demand for our applications, result in customer dissatisfaction, and adversely affect our business and results of operations.
If our applications fail to perform properly, our reputation could be adversely affected, our market share could decline, and we could be subject to warranty and other claims.
Our applications are inherently complex and may contain material defects or errors. Any defects in functionality or that cause interruptions in the availability of our applications could result in:
|
•
|
loss or delayed market acceptance and sales;
|
|
•
|
legal claims, including breach of warranty claims;
|
|
•
|
issuance of refunds or service credits to customers for prepaid and unused subscription services;
|
|
•
|
loss of customers;
|
|
•
|
diversion of development and customer service resources; and
|
|
•
|
injury to our brand and reputation.
|
The costs incurred in correcting any material defects or errors might be substantial and could adversely affect our operating results.
Because of the large amount of data that we collect and process in our systems, it is possible that hardware failures or errors in our systems could result in data loss or corruption, or cause the data to be incomplete or contain inaccuracies that our customers regard as significant. Furthermore, the availability or performance of our applications could be adversely affected by a number of factors, including customers’ inability to access the internet, the failure of our network or software systems, security breaches, or variability in user traffic for our services. For example, our customers access our applications through their internet service providers. If a service provider fails to provide sufficient capacity to support our applications or otherwise experiences service outages, such failure could interrupt our customers’ access to our applications, which could adversely affect their perception of our applications’ reliability and our revenues. We may be required to issue credits or refunds for prepaid amounts related to unused services or otherwise be liable to our customers for damages they may incur resulting from certain of these events. In addition to potential liability, if we experience interruptions in the availability of our applications, our reputation could be adversely affected, and we could lose customers.
Our errors and omissions insurance may be inadequate or may not be available in the future on acceptable terms, or at all. In addition, our policy may not cover all claims made against us and defending a suit, regardless of its merit, could be costly and divert management’s attention.
10
Catastrophic events may disrupt our business.
Our corporate headquarters are located in Pleasanton, California, and we have data centers located in the United States, Europe, and Canada. We also rely on AWS’s and Dimension Data’s distributed computing infrastructure platforms. The west coast of the United States contains active earthquake zones and the southeast is subject to seasonal hurricanes. Additionally, we rely on our network and third-party infrastructure and enterprise applications, internal technology systems, and our website for our development, marketing, operational support, hosted services, and sales activities. In the event of a major earthquake, hurricane, or other natural disaster or a catastrophic event such as fire, power loss, telecommunications failure, vandalism, civil unrest, cyber-attack, geopolitical instability, war, terrorist attack, or the effects of climate change (such as drought, flooding, wildfires, increased storm severity, and sea level rise), we may be unable to continue our operations and may endure system interruptions, delays in our product development, lengthy interruptions in our services, breaches of data security, and loss of critical data, all of which could cause reputational harm or otherwise have an adverse effect on our business and operating results.
Because we sell applications to manage complex operating environments of large customers, we encounter long sales cycles, which could adversely affect our operating results in a given period.
Our ability to increase revenues and achieve and maintain profitability depends, in large part, on widespread acceptance of our applications by large businesses and other organizations. Sales efforts targeted at these large customers involve greater costs, longer sales cycles, and less predictability in completing some of our sales. Our customers’ deployment timeframes vary based on many factors including the number and type of applications being deployed, the complexity and scale of the customers’ businesses and operations, the configuration requirements, the number of integrations with other systems, and other factors, many of which are beyond our control. In the large enterprise market, the customer’s decision to use our applications may be an enterprise-wide decision and, therefore, these types of sales require us to provide greater levels of education regarding the use and benefits of our applications. In addition, our target customers may prefer to purchase applications that are critical to their business from one of our larger, more established competitors. Our typical sales cycles are six to twelve months but can extend for eighteen months or more, and we expect that this lengthy sales cycle may continue or expand as customers increasingly adopt our applications beyond HCM. Longer sales cycles could cause our operating and financial results to suffer in a given period.
The loss of one or more of our key customers, or a failure to renew our subscription agreements with one or more of our key customers, could negatively affect our ability to market our applications.
We rely on our reputation and recommendations from key customers in order to promote subscriptions to our applications. The loss of, or failure to renew by, any of our key customers could have a significant impact on our revenues, reputation, and our ability to obtain new customers. In addition, acquisitions of our customers could lead to cancellation of our contracts with those customers or by the acquiring companies, thereby reducing the number of our existing and potential customers.
Our business could be adversely affected if our customers are not satisfied with the deployment services provided by us or our partners.
Our business depends on our ability to satisfy our customers, both with respect to our application offerings and the professional services that are performed to help our customers use features and functions that address their business needs. Professional services may be performed by our own staff, by a third party, or by a combination of the two. Our strategy is to work with third parties to increase the breadth of capability and depth of capacity for delivery of these services to our customers, and third parties provide a majority of deployment services for our customers. If customers are not satisfied with the quality of work performed by us or a third party or with the type of professional services or applications delivered, then we could incur additional costs to address the situation, the revenue recognition of the contract could be impacted, and the dissatisfaction with our services could damage our ability to expand the applications subscribed to by our customers. We must also align our product development and professional services operations in order to ensure that customers’ evolving needs are met. Negative publicity related to our customer relationships, regardless of its accuracy, may further damage our business by affecting our ability to compete for new business with current and prospective customers.
Any failure to offer high-quality technical support services may adversely affect our relationships with our customers and our financial results.
Our customers depend on our support organization to provision the environments used by our customers and to resolve technical issues relating to our applications. We may be unable to respond quickly enough to accommodate short-term increases in customer demand for support services. We also may be unable to modify the format of our support services to compete with changes in support services provided by our competitors. Increased customer demand for these services, without corresponding revenues, could increase costs and adversely affect our operating results. In addition, our sales process is highly dependent on our applications and business reputation and on positive recommendations from our existing customers. Any failure to maintain high-quality technical support, or a market perception that we do not maintain high-quality support, could adversely affect our reputation, our ability to sell our applications to existing and prospective customers, renewal rates for existing customers, and our business, operating results, and financial position.
11
Sales to customers outside the United States or with international operations expose us to risks inherent in global operations.
A key element of our growth strategy is to develop a worldwide customer base. Operating globally requires significant resources and management attention and will subject us to regulatory, economic, and political risks that are different from those in the United States. Our international expansion efforts may not be successful in creating demand for our applications outside of the United States or in effectively selling subscriptions to our applications in all of the markets we enter. In addition, we will face risks in doing business on a global scale that could adversely affect our business, including:
|
•
|
the need to localize and adapt our applications for specific countries, including translation into foreign languages, localization of contracts for different legal jurisdictions, and associated expenses;
|
|
•
|
the need for a go-to-market strategy that aligns application management efforts and the development of supporting infrastructure;
|
|
•
|
stricter data privacy laws including requirements that customer data be stored and processed in a designated territory and obligations on us as a data processor;
|
|
•
|
difficulties in appropriately staffing and managing foreign operations and providing appropriate compensation for local markets;
|
|
•
|
difficulties in leveraging executive presence and company culture globally;
|
|
•
|
different pricing environments, longer sales cycles, and longer trade receivables payment cycles, and collections issues;
|
|
•
|
new and different sources of competition;
|
|
•
|
potentially weaker protection for intellectual property and other legal rights than in the United States and practical difficulties in enforcing intellectual property and other rights;
|
|
•
|
laws, customs, and business practices favoring local competitors;
|
|
•
|
restrictive governmental actions focused on cross-border trade, such as import and export restrictions, duties, quotas, tariffs, trade disputes, and barriers or sanctions that may prevent us from offering certain portions of our products or services to a particular market, may increase our operating costs, or may subject us to monetary fines or penalties in case of unintentional noncompliance due to factors beyond our control;
|
|
•
|
compliance challenges related to the complexity of multiple, conflicting, and changing governmental laws and regulations, including employment, tax, privacy, and data protection laws and regulations;
|
|
•
|
increased compliance costs related to government regulatory reviews or audits, including those related to international cybersecurity requirements;
|
|
•
|
increased financial accounting and reporting burdens and complexities;
|
|
•
|
restrictions on the transfer of funds;
|
|
•
|
ensuring compliance with anti-corruption laws including the Foreign Corrupt Practices Act;
|
|
•
|
the effects of currency fluctuations on our revenues and expenses and customer demand for our services, including any fluctuations caused by uncertainties relating to the UK leaving the EU (“Brexit”);
|
|
•
|
the cost and potential outcomes of any international claims or litigation;
|
|
•
|
adverse tax consequences and tax rulings; and
|
|
•
|
unstable economic and political conditions.
|
Any of the above factors may negatively impact our ability to sell our applications and offer services globally, reduce our competitive position in foreign markets, increase our costs of global operations, and reduce demand for our applications and services from global customers. Additionally, the majority of our international costs are denominated in local currencies and we anticipate that over time an increasing portion of our sales contracts outside the U.S. may be denominated in local currencies. Therefore, fluctuations in the value of the U.S. dollar and foreign currencies may impact our operating results when translated into U.S. dollars. Such fluctuations may also impact our ability to predict our future results accurately. We have a hedging program, but we cannot ensure that this hedging program will be effective, and we will continue to have risk of exchange rate fluctuations.
We have acquired, and may in the future acquire, other companies, employee teams, or technologies, which could divert our management’s attention, result in additional dilution to our stockholders, and otherwise disrupt our operations and adversely affect our operating results.
We have acquired, and may in the future acquire, other companies, employee teams, or technologies to complement or expand our applications, enhance our technical capabilities, obtain personnel, or otherwise offer growth opportunities. For example, during the third quarter of fiscal 2019, we acquired Adaptive Insights, Inc. (“Adaptive Insights”). The pursuit of acquisitions may divert the attention of management and cause us to incur various expenses in identifying, investigating, and pursuing suitable acquisitions, whether or not they are consummated.
12
We may not be able to integrate acquired personnel, operations, and technologies successfully, or effectively manage the combined operations following any acquisition. We also may not achieve the anticipated benefits from an acquisition due to a number of factors, including:
|
•
|
inability to integrate or benefit from an acquisition in a profitable manner;
|
|
•
|
acquisition-related costs, liabilities, or tax impacts, some of which may be unanticipated;
|
|
•
|
difficulty in integrating the intellectual property, technology infrastructure, and operations of the acquired business, including difficulty in addressing security issues of the acquired business;
|
|
•
|
difficulty in integrating and retaining the personnel of the acquired business;
|
|
•
|
difficulty in leveraging the data of the acquired business if it includes personal data;
|
|
•
|
ineffective or inadequate controls, procedures, or policies at the acquired company;
|
|
•
|
multiple product lines or service offerings, as a result of our acquisitions, that are offered, priced, and supported differently;
|
|
•
|
difficulties and additional expenses associated with synchronizing product offerings, customer relationships, and contract portfolio terms and conditions between Workday and the acquired business;
|
|
•
|
potential unknown liabilities or risks associated with the acquired businesses, including those arising from existing contractual obligations or litigation matters;
|
|
•
|
adverse effects on our existing business relationships with business partners and customers as a result of the acquisition;
|
|
•
|
potential write-offs of acquired assets and potential financial and credit risks associated with acquired customers;
|
|
•
|
inability to maintain relationships with key customers, suppliers, and partners of the acquired business;
|
|
•
|
difficulty in predicting and controlling the effect of integrating multiple acquisitions concurrently;
|
|
•
|
lack of experience in new markets, products, or technologies;
|
|
•
|
diversion of management’s attention from other business concerns;
|
|
•
|
use of resources that are needed in other parts of our business; and
|
|
•
|
use of substantial portions of our available cash to consummate the acquisition.
|
In addition, a significant portion of the purchase price of companies we acquire may be allocated to acquired goodwill and other intangible assets, which must be assessed for impairment at least annually. In the future, if our acquisitions do not yield expected returns, we may be required to take charges to our operating results based on this impairment assessment process, which could adversely affect our results of operations.
Acquisitions could also result in dilutive issuances of equity securities or the issuance of debt, which could adversely affect our operating results. In addition, if an acquired business fails to meet our expectations, our operating results, business, and financial position may suffer.
We are subject to risks associated with our equity investments including partial or complete loss of invested capital, and significant changes in the fair value of this portfolio could negatively impact our financial results.
We invest in early-to-late stage companies for strategic reasons and to support key business initiatives, and we may not realize a return on our equity investments. Many such companies generate net losses and the market for their products, services, or technologies may be slow to develop. These companies are often dependent on the availability of later rounds of financing from banks or investors on favorable terms to continue their operations. The financial success of our investment in any company is typically dependent on a liquidity event, such as a public offering, acquisition, or other favorable market event reflecting appreciation to the cost of our initial investment. The capital markets for public offerings and acquisitions are dynamic and the likelihood of liquidity events for the companies we have invested in could deteriorate.
Further, valuations of non-marketable equity investments are inherently complex due to the lack of readily available market data. In addition, we may experience additional volatility to our statements of operations due to changes in market prices of our marketable equity investments and the valuation and timing of observable price changes or impairments of our non-marketable equity investments. This volatility could be material to our results in any given quarter and may cause our stock price to decline.
We have a history of cumulative losses and we do not expect to be profitable on a GAAP basis for the foreseeable future.
We have incurred significant losses in each period since our inception in 2005. These losses and our accumulated deficit reflect the substantial investments we made to acquire new customers and develop our applications. We expect our operating expenses to increase in the future due to anticipated increases in sales and marketing expenses, product development expenses, operations costs, and general and administrative costs, and therefore we expect our losses on a GAAP basis to continue for the foreseeable future. Furthermore, to the extent we are successful in increasing our customer base, we will also incur increased losses in the acquisition period because costs associated with acquiring customers are generally incurred up front, while subscription services revenues are generally recognized ratably over the terms of the agreements, which are typically three years or longer. You should not consider our recent growth in revenues as indicative of our future performance. We cannot assure you that we will achieve GAAP profitability in the future, nor that, if we do become profitable, we will sustain profitability.
13
We may not receive significant revenues from our current development efforts for several years, if at all.
Developing software applications is expensive and the investment in product development often involves a long return on investment cycle. We have made and expect to continue to make significant investments in development and related opportunities. Accelerated application introductions and short application life cycles require high levels of expenditures that could adversely affect our operating results if not offset by revenue increases. We believe that we must continue to dedicate a significant amount of resources to our development efforts to maintain our competitive position. However, we may not receive significant revenues from these investments for several years, if at all.
If we experience significant fluctuations in our rate of anticipated growth and fail to balance our expenses with our revenue forecasts, our results could be harmed.
Our ability to forecast our future rate of growth is limited and subject to a number of uncertainties, including general economic and market conditions. We plan our expense levels and investment on estimates of future revenue and future anticipated rates of growth. We may not be able to adjust our spending quickly enough if our growth rates fall short of our expectations.
Moreover, we have encountered and will encounter risks and uncertainties frequently experienced by growing companies in rapidly changing industries, such as the risks and uncertainties described herein. If our assumptions regarding these risks and uncertainties (which we use to plan our business) are incorrect or change due to changes in our markets, or if we do not address these risks successfully, our operating and financial results could differ materially from our expectations and our business could suffer.
We may not be able to sustain our revenue growth rates in the future.
You should not consider our historical revenue growth rates as indicative of our future performance. Our revenue growth rates have declined, and may decline in future periods, as the size of our customer base increases and as we achieve higher market penetration rates. Other factors may also contribute to declines in our growth rates, including slowing demand for our services, increasing competition, a decrease in the growth of our overall market, our failure to continue to capitalize on growth opportunities, and the maturation of our business, among others. As our growth rates decline, investors’ perceptions of our business and the trading price of our securities could be adversely affected.
Our quarterly results may fluctuate significantly and may not fully reflect the underlying performance of our business.
Our quarterly results of operations, including the levels of our revenues, gross margin, operating margin, profitability, cash flow, unearned revenue, and remaining subscription revenue performance obligations, which we also refer to as backlog, may vary significantly in the future and period-to-period comparisons of our operating results may not be meaningful. Accordingly, the results of any one quarter should not be relied upon as an indication of future performance. Our quarterly financial results may fluctuate as a result of a variety of factors, many of which are outside of our control, and as a result, may not fully reflect the underlying performance of our business. Fluctuation in quarterly results may negatively impact the value of our securities. Factors that may cause fluctuations in our quarterly financial results include, without limitation, those listed below:
|
•
|
our ability to attract new customers;
|
|
•
|
the addition or loss of large customers, including through acquisitions or consolidations;
|
|
•
|
customer renewal rates;
|
|
•
|
the timing of operating expenses and recognition of revenues;
|
|
•
|
the amount and timing of operating expenses related to the maintenance and expansion of our business, operations, and infrastructure;
|
|
•
|
network outages or security breaches;
|
|
•
|
general economic and market conditions;
|
|
•
|
increases or decreases in the number of elements of our services or pricing changes upon any renewals of customer agreements;
|
|
•
|
changes in our pricing policies or those of our competitors;
|
|
•
|
the mix of applications sold during a period;
|
|
•
|
seasonal variations in sales of our applications, which have historically been highest in our fiscal fourth quarter;
|
|
•
|
the timing and success of new application and service introductions by us or our competitors;
|
|
•
|
changes in the competitive dynamics of our industry, including consolidation among competitors, customers, or strategic partners;
|
|
•
|
changes in laws and regulations that impact our business; and
|
|
•
|
the timing of expenses related to acquisitions and potential future charges for impairment of goodwill.
|
14
Because we recognize subscription services revenues over the term of the contract, downturns or upturns in new sales will not be immediately reflected in our operating results and may be difficult to discern.
We generally recognize subscription services revenues over time as services are delivered to the customer, which typically occurs over a period of three years or longer. As a result, most of the subscription services revenues we report in each quarter are derived from the recognition of unearned revenue relating to subscriptions entered into during previous quarters. Consequently, a decline in new or renewed subscription contracts in any single quarter will likely have a minor impact on our revenue results for that quarter. However, such a decline will negatively affect our revenues in future quarters. Accordingly, the effect of significant downturns in sales and market acceptance of our applications, and potential changes in our pricing policies or rate of renewals may not be fully reflected in our results of operations until future periods. We may be unable to adjust our cost structure to reflect the changes in revenues. In addition, a majority of our costs are expensed as incurred, while revenues are recognized over the life of the customer agreement. As a result, increased growth in the number of our customers could result in our recognition of more costs than revenues in the earlier periods of the terms of our agreements. Our subscription model also makes it difficult for us to rapidly increase our revenues through additional sales in any period, as subscription revenues from new customers generally are recognized over the applicable subscription term.
Our ability to predict the rate of customer subscription renewals or adoptions, and the impact these renewals and adoptions will have on our revenues or operating results, is limited.
As the markets for our applications mature, or as new competitors introduce new products or services that compete with ours, we may be unable to attract new customers at the same price or based on the same pricing model as we have used historically. Moreover, large customers, which are the focus of our sales efforts, may demand greater price concessions. As a result, in the future we may be required to reduce our prices, which could adversely affect our revenues, gross margin, profitability, financial position, and cash flow.
In addition, our customers have no obligation to renew their subscriptions for our applications after the expiration of either the initial or renewed subscription period. Our customers may renew for fewer elements of our applications or on different pricing terms. Our customers’ renewal rates may decline or fluctuate as a result of a number of factors, including their level of satisfaction with our pricing or our applications and their ability to continue their operations and spending levels. If our customers do not renew their subscriptions for our applications on similar pricing terms, our revenues may decline, and our business could suffer. In addition, over time the average term of our contracts could change based on renewal rates or for other reasons.
Our future success also depends in part on our ability to sell additional products to our current customers, and the success rate of such endeavors is difficult to predict. This may require increasingly costly marketing and sales efforts that are targeted at senior management, and if these efforts are not successful, our business and results of operations may suffer.
Failure to adequately expand and optimize our direct sales force will impede our growth.
We will need to continue to expand and optimize our sales infrastructure, both domestically and internationally, in order to grow our customer base and our business. Identifying and recruiting qualified personnel and training them in our sales methodology, our sales systems, and the use of our software requires significant time, expense, and attention. It can take significant time before our sales representatives are fully trained and productive. Our business may be adversely affected if our efforts to expand and train our direct sales force do not generate a corresponding increase in revenues. In particular, if we are unable to hire, develop, and retain talented sales personnel or if new direct sales personnel are unable to achieve desired productivity levels in a reasonable period of time, we may not be able to realize the expected benefits of this investment or increase our revenues.
If we fail to develop widespread brand awareness cost-effectively, our business may suffer.
We believe that developing and maintaining widespread positive awareness of our brand is critical to achieving widespread acceptance of our applications, attracting new customers, and hiring and retaining employees. Brand promotion activities may not generate customer awareness or increase revenues, and even if they do, any increase in revenues may not offset the significant expenses we incur in building our brand. If we fail to successfully promote and maintain our brand we may fail to attract or retain customers necessary to realize a sufficient return on our brand-building efforts, or to achieve the widespread brand awareness that is critical for broad customer adoption of our applications. In addition, if our brand is negatively impacted, it may be more difficult to hire and retain employees.
15
Our growth depends in part on the success of our strategic relationships with third parties.
In order to grow our business, we anticipate that we will continue to depend on relationships with third parties, such as deployment partners, technology and content providers, and other key suppliers. Identifying partners, and negotiating and documenting relationships with them, requires significant time and resources. Our competitors may be effective in providing incentives to third parties to favor their products or services or to prevent or reduce subscriptions to our services, or in negotiating better rates or terms with such third parties. In addition, acquisitions of our partners by our competitors could result in a decrease in the number of our current and potential customers, as our partners may no longer facilitate the adoption of our applications by potential customers.
If we are unsuccessful in establishing or maintaining our relationships with third parties, our ability to compete in the marketplace or to grow our revenues could be impaired and our operating results may suffer. Even if we are successful, we cannot assure you that these relationships will result in increased customer usage of our applications or increased revenues.
Adverse economic conditions may negatively impact our business.
Our business depends on the overall demand for enterprise software and on the economic health of our current and prospective customers. Any significant weakening of the economy in the United States or Europe and of the global economy, more limited availability of credit, a reduction in business confidence and activity, decreased government spending, economic uncertainty and other difficulties, such as rising interest rates and increased inflation, may affect one or more of the sectors or countries in which we sell our applications. Alternatively, a strong dollar could reduce demand for our applications and services in countries with relatively weaker currencies.
Also, Brexit has created substantial economic and political uncertainty, including significant volatility in global financial markets and the value of foreign currencies. The impact of Brexit depends on the terms of the UK’s withdrawal from the EU and such impact may not be fully realized for several years or more. This uncertainty may cause some of our customers or potential customers to curtail spending and may ultimately result in new regulatory, operational, and cost challenges to our UK and global operations. These adverse conditions could result in reductions in sales of our applications, longer sales cycles, reductions in subscription duration and value, slower adoption of new technologies, and increased price competition. Any of these events would likely have an adverse effect on our business, operating results, and financial position.
Any failure to protect our intellectual property rights could impair our ability to protect our proprietary technology and our brand.
Our success and ability to compete depend in part upon our intellectual property. We rely on patent, copyright, trade secret and trademark laws, trade secret protection, and confidentiality or license agreements with our employees, customers, partners, and others to protect our intellectual property rights. However, the steps we take to protect our intellectual property rights may be inadequate. While we have patent applications pending in the United States, we may be unable to obtain patent protection for the technology covered in our patent applications. In addition, any patents issued to us in the future may not provide us with competitive advantages or may be successfully challenged by third parties. Furthermore, legal standards relating to the validity, enforceability, and scope of protection of intellectual property rights are uncertain. Despite our precautions, it may be possible for unauthorized third parties to copy our applications and use information that we regard as proprietary to create products and services that compete with ours. Some license provisions protecting against unauthorized use, copying, transfer, and disclosure of our technology may be unenforceable under the laws of jurisdictions outside the United States. In addition, the laws of some countries do not protect proprietary rights to the same extent as the laws of the United States.
We enter into confidentiality and invention assignment agreements with our employees and consultants and enter into confidentiality agreements with the parties with whom we have strategic relationships and business alliances. No assurance can be given that these agreements will be effective in controlling access to and distribution of our applications and proprietary information. Further, these agreements do not prevent our competitors or partners from independently developing technologies that are substantially equivalent or superior to our applications.
We may be required to spend significant resources to monitor and protect our intellectual property rights. Litigation brought to protect and enforce our intellectual property rights could be costly, time-consuming, and distracting to management and could result in the impairment or loss of portions of our intellectual property. Furthermore, our efforts to enforce our intellectual property rights may be met with defenses, counterclaims, and countersuits attacking the validity and enforceability of our intellectual property rights. Our failure to secure, protect, and enforce our intellectual property rights could seriously adversely affect our brand and our business.
16
We may be sued by third parties for alleged infringement of their proprietary rights.
There is considerable patent and other intellectual property development activity in our industry. Our competitors, as well as a number of other entities and individuals, may own or claim to own intellectual property relating to our industry. From time to time, third parties may claim that we are infringing upon their intellectual property rights, and we may be found to be infringing upon such rights. In the future, they may claim that our applications and underlying technology infringe or violate their intellectual property rights, even if we are unaware of the intellectual property rights that others may claim cover some or all of our technology or services. Any claims or litigation could cause us to incur significant expenses and, if successfully asserted against us, could require that we pay substantial damages or ongoing royalty payments, prevent us from offering our services, or require that we comply with other unfavorable terms. We may also be obligated to indemnify our customers or business partners or pay substantial settlement costs, including royalty payments, in connection with any such claim or litigation and to obtain licenses, modify applications, or refund fees, which could be costly. Even if we were to prevail in such a dispute, any litigation regarding our intellectual property could be costly and time-consuming and divert the attention of our management and key personnel from our business operations.
Some of our applications utilize open source software, and any failure to comply with the terms of one or more of these open source licenses could negatively affect our business.
Some of our applications include software covered by open source licenses, which may include, by way of example, GNU General Public License and the Apache License. The terms of various open source licenses have not been interpreted by United States courts, and there is a risk that such licenses could be construed in a manner that imposes unanticipated conditions or restrictions on our ability to market our applications. By the terms of certain open source licenses, we could be required to release the source code of our proprietary software, and to make our proprietary software available under open source licenses, if we combine our proprietary software with open source software in a certain manner. In the event that portions of our proprietary software are determined to be impacted by an open source license, we could be required to publicly release the affected portions of our source code, re-engineer all or a portion of our technologies, or otherwise be limited in the licensing of our technologies, each of which could reduce or eliminate the value of our technologies and services. In addition to risks related to license requirements, usage of open source software can lead to greater risks than use of third-party commercial software, as open source licensors generally do not provide warranties or controls on the origin of the software. Many of the risks associated with usage of open source software cannot be eliminated and could negatively affect our business.
We employ third-party licensed software for use in or with our applications and for improving our internal systems, processes, and controls, and the inability to maintain these licenses or errors in the software we license could result in increased costs, or reduced service levels, which would adversely affect our business.
Our applications incorporate certain third-party software obtained under licenses from other companies. We anticipate that we will continue to rely on such third-party software and development tools from third parties in the future. Although we believe that there are commercially reasonable alternatives to the third-party software we currently license, this may not always be the case, or it may be difficult or costly to replace. Our use of additional or alternative third-party software would require us to enter into license agreements with third parties. In addition, integration of the software used in our applications with new third-party software may require significant work and require substantial investment of our time and resources. To the extent that our applications depend upon the successful operation of third-party software in conjunction with our software, any undetected errors or defects in this third-party software could prevent the deployment or impair the functionality of our applications, delay new application introductions, result in a failure of our applications, and injure our reputation.
Furthermore, we have also licensed third-party software to help us improve our internal systems, processes, and controls. The support services available for such third-party technology may be negatively affected by mergers and consolidation in the software industry, and support services for such technology may not be available to us in the future. Additionally, we may experience difficulties in managing improvements to our systems, processes, and controls or in connection with third-party software, which could materially impair our ability to provide our solutions or professional services to our customers in a timely manner, cause us to lose customers, limit us to smaller deployments of our solutions, or increase our technical support costs.
Changes in laws and regulations related to the internet or changes in the internet infrastructure itself may diminish the demand for our applications and could have a negative impact on our business.
Federal, state, or foreign government bodies or agencies have in the past adopted, and may in the future adopt, laws or regulations relating to internet usage. Changes in these laws or regulations could require us to modify our applications in order to comply with these laws or regulations. In addition, government agencies or private organizations may begin to impose taxes, fees, or other charges for accessing the internet or commerce conducted via the internet. These laws or charges could limit the growth of internet-related commerce or communications, or negatively impact demand for internet-based applications such as ours.
17
In addition, businesses could be adversely affected due to delays in the development or adoption of new standards and protocols to handle increased demands of internet activity, security, reliability, cost, ease of use, accessibility, and quality of service. Businesses have been adversely affected by “viruses,” “worms,” and similar malicious programs and have experienced a variety of outages and other delays as a result of damage to internet infrastructure. These issues could negatively impact demand for our cloud-based applications.
We may discover weaknesses in our internal controls over financial reporting, which may adversely affect investor confidence in the accuracy and completeness of our financial reports and consequently the market price of our securities.
As a public company, we are required to design and maintain proper and effective internal controls over financial reporting and to report any material weaknesses in such internal controls. Section 404 of the Sarbanes-Oxley Act of 2002 requires that we evaluate and determine the effectiveness of our internal controls over financial reporting and provide a management report on the internal controls over financial reporting, which must be attested to by our independent registered public accounting firm. If we have a material weakness in our internal controls over financial reporting, we may not detect errors on a timely basis and our financial statements may be materially misstated.
The process of compiling the system and processing documentation necessary to perform the evaluation needed to comply with Section 404 is challenging and costly. In the future, we may not be able to complete our evaluation, testing, and any required remediation in a timely fashion. If we identify material weaknesses in our internal controls over financial reporting, if we are unable to comply with the requirements of Section 404 in a timely manner, if we are unable to assert that our internal controls over financial reporting are effective, or if our independent registered public accounting firm is unable to express an opinion as to the effectiveness of our internal controls over financial reporting, investors may lose confidence in the accuracy and completeness of our financial reports and the market price of our securities could be negatively affected, and we could become subject to investigations by the Financial Industry Regulatory Authority, the SEC, or other regulatory authorities, which could require additional financial and management resources. In addition, because we use Workday’s financial management application, any problems that we experience with financial reporting and compliance could be negatively perceived by prospective or current customers, and negatively impact demand for our applications.
We may not be able to utilize a portion of our net operating loss or research tax credit carryforwards, which could adversely affect our profitability.
As of
January 31, 2019
, we had federal and state net operating loss carryforwards due to prior period losses. If not utilized, the pre-fiscal 2018 federal and the state net operating loss carryforwards expire in varying amounts between fiscal 2020 and 2039. The federal net operating losses generated in and after fiscal 2018 do not expire and may be carried forward indefinitely. We also have federal research tax credit carryforwards, which if not utilized will begin to expire in fiscal 2023. These net operating loss and research tax credit carryforwards could expire unused and be unavailable to reduce future income tax liabilities, which could adversely affect our profitability. In addition, under Section 382 of the Internal Revenue Code of 1986, as amended, our ability to utilize net operating loss carryforwards or other tax attributes, such as research tax credits, in any taxable year may be limited if we experience an “ownership change.” A Section 382 “ownership change” generally occurs if one or more stockholders or groups of stockholders who own at least 5% of our stock increase their ownership by more than 50 percentage points over their lowest ownership percentage within a rolling three-year period. Similar rules may apply under state tax laws. It is possible that an ownership change, or any future ownership change, could have a material effect on the use of our net operating loss carryforwards or other tax attributes, which could adversely affect our profitability.
Adverse tax laws or regulations could be enacted or existing laws could be applied to us or our customers, which could increase the costs of our services and adversely impact our business.
We operate and are subject to taxes in the United States and numerous other jurisdictions throughout the world. Changes to federal, state, local, or international tax laws on income, sales, use, indirect, or other tax laws, statutes, rules, regulations, or ordinances on multinational corporations are currently being considered by the United States and other countries where we do business. These contemplated legislative initiatives include, but are not limited to, changes to transfer pricing policies and definitional changes to permanent establishment that could be applied solely or disproportionately to services provided over the internet. These contemplated tax initiatives, if finalized and adopted by countries, may ultimately impact our effective tax rate and could adversely affect our sales activity resulting in a negative impact on our operating results and cash flows.
In addition, existing tax laws, statutes, rules, regulations, or ordinances could be interpreted, changed, modified, or applied adversely to us (possibly with retroactive effect), which could require us to pay additional tax amounts, fines or penalties, and interest for past amounts. Existing tax laws, statutes, rules, regulations, or ordinances could also be interpreted, changed, modified, or applied adversely to our customers (possibly with retroactive effect), which could require our customers to pay additional tax amounts with respect to services we have provided, fines or penalties, and interest for past amounts. If we are unsuccessful in collecting such taxes from our customers, we could be held liable for such costs, thereby adversely impacting our operating results and cash flows. If our customers must pay additional fines or penalties, it could adversely affect demand for our services.
18
The 2017 Tax Cuts and Jobs Act (the “Tax Act”) was enacted on December 22, 2017, and significantly affected U.S. tax law by changing how the U.S. imposes income tax on multinational corporations. The U.S. Department of Treasury has broad authority to issue regulations and interpretative guidance that may significantly impact how we will apply the law and impact our results of operations in the period issued. The Tax Act requires complex computations not previously provided in U.S. tax law. As such, the application of accounting guidance for such items is currently uncertain. Further, compliance with the Tax Act and the accounting for such provisions require accumulation of information not previously required or regularly produced. As additional regulatory guidance is issued by the applicable taxing authorities and as accounting treatment is clarified, we will perform additional analysis on the application of the law and refine estimates in calculating the effect, which may produce different results and will be reflected in the period the analysis is completed.
Our reported financial results may be adversely affected by changes in accounting principles generally accepted in the United States.
Generally accepted accounting principles in the United States are subject to interpretation by the Financial Accounting Standards Board, the SEC, and various bodies formed to promulgate and interpret appropriate accounting principles. A change in these principles or interpretations could have a significant effect on our reported financial results, and may even affect the reporting of transactions completed before the announcement or effectiveness of a change.
We have broad discretion in the use of our cash balances and may not use them effectively.
We have broad discretion in the use of our cash balances and may not use them effectively. The failure by our management to apply these funds effectively could adversely affect our business and financial condition. Pending their use, we may invest our cash balances in a manner that does not produce income or that loses value. Our investments may not yield a favorable return to our investors and may negatively impact the price of our securities.
Risks Related to Our Class A Common Stock
Our Chairman and CEO have control over key decision making as a result of their control of a majority of our voting stock.
As of
January 31, 2019
, our co-founder and Chairman David Duffield, together with his affiliates, held voting rights with respect to approximately 54 million shares of Class B common stock, 0.8 million shares of Class A common stock, and less than 0.1 million restricted stock units (“RSUs”), which will be settled in an equivalent number of shares of Class A common stock. As of
January 31, 2019
, our co-founder and CEO Aneel Bhusri, together with his affiliates, held voting rights with respect to approximately 8 million shares of Class B common stock and 0.2 million shares of Class A common stock. In addition, Mr. Bhusri holds exercisable stock options to acquire approximately 2 million shares of Class B common stock and 0.2 million RSUs, which will be settled in an equivalent number of shares of Class A common stock. Further, Messrs. Duffield and Bhusri have entered into a voting agreement under which each has granted a voting proxy with respect to certain Class B common stock beneficially owned by him effective upon his death or incapacity as described in our registration statement on Form S-1 filed in connection with our IPO. Messrs. Duffield and Bhusri have each initially designated the other as their respective proxies. Accordingly, upon the death or incapacity of either Mr. Duffield or Mr. Bhusri, the other would individually continue to control the voting of shares subject to the voting proxy. Collectively, the shares described above represent a substantial majority of the voting power of our outstanding capital stock. As a result, Messrs. Duffield and Bhusri have the ability to control the outcome of matters submitted to our stockholders for approval, including the election of directors and any merger, consolidation, or sale of all or substantially all of our assets. In addition, they have the ability to control the management and affairs of our company as a result of their positions as our Chairman and CEO, respectively, and their ability to control the election of our directors. Mr. Duffield, in his capacity as a board member, and Mr. Bhusri, in his capacity as a board member and officer, each owe a fiduciary duty to our stockholders and must act in good faith in a manner they reasonably believe to be in the best interests of our stockholders. As stockholders, even as controlling stockholders, they are entitled to vote their shares in their own interests, which may not always be in the interests of our stockholders generally.
19
The dual class structure of our common stock has the effect of concentrating voting control with our Chairman and CEO, and also with other executive officers, directors, and affiliates; this will limit or preclude the ability of non-affiliates to influence corporate matters.
Our Class B common stock has 10 votes per share and our Class A common stock, which is the stock that is publicly traded, has one vote per share. Stockholders who hold shares of Class B common stock, including our executive officers, directors, and other affiliates, together hold a substantial majority of the voting power of our outstanding capital stock as of
January 31, 2019
. Because of the ten-to-one voting ratio between our Class B and Class A common stock, the holders of our Class B common stock collectively will continue to control a majority of the combined voting power of our common stock and therefore be able to control all matters submitted to our stockholders for approval until the conversion of all shares of all Class A and Class B shares to a single class of common stock on the date that is the first to occur of (i) October 11, 2032, (ii) such time as the shares of Class B common stock represent less than 9% of the outstanding Class A and Class B common stock, (iii) nine months following the death of both Mr. Duffield and Mr. Bhusri, or (iv) the date on which the holders of a majority of the shares of Class B common stock elect to convert all shares of Class A common stock and Class B common stock into a single class of common stock. This concentrated control will limit or preclude the ability of non-affiliates to influence corporate matters for the foreseeable future.
Future transfers by holders of Class B common stock will generally result in those shares converting to Class A common stock, subject to limited exceptions, such as certain transfers effected for estate planning purposes. The conversion of Class B common stock to Class A common stock will have the effect, over time, of increasing the relative voting power of those holders of Class B common stock who retain their shares in the long term. If, for example, our Chairman and CEO retain a significant portion of their holdings of Class B common stock for an extended period of time, they could, in the future, continue to control a majority of the combined voting power of our Class A common stock and Class B common stock.
Our stock price has been volatile in the past and may be subject to volatility in the future.
The trading price of our Class A common stock has been volatile historically and could be subject to wide fluctuations in response to various factors described below. These factors, as well as the volatility of our Class A common stock, could also impact the price of our convertible senior notes. The factors that may affect the trading price of our securities, some of which are beyond our control, include:
|
•
|
overall performance of the equity markets;
|
|
•
|
fluctuations in the valuation of companies perceived by investors to be comparable to us, such as high-growth or cloud companies, or in valuation metrics, such as our price to revenues ratio;
|
|
•
|
guidance as to our operating results that we provide to the public, differences between our guidance and market expectations, our failure to meet our guidance, or changes in recommendations by securities analysts that follow our securities;
|
|
•
|
announcements of technological innovations, new applications or enhancements to services, acquisitions, strategic alliances, or significant agreements by us or by our competitors;
|
|
•
|
disruptions in our services due to computer hardware, software, or network problems;
|
|
•
|
announcements of customer additions and customer cancellations or delays in customer purchases;
|
|
•
|
recruitment or departure of key personnel;
|
|
•
|
the economy as a whole, market conditions in our industry, and the industries of our customers;
|
|
•
|
trading activity by directors, executive officers and significant stockholders, or the perception in the market that the holders of a large number of shares intend to sell their shares;
|
|
•
|
the exercise of rights held by certain of our stockholders, subject to some conditions, to require us to file registration statements covering their shares or to include their shares in registration statements that we may file for ourselves or our stockholders;
|
|
•
|
the size of our market float and significant stock option exercises;
|
|
•
|
any future issuances of securities;
|
|
•
|
sales and purchases of any Class A common stock issued upon conversion of our convertible senior notes or in connection with the convertible note hedge and warrant transactions related to such convertible senior notes;
|
|
•
|
our operating performance and the performance of other similar companies; and
|
|
•
|
the sale or availability for sale of a large number of shares of our Class A common stock in the public market.
|
Additionally, the stock markets have at times experienced extreme price and volume fluctuations that have affected and may in the future affect the market prices of equity securities of many companies. These fluctuations have, in some cases, been unrelated or disproportionate to the operating performance of these companies. Further, the trading prices of publicly traded shares of companies in our industry have been particularly volatile and may be very volatile in the future.
In the past, some companies that have experienced volatility in the market price of their stock have been subject to securities class action litigation. We may be the target of this type of litigation in the future. Securities litigation against us could result in substantial costs and divert our management’s attention from other business concerns, which could harm our business.
20
We have substantial indebtedness in the form of convertible senior notes, which may adversely affect our financial condition and operating results.
In June 2013, we completed an offering of $250 million of 1.50% convertible senior notes due July 15, 2020 (“2020 Notes”). In September 2017, we completed an offering of $1.15 billion of 0.25% convertible senior notes due October 1, 2022 (“2022 Notes”). As a result of these convertible notes offerings, we incurred $250 million principal amount of indebtedness, which we may be required to pay at maturity in 2020, and $1.15 billion principal amount of indebtedness, which we may be required to pay at maturity in 2022, or upon the occurrence of a fundamental change (as defined in the applicable indenture). We may incur substantial additional debt in the future, some of which may be secured debt. There can be no assurance that we will be able to repay this indebtedness when due, or that we will be able to refinance this indebtedness on acceptable terms or at all. Our ability to pay cash upon conversion or repurchase of the 2020 Notes or the 2022 Notes may be limited by law, regulatory authority, or agreements governing our future indebtedness and is dependent on our future performance, which is subject to economic, financial, competitive, and other factors beyond our control. Any future debt may also contain limitations on our ability to pay cash upon a conversion request or repurchase upon a fundamental change.
In addition, this indebtedness could, among other things:
|
•
|
make it difficult for us to pay other obligations;
|
|
•
|
make it difficult to obtain favorable terms for any necessary future financing for working capital, capital expenditures, debt service requirements, or other purposes;
|
|
•
|
adversely affect our liquidity and result in a material adverse effect on our financial position upon repayment of the indebtedness;
|
|
•
|
require us to dedicate a substantial portion of our cash flow from operations to service and repay the indebtedness, reducing the amount of cash flow available for other purposes; and
|
|
•
|
limit our flexibility in planning for and reacting to changes in our business.
|
The convertible note hedge and warrant transactions may affect the value of our Class A common stock.
In connection with the sale of our convertible notes, we entered into convertible note hedge transactions with institutions that we refer to as the option counterparties. We also entered into warrant transactions with the option counterparties pursuant to which we sold warrants for the purchase of our Class A common stock. The convertible note hedge transactions are expected to offset the potential dilution to our Class A common stock upon any conversion of the convertible notes. The warrant transactions could separately have a dilutive effect to the extent that the market price per share of our Class A common stock exceeds the exercise price of the relevant warrants.
The option counterparties or their respective affiliates may modify their hedge positions by entering into or unwinding various derivatives with respect to our Class A common stock and/or purchasing or selling our Class A common stock or other securities of ours in secondary market transactions prior to the maturity of the convertible notes. This activity could suppress or inflate the market price of our Class A common stock.
We will also be subject to the risk that these option counterparties may default under the convertible note hedge transactions. Our exposure to the credit risk of the option counterparties will not be secured by any collateral. If one or more of the option counterparties to one or more of our convertible note hedge transactions becomes subject to insolvency proceedings, we will become an unsecured creditor in those proceedings with a claim equal to our exposure at the time under those transactions. Our exposure will depend on many factors but, generally, the increase in our exposure will be correlated to the increase in the market price of our Class A common stock during the related settlement period. In addition, upon a default by one of the option counterparties, we may suffer dilution with respect to our Class A common stock as well as adverse financial consequences.
Delaware law and provisions in our restated certificate of incorporation and restated bylaws could make a merger, tender offer, or proxy contest difficult, thereby depressing the market price of our Class A common stock.
Our status as a Delaware corporation and the anti-takeover provisions of the Delaware General Corporation Law may discourage, delay, or prevent a change in control by prohibiting us from engaging in a business combination with an interested stockholder for a period of three years after the person becomes an interested stockholder, even if a change of control would be beneficial to our existing stockholders. In addition, our restated certificate of incorporation and restated bylaws contain provisions that may make the acquisition of our company more difficult, including the following:
|
•
|
any transaction that would result in a change in control of our company requires the approval of a majority of our outstanding Class B common stock voting as a separate class;
|
|
•
|
our dual class common stock structure, which provides our chairman and CEO with the ability to control the outcome of matters requiring stockholder approval, even if they own significantly less than a majority of the shares of our outstanding Class A and Class B common stock;
|
|
•
|
our board of directors is classified into three classes of directors with staggered three-year terms and directors are only able to be removed from office for cause;
|
21
|
•
|
when the outstanding shares of our Class B common stock represent less than a majority of the combined voting power of common stock:
|
|
•
|
certain amendments to our restated certificate of incorporation or restated bylaws will require the approval of two-thirds of the combined vote of our then-outstanding shares of Class A and Class B common stock;
|
|
•
|
our stockholders will only be able to take action at a meeting of stockholders and not by written consent; and
|
|
•
|
vacancies on our board of directors will be able to be filled only by our board of directors and not by stockholders;
|
|
•
|
only our chairman of the board, chief executive officer, either co-president, or a majority of our board of directors are authorized to call a special meeting of stockholders;
|
|
•
|
certain litigation against us can only be brought in Delaware;
|
|
•
|
we will have two classes of common stock until the date that is the first to occur of (i) October 11, 2032, (ii) such time as the shares of Class B common stock represent less than 9% of the outstanding Class A and Class B common stock, (iii) nine months following the death of both Mr. Duffield and Mr. Bhusri, or (iv) the date on which the holders of a majority of the shares of Class B common stock elect to convert all shares of Class A common stock and Class B common stock into a single class of common stock;
|
|
•
|
our restated certificate of incorporation authorizes undesignated preferred stock, the terms of which may be established, and shares of which may be issued, without the approval of the holders of Class A common stock; and
|
|
•
|
advance notice procedures apply for stockholders to nominate candidates for election as directors or to bring matters before an annual meeting of stockholders.
|
These anti-takeover defenses could discourage, delay, or prevent a transaction involving a change in control of our company. These provisions could also discourage proxy contests and make it more difficult for stockholders to elect directors of their choosing and to cause us to take other corporate actions they desire, any of which, under certain circumstances, could depress the market price of our securities.
If securities or industry analysts publish inaccurate or unfavorable research about our business, or discontinue publishing research about our business, the price and trading volume of our securities could decline.
The trading market for our securities will depend in part on the research and reports that securities or industry analysts publish about us or our business. If one or more of the analysts who cover us downgrade our Class A common stock or publish inaccurate or unfavorable research about our business, the price of our securities would likely decline. If one or more of these analysts cease coverage of us or fail to publish reports on us regularly, demand for our securities could decrease, which might cause the price and trading volume of our securities to decline.
We do not intend to pay dividends for the foreseeable future.
We have never declared nor paid cash dividends on our capital stock. We currently intend to retain any future earnings to finance the operation and expansion of our business, and we do not expect to declare or pay any dividends in the foreseeable future. Consequently, stockholders must rely on sales of their common stock after price appreciation as the only way to realize any future gains on their investment.
ITEM 1B. UNRESOLVED STAFF COMMENTS
None.
ITEM 2. PROPERTIES
Our corporate headquarters, which includes operations and product development facilities, is located in Pleasanton, California. It consists of approximately 650,000 square feet of leased facilities, 677,000 square feet of owned facilities, and a 6.9 acre parcel of leased land. The land lease will expire in 2108.
491,000 square feet of our leased facilities in Pleasanton, California are owned by an affiliate of our Chairman, Mr. Duffield. We expect to continue to lease additional space from the affiliate in the coming year and beyond. We have and will continue to seek independent evaluations of current market rates at the time of lease negotiations with the goal of leasing at a rate comparable to the current market price.
In addition, we lease office space in various locations throughout North America, Europe, and Asia totaling approximately 937,000 square feet. We also lease data centers throughout North America and Europe.
We expect to expand our facilities capacity at our corporate headquarters and in certain field locations during fiscal
2020
to support our continued growth. We believe that we will be able to obtain additional space at commercially reasonable terms.
22
ITEM 3. LEGAL PROCEEDINGS
From time to time, we are or may be involved in various legal proceedings arising from the normal course of business including matters related to alleged infringement of third-party patents and other intellectual property rights, commercial, employment, and other claims. We are not presently a party to any litigation the outcome of which we believe, if determined adversely to us, would individually or taken together have a material adverse effect on our business, operating results, cash flows, or financial condition. Defending such proceedings is costly and can impose a significant burden on management and employees, we may receive unfavorable preliminary or interim rulings in the course of litigation, and there can be no assurances that favorable final outcomes will be obtained. The resolution of legal matters could prevent us from offering one or more of our applications, services, or features to others, could require us to change our technology or business practices, pay monetary damages, or enter into short- or long-term royalty or licensing agreements, or could otherwise be material to our financial condition or cash flows, or both, or adversely affect our operating results.
ITEM 4. MINE SAFETY DISCLOSURES
Not applicable.
23
PART II
ITEM 5. MARKET FOR REGISTRANT’S COMMON EQUITY, RELATED STOCKHOLDER MATTERS, AND ISSUER PURCHASES OF EQUITY SECURITIES
Market Information for Common Stock
Our Class A common stock has traded on the Nasdaq Global Select Market under the symbol “WDAY” since September 20, 2017. Prior to that time, it traded on the New York Stock Exchange.
Our Class B common stock is not listed or traded on any stock exchange.
Dividend Policy
We have never declared or paid cash dividends on our capital stock. We currently intend to retain any future earnings for use in the operation of our business and do not intend to declare or pay any cash dividends in the foreseeable future. Any further determination to pay dividends on our capital stock will be at the discretion of our board of directors, subject to applicable laws, and will depend on our financial condition, results of operations, capital requirements, general business conditions, and other factors that our board of directors considers relevant.
Stockholders
As of February 28, 2019, there were 23 stockholders of record of our Class A common stock, including The Depository Trust Company, which holds shares of our common stock on behalf of an indeterminate number of beneficial owners, as well as 114 stockholders of record of our Class B common stock.
Stock Performance Graph
The following shall not be deemed “soliciting material” or deemed “filed” for purposes of Section 18 of the Exchange Act or subject to Regulation 14A or 14C, other than as provided by this Item 5, or to the liabilities of Section 18 of the Exchange Act, or incorporated by reference into any of our other filings under the Exchange Act or the Securities Act of 1933, as amended, except to the extent we specifically incorporate it by reference into such filing.
24
This chart compares the cumulative total return on our common stock with that of the S&P 500 Index and the S&P 1500 Application Software Index. The chart assumes $100 was invested at the close of market on January 31, 2014, in the Class A common stock of Workday, Inc., the S&P 500 Index, and the S&P 1500 Application Software Index, and assumes the reinvestment of any dividends. The stock price performance on the following graph is not necessarily indicative of future stock price performance.
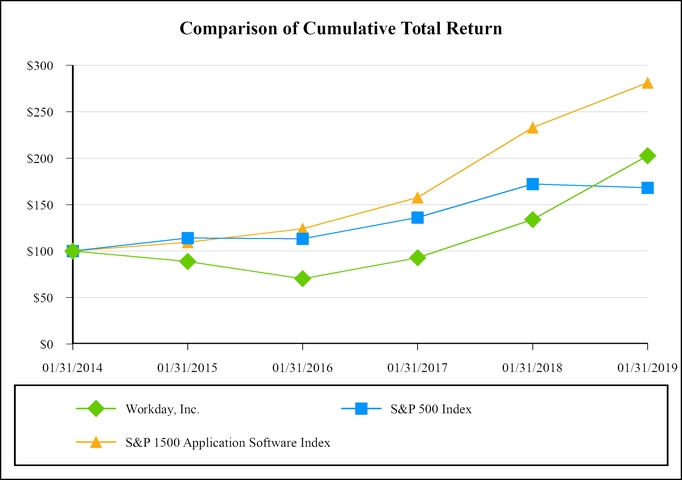
|
Company/Index
|
1/31/2014
|
1/31/2015
|
1/31/2016
|
1/31/2017
|
1/31/2018
|
1/31/2019
|
||||||||||||||||||
|
Workday, Inc.
|
$
|
100.00
|
|
$
|
88.74
|
|
$
|
70.37
|
|
$
|
92.80
|
|
$
|
133.90
|
|
$
|
202.74
|
|
||||||
|
S&P 500 Index
|
100.00
|
|
114.21
|
|
113.44
|
|
136.17
|
|
172.12
|
|
168.12
|
|
||||||||||||
|
S&P 1500 Application Software Index
|
100.00
|
|
109.45
|
|
124.20
|
|
157.75
|
|
232.97
|
|
281.13
|
|
||||||||||||
Unregistered Sales of Equity Securities
During fiscal 2019, we issued 1,457,382 shares of our unregistered Class A common stock to holders of our 0.75% convertible senior notes (“2018 Notes”) upon settlement of conversion of an aggregate principal amount of $350 million of such notes. This share amount represents the conversion value of the 2018 Notes in excess of the principal amount of notes converted.
During fiscal 2019, we issued 131 shares of our unregistered Class A common stock to holders of our 1.50% convertible senior notes (“2020 Notes”) upon settlement of conversion of an aggregate principal amount of $0.03 million of such notes. This share amount represents the conversion value of the 2020 Notes in excess of the principal amount of notes converted.
During fiscal 2019, we issued 1,063,380 shares of our unregistered Class A common stock to warrant holders who exercised their warrants related to the 2018 Notes. This share amount represents the number of such warrants exercised multiplied by the difference between the exercise price of the warrants and their daily volume weighted-average stock price.
For further information regarding the above transactions, see Note 11 of the notes to consolidated financial statements. These shares of the Company’s Class A common stock were issued in reliance on the exemption from registration provided by Section 3(a)(9) of the Securities Act of 1933, as amended.
25
Issuer Purchases of Equity Securities
The table below sets forth information regarding our purchases of our Class A common stock for each month in which there was a purchase of such equity securities covered by this report:
|
Period
|
Total Number of Shares Purchased
|
Average Price Paid per Share
|
Total Number of Shares Purchased as Part of Publicly Announced Plans or Programs
|
Maximum Number (or Approximate Dollar Value) of Shares that May Yet Be Purchased Under the Plans or Programs
|
|||||||||
|
July 1, 2018 - July 31, 2018
(1)
|
1,457,546
|
|
$
|
132.88
|
|
—
|
|
—
|
|
||||
|
August 1, 2018 - August 31, 2018
(2)
|
1
|
|
$
|
132.75
|
|
—
|
|
—
|
|
||||
|
November 1, 2018 - November 30, 2018
(2)
|
1
|
|
$
|
130.32
|
|
—
|
|
—
|
|
||||
|
Total
|
1,457,548
|
|
—
|
|
|||||||||
|
(1)
|
The shares purchased represent the exercise of the convertible note hedges relating to the 2018 Notes. For further information, see Note 11 of the notes to consolidated financial statements.
|
|
(2)
|
The share purchased represents the exercise of the convertible note hedge relating to the partial early conversion of the 2020 Notes. For further information, see Note 11 of the notes to consolidated financial statements.
|
ITEM 6. SELECTED CONSOLIDATED FINANCIAL DATA
The consolidated statements of operations data and the consolidated balance sheets data are derived from our audited consolidated financial statements and should be read together with “Management’s Discussion and Analysis of Financial Condition and Results of Operations,” our consolidated financial statements, and the related notes included elsewhere in this filing. Our historical results are not necessarily indicative of our results in any future period.
26
|
|
Year Ended January 31,
|
||||||||||||||||||
|
|
2019
|
2018
|
2017
|
2016
|
*2015
|
||||||||||||||
|
*As Adjusted
|
*As Adjusted
|
||||||||||||||||||
|
|
(in thousands, except per share data)
|
||||||||||||||||||
|
Consolidated Statements of Operations Data:
|
|||||||||||||||||||
|
Revenues:
|
|||||||||||||||||||
|
Subscription services
|
$
|
2,385,769
|
|
$
|
1,787,833
|
|
$
|
1,290,733
|
|
$
|
920,196
|
|
$
|
613,328
|
|
||||
|
Professional services
|
436,411
|
|
355,217
|
|
283,707
|
|
236,494
|
|
174,532
|
|
|||||||||
|
Total revenues
|
2,822,180
|
|
2,143,050
|
|
1,574,440
|
|
1,156,690
|
|
787,860
|
|
|||||||||
|
Costs and expenses
(1)
:
|
|||||||||||||||||||
|
Costs of subscription services
|
379,877
|
|
273,461
|
|
213,389
|
|
149,869
|
|
102,476
|
|
|||||||||
|
Costs of professional services
|
455,073
|
|
355,952
|
|
270,156
|
|
224,558
|
|
162,327
|
|
|||||||||
|
Product development
|
1,211,832
|
|
910,584
|
|
680,531
|
|
469,944
|
|
316,868
|
|
|||||||||
|
Sales and marketing
|
891,345
|
|
683,367
|
|
565,328
|
|
413,530
|
|
315,840
|
|
|||||||||
|
General and administrative
|
347,337
|
|
222,909
|
|
198,122
|
|
148,578
|
|
106,051
|
|
|||||||||
|
Total costs and expenses
|
3,285,464
|
|
2,446,273
|
|
1,927,526
|
|
1,406,479
|
|
1,003,562
|
|
|||||||||
|
Operating loss
|
(463,284
|
)
|
(303,223
|
)
|
(353,086
|
)
|
(249,789
|
)
|
(215,702
|
)
|
|||||||||
|
Other income (expense), net
|
39,532
|
|
(11,563
|
)
|
(32,427
|
)
|
(24,242
|
)
|
(30,270
|
)
|
|||||||||
|
Loss before provision for (benefit from) income taxes
|
(423,752
|
)
|
(314,786
|
)
|
(385,513
|
)
|
(274,031
|
)
|
(245,972
|
)
|
|||||||||
|
Provision for (benefit from) income taxes
|
(5,494
|
)
|
6,436
|
|
(814
|
)
|
1,017
|
|
2,010
|
|
|||||||||
|
Net loss
|
$
|
(418,258
|
)
|
$
|
(321,222
|
)
|
$
|
(384,699
|
)
|
$
|
(275,048
|
)
|
$
|
(247,982
|
)
|
||||
|
Net loss attributable to Class A and Class B common stockholders
|
$
|
(418,258
|
)
|
$
|
(321,222
|
)
|
$
|
(384,699
|
)
|
$
|
(275,048
|
)
|
$
|
(247,982
|
)
|
||||
|
Net loss per share attributable to Class A and Class B common stockholders, basic and diluted
|
$
|
(1.93
|
)
|
$
|
(1.55
|
)
|
$
|
(1.94
|
)
|
$
|
(1.45
|
)
|
$
|
(1.35
|
)
|
||||
|
Weighted-average shares used to compute net loss per share attributable to Class A and Class B common stockholders
|
216,789
|
|
207,774
|
|
198,214
|
|
190,016
|
|
183,702
|
|
|||||||||
|
(1)
|
Costs and expenses include share-based compensation expenses as follows (in thousands):
|
|
|
Year Ended January 31,
|
||||||||||||||||||
|
|
2019
|
2018
|
2017
|
2016
|
2015
|
||||||||||||||
|
Costs of subscription services
|
$
|
36,754
|
|
$
|
26,280
|
|
$
|
20,773
|
|
$
|
12,060
|
|
$
|
6,053
|
|
||||
|
Costs of professional services
|
55,535
|
|
37,592
|
|
26,833
|
|
19,526
|
|
12,890
|
|
|||||||||
|
Product development
|
320,876
|
|
229,819
|
|
166,529
|
|
109,362
|
|
63,938
|
|
|||||||||
|
Sales and marketing
|
132,810
|
|
100,762
|
|
86,229
|
|
51,617
|
|
29,875
|
|
|||||||||
|
General and administrative
|
127,443
|
|
83,972
|
|
78,265
|
|
57,405
|
|
43,292
|
|
|||||||||
27
|
|
As of January 31,
|
||||||||||||||||||
|
|
2019
|
2018
|
2017
|
2016
|
*2015
|
||||||||||||||
|
*As Adjusted
|
*As Adjusted
|
||||||||||||||||||
|
|
(in thousands)
|
||||||||||||||||||
|
Consolidated Balance Sheet Data:
|
|||||||||||||||||||
|
Cash and cash equivalents
|
$
|
638,554
|
|
$
|
1,134,355
|
|
$
|
539,923
|
|
$
|
300,087
|
|
$
|
298,192
|
|
||||
|
Marketable securities
|
1,139,864
|
|
2,133,495
|
|
1,456,822
|
|
1,669,372
|
|
1,559,517
|
|
|||||||||
|
Working capital
|
269,905
|
|
1,898,104
|
|
1,239,202
|
|
1,468,067
|
|
1,467,122
|
|
|||||||||
|
Property and equipment, net
|
796,907
|
|
546,609
|
|
365,877
|
|
214,158
|
|
140,136
|
|
|||||||||
|
Total assets
|
5,520,746
|
|
4,947,424
|
|
3,268,282
|
|
2,812,370
|
|
2,350,090
|
|
|||||||||
|
Total unearned revenue
|
1,949,270
|
|
1,537,147
|
|
1,221,543
|
|
891,882
|
|
632,744
|
|
|||||||||
|
Convertible senior notes, net
|
1,204,778
|
|
1,491,354
|
|
534,423
|
|
507,476
|
|
481,958
|
|
|||||||||
|
Total liabilities
|
3,562,304
|
|
3,367,059
|
|
1,991,674
|
|
1,586,090
|
|
1,224,115
|
|
|||||||||
|
Total stockholders’ equity
|
1,958,442
|
|
1,580,365
|
|
1,276,608
|
|
1,226,280
|
|
1,125,975
|
|
|||||||||
|
|
Year Ended January 31,
|
||||||||||||||||||
|
|
2019
|
2018
|
2017
|
2016
|
*2015
|
||||||||||||||
|
*As Adjusted
|
*As Adjusted
|
||||||||||||||||||
|
|
(in thousands)
|
||||||||||||||||||
|
Cash Flow Data:
|
|||||||||||||||||||
|
Net cash provided by (used in) operating activities
|
$
|
606,658
|
|
$
|
465,727
|
|
$
|
350,626
|
|
$
|
258,637
|
|
$
|
102,003
|
|
||||
|
*
|
The summary consolidated financial data for the years ended January 31, 2019, 2018, 2017, and 2016 and as of January 31, 2019, 2018, 2017, and 2016 reflects the adoption of Accounting Standards Update (“ASU”) No. 2014-09,
Revenue from Contracts with Customers (
“
Topic 606
”
)
, and ASU No. 2016-18,
Statement of Cash Flows, Restricted Cash
. See Note 1 of the notes to consolidated financial statements for further information. The summary consolidated financial data for the year ended January 31, 2015 and as of January 31, 2015 does not reflect the adoption of Topic 606 or ASU No. 2016-18.
|
28
ITEM 7. MANAGEMENT’S DISCUSSION AND ANALYSIS OF FINANCIAL CONDITION AND RESULTS OF OPERATIONS
You should read the following discussion of our financial condition and results of operations in conjunction with the consolidated financial statements and notes thereto included elsewhere in this report. The following discussion contains forward-looking statements that reflect our plans, estimates, and beliefs. Our actual results could differ materially from those discussed in the forward-looking statements. Factors that could cause or contribute to these differences include those discussed below and elsewhere in this report, particularly in
“
Risk Factors.
”
Overview
Workday provides financial management, human capital management, planning, and analytics applications designed for the world’s largest companies, educational institutions, and government agencies. We offer innovative and adaptable technology focused on the consumer internet experience and cloud delivery model. Our applications are designed for global enterprises to manage complex and dynamic operating environments. We provide our customers with highly adaptable, accessible, and reliable applications to manage critical business functions that enable them to optimize their financial and human capital resources.
We were founded in 2005 to deliver cloud applications to global enterprises. Our applications are designed around the way people work today—in an environment that is global, collaborative, fast-paced, and mobile. Our cycle of frequent updates has facilitated rapid innovation and the introduction of new applications throughout our history. We began offering our HCM application in 2006 and our Financial Management application in 2007. Since then we have continued to invest in innovation and have consistently introduced new services to our customers.
We offer Workday applications to our customers on an enterprise-wide subscription basis, typically with contract terms of three years or longer and with subscription fees largely based on the size of the customer’s workforce. We generally recognize revenues from subscription fees ratably over the term of the contract. We currently derive a substantial majority of our subscription services revenues from subscriptions to our HCM application. We market our applications primarily through our direct sales force.
Our diverse customer base includes medium-sized and large, global companies, as well as smaller organizations that primarily use our planning product. We have achieved significant growth in a relatively short period of time with a substantial amount of our growth coming from new customers. Our current financial focus is on growing our revenues and expanding our customer base. While we are incurring losses today, we strive to invest in a disciplined manner across all of our functional areas to sustain continued near-term revenue growth and support our long-term initiatives. Our operating expenses have increased significantly in absolute dollars in recent periods, primarily due to the significant growth of our employee population. We had approximately
10,500
and approximately
8,200
employees as of
January 31, 2019
and
2018
, respectively.
We intend to continue investing for long-term growth. We have invested, and expect to continue to invest, heavily in our product development efforts to deliver additional compelling applications and to address customers’ evolving needs. In addition, we plan to continue to expand our ability to sell our applications globally, particularly in Europe and Asia, by investing in product development and customer support to address the business needs of local markets, increasing our sales and marketing organizations, acquiring, building and/or leasing additional office space, and expanding our ecosystem of service partners to support local deployments. We expect to make further significant investments in our data center capacity as we plan for future growth. We are also investing in personnel to service our growing customer base.
We also regularly evaluate acquisitions or investment opportunities in complementary businesses, joint ventures, and intellectual property rights in an effort to expand our product and service offerings. We expect to continue to make such acquisitions and investments in the future, and we plan to reinvest a significant portion of our incremental revenue in future periods to grow our business and continue our leadership role in the industry. While we remain focused on improving operating margins, these acquisitions and investments will increase our costs on an absolute basis in the near-term. Many of these investments will occur in advance of experiencing any direct benefit from them and could make it difficult to determine if we are allocating our resources efficiently. We expect our product development, sales and marketing, and general and administrative expenses as a percentage of total revenues to decrease over time as we grow our revenues, and we anticipate that we will gain economies of scale by increasing our customer base without direct incremental development costs and by utilizing more of the capacity of our data centers.
Since inception, we have also invested heavily in our professional services organization to help ensure that customers successfully deploy and adopt our applications. Additionally, we continue to expand our professional service partner ecosystem to further support our customers. We believe our investment in professional services, as well as partners building consulting practices around Workday, will drive additional customer subscriptions and continued growth in revenues. Due to our ability to leverage the expanding partner ecosystem, we expect that the rate of professional services revenue growth will decline over time and continue to be lower than subscription revenue growth.
29
Components of Results of Operations
Revenues
We primarily derive our revenues from subscription services and professional services. Subscription services revenues primarily consist of fees that give our customers access to our cloud applications, which include related customer support. Professional services fees include deployment services, optimization services, and training.
Subscription services revenues accounted for
85%
of our total revenues during fiscal
2019
and represented 96% of our total unearned revenue as of
January 31, 2019
. Subscription services revenues are driven primarily by the number of customers, the number of workers at each customer, the specific applications subscribed to by each customer, and the price of our applications.
The mix of the applications to which a customer subscribes can affect our financial performance due to price differentials in our applications. Pricing for our applications varies based on many factors, including the complexity and maturity of the application and its acceptance in the marketplace. New products or services offerings by competitors in the future could also impact the mix and pricing of our offerings.
Subscription services revenues are recognized over time as they are delivered and consumed concurrently over the contractual term, beginning on the date our service is made available to the customer. Our subscription contracts typically have a term of three years or longer and are generally non-cancelable. We generally invoice our customers annually in advance. Amounts that have been invoiced are initially recorded as unearned revenue.
The majority of our consulting engagements are billed on a time and materials basis, and revenues are typically recognized over time as the services are performed. In some cases, we supplement our consulting teams by subcontracting resources from our service partners and deploying them on customer engagements. As our professional services organization and the Workday-related consulting practices of our partner firms continue to develop, we expect the partners to increasingly contract directly with our subscription customers. As a result of this trend, and the increase of our subscription services revenues, we expect professional services revenues as a percentage of total revenues to decline over time.
Costs and Expenses
Costs of subscription services revenues.
Costs of subscription services revenues consist primarily of employee-related expenses related to hosting our applications and providing customer support, the costs of data center capacity, and depreciation of computer equipment and software.
Costs of professional services revenues
. Costs of professional services revenues consist primarily of employee-related expenses associated with these services, the cost of subcontractors, and travel.
Product development
. Product development expenses consist primarily of employee-related costs. We continue to focus our product development efforts on adding new features and applications, increasing the functionality, and enhancing the ease of use of our cloud applications.
Sales and marketing.
Sales and marketing expenses consist primarily of employee-related costs, sales commissions, marketing programs, and travel. Marketing programs consist of advertising, events, corporate communications, brand building, and product marketing activities. Sales commissions are considered incremental costs of obtaining a contract with a customer and are deferred and amortized. Sales commissions for initial contracts are deferred and then amortized on a straight-line basis over a period of benefit that we have determined to be five years. Sales commissions for renewal contracts are deferred and then amortized on a straight-line basis over the related contractual renewal period.
General and administrative
. General and administrative expenses consist of employee-related costs for finance and accounting, legal, human resources, information systems personnel, professional fees, and other corporate expenses.
30
Results of Operations
Revenues
Our total revenues for fiscal
2019
,
2018
, and
2017
were as follows (in thousands, except percentages):
|
|
Year Ended January 31,
|
||||||||||||||||
|
|
2019
|
2018
|
2017
|
2018 to 2019
% Change |
2017 to 2018
% Change |
||||||||||||
|
*As Adjusted
|
|||||||||||||||||
|
Subscription services
|
$
|
2,385,769
|
|
$
|
1,787,833
|
|
$
|
1,290,733
|
|
33
|
%
|
39
|
%
|
||||
|
Professional services
|
436,411
|
|
355,217
|
|
283,707
|
|
23
|
%
|
25
|
%
|
|||||||
|
Total revenues
|
$
|
2,822,180
|
|
$
|
2,143,050
|
|
$
|
1,574,440
|
|
32
|
%
|
36
|
%
|
||||
|
*
|
See Note 1 of the notes to consolidated financial statements for further information.
|
Total revenues were
$2.8 billion
for fiscal
2019
, compared to
$2.1 billion
for fiscal
2018
,
an
increase
of
$0.7 billion
, or
32%
. Subscription services revenues were
$2.4 billion
for fiscal
2019
, compared to
$1.8 billion
for fiscal
2018
,
an
increase
of
$0.6 billion
, or
33%
. The
increase
in subscription revenues was due primarily to an increased number of customer contracts as compared to the prior year. Professional services revenues were
$436 million
for fiscal
2019
, compared to
$355 million
for fiscal
2018
,
an
increase
of
$81 million
, or
23%
. The
increase
in professional services revenues was due primarily to Workday performing deployment and integration services for a greater number of customers than in the prior year period.
Total revenues were
$2.1 billion
for fiscal
2018
, compared to
$1.6 billion
for fiscal
2017
,
an
increase
of
$0.5 billion
, or
36%
. Subscription services revenues were
$1.8 billion
for fiscal
2018
, compared to
$1.3 billion
for fiscal
2017
,
an
increase
of
$0.5 billion
, or
39%
. The
increase
in subscription revenues was due primarily to an increased number of customer contracts as compared to the prior year. Professional services revenues were
$0.4 billion
for fiscal
2018
, compared to
$0.3 billion
for fiscal
2017
,
an
increase
of
$0.1 billion
, or
25%
. The
increase
in professional services revenues was due primarily to the addition of new customers and a greater number of customers requesting deployment and integration services.
Operating Expenses
GAAP operating expenses were
$3.3 billion
for fiscal
2019
, compared to
$2.4 billion
for fiscal
2018
,
an
increase
of
$0.9 billion
, or
34%
. The
increase
was primarily due to increases of $0.6 billion in employee-related costs driven by higher headcount and $0.1 billion in expenses related to facilities, IT, depreciation, amortization, and service contracts to expand data center capacity. These increases are partially attributable to the acquisition of Adaptive Insights and include one-time transaction and integration-related costs.
GAAP operating expenses were
$2.4 billion
for fiscal
2018
, compared to
$1.9 billion
for fiscal
2017
,
an
increase
of
$0.5 billion
, or
27%
. The
increase
was primarily due to increases of $0.4 billion in employee-related costs driven by higher headcount and $0.1 billion in expenses related to facilities, IT, depreciation, amortization, and service contracts to expand data center capacity.
We use the non-GAAP financial measure of non-GAAP operating expenses to understand and compare operating results across accounting periods, for internal budgeting and forecasting purposes, for short- and long-term operating plans, and to evaluate our financial performance. We believe that non-GAAP operating expenses reflect our ongoing business in a manner that allows for meaningful period-to-period comparisons and analysis of trends in our business, as they exclude expenses that are not reflective of ongoing operating results. We also believe that non-GAAP operating expenses provide useful information to investors and others in understanding and evaluating our operating results and prospects in the same manner as management and in comparing financial results across accounting periods and to those of peer companies.
Non-GAAP operating expenses are calculated by excluding share-based compensation expenses, and certain other expenses, which consist of employer payroll tax-related items on employee stock transactions and amortization of acquisition-related intangible assets.
Non-GAAP operating expenses were
$2.5 billion
for fiscal
2019
, compared to
$1.9 billion
for fiscal
2018
,
an
increase
of
$0.6 billion
, or
31%
. The
increase
was primarily due to increases of $0.4 billion in employee-related costs driven by higher headcount and $0.1 billion in expenses related to facilities, IT, depreciation, amortization, and service contracts to expand data center capacity. These increases are partially attributable to the acquisition of Adaptive Insights and include one-time transaction and integration-related costs.
Non-GAAP operating expenses were
$1.9 billion
for fiscal
2018
, compared to
$1.5 billion
for fiscal
2017
,
an
increase
of
$0.4 billion
, or
27%
. The
increase
was primarily due to increases of $0.3 billion in employee-related costs driven by higher headcount and $0.1 billion in expenses related to facilities, IT, depreciation, amortization, and service contracts to expand data center capacity.
31
Reconciliations of our GAAP to non-GAAP operating expenses were as follows (in thousands):
|
|
Year Ended January 31, 2019
|
||||||||||||||
|
|
GAAP Operating Expenses
|
Share-Based
Compensation Expenses (1) |
Other
Operating Expenses (2) |
Non-GAAP Operating Expenses
(3)
|
|||||||||||
|
Costs of subscription services
|
$
|
379,877
|
|
$
|
(36,754
|
)
|
$
|
(31,395
|
)
|
$
|
311,728
|
|
|||
|
Costs of professional services
|
455,073
|
|
(55,535
|
)
|
(3,653
|
)
|
395,885
|
|
|||||||
|
Product development
|
1,211,832
|
|
(320,876
|
)
|
(21,230
|
)
|
869,726
|
|
|||||||
|
Sales and marketing
|
891,345
|
|
(132,810
|
)
|
(19,725
|
)
|
738,810
|
|
|||||||
|
General and administrative
|
347,337
|
|
(127,443
|
)
|
(5,120
|
)
|
214,774
|
|
|||||||
|
Total costs and expenses
|
$
|
3,285,464
|
|
$
|
(673,418
|
)
|
$
|
(81,123
|
)
|
$
|
2,530,923
|
|
|||
|
|
Year Ended January 31, 2018
|
||||||||||||||
|
|
GAAP Operating Expenses
|
Share-Based
Compensation Expenses (1) |
Other
Operating Expenses (2) |
Non-GAAP Operating Expenses
(3)
|
|||||||||||
|
Costs of subscription services
|
$
|
273,461
|
|
$
|
(26,280
|
)
|
$
|
(7,043
|
)
|
$
|
240,138
|
|
|||
|
Costs of professional services
|
355,952
|
|
(37,592
|
)
|
(2,045
|
)
|
316,315
|
|
|||||||
|
Product development
|
910,584
|
|
(229,819
|
)
|
(23,128
|
)
|
657,637
|
|
|||||||
|
Sales and marketing
|
683,367
|
|
(100,762
|
)
|
(4,567
|
)
|
578,038
|
|
|||||||
|
General and administrative
|
222,909
|
|
(83,972
|
)
|
(3,614
|
)
|
135,323
|
|
|||||||
|
Total costs and expenses
|
$
|
2,446,273
|
|
$
|
(478,425
|
)
|
$
|
(40,397
|
)
|
$
|
1,927,451
|
|
|||
|
|
Year Ended January 31, 2017
|
||||||||||||||
|
|
GAAP Operating Expenses
|
Share-Based
Compensation Expenses (1) |
Other
Operating Expenses (2) |
Non-GAAP Operating Expenses
(3)
|
|||||||||||
|
*As Adjusted
|
*As Adjusted
|
||||||||||||||
|
Costs of subscription services
|
$
|
213,389
|
|
$
|
(20,773
|
)
|
$
|
(730
|
)
|
$
|
191,886
|
|
|||
|
Costs of professional services
|
270,156
|
|
(26,833
|
)
|
(1,199
|
)
|
242,124
|
|
|||||||
|
Product development
|
680,531
|
|
(166,529
|
)
|
(18,533
|
)
|
495,469
|
|
|||||||
|
Sales and marketing
|
565,328
|
|
(86,229
|
)
|
(3,316
|
)
|
475,783
|
|
|||||||
|
General and administrative
|
198,122
|
|
(78,265
|
)
|
(3,302
|
)
|
116,555
|
|
|||||||
|
Total costs and expenses
|
$
|
1,927,526
|
|
$
|
(378,629
|
)
|
$
|
(27,080
|
)
|
$
|
1,521,817
|
|
|||
|
(1)
|
Share-based compensation expenses were
$673 million
,
$478 million
, and
$379 million
for fiscal
2019
,
2018
, and
2017
, respectively. The increase in share-based compensation expenses was primarily due to assumed Adaptive Insights awards and grants of RSUs to existing and new employees.
|
|
(2)
|
Other operating expenses include employer payroll tax-related items on employee stock transactions of $32 million, $21 million, and $14 million for fiscal
2019
,
2018
, and
2017
, respectively. In addition, other operating expenses include amortization of acquisition-related intangible assets of $49 million, $19 million, and $13 million for fiscal
2019
,
2018
, and
2017
, respectively.
|
|
(3)
|
See “Non-GAAP Financial Measures” below for further information.
|
|
*
|
See Note 1 of the notes to consolidated financial statements for further information.
|
Costs of Subscription Services
GAAP operating expenses in costs of subscription services were
$380 million
for fiscal
2019
, compared to
$273 million
for fiscal
2018
,
an
increase
of
$107 million
, or
39%
. The
increase
was primarily due to increases of $33 million in employee-related costs driven by higher headcount, $24 million in amortization expense for our acquisition-related intangible assets, $22 million in third-party costs for hardware maintenance and data center capacity, and $19 million in depreciation expense related to our data centers.
32
GAAP operating expenses in costs of subscription services were
$273 million
for fiscal
2018
, compared to
$213 million
for fiscal
2017
,
an
increase
of
$60 million
, or
28%
. The
increase
was primarily due to increases of $23 million in depreciation expense related to our data centers, $22 million in employee-related costs driven by higher headcount, and $10 million in facility and IT-related expenses.
Non-GAAP operating expenses in costs of subscription services were
$312 million
for fiscal
2019
, compared to
$240 million
for fiscal
2018
,
an
increase
of
$72 million
, or
30%
. The
increase
was primarily due to increases of $22 million in employee-related costs driven by higher headcount, $22 million in third-party costs for hardware maintenance and data center capacity, and $19 million in depreciation expense related to our data centers.
Non-GAAP operating expenses in costs of subscription services were
$240 million
for fiscal
2018
, compared to
$192 million
for fiscal
2017
,
an
increase
of
$48 million
, or
25%
. The
increase
was primarily due to increases of $17 million in depreciation expense related to our data centers, $16 million in employee-related costs driven by higher headcount, and $10 million in facility and IT-related expenses.
We expect that GAAP and non-GAAP operating expenses in costs of subscription services will continue to increase in absolute dollars as we improve and expand our data center capacity and operations.
Costs of Professional Services
GAAP operating expenses in costs of professional services were
$455 million
for fiscal
2019
, compared to
$356 million
for fiscal
2018
,
an
increase
of
$99 million
, or
28%
. The
increase
was primarily due to increases of $86 million to staff our deployment and integration engagements.
GAAP operating expenses in costs of professional services were
$356 million
for fiscal
2018
, compared to
$270 million
for fiscal
2017
,
an
increase
of
$86 million
, or
32%
. The
increase
was primarily due to increases of $70 million to staff our deployment and integration engagements.
Non-GAAP operating expenses in costs of professional services were
$396 million
for fiscal
2019
, compared to
$316 million
for fiscal
2018
,
an
increase
of
$80 million
, or
25%
. The
increase
was primarily due to increases of $66 million to staff our deployment and integration engagements.
Non-GAAP operating expenses in costs of professional services were
$316 million
for fiscal
2018
, compared to
$242 million
for fiscal
2017
,
an
increase
of
$74 million
, or
31%
. The
increase
was primarily due to increases of $59 million to staff our deployment and integration engagements.
Going forward, we expect GAAP and non-GAAP costs of professional services as a percentage of total revenues to continue to decline as we continue to rely on our service partners to deploy our applications and as the number of our customers continues to grow. For fiscal 2020, we anticipate GAAP and non-GAAP professional services margins to be lower than fiscal
2019
as we invest in programs to ensure ongoing customer success.
Product Development
GAAP operating expenses in product development were
$1.2 billion
for fiscal
2019
, compared to
$911 million
for fiscal
2018
,
an
increase
of
$301 million
, or
33%
. The
increase
was primarily due to increases of $267 million in employee-related costs due to higher headcount and $26 million in facility and IT-related expenses.
GAAP operating expenses in product development were
$911 million
for fiscal
2018
, compared to
$681 million
for fiscal
2017
,
an
increase
of
$230 million
, or
34%
. The
increase
was primarily due to increases of $180 million in employee-related costs due to higher headcount, $34 million in facility and IT-related expenses, and $15 million in third-party costs for hardware maintenance and data center capacity.
Non-GAAP operating expenses in product development were
$870 million
for fiscal
2019
, compared to
$658 million
for fiscal
2018
,
an
increase
of
$212 million
, or
32%
. The
increase
was primarily due to increases of $170 million in employee-related costs due to higher headcount and $26 million in facility and IT-related expenses.
Non-GAAP operating expenses in product development were
$658 million
for fiscal
2018
, compared to
$495 million
for fiscal
2017
,
an
increase
of
$163 million
, or
33%
. The
increase
was primarily due to increases of $113 million in employee-related costs due to higher headcount, $34 million in facility and IT-related expenses, and $15 million in third-party costs for hardware maintenance and data center capacity.
We expect that GAAP and non-GAAP product development expenses will continue to increase in absolute dollars as we improve and extend our applications and develop new technologies.
33
Sales and Marketing
GAAP operating expenses in sales and marketing were
$891 million
for fiscal
2019
, compared to
$683 million
for fiscal
2018
,
an
increase
of
$208 million
, or
30%
. The
increase
was primarily due to increases of $147 million in employee-related costs due to higher headcount and higher commissionable sales volume, $20 million in advertising, marketing, and event costs, $13 million in travel, and $11 million in facility and IT-related expenses.
GAAP operating expenses in sales and marketing were
$683 million
for fiscal
2018
, compared to
$565 million
for fiscal
2017
,
an
increase
of
$118 million
, or
21%
. The
increase
was primarily due to increases of $87 million in employee-related costs due to higher headcount and higher commissionable sales volume, $14 million in advertising, marketing, and event costs, and $11 million in facility and IT-related expenses.
Non-GAAP operating expenses in sales and marketing were
$739 million
for fiscal
2019
, compared to
$578 million
for fiscal
2018
,
an
increase
of
$161 million
, or
28%
. The
increase
was primarily due to increases of $114 million in employee-related costs due to higher headcount and higher commissionable sales volume, $20 million in advertising, marketing, and event costs, $13 million in travel, and $11 million in facility and IT-related expenses.
Non-GAAP operating expenses in sales and marketing were
$578 million
for fiscal
2018
, compared to
$476 million
for fiscal
2017
,
an
increase
of
$102 million
, or
21%
. The
increase
was primarily due to increases of $71 million in employee-related costs due to higher headcount and higher commissionable sales volume, $14 million in advertising, marketing, and event costs, and $11 million in facility and IT-related expenses.
We expect that GAAP and non-GAAP sales and marketing expenses will continue to increase in absolute dollars as we continue to invest in the expansion of our domestic and international selling and marketing activities to build brand awareness and attract new customers.
General and Administrative
GAAP operating expenses in general and administrative were
$347 million
for fiscal
2019
, compared to
$223 million
for fiscal
2018
,
an
increase
of
$124 million
, or
56%
. The
increase
was primarily due to additional employee-related costs driven by higher headcount and one-time transaction and integration-related costs due to the acquisition of Adaptive Insights.
GAAP operating expenses in general and administrative were
$223 million
for fiscal
2018
, compared to
$198 million
for fiscal
2017
,
an
increase
of
$25 million
, or
13%
. The
increase
was primarily due to $20 million in higher employee-related costs due to higher headcount, and $3 million in higher professional services costs including consulting, legal, and audit.
Non-GAAP operating expenses in general and administrative were
$215 million
for fiscal
2019
, compared to
$135 million
for fiscal
2018
,
an
increase
of
$80 million
, or
59%
. The
increase
was primarily due to increases in outside services expenses, additional employee-related costs driven by higher headcount, and one-time transaction and integration-related costs due to the acquisition of Adaptive Insights.
Non-GAAP operating expenses in general and administrative were
$135 million
for fiscal
2018
, compared to
$117 million
for fiscal
2017
,
an
increase
of
$18 million
, or
15%
. The
increase
was primarily due to $14 million in higher employee-related costs due to higher headcount, and $3 million in higher professional services costs including consulting, legal, and audit.
We expect GAAP and non-GAAP general and administrative expenses will continue to increase in absolute dollars as we further invest in our infrastructure and support our global expansion.
Operating Margins
GAAP operating margins
declined
from
(14.1)%
for fiscal
2018
to
(16.4)%
for fiscal
2019
. The
reduction
in our GAAP operating margin was primarily due to higher share-based compensation and other operating expenses related to the Adaptive Insights acquisition, including one-time transaction and integration-related costs, offset by higher revenues.
GAAP operating margins
improved
from
(22.4)%
for fiscal
2017
to
(14.1)%
for fiscal
2018
. The
improvement
in our GAAP operating margin was primarily due to higher subscription services revenues, higher professional services revenues, and improvements in operating leverage.
We use the non-GAAP financial measure of non-GAAP operating margins to understand and compare operating results across accounting periods, for internal budgeting and forecasting purposes, for short- and long-term operating plans, and to evaluate our financial performance. We believe that non-GAAP operating margins reflect our ongoing business in a manner that allows for meaningful period-to-period comparisons and analysis of trends in our business, as they exclude expenses that are not reflective of ongoing operating results. We also believe that non-GAAP operating margins provide useful information to investors and others in understanding and evaluating our operating results and prospects in the same manner as management and in comparing financial results across accounting periods and to those of peer companies.
34
Non-GAAP operating margins are calculated using GAAP revenues and non-GAAP operating expenses. See “Non-GAAP Financial Measures” below for further information.
Non-GAAP operating margins
improved
from
10.1%
for fiscal
2018
to
10.3%
for fiscal
2019
. The
improvement
in our non-GAAP operating margin was primarily due to higher revenues, offset by higher operating expenses related to the Adaptive Insights acquisition, including one-time transaction and integration-related costs.
Non-GAAP operating margins
improved
from
3.3%
for fiscal
2017
to
10.1%
for fiscal
2018
. The
improvement
in our non-GAAP operating margin was primarily due to higher subscription services revenues, higher professional services revenues, and improvements in operating leverage.
Reconciliations of our GAAP to non-GAAP operating margins were as follows:
|
|
Year Ended January 31, 2019
|
||||||||||
|
|
GAAP Operating Expenses
|
Share-Based
Compensation Expenses |
Other
Operating Expenses |
Non-GAAP Operating Expenses
(1)
|
|||||||
|
Operating margin
|
(16.4
|
)%
|
23.8
|
%
|
2.9
|
%
|
10.3
|
%
|
|||
|
|
Year Ended January 31, 2018
|
||||||||||
|
|
GAAP Operating Expenses
|
Share-Based
Compensation Expenses |
Other
Operating Expenses |
Non-GAAP Operating Expenses
(1)
|
|||||||
|
Operating margin
|
(14.1
|
)%
|
22.3
|
%
|
1.9
|
%
|
10.1
|
%
|
|||
|
|
Year Ended January 31, 2017
|
||||||||||
|
|
GAAP Operating Expenses
|
Share-Based
Compensation Expenses |
Other
Operating Expenses |
Non-GAAP Operating Expenses
(1)
|
|||||||
|
*As Adjusted
|
*As Adjusted
|
||||||||||
|
Operating margin
|
(22.4
|
)%
|
24.0
|
%
|
1.7
|
%
|
3.3
|
%
|
|||
|
(1)
|
See “Non-GAAP Financial Measures” below for further information.
|
|
*
|
See Note 1 of the notes to consolidated financial statements for further information.
|
Other Income (Expense), Net
Other income (expense), net was
$40 million
,
$(12) million
, and
$(32) million
for fiscal
2019
,
2018
, and
2017
, respectively.
The
increase
in other
income
, net for fiscal
2019
compared to fiscal
2018
was caused by an increase in other income of
$50 million
primarily related to the net gain from our equity investments and an increase in interest income of
$17 million
. This was offset by an increase in interest expense of
$16 million
primarily related to the 0.25% convertible senior notes issued in September 2017.
The
decrease
in other
expense
, net for fiscal
2018
compared to fiscal
2017
was caused by an increase in interest income of $14 million, a decrease in non-marketable equity investment impairment of $14 million, and an increase in other income of $6 million, partially offset by an increase in interest expense of $14 million.
Liquidity and Capital Resources
As of
January 31, 2019
, our principal sources of liquidity were cash, cash equivalents, and marketable securities totaling
$1.8 billion
, which were primarily held for working capital purposes. Our cash equivalents and marketable securities are composed primarily of U.S. treasury securities, U.S. agency obligations, corporate bonds, commercial paper, and money market funds.
We have financed our operations primarily through customer payments, sales of equity securities, and issuance of debt. Our future capital requirements will depend on many factors, including our customer growth rate, subscription renewal activity, the timing of construction of facilities in Pleasanton, California and the acquisition of additional facilities, the timing and extent of development efforts, the expansion of sales and marketing activities, the introduction of new and enhanced services offerings, the continuing market acceptance of our services, and acquisition activities. We may enter into arrangements to acquire or invest in complementary businesses, services, technologies, or intellectual property rights in the future. We also may choose to seek additional equity or debt financing.
35
Our cash flows for fiscal
2019
,
2018
, and
2017
were as follows (in thousands):
|
|
Year Ended January 31,
|
||||||||||
|
|
2019
|
2018
|
2017
|
||||||||
|
*As Adjusted
|
|||||||||||
|
Net cash provided by (used in):
|
|||||||||||
|
Operating activities
|
$
|
606,658
|
|
$
|
465,727
|
|
$
|
350,626
|
|
||
|
Investing activities
|
(842,784
|
)
|
(978,980
|
)
|
(168,885
|
)
|
|||||
|
Financing activities
|
(256,711
|
)
|
1,106,262
|
|
59,681
|
|
|||||
|
Effect of exchange rate changes
|
(614
|
)
|
751
|
|
385
|
|
|||||
|
Net increase (decrease) in cash, cash equivalents, and restricted cash
|
$
|
(493,451
|
)
|
$
|
593,760
|
|
$
|
241,807
|
|
||
|
*
|
See Note 1 of the notes to consolidated financial statements for further information.
|
Operating Activities
Cash provided by operating activities was
$607 million
,
$466 million
, and
$351 million
for fiscal
2019
,
2018
, and
2017
, respectively. The improvements in cash flows provided by operating activities in both fiscal
2019
and
2018
compared to prior fiscal years resulted primarily from increased sales and the related cash collections, partially offset by higher operating expenses driven by increased headcount.
Investing Activities
Cash used in investing activities for fiscal
2019
was
$843 million
, which was primarily the result of a net cash outflow of $1.4 billion related to the Adaptive Insights acquisition, capital expenditures for data center and office space projects of
$203 million
, capital expenditures related to the construction of our development center of $160 million, and purchases of non-marketable equity and other investments of
$43 million
. These payments were partially offset by the timing of purchases and maturities of marketable securities, proceeds of
$950 million
from the sale of marketable securities, and proceeds of
$18 million
from the sales and maturities of non-marketable equity and other investments. The sale of marketable securities during fiscal 2019 was primarily to fund the Adaptive Insights acquisition.
Cash used in investing activities for fiscal
2018
was
$979 million
, which was primarily the result of the timing of purchases and maturities of marketable securities, capital expenditures for owned real estate projects (including construction of our development center) of
$125 million
, capital expenditures for data center and office space projects of
$142 million
, purchases of non-marketable equity and other investments of
$16 million
, purchases of other non-acquisition related intangible assets of
$11 million
, and a net cash outflow of
$6 million
related to an acquisition. These payments were partially offset by proceeds of
$244 million
from the sale of marketable securities.
Cash used in investing activities for fiscal
2017
was
$169 million
, which was primarily the result of the timing of purchases and maturities of marketable securities, a net cash outflow of
$148 million
related to acquisitions, purchases of office buildings and land in Pleasanton, California for $62 million, capital expenditures for owned real estate projects (including construction of our development center) of $45 million, and capital expenditures for data center and office space projects of
$121 million
. These payments were partially offset by proceeds of
$133 million
from the sale of marketable securities and
$5 million
from the sales and maturities of non-marketable equity and other investments.
We expect capital expenditures related to owned real estate projects, including construction of our development center, will be approximately $130 million for fiscal
2020
. We expect capital expenditures, excluding owned real estate projects, will be approximately $280 million for fiscal
2020
. We expect that these capital outlays will largely be used to expand the infrastructure of our data centers and to build out additional office space to support our growth.
Financing Activities
For fiscal
2019
, cash used in financing activities was
$257 million
, which was primarily due to the principal payment of $350 million of 0.75% convertible senior notes, offset by
$94 million
of proceeds from the issuance of common stock from employee equity plans.
For fiscal
2018
, cash provided by financing activities was
$1.1 billion
, which was primarily due to the issuance of $1.15 billion principal amount of 0.25% convertible senior notes due October 1, 2022, net of issuance costs of $18 million, and the related sale of warrants for $81 million and purchase of note hedges for $176 million. For further information, see Note 11 of the notes to consolidated financial statements. In addition, cash flows from financing activities included
$69 million
of proceeds from the issuance of common stock from employee equity plans.
36
For fiscal
2017
, cash provided by financing activities was
$60 million
, primarily as a result of
$58 million
of proceeds from the issuance of common stock from employee equity plans.
Non-GAAP Financial Measures
Regulation S-K Item 10(e), “Use of non-GAAP financial measures in Commission filings,” defines and prescribes the conditions for use of non-GAAP financial information. Our measures of non-GAAP operating expenses and non-GAAP operating margin meet the definition of a non-GAAP financial measure.
Non-GAAP Operating Expenses and Non-GAAP Operating Margins
We define non-GAAP operating expenses as our total operating expenses excluding the following components, which we believe are not reflective of our ongoing operational expenses. Similarly, the same components are also excluded from the calculation of non-GAAP operating margins. In each case, for the reasons set forth below, management believes that excluding the component provides useful information to investors and others in understanding and evaluating our operating results and prospects in the same manner as management, in comparing financial results across accounting periods and to those of peer companies, and to better understand the long-term performance of our core business.
|
•
|
Share-Based Compensation Expenses.
Although share-based compensation is an important aspect of the compensation of our employees and executives, management believes it is useful to exclude share-based compensation expenses to better understand the long-term performance of our core business and to facilitate comparison of our results to those of peer companies. Share-based
compensation expenses are determined using a number of factors, including our stock price, volatility, and forfeiture rates that are beyond our control and generally unrelated to operational decisions and performance in any particular period. Further, share-based compensation expenses are not reflective of the value ultimately received by the grant recipients.
|
|
•
|
Other Operating Expenses.
Other operating expenses includes employer payroll tax-related items on employee stock transactions and amortization of acquisition-related intangible assets. The amount of employer payroll tax-related items on employee stock transactions is dependent on our stock price and other factors that are beyond our control and do not correlate to the operation of the business. For business combinations, we generally allocate a portion of the purchase price to intangible assets. The amount of the allocation is based on estimates and assumptions made by management and is subject to amortization. The amount of purchase price allocated to intangible assets and the term of its related amortization can vary significantly and are unique to each acquisition and thus we do not believe it is reflective of our ongoing operations.
|
Limitations on the Use of Non-GAAP Financial Measures
A limitation of our non-GAAP financial measures of non-GAAP operating expenses and non-GAAP operating margin is that they do not have uniform definitions. Our definitions will likely differ from the definitions used by other companies, including peer companies, and therefore comparability may be limited. Further, the non-GAAP financial measure of non-GAAP operating expenses has certain limitations because it does not reflect all items of expense that affect our operations and are reflected in the GAAP financial measure of total operating expenses. In the case of share-based compensation, if we did not pay out a portion of compensation in the form of share-based compensation and related employer payroll tax-related items, the cash salary expense included in costs of revenues and operating expenses would be higher, which would affect our cash position.
We compensate for these limitations by reconciling the non-GAAP financial measures to the most comparable GAAP financial measures. These non-GAAP financial measures should be considered in addition to, not as a substitute for or in isolation from, measures prepared in accordance with GAAP. We encourage investors and others to review our financial information in its entirety, not to rely on any single financial measure, and to view our non-GAAP financial measures in conjunction with the most comparable GAAP financial measures.
See Results of Operations—Operating Expenses and Results of Operations—Operating Margins for reconciliations from the most directly comparable GAAP financial measures, GAAP operating expenses and GAAP operating margins, to the non-GAAP financial measures, non-GAAP operating expenses and non-GAAP operating margins, for fiscal
2019
,
2018
, and
2017
.
37
Contractual Obligations
The following table summarizes our consolidated principal contractual cash obligations as of
January 31, 2019
(in thousands):
|
|
Payments Due by Period
|
||||||||||||||||||
|
|
Total
|
Less than 1 Year
|
1-3 Years
|
3-5 Years
|
More than 5 Years
|
||||||||||||||
|
1.50% Convertible Senior Notes due 2020
(1)
|
$
|
250,000
|
|
$
|
—
|
|
$
|
250,000
|
|
$
|
—
|
|
$
|
—
|
|
||||
|
0.25% Convertible Senior Notes due 2022
(1)
|
1,150,000
|
|
—
|
|
—
|
|
1,150,000
|
|
—
|
|
|||||||||
|
Aggregate interest obligation
(2)
|
16,008
|
|
6,625
|
|
7,458
|
|
1,925
|
|
—
|
|
|||||||||
|
Operating lease obligations:
|
|||||||||||||||||||
|
Facilities space, not including related party
(3)
|
273,906
|
|
64,364
|
|
95,916
|
|
60,173
|
|
53,453
|
|
|||||||||
|
Facilities space with related party
|
90,619
|
|
12,972
|
|
32,740
|
|
31,297
|
|
13,610
|
|
|||||||||
|
Computing infrastructure platform obligations
|
77,667
|
|
10,667
|
|
28,000
|
|
39,000
|
|
—
|
|
|||||||||
|
Contractual commitments
|
77,399
|
|
18,479
|
|
25,498
|
|
33,422
|
|
—
|
|
|||||||||
|
Total
|
$
|
1,935,599
|
|
$
|
113,107
|
|
$
|
439,612
|
|
$
|
1,315,817
|
|
$
|
67,063
|
|
||||
|
(1)
|
Represents aggregate principal amount of the Notes, without the effect of associated discounts.
|
|
(2)
|
Represents estimated aggregate interest obligations for our outstanding Notes that are payable in cash.
|
|
(3)
|
For the 95-year lease we entered in January 2014, the cash obligations exclude the potential annual rental increases based on the increases to the Consumer Price Index (“CPI”). We believe it is likely we will make higher rent payments over the lease term due to future changes in the CPI.
|
Our contractual obligations primarily consist of our convertible senior notes, as well as obligations under leases for office space, co-location facilities for data center capacity, and computing infrastructure platforms for business operations. For fiscal
2020
, we anticipate leasing additional office space near our headquarters and in various other locations around the world to support our growth. In addition, our existing lease agreements often provide us with an option to renew. We expect our future operating lease obligations will increase as we expand our operations.
We are not required to make principal payments under the Notes prior to maturity. If the Notes are not converted to Class A common stock prior to their maturity dates, we are required to repay $250 million in principal on July 15, 2020 and $1.15 billion in principal on October 1, 2022. We are also required to make interest payments on a semi-annual basis at the interest rates described in Note 11 of the notes to the consolidated financial statements.
In January 2014, we entered into a 95-year lease for a 6.9 acre parcel of land in Pleasanton, California, under which we paid $2 million for base rent from commencement through December 31, 2020. Annual rent payments of $0.2 million plus increases based on increases in the CPI begin on January 1, 2021 and continue through the end of the lease. Our new development center, consisting of approximately 410,000 square feet of office space, is being constructed on this property. The agreement with the contractor for the construction of the development center is not included in the table above because it allows for termination without significant penalty.
Purchase orders are not included in the table above. Our purchase orders represent authorizations to purchase rather than binding agreements. The contractual obligation amounts in the table above are associated with agreements that are enforceable and legally binding and that specify all significant terms, including fixed or minimum services to be used, fixed, minimum or variable price provisions, and the approximate timing of the transaction. Obligations under contracts that we can cancel without a significant penalty are not included in the table above.
Off-Balance Sheet Arrangements
Through
January 31, 2019
, we did not have any relationships with unconsolidated organizations or financial partnerships, such as structured finance or special purpose entities, that would have been established for the purpose of facilitating off-balance sheet arrangements or other contractually narrow or limited purposes.
38
Critical Accounting Policies and Estimates
Our consolidated financial statements are prepared in accordance with accounting principles generally accepted in the United States. The preparation of these consolidated financial statements requires us to make estimates and assumptions that affect the reported amounts of assets, liabilities, revenues, costs and expenses, and related disclosures. On an ongoing basis, we evaluate our estimates and assumptions. Our actual results may differ from these estimates under different assumptions or conditions.
We believe that of our significant accounting policies, which are described in Note 2 of the notes to the consolidated financial statements, the following accounting policies involve a greater degree of judgment and complexity. Accordingly, these are the policies we believe are the most critical to aid in fully understanding and evaluating our consolidated financial condition and results of operations.
Revenue Recognition
We derive our revenues primarily from subscription services and professional services. Revenues are recognized when control of these services is transferred to our customers, in an amount that reflects the consideration we expect to be entitled to in exchange for those services.
We determine revenue recognition through the following steps:
|
•
|
Identification of the contract, or contracts, with a customer
|
|
•
|
Identification of the performance obligations in the contract
|
|
•
|
Determination of the transaction price
|
|
•
|
Allocation of the transaction price to the performance obligations in the contract
|
|
•
|
Recognition of revenue when, or as, we satisfy a performance obligation
|
Subscription Services Revenues
Subscription services revenues primarily consist of fees that provide customers access to one or more of our cloud applications for finance, human resources, planning, and analytics, with routine customer support. Revenue is generally recognized over time on a ratable basis over the contract term beginning on the date that our service is made available to the customer. Our subscription contracts are generally three years or longer in length, billed annually in advance, and non-cancelable.
Professional Services Revenues
Professional services revenues primarily consist of fees for deployment and optimization services, as well as training. The majority of our consulting contracts are billed on a time and materials basis and revenue is recognized over time as the services are performed. For contracts billed on a fixed price basis, revenue is recognized over time based on the proportion performed.
Contracts with Multiple Performance Obligations
Some of our contracts with customers contain multiple performance obligations. For these contracts, we account for individual performance obligations separately if they are distinct. The transaction price is allocated to the separate performance obligations on a relative standalone selling price basis. We determine the standalone selling prices based on our overall pricing objectives, taking into consideration market conditions and other factors, including the value of our contracts, the cloud applications sold, customer demographics, geographic locations, and the number and types of users within our contracts.
Deferred Commissions
Sales commissions earned by our sales force are considered incremental and recoverable costs of obtaining a contract with a customer. Sales commissions for initial contracts are deferred and then amortized on a straight-line basis over a period of benefit that we have determined to be five years. We determined the period of benefit by taking into consideration our customer contracts, our technology, and other factors. Sales commissions for renewal contracts are deferred and then amortized on a straight-line basis over the related contractual renewal period. Amortization expense is included in Sales and marketing expenses on the consolidated statements of operations.
39
Convertible Senior Notes
In June 2013, we issued
0.75%
convertible senior notes due July 15, 2018 (“2018 Notes”) with a principal amount of
$350 million
, which were subsequently converted by note holders during the second quarter of fiscal 2019. Concurrently in June 2013, we issued
1.50%
convertible senior notes due July 15, 2020 (“2020 Notes”) with a principal amount of
$250 million
. In September 2017, we issued
0.25%
convertible senior notes due October 1, 2022 (“2022 Notes”) with a principal amount of
$1.15 billion
(together with the 2018 Notes and 2020 Notes, referred to as the “Notes”). In accounting for the issuance of the Notes, we separated each of the Notes into liability and equity components. The carrying amounts of the liability components were calculated by measuring the fair value of similar liabilities that do not have associated convertible features. The carrying amount of the equity components representing the conversion option were determined by deducting the fair value of the liability components from the par value of the respective Notes. These differences represent debt discounts that are amortized to interest expense over the respective terms of the Notes using the effective interest rate method. The equity components are not remeasured as long as they continue to meet the conditions for equity classification. In accounting for the issuance costs related to the Notes, we allocated the total amount of issuance costs incurred to the liability and equity components based on their relative values. Issuance costs attributable to the liability components are being amortized on a straight-line basis, which approximates the effective interest rate method, to interest expense over the respective terms of the Notes. The issuance costs attributable to the equity components were netted against the respective equity components in Additional paid-in capital.
Business Combinations, Goodwill, and Acquisition-Related Intangible Assets
Accounting for business combinations requires us to make significant estimates and assumptions. We allocate the purchase consideration to the tangible and intangible assets acquired and liabilities assumed based on their estimated fair values, with the excess recorded to goodwill. Critical estimates in valuing certain intangible assets include, but are not limited to, future expected cash flows, expected asset lives, royalty rates, and discount rates. The amounts and useful lives assigned to acquisition-related intangible assets impact the amount and timing of future amortization expense.
We use estimates, assumptions, and judgments when assessing the recoverability of goodwill and acquisition-related intangible assets. We test for impairment on an annual basis, or more frequently if a significant event or circumstance indicates impairment. We also evaluate the estimated remaining useful lives of acquisition-related intangible assets for changes in circumstances that warrant a revision to the remaining periods of amortization.
Recent Accounting Pronouncements
See Note 2 of the notes to consolidated financial statements for a full description of recent accounting pronouncements.
40
ITEM 7A. QUANTITATIVE AND QUALITATIVE DISCLOSURES ABOUT MARKET RISK
Foreign Currency Exchange Risk
We transact business globally in multiple currencies. As a result, our results of operations and cash flows are subject to fluctuations due to changes in foreign currency exchange rates. As of
January 31, 2019
and
2018
, our most significant currency exposures were the euro, British pound, Canadian dollar, and Australian dollar.
Due to our exposure to market risks that may result from changes in foreign currency exchange rates, we enter into foreign currency derivative hedging transactions to mitigate these risks. For further information, see Note 10 of the notes to consolidated financial statements.
Interest Rate Sensitivity
We had cash, cash equivalents, and marketable securities totaling
$1.8 billion
and
$3.3 billion
as of
January 31, 2019
and
2018
, respectively. Cash equivalents and marketable securities were invested primarily in U.S. treasury securities, U.S. agency obligations, corporate bonds, commercial paper, and money market funds. The cash, cash equivalents, and marketable securities are held primarily for working capital purposes. Our investment portfolios are managed to preserve capital and meet liquidity needs. We do not enter into investments for trading or speculative purposes.
Our cash equivalents and our portfolio of debt securities are subject to market risk due to changes in interest rates. Fixed rate securities may have their market value adversely affected due to a rise in interest rates, while floating rate securities may produce less income than expected if interest rates fall. Due in part to these factors, our future investment income may fluctuate due to changes in interest rates or we may suffer losses in principal if we are forced to sell securities that decline in market value due to changes in interest rates. However, because we classify our debt securities as “available for sale,” no gains or losses are recognized in income due to changes in interest rates unless such securities are sold prior to maturity or declines in fair value are determined to be other-than-temporary.
An immediate increase of 100 basis points in interest rates would have resulted in a $5 million and $10 million market value reduction in our investment portfolio as of
January 31, 2019
and
2018
, respectively. An immediate decrease of 100 basis points in interest rates would have increased the market value by $5 million and $10 million as of
January 31, 2019
and
2018
, respectively. This estimate is based on a sensitivity model that measures market value changes when changes in interest rates occur. Fluctuations in the value of our investment securities caused by a change in interest rates (gains or losses on the carrying value) are recorded in Accumulated other comprehensive income (loss) and are realized only if we sell the underlying securities before maturity.
Market Risk and Market Interest Risk
In June 2013, we completed an offering of $350 million of 0.75% convertible senior notes due July 15, 2018, which were subsequently converted by note holders during the second quarter of fiscal 2019. In June 2013, concurrent with the 2018 Notes offering, we issued $250 million of 1.50% convertible senior notes due July 15, 2020. In September 2017, we completed an offering of $1.15 billion of 0.25% convertible senior notes due October 1, 2022.
Holders may convert the Notes prior to maturity upon the occurrence of certain circumstances. Upon conversion, holders of the Notes will receive cash, shares of Class A common stock, or a combination of cash and shares of Class A common stock, at our election.
Concurrently with the issuance of the Notes, we entered into separate note hedge and warrant transactions. These separate transactions were completed to reduce the potential economic dilution from the conversion of the Notes.
The 2020 Notes and 2022 Notes have fixed annual interest rates of 1.50% and 0.25%, respectively, and therefore we do not have economic interest rate exposure on our 2020 Notes and 2022 Notes. However, the values of the 2020 Notes and 2022 Notes are exposed to interest rate risk. Generally, the fair market value of our fixed interest rate 2020 Notes and 2022 Notes will increase as interest rates fall and decrease as interest rates rise. In addition, the fair values of the 2020 Notes and 2022 Notes are affected by our stock price. The carrying values of the 2020 Notes and 2022 Notes were
$233 million
and
$972 million
, respectively, as of
January 31, 2019
. These represent the liability component of the principal balance of our 2020 Notes and 2022 Notes as of
January 31, 2019
. The total estimated fair values of the 2020 Notes and 2022 Notes as of
January 31, 2019
were
$557 million
and
$1.6 billion
, respectively. The fair values were determined based on the quoted bid prices of the 2020 Notes and 2022 Notes in an over-the-counter market as of the last trading day for fiscal
2019
, which were $222.85 and $135.67, respectively. For further information, see Note 11 of the notes to consolidated financial statements.
41
ITEM 8. CONSOLIDATED FINANCIAL STATEMENTS AND SUPPLEMENTARY DATA
WORKDAY, INC.
INDEX TO CONSOLIDATED FINANCIAL STATEMENTS
42
Report of Independent Registered Public Accounting Firm
To the Stockholders and the Board of Directors of Workday, Inc.
Opinion on the Financial Statements
We have audited the accompanying consolidated balance sheets of Workday, Inc. (the Company) as of January 31, 2019 and 2018, the related consolidated statements of operations, comprehensive loss, stockholders’ equity and cash flows for each of the three years in the period ended January 31, 2019, and the related notes (collectively referred to as the “consolidated financial statements”). In our opinion, the consolidated financial statements present fairly, in all material respects, the financial position of the Company at January 31, 2019 and 2018, and the results of its operations and its cash flows for each of the three years in the period ended January 31, 2019, in conformity with U.S. generally accepted accounting principles.
We also have audited, in accordance with the standards of the Public Company Accounting Oversight Board (United States) (PCAOB), the Company’s internal control over financial reporting as of January 31, 2019, based on criteria established in Internal Control-Integrated Framework issued by the Committee of Sponsoring Organizations of the Treadway Commission (2013 framework) and our report dated March 18, 2019 expressed an unqualified opinion thereon.
Basis for Opinion
These financial statements are the responsibility of the Company’s management. Our responsibility is to express an opinion on the Company’s financial statements based on our audits. We are a public accounting firm registered with the PCAOB and are required to be independent with respect to the Company in accordance with the U.S. federal securities laws and the applicable rules and regulations of the Securities and Exchange Commission and the PCAOB.
We conducted our audits in accordance with the standards of the PCAOB. Those standards require that we plan and perform the audit to obtain reasonable assurance about whether the financial statements are free of material misstatement, whether due to error or fraud. Our audits included performing procedures to assess the risks of material misstatement of the financial statements, whether due to error or fraud, and performing procedures that respond to those risks. Such procedures included examining, on a test basis, evidence regarding the amounts and disclosures in the financial statements. Our audits also included evaluating the accounting principles used and significant estimates made by management, as well as evaluating the overall presentation of the financial statements. We believe that our audits provide a reasonable basis for our opinion.
/s/ Ernst & Young LLP
We have served as the Company’s auditor since 2008.
San Jose, California
March 18, 2019
43
Report of Independent Registered Public Accounting Firm
To the Stockholders and the Board of Directors of Workday, Inc.
Opinion on Internal Control Over Financial Reporting
We have audited Workday, Inc.’s internal control over financial reporting as of January 31, 2019, based on criteria established in Internal Control-Integrated Framework issued by the Committee of Sponsoring Organizations of the Treadway Commission (2013 framework) (the COSO criteria). In our opinion, Workday, Inc. (the Company) maintained, in all material respects, effective internal control over financial reporting as of January 31, 2019, based on the COSO criteria.
We also have audited, in accordance with the standards of the Public Company Accounting Oversight Board (United States) (PCAOB), the consolidated balance sheets of the Company as of January 31, 2019 and 2018, and the related consolidated statements of operations, comprehensive loss, stockholders’ equity and cash flows for each of the three years in the period ended January 31, 2019, and the related notes and our report dated March 18, 2019 expressed an unqualified opinion thereon.
Basis for Opinion
The Company’s management is responsible for maintaining effective internal control over financial reporting and for its assessment of the effectiveness of internal control over financial reporting included in the accompanying Management’s Report on Internal Control Over Financial Reporting. Our responsibility is to express an opinion on the Company’s internal control over financial reporting based on our audit. We are a public accounting firm registered with the PCAOB and are required to be independent with respect to the Company in accordance with the U.S. federal securities laws and the applicable rules and regulations of the Securities and Exchange Commission and the PCAOB.
We conducted our audit in accordance with the standards of the PCAOB. Those standards require that we plan and perform the audit to obtain reasonable assurance about whether effective internal control over financial reporting was maintained in all material respects.
Our audit included obtaining an understanding of internal control over financial reporting, assessing the risk that a material weakness exists, testing and evaluating the design and operating effectiveness of internal control based on the assessed risk, and performing such other procedures as we considered necessary in the circumstances. We believe that our audit provides a reasonable basis for our opinion.
Definition and Limitations of Internal Control Over Financial Reporting
A company’s internal control over financial reporting is a process designed to provide reasonable assurance regarding the reliability of financial reporting and the preparation of financial statements for external purposes in accordance with generally accepted accounting principles. A company’s internal control over financial reporting includes those policies and procedures that (1) pertain to the maintenance of records that, in reasonable detail, accurately and fairly reflect the transactions and dispositions of the assets of the company; (2) provide reasonable assurance that transactions are recorded as necessary to permit preparation of financial statements in accordance with generally accepted accounting principles, and that receipts and expenditures of the company are being made only in accordance with authorizations of management and directors of the company; and (3) provide reasonable assurance regarding prevention or timely detection of unauthorized acquisition, use, or disposition of the company’s assets that could have a material effect on the financial statements.
Because of its inherent limitations, internal control over financial reporting may not prevent or detect misstatements. Also, projections of any evaluation of effectiveness to future periods are subject to the risk that controls may become inadequate because of changes in conditions, or that the degree of compliance with the policies or procedures may deteriorate.
/s/ Ernst & Young LLP
San Jose, California
March 18, 2019
44
WORKDAY, INC.
CONSOLIDATED BALANCE SHEETS
(in thousands, except share and par value data)
|
|
January 31,
|
||||||
|
|
2019
|
2018
|
|||||
|
Assets
|
|||||||
|
Current assets:
|
|||||||
|
Cash and cash equivalents
|
$
|
638,554
|
|
$
|
1,134,355
|
|
|
|
Marketable securities
|
1,139,864
|
|
2,133,495
|
|
|||
|
Trade and other receivables, net of allowance for doubtful accounts of $5,965 and $2,212, respectively
|
704,680
|
|
528,208
|
|
|||
|
Deferred costs
|
80,809
|
|
63,060
|
|
|||
|
Prepaid expenses and other current assets
|
136,689
|
|
97,860
|
|
|||
|
Total current assets
|
2,700,596
|
|
3,956,978
|
|
|||
|
Property and equipment, net
|
796,907
|
|
546,609
|
|
|||
|
Deferred costs, noncurrent
|
183,518
|
|
140,509
|
|
|||
|
Acquisition-related intangible assets, net
|
313,240
|
|
34,234
|
|
|||
|
Goodwill
|
1,379,125
|
|
159,376
|
|
|||
|
Other assets
|
147,360
|
|
109,718
|
|
|||
|
Total assets
|
$
|
5,520,746
|
|
$
|
4,947,424
|
|
|
|
Liabilities and stockholders’ equity
|
|||||||
|
Current liabilities:
|
|||||||
|
Accounts payable
|
$
|
29,093
|
|
$
|
20,998
|
|
|
|
Accrued expenses and other current liabilities
|
123,542
|
|
121,879
|
|
|||
|
Accrued compensation
|
207,924
|
|
148,247
|
|
|||
|
Unearned revenue
|
1,837,618
|
|
1,426,241
|
|
|||
|
Current portion of convertible senior notes, net
|
232,514
|
|
341,509
|
|
|||
|
Total current liabilities
|
2,430,691
|
|
2,058,874
|
|
|||
|
Convertible senior notes, net
|
972,264
|
|
1,149,845
|
|
|||
|
Unearned revenue, noncurrent
|
111,652
|
|
110,906
|
|
|||
|
Other liabilities
|
47,697
|
|
47,434
|
|
|||
|
Total liabilities
|
3,562,304
|
|
3,367,059
|
|
|||
|
Commitments and contingencies (Note 12)
|
|
|
|||||
|
Stockholders’ equity:
|
|||||||
|
Preferred stock, $0.001 par value; 10 million shares authorized as of January 31, 2019 and 2018; no shares issued and outstanding as of January 31, 2019 and 2018
|
—
|
|
—
|
|
|||
|
Class A common stock, $0.001 par value; 750 million shares authorized as of January 31, 2019 and 2018; 157 million and 142 million shares issued and outstanding as of January 31, 2019 and 2018, respectively
|
157
|
|
142
|
|
|||
|
Class B common stock, $0.001 par value; 240 million shares authorized as of January 31, 2019 and 2018; 65 million and 70 million shares issued and outstanding as of January 31, 2019 and 2018, respectively
|
64
|
|
69
|
|
|||
|
Additional paid-in capital
|
4,105,334
|
|
3,354,423
|
|
|||
|
Accumulated other comprehensive income (loss)
|
(809
|
)
|
(46,413
|
)
|
|||
|
Accumulated deficit
|
(2,146,304
|
)
|
(1,727,856
|
)
|
|||
|
Total stockholders’ equity
|
1,958,442
|
|
1,580,365
|
|
|||
|
Total liabilities and stockholders’ equity
|
$
|
5,520,746
|
|
$
|
4,947,424
|
|
|
See Notes to Consolidated Financial Statements
45
WORKDAY, INC.
CONSOLIDATED STATEMENTS OF OPERATIONS
(in thousands, except per share data)
|
|
Year Ended January 31,
|
||||||||||
|
|
2019
|
2018
|
2017
|
||||||||
|
*As Adjusted
|
|||||||||||
|
Revenues:
|
|||||||||||
|
Subscription services
|
$
|
2,385,769
|
|
$
|
1,787,833
|
|
$
|
1,290,733
|
|
||
|
Professional services
|
436,411
|
|
355,217
|
|
283,707
|
|
|||||
|
Total revenues
|
2,822,180
|
|
2,143,050
|
|
1,574,440
|
|
|||||
|
Costs and expenses
(1)
:
|
|||||||||||
|
Costs of subscription services
|
379,877
|
|
273,461
|
|
213,389
|
|
|||||
|
Costs of professional services
|
455,073
|
|
355,952
|
|
270,156
|
|
|||||
|
Product development
|
1,211,832
|
|
910,584
|
|
680,531
|
|
|||||
|
Sales and marketing
|
891,345
|
|
683,367
|
|
565,328
|
|
|||||
|
General and administrative
|
347,337
|
|
222,909
|
|
198,122
|
|
|||||
|
Total costs and expenses
|
3,285,464
|
|
2,446,273
|
|
1,927,526
|
|
|||||
|
Operating loss
|
(463,284
|
)
|
(303,223
|
)
|
(353,086
|
)
|
|||||
|
Other income (expense), net
|
39,532
|
|
(11,563
|
)
|
(32,427
|
)
|
|||||
|
Loss before provision for (benefit from) income taxes
|
(423,752
|
)
|
(314,786
|
)
|
(385,513
|
)
|
|||||
|
Provision for (benefit from) income taxes
|
(5,494
|
)
|
6,436
|
|
(814
|
)
|
|||||
|
Net loss
|
$
|
(418,258
|
)
|
$
|
(321,222
|
)
|
$
|
(384,699
|
)
|
||
|
Net loss attributable to Class A and Class B common stockholders
|
$
|
(418,258
|
)
|
$
|
(321,222
|
)
|
$
|
(384,699
|
)
|
||
|
Net loss per share attributable to Class A and Class B common stockholders, basic and diluted
|
$
|
(1.93
|
)
|
$
|
(1.55
|
)
|
$
|
(1.94
|
)
|
||
|
Weighted-average shares used to compute net loss per share attributable to Class A and Class B common stockholders
|
216,789
|
|
207,774
|
|
198,214
|
|
|||||
|
(1)
|
Costs and expenses include share-based compensation expenses as follows:
|
|
|
Year Ended January 31,
|
||||||||||
|
|
2019
|
2018
|
2017
|
||||||||
|
Costs of subscription services
|
$
|
36,754
|
|
$
|
26,280
|
|
$
|
20,773
|
|
||
|
Costs of professional services
|
55,535
|
|
37,592
|
|
26,833
|
|
|||||
|
Product development
|
320,876
|
|
229,819
|
|
166,529
|
|
|||||
|
Sales and marketing
|
132,810
|
|
100,762
|
|
86,229
|
|
|||||
|
General and administrative
|
127,443
|
|
83,972
|
|
78,265
|
|
|||||
* For further information, see Note 1.
See Notes to Consolidated Financial Statements
46
WORKDAY, INC.
CONSOLIDATED STATEMENTS OF COMPREHENSIVE LOSS
(in thousands)
|
|
Year Ended January 31,
|
||||||||||
|
|
2019
|
2018
|
2017
|
||||||||
|
*As Adjusted
|
|||||||||||
|
Net loss
|
$
|
(418,258
|
)
|
$
|
(321,222
|
)
|
$
|
(384,699
|
)
|
||
|
Other comprehensive income (loss), net of tax:
|
|||||||||||
|
Net change in foreign currency translation adjustment
|
(1,635
|
)
|
1,581
|
|
150
|
|
|||||
|
Net change in unrealized gains (losses) on available-for-sale debt securities, net of tax provision of $660, $0, and $0, respectively
|
2,534
|
|
(2,687
|
)
|
(388
|
)
|
|||||
|
Net change in market value of effective foreign currency forward exchange contracts, net of tax provision of $6,386, $0, and $0, respectively
|
44,705
|
|
(47,378
|
)
|
1,510
|
|
|||||
|
Other comprehensive income (loss), net of tax:
|
45,604
|
|
(48,484
|
)
|
1,272
|
|
|||||
|
Comprehensive loss
|
$
|
(372,654
|
)
|
$
|
(369,706
|
)
|
$
|
(383,427
|
)
|
||
* For further information, see Note 1.
See Notes to Consolidated Financial Statements
47
WORKDAY, INC.
CONSOLIDATED STATEMENTS OF CASH FLOWS
(in thousands)
|
|
Year Ended January 31,
|
||||||||||
|
|
2019
|
2018
|
2017
|
||||||||
|
*As Adjusted
|
|||||||||||
|
Cash flows from operating activities
|
|||||||||||
|
Net loss
|
$
|
(418,258
|
)
|
$
|
(321,222
|
)
|
$
|
(384,699
|
)
|
||
|
Adjustments to reconcile net loss to net cash provided by (used in) operating activities:
|
|||||||||||
|
Depreciation and amortization
|
198,111
|
|
135,723
|
|
105,825
|
|
|||||
|
Share-based compensation expenses
|
652,465
|
|
478,425
|
|
372,272
|
|
|||||
|
Amortization of deferred costs
|
71,238
|
|
57,562
|
|
45,345
|
|
|||||
|
Amortization of debt discount and issuance costs
|
59,974
|
|
43,916
|
|
26,947
|
|
|||||
|
Other
|
(53,195
|
)
|
(8,379
|
)
|
23,013
|
|
|||||
|
Changes in operating assets and liabilities, net of business combinations:
|
|||||||||||
|
Trade and other receivables, net
|
(160,527
|
)
|
(114,613
|
)
|
(91,755
|
)
|
|||||
|
Deferred costs
|
(131,996
|
)
|
(92,552
|
)
|
(82,848
|
)
|
|||||
|
Prepaid expenses and other assets
|
(16,344
|
)
|
(68,983
|
)
|
(16,794
|
)
|
|||||
|
Accounts payable
|
5,877
|
|
(7,249
|
)
|
6,336
|
|
|||||
|
Accrued expenses and other liabilities
|
54,895
|
|
47,515
|
|
23,367
|
|
|||||
|
Unearned revenue
|
344,418
|
|
315,584
|
|
323,617
|
|
|||||
|
Net cash provided by (used in) operating activities
|
606,658
|
|
465,727
|
|
350,626
|
|
|||||
|
Cash flows from investing activities
|
|||||||||||
|
Purchases of marketable securities
|
(1,989,868
|
)
|
(2,515,997
|
)
|
(1,917,238
|
)
|
|||||
|
Maturities of marketable securities
|
2,090,693
|
|
1,591,554
|
|
1,986,031
|
|
|||||
|
Sales of marketable securities
|
949,970
|
|
243,727
|
|
133,292
|
|
|||||
|
Business combinations, net of cash acquired
|
(1,474,337
|
)
|
(5,744
|
)
|
(147,879
|
)
|
|||||
|
Owned real estate projects
|
(181,180
|
)
|
(124,811
|
)
|
(106,997
|
)
|
|||||
|
Capital expenditures, excluding owned real estate projects
|
(202,507
|
)
|
(141,536
|
)
|
(120,813
|
)
|
|||||
|
Purchases of non-marketable equity and other investments
|
(43,016
|
)
|
(16,199
|
)
|
(300
|
)
|
|||||
|
Sales and maturities of non-marketable equity and other investments
|
17,911
|
|
1,026
|
|
5,315
|
|
|||||
|
Purchase of other intangible assets
|
(10,450
|
)
|
(11,000
|
)
|
—
|
|
|||||
|
Other
|
—
|
|
—
|
|
(296
|
)
|
|||||
|
Net cash provided by (used in) investing activities
|
(842,784
|
)
|
(978,980
|
)
|
(168,885
|
)
|
|||||
|
Cash flows from financing activities
|
|||||||||||
|
Proceeds from borrowings on convertible senior notes, net of issuance costs
|
—
|
|
1,132,101
|
|
—
|
|
|||||
|
Proceeds from issuance of warrants
|
—
|
|
80,805
|
|
—
|
|
|||||
|
Purchase of convertible senior notes hedges
|
—
|
|
(175,530
|
)
|
—
|
|
|||||
|
Payments on convertible senior notes
|
(350,030
|
)
|
—
|
|
—
|
|
|||||
|
Proceeds from issuance of common stock from employee equity plans
|
93,567
|
|
69,056
|
|
58,079
|
|
|||||
|
Other
|
(248
|
)
|
(170
|
)
|
1,602
|
|
|||||
|
Net cash provided by (used in) financing activities
|
(256,711
|
)
|
1,106,262
|
|
59,681
|
|
|||||
|
Effect of exchange rate changes
|
(614
|
)
|
751
|
|
385
|
|
|||||
|
Net increase (decrease) in cash, cash equivalents, and restricted cash
|
(493,451
|
)
|
593,760
|
|
241,807
|
|
|||||
|
Cash, cash equivalents, and restricted cash at the beginning of period
|
1,135,654
|
|
541,894
|
|
300,087
|
|
|||||
|
Cash, cash equivalents, and restricted cash at the end of period
|
$
|
642,203
|
|
$
|
1,135,654
|
|
$
|
541,894
|
|
||
See Notes to Consolidated Financial Statements
48
|
|
Year Ended January 31,
|
||||||||||
|
|
2019
|
2018
|
2017
|
||||||||
|
Supplemental cash flow data
|
|||||||||||
|
Cash paid for interest, net of amounts capitalized
|
$
|
38
|
|
$
|
76
|
|
$
|
3,156
|
|
||
|
Cash paid for income taxes
|
6,007
|
|
3,418
|
|
5,315
|
|
|||||
|
Non-cash investing and financing activities:
|
|||||||||||
|
Vesting of early exercised stock options
|
$
|
—
|
|
$
|
775
|
|
$
|
1,803
|
|
||
|
Purchases of property and equipment, accrued but not paid
|
56,308
|
|
51,545
|
|
27,696
|
|
|||||
|
Non-cash additions to property and equipment
|
8,171
|
|
5,396
|
|
2,094
|
|
|||||
|
January 31,
|
|||||||||||
|
2019
|
2018
|
2017
|
|||||||||
|
*As Adjusted
|
|||||||||||
|
Reconciliation of cash, cash equivalents, and restricted cash as shown in the statements of cash flows
|
|||||||||||
|
Cash and cash equivalents
|
$
|
638,554
|
|
$
|
1,134,355
|
|
$
|
539,923
|
|
||
|
Restricted cash included in Prepaid expenses and other current assets
|
3,519
|
|
—
|
|
—
|
|
|||||
|
Restricted cash included in Other assets
|
130
|
|
1,299
|
|
1,971
|
|
|||||
|
Total cash, cash equivalents, and restricted cash
|
$
|
642,203
|
|
$
|
1,135,654
|
|
$
|
541,894
|
|
||
* For further information, see Note 1.
See Notes to Consolidated Financial Statements
49
WORKDAY, INC.
CONSOLIDATED STATEMENTS OF STOCKHOLDERS’ EQUITY
(in thousands, except share data)
|
Common Stock
|
Additional
Paid-In Capital |
Treasury
Stock |
Accumulated
Other Comprehensive Income (Loss) |
Accumulated
Deficit |
Total
Stockholders’ Equity |
|||||||||||||||||||||
|
Shares
|
Amount
|
*As Adjusted
|
*As Adjusted
|
|||||||||||||||||||||||
|
Balances as of January 31, 2016
|
194,479,350
|
|
$
|
193
|
|
$
|
2,247,454
|
|
$
|
—
|
|
$
|
799
|
|
$
|
(1,022,166
|
)
|
$
|
1,226,280
|
|
||||||
|
Issuance of common stock under employee equity plans
|
4,379,787
|
|
4
|
|
58,075
|
|
—
|
|
—
|
|
—
|
|
58,079
|
|
||||||||||||
|
Vesting of early exercised stock options
|
—
|
|
1
|
|
1,802
|
|
—
|
|
—
|
|
—
|
|
1,803
|
|
||||||||||||
|
Vested restricted stock units
|
4,084,268
|
|
4
|
|
(4
|
)
|
—
|
|
—
|
|
—
|
|
—
|
|
||||||||||||
|
Share-based compensation
|
—
|
|
—
|
|
372,272
|
|
—
|
|
—
|
|
—
|
|
372,272
|
|
||||||||||||
|
Excess tax benefits from share-based compensation
|
—
|
|
—
|
|
1,226
|
|
—
|
|
—
|
|
—
|
|
1,226
|
|
||||||||||||
|
Other
|
—
|
|
—
|
|
375
|
|
—
|
|
—
|
|
—
|
|
375
|
|
||||||||||||
|
Other comprehensive income (loss)
|
—
|
|
—
|
|
—
|
|
—
|
|
1,272
|
|
—
|
|
1,272
|
|
||||||||||||
|
Net loss
|
—
|
|
—
|
|
—
|
|
—
|
|
—
|
|
(384,699
|
)
|
(384,699
|
)
|
||||||||||||
|
Balances as of January 31, 2017
|
202,943,405
|
|
$
|
202
|
|
$
|
2,681,200
|
|
$
|
—
|
|
$
|
2,071
|
|
$
|
(1,406,865
|
)
|
$
|
1,276,608
|
|
||||||
|
Cumulative-effect adjustment to Accumulated deficit related to the adoption of ASU No. 2016-09
|
—
|
|
—
|
|
—
|
|
—
|
|
—
|
|
231
|
|
231
|
|
||||||||||||
|
Issuance of common stock under employee equity plans
|
3,318,514
|
|
3
|
|
69,052
|
|
—
|
|
—
|
|
—
|
|
69,055
|
|
||||||||||||
|
Vesting of early exercised stock options
|
—
|
|
—
|
|
775
|
|
—
|
|
—
|
|
—
|
|
775
|
|
||||||||||||
|
Vested restricted stock units
|
5,715,576
|
|
6
|
|
(6
|
)
|
—
|
|
—
|
|
—
|
|
—
|
|
||||||||||||
|
Share-based compensation
|
—
|
|
—
|
|
478,425
|
|
—
|
|
—
|
|
—
|
|
478,425
|
|
||||||||||||
|
Purchase of convertible senior notes hedges
|
—
|
|
—
|
|
(175,530
|
)
|
—
|
|
—
|
|
—
|
|
(175,530
|
)
|
||||||||||||
|
Issuance of warrants
|
—
|
|
—
|
|
80,805
|
|
—
|
|
—
|
|
—
|
|
80,805
|
|
||||||||||||
|
Equity component of convertible senior notes
|
—
|
|
—
|
|
219,702
|
|
—
|
|
—
|
|
—
|
|
219,702
|
|
||||||||||||
|
Other comprehensive income (loss)
|
—
|
|
—
|
|
—
|
|
—
|
|
(48,484
|
)
|
—
|
|
(48,484
|
)
|
||||||||||||
|
Net loss
|
—
|
|
—
|
|
—
|
|
—
|
|
—
|
|
(321,222
|
)
|
(321,222
|
)
|
||||||||||||
|
Balances as of January 31, 2018
|
211,977,495
|
|
$
|
211
|
|
$
|
3,354,423
|
|
$
|
—
|
|
$
|
(46,413
|
)
|
$
|
(1,727,856
|
)
|
$
|
1,580,365
|
|
||||||
|
Cumulative-effect adjustment to Accumulated deficit related to the adoption of ASU No. 2016-16 (see Note 2)
|
—
|
|
—
|
|
—
|
|
—
|
|
—
|
|
427
|
|
427
|
|
||||||||||||
|
Issuance of common stock under employee equity plans
|
2,317,463
|
|
2
|
|
37,752
|
|
55,813
|
|
—
|
|
—
|
|
93,567
|
|
||||||||||||
|
Vested restricted stock units
|
6,273,733
|
|
6
|
|
(6
|
)
|
—
|
|
—
|
|
—
|
|
—
|
|
||||||||||||
|
Share-based compensation
|
—
|
|
—
|
|
652,404
|
|
—
|
|
—
|
|
—
|
|
652,404
|
|
||||||||||||
|
Exercise of convertible senior notes hedges
|
—
|
|
—
|
|
193,680
|
|
(193,679
|
)
|
—
|
|
—
|
|
1
|
|
||||||||||||
|
Settlement of warrants
|
25,990
|
|
—
|
|
(137,245
|
)
|
137,849
|
|
—
|
|
(617
|
)
|
(13
|
)
|
||||||||||||
|
Settlement of convertible senior notes
|
1,457,382
|
|
2
|
|
(24
|
)
|
17
|
|
—
|
|
—
|
|
(5
|
)
|
||||||||||||
|
Equity awards assumed in business combination
|
—
|
|
—
|
|
4,350
|
|
—
|
|
—
|
|
—
|
|
4,350
|
|
||||||||||||
|
Other comprehensive income (loss)
|
—
|
|
—
|
|
—
|
|
—
|
|
45,604
|
|
—
|
|
45,604
|
|
||||||||||||
|
Net loss
|
—
|
|
—
|
|
—
|
|
—
|
|
—
|
|
(418,258
|
)
|
(418,258
|
)
|
||||||||||||
|
Balances as of January 31, 2019
|
222,052,063
|
|
$
|
221
|
|
$
|
4,105,334
|
|
$
|
—
|
|
$
|
(809
|
)
|
$
|
(2,146,304
|
)
|
$
|
1,958,442
|
|
||||||
*
For further information, see Note 1.
See Notes to Consolidated Financial Statements
50
Workday, Inc.
Notes to Consolidated Financial Statements
Note 1. Overview and Basis of Presentation
Company and Background
Workday provides financial management, human capital management, planning, and analytics applications designed for the world’s largest companies, educational institutions, and government agencies. We offer innovative and adaptable technology focused on the consumer internet experience and cloud delivery model. Our applications are designed for global enterprises to manage complex and dynamic operating environments. We provide our customers highly adaptable, accessible, and reliable applications to manage critical business functions that enable them to optimize their financial and human capital resources. We were originally incorporated in March 2005 in Nevada and in June 2012, we reincorporated in Delaware.
Fiscal Year
Our fiscal year ends on January 31. References to fiscal
2019
, for example, refer to the year ended
January 31, 2019
.
Basis of Presentation
These consolidated financial statements have been prepared in accordance with generally accepted accounting principles in the United States (“GAAP”). The consolidated financial statements include the results of Workday, Inc. and its wholly-owned subsidiaries. All intercompany balances and transactions have been eliminated.
Effective February 1, 2017, we adopted the requirements of Accounting Standards Update (“ASU”) No. 2014-09,
Revenue from Contracts with Customers
and ASU No. 2016-18,
Statement of Cash Flows, Restricted Cash
. All amounts and disclosures set forth in this Form 10-K have been updated to comply with the new standards, as indicated by the “as adjusted” footnote.
Certain prior period amounts reported in our consolidated financial statements and notes thereto have been reclassified to conform to current period presentation.
Use of Estimates
The preparation of consolidated financial statements in conformity with GAAP requires us to make certain estimates, judgments, and assumptions that affect the reported amounts of assets and liabilities and disclosure of contingent assets and liabilities as of the date of the consolidated financial statements, as well as the reported amounts of revenues and expenses during the reporting period. These estimates include, but are not limited to, the fair value of assets acquired and liabilities assumed through business combinations, the determination of the period of benefit for deferred commissions, certain assumptions used in the valuation of equity awards, and assumptions used in the valuation of non-marketable equity investments. Actual results could differ from those estimates and such differences could be material to our consolidated financial position and results of operations.
Segment Information
We operate in
one
operating segment, cloud applications. Operating segments are defined as components of an enterprise where separate financial information is evaluated regularly by the chief operating decision maker, who is our chief executive officer, in deciding how to allocate resources and assessing performance. Our chief operating decision maker allocates resources and assesses performance based upon discrete financial information at the consolidated level.
Note 2. Accounting Standards and Significant Accounting Policies
Summary of Significant Accounting Policies
Revenue Recognition
We derive our revenues primarily from subscription services and professional services. Revenues are recognized when control of these services is transferred to our customers, in an amount that reflects the consideration we expect to be entitled to in exchange for those services.
51
We determine revenue recognition through the following steps:
|
•
|
Identification of the contract, or contracts, with a customer
|
|
•
|
Identification of the performance obligations in the contract
|
|
•
|
Determination of the transaction price
|
|
•
|
Allocation of the transaction price to the performance obligations in the contract
|
|
•
|
Recognition of revenue when, or as, we satisfy a performance obligation
|
Subscription Services Revenues
Subscription services revenues primarily consist of fees that provide customers access to one or more of our cloud applications for finance, human resources, planning, and analytics, with routine customer support. Revenue is generally recognized on a ratable basis over the contract term beginning on the date that our service is made available to the customer. Our subscription contracts are generally
three
years or longer in length, billed annually in advance, and non-cancelable.
Professional Services Revenues
Professional services revenues primarily consist of fees for deployment and optimization services, as well as training. The majority of our consulting contracts are billed on a time and materials basis and revenue is recognized over time as the services are performed. For contracts billed on a fixed price basis, revenue is recognized over time based on the proportion performed.
Contracts with Multiple Performance Obligations
Some of our contracts with customers contain multiple performance obligations. For these contracts, we account for individual performance obligations separately if they are distinct. The transaction price is allocated to the separate performance obligations on a relative standalone selling price basis. We determine the standalone selling prices based on our overall pricing objectives, taking into consideration market conditions and other factors, including the value of our contracts, the cloud applications sold, customer demographics, geographic locations, and the number and types of users within our contracts.
Fair Value Measurement
We measure our cash equivalents, marketable securities and foreign currency derivative contracts at fair value at each reporting period using a fair value hierarchy that requires that we maximize the use of observable inputs and minimize the use of unobservable inputs when measuring fair value. A financial instrument’s classification within the fair value hierarchy is based upon the lowest level of input that is significant to the fair value measurement. Three levels of inputs may be used to measure fair value:
Level 1 — Observable inputs that reflect quoted prices (unadjusted) for identical assets or liabilities in active markets.
Level 2 — Other inputs that are directly or indirectly observable in the marketplace.
Level 3 — Unobservable inputs that are supported by little or no market activity.
Cash and Cash Equivalents
Cash and cash equivalents consist of highly liquid investments with maturities of three months
or less
at the time of purchase. Our cash equivalents primarily consist of investments in U.S. treasury securities, U.S. agency obligations, corporate bonds, commercial paper, and money market funds.
Debt Securities
Our debt securities primarily consist of investments in U.S. treasury securities, U.S. agency obligations, corporate bonds, and commercial paper. We classify our debt securities as available-for-sale at the time of purchase and reevaluate such classification as of each balance sheet date. We consider all debt securities as available for use in current operations, including those with maturity dates beyond one year, and therefore classify these securities as current assets in the accompanying consolidated balance sheets.
All debt securities are recorded at their estimated fair value. Unrealized gains and losses on available-for-sale debt securities are recorded in Accumulated other comprehensive income (loss) (“OCI”). We evaluate our investments to assess whether those in unrealized loss positions are other-than-temporarily impaired. We consider impairments to be other-than-temporary if they are related to deterioration in credit risk or if it is likely we will sell the securities before the recovery of their cost basis. Realized gains and losses and declines in value judged to be other-than-temporary are determined based on the specific identification method and are reported in Other income (expense), net on the consolidated statements of operations.
52
If quoted prices for identical instruments are available in an active market, debt securities are classified within Level 1 of the fair value hierarchy. If quoted prices for identical instruments in active markets are not available, fair values are estimated using quoted prices of similar instruments and are classified within Level 2 of the fair value hierarchy. To date, all of our debt securities can be valued using one of these two methodologies.
Equity Investments
We hold marketable and non-marketable equity investments, over which we do not have a controlling interest or significant influence. Marketable equity investments are measured using quoted prices in active markets with changes recorded in Other income (expense), net on the consolidated statements of operations. Non-marketable equity investments have no readily determinable fair values and are measured using the measurement alternative, which is defined as cost, less impairment, adjusted for observable price changes from orderly transactions for identical or similar investments of the same issuer. Adjustments are recorded in Other income (expense), net on the consolidated statements of operations.
Non-marketable equity investments are valued using significant unobservable inputs or data in an inactive market and the valuation requires our judgment due to the absence of market prices and inherent lack of liquidity. The carrying value for these investments is not adjusted if there are no observable transactions for identical or similar investments of the same issuer or if there are no identified events or changes in circumstances that may indicate impairment. Valuations of non-marketable equity investments are inherently complex due to the lack of readily available market data. In addition, the determination of whether an orderly transaction is for an identical or similar investment requires significant management judgment, including understanding the differences in the rights and obligations of the investments and the extent to which those differences would affect the fair values of those investments.
We assess our non-marketable equity investments quarterly for impairment. Our impairment analysis encompasses an assessment of the severity and duration of the impairment and a qualitative and quantitative analysis of other key factors including the investee’s financial metrics, market acceptance of the investee’s product or technology, other competitive products or technology in the market, general market conditions, and the rate at which the investee is using its cash. If our investment is considered to be impaired, we will record an impairment in Other income (expense), net on the consolidated statements of operations and establish a new carrying value for the investment.
Trade and Other Receivables
Trade and other receivables are primarily comprised of trade receivables that are recorded at the invoice amount, net of an allowance for doubtful accounts, which is not material. Other receivables represent unbilled receivables related to subscription and professional services contracts.
Deferred Commissions
Sales commissions earned by our sales force are considered incremental and recoverable costs of obtaining a contract with a customer. Sales commissions for initial contracts are deferred and then amortized on a straight-line basis over a period of benefit that we have determined to be
five
years. We determined the period of benefit by taking into consideration our customer contracts, our technology, and other factors. Sales commissions for renewal contracts are deferred and then amortized on a straight-line basis over the related contractual renewal period. Amortization expense is included in Sales and marketing expenses on the consolidated statements of operations.
Derivative Financial Instruments and Hedging Activities
We use derivative financial instruments to manage foreign currency risks. Derivative instruments are carried at fair value and recorded as either an asset or liability on the consolidated balance sheets. Gains and losses resulting from changes in fair value are accounted for depending on the use of the derivative and whether it is designated and qualifies for hedge accounting. For foreign currency forward contracts not designated as hedging instruments, which we use to hedge a portion of our net outstanding monetary assets and liabilities, the gains or losses are recorded in Other income (expense), net on the consolidated statements of operations in the period of change. For a derivative instrument designated as a cash flow hedge, which we use to hedge certain customer contracts denominated in foreign currencies, the change in fair value on the effective portion is recorded to OCI on our consolidated balance sheets each reporting period. The balance in OCI is subsequently reclassified to the related revenue line item on the consolidated statements of operations in the same period that the underlying revenues are earned.
Our foreign currency contracts are classified within Level 2 of the fair value hierarchy because the valuation inputs are based on quoted prices and market observable data of similar instruments in active markets, such as currency spot and forward rates.
53
Property and Equipment
Property and equipment are stated at cost less accumulated depreciation. Depreciation is recorded using the straight-line method over the estimated useful lives of the respective assets. Leasehold improvements are depreciated over the shorter of the estimated useful lives of the assets or the related lease term. Property and equipment is reviewed for impairment whenever events or changes in circumstances indicate the carrying amount of an asset may not be recoverable.
Business Combinations
We use our best estimates and assumptions to assign fair value to the tangible and intangible assets acquired and liabilities assumed as of the acquisition date. Our estimates are inherently uncertain and subject to refinement. During the measurement period, which may be up to one year from the acquisition date, we may record adjustments to the fair value of these tangible and intangible assets acquired and liabilities assumed, with the corresponding offset to goodwill. In addition, uncertain tax positions and tax-related valuation allowances are initially established in connection with a business combination as of the acquisition date. Upon the conclusion of the measurement period or final determination of the fair value of assets acquired or liabilities assumed, whichever comes first, any subsequent adjustments are recorded to our consolidated statements of operations.
Goodwill and Acquisition-Related Intangible Assets
Acquisition-related intangible assets with finite lives are amortized over their estimated useful lives. Goodwill amounts are not amortized. Acquisition-related intangible assets and goodwill are tested for impairment at least annually, and more frequently upon the occurrence of certain events.
Unearned Revenue
Unearned revenue primarily consists of customer billings in advance of revenues being recognized from our subscription contracts. We generally invoice our customers annually in advance for our subscription services. Our typical payment terms provide that customers pay a portion of the total arrangement fee within
30
days of the contract date. Unearned revenue that is anticipated to be recognized during the succeeding
twelve
-month period is recorded as current unearned revenue and the remaining portion is recorded as noncurrent.
Convertible Senior Notes
In June 2013, we issued
0.75%
convertible senior notes due July 15, 2018 (“2018 Notes”) with a principal amount of
$350 million
, which were subsequently converted by note holders during the second quarter of fiscal 2019. Concurrently in June 2013, we issued
1.50%
convertible senior notes due July 15, 2020 (“2020 Notes”) with a principal amount of
$250 million
. In September 2017, we issued
0.25%
convertible senior notes due October 1, 2022 (“2022 Notes”) with a principal amount of
$1.15 billion
(together with the 2018 Notes and 2020 Notes, referred to as the “Notes”). In accounting for the issuance of the Notes, we separated each of the Notes into liability and equity components. The carrying amounts of the liability components were calculated by measuring the fair value of similar liabilities that do not have associated convertible features. The carrying amount of the equity components representing the conversion option were determined by deducting the fair value of the liability components from the par value of the respective Notes. These differences represent debt discounts that are amortized to interest expense over the respective terms of the Notes using the effective interest rate method. The equity components are not remeasured as long as they continue to meet the conditions for equity classification. In accounting for the issuance costs related to the Notes, we allocated the total amount of issuance costs incurred to the liability and equity components based on their relative values. Issuance costs attributable to the liability components are being amortized on a straight-line basis, which approximates the effective interest rate method, to interest expense over the respective terms of the Notes. The issuance costs attributable to the equity components were netted against the respective equity components in Additional paid-in capital.
Advertising Expenses
Advertising is expensed as incurred. Advertising expense was
$51 million
,
$43 million
, and
$35 million
for fiscal
2019
,
2018
, and
2017
, respectively.
Share-Based Compensation
We measure and recognize compensation expense for share-based awards issued to employees and non-employees, including restricted stock units (“RSUs”), performance-based restricted stock units (“PRSUs”), stock options, and purchases under the 2012 Employee Stock Purchase Plan (“ESPP”), on our consolidated statements of operations.
54
For RSUs and PRSUs, fair value is based on the closing price of our common stock on the grant date. Compensation expense, net of estimated forfeitures, is recognized on a straight-line basis over the requisite service period. Non-employee RSUs subject to vesting are required to be periodically revalued over the requisite service period. The requisite service period of the awards is generally the same as the vesting period.
For stock options assumed, fair value is estimated using the Black-Scholes option-pricing model. Compensation expense is recognized on a straight-line basis over the requisite service period. We determine the assumptions for the option-pricing model as follows:
|
•
|
Risk-Free Interest Rate.
The risk-free interest rate is based on the U.S. Treasury yield curve in effect at the date closest to the grant date for zero-coupon U.S. Treasury notes with maturities approximately equal to the expected term of the stock option grants.
|
|
•
|
Expected Term.
The expected term represents the period that our share-based award is expected to be outstanding. The expected term for stock options was determined based on the vesting terms, exercise terms, and contractual lives.
|
|
•
|
Volatility.
The volatility is based on a blend of historical volatility and implied volatility of our common stock. Implied volatility is based on market traded options of our common stock.
|
|
•
|
Dividend Yield.
The dividend yield is assumed to be zero as we have not paid and do not expect to pay dividends.
|
For shares issued under the ESPP, fair value is estimated using the Black-Scholes option-pricing model. Compensation expense is recognized on a straight-line basis over the offering period. We determine the assumptions for the option-pricing model as follows:
|
•
|
Risk-Free Interest Rate.
The risk-free interest rate is based on the U.S. Treasury yield curve in effect at the date closest to the grant date for zero-coupon U.S. Treasury notes with maturities approximately equal to the expected term of the ESPP purchase rights.
|
|
•
|
Expected Term.
The expected term represents the period that our ESPP is expected to be outstanding. The expected term for the ESPP approximates the offering period.
|
|
•
|
Volatility.
The volatility is based on a blend of historical volatility and implied volatility of our common stock. Implied volatility is based on market traded options of our common stock.
|
|
•
|
Dividend Yield.
The dividend yield is assumed to be zero as we have not paid and do not expect to pay dividends.
|
Income Taxes
We record a provision for income taxes for the anticipated tax consequences of the reported results of operations using the asset and liability method. Under this method, we recognize deferred tax assets and liabilities for the expected future tax consequences of temporary differences between the financial reporting and tax basis of assets and liabilities, as well as for operating loss and tax credit carryforwards. Deferred tax assets and liabilities are measured using the tax rates that are expected to apply to taxable income for the years in which those tax assets and liabilities are expected to be realized or settled. We record a valuation allowance to reduce our deferred tax assets to the net amount that we believe is more likely than not to be realized.
We recognize tax benefits from uncertain tax positions only if we believe that it is more likely than not that the tax position will be sustained on examination by the taxing authorities based on the technical merits of the position. Although we believe that we have adequately reserved for our uncertain tax positions, we can provide no assurance that the final tax outcome of these matters will not be materially different. We make adjustments to these reserves when facts and circumstances change, such as the closing of a tax audit or the refinement of an estimate. To the extent that the final tax outcome of these matters is different than the amounts recorded, such differences will affect the provision for income taxes in the period in which such determination is made and could have a material impact on our financial condition and operating results. The provision for income taxes includes the effects of any accruals that we believe are appropriate, as well as the related net interest and penalties.
Warranties and Indemnification
Our cloud applications are generally warranted to perform materially in accordance with our online documentation under normal use and circumstances. Additionally, our contracts generally include provisions for indemnifying customers against liabilities if use of our cloud applications infringe a third party’s intellectual property rights. We may also incur liabilities if we breach the security, privacy and/or confidentiality obligations in our contracts. To date, we have not incurred any material costs, and we have not accrued any liabilities in the accompanying consolidated financial statements, as a result of these obligations.
55
We have entered into service-level agreements with a majority of our customers committing to defined levels of service availability and performance and permitting those customers to receive credits or refunds for prepaid amounts related to unused subscription services or to terminate their agreements in the event that we fail to meet those levels. To date, we have not experienced any significant failures to meet defined levels of availability and performance of those agreements and, as a result, we have not accrued any liabilities related to these agreements on the consolidated financial statements.
Foreign Currency Exchange
The functional currency for certain of our foreign subsidiaries is the U.S. dollar, while others use local currencies. We translate the foreign functional currency financial statements to U.S. dollars for those entities that do not have U.S. dollars as their functional currency using the exchange rates at the balance sheet date for assets and liabilities, the period average exchange rates for revenues and expenses, and the historical exchange rates for equity transactions. The effects of foreign currency translation adjustments are recorded in OCI as a component of stockholders’ equity and related periodic movements are summarized as a line item in our consolidated statements of comprehensive loss. Foreign currency transaction gains and losses are included in Other income (expense), net on the consolidated statements of operations.
Concentrations of Risk and Significant Customers
Our financial instruments that are exposed to concentrations of credit risk consist primarily of cash and cash equivalents, debt securities, and trade and other receivables. Our deposits exceed federally insured limits.
No single customer represented over
10%
of trade and other receivables on the consolidated financial statements as of
January 31, 2019
or
2018
. No single customer represented over
10%
of total revenues for any of the periods on the consolidated financial statements.
In order to reduce the risk of down-time of our cloud applications, we have established data centers in various geographic regions. We have internal procedures to restore services in the event of disaster at one of our current data center facilities. We serve our customers and users from data center facilities operated by third parties, located in the United States, Europe, and Canada. Even with these procedures for disaster recovery in place, our cloud applications could be significantly interrupted during the implementation of the procedures to restore services.
In addition, we rely upon third-party hosted infrastructure partners globally, including Amazon Web Services and Dimension Data, to serve customers and operate certain aspects of our services, such as environments for development testing, training, sales demonstrations, and production usage. Given this, any disruption of or interference at our hosted infrastructure partners would impact our operations and our business could be adversely impacted.
Recently Adopted Accounting Pronouncements
ASU No. 2016-01
In January 2016, the Financial Accounting Standards Board (“FASB”) issued ASU No. 2016-01,
Recognition and Measurement of Financial Assets and Financial Liabilities (Subtopic 825-10)
, which amends various aspects of the recognition, measurement, presentation, and disclosure of financial instruments. As of February 1, 2018, we adopted the applicable provisions of ASU No. 2016-01 as follows:
|
•
|
Marketable equity investments (readily determinable fair values): We are now required to account for changes in fair value of our equity investments previously classified as available-for-sale equity investments in the consolidated statements of operations. We have applied the modified retrospective transition method upon adoption, resulting in no impact to our consolidated financial statements as of February 1, 2018.
|
|
•
|
Non-marketable equity investments (no readily determinable fair values): We now measure our equity investments previously classified as cost method investments at fair value or the measurement alternative, unless they qualify for the net asset value practical expedient. The measurement alternative is defined as cost, less impairment, adjusted for observable price changes from orderly transactions for identical or similar investments of the same issuer. Adjustments resulting from impairment, fair value, or observable price changes are accounted for in the consolidated statements of operations. We adopted the guidance prospectively effective February 1, 2018, and there was no impact to our consolidated financial statements.
|
Going forward, the impact of this new standard could result in volatility in the consolidated statements of operations.
56
ASU No. 2016-16
In October 2016, the FASB issued ASU No. 2016-16,
Intra-Entity Transfers of Assets Other Than Inventory (Topic 740)
, which requires entities to recognize the income tax consequences of an intra-entity transfer of an asset other than inventory when the transfer occurs. Prior to the issuance of this ASU, existing guidance prohibited the recognition of current and deferred income taxes for an intra-entity asset transfer until the asset had been sold to an outside party. We adopted this new standard effective February 1, 2018 using the modified retrospective transition method, resulting in a
$0.4 million
cumulative-effect adjustment to Accumulated deficit as of February 1, 2018.
Recently Issued Accounting Pronouncements
In February 2016, the FASB issued ASU No. 2016-02,
Leases (Topic 842)
, which requires the recognition of right-of-use assets and lease liabilities on the balance sheet by lessees for those leases currently classified as operating leases under Accounting Standards Codification Topic 840 Leases. The guidance is effective for our fiscal year beginning February 1, 2019. We plan to adopt this new standard in the first quarter of our fiscal 2020 using a modified retrospective method, and we will not restate comparative periods per the transition method provided by ASU No. 2018-11. We will recognize and measure leases existing at, or entered into after, the beginning of the period of adoption. The standard will have a material impact on our consolidated balance sheets but will not have a material impact on our consolidated statements of operations. We expect to elect the practical expedient that allows entities to combine lease components with related non-lease components, which will further increase reported assets and liabilities. We will also elect to not recognize right-of-use assets and lease liabilities for leases with a term of 12 months or less. We are completing our evaluation of the accounting, transition, and disclosure requirements of this standard, and we currently expect that all of our operating leases, as disclosed in Note 12, will be subject to the new standard.
In August 2017, the FASB issued ASU No. 2017-12,
Derivatives and Hedging (Topic 815)
, to better align an entity’s risk management activities and financial reporting for hedging relationships through changes to both the designation and measurement guidance for qualifying hedging relationships and the presentation of hedge results. The standard eliminates the requirement to separately measure and report hedge ineffectiveness and generally requires the entire change in the fair value of a hedging instrument to be presented in the same income statement line item as the respective hedged item. The standard also modifies certain disclosure requirements. The guidance is effective for our fiscal year beginning February 1, 2019 and must be applied using a modified retrospective approach. We plan to adopt this new standard in the first quarter of our fiscal 2020. We are evaluating the accounting, transition, and disclosure requirements of this standard and cannot currently estimate the financial statement impact of adoption.
In February 2018, the FASB issued ASU No. 2018-02,
Income Statement - Reporting Comprehensive Income (Topic 220): Reclassification of Certain Tax Effects from Accumulated Other Comprehensive Income,
which provides entities the option to reclassify tax effects stranded in OCI as a result of the 2017 Tax Cuts and Jobs Act (the “Tax Act”) to retained earnings. The guidance is effective for our fiscal year beginning February 1, 2019 and must be applied either in the period of adoption or retrospectively to each period in which the effect of the change in the U.S. federal corporate income tax rate in the Tax Act is recognized. We plan to adopt the new standard in the first quarter of our fiscal 2020 and do not expect it to have a material impact on our consolidated financial statements.
In June 2018, the FASB issued ASU No. 2018-07,
Compensation - Stock Compensation (Topic 718): Improvements to Non-employee Share-Based Payment Accounting
, which expands the scope of Topic 718 to include share-based payment transactions for acquiring goods and services from non-employees, with certain exceptions. The guidance is effective for our fiscal year beginning February 1, 2019. We plan to adopt this new standard in the first quarter of our fiscal 2020 and do not expect it to have a material impact on our consolidated financial statements.
57
Note 3. Investments
Debt Securities
As of
January 31, 2019
, debt securities consisted of the following (in thousands):
|
Amortized Cost
|
Unrealized Gains
|
Unrealized Losses
|
Aggregate Fair Value
|
||||||||||||
|
U.S. treasury securities
|
$
|
396,347
|
|
$
|
61
|
|
$
|
(178
|
)
|
$
|
396,230
|
|
|||
|
U.S. agency obligations
|
241,914
|
|
73
|
|
(151
|
)
|
241,836
|
|
|||||||
|
Corporate bonds
|
419,784
|
|
336
|
|
(352
|
)
|
419,768
|
|
|||||||
|
Commercial paper
|
254,175
|
|
—
|
|
(2
|
)
|
254,173
|
|
|||||||
|
$
|
1,312,220
|
|
$
|
470
|
|
$
|
(683
|
)
|
$
|
1,312,007
|
|
||||
|
Included in cash and cash equivalents
|
$
|
216,270
|
|
$
|
—
|
|
$
|
—
|
|
$
|
216,270
|
|
|||
|
Included in marketable securities
|
$
|
1,095,950
|
|
$
|
470
|
|
$
|
(683
|
)
|
$
|
1,095,737
|
|
|||
As of
January 31, 2018
, debt securities consisted of the following (in thousands):
|
Amortized Cost
|
Unrealized Gains
|
Unrealized Losses
|
Aggregate Fair Value
|
||||||||||||
|
U.S. treasury securities
|
$
|
797,977
|
|
$
|
—
|
|
$
|
(1,142
|
)
|
$
|
796,835
|
|
|||
|
U.S. agency obligations
|
683,551
|
|
—
|
|
(1,127
|
)
|
682,424
|
|
|||||||
|
Corporate bonds
|
470,259
|
|
16
|
|
(1,154
|
)
|
469,121
|
|
|||||||
|
Commercial paper
|
602,727
|
|
—
|
|
—
|
|
602,727
|
|
|||||||
|
$
|
2,554,514
|
|
$
|
16
|
|
$
|
(3,423
|
)
|
$
|
2,551,107
|
|
||||
|
Included in cash and cash equivalents
|
$
|
417,613
|
|
$
|
—
|
|
$
|
(1
|
)
|
$
|
417,612
|
|
|||
|
Included in marketable securities
|
$
|
2,136,901
|
|
$
|
16
|
|
$
|
(3,422
|
)
|
$
|
2,133,495
|
|
|||
We do not believe the unrealized losses represent other-than-temporary impairments based on our evaluation of available evidence as of
January 31, 2019
, which includes an assessment of whether it is more likely than not we will be required to sell the investment before recovery of the investment’s amortized cost basis. The unrealized losses on debt securities that have been in a net loss position for 12 months or more were not material as of
January 31, 2019
. We sold
$950 million
,
$244 million
, and
$133 million
of our debt securities during fiscal
2019
,
2018
, and
2017
, respectively, and the realized gains and losses from the sales were immaterial.
Equity Investments
Money market funds and marketable equity investments are investments with readily determinable fair values. Non-marketable equity investments consist of investments in privately held companies without readily determinable fair values.
Equity investments consisted of the following (in thousands):
|
January 31,
|
|||||||||
|
Consolidated Balance Sheets Location
|
2019
|
2018
|
|||||||
|
Money market funds
|
Cash and cash equivalents
|
$
|
237,071
|
|
$
|
551,804
|
|
||
|
Marketable equity investments
|
Marketable securities
|
44,127
|
|
—
|
|
||||
|
Non-marketable equity investments
|
Other assets
|
36,925
|
|
28,005
|
|
||||
|
$
|
318,123
|
|
$
|
579,809
|
|
||||
58
There were no adjustments made to the carrying value of the non-marketable equity investments as measured under the measurement alternative during fiscal
2019
. Realized and unrealized gains and losses associated with our equity investments consisted of the following (in thousands):
|
Year Ended January 31,
|
|||||||||||
|
2019
|
2018
|
2017
|
|||||||||
|
Net realized gains (losses) recognized on equity investments sold
|
$
|
8,333
|
|
$
|
720
|
|
$
|
65
|
|
||
|
Net unrealized gains (losses) recognized on equity investments held
|
32,127
|
|
(692
|
)
|
(15,000
|
)
|
|||||
|
Total net gains (losses) recognized in other income (expense), net
|
$
|
40,460
|
|
$
|
28
|
|
$
|
(14,935
|
)
|
||
Note 4. Fair Value Measurements
Assets and Liabilities Measured at Fair Value on a Recurring Basis
The following table presents information about our assets and liabilities that are measured at fair value on a recurring basis and their assigned levels within the valuation hierarchy as of
January 31, 2019
(in thousands):
|
Description
|
Level 1
|
Level 2
|
Level 3
|
Total
|
||||||||||||
|
U.S. treasury securities
|
$
|
396,230
|
|
$
|
—
|
|
$
|
—
|
|
$
|
396,230
|
|
||||
|
U.S. agency obligations
|
—
|
|
241,836
|
|
—
|
|
241,836
|
|
||||||||
|
Corporate bonds
|
—
|
|
419,768
|
|
—
|
|
419,768
|
|
||||||||
|
Commercial paper
|
—
|
|
254,173
|
|
—
|
|
254,173
|
|
||||||||
|
Money market funds
|
237,071
|
|
—
|
|
—
|
|
237,071
|
|
||||||||
|
Marketable equity investments
|
44,127
|
|
—
|
|
—
|
|
44,127
|
|
||||||||
|
Foreign currency derivative assets
|
—
|
|
22,570
|
|
—
|
|
22,570
|
|
||||||||
|
Total assets
|
$
|
677,428
|
|
$
|
938,347
|
|
$
|
—
|
|
$
|
1,615,775
|
|
||||
|
Foreign currency derivative liabilities
|
$
|
—
|
|
$
|
3,135
|
|
$
|
—
|
|
$
|
3,135
|
|
||||
|
Total liabilities
|
$
|
—
|
|
$
|
3,135
|
|
$
|
—
|
|
$
|
3,135
|
|
||||
The following table presents information about our assets and liabilities that are measured at fair value on a recurring basis and their assigned levels within the valuation hierarchy as of
January 31, 2018
(in thousands):
|
Description
|
Level 1
|
Level 2
|
Level 3
|
Total
|
||||||||||||
|
U.S. treasury securities
|
$
|
796,835
|
|
$
|
—
|
|
$
|
—
|
|
$
|
796,835
|
|
||||
|
U.S. agency obligations
|
—
|
|
682,424
|
|
—
|
|
682,424
|
|
||||||||
|
Corporate bonds
|
—
|
|
469,121
|
|
—
|
|
469,121
|
|
||||||||
|
Commercial paper
|
—
|
|
602,727
|
|
—
|
|
602,727
|
|
||||||||
|
Money market funds
|
551,804
|
|
—
|
|
—
|
|
551,804
|
|
||||||||
|
Foreign currency derivative assets
|
—
|
|
98
|
|
—
|
|
98
|
|
||||||||
|
Total assets
|
$
|
1,348,639
|
|
$
|
1,754,370
|
|
$
|
—
|
|
$
|
3,103,009
|
|
||||
|
Foreign currency derivative liabilities
|
$
|
—
|
|
$
|
32,912
|
|
$
|
—
|
|
$
|
32,912
|
|
||||
|
Total liabilities
|
$
|
—
|
|
$
|
32,912
|
|
$
|
—
|
|
$
|
32,912
|
|
||||
59
Fair Value Measurements of Other Financial Instruments
The following table presents the carrying amounts and estimated fair values of our financial instruments that are not recorded at fair value on the consolidated balance sheets (in thousands):
|
|
January 31, 2019
|
January 31, 2018
|
|||||||||||||
|
|
Net Carrying Amount
|
Estimated Fair Value
|
Net Carrying Amount
|
Estimated Fair Value
|
|||||||||||
|
0.75% Convertible senior notes
|
$
|
—
|
|
$
|
—
|
|
$
|
341,509
|
|
$
|
504,994
|
|
|||
|
1.50% Convertible senior notes
|
232,514
|
|
557,074
|
|
221,378
|
|
385,550
|
|
|||||||
|
0.25% Convertible senior notes
|
972,264
|
|
1,560,228
|
|
928,467
|
|
1,200,577
|
|
|||||||
The estimated fair values of the Notes, which we have classified as Level 2 financial instruments, were determined based on the quoted bid prices of the Notes in an over-the-counter market on the last trading day of fiscal
2019
and
2018
. The if-converted values of the 2020 and 2022 Notes exceeded the principal amounts by
$305 million
and
$269 million
, respectively. The if-converted values were determined based on the closing price of our common stock of
$181.53
on
January 31, 2019
. For further information, see Note 11.
Note 5. Deferred Costs
Deferred costs, which primarily consist of deferred sales commissions, were
$264 million
and
$204 million
as of
January 31, 2019
and
2018
, respectively. Amortization expense for the deferred costs was
$71 million
,
$58 million
, and
$45 million
for fiscal
2019
,
2018
, and
2017
, respectively. There was
no
impairment loss in relation to the costs capitalized for the periods presented.
Note 6. Property and Equipment, Net
Property and equipment, net consisted of the following (in thousands):
|
|
January 31,
|
||||||
|
|
2019
|
2018
|
|||||
|
Land
|
$
|
22,694
|
|
$
|
8,451
|
|
|
|
Buildings
|
433,863
|
|
255,093
|
|
|||
|
Computers, equipment, and software
|
539,090
|
|
425,025
|
|
|||
|
Furniture and fixtures
|
38,840
|
|
34,809
|
|
|||
|
Leasehold improvements
|
162,657
|
|
132,209
|
|
|||
|
Property and equipment, gross
(1)
|
1,197,144
|
|
855,587
|
|
|||
|
Less accumulated depreciation and amortization
|
(400,237
|
)
|
(308,978
|
)
|
|||
|
Property and equipment, net
|
$
|
796,907
|
|
$
|
546,609
|
|
|
|
(1)
|
Property and equipment, gross included construction-in-progress for owned real estate projects of
$355 million
and
$177 million
that had not yet been placed in service as of January 31,
2019
and
2018
, respectively.
|
Depreciation expense totaled
$147 million
,
$115 million
, and
$92 million
for fiscal
2019
,
2018
, and
2017
, respectively. Interest costs capitalized to property and equipment totaled
$11 million
,
$8 million
, and
$3 million
for fiscal
2019
,
2018
, and
2017
, respectively.
Note 7. Business Combinations
Fiscal 2019
Acquisition of Adaptive Insights
On August 1, 2018, we acquired all outstanding stock of Adaptive Insights, Inc. (“Adaptive Insights”) for
$1.5 billion
. The acquisition of Adaptive Insights, a cloud-based provider of business planning software, strengthens our product portfolio and will enable our customers to better plan, execute, and analyze in one system.
60
The purchase consideration transferred consisted of the following (in thousands):
|
Purchase Consideration
|
||||
|
Cash paid to common and preferred stockholders, warrant holders, and vested option holders
|
$
|
1,408,422
|
|
|
|
Debt repaid by Workday on behalf of Adaptive Insights
|
53,696
|
|
||
|
Transaction costs paid by Workday on behalf of Adaptive Insights
|
23,375
|
|
||
|
Fair value of assumed Adaptive Insights awards attributable to pre-combination services
(1)
|
5,424
|
|
||
|
Total purchase consideration
|
$
|
1,490,917
|
|
|
|
(1)
|
The assumed awards were primarily options, which were valued based upon the Black-Scholes option-pricing model.
|
The purchase consideration was preliminarily allocated to the tangible and intangible assets acquired and liabilities assumed based on their estimated fair values as of the acquisition date, with the excess recorded to goodwill as shown below. The fair values of assets acquired and liabilities assumed may change over the measurement period as additional information is received. The primary areas that are subject to change include current income taxes payable and deferred taxes. The measurement period will end no later than one year from the acquisition date.
The preliminary purchase consideration allocation, which includes measurement period adjustments, was as follows (in thousands):
|
Assets acquired:
|
||||
|
Cash and cash equivalents
|
$
|
37,892
|
|
|
|
Trade and other receivables, net
|
23,042
|
|
||
|
Prepaid expenses and other current assets and other assets
|
3,183
|
|
||
|
Property and equipment, net
|
2,246
|
|
||
|
Acquisition-related intangible assets, net
|
316,000
|
|
||
|
Total assets acquired
|
$
|
382,363
|
|
|
|
Liabilities assumed:
|
||||
|
Accounts payable
|
$
|
3,115
|
|
|
|
Accrued expenses and other current liabilities
|
9,092
|
|
||
|
Accrued compensation
|
13,545
|
|
||
|
Unearned revenue
(1)
|
67,754
|
|
||
|
Other liabilities
|
1,919
|
|
||
|
Total liabilities assumed
|
95,425
|
|
||
|
Net assets acquired, excluding goodwill
|
286,938
|
|
||
|
Total purchase consideration
|
1,490,917
|
|
||
|
Estimated goodwill
|
$
|
1,203,979
|
|
|
|
(1)
|
The cost build-up method was used to determine the fair value of unearned revenue.
|
The goodwill recognized was primarily attributable to the value of the acquired workforce, the opportunity to expand our customer base, and the ability to add breadth and depth to our product portfolio by accelerating our financial planning roadmap. The goodwill is not deductible for U.S. federal income tax purposes.
61
The fair value of the separately identifiable finite-lived intangible assets acquired and estimated useful lives are as follows (in thousands, except years):
|
Estimated Fair Values
|
Estimated Useful Lives
|
||||
|
Trade name
|
$
|
12,000
|
|
1.5
|
|
|
Developed technology
|
105,000
|
|
5.0
|
||
|
Customer relationships
|
188,000
|
|
9.0 - 10.0
|
||
|
Backlog
|
11,000
|
|
2.0
|
||
|
Total acquisition-related intangible assets
|
$
|
316,000
|
|
||
The fair values of the trade name and developed technology were determined utilizing the relief-from-royalty method, and the multi-period excess earnings method was utilized to fair value customer relationships and backlog. The valuation model inputs required the application of considerable judgment by management. The acquired finite-lived intangible assets have a total weighted-average amortization period of
7.6 years
. The weighted-average amortization period of customer relationships is
9.7 years
.
We have included the financial results of Adaptive Insights in our consolidated financial statements from the date of acquisition. One-time acquisition related transaction costs of
$25 million
were expensed as incurred during fiscal
2019
and were recorded within general and administrative expense in our consolidated statements of operations.
The pro forma financial information shown below summarizes the combined results of operations for Workday and Adaptive Insights as if the closing of the acquisition had occurred on February 1, 2017, the first day of our fiscal year 2018. The pro forma financial information includes adjustments that are directly attributable to the business combination and are factually supportable. The adjustments primarily reflect the amortization of acquired intangible assets, share-based compensation expense for replacement awards, as well as the pro forma tax impact for such adjustments. The pro forma financial information reflects
$67 million
of nonrecurring expenses related to acquisition costs and certain compensation expenses.
|
Year Ended January 31,
|
|||||||
|
2019
|
2018
|
||||||
|
(in thousands, except per share data)
|
|||||||
|
Total revenues
|
$
|
2,886,057
|
|
$
|
2,228,917
|
|
|
|
Net loss
|
(425,604
|
)
|
(529,404
|
)
|
|||
|
Net loss per share, basic and diluted
|
$
|
(1.96
|
)
|
$
|
(2.55
|
)
|
|
The pro forma financial information is presented for illustrative purposes only and is not necessarily indicative of the results of operations that would have been realized if the acquisition had taken place on February 1, 2017.
Other Fiscal 2019 Acquisitions
In the second quarter of fiscal 2019, we completed
two
acquisitions resulting in an increase of
$12 million
and
$16 million
in developed technology and goodwill, respectively.
Fiscal 2018
In the fourth quarter of fiscal 2018, we completed an acquisition resulting in an increase of
$5 million
and
$1 million
in developed technology and goodwill, respectively.
Fiscal 2017
In fiscal 2017, we acquired
two
businesses in order to expand our product and service offerings. We have included the financial results of the acquired businesses in our consolidated financial statements from the respective acquisition dates. The consideration paid for these acquisitions was
$148 million
, net of cash acquired.
62
The following table summarizes the estimated fair values of assets acquired and liabilities assumed in the business combinations during fiscal 2017 (in thousands):
|
Cash and cash equivalents
|
$
|
3,390
|
|
|
Other tangible assets
|
3,466
|
|
|
|
Developed technology
|
45,039
|
|
|
|
Customer relationships
|
1,000
|
|
|
|
Accounts payable and other liabilities
|
(3,256
|
)
|
|
|
Unearned revenue
|
(6,000
|
)
|
|
|
Net assets acquired
|
43,639
|
|
|
|
Goodwill
|
107,658
|
|
|
|
Total purchase consideration
|
$
|
151,297
|
|
The excess of purchase consideration over the fair value of net tangible and identifiable intangible assets acquired was recorded as goodwill. The goodwill balance is not deductible for U.S. income tax purposes.
Pro forma results of operations for these acquisitions have not been presented because they are not material to the consolidated results of operations, either individually or in aggregate.
Note 8. Acquisition-related Intangible Assets, Net
Acquisition-related intangible assets, net consisted of the following (in thousands):
|
January 31,
|
|||||||
|
|
2019
|
2018
|
|||||
|
Developed technology
|
$
|
186,800
|
|
$
|
69,700
|
|
|
|
Customer relationships
|
189,000
|
|
1,000
|
|
|||
|
Trade name
|
12,000
|
|
—
|
|
|||
|
Backlog
|
11,000
|
|
—
|
|
|||
|
|
398,800
|
|
70,700
|
|
|||
|
Less accumulated amortization
|
(85,560
|
)
|
(36,466
|
)
|
|||
|
Acquisition-related intangible assets, net
|
$
|
313,240
|
|
$
|
34,234
|
|
|
Amortization expense related to acquisition-related intangible assets was
$49 million
,
$19 million
, and
$13 million
for fiscal
2019
,
2018
, and
2017
, respectively.
As of
January 31, 2019
, our future estimated amortization expense related to acquisition-related intangible assets is as follows (in thousands):
|
Fiscal Period:
|
|||
|
2020
|
$
|
68,856
|
|
|
2021
|
48,142
|
|
|
|
2022
|
43,733
|
|
|
|
2023
|
41,009
|
|
|
|
2024
|
29,833
|
|
|
|
Thereafter
|
81,667
|
|
|
|
Total
|
$
|
313,240
|
|
63
Note 9. Other Assets
Other assets consisted of the following (in thousands):
|
|
January 31,
|
||||||
|
|
2019
|
2018
|
|||||
|
Non-marketable equity and other investments
|
$
|
50,546
|
|
$
|
29,205
|
|
|
|
Prepayments for computing infrastructure platforms
|
16,976
|
|
13,588
|
|
|||
|
Technology patents, net
|
19,416
|
|
11,217
|
|
|||
|
Acquired land leasehold interest, net
|
9,465
|
|
9,570
|
|
|||
|
Deposits
|
4,383
|
|
4,492
|
|
|||
|
Net deferred tax assets
|
4,544
|
|
1,884
|
|
|||
|
Other
|
42,030
|
|
39,762
|
|
|||
|
Total
|
$
|
147,360
|
|
$
|
109,718
|
|
|
Intangible assets with estimable useful lives, including primarily technology patents and acquired land leasehold interests, are amortized on a straight-line basis over their useful lives. As of
January 31, 2019
, the future estimated amortization expense is as follows (in thousands):
|
Fiscal Period:
|
|||
|
2020
|
$
|
3,360
|
|
|
2021
|
3,031
|
|
|
|
2022
|
2,617
|
|
|
|
2023
|
2,351
|
|
|
|
2024
|
2,049
|
|
|
|
Thereafter
|
16,392
|
|
|
|
Total
|
$
|
29,800
|
|
Note 10. Derivative Instruments
We conduct business on a global basis in multiple foreign currencies, subjecting Workday to foreign currency risk. To mitigate this risk, we utilize hedging contracts as described below. We do not enter into any derivatives for trading or speculative purposes.
Cash Flow Hedges
We are exposed to foreign currency fluctuations resulting from customer contracts denominated in foreign currencies. We have a hedging program in which we enter into foreign currency forward contracts related to certain customer contracts. We designate these forward contracts as cash flow hedging instruments as the accounting criteria for such designation have been met. The effective portion of the gains or losses resulting from changes in the fair value of these hedges is recorded in OCI on the consolidated balance sheets and will be subsequently reclassified to the related revenue line item on the consolidated statements of operations in the same period that the underlying revenues are earned. The changes in value of these contracts resulting from changes in forward points are excluded from the assessment of hedge effectiveness and are recorded as incurred in Other income (expense), net on the consolidated statements of operations. Cash flows from such forward contracts are classified as operating activities.
As of
January 31, 2019
and
2018
, we had outstanding foreign currency forward contracts designated as cash flow hedges with total notional values of
$717 million
and
$549 million
, respectively. All such contracts have maturities not greater than
36 months
. The notional value represents the amount that will be bought or sold upon maturity of the forward contract.
Foreign Currency Forward Contracts not Designated as Hedges
We also enter into foreign currency forward contracts to hedge a portion of our net outstanding monetary assets and liabilities. These forward contracts are not designated as hedging instruments under applicable accounting guidance, and therefore all changes in the fair value of the forward contracts are recorded in Other income (expense), net on the consolidated statements of operations. These forward contracts are intended to offset the foreign currency gains or losses associated with the underlying monetary assets and liabilities. Cash flows from such forward contracts are classified as operating activities.
64
As of
January 31, 2019
and
2018
, we had outstanding forward contracts not designated as hedges with total notional values of
$198 million
and
$75 million
, respectively.
The fair values of outstanding derivative instruments were as follows (in thousands):
|
Consolidated Balance Sheets Location
|
January 31,
|
|||||||||
|
2019
|
2018
|
|||||||||
|
Derivative Assets:
|
||||||||||
|
Foreign currency forward contracts designated as cash flow hedges
|
Prepaid expenses and other current assets
|
$
|
12,076
|
|
$
|
15
|
|
|||
|
Foreign currency forward contracts designated as cash flow hedges
|
Other assets
|
10,015
|
|
4
|
|
|||||
|
Foreign currency forward contracts not designated as hedges
|
Prepaid expenses and other current assets
|
459
|
|
79
|
|
|||||
|
Foreign currency forward contracts not designated as hedges
|
Other assets
|
20
|
|
—
|
|
|||||
|
Total Derivative Assets
|
$
|
22,570
|
|
$
|
98
|
|
||||
|
Derivative Liabilities:
|
||||||||||
|
Foreign currency forward contracts designated as cash flow hedges
|
Accrued expenses and other current liabilities
|
$
|
983
|
|
$
|
18,355
|
|
|||
|
Foreign currency forward contracts designated as cash flow hedges
|
Other liabilities
|
706
|
|
11,650
|
|
|||||
|
Foreign currency forward contracts not designated as hedges
|
Accrued expenses and other current liabilities
|
1,446
|
|
2,805
|
|
|||||
|
Foreign currency forward contracts not designated as hedges
|
Other liabilities
|
—
|
|
102
|
|
|||||
|
Total Derivative Liabilities
|
$
|
3,135
|
|
$
|
32,912
|
|
||||
Gains (losses) associated with foreign currency forward contracts designated as cash flow hedges were as follows (in thousands):
|
Consolidated Statements of Operations and Statements of Comprehensive Loss Locations
|
Year Ended January 31,
|
|||||||||||||
|
2019
|
2018
|
2017
|
||||||||||||
|
Gains (losses) recognized in OCI (effective portion)
(1)
|
Net change in market value of effective foreign currency forward exchange contracts
|
$
|
44,079
|
|
$
|
(45,869
|
)
|
$
|
2,145
|
|
||||
|
Gains (losses) reclassified from OCI into income (effective portion)
|
Revenues
|
(7,012
|
)
|
1,509
|
|
635
|
|
|||||||
|
Gains (losses) recognized in income (amount excluded from effectiveness testing and ineffective portion)
|
Other income (expense), net
|
13,868
|
|
1,607
|
|
1,386
|
|
|||||||
|
(1)
|
Of the total effective portion of foreign currency forward contracts designated as cash flow hedges as of
January 31, 2019
, net gains of
$2 million
are expected to be reclassified out of OCI within the next 12 months.
|
Gains (losses) associated with foreign currency forward contracts not designated as cash flow hedges were as follows (in thousands):
|
Consolidated Statements of Operations Location
|
Year Ended January 31,
|
|||||||||||||
|
Derivative Type
|
2019
|
2018
|
2017
|
|||||||||||
|
Foreign currency forward contracts not designated as hedges
|
Other income (expense), net
|
$
|
4,706
|
|
$
|
(5,641
|
)
|
$
|
662
|
|
||||
65
We are subject to master netting agreements with certain counterparties of the foreign exchange contracts, under which we are permitted to net settle transactions of the same currency with a single net amount payable by one party to the other. It is our policy to present the derivatives gross on the consolidated balance sheets. Our foreign currency forward contracts are not subject to any credit contingent features or collateral requirements. We manage our exposure to counterparty risk by entering into contracts with a diversified group of major financial institutions and by actively monitoring outstanding positions.
As of
January 31, 2019
, information related to these offsetting arrangements was as follows (in thousands):
|
Gross Amounts of Recognized Assets
|
Gross Amounts Offset on the Consolidated Balance Sheets
|
Net Amounts of Assets Presented on the Consolidated Balance Sheets
|
Gross Amounts Not Offset on the Consolidated Balance Sheets
|
Net Assets Exposed
|
|||||||||||||||||||
|
Financial Instruments
|
Cash Collateral Received
|
||||||||||||||||||||||
|
Derivative Assets:
|
|||||||||||||||||||||||
|
Counterparty A
|
$
|
2,305
|
|
$
|
—
|
|
$
|
2,305
|
|
$
|
(78
|
)
|
$
|
—
|
|
$
|
2,227
|
|
|||||
|
Counterparty B
|
18,053
|
|
—
|
|
18,053
|
|
(1,823
|
)
|
—
|
|
16,230
|
|
|||||||||||
|
Counterparty C
|
2,212
|
|
—
|
|
2,212
|
|
(1,234
|
)
|
—
|
|
978
|
|
|||||||||||
|
Total
|
$
|
22,570
|
|
$
|
—
|
|
$
|
22,570
|
|
$
|
(3,135
|
)
|
$
|
—
|
|
$
|
19,435
|
|
|||||
|
Gross Amounts of Recognized Liabilities
|
Gross Amounts Offset on the Consolidated Balance Sheets
|
Net Amounts of Liabilities Presented on the Consolidated Balance Sheets
|
Gross Amounts Not Offset on the Consolidated Balance Sheets
|
Net Liabilities Exposed
|
|||||||||||||||||||
|
Financial Instruments
|
Cash Collateral Pledged
|
||||||||||||||||||||||
|
Derivative Liabilities:
|
|||||||||||||||||||||||
|
Counterparty A
|
$
|
78
|
|
$
|
—
|
|
$
|
78
|
|
$
|
(78
|
)
|
$
|
—
|
|
$
|
—
|
|
|||||
|
Counterparty B
|
1,823
|
|
—
|
|
1,823
|
|
(1,823
|
)
|
—
|
|
—
|
|
|||||||||||
|
Counterparty C
|
1,234
|
|
—
|
|
1,234
|
|
(1,234
|
)
|
—
|
|
—
|
|
|||||||||||
|
Total
|
$
|
3,135
|
|
$
|
—
|
|
$
|
3,135
|
|
$
|
(3,135
|
)
|
$
|
—
|
|
$
|
—
|
|
|||||
Note 11. Convertible Senior Notes, Net
Convertible Senior Notes
In June 2013, we issued
0.75%
convertible senior notes due July 15, 2018 with a principal amount of
$350 million
. The 2018 Notes were unsecured, unsubordinated obligations, and interest was payable in cash in arrears at a fixed rate of
0.75%
on January 15 and July 15 of each year. During the second quarter of fiscal 2019, the 2018 Notes were converted by note holders and we repaid the
$350 million
principal balance in cash. We also distributed approximately
1.5 million
shares of our Class A common stock to note holders during the second quarter of fiscal 2019, which represents the conversion value in excess of the principal amount.
In June 2013, we issued
1.50%
convertible senior notes due July 15, 2020 with a principal amount of
$250 million
. The 2020 Notes are unsecured, unsubordinated obligations, and interest is payable in cash in arrears at a fixed rate of
1.50%
on January 15 and July 15 of each year. The 2020 Notes mature on
July 15, 2020
unless repurchased or converted in accordance with their terms prior to such date. We cannot redeem the 2020 Notes prior to maturity.
In September 2017, we issued
0.25%
convertible senior notes due October 1, 2022 with a principal amount of
$1.15 billion
. The 2022 Notes are unsecured, unsubordinated obligations, and interest is payable in cash in arrears at a fixed rate of
0.25%
on April 1 and October 1 of each year. The 2022 Notes mature on October 1, 2022 unless repurchased or converted in accordance with their terms prior to such date. We cannot redeem the 2022 Notes prior to maturity.
The terms of the Notes are governed by Indentures by and between us and Wells Fargo Bank, National Association, as Trustee (the “Indentures”). Upon conversion, holders of the Notes will receive cash, shares of Class A common stock, or a combination of cash and shares of Class A common stock, at our election.
66
For the 2020 Notes, the initial conversion rate is
12.2340
shares of Class A common stock per
$1,000
principal amount, which is equal to an initial conversion price of approximately
$81.74
per share of Class A common stock, subject to adjustment. Prior to the close of business on
March 13, 2020
, conversion of the 2020 Notes is subject to the satisfaction of certain conditions, as described below. For the 2022 Notes, the initial conversion rate is
6.7982
shares of Class A common stock per
$1,000
principal amount, which is equal to an initial conversion price of approximately
$147.10
per share of Class A common stock, subject to adjustment. Prior to the close of business on May 31, 2022, conversion of the 2022 Notes is subject to the satisfaction of certain conditions, as described below.
Holders of the Notes who convert their Notes in connection with certain corporate events that constitute a make-whole fundamental change (as defined in the Indentures) are, under certain circumstances, entitled to an increase in the conversion rate. Additionally, in the event of a corporate event that constitutes a fundamental change (as defined in the Indentures), holders of the Notes may require us to repurchase all or a portion of their Notes at a price equal to
100%
of the principal amount of the Notes, plus any accrued and unpaid interest.
Holders of the 2020 Notes and 2022 Notes may convert all or a portion of their Notes prior to the close of business on March 13, 2020 and May 31, 2022, respectively, in multiples of
$1,000
principal amount, only under the following circumstances:
|
•
|
if the last reported sale price of Class A common stock for at least
20
trading days during a period of
30
consecutive trading days ending on the last trading day of the immediately preceding fiscal quarter is greater than or equal to
130%
of the conversion price of the respective Notes on each applicable trading day;
|
|
•
|
during the
five
business day period after any
five
consecutive trading day period in which the trading price per
$1,000
principal amount of the respective Notes for each day of that
five
day consecutive trading day period was less than
98%
of the product of the last reported sale price of Class A common stock and the conversion rate of the respective Notes on such trading day; or
|
|
•
|
upon the occurrence of specified corporate events, as noted in the Indentures.
|
On or after March 15, 2020 for the 2020 Notes and June 1, 2022 for the 2022 Notes, holders of the respective Notes may convert their Notes at any time until the close of business on the second scheduled trading day immediately preceding the respective maturity date of their Notes.
In accounting for the issuance of the Notes, we separated each of the Notes into liability and equity components. The carrying amounts of the liability components were calculated by measuring the fair value of similar liabilities that do not have associated convertible features. The carrying amount of the equity components representing the conversion option were determined by deducting the fair value of the liability components from the par value of the respective Notes. These differences represent debt discounts that are amortized to interest expense over the respective terms of the Notes using the effective interest rate method. The equity components are not remeasured as long as they continue to meet the conditions for equity classification.
In accounting for the issuance costs related to the Notes, we allocated the total amount of issuance costs incurred to the liability and equity components based on their relative values. Issuance costs attributable to the liability components are being amortized on a straight-line basis, which approximates the effective interest rate method, to interest expense over the respective terms of the Notes. The issuance costs attributable to the equity components were netted against the respective equity components in Additional paid-in capital. For the 2018 Notes, we recorded liability issuance costs of
$7 million
and equity issuance costs of
$2 million
. Amortization expense for the liability issuance costs was less than
$1 million
for fiscal
2019
and
$1 million
for fiscal
2018
and
2017
, respectively. For the 2020 Notes, we recorded liability issuance costs of
$5 million
and equity issuance costs of
$2 million
. Amortization expense for the liability issuance costs was less than
$1 million
for fiscal
2019
,
2018
, and
2017
. For the 2022 Notes, we recorded liability issuance costs of
$14 million
and equity issuance costs of
$4 million
. Amortization expense for the liability issuance costs was
$3 million
and
$1 million
for fiscal
2019
and
2018
, respectively.
67
The Notes, net consisted of the following (in thousands):
|
|
January 31, 2019
|
January 31, 2018
|
||||||||||||||||||||||
|
|
2018 Notes
|
2020 Notes
|
2022 Notes
|
2018 Notes
|
2020 Notes
|
2022 Notes
|
||||||||||||||||||
|
Principal amounts:
|
||||||||||||||||||||||||
|
Principal
|
$
|
—
|
|
$
|
249,975
|
|
$
|
1,150,000
|
|
$
|
350,000
|
|
$
|
250,000
|
|
$
|
1,150,000
|
|
||||||
|
Unamortized debt discount
|
—
|
|
(16,480
|
)
|
(167,249
|
)
|
(7,850
|
)
|
(26,968
|
)
|
(208,188
|
)
|
||||||||||||
|
Unamortized debt issuance costs
|
—
|
|
(981
|
)
|
(10,487
|
)
|
(641
|
)
|
(1,654
|
)
|
(13,345
|
)
|
||||||||||||
|
Net carrying amount
|
$
|
—
|
|
$
|
232,514
|
|
$
|
972,264
|
|
$
|
341,509
|
|
$
|
221,378
|
|
$
|
928,467
|
|
||||||
|
Carrying amount of the equity component
(1)
|
$
|
74,887
|
|
$
|
66,007
|
|
$
|
219,702
|
|
$
|
74,892
|
|
$
|
66,007
|
|
$
|
219,702
|
|
||||||
|
(1)
|
Included on the consolidated balance sheets within Additional paid-in capital, net of
$2 million
,
$2 million
, and
$4 million
for the 2018 Notes, 2020 Notes, and 2022 Notes, respectively, in equity issuance costs.
|
As of January 31, 2019, the 2020 Notes and 2022 Notes have remaining lives of approximately
17 months
and
44 months
, respectively.
For more than
20
trading days during the
30
consecutive trading days ended April 30, 2018, July 31, 2018, October 31, 2018, and
January 31, 2019
, the last reported sale price of our Class A common stock exceeded
130%
of the conversion price of the 2020 Notes. As a result, the 2020 Notes were convertible at the option of the holders during the second, third, and fourth quarter of fiscal 2019 and will continue to be convertible during the first quarter of fiscal 2020. Accordingly, the 2020 Notes are classified as current on the condensed consolidated balance sheet as of
January 31, 2019
. From May 1, 2018 through the date of this filing, the amount of the principal balance of the 2020 Notes that has been converted or for which conversion has been requested was not material.
The effective interest rates of the liability components of the 2018 Notes, 2020 Notes, and 2022 Notes are
5.75%
,
6.25%
, and
4.60%
, respectively. These interest rates were based on the interest rates of similar liabilities at the time of issuance that did not have associated convertible features. The following table sets forth total interest expense recognized related to the Notes (in thousands):
|
Year Ended January 31,
|
||||||||||||||||||||||||||||||||||||
|
2019
|
2018
|
2017
|
||||||||||||||||||||||||||||||||||
|
2018 Notes
|
2020 Notes
|
2022 Notes
|
2018 Notes
|
2020 Notes
|
2022 Notes
|
2018 Notes
|
2020 Notes
|
2022 Notes
|
||||||||||||||||||||||||||||
|
Contractual interest expense
|
$
|
1,196
|
|
$
|
3,750
|
|
$
|
2,875
|
|
$
|
2,625
|
|
$
|
3,750
|
|
$
|
1,086
|
|
$
|
2,625
|
|
$
|
3,750
|
|
$
|
—
|
|
|||||||||
|
Interest cost related to amortization of debt issuance costs
|
641
|
|
673
|
|
2,858
|
|
1,409
|
|
673
|
|
1,080
|
|
1,408
|
|
675
|
|
—
|
|
||||||||||||||||||
|
Interest cost related to amortization of the debt discount
|
7,850
|
|
10,488
|
|
40,939
|
|
16,530
|
|
9,852
|
|
14,989
|
|
15,607
|
|
9,257
|
|
—
|
|
||||||||||||||||||
We capitalized interest costs related to the Notes of
$11 million
,
$8 million
, and
$3 million
for fiscal
2019
,
2018
, and
2017
, respectively.
68
Notes Hedges
In connection with the issuance of the Notes, we entered into convertible note hedge transactions with respect to our Class A common stock (“Purchased Options”). The Purchased Options relating to the 2018 Notes gave us the option to purchase, subject to anti-dilution adjustments substantially identical to those in the 2018 Notes, approximately
4.2 million
shares of our Class A common stock for
$83.28
per share, exercisable upon conversion of the 2018 Notes. During the second quarter of fiscal 2019, we received approximately
1.5 million
shares of our Class A common stock from the exercise of the Purchased Options relating to the 2018 Notes. These shares were recorded as treasury stock.
The Purchased Options relating to the 2020 Notes give us the option to purchase, subject to anti-dilution adjustments substantially identical to those in the 2020 Notes, approximately
3.1 million
shares of our Class A common stock for
$81.74
per share, exercisable upon conversion of the 2020 Notes. The Purchased Options relating to the 2022 Notes give us the option to purchase, subject to anti-dilution adjustments substantially identical to those in the 2022 Notes, approximately
7.8 million
shares of our Class A common stock for
$147.10
per share, exercisable upon conversion of the 2022 Notes. The Purchased Options will expire in 2020 for the 2020 Notes and in 2022 for the 2022 Notes, if not exercised earlier.
The Purchased Options are intended to offset potential economic dilution to our Class A common stock upon any conversion of the Notes. The Purchased Options are separate transactions and are not part of the terms of the Notes.
We paid an aggregate amount of
$144 million
for the Purchased Options relating to the 2018 Notes and 2020 Notes, and
$176 million
for the Purchased Options relating to the 2022 Notes. The amount paid for the Purchased Options is included in Additional paid-in capital on the consolidated balance sheets.
Warrants
In connection with the issuance of the Notes, we also entered into warrant transactions to sell warrants (“Warrants”) to acquire, subject to anti-dilution adjustments, up to approximately
4.2 million
shares over
60
scheduled trading days beginning in October 2018,
3.1 million
shares over
60
scheduled trading days beginning in October 2020, and
7.8 million
shares over
60
scheduled trading days beginning in January 2023 of our Class A common stock at an exercise price of
$107.96
,
$107.96
, and
$213.96
per share, respectively. If the Warrants are not exercised on their exercise dates, they will expire. If the market value per share of our Class A common stock exceeds the applicable exercise price of the Warrants, the Warrants will have a dilutive effect on our earnings per share assuming that we are profitable. The Warrants are separate transactions, and are not part of the terms of the Notes or the Purchased Options.
We received aggregate proceeds of
$93 million
from the sale of the Warrants related to the 2018 Notes and the 2020 Notes, and
$81 million
from the sale of the Warrants related to the 2022 Notes. The proceeds from the sale of the Warrants are recorded in Additional paid-in capital on the consolidated balance sheets.
During the third and fourth quarters of fiscal 2019, Warrants related to the 2018 Notes were exercised, and we distributed approximately
1.1 million
shares of our Class A common stock to warrant holders primarily utilizing treasury stock. The number of net shares distributed was determined based on the number of Warrants exercised multiplied by the difference between the exercise price of the Warrants and their daily volume weighted-average stock price. As of
January 31, 2019
, there were
zero
Warrants outstanding related to the 2018 Notes.
Note 12. Commitments and Contingencies
Facility and Computing Infrastructure-related Commitments
We have entered into non-cancelable agreements for certain of our offices and data centers with various expiration dates. Certain of our office leases are with an affiliate of our Chairman, David Duffield, who is also a significant stockholder (see Note 18). Our operating lease agreements generally provide for rental payments on a graduated basis and for options to renew, which could increase future minimum lease payments if exercised. This includes payments for office and data center square footage as well as data center power capacity for certain data centers. We generally recognize these expenses on a straight-line basis over the period in which we benefit from the lease. Total rent expense was
$99 million
,
$82 million
, and
$72 million
for fiscal
2019
,
2018
, and
2017
, respectively.
In
January 2014
, we entered into a
95
-year lease for a
6.9
-acre parcel of vacant land in Pleasanton, California, under which we paid
$2 million
for base rent from commencement through December 31, 2020. Annual rent payments of
$0.2 million
plus increases based on increases in the Consumer Price Index begin on January 1, 2021 and continue through the end of the lease.
Additionally, we have entered into non-cancelable agreements with computing infrastructure vendors with various expiration dates.
69
As of
January 31, 2019
, the future minimum payments by year for our non-cancelable leases and computing infrastructure platforms are as follows (in thousands):
|
Operating Leases, not including Related Party
|
Operating Leases with Related Party
|
Computing Infrastructure Platforms
|
|||||||||
|
2020
|
$
|
64,364
|
|
$
|
12,972
|
|
$
|
10,667
|
|
||
|
2021
|
53,116
|
|
16,178
|
|
14,000
|
|
|||||
|
2022
|
42,800
|
|
16,562
|
|
14,000
|
|
|||||
|
2023
|
33,114
|
|
16,952
|
|
19,000
|
|
|||||
|
2024
|
27,059
|
|
14,345
|
|
20,000
|
|
|||||
|
Thereafter
|
53,453
|
|
13,610
|
|
—
|
|
|||||
|
Total
|
$
|
273,906
|
|
$
|
90,619
|
|
$
|
77,667
|
|
||
Legal Matters
We are a party to various legal proceedings and claims that arise in the ordinary course of business. We make a provision for a liability relating to legal matters when it is both probable that a liability has been incurred and the amount of the loss can be reasonably estimated. These provisions are reviewed at least quarterly and adjusted to reflect the impacts of negotiations, settlements, rulings, advice of legal counsel, and other information and events pertaining to a particular matter. In our opinion, as of
January 31, 2019
, there was not at least a reasonable possibility that we had incurred a material loss, or a material loss in excess of a recorded accrual, with respect to such loss contingencies.
Note 13. Common Stock and Stockholders’ Equity
Common Stock
As of
January 31, 2019
, there were
157 million
shares of Class A common stock and
65 million
shares of Class B common stock outstanding. The rights of the holders of Class A common stock and Class B common stock are identical, except with respect to voting and conversion. Each share of Class A common stock is entitled to
one
vote per share and each share of Class B common stock is entitled to
10
votes per share. Each share of Class B common stock can be converted into a share of Class A common stock at any time at the option of the holder. All of our Class A and Class B shares will convert to a single class of common stock upon the date that is the first to occur of (i) October 11, 2032, (ii) such time as the shares of Class B common stock represent less than
9%
of the outstanding Class A and Class B common stock, (iii)
nine months
following the death of both Mr. Duffield and Mr. Bhusri, and (iv) the date on which the holders of a majority of the shares of Class B common stock elect to convert all shares of Class A common stock and Class B common stock into a single class of common stock.
Employee Equity Plans
Our 2012 Equity Incentive Plan (“EIP”) serves as the successor to our 2005 Stock Plan (together with the EIP, the “Stock Plans”). Pursuant to the terms of the EIP, the share reserve increased by
11 million
shares in March 2018. As of
January 31, 2019
, we had approximately
65 million
shares of Class A common stock available for future grants.
In connection with the acquisition of Adaptive Insights, we assumed unvested awards that had been granted under the Adaptive Insights, Inc. 2013 Equity Incentive Plan.
We also have a 2012 Employee Stock Purchase Plan. Under the ESPP, eligible employees are granted options to purchase shares at the lower of
85%
of the fair market value of the stock at the time of grant or
85%
of the fair market value at the time of exercise. Options to purchase shares are granted twice yearly on or about June 1 and December 1 and exercisable on or about the succeeding November 30 and May 31, respectively, of each year. As of
January 31, 2019
, approximately
6 million
shares of Class A common stock were available for issuance under the ESPP.
70
Restricted Stock Units
The Stock Plans provide for the issuance of RSUs to employees and non-employees. RSUs generally vest over
four
years. A summary of information related to RSU activity during fiscal
2019
is as follows:
|
Number of Shares
|
Weighted-Average Grant Date Fair Value
|
|||||
|
Balance as of January 31, 2018
|
12,819,516
|
|
$
|
84.77
|
|
|
|
RSUs granted
|
6,991,459
|
|
129.62
|
|
||
|
RSUs vested
|
(5,893,133
|
)
|
84.58
|
|
||
|
RSUs forfeited
|
(904,553
|
)
|
96.79
|
|
||
|
Balance as of January 31, 2019
|
13,013,289
|
|
$
|
108.12
|
|
|
The weighted-average grant-date fair value of RSUs granted during fiscal
2019
,
2018
, and
2017
was
$129.62
,
$88.90
, and
$75.71
, respectively. The total fair value of RSUs vested as of the vesting dates during fiscal
2019
,
2018
, and
2017
was
$801 million
,
$528 million
, and
$303 million
, respectively.
As of
January 31, 2019
, there was a total of
$1.2 billion
in unrecognized compensation cost related to unvested RSUs, which is expected to be recognized over a weighted-average period of approximately
2.7
years.
Performance-based Restricted Stock Units
During fiscal
2018
,
0.4 million
shares of PRSUs were granted to all employees other than executive management that included both service conditions and performance conditions related to company-wide goals. These performance conditions were met and the PRSUs vested on March 15, 2018. During fiscal
2019
, we recognized
$7 million
in compensation cost related to these PRSUs.
Additionally, during fiscal
2019
,
0.5 million
shares of PRSUs were granted to all employees other than executive management that included both service conditions and performance conditions related to company-wide goals. These performance conditions were met and the PRSU awards will vest if the individual employee continues to provide service through the vesting date of March 15, 2019. During fiscal
2019
, we recognized
$51 million
in compensation cost related to these PRSUs, and as of
January 31, 2019
, there was a total of
$15 million
in unrecognized compensation cost which is expected to be recognized over a weighted-average period of approximately
2
months.
Stock Options
The Stock Plans provide for the issuance of incentive and nonstatutory stock options to employees and non-employees. Stock options issued under the Stock Plans generally are exercisable for periods not to exceed
10
years and generally vest over
five years
. A summary of information related to stock option activity during fiscal
2019
is as follows (in millions, except share and per share data):
|
Outstanding Stock Options
|
Weighted-Average Exercise Price
|
Aggregate Intrinsic Value
|
||||||||
|
Balance as of January 31, 2018
|
6,595,486
|
|
$
|
4.23
|
|
$
|
763
|
|
||
|
Stock options assumed
|
1,103,942
|
|
26.84
|
|
|
|||||
|
Stock options exercised
|
(1,872,545
|
)
|
5.68
|
|
|
|||||
|
Stock options canceled
|
(46,141
|
)
|
18.77
|
|
|
|||||
|
Balance as of January 31, 2019
|
5,780,742
|
|
$
|
7.96
|
|
$
|
1,003
|
|
||
|
Vested and expected to vest as of January 31, 2019
|
5,706,507
|
|
$
|
7.66
|
|
$
|
992
|
|
||
|
Exercisable as of January 31, 2019
|
4,985,686
|
|
$
|
4.74
|
|
$
|
881
|
|
||
The total grant-date fair value of stock options vested during fiscal
2019
,
2018
, and
2017
was
$29 million
,
$5 million
, and
$14 million
, respectively. The total intrinsic value of stock options exercised during fiscal
2019
,
2018
, and
2017
was
$261 million
,
$234 million
, and
$273 million
, respectively. The intrinsic value is the difference between the current fair value of the stock and the exercise price of the stock option. The weighted-average remaining contractual life of vested and expected to vest stock options as of
January 31, 2019
is approximately
3.2
years.
71
As of
January 31, 2019
, there was a total of
$72 million
in unrecognized compensation cost related to unvested assumed stock options, which is expected to be recognized over a weighted-average period of approximately
2.3
years.
The stock options that are exercisable as of
January 31, 2019
have a weighted-average remaining contractual life of approximately
2.4
years. The weighted-average remaining contractual life of outstanding stock options as of
January 31, 2019
is approximately
3.3
years.
The weighted-average grant-date fair value of stock options assumed during fiscal 2019 was
$100.69
. The fair value of stock options assumed was estimated using the following assumptions:
|
Year Ended January 31, 2019
|
|
|
Expected volatility
|
31.5% – 34.3%
|
|
Expected term (in years)
|
0.03 – 2.42
|
|
Risk-free interest rate
|
2.10% – 2.72%
|
|
Dividend yield
|
—%
|
There were
no
stock options granted during fiscal 2019, 2018, or 2017.
Employee Stock Purchase Plan
For fiscal
2019
, approximately
1 million
shares of Class A common shares were purchased under the ESPP at a weighted-average price of
$96.12
per share, resulting in cash proceeds of
$83 million
.
The fair value of stock purchase rights granted under the ESPP was estimated using the following assumptions:
|
|
Year Ended January 31,
|
||||
|
2019
|
2018
|
2017
|
|||
|
Expected volatility
|
30.9% – 41.7%
|
25.3% – 32.0%
|
34.5% – 44.5%
|
||
|
Expected term (in years)
|
0.5
|
0.5
|
0.5
|
||
|
Risk-free interest rate
|
2.09% – 2.50%
|
1.11% – 1.45%
|
0.53% – 0.91%
|
||
|
Dividend yield
|
—%
|
—%
|
—%
|
||
|
Grant date fair value per share
|
$126.29 – $167.80
|
$98.39 – $100.52
|
$69.00 – $79.30
|
||
Note 14. Unearned Revenue and Performance Obligations
$1.4 billion
,
$1.0 billion
, and
$738 million
of subscription services revenue was recognized during fiscal
2019
,
2018
, and
2017
, respectively, that was included in the unearned revenue balances at the beginning of the respective periods. Professional services revenue recognized in the same periods from unearned revenue balances at the beginning of the respective periods was not material.
Transaction Price Allocated to the Remaining Performance Obligations
As of
January 31, 2019
, approximately
$6.7 billion
of revenue is expected to be recognized from remaining performance obligations for subscription contracts. We expect to recognize revenue on approximately
$4.47 billion
of these remaining performance obligations over the next
24
months, with the balance recognized thereafter. Revenue from remaining performance obligations for professional services contracts as of
January 31, 2019
was not material.
72
Note 15. Other Income (Expense), Net
Other income (expense), net consisted of the following (in thousands):
|
|
Year Ended January 31,
|
||||||||||
|
|
2019
|
2018
|
2017
|
||||||||
|
Interest income
|
$
|
42,461
|
|
$
|
25,252
|
|
$
|
11,303
|
|
||
|
Interest expense
(1)
|
(60,209
|
)
|
(44,549
|
)
|
(30,103
|
)
|
|||||
|
Other
(2)
|
57,280
|
|
7,734
|
|
(13,627
|
)
|
|||||
|
Other income (expense), net
|
$
|
39,532
|
|
$
|
(11,563
|
)
|
$
|
(32,427
|
)
|
||
|
(1)
|
Interest expense includes the contractual interest expense related to the 2018 Notes, 2020 Notes, and 2022 Notes and non-cash interest expense related to amortization of the debt discount and debt issuance costs, net of capitalized interest costs (for further information, see Note 11).
|
|
(2)
|
Other includes the net gains (losses) from our equity investments (for further information, see Note 3).
|
Note 16. Income Taxes
The components of loss before provision for (benefit from) income taxes were as follows (in thousands):
|
|
Year Ended January 31,
|
||||||||||
|
|
2019
|
2018
|
2017
|
||||||||
|
*As Adjusted
|
|||||||||||
|
Domestic
|
$
|
(263,505
|
)
|
$
|
(85,167
|
)
|
$
|
(190,043
|
)
|
||
|
Foreign
|
(160,247
|
)
|
(229,619
|
)
|
(195,470
|
)
|
|||||
|
Total
|
$
|
(423,752
|
)
|
$
|
(314,786
|
)
|
$
|
(385,513
|
)
|
||
|
*
|
For further information, see Note 1.
|
The provision for (benefit from) income taxes consisted of the following (in thousands):
|
|
Year Ended January 31,
|
||||||||||
|
|
2019
|
2018
|
2017
|
||||||||
|
Current:
|
|||||||||||
|
Federal
|
$
|
—
|
|
$
|
—
|
|
$
|
213
|
|
||
|
State
|
270
|
|
177
|
|
17
|
|
|||||
|
Foreign
|
6,596
|
|
4,251
|
|
3,573
|
|
|||||
|
Total
|
6,866
|
|
4,428
|
|
3,803
|
|
|||||
|
Deferred:
|
|||||||||||
|
Federal
|
(760
|
)
|
(535
|
)
|
(466
|
)
|
|||||
|
State
|
(2,446
|
)
|
(100
|
)
|
(52
|
)
|
|||||
|
Foreign
|
(9,154
|
)
|
2,643
|
|
(4,099
|
)
|
|||||
|
Total
|
(12,360
|
)
|
2,008
|
|
(4,617
|
)
|
|||||
|
Provision for (benefit from) income taxes
|
$
|
(5,494
|
)
|
$
|
6,436
|
|
$
|
(814
|
)
|
||
73
The items accounting for the difference between income taxes computed at the federal statutory income tax rate and the provision for (benefit from) income taxes consisted of the following:
|
|
Year Ended January 31,
|
|||||||
|
|
2019
|
2018
|
2017
|
|||||
|
*As Adjusted
|
||||||||
|
Federal statutory rate
|
21.0
|
%
|
33.8
|
%
|
35.0
|
%
|
||
|
Effect of:
|
||||||||
|
Foreign income at other than U.S. rates
|
(8.9
|
)%
|
(26.5
|
)%
|
(18.5
|
)%
|
||
|
Intercompany transactions
|
3.7
|
%
|
10.2
|
%
|
4.2
|
%
|
||
|
Research tax credits
|
12.6
|
%
|
9.1
|
%
|
6.4
|
%
|
||
|
State taxes, net of federal benefit
|
(0.1
|
)%
|
—
|
%
|
—
|
%
|
||
|
U.S. corporate tax rate reduction
|
—
|
%
|
(81.3
|
)%
|
—
|
%
|
||
|
Changes in valuation allowance
|
(39.7
|
)%
|
33.0
|
%
|
(20.4
|
)%
|
||
|
Stock compensation
|
12.7
|
%
|
20.0
|
%
|
(6.1
|
)%
|
||
|
Other
|
—
|
%
|
(0.4
|
)%
|
(0.4
|
)%
|
||
|
1.3
|
%
|
(2.1
|
)%
|
0.2
|
%
|
|||
|
*
|
For further information, see Note 1.
|
On December 22, 2017, the Tax Act was enacted into law and reduced the corporate income tax rate to 21% effective January 1, 2018. We adjusted our federal statutory rate to 21% for fiscal 2019 and to a blended rate of
33.8%
for fiscal 2018. In December 2017, the SEC staff issued Staff Accounting Bulletin No. 118,
Income Tax Accounting Implications of the Tax Cuts and Jobs Act
, which allows companies to record provisional amounts for the Tax Act during a measurement period not to extend beyond one year from the enactment date. As of January 31, 2019, we have completed our analysis and recorded no adjustments.
As a result of our history of net operating losses, the current provision for income taxes primarily relates to state income taxes and the current foreign provision from our profitable foreign entities. The benefit from domestic deferred federal and state income tax primarily relates to the release of the valuation allowance for certain intangibles from fiscal 2019 business acquisitions, where the balance for financial reporting exceeded the tax basis. The foreign deferred income tax benefit primarily relates to the application of intra-period tax allocation rules for the gains from other comprehensive income and the excess tax benefit in certain foreign jurisdictions from share-based compensation.
74
Significant components of our deferred tax assets and liabilities were as follows (in thousands):
|
January 31,
|
|||||||
|
2019
|
2018
|
||||||
|
Deferred tax assets:
|
|||||||
|
Unearned revenue
|
$
|
21,557
|
|
$
|
27,934
|
|
|
|
Other reserves and accruals
|
23,384
|
|
14,945
|
|
|||
|
Federal net operating loss carryforwards
|
602,310
|
|
422,235
|
|
|||
|
State and foreign net operating loss carryforwards
|
202,607
|
|
81,757
|
|
|||
|
Property and equipment
|
7,168
|
|
—
|
|
|||
|
Share-based compensation
|
51,233
|
|
39,294
|
|
|||
|
Research and development credits
|
164,555
|
|
110,694
|
|
|||
|
Intangibles
|
519,402
|
|
—
|
|
|||
|
Other
|
2,208
|
|
5,622
|
|
|||
|
1,594,424
|
|
702,481
|
|
||||
|
Valuation allowance
|
(1,515,945
|
)
|
(625,030
|
)
|
|||
|
Deferred tax assets, net of valuation allowance
|
78,479
|
|
77,451
|
|
|||
|
Deferred tax liabilities:
|
|||||||
|
Intangibles
|
—
|
|
(1,453
|
)
|
|||
|
Intercompany transactions
|
(29,885
|
)
|
(40,338
|
)
|
|||
|
Other prepaid assets
|
(448
|
)
|
(742
|
)
|
|||
|
Deferred commissions
|
(45,277
|
)
|
(29,231
|
)
|
|||
|
Property and equipment
|
—
|
|
(3,803
|
)
|
|||
|
(75,610
|
)
|
(75,567
|
)
|
||||
|
Net deferred tax assets
|
$
|
2,869
|
|
$
|
1,884
|
|
|
We regularly assess the need for a valuation allowance against our deferred tax assets by considering both positive and negative evidence related to whether it is more likely than not that our deferred tax assets will be realized. In evaluating the need for a valuation allowance, we consider the cumulative losses in recent years as a significant piece of negative evidence that is generally difficult to overcome. As of January 31, 2019, we continue to maintain a full valuation allowance against our U.S. federal, state, and certain foreign jurisdiction deferred tax assets.
As of
January 31, 2019
, we recorded a valuation allowance of
$1.5 billion
for the portion of the deferred tax assets that we do not expect to be realized. The valuation allowance on our net deferred tax assets increased by
$891 million
and
$333 million
during fiscal
2019
and
2018
, respectively. The increase in the valuation allowance during fiscal 2019 is mainly due to an increase in our deferred tax assets on tax deductible intangibles as the result of the adoption of ASU No. 2016-16,
Intra-Entity Transfers of Assets Other Than Inventory (Topic 740)
and our net operating losses during the fiscal year. The increase in the valuation allowance during fiscal 2018 was mainly due to an increase in our deferred tax assets on our net operating losses as a result of the recognition of excess tax benefits from share-based compensation resulting from the adoption of ASU No. 2016-09,
Improvements to Employee Share-Based Payment Accounting (Topic 718)
. This was partially offset by a decrease in our federal deferred tax assets resulting from the re-measurement of the corporate tax rate from 35% to 21%.
As of
January 31, 2019
, we had approximately
$2.8 billion
of federal,
$1.8 billion
of state, and
$703 million
of foreign net operating loss carryforwards available to offset future taxable income. If not utilized, the pre-fiscal 2018 federal and the state net operating loss carryforwards expire in varying amounts between fiscal 2020 and 2039. The federal net operating losses generated in and after fiscal 2018 and the foreign net operating losses do not expire and may be carried forward indefinitely.
We also had approximately
$128 million
of federal and
$123 million
of California research and development tax credit carryforwards as of
January 31, 2019
. The federal credits expire in varying amounts between fiscal 2023 and 2039. The California research credits do not expire and may be carried forward indefinitely.
Our ability to utilize the net operating loss and tax credit carryforwards in the future may be subject to substantial restrictions in the event of past or future ownership changes as defined in Section 382 of the Internal Revenue Code of 1986, as amended, and similar state tax law.
75
A reconciliation of the gross unrecognized tax benefit is as follows (in thousands):
|
|
Year Ended January 31,
|
||||||||||
|
|
2019
|
2018
|
2017
|
||||||||
|
Unrecognized tax benefits at the beginning of the period
|
$
|
107,849
|
|
$
|
116,801
|
|
$
|
98,460
|
|
||
|
Additions for tax positions taken in prior years
|
10,586
|
|
1,500
|
|
3,981
|
|
|||||
|
Reductions for tax positions taken in prior years
|
—
|
|
(8,121
|
)
|
—
|
|
|||||
|
Decrease for tax positions taken in prior years due to federal rate reduction
|
—
|
|
(10,062
|
)
|
—
|
|
|||||
|
Additions for tax positions related to the current year
|
12,336
|
|
7,731
|
|
14,475
|
|
|||||
|
Reductions related to a lapse of applicable statute of limitations
|
—
|
|
—
|
|
(115
|
)
|
|||||
|
Unrecognized tax benefits at the end of the period
|
$
|
130,771
|
|
$
|
107,849
|
|
$
|
116,801
|
|
||
Our policy is to include interest and penalties related to unrecognized tax benefits within our provision for income taxes. We did not accrue any interest expense or penalties during fiscal 2019, 2018, or 2017.
Of the total amount of unrecognized tax benefits of
$131 million
,
$2 million
, if recognized, would impact the effective tax rate, as of
January 31, 2019
.
We file federal, state, and foreign income tax returns in jurisdictions with varying statutes of limitations. Due to our net operating loss carryforwards, our income tax returns generally remain subject to examination by federal and most state and foreign tax authorities.
On December 1, 2015, the United States Tax Court issued its final decision with respect to Altera Corporation’s litigation with the Internal Revenue Service (“IRS”). The litigation relates to the treatment of share-based compensation expense in an inter-company cost-sharing arrangement with the taxpayer’s foreign subsidiary for fiscal 2004 through 2007. In its final decision, the Court accepted Altera’s position of excluding share-based compensation in its cost sharing arrangement and concluded that the related IRS Regulations were invalid. Subsequent to the decision, the IRS filed its appeal on February 23, 2016. Although the IRS has appealed the decision, based on the facts and circumstances of the Tax Court Case, we believe that it is more likely than not that the decision will be upheld. We have therefore recorded the effects of the decision and determined that there was no material impact to our effective tax rate and income tax expense due to our current full valuation allowance position. We will continue to monitor ongoing developments and potential impacts to our consolidated financial statements.
Note 17. Net Loss Per Share
Basic net loss per share attributable to common stockholders is computed by dividing the net loss attributable to common stockholders by the weighted-average number of shares of common stock outstanding during the period. Diluted net loss per share is computed by giving effect to all potential shares of common stock, including our outstanding stock options, outstanding warrants, common stock related to unvested early exercised stock options, common stock related to unvested restricted stock units and awards and convertible senior notes to the extent dilutive, and common stock issuable pursuant to the ESPP. Basic and diluted net loss per share was the same for each period presented, as the inclusion of all potential common shares outstanding would have been anti-dilutive.
The net loss per share attributable to common stockholders is allocated based on the contractual participation rights of the Class A common shares and Class B common shares as if the loss for the year had been distributed. As the liquidation and dividend rights are identical, the net loss attributable to common stockholders is allocated on a proportionate basis.
76
The following table presents the calculation of basic and diluted net loss attributable to common stockholders per share (in thousands, except per share data):
|
|
Year Ended January 31,
|
||||||||||||||||||||||
|
|
2019
|
2018
|
2017
|
||||||||||||||||||||
|
*As Adjusted
|
|||||||||||||||||||||||
|
|
Class A
|
Class B
|
Class A
|
Class B
|
Class A
|
Class B
|
|||||||||||||||||
|
Basic and diluted net loss attributable to Class A and Class B common stockholders per share:
|
|||||||||||||||||||||||
|
Numerator:
|
|||||||||||||||||||||||
|
Allocation of distributed net loss attributable to common stockholders
|
$
|
(287,021
|
)
|
$
|
(131,237
|
)
|
$
|
(208,159
|
)
|
$
|
(113,063
|
)
|
$
|
(236,946
|
)
|
$
|
(147,753
|
)
|
|||||
|
Denominator:
|
|||||||||||||||||||||||
|
Weighted-average common shares outstanding
|
148,767
|
|
68,022
|
|
134,642
|
|
73,132
|
|
122,085
|
|
76,129
|
|
|||||||||||
|
Basic and diluted net loss per share
|
$
|
(1.93
|
)
|
$
|
(1.93
|
)
|
$
|
(1.55
|
)
|
$
|
(1.55
|
)
|
$
|
(1.94
|
)
|
$
|
(1.94
|
)
|
|||||
|
*
|
For further information, see Note 1.
|
The anti-dilutive securities excluded from the weighted-average shares used to calculate the diluted net loss per common share were as follows (in thousands):
|
|
January 31,
|
|||||||
|
|
2019
|
2018
|
2017
|
|||||
|
Outstanding common stock options
|
5,781
|
|
6,595
|
|
9,097
|
|
||
|
Shares subject to repurchase
|
—
|
|
—
|
|
110
|
|
||
|
Unvested restricted stock awards, units, and PRSUs
|
13,551
|
|
13,209
|
|
12,155
|
|
||
|
Shares related to the convertible senior notes
|
10,876
|
|
15,079
|
|
7,261
|
|
||
|
Shares subject to warrants related to the issuance of convertible senior notes
|
10,876
|
|
15,079
|
|
7,261
|
|
||
|
Shares issuable pursuant to the ESPP
|
402
|
|
466
|
|
485
|
|
||
|
Total
|
41,486
|
|
50,428
|
|
36,369
|
|
||
Note 18. Related Party Transactions
We lease certain office space from an affiliate of our Chairman, Mr. Duffield, adjacent to our corporate headquarters in Pleasanton, California, under various lease agreements. The average term of the agreements is
8 years
. The total rent expense under these agreements was
$11 million
,
$8 million
, and
$8 million
for fiscal
2019
,
2018
, and
2017
, respectively.
77
Note 19. Geographic Information
Disaggregation of Revenue
We sell our subscription contracts and related services in two primary geographical markets: to customers located in the United States and to customers located outside of the United States. Revenue by geography is generally based on the address of the customer as specified in our master subscription agreement. The following table sets forth revenue by geographic area (in thousands):
|
|
Year Ended January 31,
|
||||||||||
|
|
2019
|
2018
|
2017
|
||||||||
|
*As Adjusted
|
|||||||||||
|
United States
|
$
|
2,173,346
|
|
$
|
1,694,347
|
|
$
|
1,283,475
|
|
||
|
Other countries
|
648,834
|
|
448,703
|
|
290,965
|
|
|||||
|
Total
|
$
|
2,822,180
|
|
$
|
2,143,050
|
|
$
|
1,574,440
|
|
||
|
*
|
Adjusted to reflect the adoption of ASU No. 2014-09,
Revenue from Contracts with Customers.
For further information, see Note 1.
|
Long-Lived Assets
We attribute our long-lived assets, which primarily consist of property and equipment, to a country based on the physical location of the assets. The following table sets forth Property and equipment, net by geographic area (in thousands):
|
January 31,
|
|||||||
|
|
2019
|
2018
|
|||||
|
United States
|
$
|
726,801
|
|
$
|
479,996
|
|
|
|
Ireland
|
55,306
|
|
52,904
|
|
|||
|
Other countries
|
14,800
|
|
13,709
|
|
|||
|
Total
|
$
|
796,907
|
|
$
|
546,609
|
|
|
Note 20. 401(k) Plan
We have a qualified defined contribution plan under Section 401(k) of the Internal Revenue Code covering eligible employees. In fiscal 2017, we began to match a certain portion of employee contributions up to a fixed maximum per employee. Our contributions to the plan were
$28 million
,
$15 million
, and
$6 million
in fiscal
2019
,
2018
, and
2017
, respectively.
Note 21. Selected Quarterly Financial Data (unaudited)
The following tables set forth selected unaudited quarterly consolidated statements of operations data for each of the eight quarters in fiscal
2019
and
2018
(in thousands except per share data):
|
|
Quarter ended
|
||||||||||||||||||||||||||||||
|
|
January 31, 2019
|
October 31, 2018
|
July 31, 2018
|
April 30, 2018
|
January 31, 2018
|
October 31, 2017
|
July 31, 2017
|
April 30, 2017
|
|||||||||||||||||||||||
|
Consolidated Statements of Operations Data:
|
|||||||||||||||||||||||||||||||
|
Total revenues
|
$
|
788,628
|
|
$
|
743,189
|
|
$
|
671,720
|
|
$
|
618,643
|
|
$
|
582,480
|
|
$
|
555,389
|
|
$
|
525,320
|
|
$
|
479,861
|
|
|||||||
|
Operating loss
|
(120,283
|
)
|
(182,755
|
)
|
(88,982
|
)
|
(71,264
|
)
|
(81,335
|
)
|
(80,059
|
)
|
(81,629
|
)
|
(60,200
|
)
|
|||||||||||||||
|
Net loss
|
(104,361
|
)
|
(153,331
|
)
|
(86,156
|
)
|
(74,410
|
)
|
(89,100
|
)
|
(85,546
|
)
|
(82,532
|
)
|
(64,044
|
)
|
|||||||||||||||
|
Net loss per share, basic and diluted
|
(0.47
|
)
|
(0.70
|
)
|
(0.40
|
)
|
(0.35
|
)
|
(0.42
|
)
|
(0.41
|
)
|
(0.40
|
)
|
(0.31
|
)
|
|||||||||||||||
78
ITEM 9. CHANGES IN AND DISAGREEMENTS WITH ACCOUNTANTS ON ACCOUNTING AND FINANCIAL DISCLOSURE
None.
ITEM 9A. CONTROLS AND PROCEDURES
(a) Evaluation of Disclosure Controls and Procedures
Under the supervision and with the participation of our management, including our principal executive officer and principal financial officer, we conducted an evaluation of the effectiveness of the design and operation of our disclosure controls and procedures, as defined in Rules 13a-15(e) and 15d-15(e) under the Exchange Act, as of the end of the period covered by this report.
In designing and evaluating our disclosure controls and procedures, management recognizes that any disclosure controls and procedures, no matter how well designed and operated, can provide only reasonable assurance of achieving the desired control objectives. In addition, the design of disclosure controls and procedures must reflect the fact that there are resource constraints and that management is required to apply its judgment in evaluating the benefits of possible controls and procedures relative to their costs.
Based on management’s evaluation, our principal executive officer and principal financial officer concluded that our disclosure controls and procedures are designed to, and are effective to, provide assurance at a reasonable level that the information we are required to disclose in reports that we file or submit under the Exchange Act is recorded, processed, summarized, and reported within the time periods specified in SEC rules and forms, and that such information is accumulated and communicated to our management, including our principal executive officer and principal financial officer, as appropriate, to allow timely decisions regarding required disclosures.
(b) Management’s Report on Internal Control Over Financial Reporting
Our management is responsible for establishing and maintaining adequate internal control over financial reporting (as defined in Rule 13a-15(f) under the Exchange Act). Management conducted an assessment of the effectiveness of our internal control over financial reporting based on the criteria set forth in Internal Control—Integrated Framework issued by the Committee of Sponsoring Organizations of the Treadway Commission (2013 framework). Based on the assessment, management has concluded that its internal control over financial reporting was effective as of
January 31, 2019
to provide reasonable assurance regarding the reliability of financial reporting and the preparation of financial statements in accordance with GAAP. Our independent registered public accounting firm, Ernst & Young LLP, has issued an audit report with respect to our internal control over financial reporting, which appears in Part II, Item 8 of this Annual Report on Form 10-K, and is incorporated herein by reference.
(c) Changes in Internal Control Over Financial Reporting
Under the supervision and with the participation of our management, including our principal executive officer and principal financial officer, we conducted an evaluation of any changes in our internal control over financial reporting (as such term is defined in Rules 13a-15(d) and 15d-15(d) under the Exchange Act) that occurred during our most recently completed fiscal quarter. Based on that evaluation, our principal executive officer and principal financial officer concluded that there has not been any material change in our internal control over financial reporting during the fourth quarter of fiscal
2019
that materially affected, or is reasonably likely to materially affect, our internal control over financial reporting.
(d) Limitations on Effectiveness of Controls and Procedures and Internal Control over Financial Reporting
In designing and evaluating the disclosure controls and procedures and internal control over financial reporting, management recognizes that any controls and procedures, no matter how well designed and operated, can provide only reasonable assurance of achieving the desired control objectives. In addition, the design of disclosure controls and procedures and internal control over financial reporting must reflect the fact that there are resource constraints and that management is required to apply judgment in evaluating the benefits of possible controls and procedures relative to their costs.
See Management’s Report on Internal Control over Financial Reporting above and the Report of Independent Registered Public Accounting Firm on our internal control over financial reporting in Item 8, which are incorporated herein by reference.
ITEM 9B. OTHER INFORMATION
None.
79
PART III
ITEM 10. DIRECTORS, EXECUTIVE OFFICERS, AND CORPORATE GOVERNANCE
The information concerning our directors, compliance with Section 16(a) of the Exchange Act, our Audit Committee and any changes to the process by which stockholders may recommend nominees to the Board required by this Item are incorporated herein by reference to information contained in the Proxy Statement, including “Proposal No. 1: Election of Directors,” “Directors and Corporate Governance” and “Section 16(a) Beneficial Ownership Reporting Compliance.”
The information concerning our executive officers required by this Item is incorporated herein by reference to information contained in the Proxy Statement including “Named Executive Officers and Other Executive Management.”
We have adopted a code of ethics, our Code of Conduct, which applies to all employees, including our principal executive officer, our principal financial officer, and all other executive officers. The Code of Conduct is available on our website at
www.workday.com/codeofconduct.
A copy may also be obtained without charge by contacting Investor Relations, Workday, Inc., 6110 Stoneridge Mall Road, Pleasanton, California 94588 or by calling (925) 951-9000.
We plan to post on our website at the address described above any future amendments or waivers of our Code of Conduct.
ITEM 11. EXECUTIVE COMPENSATION
The information required by this Item is incorporated herein by reference to information contained in the Proxy Statement, including “Directors and Corporate Governance” and “Executive Compensation.”
ITEM 12. SECURITY OWNERSHIP OF CERTAIN BENEFICIAL OWNERS AND MANAGEMENT AND RELATED STOCKHOLDER MATTERS
The information required by this Item is incorporated herein by reference to information contained in the Proxy Statement, including “Equity Compensation Plan Information” and “Security Ownership of Certain Beneficial Owners and Management.”
ITEM 13. CERTAIN RELATIONSHIPS AND RELATED TRANSACTIONS AND DIRECTOR INDEPENDENCE
The information required by this Item is incorporated herein by reference to information contained in the Proxy Statement, including “Directors and Corporate Governance,” “Related Party Transactions,” and “Employment Arrangements and Indemnification Agreements.”
ITEM 14. PRINCIPAL ACCOUNTANT FEES AND SERVICES
The information required by this Item is incorporated herein by reference to information contained in the Proxy Statement, including “Proposal No. 2: Ratification of Appointment of Independent Registered Public Accounting Firm.”
80
PART IV
ITEM 15. EXHIBITS AND FINANCIAL STATEMENT SCHEDULES
1. Consolidated Financial Statements
See Index to Consolidated Financial Statements at Item 8 herein.
2. Financial Statement Schedules
All schedules have been omitted because they are not required, not applicable, or not present in amounts sufficient to require submission of the schedule.
3. Exhibits
|
Exhibit
No.
|
Exhibit
|
Incorporated by Reference
|
Filed
Herewith
|
|||||||||
|
Form
|
File No.
|
Filing Date
|
Exhibit No.
|
|||||||||
|
2.1+
|
8-K
|
001-35680
|
August 1, 2018
|
2.1
|
||||||||
|
3.1
|
10-Q
|
001-35680
|
December 7, 2012
|
3.1
|
||||||||
|
3.2
|
8-K
|
001-35680
|
June 5, 2015
|
3.1
|
||||||||
|
4.1
|
S-1/A
|
333-183640
|
October 1, 2012
|
4.1
|
||||||||
|
4.2
|
S-8
|
333-184395
|
October 12, 2012
|
4.9
|
||||||||
|
4.3
|
8-K
|
001-35680
|
June 17, 2013
|
4.2
|
||||||||
|
4.4
|
8-K
|
001-35680
|
September 15, 2017
|
4.1
|
||||||||
|
4.5
|
8-K
|
001-35680
|
January 2, 2018
|
4.3
|
||||||||
|
4.6
|
8-K
|
001-35680
|
January 2, 2018
|
4.4
|
||||||||
|
4.7
|
10-Q
|
001-35680
|
June 1, 2018
|
4.1
|
||||||||
|
10.1
|
S-1
|
333-183640
|
August 30, 2012
|
10.1
|
||||||||
|
10.2†
|
10-Q
|
001-35680
|
June 5, 2013
|
10.12
|
||||||||
|
10.3†
|
S-8
|
333-187665
|
April 2, 2013
|
4.4
|
||||||||
|
10.4†
|
X
|
|||||||||||
|
10.5†
|
10-Q
|
001-35680
|
December 3, 2018
|
10.1
|
||||||||
|
10.6†
|
S-8
|
333-226907
|
August 17, 2018
|
99.1
|
||||||||
|
10.7†
|
S-8
|
333-226907
|
August 17, 2018
|
99.2
|
||||||||
81
|
10.8†
|
S-1
|
333-183640
|
August 30, 2012
|
10.6
|
||||||||
|
10.9†
|
10-K
|
001-35680
|
March 31, 2014
|
10.9
|
|
|||||||
|
10.10†
|
10-Q
|
001-35680
|
June 1, 2016
|
10.11
|
||||||||
|
10.11†
|
X
|
|||||||||||
|
10.12
|
S-1
|
333-183640
|
August 30, 2012
|
10.8
|
||||||||
|
10.13
|
10-K
|
001-35680
|
March 31, 2014
|
10.11
|
|
|||||||
|
10.14
|
S-1/A
|
333-183640
|
October 1, 2012
|
10.11
|
||||||||
|
10.15
|
8-K
|
001-35680
|
June 17, 2013
|
99.3
|
||||||||
|
10.16
|
8-K
|
001-35680
|
June 17, 2013
|
99.4
|
||||||||
|
10.17
|
8-K
|
001-35680
|
June 24, 2013
|
99.3
|
||||||||
|
10.18
|
8-K
|
001-35680
|
June 24, 2013
|
99.4
|
||||||||
|
10.19
|
8-K
|
001-35680
|
September 15, 2017
|
99.1
|
||||||||
|
10.20
|
8-K
|
001-35680
|
September 15, 2017
|
99.2
|
||||||||
|
10.21
|
8-K
|
001-35680
|
September 15, 2017
|
99.3
|
||||||||
|
10.22
|
8-K
|
001-35680
|
September 15, 2017
|
99.4
|
||||||||
|
21.1
|
X
|
|||||||||||
|
23.1
|
X
|
|||||||||||
|
24.1
|
X
|
|||||||||||
|
31.1
|
X
|
|||||||||||
|
31.2
|
|
|
|
|
|
|
X
|
|||||
82
|
32.1*
|
|
|
|
|
|
|
X
|
|||||
|
32.2*
|
|
|
|
|
|
|
X
|
|||||
|
101.INS
|
|
XBRL Instance Document
|
|
|
|
|
|
X
|
||||
|
101.SCH
|
|
XBRL Taxonomy Extension Schema Document
|
|
|
|
|
|
X
|
||||
|
101.CAL
|
|
XBRL Taxonomy Extension Calculation Linkbase Document
|
|
|
|
|
|
X
|
||||
|
101.DEF
|
|
XBRL Taxonomy Extension Definition Linkbase Document
|
|
|
|
|
|
X
|
||||
|
101.LAB
|
|
XBRL Taxonomy Extension Label Linkbase Document
|
|
|
|
|
|
X
|
||||
|
101.PRE
|
|
XBRL Taxonomy Extension Presentation Linkbase Document
|
|
|
|
|
|
X
|
||||
|
+
|
The Company has omitted schedules and similar attachments to the merger agreement pursuant to Item 601(b) of Regulation S-K. The Company will furnish a copy of any omitted schedule or similar attachment to the Securities and Exchange Commission upon request.
|
|
†
|
Indicates a management contract or compensatory plan.
|
|
*
|
As contemplated by SEC Release No. 33-8212, these exhibits are furnished with this Annual Report on Form 10-K and are not deemed filed with the Securities and Exchange Commission and are not incorporated by reference in any filing of Workday, Inc. under the Securities Act of 1933 or the Exchange Act of 1934, whether made before or after the date hereof and irrespective of any general incorporation language in such filings.
|
83
ITEM 16. FORM 10-K SUMMARY
Not applicable.
84
SIGNATURES
Pursuant to the requirements of Section 13 or 15(d) of the Securities Exchange Act of 1934, the Registrant has duly caused this Annual Report on Form 10-K to be signed on its behalf by the undersigned, thereunto duly authorized, in the City of Pleasanton, State of California, on this 15th day of March,
2019
.
|
WORKDAY, INC.
|
|
|
/s/ Robynne D. Sisco
|
|
|
Robynne D. Sisco
Co-President and Chief Financial Officer (Principal Financial and Accounting Officer)
|
|
POWER OF ATTORNEY
KNOW ALL PERSONS BY THESE PRESENTS, that each person whose signature appears below constitutes and appoints Robynne D. Sisco or Juliana Capata, or any of them, his or her attorneys-in-fact, for such person in any and all capacities, to sign any amendments to this report and to file the same, with exhibits thereto, and other documents in connection therewith, with the Securities and Exchange Commission, hereby ratifying and confirming all that either of said attorneys-in-fact, or substitute or substitutes, may do or cause to be done by virtue hereof.
Pursuant to the requirements of the Securities Exchange Act of 1934, this report has been signed below by the following persons on behalf of the Registrant and in the capacities and on the dates indicated.
|
Signature
|
|
Title
|
|
Date
|
|
/s/ Aneel Bhusri
|
|
Chief Executive Officer
|
|
March 15, 2019
|
|
Aneel Bhusri
|
(Principal Executive Officer)
|
|||
|
/s/ Robynne D. Sisco
|
|
Co-President and Chief Financial Officer
|
|
March 15, 2019
|
|
Robynne D. Sisco
|
(Principal Financial and Accounting Officer)
|
|||
|
/s/ A. George Battle
|
|
Director
|
|
March 15, 2019
|
|
A. George Battle
|
||||
|
/s/ Christa Davies
|
|
Director
|
|
March 15, 2019
|
|
Christa Davies
|
||||
|
/s/ David A. Duffield
|
Director
|
March 15, 2019
|
||
|
David A. Duffield
|
|
|
||
|
/s/ Carl M. Eschenbach
|
|
Director
|
|
March 15, 2019
|
|
Carl M. Eschenbach
|
||||
|
/s/ Michael M. McNamara
|
|
Director
|
|
March 15, 2019
|
|
Michael M. McNamara
|
||||
|
/s/ Michael A. Stankey
|
|
Director
|
|
March 15, 2019
|
|
Michael A. Stankey
|
||||
|
/s/ George J. Still, Jr.
|
|
Director
|
|
March 15, 2019
|
|
George J. Still, Jr.
|
||||
|
/s/ Lee J. Styslinger III
|
|
Director
|
|
March 15, 2019
|
|
Lee J. Styslinger III
|
||||
|
/s/ Jerry Yang
|
|
Director
|
|
March 15, 2019
|
|
Jerry Yang
|
||||
85
TABLE OF CONTENTS
Part IItem 1. BusinessItem 1A. Risk FactorsItem 1B. Unresolved Staff CommentsItem 2. PropertiesItem 3. Legal ProceedingsItem 4. Mine Safety DisclosuresPart IIItem 5. Market For Registrant S Common Equity, Related Stockholder Matters, and Issuer Purchases Of Equity SecuritiesItem 6. Selected Consolidated Financial DataItem 7. Management S Discussion and Analysis Of Financial Condition and Results Of OperationsItem 7A. Quantitative and Qualitative Disclosures About Market RiskItem 8. Consolidated Financial Statements and Supplementary DataNote 1. Overview and Basis Of PresentationNote 2. Accounting Standards and Significant Accounting PoliciesNote 3. InvestmentsNote 4. Fair Value MeasurementsNote 5. Deferred CostsNote 6. Property and Equipment, NetNote 7. Business CombinationsNote 8. Acquisition-related Intangible Assets, NetNote 9. Other AssetsNote 10. Derivative InstrumentsNote 11. Convertible Senior Notes, NetNote 12. Commitments and ContingenciesNote 13. Common Stock and Stockholders EquityNote 14. Unearned Revenue and Performance ObligationsNote 15. Other Income (expense), NetNote 16. Income TaxesNote 17. Net Loss Per ShareNote 18. Related Party TransactionsNote 19. Geographic InformationNote 20. 401(k) PlanNote 21. Selected Quarterly Financial Data (unaudited)Item 9. Changes in and Disagreements with Accountants on Accounting and Financial DisclosureItem 9A. Controls and ProceduresItem 9B. Other InformationPart IIIItem 10. Directors, Executive Officers, and Corporate GovernanceItem 11. Executive CompensationItem 12. Security Ownership Of Certain Beneficial Owners and Management and Related Stockholder MattersItem 13. Certain Relationships and Related Transactions and Director IndependenceItem 14. Principal Accountant Fees and ServicesPart IVItem 15. Exhibits and Financial Statement SchedulesItem 16. Form 10-k Summary