WESTERN DIGITAL CORP
10-Ks and 10-Qs
|
|
|
|
|
|
|
|
|
|
|
|
|
|
|
|
|
|
|
|
|
|
|
|
|
|
|
|
|
|
|
|
|
|
|
|
|
|
|
|
|
|
|
|
|
|
|
|
|
|
|
|
|
|
|
|
|
|
|
|
|
|
|
|
|
UNITED STATES
SECURITIES AND EXCHANGE COMMISSION
Washington, D.C. 20549
__________________________
Form 10-K
__________________________
(Mark One)
|
x
|
ANNUAL REPORT PURSUANT TO SECTION 13 OR 15(d) OF THE SECURITIES EXCHANGE ACT OF 1934
|
For the fiscal year ended
July 1, 2016
Or
|
¨
|
TRANSITION REPORT PURSUANT TO SECTION 13 OR 15(d) OF THE SECURITIES EXCHANGE ACT OF 1934
|
For the transition period from
to
Commission file number 1-8703
__________________________

WESTERN DIGITAL CORPORATION
(Exact Name of Registrant as Specified in Its Charter)
__________________________
|
Delaware
|
|
33-0956711
|
|
State or Other Jurisdiction of
Incorporation or Organization
|
|
(I.R.S. Employer
Identification No.)
|
|
3355 Michelson Drive, Suite 100
Irvine, California
|
|
92612
|
|
(Address of principal executive offices)
|
|
(Zip Code)
|
Registrant’s telephone number, including area code: (949) 672-7000
Securities registered pursuant to Section 12(b) of the Act:
|
Title of each class
|
|
Name of each exchange on which registered
|
|
Common Stock, $.01 Par Value Per Share
|
|
The NASDAQ Stock Market LLC
|
|
|
(NASDAQ Global Select Market)
|
|
Securities registered pursuant to Section 12(g) of the Act:
None
__________________________
Indicate by check mark if the registrant is a well-known seasoned issuer, as defined in Rule 405 of the Securities Act. Yes
x
No
¨
Indicate by check mark if the registrant is not required to file reports pursuant to Section 13 or Section 15(d) of the Act. Yes
¨
No
x
Indicate by check mark whether the registrant: (1) has filed all reports required to be filed by Section 13 or 15(d) of the Securities Exchange Act of 1934 during the preceding 12 months (or for such shorter period that the registrant was required to file such reports), and (2) has been subject to such filing requirements for the past 90 days. Yes
x
No
¨
Indicate by checkmark whether the registrant has submitted electronically and posted on its corporate website, if any, every Interactive Data File required to be submitted and posted pursuant to Rule 405 of Regulation S-T (§ 232.405 of this chapter) during the preceding 12 months (or for such shorter period that the registrant was required to submit and post such files). Yes
x
No
¨
Indicate by check mark if disclosure of delinquent filers pursuant to Item 405 of Regulation S-K (§ 229.405 of this chapter) is not contained herein, and will not be contained, to the best of registrant’s knowledge, in definitive proxy or information statements incorporated by reference in Part III of this Form 10-K or any amendment to this Form 10-K.
¨
Indicate by check mark whether the registrant is a large accelerated filer, an accelerated filer, a non-accelerated filer, or a smaller reporting company. See the definitions of “large accelerated filer,” “accelerated filer” and “smaller reporting company” in Rule 12b-2 of the Exchange Act. (Check one):
|
Large accelerated filer
|
|
x
|
|
Accelerated filer
|
|
¨
|
|
Non-accelerated filer
|
|
¨
(Do not check if a smaller reporting company)
|
|
Smaller reporting
company
|
|
¨
|
Indicate by check mark whether the registrant is a shell company (as defined in Rule 12b-2 of the Act). Yes
¨
No
x
The aggregate market value of the registrant’s common stock held by non-affiliates of the registrant on December 31, 2015, the last business day of the registrant’s most recently completed second fiscal quarter, was
$14 billion
, based on the closing sale price as reported on the NASDAQ Global Select Market.
As of the close of business on
August 11, 2016
,
284,264,636
shares of common stock, par value $.01 per share, were outstanding.
__________________________
Documents Incorporated by Reference
Part III incorporates by reference certain information from the registrant’s definitive proxy statement (the “Proxy Statement”) for the
2016
Annual Meeting of Stockholders, which will be filed with the Securities and Exchange Commission within 120 days after the end of the
2016
fiscal year. Except with respect to information specifically incorporated by reference in this Form 10-K, the Proxy Statement is not deemed to be filed as part hereof.
WESTERN DIGITAL CORPORATION
INDEX TO ANNUAL REPORT ON FORM 10-K
For the Fiscal Year Ended
July 1, 2016
|
|
Page
|
Unless otherwise indicated, references herein to specific years and quarters are to our fiscal years and fiscal quarters, and references to financial information are on a consolidated basis. As used herein, the terms “we,” “us,” “our,” the “Company,” “WDC” and “Western Digital” refer to Western Digital Corporation and its subsidiaries, unless we state, or the context indicates, otherwise.
WDC, a Delaware corporation, is the parent company of our data storage business. Our principal executive offices are located at 3355 Michelson Drive, Suite 100, Irvine, California 92612. Our telephone number is (949) 672-7000, and our website is www.westerndigital.com. The information on our website is not incorporated in this Annual Report on Form 10-K.
Western Digital, WD, the WD logo, the HGST logo, SanDisk and G-Technology are registered trademarks or trademarks of Western Digital or its affiliates in the U.S. and/or other countries. All other trademarks, registered trademarks and/or service marks, indicated or otherwise, are the property of their respective owners.
2
Forward-Looking Statements
This document contains forward-looking statements within the meaning of the federal securities laws. Any statements that do not relate to historical or current facts or matters are forward-looking statements. You can identify some of the forward-looking statements by the use of forward-looking words, such as “may,” “will,” “could,” “would,” “project,” “believe,” “anticipate,” “expect,” “estimate,” “continue,” “potential,” “plan,” “forecast,” and the like, or the use of future tense. Statements concerning current conditions may also be forward-looking if they imply a continuation of current conditions. Examples of forward-looking statements include, but are not limited to, statements concerning:
|
•
|
expectations concerning the anticipated benefits of our acquisition of SanDisk Corporation;
|
|
•
|
expectations regarding the integration of our HGST and WD subsidiaries following the decision by the Ministry of Commerce of the People’s Republic of China in October 2015;
|
|
•
|
expectations regarding the growth of digital data and demand for digital storage;
|
|
•
|
expectations regarding our business strategy, our ability to execute that strategy and its intended benefits;
|
|
•
|
expectations with respect to relationships with our customers, employees, suppliers and strategic partners;
|
|
•
|
our plans to develop and invest in new products and expand into new storage markets and into emerging economic markets;
|
|
•
|
expectations regarding the personal computer market and the emergence of new storage markets for our products;
|
|
•
|
expectations regarding the amount and timing of charges and cash expenditures associated with our restructuring activities;
|
|
•
|
our quarterly cash dividend policy;
|
|
•
|
expectations regarding the outcome of legal proceedings in which we are involved;
|
|
•
|
expectations regarding the repatriation of funds from our foreign operations;
|
|
•
|
our beliefs regarding tax benefits and the timing of future payments, if any, relating to the unrecognized tax benefits, and the adequacy of our tax provisions;
|
|
•
|
expectations regarding capital investments and sources of funding for those investments;
|
|
•
|
our beliefs regarding the sufficiency of our available liquidity to meet our working capital, debt, dividend and capital expenditure needs; and
|
|
•
|
expectations regarding our debt financing plans.
|
Forward-looking statements are subject to risks and uncertainties that could cause actual results to differ materially from those expressed in the forward-looking statements. You are urged to carefully review the disclosures we make concerning risks and other factors that may affect our business and operating results, including those made in Part I, Item 1A of this Annual Report on Form 10-K, and any of those made in our other reports filed with the Securities and Exchange Commission. You are cautioned not to place undue reliance on these forward-looking statements, which speak only as of the date of this document. We do not intend, and undertake no obligation, to publish revised forward-looking statements to reflect events or circumstances after the date of this document or to reflect the occurrence of unanticipated events.
3
Item 1.
Business
General
Western Digital is a leading developer, manufacturer and provider of data storage devices and solutions that address the evolving needs of the information technology (“IT”) industry and the infrastructure that enables the proliferation of data in virtually every industry. Our broad portfolio of offerings addresses three categories: Datacenter Devices and Solutions (capacity and performance enterprise hard disk drives (“HDDs”), enterprise solid state drives (“SSDs”), datacenter software and system solutions); Client Devices (mobile, desktop, gaming and digital video hard drives, client SSDs, embedded products and wafers); and Client Solutions (removable products, hard drive content solutions and flash content solutions). We also generate license and royalty revenue related to our intellectual property which is included in each of the three categories.
We have a rich heritage of innovation, operational execution, deep intellectual property assets and broad research and development (“R&D”) capabilities. The landscape of storage markets we serve is changing rapidly in terms of how data is being used, stored and monetized, while data growth is continuing unabated. We estimate that on a worldwide basis, the rate at which data is generated will likely expand at approximately
40%
per annum for the next several years. We are transforming ourselves to address this growth by providing the broadest range of storage technologies, product portfolio and global reach in the industry. Founded in 1970 and headquartered in Irvine, California, Western Digital has approximately
11,300
engineers, and one of the technology industry’s most valuable patent portfolios with more than
13,500
patents awarded worldwide. Since 2009, we have been a Standard & Poor’s, or S&P, 500 company.
Built on decades of expertise in developing leading technology and components, we are enabling enterprises to collect virtually limitless sets of data, and helping cloud providers build more powerful, cost effective and efficient datacenters. We have relationships with the full range of original equipment manufacturers (“OEM”) and datacenter customers currently addressing storage opportunities, including storage subsystem suppliers, major server OEMs, Internet and social media infrastructure players, and personal computer (“PC”) and Mac™ OEMs. We have also built strong consumer brands by providing people with effective tools to manage fast-accumulating libraries of personal content. We market our products primarily under the HGST, SanDisk and WD brands, and our products are sold through distribution, retail and direct channels worldwide.
We believe we are well positioned to capitalize on the ongoing expansion in digital content generation and management. These trends are linked directly to commercial enterprises’ and consumers’ increasingly ubiquitous experience with data and the increasing value of that data. The confluence of data growth and the ability to expand the extraction of value from data are driving the need for the long-term retention of as much data as possible for legal and regulatory purposes and for potential future refinements in a wide range of fields, including advertising, aerospace, e-commerce, energy, medical, mining and security surveillance. We believe the ways in which people and organizations are creating and using data are changing and that the amount of data considered useful to store is expanding. Increasingly, more and more digital content is being stored and managed on HDDs and SSDs in a cloud environment, and we believe we are well positioned to continue to play a role in this transition. With a focus on innovation and value creation, our goal is to grow through continued strong execution and with targeted investments in datacenter infrastructure, mobility and the cloud.
Two pivotal events in fiscal 2016 contributed to the ongoing strategic transformation of our company in this context:
|
1.
|
In October 2015, the Ministry of Commerce of the People’s Republic of China (“MOFCOM”) lifted substantially all conditions associated with its 2012 hold separate ruling in connection with Western Digital’s 2012 acquisition of the HGST subsidiary of Hitachi, Ltd. (“Hitachi”). Prior to the October ruling by MOFCOM, we were required to operate our WD and HGST businesses as separate subsidiaries. The October decision allowed us to integrate all HGST and WD operations and resources except for sales forces and product brands, creating the opportunity to achieve significant efficiencies and synergies.
|
|
2.
|
In May 2016, we completed the acquisition (the “Merger”) of SanDisk Corporation (“SanDisk”), a global leader in NAND-flash storage solutions with a strong history of innovative flash-based product offerings. This acquisition aligned with our long-term strategy to be a broad based, innovative and media-agnostic leader in the storage industry, and it more than doubled our addressable market. SanDisk brings a 27-year history of innovation and expertise in non-volatile memory, systems solutions and manufacturing. The combination enables us to vertically integrate into non-volatile memory, providing long-term access to solid state technology at lower cost. It will also enable us to engage in R&D that focuses on blending our technologies and to create enhanced storage solutions.
|
4
Industry
We operate in the data storage and data management industry. Our devices and solutions are made using rotating magnetic or non-volatile memory storage technologies (“NAND”) that together provide a broad range of reliability, performance, storage capacity and data retention capabilities to our customers. With increasing ability to capture and create meaning from data, customers view data analytics insight as one of their most treasured assets. In a connected global marketplace, there is a proliferation in the methods by and the rates at which content is generated, consumed and stored by end users. When combined with fast global networks, these trends create tremendous need for cost effective, high-performance and/or high-capacity storage solutions in mobile, computing and consumer electronic devices, as well as in a wide range of storage systems, servers and datacenters. We are a market and customer driven company, focused on growth, innovation and value creation for our customers, employees and shareholders. We develop deep and collaborative relationships with our customers with a goal of enabling their continued success, an approach that has made us a trusted advisor and market maker in our served markets. As our portfolio of storage solutions expands further, we believe our customer engagement approach is one of the key factors that will help us continue to achieve strong financial performance over the long term. We believe that our product platform is broad-based and powerful, and our unique competitive advantages with growth drivers will continue to provide us the opportunity to expand our value-creation model within an evolving, changing and growing storage ecosystem.
Storage solutions that hold large amounts of data are a key enabler of the trends seen in the evolution of a data driven economy, underpinned by the proliferation of digital content creation, consumption and monetization. We believe the growth in the number of computing users and connected mobile devices in the world continues unabated, creating varied usage patterns and the need for greater volumes of digital content to be stored. Cloud computing applications are especially noteworthy in their ability to generate more data through creation of multiple copies of content such as photos, videos and in other formats to ensure smooth user experience in a secure manner.
There are several key shifts underway in the data storage industry, including a change in the methods of storage in client devices (both desktop and notebook PCs), the increased use of SSDs in client devices, and the shift of data storage from client, or local, devices to the cloud. As a broad-based provider of data storage technologies, devices and solutions in both the client and datacenter markets, we are strategically positioned to manage through these transitions, address these changes and meet the needs of our customers.
Competition
Our industry is highly competitive. We compete with manufacturers of HDDs and SSDs for client devices and solutions and datacenter devices and solutions. The HDD market consists of five principal brands: HGST, Samsung Electronics Co., Ltd (“Samsung”), Seagate Technology LLC (“Seagate”), Toshiba Corporation (“Toshiba”) and WD. In SSDs and storage solutions, we compete with a wide range of manufacturers, from numerous small startup companies to large multinational corporations, including captive NAND suppliers SK Hynix, Inc., Intel Corporation, Micron Technology, Inc., Samsung and Toshiba.
The storage industry is increasingly utilizing tiered architectures with both HDDs and SSDs to address an expanding set of uses and applications. We monitor the advantages, disadvantages and advances of the full array of storage technologies on an ongoing basis to ensure we are appropriately resourced to meet our customers’
storage needs.
Business Strategy
Our overall strategy is to leverage our innovation and execution capabilities to be an industry-leading and broad-based developer, manufacturer and provider of storage devices and solutions that support the evolving IT industry infrastructure that enables the unabated proliferation of data. We strive to successfully execute our strategy through the following foundational elements:
|
•
|
Focus on strategy and execution as we integrate:
Ensure that we focus on both strategy and execution as we integrate our HGST, SanDisk and WD subsidiaries to deliver the best outcome for our customers, partners and employees;
|
|
•
|
Optimize our core HDD business:
as an established leader in the HDD industry, we are focused on delivering the best value for our customers in datacenter and client markets through a relentless focus on operational excellence and continued innovation;
|
|
•
|
Lead in SSDs and solutions:
strategically align our investments to focus on established profitable and growing markets, as well as on emerging markets such as “Internet of Things”, to enable our future growth;
|
|
•
|
Grow in higher value markets with a blend of HDD and SSD technologies:
leverage our capabilities in firmware, software and systems to deliver compelling storage solutions to our customers that offer the best combinations of performance, cost, power consumption, form factor, quality and reliability; and
|
5
|
•
|
Align our retail devices and solutions portfolio:
compete with the industry’s broadest portfolio of storage offerings for consumers in all the channels we serve while creating new use cases for our solutions in emerging markets.
|
We believe our strategy provides the following benefits, which distinguish us in the dynamic and competitive storage industry:
|
•
|
enables scaling for efficiency and flexibility, allowing us to leverage our R&D and capital expenditures to deliver storage solutions to multiple markets;
|
|
•
|
results in continued diversification of our storage solutions portfolio and entry into additional growing adjacent markets; and
|
|
•
|
allows us to achieve strong financial performance, including healthy returns on invested capital and cash generation, thereby enabling efficient allocation of capital to shareholders and strategic long-term investments in innovative technologies.
|
Data Storage Solutions
We offer a broad line of data storage solutions to meet the evolving storage needs of end markets which include the following:
Datacenter Devices and Solutions
Datacenter devices and solutions consists of high-performance and high-capacity enterprise HDDs and enterprise SSDs, datacenter software and system solutions. Our high-performance HDDs are optimized for performance applications providing a range of capacity and performance levels primarily for use in enterprise servers, supporting high volume on-line transactions, data analysis and other enterprise applications. Our datacenter solutions also include a wide range of high-capacity HDDs and drive configurations which provide enterprise class reliability at the lowest cost per gigabyte (“GB”) and are primarily for use in data storage systems, in tiered storage models and where data must be stored reliably for years. Our enterprise SSDs include high-performance NAND-flash SSDs and software solutions designed to improve the performance in various enterprise workload environments. Our enterprise SSDs encompass all major storage interface protocols, including serial attached SCSI (Small Computer System Interface) (“SAS”), peripheral component interconnect express (“PCIe”), and serial advanced technology attachment (“SATA”). We also provide higher value data storage platforms and systems to the market through our vertically integrated scale-out object storage active archive systems. We also offer system solutions such as the InfiniFlash™ System, which provide petabyte scalable capacity with high performance metrics at compelling economics.
Client Devices
Client devices consist of HDDs and SSDs for desktop PCs, notebook PCs, gaming consoles, set top boxes, security surveillance systems and other computing devices, embedded NAND-flash storage for mobile phones, tablets, notebook PCs and other portable and wearable devices, as well as in automotive and connected home applications, and NAND-flash wafers. Our HDDs and SSDs are designed for use in devices requiring high performance, reliability and capacity with various attributes such as low cost per GB, quiet acoustics, low power consumption and protection against shocks. Our embedded storage is designed to meet the increasing demand for increased internal storage for mobile phones, tablets, notebooks and other portable and wearable devices, as well as in automotive and connected home applications. Our embedded NAND-flash storage products include custom embedded solutions and our iNAND
®
embedded flash products, which include our multi-chip package, or MCP, solutions that combine NAND and mobile dynamic random-access memory (“DRAM”) in an integrated package.
Client Solutions
Client solutions consist of HDDs embedded into WD- and HGST-branded external storage products and SanDisk-branded removable NAND-flash products which include cards, universal serial bus (“USB”) flash drives and wireless drives. Our external HDD storage products provide high quality, reliable storage for backup and capacity expansion in both mobile and desktop form factors that are designed to keep digital content secure while providing portable storage. Our removable cards are designed primarily for use in mobile products such as smartphones, tablets, imaging systems, action video cameras, security surveillance systems and other consumer applications. Our USB flash drives are used in the computing and consumer markets, and are designed for high-performance and reliability. Our wireless drive products allow in-field back up of created content, as well as wireless streaming of high-definition movies, photos, music and documents to tablets, smartphones and PCs.
6
Technology
Rotating Magnetic Storage
HDDs provide non-volatile data storage based on the recording of magnetic information on a spinning disk. The storage capacity of an HDD is given by the number of disks in the HDD enclosure multiplied by the surface area of each disk multiplied by the areal density (bits per unit area) of the magnetic bits recorded on the disk surface. Improvements over time in magnetic recording areal density (HDD capacity) have been enabled largely through advancements in recording head and magnetic media technology. We develop and manufacture a substantial portion of the recording heads and magnetic media used in our hard drive products. As areal density increases, we can achieve greater HDD capacities and/or lower product costs over time. We invest considerable resources in R&D, manufacturing infrastructure and capital equipment for recording head and media technology, as well as in other aspects of the magnetic recording system such as HDD mechanics, controller and firmware technology, in order to secure our competitive position and cost structure.
Industry-standard interfaces allow the drives to communicate with the host system. The primary interface for PCs is SATA and the primary interfaces for enterprise systems are Fibre Channel, SAS, SATA and PCIe.
Solid State Storage
Solid state storage products provide non-volatile storage based on NAND-flash technology. We develop and manufacture solid state storage products in different form factors for a variety of different markets, including enterprise or cloud storage, client storage, mobile devices and removable memory devices.
Our solid state storage products leverage our internal NAND-flash technology which we develop and manufacture through our business ventures with Toshiba. We focus significant research, development and effort on developing highly reliable, high-performance, cost-effective NAND-flash technology. We have successfully developed and commercialized 2-bits per cell flash multi‑level cell (“X2”) and 3-bits per cell flash multi‑level cell (“X3”) technologies, which have enabled significant cost reduction and growth in NAND-flash usage. A majority of our NAND manufacturing capacity utilizes the 15-nanometer node and we expect this node to be our last technology node on 2D NAND-flash architecture. To drive further cost reduction in NAND, we are transitioning to a 3-dimensional NAND (“3D NAND”) architecture.
In July 2016, we announced that we have successfully developed our next generation 3D NAND technology, BiCS3, with 64 layers of vertical storage capability. BiCS3 will feature the use of X3 technology along with advances in high aspect ratio semiconductor processing. We expect to develop and commercialize additional generations of 3D NAND technologies over the next several years while continuing to utilize our 2D NAND technology for certain markets and applications.
With Toshiba, we are also investing in 3D resistive random-access memory (“ReRAM”) technology, and we are collaborating with Hewlett Packard Enterprise Development LP on the further development of 3D ReRAM for use in storage class memory applications. We have also initiated, defined and developed standards to meet new market needs and to promote wide acceptance of flash storage standards through interoperability and ease-of-use.
Our solid state storage products generally leverage a common platform for various products within product families, and in some cases across product families, resulting in the commonality of components which reduces our exposure to changes in demand, facilitates inventory management and allows us to achieve lower costs through purchasing economies. This platform strategy also enables our customers to leverage their qualification efforts onto successive product models. For a discussion of associated risks, see Part I, Item 1A of this Annual Report on Form 10-K.
Research and Development
We devote substantial resources to the development of new products and the improvement of existing products. We focus our engineering efforts on coordinating our product design and manufacturing processes to bring our products to market in a cost-effective and timely manner. R&D expenses totaled
$1.6 billion
,
$1.6 billion
and
$1.7 billion
in
2016
,
2015
and
2014
, respectively. For a discussion of associated risks, see Part I, Item 1A of this Annual Report on Form 10-K.
Patents, Licenses and Proprietary Information
We have more than
13,500
active patents and have many patent applications in process. We believe that although our active patents and patent applications have considerable value, the successful manufacturing and marketing of our products depends primarily upon the technical and managerial competence of our staff. Accordingly, the patents held and applied for do not ensure our future success.
7
In addition to patent protection of certain intellectual property rights, we consider elements of our product designs and processes to be proprietary and confidential. We believe that our non-patented intellectual property, particularly some of our process technology, is an important factor in our success. We rely upon non-disclosure agreements and contractual provisions and a system of internal safeguards to protect our proprietary information. Despite these safeguards, there is a risk that competitors may obtain and use such information. The laws of foreign jurisdictions in which we conduct business may provide less protection for confidential information than the laws of the United States (“U.S.”).
We rely on certain technology that we license from other parties to manufacture and sell our products. We believe that we have adequate cross-licenses and other agreements in place in addition to our own intellectual property portfolio to compete successfully in the storage industry. For a discussion of associated risks, see Part I, Item 1A of this Annual Report on Form 10‑K.
Manufacturing
We believe that we have significant know-how, unique product manufacturing processes, test and tooling, execution skills, and human resources to continue to be successful and to grow, as necessary, our manufacturing operations. We strive to maintain manufacturing flexibility, high manufacturing yields, reliable products and high-quality components. The critical elements of our production of HDD and NAND-flash products are high-volume and utilization, low-cost assembly and testing, strict adherence to quality metrics and maintaining close relationships with our strategic component suppliers to access best-in-class technology and manufacturing capacity.
HDD and NAND-flash product manufacturing is a complex process involving the production and assembly of precision components with narrow tolerances and thorough testing. The assembly process occurs in a “clean room” environment that demands skill in process engineering and efficient space utilization to control the operating costs of this manufacturing environment. Our clean room manufacturing process consists of modular production units, each of which contains a number of work cells. We continually evaluate our manufacturing processes in an effort to increase productivity, sustain and improve quality and decrease manufacturing costs. We continually evaluate which steps in the manufacturing process would benefit from automation and how automated manufacturing processes can improve productivity and reduce manufacturing costs.
A majority of our NAND-flash supply requirements for our NAND-flash products is obtained from our business ventures with Toshiba, which provide us with leading-edge, high-quality, low-cost NAND-flash wafers. This represents a captive supply and we are obligated to take our share of the output from these ventures or pay the fixed costs associated with that capacity. See “Ventures with Toshiba” below for additional information. While a majority of our flash memory supply utilized for our products is purchased from these ventures, from time-to-time, we also purchase flash memory from other NAND-flash manufacturers, which we refer to as non-captive. While we do not unilaterally control the operations of these ventures, we believe that our business venture relationship with Toshiba helps us to reduce the costs of producing our products, increases our ability to control the quality of our products and speeds delivery of our products to our customers. Our vertically integrated manufacturing operations for our NAND-flash products are concentrated in three locations, with our business ventures with Toshiba located in Yokkaichi, Japan, and our in-house assembly and test operations located in Shanghai, China and Penang, Malaysia.
We also leverage the efficiencies of contract manufacturers when strategically advantageous. For a discussion of associated risks, see Part I, Item 1A of this Annual Report on Form 10‑K.
Materials and Supplies
The main components of the hard drive are a head-disk-assembly (“HDA”) and a printed circuit board assembly (“PCBA”). The HDA includes recording heads, magnetic media, head positioning mechanism (“actuator”) and spindle motor. A rigid base and top cover contain these components in a contamination-controlled environment. One or more disks positioned around a motor-driven spindle hub that rotates the disks comprise the disk-pack assembly. The disk is made up of a smooth substrate on which thin layers of magnetic materials are deposited. The head stack assembly (“HSA”) is comprised of a magnetic positioner and a pivot-arm module on which the head gimbal assemblies (“HGAs”) including suspension, are mounted. Each disk surface has a head suspended directly above it, which can read data from or write data to the spinning disk. Other key components of our hard drives are pre-amps and voice coil magnets.
The PCBA includes both standard and custom integrated circuits, an interface connector to the host computer and a power connector. The integrated circuits on the printed circuit board typically include a power device that controls the motor and HSA positioner and a system-on-chip (“SoC”) comprised of a drive interface, controller and recording channel. The drive interface receives instructions from the host computer, while the controller directs the flow of data to or from the disks and controls the heads. The location of data on each disk is logically maintained in concentric tracks divided into sectors. The host computer sends instructions to the controller to read data from or write data to the disks, based on logical track and sector locations. Guided by instructions from the controller, the HSA pivots in an arc across the disk until it reaches the selected track of a disk, where the data is recorded or retrieved.
8
We design and manufacture a substantial portion of the recording heads and magnetic media required for our products. Consequently, we are more dependent upon our own development and execution efforts and less able to take advantage of recording head and magnetic media technologies developed by other manufacturers. We depend on an external supply base for all remaining components and materials for use in our HDD product design and manufacturing.
NAND-flash memory and controllers are the main components in our NAND-flash products. A majority of our NAND-flash memory is primarily supplied by our business ventures with Toshiba. Controllers are primarily designed in-house and manufactured by third-party foundries or acquired from third party suppliers. We believe the use of our in-house assembly and test facilities, as well as contract manufacturers, provides flexibility and gives us access to increased production capacity. We have developed deep relationships with these vendors and Toshiba to establish continuous supply of NAND-flash memory and controllers.
We generally retain multiple suppliers for our component requirements but in some instances use sole or single sources for business or technology reasons. Currently, we believe that there are no major issues with component availability. For a discussion of associated risks, see Part I, Item 1A of this Annual Report on Form 10-K.
Ventures with Toshiba
We and Toshiba currently operate three business ventures in 300-millimeter NAND-flash manufacturing facilities in Yokkaichi, Japan, which provide us leading-edge, cost-competitive NAND wafers for our end products. Flash Partners Ltd., which operates primarily in Toshiba’s Fab 3 facility (“Fab 3”) was formed in September 2004. Flash Alliance Ltd., which operates primarily in Toshiba’s Fab 4 facility (“Fab 4”) was formed in July 2006. Flash Forward Ltd., which operates primarily in Toshiba’s Fab 5 facility (“Fab 5”) was formed in July 2010. We refer to Flash Partners, Flash Alliance and Flash Forward collectively as Flash Ventures. In addition, we have a facility agreement with Toshiba related to the construction and operation of Toshiba’s “New Fab 2” fabrication facility, which is primarily intended to provide additional clean room space to convert a portion of existing 2D NAND wafer capacity to 3D NAND.
Through Flash Ventures, we and Toshiba collaborate in the development and manufacture of NAND-flash wafers using semiconductor manufacturing equipment owned or leased by each of the Flash Venture entities. We hold a 49.9% ownership position in each of the Flash Venture entities. Each Flash Venture entity purchases wafers from Toshiba at cost and then resells those wafers to us and Toshiba at cost plus a mark-up. We are committed to purchase half of Flash Ventures’ NAND wafer supply or pay for half of Flash Ventures’ fixed costs regardless of the output we choose to purchase. We are also committed to fund 49.9% to 50% of Flash Ventures’ investments to the extent that Flash Ventures’ operating cash flow is insufficient to fund these investments. We and Toshiba also collaborate on certain R&D activities. For a discussion of associated risks, see Part I, Item 1A of this Annual Report on Form 10-K.
Sales and Distribution
We maintain sales offices in selected parts of the world including the major geographies of the Americas, Asia Pacific, Europe and the Middle East. Our international sales, which include sales to foreign subsidiaries of U.S. companies but do not include sales to U.S. subsidiaries of foreign companies, represented
72%
,
79%
and
80%
of our net revenue for
2016
,
2015
and
2014
, respectively. Sales to international customers are subject to certain risks not normally encountered in domestic operations, including exposure to tariffs and various trade regulations. For a discussion of associated risks, see Part I, Item 1A of this Annual Report on Form 10-K.
We perform our marketing and advertising functions internally and through outside firms utilizing both consumer media and trade publications targeting various reseller and end-user categories. We also maintain customer relationships through direct communication and by providing information and support through our website. In accordance with standard storage industry practice, we provide distributors and retailers with limited price protection and programs under which we reimburse certain marketing expenditures. We also provide distributors, resellers and OEMs with other sales incentive programs.
Original Equipment Manufacturers.
OEMs, including large-scale datacenter operators
,
system integrators and hyperscale customers who bundle, embed or integrate our storage solutions, purchase our products, either directly or through a contract manufacturer such as an original design manufacturer (“ODM”) and assemble them into the devices they build. OEMs typically seek to qualify two or more providers for each generation of products and generally will purchase products from those vendors for the life of that product. Many of our OEM customers utilize just-in-time inventory management processes. As a result, for certain OEMs, we maintain a base stock of finished goods inventory in facilities located near or adjacent to the OEM’s operations. In addition, we also sell directly to cloud infrastructure players as well as flash storage solutions to customers that offer our products under their own brand name in the retail market, which we classify as OEMs for purposes of channel information.
9
Distributors.
We use a broad group of distributors to sell our products to non-direct customers such as small computer and consumer electronics (“CE”) manufacturers, dealers, value-added resellers, systems integrators, online retailers and other resellers. Distributors generally enter into non-exclusive agreements with us for the purchase and redistribution of our products in specific territories.
Retailers.
We sell our branded products directly to a select group of major retailers such as computer superstores, warehouse clubs, online retailers and computer electronics stores, and authorize sales through distributors to smaller retailers. The retail channel complements our other sales channels, while helping to build brand awareness for us and our products. We also sell our branded products through our websites.
For fiscal
2016
,
no
single customer accounted for
10%
or more of our net revenue. For both fiscal
2015
and
2014
, Hewlett-Packard Company accounted for
11%
of our net revenue. For a discussion of associated risks, see Part I, Item 1A of this Annual Report on Form 10-K. For additional information regarding revenue recognition, sales by geographic region and major customers, see Part II, Item 8, Notes 1 and 7 of the Notes to Consolidated Financial Statements included in this Annual Report on Form 10-K.
Backlog
A substantial portion of our orders are generally for shipments within 60 days of the placement of the order. Customers’ purchase orders may be canceled with relatively short notice to us, with little or no cost to the customer, or modified by customers to provide for delivery at a later date. In addition, for many of our OEMs utilizing just-in-time inventory, we do not generally require firm order commitments and instead, receive a periodic forecast of requirements. Therefore, backlog information as of the end of a particular period is not necessarily indicative of future levels of our revenue and profit and may not be comparable to prior periods.
Seasonality
We have historically experienced seasonal fluctuations in our business with higher levels of demand in the first and second quarters of our fiscal year as a result of increased customer spending. Seasonality can also be impacted by the growth in emerging markets and macroeconomic conditions. For a discussion of associated risks, see Part I, Item 1A of this Annual Report on Form 10-K.
Service and Warranty
We generally warrant our newly manufactured products against defects in materials and workmanship from one to five years from the date of manufacture depending on the type of product, with a small number of products having a warranty ranging up to ten years or more. Our warranty obligation is generally limited to repair or replacement. We have engaged third parties in various countries in multiple regions to provide various levels of testing, processing or recertification of returned products for our customers. For additional information regarding our service and warranty policy, see Part II, Item 8, Note 1 of the Notes to Consolidated Financial Statements included in this Annual Report on Form 10-K.
Environmental Regulation
We are subject to a variety of U.S. and foreign laws and regulations in connection with our operations and relating to the protection of the environment, including those governing discharges of pollutants into the air and water, the management and disposal of hazardous substances and the clean-up of contaminated sites. Some of our operations require environmental permits and controls to prevent and reduce air and water pollution. These permits are subject to modification, renewal and revocation by issuing authorities. We believe that we have obtained or are in the process of obtaining all necessary environmental permits for our operations.
We have established environmental management systems and continually update our environmental policies and standard operating procedures for our operations worldwide. We believe that our operations are in material compliance with applicable environmental laws, regulations and permits. We budget for operating and capital costs on an ongoing basis to comply with environmental laws.
Our properties have in some cases been operated for many years and may contain soil or groundwater contamination. In certain of our facilities we are undertaking voluntary monitoring of soil and groundwater. Based on available information, including our voluntary monitoring activities, we do not believe that we have a current affirmative legal obligation for any remedial action.
For a discussion of associated risks, see Part I, Item 1A of this Annual Report on Form 10-K.
10
Employees
As of
July 1, 2016
, we employed a total of
72,878
employees worldwide, excluding temporary employees and contractors. Many of our employees are highly skilled, and our continued success depends in part upon our ability to attract and retain such employees. Accordingly, we offer employee benefit programs that we believe are, in the aggregate, competitive with those offered by our competitors.
While the substantial majority of our employees are not party to a collective bargaining agreement, a majority of our employees in Japan and China are subject to collective bargaining agreements. We consider our employee relations to be good. For a discussion of associated risks, see Part I, Item 1A of this Annual Report on Form 10-K.
Corporate Responsibility
We believe that corporate social responsibility is an essential factor for our overall corporate success. This includes adopting ethical and sustainable business practices to direct how we do business while keeping the interests of our stakeholders and the environment in focus.
We strive to uphold the following principles:
|
•
|
treat all employees with dignity and respect;
|
|
•
|
set up processes and procedures intended to comply with applicable laws and regulations as well as our internal guidelines and uphold ethical standards;
|
|
•
|
establish policies and procedures intended to promote the idea that the quality of our products and services, consistency of production and employee well-being are predicated on a safe and healthy work environment; and
|
|
•
|
establish policies and procedures intended to promote environmental responsibility as an integral part of our culture.
|
Available Information
We maintain an Internet website at www.westerndigital.com. Our Annual Report on Form 10-K, Quarterly Reports on Form 10-Q, Current Reports on Form 8-K and amendments to reports filed or furnished pursuant to Sections 13(a) and 15(d) of the Securities Exchange Act of 1934, as amended, are available on our website at www.westerndigital.com, free of charge, as soon as reasonably practicable after the electronic filing of these reports with, or furnishing of these reports to, the Securities and Exchange Commission (“SEC”). Any materials we file with the SEC are available at the SEC’s Public Reference Room at 100 F Street, NE, Washington, DC 20549. Additional information about the operation of the Public Reference Room can also be obtained by calling the SEC at 1-800-SEC-0330. In addition, the SEC maintains a website at www.sec.gov that contains reports, proxy and information statements and other information regarding issuers that file electronically with the SEC, including us.
11
Item 1A.
Risk Factors
The business, financial condition and operating results of the Company can be affected by a number of risks and uncertainties, whether currently known or unknown, any one or more of which could, directly or indirectly, cause the Company’s actual results of operations and financial condition to vary materially from past, or from anticipated future, results of operations and financial condition. The risks and uncertainties discussed below are not the only ones facing our business, but do represent those risks and uncertainties that we believe are material to us. Additional risks and uncertainties not presently known to us or that we currently deem immaterial may also adversely affect our business, financial condition, results of operations or the market price of our common stock.
Adverse global economic conditions and credit market uncertainty could harm our business, results of operations and financial condition.
Adverse global economic conditions and uncertain conditions in the credit market have had, and in the future could have, a significant adverse effect on our company and on the storage industry as a whole. Several factors contribute to these conditions and this uncertainty, including, but not limited to, volatility in the equity, credit and other financial markets and real estate markets, slower growth in certain geographic regions, lower levels of consumer liquidity, risk of default on sovereign debt, higher interest rates, materials and component cost increases, political uncertainty and other macroeconomic factors, such as the June 23, 2016 referendum by British voters to exit the European Union, commonly referred to as “Brexit”. Some of the risks and uncertainties we face as a result of these conditions include the following:
|
•
|
Volatile Demand and Supplier Risk. Our direct and indirect customers may delay or reduce their purchases of our products and systems containing our products. In addition, many of our customers rely on credit financing to purchase our products. If negative conditions in the global credit markets prevent our customers’ access to credit, product orders may decrease, which could result in lower revenue. Likewise, if our suppliers, sub-suppliers and sub-contractors (collectively referred to as “suppliers”), or partners face challenges in obtaining credit, in selling their products or otherwise in operating their businesses, they may be unable to offer the materials we use to manufacture our products. These actions could result in reductions in our revenue and increased operating costs, which could adversely affect our business, results of operations and financial condition.
|
|
•
|
Restructuring Activities. If demand for our products slows as a result of a deterioration in economic conditions, we may undertake restructuring activities to realign our cost structure with softening demand. The occurrence of restructuring activities could result in impairment charges and other expenses, which could adversely impact our results of operations and financial condition.
|
|
•
|
Credit Volatility and Loss of Receivables. We extend credit and payment terms to some of our customers. In addition to ongoing credit evaluations of our customers’ financial condition, we traditionally seek to mitigate our credit risk by purchasing credit insurance on certain of our accounts receivable balances. As a result of the continued uncertainty and volatility in global economic conditions; however, we may find it increasingly difficult to be able to insure these accounts receivable. We could suffer significant losses if a customer whose accounts receivable we have not insured, or have underinsured, fails to pay us on their accounts receivable balances. Additionally, negative or uncertain global economic conditions increase the risk that if a customer we have insured fails to pay us on their accounts receivable, the financial condition of the insurance carrier for such customer account may have also deteriorated such that it cannot cover our loss. A significant loss of accounts receivable that we cannot recover through credit insurance would have a negative impact on our financial condition.
|
|
•
|
Impairment Charges. We test goodwill for impairment annually as of the first day of our fourth fiscal quarter and at other times if events have occurred or circumstances exist that indicate the carrying value of goodwill may no longer be recoverable. Negative or uncertain global economic conditions could result in circumstances, such as a sustained decline in our stock price and market capitalization or a decrease in our forecasted cash flows, indicating that the carrying value of our long-lived assets or goodwill may be impaired. If we are required to record a significant charge to earnings in our consolidated financial statements because of an impairment of our long-lived assets or goodwill, our results of operations will be adversely affected. For example, given the recent volatility of our market capitalization, it is possible that our goodwill could become impaired in the near term which could result in a material charge and adversely affect our results of operations and financial condition.
|
12
Integrating SanDisk’s operations with ours may be more difficult, costly or time consuming than expected and the anticipated benefits, synergies and cost savings of the Merger may not be realized.
The success of our recent acquisition of SanDisk, including anticipated benefits, synergies and cost savings, will depend, in part, on our ability to successfully combine and integrate the businesses and culture of SanDisk into our company. It is possible that the integration process will take longer than anticipated. In addition, the integration process could result in the loss of key employees, higher than expected costs, ongoing diversion of management attention, the disruption of our ongoing businesses or inconsistencies in standards, controls, procedures and policies that adversely affect our ability to maintain relationships with customers, vendors, partners and employees. If we experience difficulties with the integration process, the anticipated benefits of the Merger may not be realized fully or at all, or may take longer to realize than expected. In addition, the actual cost savings of the Merger could be less than anticipated. Additionally, the integration of SanDisk’s operations into our operations may also increase the risk that our internal controls are found to be ineffective.
Achieving the benefits of the Merger will depend, in part, on our ability to integrate the business and operations of SanDisk successfully and efficiently with our business. The challenges involved in this integration, which will be complex and time-consuming, include, but are not limited to, the following:
|
•
|
difficulties entering new markets or manufacturing in new geographies where we have no or limited direct prior experience;
|
|
•
|
successfully managing relationships with our strategic partners, and our combined supplier and customer base;
|
|
•
|
coordinating and integrating independent R&D and engineering teams across technologies and product platforms to enhance product development while reducing costs;
|
|
•
|
increased levels of investment in R&D, manufacturing capability and technology enhancement relating to SanDisk’s business;
|
|
•
|
successfully transitioning to 3D NAND and alternative technologies;
|
|
•
|
coordinating sales and marketing efforts to effectively position the combined company’s capabilities and the direction of product development;
|
|
•
|
difficulties in integrating the systems and processes of two companies with complex operations and multiple manufacturing sites;
|
|
•
|
the increased scale and complexity of our operations resulting from the Merger;
|
|
•
|
retaining key employees;
|
|
•
|
obligations that we will have to counterparties of SanDisk that arise as a result of the change in control of SanDisk; and
|
|
•
|
the diversion of management attention from other important business objectives.
|
If we do not successfully manage these issues and the other challenges inherent in integrating an acquired business of the size and complexity of SanDisk, then we may not achieve the anticipated benefits of the Merger and our revenue, expenses, operating results and financial condition could be materially adversely affected.
The incurrence of substantial indebtedness in connection with the financing of the Merger may have an adverse impact on our liquidity, limit our flexibility in responding to other business opportunities and increase our vulnerability to adverse economic and industry conditions.
In connection with the Merger, we substantially increased our indebtedness, which could adversely affect our ability to fulfill our obligations and have a negative impact on our financing options and liquidity position. As of July 1, 2016, our total indebtedness was
$17.5 billion
, and we had $1.0 billion of additional borrowing availability under our revolving credit facility. On April 13, 2016, we issued
$1.875 billion
in senior secured notes and
$3.35 billion
in senior unsecured notes. We also entered into new senior credit facilities on April 29, 2016 and an additional $3.0 billion bridge facility on May 12, 2016 under which we have borrowed in the aggregate approximately $11.9 billion as of the date of this Annual Report on Form 10-K. The proceeds from the notes issuance and new credit facilities were used to pay part of the purchase price for the Merger, refinance existing indebtedness of WD and SanDisk and pay related transaction-related fees and expenses. On July 21, 2016, we repaid the
$3.0 billion
bridge facility in full. On August 17, 2016 we issued a new
$3.0 billion
U.S. dollar-denominated Term Loan B-1. In connection with this transaction, we settled the previous U.S. Term Loan B tranche with the proceeds of this new loan and a voluntary cash prepayment of
$750 million
.
13
Our high level of debt could have significant consequences, which include, but are not limited to, the following:
|
•
|
limiting our ability to obtain additional financing in the future for working capital, capital expenditures, acquisitions or other general corporate purposes;
|
|
•
|
requiring a substantial portion of our cash flows to be dedicated to debt service payments instead of other purposes, thereby reducing the amount of cash flows available for working capital, capital expenditures, acquisitions, R&D and other general corporate purposes;
|
|
•
|
limiting our ability to refinance our indebtedness on terms acceptable to us or at all;
|
|
•
|
imposing restrictive covenants on our operations;
|
|
•
|
if we breach the covenants under our debt agreements, causing an event of default under the applicable indebtedness, which, if not cured or waived, could result in us having to repay our indebtedness before their due dates or result in cross defaults;
|
|
•
|
placing us at a competitive disadvantage to competitors carrying less debt; and
|
|
•
|
making us more vulnerable to economic downturns and limiting our ability to withstand competitive pressures.
|
In addition, our credit ratings impact the cost and availability of future borrowings and, accordingly, our cost of capital. Our ratings reflect the opinions of the ratings agencies of our financial strength, operating performance and ability to meet our debt obligations. There can be no assurance that we will achieve a particular rating or maintain a particular rating in the future.
We may from time to time seek to refinance the substantial indebtedness we incurred to finance the Merger by issuing additional shares of our common stock in one or more securities offerings. These securities offerings may dilute our existing shareholders, reduce the value of our common stock, or both. Because our decision to issue securities will depend on, among other things, market conditions and other factors beyond our control, we cannot predict or estimate the amount, timing or nature of any future securities offerings. Thus, holders of our common stock bear the risk of our future offerings diluting and potentially reducing the value of our common stock.
If we are unable to successfully integrate the business and operations of HGST, our business and financial condition may be adversely affected.
In connection with obtaining the regulatory approvals required to complete the acquisition of HGST, we agreed to certain conditions required by MOFCOM, including adopting measures to keep HGST as an independent competitor until MOFCOM agreed otherwise. On October 19, 2015, MOFCOM announced that it had made a decision allowing us to integrate substantial portions of our HGST and WD subsidiaries, provided that we continue to offer both HGST and WD product brands and maintain separate sales teams that will separately offer products under the WD and HGST brands for two years from the date of the decision.
As a result of MOFCOM’s decision, we immediately began planning for the integration of the substantial portions of our HGST and WD subsidiaries that we are now allowed to integrate (including corporate functions, R&D, recording heads and magnetic media operations, engineering and manufacturing). We expect this integration to continue through the end of calendar year 2017. Our integration efforts during this time may involve significant management time and create uncertainty for employees and customers. Any delays in the integration process could have a material adverse effect on our business, results of operations and financial condition. It is possible that the integration process could result in the loss of key employees, the loss of customers, the disruption of our company’s ongoing business or in unexpected integration issues, higher than expected integration costs and an overall integration process that takes longer than originally anticipated. Additionally, the integration of the operations of our HGST and WDT subsidiaries may also increase the risk that our internal controls are found to be ineffective. Further, until we are able to begin combining our HGST and WD product brands and sales teams on October 19, 2017, we will continue to incur additional costs to maintain separate brands and sales teams. These additional costs, along with any delay in the integration process or higher than expected integration costs or other integration issues, could adversely affect our ability to achieve the full operating expense synergies we expect from integration of the businesses of our HGST and WDT subsidiaries. Any failure to achieve the full operating expense synergies that we expect from this integration could harm our business and financial condition. Achieving these synergies is also subject to significant business, operational, economic and competitive uncertainties and contingencies, and we cannot assure you that any or all of these synergies will be achieved in the anticipated amounts or within the anticipated timeframes or cost expectations or at all.
14
We participate in a highly competitive industry that is subject to declining average selling prices (“ASPs”), volatile gross margins and significant shifts in market share, all of which could adversely affect our operating results and financial condition.
Demand for our devices, software and solutions that we offer to our customers, which we refer to in this Item 1A as our “products”, depends in large part on the demand for systems (including PCs and mobile devices) manufactured by our customers and on storage upgrades to existing systems. The demand for systems has been volatile in the past and often has had an exaggerated effect on the demand for our products in any given period. The price of NAND flash memory is also influenced by, among other factors, the balance between supply and demand, including the effects of new fab capacity in the industry, macroeconomic factors, business conditions, technology transitions, conversion of industry DRAM capacity to NAND, conversion of 2D NAND capacity to 3D NAND or other actions taken by us or our competitors. The storage market has experienced periods of excess capacity, which can lead to liquidation of excess inventories and more intense price competition. If more intense price competition occurs, we may be forced to lower prices sooner and more than expected, which could adversely impact revenue and gross margins. In addition, we compete based on our ability to offer our customers competitive solutions that provide the most current and desired product and service features. We expect that competition will continue to be intense, and there is a risk that our competitors’ products may be less costly, provide better performance or include additional features when compared to our products. Our ASPs and gross margins also tend to decline when there is a shift in the mix of product sales, and sales of lower priced products increase relative to those of higher priced products. Further, we face potential gross margin pressures resulting from our ASPs declining more rapidly than our cost of goods sold. Rapid technological changes often reduce the volume and profitability of sales of existing products and increase the risk of inventory obsolescence. These factors, along with others, may also result in significant shifts in market share among the industry’s major participants, including a substantial decrease in our market share, all of which could adversely impact our operating results and financial condition.
Our failure to accurately forecast market and customer demand for our products, or to quickly adjust to forecast changes, could adversely affect our business and financial results or operating efficiencies.
The data storage industry faces difficulties in accurately forecasting market and customer demand for its products. The variety and volume of products we manufacture are based in part on these forecasts. Accurately forecasting demand has become increasingly difficult for us, our customers and our suppliers in light of the volatility in global economic conditions and industry consolidation, resulting in less availability of historical market data for certain product segments. Further, for many of our OEMs utilizing just-in-time inventory, we do not generally require firm order commitments and instead receive a periodic forecast of requirements, which may prove to be inaccurate. In addition, because our products are designed to be largely interchangeable with competitors’ products, our demand forecasts may be impacted significantly by the strategic actions of our competitors. As forecasting demand becomes more difficult, the risk that our forecasts are not in line with demand increases. If our forecasts exceed actual market demand, then we could experience periods of product oversupply, excess inventory and price decreases, which could impact our financial performance. If market demand increases significantly beyond our forecasts or beyond our ability to add manufacturing capacity, then we may not be able to satisfy customer product needs, possibly resulting in a loss of market share if our competitors are able to meet customer demands. In addition, some of our components have long lead-times, requiring us to place orders several months in advance of anticipated demand. Such long lead-times increase the risk of excess inventory or loss of sales in the event our forecasts vary substantially from actual demand.
We experience significant sales seasonality and cyclicality, which could cause our operating results to fluctuate.
Sales of computer systems, mobile devices, storage subsystems, gaming consoles and consumer electronics (“CE”) tend to be seasonal and cyclical, and therefore we expect to continue to experience seasonality and cyclicality in our business as we respond to variations in our customers’ demand for our products. However, changes in seasonal and cyclical patterns have made it, and could continue to make it, more difficult for us to forecast demand, especially as a result of the current macroeconomic environment. Changes in the product or channel mix of our business can also impact seasonal and cyclical patterns, adding complexity in forecasting demand. Seasonality and cyclicality also may lead to higher volatility in our stock price. It is difficult for us to evaluate the degree to which seasonality and cyclicality may affect our stock price or business in future periods because of the rate and unpredictability of product transitions and new product introductions and macroeconomic conditions.
15
Our sales to the CE, cloud computing, network attached storage (NAS), surveillance systems and enterprise markets, which have accounted for and may continue accounting for an increasing percentage of our overall revenue, may grow at a slower rate than current estimates or not at all, which could materially adversely impact our operating results and financial condition.
The secular growth of digital data has resulted in a more diversified mix of revenue from the CE, cloud computing, NAS, surveillance systems and enterprise markets. As sales into these markets have become a more significant portion of our revenue, events or circumstances that adversely impact demand in these markets, or our inability to address that demand successfully, could materially adversely impact our operating results. For example, demand in, or our sales to, these markets may be adversely affected by the following:
|
•
|
Mobile Devices. There has been and continues to be a rapid growth in devices that do not contain a hard drive such as tablet computers and smart phones. As tablet computers and smart phones provide many of the same capabilities as PCs, they have displaced or materially affected, and we expect will continue to displace or materially affect, the demand for PCs. If we are not successful in adapting our product offerings to include disk drives or alternative storage solutions that address these devices, even after our acquisition of SanDisk, demand for our products in these markets may decrease and our financial results could be materially adversely affected. In addition, global slowdown in the growth rate of mobile devices will also negatively impact our financial results.
|
|
•
|
Enterprise. The enterprise storage space is comprised of customers with long design, qualification and test cycles prior to sales. We spend substantial time and resources in our sales process without any assurance that our efforts will produce any customer orders on the timelines or in the quantities we expect. These lengthy and uncertain processes also make it difficult for us to forecast demand and timing of customer orders. Due to longer customer product cycles, we may not be able to transition customers to our leading edge products, which would prevent us from benefitting from the technology transitions that enable cost reductions, which may harm our gross margin. Demand for our enterprise solutions from our hyperscale customers is correlated to large projects and expansions which can be sporadic, resulting in demand that is lumpy and less consistent than the consumer-driven demand for many of our solutions. Hyperscale customers may place orders for significant volumes with short lead times that may be difficult for us to fulfill, and sales to hyperscale customers may negatively impact gross margins due to product mix and pricing, each of which could adversely affect our business. In addition, hyperscale companies may internally develop enterprise storage solutions that reduce the demand for our solutions.
|
|
•
|
Cloud Computing. Consumers traditionally have stored their data on their PC, often supplemented with personal external storage devices. Most businesses also include similar local storage as a primary or secondary storage location. This storage is typically provided by HDDs and increasingly SSDs. With cloud computing, applications and data are hosted, accessed and processed through a third-party provider over a broadband Internet connection, potentially reducing or eliminating the need for, among other things, significant storage inside the accessing electronic device. Even if we are successful at increasing revenues from sales to cloud computing customers, if we are not successful in manufacturing compelling products to address the cloud computing opportunity, demand for our products in these other markets may decrease and our financial results could be materially adversely affected. Demand for cloud computing solutions themselves may be volatile due to differing patterns of technology adoption and innovation, improved data storage efficiency by cloud computing service providers, and concerns about data protection by end users.
|
|
•
|
Obsolete Inventory. In some cases, products we manufacture for these markets are uniquely configured for a single customer’s application, creating a risk of obsolete inventory if anticipated demand is not actually realized. In addition, rapid technological change in our industry increases the risk of inventory obsolescence.
|
|
•
|
Macroeconomic Conditions. Consumer spending has been, and may continue to be, adversely affected in many regions due to negative macroeconomic conditions and high unemployment levels. Please see the risk factor entitled “
Adverse global economic conditions and credit market uncertainty could harm our business, results of operations and financial condition
” for additional risks and uncertainties relating to macroeconomic conditions.
|
In addition, demand in these areas also could be negatively impacted by developments in the regulation and enforcement of digital rights management and the emergence of new technologies, such as data duplication, compression and storage virtualization. If we are not able to respond appropriately, these factors could lead to our customers’ storage needs being satisfied at lower prices with lower capacity hard drives or solid-state storage products, thereby decreasing our revenue or putting us at a disadvantage to competing storage technologies. As a result, even with increasing aggregate demand for digital storage, if we fail to anticipate or timely respond to these developments in the demand for storage, our ASPs could decline, which could adversely affect our operating results and financial condition. Furthermore, our ability to accurately read and respond to market trends, such as trends relating to the Internet of Things or big data, could harm our results.
16
Deterioration in the PC market may continue or accelerate, which could cause our operating results to suffer.
While sales to non-PC markets are becoming a more significant source of revenue, sales to the PC market remain an important part of our business. We believe that sales of PCs have declined due to fundamental changes in the PC market, including the growth of alternative mobile devices and the lengthening of product life cycles, and that further deterioration of the PC market may continue or accelerate, which could cause our operating results and financial condition to suffer. Additionally, if demand in the PC market is worse than expected as a result of these or other conditions, or demand for our products in the PC market decreases at a faster rate than expected, our operating results and financial condition may be adversely affected.
Selling to the retail market is an important part of our business, and if we fail to maintain and grow our market share or gain market acceptance of our branded products, our operating results could suffer.
Selling branded products is an important part of our business, and as our branded products revenue increases as a portion of our overall revenue, our success in the retail market becomes increasingly important to our operating results. Our success in the retail market depends in large part on our ability to maintain our brand image and corporate reputation and to expand into and gain market acceptance of our products in multiple channels. We must successfully respond to the rapid change away from traditional advertising media, marketing and sales methods to the use of Internet media and advertising, particularly social media, and online sales, or our brand and retail sales could be negatively affected. Adverse publicity, whether or not justified, or allegations of product or service quality issues, even if false or unfounded, could tarnish our reputation and cause our customers to choose products offered by our competitors. In addition, the proliferation of new methods of mass communication facilitated by the Internet makes it easier for false or unfounded allegations to adversely affect our brand image and reputation. If customers no longer maintain a preference for WD, HGST™ or SanDisk brand products, our operating results may be adversely affected. A significant portion of our sales is made through retailers, and if our retailers are not successful in selling our products, not only would our revenue decrease, but we could also experience lower gross margin due to the return of unsold inventory or the protection we provide to retailers against price declines.
Sales in the distribution channel are important to our business, and if we fail to respond to demand changes in distribution markets or if distribution markets for our products weaken, our operating results could suffer.
Our distribution customers typically sell to small computer manufacturers, dealers, systems integrators and other resellers. We face significant competition in this channel as a result of limited product qualification programs and a significant focus on price and availability of product. In addition, the PC market is experiencing a shift to notebook and other mobile devices and, as a result, more computing devices are being delivered to the market as complete systems, which could weaken the distribution market. If we fail to respond to changes in demand in the distribution market, our operating results could suffer. Additionally, if the distribution market weakens as a result of a slowing PC growth rate, technology transitions or a significant change in consumer buying preference, or if we experience significant price declines due to demand changes in the distribution channel, then our operating results would be adversely affected.
Negative changes in the credit-worthiness or the ability to access credit, or the bankruptcy or shutdown of any of our significant retail or distribution partners would harm our revenue and our ability to collect outstanding receivable balances.
Loss of market share with or by a key customer, or consolidation among our customer base, could harm our operating results.
During the fiscal year ended July 1, 2016,
43%
of our revenue came from sales to our top 10 customers. These customers have a variety of suppliers to choose from and therefore can make substantial demands on us, including demands on product pricing and on contractual terms, often resulting in the allocation of risk to us as the supplier. Our ability to maintain strong relationships with our principal customers is essential to our future performance. If we lose a key customer, if any of our key customers reduce their orders of our products or require us to reduce our prices before we are able to reduce costs, if a customer is acquired by one of our competitors or if a key customer suffers financial hardship, our operating results and financial condition would likely be harmed.
Additionally, if there is consolidation among our customer base, our customers may be able to command increased leverage in negotiating prices and other terms of sale, which could adversely affect our profitability. In addition, if, as a result of increased leverage, customer pressures require us to reduce our pricing such that our gross margins are diminished, we could decide not to sell our products to a particular customer, which could result in a decrease in our revenue. Consolidation among our customer base may also lead to reduced demand for our products, replacement of our products by the combined entity with those of our competitors and cancellations of orders, each of which could harm our operating results.
17
Also, the storage ecosystem is constantly evolving, and our traditional customer base is changing. Fewer companies now hold greater market share for certain applications and services, such as mobile, social media, shopping and streaming media. As a result, the competitive landscape is changing, giving these companies increased leverage in negotiating prices and other terms of sale, which could adversely affect our profitability. In addition, the changes in our evolving customer base create new selling and distribution patterns to which we must adapt. To remain competitive, we must respond to these changes by ensuring we have proper scale in this evolving market, as well as offer products that meet the technological requirements of this customer base at competitive pricing points. To the extent we are not successful in adequately responding to these changes, our operating results and financial condition could be harmed.
Expansion into new markets may increase the complexity of our business, cause us to increase our R&D expenses to develop new products and technologies or cause our capital expenditures to increase, and if we are unable to successfully adapt our business processes and product offerings as required by these new markets, our ability to grow will be adversely affected.
To remain a significant supplier in the storage industry and to expand into new markets, we will need to offer a broader range of storage products to our customers. We currently offer a variety of 3.5-inch and 2.5-inch hard drives, solid state drives and systems, flash storage solutions, and other products for the PC, mobile, enterprise, data center and other storage markets. As we expand our product lines to sell into new markets, such as our recent entry into active archive systems and new flash memory business through the Merger, including the vertically integrated business model through Flash Ventures, the overall complexity of our business may increase at an accelerated rate and we may become subject to different market dynamics. These dynamics may include, among other things, different demand volume, cyclicality, seasonality, product requirements, sales channels, and warranty and return policies. In addition, expansion into other markets may result in increases in R&D expenses and substantial investments in manufacturing capability, technology enhancements and go-to-market capability. Flash Ventures requires significant investments by both Toshiba and us for technology transitions, including the transition to 3D NAND, and capacity expansions. If we fail to successfully expand into new markets with products that we do not currently offer, we may lose business to our competitors or new entrants who offer these products.
Our vertical integration of recording head and magnetic media manufacturing makes us dependent on our ability to timely and cost-effectively develop recording heads and magnetic media with leading technology and overall quality, increasing capital expenditure costs and asset utilization risks for our business.
We develop and manufacture a substantial portion of the recording heads and magnetic media used in the hard drive products we produce. Consequently, we are more dependent upon our own development and execution efforts and less able to take advantage of recording head and magnetic media technologies developed by other manufacturers. Technology transition for recording heads and magnetic media designs is critical to increasing our volume production of recording heads and magnetic media. We may be unsuccessful in timely and cost-effectively developing and manufacturing recording heads or magnetic media for products using future technologies. We also may not effectively transition our recording head or magnetic media design and technology to achieve acceptable manufacturing yields using the technologies necessary to satisfy our customers’ product needs, or we may encounter quality problems with the recording heads or magnetic media we manufacture. If we are unable to timely and cost-effectively develop recording heads and magnetic media with leading technology and overall quality, our ability to sell our products may be significantly diminished, which could materially and adversely affect our business and financial results.
In addition, as a result of our vertical integration of recording heads and magnetic media manufacturing, we make more capital investments and carry a higher percentage of fixed costs than we would if we were not vertically integrated. If our overall level of production decreases for any reason, and we are unable to reduce our fixed costs to match sales, our recording head or magnetic media manufacturing assets may face underutilization that may impact our operating results. We are therefore subject to additional risks related to overall asset utilization, including the need to operate at high levels of utilization to drive competitive costs and the need for assured supply of components that we do not manufacture ourselves. In addition, as a result of adverse labor rates or availability, we may be required to increase investments in automation, which may cause our capital expenditures to increase. If we do not adequately address the challenges related to our recording head or magnetic media manufacturing operations, our ongoing operations could be disrupted, resulting in a decrease in our revenue or profit margins and negatively impacting our operating results.
18
We make significant investments in R&D to improve our technology and develop new technologies, and unsuccessful investments or investments that are not cost effective could materially adversely affect our business, financial condition and results of operations.
As a leading supplier of hard drives and flash storage solutions, we make significant investments to maintain our existing products and to lead innovation and development of new technologies. This strategy requires us to make significant investments in R&D. In addition, we may increase our capital expenditures and expenses above our historical run-rate model in order to remain competitive or as a result of the Merger with SanDisk, which has historically maintained higher levels of investment in R&D than our company. The current inherent physical limitations associated with storage technologies are resulting in more costly capital expenditures that reduce the cost benefits of technology transitions and could limit our ability to keep pace with reductions in ASPs. These investments may not result in viable technologies or products, and even if they do result in viable technologies or products, they may not be profitable or accepted by the market. Significant investments in unsuccessful or cost-ineffective R&D efforts could materially adversely affect our business, financial condition and results of operations. In addition, increased investments in technology could cause our cost structure to fall out of alignment with demand for our products, which would have a negative impact on our financial results.
Current or future competitors may gain a technology advantage or develop an advantageous cost structure that we cannot match.
It may be possible for our current or future competitors to gain an advantage in product technology, manufacturing technology, or process technology, which may allow them to offer products or services that have a significant advantage over the products and services that we offer. Advantages could be in price, capacity, performance, reliability, serviceability, industry standards or formats, brand and marketing, or other attributes. A competitive cost structure for our products, including critical components, labor and overhead, is also critical to the success of our business. We may be at a competitive disadvantage to any companies that are able to gain a technological or cost structure advantage. The Chinese government and various agencies, state-owned or affiliated enterprises and investment funds are making significant investments to promote China’s domestic semiconductor industry consistent with the government’s stated national policy objectives. If we are unable to effectively compete with any manufacturers located in China or non-Chinese competitors benefitting from alliances with Chinese companies in the markets where we compete, our operating results and financial condition will suffer.
Consolidation within the data storage industry could provide competitive advantages to our competitors.
The data storage industry as a whole has experienced consolidation over the past several years through acquisitions, mergers and decisions by industry players to exit the industry. Consolidation across the industry, including by our competitors, may enhance their capacity, abilities and resources and lower their cost structure, causing us to be at a competitive disadvantage.
Some of our competitors with diversified business units outside of storage products, may, over extended periods of time, sell storage products at prices that we cannot profitably match.
Some of our competitors earn a significant portion of their revenue from business units outside of storage products. Because they do not depend solely on sales of storage products to achieve profitability, they may sell storage products at lower prices and operate their storage business unit at a loss over an extended period of time while still remaining profitable overall. In addition, if these competitors can increase sales of non-storage products to the same customers, they may benefit from selling their storage products at lower prices. Our operating results may be adversely affected if we cannot successfully compete with the pricing by these companies.
19
If we fail to qualify our products and achieve design wins with our customers, it may have a significant adverse impact on our sales and margins.
We regularly engage in new product qualification with our customers, and the product qualification process may be lengthy for some customers, including those in enterprise storage. Once a product is accepted for qualification testing, failures or delays in the qualification process can result in delayed or reduced product sales, reduced product margins caused by having to continue to offer a more costly current generation product, or lost sales to that customer until the next generation of products is introduced. The effect of missing a product qualification opportunity is magnified by the limited number of high volume OEMs and hyperscale customers, which continue to consolidate their share of the storage markets. Likewise, if product life cycles lengthen, we may have a significantly longer period to wait before we have an opportunity to qualify a new product with a customer, which could reduce our profits because we expect declining gross margins on our current generation products as a result of competitive pressures. Even if our products meet customer specifications, our sales to these customers are dependent upon the customers choosing our products over those of our competitors and purchasing our products in sufficient volume, our ability to supply our products in sufficient quantity and in a timely manner and, with respect to OEM partners, the OEMs’ ability to create, market and successfully sell products containing our solutions. Moreover, in transitioning to new technologies, such as 3D NAND, and products, we may not achieve design wins, our customers may delay transition to these new technologies, our competitors may transition more quickly than we do, or we may experience product delays, cost overruns or performance issues that could harm our operating results and financial condition.
We are subject to risks related to product defects or the unintended use or security breaches of our products, which could result in product recalls or epidemic failures and could subject us to warranty claims in excess of our warranty provisions or which are greater than anticipated, litigation or indemnification claims.
We warrant the majority of our products for periods of one to five years. We test our products in our manufacturing facilities through a variety of means. However, our testing may fail to reveal defects in our products that may not become apparent until after the products have been sold into the market. In addition, our products may be used in a manner that is not intended or anticipated by us, resulting in potential liability. Accordingly, there is a risk that product defects will occur, which could require a product recall. Product recalls can be expensive to implement. As part of a product recall, we may be required or choose to replace the defective product. Moreover, there is a risk that product defects may trigger an epidemic failure clause in a customer agreement. If an epidemic failure occurs, we may be required to replace or refund the value of the defective product and to cover certain other costs associated with the consequences of the epidemic failure. In addition, product defects, product recalls or epidemic failures may cause damage to our reputation or customer relationships, lost revenue, indemnification for a recall of our customers’ products, warranty claims, litigation or loss of market share with our customers, including our OEM and ODM customers. Our business liability insurance may be inadequate or future coverage may be unavailable on acceptable terms, which could adversely impact our operating results and financial condition.
Our standard warranties contain limits on damages and exclusions of liability for consequential damages and for misuse, improper installation, alteration, accident or mishandling while in the possession of someone other than us. We record an accrual for estimated warranty costs at the time revenue is recognized. We may incur additional expenses if our warranty provision do not reflect the actual cost of resolving issues related to defects in our products, whether as a result of a product recall, epidemic failure or otherwise. If these additional expenses are significant, it could adversely affect our business, financial condition and operating results.
Certain of our products contain encryption or security algorithms to protect third party content and user-generated data stored on our products. To the extent our products are hacked or the encryption schemes are compromised or breached, this could harm our business by hurting our reputation, requiring us to employ additional resources to fix the errors or defects and expose us to litigation and indemnification claims.
In addition, third-party components or applications that we incorporate or use in our products may contain defects in design or manufacturing that could unexpectedly result in epidemic failures and subject us to liability.
We rely substantially on our business ventures and strategic partnerships with Toshiba for the supply of NAND flash memory, which subjects us to risks and uncertainties that could harm our business, financial condition and operating results.
We are dependent on Flash Ventures and other strategic relationships with Toshiba for our NAND flash memory supply, and therefore our business, financial condition and operating results, and our ability to realize the anticipated benefits from the Merger, will be dependent on the success of Flash Ventures and other strategic relationships with Toshiba.
20
A majority of our NAND flash memory is supplied by Flash Ventures, which limits our ability to respond to demand and supply changes. A failure to accurately forecast demand could cause us to over-invest or under-invest in technology transitions or the expansion of captive memory capacity in Flash Ventures. Over-investment could result in excess supply, which could cause significant decreases in our product prices, significant excess, obsolete or lower of cost or net realizable value inventory write-downs or under-utilization charges, and the potential impairment of our investments in Flash Ventures. On the other hand, if we or Toshiba under-invest in captive memory capacity or technology transitions, if we grow capacity more slowly than the rest of the industry, if our technology transitions do not occur on the timeline that we expect, if we encounter unanticipated difficulties in implementing these transitions, or if we implement technology transitions more slowly than our competitors, we may not have enough captive supply of the right type of memory or at all to meet demand on a timely and cost effective basis and we may lose opportunities for revenue and share as a result. If our NAND memory supply is limited, we may make strategic decisions with respect to the allocation of our supply among our products and customers, and these strategic allocation decisions may result in less favorable gross margin in the short term or damage certain customer relationships. Growth of our NAND flash memory bit supply at a slower rate than the overall industry for an extended period of time would result in lowering our share which could limit our future opportunities and harm our financial results. We are also contractually obligated to pay for 50% of the fixed costs of Flash Ventures regardless of whether we purchase any wafers from Flash Ventures. Furthermore, purchase orders placed with Flash Ventures and under the foundry arrangements with Toshiba for up to three months are binding and cannot be canceled. Therefore, once our purchase decisions have been made, our production costs for flash memory are fixed, and we may be unable to reduce costs to match any subsequent declines in pricing or demand, which would harm our gross margin. Our limited ability to react to fluctuations in flash memory supply and demand makes our financial results particularly susceptible to variations from our forecasts and expectations.
In addition, we partner with Toshiba on the development of NAND flash technology. SanDisk has entered into strategic partnerships with Toshiba relating to R&D for the next technology transitions of NAND flash and alternative technologies beyond NAND flash technologies.
These ventures and strategic partnerships are subject to various risks that could harm the value of our investments, our revenue and costs, our future rate of spending, our technology plans and our future growth opportunities. Under the terms of SanDisk’s venture agreements with Toshiba, which govern the operations of Flash Ventures, we have limited power to unilaterally direct most of the activities that most significantly impact Flash Ventures’ performance. Although SanDisk and Toshiba have a long history of aligning on important manufacturing and technology development decisions, the integration of SanDisk into our organization could complicate the process of reaching agreement with Toshiba in a timely and favorable manner. We may not always agree with Toshiba on the NAND R&D roadmap, the technology path beyond NAND flash memory, or expansions or conversions of production capacity. A change in the management or control of Toshiba’s storage business could lead to delays in decision-making or changes in strategic direction that could also adversely impact Flash Ventures. In addition, Toshiba’s financial position or shift in strategic priorities could adversely impact our business.
Flash Ventures requires significant investments by both Toshiba and us for technology transitions, including the transition to 3D NAND, and capacity expansions. In March 2016, Toshiba announced plans to construct a new wafer fab in Yokkaichi, Japan, to provide additional cleanroom space for expanded 3D NAND production. Although we intend to extend the joint venture partnership with Toshiba to the new wafer fab, there is no certainty as to when, and on what terms, we will participate with Toshiba in any investment in, or use of, the new wafer fab, if at all. Failure to extend the joint venture partnership or failure to continue to secure and invest in additional cleanroom space to support the continued 3D NAND transition could adversely impact our supply of captive NAND flash memory and financial results. If Toshiba does not or we do not provide sufficient resources or have adequate access to credit, these investments could be delayed or reduced. In addition, in the event that lease financings for Flash Ventures are not available on favorable terms or at all, more cash would be required to fund these investments.
21
Our strategic relationships subject us to risks that could adversely affect our business, financial condition and results of operations.
We have entered into strategic relationships with various partners for future product development, sales growth and the supply of technologies, components, equipment and materials for use in our product design and manufacturing, including our relationships with Toshiba for NAND flash memory supply. In addition, in November 2015, we entered into an agreement to form a joint venture with Unis to market and sell our current data center storage systems in China and to develop data storage systems for the Chinese market in the future; the joint venture is 49% owned by us and 51% owned by Unis and its subsidiary, Unissoft (Wuxi) Group Co. Ltd. Please see the risk factor entitled “
Because we are dependent on a limited number of qualified suppliers for components, sub-assemblies, equipment, consumables, raw materials, and logistics, a supplier’s inability, unwillingness, or failure to support us in a timely manner with goods or services at a quality level and cost acceptable to us can adversely affect our margins, revenues and operating results,
” for a further description of the risks associated with our reliance on external suppliers. These strategic relationships are subject to various risks that could adversely affect the value of our investments and our results of operations and financial condition. These risks include, but are not limited to, the following:
|
•
|
our interests could diverge from our partners’ interests or we may not agree with co-venturers on ongoing activities, technology transitions or on the amount, timing or nature of further investments in the relationship;
|
|
•
|
we may experience difficulties and delays in ramping production at, and transferring technology to, our business ventures;
|
|
•
|
our control over the operations of our business ventures is limited;
|
|
•
|
due to financial constraints, our co-venturers may be unable to meet their commitments to us or may pose credit risks for our transactions with them;
|
|
•
|
due to differing business models or long-term business goals, our partners may decide not to join us in funding capital investment by our business ventures, which may result in higher levels of cash expenditures by us;
|
|
•
|
we may lose the rights to technology or products being developed by the strategic relationship, including if any of our co-venturers is acquired by another company, files for bankruptcy or experiences financial or other losses;
|
|
•
|
we may experience difficulties or delays in collecting amounts due to us from our co-venturers;
|
|
•
|
the terms of our arrangements may turn out to be unfavorable; and
|
|
•
|
changes in tax, legal or regulatory requirements may necessitate changes in the agreements with our co-venturers.
|
If our strategic relationships are unsuccessful or there are unanticipated changes in, or termination of, our strategic relationships, our business, results of operations and financial condition may be adversely affected.
Because we are dependent on a limited number of qualified suppliers for components, sub-assemblies, testing, equipment, consumables, raw materials, and logistics, a supplier’s inability, unwillingness, or failure to support us in a timely manner with goods or services at a quality level and cost acceptable to us can adversely affect our margins, revenues and operating results.
We depend on an external supply base for technologies, software (including firmware), controller, components, equipment and materials for use in our product design and manufacturing. We also depend on suppliers for a portion of our wafer testing, chip assembly, product assembly and product testing, and on service suppliers for providing technical support for our products. In addition, we use logistics partners to manage our just-in-time hubs, distribution centers and freight from suppliers to our factories and from our factories to our customers throughout the world. Many of the components and much of the equipment we acquire must be specifically designed to be compatible for use in our products or for developing and manufacturing our future products, and are only available from a limited number of suppliers, some of whom are our sole-source suppliers. We are therefore dependent on these suppliers to be able and willing to dedicate adequate engineering resources to develop components that can be successfully integrated into our products, technology and equipment that can be used to develop and manufacture our next-generation products efficiently. Our supply base has experienced industry consolidation. Where we rely on a limited number of suppliers or a single supplier, the risk of supplier loss due to industry consolidation is enhanced. Any disruption in our supply chain could reduce our revenue and adversely impact our financial results.
22
From time to time, our suppliers have experienced difficulty meeting our requirements. If we are unable to purchase sufficient quantities from our current suppliers or qualify and engage additional suppliers, we may not be able to meet demand for our products. We do not have long-term contracts with some of our existing suppliers, nor do we always have guaranteed manufacturing capacity with our suppliers and, therefore, we cannot guarantee that they will devote sufficient resources or capacity to manufacturing our products. We are not able to directly control product delivery schedules or quality assurance. Furthermore, we manufacture on a turnkey basis with some of our suppliers. In these arrangements, we do not have visibility and control of our suppliers’ inventories of purchased parts necessary to build our products or of the progress of our products through their assembly line. Any significant problems that occur at our suppliers, or their failure to perform at the level we expect, could lead to product shortages or quality assurance problems, either of which would harm our operating results and financial condition. In addition, if we are unable to purchase sufficient quantities from our current suppliers, we may not be able to engage alternative suppliers who are able or willing to provide goods or services in sufficient quantities or at a cost acceptable to us.
Our products require controllers and firmware. We rely on a limited number of third-party vendors to develop or supply controllers for many of our high-value solutions. Any delays or cost increases in developing or sourcing controllers or firmware, or incompatibility or quality issues relating to the controllers or firmware in our products, could harm our financial results as well as business relationships with our customers.
A majority of our flash memory is currently supplied by Flash Ventures and, to a much lesser extent, by third-party silicon suppliers. Any disruption or shortage in supply of flash memory from our captive or non-captive sources would harm our operating results and financial condition. Many of the risks that affect us also affect our supply base and Flash Ventures, including, but not limited to, having single site manufacturing locations and other facilities based in high risk regions of the world (for example, Flash Ventures is located in Yokkaichi, Japan), natural disasters, power shortages, macro and local economic conditions, shortages of commodity materials, proper management of technology transitions, geo-political risks, employee strikes and other labor actions, compliance with legal requirements, financial instability and exposure to intellectual property (“IP”) and other litigation, including an injunction or other action that could delay shipping. If any of these risks were to affect our suppliers or Flash Ventures, we could also be adversely affected, especially in the case of products, components or services that are single-sourced. For example, if suppliers are facing increased costs due to the above risks, they may require us to enter into long-term volume agreements to shift the burden of fixed costs to us. Further, we work closely with many of our suppliers and strategic partners to develop new technologies and, as a result, we may become subject to litigation from our suppliers, strategic partners or third parties.
Without a capable and financially stable supply base that has established appropriate relationships within the supply chain and has implemented business processes, strategies and risk management safeguards, we would be unable to develop our products, manufacture them in high volumes, and distribute them to our customers to execute our business plans effectively. Some of our suppliers have also experienced a decline in financial performance. Our suppliers may be acquired by our competitors, consolidate, or decide to exit the industry, redirect their investments and increase costs to us, each of which may have an adverse effect on our business and operations. In addition, moving to new technologies may require us to align to, and build, a new supply base. Our success in new product areas may be dependent on our ability to develop close relationships with new suppliers, with preferential agreements. Where this cannot be done, our business and operations may be adversely affected.
In addition to an external supply base, we also rely on an internal supply chain of heads, media and media substrate, and we rely on our business ventures with Toshiba for the supply of NAND flash memory. Please see the risk factors entitled, “
A fundamental change in storage technologies and standards could result in significant increases in our costs and could put us at a competitive disadvantage,” “If we do not properly manage technology transitions, our competitiveness and operating results may be negatively affected,” and “We rely substantially on our business ventures and strategic partnerships with Toshiba for the supply of NAND flash memory, which subjects us to risks and uncertainties that could harm our business, financial condition and operating results”
for a review of some of the risks related to these supplies.
23
Price volatility, shortages of critical materials or components, or use by other industries of materials and components used in the storage industry, may negatively impact our operating results.
Increases in the cost for certain critical materials and components and oil may increase our costs of manufacturing and transporting our products and key components and may result in lower operating margins if we are unable to pass these increased costs on to our customers. Shortages of critical components such as DRAM and NAND flash, or materials such as glass substrates, stainless steel, aluminum, nickel, neodymium, ruthenium, platinum or cerium, may increase our costs and may result in lower operating margins if we are unable to find ways to mitigate these increased costs. We or our suppliers acquire certain precious metals and rare earth metals like ruthenium, platinum, neodymium and cerium, which are critical to the manufacture of components in our products from a number of countries, including the People’s Republic of China. The government of China or any other nation may impose regulations, quotas or embargoes upon these metals that would restrict the worldwide supply of such metals or increase their cost, both of which could negatively impact our operating results until alternative suppliers are sourced. Furthermore, if other high volume industries increase their demand for materials or components used in our products, our costs may further increase, which could have an adverse effect on our operating margins. In addition, shortages in other components and materials used in our customers’ products could result in a decrease in demand for our products, which would negatively impact our operating results.
Contractual commitments with component suppliers may result in us paying increased charges and cash advances for such components or may cause us to have inadequate or excess component inventory.
To reduce the risk of component shortages, we attempt to provide significant lead times when buying components, which may subject us to cancellation charges if we cancel orders as a result of technology transitions or changes in our component needs. In addition, we may from time to time enter into contractual commitments with component suppliers in an effort to increase and stabilize the supply of those components and enable us to purchase such components at favorable prices. Some of these commitments may require us to buy a substantial number of components from the supplier or make significant cash advances to the supplier; however, these commitments may not result in a satisfactory increase or stabilization of the supply of such components. Furthermore, as a result of uncertain global economic conditions, our ability to forecast our requirements for these components has become increasingly difficult, therefore increasing the risk that our contractual commitments may not meet our actual supply requirements, which could cause us to have inadequate or excess component inventory and adversely affect our operating results and increase our operating costs.
If we do not properly manage technology transitions, our competitiveness and operating results may be negatively affected.
The storage markets in which we offer our products continuously undergo technology transitions that we must anticipate and adapt our products to address in a timely manner. If we fail to implement new technologies successfully, or if we are slower than our competitors at implementing new technologies, we may not be able to competitively offer products that our customers desire or keep pace with ASP reduction, which could harm our operating results. In addition, if our customers choose to delay transition to new technologies, if demand for the products that we develop is lower than expected or if the supporting technologies to implement these new technologies are not available, we may be unable to achieve the cost structure required to support our profit objectives or may be unable to grow or maintain our market position.
For example, as 2D NAND technology reaches its limits of cost effective technology scaling, our successful development of 3D NAND and alternative technologies, such as 3D ReRAM, and transitioning our customers to these technologies in a timely and effective manner are crucial to continuing the cost reductions necessary to maintain adequate gross margin. In transitioning our 2D NAND manufacturing capacity to 3D NAND technology, we could experience delays or other challenges in the production ramp, qualification of wafers, shipment of samples to customers or customer approval process. 3D NAND and any new manufacturing node may be more susceptible to manufacturing yield issues. Manufacturing yield issues may not be identified during the development or production process or solved until an actual product is manufactured and tested, further increasing our costs. If our technology transitions, including the production ramp of 3D NAND technology, take longer, are more costly to complete than anticipated, or do not improve manufacturing yield or other manufacturing efficiencies, our flash memory costs may not remain competitive with other NAND flash memory producers or may not fall commensurate with declines in the price of NAND flash memory, which would harm revenues, our gross margin and operating results.
Many companies, including some of our competitors, have developed or are attempting to develop alternative non-volatile technologies. Successful broad-based commercialization of one or more competing technologies, as well as differing strategies and timing with respect to the transition from 2D NAND to 3D NAND, could reduce the competitiveness and future revenue and profitability of our 2D NAND and 3D NAND flash technologies, and the potential 3D ReRAM technology that we are developing with our partners. In addition, we generate license and royalty revenue from NAND flash technology, and if NAND flash technology is replaced by a technology where our IP is less relevant, our license and royalty revenue would decrease. Also, we may not have access to alternative technologies that we do not develop internally and we may have to pay royalties in order to access such technologies.
24
Changes in product life cycles could adversely affect our financial results.
If product life cycles lengthen, we may need to develop new technologies or programs to reduce our costs on any particular product to maintain competitive pricing for that product. Longer product life cycles could also restrict our ability to transition customers to our newer products in a timely manner, or at all, negatively impacting our ability to recoup our significant R&D investments to improve our existing technology and develop new technologies. If product life cycles shorten, it may result in an increase in our overall expenses and a decrease in our gross margins, both of which could adversely affect our operating results. In addition, shortening of product life cycles also makes it more difficult to recover the cost of product development before the product becomes obsolete. Our failure to recover the cost of product development in the future could adversely affect our operating results.
A fundamental change in storage technologies and standards could result in significant increases in our costs and could put us at a competitive disadvantage.
Historically, when the industry experiences a fundamental change in storage technologies or standards, any manufacturer that fails to successfully and timely adjust its designs and processes to accommodate the new technology or standard fails to remain competitive. There are some revolutionary technologies, such as current-perpendicular-to-plane giant magnetoresistance, shingle magnetic recording, heat-assisted magnetic recording, patterned magnetic media and advanced signal processing that, if implemented by a competitor on a commercially viable basis ahead of the industry, could put us at a competitive disadvantage. In addition, many companies, including some of our competitors, have developed or are attempting to develop alternative non-volatile technologies, including non-NAND technologies such as magnetorestitive RAM, ReRAM, 3D XPoint, phase change and Memristor, as well as NAND based vertical or stacked 3D memories based on charge trap, floating gate and other cell architecture. In embedded solutions, certain competitors have recently introduced a mobile storage standard referred to as Universal Flash Storage, or UFS, and in the datacenter market, certain competitors have recently introduced a non-volatile memory express, or NVMe, product that can be used as a substitute for our PCIe solutions. As a result of these shifts in technology and standards, we could incur substantial costs in developing new technologies, such as recording heads, magnetic media and tools, in adopting new standards or in investing in different capital equipment or manufacturing processes to remain competitive. If we fail to successfully implement these new technologies or standards, or if we are significantly slower than our competitors at implementing new technologies or standards, we may not be able to offer products with capacities and capabilities that our customers desire, which could harm our operating results.
The difficulty of introducing hard drives with higher levels of areal density and the challenges of reducing other costs may impact our ability to achieve historical levels of cost reduction.
Storage capacity of the hard drive, as manufactured by us, is determined by the number of disks and each disk’s areal density. Areal density is a measure of the amount of magnetic bits that can be stored on the recording surface of the disk. Generally, the higher the areal density, the more information can be stored on a single platter. Higher areal densities require existing recording head and magnetic media technology to be improved or new technologies developed to accommodate more data on a single disk. Historically, we have been able to achieve a large percentage of cost reduction through increases in areal density. Increases in areal density mean that the average drive we sell has fewer heads and disks for the same capacity and, therefore, may result in a lower component cost. However, increasing areal density has become more difficult in the storage industry. If we are not able to increase areal density at the same rate as our competitors or at a rate that is expected by our customers, we may be required to include more components in our drives to meet demand without corresponding incremental revenue, which could negatively impact our operating margins and make achieving historical levels of cost reduction difficult or unlikely. Additionally, increases in areal density may require us to make further capital expenditures on items such as new test equipment needed as a result of an increased number of gigabytes per platter. Our inability to achieve cost reductions could adversely affect our operating results.
25
Our license and royalty revenue may fluctuate or decline significantly in the future due to license agreement expirations or renewals, declines in sales of the products or use of technology underlying the license and royalty revenue by our licensees, or if licensees fail to perform on a portion or all of their contractual obligations.
If our existing licensees do not renew their licenses upon expiration, renew or sign new agreements on less favorable terms, exercise their option to terminate the license or fail to exercise their option to extend the licenses, or we are not successful in signing new licensees in the future, our license revenue, profitability and cash provided by operating activities would be harmed and we may incur significant patent litigation costs to enforce our patents against these licensees. As our older patents expire, and the coverage of our newer patents may be different, it may be more difficult to negotiate or renew favorable license agreement terms or a license agreement at all. Our 2009 license agreement with Samsung expired on August 14, 2016. If we are unable to negotiate a new agreement or if we negotiate a new agreement on less favorable terms such as a lower effective royalty rate compared to the expired license agreement, we will experience a decrease in license and royalty revenue. Our agreements may require us in certain instances to recognize license revenue related to a particular licensee all in one period instead of over time, which could create additional volatility in our licensing revenue. A portion of our license and royalty revenue is based on sales of product categories as well as the underlying technology, and fluctuations in the sales of those products or technology adoption rates would also result in fluctuations in the license and royalty revenue due to us under our agreements. If our licensees or we fail to perform on contractual obligations, we may incur costs to enforce or defend the terms of our licenses and there can be no assurance that our enforcement, defense or collection efforts will be effective. If we license new IP from third parties or existing licensees, we may be required to pay license fees, royalty payments or offset existing license revenue. We may enter into agreements with customers, suppliers or partners that could limit our ability to monetize our IP or could result in us being required to provide IP indemnification to our customers, suppliers or partners. In addition, we may be subject to disputes, claims or other disagreements on the timing, amount or collection of royalties or license payments under our license agreements.
If we do not properly manage new product development, our competitiveness and operating results may be negatively affected.
Our success depends in part on our ability to develop and introduce new products in a timely manner in order to keep pace with technology advancements. Advances in semiconductor technology have resulted in other emerging technologies that can be competitive with traditional storage technologies. We may be unsuccessful in anticipating and developing new and improved products for the client, enterprise and other storage markets in response to competing technologies. If our hard drive, solid state products and our storage solutions products fail to offer a superior value proposition to alternative storage products, we will be at a competitive disadvantage and our business will suffer. In some cases, our customers’ demand for a more diversified portfolio results in investments in new products for a particular market that do not necessarily expand overall market opportunity, which may negatively affect our operating results. As we introduce new products, standards or technologies, it can take time for these new standards or technologies to be adopted, for consumers to accept and transition to these new standards or technologies and for significant sales to be generated, if at all. Failure of consumers or enterprises to adopt our new products, standards or technologies could harm our results of operations as we fail to reap the benefits of our investments.
In addition, the success of our new product introductions depends on a number of other factors, including:
|
•
|
difficulties faced in manufacturing ramp;
|
|
•
|
implementing at an acceptable cost product features expected by our customers;
|
|
•
|
market acceptance/qualification;
|
|
•
|
effective management of inventory levels in line with anticipated product demand;
|
|
•
|
quality problems or other defects in the early stages of new product introduction and problems with compatibility between our products and those of our customers that were not anticipated in the design of those products;
|
|
•
|
our ability to increase our software development capability; and
|
|
•
|
the effectiveness of our go-to-market capability in selling these new products.
|
In particular, as part of our growth strategy, we have made significant investments in active archive systems, which are designed to enable organizations to rapidly access massive long-term data stores. For example, our acquisition of Amplidata was partially driven by our strategy to expand in this area. We expect to continue to make significant investments in active archive systems. Our active archive systems may fail to gain market acceptance, or the market for active archive systems may not grow as we anticipate.
26
We
have also seen, and anticipate continuing to see, an increase in customers requesting that we develop products, including software associated with our products, that incorporate open source software elements and operate in an open source environment. Adapting to this demand may cause product delays, placing us at a competitive disadvantage.
Open source products could also reduce our capability for product differentiation or innovation and our affected products could be diminished to commodity status, which we expect would place increased downward pressure on our margins. If we fail to successfully anticipate and manage issues associated with our product development generally, our business may suffer.
Our operations, and those of certain of our suppliers and customers, are concentrated in large, purpose-built facilities, subjecting us to substantial risk of damage or loss if operations at any of these facilities are disrupted.
As a result of our cost structure and strategy of vertical integration, we conduct our operations at large, high volume, purpose-built facilities in California and throughout Asia. The concentration of Flash Ventures in Yokkaichi, Japan, magnifies the risks of supply disruption. The facilities of many of our customers, our suppliers and our customers’ suppliers are also concentrated in certain geographic locations throughout Asia and elsewhere. A localized health risk affecting our employees at these facilities or the staff of our or our customers’ other suppliers, such as the spread of a pandemic influenza, could impair the total volume of our products that we are able to manufacture or sell, which would result in substantial harm to our operating results. Similarly, a fire, flood, earthquake, tsunami or other natural disaster, condition or event such as political instability, civil unrest or a power outage that adversely affects any of these facilities, including access to or from these facilities by employees or logistics operators, would significantly affect our ability to manufacture or sell our products, which would result in a substantial loss of sales and revenue and a substantial harm to our operating results. For example, prior to the 2011 flooding in Thailand, all of WD's internal slider capacity and 60% of WD's hard drive manufacturing capacity was in Thailand. As a result of the flooding in Thailand, WD's facilities were inundated and temporarily shut down. During that period, WD's ability to manufacture hard drives was significantly constrained, adversely affecting WD's business, financial condition and results of operations. In addition, the concentration of our manufacturing sites could exacerbate the negative impacts resulting from localized labor unrest or other employment issues. A significant event that impacts any of our manufacturing sites, or the sites of our customers or suppliers, could adversely affect our ability to manufacture or sell our products, and our business, financial condition and results of operations could suffer.
We may incur losses beyond the limits of, or outside the scope of, the coverage of our insurance policies. There can be no assurance that in the future we will be able to maintain existing insurance coverage or that premiums will not increase substantially. Due to market availability, pricing or other reasons, we may elect not to purchase insurance coverage or to purchase only limited coverage. We maintain limited insurance coverage and, in some cases, no coverage at all, for natural disasters and environmental damages, as these types of insurance are sometimes not available or available only at a prohibitive cost. We depend upon Toshiba to obtain and maintain sufficient property, business interruption and other insurance for Flash Ventures. If Toshiba fails to do so, we could suffer significant unreimbursable losses, and such failure could also cause Flash Ventures to breach various financing covenants.
Manufacturing, marketing and selling our products globally subjects us to numerous risks.
Currently, a large portion of our revenue is derived from our international operations, and many of our products and components are produced overseas. Our revenue and future growth is significantly dependent on the growth of international markets, and we may face difficulties in entering or maintaining international sales markets. We are subject to risks associated with our global manufacturing operations and global marketing and sales efforts, as well as risks associated with our utilization of and reliance on contract manufacturers, including:
|
•
|
obtaining requisite governmental permits and approvals, compliance with foreign laws and regulations, changes in foreign laws and regulations;
|
|
•
|
the need to comply with regulations on international business, including the Foreign Corrupt Practices Act, the United Kingdom Bribery Act 2010, the anti-bribery laws of other countries and rules regarding conflict minerals;
|
|
•
|
currency exchange rate fluctuations or restrictions;
|
|
•
|
political and economic instability, civil unrest and natural disasters;
|
|
•
|
limited transportation availability, delays, and extended time required for shipping, which risks may be compounded in periods of price declines;
|
|
•
|
higher freight rates;
|
|
•
|
labor challenges, including difficulties finding and retaining talent or responding to labor disputes or disruptions;
|
|
•
|
trade restrictions or higher tariffs and fees, import and export restriction including on encryption technology, and complex customs regulations;
|
|
•
|
copyright levies or similar fees or taxes imposed in European and other countries;
|
27
|
•
|
exchange, currency and tax controls and reallocations;
|
|
•
|
increasing labor and overhead costs;
|
|
•
|
weaker protection of IP rights;
|
|
•
|
difficulties in managing international operations, including appropriate internal controls; and
|
|
•
|
loss or non-renewal of favorable tax treatment under agreements or treaties with foreign tax authorities.
|
As a result of these risks, our business, results of operations or financial condition could be adversely affected.
Terrorist attacks may adversely affect our business and operating results.
Recent terrorist incidents around the world and the continued threat of terrorist activity and other acts of war or hostility have created uncertainty in the financial and insurance markets and have significantly increased the political, economic and social instability in some of the geographic areas in which we, our suppliers or our customers operate. Additionally, it is uncertain what impact the reactions to such acts by various governmental agencies and security regulators worldwide will have on shipping costs. Acts of terrorism, either domestically or abroad, could create further uncertainties and instability. To the extent this results in disruption or delays of our manufacturing capabilities, R&D activities (including our operations in Israel) or shipments of our products, our business, operating results and financial condition could be adversely affected. Any of these events could also increase volatility in the U.S. and world financial markets, which could have a negative effect on our stock price and may limit the capital resources available to us and our customers or suppliers, or adversely affect consumer confidence.
Sudden disruptions to the availability of air transportation, or ocean or land freight lanes, could have an impact on our operations.
We generally ship our products to our customers, and receive shipments from our suppliers, via air, ocean or land freight. The sudden unavailability or disruption of air transportation, cargo operations or ocean, rail or truck freight lanes caused by, among other things, labor difficulties or disputes, severe weather patterns or other natural disasters, or political instability or civil unrest, could impact our operating results by impairing our ability to timely and efficiently receive shipments from our suppliers or deliver our products.
If our technology infrastructure, systems or products are compromised, damaged or interrupted by cyber attacks, data security breaches, other security problems, security vulnerabilities or design defects, or sustain system failures, our operating results and financial condition could be adversely affected.
We experience cyber attacks of varying degrees on our technology infrastructure and systems and, as a result, unauthorized parties have obtained in the past, and may in the future obtain, access to our computer systems and networks. The technology infrastructure and systems of our suppliers, vendors and partners may also experience such attacks. Cyber attacks can include computer viruses, computer denial-of-service attacks, worms, and other malicious software programs or other attacks, covert introduction of malware to computers and networks, impersonation of authorized users, and efforts to discover and exploit any security vulnerabilities or security weaknesses, as well as intentional or unintentional acts by employees or other insiders with access privileges, intentional acts of vandalism by third parties and sabotage. We believe cyber attack attempts are increasing in number and that cyber attackers are developing increasingly sophisticated systems and means to not only attack systems, but also to evade detection or to obscure their activities. Our products are also targets for cyber attacks. While some of our products contain encryption or security algorithms to protect third-party content or user-generated data stored on our products, these products could still be hacked or the encryption schemes could be compromised, breached, or circumvented by motivated and sophisticated attackers. We have agreed with certain customers and strategic partners, including Toshiba, to undertake certain commitments to promote information security, and we may be liable to Toshiba or such other parties if we fail to meet our cyber security commitments.
In addition, our technology infrastructure and systems are vulnerable to damage or interruption from natural disasters, power loss and telecommunications failures. Further, our products contain sophisticated hardware and operating system software and applications that may contain security problems, security vulnerabilities, or defects in design or manufacture, including “bugs” and other problems that could interfere with the intended operation of our products.
28
If efforts to breach our infrastructure, systems or products are successful or we are unable to protect against these risks, we could suffer interruptions, delays, or cessation of operations of our systems, and loss or misuse of proprietary or confidential information, IP, or sensitive or personal information. Breaches of our infrastructure, systems or products could also cause our customers and other affected third parties to suffer loss or misuse of proprietary or confidential information, IP, or sensitive or personal information, and could harm our relationships with customers and other third parties. As a result, we could experience additional costs, indemnification claims, litigation, and damage to our brand and reputation. All of these consequences could harm our reputation and our business and materially and adversely affect our operating results and financial condition.
If we fail to identify, manage, complete and integrate acquisitions, investment opportunities or other significant transactions, which are a key part of our growth strategy, it may adversely affect our future results.
We seek to be an industry-leading developer, manufacturer and provider of innovative storage solutions, balancing our core hard drive and flash memory business with growing investments in newer areas that we believe will provide us with higher growth opportunities. Acquisitions of, investment opportunities in, or other significant transactions with companies that are complementary to our business are a key part of our overall business strategy. For example, we have completed the acquisitions of SanDisk (in May 2016), Amplidata (in March 2015), Virident Systems, Inc. (in October 2013) and sTec, Inc. (in September 2013). In order to pursue this part of our growth strategy successfully, we must continue to identify attractive acquisition or investment opportunities, successfully complete the transactions, some of which may be large and complex, and manage post-closing issues such as integration of the acquired company or employees. We may not be able to continue to identify or complete appealing acquisition or investment opportunities given the intense competition for these transactions. We are also subject to certain covenants in our debt agreements which place limits on our ability to complete acquisitions and investments. Even if we identify and complete suitable corporate transactions, we may not be able to successfully address any integration challenges in a timely manner, or at all. Failing to successfully integrate or realign our business to take advantage of efficiencies or reduce redundancies of an acquisition may result in not realizing all or any of the anticipated benefits of the acquisition. In addition, failing to achieve the financial model projections for an acquisition may result in the incurrence of impairment charges and other expenses, both of which could adversely impact our results of operations or financial condition. Acquisitions and investments may also result in the issuance of equity securities that may be dilutive to our stockholders and the issuance of additional indebtedness which would put additional pressure on liquidity. Furthermore, we may agree to provide continuing service obligations or enter into other agreements in order to obtain certain regulatory approvals of our corporate transactions, and failure to satisfy these additional obligations could result in our failing to obtain regulatory approvals or the imposition of additional obligations on us, any of which could adversely affect our business, financial condition and results of operations.
The loss of our key executive management, staff and skilled employees, the inability to hire and integrate new employees or decisions to realign our business could negatively impact our business prospects.
Our success depends upon the continued contributions of our key management, staff and skilled employees, many of whom would be extremely difficult to replace. Global competition for skilled employees in the data storage industry is intense and, as we attempt to move to a position of technology leadership in the storage industry, our business success becomes increasingly dependent on our ability to retain our key staff and skilled employees, to attract, integrate and retain new skilled employees, including employees from acquisitions, and to make decisions to realign our business to take advantage of efficiencies or reduce redundancies. Volatility or lack of positive performance in our stock price and the overall markets may adversely affect our ability to retain key staff or skilled employees who have received equity compensation. Additionally, because a substantial portion of our key employees’ compensation is placed “at risk” and linked to the performance of our business, when our operating results are negatively impacted, we are at a competitive disadvantage for retaining and hiring key management, staff and skilled employees versus other companies that pay a relatively higher fixed salary. If we lose our existing key management, staff or skilled employees, or are unable to hire and integrate new key management, staff or skilled employees, or if we fail to implement succession plans for our key management or staff, our operating results would likely be harmed. Furthermore, if we do not realize the anticipated benefits of our intended realignment after we make decisions regarding our personnel and implement our realignment plans, our operating results could be adversely affected.
We and certain of our officers are at times involved in litigation, including IP, antitrust and securities litigation, which may be costly, may divert the efforts of our key personnel and could result in adverse court rulings, which could materially harm our business.
We are involved in litigation, including cases involving our IP rights and those of others, antitrust and commercial matters, putative securities class action suits and other actions. We are the plaintiff in some of these actions and the defendant in others. Some of the actions seek injunctive relief, including injunctions against the sale of our products and substantial monetary damages, which if granted or awarded, could materially harm our business, financial condition and operating results.
29
Litigation is subject to inherent risks and uncertainties that may cause actual results to differ materially from our expectations. If we receive an adverse judgment in any litigation, we could be required to pay substantial damages and cease certain practices or activities, including the manufacture, use and sale of products. With or without merit, litigation can be complex, can extend for a protracted period of time, can be very expensive and the expense can be unpredictable. Litigation initiated by us could also result in counter-claims against us, which could increase the costs associated with the litigation and result in our payment of damages or other judgments against us. In addition, litigation, and any related publicity, may divert the efforts and attention of some of our key personnel. Litigation may also harm the market prices of our securities.
We may be obligated to indemnify our current or former directors or employees, or former directors or employees of companies that we have acquired, in connection with litigation or regulatory investigations. These liabilities could be substantial and may include, among other things: the costs of defending lawsuits against these individuals; the cost of defending stockholder derivative suits; the cost of governmental, law enforcement or regulatory investigations; civil or criminal fines and penalties; legal and other expenses; and expenses associated with the remedial measures, if any, which may be imposed.
We are subject to laws, rules, and regulations in the U.S. and other countries relating to the collection, use, sharing, and security of third-party data including personal data, and our failure to comply with these laws, rules and regulations could subject us to proceedings by governmental entities or others and cause us to incur penalties, significant legal liability, or loss of customers, loss of revenue, and reputational harm
.
We are subject to laws, rules, and regulations in the U.S. and other countries relating to the collection, use, and security of third-party data including data that relates to or identifies an individual person. In many cases, these laws apply not only to third-party transactions, but also to transfers of information between us and our subsidiaries, and among us, our subsidiaries and other parties with which we have commercial relations. Our possession and use of third-party data, including personal data and employee data in conducting our business subjects us to legal and regulatory burdens that may require us to notify vendors, customers or employees or other parties with which we have commercial relations of a data security breach and to respond to regulatory inquiries and to enforcement proceedings. Global privacy and data protection legislation, enforcement, and policy activity in this area are rapidly expanding and evolving, and may be inconsistent from jurisdiction to jurisdiction. Compliance requirements and even our inadvertent failure to comply with applicable laws may cause us to incur substantial costs, subject us to proceedings by governmental entities or others, and cause us to incur penalties or other significant legal liability, or lead us to change our business practices.
The nature of our industry and its reliance on IP and other proprietary information subjects us and our suppliers, customers and partners to the risk of significant litigation.
The data storage industry has been characterized by significant litigation. This includes litigation relating to patent and other IP rights, product liability claims and other types of litigation. We have historically been involved in frequent disputes regarding patent and other IP rights, and we have in the past received, and we may in the future receive, communications from third parties asserting that certain of our products, processes or technologies infringe upon their patent rights, copyrights, trademark rights or other IP rights. We may also receive claims of potential infringement if we attempt to license IP to others. IP risks increase when we enter into new markets where we have little or no IP protection as a defense against litigation. The complexity of the technology involved and the uncertainty of IP litigation increase the IP risks we face. Litigation can be expensive, lengthy and disruptive to normal business operations. Moreover, the results of litigation are inherently uncertain and may result in adverse rulings or decisions. We may be subject to injunctions, enter into settlements or be subject to judgments that may, individually or in the aggregate, have a material adverse effect on our business, financial condition or operating results.
If we incorporate third-party technology into our products or if claims or actions are asserted against us for alleged infringement of the IP of others, we may be required to obtain a license or cross-license, modify our existing technology or design a new non-infringing technology. Such licenses or design modifications can be extremely costly. We evaluate notices of alleged patent infringement and notices of patents from patent holders that we receive from time to time. We may decide to settle a claim or action against us, which settlement could be costly. We may also be liable for any past infringement. If there is an adverse ruling against us in an infringement lawsuit, an injunction could be issued barring production or sale of any infringing product. It could also result in a damage award equal to a reasonable royalty or lost profits or, if there is a finding of willful infringement, treble damages. Any of these results would increase our costs and harm our operating results. In addition, our suppliers, customers and partners are subject to similar risks of litigation, and a material, adverse ruling against a supplier, customer or partner could negatively impact our business.
Moreover, from time to time, we agree to indemnify certain of our suppliers and customers for alleged IP infringement. The scope of such indemnity varies but may include indemnification for direct and consequential damages and expenses, including attorneys’ fees. We may be engaged in litigation as a result of these indemnification obligations. Third party claims for patent infringement are excluded from coverage under our insurance policies. A future obligation to indemnify our customers or suppliers may harm our business, financial condition and operating results.
30
Our reliance on IP and other proprietary information subjects us to the risk that these key ingredients of our business could be copied by competitors.
Our success depends, in significant part, on the proprietary nature of our technology, including non-patentable IP such as our process technology. We primarily rely on patent, copyright, trademark and trade secret laws, as well as nondisclosure agreements and other methods, to protect our proprietary technologies and processes. There can be no assurance that our existing patents will continue to be held valid, if challenged, or that they will have sufficient scope or strength to protect us. It is also possible that competitors or other unauthorized third parties may obtain, copy, use or disclose, illegally or otherwise, our proprietary technologies and processes, despite our efforts to protect our proprietary technologies and processes. If a competitor is able to reproduce or otherwise capitalize on our technology despite the safeguards we have in place, it may be difficult, expensive or impossible for us to obtain necessary legal protection. There are entities whom we believe may infringe our IP. Enforcement of our rights often requires litigation. If we bring a patent infringement action and are not successful, our competitors would be able to use similar technology to compete with us. Moreover, the defendant in such an action may successfully countersue us for infringement of their patents or assert a counterclaim that our patents are invalid or unenforceable. Also, the laws of some foreign countries may not protect our IP to the same extent as do U.S. laws. In addition to patent protection of IP rights, we consider elements of our product designs and processes to be proprietary and confidential. We rely upon employee, consultant and vendor non-disclosure agreements and contractual provisions and a system of internal safeguards to protect our proprietary information. However, any of our registered or unregistered IP rights may be challenged or exploited by others in the industry, which could harm our operating results.
The success of our branded products depends in part on the positive image that consumers have of our brands. We believe the popularity of our brands makes them a target of counterfeiting or imitation, with third parties attempting to pass off counterfeit products as our products. Any occurrence of counterfeiting, imitation or confusion with our brands could adversely affect our reputation and impair the value of our brands, which in turn could negatively impact sales of our branded products, our share and our gross margin, as well as increase our administrative costs related to brand protection and counterfeit detection and prosecution.
The costs of compliance with state, federal and international legal and regulatory requirements, such as environmental, labor, trade, health, safety, anti-corruption and tax regulations, customers’ standards of corporate citizenship, and industry and coalition standards, such as those established by the Electronics Industry Citizenship Coalition, could cause an increase in our operating costs.
We are subject to, and may become subject to additional, state, federal and international laws and regulations governing our environmental, labor, trade, health, safety, anti-corruption and tax practices. These laws and regulations, particularly those applicable to our international operations, are or may be complex, extensive and subject to change. We will need to ensure that we and our suppliers and partners timely comply with such laws and regulations, which may result in an increase in our operating costs. Legislation has been, and may in the future be, enacted in locations where we manufacture or sell our products. In addition, climate change and financial reform legislation is a significant topic of discussion and has generated and may continue to generate federal, international or other regulatory responses in the near future. If we or our suppliers or partners fail to timely comply with applicable legislation, our customers may refuse to purchase our products or we may face increased operating costs as a result of taxes, fines or penalties, or legal liability and reputational damage, which would have a materially adverse effect on our business, operating results and financial condition.
In connection with our compliance with environmental laws and regulations, as well as our compliance with industry and coalition environmental initiatives, such as those established by the Electronics Industry Citizenship Coalition, the standards of business conduct required by some of our customers, and our commitment to sound corporate citizenship in all aspects of our business, we could incur substantial compliance and operating costs and be subject to disruptions to our operations and logistics. In addition, if we were found to be in violation of these laws or noncompliant with these initiatives or standards of conduct, we could be subject to governmental fines, liability to our customers and damage to our reputation and corporate brand which could cause our financial condition and operating results to suffer.
31
Conflict minerals regulations may cause us to incur additional expenses and could limit the supply and increase the cost of certain components and metals contained in our products.
In August 2012, the SEC adopted rules establishing diligence and disclosure requirements regarding the use and source of gold, tantalum, tin and tungsten, commonly referred to as 3TG or conflict minerals, that are necessary to the functionality or production of products manufactured or contracted to be manufactured by public companies. These rules require us to determine and report annually whether such 3TG originated from the Democratic Republic of the Congo or an adjoining country. These rules could affect our ability to source components that contain 3TG, or 3TG generally, at acceptable prices and could impact the availability of such components or 3TG, since there may be only a limited number of suppliers of “conflict free” 3TG. Our customers, including our OEM customers, may require, and some of our customers have notified us that they require, that our products contain only conflict free 3TG, and our revenues and margins may be harmed if we are unable to meet this requirement at a reasonable price, or at all, or are unable to pass through any increased costs associated with meeting this requirement. Additionally, we may suffer reputational harm with our customers and other stakeholders and challenges from government regulators if our products are not conflict free or if we are unable to sufficiently verify the origins of the 3TG contained in our products through the due diligence procedures that we implement. We could incur significant costs to the extent that we are required to make changes to products, processes, or sources of supply due to the foregoing requirements or pressures. To the extent that conflict minerals legislation is adopted by the European Commission, Canada or any other jurisdiction, these risks could increase.
Violation of applicable laws, including labor or environmental laws, and certain other practices by our suppliers, customers or partners could harm our business.
We expect our suppliers, customers and partners to operate in compliance with applicable laws and regulations, including labor and environmental laws, and to otherwise meet our required standards of conduct. While our internal operating guidelines promote ethical business practices, we do not control our suppliers, customers, partners or their labor or environmental practices. The violation of labor, environmental or other laws by any of them, or divergence of their business practices from those generally accepted as ethical, could harm our business by:
|
•
|
interrupting or otherwise disrupting the shipment of our product components;
|
|
•
|
damaging our reputation;
|
|
•
|
forcing us to find alternate component sources;
|
|
•
|
reducing demand for our products (for example, through a consumer boycott); or
|
|
•
|
exposing us to potential liability for our suppliers’, customers’ or partners’ wrongdoings.
|
Because of high debt levels, we may not be able to service our debt obligations in accordance with their terms.
As of July 1, 2016, our total indebtedness was $17.5 billion, and we had $1.0 billion of additional borrowing availability under our revolving credit facility. Our ability to meet our expense and debt service obligations contained in our debt agreements will depend on our available cash and our future performance, which will be affected by financial, business, economic and other factors, including potential changes in laws or regulations, industry conditions, industry supply and demand balance, customer preferences, the success of our products and pressure from competitors. If we are unable to meet our debt service obligations or should we fail to comply with our financial and other restrictive covenants contained in the agreements governing our indebtedness, we may be required to refinance all or part of our debt, sell important strategic assets at unfavorable prices, incur additional indebtedness or issue common stock or other equity securities. We may not be able to, at any given time, refinance our debt, sell assets, incur additional indebtedness or issue equity securities on terms acceptable to us, in amounts sufficient to meet our needs or at all. If we are able to raise additional funds through the issuance of equity securities, such issuance would also result in dilution to our shareholders. Our inability to service our debt obligations or refinance our debt could have a material adverse effect on our business, operating results and financial condition. In addition, our debt obligations may limit our ability to make required investments in capacity, technology or other areas of our business, which could have a material adverse effect on our business, operating results and financial condition. Further, if we are unable to repay, refinance or restructure our secured indebtedness, the holder of such debt could proceed against the collateral securing that indebtedness.
32
The terms of the agreements governing our indebtedness may restrict our current and future operations, particularly our ability to respond to changes or to pursue our business strategies, and could adversely affect our capital resources, financial condition and liquidity.
The agreements that govern our indebtedness contain a number of restrictive covenants that impose significant operating and financial restrictions on us and may limit our ability to engage in acts that may be in our long-term best interests, including, among other things, restrictions on our ability to:
|
•
|
incur, assume or guarantee additional indebtedness;
|
|
•
|
declare or pay dividends or make other distributions with respect to, or purchase or otherwise acquire or retire for value, equity interests;
|
|
•
|
make principal payments on, or redeem or repurchase, subordinated debt;
|
|
•
|
make loans, advances or other investments;
|
|
•
|
incur liens;
|
|
•
|
sell or otherwise dispose of assets, including capital stock of subsidiaries;
|
|
•
|
purchase assets, make investments, complete acquisitions, consolidate or merge with or into, or sell all or substantially all of our assets to, another person; and
|
|
•
|
enter into transactions with affiliates.
|
Due to these restrictions, we may be unable to raise additional debt or equity financing to operate our business during general economic or business downturns, and we may be unable to compete effectively or take advantage of new opportunities to grow our business. In addition, our credit facilities require us to comply with certain financial maintenance covenants. Our ability to satisfy these financial maintenance covenants can be affected by events beyond our control, and we cannot assure you that we will meet them. The indebtedness and these restrictive covenants may have the effect, among other things, of limiting our flexibility in the conduct of our business and making us more vulnerable to economic downturns and adverse competitive and industry conditions.
A breach of the covenants under these agreements could result in an event of default under the applicable indebtedness, which, if not cured or waived, could result in us having to repay our borrowings or repay our notes before their due dates. Such default may allow the debt holders to accelerate the related debt and may result in the acceleration of any other debt, leases, or other obligations to which a cross-acceleration or cross-default provision applies. If we are forced to refinance these borrowings or our notes on less favorable terms or if we were to experience difficulty in refinancing the debt prior to maturity, our results of operations and financial condition could be materially affected. In addition, an event of default under our credit facilities may permit the lenders under our credit facilities to terminate all commitments to extend further credit under such credit facilities. If we are unable to repay the amounts due and payable under our credit facilities and our senior secured notes, those lenders may be able to proceed against the collateral granted to them to secure that indebtedness. In the event our lenders or holders of notes accelerate the repayment of such borrowings, we cannot assure you that we will have sufficient assets to repay such indebtedness. Any of the foregoing would have a material adverse effect on our business, results of operations and financial condition.
Flash Ventures’ equipment lease agreements contain covenants and other cancellation events, and cancellation of the leases would harm our business, operating results and financial condition.
Flash Ventures sells and leases back from a consortium of financial institutions (“lessors”) a portion of its equipment and Flash Ventures has entered into equipment lease agreements, of which we and Toshiba each guarantee half of the total outstanding obligations. As of July 1, 2016, the portion of outstanding Flash Ventures’ lease obligations covered by our guarantees totaled approximately $1.15 billion, based upon the exchange rate at July 1, 2016. The equipment lease agreements contain covenants and cancellation events that are customary for Japanese lease facilities and that relate to Flash Ventures and each of the guarantors. Cancellation events relating to the guarantors include, among other things, an assignment of all or a substantial part of a guarantor’s business, acceleration of other monetary debts of a guarantor above a specified threshold and certain financial covenants.
The breach of a covenant or the occurrence of another cancellation event could result in an acceleration of the Flash Ventures’ lease obligations. If a cancellation event were to occur, Flash Ventures would be required to negotiate a resolution with the lessors, as well as other parties to the lease transactions, to avoid cancellation and acceleration of the lease obligations. Such resolution could include, among other things, supplementary security to be supplied by us, as guarantor, increased interest rates or waiver fees. If a cancellation event occurs and we fail to reach a resolution, we may be required to pay all or a portion of the outstanding lease obligations covered by our guarantees, which would significantly reduce our cash position and may force us to seek additional financing, which may not be available on terms acceptable to us, if at all.
33
Any decisions to reduce or discontinue paying cash dividends to our shareholders could cause the market price for our common stock to decline.
We may modify, suspend or cancel our cash dividend policy in any manner and at any time. Any reduction or discontinuance by us of the payment of quarterly cash dividends could cause the market price of our common stock to decline. Moreover, in the event our payment of quarterly cash dividends are reduced or discontinued, our failure or inability to resume paying cash dividends at historical levels could cause the market price of our common stock to decline.
Fluctuations in currency exchange rates as a result of our international operations may negatively affect our operating results.
Because we manufacture and sell our products abroad, our revenue, cost of goods sold, margins, operating costs and cash flows are impacted by fluctuations in foreign currency exchange rates. If the U.S. dollar exhibits sustained weakness against most foreign currencies, the U.S. dollar equivalents of unhedged manufacturing costs could increase because a significant portion of our production costs are foreign-currency denominated. Conversely, there would not be an offsetting impact to revenues since revenues are substantially U.S. dollar denominated. Additionally, we negotiate and procure some of our component requirements in U.S. dollars from non-U.S. based vendors. If the U.S. dollar weakens against other foreign currencies, some of our component suppliers may increase the price they charge for their components in order to maintain an equivalent profit margin. In addition, our purchases of NAND flash memory from Flash Ventures and our investment in Flash Ventures are denominated in Japanese yen. If the Japanese yen appreciates against the U.S. dollar, our cost of purchasing NAND flash wafers and the cost to us of future funding of Flash Ventures would increase, and the value of our investments denominated in Japanese yen would be higher, increasing our exposure to asset impairment. If any of these events occur, they would have a negative impact on our operating results.
Prices for our products are substantially U.S. dollar denominated, even when sold to customers that are located outside the United States. Therefore, as a substantial portion of our sales are from countries outside the United States, fluctuations in currency exchanges rates, most notably the strengthening of the U.S. dollar against other foreign currencies, contribute to variations in sales of products in impacted jurisdictions and could adversely impact demand and revenue growth. In addition, currency variations can adversely affect margins on sales of our products in countries outside the United States.
We attempt to manage the impact of foreign currency exchange rate changes by, among other things, entering into short-term, foreign exchange contracts. However, these contracts do not cover our full exposure, and can be canceled by the counterparty if currency controls are put in place. Thus, our decisions and hedging strategy with respect to currency risks may not be successful and harm our operating results. Further, the ability to enter into foreign exchange contracts with financial institutions is based upon our available credit from such institutions and compliance with covenants and other restrictions. Operating losses, third party downgrades of our credit rating or instability in the worldwide financial markets could impact our ability to effectively manage our foreign currency exchange rate risk. Hedging also exposes us to the credit risk of our counterparty financial institutions.
Increases in our customers’ credit risk could result in credit losses and term extensions under existing contracts with customers with credit losses could result in an increase in our operating costs.
Some of our OEM customers have adopted a subcontractor model that requires us to contract directly with companies, such as ODMs, that provide manufacturing and fulfillment services to our OEM customers. Because these subcontractors are generally not as well capitalized as our direct OEM customers, this subcontractor model exposes us to increased credit risks. Our agreements with our OEM customers may not permit us to increase our product prices to alleviate this increased credit risk. Additionally, as we attempt to expand our OEM and distribution channel sales into emerging economies such as Brazil, Russia, India and China, the customers with the most success in these regions may have relatively short operating histories, making it more difficult for us to accurately assess the associated credit risks. Any credit losses we may suffer as a result of these increased risks, or as a result of credit losses from any significant customer, especially in situations where there are term extensions under existing contracts with such customers, would increase our operating costs, which may negatively impact our operating results.
Our operating results fluctuate, sometimes significantly, from period to period due to many factors, which may result in a significant decline in our stock price.
Our quarterly operating results may be subject to significant fluctuations as a result of a number of other factors including:
|
•
|
weakness in demand for one or more product categories;
|
|
•
|
the timing of orders from and shipment of products to major customers, loss of major customers;
|
|
•
|
our product mix;
|
34
|
•
|
reductions in the ASPs of our products and lower margins;
|
|
•
|
excess output, capacity or inventory, resulting in lower ASPs, financial charges or impairments, or insufficient output, capacity or inventory, resulting in lost revenue opportunities;
|
|
•
|
inability to successfully transition to 3D NAND or other technology developments, or other failure to reduce product costs to keep pace with reduction in ASPs;
|
|
•
|
manufacturing delays or interruptions;
|
|
•
|
delays in design wins or customer qualifications, acceptance by customers of competing products in lieu of our products;
|
|
•
|
success of our partnerships and joint ventures, in particular the volume, timing and cost of wafer production at Flash Ventures, and our success in managing the relationships with our strategic partners;
|
|
•
|
inability to realize the potential benefits of our acquisitions and the success of our integration efforts;
|
|
•
|
ability to penetrate new markets for our storage solutions;
|
|
•
|
variations in the cost of and lead times for components for our products, disruptions of our supply chain;
|
|
•
|
limited availability of components that we obtain from a single or a limited number of suppliers;
|
|
•
|
seasonal and other fluctuations in demand often due to technological advances;
|
|
•
|
increase in costs due to warranty claims;
|
|
•
|
higher costs as a result of currency exchange rate fluctuations; and
|
|
•
|
availability and rates of transportation.
|
We often ship a high percentage of our total quarterly sales in the third month of the quarter, which makes it difficult for us to forecast our financial results before the end of the quarter. As a result of the above or other factors, our forecast of operating results for the quarter may differ materially from our actual financial results. If our results of operations fail to meet the expectations of analysts or investors, it could cause an immediate and significant decline in our stock price.
We have made and continue to make a number of estimates and assumptions relating to our consolidated financial reporting, and actual results may differ significantly from our estimates and assumptions.
We have made and continue to make a number of estimates and assumptions relating to our consolidated financial reporting. The highly technical nature of our products and the rapidly changing market conditions with which we deal means that actual results may differ significantly from our estimates and assumptions. These changes have impacted our financial results in the past and may continue to do so in the future. Key estimates and assumptions for us include:
|
•
|
price protection adjustments and other sales promotions and allowances on products sold to retailers, resellers and distributors;
|
|
•
|
inventory adjustments for write-down of inventories to lower of cost or market value (net realizable value);
|
|
•
|
testing of goodwill and other long-lived assets for impairment;
|
|
•
|
reserves for doubtful accounts;
|
|
•
|
accruals for product returns;
|
|
•
|
accruals for warranty costs related to product defects;
|
|
•
|
accruals for litigation and other contingencies;
|
|
•
|
liabilities for unrecognized tax benefits; and
|
|
•
|
expensing of stock-based compensation.
|
In addition, changes in existing accounting or taxation rules or practices, new accounting pronouncements or taxation rules, or varying interpretations of current accounting pronouncements or taxation practice could have an adverse effect on our results of operations and financial condition.
35
The market price of our common stock is volatile.
The market price of our common stock has been, and may continue to be, volatile. Factors that may significantly affect the market price of our common stock include the following:
|
•
|
actual or anticipated fluctuations in our operating results, including those resulting from the seasonality of our business;
|
|
•
|
announcements of technological innovations by us or our competitors, which may decrease the volume and profitability of sales of our existing products and increase the risk of inventory obsolescence;
|
|
•
|
new products introduced by us or our competitors;
|
|
•
|
strategic actions by us or competitors, such as acquisitions and restructurings;
|
|
•
|
periods of severe pricing pressures due to oversupply or price erosion resulting from competitive pressures or industry consolidation;
|
|
•
|
developments with respect to patents or proprietary rights, and any litigation;
|
|
•
|
proposed or adopted regulatory changes or developments or anticipated or pending investigations, proceedings or litigation that involve or affect us or our competitors;
|
|
•
|
conditions and trends in the hard drive, solid state storage, flash memory, computer, mobile, data and content management, storage and communication industries;
|
|
•
|
contraction in our operating results or growth rates that are lower than our previous high growth-rate periods;
|
|
•
|
failure to meet analysts’ revenue or earnings estimates or changes in financial estimates or publication of research reports and recommendations by financial analysts relating specifically to us or the storage industry in general;
|
|
•
|
announcements relating to dividends and share repurchases; and
|
|
•
|
macroeconomic conditions that affect the market generally and, in particular, developments related to market conditions for our industry.
|
In addition, the stock market is subject to fluctuations in the stock prices and trading volumes that affect the market prices of the stock of public companies, including us. These broad market fluctuations have adversely affected and may continue to adversely affect the market price of shares of our common stock. For example, expectations concerning general economic conditions may cause the stock market to experience extreme price and volume fluctuations from time to time that particularly affect the stock prices of many high technology companies. These fluctuations may be unrelated to the operating performance of the companies.
Securities class action lawsuits are often brought against companies after periods of volatility in the market price of their securities. A number of such suits have been filed against us in the past, and should any new lawsuits be filed, such matters could result in substantial costs and a diversion of resources and management’s attention.
The resale of shares of common stock issued to Hitachi in connection with our acquisition of HGST could adversely affect the market price of our common stock.
On March 8, 2012, as partial consideration for our acquisition of HGST, we issued 25 million shares of our common stock to Hitachi. On each of November 6, 2013 and November 13, 2014, Hitachi completed a secondary offering of 12.5 million and 6.25 million, respectively, of these shares. Future sales of the remaining 6.25 million shares of our common stock held by Hitachi could adversely affect the market price of our common stock.
36
Our cash balances and investment portfolio are subject to various risks, any of which could adversely impact our financial position.
Given the international footprint of our business, we have both domestic and international cash balances and investments. We maintain an investment portfolio of various holdings, security types, and maturities. These investments are subject to general credit, liquidity, market, political, sovereign and interest rate risks, which may be exacerbated by unusual events that affect global financial markets. A material part of our investment portfolio consists of U.S. government securities and bank deposits. If global credit and equity markets experience prolonged periods of decline, or if there is a downgrade of the U.S. government credit rating due to an actual or threatened default on government debt, our investment portfolio may be adversely impacted and we could determine that our investments may experience an other-than-temporary decline in fair value, requiring impairment charges that could adversely affect our financial results. A failure of any of these financial institutions in which deposits exceed FDIC limits could also have an adverse impact on our financial position.
In addition, i
f we are unable to generate sufficient cash flows from operations to repay our indebtedness, fund acquisitions, pay dividends, or repurchase shares of our common stock, we may choose or be required to increase our borrowings, if available, or to repatriate funds to the United States at a substantial tax cost.
If our internal controls are found to be ineffective, our stock price may be adversely affected.
Our most recent evaluation resulted in our conclusion that as of July 1, 2016, in compliance with Section 404 of the Sarbanes-Oxley Act of 2002, our internal control over financial reporting was effective. If our internal control over financial reporting is found to be ineffective or if we identify a material weakness in our financial reporting in future periods, investors may lose confidence in the reliability of our financial statements, we may be required to restate our financial results, our access to capital markets may be limited, and we may be subject to sanctions from regulatory agencies and The NASDAQ Global Select Market, each of which may adversely affect our stock price.
From time to time we may become subject to income tax examinations or similar proceedings, and as a result we may incur additional costs and expenses or owe additional taxes, interest and penalties that may negatively impact our operating results.
We are subject to income taxes in the United States and certain foreign jurisdictions, and our determination of our tax liability is subject to review by applicable domestic and foreign tax authorities. For example, as we have previously disclosed, we are under examination by the Internal Revenue Service for certain fiscal years and in connection with that examination, we received a Revenue Agent’s Report seeking certain adjustments to income as disclosed in Part II, Item 8, Note 10 to the Consolidated Financial Statements included in this Annual Report on Form 10-K. Although we believe our tax positions are properly supported, the final timing and resolution of any tax examinations are subject to significant uncertainty and could result in our having to pay amounts to the applicable tax authority in order to resolve examination of our tax positions, which could result in an increase or decrease of our current estimate of unrecognized tax benefits and may negatively impact our financial position, results of operations or cash flows.
We are subject to risks associated with loss or non-renewal of favorable tax treatment under agreements or treaties with foreign tax authorities.
Portions of our operations are subject to a reduced tax rate or are free of tax under various tax holidays that expire in whole or in part from time to time, or may be terminated if certain conditions are not met. Although many of these holidays may be extended when certain conditions are met, we may not be able to meet such conditions. If the tax holidays are not extended, or if we fail to satisfy the conditions of the reduced tax rate, then our effective tax rate could increase in the future. In addition, any actions by us to repatriate non-U.S. earnings for which we have not previously provided for U.S. taxes may impact our effective tax rate.
Changes in tax laws could increase our worldwide tax rate and materially affect our financial position and results of operations.
Tax laws are dynamic and subject to change as new laws and regulations are passed and new interpretations of the laws are issued or applied. The current U.S. administration and key members of Congress have made public statements indicating that tax reform is a priority, and certain changes to the U.S. tax laws and regulations have been proposed. In addition, many countries in the European Union, as well as a number of other countries and organizations such as the Organization for Economic Cooperation and Development, are actively considering changes to existing tax laws that, if enacted, could increase our tax obligations in many countries where we do business. Due to the large scale of our U.S. and international business activities, many of these proposed changes to the taxation of our activities, if enacted, could increase our worldwide effective tax rate and harm our financial position and results of operations.
Item 1B.
Unresolved Staff Comments
Not applicable.
37
Item 2.
Properties
Our principal executive offices are located in Irvine, California. Our leased facilities are occupied under leases that expire at various times through 2025.
Our principal manufacturing, R&D, marketing and administrative facilities at
July 1, 2016
were as follows:
|
Location
|
Buildings Owned or Leased
|
Approximate Square Footage
|
Description
|
||||
|
United States
|
|||||||
|
California
|
|||||||
|
Fremont
|
Owned
|
392,000
|
|
Manufacturing of head wafers and R&D
|
|||
|
Irvine
|
Leased
|
538,000
|
|
R&D, administrative and marketing and sales
|
|||
|
San Jose
|
Owned and Leased
|
3,260,000
|
|
Manufacturing of head wafers, head, media and product development, R&D, administrative and marketing and sales
|
|||
|
Milpitas
|
Owned
|
589,000
|
|
R&D, marketing and sales, operations and administrative
|
|||
|
Santa Ana
|
Leased
|
73,000
|
|
R&D
|
|||
|
Colorado
|
|||||||
|
Longmont
|
Leased
|
62,000
|
|
R&D
|
|||
|
Minnesota
|
|||||||
|
Rochester
|
Leased
|
118,000
|
|
Product development
|
|||
|
Asia
|
|||||||
|
China
|
|||||||
|
Shenzhen
|
Owned and Leased
|
1,194,000
|
|
Manufacturing of hard drives, HGAs and media and administrative
|
|||
|
Shanghai
|
Owned
|
715,000
|
|
Manufacturing and assembly and test
|
|||
|
Japan
|
|||||||
|
Fujisawa
|
Owned
|
661,000
|
|
Product development
|
|||
|
Malaysia
|
|||||||
|
Johor
|
Owned
|
271,000
|
|
Manufacturing of substrates
|
|||
|
Kuala Lumpur
|
Owned
|
1,074,000
|
|
Manufacturing of hard drives and R&D
|
|||
|
Kuching
|
Owned
|
285,000
|
|
Manufacturing and development of substrates
|
|||
|
Penang
|
Owned
|
1,075,000
|
|
Assembly and test, manufacturing of media and SSDs and R&D
|
|||
|
Philippines
|
|||||||
|
Laguna
|
Owned
|
621,000
|
|
Manufacturing of HGAs and slider fabrication
|
|||
|
Singapore
|
Leased
|
644,000
|
|
Manufacturing of media, R&D and administrative
|
|||
|
Thailand
|
|||||||
|
Bang Pa-In
|
Owned
|
1,665,000
|
|
Slider fabrication, manufacturing of hard drives and HGAs and R&D
|
|||
|
Navanakorn
|
Owned
|
290,000
|
|
Manufacturing of HGAs
|
|||
|
Prachinburi
|
Owned
|
729,000
|
|
Manufacturing of hard drives
|
|||
|
India
|
|||||||
|
Bangalore
|
Owned
|
240,000
|
|
R&D, marketing and administrative
|
|||
|
Middle East
|
|||||||
|
Israel
|
|||||||
|
Kfar Saba
|
Owned
|
167,000
|
|
R&D, marketing and administrative
|
|||
|
Tefen
|
Owned
|
64,000
|
|
R&D, marketing and administrative
|
|||
38
We also lease office space in various other locations throughout the world primarily for R&D, sales, operations, administration and technical support.
We believe our present facilities are adequate for our current needs, although we from time to time upgrade our facilities to meet anticipated future technological and market requirements. New manufacturing facilities, in general, can be developed and become operational within approximately nine to eighteen months should we require such additional facilities.
Item 3.
Legal Proceedings
For a description of our legal proceedings, see Part II, Item 8, Note 6 of the Notes to Consolidated Financial Statements included in this Annual Report on Form 10-K, which is incorporated by reference in response to this item.
Item 4.
Mine Safety Disclosures
Not applicable.
39
Item 5.
Market for Registrant’s Common Equity, Related Stockholder Matters and Issuer Purchases of Equity Securities
Market Information for Common Stock
Our common stock is listed on the NASDAQ Global Select Market (“NASDAQ”) under the symbol “WDC.” The approximate number of holders of record of our common stock as of
August 11, 2016
was
1,155
.
The high and low sales prices of our common stock as reported by NASDAQ for each quarter of
2016
and
2015
were as follows:
|
First
|
Second
|
Third
|
Fourth
|
||||
|
2016
|
|||||||
|
High
|
$88.46
|
$86.39
|
$60.97
|
$51.27
|
|||
|
Low
|
$67.87
|
$57.94
|
$38.64
|
$34.99
|
|||
|
2015
|
|||||||
|
High
|
$103.51
|
$114.69
|
$113.88
|
$102.07
|
|||
|
Low
|
$91.99
|
$82.85
|
$89.82
|
$78.27
|
|||
Repurchases of Equity Securities
There were no repurchases by us of shares of our common stock during the quarter ended
July 1, 2016
.
Dividends to Shareholders
On September 13, 2012, we announced that our Board of Directors had authorized the adoption of a quarterly cash dividend policy. Under the cash dividend policy, holders of our common stock receive dividends when and as declared by our Board of Directors. In
2016
, we declared aggregate cash dividends of
$2.00
per share of our common stock, totaling
$490 million
. We may modify, suspend, or cancel our cash dividend policy in any manner and at any time.
The following table provides information about the quarterly dividends our Board of Directors declared in the last two fiscal years.
|
Record Date
|
Payment Date
|
Dividend Per Share
|
||||
|
October 3, 2014
|
October 15, 2014
|
$
|
0.40
|
|
||
|
January 2, 2015
|
January 15, 2015
|
$
|
0.40
|
|
||
|
April 3, 2015
|
April 16, 2015
|
$
|
0.50
|
|
||
|
July 3, 2015
|
July 15, 2015
|
$
|
0.50
|
|
||
|
October 2, 2015
|
October 15, 2015
|
$
|
0.50
|
|
||
|
January 1, 2016
|
January 15, 2016
|
$
|
0.50
|
|
||
|
April 1, 2016
|
April 15, 2016
|
$
|
0.50
|
|
||
|
July 1, 2016
|
July 15, 2016
|
$
|
0.50
|
|
||
40
Stock Performance Graph
The following graph compares the cumulative total stockholder return of our common stock with the cumulative total return of the S&P 500 Index and the Dow Jones US Technology Hardware & Equipment Index for the five years ended
July 1, 2016
. The graph assumes that
$100
was invested in our common stock at the close of market on
July 1, 2011
and that all dividends were reinvested. Stockholder returns over the indicated period should not be considered indicative of future stockholder returns.
TOTAL RETURN TO STOCKHOLDERS
(Assumes $100 investment on
7/1/11
)
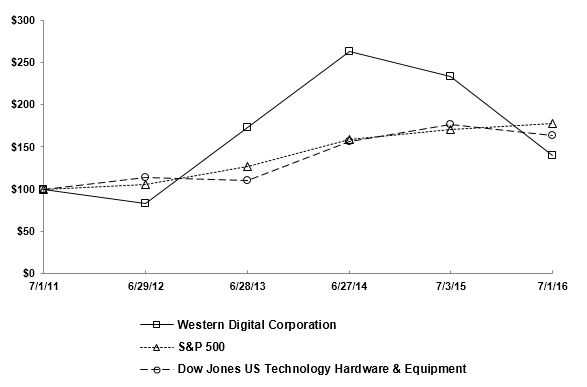
Total Return Analysis
|
7/1/11
|
6/29/12
|
6/28/13
|
6/27/14
|
7/3/15
|
7/1/16
|
||||||||||||||||||
|
Western Digital Corporation
|
$
|
100.00
|
|
$
|
83.19
|
|
$
|
173.28
|
|
$
|
263.24
|
|
$
|
233.69
|
|
$
|
139.22
|
|
|||||
|
S&P 500 Index
|
100.00
|
|
105.45
|
|
127.17
|
|
158.46
|
|
170.22
|
|
177.02
|
|
|||||||||||
|
Dow Jones US Technology Hardware & Equipment Index
|
100.00
|
|
113.15
|
|
109.65
|
|
156.06
|
|
176.80
|
|
163.20
|
|
|||||||||||
The stock performance graph shall not be deemed soliciting material or to be filed with the SEC or subject to Regulation 14A or 14C under the Securities Exchange Act of 1934 or to the liabilities of Section 18 of the Securities Exchange Act of 1934, nor shall it be incorporated by reference into any past or future filing under the Securities Act of 1933 or the Securities Exchange Act of 1934, except to the extent we specifically request that it be treated as soliciting material or specifically incorporate it by reference into a filing under the Securities Act of 1933 or the Securities Exchange Act of 1934.
41
Item 6.
Selected Financial Data
Financial Highlights
This selected consolidated financial data should be read together with the Consolidated Financial Statements and related Notes contained in this Annual Report on Form 10-K, as well as the section of this Annual Report on Form 10-K entitled “Management’s Discussion and Analysis of Financial Condition and Results of Operations.”
|
July 1,
2016 |
July 3,
2015 |
June 27,
2014 |
June 28,
2013 |
June 29,
2012 |
|||||||||||||||
|
(in millions, except per share and employee data)
|
|||||||||||||||||||
|
Revenue, net
|
$
|
12,994
|
|
$
|
14,572
|
|
$
|
15,130
|
|
$
|
15,351
|
|
$
|
12,478
|
|
||||
|
Gross profit
|
$
|
3,435
|
|
$
|
4,221
|
|
$
|
4,360
|
|
$
|
4,363
|
|
$
|
3,638
|
|
||||
|
Net income
|
$
|
242
|
|
$
|
1,465
|
|
$
|
1,617
|
|
$
|
980
|
|
$
|
1,612
|
|
||||
|
Income per common share:
|
|||||||||||||||||||
|
Basic
|
$
|
1.01
|
|
$
|
6.31
|
|
$
|
6.88
|
|
$
|
4.07
|
|
$
|
6.69
|
|
||||
|
Diluted
|
$
|
1.00
|
|
$
|
6.18
|
|
$
|
6.68
|
|
$
|
3.98
|
|
$
|
6.58
|
|
||||
|
Cash dividends declared per common share
|
$
|
2.00
|
|
$
|
1.80
|
|
$
|
1.25
|
|
$
|
1.00
|
|
$
|
—
|
|
||||
|
Working capital
|
$
|
5,635
|
|
$
|
5,275
|
|
$
|
4,875
|
|
$
|
3,625
|
|
$
|
3,109
|
|
||||
|
Total assets
|
$
|
32,862
|
|
$
|
15,170
|
|
$
|
15,499
|
|
$
|
14,036
|
|
$
|
14,206
|
|
||||
|
Long-term debt
|
$
|
13,660
|
|
$
|
2,149
|
|
$
|
2,313
|
|
$
|
1,725
|
|
$
|
1,955
|
|
||||
|
Shareholders’ equity
|
$
|
11,145
|
|
$
|
9,219
|
|
$
|
8,842
|
|
$
|
7,893
|
|
$
|
7,669
|
|
||||
|
Number of employees
(1)
|
72,878
|
|
76,449
|
|
84,072
|
|
85,777
|
|
103,111
|
|
|||||||||
|
(1)
|
Excludes temporary employees and contractors.
|
Results for SanDisk, Amplidata NV (“Amplidata”), Virident, sTec, VeloBit and HGST, which were acquired on May 12, 2016, March 9, 2015, October 17, 2013, September 12, 2013, July 9, 2013 and March 8, 2012, respectively, are included in our operating results only after the respective dates of acquisition.
Item 7.
Management’s Discussion and Analysis of Financial Condition and Results of Operations
Forward-Looking Statements
The following discussion and analysis contains forward-looking statements within the meaning of the federal securities laws, and should be read in conjunction with the disclosures we make concerning risks and other factors that may affect our business and operating results, including those made in Part I, Item 1A of this Annual Report on Form 10-K.
Our Company
We are a leading developer, manufacturer and provider of data storage devices and solutions that address the evolving needs of the IT industry and the infrastructure that enables the proliferation of data in virtually every industry. Our broad portfolio of offerings addresses three categories: Datacenter Devices and Solutions (capacity and performance enterprise HDDs, enterprise SSDs, datacenter software and system solutions); Client Devices (mobile, desktop, gaming and digital video hard drives, client SSDs, embedded products and wafers); and Client Solutions (removable products, hard drive content solutions and flash content solutions). We also generate license and royalty revenue related to our intellectual property which is included in each of the three categories.
Our fiscal year ends on the Friday nearest to June 30 and typically consists of 52 weeks. Approximately every six years, we report a 53-week fiscal year to align our fiscal year with the foregoing policy. Fiscal years
2016
and
2014
, which ended on
July 1, 2016
and
June 27, 2014
, respectively, comprised of
52
weeks. Fiscal year
2015
, which ended on
July 3, 2015
, comprised of
53
weeks, with the first quarter consisting of
14
weeks and the second, third and fourth quarters consisting of
13
weeks each.
42
Recent Developments
Acquisition of SanDisk
On May 12, 2016, we completed the acquisition of SanDisk (the “Merger”), a global leader in NAND flash storage solutions, pursuant to the terms of the Agreement and Plan of Merger, dated October 21, 2015. The Merger is primarily intended to deepen our expertise in non-volatile memory and enable us to vertically integrate into NAND, securing long-term access to solid state technology at a lower cost. The aggregate purchase price of the Merger was
$15.59 billion
, consisting of
$13.77 billion
funded with existing cash and cash from new debt,
49 million
newly issued shares of our common stock with a fair value of
$1.764 billion
and
$58 million
related to the fair value of assumed share-based awards.
For additional information, see Part II, Item 8, Note 16 of the Notes to Consolidated Financial Statements included in this Annual Report on Form 10-K.
Debt Facilities
In connection with the Merger, we entered into new debt facilities. The proceeds from the new debt facilities were used to finance, in part, the cash portion of the purchase price related to the Merger, refinance certain existing indebtedness of Western Digital and SanDisk, and pay certain transaction costs.
The new debt facilities we entered into aggregated approximately $18.1 billion in principal and consisted of the following:
|
•
|
On April 13, 2016, we completed an offering of our
$1.875 billion
aggregate principal amount of
7.375%
senior secured notes due 2023 (the “Secured Notes”) and
$3.35 billion
aggregate principal amount of
10.500%
senior unsecured notes due 2024 (the “Unsecured Notes” and, together with the Secured Notes, the “Notes”).
|
|
•
|
On April 29, 2016, we entered into a new credit agreement with JPMorgan Chase Bank, N.A., as administrative agent and collateral agent, and the lenders party thereto, which provides for secured loan facilities consisting of a
$4.125 billion
term loan facility (the “Term Loan A”), a
$3.75 billion
term loan facility (the “U.S. Term Loan B”), an
€885 million
(approximately
$987 million
based on the currency exchange rate at July 1, 2016) term loan facility (the “Euro Term Loan B” and, together with the U.S. Term Loan B, the “Term Loan B”) and a
$1.0 billion
revolving credit facility. The Term Loan A and the revolving credit facility have a
five
-year term. Term Loan B has a term of
seven
years. On May 12, 2016, concurrent with entering into the new credit agreement, we repaid all outstanding loans, together with accrued interest and related fees, and terminated all commitments under our then-existing credit agreement dated as of January 29, 2014.
|
|
•
|
On May 12, 2016, we and our wholly owned subsidiary, Western Digital Technologies, Inc. (“WDT”), entered into a
45
-day senior secured bridge credit agreement for
$3.0 billion
in aggregate principal amount with JPMorgan Chase Bank and the lenders from time to time party thereto. On June 9, 2016, this agreement was amended to extend the maturity to
75
days. On July 21, 2016, the
$3.0 billion
aggregate principal amount of senior secured bridge loan outstanding was repaid in full, together with accrued interest.
|
On May 12, 2016, we assumed
$997 million
aggregate principal amount of SanDisk outstanding
1.5%
Convertible Senior Notes due 2017 (the “2017 Notes”) and
$1.5 billion
aggregate principal amount of SanDisk outstanding
0.5%
Convertible Senior Notes due 2020 (the “2020 Notes” and, together with the 2017 Notes, the “SanDisk Notes”). The 2017 Notes mature on August 15, 2017 and the 2020 Notes mature on October 15, 2020. The SanDisk Notes are not callable. As a result of the Merger, holders of
$997 million
of the outstanding principal amount of the 2017 Notes and
$1.44 billion
of the outstanding principal amount of the 2020 Notes had elected to convert their SanDisk Notes at temporarily increased conversion rates that expired on June 9, 2016. Once the holders elected conversion, there was a
20
trading day observation period which resulted in holders of
$868 million
principal amount of the 2017 Notes and
$1.19 billion
principal amount of the 2020 Notes converting by
July 1, 2016
and
$129 million
principal amount of the 2017 Notes and
$250 million
principal amount of the 2020 Notes converting after
July 1, 2016
. In addition, during July 2016, we repurchased
$25 million
of the 2020 Notes. After taking into account conversions and the amounts that we repurchased, as of
August 26, 2016
,
$37 million
principal amount of the 2020 Notes and an immaterial principal amount of the 2017 Notes were outstanding.
For additional information, see Part II, Item 8, Note 3 of the Notes to Consolidated Financial Statements included in this Annual Report on Form 10-K.
43
Restructuring Plan (the “Restructuring Plan”)
In connection with the regulatory approval process for the HGST acquisition, which closed on March 8, 2012, we agreed to certain conditions required by MOFCOM, including adopting measures to maintain HGST as an independent competitor until MOFCOM agreed otherwise. Accordingly, since March 2012, we have operated our global business through two independent subsidiaries — HGST and WD. In March 2014, we submitted an application to MOFCOM to lift the condition it imposed on us to operate these businesses separately. On October 19, 2015, MOFCOM issued a decision in response to our application that permits us to integrate our HGST and WD subsidiaries, except that we committed to maintain two sales teams that will separately offer products under the WD or HGST brands for two years from the date of the decision.
We have initiated a set of actions relating to the Restructuring Plan associated with the integration of substantial portions of our HGST and WD subsidiaries. The Restructuring Plan consists of asset and footprint reduction, product roadmap consolidation and organization rationalization.
We expect the Restructuring Plan to be substantially completed by the end of calendar year 2017 and it is expected to result in total pre-tax charges of
$400 million
. These charges are expected to consist of
$185 million
in employee termination benefits,
$125 million
in asset charges and
$90 million
in other related costs.
$275 million
of these charges are expected to be cash expenditures. In
2016
, we recognized
$77 million
of expenses related to the Restructuring Plan, which consisted of
$58 million
in employee termination benefits and
$19 million
in contract termination and other charges.
Closure of Foreign Manufacturing Facility
In January 2016, we announced the closing of our head component front end wafer manufacturing facility in Odawara, Japan, in order to reduce manufacturing costs. In
2016
, we recognized
$152 million
of expenses related to the closure of the facility, which consisted of
$119 million
in employee termination benefits,
$24 million
in asset impairment and
$9 million
in contract termination and other charges. In addition, we recognized
$48 million
of accelerated depreciation charges on assets held at the Odawara facility, of which
$34 million
was recognized in cost of revenue and
$14 million
was recognized in research and development within the consolidated statements of income. As of
July 1, 2016
, we substantially completed all activities related to the closure of the facility.
For additional information, see Part II, Item 8, Note 17 of the Notes to Consolidated Financial Statements included in this Annual Report on Form 10-K.
Unis Joint Venture
In November 2015, we entered into an agreement to form a joint venture with Unis to market and sell our current data center storage systems in China and to develop data storage systems for the Chinese market in the future. A business plan for the joint venture has been completed, and we expect that the joint venture will be operational during calendar year 2016. The joint venture is
49%
owned by us and
51%
owned by Unis and its subsidiary, Unissoft (Wuxi) Group Co. Ltd.
Results of Operations
Fiscal
2016
Overview
In accordance with accounting principles generally accepted in the United States (“U.S. GAAP”), operating results for SanDisk and Amplidata, which we acquired on May 12, 2016 and March 9, 2015, respectively, are included in our operating results only after the respective dates of acquisition.
In the course of finalizing this Annual Report on Form 10-K, we determined it was necessary to record an additional
$10 million
in R&D expense primarily for third party non-recurring engineering charges and
$5 million
in asset impairment for the discontinuation of a software project for the fourth quarter and full year of fiscal 2016 that were not included in our Current Report on Form 8-K filed with the SEC on July 28, 2016 to announce our preliminary and unaudited financial results for the fourth fiscal quarter and fiscal year ended July 1, 2016. Given this change, for fiscal year 2016, operating income decreased to
$466 million
and net income decreased to
$242 million
, or
$1.00
per diluted share, and for the fourth quarter of 2016, operating loss increased to
$195 million
and net loss increased to
$366 million
, or
$1.40
per diluted share.
The following is a summary of our financial performance for fiscal
2016
:
|
•
|
In
2016
, our net revenue
decreased
by
11%
to
$13.0 billion
on HDD shipments of
185 million
units, as compared to
$14.6 billion
on shipments of
229 million
units in
2015
.
|
|
•
|
HDD ASPs
increased
to
$61
in
2016
, as compared to
$60
in
2015
.
|
|
•
|
Gross profit as a percentage of net revenue
decreased
to
26.4%
in
2016
, as compared to
29.0%
in
2015
.
|
44
|
•
|
Operating income
decreased
to
$466 million
in
2016
, as compared to
$1.6 billion
in
2015
. Operating income in
2016
included
$345 million
of employee termination, asset impairment and other charges, as compared to
$176 million
in
2015
. In addition, operating income in
2016
included SanDisk acquisition-related costs of
$159 million
and charges related to cost savings initiatives of
$143 million
.
|
|
•
|
Net income in
2016
was
$242 million
, or
$1.00
per diluted share, as compared to
$1.5 billion
, or
$6.18
per diluted share, in
2015
.
|
Summary Comparison of
2016
,
2015
and
2014
The following table sets forth, for the periods presented, selected summary information from our consolidated statements of income by dollars and percentage of net revenue:
|
|
Years Ended
|
|||||||||||||||||||
|
|
July 1,
2016 |
July 3,
2015 |
June 27,
2014 |
|||||||||||||||||
|
(in millions, except percentages)
|
||||||||||||||||||||
|
Net revenue
|
$
|
12,994
|
|
100.0
|
%
|
$
|
14,572
|
|
100.0
|
%
|
$
|
15,130
|
|
100.0
|
%
|
|||||
|
Cost of revenue
|
9,559
|
|
73.6
|
|
10,351
|
|
71.0
|
|
10,770
|
|
71.2
|
|
||||||||
|
Gross profit
|
3,435
|
|
26.4
|
|
4,221
|
|
29.0
|
|
4,360
|
|
28.8
|
|
||||||||
|
Research and development
|
1,627
|
|
12.5
|
|
1,646
|
|
11.3
|
|
1,661
|
|
11.0
|
|
||||||||
|
Selling, general and administrative
|
997
|
|
7.7
|
|
788
|
|
5.4
|
|
813
|
|
5.4
|
|
||||||||
|
Employee termination, asset impairment and other charges
|
345
|
|
2.6
|
|
176
|
|
1.2
|
|
95
|
|
0.6
|
|
||||||||
|
Operating income
|
466
|
|
3.6
|
|
1,611
|
|
11.1
|
|
1,791
|
|
11.8
|
|
||||||||
|
Other expense, net
|
(313
|
)
|
(2.4
|
)
|
(34
|
)
|
(0.2
|
)
|
(39
|
)
|
(0.3
|
)
|
||||||||
|
Income before income taxes
|
153
|
|
1.2
|
|
1,577
|
|
10.8
|
|
1,752
|
|
11.6
|
|
||||||||
|
Income tax expense (benefit)
|
(89
|
)
|
(0.7
|
)
|
112
|
|
0.8
|
|
135
|
|
0.9
|
|
||||||||
|
Net income
|
$
|
242
|
|
1.9
|
|
$
|
1,465
|
|
10.1
|
|
$
|
1,617
|
|
10.7
|
|
|||||
The following table sets forth, for the periods presented, summary information regarding unit shipments, ASPs and net revenues by geography and channel:
|
|
Years Ended
|
||||||||||
|
|
July 1,
2016 |
July 3,
2015 |
June 27,
2014 |
||||||||
|
(in millions, except percentages and ASPs)
|
|||||||||||
|
Net revenue
|
$
|
12,994
|
|
$
|
14,572
|
|
$
|
15,130
|
|
||
|
ASPs (per unit)
(1)
|
$
|
61
|
|
$
|
60
|
|
$
|
58
|
|
||
|
Revenues by Geography (%)
|
|||||||||||
|
Americas
|
32
|
%
|
28
|
%
|
25
|
%
|
|||||
|
Europe, Middle East and Africa
|
21
|
|
22
|
|
21
|
|
|||||
|
Asia
|
47
|
|
50
|
|
54
|
|
|||||
|
Revenues by Channel (%)
|
|||||||||||
|
Original Equipment Manufacturers
|
66
|
%
|
64
|
%
|
63
|
%
|
|||||
|
Distributors
|
20
|
|
23
|
|
24
|
|
|||||
|
Retailers
|
14
|
|
13
|
|
13
|
|
|||||
|
Unit Shipments
(1)
|
|||||||||||
|
PC
|
99
|
|
136
|
|
157
|
|
|||||
|
Non-PC
|
86
|
|
93
|
|
92
|
|
|||||
|
Total units shipped
|
185
|
|
229
|
|
249
|
|
|||||
|
(1)
|
Based on sales of HDD units only.
|
45
Fiscal Year
2016
Compared to Fiscal Year
2015
Net Revenue
Net revenue was
$13.0 billion
for
2016
,
a decrease
of
11%
from the prior year primarily due to lower HDD unit shipments partially offset by an increase in HDD ASP and revenues from SanDisk of
$793 million
following May 12, 2016, the closing date of the Merger (the “SanDisk Closing Date”). Total HDD shipments for
2016
decreased
to
185 million
units, as compared to
229 million
units in the prior year primarily due to a softer demand environment. ASPs were
$61
for
2016
,
an increase
of
$1
from
2015
, primarily due to a change in product mix.
Changes in net revenue by geography reflect a:
|
•
|
decrease in Asia primarily due to reduced demand of client HDD shipments as a result of a decline in the desktop and notebook PC market.
|
|
•
|
decrease in Europe, Middle East and Africa due to lower demand for our client and retail HDD products primarily due to the continued decline of PC-related after-market sales.
|
Consistent with standard industry practice, we have sales incentive and marketing programs that provide customers with price protection and other incentives or reimbursements that are recorded as a reduction to gross revenue. For
2016
and
2015
, these programs represented
13%
and
10%
of gross revenues, respectively. These amounts generally vary according to several factors including industry conditions, seasonal demand, competitor actions, channel mix and overall availability of products. Changes in future customer demand and market conditions may require us to adjust our incentive programs as a percentage of gross revenue.
Gross Profit
Gross profit for
2016
was
$3.4 billion
,
a decrease
of
$786 million
from the prior year. Gross profit as a percentage of net revenue
decreased
to
26.4%
in
2016
, as compared to
29.0%
in the prior year. This
decrease
was primarily the result of lower HDD unit sales and the related absorption impact, and accelerated depreciation on assets related to both the closure of the Odawara, Japan facility and the Restructuring Plan. This decrease in gross profit was partially offset by SanDisk’s gross profit following the SanDisk Closing Date.
Operating Expenses
R&D expense was
$1.6 billion
in
2016
,
a decrease
of
$19 million
, or
1%
, from the prior year. This
decrease
was primarily the result of reductions in employee compensation expenses due to a reduction in headcount as a result of our business realignment initiatives, reduction in material spend due to the consolidation of our product roadmap in relation to the integration of our HGST and WD subsidiaries and an additional week in the prior year. These decreases were partially offset by SanDisk’s R&D expenses following the SanDisk Closing Date and expenses related to the integration of our HGST and WD subsidiaries.
Selling, general and administrative (“SG&A”) expense was
$997 million
in
2016
,
an increase
of
$209 million
, or
27%
, from the prior year. This
increase
was primarily the result of SanDisk’s SG&A expenses following the SanDisk Closing Date, charges related to the Merger and expenses related to the integration of our HGST and WD subsidiaries. These charges were partially offset by a reduction in employee compensation expenses due to a reduction in headcount as a result of our business realignment initiatives and an additional week in the prior year.
During
2016
, we recorded
$345 million
of employee termination, asset impairment and other charges. These charges consisted of
$251 million
of employee termination costs,
$37 million
of asset impairment charges and
$57 million
of contract termination and other charges. During
2015
, we recorded
$176 million
of employee termination, asset impairment and other charges. These charges consisted of
$82 million
of employee termination costs,
$82 million
of asset impairment charges and
$12 million
of contract termination and other charges. For additional information, see Part II, Item 8, Note 17 of the Notes to Consolidated Financial Statements included in this Annual Report on Form 10-K.
Other Income (Expense)
Total other expense, net was
$313 million
in
2016
, as compared to
$34 million
in the prior year. Interest income
increased
to
$26 million
in
2016
, from
$14 million
in the prior year, primarily due to a higher average daily invested cash balance and higher market interest rates. Interest expense
increased
to
$266 million
in
2016
, from
$49 million
in the prior year, primarily due to a higher debt balance and amortization of issuance costs related to the debt issued in connection with the Merger. Other income (expense), net was
$73 million
of expense, primarily comprised of settlement of the SanDisk debt instruments and the write-off of debt issuance costs related to the termination of our existing credit agreement. For additional information on debt, see Part II, Item 8, Note 3 of the Notes to Consolidated Financial Statements included in this Annual Report on Form 10‑K.
46
Income Tax Expense (Benefit)
Income tax benefit was
$89 million
in
2016
, as compared to a
$112 million
expense in the prior year. Tax benefit as a percentage of income before taxes was
58.2%
in
2016
, as compared to tax expense of
7.1%
in the prior year. Our income tax benefit for
2016
reflects tax benefits from expenses related to the Merger and from interest expense related to new debt facilities. The difference between the effective tax rate and the U.S. Federal statutory rate is primarily due to foreign income taxed at lower tax rates due to tax holidays in Malaysia, the Philippines, Singapore and Thailand that expire at various dates from 2016 through 2029, the current year generation of income tax credits and the tax deductible expenses related to the Merger.
As of
July 1, 2016
, we had a recorded liability for unrecognized tax benefits of
$491 million
. We recognized a net increase of
$141 million
in our liability for unrecognized tax benefits during
2016
. Accrued interest and penalties related to unrecognized tax benefits as of
July 1, 2016
was
$75 million
.
$120 million
of the net increase in our liability for unrecognized tax benefits is attributable to balances assumed as a result of the Merger.
The Internal Revenue Service (“IRS”) previously completed its field examination of our federal income tax returns for fiscal years 2006 through 2009 and proposed certain adjustments. We have received Revenue Agent Reports from the IRS that seek to increase our U.S. taxable income which would result in additional federal tax expense totaling
$795 million
, subject to interest. The issues in dispute relate primarily to transfer pricing with our foreign subsidiaries and intercompany payable balances. We disagree with the proposed adjustments and in September 2015, filed a protest with the IRS Appeals Office and received the IRS rebuttal in July 2016. We believe that our tax positions are properly supported and will vigorously contest the position taken by the IRS. In September 2015, the IRS commenced an examination of our fiscal years 2010 through 2012.
We believe that adequate provision has been made for any adjustments that may result from tax examinations. However, the outcome of tax examinations cannot be predicted with certainty. If any issues addressed in our tax examinations are resolved in a manner not consistent with management’s expectations, we could be required to adjust our provision for income taxes in the period such resolution occurs. As of
July 1, 2016
, it is not possible to estimate the amount of change, if any, in the unrecognized tax benefits that is reasonably possible within the next twelve months. Any significant change in the amount of our liability for unrecognized tax benefits would most likely result from additional information or settlements relating to the examination of our tax returns.
Fiscal Year
2015
Compared to Fiscal Year
2014
Net Revenue
Net revenue was $14.6 billion for 2015, a decrease of 4% from 2014. The decrease was primarily due to a 8% decline in total HDD shipments, partially offset by an increase in ASPs. Total HDD shipments in 2015 decreased to 229 million units as compared to 249 million units for the prior year primarily due to a decrease in client PC demand. ASPs were $60 for 2015, an increase of $2 from 2014, primarily due to a change in product mix.
Changes in net revenue by geography and channel generally reflect normal fluctuations in market demand and competitive dynamics.
Consistent with standard industry practice, we have sales incentive and marketing programs that provide customers with price protection and other incentives or reimbursements that are recorded as a reduction to gross revenue. For 2015 and 2014, these programs represented 10% and 8% of gross revenues, respectively. These amounts generally vary according to several factors including industry conditions, seasonal demand, competitor actions, channel mix and overall availability of products.
Gross Profit
Gross profit for 2015 was $4.2 billion, a decrease of $139 million from the prior year. The decrease was primarily due to lower volume. Gross profit as a percentage of net revenue remained relatively flat at 29.0% in 2015, as compared to 28.8% in 2014.
Operating Expenses
R&D expense was $1.6 billion in 2015, a decrease of $15 million, or 1%, over the prior year. This slight decrease was due primarily to lower incentive compensation, partially offset by an additional week in fiscal 2015 and additional expenses related to our acquisitions.
SG&A expense was
$788 million
in 2015,
a decrease
of
$25 million
, or
3%
, as compared to 2014. Adjusting for a $37 million flood-related insurance recovery in 2015, compared to a $65 million flood-related insurance recovery in 2014, and legal charges of
$15 million
in 2015, compared to
$52 million
in 2014, related to a litigation matter that is now closed, SG&A expense
decreased
$16 million
, or
2%
, compared to 2014. This slight decrease was primarily due to lower incentive compensation, partially offset by an additional week in fiscal 2015 and additional expenses related to our acquisitions.
47
During 2015, we recorded $176 million of employee termination, asset impairment and other charges. These charges consisted of $82 million of employee termination costs, $82 million of asset impairment charges and $12 million of contract termination and other charges. During 2014, we recorded $95 million of employee termination, asset impairment and other charges. These charges consisted of $27 million of employee termination costs, $62 million of asset impairment charges and $6 million of contract termination and other charges.
Other Income (Expense)
Other expense, net was $34 million in 2015, compared to $39 million in 2014. Interest income decreased to $14 million in 2015 from $15 million in 2014, primarily due to a $3 million gain on the sale of our auction-rate securities in 2014. Interest expense decreased to $49 million in 2015, from $56 million in 2014, primarily due to a $4 million write-off of debt issuance costs in 2014.
Income Tax Provision
Income tax expense was $112 million in 2015, as compared to $135 million in 2014. Tax expense as a percentage of income before taxes was 7.1% in 2015, as compared to 7.7% in 2014. Our income tax provision for 2015 reflects a tax benefit of $27 million as a result of the retroactive extension of the U.S. Federal research and development tax credit that was signed into law on December 19, 2014. The differences between the effective tax rate and the U.S. Federal statutory rate are primarily due to tax holidays in Malaysia, the Philippines, Singapore and Thailand that expire at various dates from 2016 through 2025 and the current year generation of income tax credits.
48
Liquidity and Capital Resources
We ended
2016
with total cash and cash equivalents of
$8.2 billion
,
an increase
of
$3.1 billion
from
July 3, 2015
. The following table summarizes our statements of cash flows for the three years ended
July 1, 2016
:
|
|
Years Ended
|
||||||||||
|
|
July 1,
2016 |
July 3,
2015 |
June 27,
2014 |
||||||||
|
(in millions)
|
|||||||||||
|
Net cash flow provided by (used in):
|
|||||||||||
|
Operating activities
|
$
|
1,983
|
|
$
|
2,242
|
|
$
|
2,816
|
|
||
|
Investing activities
|
(9,608
|
)
|
(953
|
)
|
(1,936
|
)
|
|||||
|
Financing activities
|
10,751
|
|
(1,069
|
)
|
(385
|
)
|
|||||
|
Effect of exchange rate changes on cash
|
1
|
|
—
|
|
—
|
|
|||||
|
Net increase in cash and cash equivalents
|
$
|
3,127
|
|
$
|
220
|
|
$
|
495
|
|
||
We believe our current cash, cash equivalents and cash generated from operations as well as our available credit facilities will be sufficient to meet our working capital, debt, dividend and capital expenditure needs for at least the next twelve months. Our ability to sustain our working capital position is subject to a number of risks that we discuss in Part I, Item 1A in this Annual Report on Form 10-K.
In connection with the Merger, we entered into new debt facilities totaling
$18.1 billion
, which included Notes with an aggregate principal amount of
$5.2 billion
, term loans of
$8.9 billion
, a revolving credit facility of
$1.0 billion
and a bridge loan of
$3.0 billion
. As of
July 1, 2016
, we had
$17.0 billion
in debt facilities outstanding, net of debt issuance costs. The proceeds from the new debt facilities were used to finance, in part, the cash portion of the purchase price related to the Merger, refinance certain existing indebtedness of Western Digital and SanDisk and pay certain transaction costs. On July 21, 2016, the
$3.0 billion
aggregate principal amount of senior secured bridge loan outstanding was repaid in full, together with accrued interest. On May 12, 2016, we assumed SanDisk’s outstanding
$997 million
aggregate principal amount of its 2017 Notes and
$1.5 billion
aggregate principal amount of its 2020 Notes. After taking into account conversions and the amounts that we purchased, as of
August 26, 2016
,
$37 million
principal amount of the 2020 Notes and an immaterial principal amount of the 2017 Notes were outstanding. For additional information on the debt entered into in connection with the Merger, see Part II, Item 8, Note 3 of the Notes to Consolidated Financial Statements included in this Annual Report on Form 10-K.
The cash on hand and indebtedness used to finance the Merger could cause us to place more reliance on cash generated from operations to pay principal and interest on our debt, thereby reducing the availability of our cash flow for working capital, dividend and capital expenditure needs or to pursue other potential strategic plans.
During 2017, we expect our total capital investment to be approximately
$2.6 billion
to
$3.0 billion
, including our net capital investments in Flash Ventures and our investment in non-fab property and equipment. We expect these 2017 investments to be funded by Flash Ventures’ working capital, anticipated new equipment leases and approximately
$1.0 billion
to
$1.4 billion
of our cash.
A total of
$6.9 billion
and
$4.3 billion
of our cash and cash equivalents was held outside of the United States as of
July 1, 2016
and
July 3, 2015
, respectively. Our current plans do not anticipate that we will need funds generated from foreign operations to fund our domestic operations or dividends to our shareholders pursuant to our quarterly cash dividend policy. In the event funds from foreign operations are needed in the United States, any repatriation could result in the accrual and payment of additional U.S. income tax.
Operating Activities
Net cash provided by operating activities was
$2.0 billion
in
2016
, as compared to
$2.2 billion
and
$2.8 billion
in
2015
and
2014
, respectively. Cash flow from operating activities consists of net income, adjusted for non-cash charges, plus or minus working capital changes. This represents our principal source of cash. Net cash provided by working capital changes was
$377 million
for
2016
, as compared to
$593 million
and
$234 million
used for working capital changes in
2015
and
2014
, respectively.
49
Our working capital requirements primarily depend on the effective management of our cash conversion cycle, which measures how quickly we can convert our products into cash through sales. The cash conversion cycles for the three years ended
July 1, 2016
were as follows:
|
|
Years Ended
|
|||||||
|
|
July 1,
2016 |
July 3,
2015 |
June 27,
2014 |
|||||
|
(in days)
|
||||||||
|
Days sales outstanding
|
41
|
|
39
|
|
48
|
|
||
|
Days in inventory
|
81
|
|
49
|
|
41
|
|
||
|
Days payables outstanding
|
(78
|
)
|
(67
|
)
|
(67
|
)
|
||
|
Cash conversion cycle
|
44
|
|
21
|
|
22
|
|
||
In
2016
, our days sales outstanding (“DSOs”)
increased
by
2
days, days in inventory (“DIOs”)
increased
by
32
days and days payables outstanding (“DPOs”)
increased
by
11
days, as compared to the prior year. These increases were primarily due to the impact of including SanDisk’s accounts receivable, inventory and accounts payable balances as of
July 1, 2016
, but only including SanDisk’s revenue and cost of sales following the SanDisk Closing Date. The Merger increased DSO, DIO and DPO by 12 days, 32 days and 14 days, respectively. For
2016
, the increase in DSOs from the Merger was largely offset by the linearity of shipments. Changes in DIOs are generally related to the timing of inventory builds. Changes in DPOs are generally related to production volume and the timing of purchases during the period. From time to time, we modify the timing of payments to our vendors. We make modifications primarily to manage our vendor relationships and to manage our cash flows, including our cash balances. Generally, we make the payment term modifications through negotiations with our vendors or by granting to, or receiving from, our vendors’ payment term accommodations.
Investing Activities
Net cash used in investing activities in
2016
was
$9.6 billion
, as compared to
$1.0 billion
and
$1.9 billion
for
2015
and
2014
, respectively. During
2016
, net cash used in investing activities primarily consisted of
$9.8 billion
related to the Merger, net of cash acquired,
$632 million
related to the purchase of investments,
$584 million
of capital expenditures, $90 million net increase in notes receivable to Flash Ventures and a net
$76 million
of other investing activities, partially offset by
$1.6 billion
of proceeds from sales and maturities of investments. During
2015
, net cash used in investing activities primarily consisted of
$857 million
related to the purchase of investments,
$612 million
of capital expenditures and
$257 million
related to acquisitions, net of cash acquired, partially offset by
$768 million
of proceeds from the sales and maturities of investments. During
2014
, net cash used in investing activities primarily consisted of
$823 million
related to acquisitions, net of cash acquired,
$628 million
of capital expenditures and
$561 million
related to the purchase of investments, partially offset by
$72 million
of proceeds from the sales and maturities of investments.
Our cash equivalents are primarily invested in highly liquid money market funds that are invested in U.S. Treasury securities and U.S. Government Agency securities. In addition, we invest directly in U.S. Treasury securities, U.S. and International Government Agency securities, certificates of deposit, asset-backed securities, and corporate and municipal notes and bonds.
Financing Activities
Net cash provided by financing activities was
$10.8 billion
in
2016
, as compared to net cash used of
$1.1 billion
and
$385 million
for
2015
and
2014
, respectively. During
2016
, net cash provided by financing activities consisted of
$16.6 billion
of proceeds from debt, net of issuance costs,
$409 million
of proceeds from call options,
$125 million
of proceeds from borrowings under our revolving credit facility and a net
$74 million
provided by employee stock plans, offset by
$2.6 billion
to settle convertible debt,
$2.3 billion
to repay debt,
$613 million
for payment upon settlement of warrants,
$464 million
to pay dividends on our common stock,
$380 million
to repay the revolving credit facility and
$60 million
to repurchase shares of our common stock. During
2015
, net cash used in financing activities consisted of
$970 million
to repurchase shares of our common stock,
$396 million
to pay dividends on our common stock and
$125 million
to repay debt, partially offset by
$255 million
of proceeds from our revolving credit facility and a net
$167 million
provided by employee stock plans. During
2014
, net cash used in financing activities consisted of
$2.5 billion
used to repay debt,
$816 million
used to repurchase shares of our common stock and
$259 million
used to pay dividends on our common stock, partially offset by
$3.0 billion
of proceeds from our term loan facility, net of issuance costs and a net
$215 million
provided by employee stock plans.
50
Off-Balance Sheet Arrangements
Other than the commitments related to Flash Ventures, facility lease commitments incurred in the normal course of business and certain indemnification provisions (see “Contractual Obligations and Commitments” below), we do not have any other material off-balance sheet financing arrangements or liabilities, guarantee contracts, retained or contingent interests in transferred assets, or any other obligation arising out of a material variable interest in an unconsolidated entity. We do not have any majority-owned subsidiaries that are not included in the consolidated financial statements. Additionally, we do not have an interest in, or relationships with, any special-purpose entities. For additional information regarding our off-balance sheet arrangements, see Part II, Item 8, Note 4 of the Notes to Consolidated Financial Statements included in this Annual Report on Form 10-K.
Contractual Obligations and Commitments
The following is a summary of our known contractual cash obligations and commercial commitments as of
July 1, 2016
:
|
Total
|
1 Year
(2017)
|
2-3 Years (2018-2019)
|
4-5 Years (2020-2021)
|
More than 5 Years
(Beyond 2021)
|
|||||||||||||||
|
(in millions)
|
|||||||||||||||||||
|
Bridge loan
(1)
|
$
|
3,000
|
|
$
|
3,000
|
|
$
|
—
|
|
$
|
—
|
|
$
|
—
|
|
||||
|
Long-term debt, including current portion
(1)
|
14,087
|
|
47
|
|
611
|
|
3,704
|
|
9,725
|
|
|||||||||
|
Convertible senior notes
|
439
|
|
377
|
|
—
|
|
62
|
|
(2)
|
—
|
|
||||||||
|
Interest on debt
|
6,371
|
|
878
|
|
1,793
|
|
1,791
|
|
1,909
|
|
|||||||||
|
Flash Ventures and other related commitments
(3)
|
5,604
|
|
2,260
|
|
1,877
|
|
1,108
|
|
359
|
|
|||||||||
|
Operating leases
|
329
|
|
95
|
|
148
|
|
49
|
|
37
|
|
|||||||||
|
Purchase obligations
|
1,381
|
|
1,372
|
|
9
|
|
—
|
|
—
|
|
|||||||||
|
Total
|
$
|
31,211
|
|
$
|
8,029
|
|
$
|
4,438
|
|
$
|
6,714
|
|
$
|
12,030
|
|
||||
|
(1)
|
Included within our consolidated balance sheet. The bridge loan was repaid in full, together with accrued interest, on July 21, 2016.
|
|
(2)
|
$25 million
of the 2020 Notes were repurchased after
July 1, 2016
.
|
|
(3)
|
Includes reimbursement for depreciation and lease payments on owned and committed equipment, funding commitments for loans and equity investments and reimbursement for other committed expenses, including R&D. Funding commitments assume no additional operating lease guarantees. Additional operating lease guarantees can reduce funding commitments.
|
Debt
In connection with the Merger, we entered into new debt facilities. The proceeds from the new debt facilities were used to finance, in part, the cash portion of the purchase price related to the Merger, refinance certain existing indebtedness of Western Digital and SanDisk and pay certain transaction costs.
On April 13, 2016, we completed an offering of our Notes. We are not required to make principal payments on the Notes prior to their respective maturity dates, except that we may be required to offer to purchase the Notes upon the occurrence of a change of control or with the proceeds of certain non-ordinary course asset sales. Interest payments on the Notes are due semi-annually in arrears. The obligations under the Notes are guaranteed by certain of our existing and subsequently acquired or organized wholly-owned, material domestic subsidiaries.
As of
July 1, 2016
, our non-guarantor subsidiaries had
$4.3 billion
of aggregate total liabilities (excluding intercompany transactions), all of which were structurally senior to the Notes and the related guarantees. For the year ended
July 1, 2016
, our non-guarantor subsidiaries accounted for
16%
of our net sales and
86%
of our total operating income, and as of
July 1, 2016
, our non-guarantor subsidiaries accounted for
87%
of our total consolidated assets (excluding intercompany transactions).
On April 29, 2016, we entered into a new credit agreement which provides for secured loan facilities consisting of the
$4.125 billion
Term Loan A, the
$3.75 billion
U.S. Term Loan B tranche, the
€885 million
Euro Term Loan B tranche and the
$1.0 billion
revolving credit facility.
51
Term Loan B closed into escrow on April 29, 2016 and, at the SanDisk Closing Date, the proceeds of the borrowings under Term Loan B were released from escrow. Term Loan B has a term of
seven
years. Beginning in September 2016, we are required to make quarterly principal payments on Term Loan B equal to
0.25%
of the original principal amount thereof, with the remaining balance due in fiscal 2023. As of
July 1, 2016
, the U.S. Term Loan B tranche had an outstanding balance of
$3.750 billion
with a variable interest rate of
6.250%
, and the Euro Term Loan B tranche had an outstanding balance of
€885 million
(approximately
$987 million
based on the currency exchange rate at July 1, 2016) with a variable interest rates of
6.000%
.
On August 17, 2016 we issued a new
$3.0 billion
U.S. dollar-denominated Term Loan B-1 at an interest rate of LIBOR plus
3.75%
or a base rate plus
2.75%
. Principal payments of
0.25%
are due quarterly beginning September 30, 2016 with the balance due on April 29, 2023. In connection with this transaction, we settled the previous U.S. Term Loan B tranche with the proceeds of this new loan and a voluntary cash prepayment of
$750 million
. We expect to incur a debt extinguishment charge as a result of this transaction of approximately
$230 million
, which will be recorded in the first quarter of 2017.
On May 12, 2016, the loans under Term Loan A were drawn and the related proceeds were received by us, and the commitments under the revolving credit facility became available. Term Loan A and the revolving credit facility have a
five
‑year term. Beginning in September 2017, we are required to make quarterly principal payments on Term Loan A totaling
$206 million
in 2018,
$309 million
in 2019,
$413 million
in 2020 and the remaining balance of
$3.2 billion
due in 2021. As of
July 1, 2016
, Term Loan A had an outstanding balance of
$4.125 billion
with a variable interest rate of
2.450%
. As of
July 1, 2016
, there was no outstanding balance on the revolving credit facility.
The term loans and the revolving credit loans may be prepaid in whole or in part at any time without premium or penalty, subject to certain conditions, except that Term Loan B requires us to pay a
1.0%
prepayment fee if the loans thereunder are repaid in connection with certain “repricing” transactions on or before the one year anniversary of the effective date.
The new credit agreement requires us to comply with a leverage ratio and an interest coverage ratio calculated on a consolidated basis for us and our subsidiaries. In addition, the new credit agreement contains customary covenants that limit or restrict us and our subsidiaries’ ability to incur liens, incur indebtedness, make certain restricted payments, make acquisitions and investments, loans and guarantees, enter into transactions with affiliates, make certain modifications of organizational documents and certain debt agreements and merge or consolidate, and customary events of default.
On May 12, 2016, WDT entered into a
45
-day senior secured bridge credit agreement providing for
$3.0 billion
in aggregate principal amount of senior secured bridge loans. On June 9, 2016, this agreement was amended to extend the maturity to
75
days. On July 21, 2016, we paid in full the
$3.0 billion
aggregate principal outstanding together with accrued interest.
On May 12, 2016, we repaid all outstanding loans, together with accrued interest and related fees of
$2.2 billion
and terminated all commitments under the credit agreement dated as of January 9, 2014, as amended.
On May 12, 2016, we assumed SanDisk’s outstanding
$997 million
aggregate principal amount of its 2017 Notes and
$1.5 billion
aggregate principal amount of its 2020 Notes. The 2017 Notes mature on August 15, 2017 and the 2020 Notes mature on October 15, 2020. Holders of
$997 million
of the outstanding principal amount of the 2017 Notes and
$1.44 billion
of the outstanding principal amount of the 2020 Notes had elected to convert their Notes at temporarily increased conversion rates that expired on June 9, 2016. Once the holders elected conversion, there was a
20
trading day observation period which resulted in holders of
$868 million
principal amount of the 2017 Notes and
$1.19 billion
principal amount of the 2020 Notes converting by
July 1, 2016
and
$129 million
principal amount of the 2017 Notes and
$250 million
principal amount of the 2020 Notes converting after
July 1, 2016
. In addition, during July 2016, we repurchased
$25 million
of the 2020 Notes. After taking into account conversions and the amounts that we repurchased, as of
August 26, 2016
,
$37 million
principal amount of the 2020 Notes and an immaterial principal amount of the 2017 Notes were outstanding.
As of
July 1, 2016
, under our credit agreement, we were in compliance with all covenants. For additional information, see Part II, Item 8, Note 3 of the Notes to Consolidated Financial Statements included in this Annual Report on Form 10-K.
52
Flash Ventures
We are a
49.9%
owner of each entity within Flash Ventures, our business ventures with Toshiba to develop and manufacture NAND flash memory products. These NAND flash memory products are manufactured by Toshiba at Toshiba’s Yokkaichi, Japan operations using the semiconductor manufacturing equipment owned or leased by Flash Ventures. This equipment is funded, or will be funded, by investments in, or loans to, Flash Ventures from us and Toshiba as well as through operating leases received by Flash Ventures from third-party banks and guaranteed by us and Toshiba. The entities within Flash Ventures purchase wafers from Toshiba at cost and then resell those wafers to us and Toshiba at cost plus a markup. We are contractually obligated to purchase half of Flash Ventures’ NAND wafer supply or pay for
50%
of the fixed costs of Flash Ventures. We are not able to estimate our total wafer purchase obligations beyond our rolling three month purchase commitment because the price is determined by reference to the future cost to produce the semiconductor wafers. We are also committed to fund
49.9%
to
50%
of Flash Ventures’ investments to the extent that Flash Ventures’ operating cash flow is insufficient to fund these investments.
From time-to-time, we and Toshiba mutually approve the purchase of equipment for Flash Ventures in order to convert to new process technologies or add wafer capacity. Flash Partners’ share of Fab 3 and Flash Alliance’s share of Fab 4 have been previously equipped to full wafer capacity. Fab 5, which is primarily utilized by Flash Forward, was built in two phases of approximately equal size. Phase 1 of Fab 5 is fully equipped and the majority of Phase 2 of Fab 5 is equipped. To date, we have invested in approximately 50% of Flash Forward’s equipment, and the output has been shared equally between us and Toshiba. Toshiba’s most recent 300-millimeter wafer fabrication facility, located in Yokkaichi, Japan (“New Fab 2”), for which we have a facility agreement with Toshiba, is primarily intended to provide additional cleanroom space to convert a portion of 2D NAND capacity to 3D NAND. We expect that the New Fab 2 space will accommodate conversion of somewhat less than half of the current Fab 3, Fab 4 and Fab 5 2D NAND capacity to 3D NAND. Production wafers in New Fab 2 started in January 2016.
For semiconductor manufacturing equipment that is leased by Flash Ventures, we and Toshiba each guarantee, on an unsecured and several basis, 50% of the outstanding Flash Ventures’ lease obligations under lease agreements entered into by Flash Ventures. These lease obligations are denominated in Japanese yen and are noncancelable. Our lease obligation guarantees as of
July 1, 2016
, which reflects future payments and any lease adjustments, totaled
$1.15 billion
, based upon the exchange rate at
July 1, 2016
. The lease agreements contain certain covenants and cancellation events that are customary for Japanese lease facilities and that relate to Flash Ventures and each of the guarantors. The breach of a covenant or the occurrence of another cancellation event could result in an acceleration of Flash Ventures’ lease obligations. As of
July 1, 2016
, we were in compliance with all covenants under these Japanese lease facilities.
For additional information regarding Flash Ventures, see Part II, Item 8, Notes 4 and 5 of the Notes to Consolidated Financial Statements included in this Annual Report on Form 10-K.
Purchase Orders
In the normal course of business, we enter into purchase orders with suppliers for the purchase of components used to manufacture our products. These purchase orders generally cover forecasted component supplies needed for production during the next quarter, are recorded as a liability upon receipt of the components, and generally may be changed or canceled at any time prior to shipment of the components. We also enter into purchase orders with suppliers for capital equipment that are recorded as a liability upon receipt of the equipment. Our ability to change or cancel a capital equipment purchase order without penalty depends on the nature of the equipment being ordered. In some cases, we may be obligated to pay for certain costs related to changes to, or cancellation of, a purchase order, such as costs incurred for raw materials or work in process of components or capital equipment.
We have entered into long-term purchase agreements with various component suppliers, containing minimum quantity requirements. However, the dollar amount of the purchases may depend on the specific products ordered, achievement of pre-defined quantity or quality specifications or future price negotiations. The estimated related minimum purchase requirements are included in “Purchase obligations” in the table above. We have also entered into long-term purchase agreements with various component suppliers that carry fixed volumes and pricing which obligate us to make certain future purchases, contingent on certain conditions of performance, quality and technology of the vendor’s components. These arrangements are included under “Purchase obligations” in the table above.
We have inventory purchase commitments with Flash Ventures to purchase Flash Ventures’ NAND wafer supply. Purchase orders placed under Flash Ventures for up to three months are binding and cannot be canceled. We also have contracts with our other sources of silicon wafers that generally require us to provide monthly purchase order commitments. The purchase orders placed under these arrangements are generally binding and cannot be canceled. These arrangements are included under “Purchase obligations” in the table above.
53
We enter into, from time to time, other long-term purchase agreements for components with certain vendors. Generally, future purchases under these agreements are not fixed and determinable as they depend on our overall unit volume requirements and are contingent upon the prices, technology and quality of the supplier’s products remaining competitive. These arrangements are not included under “Purchase obligations” in the table above. Please see Part I, Item 1A of this Annual Report on Form 10-K for a discussion of risks related to commitments.
Foreign Exchange Contracts
We purchase foreign exchange contracts to hedge the impact of foreign currency fluctuations on certain underlying assets, liabilities and commitments for operating expenses and product costs denominated in foreign currencies. For a description of our current foreign exchange contract commitments, see Part II, Item 7A, under the heading “Disclosure About Foreign Currency Risk,” and Part II, Item 8, Notes 1 and 13 of the Notes to Consolidated Financial Statements included in this Annual Report on Form 10-K.
Indemnifications
In the ordinary course of business, we may provide indemnifications of varying scope and terms to customers, vendors, lessors, business partners and other parties with respect to certain matters, including, but not limited to, losses arising out of our breach of agreements, products or services to be provided by us, environmental compliance or from intellectual property infringement claims made by third parties. In addition, we have entered into indemnification agreements with our directors and certain of our officers that will require us, among other things, to indemnify them against certain liabilities that may arise by reason of their status or service as directors or officers. We maintain director and officer insurance, which may cover certain liabilities arising from our obligation to indemnify our directors and officers in certain circumstances.
It is not possible to determine the maximum potential amount under these indemnification agreements due to the limited history of prior indemnification claims and the unique facts and circumstances involved in each particular agreement. Such indemnification agreements may not be subject to maximum loss clauses. Historically, we have not incurred material costs as a result of obligations under these agreements.
Unrecognized Tax Benefits
As of
July 1, 2016
, the amount of unrecognized tax benefits, including related accrued interest and penalties, was
$566 million
, of which
$411 million
could result in potential cash payments. We are not able to provide a reasonable estimate of the timing of future tax payments related to these obligations. For additional information regarding our total tax liability for unrecognized tax benefits, see Part II, Item 8, Note 10 of the Notes to Consolidated Financial Statements included in this Annual Report on Form 10-K.
Stock Repurchase Program
Our Board of Directors previously authorized a stock repurchase program. Effective October 21, 2015, in connection with the Merger, we suspended this stock repurchase program. For additional information, see Part II, Item 8, Note 9 of the Notes to Consolidated Financial Statements included in this Annual Report on Form 10-K.
Cash Dividend Policy
Since the first quarter of fiscal 2014, we have issued a quarterly cash dividend. On
August 3, 2016
, we declared a cash dividend of
$0.50
per share to the holders of record as of
September 30, 2016
, which will be paid on
October 17, 2016
. We may modify, suspend, or cancel our cash dividend policy in any manner and at any time. For additional information, see Part II, Item 5 included in this Annual Report on Form 10-K.
54
Critical Accounting Policies and Estimates
We have prepared the accompanying consolidated financial statements in accordance with U.S. GAAP. The preparation of the financial statements requires the use of judgments and estimates that affect the reported amounts of revenues, expenses, assets, liabilities and shareholders’ equity. We have adopted accounting policies and practices that are generally accepted in the industry in which we operate. We believe the following are our most critical accounting policies that affect significant areas and involve judgment and estimates made by us. If these estimates differ significantly from actual results, the impact to the consolidated financial statements may be material.
Revenue and Accounts Receivable
In accordance with standard industry practice, we provide distributors and retailers (collectively referred to as “resellers”) with limited price protection for inventories held by resellers at the time of published list price reductions and/or a right of return, and we provide resellers and OEMs with other sales incentive programs. At the time we recognize revenue to resellers and OEMs, we record a reduction of revenue for estimated price protection and/or returns until the resellers sell such inventory to their customers and we also record a reduction of revenue for the other programs in effect. We base these adjustments on several factors including anticipated price decreases during the reseller holding period, resellers’ sell-through and inventory levels, estimated amounts to be reimbursed to qualifying customers, historical pricing information, historical and anticipated returns information and customer claim processing. If customer demand for our products or market conditions differ from our expectations, our operating results could be materially affected. We also have programs under which we reimburse qualified distributors and retailers for certain marketing expenditures, which are recorded as a reduction of revenue. These amounts generally vary according to several factors including industry conditions, seasonal demand, competitor actions, channel mix and overall availability of product. Changes in future customer demand and market conditions may require us to adjust our incentive programs as a percentage of gross revenue from the current range. Total sales incentive and marketing programs have ranged from
7%
to
14%
of gross revenue and adjustments to revenue due to changes in accruals for these programs related to revenue reported in prior periods have generally averaged less than 1% of gross revenue over the last three fiscal years.
We record an allowance for doubtful accounts by analyzing specific customer accounts and assessing the risk of loss based on insolvency, disputes or other collection issues. In addition, we routinely analyze the different receivable aging categories and establish reserves based on a combination of past due receivables and expected future losses based primarily on our historical levels of bad debt losses. If the financial condition of a significant customer deteriorates resulting in its inability to pay its accounts when due, or if our overall loss history changes significantly, an adjustment in our allowance for doubtful accounts would be required, which could materially affect operating results.
We establish provisions against revenue and cost of revenue for sales returns in the same period that the related revenue is recognized. We base these provisions on existing product return notifications. If actual sales returns exceed expectations, an increase in the sales return accrual would be required, which could materially affect operating results.
Warranty
We record an accrual for estimated warranty costs when revenue is recognized. We generally warrant our products for a period of
one
to
five
years, with a small number of products having a warranty ranging up to
ten
years or more. Our warranty provision considers estimated product failure rates and trends, estimated replacement costs, estimated repair costs which include scrap costs and estimated costs for customer compensatory claims related to product quality issues, if any. For warranties ten years or greater, including lifetime warranties, we use the estimated useful life of the product to calculate the warranty exposure. We use a statistical warranty tracking model to help prepare our estimates and assist us in exercising judgment in determining the underlying estimates. Our statistical tracking model captures specific detail on product reliability, such as factory test data, historical field return rates and costs to repair by product type. Our judgment is subject to a greater degree of subjectivity with respect to newly introduced products because of limited field experience with those products upon which to base our warranty estimates. We review our warranty accrual quarterly for products shipped in prior periods and which are still under warranty. Any changes in the estimates underlying the accrual may result in adjustments that impact current period gross profit and income. Such changes are generally a result of differences between forecasted and actual return rate experience and costs to repair. If actual product return trends, costs to repair returned products or costs of customer compensatory claims differ significantly from our estimates, our future results of operations could be materially affected. For a summary of historical changes in estimates related to pre-existing warranty provisions, see Part II, Item 8, Note 4 of the Notes to Consolidated Financial Statements included in this Annual Report on Form 10-K.
Inventories
We value inventories at the lower of cost (first-in, first-out) or net realizable value. We record inventory write-downs for the valuation of inventory at the lower of cost or net realizable value by analyzing market conditions and estimates of future sales prices as compared to inventory costs and inventory balances.
55
We evaluate inventory balances for excess quantities and obsolescence on a regular basis by analyzing estimated demand, inventory on hand, sales levels and other information, and reduce inventory balances to net realizable value for excess and obsolete inventory based on this analysis. Unanticipated changes in technology or customer demand could result in a decrease in demand for one or more of our products, which may require a write down of inventory that could materially affect operating results.
Litigation and Other Contingencies
When we become aware of a claim or potential claim, we assess the likelihood of any loss or exposure. We disclose information regarding each material claim where the likelihood of a loss contingency is probable or reasonably possible. If a loss contingency is probable and the amount of the loss can be reasonably estimated, we record an accrual for the loss. In such cases, there may be an exposure to potential loss in excess of the amount accrued. Where a loss is not probable but is reasonably possible or where a loss in excess of the amount accrued is reasonably possible, we disclose an estimate of the amount of the loss or range of possible losses for the claim if a reasonable estimate can be made, unless the amount of such reasonably possible losses is not material to our financial position, results of operations or cash flows. The ability to predict the ultimate outcome of such matters involves judgments, estimates and inherent uncertainties. The actual outcome of such matters could differ materially from management’s estimates. For additional information, see Part II, Item 8, Note 6 of the Notes to Consolidated Financial Statements included in this Annual Report on Form 10-K.
Income Taxes
We account for income taxes under the asset and liability method, which provides that deferred tax assets and liabilities be recognized for temporary differences between the financial reporting basis and the tax basis of our assets and liabilities and expected benefits of utilizing net operating loss and tax credit carryforwards. We record a valuation allowance when it is more likely than not that the deferred tax assets will not be realized. Each quarter, we evaluate the need for a valuation allowance for our deferred tax assets and we adjust the valuation allowance so that we record net deferred tax assets only to the extent that we conclude it is more likely than not that these deferred tax assets will be realized.
We recognize liabilities for uncertain tax positions based on a two-step process. To the extent a tax position does not meet a more-likely-than-not level of certainty, no benefit is recognized in the financial statements. If a position meets the more-likely-than-not level of certainty, it is recognized in the financial statements at the largest amount that has a greater than 50% likelihood of being realized upon ultimate settlement. Interest and penalties related to unrecognized tax benefits are recognized on liabilities recorded for uncertain tax positions and are recorded in our provision for income taxes. The actual liability for unrealized tax benefits in any such contingency may be materially different from our estimates, which could result in the need to record additional liabilities for unrecognized tax benefits or potentially adjust previously-recorded liabilities for unrealized tax benefits and materially affect our operating results.
Stock-based Compensation
We account for all stock-based compensation at fair value. Stock-based compensation cost is measured at the grant date based on the value of the award and is recognized as expense over the vesting period. The fair values of all stock options granted are estimated using a binomial model, and the fair values of all Employee Stock Purchase Plan purchase rights are estimated using the Black-Scholes-Merton option-pricing model. We account for stock appreciation rights (“SARs”) as liability awards based upon our intention to settle such awards in cash. The SARs liability is recognized for that portion of fair value for the service period rendered at the reporting date. The share-based liability is remeasured at each reporting date through the requisite service period. Both the binomial and the Black-Scholes-Merton models require the input of highly subjective assumptions. We are required to use judgment in estimating the amount of stock-based awards that are expected to be forfeited. If actual forfeitures differ significantly from the original estimate, stock-based compensation expense and our results of operations could be materially affected. Performance restricted stock unit awards (“PSUs”) are subject to continued service by the employee, and expense is recognized over the vesting period. At each reporting date, we evaluate the probability that PSUs will be earned. We record stock-based compensation expense on the probability that the performance metrics will be achieved.
56
Business Combinations
The application of acquisition accounting to a business acquisition requires that we identify the individual assets acquired and liabilities assumed and estimate the fair value of each. The fair value of assets acquired and liabilities assumed in a business acquisition are recognized at the acquisition date, with the purchase price exceeding the fair values being recognized as goodwill. Determining fair value of identifiable assets, particularly intangibles, liabilities acquired and contingent obligations assumed requires management to make estimates. In certain circumstances, the allocations of the purchase price are based upon preliminary estimates and assumptions and subject to revision when we receive final information, including appraisals and other analysis. Accordingly, the measurement period for such purchase price allocations will end when the information, or the facts and circumstances, becomes available, but will not exceed twelve months. We will recognize measurement-period adjustments during the period of resolution, including the effect on earnings of any amounts that would have been recorded in previous periods if the accounting had been completed at the acquisition date.
Goodwill and intangible assets often represent a significant portion of the assets acquired in a business combination. We recognize the fair value of an acquired intangible apart from goodwill whenever the intangible arises from contractual or other legal rights, or when it can be separated or divided from the acquired entity and sold, transferred, licensed, rented or exchanged, either individually or in combination with a related contract, asset or liability. Intangible assets consist primarily of technology, customer relationships, and trade name and trademarks acquired in business combinations and in-process research and development (“IPR&D”). We generally assess the estimated fair values of acquired intangibles using a combination of valuation techniques. To estimate fair value, we are required to make certain estimates and assumptions, including future economic and market conditions, revenue growth, market share, operating costs and margins, and risk-adjusted discount rates. Our estimates require significant judgment and are based on historical data, various internal estimates, and external sources. Our assessment of IPR&D also includes consideration of the risk of the projects not achieving technological feasibility.
Goodwill and Other Long-Lived Assets
Goodwill is not amortized. Instead, it is tested for impairment on an annual basis or more frequently whenever events or changes in circumstances indicate that goodwill may be impaired. We perform our annual impairment test as of the first day of our fiscal fourth quarter. We either use qualitative factors to determine whether goodwill is more likely than not impaired or we perform a two-step approach to quantify impairment. If we conclude from the qualitative assessment that goodwill is more likely than not impaired, we are required to follow a two-step approach to quantify the impairment. We are required to use judgment when applying the goodwill impairment test, including the identification of reporting units, assignment of assets and liabilities to reporting units, assignment of goodwill to reporting units and determination of the fair value of each reporting unit. In addition, the estimates used to determine the fair value of each reporting unit may change based on results of operations, macroeconomic conditions or other factors. Changes in these estimates could materially affect our assessment of the fair value and goodwill impairment for each reporting unit. If our stock price decreases significantly, goodwill could become impaired, which could result in a material charge and adversely affect our results of operations.
Acquired intangibles are amortized over their estimated useful lives based on the pattern in which the economic benefits are expected to be received. Long-lived assets are tested for recoverability whenever events or changes in circumstances indicate that their carrying amounts may not be recoverable. IPR&D is not amortized until the point at which it reaches technological feasibility. Instead, it is tested for impairment on an annual basis or more frequently whenever events or changes in circumstances indicate that it may be impaired. If impairment is indicated, the impairment is measured as the amount by which the carrying amount of the assets exceeds the fair value of the assets.
Recent Accounting Pronouncements
For a description of recently issued and adopted accounting pronouncements, including the respective dates of adoption and expected effects on our results of operations and financial condition, see Part II, Item 8, Note 1 of the Notes to Consolidated Financial Statements included in this Annual Report on Form 10-K, which is incorporated by reference in response to this item.
57
Item 7A.
Quantitative and Qualitative Disclosures About Market Risk
Disclosure About Foreign Currency Risk
Although the majority of our transactions are in U.S. dollars, some transactions are based in various foreign currencies. We purchase short-term, foreign exchange contracts to hedge the impact of foreign currency exchange fluctuations on certain underlying assets, liabilities and commitments for operating expenses and product costs denominated in foreign currencies. The purpose of entering into these hedge transactions is to minimize the impact of foreign currency fluctuations on our results of operations. The contract maturity dates do not exceed 12 months. We do not purchase foreign exchange contracts for speculative or trading purposes. For additional information, see Part II, Item 8, Notes 1 and 13 of the Notes to Consolidated Financial Statements included in this Annual Report on Form 10-K.
As of
July 1, 2016
, we had outstanding the foreign exchange contracts presented in the following table. The changes in fair values of these foreign exchange contracts would be largely offset in other income (expense) by corresponding changes in the fair values of the foreign currency denominated monetary assets and liabilities.
|
Contract Amount
|
Weighted
Average Contract Rate
(1)
|
Unrealized Gain (Loss)
|
||||||||
|
(in millions, except weighted average contract rate)
|
||||||||||
|
Foreign exchange contracts:
|
||||||||||
|
Cash flow hedges:
|
||||||||||
|
Japanese Yen
|
$
|
922
|
|
113.08
|
|
$
|
61
|
|
||
|
Malaysian Ringgit
|
118
|
|
4.20
|
|
5
|
|
||||
|
Philippine Peso
|
38
|
|
47.33
|
|
—
|
|
||||
|
Singapore Dollar
|
36
|
|
1.41
|
|
1
|
|
||||
|
Thailand Baht
|
487
|
|
35.82
|
|
7
|
|
||||
|
Fair value hedges:
|
||||||||||
|
British Pound Sterling
|
$
|
18
|
|
0.71
|
|
$
|
1
|
|
||
|
European Euro
|
969
|
|
0.86
|
|
(27
|
)
|
||||
|
Japanese Yen
|
317
|
|
105.96
|
|
10
|
|
||||
|
Philippine Peso
|
23
|
|
47.00
|
|
—
|
|
||||
|
Singapore Dollar
|
13
|
|
1.35
|
|
—
|
|
||||
|
Thailand Baht
|
118
|
|
35.24
|
|
1
|
|
||||
|
Malaysian Ringgit
|
15
|
|
4.06
|
|
—
|
|
||||
|
(1)
|
Expressed in units of foreign currency per U.S. dollar.
|
In
2016
,
2015
and
2014
, total net realized transaction and foreign exchange contract currency gains and losses were not material to our consolidated financial statements.
Notwithstanding our efforts to mitigate some foreign exchange risks, we do not hedge all of our foreign currency exposures, and there can be no assurance that our mitigating activities related to the exposures that we hedge will adequately protect us against risks associated with foreign currency fluctuations.
58
Disclosure About Other Market Risks
Variable Interest Rate Risk
Borrowings under our Term Loan A Facility and our revolving credit facility bear interest at a rate per annum, at our option, of either an adjusted LIBOR rate (subject to a 0.0% floor) plus an applicable margin of 2.0% or at a base rate plus an applicable margin of 1.00%. Beginning in September 2016, the applicable margin for the borrowings under our Term Loan A Facility and our revolving credit facility will range, depending on our leverage, from 1.50% to 2.25% for LIBOR loans and from 0.50% to 1.25% for base rate loans. Borrowings under the U.S. Term Loan B tranche bear interest at a rate per annum, at our option, of either an adjusted LIBOR rate (subject to a 0.75% floor) plus an applicable margin of 5.5% or at a base rate plus an applicable margin of 4.50%. Borrowings under the Euro Term Loan B tranche bear interest at a rate per annum equal to an adjusted EURIBOR rate (subject to a 0.75% floor) plus an applicable margin of 5.25%. Borrowings under our senior secured bridge credit agreement bear interest at a rate per annum equal to, at our option, either an adjusted LIBOR rate (subject to a 0.0% floor) plus an applicable margin of 2.00% or a base rate plus an applicable margin of 1.0%.
As of
July 1, 2016
, we had
$8.9 billion
of long-term variable rate debt outstanding, and a
one
percent increase in the variable rate of interest, subject to each loan specific floor, would have increased annual interest expense by
$70 million
. For additional information, see Part II, Item 8, Note 3 of the Notes to Consolidated Financial Statements included in this Annual Report on Form 10-K.
59
Item 8.
Financial Statements and Supplementary Data
Index to Financial Statements and Financial Statement Schedule
|
|
Page
|
|
Consolidated Financial Statements:
|
|
|
Financial Statement Schedule:
|
|
60
REPORT OF INDEPENDENT REGISTERED PUBLIC ACCOUNTING FIRM
The Board of Directors and Shareholders
Western Digital Corporation:
We have audited the accompanying consolidated balance sheets of Western Digital Corporation and subsidiaries as of
July 1, 2016
and
July 3, 2015
, and the related consolidated statements of income, comprehensive income, shareholders’ equity, and cash flows for each of the years in the three-year period ended
July 1, 2016
. In connection with our audits of the consolidated financial statements, we have also audited the related financial statement schedule. These consolidated financial statements and financial statement schedule are the responsibility of the Company’s management. Our responsibility is to express an opinion on these consolidated financial statements and financial statement schedule based on our audits.
We conducted our audits in accordance with the standards of the Public Company Accounting Oversight Board (United States). Those standards require that we plan and perform the audit to obtain reasonable assurance about whether the financial statements are free of material misstatement. An audit includes examining, on a test basis, evidence supporting the amounts and disclosures in the financial statements. An audit also includes assessing the accounting principles used and significant estimates made by management, as well as evaluating the overall financial statement presentation. We believe that our audits provide a reasonable basis for our opinion.
In our opinion, the consolidated financial statements referred to above present fairly, in all material respects, the financial position of Western Digital Corporation and subsidiaries as of
July 1, 2016
and
July 3, 2015
, and the results of their operations and their cash flows for each of the years in the three-year period ended
July 1, 2016
, in conformity with U.S. generally accepted accounting principles. Also, in our opinion, the related financial statement schedule, when considered in relation to the basic consolidated financial statements taken as a whole, presents fairly, in all material respects, the information set forth therein.
We also have audited, in accordance with the standards of the Public Company Accounting Oversight Board (United States), Western Digital Corporation and subsidiaries’ internal control over financial reporting as of
July 1, 2016
, based on criteria established in
Internal Control — Integrated Framework (2013)
issued by the Committee of Sponsoring Organizations of the Treadway Commission (COSO), and our report dated
August 26, 2016
, expressed an unqualified opinion on the effectiveness of the Company’s internal control over financial reporting.
|
/s/ KPMG LLP
|
|
|
August 26, 2016
|
|
|
Irvine, California
|
|
61
REPORT OF INDEPENDENT REGISTERED PUBLIC ACCOUNTING FIRM
The Board of Directors and Shareholders
Western Digital Corporation:
We have audited Western Digital Corporation and subsidiaries’ internal control over financial reporting as of
July 1, 2016
, based on criteria established in
Internal Control — Integrated Framework (2013)
issued by the Committee of Sponsoring Organizations of the Treadway Commission (COSO). Western Digital Corporation and subsidiaries’ management is responsible for maintaining effective internal control over financial reporting and for its assessment of the effectiveness of internal control over financial reporting, included in the accompanying Management’s Report on Internal Control over Financial Reporting appearing under Item 9A. Our responsibility is to express an opinion on the Company’s internal control over financial reporting based on our audit.
We conducted our audit in accordance with the standards of the Public Company Accounting Oversight Board (United States). Those standards require that we plan and perform the audit to obtain reasonable assurance about whether effective internal control over financial reporting was maintained in all material respects. Our audit included obtaining an understanding of internal control over financial reporting, assessing the risk that a material weakness exists, and testing and evaluating the design and operating effectiveness of internal control based on the assessed risk. Our audit also included performing such other procedures as we considered necessary in the circumstances. We believe that our audit provides a reasonable basis for our opinion.
A company’s internal control over financial reporting is a process designed to provide reasonable assurance regarding the reliability of financial reporting and the preparation of financial statements for external purposes in accordance with generally accepted accounting principles. A company’s internal control over financial reporting includes those policies and procedures that (1) pertain to the maintenance of records that, in reasonable detail, accurately and fairly reflect the transactions and dispositions of the assets of the company; (2) provide reasonable assurance that transactions are recorded as necessary to permit preparation of financial statements in accordance with U.S. generally accepted accounting principles, and that receipts and expenditures of the company are being made only in accordance with authorizations of management and directors of the company; and (3) provide reasonable assurance regarding prevention or timely detection of unauthorized acquisition, use, or disposition of the company’s assets that could have a material effect on the financial statements.
Because of its inherent limitations, internal control over financial reporting may not prevent or detect misstatements. Also, projections of any evaluation of effectiveness to future periods are subject to the risk that controls may become inadequate because of changes in conditions, or that the degree of compliance with the policies or procedures may deteriorate.
In our opinion, Western Digital Corporation and subsidiaries maintained, in all material respects, effective internal control over financial reporting as of
July 1, 2016
, based on criteria established in
Internal Control — Integrated Framework (2013)
issued by the Committee of Sponsoring Organizations of the Treadway Commission (COSO).
Western Digital Corporation and subsidiaries acquired SanDisk Corporation on May 12, 2016, and management excluded from its assessment of the effectiveness of Western Digital Corporation and subsidiaries’ internal control over financial reporting as of July 1, 2016, SanDisk Corporation’s internal control over financial reporting associated with total assets of
17%
and total revenues of
6%
of the related consolidated financial statement amounts included in the consolidated financial statements of Western Digital Corporation and subsidiaries as of and for the year ended July 1, 2016. Our audit of internal control over financial reporting of Western Digital Corporation and subsidiaries also excluded an evaluation of the internal control over financial reporting of SanDisk Corporation.
We also have audited, in accordance with the standards of the Public Company Accounting Oversight Board (United States), the consolidated balance sheets of Western Digital Corporation and subsidiaries as of
July 1, 2016
and
July 3, 2015
, the related consolidated statements of income, comprehensive income, shareholders’ equity, and cash flows for each of the years in the three-year period ended
July 1, 2016
, and the related financial statement schedule, and our report dated
August 26, 2016
, expressed an unqualified opinion on those consolidated financial statements and financial statement schedule.
|
/s/ KPMG LLP
|
|
|
August 26, 2016
|
|
|
Irvine, California
|
|
62
WESTERN DIGITAL CORPORATION
(in millions, except par value)
|
July 1,
2016 |
July 3,
2015 |
||||||
|
ASSETS
|
|||||||
|
Current assets:
|
|||||||
|
Cash and cash equivalents
|
$
|
8,151
|
|
$
|
5,024
|
|
|
|
Short-term investments
|
227
|
|
262
|
|
|||
|
Accounts receivable, net
|
1,461
|
|
1,532
|
|
|||
|
Inventories
|
2,129
|
|
1,368
|
|
|||
|
Other current assets
|
616
|
|
327
|
|
|||
|
Total current assets
|
12,584
|
|
8,513
|
|
|||
|
Property, plant and equipment, net
|
3,503
|
|
2,965
|
|
|||
|
Notes receivable and investments in Flash Ventures
|
1,171
|
|
—
|
|
|||
|
Goodwill
|
9,951
|
|
2,766
|
|
|||
|
Other intangible assets, net
|
5,034
|
|
332
|
|
|||
|
Other non-current assets
|
619
|
|
594
|
|
|||
|
Total assets
|
$
|
32,862
|
|
$
|
15,170
|
|
|
|
LIABILITIES AND STOCKHOLDERS’ EQUITY
|
|||||||
|
Current liabilities:
|
|||||||
|
Accounts payable
|
$
|
1,888
|
|
$
|
1,881
|
|
|
|
Accounts payable to related parties
|
168
|
|
—
|
|
|||
|
Accrued expenses
|
995
|
|
470
|
|
|||
|
Accrued compensation
|
392
|
|
330
|
|
|||
|
Accrued warranty
|
172
|
|
150
|
|
|||
|
Revolving credit facility
|
—
|
|
255
|
|
|||
|
Bridge loan
|
2,995
|
|
—
|
|
|||
|
Current portion of long-term debt
|
339
|
|
152
|
|
|||
|
Total current liabilities
|
6,949
|
|
3,238
|
|
|||
|
Long-term debt
|
13,660
|
|
2,149
|
|
|||
|
Other liabilities
|
1,108
|
|
564
|
|
|||
|
Total liabilities
|
21,717
|
|
5,951
|
|
|||
|
Commitments and contingencies (Notes 3, 4, 6 and 10)
|
|
|
|||||
|
Stockholders’ equity:
|
|||||||
|
Preferred stock, $0.01 par value; authorized — 5 shares; issued and outstanding — none
|
—
|
|
—
|
|
|||
|
Common stock, $0.01 par value; authorized — 450 shares; issued — 312 shares in 2016 and 261 shares in 2015; outstanding — 284 shares in 2016 and 230 shares in 2015
|
3
|
|
3
|
|
|||
|
Additional paid-in capital
|
4,429
|
|
2,428
|
|
|||
|
Accumulated other comprehensive income (loss)
|
103
|
|
(20
|
)
|
|||
|
Retained earnings
|
8,848
|
|
9,107
|
|
|||
|
Treasury stock — common shares at cost; 28 shares in 2016 and 31 shares in 2015
|
(2,238
|
)
|
(2,299
|
)
|
|||
|
Total stockholders’ equity
|
11,145
|
|
9,219
|
|
|||
|
Total liabilities and stockholders’ equity
|
$
|
32,862
|
|
$
|
15,170
|
|
|
The accompanying notes are an integral part of these consolidated financial statements.
63
WESTERN DIGITAL CORPORATION
CONSOLIDATED STATEMENTS OF INCOME
(in millions, except per share amounts)
|
|
Years Ended
|
||||||||||
|
|
July 1,
2016 |
July 3,
2015 |
June 27,
2014 |
||||||||
|
Revenue, net
|
$
|
12,994
|
|
$
|
14,572
|
|
$
|
15,130
|
|
||
|
Cost of revenue
|
9,559
|
|
10,351
|
|
10,770
|
|
|||||
|
Gross profit
|
3,435
|
|
4,221
|
|
4,360
|
|
|||||
|
Operating expenses:
|
|||||||||||
|
Research and development
|
1,627
|
|
1,646
|
|
1,661
|
|
|||||
|
Selling, general and administrative
|
997
|
|
788
|
|
813
|
|
|||||
|
Employee termination, asset impairment and other charges
|
345
|
|
176
|
|
95
|
|
|||||
|
Total operating expenses
|
2,969
|
|
2,610
|
|
2,569
|
|
|||||
|
Operating income
|
466
|
|
1,611
|
|
1,791
|
|
|||||
|
Other income (expense):
|
|||||||||||
|
Interest income
|
26
|
|
14
|
|
15
|
|
|||||
|
Interest expense
|
(266
|
)
|
(49
|
)
|
(56
|
)
|
|||||
|
Other income (expense), net
|
(73
|
)
|
1
|
|
2
|
|
|||||
|
Total other expense, net
|
(313
|
)
|
(34
|
)
|
(39
|
)
|
|||||
|
Income before income taxes
|
153
|
|
1,577
|
|
1,752
|
|
|||||
|
Income tax expense (benefit)
|
(89
|
)
|
112
|
|
135
|
|
|||||
|
Net income
|
$
|
242
|
|
$
|
1,465
|
|
$
|
1,617
|
|
||
|
Income per common share:
|
|||||||||||
|
Basic
|
$
|
1.01
|
|
$
|
6.31
|
|
$
|
6.88
|
|
||
|
Diluted
|
$
|
1.00
|
|
$
|
6.18
|
|
$
|
6.68
|
|
||
|
Weighted average shares outstanding:
|
|||||||||||
|
Basic
|
239
|
|
232
|
|
235
|
|
|||||
|
Diluted
|
242
|
|
237
|
|
242
|
|
|||||
|
Cash dividends declared per share
|
$
|
2.00
|
|
$
|
1.80
|
|
$
|
1.25
|
|
||
The accompanying notes are an integral part of these consolidated financial statements.
64
WESTERN DIGITAL CORPORATION
CONSOLIDATED STATEMENTS OF COMPREHENSIVE INCOME
(in millions)
|
|
Years Ended
|
||||||||||
|
|
July 1,
2016 |
July 3,
2015 |
June 27,
2014 |
||||||||
|
Net income
|
$
|
242
|
|
$
|
1,465
|
|
$
|
1,617
|
|
||
|
Other comprehensive income (loss), before tax:
|
|||||||||||
|
Actuarial pension loss
|
(73
|
)
|
(2
|
)
|
(4
|
)
|
|||||
|
Foreign currency translation adjustment
|
74
|
|
—
|
|
—
|
|
|||||
|
Net unrealized gain (loss) on foreign exchange contracts
|
99
|
|
(30
|
)
|
51
|
|
|||||
|
Other comprehensive income (loss), before tax
|
100
|
|
(32
|
)
|
47
|
|
|||||
|
Income tax benefit related to items of other comprehensive income (loss)
|
23
|
|
—
|
|
—
|
|
|||||
|
Other comprehensive income (loss), net of tax
|
123
|
|
(32
|
)
|
47
|
|
|||||
|
Total comprehensive income
|
$
|
365
|
|
$
|
1,433
|
|
$
|
1,664
|
|
||
The accompanying notes are an integral part of these consolidated financial statements.
65
WESTERN DIGITAL CORPORATION
(in millions)
|
Years Ended
|
|||||||||||
|
|
July 1,
2016 |
July 3,
2015 |
June 27,
2014 |
||||||||
|
Cash flows from operating activities
|
|||||||||||
|
Net income
|
$
|
242
|
|
$
|
1,465
|
|
$
|
1,617
|
|
||
|
Adjustments to reconcile net income to net cash provided by operations:
|
|||||||||||
|
Depreciation and amortization
|
1,154
|
|
1,114
|
|
1,244
|
|
|||||
|
Stock-based compensation
|
191
|
|
162
|
|
156
|
|
|||||
|
Deferred income taxes
|
(149
|
)
|
28
|
|
(13
|
)
|
|||||
|
Gain from insurance recovery
|
—
|
|
(37
|
)
|
(65
|
)
|
|||||
|
Loss on disposal of assets
|
22
|
|
17
|
|
40
|
|
|||||
|
Amortization of debt discount and issuance costs
|
36
|
|
—
|
|
—
|
|
|||||
|
Loss on settlement of convertible debt
|
58
|
|
—
|
|
—
|
|
|||||
|
Non-cash portion of employee termination, asset impairment and other charges
|
41
|
|
86
|
|
62
|
|
|||||
|
Other non-cash operating activities, net
|
11
|
|
—
|
|
9
|
|
|||||
|
Changes in:
|
|||||||||||
|
Accounts receivable, net
|
466
|
|
458
|
|
(175
|
)
|
|||||
|
Inventories
|
306
|
|
(143
|
)
|
—
|
|
|||||
|
Accounts payable
|
(299
|
)
|
(148
|
)
|
(32
|
)
|
|||||
|
Accounts payable to related parties
|
(115
|
)
|
—
|
|
—
|
|
|||||
|
Accrued arbitration award
|
—
|
|
(758
|
)
|
52
|
|
|||||
|
Accrued expenses
|
102
|
|
35
|
|
(56
|
)
|
|||||
|
Accrued compensation
|
(94
|
)
|
(134
|
)
|
7
|
|
|||||
|
Other assets and liabilities, net
|
11
|
|
97
|
|
(30
|
)
|
|||||
|
Net cash provided by operating activities
|
1,983
|
|
2,242
|
|
2,816
|
|
|||||
|
Cash flows from investing activities
|
|||||||||||
|
Purchases of property, plant and equipment
|
(584
|
)
|
(612
|
)
|
(628
|
)
|
|||||
|
Acquisitions, net of cash acquired
|
(9,835
|
)
|
(257
|
)
|
(823
|
)
|
|||||
|
Purchases of investments
|
(632
|
)
|
(857
|
)
|
(561
|
)
|
|||||
|
Proceeds from sales and maturities of investments
|
1,609
|
|
768
|
|
72
|
|
|||||
|
Notes receivable issuances to Flash Ventures
|
(106
|
)
|
—
|
|
—
|
|
|||||
|
Notes receivable proceeds from Flash Ventures
|
16
|
|
—
|
|
—
|
|
|||||
|
Strategic investments and other, net
|
(76
|
)
|
5
|
|
4
|
|
|||||
|
Net cash used in investing activities
|
(9,608
|
)
|
(953
|
)
|
(1,936
|
)
|
|||||
|
Cash flows from financing activities
|
|||||||||||
|
Issuance of stock under employee stock plans
|
117
|
|
212
|
|
187
|
|
|||||
|
Taxes paid on vested stock awards under employee stock plans
|
(50
|
)
|
(64
|
)
|
(32
|
)
|
|||||
|
Excess tax benefits from employee stock plans
|
7
|
|
19
|
|
60
|
|
|||||
|
Proceeds from acquired call option
|
409
|
|
—
|
|
—
|
|
|||||
|
Settlement of convertible debt
|
(2,611
|
)
|
—
|
|
—
|
|
|||||
|
Repurchases of common stock
|
(60
|
)
|
(970
|
)
|
(816
|
)
|
|||||
|
Proceeds from revolving credit facility
|
125
|
|
—
|
|
—
|
|
|||||
|
Repayment of revolving credit facility
|
(380
|
)
|
—
|
|
—
|
|
|||||
|
Dividends paid to shareholders
|
(464
|
)
|
(396
|
)
|
(259
|
)
|
|||||
|
Repayment of debt
|
(2,313
|
)
|
(125
|
)
|
(2,517
|
)
|
|||||
|
Proceeds from debt
|
17,108
|
|
255
|
|
2,992
|
|
|||||
|
Debt issuance costs
|
(524
|
)
|
—
|
|
—
|
|
|||||
|
Payment upon settlement of acquired warrants
|
(613
|
)
|
—
|
|
—
|
|
|||||
|
Net cash provided by (used in) financing activities
|
10,751
|
|
(1,069
|
)
|
(385
|
)
|
|||||
|
Effect of exchange rate changes on cash
|
1
|
|
—
|
|
—
|
|
|||||
|
Net increase in cash and cash equivalents
|
3,127
|
|
220
|
|
495
|
|
|||||
|
Cash and cash equivalents, beginning of year
|
5,024
|
|
4,804
|
|
4,309
|
|
|||||
|
Cash and cash equivalents, end of year
|
$
|
8,151
|
|
$
|
5,024
|
|
$
|
4,804
|
|
||
|
Supplemental disclosure of cash flow information:
|
|||||||||||
|
Cash paid for income taxes
|
$
|
26
|
|
$
|
47
|
|
$
|
141
|
|
||
|
Cash paid for interest
|
$
|
113
|
|
$
|
45
|
|
$
|
46
|
|
||
|
Supplemental disclosure of non-cash investing and financing activities:
|
|||||||||||
|
Common stock issued and equity awards assumed in connection with acquisition
|
$
|
1,822
|
|
$
|
—
|
|
$
|
—
|
|
||
|
Shares issued in conjunction with settlement of convertible notes
|
$
|
94
|
|
$
|
—
|
|
$
|
—
|
|
||
|
Shares received in conjunction with assumed call options
|
$
|
(70
|
)
|
$
|
—
|
|
$
|
—
|
|
||
|
Accrual of cash dividend declared
|
$
|
142
|
|
$
|
116
|
|
$
|
94
|
|
||
The accompanying notes are an integral part of these consolidated financial statements.
66
WESTERN DIGITAL CORPORATION
CONSOLIDATED STATEMENTS OF STOCKHOLDERS’ EQUITY
(in millions)
|
Additional
|
Accumulated Other
|
Total
|
|||||||||||||||||||||||||||
|
|
Common Stock
|
Treasury Stock
|
Paid-In
|
Comprehensive
|
Retained
|
Stockholders’
|
|||||||||||||||||||||||
|
|
Shares
|
Amount
|
Shares
|
Amount
|
Capital
|
Income (Loss)
|
Earnings
|
Equity
|
|||||||||||||||||||||
|
Balance at June 28, 2013
|
261
|
|
$
|
3
|
|
(24
|
)
|
$
|
(1,012
|
)
|
$
|
2,188
|
|
$
|
(35
|
)
|
$
|
6,749
|
|
$
|
7,893
|
|
|||||||
|
Employee stock plans
|
—
|
|
—
|
|
7
|
|
258
|
|
(103
|
)
|
—
|
|
—
|
|
155
|
|
|||||||||||||
|
Stock-based compensation
|
—
|
|
—
|
|
—
|
|
—
|
|
156
|
|
—
|
|
—
|
|
156
|
|
|||||||||||||
|
Stock awards assumed in acquisition
|
—
|
|
—
|
|
—
|
|
—
|
|
25
|
|
—
|
|
—
|
|
25
|
|
|||||||||||||
|
Increase in excess tax benefits from employee stock plans
|
—
|
|
—
|
|
—
|
|
—
|
|
60
|
|
—
|
|
—
|
|
60
|
|
|||||||||||||
|
Repurchases of common stock
|
—
|
|
—
|
|
(10
|
)
|
(816
|
)
|
—
|
|
—
|
|
—
|
|
(816
|
)
|
|||||||||||||
|
Dividends to stockholders
|
—
|
|
—
|
|
—
|
|
—
|
|
5
|
|
—
|
|
(300
|
)
|
(295
|
)
|
|||||||||||||
|
Net income
|
—
|
|
—
|
|
—
|
|
—
|
|
—
|
|
—
|
|
1,617
|
|
1,617
|
|
|||||||||||||
|
Actuarial pension loss
|
—
|
|
—
|
|
—
|
|
—
|
|
—
|
|
(4
|
)
|
—
|
|
(4
|
)
|
|||||||||||||
|
Unrealized gain on foreign exchange contracts
|
—
|
|
—
|
|
—
|
|
—
|
|
—
|
|
51
|
|
—
|
|
51
|
|
|||||||||||||
|
Balance at June 27, 2014
|
261
|
|
$
|
3
|
|
(27
|
)
|
$
|
(1,570
|
)
|
$
|
2,331
|
|
$
|
12
|
|
$
|
8,066
|
|
$
|
8,842
|
|
|||||||
|
Employee stock plans
|
—
|
|
—
|
|
6
|
|
241
|
|
(93
|
)
|
—
|
|
—
|
|
148
|
|
|||||||||||||
|
Stock-based compensation
|
—
|
|
—
|
|
—
|
|
—
|
|
162
|
|
—
|
|
—
|
|
162
|
|
|||||||||||||
|
Stock awards assumed in acquisition
|
—
|
|
—
|
|
—
|
|
—
|
|
3
|
|
—
|
|
—
|
|
3
|
|
|||||||||||||
|
Increase in excess tax benefits from employee stock plans
|
—
|
|
—
|
|
—
|
|
—
|
|
19
|
|
—
|
|
—
|
|
19
|
|
|||||||||||||
|
Repurchases of common stock
|
—
|
|
—
|
|
(10
|
)
|
(970
|
)
|
—
|
|
—
|
|
—
|
|
(970
|
)
|
|||||||||||||
|
Dividends to stockholders
|
—
|
|
—
|
|
—
|
|
—
|
|
6
|
|
—
|
|
(424
|
)
|
(418
|
)
|
|||||||||||||
|
Net income
|
—
|
|
—
|
|
—
|
|
—
|
|
—
|
|
—
|
|
1,465
|
|
1,465
|
|
|||||||||||||
|
Actuarial pension loss
|
—
|
|
—
|
|
—
|
|
—
|
|
—
|
|
(2
|
)
|
—
|
|
(2
|
)
|
|||||||||||||
|
Unrealized loss on foreign exchange contracts
|
—
|
|
—
|
|
—
|
|
—
|
|
—
|
|
(30
|
)
|
—
|
|
(30
|
)
|
|||||||||||||
|
Balance at July 3, 2015
|
261
|
|
$
|
3
|
|
(31
|
)
|
$
|
(2,299
|
)
|
$
|
2,428
|
|
$
|
(20
|
)
|
$
|
9,107
|
|
$
|
9,219
|
|
|||||||
|
Employee stock plans
|
—
|
|
—
|
|
5
|
|
191
|
|
(124
|
)
|
—
|
|
—
|
|
67
|
|
|||||||||||||
|
Stock-based compensation
|
—
|
|
—
|
|
—
|
|
—
|
|
191
|
|
—
|
|
—
|
|
191
|
|
|||||||||||||
|
Common stock issued in connection with acquisition
|
49
|
|
—
|
|
—
|
|
—
|
|
1,764
|
|
—
|
|
—
|
|
1,764
|
|
|||||||||||||
|
Stock awards assumed in acquisition
|
—
|
|
—
|
|
—
|
|
—
|
|
58
|
|
—
|
|
—
|
|
58
|
|
|||||||||||||
|
Increase in excess tax benefits from employee stock plans
|
—
|
|
—
|
|
—
|
|
—
|
|
7
|
|
—
|
|
—
|
|
7
|
|
|||||||||||||
|
Shares issued in conjunction with settlement of convertible notes
|
2
|
|
—
|
|
—
|
|
—
|
|
94
|
|
—
|
|
—
|
|
94
|
|
|||||||||||||
|
Shares received in conjunction with assumed call options
|
—
|
|
—
|
|
(1
|
)
|
(70
|
)
|
—
|
|
—
|
|
—
|
|
(70
|
)
|
|||||||||||||
|
Repurchases of common stock
|
—
|
|
—
|
|
(1
|
)
|
(60
|
)
|
—
|
|
—
|
|
—
|
|
(60
|
)
|
|||||||||||||
|
Dividends to stockholders
|
—
|
|
—
|
|
—
|
|
—
|
|
11
|
|
—
|
|
(501
|
)
|
(490
|
)
|
|||||||||||||
|
Net income
|
—
|
|
—
|
|
—
|
|
—
|
|
—
|
|
—
|
|
242
|
|
242
|
|
|||||||||||||
|
Actuarial pension loss
|
—
|
|
—
|
|
—
|
|
—
|
|
—
|
|
(50
|
)
|
—
|
|
(50
|
)
|
|||||||||||||
|
Foreign currency translation adjustment
|
—
|
|
—
|
|
—
|
|
—
|
|
—
|
|
74
|
|
—
|
|
74
|
|
|||||||||||||
|
Net unrealized gain on foreign exchange contracts
|
—
|
|
—
|
|
—
|
|
—
|
|
—
|
|
99
|
|
—
|
|
99
|
|
|||||||||||||
|
Balance at July 1, 2016
|
312
|
|
$
|
3
|
|
(28
|
)
|
$
|
(2,238
|
)
|
$
|
4,429
|
|
$
|
103
|
|
$
|
8,848
|
|
$
|
11,145
|
|
|||||||
The accompanying notes are an integral part of these consolidated financial statements.
67
WESTERN DIGITAL CORPORATION
NOTES TO CONSOLIDATED FINANCIAL STATEMENTS
Western Digital Corporation (the “Company” or “Western Digital”) is a leading developer, manufacturer and provider of data storage devices and solutions that address the needs of the information technology industry and the infrastructure that enables the storage of data. The Company also generates license and royalty revenue related to its intellectual property.
The Company has prepared its consolidated financial statements in accordance with accounting principles generally accepted in the United States (“U.S. GAAP”) and has adopted accounting policies and practices which are generally accepted in the industry in which it operates. The Company’s significant accounting policies are summarized below.
Fiscal Year
The Company’s fiscal year ends on the Friday nearest to June 30 and typically consists of 52 weeks. Approximately every six years, the Company reports a 53-week fiscal year to align the fiscal year with the foregoing policy. Fiscal year
2016
ended on
July 1, 2016
and was comprised of
52
weeks. Fiscal year
2015
ended on
July 3, 2015
and was comprised of
53
weeks, with the first quarter consisting of
14
weeks and the second, third and fourth quarters consisting of
13
weeks each. Fiscal year
2014
ended on
June 27, 2014
and was comprised of
52
weeks.
Basis of Presentation
The consolidated financial statements include the accounts of the Company and its wholly owned subsidiaries. All significant intercompany accounts and transactions have been eliminated in consolidation. The functional currency of most of the Company’s foreign subsidiaries is the U.S. dollar. The accounts of these foreign subsidiaries have been remeasured using the U.S. dollar as the functional currency. Gains or losses resulting from remeasurement of these accounts from local currencies into U.S. dollars were immaterial to the consolidated financial statements. Financial statements of the Company’s foreign subsidiaries for which the functional currency is the local currency are translated into U.S. dollars using the exchange rate at each balance sheet date for assets and liabilities and a weighted average exchange rate for each period for statement of income items. Translation adjustments are recorded in accumulated other comprehensive income, a component of stockholders’ equity.
Reclassifications
Certain prior year amounts have been reclassified in the balance sheet, statement of income and footnotes to conform with the current year presentation.
Cash and Cash Equivalents
The Company’s cash equivalents represent highly liquid investments in money market funds, which are invested in U.S. Treasury securities and U.S. Government agency securities as well as bank certificates of deposit with original maturities at purchase of three months or less. Cash equivalents are carried at cost plus accrued interest, which approximates fair value.
Available-for-Sale Securities
The Company invests in U.S. Treasury securities, U.S. and International Government agency securities, certificates of deposit, asset-backed securities, and corporate and municipal notes and bonds, with original maturities at purchase of more than three months. These investments are classified as available-for-sale securities and included within short-term investments and other non-current assets in the consolidated balance sheets. Available-for-sale securities are stated at fair value with unrealized gains and losses included in accumulated other comprehensive income (loss), which is a component of stockholders’ equity. Gains and losses on available-for-sale securities are recorded based on the specific identification method. The Company evaluates the available-for-sale securities in an unrealized loss position for other-than-temporary impairment. The amortized cost of available-for-sale securities is adjusted for amortization of premiums and accretion of discounts to maturity. Such amortization and accretion are included in total other expense, net in the consolidated statements of income. In addition, realized gains and losses are included in total other expense, net in the consolidated statements of income.
Equity Investments
The Company enters into certain strategic investments for the promotion of business and strategic objectives. The Company accounts for investments in equity securities of other entities that are not consolidated under the cost method of accounting if the Company’s ownership interest is less than
20%
, and the Company does not have the ability to exercise significant influence over operating and financial policies of the investee. The equity method of accounting is used if the Company’s ownership interest is greater than or equal to
20%
but less than a majority or where the Company has the ability to exercise significant influence over operating and financial policies.
68
WESTERN DIGITAL CORPORATION
NOTES TO CONSOLIDATED FINANCIAL STATEMENTS — (Continued)
Investments accounted for under the cost method are recorded within other non-current assets in the consolidated balance sheets as of
July 1, 2016
and
July 3, 2015
. They are also periodically analyzed to determine whether or not there are indicators of impairment.
Variable Interest Entities
The Company evaluates its investments and other significant relationships to determine whether any investee is a variable interest entity (“VIE”). If the Company concludes that an investee is a VIE, the Company evaluates its power to direct the activities of the investee, its obligation to absorb the expected losses of the investee and its right to receive the expected residual returns of the investee to determine whether the Company is the primary beneficiary of the investee. If the Company is the primary beneficiary of a VIE, the Company consolidates such entity and reflects the non-controlling interest of other beneficiaries of that entity. The Company does not consolidate any cost method investment or equity method investment entities.
Fair Value of Financial Instruments
The carrying amounts of cash equivalents, accounts receivable, accounts payable and accrued expenses approximate fair value for all periods presented because of the short-term maturity of these assets and liabilities. The fair value of investments that are not accounted for under the equity method is based on appropriate market information.
Inventories
The Company values inventories at the lower of cost (first-in, first out and weighted-average methods) or net realizable value. The first-in, first-out (“FIFO”) method is used to value the cost of the majority of the Company’s inventories, while the weighted-average method is used to value precious metal inventories. Weighted-average cost is calculated based upon the cost of precious metals at the time they are received by the Company. The Company has determined that it is not practicable to assign specific costs to individual units of precious metals and, as such, precious metals are relieved from inventory based on the weighted-average cost of the inventory at the time the inventory is used in production. The weighted average method of valuing precious metals does not materially differ from the FIFO method. Inventory write-downs are recorded for the valuation of inventory at the lower of cost or net realizable value by analyzing market conditions and estimates of future sales prices as compared to inventory costs and inventory balances.
The Company evaluates inventory balances for excess quantities and obsolescence on a regular basis by analyzing estimated demand, inventory on hand, sales levels and other information, and reduces inventory balances to net realizable value for excess and obsolete inventory based on this analysis. Unanticipated changes in technology or customer demand could result in a decrease in demand for one or more of the Company’s products, which may require a write down of inventory that could materially affect operating results.
Property, Plant and Equipment
Property and equipment are carried at cost less accumulated depreciation and amortization. The cost of property, plant and equipment is depreciated over the estimated useful lives of the respective assets. The Company’s buildings are depreciated over periods ranging from
fifteen
to
thirty-five
years. The majority of the Company’s equipment is depreciated over periods of
two
to
seven
years. Depreciation is computed on a straight-line basis. Leasehold improvements are amortized over the lesser of the estimated useful lives of the assets or the related lease terms.
Business Combinations
The application of acquisition accounting to a business combination requires that the Company identify the individual assets acquired and liabilities assumed and estimate the fair value of each. The fair value of assets acquired and liabilities assumed in a business acquisition are recognized at the acquisition date, with the purchase price exceeding the fair values being recognized as goodwill. Determining fair value of identifiable assets, particularly intangibles, liabilities acquired and contingent obligations assumed requires management to make estimates. In certain circumstances, the allocations of the excess purchase price are based upon preliminary estimates and assumptions and subject to revision when the Company receives final information, including appraisals and other analysis. Accordingly, the measurement period for such purchase price allocations will end when the information, or the facts and circumstances, becomes available, but will not exceed twelve months. The Company will recognize measurement-period adjustments during the period of resolution, including the effect on earnings of any amounts that would have been recorded in previous periods if the accounting had been completed at the acquisition date.
69
WESTERN DIGITAL CORPORATION
NOTES TO CONSOLIDATED FINANCIAL STATEMENTS — (Continued)
Goodwill and intangible assets often represent a significant portion of the assets acquired in a business combination. The Company recognizes the fair value of an acquired intangible apart from goodwill whenever the intangible arises from contractual or other legal rights, or when it can be separated or divided from the acquired entity and sold, transferred, licensed, rented or exchanged, either individually or in combination with a related contract, asset or liability. Intangible assets consist primarily of technology, customer relationships, and trade name and trademarks acquired in business combinations and in-process research and development (“IPR&D”). The Company generally assesses the estimated fair values of acquired intangibles using a combination of valuation techniques. To estimate fair value, the Company is required make certain estimates and assumptions, including future economic and market conditions, revenue growth, market share, operating costs and margins, and risk-adjusted discount rates. These estimates require significant judgment and are based on historical data, various internal estimates, and external sources. The Company’s assessment of IPR&D also includes consideration of the risk of the projects not achieving technological feasibility.
Goodwill and Other Long-Lived Assets
Goodwill is not amortized. Instead, it is tested for impairment on an annual basis or more frequently whenever events or changes in circumstances indicate that goodwill may be impaired. The Company performs an annual impairment test as of the first day of its fiscal fourth quarter. The Company either uses qualitative factors to determine whether goodwill is more likely than not impaired or performs a two-step approach to quantify impairment. If the Company concludes from the qualitative assessment that goodwill is more likely than not impaired, the Company is required to follow a two-step approach to quantify the impairment. The Company is required to use judgment when applying the goodwill impairment test, including the identification of reporting units, assignment of assets and liabilities to reporting units, assignment of goodwill to reporting units and determination of the fair value of each reporting unit. In addition, the estimates used to determine the fair value of each reporting unit may change based on results of operations, macroeconomic conditions or other factors. Changes in these estimates could materially affect the Company’s assessment of the fair value and goodwill impairment for each reporting unit. If the Company’s stock price decreases significantly, goodwill could become impaired, which could result in a material charge and adversely affect the Company’s results of operations.
Acquired intangibles are amortized over their estimated useful lives based on the pattern in which the economic benefits are expected to be received. Long-lived assets are tested for recoverability whenever events or changes in circumstances indicate that their carrying amounts may not be recoverable. IPR&D is not amortized until the point at which it reaches technological feasibility. Instead, it is tested for impairment on an annual basis or more frequently whenever events or changes in circumstances indicate that it may be impaired. If impairment is indicated, the impairment is measured as the amount by which the carrying amount of the assets exceeds the fair value of the assets. The Company recorded impairments to certain long-lived assets in
2016
,
2015
and
2014
. See Notes 14 and 17 to the consolidated financial statements for additional disclosures related to the Company’s other intangible assets.
Revenue and Accounts Receivable
Revenue is recognized when the title and risk of loss have passed to the customer, there is persuasive evidence of an arrangement, delivery has occurred, or services have been rendered, the sales price is fixed or determinable and collectability is reasonably assured. The Company establishes provisions against revenue and cost of revenue for estimated sales returns in the same period that the related revenue is recognized based on existing product return notifications. If actual sales returns exceed expectations, an increase in the sales return accrual would be required, which could materially affect operating results.
In accordance with standard industry practice, the Company provides distributors and retailers (collectively referred to as “resellers”) with limited price protection for inventories held by resellers at the time of published list price reductions and/or a right of return, and the Company provides resellers and original equipment manufacturers (“OEMs”) with other sales incentive programs. At the time the Company recognizes revenue to resellers and OEMs, a reduction of revenue is recorded for estimated price protection and/or returns until the resellers sell such inventory to their customers and the Company also records a reduction of revenue for the other programs in effect. The Company bases these adjustments on several factors including anticipated price decreases during the reseller holding period, reseller’s sell-through and inventory levels, estimated amounts to be reimbursed to qualifying customers, historical pricing information, historical and anticipated returns information and customer claim processing. If customer demand for the Company’s products or market conditions differ from the Company’s expectations, the Company’s operating results could be materially affected. The Company also has programs under which it reimburses qualified distributors and retailers for certain marketing expenditures, which are recorded as a reduction of revenue.
70
WESTERN DIGITAL CORPORATION
NOTES TO CONSOLIDATED FINANCIAL STATEMENTS — (Continued)
Revenue from patent licensing arrangements is recognized when earned, estimable and realizable. The timing of revenue recognition is dependent on the terms of each license agreement and on the timing of sales of licensed products. The Company generally recognizes royalty revenue when it is reported to the Company by its licensees, which is generally one quarter in arrears from the licensees’ sales of licensed products. For licensing fees that are not determined by the licensees’ sales, the Company generally recognizes license fee revenue on a straight-line basis over the life of the license.
Some of the Company’s revenue arrangements are multiple-element arrangements because they are generally comprised of product, software and support services or multiple distinct licenses. For multiple-element arrangements, the Company evaluates whether each deliverable should be accounted for as a separate unit of accounting. For multiple-element arrangements that include support or software elements, the Company analyzes whether tangible products containing software and non-software components function together and therefore should be excluded from industry-specific software revenue recognition guidance. For all multiple-element arrangements, the Company allocates revenue to each element, or the software elements as a group, based on the relative selling price determined in accordance with the Company’s normal pricing and discounting practices for the specific element when sold separately. For multiple-element license agreements that include more than one license to distinct technology that are separate units of accounting, the Company allocates revenue to each license based on the relative selling price of each deliverable. License fees related to existing technology with no continuing performance obligations are generally recognized upon license commencement and other license fees are generally recognized on a straight-line basis over the life of the license. The Company primarily uses an estimate of selling price to allocate revenue for multiple-element license agreements based upon similar licenses, historical and estimated future sales volume, duration, and market conditions.
The Company records an allowance for doubtful accounts by analyzing specific customer accounts and assessing the risk of loss based on insolvency, disputes or other collection issues. In addition, the Company routinely analyzes the different receivable aging categories and establishes reserves based on a combination of past due receivables and expected future losses based primarily on its historical levels of bad debt losses. If the financial condition of a significant customer deteriorates resulting in its inability to pay its accounts when due, or if the Company’s overall loss history changes significantly, an adjustment in the Company’s allowance for doubtful accounts would be required, which could materially affect operating results.
From time to time, in connection with a factoring agreement, the Company sells trade accounts receivable without recourse to a third party purchaser in exchange for cash. The Company sold trade accounts receivable and received cash proceeds of
$225 million
,
$269 million
and
$187 million
during
2016
,
2015
and
2014
, respectively. The discounts on the sales of trade accounts receivables were not material and were recorded within interest expense in the consolidated statements of income.
Warranty
The Company records an accrual for estimated warranty costs when revenue is recognized. The Company generally warrants its products for a period of
one
to
five
years, with a small number of products having a warranty ranging up to ten years or more. The warranty provision considers estimated product failure rates and trends, estimated replacement costs, estimated repair costs which include scrap costs and estimated costs for customer compensatory claims related to product quality issues, if any. For warranties ten years or greater, including lifetime warranties, the Company uses the estimated useful life of the product to calculate the warranty exposure. A statistical warranty tracking model is used to help prepare estimates and assist the Company in exercising judgment in determining the underlying estimates. The statistical tracking model captures specific detail on product reliability, such as factory test data, historical field return rates and costs to repair by product type. Management’s judgment is subject to a greater degree of subjectivity with respect to newly introduced products because of limited field experience with those products upon which to base warranty estimates. Management reviews the warranty accrual quarterly for products shipped in prior periods and which are still under warranty. Any changes in the estimates underlying the accrual may result in adjustments that impact current period gross profit and income. Such changes are generally a result of differences between forecasted and actual return rate experience and costs to repair. If actual product return trends, costs to repair returned products or costs of customer compensatory claims differ significantly from estimates, future results of operations could be materially affected.
71
WESTERN DIGITAL CORPORATION
NOTES TO CONSOLIDATED FINANCIAL STATEMENTS — (Continued)
Litigation and Other Contingencies
When the Company becomes aware of a claim or potential claim, the Company assesses the likelihood of any loss or exposure. The Company discloses information regarding each material claim where the likelihood of a loss contingency is probable or reasonably possible. If a loss contingency is probable and the amount of the loss can be reasonably estimated, the Company records an accrual for the loss. In such cases, there may be an exposure to potential loss in excess of the amount accrued. Where a loss is not probable but is reasonably possible or where a loss in excess of the amount accrued is reasonably possible, the Company discloses an estimate of the amount of the loss or range of possible losses for the claim if a reasonable estimate can be made, unless the amount of such reasonably possible losses is not material to the Company’s financial position, results of operations or cash flows. The ability to predict the ultimate outcome of such matters involves judgments, estimates and inherent uncertainties. The actual outcome of such matters could differ materially from management’s estimates. See Note 6 to the consolidated financial statements for additional disclosures related to the Company’s litigation.
Advertising Expense
Advertising costs are expensed as incurred. Selling, general and administrative expenses of the Company included advertising costs of
$60 million
,
$71 million
and
$60 million
in
2016
,
2015
and
2014
, respectively.
Research and Development Expense
Research and development (“R&D”) expenditures are expensed as incurred.
Income Taxes
The Company accounts for income taxes under the asset and liability method, which provides that deferred tax assets and liabilities be recognized for temporary differences between the financial reporting basis and the tax basis of assets and liabilities and expected benefits of utilizing net operating loss (“NOL”) and tax credit carryforwards. The Company records a valuation allowance when it is more likely than not that the deferred tax assets will not be realized. Each quarter, the Company evaluates the need for a valuation allowance for its deferred tax assets and adjusts the valuation allowance so that the Company records net deferred tax assets only to the extent that it has concluded it is more likely than not that these deferred tax assets will be realized.
The Company recognizes liabilities for uncertain tax positions based on a two-step process. To the extent a tax position does not meet a more-likely-than-not level of certainty, no benefit is recognized in the financial statements. If a position meets the more-likely-than-not level of certainty, it is recognized in the financial statements at the largest amount that has a
greater than 50%
likelihood of being realized upon ultimate settlement. Interest and penalties related to unrecognized tax benefits are recognized in liabilities recorded for uncertain tax positions and are recorded in the provision for income taxes. The actual liability for unrealized tax benefits in any such contingency may be materially different from the Company’s estimates, which could result in the need to record additional liabilities for unrecognized tax benefits or potentially adjust previously-recorded liabilities for unrealized tax benefits, and may materially affect the Company’s operating results.
Income per Common Share
The Company computes basic income per common share using net income and the weighted average number of common shares outstanding during the period. Diluted income per common share is computed using net income and the weighted average number of common shares and potentially dilutive common shares outstanding during the period. Potentially dilutive common shares include dilutive outstanding employee stock options, restricted stock unit awards (“RSUs”), performance-based restricted stock unit awards (“PSUs”), rights to purchase shares of common stock under the Company’s Employee Stock Purchase Plan (“ESPP”) and shares issuable in connection with convertible debt.
72
WESTERN DIGITAL CORPORATION
NOTES TO CONSOLIDATED FINANCIAL STATEMENTS — (Continued)
The following table presents the computation of basic and diluted income per common share for
2016
,
2015
and
2014
:
|
|
2016
|
2015
|
2014
|
||||||||
|
(in millions, except per share data)
|
|||||||||||
|
Net income
|
$
|
242
|
|
$
|
1,465
|
|
$
|
1,617
|
|
||
|
Weighted average shares outstanding:
|
|||||||||||
|
Basic
|
239
|
|
232
|
|
235
|
|
|||||
|
Employee stock options, RSUs, PSUs, ESPP
|
3
|
|
5
|
|
7
|
|
|||||
|
Diluted
|
242
|
|
237
|
|
242
|
|
|||||
|
Income per common share:
|
|||||||||||
|
Basic
|
$
|
1.01
|
|
$
|
6.31
|
|
$
|
6.88
|
|
||
|
Diluted
|
$
|
1.00
|
|
$
|
6.18
|
|
$
|
6.68
|
|
||
|
Anti-dilutive potential common shares excluded
(1)
|
5
|
|
1
|
|
2
|
|
|||||
|
(1)
|
For purposes of computing diluted income per common share, certain potentially dilutive securities have been excluded from the calculation because their effect would have been anti-dilutive.
|
Stock-based Compensation
The Company accounts for all stock-based compensation at fair value. Stock-based compensation cost is measured at the grant date based on the value of the award and is recognized as expense over the vesting period. The fair values of all stock options granted are estimated using a binomial option-pricing model, and the fair values of all ESPP purchase rights are estimated using the Black-Scholes-Merton option-pricing model. The Company accounts for stock appreciation rights (“SARs”) as liability awards based upon management’s intention to settle such awards in cash. All SARs issued to employees were fully vested, and the fair values are now solely subject to market price fluctuations. Both the binomial and the Black-Scholes-Merton option-pricing models require the input of highly subjective assumptions. The Company is required to use judgment in estimating the amount of stock-based awards that are expected to be forfeited. If actual forfeitures differ significantly from the original estimate, stock-based compensation expense and the results of operations could be materially affected.
PSUs are granted to certain employees and vest only after the achievement of pre-determined performance metrics. Once the performance metrics are met, vesting of PSUs is subject to continued service by the employee. At the end of each reporting period, the Company evaluates the probability that PSUs will be earned. The Company records stock-based compensation expense based on the probability that the performance metrics will be achieved over the vesting period.
Other Comprehensive Income (Loss), Net of Tax
Other comprehensive income (loss), net of tax refers to revenue, expenses, gains and losses that are recorded as an element of stockholders’ equity but are excluded from net income. The Company’s other comprehensive income (loss), net of tax is comprised of unrealized gains and losses on foreign exchange contracts designated as cash flow hedges, foreign currency translation gains and actuarial losses related to pensions.
73
WESTERN DIGITAL CORPORATION
NOTES TO CONSOLIDATED FINANCIAL STATEMENTS — (Continued)
The following table illustrates the changes in the balances of each component of accumulated comprehensive income (loss) for
2016
and
2015
:
|
Actuarial Pension Gains (Losses)
|
Foreign Currency Translation Gains (Losses)
|
Unrealized Gains (Losses) on Foreign Exchange Contracts
|
Total Accumulated Other Comprehensive Income (Loss)
|
||||||||||||
|
(in millions)
|
|||||||||||||||
|
Balance at June 27, 2014
|
$
|
7
|
|
$
|
—
|
|
$
|
5
|
|
$
|
12
|
|
|||
|
Other comprehensive income before reclassifications
|
—
|
|
—
|
|
(74
|
)
|
(74
|
)
|
|||||||
|
Amounts reclassified from accumulated other comprehensive income
|
(2
|
)
|
—
|
|
44
|
|
42
|
|
|||||||
|
Net current-period other comprehensive loss
|
(2
|
)
|
—
|
|
(30
|
)
|
(32
|
)
|
|||||||
|
Balance at July 3, 2015
|
5
|
|
—
|
|
(25
|
)
|
(20
|
)
|
|||||||
|
Other comprehensive income before reclassifications
|
(73
|
)
|
74
|
|
48
|
|
49
|
|
|||||||
|
Amounts reclassified from accumulated other comprehensive income
|
—
|
|
—
|
|
51
|
|
51
|
|
|||||||
|
Income tax benefit related to items of other comprehensive income (loss)
|
23
|
|
—
|
|
—
|
|
23
|
|
|||||||
|
Net current-period other comprehensive income (loss)
|
(50
|
)
|
74
|
|
99
|
|
123
|
|
|||||||
|
Balance at July 1, 2016
|
$
|
(45
|
)
|
$
|
74
|
|
$
|
74
|
|
$
|
103
|
|
|||
The following table illustrates the significant amounts reclassified out of each component of accumulated comprehensive income (loss) for
2016
,
2015
and
2014
:
|
AOCI Component
|
2016
|
2015
|
2014
|
Line Item
|
||||||||||
|
(in millions)
|
||||||||||||||
|
Unrealized holding gain (loss) on cash flow hedging activities:
|
||||||||||||||
|
Foreign exchange contracts
|
$
|
(17
|
)
|
$
|
(44
|
)
|
$
|
(38
|
)
|
Cost of revenue
|
||||
|
Foreign exchange contracts
|
(34
|
)
|
—
|
|
—
|
|
Research and development
|
|||||||
|
Unrealized holding loss on cash flow hedging activities
|
(51
|
)
|
(44
|
)
|
(38
|
)
|
||||||||
|
Total reclassifications for the period
|
$
|
(51
|
)
|
$
|
(44
|
)
|
$
|
(38
|
)
|
|||||
Foreign Exchange Contracts
Although the majority of the Company’s transactions are in U.S. dollars, some transactions are based in various foreign currencies. The Company purchases foreign exchange contracts to hedge the impact of foreign currency exchange fluctuations on certain underlying assets, liabilities and commitments for operating expenses and product costs denominated in foreign currencies. The purpose of entering into these hedging transactions is to minimize the impact of foreign currency fluctuations on the Company’s results of operations. These contract maturity dates do not exceed
12 months
. All foreign exchange contracts are for risk management purposes only. The Company does not purchase foreign exchange contracts for speculative or trading purposes. The Company had foreign exchange contracts with commercial banks for British Pound Sterling, European Euro, Japanese Yen, Malaysian Ringgit, Philippine Peso, Singapore Dollar and Thai Baht, which were designated as either cash flow or fair value hedges and had an aggregate notional amount of
$3.1 billion
and
$1.3 billion
at
July 1, 2016
and
July 3, 2015
, respectively.
74
WESTERN DIGITAL CORPORATION
NOTES TO CONSOLIDATED FINANCIAL STATEMENTS — (Continued)
If the derivative is designated as a cash flow hedge, the effective portion of the change in fair value of the derivative is initially deferred in other comprehensive income (loss), net of tax. These amounts are subsequently recognized into earnings when the underlying cash flow being hedged is recognized into earnings. Recognized gains and losses on foreign exchange contracts are reported in cost of revenue and R&D and presented within cash flows from operating activities. Hedge effectiveness is measured by comparing the hedging instrument’s cumulative change in fair value from inception to maturity to the underlying exposure’s terminal value. The Company determined the ineffectiveness associated with its cash flow hedges to be immaterial to the consolidated financial statements for all years presented.
A change in the fair value of fair value hedges is recognized in earnings in the period incurred and is reported in cost of revenue or operating expenses, depending on the nature of the underlying hedged item. All fair value hedges, if any, were determined to be effective as of
July 1, 2016
and
July 3, 2015
. See Notes 11 and 13 to the consolidated financial statements for additional disclosures related to the Company’s foreign exchange contracts.
Pensions and Other Post-Retirement Benefit Plans
The Company has defined benefit pension plans and other post-retirement plans covering certain employees in various countries. The benefits are based on the employees’ years of service and compensation. The plans are funded in conformity with the funding requirements of applicable government authorities. The Company amortizes unrecognized actuarial gains and losses and prior service costs on a straight-line basis over the remaining estimated average service life of the participants. The measurement date for the plans is the Company’s fiscal year-end. The Company recognizes the funded status of its defined benefit pension and postretirement plans in the consolidated balance sheets, with changes in the funded status recognized through accumulated other comprehensive income (loss) in the year in which such changes occur. See Note 15 to the consolidated financial statements for additional disclosures related to the Company’s pensions and other post-retirement benefit plans.
Use of Estimates
Company management has made estimates and assumptions relating to the reporting of certain assets and liabilities in conformity with U.S. GAAP. These estimates and assumptions have been applied using methodologies that are consistent throughout the periods presented. However, actual results could differ materially from these estimates.
Recent Accounting Pronouncements
Recently Adopted
In September 2015, the Financial Accounting Standards Board (“FASB”) issued Accounting Standards Update (“ASU”) No. 2015-16, “Business Combinations (Topic 805): Simplifying the Accounting for Measurement-Period Adjustments” (“ASU 2015-16”), which eliminates the requirement for an acquirer in a business combination to account for measurement-period adjustments retrospectively. Acquirers must recognize measurement-period adjustments during the period of resolution, including the effect on earnings of any amounts they would have recorded in previous periods if the accounting had been completed at the acquisition date. The Company early adopted ASU 2015-16 during the fourth quarter of fiscal 2016 on a prospective basis. The Company adopted this standard in the fourth quarter of 2016 on a prospective basis. No adjustments were made to prior-period consolidated financial statements.
In November 2015, the FASB issued ASU No. 2015-17, “Income Taxes (Topic 740): Balance Sheet Classification of Deferred Taxes” (“ASU 2015-17”), which requires that deferred tax liabilities and assets for each tax-paying jurisdiction within each tax-paying component to be classified as noncurrent in a classified statement of financial position. The Company early adopted ASU 2015-17 during the second quarter of fiscal 2016 on a prospective basis, which resulted in the reclassification of
$165 million
of net deferred tax assets as of January 1, 2016 from current assets to noncurrent assets. Since the Company adopted this standard on a prospective basis, no adjustments were made to prior-period balance sheets.
In April 2015, the FASB issued ASU No. 2015-03, “Interest — Imputation of Interest (Subtopic 835-30): Simplifying the Presentation of Debt Issuance Costs” (“ASU 2015-03”). The new standard requires debt issuance costs related to a recognized debt liability to be presented in the balance sheet as a direct deduction from the carrying amount of that debt liability, consistent with debt discounts. The new standard is effective for fiscal years and interim periods within those fiscal years, beginning after December 15, 2015, which for the Company is the first quarter of fiscal 2017. The Company early adopted ASU 2015-03 during the fourth quarter of fiscal 2016 on a retrospective basis, which resulted in a reduction of
$4 million
in other current assets and the current portion of long-term debt, and a reduction of
$7 million
in other non-current assets and long-term debt within the consolidated balance sheet as of
July 3, 2015
.
75
WESTERN DIGITAL CORPORATION
NOTES TO CONSOLIDATED FINANCIAL STATEMENTS — (Continued)
Recently Issued
In March 2016, the FASB issued ASU No. 2016-09, “Compensation — Stock Compensation (Topic 718): Improvements to Employee Share-Based Payment Accounting” (“ASU 2016-09”). The new standard simplifies several aspects of the accounting for share-based payment transactions and states that, among other things, all excess tax benefits and tax deficiencies should be recognized as income tax expense or benefit in the income statement and an entity can make an entity-wide accounting policy election to either estimate the number of awards that are expected to vest or account for forfeitures when they occur. The new standard is effective for fiscal years beginning after December 15, 2016, and interim periods within these periods, which for the Company is the first quarter of fiscal 2018. The Company is currently evaluating the impact ASU 2016-09 will have on its consolidated financial statements and related disclosures.
In February 2016, the FASB issued ASU No. 2016-02, “Leases (Topic 842)” (“ASU 2016-02”). The new standard, among other things, requires lessees to recognize a right-of-use asset and a lease liability for leases. The new standard is effective for fiscal years beginning after December 15, 2018, which for the Company is the first quarter of fiscal 2020. The Company is currently evaluating the impact ASU 2016-02 will have on its consolidated financial statements and related disclosures.
In April 2015, the FASB issued ASU No. 2015-05, “Intangibles — Goodwill and Other — Internal-Use Software (Subtopic 350-40)” (“ASU 2015-05”), which provides guidance to customers about whether a cloud computing arrangement includes a software license. If a cloud computing arrangement includes a software license, the customer should account for the software license element of the arrangement consistent with the acquisition of other software licenses. If a cloud computing arrangement does not include a software license, the customer should account for the arrangement as a service contract. The standard is effective for fiscal years beginning after December 15, 2015, including interim periods within those fiscal years, which for the Company is the first quarter of fiscal 2017. The Company is currently evaluating the impact ASU 2015-05 will have on its consolidated financial statements and related disclosures.
In May 2014, the FASB issued ASU 2014-09, “Revenue from Contracts with Customers” (“ASU 2014-09”), which amends the guidance in former Accounting Standards Codification Topic 605, “Revenue Recognition,” to provide a single, comprehensive revenue recognition model for all contracts with customers. The new standard requires an entity to recognize revenue in a manner that depicts the transfer of promised goods or services to customers in amounts that reflect the consideration to which an entity expects to be entitled in exchange for those goods or services. The new standard also requires entities to enhance disclosures about the nature, amount, timing and uncertainty of revenue and cash flows arising from contracts with customers. The proposed standard may accelerate the timing of revenue recognition for the Company’s license and royalty contracts. In August 2015, the FASB issued ASU 2015-14, which deferred the effective date of this ASU by one year. The new standard allows for either a full retrospective or a modified retrospective transition method and is effective for fiscal years and interim periods within those years beginning after December 15, 2017, which for the Company is the first quarter of fiscal 2019. The Company has not yet selected a transition method and is currently expecting to adopt this standard in the first quarter of fiscal 2019.
76
WESTERN DIGITAL CORPORATION
NOTES TO CONSOLIDATED FINANCIAL STATEMENTS — (Continued)
|
July 1,
2016 |
July 3,
2015 |
||||||
|
|
(in millions)
|
||||||
|
Inventories:
|
|||||||
|
Raw materials and component parts
|
$
|
569
|
|
$
|
168
|
|
|
|
Work-in-process
|
589
|
|
500
|
|
|||
|
Finished goods
|
971
|
|
700
|
|
|||
|
Total inventories
|
$
|
2,129
|
|
$
|
1,368
|
|
|
|
July 1,
2016 |
July 3,
2015 |
||||||
|
|
(in millions)
|
||||||
|
Property, plant and equipment:
|
|||||||
|
Land and buildings
|
$
|
1,900
|
|
$
|
1,441
|
|
|
|
Machinery and equipment
|
7,070
|
|
6,520
|
|
|||
|
Furniture and fixtures
|
110
|
|
71
|
|
|||
|
Leasehold improvements
|
307
|
|
276
|
|
|||
|
Construction-in-process
|
245
|
|
296
|
|
|||
|
Total property, plant and equipment
|
9,632
|
|
8,604
|
|
|||
|
Accumulated depreciation
|
(6,129
|
)
|
(5,639
|
)
|
|||
|
Property, plant and equipment, net
|
$
|
3,503
|
|
$
|
2,965
|
|
|
Depreciation expense of property, plant and equipment totaled
$888 million
,
$809 million
and
$914 million
in
2016
,
2015
and
2014
, respectively.
77
WESTERN DIGITAL CORPORATION
NOTES TO CONSOLIDATED FINANCIAL STATEMENTS — (Continued)
Debt consisted of the following as of
July 1, 2016
and
July 3, 2015
:
|
July 1,
2016 |
July 3,
2015 |
||||||
|
(in millions)
|
|||||||
|
Variable interest rate term loan maturing 2019
|
$
|
—
|
|
$
|
2,312
|
|
|
|
Variable interest rate term loan maturing 2021 (Term Loan A)
|
4,125
|
|
—
|
|
|||
|
Variable interest rate USD term loan maturing 2023 (U.S. Term Loan B)
|
3,750
|
|
—
|
|
|||
|
Variable interest rate Euro term loan maturing 2023 (Euro Term Loan B)
(1)
|
987
|
|
—
|
|
|||
|
7.375% senior secured notes due 2023
|
1,875
|
|
—
|
|
|||
|
10.500% senior unsecured notes due 2024
|
3,350
|
|
—
|
|
|||
|
Convertible senior notes
|
439
|
|
—
|
|
|||
|
Bridge loans
|
3,000
|
|
—
|
|
|||
|
Total debt
|
17,526
|
|
2,312
|
|
|||
|
Issuance costs and debt discounts
|
(532
|
)
|
(11
|
)
|
|||
|
Subtotal
|
16,994
|
|
2,301
|
|
|||
|
Less bridge loans and current portion of long-term debt
|
(3,334
|
)
|
(152
|
)
|
|||
|
Long-term debt
|
$
|
13,660
|
|
$
|
2,149
|
|
|
|
(1)
|
Euro Term Loan B principal amount was based upon the Euro exchange rate as of July 1, 2016.
|
In connection with the merger (the “Merger”) with SanDisk Corporation (“SanDisk”), the Company entered into new debt facilities. The proceeds from the new debt facilities were used to, among other things, (i) finance, in part, the cash portion of the purchase price, (ii) refinance certain existing indebtedness of Western Digital and SanDisk, and (iii) pay certain transaction costs.
Notes
On April 13, 2016, the Company completed an offering consisting of
$1.875 billion
7.375%
senior secured notes due 2023 (the “Secured Notes”) and
$3.350 billion
10.500%
senior unsecured notes due 2024 (the “Unsecured Notes” and, together with the Secured Notes, the “Notes”). The Company is not required to make principal payments on the Notes prior to their respective maturity dates, except that it may be required to offer to purchase the Notes upon the occurrence of a change of control or with the proceeds of certain non-ordinary course asset sales. Interest payments on the Notes are due semi-annually in arrears. The obligations under the Notes are guaranteed by certain of the Company’s existing and subsequently acquired or organized wholly-owned, material domestic subsidiaries.
The Secured Notes were funded on May 12, 2016, and the Company received net cash proceeds of
$1.826 billion
. The Company pays cash interest on the Secured Notes quarterly at an annual rate of
7.375%
. The Secured Notes mature in
April 2023
. The Secured Notes issuance cost was
$49 million
, which is amortized to interest expense over the term of the Secured Notes. The Secured Notes are collateralized on an equal and ratable basis by liens on the same assets that secure indebtedness under the New Credit Agreement (as defined below).
The Unsecured Notes were funded on May 12, 2016, and the Company received net cash proceeds of
$3.226 billion
. The Company pays cash interest on the Unsecured Notes quarterly at an annual rate of
10.500%
. The Unsecured Notes mature in
April 2024
. The Unsecured Notes issuance cost was
$124 million
, which is amortized to interest expense over the term of the Secured Notes.
New Credit Agreement
On April 29, 2016, the Company entered into a new credit agreement (the “New Credit Agreement”) with JPMorgan Chase Bank, N.A., as administrative agent and collateral agent (the “Administrative Agent”), and the lenders party thereto, which provides for variable interest rate secured loans consisting of a
$4.125 billion
term loan (the “Term Loan A”), a term loan (the “Term Loan B”) composed of a
$3.750 billion
U.S. dollar tranche (the “U.S. Term Loan B”) and a
€885 million
Euro tranche (the “Euro Term Loan B”), and a
$1.000 billion
revolving credit facility (the “Revolving Credit Facility”). The Revolving Credit Facility includes a
$200 million
sublimit for letters of credit.
78
WESTERN DIGITAL CORPORATION
NOTES TO CONSOLIDATED FINANCIAL STATEMENTS — (Continued)
The Term Loan A was funded on May 12, 2016, and the Company received net cash proceeds of
$4.059 billion
. The Company pays monthly cash interest on the Term Loan A at a rate based on LIBOR, plus the applicable spread of
2.00%
(approximately
2.450%
at July 1, 2016). Term Loan A issuance costs were
$66 million
, which are amortized to interest expense over the term of the loan.
The U.S. Term Loan B tranche was funded on April 29, 2016, and the Company received net cash proceeds of
$3.541 billion
. The Company pays monthly cash interest on the U.S. Term Loan B tranche at a rate based on LIBOR, subject to a
0.750%
floor, plus the applicable spread of
5.500%
(
6.250%
at
July 1, 2016
). The U.S. Term Loan B tranche issuance costs were
$209 million
, which are amortized to interest expense over the term of the loan. On August 17, 2016, the Company settled the U.S. Term Loan B tranche with proceeds of a new U.S. dollar-denominated Term Loan B-1 and a voluntary cash prepayment. For additional information, see Note 19 to the consolidated financial statements.
The Euro Term Loan B tranche was funded on April 29, 2016, and the Company received net cash proceeds of
$980 million
, based on the Euro exchange rate. The Company pays monthly cash interest on the Euro Term Loan B tranche at a rate based on EURIBOR, subject to a
0.750%
floor, plus the applicable spread of
5.250%
(
6.000%
at
July 1, 2016
). The Euro Term Loan B tranche issuance costs were
$28 million
, which are amortized to interest expense over the term of the loan.
The Revolving Credit Facility was not drawn upon, and there was no outstanding balance as of July 1, 2016.
Term Loan A and the Revolving Credit Facility have a
five
-year term. Beginning in September 2017, the Company is required to make quarterly principal payments on Term Loan A totaling
$206 million
in fiscal 2018,
$309 million
in fiscal 2019,
$413 million
in fiscal 2020 and the remaining balance of
$3.197 billion
due in fiscal 2021. Term Loan B has a
seven
-year term. Beginning in September 2016, the Company is required to make quarterly principal payments on Term Loan B equal to
0.25%
of the original principal amount thereof, with the remaining balance due in fiscal 2023.
The obligations under the New Credit Agreement are secured on a first-priority basis by a lien on substantially all the assets and properties of (i) the Company and (ii) HGST, Inc., WD Media, LLC, Western Digital (Fremont), LLC and Western Digital Technologies, Inc. (“WDT”) (together referred to as the “WD Guarantors”), including all of the capital stock held by these entities (subject to a
65%
limitation on pledges of capital stock of foreign subsidiaries and domestic holding companies of foreign subsidiaries), subject to certain exceptions.
The obligations under the New Credit Agreement are guaranteed by the WD Guarantors. The term loans and the revolving credit loans may be prepaid in whole or in part at any time without premium or penalty, subject to certain conditions, except that Term Loan B requires the Company to pay a
1.0%
prepayment fee if the loans thereunder are repaid in connection with certain “repricing” transactions on or before the one-year anniversary of the effective date.
Covenants
The Notes and the loans under the New Credit Agreement require the Company to comply with certain financial covenants, such as a leverage ratio, an interest coverage ratio and customary covenants that limit or restrict the Company’s and its subsidiaries’ ability to incur liens and indebtedness; make certain restricted payments, acquisitions, investments, loans and guarantees; and enter into certain transactions with affiliates, mergers and consolidations. As of July 1, 2016, the Company was in compliance with all of the financial covenants.
Additional Bridge Facility
On May 12, 2016, WDT entered into a
45
-day senior secured bridge credit agreement (the “Additional Bridge Credit Agreement”) among JPMorgan Chase Bank, N.A., as administrative agent and collateral agent, the lenders from time to time party thereto and Western Digital providing for
$3.0 billion
in aggregate principal amount of senior secured bridge loans (the “Additional Bridge Facility”). On June 9, 2016, this agreement was amended to extend the maturity to
75
days.
The Additional Bridge Facility was funded on May 12, 2016, and the Company received net cash proceeds of
$2.972 billion
. The bridge loan interest rate was
2.450%
. The Additional Bridge Facility issuance costs were
$28 million
and are amortized to interest expense over the term of the bridge facility. On July 21, 2016, the Company paid in full the
$3.0 billion
aggregate principal amount of the bridge loan outstanding together with accrued interest.
79
WESTERN DIGITAL CORPORATION
NOTES TO CONSOLIDATED FINANCIAL STATEMENTS — (Continued)
Termination of Existing Credit Agreement
On May 12, 2016, pursuant to the terms of the New Credit Agreement, Western Digital Technologies, Inc., Western Digital Ireland, Ltd. and Western Digital International Ltd. (collectively, the “Existing Borrowers”) extinguished all outstanding loans, together with accrued interest and related fees, of
$2.2 billion
and terminated all commitments under the credit agreement dated as of January 9, 2014, as amended, among the Company, the Existing Borrowers, the lenders party thereto and JPMorgan Chase Bank, N.A., as administrative agent. Upon extinguishment of the outstanding loans, the Company recorded a loss of
$11 million
, which related to the write-off of previously capitalized debt issuance costs.
Assumed SanDisk Convertible Notes, Call Options and Warrants
On May 12, 2016, the closing date of the Merger (the “SanDisk Closing Date”), SanDisk had outstanding
$997 million
aggregate principal amount of its
1.5%
Convertible Senior Notes due 2017 (the “2017 Notes”) and
$1.5 billion
aggregate principal amount of its
0.5%
Convertible Senior Notes due 2020 (the “2020 Notes” and, together with the 2017 Notes, the “SanDisk Notes”). The 2017 Notes mature on August 15, 2017 and the 2020 Notes mature on October 15, 2020.
The Merger constituted a fundamental change under each indenture governing the SanDisk Notes. As a result, the conversion rate for each $1,000 of principal amount of SanDisk Notes surrendered for conversion from March 8, 2016 to June 9, 2016 was increased temporarily to
20.8004
units of reference property in the case of the 2017 Notes and
13.7726
units of reference property in the case of the 2020 Notes. Each reference unit is comprised of
0.2387
shares of Western Digital common stock and
$67.50
in cash.
The SanDisk Notes were bifurcated into a debt host and exchange option for accounting purposes. The exchange option is accounted for as a derivative liability because it is predominantly settled in cash. Changes in the fair value of the exchange option are reported in the consolidated statements of income in other income (expense), net until the Company extinguishes the related debt. The initial fair value of the exchange option reduced the carrying value of the SanDisk Notes (effectively an original issuance discount). This discount is amortized using the effective interest rate method through the recognition of non-cash interest expense over the remaining term of the debt. This has resulted in the recognition of interest expense on the 2017 Notes and the 2020 Notes at an effective rate of
5.0%
and
5.5%
, respectively. As of
July 1, 2016
, the 2017 Notes and the 2020 Notes have a remaining unamortized discount of
$5 million
and
$59 million
, respectively.
The exchange option is measured and reported at fair value on a recurring basis, within Level 3 of the fair value hierarchy. The fair value of the unredeemed and unsettled exchange option was reported in current portion of long-term debt and long-term debt in the consolidated balance sheets. See Note 11 to the consolidated financial statements for additional disclosures related to the fair values of the exchange option. For the quarter ended
July 1, 2016
, the change in the fair value of the exchange option related to the 2017 Notes and 2020 Notes resulted in a
loss
of
$8 million
and a
gain
of
$6 million
, respectively.
During the quarter ended
July 1, 2016
, the Company paid to the holders of the SanDisk Notes for conversion and repurchase
$2.611 billion
cash and
1.959 million
shares of Western Digital common stock with an aggregate value of
$94 million
. After taking into account the exchanges and repurchases settled prior to
July 1, 2016
,
$129 million
principal amount of the 2017 Notes and
$310 million
principal amount of the 2020 Notes were outstanding. After taking into account the exchanges and repurchases settled after
July 1, 2016
and the principal amount of
$25 million
of 2020 Notes repurchased by the Company, as of
August 26, 2016
,
$37 million
principal amount of the 2020 Notes and an immaterial principal amount of the 2017 Notes were outstanding. For the remaining outstanding 2020 Notes, the conversion rate is
10.9006
units of reference property, corresponding to
2.6020
shares of Western Digital common stock and
$735.79
, per
$1,000
principal amount of the 2020 Notes, subject to adjustments under the applicable indenture. The 2020 Notes are not currently exchangeable into reference property.
Concurrently with the assumption of the SanDisk Notes, the Company assumed the outstanding call options and the warrants that were entered into by SanDisk at the inception of the respective SanDisk Notes, which were structured to reduce the potential economic dilution associated with the conversion of SanDisk Notes. SanDisk negotiated the termination of the warrants prior to the closing of the Merger and recorded a liability on the SanDisk Closing Date of
$613 million
. This amount was subsequently paid in the quarter ended
July 1, 2016
.
The SanDisk call options are derivative instruments classified as an asset that result in the Company receiving cash and shares partially offsetting amounts payable upon exchange of the SanDisk Notes. During the quarter ended
July 1, 2016
, under the SanDisk call options, the Company received
$409 million
of cash and
1.4 million
shares of Western Digital common stock which had an aggregate value of
$70 million
. During the quarter ended
July 1, 2016
, the Company recognized a non-cash
gain
of
$7 million
related to the change in value in the SanDisk call options, recorded in other income (expense), net in the consolidated statements of income. The value of the SanDisk call options at
July 1, 2016
was
$71 million
.
80
WESTERN DIGITAL CORPORATION
NOTES TO CONSOLIDATED FINANCIAL STATEMENTS — (Continued)
The exchange and repurchase of the 2017 Notes and related settlement of the debt instruments during the quarter ended
July 1, 2016
resulted in a loss of
$14 million
. The exchange and repurchase of the 2020 Notes and related settlement of the debt instruments during the quarter ended
July 1, 2016
resulted in a loss of
$42 million
.
Debt maturities
As of
July 1, 2016
, annual debt maturities were as follows:
|
Fiscal Years
|
Debt Maturities
|
|||
|
(in millions)
|
||||
|
2017
|
$
|
3,424
|
|
|
|
2018
|
254
|
|
||
|
2019
|
357
|
|
||
|
2020
|
460
|
|
||
|
2021
|
3,306
|
|
||
|
Thereafter
|
9,725
|
|
||
|
Total
|
17,526
|
|
||
|
Issuance costs and debt discounts
|
(532
|
)
|
||
|
Net carrying value
|
$
|
16,994
|
|
|
81
WESTERN DIGITAL CORPORATION
NOTES TO CONSOLIDATED FINANCIAL STATEMENTS — (Continued)
Lease Commitments
The Company leases certain facilities and equipment under long-term, non-cancelable operating leases. The Company’s operating leases consist of leased property and equipment that expire at
various dates through 2025
. Rental expense under these operating leases, including month-to-month rentals, was
$59 million
,
$60 million
and
$59 million
in
2016
,
2015
and
2014
, respectively. Future minimum lease payments under operating leases that have initial or remaining non-cancelable lease terms in excess of one year at
July 1, 2016
are as follows:
|
Fiscal Years
|
Lease Amounts
|
|||
|
(in millions)
|
||||
|
2017
|
$
|
95
|
|
|
|
2018
|
79
|
|
||
|
2019
|
69
|
|
||
|
2020
|
27
|
|
||
|
2021
|
22
|
|
||
|
Thereafter
|
37
|
|
||
|
Future minimum payments
|
$
|
329
|
|
|
Product Warranty Liability
Changes in the warranty accrual for
2016
,
2015
and
2014
were as follows:
|
2016
|
2015
|
2014
|
|||||||||
|
(in millions)
|
|||||||||||
|
Warranty accrual, beginning of period
|
$
|
221
|
|
$
|
182
|
|
$
|
187
|
|
||
|
Warranty liabilities assumed as a result of acquisitions
|
45
|
|
1
|
|
4
|
|
|||||
|
Charges to operations
|
162
|
|
187
|
|
170
|
|
|||||
|
Utilization
|
(178
|
)
|
(190
|
)
|
(207
|
)
|
|||||
|
Changes in estimate related to pre-existing warranties
|
29
|
|
41
|
|
28
|
|
|||||
|
Warranty accrual, end of period
|
$
|
279
|
|
$
|
221
|
|
$
|
182
|
|
||
The long-term portion of the warranty accrual classified in other liabilities was
$107 million
at
July 1, 2016
and
$71 million
at
July 3, 2015
.
Flash Ventures
The Company’s business ventures with Toshiba Corporation (“Toshiba”) consist of three separate legal entities: Flash Partners Ltd. (“Flash Partners”), Flash Alliance Ltd. (“Flash Alliance”) and Flash Forward Ltd (“Flash Forward” and together with Flash Partners and Flash Alliance, “Flash Ventures”). The Company has a
49.9%
ownership interest and Toshiba has a
50.1%
ownership interest in each of these entities. Through these ventures, the Company and Toshiba collaborate in the development and manufacture of NAND flash memory products, which are manufactured by Toshiba at its wafer fabrication facilities located in Yokkaichi, Japan, using semiconductor manufacturing equipment individually owned or leased by each Flash Ventures entity. The entities within Flash Ventures purchase wafers from Toshiba at cost and then resell those wafers to the Company and Toshiba at cost plus a markup. The Company accounts for its ownership position in each Flash Ventures entity under the equity method of accounting. The Company is committed to purchase its provided three-month forecast of Flash Ventures’ NAND wafer supply, which generally equals
50%
of Flash Ventures’ output. The Company is not able to estimate its total wafer purchase commitment obligation beyond its rolling three-month purchase commitment because the price is determined by reference to the future cost of producing the semiconductor wafers. In addition, the Company is committed to fund
49.9%
to
50.0%
of each Flash Ventures entity’s investments to the extent that each Flash Ventures entity’s operating cash flow is insufficient to fund these investments.
Flash Partners.
Flash Partners was formed in 2004. NAND flash memory products provided to the Company by this venture are manufactured by Toshiba primarily at its 300-millimeter wafer fabrication facility (“Fab 3”) located in Yokkaichi, Japan.
82
WESTERN DIGITAL CORPORATION
NOTES TO CONSOLIDATED FINANCIAL STATEMENTS — (Continued)
Flash Alliance.
Flash Alliance was formed in 2006. NAND flash memory products provided to the Company by this venture are manufactured by Toshiba primarily at its 300-millimeter wafer fabrication facility (“Fab 4”) located in Yokkaichi, Japan.
Flash Forward.
Flash Forward was formed in 2010. NAND flash memory products provided to the Company by this venture are manufactured by Toshiba primarily at its 300-millimeter wafer fabrication facility (“Fab 5”) located in Yokkaichi, Japan. Fab 5 was built in two phases of approximately equal size.
New Fab 2.
The Company has a facility agreement with Toshiba related to the construction and operation of Toshiba’s “New Fab 2” 300-millimeter wafer fabrication facility located in Yokkaichi, Japan. New Fab 2 is primarily intended to provide additional cleanroom space to convert a portion of 2D NAND capacity to 3D NAND. Production wafers in New Fab 2 started in January 2016.
The following table presents, as of
July 1, 2016
, the notes receivable from and equity investments in Flash Ventures assumed in connection with the Merger:
|
July 1,
2016 |
|||
|
(in millions)
|
|||
|
Notes receivable, Flash Partners
|
$
|
65
|
|
|
Notes receivable, Flash Alliance
|
235
|
|
|
|
Notes receivable, Flash Forward
|
263
|
|
|
|
Investment in Flash Partners
|
202
|
|
|
|
Investment in Flash Alliance
|
306
|
|
|
|
Investment in Flash Forward
|
100
|
|
|
|
Total notes receivable and investments in Flash Ventures
|
$
|
1,171
|
|
The Company makes, or will make, loans to Flash Ventures to fund equipment investments for new process technologies and additional wafer capacity. The Company aggregates its Flash Ventures’ notes receivable into one class of financing receivables due to the similar ownership interest and common structure in each Flash Venture entity. For all reporting periods presented, no loans were past due and no loan impairments were recorded. The Company’s notes receivable from each Flash Ventures entity, denominated in Japanese yen, are secured by equipment owned by that Flash Ventures entity.
The Company assesses financing receivable credit quality through financial and operational reviews of the borrower and creditworthiness, including credit rating agency ratings, of significant investors of the borrower, where material or known. Impairments, when required for credit worthiness, are recorded in other income (expense).
Inventory Purchase Commitments with Flash Ventures.
Purchase orders placed under Flash Ventures for up to three months are binding and cannot be canceled.
Research and Development Activities.
The Company participates in common R&D activities with Toshiba and is contractually committed to a minimum funding level. R&D commitments are immaterial to the consolidated financial statements.
Off-Balance Sheet Liabilities
Flash Ventures sells and leases back from a consortium of financial institutions (“lessors”) a portion of its tools and has entered into equipment lease agreements of which the Company guarantees half of the total outstanding obligations. The lease agreements contain customary covenants for Japanese lease facilities. In addition to containing customary events of default related to Flash Ventures that could result in an acceleration of Flash Ventures’ obligations, the lease agreements contain acceleration clauses for certain events of default related to the guarantors, including the Company.
The following table presents the Company’s portion of the remaining guarantee obligations under the Flash Ventures’ lease facilities in both Japanese yen and U.S. dollar-equivalent based upon the exchange rate at
July 1, 2016
:
|
Lease Amounts
|
||||||||
|
(Japanese yen, in billions)
|
(U.S. dollar, in millions)
|
|||||||
|
Total guarantee obligations
|
¥
|
118.0
|
|
$
|
1,151
|
|
||
83
WESTERN DIGITAL CORPORATION
NOTES TO CONSOLIDATED FINANCIAL STATEMENTS — (Continued)
The following table details the breakdown of the Company’s remaining guarantee obligations between the principal amortization and the purchase option exercise price at the end of the term of the lease agreements, in annual installments as of
July 1, 2016
in U.S. dollars based upon the Japanese yen to U.S. dollar exchange rate at
July 1, 2016
:
|
Annual Installments
|
Payment of Principal Amortization
|
Purchase Option Exercise Price at Final Lease Terms
|
Guarantee Amount
|
|||||||||
|
(in millions)
|
||||||||||||
|
Year 1
|
$
|
287
|
|
$
|
61
|
|
$
|
348
|
|
|||
|
Year 2
|
225
|
|
19
|
|
244
|
|
||||||
|
Year 3
|
186
|
|
48
|
|
234
|
|
||||||
|
Year 4
|
120
|
|
57
|
|
177
|
|
||||||
|
Year 5
|
43
|
|
105
|
|
148
|
|
||||||
|
Total guarantee obligations
|
$
|
861
|
|
$
|
290
|
|
$
|
1,151
|
|
|||
The Company and Toshiba have agreed to mutually contribute to, and indemnify each other and Flash Ventures for, environmental remediation costs or liability resulting from Flash Ventures’ manufacturing operations in certain circumstances. The Company has not made any indemnification payments, nor recorded any indemnification receivables, under any such agreements. As of July 1, 2016, no amounts have been accrued in the consolidated financial statements with respect to these indemnification guarantees.
Purchase Agreements
The Company has entered into long-term purchase agreements with various component suppliers. The commitments depend on specific products ordered and may be subject to minimum quality requirements and future price negotiations. The Company expects these commitments to total
$15 million
for
2017
,
$7 million
for
2018
,
$1 million
for
2019
and
no
remaining commitments for
2020
.
The Company also has contracts with its other sources of silicon wafers that generally require the Company to provide monthly purchase order commitments. The purchase orders placed under these arrangements are generally binding and cannot be canceled. In addition, the Company’s subcontractors periodically procure production materials based on the forecast the Company provides to them. The Company’s agreements with these subcontractors require that the Company reimburse them for materials that are purchased on the Company’s behalf in accordance with such forecast. Accordingly, the Company may be committed to certain costs over and above its open noncancelable purchase orders with these subcontractors.
84
WESTERN DIGITAL CORPORATION
NOTES TO CONSOLIDATED FINANCIAL STATEMENTS — (Continued)
The Company owns
49.9%
of each entity within Flash Ventures and accounts for its ownership position under the equity method of accounting. The Company’s obligations with respect to Flash Ventures’ master lease agreements, take-or-pay supply arrangements and R&D cost sharing are described in Note 4 to the consolidated financial statements. The financial and other support provided by the Company in all periods presented was either contractually required or the result of a joint decision to expand wafer capacity, transition to new technologies or refinance existing equipment lease commitments. Entities within Flash Ventures are VIEs. The Company evaluated whether it is the primary beneficiary of any of the entities within Flash Ventures for all periods presented and determined that it is not the primary beneficiary of any of the entities within Flash Ventures because it does not have a controlling financial interest in any of those entities. In determining whether the Company is the primary beneficiary, the Company analyzed the primary purpose and design of Flash Ventures, the activities that most significantly impact Flash Ventures’ economic performance, and whether the Company had the power to direct those activities. The Company concluded, based upon its
49.9%
ownership, the voting structure and the manner in which the day-to-day operations are conducted for each entity within Flash Ventures, that the Company lacked the power to direct most of the activities that most significantly impact the economic performance of each entity within Flash Ventures.
From the SanDisk Closing Date through the Company’s year-end, the Company purchased NAND flash memory wafers from Flash Ventures and made prepayments and loans to Flash Ventures totaling
$387 million
and received loan repayments from Flash Ventures of
$16 million
. At
July 1, 2016
, the Company had accounts payable balances due to Flash Ventures of
$168 million
.
The Company’s maximum reasonably estimable loss exposure (excluding lost profits), based upon the exchange rate at
July 1, 2016
, as a result of its involvement with Flash Ventures, is presented below. Flash Ventures’ investments are denominated in Japanese yen and the maximum possible loss exposure excludes any cumulative translation adjustment due to revaluation from the Japanese yen to the U.S. dollar.
|
July 1,
2016 |
|||
|
(in millions)
|
|||
|
Notes receivable
|
$
|
563
|
|
|
Equity investments
|
608
|
|
|
|
Operating lease guarantees
|
1,151
|
|
|
|
Prepayments
|
34
|
|
|
|
Maximum estimable loss exposure
|
$
|
2,356
|
|
As of
July 1, 2016
, the Company’s retained earnings included undistributed earnings of Flash Ventures of
$2 million
.
85
WESTERN DIGITAL CORPORATION
NOTES TO CONSOLIDATED FINANCIAL STATEMENTS — (Continued)
Unless otherwise stated below, for each of the matters described below, the Company has either recorded an accrual for losses that are probable and reasonably estimable or has determined that, while a loss is reasonably possible (including potential losses in excess of the amounts accrued by the Company), a reasonable estimate of the amount of loss or range of possible losses with respect to the claim or in excess of amounts already accrued by the Company cannot be made. The ability to predict the ultimate outcome of such matters involves judgments, estimates and inherent uncertainties. The actual outcome of such matters could differ materially from management’s estimates.
Solely for purposes of this note, “WD” refers to Western Digital Corporation or one or more of its subsidiaries excluding HGST prior to the closing of the Company’s acquisition of HGST on March 8, 2012 (the “HGST Closing Date”) and SanDisk prior to May 12, 2016 (the “SanDisk Closing Date”). HGST refers to Hitachi Global Storage Technologies Holdings Pte. Ltd. or one or more of its subsidiaries as of the HGST Closing Date, and SanDisk refers to SanDisk Corporation or one or more of its subsidiaries as of the SanDisk Closing Date and “the Company” refers to Western Digital Corporation and all of its subsidiaries on a consolidated basis including HGST and SanDisk.
Intellectual Property Litigation
In June 2008, Convolve, Inc. (“Convolve”) filed a complaint in the Eastern District of Texas against WD, HGST, and two other companies alleging infringement of U.S. Patent Nos. 6,314,473 and 4,916,635. The complaint sought unspecified monetary damages and injunctive relief. In October 2008, Convolve amended its complaint to allege infringement of only the ‘473 patent. The ‘473 patent allegedly relates to interface technology to select between certain modes of a disk drive’s operations relating to speed and noise. In July 2011, a verdict was rendered against WD and HGST in an amount that is not material to the Company’s financial position, results of operations or cash flows, for which the Company previously recorded an accrual. In March 2015, WD and HGST filed Notices of Appeal with the United States District Court for the Federal Circuit (“Federal Circuit”). In April 2015, Convolve filed a motion for reconsideration of the final judgment, and in May 2015, the Federal Circuit deactivated the appeal pending the Court’s decision on reconsideration. WD and HGST intend to continue to defend themselves vigorously in this matter.
In May 2016, Lambeth Magnetic Structures, LLC (“Lambeth”) filed a complaint in the Western District of Pennsylvania against WD and certain of its subsidiaries alleging infringement of U.S. Patent No. 7,128,988. The complaint seeks unspecified monetary damages and injunctive relief. The ’988 patent, entitled “Magnetic Material Structures, Devices and Methods,” allegedly relates to a magnetic material structure for hard disk drive devices. The Company intends to defend itself vigorously in this matter.
Antitrust
On June 25, 2010, Ritz Camera & Image, LLC (“Ritz”) filed a complaint captioned
Ritz Camera & Image, LLC v. SanDisk Corporation, Inc. and Eliyahou Harari
in the U.S. District Court for the Northern District of California, alleging that SanDisk violated federal antitrust laws by conspiring to monopolize and monopolizing the market for flash memory products. The lawsuit purports to be on behalf of direct purchasers of flash memory products sold by SanDisk and SanDisk-controlled joint ventures from June 25, 2006 through the present. The complaint alleged that SanDisk created and maintained a monopoly by fraudulently obtaining patents and using them to restrain competition and by allegedly converting other patents for its competitive use. The complaint sought damages, injunctive relief, and fees and costs. On February 24, 2011, the District Court granted in part SanDisk’s motion to dismiss, which resulted in Dr. Harari being dismissed as a defendant. Between 2013 and 2014, the District Court granted Ritz’s motion to substitute in as named plaintiff Albert Giuliano, the Chapter 7 Trustee of the Ritz bankruptcy estate, and the Trustee’s motions to add as named plaintiffs CPM Electronics Inc., E.S.E. Electronics, Inc. and Mflash, Inc. On May 14, 2015, the District Court granted in part plaintiffs’ motion for class certification. On April 29, 2016, the court granted SanDisk’s motion for summary judgment and entered judgment in SanDisk's favor as to all of the plaintiffs’ claims. On May 31, 2016, the plaintiffs filed a notice of appeal to the U.S. Court of Appeals for the Federal Circuit. The appeal is currently pending.
86
WESTERN DIGITAL CORPORATION
NOTES TO CONSOLIDATED FINANCIAL STATEMENTS — (Continued)
On July 15, 2010, Samsung Electronics Co., Ltd. (“Samsung”) filed an action against Panasonic and SD-3D LLC (“SD-3C”) in the U.S. District Court for the Northern District of California, alleging that defendants violated federal antitrust laws and California antitrust and unfair competition laws relating to the licensing practices and operations of SD-3C. The complaint seeks damages, restitution, injunctive and declaratory relief, and fees and costs. SanDisk is not a defendant in this case, but it established SD‑3C along with Panasonic and Toshiba, and the complaint includes various factual allegations concerning SanDisk. As a member of SD‑3C, SanDisk could be responsible for a portion of any monetary award. Other requested relief, if granted, could result in a loss of revenue to SanDisk. On August 25, 2011, the District Court granted the defendants’ motion to dismiss, dismissing Samsung’s patent misuse claim with prejudice and all other claims with leave to amend. Samsung filed an amended complaint on September 16, 2011. On January 3, 2012, the District Court granted the defendants’ motion to dismiss Samsung’s amended complaint without leave to amend. Samsung appealed. On April 4, 2014, the U.S. Court of Appeals for the Ninth Circuit reversed the District Court’s dismissal and remanded the case to the District Court for further proceedings. Samsung filed a third amended complaint on January 20, 2015. On September 30, 2015, the District Court granted in part the defendants’ motion to dismiss with leave to amend. On October 21, 2015, Samsung filed a fourth amended complaint. On November 4, 2015, the defendants filed a motion to dismiss, which is currently under submission. Discovery is presently stayed until after completion of the pleading stage.
On March 15, 2011, a complaint was filed against SanDisk, SD‑3C, Panasonic Corporation, Panasonic Corporation of North America, Toshiba and Toshiba America Electronic Components, Inc. in the U.S. District Court for the Northern District of California. The lawsuit purports to be on behalf of a nationwide class of indirect purchasers of Secure Digital (“SD”) cards. The complaint asserts claims under federal antitrust laws and California antitrust and unfair competition laws, as well as common law claims. The complaint seeks damages, restitution, injunctive relief, and fees and costs. The plaintiffs allege that the defendants conspired to artificially inflate the royalty costs associated with manufacturing SD™ cards, which in turn allegedly caused the plaintiffs to pay higher prices for SD cards. The allegations are similar to and incorporate allegations in
Samsung Electronics Co., Ltd. v. Panasonic Corp., et al.
, described above. On May 21, 2012, the District Court granted the defendants’ motion to dismiss the complaint with prejudice. The plaintiffs appealed. On May 14, 2014, the U.S. Court of Appeals for the Ninth Circuit reversed the District Court’s dismissal and remanded the case to the District Court for further proceedings. On February 3, 2015, the plaintiffs filed a second amended complaint in the District Court. On September 30, 2015, the District Court granted the defendants’ motion to dismiss with leave to amend. On November 4, 2015, the plaintiffs filed a third amended complaint. On November 25, 2015, the defendants filed a motion to dismiss, which is currently pending. Discovery is presently stayed until after completion of the pleading stage. The Company intends to defend itself vigorously in this matter.
Securities
Beginning on March 30, 2015, SanDisk and two officers, Sanjay Mehrotra and Judy Bruner, were named in three putative class action lawsuits filed in the United States District Court for the Northern District of. Two complaints are allegedly brought on behalf of a class of purchasers of SanDisk’s securities between October 16, 2014 and March 25, 2015, and one is brought on behalf of a purported class of purchasers of SanDisk’s securities between April 16, 2014 and April 15, 2015. The complaints generally allege violations of federal securities laws arising out of alleged misstatements or omissions by the defendants during the alleged class periods. The complaints seek, among other things, damages and fees and costs. On July 9, 2015, the Court consolidated the cases and appointed Union Asset Management Holding AG and KBC Asset Management NV as lead plaintiffs. The lead plaintiffs filed an amended complaint in August 2015. On January 22, 2016, the court granted the defendants’ motion to dismiss and dismissed the amended complaint with leave to amend. On February 22, 2016, the court issued an order appointing as new lead plaintiffs Bristol Pension Fund; City of Milford, Connecticut Pension & Retirement Board; Pavers and Road Builders Pension, Annuity and Welfare Funds; the Newport News Employees’ Retirement Fund; and Massachusetts Laborers’ Pension Fund (collectively, the “Institutional Investor Group”). On March 23, 2016, the Institutional Investor Group filed an amended complaint. The defendants filed a motion to dismiss on April 29, 2016. On June 24, 2016, the court granted the motion and dismissed the amended complaint with leave to amend. On July 15, 2016, the Institutional Investor Group filed a further amended complaint. The Company filed a motion to dismiss on August 19, 2016. The Company intends to defend itself vigorously in this matter.
87
WESTERN DIGITAL CORPORATION
NOTES TO CONSOLIDATED FINANCIAL STATEMENTS — (Continued)
Other Matters
In December 2011, the German Central Organization for Private Copying Rights (Zentralstelle für private Überspielungsrechte) (“ZPÜ”), an organization consisting of several copyright collecting societies, instituted arbitration proceedings against WD’s German subsidiary (“WD Germany”) before the Copyright Arbitration Board (“CAB”) claiming copyright levies for multimedia hard drives, external hard drives and network hard drives sold or introduced into commerce in Germany by WD Germany from January 2008 through December 2010. In February 2013, WD Germany filed a declaratory relief action against ZPÜ in the Higher Regional Court of Munich (the “Higher Court”), seeking an order from the court to determine the copyright levy issue. On May 21, 2013, ZPÜ filed a counter-claim against WD Germany with the Higher Court, seeking copyright levies for multimedia hard drives, external hard drives and network hard drives sold or introduced into commerce from January 2008 through December 2010 based on tariffs published by ZPÜ on November 3, 2011. In January 2015, the Higher Court ruled in favor of ZPÜ. In its ruling, the Higher Court declared that WD Germany must pay certain levies on certain products which it sold in Germany between January 2008 and December 2010. The judgment specifies levy amounts on certain products sold from January 2008 through December 2010 and directs WD Germany to provide applicable sales data to ZPÜ. The exact amount of the judgment has not been determined. ZPÜ and WD Germany filed appeals with the German Federal Court of Justice in February 2015. The Company intends to defend itself vigorously in this matter.
In December 2014, ZPÜ submitted a pleading to the CAB seeking copyright levies for multimedia hard drives, external hard drives and network hard drives sold or introduced into commerce in Germany by WD Germany between January 2012 and December 2013. The Company intends to defend itself vigorously in this matter.
The Company has recorded an accrual for German copyright levies in an amount that is not material to the Company’s financial position, results of operations or cash flows. It is reasonably possible that the Company may incur losses totaling up to
$123 million
, including the amounts accrued.
In the normal course of business, the Company is subject to other legal proceedings, lawsuits and other claims. Although the ultimate aggregate amount of probable monetary liability or financial impact with respect to these other matters is subject to many uncertainties, management believes that any monetary liability or financial impact to the Company from these other matters, individually and in the aggregate, would not be material to the Company’s financial condition, results of operations or cash flows. However, any monetary liability and financial impact to the Company from these other matters could differ materially from the Company’s expectations.
88
WESTERN DIGITAL CORPORATION
NOTES TO CONSOLIDATED FINANCIAL STATEMENTS — (Continued)
Segment Information
The Company historically was organized into
two
operating segments that have been aggregated into
one
reportable operating segment, the hard drive business. In October 2015, the Company received a decision from the Ministry of Commerce of the People’s Republic of China which enables it to integrate substantial portions of its HGST and WD subsidiaries. In May 2016, the Company completed its acquisition of SanDisk. With the integration and acquisition, the Company is going through a transformation into a storage solutions company with global scale, extensive product and technology assets and expertise in non-volatile memory within the data storage industry. As part of the transformation, the Company introduced a new operating model during the fourth quarter of 2016 that incorporates the HGST, WD and SanDisk businesses. As of fiscal year-end, the Company remained in a transition period from the existing operating model to the new operating model such that discrete information was not yet available that aligns with the revised management structure under the new operating model. Therefore as of
July 1, 2016
, the Company concluded that it has one reportable segment. The Company will continue to assess its operating segments and reportable segments under the new operating model in future periods once transition is complete.
Geographic Information
The Company’s operations outside the United States include manufacturing facilities in China, Japan, Malaysia, the Philippines and Thailand, as well as sales offices throughout the Americas, Asia Pacific, Europe and the Middle East. The following tables summarize the Company’s operations by geographic area:
|
Net revenue
(1)
:
|
|||||||||||
|
2016
|
2015
|
2014
|
|||||||||
|
(in millions)
|
|||||||||||
|
United States
|
$
|
3,651
|
|
$
|
3,054
|
|
$
|
3,013
|
|
||
|
China
|
2,413
|
|
2,726
|
|
3,499
|
|
|||||
|
Asia
|
3,989
|
|
4,552
|
|
4,756
|
|
|||||
|
Europe, Middle East and Africa
|
2,664
|
|
3,169
|
|
3,117
|
|
|||||
|
Other
|
277
|
|
1,071
|
|
745
|
|
|||||
|
Total
|
$
|
12,994
|
|
$
|
14,572
|
|
$
|
15,130
|
|
||
|
Long-lived assets
(2)
:
|
|||||||||
|
July 1,
2016 |
July 3,
2015 |
||||||||
|
(in millions)
|
|||||||||
|
United States
|
$
|
1,406
|
|
$
|
1,121
|
|
|||
|
China
|
463
|
|
367
|
|
|||||
|
Asia
|
1,628
|
|
1,473
|
|
|||||
|
Europe, Middle East and Africa
|
6
|
|
4
|
|
|||||
|
Total
|
$
|
3,503
|
|
$
|
2,965
|
|
|||
|
(1)
|
Net revenue is attributed to geographic regions based on the ship-to location of the customer. License and royalty revenue is attributed to countries based upon the location of the headquarters of the licensee.
|
|
(2)
|
Long-lived assets are attributed to the geographic location in which they are located.
|
Concentration and Credit Risk
The Company sells its products to computer manufacturers, resellers and retailers throughout the world. For
2016
,
no
single customer accounted for
10%
or more of the Company’s net revenue. For both
2015
and
2014
, Hewlett-Packard Company accounted for
11%
of the Company’s net revenue. Sales to the Company’s top
ten
customers accounted for
43%
,
44%
and
44%
of the Company’s net revenue for
2016
,
2015
and
2014
, respectively.
89
WESTERN DIGITAL CORPORATION
NOTES TO CONSOLIDATED FINANCIAL STATEMENTS — (Continued)
The Company performs ongoing credit evaluations of its customers’ financial condition and generally requires no collateral. The Company maintains allowances for potential credit losses, and such losses have historically been within management’s expectations. At any given point in time, the total amount outstanding from any one of a number of its customers may be individually significant to the Company’s financial results. At
July 1, 2016
,
no
single customer accounted for
10%
or more of the Company’s net accounts receivable. As of
July 3, 2015
, the Company had
two
customers that accounted for
30%
of the Company’s net accounts receivable. At
July 1, 2016
and
July 3, 2015
, the Company had reserves for potential credit losses of
$10 million
and
$7 million
, respectively, and net accounts receivable of
$1.5 billion
and
$1.5 billion
, respectively.
The Company also has cash equivalent and investment policies that limit the amount of credit exposure to any one financial institution or investment instrument and requires that investments be made only with financial institutions or in investment instruments evaluated as highly credit-worthy.
Supplier Concentration
All of the Company’s flash memory system products require silicon wafers for the memory and controller components. The Company’s memory wafers are currently supplied almost entirely from Flash Ventures and the controller wafers are all manufactured by third-party sources. The failure of any of these sources to deliver silicon wafers could have a material adverse effect on the Company’s business, financial condition and results of operations.
In addition, some key components are purchased from single source vendors for which alternative sources are currently not available. Shortages could occur in these essential materials due to an interruption of supply or increased demand in the industry. If the Company was unable to procure certain of such materials, the Company’s sales could decline, which could have a material adverse effect upon its results of operations. The Company also relies on third-party subcontractors to assemble and test a portion of its products. The Company does not have long-term contracts with some of these subcontractors and cannot directly control product delivery schedules or manufacturing processes. This could lead to product shortages or quality assurance problems that could increase the manufacturing costs of the Company’s products and have material adverse effects on the Company’s operating results.
90
WESTERN DIGITAL CORPORATION
NOTES TO CONSOLIDATED FINANCIAL STATEMENTS — (Continued)
The Company adopted the Western Digital Corporation 401(k) Plan (the “Plan”). The Plan covers substantially all domestic employees, subject to certain eligibility requirements. The Company makes a basic matching contribution on behalf of each participating eligible employee equal to fifty percent
(50%)
of the eligible participant’s combined pre-tax contributions and deferrals for the contribution cycle, not to exceed
5%
of the eligible participant’s compensation; provided, however, that each eligible participant shall receive a minimum annual basic matching contribution equal to fifty percent
(50%)
of the first
$4,000
of combined pre-tax contributions and deferrals for any calendar year. The Plan was amended effective January 1, 2013 to provide for an alternate year-end true-up matching contribution such that participants who save at least
5%
of their eligible compensation for the year receive a minimum annual matching contribution equal to
2.5%
of eligible compensation (up to Internal Revenue Service (“IRS”) limitations). Company contributions vest over a
5
-year period of employment. For
2016
,
2015
and
2014
, the Company made Plan contributions of
$20 million
,
$22 million
and
$21 million
, respectively.
91
WESTERN DIGITAL CORPORATION
NOTES TO CONSOLIDATED FINANCIAL STATEMENTS — (Continued)
Stock Incentive Plans
2004 Performance Incentive Plan
The types of awards that may be granted under the amended and restated 2004 Performance Incentive Plan include stock options, SARs, RSUs, PSUs, stock bonuses and other forms of awards granted or denominated in the Company’s common stock or units of the Company’s common stock, as well as cash bonus awards. Persons eligible to receive awards under the 2004 Performance Incentive Plan include officers and employees of the Company or any of its subsidiaries, directors of the Company and certain consultants and advisors to the Company or any of its subsidiaries. The vesting of awards under the 2004 Performance Incentive Plan is determined at the date of grant. Each award expires on a date determined at the date of grant; however, the maximum term of options and SARs under the 2004 Performance Incentive Plan is ten years after the grant date of the award. RSUs granted under the 2004 Performance Incentive Plan typically vest over periods ranging from
one
to
four
years from the date of grant.
PSUs are granted to certain employees and vest only after the achievement of pre-determined performance metrics. Once the performance metrics are met, vesting of PSUs is subject to continued service by the employee. At the end of each reporting period, the Company evaluates the probability that PSUs will be earned. The Company records stock-based compensation expense based on the probability that the performance metrics will be achieved over the vesting period.
To the extent available, the Company issues shares out of treasury stock upon the vesting of awards, the exercise of employee stock options and the purchase of shares pursuant to the ESPP.
Outstanding RSU awards have dividend equivalent rights which entitle holders of outstanding RSUs to the same dividend value per share as holders of common stock. Dividend equivalent rights are subject to the same vesting and other terms and conditions as the corresponding unvested RSUs. Dividend equivalent rights are accumulated and paid in additional shares when the underlying shares vest.
As of
July 1, 2016
, the maximum number of shares of the Company’s common stock that was authorized for award grants under the 2004 Performance Incentive Plan was
65.8 million
shares. Shares issued in respect of stock options and SARs granted under the 2004 Performance Incentive Plan count against the plan’s share limit on a one-for-one basis, whereas shares issued in respect of any other type of award granted through November 7, 2012 under the plan count against the plan’s share limit as
1.35
shares for every one share actually issued in connection with such award. Shares issued in respect of awards, other than options and SARs, granted on or after November 8, 2012 count against the plan’s share limit as
1.72
shares for every one share actually issued in connection with such award. The 2004 Performance Incentive Plan was extended in 2013 and will terminate on August 4, 2025 unless terminated earlier by the Company’s Board of Directors (the “Board”).
Acquired Plan
In connection with the Merger, the Company assumed the SanDisk 2013 Incentive Plan. Options eligible for exercise may be exercised for shares of the Company’s common stock at any time prior to the expiration of the seven-year option term or any earlier termination of those options in connection with the optionee’s cessation of service with the Company. Outstanding RSU awards under the SanDisk 2013 Incentive Plan have dividend equivalent rights which entitle holders of RSUs to the same dividend value per share as holders of common stock. Dividend equivalent rights are subject to the same vesting and other terms and conditions as the corresponding unvested RSUs. Dividend equivalent rights are accumulated and paid when the underlying shares vest.
The Company assumed all of the unvested and underwater vested stock options and RSUs outstanding under SanDisk’s stock plans as of the SanDisk Closing Date. In addition, the Company assumed
14.4 million
shares that were available to be granted to SanDisk employees under the SanDisk 2013 Incentive Plan. The assumed stock options and RSUs were converted into equivalent stock options and RSUs with respect to shares of the Company’s common stock using an equity award exchange ratio specified in the Merger agreement.
Employee Stock Purchase Plan
Under the Company’s ESPP, eligible employees may authorize payroll deductions of
up to 10%
of their eligible compensation during prescribed offering periods to purchase shares of the Company’s common stock
at 95%
of the fair market value of common stock on either the first day of that offering period or on the applicable exercise date, whichever is less. A participant may participate in only one offering period at a time, and a new offering period generally begins each June 1st and December 1st. Each offering period is generally
24 months
and consists of four exercise dates (each, generally six months following the start of the offering period or the preceding exercise date, as the case may be). If the fair market value of the Company’s common stock is less on a given exercise date than on the date of grant, employee participation in that offering period ends and participants are automatically re-enrolled in the next new offering period.
92
WESTERN DIGITAL CORPORATION
NOTES TO CONSOLIDATED FINANCIAL STATEMENTS — (Continued)
Stock-Based Compensation Expense
For purposes of this footnote, references to RSUs include PSUs. The following table presents the Company’s stock-based compensation and related tax benefit for
2016
,
2015
and
2014
:
|
2016
|
2015
|
2014
|
|||||||||
|
(in millions)
|
|||||||||||
|
Options
|
$
|
55
|
|
$
|
58
|
|
$
|
67
|
|
||
|
ESPP
|
13
|
|
16
|
|
18
|
|
|||||
|
RSUs
|
123
|
|
88
|
|
71
|
|
|||||
|
Subtotal
|
191
|
|
162
|
|
156
|
|
|||||
|
Tax Benefit
|
(48
|
)
|
(43
|
)
|
(40
|
)
|
|||||
|
Total
|
$
|
143
|
|
$
|
119
|
|
$
|
116
|
|
||
Included in the stock-based compensation expense for 2016 was
$29 million
related to converted awards in connection with the Merger. As of
July 1, 2016
, total compensation cost related to unvested stock options was
$76 million
and will be amortized on a straight-line basis over a weighted average service period of approximately
2.3
years. As of
July 1, 2016
, total compensation cost related to ESPP rights issued to employees but not yet recognized was
$45 million
and will be amortized on a straight-line basis over a weighted average service period of approximately
1.8
years.
As of
July 1, 2016
, the aggregate unamortized fair value of all unvested RSUs and PSUs was
$498 million
, which will be recognized on a straight-line basis over a weighted average vesting period of approximately
2.5
years, assuming the performance metrics are met for the PSUs.
Stock Option Activity
The following table summarizes stock option activity under the 2004 Performance Incentive Plan and any assumed plan, including the SanDisk 2013 Incentive Plan, during the last three fiscal years:
|
Number of Shares
|
Weighted Average Exercise Price Per Share
|
Weighted Average Remaining Contractual Life
|
Aggregate Intrinsic Value
|
|||||||||
|
(in millions)
|
(in years)
|
(in millions)
|
||||||||||
|
Options outstanding at June 28, 2013
|
11.9
|
|
$
|
29.47
|
|
|||||||
|
Granted
|
1.6
|
|
68.96
|
|
||||||||
|
Assumed
|
1.7
|
|
38.18
|
|
||||||||
|
Exercised
|
(4.5
|
)
|
25.22
|
|
||||||||
|
Canceled or expired
|
(0.6
|
)
|
67.23
|
|
||||||||
|
Options outstanding at June 27, 2014
|
10.1
|
|
37.03
|
|
||||||||
|
Granted
|
1.2
|
|
94.10
|
|
||||||||
|
Assumed
|
0.1
|
|
3.49
|
|
||||||||
|
Exercised
|
(4.1
|
)
|
31.90
|
|
||||||||
|
Canceled or expired
|
(0.5
|
)
|
56.41
|
|
||||||||
|
Options outstanding at July 3, 2015
|
6.8
|
|
50.00
|
|
||||||||
|
Granted
|
1.7
|
|
82.68
|
|
||||||||
|
Assumed
|
2.9
|
|
38.37
|
|
||||||||
|
Exercised
|
(1.7
|
)
|
27.43
|
|
||||||||
|
Canceled or expired
|
(0.7
|
)
|
66.03
|
|
||||||||
|
Options outstanding at July 1, 2016
|
9.0
|
|
55.74
|
|
3.9
|
$
|
60
|
|
||||
|
Exercisable at July 1, 2016
|
5.0
|
|
47.11
|
|
2.8
|
$
|
45
|
|
||||
|
Vested and expected to vest after July 1, 2016
|
8.8
|
|
55.42
|
|
3.9
|
$
|
60
|
|
||||
93
WESTERN DIGITAL CORPORATION
NOTES TO CONSOLIDATED FINANCIAL STATEMENTS — (Continued)
Options granted during
2016
had a weighted average fair value per share of
$22.54
. As of
July 1, 2016
, the Company had options outstanding to purchase an aggregate of
5.2 million
shares with an exercise price below the quoted price of the Company’s stock on that date resulting in an aggregate intrinsic value of
$60 million
at that date. During
2016
,
2015
and
2014
, the aggregate intrinsic value of options exercised under the 2004 Performance Incentive Plan was
$57 million
,
$283 million
and
$247 million
, respectively, determined as of the date of exercise.
RSU and PSU Activity
The following table summarizes RSU and PSU activity under the 2004 Performance Incentive Plan and any assumed plan, including the SanDisk 2013 Incentive Plan, during the last three fiscal years:
|
Number of Shares
|
Weighted Average Grant Date Fair Value
|
|||||
|
(in millions)
|
||||||
|
RSUs and PSUs outstanding at June 28, 2013
|
3.6
|
|
$
|
35.82
|
|
|
|
Granted
|
1.4
|
|
69.08
|
|
||
|
Assumed
|
0.2
|
|
62.73
|
|
||
|
Vested
|
(1.3
|
)
|
33.61
|
|
||
|
Forfeited
|
(0.2
|
)
|
47.62
|
|
||
|
RSUs and PSUs outstanding at June 27, 2014
|
3.7
|
|
49.77
|
|
||
|
Granted
|
1.3
|
|
100.13
|
|
||
|
Vested
|
(1.7
|
)
|
42.24
|
|
||
|
Forfeited
|
(0.3
|
)
|
67.31
|
|
||
|
RSUs and PSUs outstanding at July 3, 2015
|
3.0
|
|
73.80
|
|
||
|
Granted
|
2.7
|
|
61.32
|
|
||
|
Assumed
|
12.5
|
|
32.14
|
|
||
|
Vested
|
(2.0
|
)
|
56.11
|
|
||
|
Forfeited
|
(0.5
|
)
|
62.09
|
|
||
|
RSUs and PSUs outstanding at July 1, 2016
|
15.7
|
|
41.92
|
|
||
|
Expected to vest after July 1, 2016
|
14.2
|
|
42.27
|
|
||
RSUs and PSUs are generally settled in an equal number of shares of the Company’s common stock at the time of vesting of the units. The aggregate value of RSUs and PSUs that became fully-vested during
2016
,
2015
and
2014
was
$144 million
,
$170 million
and
$89 million
, respectively, determined as of the vest date. The fair value of the shares underlying the RSU and PSU awards at the date of grant was
$163 million
,
$125 million
and
$95 million
in
2016
,
2015
and
2014
, respectively.
During
2016
, the Company granted
1.2 million
PSUs at a weighted average grant-date fair value of
$53.59
per share. The total number of PSUs outstanding as of
July 1, 2016
was
1.2 million
with a weighted average fair value per share of
$55.73
.
SARs Activity
During
2016
,
2015
and
2014
, the Company recognized an
$18 million
benefit,
$3 million
benefit and
$36 million
expense, respectively, related to adjustments to fair market value of SARs. The tax expense realized as a result of the aforementioned SARs benefit was
$2 million
during
2016
, as compared to
no
tax benefit or expense realized in
2015
and tax benefits realized of
$7 million
in
2014
. The Company’s SARs will be settled in cash upon exercise. The Company had a total liability of
$20 million
and
$41 million
related to SARs included in accrued expenses in the consolidated balance sheet as of
July 1, 2016
and
July 3, 2015
, respectively.
As of
July 1, 2016
, all SARs issued to employees were fully vested, and the fair values are now solely subject to market price fluctuations. As of
July 1, 2016
,
0.5 million
SARs were outstanding with a weighted average exercise price of
$7.90
. There were no SARs granted in
2016
,
2015
and
2014
, and all other SARs activity was immaterial to the consolidated financial statements for the year ended
July 1, 2016
.
94
WESTERN DIGITAL CORPORATION
NOTES TO CONSOLIDATED FINANCIAL STATEMENTS — (Continued)
Vested Options, RSUs and PSUs
The total grant date fair value of options, RSUs and PSUs vested during the period was as follows:
|
|
Years ended
|
||||||||||
|
|
July 1,
2016 |
July 3,
2015 |
June 27,
2014 |
||||||||
|
(in millions)
|
|||||||||||
|
Options
|
$
|
61
|
|
$
|
62
|
|
$
|
96
|
|
||
|
RSUs and PSUs
|
113
|
|
65
|
|
46
|
|
|||||
|
Total grant date fair value of options, RSUs and PSUs vested during the period
|
$
|
174
|
|
$
|
127
|
|
$
|
142
|
|
||
Fair Value Valuation Assumptions
Stock Option Grants — Binomial Model
The fair value of stock options granted is estimated using a binomial option-pricing model. The binomial model requires the input of highly subjective assumptions. The Company uses historical data to estimate exercise, employee termination and expected stock price volatility within the binomial model. The risk-free rate for periods within the contractual life of the option is based on the U.S. Treasury yield curve in effect at the time of grant. The fair value of stock options granted during
2016
,
2015
and
2014
was estimated using the following weighted average assumptions:
|
2016
|
2015
|
2014
|
|||
|
Suboptimal exercise factor
|
2.71
|
2.52
|
2.07
|
||
|
Range of risk-free interest rates
|
0.25% to 2.09%
|
0.11% to 2.16%
|
0.10% to 2.44%
|
||
|
Range of expected stock price volatility
|
0.28 to 0.49
|
0.23 to 0.47
|
0.27 to 0.50
|
||
|
Weighted-average expected volatility
|
0.35
|
0.36
|
0.43
|
||
|
Post-vesting termination rate
|
0.47%
|
1.25%
|
3.10%
|
||
|
Dividend yield
|
2.61%
|
1.69%
|
1.58%
|
||
|
Fair value
|
$22.54
|
$32.19
|
$24.14
|
||
|
Weighted-average expected term (in years)
|
4.7
|
5.8
|
5.0
|
||
RSU and PSU Grants
The fair value of the Company’s RSU and PSU awards granted, excluding unvested RSU awards assumed through acquisitions, was based upon the closing price of the Company’s stock price on the date of grant.
ESPP — Black-Scholes-Merton Model
The fair value of ESPP purchase rights issued is estimated at the date of grant of the purchase rights using the Black-Scholes-Merton option-pricing model. The Black-Scholes-Merton option-pricing model requires the input of highly subjective assumptions such as the expected stock price volatility and the expected period until options are exercised. Purchase rights under the ESPP are granted on either June 1st or December 1st of each year.
The fair values of all ESPP purchase rights granted on or prior to
July 1, 2016
have been estimated at the date of grant using a Black-Scholes-Merton option-pricing model with the following weighted average assumptions:
|
|
2016
|
2015
|
2014
|
||
|
Option life (in years)
|
1.27
|
1.26
|
1.24
|
||
|
Risk-free interest rate
|
0.82%
|
0.45%
|
0.26%
|
||
|
Stock price volatility
|
0.38
|
0.26
|
0.31
|
||
|
Dividend yield
|
3.92%
|
2.34%
|
1.64%
|
||
|
Fair value
|
$9.91
|
$14.50
|
$14.62
|
||
95
WESTERN DIGITAL CORPORATION
NOTES TO CONSOLIDATED FINANCIAL STATEMENTS — (Continued)
Stock Repurchase Program
The Board previously authorized
$5.0 billion
for the repurchase of the Company’s common stock and approved the extension of its stock repurchase program to February 3, 2020. Effective October 21, 2015, in connection with the Merger, the stock repurchase program was suspended. The Company repurchased
0.7 million
shares for a total cost of
$60 million
during
2016
. The remaining amount available to be purchased under the Company’s stock repurchase program as of
July 1, 2016
was
$2.1 billion
.
Stock Reserved for Issuance
The following table summarizes all common stock reserved for issuance at
July 1, 2016
:
|
|
Number of Shares
|
|
|
(in millions)
|
||
|
Outstanding awards and shares available for award grants
|
56.6
|
|
|
ESPP
|
9.4
|
|
|
Convertible notes
|
0.3
|
|
|
Total
|
66.3
|
|
Dividends to Shareholders
On September 13, 2012, the Company announced that the Board had authorized the adoption of a quarterly cash dividend policy. Under the cash dividend policy, holders of the Company’s common stock receive dividends when and as declared by the Board. In
2016
, the Company declared aggregate cash dividends of
$2.00
per share of the Company’s common stock, totaling
$490 million
, of which
$348 million
was paid during
2016
. The Company also paid
$116 million
of dividends in
2016
related to dividends accrued in
2015
. On
August 3, 2016
, the Company declared a cash dividend of
$0.50
per share to shareholders of record as of
September 30, 2016
, which will be paid on
October 17, 2016
. The Company may modify, suspend or cancel its cash dividend policy in any manner and at any time.
96
WESTERN DIGITAL CORPORATION
NOTES TO CONSOLIDATED FINANCIAL STATEMENTS — (Continued)
Pre-tax Income
The domestic and foreign components of income before income taxes were as follows for
2016
,
2015
and
2014
:
|
2016
|
2015
|
2014
|
|||||||||
|
(in millions)
|
|||||||||||
|
Foreign
|
$
|
516
|
|
$
|
1,501
|
|
$
|
1,664
|
|
||
|
Domestic
|
(363
|
)
|
76
|
|
88
|
|
|||||
|
Income before income taxes
|
$
|
153
|
|
$
|
1,577
|
|
$
|
1,752
|
|
||
Income Tax Provision
The components of the provision for income taxes were as follows for
2016
,
2015
and
2014
:
|
2016
|
2015
|
2014
|
|||||||||
|
(in millions)
|
|||||||||||
|
Current:
|
|||||||||||
|
Foreign
|
$
|
59
|
|
$
|
54
|
|
$
|
47
|
|
||
|
Domestic-federal
|
2
|
|
43
|
|
98
|
|
|||||
|
Domestic-state
|
(1
|
)
|
(13
|
)
|
3
|
|
|||||
|
Deferred:
|
|||||||||||
|
Foreign
|
(39
|
)
|
12
|
|
(3
|
)
|
|||||
|
Domestic-federal
|
(109
|
)
|
11
|
|
(14
|
)
|
|||||
|
Domestic-state
|
(1
|
)
|
5
|
|
4
|
|
|||||
|
Income tax provision
|
$
|
(89
|
)
|
$
|
112
|
|
$
|
135
|
|
||
The Company’s income tax benefit for
2016
reflects tax benefits from expenses related to the Merger and from interest expense related to new debt facilities.
Remaining net undistributed earnings from foreign subsidiaries at
July 1, 2016
on which no U.S. tax has been provided amounted to
$12 billion
. The net undistributed earnings are intended to finance local operating requirements and capital investments. Accordingly, an additional U.S. tax provision has not been made on these earnings. The tax liability for these earnings would be approximately
$4 billion
if the Company repatriated the
$12 billion
in undistributed earnings from the foreign subsidiaries.
97
WESTERN DIGITAL CORPORATION
NOTES TO CONSOLIDATED FINANCIAL STATEMENTS — (Continued)
Deferred Taxes
Temporary differences and carryforwards, which give rise to a significant portion of deferred tax assets and liabilities as of
July 1, 2016
and
July 3, 2015
were as follows:
|
July 1,
2016 |
July 3,
2015 |
||||||
|
(in millions)
|
|||||||
|
Deferred tax assets:
|
|||||||
|
Sales related reserves and accrued expenses not currently deductible
|
$
|
82
|
|
$
|
50
|
|
|
|
Accrued compensation and benefits not currently deductible
|
207
|
|
138
|
|
|||
|
Domestic net operating loss carryforward
|
259
|
|
137
|
|
|||
|
Business credit carryforward
|
264
|
|
167
|
|
|||
|
Long-lived assets
|
256
|
|
49
|
|
|||
|
Other
|
177
|
|
65
|
|
|||
|
Total deferred tax assets
|
1,245
|
|
606
|
|
|||
|
Deferred tax liabilities:
|
|||||||
|
Long-lived assets
|
(1,030
|
)
|
(126
|
)
|
|||
|
Other
|
(9
|
)
|
(10
|
)
|
|||
|
Total deferred tax liabilities
|
(1,039
|
)
|
(136
|
)
|
|||
|
Valuation allowances
|
(294
|
)
|
(166
|
)
|
|||
|
Deferred tax (liabilities) assets, net
|
$
|
(88
|
)
|
$
|
304
|
|
|
The net deferred tax asset valuation allowance increased by
$128 million
in
2016
and decreased by
$38 million
in
2015
.
$103 million
of the net deferred tax asset valuation allowance increase in
2016
is primarily attributable to balances assumed as a result of the Merger. The assessment of valuation allowances against deferred tax assets requires estimations and significant judgment. The Company continues to assess and adjust its valuation allowance based on operating results and market conditions. After weighing both the positive and negative evidence available, including but not limited to, earnings history, projected future outcomes, industry and market trends and the nature of each of the deferred tax assets, the Company determined that it is able to realize most of its deferred tax assets with the exception of certain loss and credit carryforwards.
In addition to the deferred tax assets presented above, the Company had additional net operating loss (“NOL”) benefits related to stock-based compensation deductions of
$119 million
and
$90 million
at
July 1, 2016
and
July 3, 2015
, respectively. During
2016
, the Company generated an additional
$34 million
of benefits related to stock-based compensation deductions, of which
$7 million
were utilized in
2016
and recorded to stockholders’ equity.
98
WESTERN DIGITAL CORPORATION
NOTES TO CONSOLIDATED FINANCIAL STATEMENTS — (Continued)
Effective Tax Rate
Reconciliation of the U.S. Federal statutory rate to the Company’s effective tax rate is as follows for
2016
,
2015
and
2014
:
|
2016
|
2015
|
2014
|
||||||
|
U.S. Federal statutory rate
|
35
|
%
|
35
|
%
|
35
|
%
|
||
|
Tax rate differential on international income
|
(103
|
)
|
(29
|
)
|
(28
|
)
|
||
|
Tax effect of U.S. non-deductible convertible debt costs
|
13
|
|
—
|
|
—
|
|
||
|
Tax effect of U.S. non-deductible acquisition costs
|
10
|
|
—
|
|
—
|
|
||
|
Tax effect of U.S. foreign income inclusion
|
9
|
|
—
|
|
—
|
|
||
|
Tax effect of U.S. non-deductible share-based compensation
|
9
|
|
—
|
|
—
|
|
||
|
Tax effect of U.S. permanent differences
|
1
|
|
1
|
|
2
|
|
||
|
State income tax, net of federal tax
|
(1
|
)
|
—
|
|
—
|
|
||
|
Retroactive extension of Federal R&D credit
|
(9
|
)
|
—
|
|
—
|
|
||
|
Creditable foreign taxes
|
(13
|
)
|
—
|
|
—
|
|
||
|
Income tax credits
|
(14
|
)
|
(2
|
)
|
(1
|
)
|
||
|
Other
|
5
|
|
2
|
|
—
|
|
||
|
Effective tax rate
|
(58
|
)%
|
7
|
%
|
8
|
%
|
||
Tax Holidays and Carryforwards
A substantial portion of the Company’s manufacturing operations in Malaysia, the Philippines, Singapore and Thailand operate under various tax holidays and tax incentive programs which will expire in whole or in part at various dates from
2016 through 2029
. Certain of the holidays may be extended if specific conditions are met. The net impact of these tax holidays and tax incentives was to increase the Company’s net earnings by
$500 million
(
$2.07
per diluted share),
$641 million
(
$2.70
per diluted share) and
$905 million
(
$3.74
per diluted share) in
2016
,
2015
and
2014
, respectively.
As of
July 1, 2016
, the Company had federal and state NOL carryforwards of
$848 million
and
$612 million
, respectively. In addition, as of
July 1, 2016
, the Company had various federal and state tax credit carryforwards of
$664 million
combined. The NOL carryforwards available to offset future federal and state taxable income expire at various dates from
2018 to 2035
and
2017 to 2036
, respectively.
$200 million
of the credit carryforwards available to offset future taxable income expire at various dates from
2017 to 2036
. The remaining amount is available indefinitely. NOLs and credits relating to various acquisitions are subject to limitations under Sections 382 and 383 of the Internal Revenue Code. The Company expects the total amount of NOLs and credits ultimately realized will be reduced by
$483 million
and
$32 million
, respectively.
Uncertain Tax Positions
With the exception of certain unrecognized tax benefits that are directly associated with the tax position taken, unrecognized tax benefits are presented gross in the Company’s balance sheet. Interest and penalties related to unrecognized tax benefits are recognized in liabilities recorded for uncertain tax positions and are recorded in the provision for income taxes. As of
July 1, 2016
, the Company had
$491 million
of unrecognized tax benefits. Accrued interest and penalties included in the Company’s liability related to unrecognized tax benefits as of
July 1, 2016
,
July 3, 2015
and
June 27, 2014
was
$75 million
,
$55 million
and
$44 million
, respectively.
$120 million
of the unrecognized tax benefits increase is attributable primarily to balances assumed as a result of the Merger.
99
WESTERN DIGITAL CORPORATION
NOTES TO CONSOLIDATED FINANCIAL STATEMENTS — (Continued)
The following is a tabular reconciliation of the total amounts of unrecognized tax benefits excluding accrued interest and penalties for
2016
,
2015
and
2014
:
|
2016
|
2015
|
2014
|
|||||||||
|
(in millions)
|
|||||||||||
|
Unrecognized tax benefit at beginning of period
|
$
|
350
|
|
$
|
300
|
|
$
|
240
|
|
||
|
Gross increases related to current year tax positions
|
46
|
|
44
|
|
27
|
|
|||||
|
Gross increases related to prior year tax positions
|
6
|
|
6
|
|
26
|
|
|||||
|
Gross decreases related to prior year tax positions
|
(15
|
)
|
—
|
|
(5
|
)
|
|||||
|
Settlements
|
(8
|
)
|
—
|
|
—
|
|
|||||
|
Lapse of statute of limitations
|
(8
|
)
|
(3
|
)
|
—
|
|
|||||
|
Acquisitions
|
120
|
|
3
|
|
12
|
|
|||||
|
Unrecognized tax benefit at end of period
|
$
|
491
|
|
$
|
350
|
|
$
|
300
|
|
||
The Company’s unrecognized tax benefits are primarily included within long-term liabilities in the Company’s consolidated balance sheets. The entire balance of unrecognized tax benefits at
July 1, 2016
,
July 3, 2015
and
June 27, 2014
, if recognized, would affect the effective tax rate, subject to certain future valuation allowance reversals.
The Company files U.S. Federal, U.S. state and foreign tax returns. For both federal and state tax returns, with few exceptions, the Company is subject to examination for fiscal years 2008 through 2015. In foreign jurisdictions, with few exceptions, the Company is subject to examination for all years subsequent to fiscal 2008. The Company is no longer subject to examination by the IRS for periods prior to 2008, although carry forwards generated prior to those periods may still be adjusted upon examination by the IRS or state taxing authority if they either have been or will be used in a subsequent period.
The IRS previously completed its field examination of the Company’s federal income tax returns for fiscal years 2006 through 2009 and proposed certain adjustments. The Company received Revenue Agent Reports from the IRS that seek to increase the Company’s U.S. taxable income which would result in additional federal tax expense totaling
$795 million
, subject to interest. The issues in dispute relate primarily to transfer pricing with the Company’s foreign subsidiaries and intercompany payable balances. The Company disagrees with the proposed adjustments and in September 2015, filed a protest with the IRS Appeals Office and received the IRS rebuttal in July 2016. The Company believes that its tax positions are properly supported and will vigorously contest the position taken by the IRS. In September 2015, the IRS commenced an examination of the Company’s fiscal years 2010 through 2012.
The Company believes that adequate provision has been made for any adjustments that may result from tax examinations. However, the outcome of tax examinations cannot be predicted with certainty. If any issues addressed in the Company’s tax examinations are resolved in a manner not consistent with management’s expectations, the Company could be required to adjust its provision for income taxes in the period such resolution occurs. As of
July 1, 2016
, it is not possible to estimate the amount of change, if any, in the unrecognized tax benefits that is reasonably possible within the next twelve months. Any significant change in the amount of the Company’s liability for unrecognized tax benefits would most likely result from additional information or settlements relating to the examination of the Company’s tax returns.
100
WESTERN DIGITAL CORPORATION
NOTES TO CONSOLIDATED FINANCIAL STATEMENTS — (Continued)
Financial Instruments Carried at Fair Value
Financial assets and liabilities that are remeasured and reported at fair value at each reporting period are classified and disclosed in one of the following three levels:
Level 1.
Quoted prices in active markets for identical assets or liabilities.
Level 2.
Inputs other than Level 1 that are observable, either directly or indirectly, such as quoted prices for similar assets or liabilities; quoted prices in markets that are not active; or other inputs that are observable or can be corroborated by observable market data for substantially the full term of the assets or liabilities.
Level 3.
Inputs that are unobservable for the asset or liability and that are significant to the fair value of the assets or liabilities.
The following tables present information about the Company’s financial assets and liabilities that are measured at fair value on a recurring basis as of
July 1, 2016
and
July 3, 2015
, and indicate the fair value hierarchy of the valuation techniques utilized to determine such values:
|
July 1, 2016
|
|||||||||||||||
|
|
Level 1
|
Level 2
|
Level 3
|
Total
|
|||||||||||
|
(in millions)
|
|||||||||||||||
|
Assets:
|
|||||||||||||||
|
Cash equivalents
|
|||||||||||||||
|
Money market funds
|
$
|
2,199
|
|
$
|
—
|
|
$
|
—
|
|
$
|
2,199
|
|
|||
|
Certificates of deposit
|
—
|
|
1
|
|
—
|
|
1
|
|
|||||||
|
Total cash equivalents
|
2,199
|
|
1
|
|
—
|
|
2,200
|
|
|||||||
|
Short-term investments:
|
|||||||||||||||
|
Certificates of deposit
|
—
|
|
202
|
|
—
|
|
202
|
|
|||||||
|
Corporate notes and bonds
|
—
|
|
8
|
|
—
|
|
8
|
|
|||||||
|
Asset-backed securities
|
—
|
|
11
|
|
—
|
|
11
|
|
|||||||
|
Municipal notes and bonds
|
—
|
|
6
|
|
—
|
|
6
|
|
|||||||
|
Total short-term investments
|
—
|
|
227
|
|
—
|
|
227
|
|
|||||||
|
Long-term investments:
|
|||||||||||||||
|
U.S. Treasury securities
|
2
|
|
—
|
|
—
|
|
2
|
|
|||||||
|
U.S. Government agency securities
|
—
|
|
10
|
|
—
|
|
10
|
|
|||||||
|
International government securities
|
—
|
|
1
|
|
—
|
|
1
|
|
|||||||
|
Corporate notes and bonds
|
—
|
|
89
|
|
—
|
|
89
|
|
|||||||
|
Asset-backed securities
|
—
|
|
11
|
|
—
|
|
11
|
|
|||||||
|
Municipal notes and bonds
|
—
|
|
6
|
|
—
|
|
6
|
|
|||||||
|
Total long-term investments
|
2
|
|
117
|
|
—
|
|
119
|
|
|||||||
|
Foreign exchange contracts
|
—
|
|
126
|
|
—
|
|
126
|
|
|||||||
|
Call options
|
—
|
|
—
|
|
71
|
|
71
|
|
|||||||
|
Total assets at fair value
|
$
|
2,201
|
|
$
|
471
|
|
$
|
71
|
|
$
|
2,743
|
|
|||
|
Liabilities:
|
|||||||||||||||
|
Foreign exchange contracts
|
$
|
—
|
|
$
|
23
|
|
$
|
—
|
|
$
|
23
|
|
|||
|
Exchange option
|
—
|
|
—
|
|
155
|
|
155
|
|
|||||||
|
Total liabilities at fair value
|
$
|
—
|
|
$
|
23
|
|
$
|
155
|
|
$
|
178
|
|
|||
101
WESTERN DIGITAL CORPORATION
NOTES TO CONSOLIDATED FINANCIAL STATEMENTS — (Continued)
|
July 3, 2015
|
|||||||||||||||
|
|
Level 1
|
Level 2
|
Level 3
|
Total
|
|||||||||||
|
(in millions)
|
|||||||||||||||
|
Assets:
|
|||||||||||||||
|
Cash equivalents
|
|||||||||||||||
|
Money market funds
|
$
|
135
|
|
$
|
—
|
|
$
|
—
|
|
$
|
135
|
|
|||
|
Total cash equivalents
|
135
|
|
—
|
|
—
|
|
135
|
|
|||||||
|
Short-term investments:
|
|||||||||||||||
|
U.S. Treasury securities
|
—
|
|
50
|
|
—
|
|
50
|
|
|||||||
|
U.S. Government agency securities
|
—
|
|
4
|
|
—
|
|
4
|
|
|||||||
|
Commercial paper
|
—
|
|
109
|
|
—
|
|
109
|
|
|||||||
|
Certificates of deposit
|
—
|
|
99
|
|
—
|
|
99
|
|
|||||||
|
Total short-term investments
|
—
|
|
262
|
|
—
|
|
262
|
|
|||||||
|
Long-term investments:
|
|||||||||||||||
|
U.S. Treasury securities
|
—
|
|
237
|
|
—
|
|
237
|
|
|||||||
|
U.S. Government agency securities
|
—
|
|
91
|
|
—
|
|
91
|
|
|||||||
|
Total long-term investments
|
—
|
|
328
|
|
—
|
|
328
|
|
|||||||
|
Total assets at fair value
|
$
|
135
|
|
$
|
590
|
|
$
|
—
|
|
$
|
725
|
|
|||
|
Liabilities:
|
|||||||||||||||
|
Foreign exchange contracts
|
$
|
—
|
|
$
|
31
|
|
$
|
—
|
|
$
|
31
|
|
|||
|
Total liabilities at fair value
|
$
|
—
|
|
$
|
31
|
|
$
|
—
|
|
$
|
31
|
|
|||
Money Market Funds.
The Company’s money market funds are funds that invest in U.S. Treasury and U.S. Government Agency securities. Money market funds are valued based on quoted market prices.
U.S. Treasury Securities.
The Company’s U.S. Treasury securities are direct obligations of the U.S. federal government and are held in custody by a third party. U.S. Treasury securities are valued using a market approach which is based on observable inputs including market interest rates from multiple pricing sources.
U.S. and International Government Agency Securities.
The Company’s U.S. and International Government agency securities are investments in fixed income securities sponsored by the U.S. and International Government and are held in custody by a third party. U.S. and International Government agency securities are valued using a market approach which is based on observable inputs including market interest rates from multiple pricing sources.
Asset-Backed Securities, and Corporate and Municipal Notes and Bonds.
The Company’s asset-backed securities, and Corporate and Municipal notes and bonds securities are investments issued by corporations and U.S. state municipalities which are held in custody by a third party. Asset-backed securities, and Corporate and Municipal notes and bonds are valued using a market approach which is based on observable inputs including market interest rates from multiple pricing sources.
Commercial Paper.
The Company’s commercial paper securities are investments issued by corporations which are held in custody by a third party. Commercial paper securities are valued using a market approach which is based on observable inputs including market interest rates from multiple pricing sources.
Certificates of Deposit.
The Company’s certificates of deposit are investments which are held in custody by a third party. Certificates of deposit are valued using fixed interest rates.
Foreign Exchange Contracts.
The Company’s foreign exchange contracts are short-term contracts to hedge the Company’s foreign currency risk. For contracts that have a right of offset by its individual counterparties under master netting arrangements, the Company presents its foreign exchange contracts on a net basis by counterparty in the consolidated balance sheets. Foreign exchange contracts are valued using an income approach that is based on a present value of future cash flows model. The market-based observable inputs for the model include forward rates and credit default swap rates. For more information on the Company’s foreign exchange contracts, see Note 13 to the consolidated financial statements.
During years 2016 and 2015, the Company had no transfers of financial assets and liabilities between Level 1 and Level 2.
102
WESTERN DIGITAL CORPORATION
NOTES TO CONSOLIDATED FINANCIAL STATEMENTS — (Continued)
Assets and Liabilities Measured at Fair Value on a Recurring Basis Using Significant Unobservable Inputs (Level 3)
In connection with the Merger, the Company assumed the previously issued SanDisk Notes which were determined to contain an embedded exchange option derivative and also assumed call options that were intended to offset the dilution of the exchange option (see Note 3). The fair value measurement of the call options and exchange option arising from the assumed SanDisk Notes are not actively traded and are determined via a lattice model, using unobservable inputs (Level 3). These inputs include (i) the estimated amount and timing of settlement of the underlying debt; (ii) the probability of the achievement of the factor(s) on which the settlement is based; (iii) the risk-adjusted discount rate based on the expected term to maturity of the debt; and (iv) economic incentive for holders to exercise their exchange option. Significant increases or decreases in any of those inputs in isolation could result in a significantly lower or higher fair value measurement.
There were no transfers of call options or exchange option out of Level 3 for
2016
.
The following is a reconciliation of the call options reported in other current assets and other non-current assets in the Company’s consolidated balance sheets as of
July 1, 2016
.
|
2017 Call Options
|
2020 Call Options
|
Total
|
|||||||||
|
(in millions)
|
|||||||||||
|
Initial estimate upon acquisition
|
$
|
501
|
|
$
|
—
|
|
$
|
501
|
|
||
|
Redemptions
|
(437
|
)
|
—
|
|
(437
|
)
|
|||||
|
Net unrealized gain (loss)
|
6
|
|
1
|
|
7
|
|
|||||
|
Fair value at end of period
|
$
|
70
|
|
$
|
1
|
|
$
|
71
|
|
||
The following is a reconciliation of the exchange option reported in accrued expenses and other liabilities in the Company’s consolidated balance sheets as of
July 1, 2016
.
|
2017 Exchange Options
|
2020 Exchange Options
|
Total
|
|||||||||
|
(in millions)
|
|||||||||||
|
Initial estimate upon acquisition
|
$
|
610
|
|
$
|
357
|
|
$
|
967
|
|
||
|
Net realized loss (gain)
|
8
|
|
8
|
|
16
|
|
|||||
|
Redemptions
|
(531
|
)
|
(283
|
)
|
(814
|
)
|
|||||
|
Net unrealized loss (gain)
|
—
|
|
(14
|
)
|
(14
|
)
|
|||||
|
Fair value at end of period
|
$
|
87
|
|
$
|
68
|
|
$
|
155
|
|
||
Financial Instruments Not Carried at Fair Value
For those financial instruments where the carrying amounts differ from fair value, the following table represents the related carrying values and fair values, which are based on quoted market prices. As of
July 1, 2016
, the Secured Notes, Unsecured Notes, Term Loan A, the U.S. Term Loan B tranche, the Euro Term Loan B tranche and senior secured bridge loan were categorized as Level 2, based on the frequency of trading directly prior to the end of the fourth quarter of 2016. See Note 3 to the consolidated financial statements for additional disclosures related to these financial instruments.
|
July 1, 2016
|
|||||||
|
Aggregated
Principal
|
Aggregated Fair Value
|
||||||
|
(in millions)
|
|||||||
|
Secured Notes
|
$
|
1,875
|
|
$
|
2,044
|
|
|
|
Unsecured Notes
|
3,350
|
|
3,575
|
|
|||
|
Term Loan A
|
4,125
|
|
4,161
|
|
|||
|
U.S. Term Loan B
|
3,750
|
|
3,773
|
|
|||
|
Euro Term Loan B
|
987
|
|
981
|
|
|||
|
Bridge Loan
|
3,000
|
|
3,000
|
|
|||
103
WESTERN DIGITAL CORPORATION
NOTES TO CONSOLIDATED FINANCIAL STATEMENTS — (Continued)
Cost Method Investments
As of
July 1, 2016
, the Company had aggregate net investments under the cost method of accounting of
$135 million
, and these investments consisted of privately-held equity securities without a readily determinable fair value. The Company has determined that it is not practicable to estimate the fair value of these investments. These privately-held equity investments are reported under other non-current assets in the consolidated balance sheets.
104
WESTERN DIGITAL CORPORATION
NOTES TO CONSOLIDATED FINANCIAL STATEMENTS — (Continued)
The following tables summarize, by major type, the fair value and cost basis of the Company’s investments classified as available-for-sale:
|
July 1, 2016
|
|||||||||||
|
Cost Basis
|
Unrealized Gains (Losses)
|
Fair Value
|
|||||||||
|
(in millions)
|
|||||||||||
|
Available-for-sale securities:
|
|||||||||||
|
U.S. Treasury securities
|
$
|
2
|
|
$
|
—
|
|
$
|
2
|
|
||
|
U.S. Government agency securities
|
10
|
|
—
|
|
10
|
|
|||||
|
Certificates of deposit
|
202
|
|
—
|
|
202
|
|
|||||
|
International government securities
|
1
|
|
—
|
|
1
|
|
|||||
|
Corporate notes and bonds
|
96
|
|
1
|
|
97
|
|
|||||
|
Asset-backed securities
|
22
|
|
—
|
|
22
|
|
|||||
|
Municipal notes and bonds
|
12
|
|
—
|
|
12
|
|
|||||
|
Total
|
$
|
345
|
|
$
|
1
|
|
$
|
346
|
|
||
|
July 3, 2015
|
|||||||||||
|
Cost Basis
|
Unrealized Gains (Losses)
|
Fair Value
|
|||||||||
|
(in millions)
|
|||||||||||
|
Available-for-sale securities:
|
|||||||||||
|
U.S. Treasury securities
|
$
|
287
|
|
$
|
—
|
|
$
|
287
|
|
||
|
U.S. Government agency securities
|
95
|
|
—
|
|
95
|
|
|||||
|
Commercial paper
|
109
|
|
—
|
|
109
|
|
|||||
|
Certificates of deposit
|
99
|
|
—
|
|
99
|
|
|||||
|
Total
|
$
|
590
|
|
$
|
—
|
|
$
|
590
|
|
||
The fair value of the Company’s investments classified as available-for-sale securities at
July 1, 2016
, by remaining contractual maturity, were as follows:
|
Cost Basis
|
Fair Value
|
||||||
|
(in millions)
|
|||||||
|
Due in less than one year (short-term investments)
|
$
|
226
|
|
$
|
227
|
|
|
|
Due in one to five years (included in other non-current assets)
|
119
|
|
119
|
|
|||
|
Total
|
$
|
345
|
|
$
|
346
|
|
|
The Company determined no available-for-sale securities were other-than-temporarily impaired in
2016
,
2015
or
2014
. For more information on the Company’s available-for-sale securities, see Note 11 to the consolidated financial statements.
In November 2015, the Company entered into an agreement to form a joint venture with Unis to market and sell the Company’s current data center storage systems in China and to develop data storage systems for the Chinese market in the future. A business plan for the joint venture has been completed, and the Company expects that the joint venture will be operational during calendar year 2016. The joint venture is
49%
owned by the Company and
51%
owned by Unis and its subsidiary, Unissoft (Wuxi) Group Co. Ltd. The Company accounts for its investment in the joint venture under the equity method of accounting. The investment is recorded within other non-current assets in the consolidated balance sheet and is not material to the consolidated financial statements as of
July 1, 2016
.
105
WESTERN DIGITAL CORPORATION
NOTES TO CONSOLIDATED FINANCIAL STATEMENTS — (Continued)
Foreign Exchange Contracts
As of
July 1, 2016
, the net amount of unrealized gains with respect to the Company’s foreign exchange contracts that is expected to be reclassified into earnings within the next 12 months was
$74 million
. In addition, as of
July 1, 2016
, the Company did not have any foreign exchange contracts with credit-risk-related contingent features. The Company opened
$5.3 billion
and
$4.6 billion
, and closed
$4.5 billion
and
$4.8 billion
, in foreign exchange contracts during the years ended
July 1, 2016
and
July 3, 2015
, respectively.
Call Options and Exchange Option Derivatives
The Company assumed call option and exchange option instruments related to the assumed SanDisk Notes in connection with the Merger. See Notes 3 and 11 for further discussion.
Derivative Instruments
The fair value and balance sheet location of the Company’s derivative instruments as of
July 1, 2016
and
July 3, 2015
were as follows:
|
Derivative Assets Reported in
|
|||||||||||||||
|
Other Current Assets
|
Other Non-current Assets
|
||||||||||||||
|
July 1,
2016 |
July 3,
2015 |
July 1,
2016 |
July 3,
2015 |
||||||||||||
|
(in millions)
|
|||||||||||||||
|
Foreign exchange forward contracts designated
|
$
|
114
|
|
$
|
—
|
|
$
|
—
|
|
$
|
—
|
|
|||
|
Foreign exchange forward contracts not designated
|
12
|
|
—
|
|
—
|
|
—
|
|
|||||||
|
Call options
|
70
|
|
—
|
|
1
|
|
—
|
|
|||||||
|
Total derivatives
|
$
|
196
|
|
$
|
—
|
|
$
|
1
|
|
$
|
—
|
|
|||
|
Derivative Liabilities Reported in
|
|||||||||||||||
|
Accrued Expenses
|
Other Liabilities
|
||||||||||||||
|
July 1,
2016 |
July 3,
2015 |
July 1,
2016 |
July 3,
2015 |
||||||||||||
|
(in millions)
|
|||||||||||||||
|
Foreign exchange forward contracts designated
|
$
|
23
|
|
$
|
31
|
|
$
|
—
|
|
$
|
—
|
|
|||
|
Foreign exchange forward contracts not designated
|
—
|
|
—
|
|
—
|
|
—
|
|
|||||||
|
Exchange option
|
141
|
|
—
|
|
14
|
|
—
|
|
|||||||
|
Total derivatives
|
$
|
164
|
|
$
|
31
|
|
$
|
14
|
|
$
|
—
|
|
|||
106
WESTERN DIGITAL CORPORATION
NOTES TO CONSOLIDATED FINANCIAL STATEMENTS — (Continued)
Netting Arrangements
The following table presents the gross amounts of the Company’s derivative instruments, amounts offset due to master netting arrangements with the Company’s various counterparties and the net amounts recognized in the consolidated balance sheet as of
July 1, 2016
:
|
Gross Amounts Not Offset in the Balance Sheet
|
||||||||||||||||||||||||
|
Derivatives Designated as Hedging Instruments
|
Gross Amounts of Recognized Assets (Liabilities)
|
Gross Amounts Offset in the Balance Sheet
|
Net Amounts of Assets (Liabilities) Presented in the Balance Sheet
|
Financial Instruments
|
Cash Collateral Received or Pledged
|
Net Amount
|
||||||||||||||||||
|
(in millions)
|
||||||||||||||||||||||||
|
Foreign exchange contracts
|
||||||||||||||||||||||||
|
Financial assets
|
$
|
118
|
|
$
|
(4
|
)
|
$
|
114
|
|
$
|
—
|
|
$
|
—
|
|
$
|
114
|
|
||||||
|
Financial liabilities
|
(27
|
)
|
4
|
|
(23
|
)
|
—
|
|
—
|
|
(23
|
)
|
||||||||||||
|
Total derivative instruments
|
$
|
91
|
|
$
|
—
|
|
$
|
91
|
|
$
|
—
|
|
$
|
—
|
|
$
|
91
|
|
||||||
The Company had a gross and net liability of
$31 million
related to its derivative instruments outstanding at
July 3, 2015
. There were no amounts offset due to master netting arrangements in place at
July 3, 2015
.
Effect of Foreign Exchange Contracts on the Consolidated Statements of Operations
The impact of foreign exchange contracts on the consolidated financial statements was as follows:
|
Derivatives in Cash Flow Hedging Relationships
|
Amount of Gain (Loss) Recognized in Accumulated Other Comprehensive Income on Derivatives
|
Amount of Gain (Loss) Reclassified from Accumulated Other Comprehensive Income into Income
|
||||||||||||||
|
2016
|
2015
|
2016
|
2015
|
|||||||||||||
|
(in millions)
|
||||||||||||||||
|
Foreign exchange contracts
|
$
|
48
|
|
$
|
(74
|
)
|
$
|
(51
|
)
|
$
|
(44
|
)
|
||||
The total net realized transaction and foreign exchange contract currency gains and losses were not material to the consolidated financial statements during
2016
,
2015
and
2014
. See Notes 1 and 11 to the consolidated financial statements for additional disclosures related to the Company’s foreign exchange contracts.
107
WESTERN DIGITAL CORPORATION
NOTES TO CONSOLIDATED FINANCIAL STATEMENTS — (Continued)
The following table summarizes the activity related to the carrying amount of goodwill:
|
Carrying Amount
|
|||
|
(in millions)
|
|||
|
Balance at June 27, 2014
|
$
|
2,559
|
|
|
Goodwill recorded in connection with acquisitions
|
207
|
|
|
|
Balance at July 3, 2015
|
2,766
|
|
|
|
Goodwill recorded in connection with acquisitions
|
7,183
|
|
|
|
Foreign currency translation adjustment
|
2
|
|
|
|
Balance at July 1, 2016
|
$
|
9,951
|
|
The following tables present intangible assets as of
July 1, 2016
and
July 3, 2015
:
|
July 1, 2016
|
|||||||||||||
|
Weighted Average Amortization Period
|
Gross Carrying Amount
|
Accumulated Amortization
|
Net Carrying Amount
|
||||||||||
|
|
(in years)
|
(in millions)
|
|||||||||||
|
Existing technology
|
3
|
$
|
2,008
|
|
$
|
632
|
|
$
|
1,376
|
|
|||
|
Trade names and trademarks
|
7
|
645
|
|
45
|
|
600
|
|
||||||
|
Customer relationships
|
6
|
628
|
|
157
|
|
471
|
|
||||||
|
Other
|
2
|
219
|
|
96
|
|
123
|
|
||||||
|
Leasehold interests
|
31
|
39
|
|
10
|
|
29
|
|
||||||
|
Total finite intangible assets
|
3,539
|
|
940
|
|
2,599
|
|
|||||||
|
In-process research and development
|
2,435
|
|
—
|
|
2,435
|
|
|||||||
|
Total intangible assets
|
$
|
5,974
|
|
$
|
940
|
|
$
|
5,034
|
|
||||
|
July 3, 2015
|
|||||||||||||
|
Weighted Average Amortization Period
|
Gross Carrying Amount
|
Accumulated Amortization
|
Net Carrying Amount
|
||||||||||
|
|
(in years)
|
(in millions)
|
|||||||||||
|
Existing technology
|
5
|
$
|
638
|
|
$
|
471
|
|
$
|
167
|
|
|||
|
Customer relationships
|
4
|
152
|
|
126
|
|
26
|
|
||||||
|
Other
|
3
|
74
|
|
68
|
|
6
|
|
||||||
|
Leasehold interests
|
31
|
39
|
|
11
|
|
28
|
|
||||||
|
Total finite intangible assets
|
903
|
|
676
|
|
227
|
|
|||||||
|
In-process research and development
|
105
|
|
—
|
|
105
|
|
|||||||
|
Total intangible assets
|
$
|
1,008
|
|
$
|
676
|
|
$
|
332
|
|
||||
Intangible assets are amortized over the estimated useful lives based on the pattern in which the economic benefits are expected to be received. Amortization expense for intangible assets was
$266 million
,
$171 million
and
$213 million
for
2016
,
2015
and
2014
, respectively. During
2016
,
2015
and
2014
, the Company recorded
$36 million
,
$39 million
and
$53 million
of impairment charges related to intangible assets, respectively, which are recorded in the employee termination, asset impairment and other charges within the Company’s consolidated statements of income. The impairment charges primarily relate to acquired IPR&D projects that were abandoned and resulted in full impairment.
108
WESTERN DIGITAL CORPORATION
NOTES TO CONSOLIDATED FINANCIAL STATEMENTS — (Continued)
The following table presents estimated future amortization expense for intangible assets currently subject to amortization:
|
July 1,
2016 |
|||
|
(in millions)
|
|||
|
2017
|
$
|
912
|
|
|
2018
|
670
|
|
|
|
2019
|
377
|
|
|
|
2020
|
167
|
|
|
|
2021
|
161
|
|
|
|
2022 and thereafter
|
312
|
|
|
|
Future amortization expense
|
$
|
2,599
|
|
109
WESTERN DIGITAL CORPORATION
NOTES TO CONSOLIDATED FINANCIAL STATEMENTS — (Continued)
The Company has pension and other post-retirement benefit plans in various countries. The Company’s principal plans are in Japan. All pension and other post-retirement benefit plans outside of the Company’s Japanese plans are immaterial to the Company’s consolidated financial statements.
Obligations and Funded Status
The changes in the benefit obligations and plan assets for the Japanese defined benefit pension plans were as follows for
2016
,
2015
and
2014
:
|
2016
|
2015
|
2014
|
|||||||||
|
(in millions)
|
|||||||||||
|
Change in benefit obligation:
|
|||||||||||
|
Benefit obligation at beginning of period
|
$
|
231
|
|
$
|
255
|
|
$
|
234
|
|
||
|
Service cost
|
8
|
|
9
|
|
10
|
|
|||||
|
Interest cost
|
3
|
|
4
|
|
4
|
|
|||||
|
Actuarial loss
|
52
|
|
16
|
|
13
|
|
|||||
|
Benefits paid
|
(16
|
)
|
(8
|
)
|
(7
|
)
|
|||||
|
Settlement/Curtailment
|
(1
|
)
|
—
|
|
—
|
|
|||||
|
Other
(1)
|
—
|
|
—
|
|
8
|
|
|||||
|
Non-U.S. currency movement
|
49
|
|
(45
|
)
|
(7
|
)
|
|||||
|
Benefit obligation at end of period
|
326
|
|
231
|
|
255
|
|
|||||
|
Change in plan assets:
|
|||||||||||
|
Fair value of plan assets at beginning of period
|
185
|
|
191
|
|
167
|
|
|||||
|
Actual return on plan assets
|
(14
|
)
|
22
|
|
15
|
|
|||||
|
Employer contributions
|
20
|
|
14
|
|
14
|
|
|||||
|
Benefits paid
|
(16
|
)
|
(8
|
)
|
(7
|
)
|
|||||
|
Other
(1)
|
—
|
|
—
|
|
7
|
|
|||||
|
Non-U.S. currency movement
|
37
|
|
(34
|
)
|
(5
|
)
|
|||||
|
Fair value of plan assets at end of period
|
212
|
|
185
|
|
191
|
|
|||||
|
Unfunded status at end of year
|
$
|
114
|
|
$
|
46
|
|
$
|
64
|
|
||
|
(1)
|
During fiscal 2014 the Japan entity assumed benefit obligations and plan assets from Hitachi Ltd. (“Hitachi”). These pension obligations related to former Hitachi employees who were hired into the HGST Japan entity during or soon after the 2012 acquisition of HGST by the Company.
|
The following table presents the unfunded amounts related to the Japanese defined pension plans as recognized on the Company’s consolidated balance sheets as of
July 1, 2016
and
July 3, 2015
:
|
July 1,
2016 |
July 3,
2015 |
||||||
|
(in millions)
|
|||||||
|
Current liabilities
|
$
|
—
|
|
$
|
1
|
|
|
|
Non-current liabilities
|
114
|
|
45
|
|
|||
|
Net amount recognized
|
$
|
114
|
|
$
|
46
|
|
|
The accumulated benefit obligation for the Japanese defined benefit pension plans was
$326 million
at
July 1, 2016
. As of
July 1, 2016
, actuarial gains for the Japanese defined benefit pension plans of
$57 million
are included in accumulated other comprehensive income (loss) in the consolidated balance sheet. There were
no
prior service credits for the defined benefit pension plans recognized in accumulated other comprehensive income (loss) in the consolidated balance sheet as of
July 1, 2016
.
110
WESTERN DIGITAL CORPORATION
NOTES TO CONSOLIDATED FINANCIAL STATEMENTS — (Continued)
Assumptions
Weighted-Average Assumptions
The weighted-average actuarial assumptions used to determine benefit obligations for the Japanese defined benefit pension plans were as follows for
2016
,
2015
and
2014
:
|
2016
|
2015
|
2014
|
||||||
|
Discount rate
|
0.4
|
%
|
1.3
|
%
|
1.6
|
%
|
||
|
Rate of compensation increase
|
0.8
|
%
|
0.9
|
%
|
1.0
|
%
|
||
The weighted-average actuarial assumptions used to determine benefit costs for the Japanese defined benefit pension plans were as follows for
2016
,
2015
and
2014
:
|
2016
|
2015
|
2014
|
||||||
|
Discount rate
|
1.3
|
%
|
1.6
|
%
|
1.6
|
%
|
||
|
Expected long-term rate of return on plan assets
|
2.5
|
%
|
3.5
|
%
|
3.5
|
%
|
||
|
Rate of compensation increase
|
0.9
|
%
|
1.0
|
%
|
0.9
|
%
|
||
The Company develops a discount rate by calculating when the estimated benefit payments will be due. Management in Japan then matches the benefit payments to AA or higher bond ratings that match the timing of the expected benefit payments to determine the appropriate discount rate.
The Company develops the expected long-term rate of return on plan assets by analyzing rates of return in Japan as well as the investment portfolio applicable to the plan. Management’s estimates of future rates of return on assets is based in large part on the projected rate of return from the respective investment managers using a long-term view of historical returns, as well as actuarial recommendations using the most current generational and mortality tables and rates.
The Company develops the rate of compensation increase assumptions using local compensation practices and historical rates of increases.
Plan Assets
Investment Policies and Strategies
The investment policy in Japan is to generate a stable return on investments over a long-term horizon in order to have adequate pension funds to meet the Company’s future obligations. In order to achieve this investment goal, a diversified portfolio with target asset allocation and expected rate of return is established by considering factors such as composition of participants, level of funded status, capacity to absorb risks and the current economic environment. The target asset allocation is
35%
in equity securities,
62%
in debt securities and the remaining
3%
in other assets. Risk management is accomplished through diversification, periodic review of plan asset performance and appropriate realignment of asset allocation. Assumptions regarding the expected long-term rate of return on plan assets are periodically reviewed and are based on the historical trend of returns, the risk and correlation of each asset and the latest economic environment.
The expected long-term rate of return is estimated based on many factors, including expected forecast for inflation, risk premiums for each asset class, expected asset allocation, current and future financial market conditions and diversification and rebalancing strategies. Historical return patterns and correlations, consensus return forecasts and other relevant financial factors are analyzed periodically by the investment advisor so as to ensure that the expected long-term rate of return is reasonable and appropriate.
111
WESTERN DIGITAL CORPORATION
NOTES TO CONSOLIDATED FINANCIAL STATEMENTS — (Continued)
Fair Value Measurements
The following tables present the Japanese defined benefit pension plans’ major asset categories and their associated fair values as of
July 1, 2016
and
July 3, 2015
:
|
July 1, 2016
|
|||||||||||||||
|
Level 1
|
Level 2
|
Level 3
|
Total
|
||||||||||||
|
(in millions)
|
|||||||||||||||
|
Equity:
|
|||||||||||||||
|
Equity securities
(1)
|
$
|
(1
|
)
|
$
|
—
|
|
$
|
—
|
|
$
|
(1
|
)
|
|||
|
Equity commingled/mutual funds
(1)(2)
|
—
|
|
72
|
|
—
|
|
72
|
|
|||||||
|
Fixed income commingled/mutual funds
(1)(3)
|
—
|
|
129
|
|
—
|
|
129
|
|
|||||||
|
Cash and short-term investments
|
9
|
|
3
|
|
—
|
|
12
|
|
|||||||
|
Fair value of plan assets
|
$
|
8
|
|
$
|
204
|
|
$
|
—
|
|
$
|
212
|
|
|||
|
July 3, 2015
|
|||||||||||||||
|
Level 1
|
Level 2
|
Level 3
|
Total
|
||||||||||||
|
(in millions)
|
|||||||||||||||
|
Equity commingled/mutual funds
(1)(2)
|
$
|
—
|
|
$
|
65
|
|
$
|
—
|
|
$
|
65
|
|
|||
|
Fixed income commingled/mutual funds
(1)(3)
|
—
|
|
112
|
|
—
|
|
112
|
|
|||||||
|
Cash and short-term investments
|
6
|
|
2
|
|
—
|
|
8
|
|
|||||||
|
Fair value of plan assets
|
$
|
6
|
|
$
|
179
|
|
$
|
—
|
|
$
|
185
|
|
|||
|
(1)
|
Commingled funds represent pooled institutional investments.
|
|
(2)
|
Equity mutual funds invest primarily in equity securities.
|
|
(3)
|
Fixed income mutual funds invest primarily in fixed income securities.
|
Assets held in defined benefit plans in the Philippines, Taiwan and Thailand were less than
$1 million
and are not presented in the above tables. There were no significant movements of assets between any level categories in
2016
,
2015
or
2014
.
Fair Value Valuation Techniques
Equity securities are valued at the closing price reported on the stock exchange on which the individual securities are traded. Equity commingled/mutual funds are typically valued using the net asset value (“NAV”) provided by the investment manager or administrator of the fund. The NAV is based on the value of the underlying assets owned by the fund, minus liabilities and divided by the number of shares or units outstanding. These assets are classified as either Level 1 or Level 2, depending on availability of quoted market prices for identical or similar assets.
If available, fixed income securities are valued using the close price reported on the major market on which the individual securities are traded and are classified as Level 1. The fair value of other fixed income securities is typically estimated using pricing models and quoted prices of securities with similar characteristics, and is generally classified as Level 2.
Cash includes money market accounts that are valued at their cost plus interest on a daily basis, which approximates fair value. Short-term investments represent securities with original maturities of one year or less. These assets are classified as either Level 1 or Level 2.
Cash Flows
Contributions
The Company’s expected employer contributions for
2017
are
$9 million
for its Japanese defined benefit pension plans.
Estimated Future Benefits Payments
Annual benefit payments from the Japanese defined benefit pension plans are estimated to range from
$6 million
to
$13 million
annually over the next
five
years.
112
WESTERN DIGITAL CORPORATION
NOTES TO CONSOLIDATED FINANCIAL STATEMENTS — (Continued)
The consolidated financial statements include the results of operations of acquired companies commencing after their respective acquisition dates.
Acquisition of SanDisk
On May 12, 2016, WDT, a wholly-owned subsidiary of the Company, completed the acquisition of SanDisk, a global leader in NAND flash storage solutions. The Merger is primarily intended to deepen the Company’s expertise in non-volatile memory and enable the Company to vertically integrate into NAND, securing long-term access to solid state technology at a lower cost.
At the SanDisk Closing Date, each issued and outstanding share of SanDisk common stock, other than shares of SanDisk common stock held in the treasury of SanDisk, shares of SanDisk common stock owned by stockholders who had validly exercised their appraisal rights under Delaware law and shares of SanDisk common stock owned by Western Digital or any subsidiary of Western Digital, was converted into the right to receive
$67.50
per share in cash; and
0.2387
shares of Western Digital common stock per share of SanDisk common stock, with cash paid in lieu of fractional shares.
The aggregate purchase price of the SanDisk acquisition was
$15.588 billion
, consisting of
$13.77 billion
in cash funded with existing cash and cash from new debt,
49 million
newly issued shares of the Company’s common stock with a fair value of
$1.76 billion
and
$58 million
related to the fair value of stock options and RSUs assumed. The fair value of the newly issued shares of the Company’s common stock was determined based on the closing market price of the Company’s shares of common stock on the date of the acquisition. The fair values of stock options assumed were estimated using a binomial option-pricing model.
|
May 12,
2016 |
|||
|
(in millions)
|
|||
|
Cash consideration
|
$
|
13,766
|
|
|
Equity consideration
|
1,764
|
|
|
|
Fair value of assumed equity attributed to pre-combination service
|
58
|
|
|
|
Total purchase price
|
$
|
15,588
|
|
Assets Acquired and Liabilities Assumed at Fair Value
The transaction has been accounted for using the acquisition method of accounting which requires that assets acquired and liabilities assumed be recognized at their fair values as of the acquisition date. The values assigned to the assets acquired and liabilities assumed are based on preliminary estimates of fair value available as of the date of this Annual Report on Form 10-K, and may be adjusted during the measurement period of up to 12 months from the date of acquisition as further information becomes available. Any changes in the fair values of the assets acquired and liabilities assumed during the measurement period may result in adjustments to goodwill. As of
July 1, 2016
, the primary areas that are not yet finalized due to information that may become available subsequently and may result in changes in the values assigned to various assets and liabilities, include the fair values of acquired property, plant and equipment, intangible assets and related deferred tax liabilities as well as assumed tax assets and liabilities.
113
WESTERN DIGITAL CORPORATION
NOTES TO CONSOLIDATED FINANCIAL STATEMENTS — (Continued)
The following table summarizes the preliminary fair values of the assets acquired and liabilities assumed at the SanDisk Closing Date:
|
May 12,
2016 |
|||
|
(in millions)
|
|||
|
Cash and cash equivalents
|
$
|
3,931
|
|
|
Marketable securities
|
737
|
|
|
|
Accounts receivables, net
|
394
|
|
|
|
Inventories
|
1,069
|
|
|
|
Other current assets
|
787
|
|
|
|
Property, plant and equipment
|
917
|
|
|
|
Notes receivable and investments in Flash Ventures
|
1,012
|
|
|
|
Intangible assets
|
4,955
|
|
|
|
Other non-current assets
|
144
|
|
|
|
Total assets
|
13,946
|
|
|
|
Accounts payable, accrued liabilities and other current liabilities
|
1,036
|
|
|
|
Deferred tax liabilities
|
572
|
|
|
|
Other long-term liabilities
|
190
|
|
|
|
Convertible notes and related derivatives
|
3,743
|
|
|
|
Total liabilities
|
5,541
|
|
|
|
Net assets acquired
|
8,405
|
|
|
|
Goodwill
|
7,183
|
|
|
|
Total purchase price
|
$
|
15,588
|
|
Accounts Receivable, Net
Accounts receivable are net of allowances for program-related incentives and doubtful accounts of
$262 million
.
Inventories
Finished goods were valued at estimated selling prices less costs of disposal and a reasonable profit allowance for the selling effort. Work-in-process inventory was valued at estimated selling prices less costs to complete, costs of disposal and a reasonable profit allowance for the completion and selling effort, or at estimated replacement costs for certain components. Raw materials were valued at estimated replacement costs at the date of acquisition.
Property, Plant and Equipment
The property, plant and equipment acquired were valued using either the replacement cost or market value approach, as appropriate, as of the date of acquisition. The following table summarizes the preliminary estimated fair value of the property, plant and equipment acquired and their estimated useful lives:
|
Estimated Fair Value
|
Estimated Weighted-Average Useful Life
|
||||
|
(in millions)
|
(in years)
|
||||
|
Land
|
$
|
73
|
|
—
|
|
|
Buildings
|
315
|
|
15
|
||
|
Machinery and equipment
|
491
|
|
2
|
||
|
Furniture and fixtures
|
16
|
|
4
|
||
|
Leasehold improvements
|
22
|
|
5
|
||
|
Total property, plant and equipment
|
$
|
917
|
|
||
114
WESTERN DIGITAL CORPORATION
NOTES TO CONSOLIDATED FINANCIAL STATEMENTS — (Continued)
Identifiable Intangible Assets Acquired
The following table summarizes the preliminary fair values and estimated useful lives of the intangibles acquired:
|
Estimated Fair Value
|
Estimated Weighted-Average Useful Life
|
||||
|
(in millions)
|
(in years)
|
||||
|
Developed technology
|
$
|
1,360
|
|
2.5
|
|
|
Trade name and trademarks
|
610
|
|
7.0
|
||
|
Customer relationships
|
475
|
|
7.0
|
||
|
Supply agreements
|
130
|
|
2.5
|
||
|
Backlog
|
50
|
|
0.1
|
||
|
In-process research and development
|
2,330
|
|
N/A
|
||
|
Total acquired identifiable intangible assets
|
$
|
4,955
|
|
||
The fair values of the identifiable intangible assets acquired were estimated using an income approach. The fair value of the finite-lived intangible assets will be amortized over the estimated useful lives based on the pattern in which the economic benefits are expected to be received to cost of revenue and operating expenses. SanDisk had IPR&D projects associated with new generations of 3D BICS memory technology, a next generation of controllers for retail products, and a new platform for enterprise solutions products that have not yet reached technological feasibility as of the SanDisk Closing Date. These projects are expected to enable increased layers in and achieve lower costs for memory products compared to existing 2D NAND technology, improve controller performance and cost, and expand the range of enterprise solutions offerings. Accordingly, the Company recorded indefinite-lived intangible assets of
$2.3 billion
for the fair value of these projects, which will initially not be amortized. Instead, the projects will be tested for impairment on an annual basis or more frequently whenever events or changes in circumstances indicate that the projects may be impaired or may have reached technological feasibility. Once a project reaches technological feasibility, the Company will begin to amortize the intangible asset over its estimated useful life.
Goodwill
Goodwill represents the excess of the preliminary estimated purchase price over the sum of the estimated fair values assigned to assets acquired less liabilities assumed. The
$7.18 billion
of goodwill recognized is primarily attributable to the benefits the Company expects to derive from deepening the Company’s expertise in non-volatile memory and enabling the Company to vertically integrate into NAND, securing long-term access to solid state technology at a lower cost. None of the goodwill is expected to be deductible for tax purposes.
Convertible Notes and Related Derivatives
On the SanDisk Closing Date, SanDisk had outstanding
$997 million
aggregate principal amount of the 2017 Notes and
$1.5 billion
aggregate principal amount of the 2020 Notes. Concurrently with the issuance of the SanDisk Notes, SanDisk also purchased call options and sold warrants. The assumed liability for the SanDisk Notes and related derivatives reflects the estimated fair values of the SanDisk Notes and the related call options and warrants. See Note 3 to the consolidated financial statements for additional disclosures related to the SanDisk Notes.
Stock-Based Compensation
In connection with the Merger, each outstanding SanDisk option and RSU that was unvested as of the SanDisk Closing Date and each outstanding underwater vested option was converted into equivalent options and RSUs, in each case with respect to shares of the Company’s common stock, using the equity award exchange ratio in accordance with the Merger agreement. The value of these converted awards related to pre-combination expense was
$58 million
and is included in the aggregate purchase price. The remaining value of the converted awards represents post-combination expense and will be recognized by the Company over the remaining service periods. As of
July 1, 2016
, the future expense for the assumed SanDisk options and RSUs was
$347 million
, which will be recognized over a weighted average service period of approximately
2.7
years.
115
WESTERN DIGITAL CORPORATION
NOTES TO CONSOLIDATED FINANCIAL STATEMENTS — (Continued)
Acquisition-related Expenses
During
2016
, the Company incurred
$98 million
of transaction expenses related to the Merger, which are included within selling, general and administrative expense in the consolidated statements of income. During
2016
, the Company incurred merger-related charges of
$30 million
associated with the acceleration of certain equity awards in connection with the Merger, of which
$24 million
was recorded in selling, general and administrative expenses and
$6 million
was recorded in R&D. The Company also incurred
$31 million
of other acquisition related expenses, primarily consisting of retention and separation costs in connection with the Merger which are included in selling, general and administrative expenses in
2016
.
SanDisk Results
Management does not have a practical method for allocating certain costs and tax elements to the SanDisk operations; however, the amount of revenue attributable to SanDisk in the Company’s consolidated statement of income from the acquisition date to
July 1, 2016
was
$793 million
.
Pro Forma Financial Information (Unaudited)
The unaudited financial information in the table below summarizes the combined results of operations of the Company and SanDisk, on a pro forma basis, as though the combination had occurred as of the beginning of fiscal 2015. The pro forma financial information presented includes the effects of adjustments related to the fair value of acquired inventory, amortization charges from acquired intangible assets, depreciation charges from acquired fixed assets, interest expenses from financing the acquisition, share-based compensation expenses from the conversion of unvested equity awards and the elimination of certain expenses directly related to the transaction. The pro forma financial information as presented below is for informational purposes only and is not necessarily indicative of the results of operations that would have been achieved if the acquisition and any borrowings undertaken to finance the acquisition had taken place at the beginning of the earliest period presented, nor does it intend to be a projection of future results:
|
2016
|
2015
|
||||||
|
(in millions, except per share amounts)
|
|||||||
|
Revenue
|
$
|
17,846
|
|
$
|
20,613
|
|
|
|
Net income
|
65
|
|
762
|
|
|||
|
Basic income per common share
|
$
|
0.23
|
|
$
|
2.71
|
|
|
|
Diluted income per common share
|
0.23
|
|
2.65
|
|
|||
Acquisition of Amplidata
On March 9, 2015, the Company acquired Amplidata NV (“Amplidata”), a developer of object storage software for public and private cloud data centers. As a result of the acquisition, Amplidata became a wholly owned indirect subsidiary of the Company. The purchase price of the acquisition was
$267 million
, consisting of
$245 million
funded with available cash at the time of the acquisition,
$19 million
related to the fair value of a previously-held cost method investment and
$3 million
related to the fair value of stock options assumed. The acquisition furthers the Company’s strategy to expand into higher value data storage platforms and systems that address the growth in storage requirements in cloud data centers.
The Company identified and recorded the assets acquired and liabilities assumed at their estimated fair values at the date of acquisition and allocated the remaining value of
$215 million
to goodwill. The values assigned to the acquired assets and liabilities were finalized prior to March 9, 2016, which was the final date of the 12-month measurement period following the date of the acquisition. The individual tangible and intangible assets acquired as well as the liabilities assumed in the acquisition were immaterial to the Company’s consolidated financial statements.
The final purchase price allocation for Amplidata was as follows:
|
|
March 9,
2015
|
||
|
(in millions)
|
|||
|
Tangible assets acquired and (liabilities) assumed, net
|
$
|
(24
|
)
|
|
Intangible assets
|
76
|
|
|
|
Goodwill
|
215
|
|
|
|
Total
|
$
|
267
|
|
116
WESTERN DIGITAL CORPORATION
NOTES TO CONSOLIDATED FINANCIAL STATEMENTS — (Continued)
The final purchase price allocation reflects adjustments since the date of acquisition, that consist of an increase of
$42 million
to goodwill, which primarily related to an adjustment to the value of deferred taxes acquired, an adjustment to the value of intangible assets acquired and an adjustment for the fair value of stock options assumed in the acquisition of Amplidata. The
$215 million
of goodwill recognized is primarily attributable to the benefits the Company expects to derive from an ability to create HDD storage solutions leveraging the core software acquired and is not expected to be deductible for tax purposes. The impact to revenue and net income attributable to Amplidata was immaterial to the Company’s consolidated financial statements for
2016
.
117
The Company recorded the following charges related to employee terminations benefits, asset impairment and other charges:
|
2016
|
2015
|
2014
|
|||||||||
|
(in millions)
|
|||||||||||
|
Employee termination and other charges:
|
|||||||||||
|
Restructuring Plan
|
$
|
77
|
|
$
|
—
|
|
$
|
—
|
|
||
|
Closure of Foreign Manufacturing Facility
|
128
|
|
—
|
|
—
|
|
|||||
|
Business Realignment
|
103
|
|
94
|
|
33
|
|
|||||
|
Total employee termination and other charges
|
308
|
|
94
|
|
33
|
|
|||||
|
Asset impairment:
|
|||||||||||
|
Restructuring Plan
|
5
|
|
—
|
|
—
|
|
|||||
|
Closure of Foreign Manufacturing Facility
|
24
|
|
—
|
|
—
|
|
|||||
|
Business Realignment
|
8
|
|
82
|
|
62
|
|
|||||
|
Total asset impairment
|
37
|
|
82
|
|
62
|
|
|||||
|
Total employee termination, asset impairment and other charges
|
$
|
345
|
|
$
|
176
|
|
$
|
95
|
|
||
Restructuring Plan
In
2016
, the Company initiated a set of actions relating to the restructuring plan associated with the integration of substantial portions of its HGST and WD subsidiaries (the “Restructuring Plan”). The Restructuring Plan consists of asset and footprint reduction, product roadmap consolidation and organization rationalization.
The Company expects the Restructuring Plan to be substantially completed by the end of calendar year 2017 and it is expected to result in total pre-tax charges of
$400 million
. These charges are expected to consist of
$185 million
in employee termination benefits,
$125 million
in asset charges and
$90 million
in other related costs.
$275 million
of these charges are expected to be cash expenditures. All of the components of the Restructuring Plan are not finalized, and actual costs, cash expenditures and timing may vary from the Company’s estimates due to changes in the scope or assumptions underlying the Restructuring Plan.
In
2016
, the Company recognized
$82 million
of expenses related to the Restructuring Plan, which consisted of
$58 million
in employee termination benefits,
$19 million
in contract termination and other charges, and
$5 million
in asset impairment. In addition, the Company recognized
$22 million
of accelerated depreciation charges on facility assets in cost of revenue.
The following table presents an analysis of the components of the restructuring charges, payments and adjustments made against the reserve as of
July 1, 2016
:
|
Employee Termination Benefits
|
Contract Termination and Other
|
Total
|
|||||||||
|
(in millions)
|
|||||||||||
|
Charges
|
$
|
58
|
|
$
|
19
|
|
$
|
77
|
|
||
|
Cash payments
|
(32
|
)
|
(19
|
)
|
(51
|
)
|
|||||
|
Accrual balance at July 1, 2016
|
$
|
26
|
|
$
|
—
|
|
$
|
26
|
|
||
118
Closure of Foreign Manufacturing Facility
In January 2016, the Company announced the closing of its head component front end wafer manufacturing facility in Odawara, Japan, in order to reduce manufacturing costs. In
2016
, the Company recognized
$152 million
of expenses related to the closure of the facility, which consisted of
$119 million
in employee termination benefits,
$24 million
in asset impairment and
$9 million
in contract termination and other charges. In addition, the Company recognized
$48 million
of accelerated depreciation charges on assets held at the Odawara facility, of which
$34 million
was recognized in cost of revenue and
$14 million
was recognized in R&D within the consolidated statements of income. As of
July 1, 2016
, the Company substantially completed all activities related to the closure of the facility.
The following table presents an analysis of the components of the restructuring charges, payments and adjustments made against the reserve as of
July 1, 2016
:
|
Employee Termination Benefits
|
Contract Termination and Other
|
Total
|
|||||||||
|
(in millions)
|
|||||||||||
|
Charges
|
$
|
119
|
|
$
|
9
|
|
$
|
128
|
|
||
|
Cash payments
|
(104
|
)
|
(10
|
)
|
(114
|
)
|
|||||
|
Non-cash items
|
(1
|
)
|
1
|
|
—
|
|
|||||
|
Accrual balance at July 1, 2016
|
$
|
14
|
|
$
|
—
|
|
$
|
14
|
|
||
Business Realignment
The Company periodically incurs charges to realign its operations with anticipated market demand. In
2016
, the Company recognized
$111 million
of expenses related to the realignment activities, which consisted of
$74 million
in employee termination benefits,
$8 million
in asset impairment and
$29 million
in contract termination and other charges. In
2015
, the Company recognized
$176 million
of expenses related to the realignment activities, which consisted of
$82 million
in employee termination benefits,
$82 million
in asset impairment and
$12 million
in contract termination and other charges. In
2014
, the Company recognized
$95 million
of expenses related to the realignment activities, which consisted of
$27 million
in employee termination benefits,
$62 million
in asset impairment and
$6 million
in contract termination and other charges.
The following table presents an analysis of the components of the restructuring charges, payments and adjustments made against the reserve as of
July 1, 2016
:
|
Employee Termination Benefits
|
Contract Termination and Other
|
Total
|
|||||||||
|
(in millions)
|
|||||||||||
|
Accrual balance at June 27, 2014
|
$
|
—
|
|
$
|
—
|
|
$
|
—
|
|
||
|
Charges
|
82
|
|
12
|
|
94
|
|
|||||
|
Cash payments
|
(72
|
)
|
(2
|
)
|
(74
|
)
|
|||||
|
Non-cash items and other
|
—
|
|
(10
|
)
|
(10
|
)
|
|||||
|
Accrual balance at July 3, 2015
|
10
|
|
—
|
|
10
|
|
|||||
|
Charges
|
74
|
|
29
|
|
103
|
|
|||||
|
Cash payments
|
(67
|
)
|
(23
|
)
|
(90
|
)
|
|||||
|
Non-cash items and other
|
(6
|
)
|
(3
|
)
|
(9
|
)
|
|||||
|
Accrual balance at July 1, 2016
|
$
|
11
|
|
$
|
3
|
|
$
|
14
|
|
||
119
WESTERN DIGITAL CORPORATION
NOTES TO CONSOLIDATED FINANCIAL STATEMENTS — (Continued)
|
First
(1)
|
Second
(2)
|
Third
(3)
|
Fourth
(4)
|
||||||||||||
|
(in millions, except per share amounts)
|
|||||||||||||||
|
2016
|
|||||||||||||||
|
Revenue, net
|
$
|
3,360
|
|
$
|
3,317
|
|
$
|
2,822
|
|
$
|
3,495
|
|
|||
|
Gross profit
|
955
|
|
906
|
|
753
|
|
821
|
|
|||||||
|
Operating income
|
322
|
|
251
|
|
88
|
|
(195
|
)
|
|||||||
|
Net income
|
283
|
|
251
|
|
74
|
|
(366
|
)
|
|||||||
|
Basic income per common share
|
$
|
1.23
|
|
$
|
1.08
|
|
$
|
0.32
|
|
$
|
(1.40
|
)
|
|||
|
Diluted income per common share
|
$
|
1.21
|
|
$
|
1.07
|
|
$
|
0.32
|
|
$
|
(1.40
|
)
|
|||
|
(1)
|
Includes
$56 million
of employee termination, asset impairment and other charges related to business realignment.
|
|
(2)
|
Includes
$27 million
of employee termination, asset impairment and other charges related to business realignment,
$32 million
of charges related to interest on an arbitration award and
$27 million
of costs related to the acquisition of SanDisk.
|
|
(3)
|
Includes
$140 million
of employee termination, asset impairment and other charges related to the closure of the Company’s Odawara Facility and business realignment and
$16 million
of costs related to the acquisition of SanDisk.
|
|
(4)
|
Includes
$122 million
of employee termination, asset impairment and other charges related to the closure of the Company’s Odawara Facility and Restructuring Plan, and
$116 million
of costs related to the acquisition of SanDisk.
|
|
First
(1)
|
Second
(2)
|
Third
(3)
|
Fourth
(4)
|
||||||||||||
|
(in millions, except per share amounts)
|
|||||||||||||||
|
2015
|
|||||||||||||||
|
Revenue, net
|
$
|
3,943
|
|
$
|
3,888
|
|
$
|
3,550
|
|
$
|
3,191
|
|
|||
|
Gross profit
|
1,149
|
|
1,110
|
|
1,032
|
|
930
|
|
|||||||
|
Operating income
|
469
|
|
466
|
|
421
|
|
255
|
|
|||||||
|
Net income
|
423
|
|
438
|
|
384
|
|
220
|
|
|||||||
|
Basic income per common share
|
$
|
1.81
|
|
$
|
1.88
|
|
$
|
1.66
|
|
$
|
0.95
|
|
|||
|
Diluted income per common share
|
$
|
1.76
|
|
$
|
1.84
|
|
$
|
1.63
|
|
$
|
0.94
|
|
|||
|
(1)
|
Includes
$9 million
of employee termination, asset impairment and other charges and
$14 million
of charges related to interest on an arbitration award.
|
|
(2)
|
Includes
$53 million
of employee termination, asset impairment and other charges,
$1 million
of charges related to interest on an arbitration award and a
$37 million
gain on flood-related insurance recovery.
|
|
(3)
|
Includes
$10 million
of employee termination, asset impairment and other charges.
|
|
(4)
|
Includes
$104 million
of employee termination, asset impairment and other charges.
|
120
WESTERN DIGITAL CORPORATION
NOTES TO CONSOLIDATED FINANCIAL STATEMENTS — (Continued)
On July 21, 2016, the Company paid in full
$3.0 billion
aggregate principal amount outstanding of the Additional Bridge Facility, together with accrued interest. For additional information on debt, see Note 3 to the consolidated financial statements.
On August 17, 2016 the Company issued a new
$3.0 billion
U.S. dollar-denominated Term Loan B-1 at an interest rate of LIBOR plus
3.75%
or a base rate plus
2.75%
. Principal payments of
0.25%
are due quarterly beginning September 30, 2016 with the balance due on April 29, 2023. In connection with this transaction, the Company settled the previous U.S. Term Loan B tranche with the proceeds of this new loan and a voluntary cash prepayment of
$750 million
.
121
WESTERN DIGITAL CORPORATION
SCHEDULE II — CONSOLIDATED VALUATION AND QUALIFYING ACCOUNTS
(in millions)
|
|
Allowance for Doubtful Accounts
|
||
|
Balance at June 28, 2013
|
$
|
9
|
|
|
Additions charges to operations
|
3
|
|
|
|
Deductions
|
(1
|
)
|
|
|
Balance at June 27, 2014
|
11
|
|
|
|
Deductions
|
(4
|
)
|
|
|
Balance at July 3, 2015
|
7
|
|
|
|
Balance assumed as a result of SanDisk acquisition
|
6
|
|
|
|
Deductions
|
(3
|
)
|
|
|
Balance at July 1, 2016
|
$
|
10
|
|
122
Item 9.
Changes in and Disagreements with Accountants on Accounting and Financial Disclosure
None.
Item 9A.
Controls and Procedures
Evaluation of Disclosure Controls and Procedures
As required by SEC Rule 13a-15(b) of the Securities Exchange Act of 1934, as amended (the “Exchange Act”), we carried out an evaluation, under the supervision and with the participation of our management, including our Chief Executive Officer and Chief Financial Officer, of the effectiveness of the design and operation of our disclosure controls and procedures (as such term is defined in Rule 13a-15(e) under the Exchange Act) as of the end of the period covered by this Annual Report on Form 10-K.
Based on that evaluation, our Chief Executive Officer and Chief Financial Officer concluded that, as of the end of the period covered by this Annual Report on Form 10-K, our disclosure controls and procedures were effective.
Management’s Report on Internal Control over Financial Reporting
Our management is responsible for establishing and maintaining adequate internal control over financial reporting (as defined in Rules 13a-15(f) and 15d-15(f) of the Exchange Act) to provide reasonable assurance regarding the reliability of our financial reporting and the preparation of financial statements for external purposes in accordance with generally accepted accounting principles. Internal control over financial reporting includes those policies and procedures that (i) pertain to the maintenance of records that in reasonable detail accurately and fairly reflect the transactions and dispositions of our assets; (ii) provide reasonable assurance that the transactions are recorded as necessary to permit preparation of financial statements in accordance with generally accepted accounting principles, and that our receipts and expenditures are being made only in accordance with authorizations of our management and our directors; and (iii) provide reasonable assurance regarding prevention or timely detection of unauthorized acquisition, use or disposition of our assets that could have a material effect on the financial statements.
Our management evaluated the effectiveness of our internal control over financial reporting using the criteria set forth by the Committee of Sponsoring Organizations of the Treadway Commission (COSO) in
Internal Control — Integrated Framework (2013).
Based on this evaluation, our management concluded that our internal control over financial reporting was effective as of the end of the period covered by this Annual Report on Form 10-K. KPMG LLP, our independent registered public accounting firm, which audited the consolidated financial statements included in this Annual Report on Form 10-K, has issued an audit report on our internal control over financial reporting. See Report of Independent Registered Public Accounting Firm herein.
Our evaluation did not include the internal controls over financial reporting of SanDisk Corporation, which was acquired on May 12, 2016. Total assets and total sales related to SanDisk represented
17%
and
6%
, respectively, of the related consolidated financial statement amounts as of and for the fiscal year ended
July 1, 2016
.
Changes in Internal Control over Financial Reporting
There has been no change in our internal control over financial reporting during the fourth fiscal quarter ended
July 1, 2016
, that has materially affected, or is reasonably likely to materially affect, our internal control over financial reporting.
Inherent Limitations of Effectiveness of Controls
Our management, including our Chief Executive Officer and our Chief Financial Officer, does not expect our internal controls over financial reporting will prevent all error and all fraud. A control system, no matter how well conceived and operated, can provide only reasonable, not absolute, assurance that the objectives of the control system are met. Further, the benefits of controls must be considered relative to their costs. Because of the inherent limitations in a system of internal control over financial reporting, no evaluation of controls can provide absolute assurance that all control issues and instances of fraud, if any, have been detected. These inherent limitations include the realities that judgments in decision-making can be faulty, and that breakdowns can occur because of simple error or mistake. Additionally, controls can be circumvented by the individual acts of some persons, by collusion of two or more people, or by management override of the control. The design of any system of controls is also based in part upon certain assumptions about the likelihood of future events, and there can be no assurance that any design will succeed in achieving its stated goals under all potential future conditions. Because of the inherent limitations in a cost-effective control system, misstatements due to error or fraud may occur and not be detected.
Item 9B.
Other Information
None.
123
Item 10.
Directors, Executive Officers and Corporate Governance
There is incorporated herein by reference the information required by this Item included in the Company’s Proxy Statement for the
2016
Annual Meeting of Stockholders, which will be filed with the SEC no later than 120 days after the close of the fiscal year ended
July 1, 2016
. In addition, our Board of Directors has adopted a Code of Business Ethics that applies to all of our directors, employees and officers, including our Chief Executive Officer and Chief Financial Officer. The current version of the Code of Business Ethics is available on our website under the Governance section at www.westerndigital.com. To the extent required by rules adopted by the SEC and The NASDAQ Stock Market LLC, we intend to promptly disclose future amendments to certain provisions of the Code of Business Ethics, or waivers of such provisions granted to executive officers and directors, on our website under the Governance section at www.westerndigital.com.
Item 11.
Executive Compensation
There is incorporated herein by reference the information required by this Item included in the Company’s Proxy Statement for the
2016
Annual Meeting of Stockholders, which will be filed with the SEC no later than 120 days after the close of the fiscal year ended
July 1, 2016
.
Item 12.
Security Ownership of Certain Beneficial Owners and Management and Related Stockholder Matters
There is incorporated herein by reference the information required by this Item included in the Company’s Proxy Statement for the
2016
Annual Meeting of Stockholders, which will be filed with the SEC no later than 120 days after the close of the fiscal year ended
July 1, 2016
.
Item 13.
Certain Relationships and Related Transactions and Director Independence
There is incorporated herein by reference the information required by this Item included in the Company’s Proxy Statement for the
2016
Annual Meeting of Stockholders, which will be filed with the SEC no later than 120 days after the close of the fiscal year ended
July 1, 2016
.
Item 14.
Principal Accountant Fees and Services
There is incorporated herein by reference the information required by this Item included in the Company’s Proxy Statement for the
2016
Annual Meeting of Stockholders, which will be filed with the SEC no later than 120 days after the close of the fiscal year ended
July 1, 2016
.
Item 15.
Exhibits and Financial Statement Schedules
(a) Documents filed as a part of this Annual Report on Form 10-K:
(1) Financial Statements
The financial statements included in Part II, Item 8 of this document are filed as part of this Annual Report on
Form 10-K.
(2) Financial Statement Schedules
The financial statement schedule included in Part II, Item 8 of this document is filed as part of this Annual Report on
Form 10-K.
All other schedules are omitted as the required information is inapplicable or the information is presented in the consolidated financial statements or related Notes.
Separate financial statements have been omitted as we are primarily an operating company and our subsidiaries are wholly or majority owned and do not have minority equity interests and/or indebtedness to any person other than us in amounts which together exceed
5%
of the total consolidated assets as shown by the most recent year-end consolidated balance sheet.
124
(3) Exhibits
The exhibits listed in the Exhibit Index (following the signature page of the Annual Report on Form 10-K) are filed with, or incorporated by reference in, this Annual Report on Form 10-K, as specified in the Exhibit List, from exhibits previously filed with the SEC. Certain agreements listed in the Exhibit List that we have filed or incorporated by reference may contain representations and warranties by us or our subsidiaries. These representations and warranties have been made solely for the benefit of the other party or parties to such agreements and (i) may have been qualified by disclosures made to such other party or parties, (ii) were made only as of the date of such agreements or such other date(s) as may be specified in such agreements and are subject to more recent developments, which may not be fully reflected in our public disclosures, (iii) may reflect the allocation of risk among the parties to such agreements and (iv) may apply materiality standards different from what may be viewed as material to investors. Accordingly, these representations and warranties may not describe the actual state of affairs at the date hereof and should not be relied upon.
125
SIGNATURES
Pursuant to the requirements of Section 13 or 15(d) of the Securities Exchange Act of 1934, the Registrant has duly caused this Annual Report on Form 10-K to be signed on its behalf by the undersigned, thereunto duly authorized.
|
WESTERN DIGITAL CORPORATION
|
||
|
By:
|
/s/ OLIVIER C. LEONETTI
|
|
|
Olivier C. Leonetti
|
||
|
Chief Financial Officer
|
||
|
(Principal Financial Officer and Principal Accounting Officer)
|
||
Dated:
August 26, 2016
Pursuant to the requirements of the Securities Exchange Act of 1934, this Annual Report on Form 10-K has been signed below by the following persons on behalf of the Registrant and in the capacities and on the dates indicated.
|
Signature
|
Title
|
Date
|
||
|
/s/ STEPHEN D. MILLIGAN
|
President and Chief Executive Officer
(Principal Executive Officer), Director
|
August 26, 2016
|
||
|
Stephen D. Milligan
|
||||
|
/s/ OLIVIER C. LEONETTI
|
Chief Financial Officer (Principal Financial Officer and Principal Accounting Officer)
|
August 26, 2016
|
||
|
Olivier C. Leonetti
|
||||
|
/s/ MATTHEW E. MASSENGILL
|
Chairman of the Board
|
August 26, 2016
|
||
|
Matthew E. Massengill
|
||||
|
/s/ MARTIN I. COLE
|
Director
|
August 26, 2016
|
||
|
Martin I. Cole
|
||||
|
/s/ KATHLEEN A. COTE
|
Director
|
August 26, 2016
|
||
|
Kathleen A. Cote
|
||||
|
/s/ HENRY T. DENERO
|
Director
|
August 26, 2016
|
||
|
Henry T. DeNero
|
||||
|
/s/ MICHAEL D. LAMBERT
|
Director
|
August 26, 2016
|
||
|
Michael D. Lambert
|
||||
|
/s/ LEN J. LAUER
|
Director
|
August 26, 2016
|
||
|
Len J. Lauer
|
||||
|
/s/ SANJAY MEHROTRA
|
Director
|
August 26, 2016
|
||
|
Sanjay Mehrotra
|
||||
|
/s/ PAULA A. PRICE
|
Director
|
August 26, 2016
|
||
|
Paula A. Price
|
||||
126
EXHIBIT INDEX
|
Exhibit
Number
|
Description
|
|
|
2.1
|
Agreement and Plan of Merger, dated as of October 21, 2015, among Western Digital Corporation, Schrader Acquisition Corporation and SanDisk Corporation (Filed as Exhibit 2.1 to the Company’s Current Report on Form 8-K (File No. 1-08703) with the Securities and Exchange Commission on October 26, 2015)±
|
|
|
3.1
|
Amended and Restated Certificate of Incorporation of Western Digital Corporation, as amended to date (Filed as Exhibit 3.1 to the Company’s Quarterly Report on Form 10-Q (File No. 1-08703) with the Securities and Exchange Commission on February 8, 2006)
|
|
|
3.2
|
Amended and Restated By-Laws of Western Digital Corporation, as amended effective as of November 14, 2013 (Filed as Exhibit 3.1 to the Company’s Current Report on Form 8-K (File No. 1-08703) with the Securities and Exchange Commission on November 14, 2013)
|
|
|
4.1
|
Indenture (including Form of 7.375% Senior Secured Notes due 2023), dated as of April 13, 2016, among Western Digital Corporation; HGST, Inc., WD Media, LLC, Western Digital (Fremont), LLC and Western Digital Technologies, Inc., as guarantors; and U.S. Bank National Association, as trustee and collateral agent (Filed as Exhibit 4.1 to the Company’s Current Report on Form 8-K (File No. 1-08703) with the Securities and Exchange Commission on April 14, 2016)
|
|
|
4.2
|
First Supplemental Indenture to the Indenture filed as Exhibit 4.1 hereto, dated as of May 12, 2016, among Western Digital Corporation, the subsidiary guarantors party thereto and U.S. Bank National Association, as trustee and collateral agent (Filed as Exhibit 4.3 to the Company’s Current Report on Form 8-K (File No. 1-08703) with the Securities and Exchange Commission on May 12, 2016)
|
|
|
4.3
|
Indenture (including Form of 10.500% Senior Unsecured Notes due 2024), dated as of April 13, 2016, among Western Digital Corporation; HGST, Inc., WD Media, LLC, Western Digital (Fremont), LLC and Western Digital Technologies, Inc., as guarantors; and U.S. Bank National Association, as trustee (Filed as Exhibit 4.2 to the Company’s Current Report on Form 8-K (File No. 1-08703) with the Securities and Exchange Commission on April 14, 2016)
|
|
|
4.4
|
First Supplemental Indenture to the Indenture filed as Exhibit 4.3 hereto, dated as of May 12, 2016, among Western Digital Corporation, the subsidiary guarantors party thereto and U.S. Bank National Association, as trustee (Filed as Exhibit 4.4 to the Company’s Current Report on Form 8-K (File No. 1-08703) with the Securities and Exchange Commission on May 12, 2016)
|
|
|
4.5
|
Indenture (including Form of 1.5% Convertible Senior Notes due 2017), dated as of August 25, 2010, by and between SanDisk Corporation and The Bank of New York Mellon Trust Company, N.A. (Filed as Exhibit 4.1 to SanDisk Corporation’s Current Report on Form 8-K (File No. 000-26734) with the Securities and Exchange Commission on August 25, 2010)
|
|
|
4.6
|
First Supplemental Indenture to the Indenture filed as Exhibit 4.5 hereto, dated as of May 12, 2016, among SanDisk Corporation, The Bank of New York Mellon Trust Company, N.A., as trustee, and Western Digital Corporation (Filed as Exhibit 4.2 to the Company’s Current Report on Form 8-K (File No. 1-08703) with the Securities and Exchange Commission on May 12, 2016)
|
|
|
4.7
|
Indenture (including Form of 0.5% Convertible Senior Notes due 2020), dated as of October 29, 2013, by and between SanDisk Corporation and The Bank of New York Mellon Trust Company, N.A. (Filed as Exhibit 4.1 to SanDisk Corporation’s Current Report on Form 8-K (File No. 000-26734) with the Securities and Exchange Commission on October 29, 2013)
|
|
|
4.8
|
First Supplemental Indenture to the Indenture filed as Exhibit 4.7 hereto, dated as of May 12, 2016, among SanDisk Corporation, The Bank of New York Mellon Trust Company, N.A., as trustee, and Western Digital Corporation (Filed as Exhibit 4.1 to the Company’s Current Report on Form 8-K (File No. 1-08703) with the Securities and Exchange Commission on May 12, 2016)
|
|
|
4.9
|
Registration Rights Agreement, dated as of April 13, 2016, among Western Digital Corporation; HGST, Inc., WD Media, LLC, Western Digital (Fremont), LLC and Western Digital Technologies, Inc., as guarantors; and Merrill Lynch, Pierce, Fenner & Smith Incorporated and J.P. Morgan Securities LLC, as representatives of the initial purchasers of the 10.500% Senior Unsecured Notes due 2024 (Filed as Exhibit 4.3 to the Company’s Current Report on Form 8-K (File No. 1-08703) with the Securities and Exchange Commission on April 14, 2016)
|
|
|
10.1
|
Western Digital Corporation Amended and Restated 2004 Performance Incentive Plan, amended and restated as of August 5, 2015 (Filed as Exhibit 10.1 to the Company’s Current Report on Form 8-K (File No. 1-08703) with the Securities and Exchange Commission on November 5, 2015)*
|
|
|
10.1.1
|
Form of Notice of Grant of Stock Option and Option Agreement - Executives, as amended on November 3, 2015, under the Western Digital Corporation Amended and Restated 2004 Performance Incentive Plan (Filed as Exhibit 10.1.1 to the Company’s Quarterly Report on Form 10-Q (File No. 1-08703) with the Securities and Exchange Commission on February 10, 2016)*
|
|
127
|
Exhibit
Number
|
Description
|
|
|
10.1.2
|
Form of Notice of Grant of Stock Option and Option Agreement - Non-Executives, as amended on November 3, 2015, under the Western Digital Corporation Amended and Restated 2004 Performance Incentive Plan (Filed as Exhibit 10.1.2 to the Company’s Quarterly Report on Form 10-Q (File No. 1-08703) with the Securities and Exchange Commission on February 10, 2016)*
|
|
|
10.1.3
|
Form of Notice of Grant of Stock Units and Stock Unit Award Agreement - Executives, as amended on November 3, 2015, under the Western Digital Corporation Amended and Restated 2004 Performance Incentive Plan (Filed as Exhibit 10.1.3 to the Company’s Quarterly Report on Form 10-Q (File No. 1-08703) with the Securities and Exchange Commission on February 10, 2016)*
|
|
|
10.1.4
|
Form of Notice of Grant of Stock Units and Stock Unit Award Agreement, as amended on November 3, 2015, under the Western Digital Corporation Amended and Restated 2004 Performance Incentive Plan (Filed as Exhibit 10.1.4 to the Company’s Quarterly Report on Form 10-Q (File No. 1-08703) with the Securities and Exchange Commission on February 10, 2016)*
|
|
|
10.1.5
|
Form of Notice of Grant of Performance Stock Units and Performance Stock Unit Award Agreement - Executives, as amended on November 3, 2015, under the Western Digital Corporation Amended and Restated 2004 Performance Incentive Plan (Filed as Exhibit 10.1.5 to the Company’s Quarterly Report on Form 10-Q (File No. 1-08703) with the Securities and Exchange Commission on February 10, 2016)*
|
|
|
10.1.6
|
Form of Notice of Grant of Performance Stock Units and Performance Stock Unit Award Agreement for Mark Long, dated September 17, 2015, under the Western Digital Corporation Amended and Restated 2004 Performance Incentive Plan (Filed as Exhibit 10.2 to the Company’s Quarterly Report on Form 10-Q (File No. 1-08703) with the Securities and Exchange Commission on November 10, 2015)*
|
|
|
10.1.7
|
Form of Notice of Grant of Performance Stock Units and Performance Stock Unit Award Agreement (revised March 2016) under the Western Digital Corporation Amended and Restated 2004 Performance Incentive Plan (Filed as Exhibit 10.1 to the Company’s Quarterly Report on Form 10-Q (File No. 1-08703) with the Securities and Exchange Commission on May 9, 2016)*
|
|
|
10.1.8
|
Western Digital Corporation Amended and Restated 2004 Performance Incentive Plan Non-Employee Director Option Grant Program, as amended September 6, 2012, and Form of Notice of Grant of Stock Option and Option Agreement - Non-Employee Directors (Filed as Exhibit 10.5 to the Company’s Quarterly Report on Form 10-Q (File No. 1-08703) with the Securities and Exchange Commission on November 2, 2012)*
|
|
|
10.1.9
|
Western Digital Corporation Amended and Restated 2004 Performance Incentive Plan Non-Employee Director Restricted Stock Unit Grant Program, as amended September 6, 2012 (Filed as Exhibit 10.6 to the Company’s Quarterly Report on Form 10-Q (File No. 1-08703) with the Securities and Exchange Commission on November 2, 2012)*
|
|
|
10.1.10
|
Western Digital Corporation Incentive Compensation Plan, as Amended and Restated August 5, 2015 (Filed as Exhibit 10.1.8 to the Company’s Annual Report on Form 10-K (File No. 1-08703) with the Securities and Exchange Commission on August 21, 2015)*
|
|
|
10.2
|
Western Digital Corporation 2005 Employee Stock Purchase Plan, as amended August 5, 2015 (Filed as Exhibit 4.2 to the Company’s Registration Statement on Form S-8 (File No. 333-207842) with the Securities and Exchange Commission on November 5, 2015)*
|
|
|
10.3
|
SanDisk Corporation 2013 Incentive Plan (Filed as Exhibit 4.2 to the Company’s Registration Statement on Form S-8 (File No. 333-211420) with the Securities and Exchange Commission on May 17, 2016)*
|
|
|
10.4
|
Western Digital Corporation Summary of Compensation Arrangements for Named Executive Officers and Directors†*
|
|
|
10.5
|
Amended and Restated Deferred Compensation Plan, amended and restated effective January 1, 2013 (Filed as Exhibit 10.4 to the Company’s Annual Report on Form 10-Q (File No. 1-08703) with the Securities and Exchange Commission on November 2, 2012)*
|
|
|
10.6
|
Amended and Restated Employment Agreement, dated as of September 6, 2012, between Western Digital Corporation and Stephen D. Milligan (Filed as Exhibit 10.2 to the Company’s Quarterly Report on Form 10-Q (File No. 1-08703) with the Securities and Exchange Commission on November 2, 2012)*
|
|
|
10.7
|
Offer Letter, dated August 14, 2014, to Olivier C. Leonetti (Filed as Exhibit 10.2 to the Company's Quarterly Report on Form 10-Q (File No. 1-08703) with the Securities and Exchange Commission on November 4, 2014)*
|
|
|
10.8
|
Separation and General Release Agreement, dated August 3, 2016, between Western Digital Technologies, Inc. and Olivier C. Leonetti†*
|
|
|
10.9
|
Separation and General Release Agreement, dated June 28, 2016, between Western Digital Technologies, Inc. and James J. Murphy†*
|
|
|
10.10
|
Western Digital Corporation Amended and Restated Change of Control Severance Plan, amended and restated as of November 3, 2015 (Filed as Exhibit 10.2 to the Company’s Current Report on Form 8-K (File No. 1-08703) with the Securities and Exchange Commission on November 5, 2015)*
|
|
128
|
Exhibit
Number
|
Description
|
|
|
10.11
|
Western Digital Corporation Executive Severance Plan, amended and restated as of February 4, 2015 (Filed as Exhibit 10.1 to the Company’s Quarterly Report on Form 10-Q (File No. 1-08703) with the Securities and Exchange Commission on February 10, 2015)*
|
|
|
10.12
|
Form of Indemnity Agreement for Directors of Western Digital Corporation (Filed as Exhibit 10.4 to the Company’s Quarterly Report on Form 10-Q (File No. 1-08703) with the Securities and Exchange Commission on November 8, 2002)*
|
|
|
10.13
|
Form of Indemnity Agreement for Officers of Western Digital Corporation (Filed as Exhibit 10.5 to the Company’s Quarterly Report on Form 10-Q (File No. 1-08703) with the Securities and Exchange Commission on November 8, 2002)*
|
|
|
10.14
|
Form of Indemnification Agreement entered into between SanDisk Corporation and its directors and officers (Filed as Exhibit 3.2 to SanDisk Corporation’s Registration Statement on Form S-1 (File No. 33-96298) with the Securities and Exchange Commission on August 29, 1995)*
|
|
|
10.15
|
Change of Control Executive Benefits Agreement, effective as of January 1, 2015, by and between SanDisk Corporation and Sanjay Mehrotra (Filed as Exhibit 10.4 to SanDisk Corporation’s Annual Report on Form 10-K (File No. 000-26734) with the Securities and Exchange Commission on February 10, 2015)*
|
|
|
10.16
|
Letter Agreement Clarifying Change of Control Executive Benefits, by and between Western Digital Corporation, SanDisk Corporation and Sanjay Mehrotra, dated as of May 12, 2016†*
|
|
|
10.17
|
Escrow Agreement, dated as of April 13, 2016, among Western Digital Corporation, U.S. Bank National Association, as trustee under the 7.375% Senior Secured Notes due 2023 Indenture, and SunTrust Bank, as escrow agent and securities intermediary (Filed as Exhibit 10.1 to the Company’s Current Report on Form 8-K (File No. 1-08703) with the Securities and Exchange Commission on April 14, 2016)
|
|
|
10.18
|
Escrow Agreement, dated as of April 13, 2016, among Western Digital Corporation, U.S. Bank National Association, as trustee under the 10.500% Senior Unsecured Notes due 2024 Indenture, and SunTrust Bank, as escrow agent (Filed as Exhibit 10.2 to the Company’s Current Report on Form 8-K (File No. 1-08703) with the Securities and Exchange Commission on April 14, 2016)
|
|
|
10.19
|
Loan Agreement, dated as of April 29, 2016, by and among Western Digital Corporation, JPMorgan Chase Bank, N.A., as administrative agent and collateral agent, and the lenders and financial institutions from time to time party thereto (Filed as Exhibit 10.4 to the Company’s Quarterly Report on Form 10-Q (File No. 1-08703) with the Securities and Exchange Commission on May 9, 2016)
|
|
|
10.20
|
Amendment No. 1, dated as of August 17, 2016, to the Loan Agreement dated as of April 29, 2016, by and among Western Digital Corporation, JPMorgan Chase Bank, N.A., as administrative agent and collateral agent, the lenders party thereto and the other loan parties thereto (Filed as Exhibit 10.1 to the Company’s Current Report on Form 8-K (File No. 1-08703) with the Securities and Exchange Commission on August 18, 2016)
|
|
|
10.21
|
Guaranty Agreement, dated as of April 29, 2016, by and among Western Digital Corporation, the subsidiary guarantors party thereto and JPMorgan Chase Bank, N.A., as administrative agent for the guaranteed creditors (Filed as Exhibit 10.2 to the Company’s Current Report on Form 8-K (File No.1-08703) with the Securities and Exchange Commission on April 29, 2016)
|
|
|
10.22
|
Escrow Agreement, dated as of April 29, 2016, by and among Western Digital Corporation, JPMorgan Chase Bank, N.A., as administrative agent and collateral agent, and SunTrust Bank, as escrow agent and securities intermediary (Filed as Exhibit 10.3 to the Company’s Current Report on Form 8-K (File No.1-08703) with the Securities and Exchange Commission on April 29, 2016)
|
|
|
10.23
|
Security Agreement, dated as of May 12, 2016, by and among Western Digital Corporation, the subsidiary guarantors party thereto and U.S. Bank National Association, as trustee and collateral agent (Filed as Exhibit 10.1 to the Company’s Current Report on Form 8-K (File No. 1-08703) with the Securities and Exchange Commission on May 12, 2016)
|
|
|
10.24
|
Security Agreement, dated as of May 12, 2016, by and among the debtors (as defined therein) party thereto and JPMorgan Chase Bank, N.A., as collateral agent (Filed as Exhibit 10.2 to the Company’s Current Report on Form 8-K (File No. 1-08703) with the Securities and Exchange Commission on May 12, 2016)
|
|
|
10.25
|
Assumption and Supplement to Guaranty Agreement, dated as of May 12, 2016, by and among the new guarantor (as defined therein) and JPMorgan Chase Bank, N.A. as administrative agent (Filed as Exhibit 10.3 to the Company’s Current Report on Form 8-K (File No. 1-08703) with the Securities and Exchange Commission on May 12, 206)
|
|
|
10.26
|
Bridge Loan Agreement, dated as of May 12, 2016, by and among Western Digital Technologies, Inc., Western Digital Corporation, JPMorgan Chase Bank, N.A., as administrative agent and collateral agent, and the lenders and financial institutions from time to time party thereto (Filed as Exhibit 10.4 to the Company’s Current Report on Form 8-K (File No. 1-08703) with the Securities and Exchange Commission on May 12, 206)
|
|
129
|
Exhibit
Number
|
Description
|
|
|
10.27
|
Amendment No. 1 to Bridge Loan Agreement, dated as of June 9, 2016, by and among Western Digital Technologies, Inc., Western Digital Corporation, JPMorgan Chase Bank, N.A., as administrative agent, the lenders party thereto and the other loan parties party thereto (Filed as Exhibit 10.1 to the Company’s Current Report on Form 8-K (File No. 1-08703) with the Securities and Exchange Commission on June 10, 206)
|
|
|
10.28
|
Bridge Guaranty Agreement, dated as of May 12, 2016, by and among Western Digital Technologies, Inc., Western Digital Corporation, the other guarantors party thereto and JPMorgan Chase Bank, N.A., as administrative agent for the guaranteed creditors (Filed as Exhibit 10.5 to the Company’s Current Report on Form 8-K (File No. 1-08703) with the Securities and Exchange Commission on May 12, 206)
|
|
|
10.29
|
Assumption and Supplement to Bridge Guaranty Agreement, dated as of May 12, 2016, by and among the new guarantor (as defined therein) and JPMorgan Chase Bank, N.A., as administrative agent (Filed as Exhibit 10.6 to the Company’s Current Report on Form 8-K (File No. 1-08703) with the Securities and Exchange Commission on May 12, 206)
|
|
|
10.30
|
Bridge Security Agreement, dated as of May 12, 2016, by and among the Debtors (as defined therein) party thereto and JPMorgan Chase Bank, N.A., as collateral agent (Filed as Exhibit 10.7 to the Company’s Current Report on Form 8-K (File No. 1-08703) with the Securities and Exchange Commission on May 12, 206)
|
|
|
10.31
|
Flash Alliance Master Agreement, dated as of July 7, 2006, by and among SanDisk Corporation, Toshiba Corporation and SanDisk (Ireland) Limited (Filed as Exhibit 10.1 to SanDisk Corporation’s Quarterly Report on Form 10-Q (File No. 000-26734) with the Securities and Exchange Commission on November 8, 2006)#
|
|
|
10.32
|
Operating Agreement of Flash Alliance, Ltd., dated as of July 7, 2006, by and between Toshiba Corporation and SanDisk (Ireland) Limited (Filed as Exhibit 10.2 to SanDisk Corporation’s Quarterly Report on Form 10-Q (File No. 000-26734) with the Securities and Exchange Commission on November 8, 2006)#
|
|
|
10.33
|
Joint Venture Restructure Agreement, dated as of January 29, 2009, by and among SanDisk Corporation, SanDisk (Ireland) Limited, SanDisk (Cayman) Limited, Toshiba Corporation, Flash Partners Limited and Flash Alliance Limited (Filed as Exhibit 10.1 to SanDisk Corporation’s Quarterly Report on Form 10-Q (File No. 000-26734) with the Securities and Exchange Commission on May 7, 2009)#
|
|
|
10.34
|
New Y2 Facility Agreement, dated October 20, 2015, by and among SanDisk Corporation, SanDisk (Ireland) Limited, SanDisk (Cayman) Limited, SanDisk Flash B.V., Toshiba Corporation, Flash Partners Limited, Flash Alliance Limited and Flash Forward Limited (Filed as Exhibit 10.37 to SanDisk Corporation’s Annual Report on Form 10-K (File No. 000-26734) with the Securities and Exchange Commission on February 12, 2016)#
|
|
|
21
|
Subsidiaries of Western Digital Corporation†
|
|
|
23
|
Consent of Independent Registered Public Accounting Firm†
|
|
|
31.1
|
Certification of Principal Executive Officer Pursuant to Section 302 of the Sarbanes-Oxley Act of 2002†
|
|
|
31.2
|
Certification of Principal Financial Officer Pursuant to Section 302 of the Sarbanes-Oxley Act of 2002†
|
|
|
32.1
|
Certification of Chief Executive Officer Pursuant to 18 U.S.C. Section 1350, as adopted pursuant to Section 906 of the Sarbanes-Oxley Act of 2002**
|
|
|
32.2
|
Certification of Chief Financial Officer Pursuant to 18 U.S.C. Section 1350, as adopted pursuant to Section 906 of the Sarbanes-Oxley Act of 2002**
|
|
|
101.INS
|
XBRL Instance Document†
|
|
|
101.SCH
|
XBRL Taxonomy Extension Schema Document†
|
|
|
101.CAL
|
XBRL Taxonomy Extension Calculation Linkbase Document†
|
|
|
101.LAB
|
XBRL Taxonomy Extension Label Linkbase Document†
|
|
|
101.PRE
|
XBRL Taxonomy Extension Presentation Linkbase Document†
|
|
|
101.DEF
|
XBRL Taxonomy Extension Definition Linkbase Document†
|
|
_______________
|
†
|
Filed with this report.
|
|
**
|
Furnished with this report.
|
|
*
|
Management contract or compensatory plan or arrangement required to be filed as an exhibit pursuant to applicable rules of the Securities and Exchange Commission.
|
± Certain schedules have been omitted pursuant to Item 601(b)(2) of Regulation S-K. The Company agrees to furnish supplementally copies of any of the omitted schedules upon request by the Securities and Exchange Commission.
|
#
|
Pursuant to a request for confidential treatment, certain portions of this exhibit have been redacted from the publicly filed document and have been furnished separately to the Securities and Exchange Commission as required by Rule 24b-2 under the Securities Exchange Act of 1933, as amended.
|
130
TABLE OF CONTENTS
Part IItem 1. BusinessItem 1A. Risk FactorsItem 1B. Unresolved Staff CommentsItem 2. PropertiesItem 3. Legal ProceedingsItem 4. Mine Safety DisclosuresPart IIItem 5. Market For Registrant S Common Equity, Related Stockholder Matters and Issuer Purchases Of Equity SecuritiesItem 6. Selected Financial DataItem 7. Management S Discussion and Analysis Of Financial Condition and Results Of OperationsItem 7A. Quantitative and Qualitative Disclosures About Market RiskItem 8. Financial Statements and Supplementary DataNote 1. Organization and Summary Of Significant Accounting PoliciesNote 2. Supplemental Financial Statement DataNote 3. DebtNote 4. Commitments and ContingenciesNote 5. Related PartiesNote 6. Legal ProceedingsNote 7. Business Segment, Geographic Information and Concentration Of RiskNote 8. Western Digital Corporation 401(k) PlanNote 9. Shareholders EquityNote 10. Income TaxesNote 11. Fair Value MeasurementsNote 12. InvestmentsNote 13. DerivativesNote 14. Goodwill and Other Intangible AssetsNote 15. Pensions and Other Post-retirement Benefit PlansNote 16. AcquisitionsNote 17. Employee Termination, Asset Impairment and Other ChargesNote 18. Quarterly Results Of Operations (unaudited)Note 19. Subsequent EventItem 9. Changes in and Disagreements with Accountants on Accounting and Financial DisclosureItem 9A. Controls and ProceduresItem 9B. Other InformationPart IIIItem 10. Directors, Executive Officers and Corporate GovernanceItem 11. Executive CompensationItem 12. Security Ownership Of Certain Beneficial Owners and Management and Related Stockholder MattersItem 13. Certain Relationships and Related Transactions and Director IndependenceItem 14. Principal Accountant Fees and ServicesPart IVItem 15. Exhibits and Financial Statement Schedules