WERNER ENTERPRISES INC
10-Ks and 10-Qs
|
|
|
|
|
|
|
|
|
|
|
|
|
|
|
|
|
|
|
|
|
|
|
|
|
|
|
|
|
|
|
|
|
|
|
|
|
|
|
|
|
|
|
|
|
|
|
|
|
|
|
|
|
|
|
|
UNITED STATES SECURITIES AND EXCHANGE COMMISSION
WASHINGTON, D.C. 20549
FORM 10-K
|
[Mark one]
|
|
|
ý
|
ANNUAL REPORT PURSUANT TO SECTION 13 OR 15(d) OF THE SECURITIES EXCHANGE ACT OF 1934
|
For the fiscal year ended December 31, 2013
OR
|
¨
|
TRANSITION REPORT PURSUANT TO SECTION 13 OR 15(d) OF THE SECURITIES EXCHANGE ACT OF 1934
|
For the transition period from ___________ to __________
Commission File Number: 0-14690
WERNER ENTERPRISES, INC.
(Exact name of registrant as specified in its charter)
|
NEBRASKA
|
|
47-0648386
|
|
(State or other jurisdiction of incorporation or organization)
|
|
(I.R.S. Employer Identification No.)
|
|
14507 FRONTIER ROAD
POST OFFICE BOX 45308
OMAHA, NEBRASKA
|
|
68145-0308
|
|
(Address of principal executive offices)
|
|
(Zip Code)
|
(402) 895-6640
(Registrant’s telephone number, including area code)
Securities registered pursuant to Section 12(b) of the Act:
|
Title of Each Class
|
|
Name of Each Exchange on Which Registered
|
|
Common Stock, $.01 Par Value
|
|
The NASDAQ Stock Market LLC
|
Securities registered pursuant to Section 12(g) of the Act: NONE
Indicate by check mark if the registrant is a well-known seasoned issuer, as defined in Rule 405 of the Securities Act. Yes
ý
No
¨
Indicate by check mark if the registrant is not required to file reports pursuant to Section 13 or Section 15(d) of the Act. Yes
¨
No
ý
Indicate by check mark whether the registrant (1) has filed all reports required to be filed by Section 13 or 15(d) of the Securities Exchange Act of 1934 during the preceding 12 months (or for such shorter period that the registrant was required to file such reports), and (2) has been subject to such filing requirements for the past 90 days. Yes
ý
No
¨
Indicate by check mark whether the registrant has submitted electronically and posted on its corporate Web site, if any, every Interactive Data File required to be submitted and posted pursuant to Rule 405 of Regulation S-T (§232.405 of this chapter) during the preceding 12 months (or for such shorter period that the registrant was required to submit and post such files). Yes
ý
No
¨
Indicate by check mark if disclosure of delinquent filers pursuant to Item 405 of Regulation S-K is not contained herein, and will not be contained, to the best of the registrant's knowledge, in definitive proxy or information statements incorporated by reference in Part III of this Form 10-K or any amendment to this Form 10-K.
ý
Indicate by check mark whether the registrant is a large accelerated filer, an accelerated filer, a non-accelerated filer or a smaller reporting company. See the definitions of “large accelerated filer,” “accelerated filer” and “smaller reporting company” in Rule 12b-2 of the Exchange Act.
|
Large accelerated filer
|
ý
|
Accelerated filer
|
o
|
Non-accelerated filer
|
o
|
Smaller reporting company
|
o
|
|||
|
|
|
(Do not check if a smaller reporting company)
|
||||||||
Indicate by check mark whether the registrant is a shell company (as defined in Rule 12b-2 of the Exchange Act). Yes
¨
No
ý
The aggregate market value of the common equity held by non-affiliates of the Registrant (assuming for these purposes that all executive officers and Directors are “affiliates” of the Registrant) as of June 28, 2013, the last business day of the Registrant's most recently completed second fiscal quarter, was approximately
$1.108 billion
(based on the closing sale price of the Registrant's Common Stock on that date as reported by Nasdaq).
As of February 19, 2014,
72,827,329
shares of the registrant’s common stock, par value $0.01 per share, were outstanding.
DOCUMENTS INCORPORATED BY REFERENCE
Portions of the Proxy Statement of Registrant for the Annual Meeting of Stockholders to be held May 13, 2014, are incorporated in Part III of this report.
WERNER ENTERPRISES, INC.
INDEX
|
|
|
PAGE
|
|
Item 1.
|
||
|
Item 1A.
|
||
|
Item 1B.
|
||
|
Item 2.
|
||
|
Item 3.
|
||
|
Item 4.
|
||
|
Item 5.
|
||
|
Item 6.
|
||
|
Item 7.
|
||
|
Item 7A.
|
||
|
Item 8.
|
||
|
Item 9.
|
||
|
Item 9A.
|
||
|
Item 9B.
|
||
|
Item 10.
|
||
|
Item 11.
|
||
|
Item 12.
|
||
|
Item 13.
|
||
|
Item 14.
|
||
|
Item 15.
|
||
This Annual Report on Form 10-K for the year ended December 31, 2013 (this “Form 10-K”) and the documents incorporated herein by reference contain forward-looking statements based on expectations, estimates and projections as of the date of this filing. Actual results may differ materially from those expressed in such forward-looking statements. For further guidance, see Item 1A of Part I and Item 7 of Part II of this Form 10-K.
|
ITEM 1.
|
BUSINESS
|
General
We are a transportation and logistics company engaged primarily in hauling truckload shipments of general commodities in both interstate and intrastate commerce. We also provide logistics services through our Value Added Services (“VAS”) division. We believe we are one of the five largest truckload carriers in the United States (based on total operating revenues), and our headquarters are located in Omaha, Nebraska, near the geographic center of our truckload service area. We were founded in 1956 by Clarence L. Werner, who started the business with one truck at the age of 19 and currently serves as our Chairman Emeritus. We were incorporated in the State of Nebraska in September 1982 and completed our initial public offering in June 1986 with a fleet of 632 trucks as of February 1986. At the end of 2013, we had a fleet of 7,050 trucks, of which 6,380 were company-operated and 670 were owned and operated by independent contractors. Our VAS division operated an additional 49 intermodal drayage trucks at the end of 2013.
We have two reportable segments – Truckload Transportation Services (“Truckload”) and VAS. You can find financial information regarding these segments and the geographic areas in which we conduct business in the Notes to Consolidated Financial Statements under Item 8 of this Form 10-K.
Our Truckload segment is comprised of the One-Way Truckload and Specialized Services units. One-Way Truckload includes the following operating fleets: (i) the regional short-haul (“Regional”) fleet transports a variety of consumer nondurable products and other commodities in truckload quantities within geographic regions across the United States using dry van trailers; (ii) the medium-to-long-haul van (“Van”) fleet provides comparable truckload van service over irregular routes; and (iii) the expedited (“Expedited”) fleet provides time-sensitive truckload services utilizing driver teams. Specialized Services provides truckload services dedicated to a specific customer, generally for a retail distribution center or manufacturing facility, including services for products requiring specialized trailers such as flatbed or temperature-controlled trailers. Our Truckload fleets operate throughout the 48 contiguous U.S. states pursuant to operating authority, both common and contract, granted by the U.S. Department of Transportation (“DOT”) and pursuant to intrastate authority granted by various U.S. states. We also have authority to operate in several provinces of Canada and to provide through-trailer service into and out of Mexico. The principal types of freight we transport include retail store merchandise, consumer products, grocery products and manufactured products. We focus on transporting consumer nondurable products that generally ship more consistently throughout the year and whose volumes are generally more stable during a slowdown in the economy.
Our VAS segment is a non-asset-based transportation and logistics provider. VAS is comprised of the following four operating units that provide non-trucking services to our customers: (i) truck brokerage (“Brokerage”) uses contracted carriers to complete customer shipments; (ii) freight management (“Freight Management”) offers a full range of single-source logistics management services and solutions; (iii) the intermodal (“Intermodal”) unit offers rail transportation through alliances with rail and drayage providers as an alternative to truck transportation; and (iv) Werner Global Logistics international (“WGL”) provides complete management of global shipments from origin to destination using a combination of air, ocean, truck and rail transportation modes. Our Brokerage unit had transportation services contracts with approximately 11,000 carriers as of December 31, 2013.
Marketing and Operations
Our business philosophy is to provide superior on-time customer service at a significant value for our customers. To accomplish this, we operate premium modern tractors and trailers. This equipment has fewer mechanical and maintenance issues and helps attract and retain experienced drivers. We continually develop our business processes and technology to improve customer service and driver retention. We focus on customers who value the broad geographic coverage, diversified truck and logistics services, equipment capacity, technology, customized services and flexibility available from a large financially-stable transportation and logistics provider.
We operate in the truckload and logistics sectors of the transportation industry. Our Truckload segment provides specialized services to customers based on (i) each customer’s trailer needs (such as van, flatbed and temperature-controlled trailers), (ii) geographic area (regional and medium-to-long-haul van, including transport throughout Mexico and Canada), (iii) time-sensitive shipments (expedited) or (iv) conversion of their private fleet to us (dedicated). In 2013, trucking revenues (net of fuel
1
surcharge) and trucking fuel surcharge revenues accounted for 81% of total operating revenues, and non-trucking and other operating revenues (primarily VAS revenues) accounted for 19% of total operating revenues. Our VAS segment manages the transportation and logistics requirements for customers, providing customers with additional sources of truck capacity, alternative modes of transportation, a global delivery network and systems analysis to optimize transportation needs. VAS services include (i) truck brokerage, (ii) freight management, (iii) intermodal transport and (iv) international. The VAS international services are provided through our domestic and global subsidiary companies and include (i) ocean, air and ground transportation services, (ii) door-to-door freight forwarding and (iii) customs brokerage. Most VAS international services are provided throughout North America, Asia and Australia, with additional coverage throughout Europe, South America and Africa. VAS is a non-asset-based transportation and logistics provider that is highly dependent on qualified associates, information systems and the services of qualified third-party capacity providers. You can find the revenues generated by services that accounted for more than 10% of our consolidated revenues, consisting of Truckload and VAS, for the last three years under Item 7 of Part II of this Form 10-K.
We have a diversified freight base but are dependent on a relatively small number of customers for a significant portion of our freight. During 2013, our largest 5, 10, 25 and 50 customers comprised 24%, 40%, 61% and 74% of our revenues, respectively. No single customer generated more than 10% of our revenues in 2013. The industry groups of our top 50 customers are 47% retail and consumer products, 27% grocery products, 14% manufacturing/industrial and 12% logistics and other. Many of our One-Way Truckload customer contracts may be terminated upon 30 days’ notice, which is common in the truckload industry. Most of our Specialized Services customer contracts are one to three years in length and may be terminated upon 90 days’ notice following the expiration of the contract’s first year.
Virtually all of our company and independent contractor tractors are equipped with communication devices manufactured by Omnitracs. These devices enable us and our drivers to conduct two-way communication using standardized and freeform messages. This technology also allows us to plan and monitor shipment progress. We automatically monitor truck movement and obtain specific data on the location of all trucks in the fleet every 15 minutes. Using the real-time data obtained from the devices, we have advanced application systems to improve customer and driver service. Examples of such application systems include: (i) an electronic logging system which records and monitors drivers’ hours of service and integrates with our information systems to pre-plan driver shipment assignments based on real-time available driving hours; (ii) software that pre-plans shipments drivers can trade enroute to meet driver home-time needs without compromising on-time delivery schedules; and (iii) automated “possible late load” tracking that informs the operations department of trucks possibly operating behind schedule, allowing us to take preventive measures to avoid late deliveries. In 1998, we began a successful pilot program and subsequently became the first trucking company in the United States to receive an exemption from the DOT to use a global positioning system-based paperless log system as an alternative to the paper logbooks traditionally used by truck drivers to track their daily work activities. In 2009, the Federal Motor Carrier Safety Administration (“FMCSA”) agency of the DOT announced in the Federal Register its determination that our paperless log system satisfies the FMCSA’s Automatic On-Board Recording Device requirements and that an exemption was no longer required.
Seasonality
In the trucking industry, revenues generally follow a seasonal pattern. Peak freight demand has historically occurred in the months of September, October and November. After the December holiday season and during the remaining winter months, our freight volumes are typically lower because some customers reduce shipment levels. Our operating expenses have historically been higher in the winter months due primarily to decreased fuel efficiency, increased cold weather-related maintenance costs of revenue equipment and increased insurance and claims costs attributed to adverse winter weather conditions. We attempt to minimize the impact of seasonality through our marketing program by seeking additional freight from certain customers during traditionally slower shipping periods and focusing on transporting consumer nondurable products. Revenue can also be affected by bad weather, holidays and the number of business days that occur during a given period because revenue is directly related to the available working days of shippers.
Employee Associates and Independent Contractors
As of December 31, 2013, we employed 9,040 drivers; 656 mechanics and maintenance associates for the trucking operation; 1,189 office associates for the trucking operation; and 771 associates for VAS, international and other non-trucking operations. We also had 670 service contracts with independent contractors who provide both a tractor and a driver or drivers. None of our U.S., Canadian, Chinese or Australian associates are represented by a collective bargaining unit, and we consider relations with our associates to be good.
We recognize that our professional driver workforce is one of our most valuable assets. Most of our professional drivers are compensated on a per-mile basis. For most company-employed drivers, the rate per mile generally increases with the drivers’ length of service. Professional drivers may earn additional compensation through incentive performance pay programs and for
2
performing additional work associated with their job (such as loading and unloading freight and making extra stops and shorter mileage trips).
At times, there are driver shortages in the trucking industry. Availability of experienced drivers can be affected by (i) changes in the demographic composition of the workforce; (ii) alternative employment opportunities other than truck driving that become available in the economy; and (iii) individual drivers’ desire to be home more frequently. The driver market was more challenging in 2013 compared to 2012, and the supply of recent driver training school graduates continues to tighten. We believe that a declining number of, and increased competition for, driver training school graduates, a declining national unemployment rate, increased job competition from the strengthening housing construction and hydraulic fracturing industries, and changing industry safety regulations are tightening driver supply. We believe our strong mileage utilization, financial strength and safety record are attractive to drivers when compared to many other carriers. Additionally, we believe our large percentage of driving jobs in shorter-haul operations (such as Dedicated and Regional) that allow drivers to return home more often is attractive to drivers.
We utilize recent driver training school graduates as a significant source of new drivers. These drivers have completed a training program at a driver training school, hold a commercial driver’s license (“CDL”) and are further trained by Werner-certified trainer drivers for approximately 275 driving hours prior to that driver becoming a solo driver with their own truck. As mentioned above, the recruiting environment for recent driver training school graduates remained challenging in 2013. The availability of these drivers has been negatively impacted by the decreased availability of student loan financing for driver training schools.
As economic conditions improve, competition for experienced drivers and recent driver training school graduates may increase and could become more challenging in 2014. We cannot predict whether we will experience future shortages in the availability of experienced drivers or driver training school graduates. If such a shortage were to occur and driver pay rate increases became necessary to attract and retain experienced drivers or driver training school graduates, our results of operations would be negatively impacted to the extent that we could not obtain corresponding freight rate increases.
We also recognize that independent contractors complement our company-employed drivers. Independent contractors supply their own tractors and drivers and are responsible for their operating expenses. Because independent contractors provide their own tractors, less financial capital is required from us. Independent contractors also provide us with another source of drivers to support our fleet. We intend to maintain our emphasis on independent contractor recruiting, in addition to company driver recruitment. We, along with others in the trucking industry, however, continue to experience independent contractor recruitment and retention difficulties that have persisted over the past several years. Challenging operating conditions, including inflationary cost increases that are the responsibility of independent contractors and a shortage of financing available to independent contractors for equipment purchases, continue to make it difficult to recruit and retain independent contractors. If a shortage of independent contractors occurs, increases in per mile settlement rates (for independent contractors) and driver pay rates (for company drivers) may become necessary to attract and retain a sufficient number of drivers. This could negatively affect our results of operations to the extent that we would be unable to obtain corresponding freight rate increases.
Revenue Equipment
As of December 31, 2013, we operated 6,380 company tractors and had contracts for 670 tractors owned by independent contractors in our Truckload segment. Our VAS segment operated an additional 49 company tractors at the end of 2013. The company tractors were manufactured by Freightliner (a Daimler company), Peterbilt and Kenworth (both divisions of PACCAR), International (a Navistar company) and Volvo. We adhere to a comprehensive maintenance program for both company tractors and trailers. We inspect independent contractor tractors prior to acceptance for compliance with Werner and DOT operational and safety requirements. We periodically inspect these tractors, in a manner similar to company tractor inspections, to monitor continued compliance. We also regulate the vehicle speed of company trucks to improve safety and fuel efficiency, and most are set to not exceed 65 miles per hour.
The average age of our company truck fleet was 2.4 years at December 31, 2013, and we currently expect to maintain our average truck age at approximately this level during 2014. In 2010, because of the ongoing cost increases for new trucks and the weak used truck market, we extended the replacement cycle for company-owned tractors. In third quarter 2010, we began buying new trucks with engines that comply with the U.S. Environmental Protection Agency (“EPA”) engine emissions standards that became effective for newly manufactured engines beginning in January 2010 to replace used trucks we sell or trade. As of December 31, 2013, approximately 76% of our company tractors have engines that comply with the 2010 emissions standards.
We operated 23,705 trailers at December 31, 2013. This total is comprised of 22,473 dry vans; 211 flatbeds; 1,014 temperature-controlled trailers; and 7 specialized trailers. Most of our trailers were manufactured by Wabash National Corporation. As of December 31, 2013, nearly all of our dry van trailer fleet consisted of 53-foot trailers and was comprised of aluminum plate or composite (DuraPlate
®
) trailers. We also provide other trailer lengths, such as 48-foot and 57-foot trailers, to meet the specialized needs of certain customers.
3
Our wholly-owned subsidiary, Fleet Truck Sales, sells our used trucks and trailers, and we believe it is one of the larger domestic Class 8 truck and equipment retail entities in the United States. Fleet Truck Sales has been in business since 1992 and operates in six locations. We may also trade used trucks to original equipment manufacturers when purchasing new trucks.
Fuel
In 2013, we purchased approximately 97% of our fuel from a predetermined network of fuel stops throughout the United States. Of this 97%, approximately 94% was purchased from three large fuel stop vendors. We negotiate discounted pricing based on historical purchase volumes with these fuel stop vendors. Bulk fueling facilities are maintained at seven of our terminals and one dedicated customer location.
Shortages of fuel, increases in fuel prices and rationing of petroleum products can have a material adverse effect on our operations and profitability. Our customer fuel surcharge reimbursement programs generally enable us to recover from our customers a majority, but not all, of higher fuel prices compared to normalized average fuel prices. These fuel surcharges, which automatically adjust depending on the U.S. Department of Energy (“DOE”) weekly retail on-highway diesel fuel prices, enable us to recoup much of the higher cost of fuel when prices increase. We do not generally recoup higher fuel costs for miles not billable to customers, out-of-route miles and truck engine idling. We cannot predict whether fuel prices will increase or decrease in the future or the extent to which fuel surcharges will be collected from customers. As of December 31, 2013, we had no derivative financial instruments to reduce our exposure to fuel price fluctuations.
We maintain aboveground and underground fuel storage tanks at many of our terminals. Leakage or damage to these facilities could expose us to environmental clean-up costs. The tanks are routinely inspected to help prevent and detect such problems.
Regulation
We are a motor carrier regulated by the DOT in the United States and similar governmental transportation agencies in foreign countries in which we operate. The DOT generally governs matters such as safety requirements, registration to engage in motor carrier operations, drivers’ hours of service and certain mergers, consolidations and acquisitions. We currently have, and have always maintained, a satisfactory DOT safety rating, which is the highest available rating, and we continually take efforts to maintain our satisfactory rating. A conditional or unsatisfactory DOT safety rating could adversely affect us because some of our customer contracts require a satisfactory rating. Equipment weight and dimensions are also subject to federal, state and international regulations with which we strive to comply.
The FMCSA's Compliance Safety Accountability (“CSA”) safety initiative monitors the safety performance of both individual drivers and carriers. In December 2010, the FMCSA made public on its website the Safety Measurement System (“SMS”), which includes monthly reports of specific safety rating measurement and percentile ranking scores for over 500,000 trucking companies. Through the SMS, the public can access carrier scores and data (including a carrier’s roadside safety inspection, out-of-service and moving violation histories) for five Behavior Analysis and Safety Improvement Categories (“BASICs”). In August 2012, the FMCSA released final CSA changes which were implemented in December 2012. These changes included (i) changing the Cargo-Related BASIC to the Hazardous Materials Compliance BASIC; (ii) changing the Fatigued Driving BASIC to the more specific Hours-of-Service Compliance BASIC; (iii) changing the Vehicle Maintenance BASIC to include cargo/load securement violations; (iv) including intermodal equipment violations that should be found during drivers' pre-trip inspections; (v) removing 1 to 5 mph speeding violations and (vi) ensuring all recorded violations accurately reflect the inspection type. As carriers, shippers, brokers, vendors and others review, evaluate and make operational and business decisions using CSA data, we anticipate that drivers and trucking companies will leave the market, although it is difficult to predict the duration and extent to which this may occur and the extent to which this could affect our business. This may limit our ability to attract and retain experienced drivers. We will continue to monitor any CSA developments and continue our CSA compliance efforts.
All truckload carriers are subject to the hours of service (“HOS”) regulations (the “HOS Regulations”) issued by the FMCSA. In December 2011, the FMCSA adopted and issued a final rule that amended the driver HOS Regulations, which became effective July 1, 2013. The rule includes provisions which affect restart periods, rest breaks, on-duty time and penalties for violations. We modified and tested our electronic HOS system and began dispatching drivers under the revised HOS rules effective July 1, 2013. The Company believes these HOS changes negatively impacted miles per truck by two to three percent. We are taking steps to minimize the financial impact of the HOS changes. However, government restrictions of available driving hours will continue to negatively impact the productivity of some drivers and some fleets within our company. On August 2, 2013, the U.S. Court of Appeals for the D.C. Circuit issued its decision related to petitions of the rule changes by the trucking industry association and consumer advocate groups. The court generally affirmed the FMCSA's final rule and vacated only the application of the 30-minute rest break to short-haul drivers as defined in 49 CFR 395.1(e).
On January 31, 2011, the FMCSA issued proposed rules regarding the required installation and use of electronic logging devices ("ELDs") by nearly all carriers to enhance the monitoring and enforcement of the driver HOS rules. Federal legislation
4
required the U.S. DOT to promulgate rules and regulations mandating the use of ELDs by July 2013 with full adoption for all trucking companies by no later than July 2015. To date, a proposed rule has not been published. We are the recognized industry leader for electronic logging of driver hours as we proactively adopted a paperless log system in 1996 that was subsequently approved for our use by the Federal Motor Carrier Safety Administration in 1998. While we don't currently believe any such rules requiring the use of ELDs would have a significant effect on our operations and profitability, we will continue to monitor future developments.
In May 2011, the FMCSA published a final rule that (i) sets new standards that must be met before states issue commercial learner’s permits (“CLP”), (ii) revises the knowledge and skills testing standards that must be met to obtain both a CLP and a CDL, and (iii) improves anti-fraud measures with the CDL program. States must be in compliance with the new requirements by July 8, 2015. In September 2013, the FMCSA withdrew its proposed rule regarding minimum requirements for entry level driver training programs and plans to initiate new rulemaking. Either of these rules could materially impact the number of potential new drivers entering the industry, and we currently cannot predict how the adoption of such rules would affect our driver recruitment and the overall driver market.
We have unlimited authority to carry general commodities in interstate commerce throughout the 48 contiguous U.S. states. We also have authority to carry freight on an intrastate basis in 46 states. The Federal Aviation Administration Authorization Act of 1994 (the “FAAA Act”) amended sections of the Interstate Commerce Act to prevent states from regulating motor carrier rates, routes or service after January 1, 1995. The FAAA Act did not address state oversight of motor carrier safety and financial responsibility or state taxation of transportation. If a carrier wishes to operate in intrastate commerce in a state where the carrier did not previously have intrastate authority, the carrier must, in most cases, still apply for authority in such state.
WGL, through its domestic and global subsidiary companies, holds a variety of licenses required to carry out its international services. These licenses permit us to provide services as a Non-Vessel Operating Common Carrier (“NVOCC”), customs broker, freight forwarder, indirect air carrier, accredited cargo agent and others. These international services subject us to regulation by the Transportation Security Administration (“TSA”) and Customs and Borders Protection (“CBP”) agencies of the U.S. Department of Homeland Security, the U.S. Federal Maritime Commission (“FMC”), the International Air Transport Association (“IATA”), as well as similar regulatory agencies in foreign jurisdictions.
Our operations are subject to various federal, state and local environmental laws and regulations, many of which are implemented by the EPA and similar state regulatory agencies. These laws and regulations govern the management of hazardous wastes, discharge of pollutants into the air and surface and underground waters and disposal of certain substances. We do not believe that compliance with these regulations has a material effect on our capital expenditures, earnings and competitive position.
The EPA mandated a series of stringent engine emissions standards for all newly manufactured truck engines, which became effective in October 2002, January 2007 and January 2010, resulting in increases in the costs of new trucks. The 2010 regulations required a significant decrease in particulate matter (soot and ash) and nitrogen oxide emitted from on-road diesel engines. Engine manufacturers responded to the 2010 standards by modifying engines to produce cleaner combustion with selective catalytic reduction (“SCR”) or exhaust gas recirculation (“EGR”) technologies to remove pollutants from exhaust gases exiting the combustion chamber. The SCR technology also requires the ongoing periodic use of a urea-based diesel exhaust fluid. Trucks with 2010-standard engines have a higher purchase price than trucks manufactured to meet the 2007 standards but are more fuel efficient. In 2013, we continued to purchase new trucks with the 2010-standard engines to replace older trucks we sell or trade, and as of December 31, 2013, approximately 76% of our company tractors have engines that comply with the 2010 emission standards.
California also enacted restrictions on transport refrigeration unit (“TRU”) emissions that require companies to operate compliant TRUs in California. The California regulations apply not only to California intrastate carriers, but also to carriers outside of California who wish to enter the state with TRUs. In January 2009, the EPA enabled California to phase in its Low-Emission TRU In-Use Performance Standards over several years. Enforcement of California’s in-use performance standards for TRU engines began in January 2010 for 2002 and older TRUs and will be phased in annually for later model years. We have complied with all compliance deadlines through December 31, 2013 that applied to model year 2006 and older TRU engines. California also required the registration of all California-based TRUs by July 31, 2009. For compliance purposes, we completed the California TRU registration process and continue to structure our plan to operate compliant TRUs over the next several years as the regulations gradually become effective.
California also adopted new regulations to improve the fuel efficiency of heavy-duty tractors that pull 53-foot or longer box-type trailers within the state. The tractors and trailers subject to these regulations must either use EPA SmartWay-certified tractors and trailers or retrofit their existing fleet with SmartWay-verified technologies that have been demonstrated to meet or exceed fuel savings percentages specified in the regulations. Examples of these technologies include tractor and trailer aerodynamics packages (such as tractor fairings and trailer skirts) and the use of low-rolling resistance tires on both tractors and trailers. Enforcement of
5
these regulations for 2011 model year equipment began in January 2010 and is being phased in over several years for older equipment. In order to comply with the California Air Resources Board’s (“CARB”) fuel efficiency regulations, we submitted a large fleet compliance plan to CARB on June 30, 2010, to install skirting on our dry van trailers by certain deadlines through 2016. We will continue monitoring our compliance with these CARB regulations.
Various provisions of the North American Free Trade Agreement (“NAFTA”) may alter the competitive environment for shipping into and out of Mexico. In July 2011, a portion of NAFTA was implemented allowing U.S. and Mexico carriers to travel beyond the border to transport cargo within one another's countries. We currently believe we are well prepared to respond to any changes that may result from this agreement. We conduct a substantial amount of business in international freight shipments to and from the United States and Mexico (see Note 9 in the Notes to Consolidated Financial Statements under Item 8 of Part II of this Form 10-K), and we believe we are one of the five largest truckload carriers in terms of freight volume shipped to and from the United States and Mexico.
Competition
The freight transportation industry is highly competitive and includes thousands of trucking and non-asset-based logistics companies. We have a small share of the markets we target. Our Truckload segment competes primarily with other truckload carriers. Logistics companies, intermodal companies, railroads, less-than-truckload carriers and private carriers provide competition for both our Truckload and VAS segments. Our VAS segment also competes for the services of third-party capacity providers.
Competition for the freight we transport is based primarily on service, efficiency, available capacity and, to some degree, on freight rates alone. We believe that few other truckload carriers have greater financial resources, own more equipment or carry a larger volume of freight than us. We believe we are one of the five largest carriers in the truckload transportation industry based on total operating revenues.
Internet Website
We maintain an Internet website where you can find additional information regarding our business and operations. The website address is
www.werner.com.
On the website, we make certain investor information available free of charge, including our Annual Report on Form 10-K, Quarterly Reports on Form 10-Q, Current Reports on Form 8-K, stock ownership reports filed under Section 16 of the Securities Exchange Act of 1934, as amended (the “Exchange Act”), and any amendments to such reports filed or furnished pursuant to Section 13(a) or 15(d) of the Exchange Act. This information is included on our website as soon as reasonably practicable after we electronically file or furnish such materials to the U.S. Securities and Exchange Commission (“SEC”). The website also includes Interactive Data Files required to be posted pursuant to Rule 405 of SEC Regulation S-T. We also provide our corporate governance materials, such as Board committee charters and our Code of Corporate Conduct, on our website free of charge, and we may occasionally update these materials when necessary to comply with SEC and NASDAQ rules or to promote the effective and efficient governance of our company. Information provided on our website is not incorporated by reference into this Form 10-K.
|
ITEM 1A.
|
RISK FACTORS
|
The following risks and uncertainties may cause our actual results, business, financial condition and cash flows to materially differ from those anticipated in the forward-looking statements included in this Form 10-K. Caution should be taken not to place undue reliance on forward-looking statements made herein because such statements speak only to the date they were made. Unless otherwise required by applicable securities laws, we undertake no obligation or duty to revise or update any forward-looking statements contained herein to reflect subsequent events or circumstances or the occurrence of unanticipated events. Also refer to the Cautionary Note Regarding Forward-Looking Statements in Item 7 of Part II of this Form 10-K.
Our business is subject to overall economic conditions that could have a material adverse effect on our results of operations.
We are sensitive to changes in overall economic conditions that impact customer shipping volumes, industry freight demand and industry truck capacity. When shipping volumes decline or available truck capacity increases, freight pricing generally becomes more competitive as carriers compete for loads to maintain truck productivity. We may be negatively affected by future economic conditions including employment levels, business conditions, fuel and energy costs, interest rates and tax rates. Economic conditions may also impact the financial condition of our customers, resulting in a greater risk of bad debt losses, and that of our suppliers, which may affect negotiated pricing or availability of needed goods and services.
6
Increases in fuel prices and shortages of fuel can have a material adverse effect on the results of operations and profitability.
To lessen the effect of fluctuating fuel prices on our margins, we have fuel surcharge programs with our customers. These programs generally enable us to recover a majority, but not all, of the fuel price increases. The remaining portion is generally not recoverable because it results from empty and out-of-route miles (which are not billable to customers) and truck idle time. Fuel prices that change rapidly in short time periods also impact our recovery because the surcharge rate in most programs only changes once per week. Fuel shortages, increases in fuel prices and petroleum product rationing could have a material adverse impact on our operations and profitability. To the extent that we cannot recover the higher cost of fuel through customer fuel surcharges, our financial results would be negatively impacted. As of December 31, 2013, we had no derivative financial instruments to reduce our exposure to fuel price fluctuations.
Difficulty in recruiting and retaining experienced drivers, recent driver training school graduates and independent contractors could impact our results of operations and limit growth opportunities.
At times, the trucking industry has experienced driver shortages. Driver availability may be affected by changing workforce demographics, alternative employment opportunities (i.e., housing construction and hydraulic fracturing industries), national unemployment rates, freight market conditions, availability of financial aid for driver training schools, extended unemployment benefit payment programs and changing industry regulations. If such a shortage were to occur and driver pay rate increases were necessary to attract and retain drivers, our results of operations would be negatively impacted to the extent that we could not obtain corresponding freight rate increases. Additionally, a shortage of drivers could result in idled equipment, which could affect our profitability.
Independent contractor availability may also be affected by both inflationary cost increases that are the responsibility of independent contractors and the availability of equipment financing. If a shortage of independent contractors occurs, increases in per mile settlement rates (for independent contractors) and driver pay rates (for company drivers) may become necessary to attract and retain a sufficient number of drivers. This could negatively affect our results of operations to the extent that we would be unable to obtain corresponding freight rate increases.
We operate in a highly competitive industry, which may limit growth opportunities and reduce profitability.
The freight transportation industry is highly competitive and includes thousands of trucking and non-asset-based logistics companies. We compete primarily with other truckload carriers in our Truckload segment. Logistics companies, intermodal companies, railroads, less-than-truckload carriers and private carriers also provide a lesser degree of competition in our Truckload segment, but such providers are more direct competitors in our VAS segment. Competition for the freight we transport or manage is based primarily on service, efficiency, available capacity and, to some degree, on freight rates alone. This competition could have an adverse effect on either the number of shipments we transport or the freight rates we receive, which could limit our growth opportunities and reduce our profitability.
We operate in a highly regulated industry. Changes in existing regulations or violations of existing or future regulations could adversely affect our operations and profitability.
We are regulated by the DOT in the United States and similar governmental transportation agencies in foreign countries in which we operate. We are also regulated by agencies in certain U.S. states. These regulatory agencies have the authority to govern transportation-related activities, such as safety, authorization to conduct motor carrier operations and other matters. The Regulation subsection in Item 1 of Part I of this Form 10-K describes several proposed and pending regulations that may have a significant effect on our operations including our productivity, driver recruitment and retention and capital expenditures. The subsidiaries of WGL hold a variety of licenses required to carry out its international services, and the loss of any of these licenses could adversely impact the operations of WGL.
The seasonal pattern generally experienced in the trucking industry may affect our periodic results during traditionally slower shipping periods and winter months.
In the trucking industry, revenues generally follow a seasonal pattern which may affect our results of operations. After the December holiday season and during the remaining winter months, our freight volumes are typically lower because some customers reduce shipment levels. Our operating expenses have historically been higher in the winter months because of cold temperatures and other adverse winter weather conditions which result in decreased fuel efficiency, increased cold weather-related maintenance costs of revenue equipment and increased insurance and claims costs. Revenue can also be affected by bad weather, holidays and the number of business days during a given period because revenue is directly related to the available working days of shippers.
7
We depend on key customers, the loss or financial failure of which may have a material adverse effect on our operations and profitability.
A significant portion of our revenue is generated from key customers. During 2013, our largest 5, 10 and 25 customers accounted for 24%, 40% and 61% of revenues, respectively. No single customer generated more than 10% of our revenues in 2013, and our largest customer accounted for 7% of our revenues in 2013. We do not have long-term contractual relationships with many of our key One-Way Truckload customers. Our contractual relationships with our Specialized Services customers are typically one to three years in length and may be terminated upon 90 days’ notice following the expiration of the contract’s first year. We cannot provide any assurance that key customer relationships will continue at the same levels. If a significant customer reduced or terminated our services, it could have a material adverse effect on our business and results of operations. We review our customers’ financial conditions for granting credit, monitor changes in customers’ financial conditions on an ongoing basis, and review individual past-due balances and collection concerns. However, a key customer’s financial failure may negatively affect our results of operations.
We depend on the services of third-party capacity providers, the availability of which could affect our profitability and limit growth in our VAS segment.
Our VAS segment is highly dependent on the services of third-party capacity providers, such as other truckload carriers, less-than-truckload carriers, railroads, ocean carriers and airlines. Many of those providers face the same economic challenges as we do and therefore are actively and competitively soliciting business. These economic conditions may have an adverse effect on the availability and cost of third-party capacity. If we are unable to secure the services of these third-party capacity providers at reasonable rates, our results of operations could be adversely affected.
If we cannot effectively manage the challenges associated with doing business internationally, our revenues and profitability may suffer.
Our results are affected by the success of our operations in Mexico, China and other foreign countries in which we operate. We are subject to risks of doing business internationally, including fluctuations in foreign currencies, changes in the economic strength of the countries in which we do business, difficulties in enforcing contractual obligations and intellectual property rights, burdens of complying with a wide variety of international and United States export and import laws, and social, political, and economic instability. Additional risks associated with our foreign operations, including restrictive trade policies and imposition of duties, taxes, or government royalties by foreign governments, are present but largely mitigated by the terms of NAFTA for Mexico and Canada. The agreement permitting cross border movements for both United States and Mexican based carriers into the United States and Mexico presents additional risks in the form of potential increased competition and the potential for increased congestion on the cross border lanes between countries.
Our earnings could be reduced by increases in the number of insurance claims, cost per claim, costs of insurance premiums or availability of insurance coverage.
We are self-insured for a significant portion of liability resulting from bodily injury, property damage, cargo and associate workers’ compensation and health benefit claims. This is supplemented by premium-based insurance with licensed insurance companies above our self-insurance level for each type of coverage. To the extent we experience a significant increase in the number of claims, cost per claim or insurance premium costs for coverage in excess of our retention amounts, our operating results would be negatively affected. Healthcare legislation and inflationary cost increases could also have a negative effect on our results.
Decreased demand for our used revenue equipment could result in lower unit sales, resale values and gains on sales of assets.
We are sensitive to changes in used equipment prices and demand, especially with respect to tractors. We have been in the business of selling our company-owned trucks since 1992, when we formed our wholly-owned subsidiary Fleet Truck Sales. Reduced demand for used equipment could result in a lower volume of sales or lower sales prices, either of which could negatively affect our gains on sales of assets.
Our operations are subject to various environmental laws and regulations, the violation of which could result in substantial fines or penalties.
In addition to direct regulation by the DOT, EPA and other federal, state, and local agencies, we are subject to various environmental laws and regulations dealing with the handling of hazardous materials, underground fuel storage tanks, discharge and retention of storm-water, and emissions from our vehicles. We operate in industrial areas, where truck terminals and other industrial activities are located and where groundwater or other forms of environmental contamination have occurred. Our operations involve the risks of fuel spillage or seepage, environmental damage and hazardous waste disposal, among others. We also maintain bulk fuel storage at several of our facilities. If we are involved in a spill or other accident involving hazardous
8
substances, or if we are found to be in violation of applicable laws or regulations, it could have a material adverse effect on our business and operating results. If we fail to comply with applicable environmental regulations, we could be subject to substantial fines or penalties and to civil and criminal liability. Tractors and trailers used in our daily operations have been affected by regulatory changes related to air emissions and fuel efficiency, and may be adversely affected in the future by new regulatory actions.
We rely on the services of key personnel, the loss of which could impact our future success.
We are highly dependent on the services of key personnel, including our executive officers. Although we believe we have an experienced and highly qualified management team, the loss of the services of these key personnel could have a significant adverse impact on us and our future profitability.
Difficulty in obtaining goods and services from our vendors and suppliers could adversely affect our business.
We are dependent on our vendors and suppliers. We believe we have good vendor relationships and that we are generally able to obtain favorable pricing and other terms from vendors and suppliers. If we fail to maintain satisfactory relationships with our vendors and suppliers, or if our vendors and suppliers experience significant financial problems, we could experience difficulty in obtaining needed goods and services because of production interruptions or other reasons. Consequently, our business could be adversely affected.
We use our information systems extensively for day-to-day operations, and service disruptions could have an adverse impact on our operations.
The efficient operation of our business is highly dependent on our information systems. Much of our software was developed internally or by adapting purchased software applications to suit our needs. Our information systems are used for receiving and planning loads, dispatching drivers and other capacity providers, billing customers and providing financial reports. If any of our critical information systems fail or become unavailable, we would have to perform certain functions manually, which could temporarily affect our ability to efficiently manage our operations. We maintain information security policies to protect our systems and data from cyber security events and threats. We purchased redundant computer hardware systems and have our own off-site disaster recovery facility approximately ten miles from our headquarters for use in the event of a disaster. We took these steps to reduce the risk of disruption to our business operation if a disaster occurred. We believe any such disruption would be minimal or moderate; however, we cannot predict the degree to which any disaster would affect our information systems or disaster recovery facility. Any system failure, disruption, or security breach could interrupt or delay our operations, damage our reputation, cause us to lose customers, or impact our ability to manage our operations, any of which could have an adverse effect on our operations.
|
ITEM 1B.
|
UNRESOLVED STAFF COMMENTS
|
We have not received any written comments from SEC staff regarding our periodic or current reports that were issued 180 days or more preceding the end of our 2013 fiscal year and that remain unresolved.
|
ITEM 2.
|
PROPERTIES
|
Our headquarters are located on approximately 197 acres near U.S. Interstate 80 west of Omaha, Nebraska, 107 acres of which are held for future expansion. Our headquarters office building includes a computer center, drivers’ lounges, cafeteria and company store. The Omaha headquarters also includes a driver training facility, equipment maintenance and repair facilities and a sales office for selling used trucks and trailers. These maintenance facilities contain a central parts warehouse, frame straightening and alignment machine, truck and trailer wash areas, equipment safety lanes, body shops for tractors and trailers, two paint booths and a reclaim center. Our headquarter facilities have suitable space available to accommodate planned needs for at least the next three to five years.
9
We also have several terminals throughout the United States, consisting of office and/or maintenance facilities. Our terminal locations are described below:
|
Location
|
|
Owned or Leased
|
|
Description
|
Segment
|
|||||
|
Omaha, Nebraska
|
|
Owned
|
|
Corporate headquarters, maintenance
|
Truckload, VAS, Corporate
|
|||||
|
Omaha, Nebraska
|
|
Owned
|
|
Disaster recovery, warehouse
|
Corporate
|
|||||
|
Phoenix, Arizona
|
|
Owned
|
|
Office, maintenance
|
Truckload
|
|||||
|
Fontana, California
|
|
Owned
|
|
Office, maintenance
|
Truckload
|
|||||
|
Denver, Colorado
|
|
Owned
|
|
Office, maintenance
|
Truckload
|
|||||
|
Atlanta, Georgia
|
|
Owned
|
|
Office, maintenance
|
Truckload, VAS
|
|||||
|
Indianapolis, Indiana
|
|
Leased
|
|
Office, maintenance
|
Truckload
|
|||||
|
Springfield, Ohio
|
|
Owned
|
|
Office, maintenance
|
Truckload
|
|||||
|
Allentown, Pennsylvania
|
|
Leased
|
|
Office, maintenance
|
Truckload
|
|||||
|
Dallas, Texas
|
|
Owned
|
|
Office, maintenance
|
Truckload, VAS
|
|||||
|
Laredo, Texas
|
|
Owned
|
|
Office, maintenance, transloading
|
Truckload, VAS
|
|||||
|
Lakeland, Florida
|
|
Leased
|
|
Office
|
Truckload
|
|||||
|
El Paso, Texas
|
|
Owned
|
|
Office, maintenance
|
Truckload
|
|||||
|
Brownstown, Michigan
|
|
Owned
|
|
Maintenance
|
Truckload
|
|||||
|
Tomah, Wisconsin
|
|
Leased
|
|
Maintenance
|
Truckload
|
|||||
|
Newbern, Tennessee
|
|
Leased
|
|
Maintenance
|
Truckload
|
|||||
|
Chicago, Illinois
|
|
Leased
|
|
Maintenance
|
Truckload
|
|||||
We currently lease (i) approximately 70 small sales offices, brokerage offices and trailer parking yards in various locations throughout the United States and (ii) office space in Mexico, Canada, China and Australia. We own (i) a 96-room motel located near our Omaha headquarters; (ii) a 71-room private driver lodging facility at our Dallas terminal; (iii) two low-income housing apartment complexes in the Omaha area; (iv) a warehouse facility in Omaha; and (v) a terminal facility in Queretaro, Mexico, which we lease to a related party (see Note 8 in the Notes to Consolidated Financial Statements under Item 8 of Part II of this Form 10-K). We also have 50% ownership in a 125,000 square-foot warehouse located near our headquarters in Omaha. The Fleet Truck Sales network currently has six locations, which are located in certain of our terminals listed above.
|
ITEM 3.
|
LEGAL PROCEEDINGS
|
We are a party subject to routine litigation incidental to our business, primarily involving claims for bodily injury, property damage, cargo and workers’ compensation incurred in the transportation of freight. We have maintained a self-insurance program with a qualified department of risk management professionals since 1988. These associates manage our bodily injury, property damage, cargo and workers’ compensation claims. An actuary reviews our undiscounted self-insurance reserves for bodily injury, property damage and workers’ compensation claims every six months.
Since August 1, 2004, our self-insured retention ("SIR") and deductible amount for liability claims has been $2.0 million, plus administrative expenses, for each occurrence involving bodily injury or property damage. We are also responsible for varying annual aggregate amounts of liability for claims in excess of the SIR/deductible. The following table reflects the SIR/deductible levels and aggregate amounts of liability for bodily injury and property damage claims since August 1, 2010:
|
Coverage Period
|
|
Primary Coverage
|
|
Primary Coverage
SIR/Deductible
|
|
August 1, 2010 – July 31, 2011
|
|
$5.0 million
|
|
$2.0 million
(1)
|
|
August 1, 2011 – July 31, 2012
|
|
$5.0 million
|
|
$2.0 million
(1)
|
|
August 1, 2012 – July 31, 2013
|
|
$5.0 million
|
|
$2.0 million
(1)
|
|
August 1, 2013 – July 31, 2014
|
|
$5.0 million
|
|
$2.0 million
(1)
|
|
(1)
|
Subject to an additional $8.0 million aggregate in the $2.0 to $5.0 million layer and a $5.0 million aggregate in the $5.0 to $10.0 million layer.
|
10
Our primary insurance covers the range of liability under which we expect most claims to occur. If any liability claims are substantially in excess of coverage amounts listed in the table above, such claims are covered under premium-based policies (issued by insurance companies) to coverage levels that our management considers adequate. We are also responsible for administrative expenses for each occurrence involving bodily injury or property damage. See also Note 1 and Note 7 in the Notes to Consolidated Financial Statements under Item 8 of Part II of this Form 10-K.
We are responsible for workers’ compensation claims up to $1.0 million per claim and have premium-based insurance coverage for individual claims above $1.0 million. We also maintain a $34.1 million bond for the State of Nebraska and a $6.9 million bond for our workers’ compensation insurance carrier.
Information regarding material pending legal proceedings is incorporated by reference from Note 5 and Note 7 in the Notes to Consolidated Financial Statements under Item 8 of Part II of this Form 10-K.
|
ITEM 4.
|
MINE SAFETY DISCLOSURES
|
Not applicable
|
ITEM 5.
|
MARKET FOR REGISTRANT’S COMMON EQUITY, RELATED STOCKHOLDER MATTERS AND ISSUER PURCHASES OF EQUITY SECURITIES
|
Price Range of Common Stock
Our common stock trades on the NASDAQ Global Select Market
SM
tier of the NASDAQ Stock Market under the symbol “WERN”. The following table sets forth, for the quarters indicated from January 1, 2012 through December 31, 2013, (i) the high and low trade prices per share of our common stock quoted on the NASDAQ Global Select Market
SM
and (ii) our dividends declared per common share.
|
2013
|
2012
|
||||||||||
|
High
|
Low
|
Dividends
Declared Per
Common Share
|
High
|
Low
|
Dividends
Declared Per
Common Share
|
||||||
|
Quarter Ended:
|
|||||||||||
|
March 31
|
$25.02
|
$22.02
|
$0.05
|
$26.67
|
$23.80
|
$0.05
|
|||||
|
June 30
|
25.44
|
21.80
|
0.05
|
25.32
|
22.71
|
0.05
|
|||||
|
September 30
|
25.33
|
22.61
|
0.05
|
24.69
|
20.92
|
0.05
|
|||||
|
December 31
|
25.24
|
22.86
|
0.05
|
23.98
|
20.63
|
1.55
|
|||||
As of February 19, 2014, our common stock was held by 228 stockholders of record. Because many of our shares of common stock are held by brokers and other institutions on behalf of stockholders, we are unable to estimate the total number of stockholders represented by these record holders. The high and low trade prices per share of our common stock in the NASDAQ Global Select Market
SM
as of February 19, 2014 were $26.24 and $25.60, respectively. The declared dividends in the table above include a special cash dividend of $1.50 per share in 2012. We also paid special cash dividends of $0.50 per share in 2011, $1.60 per share in 2010, $1.25 per share in 2009, and $2.10 per share in 2008.
Dividend Policy
We have paid cash dividends on our common stock following each fiscal quarter since the first payment in July 1987. We currently intend to continue paying a regular quarterly dividend. We do not currently anticipate any restrictions on our future ability to pay such dividends. However, we cannot give any assurance that dividends will be paid in the future or of the amount of any such quarterly or special dividends because they are dependent on our earnings, financial condition and other factors.
Equity Compensation Plan Information
For information on our equity compensation plans, please refer to Item 12 of Part III of this Form 10-K.
11
Performance Graph
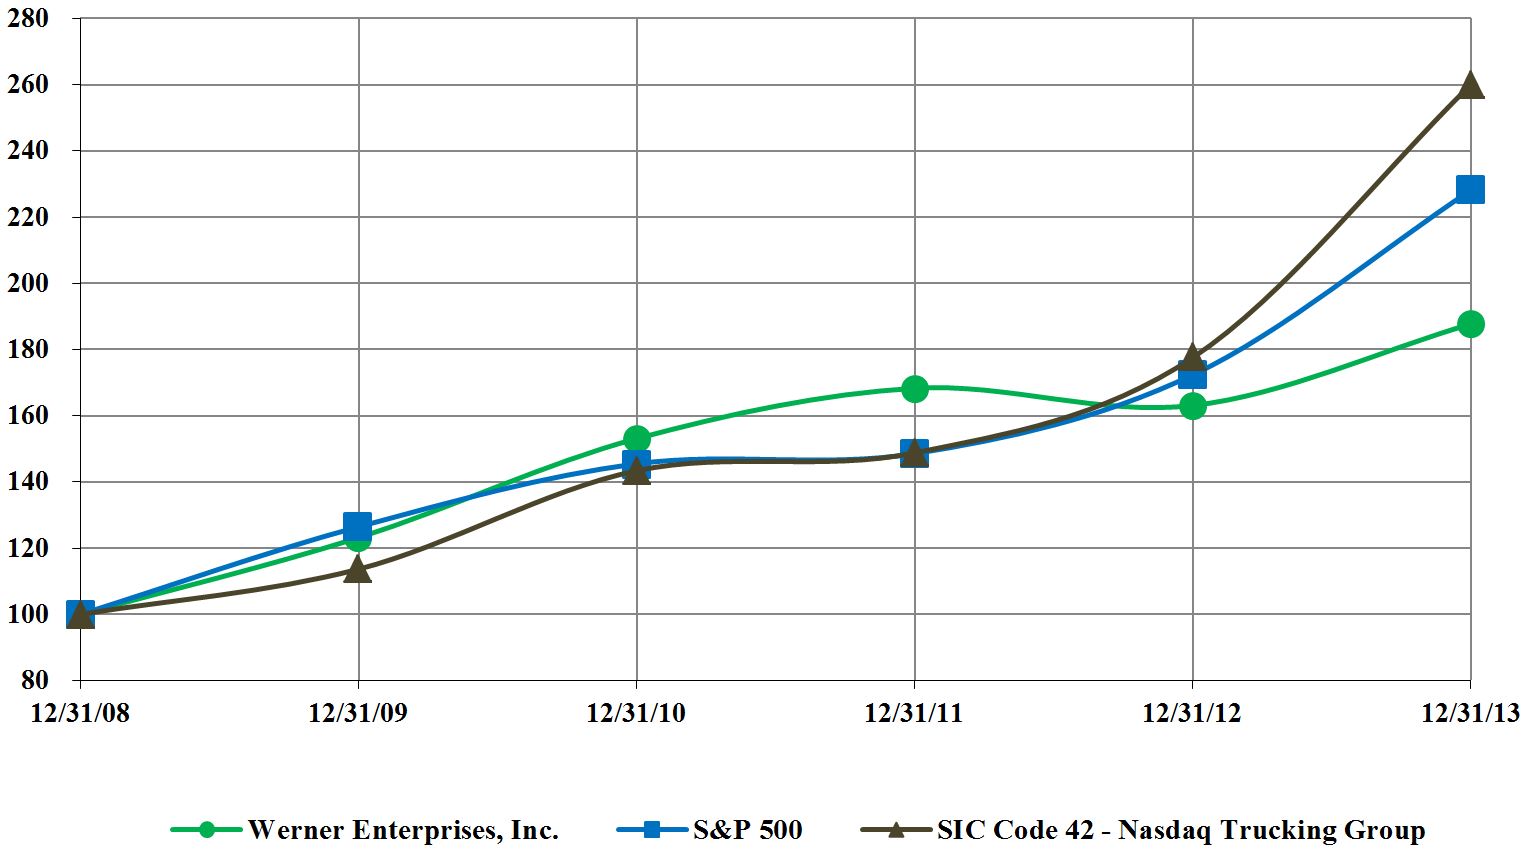
Comparison of Five-Year Cumulative Total Return
The following graph is not deemed to be “soliciting material” or to be “filed” with the SEC or subject to the liabilities of Section 18 of the Exchange Act, and the report shall not be deemed to be incorporated by reference into any prior or subsequent filing by us under the Securities Act of 1933 or the Exchange Act except to the extent we specifically request that such information be incorporated by reference or treated as soliciting material.
|
12/31/2008
|
12/31/2009
|
12/31/2010
|
12/31/2011
|
12/31/2012
|
12/31/2013
|
|||||||||||||||||||
|
Werner Enterprises, Inc. (WERN)
|
$
|
100
|
|
$
|
123
|
|
$
|
153
|
|
$
|
168
|
|
$
|
163
|
|
$
|
188
|
|
||||||
|
Standard & Poor’s 500
|
$
|
100
|
|
$
|
126
|
|
$
|
146
|
|
$
|
149
|
|
$
|
172
|
|
$
|
228
|
|
||||||
|
NASDAQ Trucking Group (SIC Code 42)
|
$
|
100
|
|
$
|
114
|
|
$
|
143
|
|
$
|
149
|
|
$
|
178
|
|
$
|
260
|
|
||||||
Assuming the investment of $100 on December 31, 2008, and reinvestment of all dividends, the graph above compares the cumulative total stockholder return on our common stock for the last five fiscal years with the cumulative total return of Standard & Poor’s 500 Market Index and an index of other companies included in the trucking industry (NASDAQ Trucking Group – Standard Industrial Classification Code 42) over the same period. Our stock price was $24.73 as of December 31, 2013. This price was used for purposes of calculating the total return on our common stock for the year ended December 31, 2013.
Purchases of Equity Securities by the Issuer and Affiliated Purchasers
On October 15, 2007, we announced that on October 11, 2007 our Board of Directors approved an increase in the number of shares of our common stock that Werner Enterprises, Inc. (the “Company”) is authorized to repurchase. Under this authorization, the Company is permitted to repurchase an additional 8,000,000 shares. As of December 31, 2013, the Company had purchased 1,862,291 shares pursuant to this authorization and had 6,137,709 shares remaining available for repurchase. The Company may purchase shares from time to time depending on market, economic and other factors. The authorization will continue unless withdrawn by the Board of Directors.
No shares of common stock were repurchased during the fourth quarter of 2013 by either the Company or any “affiliated purchaser”, as defined by Rule 10b-18 of the Exchange Act.
12
|
ITEM 6.
|
SELECTED FINANCIAL DATA
|
The following selected financial data should be read in conjunction with the consolidated financial statements and notes under Item 8 of Part II of this Form 10-K.
|
(In thousands, except per share amounts)
|
2013
|
2012
|
2011
|
2010
|
2009
|
||||||||||||||
|
Operating revenues
|
$
|
2,029,183
|
|
$
|
2,036,386
|
|
$
|
2,002,850
|
|
$
|
1,815,020
|
|
$
|
1,666,470
|
|
||||
|
Net income
|
86,785
|
|
103,034
|
|
102,757
|
|
80,039
|
|
56,584
|
|
|||||||||
|
Diluted earnings per share
|
1.18
|
|
1.40
|
|
1.40
|
|
1.10
|
|
0.79
|
|
|||||||||
|
Cash dividends declared per share
|
0.20
|
|
1.70
|
|
0.70
|
|
1.80
|
|
1.45
|
|
|||||||||
|
Total assets
|
1,354,097
|
|
1,334,900
|
|
1,302,416
|
|
1,151,552
|
|
1,173,009
|
|
|||||||||
|
Total debt
|
40,000
|
|
90,000
|
|
—
|
|
—
|
|
—
|
|
|||||||||
|
Stockholders’ equity
|
772,519
|
|
714,897
|
|
725,147
|
|
668,975
|
|
704,650
|
|
|||||||||
|
Book value per share
(1)
|
10.62
|
|
9.76
|
|
9.95
|
|
9.21
|
|
9.80
|
|
|||||||||
|
Return on average stockholders’ equity
(2)
|
11.7
|
%
|
13.6
|
%
|
14.5
|
%
|
11.1
|
%
|
7.5
|
%
|
|||||||||
|
Return on average total assets
(3)
|
6.5
|
%
|
7.7
|
%
|
8.3
|
%
|
6.6
|
%
|
4.5
|
%
|
|||||||||
|
Operating ratio (consolidated)
(4)
|
93.1
|
%
|
91.6
|
%
|
91.3
|
%
|
92.6
|
%
|
94.2
|
%
|
|||||||||
|
(1)
|
Stockholders’ equity divided by common shares outstanding as of the end of the period. Book value per share indicates the dollar value remaining for common shareholders if all assets were liquidated at recorded amounts and all debts were paid at recorded amounts.
|
|
(2)
|
Net income expressed as a percentage of average stockholders’ equity. Return on equity is a measure of a corporation’s profitability relative to recorded shareholder investment.
|
|
(3)
|
Net income expressed as a percentage of average total assets. Return on assets is a measure of a corporation’s profitability relative to recorded assets.
|
|
(4)
|
Operating expenses expressed as a percentage of operating revenues. Operating ratio is a common measure used in the trucking industry to evaluate profitability.
|
|
ITEM 7.
|
MANAGEMENT’S DISCUSSION AND ANALYSIS OF FINANCIAL CONDITION AND RESULTS OF OPERATIONS
|
Management’s Discussion and Analysis of Financial Condition and Results of Operations (“MD&A”) summarizes the financial statements from management’s perspective with respect to our financial condition, results of operations, liquidity and other factors that may affect actual results. The MD&A is organized in the following sections:
|
•
|
Cautionary Note Regarding Forward-Looking Statements
|
|
•
|
Overview
|
|
•
|
Results of Operations
|
|
•
|
Liquidity and Capital Resources
|
|
•
|
Contractual Obligations and Commercial Commitments
|
|
•
|
Off-Balance Sheet Arrangements
|
|
•
|
Critical Accounting Policies
|
|
•
|
Inflation
|
Cautionary Note Regarding Forward-Looking Statements:
This Annual Report on Form 10-K contains historical information and forward-looking statements based on information currently available to our management. The forward-looking statements in this report, including those made in this Item 7 (Management’s Discussion and Analysis of Financial Condition and Results of Operations), are made pursuant to the safe harbor provisions of the Private Securities Litigation Reform Act of 1995, as amended. These safe harbor provisions encourage reporting companies to provide prospective information to investors. Forward-looking statements can be identified by the use of certain words, such as “anticipate,” “believe,” “estimate,” “expect,” “intend,” “plan,” “project” and other similar terms and language. We believe the forward-looking statements are reasonable based on currently available information. However, forward-looking statements involve risks, uncertainties and assumptions, whether known or unknown, that could cause our actual results, business, financial condition and cash flows to differ materially from those anticipated in the forward-looking statements. A discussion of important factors relating to forward-looking statements is included in Item 1A (Risk Factors) of Part I of this Form 10-K. Readers should not unduly rely on the forward-looking statements included in this Form 10-K because such statements speak only to the date they were made. Unless otherwise required by applicable securities laws, we undertake no obligation or duty to update or
13
revise any forward-looking statements contained herein to reflect subsequent events or circumstances or the occurrence of unanticipated events.
Overview:
We have two reportable segments, Truckload and VAS, and we operate in the truckload and logistics sectors of the transportation industry. In the truckload sector, we focus on transporting consumer nondurable products that generally ship more consistently throughout the year. In the logistics sector, besides managing transportation requirements for individual customers, we provide additional sources of truck capacity, alternative modes of transportation, a global delivery network and systems analysis to optimize transportation needs. Our success depends on our ability to efficiently and effectively manage our resources in the delivery of truckload transportation and logistics services to our customers. Resource requirements vary with customer demand, which may be subject to seasonal or general economic conditions. Our ability to adapt to changes in customer transportation requirements is essential to efficiently deploy resources and make capital investments in tractors and trailers (with respect to our Truckload segment) or obtain qualified third-party capacity at a reasonable price (with respect to our VAS segment). Although our business volume is not highly concentrated, we may also be affected by our customers’ financial failures or loss of customer business.
Revenues for our Truckload segment operating units (One-Way Truckload and Specialized Services) are typically generated on a per-mile basis and also include revenues such as stop charges, loading and unloading charges, equipment detention charges and equipment repositioning charges. To mitigate our risk to fuel price increases, we recover from our customers additional fuel surcharges that generally recoup a majority of the increased fuel costs; however, we cannot assure that current recovery levels will continue in future periods. Because fuel surcharge revenues fluctuate in response to changes in fuel costs, we identify them separately and exclude them from the statistical calculations to provide a more meaningful comparison between periods. The key statistics used to evaluate trucking revenues, net of fuel surcharge, are (i) average revenues per tractor per week, (ii) average percentage of empty miles (miles without trailer cargo), (iii) average trip length (in loaded miles) and (iv) average number of tractors in service. General economic conditions, seasonal trucking industry freight patterns and industry capacity are important factors that impact these statistics. Our Truckload segment also generates a small amount of revenues categorized as non-trucking revenues, related to shipments delivered to or from Mexico where the Truckload segment utilizes a third-party capacity provider. We exclude such revenues from the statistical calculations.
Our most significant resource requirements are company drivers, independent contractors, tractors and trailers. Our financial results are affected by company driver and independent contractor availability and the markets for new and used revenue equipment. We are self-insured for a significant portion of bodily injury, property damage and cargo claims; workers’ compensation claims; and associate health claims (supplemented by premium-based insurance coverage above certain dollar levels). For that reason, our financial results may also be affected by driver safety, medical costs, weather, legal and regulatory environments and insurance coverage costs to protect against catastrophic losses.
The operating ratio is a common industry measure used to evaluate our profitability and that of our Truckload segment operating fleets. The operating ratio consists of operating expenses expressed as a percentage of operating revenues. The most significant variable expenses that impact the Truckload segment are driver salaries and benefits, fuel, fuel taxes (included in taxes and licenses expense), payments to independent contractors (included in rent and purchased transportation expense), supplies and maintenance and insurance and claims. As discussed further in the comparison of operating results for 2013 to 2012, several industry-wide issues have caused, and could cause, costs to increase in future periods. These issues include shortages of drivers or independent contractors, changing fuel prices, higher new truck and trailer purchase prices and compliance with new or proposed regulations. Our main fixed costs include depreciation expense for tractors and trailers and equipment licensing fees (included in taxes and licenses expense). The Truckload segment requires substantial cash expenditures for tractor and trailer purchases. We fund these purchases with net cash from operations and financing available under our existing credit facilities, as management deems necessary.
We provide non-trucking services primarily through the four operating units within our VAS segment (Brokerage, Freight Management, Intermodal and WGL). Unlike our Truckload segment, the VAS segment is less asset-intensive and is instead dependent upon qualified associates, information systems and qualified third-party capacity providers. The largest expense item related to the VAS segment is the cost of purchased transportation we pay to third-party capacity providers. This expense item is recorded as rent and purchased transportation expense. Other operating expenses consist primarily of salaries, wages and benefits. We evaluate the VAS segment's financial performance by reviewing the gross margin percentage (revenues less rent and purchased transportation expenses expressed as a percentage of revenues) and the operating income percentage. The gross margin percentage can be impacted by the rates charged to customers and the costs of securing third-party capacity. We generally do not have contracted long-term rates for the cost of third-party capacity, and we cannot assure that our operating results will not be adversely impacted in the future if our ability to obtain qualified third-party capacity providers changes or the rates of such providers increase.
14
Results of Operations:
The following table sets forth the Consolidated Statements of Income in dollars and as a percentage of total operating revenues and the percentage increase or decrease in the dollar amounts of those items compared to the prior year.
|
2013
|
2012
|
2011
|
Percentage Change in Dollar Amounts
|
|||||||||||||||||||||||
|
(Amounts in thousands)
|
$
|
%
|
$
|
%
|
$
|
%
|
2013 to 2012 (%)
|
2012 to 2011 (%)
|
||||||||||||||||||
|
Operating revenues
|
$
|
2,029,183
|
|
100.0
|
|
$
|
2,036,386
|
|
100.0
|
|
$
|
2,002,850
|
|
100.0
|
|
(0.4
|
)
|
1.7
|
|
|||||||
|
|
|
|||||||||||||||||||||||||
|
Operating expenses:
|
|
|
||||||||||||||||||||||||
|
Salaries, wages and benefits
|
545,419
|
|
26.9
|
|
544,322
|
|
26.7
|
|
536,509
|
|
26.8
|
|
0.2
|
|
1.5
|
|
||||||||||
|
Fuel
|
371,789
|
|
18.3
|
|
401,417
|
|
19.7
|
|
412,905
|
|
20.6
|
|
(7.4
|
)
|
(2.8
|
)
|
||||||||||
|
Supplies and maintenance
|
179,172
|
|
8.8
|
|
172,505
|
|
8.5
|
|
169,386
|
|
8.5
|
|
3.9
|
|
1.8
|
|
||||||||||
|
Taxes and licenses
|
86,686
|
|
4.3
|
|
90,002
|
|
4.4
|
|
92,917
|
|
4.6
|
|
(3.7
|
)
|
(3.1
|
)
|
||||||||||
|
Insurance and claims
|
71,177
|
|
3.5
|
|
65,593
|
|
3.2
|
|
67,523
|
|
3.4
|
|
8.5
|
|
(2.9
|
)
|
||||||||||
|
Depreciation
|
173,019
|
|
8.5
|
|
166,957
|
|
8.2
|
|
158,634
|
|
7.9
|
|
3.6
|
|
5.2
|
|
||||||||||
|
Rent and purchased transportation
|
456,885
|
|
22.5
|
|
420,480
|
|
20.7
|
|
387,472
|
|
19.3
|
|
8.7
|
|
8.5
|
|
||||||||||
|
Communications and utilities
|
13,506
|
|
0.7
|
|
13,745
|
|
0.7
|
|
15,181
|
|
0.8
|
|
(1.7
|
)
|
(9.5
|
)
|
||||||||||
|
Other
|
(8,196
|
)
|
(0.4
|
)
|
(10,079
|
)
|
(0.5
|
)
|
(11,351
|
)
|
(0.6
|
)
|
18.7
|
|
11.2
|
|
||||||||||
|
Total operating expenses
|
1,889,457
|
|
93.1
|
|
1,864,942
|
|
91.6
|
|
1,829,176
|
|
91.3
|
|
1.3
|
|
2.0
|
|
||||||||||
|
|
|
|||||||||||||||||||||||||
|
Operating income
|
139,726
|
|
6.9
|
|
171,444
|
|
8.4
|
|
173,674
|
|
8.7
|
|
(18.5
|
)
|
(1.3
|
)
|
||||||||||
|
Total other expense (income)
|
(1,985
|
)
|
(0.1
|
)
|
(1,722
|
)
|
(0.1
|
)
|
(1,232
|
)
|
0.0
|
|
(15.3
|
)
|
(39.8
|
)
|
||||||||||
|
Income before income taxes
|
141,711
|
|
7.0
|
|
173,166
|
|
8.5
|
|
174,906
|
|
8.7
|
|
(18.2
|
)
|
(1.0
|
)
|
||||||||||
|
Income taxes
|
54,926
|
|
2.7
|
|
70,132
|
|
3.4
|
|
72,149
|
|
3.6
|
|
(21.7
|
)
|
(2.8
|
)
|
||||||||||
|
Net income
|
$
|
86,785
|
|
4.3
|
|
$
|
103,034
|
|
5.1
|
|
$
|
102,757
|
|
5.1
|
|
(15.8
|
)
|
0.3
|
|
|||||||
15
The following tables set forth the operating revenues, operating expenses and operating income for the Truckload segment, as well as certain statistical data regarding our Truckload segment operations for the periods indicated.
|
|
2013
|
2012
|
2011
|
||||||||||||||
|
Truckload Transportation Services (amounts in thousands)
|
$
|
%
|
$
|
%
|
$
|
%
|
|||||||||||
|
Trucking revenues, net of fuel surcharge
|
$
|
1,287,656
|
|
$
|
1,309,503
|
|
$
|
1,310,612
|
|
||||||||
|
Trucking fuel surcharge revenues
|
354,616
|
|
376,104
|
|
373,384
|
|
|||||||||||
|
Non-trucking and other operating revenues
|
15,582
|
|
|
13,742
|
|
10,969
|
|
||||||||||
|
Operating revenues
|
1,657,854
|
|
100.0
|
1,699,349
|
|
100.0
|
1,694,965
|
|
100.0
|
||||||||
|
Operating expenses
|
1,538,257
|
|
92.8
|
1,546,207
|
|
91.0
|
1,537,361
|
|
90.7
|
||||||||
|
Operating income
|
119,597
|
|
7.2
|
153,142
|
|
9.0
|
157,604
|
|
9.3
|
||||||||
|
Truckload Transportation Services
|
2013
|
2012
|
2011
|
||||||||
|
Operating ratio, net of fuel surcharge revenues
|
90.8
|
%
|
88.4
|
%
|
88.1
|
%
|
|||||
|
Average revenues per tractor per week
(1)
|
$
|
3,457
|
|
$
|
3,486
|
|
$
|
3,480
|
|
||
|
Average trip length in miles (loaded)
|
453
|
|
481
|
|
493
|
|
|||||
|
Average percentage of empty miles
(2)
|
12.5
|
%
|
12.3
|
%
|
11.7
|
%
|
|||||
|
Average tractors in service
|
7,162
|
|
7,225
|
|
7,242
|
|
|||||
|
Total trailers (at year end)
|
21,980
|
|
22,415
|
|
22,095
|
|
|||||
|
Total tractors (at year end):
|
|||||||||||
|
Company
|
6,380
|
|
6,505
|
|
6,600
|
|
|||||
|
Independent contractor
|
670
|
|
645
|
|
600
|
|
|||||
|
Total tractors
|
7,050
|
|
7,150
|
|
7,200
|
|
|||||
|
(1)
|
Net of fuel surcharge revenues.
|
|
(2)
|
"Empty" refers to miles without trailer cargo.
|
The following tables set forth the VAS segment’s revenues, rent and purchased transportation expense, gross margin, other operating expenses (primarily salaries, wages and benefits expense) and operating income, as well as certain statistical data regarding the VAS segment's shipments and average revenues (excluding logistics fee revenue) per shipment for the periods indicated.
|
|
2013
|
2012
|
2011
|
|||||||||||||||||
|
Value Added Services (amounts in thousands)
|
$
|
%
|
$
|
%
|
$
|
%
|
||||||||||||||
|
Operating revenues
|
$
|
361,384
|
|
100.0
|
|
$
|
324,155
|
|
100.0
|
|
$
|
292,813
|
|
100.0
|
|
|||||
|
Rent and purchased transportation expense
|
305,582
|
|
84.6
|
|
274,326
|
|
84.6
|
|
245,898
|
|
84.0
|
|
||||||||
|
Gross margin
|
55,802
|
|
15.4
|
|
49,829
|
|
15.4
|
|
46,915
|
|
16.0
|
|
||||||||
|
Other operating expenses
|
41,138
|
|
11.3
|
|
33,830
|
|
10.5
|
|
29,879
|
|
10.2
|
|
||||||||
|
Operating income
|
$
|
14,664
|
|
4.1
|
|
$
|
15,999
|
|
4.9
|
|
$
|
17,036
|
|
5.8
|
|
|||||
16
|
|
Percentage Change
|
||||||||||||||||
|
Value Added Services
|
2013
|
2012
|
2011
|
2013 to 2012
|
2012 to 20111
|
||||||||||||
|
Total VAS shipments
|
277,430
|
|
265,411
|
|
256,116
|
|
4.5
|
%
|
3.6
|
%
|
|||||||
|
Less: Non-committed shipments to Truckload segment
|
75,852
|
|
79,025
|
|
78,842
|
|
(4.0
|
)%
|
0.2
|
%
|
|||||||
|
Net VAS shipments
|
201,578
|
|
186,386
|
|
177,274
|
|
8.2
|
%
|
5.1
|
%
|
|||||||
|
Average revenue per shipment
|
$
|
1,627
|
|
$
|
1,602
|
|
$
|
1,529
|
|
1.6
|
%
|
4.8
|
%
|
||||
|
|
|
|
|
|
|
||||||||||||
|
Average tractors in service
|
45
|
|
22
|
|
3
|
|
|
|
|||||||||
|
Total trailers (at year end)
|
1,725
|
|
965
|
|
950
|
|
|
|
|||||||||
|
Total tractors (at year end)
|
49
|
|
39
|
|
8
|
|
|
|
|||||||||
2013 Compared to 2012
Operating Revenues
Operating revenues decreased 0.4% in 2013 compared to 2012 due to lower revenues in the Truckload segment, partially offset by higher VAS revenues.
Truckload segment revenues declined $41.5 million, or 2.4%, in 2013 compared to 2012. The truckload freight market during 2013 was comparable to 2012. The average weekly pre-booked percentage of loads to trucks (“pre-books”) for the One-Way Truckload fleets in 2013 was slightly higher than 2012. In the first half of 2013, we saw similar freight demand and typical seasonal trends. The second half of 2013 also demonstrated normal season improvement with periods of stronger freight demand when compared with the same periods of 2012. We attribute this to slightly tighter industry capacity resulting from the July 1, 2013, HOS rule changes, slightly improved customer demand in comparison to economic uncertainty in the second half of 2012, and the compressed retail holiday selling period in 2013. Freight pre-books in our One-Way Truckload fleets in January and February 2014 were better than the same periods in 2013. Severe weather in January and February 2014 contributed to the freight improvement due to freight backlogs created by weather delays. Severe snow, ice and cold weather in multiple geographic regions, including the southeastern United States, has also caused a significant increase in costs in January and February 2014 in the areas of operating supplies and maintenance, insurance and claims, fuel (due to increased truck idling) and the impact of higher fixed costs per mile due to lower miles per truck.
Trucking revenues, net of fuel surcharge, decreased 1.7%, due to a 0.8% decrease in average revenues per tractor per week and a 0.9% decrease in the average number of tractors in service. Average revenues per tractor per week reflect the combined effects of average revenues per total mile, net of fuel surcharge, and average monthly miles per tractor. Average revenues per total mile, net of fuel surcharge, increased 2.1% in 2013 compared to 2012. Average monthly miles per tractor decreased 2.9% in 2013 compared to 2012, resulting from (i) a 5.8% shorter length of haul, (ii) an estimated two to three percent decrease due to the revised HOS rules effective July 1, 2013, and (iii) a truck mix change (more Dedicated, less One-Way Truckload).
The average number of tractors in service in the Truckload segment decreased to 7,162 in 2013 from 7,225 in 2012, a decrease of 63 tractors. We ended 2013 with 7,050 tractors, a decrease of 100 tractors from the end of 2012. We cannot predict whether future driver shortages, if any, will adversely affect our ability to maintain our fleet size or return our fleet to our goal of 7,300 trucks. If such a driver market shortage were to occur, it could result in a fleet size reduction, and our results of operations could be adversely affected.
Trucking fuel surcharge revenues represent collections from customers for the increase in fuel and fuel-related expenses, including the fuel component of our independent contractor cost (recorded as rent and purchased transportation expense) and fuel taxes (recorded in taxes and licenses expense), when diesel fuel prices rise. Conversely, when fuel prices decrease, fuel surcharge revenues decrease. These revenues decreased 5.7% to $354.6 million in 2013 from $376.1 million in 2012 because of lower average fuel prices and lower miles in 2013. To lessen the effect of fluctuating fuel prices on our margins, we collect fuel surcharge revenues from our customers for the cost of diesel fuel and taxes in excess of specified base fuel price levels according to terms in our customer contracts. Fuel surcharge rates generally adjust weekly based on an independent DOE fuel price survey which is released every Monday. Our fuel surcharge programs are designed to (i) recoup higher fuel costs from customers when fuel prices rise and (ii) provide customers with the benefit of lower fuel costs when fuel prices decline. These programs generally enable us to recover a majority, but not all, of the fuel price increases. The remaining portion is generally not recoverable because it results from empty and out-of-route miles (which are not billable to customers) and truck idle time. Fuel prices that change rapidly in short time periods also impact our recovery because the surcharge rate in most programs only changes once per week.
17
We continue to diversify our business model. Our goal is to attain a more balanced revenue portfolio comprised of one-way truckload, specialized services and logistics (which includes the VAS segment) by growing our logistics services revenues.
VAS revenues are generated by its four operating units and exclude revenues for full truckload shipments transferred to the Truckload segment, which are recorded as trucking revenues by the Truckload segment. VAS also recorded revenue and brokered freight expense of $4.5 million in 2013 and $3.2 million in 2012 for Intermodal drayage movements performed by the Truckload segment (also recorded as trucking revenues by the Truckload segment), and these transactions between reporting segments are eliminated in consolidation. VAS revenues increased 11.5% to $361.4 million in 2013 from $324.2 million in 2012, resulting from an increase in Brokerage and Intermodal shipments and a 1.6% increase in the average revenue per shipment. VAS gross margin dollars increased 12.0% to $55.8 million in 2013 from $49.8 million in 2012, and other operating expenses increased $7.3 million or 21.6%; these changes are partially attributed to Intermodal's development of its own drayage fleet, which had the effect of lowering rent and purchased transportation expense and increasing other operating expenses. The average number of tractors in service in the VAS segment (intermodal drayage trucks) increased by 23, from 22 in 2012 to 45 in 2013. The VAS gross margin percentage remained flat at 15.4% in 2013 and 2012 and was negatively impacted by higher third party carrier rates as capacity tightened and competition increased in the second half of 2013. As a result, VAS operating income decreased 8.3% to $14.7 million in 2013 from $16.0 million in 2012.
Operating Expenses
Our operating ratio (operating expenses expressed as a percentage of operating revenues) was 93.1% in 2013 compared to 91.6% in 2012. Expense items that impacted the overall operating ratio are described on the following pages. The tables on pages 15 through 17 show the Consolidated Statements of Income in dollars and as a percentage of total operating revenues and the percentage increase or decrease in the dollar amounts of those items compared to the prior year, as well as the operating ratios, operating margins, and certain statistical information for our two reportable segments, Truckload and VAS.
Salaries, wages and benefits increased $1.1 million or 0.2% in 2013 compared to 2012 and increased 0.2% as a percentage of operating revenues. The higher dollar amount of salaries, wages and benefits expense was due primarily to higher non-driver and student driver salaries. These increases were partially offset by lower workers' compensation expense and a lower dollar amount of driver salaries because of fewer total miles driven, including the shift from this expense category to rent and purchased transportation expense that occurred because of the increase in independent contractor miles as a percentage of total miles. However, when evaluated on a per-mile basis, salaries, wages and benefits increased, which we attribute primarily to higher driver pay, including discretionary and incentive performance pay items in a more competitive driver market, student driver pay as noted above, and higher driver pay during the startup of new Dedicated fleets. Non-driver salaries, wages and benefits in the non-trucking VAS segment increased 7.5% in 2013 compared to 2012. VAS handled 4.5% more shipments in 2013 compared to 2012, including those transferred to the Truckload segment, and the net shipments retained by VAS increased 8.2%.
We renewed our workers' compensation insurance coverage for the policy year beginning April 1, 2013. Our coverage levels are the same as the prior policy year. We continue to maintain a self-insurance retention of $1.0 million per claim. Our workers' compensation insurance premiums for the policy year beginning April 2013 were similar to those for the previous policy year.
The driver recruiting and retention market was more challenging in 2013 compared to 2012. We believe that a declining number of, and increased competition for, driver training school graduates, a declining national unemployment rate and increased job competition from the strengthening housing construction and hydraulic fracturing industries were all contributing factors. We hired 0.2% fewer drivers in 2013 compared to 2012, and the difficult driver market is making it challenging to achieve our 7,300 truck goal for the Truckload segment. However, we continue to believe our position in the current market is better than that of many competitors because over 70% of our driving jobs are in more attractive, shorter-haul Regional and Dedicated fleet operations that enable us to return drivers to their homes on a more frequent and consistent basis. In the event the domestic economy strengthens in 2014, we anticipate the driver market could become even more challenging in 2014. We are unable to predict whether we will experience future driver shortages. If such a shortage were to occur and driver pay rate increases became necessary to attract and retain drivers, our results of operations would be negatively impacted to the extent that we could not obtain corresponding freight rate increases.
Fuel decreased $29.6 million or 7.4% in 2013 compared to 2012 and decreased 1.4% as a percentage of operating revenues due to (i) fewer miles, (ii) slightly improved miles per gallon ("mpg"), (iii) a shift from this expense category to rent and purchased transportation expense because of the increase in independent contractor miles as a percentage of total miles and (iv) lower average diesel fuel prices. Average diesel fuel prices in 2013 were 7 cents per gallon lower than in 2012, a 2% decrease.
We continue to employ measures to improve our fuel mpg, including (i) limiting truck engine idle time, (ii) optimizing the speed, weight and specifications of our equipment and (iii) implementing mpg-enhancing equipment changes to our fleet including new trucks with U.S. Environmental Protection Agency (the "EPA") 2010 compliant engines, more aerodynamic truck features, idle reduction systems, tire inflation systems and trailer skirts to reduce our fuel gallons purchased. These measures resulted in an
18
improvement in mpg in 2013 compared to 2012. However, fuel savings from the mpg improvement is partially offset by higher depreciation expense and the additional cost of diesel exhaust fluid (required in certain tractors with engines that meet the 2010 EPA emission standards). Although our fuel management programs require significant capital investment and research and development, we intend to continue these and other environmentally conscious initiatives, including our active participation as an EPA SmartWay Transport Partner. The SmartWay Transport Partnership is a national voluntary program developed by the EPA and freight industry representatives to reduce greenhouse gases and air pollution and promote cleaner, more efficient ground freight transportation.
For the first eight weeks of 2014, the average diesel fuel price per gallon was approximately 8 cents lower than the average diesel fuel price per gallon in the same period of 2013 and approximately 6 cents lower than the average for first quarter 2013.
Shortages of fuel, increases in fuel prices and petroleum product rationing can have a material adverse effect on our operations and profitability. We are unable to predict whether fuel price levels will increase or decrease in the future or the extent to which fuel surcharges will be collected from customers. As of December 31, 2013, we had no derivative financial instruments to reduce our exposure to fuel price fluctuations.
Supplies and maintenance increased $6.7 million or 3.9% in 2013 compared to 2012 and increased 0.3% as a percentage of operating revenues. The higher maintenance costs resulted primarily from increases in over the road tractor maintenance and tire expense and smaller increases in a combination of expenses including driver advertising, driver lodging and other driver related costs. These increases were partially offset by a shift from this expense category to rent and purchased transportation expense because of the increase in independent contractor miles as a percentage of total miles.
Taxes and licenses decreased $3.3 million or 3.7% in 2013 compared to 2012 and decreased 0.1% as a percentage of operating revenues due primarily to driving fewer miles and the resulting decrease in fuel taxes associated with fewer gallons of diesel fuel purchased.
Insurance and claims increased $5.6 million or 8.5% in 2013 compared to 2012 and increased 0.3% as a percentage of operating revenues. The increase is primarily the result of an increase in the reserves for prior period claims (unfavorable development) and higher expense on new claims, both of which related primarily to smaller dollar liability claims. The increases were partially offset by a lower amount of unfavorable development on large claims. The majority of our insurance and claims expense results from our claim experience and claim development under our self-insurance program; the remainder results from insurance premiums for claims in excess of our self-insured limits. We renewed our liability insurance policies on August 1, 2013, and continue to be responsible for the first $2.0 million per claim with an annual $8.0 million aggregate for claims between $2.0 million and $5.0 million and an annual aggregate of $5.0 million for claims in excess of $5.0 million and less than $10.0 million. We maintain liability insurance coverage with insurance carriers substantially in excess of the $10.0 million per claim. See Item 3 of Part I of this Form 10-K for information on our bodily injury and property damage coverage levels since August 1, 2010. Our liability and cargo insurance premiums for the policy year that began August 1, 2013, are slightly higher than premiums for the previous policy year on a per mile basis.
Depreciation increased $6.1 million or 3.6% in 2013 compared to 2012 and increased 0.3% as a percentage of operating revenues. This increase is due primarily to the higher cost of new trucks purchased compared to the cost of used trucks that were sold. In addition, the purchase of new trailers to replace older used trailers which are fully depreciated also contributed to the increase in depreciation expense. These increases were partially offset by lower depreciation on auxiliary power units that were sold with the older used trucks and not replaced.
Depreciation expense was historically affected by two changes to engine emissions standards imposed by the EPA that became effective in October 2002 and in January 2007, resulting in increased truck purchase costs. We began to take delivery of trucks with these 2007-standard engines in first quarter 2008 to replace older trucks in our fleet. A final set of more rigorous EPA-mandated emissions standards became effective for all new engines manufactured after January 1, 2010. Trucks with 2010-standard engines have a higher purchase price than trucks manufactured to meet the 2007 standards, but the 2010-standard engines are more fuel efficient. In 2013, we continued to purchase trucks with 2010-standard engines to replace older trucks that we sold or traded, and as of December 31, 2013, over 76% of our company tractors had engines that comply with the 2010 emissions standards. Depreciation expense increased in 2013 due to higher prices for these new trucks and is expected to increase further as we continue to replace tractors with 2007-standard engines.
Rent and purchased transportation expense increased $36.4 million or 8.7% in 2013 compared to 2012 and increased 1.8% as a percentage of operating revenues. Rent and purchased transportation expense consists mainly of payments to third-party capacity providers in the VAS segment and other non-trucking operations and payments to independent contractors in the Truckload segment. The payments to third-party capacity providers generally vary depending on changes in the volume of services generated by the VAS segment. VAS rent and purchased transportation expense increased $31.3 million but as a percentage of VAS revenues was 84.6% in both 2013 and 2012.
19
Rent and purchased transportation expense for the Truckload segment increased $6.0 million in 2013 compared to 2012. This increase is due primarily to a shift from salaries, wages and benefits and several other expense categories to rent and purchased transportation expense because of the increase in independent contractor truck miles as a percentage of total miles, offset partially by lower fuel prices that resulted in lower reimbursements to independent contractors for fuel. Independent contractor miles as a percentage of total miles were 12.2% in 2013 compared to 11.1% in 2012.
Challenging operating conditions continue to make independent contractor recruitment and retention difficult. Such conditions include inflationary cost increases that are the responsibility of independent contractors and a shortage of financing available to independent contractors for equipment purchases. We have historically been able to add company tractors and recruit additional company drivers to offset any decrease in the number of independent contractors. If a shortage of independent contractors and company drivers occurs, increases in per mile settlement rates (for independent contractors) and driver pay rates (for company drivers) may become necessary to attract and retain these drivers. This could negatively affect our results of operations to the extent that we would not be able to obtain corresponding freight rate increases.
Communications and utilities decreased $0.2 million or 1.7% in 2013 compared to 2012 but did not change as a percentage of operating revenues. This decrease is due to the installation of Omnitracs MCP200 communication devices, which started in early 2011 and completed in mid-2012, that have a lower monthly service fee than the units that were replaced.
Other operating expenses increased $1.9 million or 18.7% in 2013 compared to 2012 and increased 0.1% as a percentage of operating revenues. Gains on sales of assets (primarily used trucks and trailers) are reflected as a reduction of other operating expenses and are reported net of sales-related expenses (which include costs to prepare the equipment for sale). Gains on sales of assets decreased to $16.4 million in 2013 from $20.5 million in 2012, a $4.1 million decrease. In 2013, we realized lower average gains per truck and trailer sold, and we sold fewer trucks and trailers than in 2012. The lower gains on tractor and trailer sales in 2013 were partially offset by gains of $1.8 million from the sale of real estate.
Other Expense (Income)
Other expense (income) decreased $0.3 million or 15.3% in 2013 compared to 2012 and did not change as a percentage of operating revenues. Interest income net of interest expense increased $0.3 million in 2013 compared to 2012.
Income Taxes
Our effective income tax rate (income taxes expressed as a percentage of income before income taxes) decreased to 38.76% for 2013 from 40.50% in 2012. The lower income tax rate is primarily attributed to favorable tax adjustments for the remeasurement of uncertain tax positions.
2012 Compared to 2011
Operating Revenues
Operating revenues increased 1.7% in 2012 compared to 2011 due to higher non-trucking revenues in the VAS segment. Trucking revenues were nearly flat year over year.
The truckload freight market during 2012 was softer than in 2011. The average weekly pre-booked percentage of loads to trucks for the One-Way Truckload fleets in 2012 was lower than 2011. In the first half of 2012, we saw typical seasonal trends; however, the second half of 2012 did not demonstrate typical seasonal improvement. We believe the economic and fiscal policy uncertainty during the last half of 2012 affected freight trends, as our customers were generally more cautious with their shipping volumes and tightly managed inventories.
Trucking revenues, net of fuel surcharge, decreased 0.1%, as the slight improvement in average revenues per tractor per week was offset by a small decline in the average number of tractors in service. Average revenues per tractor per week reflect the combined effects of average revenues per total mile, net of fuel surcharge, and average monthly miles per tractor. Average revenues per total mile, net of fuel surcharge, increased 2.0% in 2012 compared to 2011. Contractual rate increases in 2012 were similar to 2011, but spot pricing and project freight declined in 2012 versus 2011. Project freight is generally of a higher volume and shorter duration and therefore commands a premium price. Average monthly miles per tractor decreased 1.8% in 2012 compared to 2011, resulting from fewer driver teams and a decrease in the average trip length in miles.
The average number of tractors in service decreased to 7,225 in 2012 from 7,242 in 2011, and we ended 2012 with 7,150 tractors.
20
Trucking fuel surcharge revenues increased to $376.1 million in 2012 from $373.4 million in 2011 because of higher average fuel prices in 2012.
VAS revenues increased 10.7% to $324.2 million in 2012 from $292.8 million in 2011, resulting from a 5.1% increase in the net number of VAS freight shipments and a 4.8% increase in the average revenue per shipment. The revenue increase was nearly evenly split among the Brokerage, Intermodal and International operating units. VAS revenues and brokered freight expense include $3.2 million in 2012 and $1.7 million in 2011 for Intermodal drayage movements performed by the Truckload segment (also recorded as trucking revenues by the Truckload segment), and these transactions between reporting segments are eliminated in consolidation.VAS gross margin dollars increased 6.2% to $49.8 million in 2012 from $46.9 million in 2011. The VAS gross margin percentage decreased from 16.0% in 2011 to 15.4% in 2012 because of the higher cost of third-party capacity and growth in the lower margin Intermodal and WGL operating units. VAS operating income decreased 6.1% to $16.0 million in 2012 from $17.0 million in 2011.
Brokerage revenues increased 6% in 2012 compared to 2011 due to a 5% increase in average revenue per shipment and a 1% increase in number of shipments. Brokerage gross margin and operating income dollars both increased 3% year over year; however, the gross margin percentage and operating income percentage both decreased. In terms of 2012 revenues, Brokerage is the largest VAS operating unit, followed by Intermodal and WGL. Intermodal revenues increased 18%, and its operating income improved by a slightly lower percentage. WGL revenues grew 22% while the gross margin and operating income declined.
Operating Expenses
Our operating ratio was 91.6% in 2012 compared to 91.3% in 2011. Expense items that impacted the overall operating ratio are described on the following pages. The tables on pages 15 through 17 show the Consolidated Statements of Income in dollars and as a percentage of total operating revenues and the percentage increase or decrease in the dollar amounts of those items compared to the prior year, as well as the operating ratios, operating margins, and certain statistical information for our two reportable segments, Truckload and VAS.
Salaries, wages and benefits increased $7.8 million or 1.5% in 2012 compared to 2011 and decreased 0.1% as a percentage of operating revenues. The higher salaries, wages and benefits expense was attributed to (i) higher non-driver salaries, (ii) higher stock-based compensation expense, (iii) higher driver pay, as we made certain pay adjustments in the first half of 2012 to attract and retain drivers for specific fleets, and (iv) higher healthcare expense. These increases were partially offset by (i) lower workers' compensation expense, (ii) lower state unemployment expense, and (iii) the minimal shift from this expense category to rent and purchased transportation expense because of the increase in independent contractor miles as a percentage of total miles. Salaries, wages and benefits in the non-trucking VAS segment increased 11.8% in 2012 compared to 2011. VAS handled 3.6% more shipments in 2012 compared to 2011, including those transferred to the Truckload segment, and the net shipments retained by VAS increased by 5.1%.
We renewed our workers' compensation insurance coverage for the policy year beginning April 1, 2012. Our coverage levels were the same as the prior policy year. We maintained a self-insurance retention of $1.0 million per claim. Our workers' compensation insurance premiums for the policy year beginning April 2012 were slightly lower than those for the previous policy year.
The driver recruiting and retention market was more challenging in 2012 compared to 2011. We believe that driver pay increases by our competitors, a slightly lower number of and increased competition for driver training school graduates, an improved housing construction market and changing industry safety regulations were all contributing factors.
Fuel decreased $11.5 million or 2.8% in 2012 compared to 2011 and decreased 0.9% as a percentage of operating revenues due to improved mpg, a shift from this expense category to rent and purchased transportation expense because of the increase in independent contractor miles as a percentage of total miles, partially offset by higher average diesel fuel prices. Average diesel fuel prices in 2012 were 9 cents per gallon higher than in 2011, a 3% increase.
During 2012, we continued to employ fuel-saving measures and invest in fuel-saving equipment solutions, which were also intended to lessen environmental impact. These measures resulted in a 4% improvement in mpg in 2012 compared to 2011. However, fuel savings from the mpg improvement was partially offset by higher depreciation expense and the additional cost of diesel exhaust fluid.
Supplies and maintenance increased $3.1 million or 1.8% in 2012 compared to 2011 and didn't change as a percentage of operating revenues. The higher maintenance costs resulted primarily from higher tire expense due to tire price increases and increases in a combination of expenses including driver advertising, travel expenses and tolls expense, partially offset by a decrease in maintenance on a reduced number of APUs.
21
Taxes and licenses decreased $2.9 million or 3.1% in 2012 compared to 2011 and decreased 0.2% as a percentage of operating revenues due primarily to the improvement in the company truck fuel mpg.
Insurance and claims decreased $1.9 million or 2.9% in 2012 compared to 2011 and decreased 0.2% as a percentage of operating revenues. The decrease is primarily the result of lower expense related to new claims offset partially by an increase in the reserves for prior period claims (unfavorable development). The unfavorable development related primarily to larger liability claims as the development for smaller liability claims was favorable. We renewed our liability insurance policies on August 1, 2012 and continued to be responsible for the first $2.0 million per claim with an annual $8.0 million aggregate for claims between $2.0 million and $5.0 million and an annual aggregate of $5.0 million for claims in excess of $5.0 million and less than $10.0 million. We maintained liability insurance coverage with insurance carriers substantially in excess of the $10.0 million per claim. Our liability insurance premiums for the policy year that began August 1, 2012, are comparable to the previous policy year premiums.
Depreciation increased $8.3 million or 5.2% in 2012 compared to 2011 and increased 0.3% as a percentage of operating revenues. This increase is due primarily to the higher cost of new trucks compared to the cost of used trucks that were sold. The average cost of new trucks purchased in 2012 is approximately 25% higher than the average cost of used trucks that were sold in 2012. In 2012, we continued to purchase trucks with 2010-standard engines to replace older trucks that we sold or traded, and as of December 31, 2012, approximately 57% of our company tractors had engines that comply with the 2010 emissions standards. In addition, the purchase of new trailers to replace older used trailers which are fully depreciated also contributed to the increase in depreciation expense. These increases were partially offset by lower depreciation on auxiliary power units that were sold with the older used trucks and not replaced.
Rent and purchased transportation expense increased $33.0 million or 8.5% in 2012 compared to 2011 and increased 1.4% as a percentage of operating revenues. VAS rent and purchased transportation expense increased $26.9 million to 84.5% of VAS revenues in 2012 compared to 83.9% of VAS revenues in 2011.
Rent and purchased transportation expense for the Truckload segment increased $6.1 million in 2012 compared to 2011. This increase is due primarily to increased fuel prices that resulted in higher reimbursements to independent contractors for fuel and a shift from salaries, wages and benefits and several other expense categories to rent and purchased transportation expense because of the increase in independent contractor truck miles as a percentage of total miles. Fuel reimbursements to independent contractors amounted to $41.2 million in 2012 compared to $39.8 million in 2011, a $1.4 million increase. Independent contractor miles as a percentage of total miles were 11.1% in 2012 compared to 10.9% in 2011. In addition, rent and purchased transportation expense related to Truckload segment shipments delivered to or from Mexico utilizing a third-party capacity provider increased by $2.9 million in 2012 compared to 2011, resulting from higher volumes.
Communications and utilities decreased $1.4 million or 9.5% in 2012 compared to 2011 and decreased 0.1% as a percentage of operating revenues. This decrease is due to the installation of Omnitracs MCP200 communication devices, which was started in early 2011 and substantially completed by mid-2012.
Other operating expenses increased $1.3 million or 11.2% in 2012 compared to 2011 and increased 0.1% as a percentage of operating revenues. Gains on sales of assets decreased to $20.5 million in 2012 from $21.3 million in 2011, a $0.8 million decrease. In 2012, we realized higher average gains per truck and trailer sold; however, we sold fewer trucks and trailers than in 2011. Increases in professional fees also contributed to the increase in other operating expenses in 2012 compared to 2011.
Other Expense (Income)
Other expense (income) decreased $0.5 million or 39.8% in 2012 compared to 2011 and decreased 0.1% as a percentage of operating revenues. Interest income net of interest expense increased $0.2 million in 2012 compared to 2011 and fines and penalties decreased $0.3 million in 2012 as we paid a penalty to the State of New York in 2011 to settle a permit issue.
Income Taxes
Our effective income tax rate (income taxes expressed as a percentage of income before income taxes) decreased to 40.50% for 2012 from 41.25% in 2011. The lower income tax rate is attributed to lower expense related to unrecognized tax benefits.
22
Liquidity and Capital Resources:
During the year ended December 31, 2013, we generated cash flow from operations of $232.5 million, an 8.9% decrease ($22.6 million), compared to the year ended December 31, 2012. This decrease is attributed primarily to a $16.2 million decrease in net income and $19.3 million decrease in working capital items, namely accounts receivable ($28.1 million decrease) and other current assets ($14.2 million decrease), partially offset by accounts payable ($23.0 million increase). Cash flow from operations decreased $9.4 million in 2012 from 2011, or 3.5%. This decrease is attributed primarily to a $39.2 million increase in income tax payments in 2012 compared to 2011 as the federal bonus depreciation rates that applied to our tractor and trailer purchases decreased to 50% in 2012 from 100% in 2011 and a $39.6 million decrease in cash flows related to accounts payable, offset by a $36.0 million improvement in cash flows related to accounts receivable resulting from shipment growth and increasing rates and fuel surcharge revenues at the end of 2011 and an $18.2 million increase in cash flows related to other current assets due to increased purchases of tires for inventory in 2011 and gradually issuing those tires for use in 2012. We were able to make net capital expenditures, pay dividends, repurchase company stock and repay borrowings with the net cash provided by operating activities and existing cash balances, supplemented by new borrowings under our existing credit facilities.
Net cash used in investing activities decreased by $76.5 million to $140.3 million in 2013 from $216.8 million in 2012 and decreased by $8.0 million in 2012 from 2011. Net property additions (primarily revenue equipment) were $151.9 million for the year ended December 31, 2013 compared to $224.9 million during the same period of 2012 and $232.2 million during 2011. The decrease between 2013 and 2012 occurred because our purchases of new trucks and trailers, net of dispositions, were lower in the 2013 period than in the 2012 period. The slight decrease between 2012 and 2011 occurred because our purchases of new trucks and trailers, net of dispositions, were lower in the 2012 period than in the 2011 period. As of December 31, 2013, we were committed to property and equipment purchases of approximately $23.7 million. We currently expect our estimated net capital expenditures (primarily revenue equipment) in 2014 to be in the range of $150 million to $200 million. We intend to fund these net capital expenditures in 2014 through cash flow from operations and financing available under our existing credit facilities, as management deems necessary.
Net financing activities used $83.5 million in 2013, $35.6 million in 2012 and $40.8 million in 2011. During the year ended December 31, 2013, our borrowings totaled $10.0 million, and we repaid $60.0 million of debt. Our outstanding debt at December 31, 2013 totaled $40.0 million. During 2012, we borrowed $250.0 million and repaid $160.0 million, and in 2011 we borrowed and repaid $50.0 million. We paid quarterly dividends of $14.6 million in 2013. Our dividend payments in 2012 and 2011 totaled $124.4 million and $51.0 million, respectively, and included special dividends of $1.50 per share ($109.8 million total) paid in December 2012 and $0.50 per share ($36.4 million total) paid in December 2011. In 2011, we had financing inflows of $6.7 million from checks issued in excess of cash balances, and this same amount reduced our financing cash flows in 2012. Financing activities for the year ended December 31, 2013, also included common stock repurchases of 821,091 shares at a cost of $20.1 million. From time to time, the Company has repurchased, and may continue to repurchase, shares of the Company’s common stock. The timing and amount of such purchases depends on stock market conditions and other factors. As of December 31, 2013, the Company had purchased 1,862,291 shares pursuant to our current Board of Directors repurchase authorization and had 6,137,709 shares remaining available for repurchase.
Management believes our financial position at December 31, 2013 is strong. As of December 31, 2013, we had $23.7 million of cash and cash equivalents and $772.5 million of stockholders’ equity. Cash is invested primarily in government portfolio money market funds. As of December 31, 2013, we had a total of $250.0 million of credit pursuant to two credit facilities, of which we had borrowed $40.0 million. The remaining $210.0 million of credit available under these facilities is further reduced by the $32.7 million in standby letters of credit under which we are obligated. These letters of credit are primarily required as security for insurance policies. Based on our strong financial position, management does not foresee any significant barriers to obtaining sufficient financing, if necessary.
23
Contractual Obligations and Commercial Commitments:
The following table sets forth our contractual obligations and commercial commitments as of December 31, 2013.
Payments Due by Period
|
(Amounts in millions)
|
Total
|
Less than
1 year (2014)
|
1-3 years (2015-2016)
|
3-5 years (2017-2018)
|
More
than 5
years (After 2018)
|
Period
Unknown
|
||||||||||||||||||
|
Contractual Obligations
|
||||||||||||||||||||||||
|
Unrecognized tax benefits
|
$
|
8.6
|
|
$
|
0.1
|
|
$
|
—
|
|
$
|
—
|
|
$
|
—
|
|
$
|
8.5
|
|
||||||
|
Long-term debt, including current maturities
|
40.0
|
|
—
|
|
40.0
|
|
—
|
|
—
|
|
—
|
|
||||||||||||
|
Interest payments on debt
|
0.8
|
|
0.3
|
|
0.5
|
|
—
|
|
—
|
|
—
|
|
||||||||||||
|
Property and equipment purchase commitments
|
23.7
|
|
23.7
|
|
—
|
|
—
|
|
—
|
|
—
|
|
||||||||||||
|
Operating leases
|
2.2
|
|
1.6
|
|
0.6
|
|
—
|
|
—
|
|
—
|
|
||||||||||||
|
Total contractual cash obligations
|
$
|
75.3
|
|
$
|
25.7
|
|
$
|
41.1
|
|
$
|
—
|
|
$
|
—
|
|
$
|
8.5
|
|
||||||
|
Other Commercial Commitments
|
||||||||||||||||||||||||
|
Unused lines of credit
|
$
|
177.3
|
|
$
|
—
|
|
$
|
102.3
|
|
$
|
75.0
|
|
$
|
—
|
|
$
|
—
|
|
||||||
|
Standby letters of credit
|
32.7
|
|
32.7
|
|
—
|
|
—
|
|
—
|
|
—
|
|
||||||||||||
|
Total commercial commitments
|
$
|
210.0
|
|
$
|
32.7
|
|
$
|
102.3
|
|
$
|
75.0
|
|
$
|
—
|
|
$
|
—
|
|
||||||
|
Total obligations
|
$
|
285.3
|
|
$
|
58.4
|
|
$
|
143.4
|
|
$
|
75.0
|
|
$
|
—
|
|
$
|
8.5
|
|
||||||
We have committed credit facilities with two banks totaling $250.0 million that mature in May 2016 ($175.0 million) and May 2017 ($75.0 million). At December 31, 2013, we had borrowed $40.0 million under these facilities. Borrowings under these credit facilities bear variable interest (0.85% at December 31, 2013) based on the London Interbank Offered Rate (“LIBOR”). Interest payments on debt are based on the debt balance and interest rate at December 31, 2013. The credit available under these facilities is further reduced by the amount of standby letters of credit under which we are obligated. The standby letters of credit are primarily required for insurance policies. The unused lines of credit are available to us in the event we need financing for the replacement of our fleet or for other significant capital expenditures. Management believes our financial position is strong, and we therefore expect that we could obtain additional financing, if necessary. Property and equipment purchase commitments relate to committed equipment expenditures, primarily for revenue equipment. As of December 31, 2013, we had recorded an $8.6 million liability for unrecognized tax benefits. We expect $0.1 million to be settled within the next twelve months and are unable to reasonably determine when the $8.5 million categorized as “period unknown” will be settled.
Off-Balance Sheet Arrangements:
We began leasing certain tractors under non-cancelable operating leases in May 2011. Our future payment obligation under these leases at December 31, 2013 was approximately $2.2 million.
Critical Accounting Policies:
The preparation of consolidated financial statements in conformity with accounting principles generally accepted in the United States of America requires us to make estimates and assumptions that affect the (i) reported amount of assets and liabilities and disclosure of contingent assets and liabilities at the date of the consolidated financial statements and (ii) reported amounts of revenues and expenses during the reporting period. Actual results could differ from those estimates.
The most significant accounting policies and estimates that affect our financial statements include the following:
|
•
|
Selections of estimated useful lives and salvage values for purposes of depreciating tractors and trailers.
Depreciable lives of tractors and trailers range from 80 months to 12 years. Estimates of salvage value at the expected date of trade-in or sale are based on the expected market values of equipment at the time of disposal. We continually monitor the adequacy of the lives and salvage values used in calculating depreciation expense and adjust these assumptions appropriately when warranted.
|
|
•
|
Impairment of long-lived assets.
We review our long-lived assets for impairment whenever events or circumstances indicate the carrying amount of a long-lived asset may not be recoverable. An impairment loss would be recognized if the carrying amount of the long-lived asset is not recoverable and the carrying amount exceeds its fair value. For long-lived assets classified as held and used, the carrying amount is not recoverable when the carrying value of the long-lived asset exceeds
|
24
the sum of the future net cash flows. We do not separately identify assets by operating segment because tractors and trailers are routinely transferred from one operating fleet to another. As a result, none of our long-lived assets have identifiable cash flows from use that are largely independent of the cash flows of other assets and liabilities. Thus, the asset group used to assess impairment would include all of our assets.
|
•
|
Estimates of accrued liabilities for insurance and claims for liability and physical damage losses and workers’ compensation.
The insurance and claims accruals (current and non-current) are recorded at the estimated ultimate payment amounts and are based upon individual case estimates (including negative development) and estimates of incurred-but-not-reported losses using loss development factors based upon past experience. An actuary reviews our undiscounted self-insurance reserves for bodily injury and property damage claims and workers’ compensation claims every six months.
|
|
•
|
Policies for revenue recognition.
Operating revenues (including fuel surcharge revenues) and related direct costs are recorded when the shipment is delivered. For shipments where a third-party capacity provider (including independent contractors under contract with us) is utilized to provide some or all of the service and we (i) are the primary obligor in regard to the shipment delivery, (ii) establish customer pricing separately from carrier rate negotiations, (iii) generally have discretion in carrier selection and/or (iv) have credit risk on the shipment, we record both revenues for the dollar value of services we bill to the customer and rent and purchased transportation expense for transportation costs we pay to the third-party provider upon the shipment's delivery. In the absence of the conditions listed above, we record revenues net of those expenses related to third-party providers.
|
|
•
|
Accounting for income taxes.
Significant management judgment is required to determine (i) the provision for income taxes, (ii) whether deferred income taxes will be realized in full or in part and (iii) the liability for unrecognized tax benefits related to uncertain tax positions. Deferred income tax assets and liabilities are measured using enacted tax rates that are expected to apply to taxable income in the years when those temporary differences are expected to be recovered or settled. When it is more likely that all or some portion of specific deferred income tax assets will not be realized, a valuation allowance must be established for the amount of deferred income tax assets that are determined not to be realizable. A valuation allowance for deferred income tax assets has not been deemed necessary due to our profitable operations. Accordingly, if facts or financial circumstances change and consequently impact the likelihood of realizing the deferred income tax assets, we would need to apply management’s judgment to determine the amount of valuation allowance required in any given period.
|
|
•
|
Allowance for doubtful accounts.
The allowance for doubtful accounts is our estimate of the amount of probable credit losses and revenue adjustments in our existing accounts receivable. We review the financial condition of customers for granting credit and monitor changes in customers’ financial conditions on an ongoing basis. We determine the allowance based on analysis of individual customers’ financial condition, our historical write-off experience and national economic conditions. We have formal policies in place to continually monitor credit extended to customers and to manage our credit risk. We evaluate the adequacy of our allowance for doubtful accounts quarterly and believe our allowance for doubtful accounts is adequate based on information currently available.
|
Management periodically re-evaluates these estimates as events and circumstances change. Together with the effects of the matters discussed above, these factors may significantly impact our results of operations from period to period.
Inflation:
Inflation may impact our operating costs. A prolonged inflation period could cause rises in interest rates, fuel, wages and other costs. These inflationary increases could adversely affect our results of operations unless freight rates could be increased correspondingly. However, the effect of inflation has been minimal over the past three years.
|
ITEM 7A.
|
QUANTITATIVE AND QUALITATIVE DISCLOSURES ABOUT MARKET RISK
|
We are exposed to market risk from changes in interest rates, commodity prices and foreign currency exchange rates.
Interest Rate Risk
We had $40.0 million of variable rate debt outstanding at December 31, 2013. Interest rates on the variable rate debt and our unused credit facilities are based on the LIBOR. Increases in interest rates could impact our annual interest expense on future borrowings. Assuming this level of borrowings, a hypothetical one-percentage point increase in the LIBOR interest rate would increase our annual interest expense by $400,000. As of December 31, 2013, we had no derivative financial instruments to reduce our exposure to interest rate increases.
Commodity Price Risk
The price and availability of diesel fuel are subject to fluctuations attributed to changes in the level of global oil production, refining capacity, seasonality, weather and other market factors. Historically, we have recovered a majority, but not all, of fuel
25
price increases from customers in the form of fuel surcharges. We implemented customer fuel surcharge programs with most of our customers to offset much of the higher fuel cost per gallon. However, we do not recover all of the fuel cost increase through these surcharge programs. We cannot predict the extent to which fuel prices will increase or decrease in the future or the extent to which fuel surcharges could be collected. As of December 31, 2013, we had no derivative financial instruments to reduce our exposure to fuel price fluctuations.
Foreign Currency Exchange Rate Risk
We conduct business in several foreign countries, including Mexico, Canada, China and Australia. To date, most foreign revenues are denominated in U.S. Dollars, and we receive payment for foreign freight services primarily in U.S. Dollars to reduce direct foreign currency risk. Assets and liabilities maintained by a foreign subsidiary company in the local currency are subject to foreign exchange gains or losses. Foreign currency translation gains and losses primarily relate to changes in the value of revenue equipment owned by a subsidiary in Mexico, whose functional currency is the
Peso
. Foreign currency translation losses were $0.5 million in 2013, gains were $1.0 million in 2012, and losses were $1.8 million in 2011 and were recorded in accumulated other comprehensive loss within stockholders’ equity in the Consolidated Balance Sheets. The exchange rate between the Mexican
Peso
and the U.S. Dollar was 13.08
Pesos
to $1.00 at December 31, 2013 compared to 13.01
Pesos
to $1.00 at December 31, 2012 and 13.98
Pesos
to $1.00 at December 31, 2011.
26
|
ITEM 8.
|
FINANCIAL STATEMENTS AND SUPPLEMENTARY DATA
|
REPORT OF INDEPENDENT REGISTERED PUBLIC ACCOUNTING FIRM
The Board of Directors and Stockholders
Werner Enterprises, Inc.:
We have audited the accompanying consolidated balance sheets of Werner Enterprises, Inc. and subsidiaries (the Company) as of December 31, 2013 and 2012, and the related consolidated statements of income, comprehensive income, stockholders’ equity, and cash flows for each of the years in the three-year period ended December 31, 2013. In connection with our audits of the consolidated financial statements, we have also audited the financial statement schedule listed in Item 15(a)(2) of this Form 10-K. These consolidated financial statements and financial statement schedule are the responsibility of the Company’s management. Our responsibility is to express an opinion on these consolidated financial statements and financial statement schedule based on our audits.
We conducted our audits in accordance with the standards of the Public Company Accounting Oversight Board (United States). Those standards require that we plan and perform the audit to obtain reasonable assurance about whether the financial statements are free of material misstatement. An audit includes examining, on a test basis, evidence supporting the amounts and disclosures in the financial statements. An audit also includes assessing the accounting principles used and significant estimates made by management, as well as evaluating the overall financial statement presentation. We believe that our audits provide a reasonable basis for our opinion.
In our opinion, the consolidated financial statements referred to above present fairly, in all material respects, the financial position of Werner Enterprises, Inc. and subsidiaries as of December 31, 2013 and 2012, and the results of their operations and their cash flows for each of the years in the three-year period ended December 31, 2013, in conformity with U.S. generally accepted accounting principles. Also in our opinion, the related financial statement schedule, when considered in relation to the basic consolidated financial statements taken as a whole, presents fairly, in all material respects, the information set forth therein.
We also have audited, in accordance with the standards of the Public Company Accounting Oversight Board (United States), Werner Enterprises, Inc.’s internal control over financial reporting as of December 31, 2013, based on criteria established in
Internal Control – Integrated Framework (1992)
issued by the Committee of Sponsoring Organizations of the Treadway Commission (COSO), and our report dated February 25, 2014 expressed an unqualified opinion on the effectiveness of the Company’s internal control over financial reporting.
KPMG LLP
Omaha, Nebraska
February 25, 2014
27
WERNER ENTERPRISES, INC.
|
|
Years Ended December 31,
|
||||||||||
|
(In thousands, except per share amounts)
|
2013
|
2012
|
2011
|
||||||||
|
Operating revenues
|
$
|
2,029,183
|
|
$
|
2,036,386
|
|
$
|
2,002,850
|
|
||
|
Operating expenses:
|
|||||||||||
|
Salaries, wages and benefits
|
545,419
|
|
544,322
|
|
536,509
|
|
|||||
|
Fuel
|
371,789
|
|
401,417
|
|
412,905
|
|
|||||
|
Supplies and maintenance
|
179,172
|
|
172,505
|
|
169,386
|
|
|||||
|
Taxes and licenses
|
86,686
|
|
90,002
|
|
92,917
|
|
|||||
|
Insurance and claims
|
71,177
|
|
65,593
|
|
67,523
|
|
|||||
|
Depreciation
|
173,019
|
|
166,957
|
|
158,634
|
|
|||||
|
Rent and purchased transportation
|
456,885
|
|
420,480
|
|
387,472
|
|
|||||
|
Communications and utilities
|
13,506
|
|
13,745
|
|
15,181
|
|
|||||
|
Other
|
(8,196
|
)
|
(10,079
|
)
|
(11,351
|
)
|
|||||
|
Total operating expenses
|
1,889,457
|
|
1,864,942
|
|
1,829,176
|
|
|||||
|
Operating income
|
139,726
|
|
171,444
|
|
173,674
|
|
|||||
|
Other expense (income):
|
|||||||||||
|
Interest expense
|
454
|
|
288
|
|
85
|
|
|||||
|
Interest income
|
(2,269
|
)
|
(1,837
|
)
|
(1,448
|
)
|
|||||
|
Other
|
(170
|
)
|
(173
|
)
|
131
|
|
|||||
|
Total other income
|
(1,985
|
)
|
(1,722
|
)
|
(1,232
|
)
|
|||||
|
Income before income taxes
|
141,711
|
|
173,166
|
|
174,906
|
|
|||||
|
Income taxes
|
54,926
|
|
70,132
|
|
72,149
|
|
|||||
|
Net income
|
$
|
86,785
|
|
$
|
103,034
|
|
$
|
102,757
|
|
||
|
Earnings per share:
|
|||||||||||
|
Basic
|
$
|
1.19
|
|
$
|
1.41
|
|
$
|
1.41
|
|
||
|
Diluted
|
$
|
1.18
|
|
$
|
1.40
|
|
$
|
1.40
|
|
||
|
Weighted-average common shares outstanding:
|
|||||||||||
|
Basic
|
72,866
|
|
72,909
|
|
72,787
|
|
|||||
|
Diluted
|
73,428
|
|
73,453
|
|
73,225
|
|
|||||
See Notes to Consolidated Financial Statements.
28
WERNER ENTERPRISES, INC.
CONSOLIDATED STATEMENTS OF COMPREHENSIVE INCOME
|
|
Years Ended December 31,
|
||||||||||
|
(In thousands)
|
2013
|
2012
|
2011
|
||||||||
|
Net income
|
$
|
86,785
|
|
$
|
103,034
|
|
$
|
102,757
|
|
||
|
Other comprehensive income (loss):
|
|||||||||||
|
Foreign currency translation adjustments
|
(475
|
)
|
1,014
|
|
(1,750
|
)
|
|||||
|
Other comprehensive income (loss)
|
(475
|
)
|
1,014
|
|
(1,750
|
)
|
|||||
|
Comprehensive income
|
$
|
86,310
|
|
$
|
104,048
|
|
$
|
101,007
|
|
||
See Notes to Consolidated Financial Statements.
29
WERNER ENTERPRISES, INC.
|
December 31,
|
|||||||
|
(In thousands, except share amounts)
|
2013
|
2012
|
|||||
|
ASSETS
|
|||||||
|
Current assets:
|
|||||||
|
Cash and cash equivalents
|
$
|
23,678
|
|
$
|
15,428
|
|
|
|
Accounts receivable, trade, less allowance of $9,939 and $10,528, respectively
|
231,647
|
|
211,133
|
|
|||
|
Other receivables
|
10,769
|
|
8,004
|
|
|||
|
Inventories and supplies
|
15,743
|
|
23,260
|
|
|||
|
Prepaid taxes, licenses and permits
|
15,064
|
|
14,893
|
|
|||
|
Current deferred income taxes
|
25,315
|
|
25,139
|
|
|||
|
Other current assets
|
27,445
|
|
21,330
|
|
|||
|
Total current assets
|
349,661
|
|
319,187
|
|
|||
|
Property and equipment, at cost:
|
|||||||
|
Land
|
31,445
|
|
31,620
|
|
|||
|
Buildings and improvements
|
132,023
|
|
132,201
|
|
|||
|
Revenue equipment
|
1,364,064
|
|
1,335,897
|
|
|||
|
Service equipment and other
|
200,205
|
|
190,772
|
|
|||
|
Total property and equipment
|
1,727,737
|
|
1,690,490
|
|
|||
|
Less – accumulated depreciation
|
750,219
|
|
696,647
|
|
|||
|
Property and equipment, net
|
977,518
|
|
993,843
|
|
|||
|
Other non-current assets
|
26,918
|
|
21,870
|
|
|||
|
Total assets
|
$
|
1,354,097
|
|
$
|
1,334,900
|
|
|
|
LIABILITIES AND STOCKHOLDERS’ EQUITY
|
|||||||
|
Current liabilities:
|
|||||||
|
Accounts payable
|
$
|
66,678
|
|
$
|
56,397
|
|
|
|
Current portion of long-term debt
|
—
|
|
20,000
|
|
|||
|
Insurance and claims accruals
|
59,811
|
|
57,679
|
|
|||
|
Accrued payroll
|
22,785
|
|
21,134
|
|
|||
|
Other current liabilities
|
18,457
|
|
20,983
|
|
|||
|
Total current liabilities
|
167,731
|
|
176,193
|
|
|||
|
Long-term debt, net of current portion
|
40,000
|
|
70,000
|
|
|||
|
Other long-term liabilities
|
14,710
|
|
15,779
|
|
|||
|
Insurance and claims accruals, net of current portion
|
131,900
|
|
125,500
|
|
|||
|
Deferred income taxes
|
227,237
|
|
232,531
|
|
|||
|
Commitments and contingencies
|
|
|
|||||
|
Stockholders’ equity:
|
|||||||
|
Common stock, $0.01 par value, 200,000,000 shares authorized; 80,533,536 shares
|
|||||||
|
issued; 72,713,920 and 73,246,598 shares outstanding, respectively
|
805
|
|
805
|
|
|||
|
Paid-in capital
|
98,534
|
|
97,457
|
|
|||
|
Retained earnings
|
830,842
|
|
758,617
|
|
|||
|
Accumulated other comprehensive loss
|
(4,631
|
)
|
(4,156
|
)
|
|||
|
Treasury stock, at cost; 7,819,616 and 7,286,938 shares, respectively
|
(153,031
|
)
|
(137,826
|
)
|
|||
|
Total stockholders’ equity
|
772,519
|
|
714,897
|
|
|||
|
Total liabilities and stockholders’ equity
|
$
|
1,354,097
|
|
$
|
1,334,900
|
|
|
See Notes to Consolidated Financial Statements.
30
WERNER ENTERPRISES, INC.
|
|
Years Ended December 31,
|
||||||||||
|
(In thousands)
|
2013
|
2012
|
2011
|
||||||||
|
Cash flows from operating activities:
|
|||||||||||
|
Net income
|
$
|
86,785
|
|
$
|
103,034
|
|
$
|
102,757
|
|
||
|
Adjustments to reconcile net income to net cash provided by operating activities:
|
|||||||||||
|
Depreciation
|
173,019
|
|
166,957
|
|
158,634
|
|
|||||
|
Deferred income taxes
|
(8,389
|
)
|
(9,068
|
)
|
57,863
|
|
|||||
|
Gain on disposal of property and equipment
|
(16,408
|
)
|
(20,533
|
)
|
(21,290
|
)
|
|||||
|
Non-cash equity compensation
|
4,809
|
|
4,602
|
|
2,599
|
|
|||||
|
Insurance and claims accruals, net of current portion
|
6,400
|
|
4,250
|
|
8,000
|
|
|||||
|
Other
|
(541
|
)
|
(237
|
)
|
(1,073
|
)
|
|||||
|
Changes in certain working capital items:
|
|
||||||||||
|
Accounts receivable, net
|
(20,514
|
)
|
7,579
|
|
(28,448
|
)
|
|||||
|
Other current assets
|
3,398
|
|
17,581
|
|
(21,744
|
)
|
|||||
|
Accounts payable
|
2,793
|
|
(20,172
|
)
|
19,381
|
|
|||||
|
Other current liabilities
|
1,105
|
|
1,103
|
|
(12,199
|
)
|
|||||
|
Net cash provided by operating activities
|
232,457
|
|
255,096
|
|
264,480
|
|
|||||
|
Cash flows from investing activities:
|
|||||||||||
|
Additions to property and equipment
|
(211,329
|
)
|
(284,942
|
)
|
(302,340
|
)
|
|||||
|
Retirements of property and equipment
|
59,413
|
|
60,015
|
|
70,142
|
|
|||||
|
Decrease in notes receivable
|
10,679
|
|
8,122
|
|
7,354
|
|
|||||
|
Other
|
979
|
|
—
|
|
—
|
|
|||||
|
Net cash used in investing activities
|
(140,258
|
)
|
(216,805
|
)
|
(224,844
|
)
|
|||||
|
Cash flows from financing activities:
|
|||||||||||
|
Repayments of short-term debt
|
(20,000
|
)
|
(160,000
|
)
|
(50,000
|
)
|
|||||
|
Proceeds from issuance of short-term debt
|
—
|
|
180,000
|
|
50,000
|
|
|||||
|
Repayments of long-term debt
|
(40,000
|
)
|
—
|
|
—
|
|
|||||
|
Proceeds from issuance of long-term debt
|
10,000
|
|
70,000
|
|
—
|
|
|||||
|
Change in net checks issued in excess of cash balances
|
—
|
|
(6,671
|
)
|
6,671
|
|
|||||
|
Dividends on common stock
|
(14,587
|
)
|
(124,391
|
)
|
(50,969
|
)
|
|||||
|
Repurchases of common stock
|
(20,060
|
)
|
—
|
|
—
|
|
|||||
|
Tax withholding related to net share settlements of restricted stock awards
|
(1,804
|
)
|
(674
|
)
|
—
|
|
|||||
|
Stock options exercised
|
2,548
|
|
6,035
|
|
2,940
|
|
|||||
|
Excess tax benefits from equity compensation
|
379
|
|
150
|
|
605
|
|
|||||
|
Net cash used in financing activities
|
(83,524
|
)
|
(35,551
|
)
|
(40,753
|
)
|
|||||
|
Effect of exchange rate fluctuations on cash
|
(425
|
)
|
276
|
|
(437
|
)
|
|||||
|
Net increase (decrease) in cash and cash equivalents
|
8,250
|
|
3,016
|
|
(1,554
|
)
|
|||||
|
Cash and cash equivalents, beginning of period
|
15,428
|
|
12,412
|
|
13,966
|
|
|||||
|
Cash and cash equivalents, end of period
|
$
|
23,678
|
|
$
|
15,428
|
|
$
|
12,412
|
|
||
|
Supplemental disclosures of cash flow information:
|
|||||||||||
|
Interest paid
|
$
|
466
|
|
$
|
245
|
|
$
|
85
|
|
||
|
Income taxes paid
|
66,032
|
|
67,968
|
|
28,802
|
|
|||||
|
Supplemental schedule of non-cash investing activities:
|
|
||||||||||
|
Notes receivable issued upon sale of property and equipment
|
$
|
17,110
|
|
$
|
10,564
|
|
$
|
9,172
|
|
||
|
Property and equipment acquired included in accounts payable
|
5,403
|
|
109
|
|
17,026
|
|
|||||
|
Property and equipment disposed included in other receivables
|
434
|
|
311
|
|
258
|
|
|||||
See Notes to Consolidated Financial Statements.
31
WERNER ENTERPRISES, INC.
CONSOLIDATED STATEMENTS OF STOCKHOLDERS’ EQUITY
|
(In thousands, except share and per share amounts)
|
Common
Stock
|
Paid-In
Capital
|
Retained
Earnings
|
Accumulated
Other
Comprehensive
Income (Loss)
|
Treasury
Stock
|
Total
Stockholders’
Equity
|
|||||||||||||||||
|
BALANCE, December 31, 2010
|
$
|
805
|
|
$
|
91,872
|
|
$
|
728,216
|
|
$
|
(3,420
|
)
|
$
|
(148,498
|
)
|
$
|
668,975
|
|
|||||
|
Comprehensive income
|
—
|
|
—
|
|
102,757
|
|
(1,750
|
)
|
—
|
|
101,007
|
|
|||||||||||
|
Dividends on common stock ($0.70 per share)
|
—
|
|
—
|
|
(50,979
|
)
|
—
|
|
—
|
|
(50,979
|
)
|
|||||||||||
|
Equity compensation activity, 202,578 shares, including excess tax benefits
|
—
|
|
(75
|
)
|
—
|
|
—
|
|
3,620
|
|
3,545
|
|
|||||||||||
|
Non-cash equity compensation expense
|
—
|
|
2,599
|
|
—
|
|
—
|
|
—
|
|
2,599
|
|
|||||||||||
|
BALANCE, December 31, 2011
|
805
|
|
94,396
|
|
779,994
|
|
(5,170
|
)
|
(144,878
|
)
|
725,147
|
|
|||||||||||
|
Comprehensive income
|
—
|
|
—
|
|
103,034
|
|
1,014
|
|
—
|
|
104,048
|
|
|||||||||||
|
Dividends on common stock ($1.70 per share)
|
—
|
|
—
|
|
(124,411
|
)
|
—
|
|
—
|
|
(124,411
|
)
|
|||||||||||
|
Equity compensation activity, 399,022 shares, including excess tax benefits
|
—
|
|
(1,541
|
)
|
—
|
|
—
|
|
7,052
|
|
5,511
|
|
|||||||||||
|
Non-cash equity compensation expense
|
—
|
|
4,602
|
|
—
|
|
—
|
|
—
|
|
4,602
|
|
|||||||||||
|
BALANCE, December 31, 2012
|
805
|
|
97,457
|
|
758,617
|
|
(4,156
|
)
|
(137,826
|
)
|
714,897
|
|
|||||||||||
|
Comprehensive income
|
—
|
|
—
|
|
86,785
|
|
(475
|
)
|
—
|
|
86,310
|
|
|||||||||||
|
Purchases of 821,091 shares of common stock
|
—
|
|
—
|
|
—
|
|
—
|
|
(20,060
|
)
|
(20,060
|
)
|
|||||||||||
|
Dividends on common stock ($0.20 per share)
|
—
|
|
—
|
|
(14,560
|
)
|
—
|
|
—
|
|
(14,560
|
)
|
|||||||||||
|
Equity compensation activity, 288,413 shares, including excess tax benefits
|
—
|
|
(3,732
|
)
|
—
|
|
—
|
|
4,855
|
|
1,123
|
|
|||||||||||
|
Non-cash equity compensation expense
|
—
|
|
4,809
|
|
—
|
|
—
|
|
—
|
|
4,809
|
|
|||||||||||
|
BALANCE, December 31, 2013
|
$
|
805
|
|
$
|
98,534
|
|
$
|
830,842
|
|
$
|
(4,631
|
)
|
$
|
(153,031
|
)
|
$
|
772,519
|
|
|||||
See Notes to Consolidated Financial Statements.
32
WERNER ENTERPRISES, INC.
NOTES TO CONSOLIDATED FINANCIAL STATEMENTS
(1) SUMMARY OF SIGNIFICANT ACCOUNTING POLICIES
Nature of Business
: Werner Enterprises, Inc. (the “Company”) is a truckload transportation and logistics company operating under the jurisdiction of the U.S. Department of Transportation, similar governmental transportation agencies in the foreign countries in which we operate and various U.S. state regulatory authorities. For the years ended December 31, 2013, 2012 and 2011, our ten largest customers comprised
40%
of our revenues. No single customer generated more than 10% of the Company’s total revenues in 2013, 2012, and 2011.
Principles of Consolidation
: The accompanying consolidated financial statements include the accounts of Werner Enterprises, Inc. and our majority-owned subsidiaries. All significant intercompany accounts and transactions relating to these majority-owned entities have been eliminated.
Use of Management Estimates
: The preparation of consolidated financial statements in conformity with accounting principles generally accepted in the United States of America requires management to make estimates and assumptions that affect the (i) reported amounts of assets and liabilities and disclosure of contingent assets and liabilities at the date of the consolidated financial statements and (ii) reported amounts of revenues and expenses during the reporting period. Actual results could differ from those estimates.
Cash and Cash Equivalents
: We consider all highly liquid investments, purchased with a maturity of three months or less, to be cash equivalents. Accounts at banks with an aggregate excess of the amount of checks issued over cash balances are included in current liabilities in the Consolidated Balance Sheets, and changes in such accounts are reported as a financing activity in the Consolidated Statements of Cash Flows.
Trade Accounts Receivable:
We record trade accounts receivable at the invoiced amounts, net of an allowance for doubtful accounts. The allowance for doubtful accounts is our estimate of the amount of probable credit losses and revenue adjustments in our existing accounts receivable. We review the financial condition of customers for granting credit and determine the allowance based on analysis of individual customers’ financial condition, historical write-off experience and national economic conditions. We evaluate the adequacy of our allowance for doubtful accounts quarterly. Past due balances over
90
days and exceeding a specified amount are reviewed individually for collectibility. Account balances are charged off against the allowance after all means of collection have been exhausted and the potential for recovery is considered remote. We do not have any off-balance-sheet credit exposure related to our customers.
Inventories and Supplies
: Inventories and supplies are stated at the lower of average cost or market and consist primarily of revenue equipment parts, tires, fuel and supplies. Tires placed on new revenue equipment are capitalized as a part of the equipment cost. Replacement tires are expensed when placed in service.
Property, Equipment, and Depreciation
: Additions and improvements to property and equipment are capitalized at cost, while maintenance and repair expenditures are charged to operations as incurred. Gains and losses on the sale or exchange of equipment are recorded in other operating expenses.
Depreciation is calculated based on the cost of the asset, reduced by the asset’s estimated salvage value, using the straight-line method. Accelerated depreciation methods are used for income tax purposes. The lives and salvage values assigned to certain assets for financial reporting purposes are different than for income tax purposes. For financial reporting purposes, assets are generally depreciated using the following estimated useful lives and salvage values:
|
|
|
Lives
|
|
Salvage Values
|
|
Building and improvements
|
|
30 years
|
|
0%
|
|
Tractors
|
|
80 months
|
|
0%
|
|
Trailers
|
|
12 years
|
|
$1,000
|
|
Service and other equipment
|
|
3-10 years
|
|
0%
|
Long-Lived Assets:
We review our long-lived assets for impairment whenever events or circumstances indicate the carrying amount of a long-lived asset may not be recoverable. An impairment loss would be recognized if the carrying amount of the long-lived asset is not recoverable and the carrying amount exceeds its fair value. For long-lived assets classified as held and used, the carrying amount is not recoverable when the carrying value of the long-lived asset exceeds the sum of the future net cash flows. We do not separately identify assets by operating segment because tractors and trailers are routinely transferred from one operating
33
fleet to another. As a result, none of our long-lived assets have identifiable cash flows from use that are largely independent of the cash flows of other assets and liabilities. Thus, the asset group used to assess impairment would include all of our assets.
Insurance and Claims Accruals
: Insurance and claims accruals (both current and non-current) reflect the estimated cost (including estimated loss development and loss adjustment expenses) for (i) cargo loss and damage, (ii) bodily injury and property damage, (iii) group health and (iv) workers’ compensation claims not covered by insurance. The costs for cargo, bodily injury and property damage insurance and claims are included in insurance and claims expense in the Consolidated Statements of Income; the costs of group health and workers’ compensation claims are included in salaries, wages and benefits expense. The insurance and claims accruals are recorded at the estimated ultimate payment amounts. Such insurance and claims accruals are based upon individual case estimates (including negative development) and estimates of incurred-but-not-reported losses using loss development factors based upon past experience. Actual costs related to insurance and claims have not differed materially from estimated accrued amounts for all years presented. An actuary reviews our undiscounted self-insurance reserves for bodily injury and property damage claims and workers’ compensation claims every six months.
For the years ended December 31, 2013, 2012, and 2011 our self-insured retention (“SIR”) and deductible amount for liability claims is
$2.0 million
plus administrative expenses, for each occurrence involving bodily injury or property damage. We are also responsible for varying annual aggregate amounts of liability for claims in excess of the SIR/deductible. Liability claims in excess of these aggregates are covered under premium-based policies (issued by insurance companies) to coverage levels that our management considers adequate. We are also responsible for administrative expenses for each occurrence involving bodily injury or property damage.
Our SIR for workers’ compensation claims is
$1.0 million
per claim, with premium-based insurance coverage for claims exceeding this amount. We also maintain a
$34.1 million
bond for the State of Nebraska and a
$6.9 million
bond for our workers’ compensation insurance carrier.
Under these insurance arrangements, we maintained
$32.7 million
in letters of credit as of December 31, 2013.
Revenue Recognition:
The Consolidated Statements of Income reflect recognition of operating revenues (including fuel surcharge revenues) and related direct costs when the shipment is delivered. For shipments where a third-party capacity provider (including independent contractors under contract with us) is utilized to provide some or all of the service and we (i) are the primary obligor in regard to the shipment delivery, (ii) establish customer pricing separately from carrier rate negotiations, (iii) generally have discretion in carrier selection and/or (iv) have credit risk on the shipment, we record both revenues for the dollar value of services we bill to the customer and rent and purchased transportation expense for transportation costs we pay to the third-party provider upon the shipment’s delivery. In the absence of the conditions listed above, we record revenues net of those expenses related to third-party providers.
Foreign Currency Translation:
Local currencies are generally considered the functional currencies outside the United States. Assets and liabilities are translated at year-end exchange rates for operations in local currency environments. Foreign revenues and expense items denominated in the functional currency are translated at the average rates of exchange prevailing during the year. Foreign currency translation adjustments reflect the changes in foreign currency exchange rates applicable to the net assets of the foreign operations. Foreign currency translation adjustments are recorded in accumulated other comprehensive loss within stockholders’ equity in the Consolidated Balance Sheets and as a separate component of comprehensive income in the Consolidated Statements of Comprehensive Income.
Income Taxes:
We use the asset and liability method in accounting for income taxes. Under this method, deferred tax assets and liabilities are recognized for the future tax consequences attributable to temporary differences between the financial statement carrying amounts of existing assets and liabilities and their respective tax bases. Deferred tax assets and liabilities are measured using the enacted tax rates that are expected to apply to taxable income in the years in which those temporary differences are expected to be recovered or settled.
In accounting for uncertain tax positions, we recognize the tax benefit from an uncertain tax position only if it is more likely than not that the tax position will be sustained on examination by the taxing authorities, based on the technical merits of the position. The tax benefits recognized in the financial statements from such a position are measured based on the largest benefit that has a greater than 50% likelihood of being realized upon ultimate settlement. We recognize interest and penalties directly related to income tax matters in income tax expense.
Common Stock and Earnings Per Share:
Basic earnings per share is computed by dividing net income by the weighted average number of common shares outstanding during the period. Diluted earnings per share is computed by dividing net income by the weighted average number of common shares outstanding plus the effect of dilutive potential common shares outstanding during the period using the treasury stock method. Dilutive potential common shares include outstanding stock options and restricted
34
stock awards. There are no differences in the numerators of our computations of basic and diluted earnings per share for any periods presented. The computation of basic and diluted earnings per share is shown below (in thousands, except per share amounts).
|
|
Years Ended December 31,
|
||||||||||
|
|
2013
|
2012
|
2011
|
||||||||
|
Net income
|
$
|
86,785
|
|
$
|
103,034
|
|
$
|
102,757
|
|
||
|
Weighted average common shares outstanding
|
72,866
|
|
72,909
|
|
72,787
|
|
|||||
|
Dilutive effect of stock-based awards
|
562
|
|
544
|
|
438
|
|
|||||
|
Shares used in computing diluted earnings per share
|
73,428
|
|
73,453
|
|
73,225
|
|
|||||
|
Basic earnings per share
|
$
|
1.19
|
|
$
|
1.41
|
|
$
|
1.41
|
|
||
|
Diluted earnings per share
|
$
|
1.18
|
|
$
|
1.40
|
|
$
|
1.40
|
|
||
There were
no
options to purchase shares of common stock that were outstanding during the periods indicated above that were excluded from the computation of diluted earnings per share because the option purchase price was greater than the average market price of the common shares during the period.
Equity Compensation
: We have an equity compensation plan that provides for grants of non-qualified stock options, restricted stock, restricted stock units and stock appreciation rights to our associates and directors. We apply the fair value method of accounting for equity compensation awards. Issuances of stock upon an exercise of stock options or vesting of restricted stock are made from treasury stock; shares reacquired to satisfy tax withholding obligations upon vesting of restricted stock are recorded as treasury stock. Grants of stock options and restricted stock vest in increments, and we recognize compensation expense over the requisite service period of each award.
Comprehensive Income
: Comprehensive income consists of net income and other comprehensive income (loss). Other comprehensive income (loss) refers to revenues, expenses, gains and losses that are not included in net income, but rather are recorded directly in stockholders’ equity. For the years ended December 31, 2013, 2012 and 2011, comprehensive income consists of net income and foreign currency translation adjustments.
New Accounting Pronouncements Adopted:
In February 2013, an update was made to
“Comprehensive Income.”
This update requires an entity to provide information about the amounts reclassified out of accumulated other comprehensive income by component. The update also requires an entity to present, either on the face of the statement where net income is presented or in the notes, significant amounts reclassified out of accumulated other comprehensive income by the respective line items of net income but only if the amount reclassified is required under U.S. GAAP to be reclassified to net income in its entirety in the same reporting period. For other amounts that are not required under U.S. GAAP to be reclassified in their entirety to net income, an entity is required to cross-reference to other disclosures required under U.S. GAAP that provide additional detail about those amounts. The amendments in this update result in common requirements for the classification of amounts reclassified out of accumulated other comprehensive income. The amendments in this update are to be applied prospectively. This update became effective for us beginning January 1, 2013 and, upon adoption, had no effect on our consolidated financial position, results of operations and cash flows.
Accounting Standards Updates Not Yet Effective:
Accounting Standards Updates not effective until after December 31, 2013 are not expected to have a material effect on our consolidated financial position, results of operations or cash flows.
35
(2)
CREDIT FACILITIES
Long-term debt consisted of the following at December 31 (in thousands):
|
December 31,
|
|||||||
|
|
2013
|
2012
|
|||||
|
Notes payable to banks under committed credit facilities
|
$
|
40,000
|
|
$
|
90,000
|
|
|
|
Less current portion
|
—
|
|
20,000
|
|
|||
|
Long-term debt, net
|
$
|
40,000
|
|
$
|
70,000
|
|
|
As of December 31, 2013, we have committed credit facilities with two banks. These include a
$175 million
four-year credit facility which will expire on
May 31, 2016
and a
$75 million
five-year credit facility which will expire on
May 31, 2017
. Borrowings under these credit facilities bear variable interest (
0.85%
at December 31, 2013) based on the London Interbank Offered Rate (“LIBOR”). As of December 31, 2013, we had
$40 million
outstanding under these credit facilities with banks. The
$250 million
of credit available under these facilities is further reduced by
$32.7 million
in standby letters of credit under which we are obligated. Each of the debt agreements includes, among other things, two financial covenants requiring us (i) not to exceed a maximum ratio of total debt to total capitalization and (ii) not to exceed a maximum ratio of total funded debt to earnings before interest, income taxes, depreciation and amortization (as such terms are defined in each credit facility). At December 31, 2013, we were in compliance with these covenants.
At December 31, 2013, the aggregate future maturities of long-term debt by year are as follows (in thousands):
|
2014
|
$
|
—
|
|
|
2015
|
—
|
|
|
|
2016
|
40,000
|
|
|
|
2017
|
—
|
|
|
|
Total
|
$
|
40,000
|
|
The carrying amounts of our long-term debt approximate fair value due to the duration of the notes and the variable interest rates.
(3) NOTES RECEIVABLE
Notes receivable are included in other current assets and other non-current assets in the Consolidated Balance Sheets. At December 31, notes receivable consisted of the following (in thousands):
|
|
December 31,
|
||||||
|
|
2013
|
2012
|
|||||
|
Independent contractor notes receivable
|
$
|
18,475
|
|
$
|
12,468
|
|
|
|
Other notes receivable
|
7,331
|
|
6,907
|
|
|||
|
25,806
|
|
19,375
|
|
||||
|
Less current portion
|
8,895
|
|
5,514
|
|
|||
|
Notes receivable – non-current
|
$
|
16,911
|
|
$
|
13,861
|
|
|
We provide financing to some individuals who want to become independent contractors by purchasing a tractor from us and leasing their services to us. At December 31, 2013, we had
466
notes receivable from these independent contractors and at December 31, 2012, we had
331
such notes receivable. We maintain a primary security interest in the tractor until the independent contractor pays the note balance in full. We also retain recourse exposure related to independent contractors who purchased tractors from us with third-party financing we arranged.
36
(4) LEASES
In 2011, we entered into leases of certain tractors under operating leases which expire in
2015
. Rental expense for these leases is included in rent and purchased transportation expense within the Consolidated Statements of Income. At December 31, 2013, the future minimum lease payments under non-cancelable revenue equipment operating leases are as follows (in thousands):
|
2014
|
$
|
1,588
|
|
|
2015
|
595
|
|
|
|
Total
|
$
|
2,183
|
|
|
|
|||
Rental expense under these non-cancelable revenue equipment operating leases for the years ended December 31, 2013 and 2012 was as follows (in thousands):
|
2013
|
$
|
1,593
|
|
|
2012
|
1,620
|
|
|
(5) INCOME TAXES
Income tax expense consisted of the following (in thousands):
|
|
Years Ended December 31,
|
||||||||||
|
|
2013
|
2012
|
2011
|
||||||||
|
Current:
|
|||||||||||
|
Federal
|
$
|
55,227
|
|
$
|
69,590
|
|
$
|
6,275
|
|
||
|
State
|
6,616
|
|
10,088
|
|
6,664
|
|
|||||
|
Foreign
|
1,472
|
|
(478
|
)
|
1,347
|
|
|||||
|
63,315
|
|
79,200
|
|
14,286
|
|
||||||
|
Deferred:
|
|||||||||||
|
Federal
|
(9,668
|
)
|
(8,630
|
)
|
50,297
|
|
|||||
|
State
|
1,279
|
|
(438
|
)
|
7,566
|
|
|||||
|
(8,389
|
)
|
(9,068
|
)
|
57,863
|
|
||||||
|
Total income tax expense
|
$
|
54,926
|
|
$
|
70,132
|
|
$
|
72,149
|
|
||
The effective income tax rate differs from the federal corporate tax rate of
35%
in 2013, 2012 and 2011 as follows (in thousands):
|
|
Years Ended December 31,
|
||||||||||
|
|
2013
|
2012
|
2011
|
||||||||
|
Tax at statutory rate
|
$
|
49,599
|
|
$
|
60,608
|
|
$
|
61,217
|
|
||
|
State income taxes, net of federal tax benefits
|
5,132
|
|
6,273
|
|
9,250
|
|
|||||
|
Non-deductible meals and entertainment
|
1,577
|
|
2,686
|
|
2,571
|
|
|||||
|
Income tax credits
|
(1,574
|
)
|
(758
|
)
|
(1,517
|
)
|
|||||
|
Other, net
|
192
|
|
1,323
|
|
628
|
|
|||||
|
Total income tax expense
|
$
|
54,926
|
|
$
|
70,132
|
|
$
|
72,149
|
|
||
37
At December 31, deferred tax assets and liabilities consisted of the following (in thousands):
|
|
December 31,
|
||||||
|
|
2013
|
2012
|
|||||
|
Deferred tax assets:
|
|||||||
|
Insurance and claims accruals
|
$
|
76,596
|
|
$
|
73,211
|
|
|
|
Allowance for uncollectible accounts
|
5,672
|
|
7,813
|
|
|||
|
Other
|
8,437
|
|
9,416
|
|
|||
|
Gross deferred tax assets
|
90,705
|
|
90,440
|
|
|||
|
Deferred tax liabilities:
|
|||||||
|
Property and equipment
|
282,642
|
|
288,032
|
|
|||
|
Prepaid expenses
|
6,906
|
|
6,774
|
|
|||
|
Other
|
3,079
|
|
3,026
|
|
|||
|
Gross deferred tax liabilities
|
292,627
|
|
297,832
|
|
|||
|
Net deferred tax liability
|
$
|
201,922
|
|
$
|
207,392
|
|
|
These amounts are presented in the accompanying Consolidated Balance Sheets as of December 31 as follows (in thousands):
|
|
December 31,
|
||||||
|
|
2013
|
2012
|
|||||
|
Current deferred tax asset
|
$
|
25,315
|
|
$
|
25,139
|
|
|
|
Non-current deferred tax liability
|
227,237
|
|
232,531
|
|
|||
|
Net deferred tax liability
|
$
|
201,922
|
|
$
|
207,392
|
|
|
We have not recorded a valuation allowance because we believe that all deferred tax assets are more likely than not to be realized as a result of our historical profitability, future taxable income and reversal of deferred tax liabilities.
Tax adjustments in 2013 for uncertain tax positions decreased the total amount of unrecognized tax benefits. We recognized a
$1.8 million
decrease in the net liability for unrecognized tax benefits for the year ended December 31, 2013 and a
$0.5 million
increase for the year ended December 31, 2012. We accrued interest expense of
$0.3 million
during 2013, excluding the reversal of accrued interest related to the adjustment of uncertain tax positions, and
$0.2 million
during 2012. If recognized,
$5.5 million
of unrecognized tax benefits as of December 31, 2013 and
$7.4 million
as of December 31, 2012 would impact our effective tax rate. Interest of
$1.7 million
as of December 31, 2013 and
$3.6 million
as of December 31, 2012 has been reflected as a component of the total liability. We expect
no
other significant increases or decreases for uncertain tax positions during the next twelve months.
The reconciliations of beginning and ending gross balances of unrecognized tax benefits for 2013 and 2012 are shown below (in thousands).
|
|
December 31,
|
||||||
|
|
2013
|
2012
|
|||||
|
Unrecognized tax benefits, beginning balance
|
$
|
11,563
|
|
$
|
10,827
|
|
|
|
Gross increases – tax positions in prior period
|
286
|
|
279
|
|
|||
|
Gross increases – current-period tax positions
|
742
|
|
788
|
|
|||
|
Settlements
|
(3,947
|
)
|
(331
|
)
|
|||
|
Unrecognized tax benefits, ending balance
|
$
|
8,644
|
|
$
|
11,563
|
|
|
We file U.S. federal income tax returns, as well as income tax returns in various states and several foreign jurisdictions. The years 2010 through 2012 are open for examination by the U.S. Internal Revenue Service (“IRS”), and various years are open for examination by state and foreign tax authorities. State and foreign jurisdictional statutes of limitations generally range from three to four years.
38
In May 2010, the IRS began an audit of our 2007 and 2008 federal income tax returns. During the second quarter of 2012, we received a notice of deficiency including proposed penalties related to our like-kind exchange program for tractors and trailers. The proposed tax deficiency related to timing differences for recognition of gains on sales of equipment. Prior to holding a scheduled appeals conference in June 2013, the IRS appeals officer decided to no longer contest this issue based on the merits of our position. In July 2013, we entered into a stipulation with the IRS that there are no deficiencies in federal income tax and no penalties due for the tax years 2007 and 2008. The IRS decision has no impact on our financial condition, results of operations or income tax rate because we had not previously accrued a liability for any proposed interest or penalties related to this issue.
(6) EQUITY COMPENSATION AND EMPLOYEE BENEFIT PLANS
Equity Plan
The Company initially adopted the Werner Enterprises, Inc. Stock Option Plan in 1987, such plan being approved by the Company's shareholders on June 9, 1987, at the Company's annual meeting. The plan was later renamed the Werner Enterprises, Inc. Equity Plan (the "Equity Plan") and was last amended and restated on May 14, 2013. The Equity Plan provides for grants of nonqualified stock options, restricted stock, restricted stock units and stock appreciation rights. The Board of Directors or the Compensation Committee of our Board of Directors determines the terms of each award, including the type, recipients, number of shares subject to and vesting conditions of each award. No awards of stock appreciation rights have been issued under the Equity Plan to date. The maximum number of shares of common stock that may be awarded under the Equity Plan is
20,000,000
shares. The maximum aggregate number of shares that may be awarded to any one person in any one calendar year under the Equity Plan is
500,000
. As of December 31, 2013, there were
7,658,356
shares available for granting additional awards.
We apply the fair value method of accounting for equity compensation awards granted under our Equity Plan. Equity compensation expense is included in salaries, wages and benefits within the Consolidated Statements of Income. As of December 31, 2013, the total unrecognized compensation cost related to non-vested equity compensation awards was approximately
$8.2
million and is expected to be recognized over a weighted average period of
2.6
years. The following table summarizes the equity compensation expense and related income tax benefit recognized in the Consolidated Statements of Income (in thousands):
|
|
Years Ended December 31,
|
|||||||||||
|
|
2013
|
2012
|
2011
|
|||||||||
|
Stock options:
|
||||||||||||
|
Pre-tax compensation expense
|
$
|
84
|
|
$
|
379
|
|
$
|
343
|
|
|||
|
Tax benefit
|
31
|
|
154
|
|
141
|
|
||||||
|
Stock option expense, net of tax
|
$
|
53
|
|
$
|
225
|
|
$
|
202
|
|
|||
|
Restricted stock and restricted stock units:
|
||||||||||||
|
Pre-tax compensation expense
|
$
|
4,727
|
|
$
|
4,223
|
|
$
|
2,256
|
|
|||
|
Tax benefit
|
1,831
|
|
1,710
|
|
931
|
|
||||||
|
Restricted stock expense, net of tax
|
$
|
2,896
|
|
$
|
2,513
|
|
$
|
1,325
|
|
|||
We do not have a formal policy for issuing shares upon an exercise of stock options or vesting of restricted stock. Such shares are generally issued from treasury stock. From time to time, we repurchase shares of our common stock, the timing and amount of which depends on market and other factors. Historically, the shares acquired from such repurchases have provided us with sufficient quantities of stock to issue for equity compensation. Based on current treasury stock levels, we do not expect to repurchase additional shares specifically for equity compensation during 2014.
Stock Options
Stock options are granted at prices equal to the market value of the common stock on the date the option award is granted. Option awards currently outstanding become exercisable in installments from
24
to
72
months after the date of grant. The options are exercisable over a period not to exceed ten years and one day from the date of grant.
39
The following table summarizes stock option activity for the year ended December 31, 2013:
|
Number of
Options
(in thousands)
|
Weighted
Average
Exercise
Price ($)
|
Weighted
Average
Remaining
Contractual
Term
(Years)
|
Aggregate
Intrinsic Value
(in thousands)
|
|||||||||
|
Outstanding at beginning of period
|
800
|
|
$
|
17.92
|
|
|
|
|||||
|
Options granted
|
—
|
|
—
|
|
|
|
||||||
|
Options exercised
|
(141
|
)
|
18.13
|
|
|
|
||||||
|
Options forfeited
|
(6
|
)
|
20.15
|
|
|
|
||||||
|
Options expired
|
—
|
|
—
|
|
|
|
||||||
|
Outstanding at end of period
|
653
|
|
17.85
|
|
3.36
|
$
|
4,493
|
|
||||
|
Exercisable at end of period
|
570
|
|
17.54
|
|
2.90
|
$
|
4,095
|
|
||||
We did not grant any stock options during the years ended December 31, 2013 and 2012. The fair value of stock option grants is estimated using a Black-Scholes valuation model. The following table summarizes the number of stock options granted in 2011 and the weighted-average assumptions used in the valuations:
|
|
Year Ended December 31,
|
|||
|
|
2011
|
|||
|
Number of options granted
|
31,000
|
|
||
|
Risk-free interest rate
|
1.8
|
%
|
||
|
Expected dividend yield
|
0.90
|
%
|
||
|
Expected volatility
|
37
|
%
|
||
|
Expected term (in years)
|
7.0
|
|
||
|
Grant-date fair value
|
$
|
8.27
|
|
|
The risk-free interest rate was based on average yields for U.S. Treasury notes with a remaining term that is equivalent to the expected term of the stock option grant. We calculated expected volatility using historical daily price changes of our common stock for the period immediately preceding the grant date and equivalent in duration to the expected term of the stock option grant. The expected term was the average number of years we estimated these options will be outstanding. We considered groups of associates having similar historical exercise behavior separately for valuation purposes.
The total intrinsic value of stock options exercised was as follows (in thousands):
|
2013
|
$
|
896
|
|
|
2012
|
1,537
|
|
|
|
2011
|
2,128
|
|
|
Restricted Stock and Restricted Stock Units
Restricted stock awards entitle the holder to shares of common stock when the award vests. Restricted stock units entitle the holder to a combination of cash or stock equal to the value of common stock when the unit vests. The value of these shares may fluctuate according to market conditions and other factors. Restricted stock awards and restricted stock units currently outstanding vest over periods ranging from
12
to
84
months from the grant date of the award. The restricted stock and restricted stock units do not confer any voting or dividend rights to recipients until such shares fully vest and do not have any post-vesting sales restrictions.
40
The following table summarizes restricted stock activity for the year ended December 31, 2013:
|
Number of
Restricted
Shares (in
thousands)
|
Weighted
Average Grant
Date Fair
Value ($)
|
|||||
|
Nonvested at beginning of period
|
815
|
|
$
|
20.69
|
|
|
|
Shares granted
|
115
|
|
23.51
|
|
||
|
Shares vested
|
(223
|
)
|
21.08
|
|
||
|
Shares forfeited
|
(9
|
)
|
20.24
|
|
||
|
Nonvested at end of period
|
698
|
|
21.04
|
|
||
We estimate the fair value of restricted stock awards based upon the market price of the underlying common stock on the date of grant, reduced by the present value of estimated future dividends because the awards are not entitled to receive dividends prior to vesting. Our estimate of future dividends is based on the most recent quarterly dividend rate at the time of grant, adjusted for any known future changes in the dividend rate. Cash settled restricted stock units are recorded as a liability within the Consolidated Balance Sheets and are adjusted to fair value each reporting period. The following table summarizes the number of restricted shares and units granted and the weighted-average assumptions used to calculate the present value of estimated future dividends:
|
Years Ended December 31,
|
||||||||||||||
|
2013
|
2012
|
2011
|
||||||||||||
|
Number of shares granted
|
115,000
|
|
268,000
|
|
205,500
|
|
||||||||
|
Dividends per share (quarterly amounts)
|
$
|
0.05
|
|
$
|
0.05
|
|
$
|
0.05
|
|
|||||
|
Risk-free interest rate
|
1.4
|
%
|
0.7
|
%
|
1.0
|
%
|
||||||||
The total fair value of previously granted restricted stock awards vested during the years ended ended December 31, 2013 and 2012 was
$5.5 million
and
$2.2 million
, respectively. No shares of restricted stock vested during the year ended December 31, 2011. We withheld shares based on the closing stock price on the vesting date to settle the employees' minimum statutory obligation for the applicable income and other employment taxes. Total cash remitted for the employees' tax obligations to the relevant taxing authorities was
$1.8 million
for the year ended December 31, 2013 and is reflected as a financing activity within the Consolidated Statements of Cash Flows. The
75,071
shares withheld to satisfy the tax withholding obligations were recorded as treasury stock.
Employee Stock Purchase Plan
Employee associates that meet certain eligibility requirements may participate in our Employee Stock Purchase Plan (the “Purchase Plan”). Eligible participants designate the amount of regular payroll deductions and/or a single annual payment (each subject to a yearly maximum amount) that is used to purchase shares of our common stock on the over-the-counter market. The maximum annual contribution amount is currently
$20,000
. These purchases are subject to the terms of the Purchase Plan. We contribute an amount equal to
15%
of each participant’s contributions under the Purchase Plan. Interest accrues on Purchase Plan contributions at a rate of
5.25%
until the purchase is made. We pay the broker’s commissions and administrative charges related to purchases of common stock under the Purchase Plan. Our contributions for the Purchase Plan were as follows (in thousands):
|
2013
|
$
|
210
|
|
|
2012
|
204
|
|
|
|
2011
|
217
|
|
|
401(k) Retirement Savings Plan
We have an Employees’ 401(k) Retirement Savings Plan (the “401(k) Plan”). Associates are eligible to participate in the 401(k) Plan if they have been continuously employed with us or one of our subsidiaries for six months or more. We match a portion of each associate’s 401(k) Plan elective deferrals. Salaries, wages and benefits expense in the accompanying Consolidated Statements of Income includes our 401(k) Plan contributions and administrative expenses, which were as follows (in thousands):
|
2013
|
$
|
1,722
|
|
|
2012
|
1,612
|
|
|
|
2011
|
1,471
|
|
|
41
Nonqualified Deferred Compensation Plan
The Executive Nonqualified Excess Plan (the “Excess Plan”) is our nonqualified deferred compensation plan for the benefit of eligible key managerial associates whose 401(k) Plan contributions are limited because of IRS regulations affecting highly compensated associates. Under the terms of the Excess Plan, participants may elect to defer compensation on a pre-tax basis within annual dollar limits we establish. Beginning in 2010, participants were permitted to defer amounts from performance-based compensation. At December 31, 2013, there were
59
participants in the Excess Plan. Although our current intention is not to do so, we may also make matching credits and/or profit sharing credits to participants’ accounts as we so determine each year. Each participant is fully vested in all deferred compensation and earnings; however, these amounts are subject to general creditor claims until distributed to the participant. Under current federal tax law, we are not allowed a current income tax deduction for the compensation deferred by participants, but we are allowed a tax deduction when a distribution payment is made to a participant from the Excess Plan. The accumulated benefit obligation is included in other long-term liabilities in the Consolidated Balance Sheets. We purchased life insurance policies to fund the future liability. The aggregate market value of the life insurance policies is included in other non-current assets in the Consolidated Balance Sheets. The accumulated benefit obligation and aggregate market value of the life insurance policies were as follows (in thousands):
|
|
December 31,
|
||||||
|
|
2013
|
2012
|
|||||
|
Accumulated benefit obligation
|
$
|
5,773
|
|
$
|
4,311
|
|
|
|
Aggregate market value
|
5,186
|
|
3,971
|
|
|||
(7) COMMITMENTS AND CONTINGENCIES
We have committed to property and equipment purchases of approximately
$23.7 million
at December 31, 2013.
In November 2012, the IRS issued a Notice of Proposed Adjustment for tax years 2009 and 2010 related to an employment tax audit which focused on our driver per diem program. Under the program, eligible drivers may elect to receive a nontaxable reimbursement of certain expenses that are otherwise included in and contemplated as a portion of their compensation while away from home. The notice proposed that the nontaxable per diem payments are wages, resulting in additional FICA and FUTA taxes and federal income tax withholding obligations. In December 2013, the IRS issued a "no deficiency" notice, which concluded the audit. The IRS decision had no impact on our financial condition or results of operations because we had not previously accrued a liability related to this issue.
We are involved in certain other claims and pending litigation arising in the ordinary course of business. Management believes the ultimate resolution of these matters will not materially affect our consolidated financial statements.
(8) RELATED PARTY TRANSACTIONS
The Company leases land from a trust in which the Company’s principal stockholder is the sole trustee. The annual rent payments under this lease are
$1.00
per year. The Company is responsible for all real estate taxes and maintenance costs related to the property, which were
$93,000
in 2013 and are recorded as expenses in the Consolidated Statements of Income. The Company has made leasehold improvements to the land totaling approximately
$6.5 million
for facilities used for business meetings and customer promotion.
The Company transacts business with TDR Transportes, S.A. de C.V. (“TDR”), a truckload carrier in the Republic of Mexico, for certain purchased transportation needs. The Company recorded operating revenues from TDR of approximately
$4,141,000
in 2013,
$3,836,000
in 2012 and
$3,965,000
in 2011 related primarily to leasing revenue equipment and a terminal building. The Company recorded purchased transportation expense to TDR of approximately
$603,000
in 2013,
$608,000
in 2012 and
$534,000
in 2011. The Company also sells used revenue equipment to this entity. These sales totaled
$2,275,000
in 2013,
$1,551,000
in 2012 and
$236,000
in 2011, and the Company recognized net gains of
$1,449,000
in 2013,
$823,000
in 2012 and
$67,000
in 2011. The Company had receivables from TDR, primarily related to the leases and revenue equipment sales, of
$858,000
at December 31, 2013, and
$2,105,000
at December 31, 2012.
42
(9) SEGMENT INFORMATION
We have two reportable segments – Truckload Transportation Services (“Truckload”) and Value Added Services (“VAS”).
The Truckload segment consists of two operating units, One-Way Truckload and Specialized Services, that are aggregated because they have similar economic characteristics and meet the other aggregation criteria described in the accounting guidance for segment reporting. One-Way Truckload is comprised of the following operating fleets: (i) the regional short-haul (“Regional”) fleet transports a variety of consumer nondurable products and other commodities in truckload quantities within geographic regions across the United States using dry van trailers; (ii) the medium-to-long-haul van (“Van”) fleet provides comparable truckload van service over irregular routes; and (iii) the expedited (“Expedited”) fleet provides time-sensitive truckload services utilizing driver teams. Specialized Services provides truckload services dedicated to a specific customer, generally for a retail distribution center or manufacturing facility, including services for products requiring specialized trailers such as flatbed or temperature-controlled trailers. Revenues for the Truckload segment include a small amount of non-trucking revenues which consist primarily of the portion of shipments delivered to or from Mexico where we utilize a third-party capacity provider.
The VAS segment generates the majority of our non-trucking revenues through four operating units that provide non-trucking services to our customers. These four VAS operating units are as follows: (i) truck brokerage (“Brokerage”) uses contracted carriers to complete customer shipments; (ii) freight management (”Freight Management”) offers a full range of single-source logistics management services and solutions; (iii) the intermodal (“Intermodal”) unit offers rail transportation through alliances with rail and drayage providers as an alternative to truck transportation; and (iv) Werner Global Logistics international (“WGL”) provides complete management of global shipments from origin to destination using a combination of air, ocean, truck and rail transportation modes.
We generate other revenues related to third-party equipment maintenance, equipment leasing and other business activities. None of these operations meets the quantitative reporting thresholds. As a result, these operations are grouped in “Other” in the tables below. “Corporate” includes revenues and expenses that are incidental to our activities and are not attributable to any of our operating segments. We do not prepare separate balance sheets by segment and, as a result, assets are not separately identifiable by segment. Intersegment eliminations in the table below represent transactions between reporting segments that are eliminated in consolidation. VAS segment revenues for the years ended December 31, 2012 and 2011 have been revised to conform with the current presentation.
The following table summarizes our segment information (in thousands):
|
|
Years Ended December 31,
|
||||||||||
|
|
2013
|
2012
|
2011
|
||||||||
|
Revenues
|
|||||||||||
|
Truckload Transportation Services
|
$
|
1,657,854
|
|
$
|
1,699,349
|
|
$
|
1,694,965
|
|
||
|
Value Added Services
|
361,384
|
|
324,155
|
|
292,813
|
|
|||||
|
Other
|
11,342
|
|
11,782
|
|
12,367
|
|
|||||
|
Corporate
|
3,081
|
|
4,322
|
|
4,409
|
|
|||||
|
Subtotal
|
2,033,661
|
|
2,039,608
|
|
2,004,554
|
|
|||||
|
Inter-segment eliminations
|
(4,478
|
)
|
(3,222
|
)
|
$
|
(1,704
|
)
|
||||
|
Total
|
$
|
2,029,183
|
|
$
|
2,036,386
|
|
$
|
2,002,850
|
|
||
|
Operating Income
|
|||||||||||
|
Truckload Transportation Services
|
$
|
119,597
|
|
$
|
153,142
|
|
$
|
157,604
|
|
||
|
Value Added Services
|
14,664
|
|
15,999
|
|
17,036
|
|
|||||
|
Other
|
3,947
|
|
1,212
|
|
(383
|
)
|
|||||
|
Corporate
|
1,518
|
|
1,091
|
|
(583
|
)
|
|||||
|
Total
|
$
|
139,726
|
|
$
|
171,444
|
|
$
|
173,674
|
|
||
43
Information about the geographic areas in which we conduct business is summarized below (in thousands) as of and for the years ended December 31, 2013, 2012 and 2011. Operating revenues for foreign countries include revenues for (i) shipments with an origin or destination in that country and (ii) other services provided in that country. If both the origin and destination are in a foreign country, the revenues are attributed to the country of origin.
|
2013
|
2012
|
2011
|
|||||||||
|
Revenues
|
|||||||||||
|
United States
|
$
|
1,768,442
|
|
$
|
1,772,179
|
|
$
|
1,772,628
|
|
||
|
Foreign countries
|
|||||||||||
|
Mexico
|
172,009
|
|
172,016
|
|
147,938
|
|
|||||
|
Other
|
88,732
|
|
92,191
|
|
82,284
|
|
|||||
|
Total foreign countries
|
260,741
|
|
264,207
|
|
230,222
|
|
|||||
|
Total
|
$
|
2,029,183
|
|
$
|
2,036,386
|
|
$
|
2,002,850
|
|
||
|
Long-lived Assets
|
|||||||||||
|
United States
|
$
|
955,543
|
|
$
|
979,798
|
|
$
|
931,658
|
|
||
|
Foreign countries
|
|||||||||||
|
Mexico
|
21,654
|
|
13,659
|
|
9,993
|
|
|||||
|
Other
|
321
|
|
386
|
|
485
|
|
|||||
|
Total foreign countries
|
21,975
|
|
14,045
|
|
10,478
|
|
|||||
|
Total
|
$
|
977,518
|
|
$
|
993,843
|
|
$
|
942,136
|
|
||
We generate substantially all of our revenues within the United States or from North American shipments with origins or destinations in the United States. No customer generated more than 10% of our total revenues for 2013, 2012 and 2011.
(10) QUARTERLY RESULTS OF OPERATIONS (UNAUDITED)
|
(In thousands, except per share amounts)
|
First Quarter
|
Second Quarter
|
Third Quarter
|
Fourth Quarter
|
|||||||||||
|
2013:
|
|||||||||||||||
|
Operating revenues
|
$
|
492,887
|
|
$
|
506,648
|
|
$
|
511,728
|
|
$
|
517,920
|
|
|||
|
Operating income
|
28,693
|
|
42,361
|
|
32,583
|
|
36,089
|
|
|||||||
|
Net income
|
17,511
|
|
25,840
|
|
21,259
|
|
22,175
|
|
|||||||
|
Basic earnings per share
|
0.24
|
|
0.35
|
|
0.29
|
|
0.31
|
|
|||||||
|
Diluted earnings per share
|
0.24
|
|
0.35
|
|
0.29
|
|
0.30
|
|
|||||||
|
(In thousands, except per share amounts)
|
First Quarter
|
Second Quarter
|
Third Quarter
|
Fourth Quarter
|
|||||||||||
|
2012:
|
|||||||||||||||
|
Operating revenues
|
$
|
498,376
|
|
$
|
521,812
|
|
$
|
506,504
|
|
$
|
509,694
|
|
|||
|
Operating income
|
35,402
|
|
51,113
|
|
41,805
|
|
43,124
|
|
|||||||
|
Net income
|
21,245
|
|
30,680
|
|
25,128
|
|
25,981
|
|
|||||||
|
Basic earnings per share
|
0.29
|
|
0.42
|
|
0.34
|
|
0.36
|
|
|||||||
|
Diluted earnings per share
|
0.29
|
|
0.42
|
|
0.34
|
|
0.35
|
|
|||||||
44
|
ITEM 9.
|
CHANGES IN AND DISAGREEMENTS WITH ACCOUNTANTS ON ACCOUNTING AND FINANCIAL DISCLOSURE
|
No disclosure under this item was required within the two most recent fiscal years ended December 31, 2013, or any subsequent period, involving a change of accountants or disagreements on accounting and financial disclosure.
|
ITEM 9A.
|
CONTROLS AND PROCEDURES
|
Evaluation of Disclosure Controls and Procedures
As of the end of the period covered by this report, we carried out an evaluation, under the supervision and with the participation of our management, including our Chief Executive Officer and Chief Financial Officer, of the effectiveness of the design and operation of our disclosure controls and procedures, as defined in Exchange Act Rule 15d-15(e). Our disclosure controls and procedures are designed to provide reasonable assurance of achieving the desired control objectives. Based upon that evaluation, our Chief Executive Officer and Chief Financial Officer concluded that our disclosure controls and procedures are effective at a reasonable assurance level in enabling us to record, process, summarize and report information required to be included in our periodic filings with the SEC within the required time period and that such information is accumulated and communicated to our management, including our Chief Executive Officer and Chief Financial Officer, as appropriate, to allow timely decisions regarding required disclosure.
We have confidence in our internal controls and procedures. Nevertheless, our management, including the Chief Executive Officer and Chief Financial Officer, does not expect that the internal controls or disclosure procedures and controls will prevent all errors or intentional fraud. An internal control system, no matter how well conceived and operated, can provide only reasonable, not absolute, assurance that the objectives of such internal controls are met. Further, the design of an internal control system must reflect that resource constraints exist, and the benefits of controls must be evaluated relative to their costs. Because of the inherent limitations in all internal control systems, no evaluation of controls can provide absolute assurance that all control issues, misstatements and instances of fraud, if any, have been prevented or detected.
Management’s Report on Internal Control over Financial Reporting
Management is responsible for establishing and maintaining adequate internal control over our financial reporting. Internal control over financial reporting is a process designed to provide reasonable assurance to our management and Board of Directors regarding the reliability of financial reporting and the preparation of financial statements for external purposes in accordance with U.S. generally accepted accounting principles. Internal control over financial reporting includes (i) maintaining records that in reasonable detail accurately and fairly reflect our transactions; (ii) providing reasonable assurance that transactions are recorded as necessary for preparation of our financial statements; (iii) providing reasonable assurance that receipts and expenditures of company assets are made in accordance with management authorization; and (iv) providing reasonable assurance that unauthorized acquisition, use or disposition of company assets that could have a material effect on our financial statements would be prevented or detected on a timely basis.
Because of its inherent limitations, internal control over financial reporting may not prevent or detect misstatements. Also, projections of any evaluation of effectiveness to future periods are subject to the risk that controls may become inadequate because (i) changes in conditions may occur or (ii) the degree of compliance with the policies or procedures may deteriorate.
Management assessed the effectiveness of our internal control over financial reporting as of December 31, 2013. This assessment is based on the criteria for effective internal control described in
Internal Control – Integrated Framework (1992)
issued by the Committee of Sponsoring Organizations of the Treadway Commission. Based on its assessment, management concluded that our internal control over financial reporting was effective as of December 31, 2013.
Management has engaged KPMG LLP (“KPMG”), the independent registered public accounting firm that audited the consolidated financial statements included in this Form 10-K, to attest to and report on the effectiveness of our internal control over financial reporting. KPMG’s report is included herein.
45
Report of Independent Registered Public Accounting Firm
The Board of Directors and Stockholders
Werner Enterprises, Inc.:
We have audited Werner Enterprises, Inc.’s internal control over financial reporting as of December 31, 2013, based on criteria established in
Internal Control – Integrated Framework (1992)
issued by the Committee of Sponsoring Organizations of the Treadway Commission (COSO)
.
Werner Enterprises, Inc.’s management is responsible for maintaining effective internal control over financial reporting and for its assessment of the effectiveness of internal control over financial reporting, included in the accompanying
Management’s Report on Internal Control over Financial Reporting
. Our responsibility is to express an opinion on the Company’s internal control over financial reporting based on our audit.
We conducted our audit in accordance with the standards of the Public Company Accounting Oversight Board (United States). Those standards require that we plan and perform the audit to obtain reasonable assurance about whether effective internal control over financial reporting was maintained in all material respects. Our audit included obtaining an understanding of internal control over financial reporting, assessing the risk that a material weakness exists, and testing and evaluating the design and operating effectiveness of internal control based on the assessed risk. Our audit also included performing such other procedures as we considered necessary in the circumstances. We believe that our audit provides a reasonable basis for our opinion.
A company’s internal control over financial reporting is a process designed to provide reasonable assurance regarding the reliability of financial reporting and the preparation of financial statements for external purposes in accordance with generally accepted accounting principles. A company’s internal control over financial reporting includes those policies and procedures that (1) pertain to the maintenance of records that, in reasonable detail, accurately and fairly reflect the transactions and dispositions of the assets of the company; (2) provide reasonable assurance that transactions are recorded as necessary to permit preparation of financial statements in accordance with generally accepted accounting principles, and that receipts and expenditures of the company are being made only in accordance with authorizations of management and directors of the company; and (3) provide reasonable assurance regarding prevention or timely detection of unauthorized acquisition, use, or disposition of the company’s assets that could have a material effect on the financial statements.
Because of its inherent limitations, internal control over financial reporting may not prevent or detect misstatements. Also, projections of any evaluation of effectiveness to future periods are subject to the risk that controls may become inadequate because of changes in conditions, or that the degree of compliance with the policies or procedures may deteriorate.
In our opinion, Werner Enterprises, Inc. maintained, in all material respects, effective internal control over financial reporting as of December 31, 2013 based on criteria established in
Internal Control – Integrated Framework (1992)
issued by COSO.
We also have audited, in accordance with the standards of the Public Company Accounting Oversight Board (United States), the consolidated balance sheets of Werner Enterprises, Inc. and subsidiaries as of December 31, 2013 and 2012, and the related consolidated statements of income, comprehensive income, stockholders’ equity, and cash flows for each of the years in the three-year period ended December 31, 2013, and our report dated February 25, 2014, expressed an unqualified opinion on those consolidated financial statements.
KPMG LLP
Omaha, Nebraska
February 25, 2014
Changes in Internal Control over Financial Reporting
Management, under the supervision and with the participation of our Chief Executive Officer and Chief Financial Officer, concluded that no changes in our internal control over financial reporting occurred during the quarter ended December 31, 2013 that have materially affected, or are reasonably likely to materially affect, our internal control over financial reporting.
|
ITEM 9B.
|
OTHER INFORMATION
|
During fourth quarter 2013, no information was required to be disclosed in a report on Form 8-K, but not reported.
46
Certain information required by Part III is omitted from this Form 10-K because we will file a definitive proxy statement pursuant to Regulation 14A (the “Proxy Statement”) not later than 120 days after the end of the fiscal year covered by this Form 10-K, and certain information included therein is incorporated herein by reference. Only those sections of the Proxy Statement which specifically address the items set forth herein are incorporated by reference.
|
ITEM 10.
|
DIRECTORS, EXECUTIVE OFFICERS AND CORPORATE GOVERNANCE
|
The information required by this Item, with the exception of the Code of Corporate Conduct discussed below, is incorporated herein by reference to our Proxy Statement.
Code of Corporate Conduct
We adopted our Code of Corporate Conduct, which is our code of ethics, that applies to our principal executive officer, principal financial officer, principal accounting officer and all other officers, employee associates and directors. The Code of Corporate Conduct is available on our website,
www.werner.com
under the “Investors” tab. We will post on our website any amendment to, or waiver from, any provision of our Code of Corporate Conduct that applies to our Chief Executive Officer, Chief Financial Officer or Chief Accounting Officer (if any) within four business days of any such event.
|
ITEM 11.
|
EXECUTIVE COMPENSATION
|
The information required by this Item is incorporated herein by reference to our Proxy Statement.
|
ITEM 12.
|
SECURITY OWNERSHIP OF CERTAIN BENEFICIAL OWNERS AND MANAGEMENT AND RELATED STOCKHOLDER MATTERS
|
The information required by this Item, with the exception of the equity compensation plan information presented below, is incorporated herein by reference to our Proxy Statement.
Equity Compensation Plan Information
The following table summarizes, as of December 31, 2013, information about compensation plans under which our equity securities are authorized for issuance:
|
|
|
Number of Securities Remaining Available for Future Issuance under Equity Compensation Plans (Excluding Securities Reflected in Column (a))
|
||||
|
|
|
|||||
|
|
|
Number of Securities to be Issued upon Exercise of Outstanding Options, Warrants and Rights
|
Weighted-Average Exercise Price of Outstanding Options, Warrants and Rights
|
|||
|
|
|
|||||
|
|
|
|||||
|
Plan Category
|
|
(a)
|
|
(b)
|
|
(c)
|
|
Equity compensation plans approved by stockholders
|
|
1,351,485
(1)
|
|
$17.85
(2)
|
|
7,658,356
|
|
(1)
|
Includes 695,700 shares to be issued upon vesting of outstanding restricted stock awards.
|
|
(2)
|
The weighted-average exercise price does not take into account the shares to be issued upon vesting of outstanding restricted stock awards, which have no exercise price.
|
We do not have any equity compensation plans that were not approved by stockholders.
|
ITEM 13.
|
CERTAIN RELATIONSHIPS AND RELATED TRANSACTIONS, AND DIRECTOR INDEPENDENCE
|
The information required by this Item is incorporated herein by reference to our Proxy Statement.
|
ITEM 14.
|
PRINCIPAL ACCOUNTING FEES AND SERVICES
|
The information required by this Item is incorporated herein by reference to our Proxy Statement.
47
|
ITEM 15.
|
EXHIBITS, FINANCIAL STATEMENT SCHEDULES
|
|
(a)
|
Financial Statements and Schedules.
|
(1) Financial Statements: See Part II, Item 8 hereof.
|
|
|
Page
|
|
Report of Independent Registered Public Accounting Firm
|
|
27
|
|
Consolidated Statements of Income
|
|
28
|
|
Consolidated Statements of Comprehensive Income
|
29
|
|
|
Consolidated Balance Sheets
|
|
30
|
|
Consolidated Statements of Cash Flows
|
|
31
|
|
Consolidated Statements of Stockholders’ Equity
|
|
32
|
|
Notes to Consolidated Financial Statements
|
|
33
|
(2) Financial Statement Schedules: The consolidated financial statement schedule set forth under the following caption is included herein. The page reference is to the consecutively numbered pages of this report on Form 10-K.
|
|
|
Page
|
|
Schedule II—Valuation and Qualifying Accounts
|
|
50
|
Schedules not listed above have been omitted because they are not applicable or are not required or the information required to be set forth therein is included in the Consolidated Financial Statements or Notes thereto.
(3) Exhibits: The response to this portion of Item 15 is submitted as a separate section of this Form 10-K (see Exhibit Index on pages 51 and 52).
48
SIGNATURES
Pursuant to the requirements of Section 13 or 15(d) of the Securities Exchange Act of 1934, the registrant has duly caused this report to be signed on its behalf by the undersigned, thereunto duly authorized, on the 25
th
day of February, 2014.
|
|
WERNER ENTERPRISES, INC.
|
|
|
By:
|
/s/ Gregory L. Werner
|
|
|
|
|
|
|
|
Gregory L. Werner
Vice Chairman and Chief Executive Officer
|
|
Pursuant to the requirements of the Securities Exchange Act of 1934, this report has been signed below by the following persons on behalf of the registrant and in the capacities and on the dates indicated.
|
Signature
|
|
Position
|
|
Date
|
|
/s/ Clarence L. Werner
|
|
Chairman Emeritus and Director
|
|
February 25, 2014
|
|
Clarence L. Werner
|
|
|
||
|
/s/ Gary L. Werner
|
|
Chairman and Director
|
|
February 25, 2014
|
|
Gary L. Werner
|
|
|
||
|
/s/ Gregory L. Werner
|
|
Vice Chairman, Chief Executive Officer
|
|
February 25, 2014
|
|
Gregory L. Werner
|
|
and Director (Principal Executive Officer)
|
|
|
|
/s/ Michael L. Steinbach
|
|
Director
|
|
February 25, 2014
|
|
Michael L. Steinbach
|
|
|
||
|
/s/ Kenneth M. Bird, Ed.D.
|
|
Director
|
|
February 25, 2014
|
|
Kenneth M. Bird, Ed.D.
|
|
|
||
|
/s/ Patrick J. Jung
|
|
Director
|
|
February 25, 2014
|
|
Patrick J. Jung
|
|
|
||
|
/s/ Duane K. Sather
|
|
Director
|
|
February 25, 2014
|
|
Duane K. Sather
|
|
|
||
|
/s/ Dwaine J. Peetz, Jr., M.D.
|
|
Director
|
|
February 25, 2014
|
|
Dwaine J. Peetz, Jr., M.D.
|
|
|
||
|
/s/ John J. Steele
|
|
Executive Vice President, Treasurer
|
|
February 25, 2014
|
|
John J. Steele
|
|
and Chief Financial Officer (Principal Financial Officer)
|
|
|
|
/s/ James L. Johnson
|
|
Executive Vice President, Chief Accounting Officer
|
|
February 25, 2014
|
|
James L. Johnson
|
|
and Corporate Secretary (Principal Accounting Officer)
|
|
|
|
|
|
|||
49
SCHEDULE II
WERNER ENTERPRISES, INC.
VALUATION AND QUALIFYING ACCOUNTS
|
(In thousands)
|
Balance at
Beginning of
Period
|
Charged to
Costs and
Expenses
|
Write-offs
(Recoveries)
of Doubtful
Accounts
|
Balance at
End of
Period
|
|||||||||||
|
Year ended December 31, 2013:
|
|||||||||||||||
|
Allowance for doubtful accounts
|
$
|
10,528
|
|
$
|
15
|
|
$
|
604
|
|
$
|
9,939
|
|
|||
|
Year ended December 31, 2012:
|
|||||||||||||||
|
Allowance for doubtful accounts
|
$
|
10,154
|
|
$
|
478
|
|
$
|
104
|
|
$
|
10,528
|
|
|||
|
Year ended December 31, 2011:
|
|||||||||||||||
|
Allowance for doubtful accounts
|
$
|
9,484
|
|
$
|
633
|
|
$
|
(37
|
)
|
$
|
10,154
|
|
|||
See report of independent registered public accounting firm.
50
EXHIBIT INDEX
|
Exhibit
Number
|
|
Description
|
|
Incorporated by Reference to:
|
|
3(i)
|
|
Restated Articles of Incorporation
|
|
Exhibit 3(i) to the Company's Quarterly Report on Form 10-Q for the quarter ended June 30, 2007
|
|
3(ii)
|
|
Revised and Restated By-Laws
|
|
Exhibit 3(ii) to the Company's Quarterly Report on Form 10-Q for the quarter ended June 30, 2007
|
|
10.1
|
|
Werner Enterprises, Inc. Amended and Restated Equity Plan
|
|
Exhibit 10.1 to the Company's Quarterly Report on Form 10-Q for the quarter ended June 30, 2013
|
|
10.2
|
|
Non-Employee Director Compensation
|
|
Filed herewith
|
|
10.3
|
|
The Executive Nonqualified Excess Plan of Werner Enterprises, Inc., as amended
|
|
Exhibit 10.1 to the Company's Quarterly Report on Form 10-Q for the quarter ended September 30, 2009
|
|
10.4
|
|
Named Executive Officer Compensation
|
|
Filed herewith
|
|
10.5
|
|
Lease Agreement, as amended February 8, 2007, between the Company and Clarence L. Werner, Trustee of the Clarence L. Werner Revocable Trust
|
|
Exhibit 10.5 to the Company's Annual Report on Form
10-K for the year ended December 31, 2006
|
|
10.6
|
|
License Agreement, dated February 8, 2007 between the Company and Clarence L. Werner, Trustee of the Clarence L. Werner Revocable Trust
|
|
Exhibit 10.6 to the Company's Annual Report on Form
10-K for the year ended December 31, 2006
|
|
10.7
|
|
Form of Notice of Grant of Nonqualified Stock Option
|
|
Exhibit 10.1 to the Company's Current Report on Form 8-K dated November 29, 2007
|
|
10.8
|
|
Form of Restricted Stock Award Agreement
|
|
Exhibit 10.1 to the Company's Current Report on Form 8-K dated December 1, 2009
|
|
10.9
|
Form of Performance-Based Restricted Stock Award Agreement
|
Exhibit 10.1 to the Company's Current Report on Form 8K dated February 10, 2014
|
||
|
11
|
|
Statement Re: Computation of Per Share Earnings
|
|
See Note 1 (Common Stock and Earnings Per Share) in the Notes to Consolidated Financial Statements under Item 8 herein
|
|
21
|
|
Subsidiaries of the Registrant
|
|
Filed herewith
|
|
23.1
|
|
Consent of KPMG LLP
|
|
Filed herewith
|
|
31.1
|
|
Certification of the Chief Executive Officer pursuant to Rules 13a-14(a) and 15d-14(a) of the Securities Exchange Act of 1934 (Section 302 of the Sarbanes-Oxley Act of 2002)
|
|
Filed herewith
|
|
31.2
|
|
Certification of the Chief Financial Officer pursuant to Rules 13a-14(a) and 15d-14(a) of the Securities Exchange Act of 1934 (Section 302 of the Sarbanes-Oxley Act of 2002)
|
|
Filed herewith
|
51
|
Exhibit
Number
|
|
Description
|
|
Incorporated by Reference to:
|
|
32.1
|
|
Certification of the Chief Executive Officer pursuant to 18 U.S.C. Section 1350 (Section 906 of the Sarbanes-Oxley Act of 2002)
|
|
Furnished herewith
|
|
32.2
|
|
Certification of the Chief Financial Officer pursuant to 18 U.S.C. Section 1350 (Section 906 of the Sarbanes-Oxley Act of 2002)
|
|
Furnished herewith
|
|
101.INS
|
|
XBRL Instance Document
|
|
Filed herewith
|
|
101.SCH
|
|
XBRL Taxonomy Extension Schema Document
|
|
Filed herewith
|
|
101.CAL
|
|
XBRL Taxonomy Extension Calculation Linkbase Document
|
|
Filed herewith
|
|
101.DEF
|
|
XBRL Taxonomy Extension Definition Linkbase
|
|
Filed herewith
|
|
101.LAB
|
|
XBRL Taxonomy Extension Label Linkbase Document
|
|
Filed herewith
|
|
101.PRE
|
|
XBRL Taxonomy Extension Presentation Linkbase Document
|
|
Filed herewith
|
52
TABLE OF CONTENTS
Part IItem 1. BusinessItem 1A. Risk FactorsItem 1B. Unresolved Staff CommentsItem 2. PropertiesItem 3. Legal ProceedingsItem 4. Mine Safety DisclosuresPart IIItem 5. Market For Registrant S Common Equity, Related Stockholder Matters and Issuer Purchases Of Equity SecuritiesItem 6. Selected Financial DataItem 7. Management S Discussion and Analysis Of Financial Condition and Results Of OperationsItem 7A. Quantitative and Qualitative Disclosures About Market RiskItem 8. Financial Statements and Supplementary DataItem 9. Changes in and Disagreements with Accountants on Accounting and Financial DisclosureItem 9A. Controls and ProceduresItem 9B. Other InformationPart IIIItem 10. Directors, Executive Officers and Corporate GovernanceItem 11. Executive CompensationItem 12. Security Ownership Of Certain Beneficial Owners and Management and Related Stockholder MattersItem 13. Certain Relationships and Related Transactions, and Director IndependenceItem 14. Principal Accounting Fees and ServicesPart IVItem 15. Exhibits, Financial Statement Schedules