UNITED STATES
SECURITIES AND EXCHANGE COMMISSION
WASHINGTON, D.C. 20549
FORM
(Mark One)
|
|
QUARTERLY REPORT PURSUANT TO SECTION 13 OR 15(D) OF THE SECURITIES EXCHANGE ACT OF 1934. |
For
the Quarterly Period Ended
or
|
|
TRANSITION REPORT PURSUANT TO SECTION 13 OR 15(D) OF THE SECURITIES EXCHANGE ACT OF 1934. |
Commission
File Number:
(Exact name of registrant as specified in its charter)
|
|
|
|
|
(State or other jurisdiction of incorporation or organization) |
(I.R.S. Employer Identification No.) |
(Address of principal executive offices) (Zip Code)
(Registrant’s telephone number, including area code )
Securities registered pursuant to Section 12(b) of the Act:
| Title of each class | Trading Symbol(s) | Name of each exchange on which registered | ||
| None | N/A | N/A |
Indicate by check mark whether the registrant (1) has filed all reports required to be filed by Section 13 or 15 (d) of the Securities Exchange Act of 1934 during the preceding 12 months (or for such shorter periods that the registrant was required to file such reports), and (2) has been subject to such filing requirements for the past 90 days.
Indicate
by check mark whether the registrant has submitted electronically every Interactive Data File to be submitted posted pursuant to Rule
405 of Regulation S-T (§232.405 of this chapter) during the preceding 12 months (or for such shorter period that the registrant
was required to submit such files).
Indicate by check mark whether the registrant is a large accelerated filer, an accelerated filer, a non-accelerated filer or a smaller reporting company filer. See definition of “large accelerated filer,” “accelerated filer,” “smaller reporting company,” and “emerging growth company” in Rule 12b-2 of the Exchange Act.
| Large accelerated filer | ☐ | Accelerated filer | ☐ |
|
|
☐ | Smaller reporting company |
|
| (Do not check if a smaller reporting company) | Emerging growth company |
|
|
If an emerging growth company, indicate by check mark if the registrant has elected not to use the extended transition period for complying with any new or revised financial accounting standards provided pursuant to Section 13(a) of the Exchange Act ☐
Indicate by check mark whether the registrant is a shell company (as defined in Rule 12b-2 of the Exchange Act).
Yes
☐
As of August 15, 2023, the registrant had shares of common stock issued and outstanding.
WETOUCH TECHNOLOGY INC.
QUARTERLY REPORT ON FORM 10-Q
June 30, 2023
TABLE OF CONTENTS
| PAGE | ||
| PART I - FINANCIAL INFORMATION | 4 | |
| Item 1. | Financial Statements | 4 |
| Item 2. | Management’s Discussion and Analysis of Financial Condition and Results of Operations | 5 |
| Item 3. | Quantitative and Qualitative Disclosures About Market Risk | 14 |
| Item 4. | Controls and Procedures | 14 |
| PART II - OTHER INFORMATION | 15 | |
| Item 1. | Legal Proceedings | 15 |
| Item 1A. | Risk Factors | 15 |
| Item 2. | Unregistered Sales of Equity Securities and Use of Proceeds | 15 |
| Item 3. | Defaults Upon Senior Securities | 15 |
| Item 4. | Mine Safety Disclosure | 15 |
| Item 5. | Other Information | 15 |
| Item 6. | Exhibits | 15 |
| SIGNATURES | 16 | |
| 2 |
CAUTIONARY STATEMENT REGARDING FORWARD-LOOKING STATEMENTS
Except for historical information, this report contains forward-looking statements within the meaning of Section 27A of the Securities Act of 1933, as amended (the “Securities Act”) and Section 21E of the Securities Exchange Act of 1934, as amended (the “Exchange Act”). Such forward-looking statements include, among others, those statements including the words “believes”, “anticipates”, “expects”, “intends”, “estimates”, “plans” and words of similar import. Such forward-looking statements involve known and unknown risks, uncertainties and other factors that may cause our actual results, performance or achievements, or industry results, to be materially different from any future results, performance or achievements expressed or implied by such forward-looking statements.
Forward-looking statements are based on our current expectations and assumptions regarding our business, potential target businesses, the economy and other future conditions. Because forward-looking statements relate to the future, by their nature, they are subject to inherent uncertainties, risks and changes in circumstances that are difficult to predict. Our actual results may differ materially from those contemplated by the forward-looking statements. We caution you therefore that you should not rely on any of these forward-looking statements as statements of historical fact or as guarantees or assurances of future performance. Important factors that could cause actual results to differ materially from those in the forward-looking statements include changes in local, regional, national or global political, economic, business, competitive, market (supply and demand) and regulatory conditions.
A description of these and other risks and uncertainties that could affect our business appears in the section captioned “Risk Factors” in our Annual Report on Form 10-K for the fiscal year ended December 31, 2022 which we filed with the Securities and Exchange Commission (“SEC”) on April 17, 2023 (the “Annual Report”). The risks and uncertainties described under “Risk Factors” are not exhaustive.
Given these uncertainties, readers of this Quarterly Report on Form 10-Q (“Quarterly Report”) are cautioned not to place undue reliance on such forward-looking statements. We disclaim any obligation to update any such factors or to publicly announce the result of any revisions to any of the forward-looking statements contained herein to reflect future events or developments.
| 3 |
PART I – FINANCIAL INFORMATION
Item 1. Financial Statements.
The accompanying unaudited financial statements have been prepared in accordance with accounting principles generally accepted in the United States and the rules of the SEC, and should be read in conjunction with the audited financial statements and notes thereto contained in our Annual Report, as updated in subsequent filings we have made with the SEC. In the opinion of management, all adjustments, consisting of normal recurring adjustments, necessary for a fair presentation of financial position and the results of operations for the periods presented have been reflected herein. The results of operations for the periods presented are not necessarily indicative of the results to be expected for the full year.
WETOUCH TECHNOLOGY INC. AND SUBSIDIARIES
CONDENSED CONSOLIDATED FINANCIAL STATEMENTS (UNAUDITED)
JUNE 30, 2023
INDEX TO CONDENSED CONSOLIDATED FINANCIAL STATEMENTS
| 4 |
WETOUCH TECHNOLOGY INC. AND SUBSIDIARIES
CONDENSED CONSOLIDATED BALANCE SHEETS
(Unaudited)
| As of June 30, | As of December 31, | |||||||
| 2023 | 2022 | |||||||
| ASSETS | ||||||||
| CURRENT ASSETS | ||||||||
| Cash | $ |
|
$ |
|
||||
| Accounts receivable, net |
|
|
||||||
| Inventories |
|
|
||||||
| Due from a related party |
|
|||||||
| Prepaid expenses and other current assets |
|
|
||||||
| TOTAL CURRENT ASSETS |
|
|
||||||
| Property, plant and equipment, net |
|
|
||||||
| TOTAL ASSETS | $ |
|
$ |
|
||||
| LIABILITIES AND SHAREHOLDERS’ EQUITY | ||||||||
| CURRENT LIABILITIES | ||||||||
| Accounts payable | $ |
|
$ |
|
||||
| Loan from a third party |
|
|
||||||
| Due to a related party |
|
|||||||
| Income tax payable |
|
|
||||||
| Accrued expenses and other current liabilities |
|
|
||||||
| Convertible promissory notes payable |
|
|
||||||
| TOTAL CURRENT LIABILITIES |
|
|
||||||
| Common stock purchase warrants liability |
|
|
||||||
| TOTAL LIABILITIES | $ |
|
$ |
|
||||
| COMMITMENTS AND CONTINGENCIES (Note 13) | ||||||||
| STOCKHOLDERS’ EQUITY | ||||||||
| Common stock, $ par value, shares authorized, and issued and outstanding as of June 30, 2023 and December 31, 2022, respectively | $ |
|
$ |
|
||||
| Additional paid in capital |
|
|
||||||
| Statutory reserve |
|
|
||||||
| Retained earnings |
|
|
||||||
| Accumulated other comprehensive income |
(
|
) |
(
|
) | ||||
| TOTAL STOCKHOLDERS’ EQUITY |
|
|
||||||
| TOTAL LIABILITIES AND STOCKHOLDERS’ EQUITY | $ |
|
$ |
|
||||
The accompanying notes are an integral part of these condensed consolidated financial statements.
| F- 1 |
WETOUCH TECHNOLOGY INC. AND SUBSIDIARIES
CONDENSED CONSOLIDATED STATEMENTS OF INCOME AND COMPREHENSIVE INCOME
(Unaudited)
| Three-Month Period Ended | Six-Month Period Ended | |||||||||||||||
| June 30, | June 30, | |||||||||||||||
| 2023 | 2022 | 2023 | 2022 | |||||||||||||
| REVENUES | $ |
|
$ |
|
$ |
|
$ |
|
||||||||
| COST OF REVENUES |
(
|
) |
(
|
) |
(
|
) |
(
|
) | ||||||||
| GROSS PROFIT |
|
|
|
|
||||||||||||
| OPERATING EXPENSES | ||||||||||||||||
| Selling expenses |
(
|
) |
(
|
) |
(
|
) |
(
|
) | ||||||||
| General and administrative expenses |
(
|
) |
(
|
) |
(
|
) |
(
|
) | ||||||||
| Research and development expenses |
(
|
) |
(
|
) |
(
|
) |
(
|
) | ||||||||
| OPERATING EXPENSES |
(
|
) |
(
|
) |
(
|
) |
(
|
) | ||||||||
| INCOME FROM OPERATIONS |
|
|
|
|
||||||||||||
| Interest income |
|
|
|
|
||||||||||||
| Interest expense |
(
|
) |
(
|
) |
(
|
) |
(
|
) | ||||||||
| Gain on changes in fair value of common stock purchase warrants liability |
|
|
|
|
||||||||||||
| TOTAL OTHER INCOME |
|
|
|
|
||||||||||||
| INCOME BEFORE INCOME TAX EXPENSE |
|
|
|
|
||||||||||||
| INCOME TAX EXPENSE |
(
|
) |
(
|
) |
(
|
) |
(
|
) | ||||||||
| NET INCOME | $ |
|
$ |
|
$ |
|
$ |
|
||||||||
| OTHER COMPREHENSIVE INCOME (LOSS) | ||||||||||||||||
| Foreign currency translation adjustment |
(
|
) |
(
|
) |
(
|
) |
(
|
) | ||||||||
| COMPREHENSIVE INCOME (LOSS) | $ |
(
|
) | $ |
(
|
) | $ |
|
$ |
|
||||||
| EARNINGS PER COMMON SHARE | ||||||||||||||||
| Basic | $ |
|
$ |
|
$ |
|
$ |
|
||||||||
| Diluted | $ |
|
$ |
|
$ |
|
$ |
|
||||||||
| WEIGHTED AVERAGE NUMBER OF SHARES OUTSTANDING | ||||||||||||||||
| Basic |
|
|
|
|
||||||||||||
| Diluted |
|
|
|
|
||||||||||||
The accompanying notes are an integral part of these condensed consolidated financial statements.
| F- 2 |
WETOUCH TECHNOLODY INC. AND SUBSIDIARIES
CONDENSED CONSOLIDATED STATEMENTS OF CHANGES IN STOCKHOLDERS’ EQUITY
(Unaudited)
|
Common stock at Par value $0.001 |
Additional paid-in |
Statutory | Retained |
Accumulated other comprehensive |
Total stockholders’ |
|||||||||||||||||||||||
| Shares | Amount | capital | reserve | Earnings | income | equity | ||||||||||||||||||||||
| Balance at April 1, 2022 |
|
$ |
|
$ |
|
$ |
|
$ |
|
$ |
|
$ |
|
|||||||||||||||
| Shares issued cashless for warrants |
|
|
(
|
) | ||||||||||||||||||||||||
| Net income |
|
|
||||||||||||||||||||||||||
| Foreign currency translation adjustment | - |
(
|
) |
(
|
) | |||||||||||||||||||||||
| Balance at June 30, 2022 |
|
$ |
|
$ |
|
$ |
|
$ |
|
$ |
(
|
) | $ |
|
||||||||||||||
|
Common stock at Par value $0.001 |
Additional paid-in |
Statutory | Retained |
Accumulated other comprehensive |
Total stockholders’ |
|||||||||||||||||||||||
| Shares | Amount | capital | reserve | Earnings | Income (loss) | equity | ||||||||||||||||||||||
| Balance at April 1, 2023 |
|
$ |
|
$ |
|
$ |
|
$ |
|
$ |
(
|
) | $ |
|
||||||||||||||
| Exercise of warrants issued to third parties in conjunction with debt issuance in 2021 |
|
|
(
|
) | ||||||||||||||||||||||||
| Net income |
|
|
||||||||||||||||||||||||||
| Foreign currency translation adjustment | - |
(
|
) |
(
|
) | |||||||||||||||||||||||
| Balance at June 30, 2023 |
|
$ |
|
$ |
|
$ |
|
$ |
|
$ |
(
|
) | $ |
|
||||||||||||||
|
Common stock at Par value $0.001 |
Additional paid-in |
Statutory | Retained |
Accumulated other comprehensive |
Total stockholders’ |
|||||||||||||||||||||||
| Shares | Amount | capital | reserve | Earnings | income | equity | ||||||||||||||||||||||
| Balance at December 31, 2021 |
|
$ |
|
$ |
|
$ |
|
$ |
|
$ |
|
$ |
|
|||||||||||||||
| Shares issued cashless for warrants |
|
|
(
|
) | ||||||||||||||||||||||||
| Net income | - |
|
|
|||||||||||||||||||||||||
| Foreign currency translation adjustment | - |
(
|
) |
(
|
) | |||||||||||||||||||||||
| Balance at June 30, 2022 |
|
$ |
|
$ |
|
$ |
|
$ |
|
$ |
(
|
) | $ |
|
||||||||||||||
|
Common stock at Par value $0.001 |
Additional paid-in |
Statutory | Retained |
Accumulated other comprehensive |
Total stockholders’ |
|||||||||||||||||||||||
| Shares | Amount | capital | reserve | Earnings | Income (loss) | equity | ||||||||||||||||||||||
| Balance at December 31, 2022 |
|
$ |
|
$ |
|
$ |
|
$ |
|
$ |
(
|
) | $ |
|
||||||||||||||
| Shares issued to private placement |
|
|
|
|
||||||||||||||||||||||||
| Exercise of warrants issued to third parties in conjunction with debt issuance in 2021 |
|
|
(
|
) | ||||||||||||||||||||||||
| Net income | - |
|
|
|||||||||||||||||||||||||
| Foreign currency translation adjustment | - |
(
|
) |
(
|
) | |||||||||||||||||||||||
| Balance at June 30, 2023 |
|
$ |
|
$ |
|
$ |
|
$ |
|
$ |
(
|
) | $ |
|
||||||||||||||
The accompanying notes are an integral part of these condensed consolidated financial statements.
| F- 3 |
WETOUCH TECHNOLODY INC. AND SUBSIDIARIES
CONDENSED CONSOLIDATED STATEMENTS OF CASH FLOWS
(Unaudited)
|
For the six-months ended June 30, |
||||||||
| 2023 | 2022 | |||||||
| Cash flows from operating activities | ||||||||
| Net income | $ |
|
$ |
|
||||
| Adjustments to reconcile net income to cash provided by operating activities | ||||||||
| Depreciation |
|
|
||||||
| Amortization of discounts and issuance cost of the notes |
|
|
||||||
| Gain on changes in fair value of common stock purchase warrants liability |
(
|
) |
(
|
) | ||||
| Changes in operating assets and liabilities: | ||||||||
| Accounts receivable |
(
|
) |
(
|
) | ||||
| Amounts due from related parties |
(
|
) | ||||||
| Inventories |
|
(
|
) | |||||
| Prepaid expenses and other current assets |
|
|
||||||
| Accounts payable |
|
|
||||||
| Amounts due to related parties |
|
(
|
) | |||||
| Income tax payable |
|
|
||||||
| Accrued expenses and other current liabilities |
|
|
||||||
| Net cash provided by operating activities |
|
|
||||||
| Cash flows from investing activities | ||||||||
| Net cash provided by investing activities | ||||||||
| Cash flows from financing activities | ||||||||
| Proceeds from stock issuance of private placement |
|
|||||||
| Proceeds from interest-free advances from a third party |
|
|||||||
| Repayments of convertible promissory notes payable |
(
|
) | ||||||
| Net cash provided by financing activities |
|
|||||||
| Effect of changes of foreign exchange rates on cash |
(
|
) |
(
|
) | ||||
| Net increase in cash |
|
(
|
) | |||||
| Cash, beginning of period |
|
|
||||||
| Cash, end of period | $ |
|
$ |
|
||||
| Supplemental disclosures of cash flow information | ||||||||
| Income tax paid | $ |
|
$ |
|
||||
The accompanying notes are an integral part of these condensed consolidated financial statements.
| F- 4 |
WETOUCH TECHNOLOGY INC. AND SUBSIDIARIES
Notes to Condensed Consolidated Financial Statements (Unaudited)
NOTE 1 — BUSINESS DESCRIPTION
Wetouch Technology Inc. (“Wetouch”, or the “Company”), formerly known as Gulf West Investment Properties, Inc., was originally incorporated in August 1992, under the laws of the state of Nevada.
On October 9, 2020, the Company entered into a share exchange agreement (the “Share Exchange Agreement”) with Wetouch Holding Group Limited (“BVI Wetouch”) and all the shareholders of BVI Wetouch (each, a “BVI Shareholder” and collectively the “BVI Shareholders”), to acquire all the issued and outstanding capital stock of BVI Wetouch in exchange for the issuance to the BVI Shareholders an aggregate of shares of our common stock (the “Reverse Merger”). In the Reverse Merger, each ordinary share of BVI Wetouch was exchanged for shares of common stock of Wetouch. Immediately after the closing of the Reverse Merger on October 9, 2020, we had a total of issued and outstanding shares of common stock. As a result of the Reverse Merger, BVI Wetouch is now our wholly-owned subsidiary.
Wetouch
Holding Group Limited (“BVI Wetouch”), is a holding company whose only asset, held through a subsidiary, is
The Reverse Merger was accounted for as a recapitalization effected by a share exchange, wherein BVI Wetouch is considered the acquirer for accounting and financial reporting purposes. The assets and liabilities of BVI Wetouch have been brought forward at their book value and no goodwill has been recognized. The number of shares, par value amount, and additional paid-in capital in the prior years are retrospectively adjusted according.
Corporate History of BVI Wetouch
Wetouch Holding Group Limited (“BVI Wetouch”) was incorporated under the laws of British Virgin Islands on August 14, 2020. It became the holding company of Hong Kong Wetouch Electronics Technology Limited (“Hong Kong Wetouch”) on September 11, 2020.
Hong Kong Wetouch Technology Limited (“HK Wetouch”), was incorporated as a holding company under the laws of Hong Kong Special Administrative Region (“SAR”) on December 3, 2020. On March 2, 2021, HK Wetouch acquired all shares of Hong Kong Wetouch. Due to the fact that Hong Kong Wetouch and HK Wetouch are both under the same sole stockholder, the acquisition is accounted for under common control.
In June 2021, Hong Kong Wetouch completed its dissolution process pursuant to the minutes of its special shareholder meeting.
Sichuan
Wetouch Technology Co. Ltd. (“Sichuan Wetouch”) was formed on May 6, 2011 in the People’s Republic of China (“PRC”)
and became Wholly Foreign-Owned Enterprise in PRC on February 23, 2017. On July 19, 2016, Sichuan Wetouch was
On December 30, 2020, Sichuan Vtouch Technology Co., Ltd. (“Sichuan Vtouch”) was incorporated in Chengdu, Sichuan, under the laws of the People’s Republic of China.
In March 2021, pursuant to local PRC government guidelines on local environmental issues and the national overall plan, Sichuan Wetouch was under the government directed relocation order. Sichuan Vtouch took over the operating business of Sichuan Wetouch.
On March 30, 2023 an independent third party acquired all shares of Sichuan Wetouch in a nominal amount.
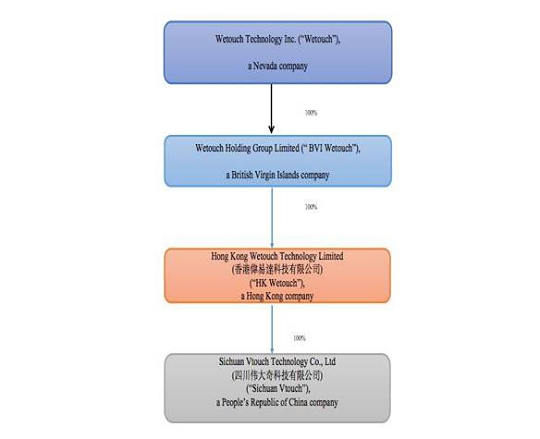
As a result of the above restructuring, HK Wetouch became the sole shareholder of Sichuan Vtouch.
The following diagram illustrates our current corporate structure:
| F- 5 |
Note 2 — BASIS OF PRESENTATION
The accompanying unaudited condensed consolidated financial statements have been prepared in accordance with accounting principles generally accepted in the United States of America (“U.S. GAAP”). Certain information and footnote disclosures normally included in financial statements prepared in accordance with U.S. GAAP have been condensed or omitted as permitted by rules and regulations of the United States Securities and Exchange Commission (“SEC”). The condensed consolidated balance sheet as of December 31, 2022 was derived from the audited consolidated financial statements of Wetouch. The accompanying unaudited condensed consolidated financial statements should be read in conjunction with the consolidated balance sheet of the Company as of December 31, 2022, and the related consolidated statements of comprehensive income, changes in equity and cash flows for the year then ended.
In the opinion of the management, all adjustments (which include normal recurring adjustments) necessary to present a fair statement of the financial position as of June 30, 2023, the results of operations and cash flows for the six-month periods ended June 30, 2023 and 2022 have been made. However, the results of operations included in such financial statements may not necessarily be indicative of annual results.
Use of Estimates
The preparation of condensed financial statements in conformity with U.S. GAAP requires management to make estimates and assumptions that affect the reported amounts of assets, liabilities, revenues and expenses, as well as the related disclosure of contingent assets and liabilities. Actual results could differ from those estimates.
On an ongoing basis, management evaluates the Company’s estimates, including those related to the bad debt allowance, fair values of financial instruments, intangible assets and property and equipment, income taxes, and contingent liabilities, among others. The Company bases its estimates on assumptions, both historical and forward looking, that are believed to be reasonable, the results of which form the basis for making judgments about the carrying values of assets and liabilities.
Significant Accounting Policies
For a detailed discussion about Wetouch’s significant accounting policies, refer to Note 2 — “Summary of Significant Accounting Policies,” in Wetouch’s consolidated financial statements included in Company’s 2022 audited consolidated financial statements. During the six-month periods ended June 30, 2023, there were no significant changes made to Wetouch significant accounting policies.
| F- 6 |
NOTE-3- ACCOUNTS RECEIVABLE
Accounts receivable consists of the following:
| June 30, 2023 | December 31 2022 | |||||||
| Accounts receivable | $ |
|
$ |
|
||||
| Allowance for doubtful accounts | ||||||||
| Accounts receivable, net | $ |
|
$ |
|
||||
The Company’s accounts receivable primarily includes balance due from customers when the Company’s products are sold and delivered to customers.
NOTE-4 — PREPAID EXPENSES AND OTHER CURRENT ASSETS
Prepaid expenses and other current assets consist of the following:
| June 30, 2023 | December 31, 2022 | |||||||
| Advance to suppliers | $ |
|
$ |
|
||||
| VAT input credits |
|
|||||||
| Issue cost related to convertible promissory notes |
|
|
||||||
| Prepayment for land use right (i) |
|
|
||||||
| Security deposit (ii) |
|
|
||||||
| Others receivable (iii) |
|
|
||||||
| Prepaid expenses and other current assets | $ |
|
$ |
|
||||
| (i) |
|
| (ii) |
|
| (iii) |
|
NOTE 5— PROPERTY, PLANT AND EQUIPMENT, NET
| June 30, 2023 | December 31, 2022 | |||||||
| Buildings | $ |
|
$ |
|
||||
| Vehicles |
|
|
||||||
| Construction in progress |
|
|
||||||
| Subtotal |
|
|
||||||
| Less: accumulated depreciation |
(
|
) |
(
|
) | ||||
| Property, plant and equipment, net | $ |
|
$ |
|
||||
Depreciation
expense was $
Pursuant to local PRC government guidelines on local environment issues and the national overall plan, Sichuan Wetouch is under the government directed relocation order to relocate no later than December 31, 2021 and received compensation accordingly. On March 18, 2021, pursuant to the agreement with the local government and an appraisal report issued by a mutual agreed appraiser, Sichuan Wetouch received a compensation of RMB million ($ million) (“Compensation Funds”) for the withdrawal of the right to use of state-owned land and the demolition of all buildings, facilities, equipment and all other appurtenances on the land.
On
March 16, 2021, in order to minimize interruption of our business, Sichuan Vtouch entered into a leasing agreement with Sichuan Renshou
Shigao Tianfu Investment Co., Ltd. (later renamed as Meishan Huantian Industrial Co., Ltd.), a limited company owned by the local government,
to lease the property, and all buildings, facilities and equipment thereon (“Demised Properties) of Sichuan Wetouch, commencing
from April 1, 2021 until December 31, 2021 at a monthly rent of RMB
| F- 7 |
NOTE 6 – RELATED PARTY TRANSACTIONS
Amounts due from a related party are as follows:
| Relationship | June 30, 2023 | December 31, 2022 | Note | ||||||||||||
| Mr. Zongyi Lian |
|
$ |
|
$ | Receivable from employee | ||||||||||
| Total | $ |
|
$ | ||||||||||||
Amounts due to a related party are as follows:
| Relationship | June 30, 2023 | December 31, 2022 | Note | ||||||||||||
| Mr. Zongyi Lian |
|
|
Payable to employee | ||||||||||||
| Total | $ | $ |
|
||||||||||||
NOTE 7 — INCOME TAXES
Wetouch
Wetouch Technology Inc. files a U.S. federal income tax return.
BVI Wetouch
Under the current laws of the British Virgin Islands, BVI Wetouch, subsidiaries of Wetouch, is not subject to tax on its income or capital gains. In addition, no British Virgin Islands withholding tax will be imposed upon the payment of dividends by the Company to its shareholders.
Hong Kong
HK
Wetouch is incorporated in Hong Kong and is subject to profit taxes in Hong Kong at a rate of
PRC
Sichuan
Wetouch and Sichuan Vtouch files income tax returns in the PRC. Effective from January 1, 2008, the PRC statutory income tax rate is
Under
PRC CIT Law, domestic enterprises and Foreign Investment Enterprises (“FIEs”) are usually subject to a unified
On March 30, 2023 an independent third party acquired all shares of Sichuan Wetouch.
Sichuan
Vtouch is entitled to
The
effective income tax rates for the six-month periods ended June 30, 2023 and 2022 were
The estimated effective income tax rate for the year ended December 31, 2023 would be similar to actual effective tax rate of the six-month periods ended June 30, 2023.
| F- 8 |
NOTE 8— ACCRUED EXPENSES AND OTHER CURRENT LIABILITIES
Accrued expenses and other current liabilities consist of the following:
| June 30, 2023 | December 31, 2022 | |||||||
| Advance from customers | $ |
|
$ |
|
||||
| Accrued payroll and employee benefits |
|
|
||||||
| Accrued interest expenses |
|
|
||||||
| Accrued underwriter fees (i) |
|
|||||||
| Other tax payables (ii) |
|
|
||||||
| Other payable to a former shareholder (iii) |
|
|||||||
| Accrued professional fees |
|
|||||||
| Others (iv) |
|
|
||||||
| Accrued expenses and other current liabilities | $ |
|
$ |
|
||||
| (i) |
|
| (ii) |
|
| (iii) |
|
| (iv) |
|
NOTE 9 – CONVERTIBLE PROMISSORY NOTES PAYABLE
a) Convertible promissory notes
In
October, November, and December 2021, the Company, issued seven (7) convertible promissory notes of US$
The details of convertible notes are as follows:
Unless
the Notes are converted, the principal amounts of the Notes, and accrued interest at the rate of
The
Lenders have the right to convert any or all of the principal and accrued interest on the Notes into shares of common stock of the Company
on the earlier of (i) 180 calendar days after the issuance date of the Notes or (ii) the closing of a listing for trading of the common
stock of the Company on a national securities exchange offering resulting in gross proceeds to the Company of $
Subject to customary exceptions, if the Company issues shares or any securities convertible into shares of common stock at an effective price per share lower than the conversion price of the Notes, the conversion rate of the Notes shall be reduced to such lower price.
| F- 9 |
Until the Notes are either paid or converted in their entirety, the Company agreed with the Lenders not to sell any securities convertible into shares of common stock of the Company (i) at a conversion price that is based on the trading price of the stock or (ii) with a conversion price that is subject to being reset at a future date or upon an event directly or indirectly related to the business of the Company or the market for the common stock. The Company also agreed to not issue securities at a future determined price.
The
Lenders have the right to require the Company to repay the Notes if the Company receives cash proceeds, including proceeds from customers
and the issuance of equity (including in the Uplist Offering). If the Company prepays the Notes prior to the Maturity Date, the Company
shall pay a
The following table summarizes the outstanding promissory notes as of June 30, 2023 and December 31, 2022 (dollars in thousands):
| June 30, 2023 | December 31, 2022 | |||||||||||||||||||
| Interest rate | Principal Amount | Carrying Amount | Principal Amount | Carrying Amount | ||||||||||||||||
| Convertible Note - Talos Victory (Note 9 (b)) |
|
% | $ | $ | $ | |||||||||||||||
| Convertible Note - Mast Hill (Note 9 (b)) |
|
% |
|
|
|
|
||||||||||||||
| Convertible Note - First Fire (Note 9 (b)) |
|
% |
|
|
|
|
||||||||||||||
| Convertible Note - LGH Note 9 (b)) |
|
% |
|
|
|
|
||||||||||||||
| Convertible Note - Fourth Man (Note 9 (b)) |
|
% |
|
|
|
|
||||||||||||||
| Convertible Note - Jefferson Street Note 9 (b)) |
|
% |
|
|
|
|
||||||||||||||
| Convertible Note - Blue Lake Note 9 (b)) |
|
% | ||||||||||||||||||
| Total | $ |
|
$ |
|
$ |
|
$ |
|
||||||||||||
| Amortization of discounts for the six months ended June 30, 2023 |
(
|
) | ||||||||||||||||||
| Convertible promissory notes payable as of June 30, 2023 | $ |
|
||||||||||||||||||
From December 28, 2022 to January 18, 2023, the remaining five (5) lenders and the Company entered into an amendment to the Note (“Amendment to Promissory Note”) extending maturity date for an additional 6 months.
For
the six-month period ended June 30, 2023 and 2022, the Company recognized interest expenses of the Notes in the amount of US$
*The
Company prepaid $
| F- 10 |
b) Warrants
Accounting for Warrants
In
connection with the issuance of a convertible promissory notes (see Note 11 (a) in October, November and December, 2021, the Company
also issued seven (7) three-year warrant (the “Warrant”) to purchase an aggregate of
The
Warrants issued to the Lenders granted each of the Lenders the right to purchase up to
The Lenders have the right to exercise the Warrants on a cashless basis if the highest traded price of a share of common stock of the Company during the 150 trading days prior to exercise of the Warrants exceeds the exercise price, unless there is an effective registration statement of the Company which covers the resale of the Lenders.
If the Company issues shares or any securities convertible into shares at an effective price per share lower than the exercise price of the Warrants, the exercise price of the Warrants shall be reduced to such lower price, subject to customary exceptions.
The
Lenders may not convert the Notes or exercise the Warrants if such conversion or exercise will result in each of the Lenders, together
with any affiliates, beneficially owning in excess of
On
January 17, 2022, we closed a private offering of ordinary shares and warrants to purchase ordinary shares. A total of
ordinary
shares (the “Shares”) were issued to a total of five (5) investors (the “Investors”) at a subscription price
of $
per share for total subscription proceeds of $
On
April 14, April 27, and September 1, 2022, three lenders exercised cashless for
On
June 16, 2023, one lender exercised cashless for
| F- 11 |
The fair values of these warrants as of June 30, 2023 were calculated using the Black-Scholes option-pricing model with the following assumptions:
| June 30, 2023 | ||||||||||||||||||||||||||||
| Volatility (%) | Expected dividends yield (%) | Weighted average expected life (year) | Risk-free interest rate (%) (per annum) | Common stock purchase warrants liability as of December 31, 2022(US$) |
Changes of fair value of common stock purchase warrants liability
(+ (loss)/(- (gain)(US$) |
Common stock purchase warrants liability as of June 30, 2023 (US$) | ||||||||||||||||||||||
| Convertible Note - Talos Victory (Note 9 (a)) |
|
% | $ |
|
% | $ |
|
|
% |
|
|
|
||||||||||||||||
| Convertible Note - Mast Hill (Note 9 (a)) |
|
% |
|
% |
|
|
% |
|
(
|
) | ||||||||||||||||||
| Convertible Note - First Fire (Note 9 (a)) |
|
% |
|
% |
|
|
% |
|
|
|
||||||||||||||||||
| Convertible Note - LGH Note 9 (a)) |
|
% |
|
% |
|
|
% |
|
|
|
||||||||||||||||||
| Convertible Note - Fourth Man (Note 9 (ab)) |
|
% |
|
% |
|
|
% |
|
|
|
||||||||||||||||||
| Convertible Note - Jefferson Street Note 9 (a))3,054 |
|
% |
|
% |
|
|
% |
|
|
|
||||||||||||||||||
| Convertible Note - Blue Lake Note 9 (a)) |
|
% |
|
% |
|
|
% |
|
|
|
||||||||||||||||||
| Total | Total |
|
(
|
) |
|
|||||||||||||||||||||||
(c) Registration Rights Agreements
Pursuant to the terms of the Registration Rights Agreement dated as of contract date of each convertible promissory note, 2021, executed between the Company and Lender, the Registration Rights Agreement dated as of each contract date, executed between the Company and Lenders, the Company agreed to file a registration statement with the Securities and Exchange Commission to register the shares of common stock underlying the Notes and the shares issuable upon exercise of the Warrants within sixty days from the date of each Registration Rights Agreement. The Company also granted the Lenders piggyback registration rights on such shares pursuant to the Purchase Agreements.
| F- 12 |
NOTE 10— SHAREHOLDERS’ EQUITY
Ordinary Shares
The Company’s authorized number of ordinary shares was shares with par value of $ .
On December 22,2020, the Company issued shares of common stock to The Crone Law Group, P.C. or its designees for legal services (see Note 11).
On January 1, 2021, the Company issued an aggregate of shares to a third party service provider for consulting services that had been rendered.
On
April 14, April 27, 2022 and September 1, 2022, the Company issued cashless warrant shares of
During
the year ended December 31, 2022, the Company issued
During the year ended December 31, 2022, the Company issued shares of common stock for the conversion of convertible promissory note payable (see note 9 (a)).
On
January 19, 2023, the Company sold an aggregate of
shares of the common stock to buyers of the private placement for an aggregate
purchase price of $
During
the six-month ended June 30, 2023, the Company issued
As of June 30, 2023, the Company had issued and outstanding shares.
The Company applied ASC 718 and related interpretations in accounting for measuring the cost of share-based compensation over the period during which the consultants are required to provide services in exchange for the issued shares. The fair value of above award was estimated at the grant date using Black-Scholes model for pricing the share compensation expenses.
On December 22, 2020, the Board of Directors of the Company authorized the issuance of an aggregate of shares and warrants to The Crone Law Group, P.C. or its designees for legal services that had been rendered. The five-year warrants are exercisable at one cent per share.
The shares of were vested on December 22, 2020 and warrants were exercised. The fair value of above award was estimated at the grant date using Black-Scholes model for pricing the share compensation expenses. The fair value of the Black-Scholes model includes the following assumptions: expected life of years, expected dividend rate of %, volatility of % and an average interest rate of %.
On January 1, 2021, the Board of Directors of the Company authorized the issuance of an aggregate of shares and warrants to a third party service provider for consulting services that had been rendered. The five-year warrants are exercisable at one cent per share.
The shares of common stock and warrants were vested on January 1, 2021 and during the year ended December 31, 2022, warrant shares were exercised cashless.
The fair value of above award was estimated at the grant date using Black-Scholes model for pricing the share compensation expenses. The fair value of the Black-Scholes model includes the following assumptions: expected life of years, expected dividend rate of %, volatility of % and an average interest rate of %.
As
of June 30, 2023, the Company had
| F- 13 |
NOTE 12- RISKS AND UNCERTAINTIES
Credit Risk – The carrying amount of accounts receivable included in the balance sheet represents the Company’s exposure to credit risk in relation to its financial assets. No other financial asset carries a significant exposure to credit risk. The Company performs ongoing credit evaluations of each customer’s financial condition. The Company maintains allowances for doubtful accounts and such allowances in the aggregate have not exceeded management’s estimates.
The
Company has its cash in bank deposits primarily at state owned banks located in the PRC. Historically, deposits in PRC banks have been
secured due to the state policy of protecting depositors’ interests. The PRC promulgated a Bankruptcy Law in August 2006, effective
June 1, 2007, which contains provisions for the implementation of measures for the bankruptcy of PRC banks. The bank deposits with financial
institutions in the PRC are insured by the government authority for up to RMB
Interest Rate Risk – The Company is exposed to the risk arising from changing interest rates, which may affect the ability of repayment of existing debts and viability of securing future debt instruments within the PRC.
Currency Risk - A majority of the Company’s revenue and expense transactions are denominated in RMB and a significant portion of the Company’s assets and liabilities are denominated in RMB. RMB is not freely convertible into foreign currencies. In the PRC, certain foreign exchange transactions are required by law to be transacted only by authorized financial institutions at exchange rates set by the People’s Bank of China (“PBOC”). Remittances in currencies other than RMB by the Company in China must be processed through the PBOC or other China foreign exchange regulatory bodies which require certain supporting documentation in order to affect the remittance.
Concentrations - The Company sells its products primarily through direct customers in the PRC and to some extent, the overseas customers in European countries and East Asia such as South Korea and Taiwan.
For
the three-month periods ended June 30, 2023 and 2022, six customers accounted for
For
the six-month periods ended June 30, 2023 and 2022, six customers accounted for
And
the Company’s top ten customers aggregately accounted for
As
of June 30, 2023, three customers accounted for
The
Company purchases its raw materials through various suppliers. Raw material purchases from these suppliers which individually exceeded
10% of the Company’s total raw material purchases, accounted for approximately
| F- 14 |
NOTE 13 — COMMITMENTS AND CONTINGENCIES
Legal Proceedings
From time to time, the Company and its affiliates are parties to various legal actions arising in the ordinary course of business. Although Sichuan Wetouch and Hong Kong Wetouch, the previous subsidiaries of the Company, and our former Chairman and director Mr. Guangde Cai were named as defendants in several litigation matters, as of the date of this report, all such matters have been settled and Sichuan Wetouch, Hong Kong Wetouch and Mr. Guangde Cai were unconditionally and fully discharged and released therefrom (See Item 13- Legal Proceedings). Accordingly, there are no pending material legal proceedings against the Company.
Please also refer to NOTE 13 - commitments and contingencies of the Annual Report filed on April 17, 2023.
Capital expenditure commitment
On
December 20, 2021, the Company entered into a contract with Shenzhen Municipal Haoyutuo Decoration & Cleaning Engineering Company
Limited to purchase a facility decoration contract of RMB
NOTE 14 — REVENUES
The Company’s geographical revenue information is set forth below:
|
Three-Month Period
June 30, |
Six-Month Period
June 30, |
|||||||||||||||
| 2023 | 2022 | 2023 | 2022 | |||||||||||||
| US$ | US$ | US$ | US$ | |||||||||||||
| Sales in PRC | $ |
|
$ |
|
$ |
|
$ |
|
||||||||
| Sales in Overseas | ||||||||||||||||
| —Republic of China (ROC, or Taiwan) |
|
|
|
|
||||||||||||
| -South Korea |
|
|
|
|
||||||||||||
| -Others |
|
(
|
) |
|
|
|||||||||||
| Sub-total |
|
|
|
|
||||||||||||
| Total Revenue | $ |
|
$ |
|
$ |
|
$ |
|
||||||||
NOTE 15 — SUBSEQUENT EVENT
On
February 17, 2023, the Board of Directors of the Company authorized a reverse stock split with a ratio of not less than
| F- 15 |
ITEM 2. MANAGEMENT’S DISCUSSION AND ANALYSIS OF FINANCIAL CONDITION AND RESULTS OF OPERATIONS.
Forward-Looking Statements
The following management’s discussion and analysis should be read in conjunction with our historical financial statements and the related notes thereto. The management’s discussion and analysis contain forward-looking statements, such as statements of our plans, objectives, expectations and intentions. Any statements that are not statements of historical fact are forward-looking statements. When used, the words “believe,” “plan,” “intend,” “anticipate,” “target,” “estimate,” “expect” and the like, and/or future tense or conditional constructions (“will,” “may,” “could,” “should,” etc.), or similar expressions, identify certain of these forward-looking statements. These forward-looking statements are subject to risks and uncertainties, including those under “Risk Factors” in our Annual Report filed with the SEC on April 17, 2023, as updated in subsequent filings we have made with the SEC that could cause actual results or events to differ materially from those expressed or implied by the forward-looking statements. Our actual results and the timing of events could differ materially from those anticipated in these forward-looking statements as a result of several factors. We do not undertake any obligation to update forward-looking statements to reflect events or circumstances occurring after the date of this Quarterly Report.
Basis of Presentation
The following discussion highlights our results of operations and the principal factors that have affected our financial condition as well as our liquidity and capital resources for the periods described, and provides information that management believes is relevant for an assessment and understanding of the statements of financial condition and results of operations presented herein. The following discussion and analysis are based on our unaudited financial statements contained in this Quarterly Report, which we have prepared in accordance with United States generally accepted accounting principles. You should read the discussion and analysis together with such financial statements and the related notes thereto.
Overview
We were originally incorporated under the laws of the state of Nevada in August 1992. On October 9, 2020, we entered into a share exchange agreement (the “Share Exchange Agreement”) with Wetouch Holding Group Limited, a British Virgin Islands (“BVI”) company incorporated on August 14, 2020 under the laws of the British Virgin Islands (“BVI Wetouch”), and all the shareholders of BVI Wetouch (each a “Shareholder” and collectively the “Shareholders”), to acquire all the issued and outstanding capital stock of BVI Wetouch in exchange for the issuance to the Shareholders an aggregate of 28 million shares of our common stock (the “Reverse Merger”). The Reverse Merger closed on October 9, 2020. Immediately after the closing of the Reverse Merger, we had a total of 31,396,394 issued and outstanding shares of common stock. As a result of the Reverse Merger, BVI Wetouch is now our wholly-owned subsidiary.
Through our wholly-owned subsidiaries, BVI Wetouch, HK Wetouch, and Sichuan Vtouch, we are engaged in the research, development, manufacturing, sales and servicing of medium to large sized projected capacitive touchscreens, which constitutes our source of revenues. We are specialized in large-format touchscreens, which are developed and designed for a wide variety of markets and used in by the financial terminals, automotive, POS, gaming, lottery, medical, HMI, and other specialized industries. Our product portfolio comprises medium to large sized projected capacitive touchscreens ranging from 7.0 inch to 42 inch screens. In terms of the structures of touch panels, we offer (i) Glass-Glass (“GG”), primarily used in GPS/car entertainment panels in mid-size and luxury cars, industrial HMI, financial and banking terminals, POS and lottery machines; (ii) Glass-Film-Film (“GFF”), mostly used in high-end GPS and entertainment panels, industrial HMI, financial and banking terminals, lottery and gaming industry; (iii) Plastic-Glass (“PG”), typically adopted by touchscreens in GPS/entertainment panels motor vehicle GPS, smart home, robots and charging stations; and (iv) Glass-Film (“GF”), mostly used in industrial HMI. The following discussion and analysis pertain financial condition and results of operations of our subsidiary for the six-month period ended June 30, 2023 and 2022, respectively.
| 5 |
Effects of COVID-19
The COVID-19 pandemic and resulting global disruptions have affected our businesses, as well as those of our customers and suppliers. To serve our customers while also providing for the safety of our employees and service providers, we have modified numerous aspects of our logistics, transportation, supply chain, purchasing, and after-sale processes. Beginning in Q1 2020, we made numerous process updates across our operations worldwide, and adapted our fulfillment network, to implement employee and customer safety measures, such as enhanced cleaning and physical distancing, personal protective gear, disinfectant spraying, and temperature checks. We will continue to prioritize employee and customer safety and comply with evolving state and local standards as well as to implement standards or processes that we determine to be in the best interests of our employees, customers, and communities.
Due to the COVID-19 pandemic, our subsidiary Sichuan Wetouch was temporarily shut down from early February 2020 to early March 2020 in accordance with the requirement of the local governments. Our business was negatively impacted and generated lower revenue and net income in 2020.
Commencing in the spring of 2021, China began to experience an increase in COVID-19 cases, and to some extent, local governments and the national government began to take more restrictive measures to stem the spread of the virus, particularly from October 2021 to December 2021 and various periods in 2022. Since December 2022, many of the restrictive policies previously adopted by the PRC government to control the spread of COVID-19 have been revoked or replaced with more flexible measures. Although there were occasional increases in COVID-19 cases in China after the government abandoned its restrictive policies, as of the date of this Quarterly Report, our PRC subsidiary has resumed normal operations. There are still uncertainties of future impact of the COVID-19 pandemic, and the extent of the impact will depend on a number of factors, including the duration and severity of the pandemic; and the macroeconomic impact of government measures to contain the spread of COVID-19 and related government stimulus measures.
Highlights for the three-month period ended June 30, 2023 include:
| ● Revenues were $12.8 million, an increase of 8.4% from $11.8 million in the second quarter of 2022 | |
| ● Gross profit was $6.3 million, an increase of 23.5% from $5.1 million in the second quarter of 2022 | |
| ● Gross profit margin was 49.0%, compared to 43.0% in the second quarter of 2022 | |
| ● Net income was $4.7 million, compared to $2.9 million in the second quarter of 2022 | |
| ● Total volume shipped was 590,140 units, an increase of 4.1% from 556,875 units in the second quarter of 2022 |
Results of Operations
The following table sets forth, for the periods indicated, statements of income data:
|
(in US Dollar millions,
except percentage) |
Three-Month
Period Ended June 30, |
Change |
Six-Month
Period Ended June 30, |
Change | ||||||||||||||||||||
| 2023 | 2022 | % | 2023 | 2022 | % | |||||||||||||||||||
| Revenues | $ | 12.8 | $ | 11.8 | 8.5 | % | $ | 26.2 | $ | 23.7 | 10.5 | % | ||||||||||||
| Cost of revenues | (6.5 | ) | (6.7 | ) | (3.0 | )% | (13.9 | ) | (14.4 | ) | (3.5 | )% | ||||||||||||
| Gross profit | 6.3 | 5.1 | 23.5 | % | 12.3 | 9.4 | 30.9 | % | ||||||||||||||||
| Total operating expenses | (0.2 | ) | (1.0 | ) | (80.0 | )% | (1.9 | ) | (1.9 | ) | (0.0 | )% | ||||||||||||
| Operating income | 6.1 | 4.1 | 48.8 | % | 10.4 | 7.5 | 38.7 | % | ||||||||||||||||
| Gain on changes of fair values of Common Stock Purchase Warrant | 0.1 | 0.0 | N/A | 0.0 | 0.2 | (100.0 | )% | |||||||||||||||||
| Income before income taxes | 6.2 | 4.1 | 51.2 | % | 10.4 | 7.7 | 35.1 | % | ||||||||||||||||
| Income tax expense | (1.5 | ) | (1.2 | ) | 25.0 | % | (2.9 | ) | (2.2 | ) | 31.8 | % | ||||||||||||
| Net income | $ | 4.7 | $ | 2.9 | 62.1 | % | $ | 7.5 | $ | 5.5 | 36.4 | % | ||||||||||||
| 6 |
Results of Operations - Three Months Ended June 30, 2023 Compared to Three Months Ended June 30, 2022
Revenues
We generated revenue of $12.8 million for the three months ended June 30, 2023, an increase of $1.1 million, or 8.5%, compared to $11.8 million in the same period of last year, primarily due to increase of 4.1% in sales volume, an increase of 10.4% in the average selling price of our products, and partially offset by 6.1% negative impact from exchange rate due to depreciation of RMB against US dollars, compared with those of the same period of last year.
| For the Three-Month Period Ended June 30, | ||||||||||||||||||||||||
| 2023 | 2022 | Change | Change | |||||||||||||||||||||
| Amount | % | Amount | % | Amount | % | |||||||||||||||||||
| (in US Dollar millions except percentage) | ||||||||||||||||||||||||
| Revenue from sales to customers in PRC | $ | 9.1 | 71.1 | % | $ | 8.1 | 68.6 | % | $ | 1.0 | 12.3 | % | ||||||||||||
| Revenue from sales to customers overseas | 3.7 | 28.9 | % | 3.7 | 31.4 | % | 0.0 | 0.0 | % | |||||||||||||||
| Total Revenues | $ | 12.8 | 100 | % | $ | 11.8 | 100 | % | $ | 1.0 | 8.5 | % | ||||||||||||
| For the Three-Month Period Ended June 30, | ||||||||||||||||||||||||
| 2023 | 2022 | Change | Change | |||||||||||||||||||||
| Unit | % | Unit | % | Unit | % | |||||||||||||||||||
| (in UNIT, except percentage) | ||||||||||||||||||||||||
| Units sold to customers in PRC | 418,190 | 70.9 | % | 382,711 | 67.5 | % | 35,479 | 9.3 | % | |||||||||||||||
| Units sold to customers overseas | 171,950 | 29.1 | % | 184,164 | 32.5 | % | (12,214 | ) | (6.6 | )% | ||||||||||||||
| Total Units Sold | 590,140 | 100 | % | 566,875 | 100 | % | 23,265 | 4.1 | % | |||||||||||||||
(i) Domestic market
For the three months ended June 30, 2023, revenue from the domestic market increased by $1.0 million or 12.3% as a combined result of: (i) an increase of 9.3% in sales volume and (ii) an increase of 8.8% in the average RMB selling price of our products, and partially offset by 6.1% negative impact from exchange rate due to depreciation of RMB against US dollars, compared with those of the same period of last year.
As for the RMB selling price, the increase of 8.8% was mainly due to the increased sales of new models of higher-end products such as POS touchscreens and industrial control computer touchscreens with higher selling prices in the domestic market during the three-month period ended June 30, 2023.
The weakening in macroeconomic conditions since the outbreak of COVID-19 pandemic in January 2020 continued to exacerbate the touch screen business environment. Due to our proactive efforts to market new models such as POS touchscreens, medical touchscreens, and industrial control computer touchscreens, and efforts to obtain new customers and penetrate into new regions, we had sales increases of 35.5% in Southwest China, 19.4% in South China, and 13.5% in Eastern China during the second quarter ended June 30, 2023 as compared to that of last year.
(ii) Overseas market
For the three-month period ended June 30, 2023 and 2022, revenues from overseas market remained stable at $3.7 million. We had an increase of 9.9% in average selling price, although the sales volume were flat.
| 7 |
The following table summarizes the breakdown of revenues by categories in US dollars :
|
Revenues For the Three-Month Period Ended June 30, |
||||||||||||||||||||||||
| 2023 | 2022 | Change | Change | |||||||||||||||||||||
| Amount | % | Amount | % | Amount | Margin% | |||||||||||||||||||
| (in US Dollars, except percentage) | ||||||||||||||||||||||||
| Product categories by end applications | ||||||||||||||||||||||||
| Automotive Touchscreens | $ | 3,210,054 | 25.1 | % | $ | 2,904,951 | 24.7 | % | $ | 305,103 | 10.5 | % | ||||||||||||
| Industrial Control Computer Touchscreens | 2,422,606 | 19.0 | % | 2,344,118 | 20.0 | % | 78,488 | 3.3 | % | |||||||||||||||
| POS Touchscreens | 2,278,814 | 17.8 | % | 2,017,900 | 17.2 | % | 260,914 | 12.9 | % | |||||||||||||||
| Medical Touchscreens | 1,888,053 | 14.8 | % | 1,576,755 | 14.4 | % | 311,298 | 19.7 | % | |||||||||||||||
| Gaming Touchscreens | 1,733,135 | 13.6 | % | 1,803,630 | 15.3 | % | (70,495 | ) | (3.9 | )% | ||||||||||||||
| Multi-Functional Printer Touchscreens | 1,241,770 | 9.7 | % | 1,105,671 | 9.4 | % | 136,099 | 12.3 | % | |||||||||||||||
| Others* | - | 0.0 | % | (91 | ) | 0.0 | % | 91 | 0.0 | % | ||||||||||||||
| Total Revenues | $ | 12,774,432 | 100.0 | % | $ | 11,752,934 | 100.0 | % | $ | 1,021,498 | 8.5 | % | ||||||||||||
*Others include applications in self-service kiosks, ticket vending machine and financial terminals.
The Company continued to shift production mix from traditional lower-end products such as touchscreens used in industrial control computer industries to high-end products such as touchscreens used in POS touchscreens, medical touchscreens, multi-functional printer touchscreens, and automotive touchscreen, primarily due to (i) greater growth potential of computer screen models in China, and (ii) the stronger demand and better quality demand from consumers’ recognition of higher-end touch screens made with better raw materials.
Gross Profit and Gross Profit Margin
| Three-Month Period Ended June 30, | Change | |||||||||||||||
| (in millions, except percentage) | 2023 | 2022 | Amount | % | ||||||||||||
| Gross Profit | $ | 6.3 | $ | 5.1 | $ | 1.2 | 23.5 | % | ||||||||
| Gross Profit Margin | 49.0 | % | 43.0 | % | 6.0 | % | ||||||||||
Gross profit was $6.3 million in the second quarter ended June 30, 2023, compared to $5.1 million in the same period of 2022. Our gross profit margin increased to 49.0% for the second quarter ended June 30, 2023, as compared to 43.0% for the same period of 2022, primarily due to the increase in revenues of 8.5%, particularly high-end products such as POS touchscreens, medical touchscreens, and multi-functional printer touchscreens for the quarter ended June 30, 2023, partially offset by the increase in cost of goods sold by 1.7% including increase of cost of materials such as chip cost by 1.5%, for the three-month period ended June 30, 2023.
General and Administrative Expenses
|
Three-Month Period Ended June 30, |
Change | |||||||||||||||
| (in US dollars, except percentage) | 2023 | 2022 | Amount | % | ||||||||||||
| General and Administrative Expenses | $ | 56,907 | $ | 443,146 | $ | (386,239 | ) | (87.2 | )% | |||||||
| as a percentage of revenues | 0.4 | % | 3.8 | % | (3.4 | )% | ||||||||||
General and administrative (G&A) expenses were $56,907 for the three-month period ended June 30, 2023, compared to $443,146 in the same period in 2022. The decrease was primarily due to the decrease of salary and wages expenses and miscellaneous expenses.
| 8 |
Research and Development Expenses
|
Three-Month Period Ended June 30, |
Change | |||||||||||||||
| (in US dollars, except percentage) | 2023 | 2022 | Amount | % | ||||||||||||
| Research and Development Expenses | $ | 20,384 | $ | 21,713 | $ | (1,329 | ) | (6.1 | )% | |||||||
| as a percentage of revenues | 0.2 | % | 0.2 | % | 0.0 | % | ||||||||||
Research and development (R&D) expenses were $20,384 for the three-month period ended June 30, 2023 compared to $21,713 in the same period in 2022, representing a decrease of $1,329 of material consumption.
Operating Income
Total operating income was $6.1 million for the three-month period ended June 30, 2023 as compared to $4.0 million of the same period of last year, primarily due to higher gross margin and lower selling expenses, and administrative expenses for the three-month period ended June 30, 2023.
Gain on changes in fair value of Common Stock Purchase Warrants
| Three-Month Period Ended June 30, | Change | |||||||||||||||
| (in millions, except percentage) | 2023 | 2022 | Amount | % | ||||||||||||
| Gain on changes in fair value of Common Stock Purchase Warrants | $ | 0.1 | $ | 0.0 | $ | 0.1 | N/A | |||||||||
| as a percentage of revenues | 0.8 | % | 0.0 | % | 0.8 | % | ||||||||||
Gain on changes in fair value of common stock purchase warrants was $0.1 million and $0.0 million for the three-month periods ended June 30, 2023 and 2022, respectively (See Note 9 (b)).
Income Taxes
|
Three-Month Period Ended June 30, |
Change | |||||||||||||||
| (in millions, except percentage) | 2023 | 2022 | Amount | % | ||||||||||||
| Income before Income Taxes | $ | 6.2 | $ | 4.1 | $ | 2.1 | 51.2 | % | ||||||||
| Income Tax (Expense) | (1.5 | ) | (1.2 | ) | (0.3 | ) | 25.0 | % | ||||||||
| Effective income tax rate | 25.0 | % | 28.3 | % | (3.3 | )% | ||||||||||
The effective income tax rates for the three-month periods ended June 30, 2023 and 2022 were 25.0% and 28.3%, respectively.
Net Income
As a result of the above factors, we had a net income of $4.7 million in the second quarter of 2023 compared to a net income of $2.9 million in the same quarter of 2022.
| 9 |
Results of Operations - Six Months Ended June 30, 2023 Compared to Six Months Ended June 30, 2022
Revenues
We generated revenue of $26.2 million for the six months ended June 30, 2023, an increase of $2.5 million, or 10.5%, compared to $23.7 million in the same period of last year. This was mainly due to an increase of 28.1% in the average RMB selling price of our products, partially offset by the decrease of 7.9% in sales volume and 6.9% negative impact from exchange rate due to depreciation of RMB against US dollars, compared with those of the same period of last year.
| For the Six-Month Period Ended June 30, | ||||||||||||||||||||||||
| 2023 | 2022 | Change | Change | |||||||||||||||||||||
| Amount | % | Amount | % | Amount | % | |||||||||||||||||||
| (in US Dollar millions except percentage) | ||||||||||||||||||||||||
| Revenue from sales to customers in PRC | $ | 18.4 | 70.3 | % | $ | 16.2 | 68.5 | % | $ | 2.2 | 13.6 | % | ||||||||||||
| Revenue from sales to customers overseas | 7.8 | 29.7 | % | 7.5 | 31.5 | % | 0.3 | 4.0 | % | |||||||||||||||
| Total Revenues | $ | 26.2 | 100 | % | $ | 23.7 | 100 | % | $ | 2.5 | 10.5 | % | ||||||||||||
| For the Six-Month Period Ended June 30, | ||||||||||||||||||||||||
| 2023 | 2022 | Change | Change | |||||||||||||||||||||
| Unit | % | Unit | % | Unit | % | |||||||||||||||||||
| (in UNIT, except percentage) | ||||||||||||||||||||||||
| Units sold to customers in PRC | 842,308 | 68.7 | % | 739,398 | 55.6 | % | 102,910 | 13.9 | % | |||||||||||||||
| Units sold to customers overseas | 383,108 | 31.3 | % | 590,706 | 44.4 | % | (207,598 | ) | (35.1 | )% | ||||||||||||||
| Total Units Sold | 1,225,416 | 100 | % | 1,330,104 | 100 | % | (104,688 | ) | (7.9 | )% | ||||||||||||||
(i) Domestic market
For the six months ended June 30, 2023, revenue from domestic market increased by $2.2 million or 13.6% as a combined result of: (i) an increase of 13.9% in sales volume and (ii) an increase of 6.2% in the average RMB selling price of our products, and partially offset by 6.9% negative impact from exchange rate due to depreciation of RMB against US dollars, compared with those of the same period of last year.
As for the RMB selling price, the increase of 6.2% was mainly due to the increased sales of new models of higher-end products such as POS touchscreens, industrial control computer touchscreens and gaming touch screens with higher selling prices in the domestic market during the three-month period ended June 30, 2023.
The weakening in macroeconomic conditions since the outbreak of COVID-19 pandemic in January 2020 continued to exacerbate the touch screen business environment. Due to our proactive efforts to market new models such as POS touchscreens, medical touchscreens, and industrial control computer touchscreens, and efforts to obtain new customers and penetrate into new regions, we had sales increases of 35.5% in Southwest China, 19.4% in South China, and 13.6% in East China during the six-month period ended June 30, 2023.
(ii) Overseas market
For the six-month period ended June 30, 2023, revenues from overseas market were $7.8 million as compared to $7.5 million of the same period of 2022, representing an increase by $0.3 million or 4.0% mainly due to increase of 5.6% in average selling price, and partially offset by the decrease of 35.1% in sales volume due to decreased sales in gaming touchscreens and automotive touchscreens as a result of demand decreasing from overseas market.
| 10 |
The following table summarizes the breakdown of revenues by categories in US dollars :
|
Revenues For the Six-Month Period Ended June 30, |
||||||||||||||||||||||||
| 2023 | 2022 | Change | Change | |||||||||||||||||||||
| Amount | % | Amount | % | Amount | Margin% | |||||||||||||||||||
| (in US Dollars, except percentage) | ||||||||||||||||||||||||
| Product categories by end applications | ||||||||||||||||||||||||
| Automotive Touchscreens | $ | 6,444,890 | 24.6 | % | $ | 5,917,676 | 24.9 | % | $ | 527,214 | 8.9 | % | ||||||||||||
| Industrial Control Computer Touchscreens | 5,094,856 | 19.4 | % | 4,642,261 | 19.6 | % | 452,595 | 5.7 | % | |||||||||||||||
| POS Touchscreens | 4,345,588 | 16.6 | % | 3,566,699 | 15.0 | % | 778,889 | 21.8 | % | |||||||||||||||
| Medical Touchscreens | 3,982,295 | 15.2 | % | 3,048,846 | 12.8 | % | 933,449 | 30.6 | % | |||||||||||||||
| Gaming Touchscreens | 3,644,432 | 13.9 | % | 3,974,250 | 16.8 | % | (329,818 | ) | (8.3 | )% | ||||||||||||||
| Multi-Functional Printer Touchscreens | 2,695,832 | 10.3 | % | 2,593,846 | 10.9 | % | 101,986 | 3.9 | % | |||||||||||||||
| Others* | - | 0.0 | % | 3,903 | 0.0 | % | (3,903 | ) | (0.0 | )% | ||||||||||||||
| Total Revenues | $ | 26,207,893 | 100.0 | % | $ | 23,747,481 | 100.0 | % | $ | 2,460,412 | 10.5 | % | ||||||||||||
*Others include applications in self-service kiosks, ticket vending machine and financial terminals.
The Company continued to shift production mix from traditional lower-end products such as touchscreens used in industrial control computer industries to high-end products such as POS touchscreens, medical touchscreens, and automotive touchscreens, primarily due to (i) greater growth potential of computer screen models in China, (ii) the stronger demand and better quality demand from consumers’ recognition of higher-end touch screens made by better raw materials.
Gross Profit and Gross Profit Margin
|
Six-Month Period Ended June 30, |
Change | |||||||||||||||
| (in millions, except percentage) | 2023 | 2022 | Amount | % | ||||||||||||
| Gross Profit | $ | 12.3 | $ | 9.4 | $ | 2.9 | 30.9 | % | ||||||||
| Gross Profit Margin | 46.9 | % | 39.4 | % | 7.5 | % | ||||||||||
Gross profit was $12.3 million during the six-month period ended June 30, 2023, compared to $9.4 million in the same period of 2022. Our gross profit margin increased to 46.9% for the six-month period ended June 30, 2023, as compared to 39.4% for the same period of 2022, primarily due to the increase in sales of 10.5%, particularly high-end products such as POS touchscreens, medical touchscreens, and automotive touchscreens, for the six-month period ended June 30, 2023, partially offset by the increase in cost of goods sold by 2.8% including increase of cost of materials such as chip cost by 2.7%, for the six-month period ended June 30, 2023.
General and Administrative Expenses
|
Six-Month Period Ended June 30, |
Change | |||||||||||||||
| (in millions, except percentage) | 2023 | 2022 | Amount | % | ||||||||||||
| General and Administrative Expenses | $ | 1.7 | $ | 0.8 | $ | 0.9 | 112.5 | % | ||||||||
| as a percentage of revenues | 6.5 | % | 3.4 | % | 3.1 | % | ||||||||||
General and administrative (G&A) expenses were $1.7 million for the six-month period ended June 30, 2023, compared to $0.8 million in the same period in 2022, representing an increase of $0.9 million or 112.5%. The increase was primarily due to the increase of accrued $1.2 million underwriting fees in connection with a private placement, partially offset by the decrease of $0.2 million in salary and wages and other miscellaneous expenses. On March 18, 2023, the Company entered into a consent agreement with representatives related to the private placement on the fees of US$1.2 million, payable only on the completion of an underwritten offering (see Note 8).
| 11 |
Research and Development Expenses
|
Six-Month Period Ended June 30, |
Change | |||||||||||||||
| (in US dollars, except percentage) | 2023 | 2022 | Amount | % | ||||||||||||
| Research and Development Expenses | $ | 41,269 | $ | 44,570 | $ | (3,301 | ) | (7.4 | )% | |||||||
| as a percentage of revenues | 0.0 | % | 0.0 | % | 0.0 | % | ||||||||||
Research and development (R&D) expenses were $41,269 for the six-month period ended June 30, 2023 compared to $44,570 in the same period in 2022.
Operating Income
Total operating income was $10.4 million for the six-month period ended June 30, 2023 as compared to $7.5 million of the same period of last year due to higher gross profit and lower selling expenses, partially offset by higher general & administration expenses.
Gain (loss) on changes in fair value of Common Stock Purchase Warrants
|
Six-Month Period Ended
June 30, |
Change | |||||||||||||||
| (in US$ millions, except percentage) | 2023 | 2022 | Amount | % | ||||||||||||
| Gain on changes in fair value of Common Stock Purchase Warrants | $ | 0.0 | $ | 0.2 | $ | (0.2 | ) | (100.0 | )% | |||||||
| as a percentage of revenues | 0.0 | % | 0.8 | % | (0.8 | )% | ||||||||||
Gain on changes in fair value of common stock purchase warrants was $44,784 for the six-month period ended June 30, 2023, as compared to gain of $0.2 million on changes in fair value of common stock purchase warrants in the same period of 2022 (See Note 9 (b)).
Income Taxes
|
Six-Month Period Ended June 30, |
Change | |||||||||||||||
| (in millions, except percentage) | 2023 | 2022 | Amount | % | ||||||||||||
| Income before Income Taxes | $ | 10.4 | $ | 7.7 | $ | 2.7 | 35.1 | % | ||||||||
| Income Tax (Expense) | (2.9 | ) | (2.2 | ) | (0.7 | ) | 31.8 | % | ||||||||
| Effective income tax rate | 28.4 | % | 28.2 | % | 0.2 | % | ||||||||||
The effective income tax rates for the six-month periods ended June 30, 2023 and 2022 were 28.4% and 28.2%, respectively.
Our PRC subsidiary Sichuan Vtouch had $92.2 million of cash and cash equivalents of June 30, 2023, which are planned to be indefinitely reinvested in PRC. The distributions from our PRC subsidiary are subject to the U.S. federal income tax at 21%, less any applicable foreign tax credits. Due to our policy of indefinitely reinvesting our earnings in our PRC business, we have not provided for deferred income tax liabilities related to PRC withholding income tax on undistributed earnings of our PRC subsidiaries.
| 12 |
Net Income
As a result of the above factors, we had a net income of $7.5 million in the six-month period ended June 30, 2023 compared to a net income of $5.5 million in the same period of 2022.
Liquidity and Capital Resources
Historically, our primary uses of cash have been to finance working capital needs. We expect that we will be able to meet our needs to fund operations, capital expenditures and other commitments in the next 12 months primarily with our cash and cash equivalents, operating cash flows and bank borrowings.
We may, however, require additional cash resources due to changes in business conditions or other future developments. If these sources are insufficient to satisfy our cash requirements, we may seek to sell additional equity or debt securities or obtain a credit facility. The sale of additional equity or equity-linked securities could result in additional dilution to stockholders. The incurrence of indebtedness would result in increased debt service obligations and could result in operating and financial covenants that would restrict operations. Financing may not be available in amounts or on terms acceptable to us, or at all.
As of June 30, 2023, we had current assets of $107.4 million, consisting of $92.2 million in cash including $40.0 million from the stock issuance of a private placement, $14.0 million in accounts receivable, $0.2 million in inventories, and $1.1 million in prepaid expenses and other current assets. Our current liabilities as of June 30, 2023, were $8.1 million, which is comprised of $2.4 million in accounts payable, $1.5 million in income tax payable, $2.5 million in accrued expenses and other current liabilities, $0.5 million from a third-party loan, and $1.2 million in convertible promissory notes payable.
The following is a summary of our cash flows provided by (used in) operating, investing, and financing activities for the six-month period ended June 30, 2023 and 2022:
|
Six-Month Period Ended June 30, |
||||||||
| (in US Dollar millions) | 2023 | 2022 | ||||||
| Net cash provided by operating activities | $ | 6.8 | $ | 1.5 | ||||
| Net cash provided by investing activities | - | - | ||||||
| Net cash provided by financing activities | 40.0 | - | ||||||
| Effect of foreign currency exchange rate changes on cash and cash equivalents | (5.8 | ) | (2.5 | ) | ||||
| Net increase (decrease) in cash and cash equivalents | 41.0 | (1.0 | ) | |||||
| Cash and cash equivalents at the beginning of period | 51.2 | 46.1 | ||||||
| Cash and cash equivalents at the end of period | $ | 92.2 | $ | 45.1 | ||||
Operating Activities
Net cash provided by operating activities was $6.8 million for the six-month period ended June 30, 2023, as compared to $1.5 million used in operating activities for the same period of the last year, primarily due to (i) the increase of $1.9 million net income for the six-month period ended June 30, 2023 as compared to the same period of 2022, (ii) the increase of $0.3 million loss on changes of FV of common stock purchase warrants for the six-month period ended June 30, 2023; (iii) the decrease of $2.1 million of accounts receivable for the six-month period ended June 30, 2023 due to faster collection of receivables, (iv) the decrease of $0.5 million in inventories, (v) the decrease of $0.3 million in accounts payable, (vi) the increase of $0.4 million in income tax payable, and (vii) the decrease of $1.0 million of accrued expenses and other current liabilities for the six-month period ended June 30, 2023, partially offset by the decrease in $0.8 million in account payable for the six-month period ended June 30, 2023.
| 13 |
Investing Activities
There was nil investing activities for the six-month periods ended June 30, 2023 and 2022.
Financing Activities
Net cash provided by financing activities for the six-month period ended June 30, 2023 was $40.0 million, due to the $40.0 million proceeds from stock issuance in a private placement.
There were nil financing activities for the six-month period ended June 30, 2022.
As of June 30, 2023, our cash and cash equivalents were $92.2 million, as compared to $51.3 million at December 31, 2022.
Days Sales Outstanding (“DSO”) has decreased to 79 days for the six-month period ended June 30, 2023 from 81 days for the year ended December 31, 2022.
The following table provides an analysis of the aging of accounts receivable as of June 30, 2023 and December 31, 2022:
| June 30, 2023 | December 31 2022 | |||||||
| -Current | $ | 8,031,102 | $ | 1,252,152 | ||||
| -1-3 months past due | 4,600,385 | 4,998,596 | ||||||
| -4-6 months past due | 1,331,966 | 2,806,973 | ||||||
| 7-12 months past due | - | 20 | ||||||
| -greater than 1 year past due | - | - | ||||||
| Total accounts receivable | $ | 13,963,453 | $ | 9,057,741 | ||||
The majority of the Company’s revenues and expenses were denominated primarily in Renminbi (“RMB”), the currency of the People’s Republic of China. There is no assurance that exchange rates between the RMB and the U.S. Dollar will remain stable. Inflation has not had a material impact on the Company’s business.
Based on past performance and current expectations, we believe our cash and cash equivalents provided by operating activities and financing activities will satisfy our working capital needs, capital expenditures and other liquidity requirements associated with our operations for at least the next 12 months.
Off Balance Sheet Arrangements
We have no off balance sheet arrangements.
ITEM 3. Quantitative and Qualitative Disclosures About Market Risk.
Not applicable because we are a smaller reporting company.
ITEM 4. Controls and Procedures.
Disclosure Controls and Procedures
We maintain disclosure controls and procedures (as that term is defined in Rules 13a-15(e) and 15d-15(e) under the Securities Exchange Act of 1934, as amended (the “Exchange Act”)) that are designed to ensure that information required to be disclosed in our reports under the Exchange Act is recorded, processed, summarized and reported within the time periods specified in the SEC’s rules and forms, and that such information is accumulated and communicated to our management, including our principal executive officer and principal financial officer, as appropriate, to allow timely decisions regarding required disclosures. In designing disclosure controls and procedures, our management necessarily was required to apply its judgment in evaluating the cost-benefit relationship of possible disclosure controls and procedures. The design of any disclosure controls and procedures also is based in part upon certain assumptions about the likelihood of future events, and there can be no assurance that any design will succeed in achieving its stated goals under all potential future conditions. Any controls and procedures, no matter how well designed and operated, can provide only reasonable, not absolute, assurance of achieving the desired control objectives.
Our management, with the participation of our principal executive officer and principal financial officer, has evaluated the effectiveness of the design and operation of our disclosure controls and procedures as of the end of the period covered by this report. Based upon that evaluation and subject to the foregoing, our principal executive officer and principal financial officer concluded that our disclosure controls and procedures were not effective as of June 30, 2023 due to the material weaknesses in internal control over financial reporting described below. Because of our limited operations, we have a limited number of employees which prohibits a segregation of duties. In addition, we lack a formal audit committee with a financial expert. As we grow and expand our operations we will engage additional employees and experts as needed. However, there can be no assurance that our operations will expand.
Changes in Internal Control Over Financial Reporting
There were no changes in our internal control over financial reporting that occurred during the period covered by this report that have materially affected, or are reasonably likely to materially affect, our internal control over financial reporting.
| 14 |
PART II – OTHER INFORMATION
ITEM 1. LEGAL PROCEEDINGS.
From time to time, the Company is a party to various legal actions arising in the ordinary course of business. The Company accrues costs associated with these matters when they become probable and the amount can be reasonably estimated. Legal costs incurred in connection with loss contingencies are expensed as incurred.
As of June 30, 2023, we know of no material, active, pending or threatened proceeding against us or our subsidiaries, nor are we, or any subsidiary, involved as a plaintiff or defendant in any material proceeding or pending litigation.
ITEM 1A. RISK FACTORS.
Not required for smaller reporting companies.
ITEM 2. UNREGISTERED SALES OF EQUITY SECURITIES AND USE OF PROCEEDS.
None.
ITEM 3. DEFAULTS UPON SENIOR SECURITIES.
None.
ITEM 4. MINE SAFETY DISCLOSURES.
Not applicable.
ITEM 5. OTHER INFORMATION.
None.
ITEM 6. EXHIBITS.
| 15 |
SIGNATURES
Pursuant to the requirements of the Securities Exchange Act of 1934, the registrant has duly caused this report to be signed on its behalf by the undersigned, thereunto duly authorized.
| WETOUCH TECHNOLOGY INC. | ||
| Date: August 16, 2023 | By: | /s/ Zongyi Lian |
| Name: | Zongyi Lian | |
| Title: | President and Chief Executive Officer (Principal Executive Officer) | |
| Date: August 16, 2023 | By: | /s/ Yuhua Huang |
| Name: | Yuhua Huang | |
| Title: | Chief Financial Officer (Principal Financial and Accounting Officer) | |
| 16 |