WEYCO GROUP INC
10-Ks and 10-Qs
|
|
|
|
|
|
|
|
|
|
|
|
|
|
|
|
|
|
|
|
|
|
|
|
|
|
|
|
|
|
|
|
|
|
|
|
|
|
|
|
|
|
|
|
|
|
|
|
|
|
|
|
|
|
|
|
|
|
|
UNITED
STATES SECURITIES AND EXCHANGE COMMISSION
Washington,
D. C. 20549
FORM
10-K
x
Annual
report pursuant to section 13 or 15(d) of the Securities Exchange Act of
1934
For the
fiscal year ended December 31, 2009, or
¨
Transition
report pursuant to section 13 or 15(d) of the Securities Exchange Act of
1934
For
transition period from .............................. to
.....................................
Commission
file number 0-9068
WEYCO
GROUP, INC.
(Exact
name of registrant as specified in its charter)
|
Wisconsin
|
39-0702200
|
|
(State
or other jurisdiction of incorporation or organization)
|
(I.R.S.
Employer Identification No.)
|
|
333
W. Estabrook Boulevard, P. O. Box 1188, Milwaukee, WI
53201
|
|
(Address
of principal executive
offices) (Zip
Code)
|
Registrant’s
telephone number, include area code: (414) 908-1600
Securities
registered pursuant to Section 12(b) of the Act:
|
Title of each class
|
Name of each exchange on which
registered
|
|
|
Common
Stock - $1.00 par value per share
|
The
NASDAQ Stock Market LLC
|
Securities
registered pursuant to Section 12(g) of the Act: None
Indicate
by check mark if the registrant is a well-known seasoned issuer, as defined in
Rule 405 of the Securities Act.
Yes
¨
No
x
Indicate
by check mark if the registrant is not required to file reports pursuant to
Section 13 or 15(d) of the Act.
Yes
¨
No
x
Indicate
by check mark whether the registrant (1) has filed all reports required to be
filed by Section 13 or 15(d) of the Securities Exchange Act of 1934 during the
preceding 12 months (or for such shorter period that the registrant was required
to file such reports), and (2) has been subject to such filing requirements for
the past 90 days. Yes
x
No
¨
Indicate
by check mark whether the registrant has submitted electronically and posted on
its corporate Website, if any, every Interactive Data File required to be
submitted and posted pursuant to rule 405 of Regulation S-T (Section 232.405 of
this chapter) during the preceding 12 months (or for such shorter period that
the registrant was required to submit and post such
files). Yes
¨
No
¨
Indicate
by check mark if disclosure of delinquent filers pursuant to Item 405 of
Regulations S-K is not contained herein, and will not be contained, to the best
of registrant’s knowledge, in any definitive proxy of information statements
incorporated by reference or in any amendment to this
Form
10-K.
x
Indicate
by check mark whether the registrant is a large accelerated filer, an
accelerated filer, a non-accelerated filer, or a smaller reporting
company. See definitions of “large accelerated filer,”
“accelerated filer,” and “smaller reporting company” in Rule
12b-2 of the Exchange Act.
Large
Accelerated Filer
¨
Accelerated
Filer
x
Non-Accelerated
Filer
¨
Smaller
Reporting Company
¨
Indicate
by check mark whether the registrant is a shell company (as defined in Rule
12b-2 of the Exchange Act).
Yes
¨
No
x
The
aggregate market value of the registrant’s common stock held by non-affiliates
of the registrant as of the close of business on June 30, 2009 was
$162,139,000. This was based on the closing price of $23.09 per share
as reported by NASDAQ on June 30, 2009, the last business day of the
registrant’s most recently completed second fiscal quarter.
As of
March 1, 2010, there were outstanding 11,337,370 shares of common
stock.
DOCUMENTS INCORPORATED BY
REFERENCE
Portions
of the definitive Proxy Statement for its Annual Meeting of Shareholders
scheduled for May 4, 2010, are incorporated by reference in Part III of this
report.
CAUTIONARY STATEMENTS FOR
FORWARD-LOOKING INFORMATION
This
report contains certain forward-looking statements with respect to the Company’s
outlook for the future. These statements represent the Company's
reasonable judgment with respect to future events and are subject to risks and
uncertainties that could cause actual results to differ materially.
The reader is cautioned
that these forward-looking statements are subject to a number of risks,
uncertainties, or other factors that may cause (and in some cases have caused)
actual results to differ materially from those described in the forward-looking
statements. These risks and uncertainties include, but are not limited to, the
risk factors described under Item 1A, “Risk Factors.”
The
Company is a Wisconsin corporation incorporated in the year 1906 as Weyenberg
Shoe Manufacturing Company. Effective April 25, 1990, the name of the
corporation was changed to Weyco Group, Inc.
Weyco
Group, Inc. and its subsidiaries (the “Company”) engage in one line of business,
the distribution of men’s footwear. The principal brands of shoes sold by the
Company are “Florsheim,” “Nunn Bush,” and “Stacy Adams.” The
Company also has other brands, including “Brass Boot” and “Nunn Bush NXXT,”
which are included within Nunn Bush sales figures, “SAO by Stacy Adams,” which
is included within Stacy Adams sales, and “Florsheim by Duckie Brown” which was
introduced in 2009 and is included within Florsheim sales. Trademarks
maintained by the Company on these names are important to the
business. The Company’s products consist of both mid-priced quality
leather dress shoes which would be worn as a part of more formal and traditional
attire and quality casual footwear of man-made materials or leather which would
be appropriate for leisure or less formal occasions. The Company’s
footwear, and that of the industry in general, is available in a broad range of
sizes and widths, primarily purchased to meet the needs and desires of the
American male population.
The
Company purchases finished shoes from outside suppliers, primarily located in
China and India. Almost all of these foreign-sourced purchases are
denominated in U.S. dollars. Historically, there have been few
inflationary pressures in the shoe industry and leather and other component
prices have been stable. However, in 2007 and 2008 there were upward
cost pressures from the Company’s suppliers. These cost increases
were caused by a variety of factors, including higher labor, materials and
freight costs and changes in the strength of the U.S. dollar. In
certain circumstances, the Company is able to increase prices to offset the
effect of these increases in costs. In 2009, the Company’s suppliers’
costs stabilized, and the Company achieved some cost reductions as a result of
cost control measures within its supply chain.
The
Company’s business is separated into two reportable segments – the North
American wholesale segment (“wholesale”) and the North American retail segment
(“retail”). The Company also has other wholesale and retail
businesses overseas which include the recently acquired businesses in Australia,
South Africa and Asia Pacific (“Florsheim Australia”) (see Note 3 of the Notes
to Consolidated Financial Statements) and its wholesale and retail businesses in
Europe. In conjunction with the acquisition of Florsheim Australia,
the Company reorganized its internal reporting structure and as such, recast its
reportable segments (see Note 15 of the Notes to Consolidated Financial
Statements). Accordingly, all prior period amounts have been restated
to conform to the current presentation.
In 2009,
2008 and 2007 sales of the North American wholesale segment, which include both
wholesale sales and licensing revenues, constituted approximately 75%, 85% and
84% of total sales, respectively. At wholesale, shoes are marketed
throughout the United States and Canada in more than 10,000 shoe, clothing and
department stores. In 2009, 2008 and 2007, sales to the Company’s
largest customer, JCPenney, were 13%, 14% and 12%, respectively, of total
sales. The Company employs traveling salespeople who sell the
Company’s products to retail outlets. Shoes are shipped to these
retailers primarily from the Company’s distribution center in Glendale,
Wisconsin. Although there is no clearly identifiable seasonality in
the men’s footwear business, new styles are historically developed and shown
twice each year, in spring and fall. In accordance with industry
practices, the Company is required to carry significant amounts of inventory to
meet customer delivery requirements and periodically provides extended payment
terms to customers. The Company has licensing agreements with third
parties who sell its branded shoes outside of the United States and Canada, as
well as licensing agreements with speciality shoe, apparel and accessory
manufacturers in the United States. Licensing revenues were
approximately 1% of total sales in 2009 and 2% of total sales in each of 2008
and 2007.
The North
American retail segment constituted approximately 10% of total sales in 2009 and
12% of total sales in each of 2008 and 2007. As of December 31, 2009,
the retail segment consisted of 36 company-operated stores in the United States
and an Internet business. Sales in retail stores are made directly to the
consumer by Company employees. In addition to the sale of the Company’s brands
of footwear in these retail stores, other branded footwear and accessories are
also sold in order to provide the consumer with a more complete
selection.
Sales of
the Company’s other businesses represented 15%, 3% and 4% of total sales in
2009, 2008 and 2007, respectively. These sales relate to the
Company’s wholesale and retail operations in Australia, South Africa, Asia
Pacific and Europe. The increase in 2009 was due to the Company’s
acquisition of Florsheim Australia in January 2009 (see Note 3 of the Notes to
Consolidated Financial Statements).
As of
December 31, 2009, the Company had a backlog of $27 million of confirmed orders
compared with $22 million as of December 31, 2008. This does not
include unconfirmed blanket orders from customers, which accounts for the
majority of the Company’s orders, particularly from its larger
accounts. All orders are expected to be filled within one
year.
As of
December 31, 2009, the Company employed 553 persons, of which 18 were members of
collective bargaining units. Future wage and benefit increases under
the collective bargaining contracts are not expected to have a significant
impact on the future operations or financial position of the
Company. During 2009, 166 employees were added as a result of the
Company’s acquisition of Florsheim Australia (see Note 3 of the Notes to
Consolidated Financial Statements).
Price,
quality, service and brand recognition are all important competitive factors in
the shoe industry and the Company has been recognized as a leader in all of
them. The Company does not engage in any specific research and
development activities. However, the Company does have a design department that
is continually reviewing and updating product designs. Compliance
with environmental regulations historically has not had, and is not expected to
have, a material adverse effect on the Company’s results of operations,
financial position or cash flows.
The
Company makes available, free of charge, copies of its annual report on Form
10-K, quarterly reports on Form 10-Q, current reports on Form 8-K and all
amendments to those reports upon written or telephone
request. Investors can also access these reports through the
Company’s website,
www.weycogroup.com
,
as soon as reasonably practical after the Company files or furnishes those
reports to the Securities and Exchange Commission (SEC). The
information on the Company’s website is not a part of this
filing. Also available on the Company’s website are various documents
relating to the corporate governance of the Company, including its Code of
Ethics.
There are
many factors that affect the Company’s business, many of which are beyond the
Company’s control. The following is a description of some of the
significant factors that might materially and adversely affect the Company’s
business, results of operations and financial condition.
Changes
in the U.S. and global economy may adversely affect the Company.
Spending
patterns in the footwear market, particularly those in the moderate-priced
market in which a good portion of the Company’s products compete, have
historically been impacted by consumers’ disposable income. As a
result, the success of the Company is impacted by changes in general economic
conditions, especially in the United States. Factors affecting
discretionary
income for the moderate consumer include, among others, general business
conditions, gas and energy costs, employment, consumer confidence, interest
rates and taxation. Additionally, the economy and consumer behavior
can impact the financial strength and buying patterns of retailers, which can
also affect the Company’s results. The continued economic slowdown,
or a worsening of economic conditions, could adversely affect the Company’s
sales volume and overall performance.
Changes
in the U.S. and global credit markets could adversely affect the Company’s
business.
The
current global financial crisis affecting the banking system and financial
markets has resulted in a tightening in the credit markets with heightened
lending standards and terms. This recent turmoil in the credit
markets poses various risks to the Company, including negatively impacting
retailer and consumer confidence, limiting the Company’s customers’ access to
credit markets and interfering with the normal commercial relationships between
the Company and its customers. Increased credit risks associated with
the financial condition of some customers in the retail industry affects their
level of purchases from the Company and the collectability of amounts owed to
the Company, and in some cases, causes the Company to reduce or cease shipments
to certain customers who no longer meet the Company’s credit
requirements.
In
addition, the current economic slowdown and credit crisis could lead to certain
of the Company’s customers experiencing cash flow problems, which may force them
into higher default rates or to file for bankruptcy protection which may
increase the Company’s bad debt expense or further negatively impact the
Company’s business.
The
Company is subject to risks related to the retail environment that could
adversely impact the Company’s business.
The
Company is subject to risks associated with doing business in the retail
environment, primarily in the United States. Recently, the U.S.
retail industry has experienced a growing trend toward consolidation of large
retailers. The merger of major retailers could result in the Company losing
sales volume or increasing its concentration of business with a few large
accounts, resulting in reduced bargaining power on the part of the Company,
which could increase pricing pressures and lower the Company’s
margins.
Changes
in consumer preferences could negatively impact the Company.
The
Company’s success is dependent upon its ability to accurately anticipate and
respond to rapidly changing fashion trends and consumer preferences. Failure to
predict or respond to current trends or preferences could have an adverse impact
on the Company’s sales volume and overall performance.
The
Company relies on independent foreign sources of production and the availability
of leather and other raw materials which could have unfavorable effects on the
Company’s business.
The
Company purchases its products entirely from independent foreign manufacturers,
primarily in China and India. Although the Company has good working
relationships with its manufacturers, the Company does not have long-term
contracts with them. Thus, the Company could experience increases in
manufacturing costs, disruptions in the timely supply of products or
unanticipated reductions in manufacturing capacity, any of which could
negatively impact the Company’s business, results of operations and financial
condition. The Company has the ability to move product to different
suppliers; however, the transition may not occur smoothly and/or quickly and the
Company could miss customer delivery date requirements and, consequently, could
lose orders. Additional risks associated with foreign sourcing that
could negatively impact the Company’s business include adverse changes in
foreign economic conditions, import regulations, restrictions on the transfer of
funds, duties, tariffs, quotas and political or labor interruptions, disruptions
at U.S. or foreign ports or other transportation facilities, foreign currency
fluctuations, expropriation and nationalization.
The
Company’s use of foreign sources of production results in long production and
delivery lead times. Therefore, the Company needs to forecast demand
at least five months in advance. If the Company’s forecasts are
wrong, it could result in the loss of sales if there is not enough product, or
in reduced margins if there is excess inventory that needs to be sold at
discounted prices.
Additionally,
the Company’s products depend on the availability of raw materials, especially
leather. Any significant shortages of quantities or increases in the
cost of leather could have a material adverse effect on the Company’s business
and results of operations.
The
Company operates in a highly competitive environment, which may result in lower
prices and reduce its profits.
The men’s
footwear market is extremely competitive. The Company competes with
manufacturers, distributors and retailers of men’s shoes, certain of which are
larger and have substantially greater resources than the Company
has. The Company competes with these companies primarily on the basis
of price, quality, service and brand recognition, all of which are important
competitive factors in the shoe industry. The Company’s ability to
maintain its competitive edge depends upon these factors, as well as its ability
to deliver new products at the best value for the consumer, maintain positive
brand recognition, and obtain sufficient retail floor space and effective
product presentation at retail. If the Company does not remain
competitive, the Company’s future results of operations and financial condition
could decline.
The
Company’s business is dependent on information and communication systems, and
significant interruptions could disrupt its business.
The
Company accepts and fills the majority of its larger customers’ orders through
the use of Electronic Data Interchange (EDI). It relies on its
warehouse management system to efficiently process orders. The
corporate office relies on computer systems to efficiently process and record
transactions. Significant interruptions in its information and
communication systems from power loss, telecommunications failure or computer
system failure could significantly disrupt the Company’s business and
operations.
The
Company may not be able to successfully integrate new brands and
businesses.
The
Company intends to continue to look for new acquisition
opportunities. That search could be unsuccessful and costs could be
incurred in failed search efforts. If an acquisition does occur, the
Company cannot guarantee that it would be able to successfully integrate the
brand into its current operations, or that any acquired brand would achieve
results in line with the Company’s historical performance or its specific
expectations for the brand.
Loss
of the services of the Company’s top executives could adversely affect the
business.
Thomas W.
Florsheim, Jr., the Company’s Chairman and Chief Executive Officer, and John W.
Florsheim, the Company’s President and Chief Operating Officer, have a strong
heritage within the Company and the footwear industry. They possess knowledge,
relationships and reputations based on their lifetime exposure to and experience
in the Company and the industry. The loss of either one or both of
the Company’s top executives could have an adverse impact on the Company’s
performance.
The
limited public float and trading volume for the Company’s stock may have an
adverse impact on the stock price or make it difficult to
liquidate.
The
Company’s common stock is held by a relatively small number of
shareholders. The Florsheim family owns over 35% of the stock and one
other institutional shareholder holds a significant block. Other
officers, directors, and members of management own stock or have the potential
to own stock through previously granted stock options and restricted
stock. Consequently, the Company has a small float and low average
daily trading volume. Future sales of substantial amounts of the
Company’s common stock in the public market, or the perception that these sales
could occur, may adversely impact the market price of the stock and the stock
could be difficult to liquidate.
None
The
following facilities were operated by the Company and its subsidiaries as of
December 31, 2009:
|
Owned/
|
Square
|
|||||||||||
|
Location
|
Character
|
Leased
|
Footage
|
%
Utilized
|
||||||||
|
Glendale,
Wisconsin
|
One
story office
|
Owned
|
780,000 | 90 | % | |||||||
|
and
distribution center
|
||||||||||||
|
Montreal,
Canada
|
Multistory
office
|
Leased
(1)
|
42,400 | 100 | % | |||||||
|
and
distribution center
|
||||||||||||
|
Florence,
Italy
|
One
story office
|
Leased
(1)
|
19,400 | 100 | % | |||||||
|
and
distribution center
|
||||||||||||
|
Fairfield
Victoria , Australia
|
Office
and
|
Leased
(1)
|
28,500 | 100 | % | |||||||
|
distribution
center
|
||||||||||||
|
Strydom
Park, South Africa
|
Distribution
center - Apparel
|
Leased
(1)
|
3,700 | 100 | % | |||||||
|
Strydom
Park, South Africa
|
Distribution
center - Footwear
|
Leased
(1)
|
3,700 | 100 | % | |||||||
|
Hong
Kong, China
|
Office
and distribution center
|
Leased
(1)
|
13,000 | 100 | % | |||||||
|
Shenzhen,
China
|
Distribution
center
|
Leased
(1)
|
3,600 | 100 | % | |||||||
(1) Not
material leases.
In
addition to the above-described office and distribution facilities, the Company
operates retail shoe stores under various rental agreements. All of
these facilities are suitable and adequate for the Company’s current
operations. See Note 12 of the Notes to Consolidated Financial
Statements and Item 1, “Business”, above.
Not
Applicable
EXECUTIVE OFFICERS OF THE
REGISTRANT
|
Served
|
||||||||
|
Officer
|
Age
|
Office(s)
|
Since
|
Business Experience
|
||||
|
Thomas
W. Florsheim, Jr.
|
51
|
Chairman
and Chief
|
1996
|
Chairman
and Chief Executive
|
||||
|
Executive
Officer
|
Officer
of the Company – 2002 to present; President and Chief Executive Officer of
the Company — 1999 to 2002; President and Chief Operating
Officer of the Company — 1996 to 1999; Vice President of the Company
– 1988 to 1996
|
|||||||
|
John
W. Florsheim
|
46
|
President,
Chief Operating Officer and Assistant Secretary
|
1996
|
President,
Chief Operating Officer and Assistant Secretary of the Company – 2002 to
present; Executive Vice President, Chief Operating Officer and Assistant
Secretary of the Company – 1999 to 2002; Executive Vice President of the
Company – 1996 to 1999; Vice President of the Company – 1994 to
1996
|
||||
|
Peter
S. Grossman
|
66
|
Senior
Vice President, President, Nunn Bush Brand and Retail
|
1971
|
Senior
Vice President of the Company – 2002 to present; Vice President of the
Company – 1971 to 2002
|
||||
|
John
F. Wittkowske
|
50
|
Senior
Vice President, Chief Financial Officer and Secretary
|
1993
|
Senior
Vice President, Chief Financial Officer and Secretary of the Company –
2002 to present; Vice President, Chief Financial Officer and Secretary of
the Company – 1995 to 2002; Secretary/Treasurer of the Company – 1993 to
1995
|
Thomas W.
Florsheim, Jr. and John W. Florsheim are brothers, and
Chairman
Emeritus Thomas W. Florsheim is their father.
|
ITEM
5
|
MARKET FOR
REGISTRANT’S COMMON EQUITY, RELATED STOCKHOLDER MATTERS AND ISSUER
PURCHASES OF EQUITY
SECURITIES
|
The
shares of the Company’s common stock are traded on the NASDAQ Stock Market LLC
(NASDAQ) under the
symbol
“WEYS.”
COMMON
STOCK DATA
|
2009
|
2008
|
|||||||||||||||||||||||
|
Cash
|
Cash
|
|||||||||||||||||||||||
|
Stock Prices
|
Dividends
|
Stock Prices
|
Dividends
|
|||||||||||||||||||||
|
Quarter
:
|
High
|
Low
|
Declared
|
High
|
Low
|
Declared
|
||||||||||||||||||
|
First
|
$ | 33.21 | $ | 20.11 | $ | 0.14 | $ | 33.68 | $ | 25.00 | $ | 0.11 | ||||||||||||
|
Second
|
$ | 28.22 | $ | 21.34 | $ | 0.15 | $ | 31.28 | $ | 24.14 | $ | 0.14 | ||||||||||||
|
Third
|
$ | 24.94 | $ | 21.26 | $ | 0.15 | $ | 41.99 | $ | 25.81 | $ | 0.14 | ||||||||||||
|
Fourth
|
$ | 24.43 | $ | 21.66 | $ | 0.15 | $ | 34.70 | $ | 23.82 | $ | 0.14 | ||||||||||||
| $ | 0.59 | $ | 0.53 | |||||||||||||||||||||
There
were 214 holders of record of the Company's common stock as of March 1,
2010.
The stock
prices shown above are the high and low actual trades on the NASDAQ for the
calendar periods indicated.
Stock
Performance
The
following line graph compares the cumulative total shareholder return on the
Company’s common stock during the five years ended December 31, 2009 with the
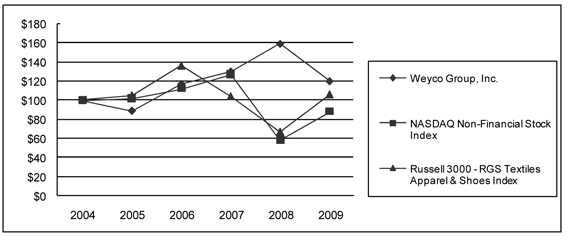
cumulative return on the NASDAQ Non-Financial Stock Index and the Russell
3000-RGS Textiles Apparel & Shoes Index. The comparison assumes
$100 was invested on December 31, 2004 in the Company’s common stock and in each
of the foregoing indices and assumes reinvestment of dividends.
|
2004
|
2005
|
2006
|
2007
|
2008
|
2009
|
|||||||||||||||||||
|
Weyco
Group, Inc.
|
100 | 89 | 117 | 130 | 159 | 120 | ||||||||||||||||||
|
NASDAQ
Non-Financial Stock Index
|
100 | 102 | 112 | 127 | 58 | 88 | ||||||||||||||||||
|
Russell
3000 – RGS Textiles Apparel & Shoes Index
|
100 | 105 | 136 | 104 | 67 | 106 | ||||||||||||||||||
In April
1998, the Company first authorized a stock repurchase program to purchase
1,500,000 shares of its common stock in open market transactions at prevailing
prices. In April 2000, May 2001 and again in February 2009 the
Company’s Board of Directors extended the stock repurchase program to cover the
repurchase of a total of 4,000,000 additional shares. Therefore, 5,500,000
shares have been authorized for repurchase through December 31,
2009. The table below presents information pursuant to Item 703 of
Regulation S-K regarding the repurchase of the Company’s common stock by the
Company in the three-month period ended December 31, 2009.
|
Total
Number of
|
Maximum
Number
|
|||||||||||||||
|
Total
|
Average
|
Shares
Purchased as
|
of
Shares
|
|||||||||||||
|
Number
|
Price
|
Part
of the Publicly
|
that
May Yet Be
|
|||||||||||||
|
of
Shares
|
Paid
|
Announced
|
Purchased
Under
|
|||||||||||||
|
Period
|
Purchased
|
Per Share
|
Program
|
the
Program
|
||||||||||||
|
10/01/09 - 10/31/09
|
350 | $ | 22.00 | 350 | 1,387,068 | |||||||||||
|
11/01/09 - 11/30/09
|
1,323 | $ | 22.03 | 1,323 | 1,385,745 | |||||||||||
|
12/01/09 - 12/31/09
|
- | - | - | 1,385,745 | ||||||||||||
|
Total
|
1,673 | $ | 22.02 | 1,673 | ||||||||||||
The
following selected financial data reflects the results of operations, balance
sheet data and common share information for the years ended December 31, 2005
through December 31, 2009.
|
Years
Ended December 31,
|
||||||||||||||||||||
|
(in
thousands, except per share amounts)
|
||||||||||||||||||||
|
2009
|
2008
|
2007
|
2006
|
2005
|
||||||||||||||||
|
Net
Sales
|
$ | 225,305 | $ | 221,432 | $ | 232,616 | $ | 221,047 | $ | 209,469 | ||||||||||
|
Net
earnings attributable to Weyco Group, Inc.
|
$ | 12,821 | $ | 17,025 | $ | 22,901 | $ | 21,856 | $ | 19,401 | ||||||||||
|
Diluted
earnings per share
|
$ | 1.11 | $ | 1.45 | $ | 1.91 | $ | 1.81 | $ | 1.62 | * | |||||||||
|
Weighted
average diluted shares outstanding
|
11,510 | 11,757 | 12,013 | 12,094 | 11,966 | * | ||||||||||||||
|
Cash
dividends per share
|
$ | 0.59 | $ | 0.53 | $ | 0.42 | $ | 0.34 | $ | .26 1/2 | * | |||||||||
|
Total
assets
|
$ | 207,153 | $ | 190,640 | $ | 190,152 | $ | 189,623 | $ | 175,498 | ||||||||||
|
Bank
borrowings
|
$ | - | $ | 1,250 | $ | 550 | $ | 10,958 | $ | 9,553 | ||||||||||
*Share
and per share amounts have been adjusted to reflect the two-for-one stock split
distributed to shareholders on April 1, 2005.
GENERAL
The
Company is a distributor of men’s casual, dress and fashion
shoes. The principal brands of shoes sold by the Company are
“Florsheim,” “Nunn Bush,” and “Stacy Adams.” Inventory is purchased from
third-party overseas manufacturers. The majority of foreign-sourced
purchases are denominated in U.S. dollars. In the North American
wholesale segment (“wholesale”), the Company’s products are sold to shoe
specialty stores, department stores and clothing retailers, primarily in the
United States and Canada. Licensing revenues are also included in the
Company’s wholesale segment. The Company has licensing agreements
with third parties who sell its branded apparel, accessories and specialty
footwear in the United States, as well as its footwear in Mexico and certain
markets overseas. The Company’s North American retail segment
(“retail”) consisted of 36 Company-owned retail stores in the United States and
an Internet business as of December 31, 2009. Sales in retail outlets
are made directly to consumers by Company employees. The Company also
has other wholesale and retail businesses overseas (“other”) which include the
recently acquired businesses in Australia, South Africa, and Asia Pacific
(“Florsheim Australia”) (see below and Note 3 of the Notes to Consolidated
Financial Statements), and its wholesale and retail businesses in
Europe. In conjunction with the acquisition of Florsheim Australia,
the Company reorganized its internal reporting structure and as such, recast its
reportable segments (see Note 15 of the Notes to Consolidated Financial
Statements). Accordingly, all prior period amounts have been restated
to conform to the current presentation. The majority of the Company’s
operations are in the United States, and its results are primarily affected by
the economic conditions and the retail environment in the United
States.
This
discussion summarizes the significant factors affecting the consolidated
operating results, financial position and liquidity of the Company for the
three-year period ended December 31, 2009. This discussion should be
read in conjunction with Item 8, “Financial Statements and Supplementary Data”
below.
OVERVIEW
In
January 2009, the Company acquired a majority interest in a new subsidiary,
Florsheim Australia Pty Ltd. (“Florsheim Australia”), which subsequently
purchased the Florsheim wholesale and retail businesses in Australia, South
Africa, and Asia Pacific. The vast majority of this business is
conducted under the Florsheim name, with a small amount of business under the
Stacy Adams and Nunn Bush brand names. The consolidated financial
statements of Florsheim Australia have been included in the Company’s 2009
consolidated financial statements since the date of acquisition. Net
sales of Florsheim Australia included in the Company’s consolidated financial
statements were $27.3 million for 2009.
The
Company’s consolidated net sales in 2009 were $225.3 million, compared with
$221.4 million and $232.6 million in 2008 and 2007, respectively. Net
earnings attributable to Weyco Group, Inc. in 2009 were $12.8 million, compared
with $17.0 million and $22.9 million in 2008 and 2007,
respectively. Diluted earnings per share were $1.11 for 2009,
compared with $1.45 and $1.91 in 2008 and 2007, respectively.
In the
fourth quarter of 2008, the Company experienced a significant drop in sales
volume across all of its business operations concurrent with the downturn in the
economy, and retailers reacted by reducing their inventory to very low
levels. The depressed economic environment continued in 2009, and
retailers kept their inventory levels low. During 2009, the Company
consciously made efforts to control costs, manage inventory levels and introduce
new products that addressed a more value conscious consumer. Although
the Company’s year-over-year sales volumes were down the first three quarters of
the year, some improvement was seen in the fourth quarter of
2009. For the full year of 2009, wholesale net sales were down 9% and
retail net sales were down 17% compared with 2008. Other net sales
were $34.6 million in 2009 compared with $7.7 million in 2008. The
increase was due primarily to the acquisition of Florsheim Australia in January
2009.
The
Company’s cash and marketable securities totaled $76.8 million at December 31,
2009 compared with $57.6 million at December 31, 2009. The Company
had no outstanding debt at December 31, 2009 as compared with $1.25 million at
December 31, 2008.
RESULTS
OF OPERATIONS
2009 vs.
2008
Wholesale
Segment Net Sales
Net sales
in the Company’s wholesale segment for the years ended December 31, 2009 and
2008 were as follows:
|
Wholesale Segment Net Sales
|
||||||||||||
|
Years ended December 31,
|
||||||||||||
|
2009
|
2008
|
% Change
|
||||||||||
|
(Dollars
in thousands)
|
||||||||||||
|
North
American Net Sales
|
||||||||||||
|
Stacy
Adams
|
$ | 48,951 | $ | 55,470 | -12 | % | ||||||
|
Nunn
Bush
|
67,744 | 69,367 | -2 | % | ||||||||
|
Florsheim
|
49,295 | 58,043 | -15 | % | ||||||||
|
Total
Wholesale
|
$ | 165,990 | $ | 182,880 | -9 | % | ||||||
|
Licensing
|
2,683 | 4,284 | -37 | % | ||||||||
|
Total
Wholesale Segment
|
$ | 168,673 | $ | 187,164 | -10 | % | ||||||
Wholesale
net sales were down across all brands in 2009 compared with last year due to the
recessionary economic environment which began in the fall of
2008. Sales volumes were down in the first three quarters of 2009,
with some improvement in the fourth quarter in comparison to last
year. The slowdown in consumer demand caused retailers to maintain
leaner inventory levels in 2009 than they had the year earlier. Sales
in 2009 were also affected by the loss of business with retailers who have
closed their doors, as well as a reduction of shipments to retailers based on
credit risk. Management believes the decreases at Stacy Adams were
due to reduced consumer spending on fashion-oriented products this
year. Management believes Nunn Bush sales, although down, performed
well in 2009, despite the challenging economic climate this year due to its
position as a moderately priced brand in mid-tier department
stores. Florsheim sales were down due to the opposite impact of the
consumer behavior discussed for Nunn Bush, as it competes at the higher end of
the pricing matrix in mid-tier department and chain stores, and suffered as
consumers “traded down” to lower priced products.
Licensing
revenues consist of royalties earned on sales of Stacy Adams apparel and
accessories in the United States, on sales of Florsheim specialty footwear and
accessories in the United States and on sales of Florsheim footwear in Mexico
and certain overseas markets. In 2009, the Company’s licensing
revenues decreased, primarily as a result of the acquisition of Florsheim
Australia this year and also due to a general trend of lower sales of
the Company’s licensed products in the current difficult retail
environment.
Retail
Segment Net Sales
Retail
net sales in 2009 were $22.0 million, down 17% from $26.5 million in
2008. The decrease reflects the particularly challenging retail
environment in 2009. There were two fewer stores in 2009 compared
with 2008. Same store sales in 2009 were down 8% compared with
2008. Stores are included in same store sales beginning in the
store’s 13
th
month
of operations after its grand opening.
Other Net
Sales
The
Company’s “other” category includes the Company’s operations in Australia, South
Africa, Asia Pacific and Europe. In 2009, net sales of the Company’s
other operations were $34.6 million, as compared with $7.7 million in
2008. The increase is due to the addition of Florsheim Australia in
January 2009, which contributed net sales of $27.3 million in 2009.
Gross
Earnings and Cost of Sales
The
Company’s overall gross earnings as a percent of net sales were 37.5% in 2009
and 36.6% in 2008. Overall gross earnings as a percent of net sales
were positively impacted in 2009 by the acquisition of Florsheim
Australia. Florsheim Australia has a higher component of retail
versus wholesale sales and therefore, its overall margins are higher and
increase the Company’s overall gross earnings as a percent of net
sales. Wholesale gross earnings as a percent of net sales were
virtually flat at 30.5% in 2009 compared with 30.4% in 2008. Retail
gross earnings as a percent of net sales were 64.1% compared with 65.8% in 2008,
primarily a result of increased discounts and promotions due to the challenging
retail environment in 2009.
The
Company’s cost of sales does not include distribution costs (e.g., receiving,
inspection or warehousing costs). The Company’s distribution costs
for the years ended December 31, 2009 and 2008 were $7.9 million and $7.4
million, respectively. These costs were included in selling and administrative
expenses. Therefore, the Company’s gross earnings may not be
comparable to other companies, as some companies may include distribution costs
in cost of sales.
Selling
and Administrative Expenses
The
Company’s selling and administrative expenses include, and are primarily related
to, distribution costs, salaries and commissions, advertising costs, employee
benefit costs, rent and depreciation. Overall selling and
administrative expenses were $67.7 million in 2009, up $11.1 million compared
with $56.6 million in 2008 and were 30.0% of net sales in 2009 compared with
25.6% in 2008. The increase was primarily due to the addition of
Florsheim Australia in 2009. Florsheim Australia’s selling and
administrative expenses were $12.5 million in 2009 and included $400,000 of
one-time acquisition costs.
Wholesale
selling and administrative expenses were down approximately $670,000 in 2009
compared with 2008. The decrease was primarily due to lower salaries,
salesmen’s commissions and advertising costs partially offset by increased
pension and stock-based compensation expense. Retail selling and
administrative expenses were down approximately $700,000 in 2009 compared with
2008. This decrease reflects two fewer stores this year as compared with last
year partially offset by a $1.1 million charge to recognize the impairment of
certain retail fixed assets (see Note 2 of the Notes to Consolidated Financial
Statements).
Wholesale
selling and administrative expenses as a percent of net wholesale sales were
22.1% in 2009 compared with 20.5% in 2008. Retail selling and
administrative expenses were 70.9% of net retail sales in 2009 compared with
61.5% in 2008. The increases this year in selling and administrative
expenses as a percent of sales in both the wholesale and retail segments was
mainly a result of the impact of lower sales volume in the current year, as many
of the Company’s selling and administrative costs are fixed in
nature.
Interest
The
majority of the Company’s interest income is from its investments in marketable
securities. Interest income for 2009 was down $166,000 compared with
2008.
Other
Income and Expense
Other
income and expense for 2009 was $1.4 million of income compared with $21,000 of
expense in 2008. The increase in 2009 was primarily due to foreign
currency exchange gains on intercompany loans.
Provision
for Income Taxes
The
effective tax rate for 2009 was 34.7% compared with 35.6% in
2008. The decrease in 2009 was primarily due to a higher portion of
municipal bond income relative to total earnings in 2009.
2008 vs.
2007
Wholesale
Segment Net Sales
Net sales
in the Company’s wholesale segment for the years ended December 31, 2008 and
2007 were as follows:
|
Wholesale Segment Net Sales
|
||||||||||||
|
Years ended December 31,
|
||||||||||||
|
2008
|
2007
|
% Change
|
||||||||||
|
(Dollars
in thousands)
|
||||||||||||
|
North
American Net Sales
|
||||||||||||
|
Stacy
Adams
|
$ | 55,470 | $ | 57,444 | -3 | % | ||||||
|
Nunn
Bush
|
69,367 | 68,644 | 1 | % | ||||||||
|
Florsheim
|
58,043 | 66,232 | -12 | % | ||||||||
|
Total
Wholesale
|
$ | 182,880 | $ | 192,320 | -5 | % | ||||||
|
Licensing
|
4,284 | 4,087 | 5 | % | ||||||||
|
Total
Wholesale Segment
|
$ | 187,164 | $ | 196,407 | -5 | % | ||||||
During
the fourth quarter of 2008, all three of the Company’s brands suffered sales
volume losses due to the downturn in the economy, which had a significant impact
on the annual performance of each brand. In addition, the 2008
decrease in Stacy Adams’ net sales reflected lower sales throughout the year to
independent shoe and apparel retailers. Stacy Adams relies on sales
to smaller independent shoe and apparel retailers more than the Company’s other
brands, and this trade class struggled in the retail environment over the past
several years. In response to this trend, the Company increased its
Stacy Adams distribution with department stores and chain stores, which offset a
portion of the loss in volume with the independent retailers. Nunn
Bush outperformed the Company’s other two brands in 2008 compared with 2007 from
a sales volume standpoint, primarily due to its strong position in the mid-tier
market, which benefited from consumers moving away from higher-priced
products. The Company’s Florsheim brand experienced the opposite
impact of this consumer behavior in 2008, and its net sales decreased, as it is
priced at the higher end of the pricing matrix in many of the mid-tier
stores.
Licensing
revenues increased in 2008. Licensing revenues result from licensee
sales of Stacy Adams and Florsheim branded products in the United States, and
Florsheim footwear overseas. Licensee sales of Stacy Adams branded
products decreased in 2008, as independent footwear and apparel retailers, who
are an important trade class for Stacy Adams branded products, struggled in the
retail environment over the past several years. However, Stacy Adams
licensing revenues increased in 2008, as the Company terminated its agreement
with its licensing agent, to whom it had previously paid a portion of the
licensing revenues. The services performed by the licensing agent are
now handled in-house and the related costs are included in selling and
administrative expenses and offset a portion of the licensing
revenues. Licensing revenues from the sale of Florsheim branded
products and footwear were flat in 2008 compared with 2007.
Retail
Segment Net Sales
In 2008,
retail net sales were $26.5 million, down 7% from $28.6 million in
2007. The decrease resulted from the general pullback in consumer
spending during the poor economic climate in the latter part of
2008. During 2008, the Company closed two stores in the United States
and closed another store in the first week of January 2009. These
three stores generated approximately $2.6 million in sales in
2008. In 2007, the Company opened five new stores and closed one
store in the United States. Same store sales in 2008 decreased 9%
compared with 2007. Stores are included in same store sales beginning
in the store’s 13
th
month
of operations after its grand opening.
Gross
Earnings and Cost of Sales
Consolidated
gross earnings as a percent of net sales were 36.6% in 2008 and 38.4% in 2007.
Wholesale gross earnings as a percent of net sales were 30.4% in 2008 compared
with 32.6% in 2007. The decrease was principally due to higher
product costs. Retail gross earnings as a percent of net sales were
65.8%, down 60 basis points from 66.4% in 2007, primarily due to the challenging
retail environment in 2008.
The
Company’s cost of sales does not include distribution costs (e.g., receiving,
inspection or warehousing costs). The Company’s distribution costs
for the years ended December 31, 2008 and 2007 were $7.4 million and $7.1
million, respectively. These costs were included in selling and administrative
expenses. Therefore, the Company’s gross earnings may not be
comparable to other companies, as some companies may include distribution costs
in cost of sales.
Selling
and Administrative Expenses
The
Company’s selling and administrative expenses include, and are primarily related
to, distribution costs, salaries and commissions, advertising costs, employee
benefit costs, rent and depreciation. In 2008, the Company’s overall
selling and administrative expenses were 25.6% of net sales compared with 23.8%
in 2007. Wholesale selling and administrative expenses were up
approximately $100,000 in 2008 compared with 2007. While bad debt
expense was up $680,000 in 2008 due to the bankruptcy filings of several of the
Company’s accounts, salary expense and wholesale salesmen’s commissions were
down in 2008. Wholesale selling and administrative expenses as a
percent of net wholesale sales were 20.5% in 2008 compared with 19.4% in 2007,
which reflects the fixed nature of the majority of the Company’s wholesale
expenses. Retail selling and administrative expenses were 61.5% of
net sales in 2008 compared with 52.6% in 2007. This increase was due
partially to higher operating expenses, particularly rent and occupancy
costs. Also, the reduced volume in 2008 did not cause a corresponding
decrease in retail operating costs, as many of these costs are
fixed.
Interest
and Taxes
The
majority of the Company’s interest income is from its investments in marketable
securities. Interest income for 2008 was down $143,000 compared with
2007. In 2008, interest expense improved by $291,000 compared with
2007 due to lower average borrowings in 2008.
The
effective tax rate for 2008 was 35.6% compared with 36.3% in
2007. The 2008 decrease primarily resulted from higher interest
income earned on municipal bonds relative to taxable income in
2008.
LIQUIDITY
& CAPITAL RESOURCES
The
Company’s primary source of liquidity is its cash and short-term marketable
securities, which aggregated $34.0 million at December 31, 2009 and $18.1
million at December 31, 2008. During 2009, the Company’s primary
source of cash was from operations, while its primary uses of cash were for the
acquisition of Florsheim Australia and dividend payments.
The
Company generated $37.9 million in cash from operating activities in 2009,
compared with $15.7 million and $24.2 million in 2008 and 2007,
respectively. Fluctuations in net cash from operating activities have
resulted mainly from changes in net earnings and operating assets and
liabilities, specifically yearend inventory and accounts receivable
balances. In 2009, almost half of the cash generated from operations
was due to reductions in inventories since the beginning of the year. Yearend
inventory balances fluctuate as the Company carefully manages its inventory
levels as inventory requirements and projections change. The
changes in accounts receivable balances reflect fluctuations in sales
volume. The Company’s capital expenditures were $1.3 million, $2.2
million and $2.7 million in 2009, 2008 and 2007,
respectively. Capital expenditures in 2010 are expected to be $1-2
million.
The
Company’s Board of Directors has continued to increase dividends per share each
year, and the Company paid cash dividends of $6.6 million, $5.7 million and $4.7
million in 2009, 2008 and 2007, respectively.
The
Company continues to repurchase its common stock under its share repurchase
program when the Company believes market conditions are favorable. In
2009, the Company repurchased 117,837 shares for a total cost of $2.6
million. In February 2009, the Company’s Board of Directors
authorized the repurchase of an additional 1.0 million shares of its common
stock under its repurchase program. At December 31, 2009, the total
shares available to purchase under the program was approximately 1.4 million
shares.
The
Company had no outstanding debt at December 31, 2009 under its $50 million line
of credit. The line of credit includes a minimum net worth covenant,
which the Company was in compliance with at December 31,
2009. This borrowing facility expires April 30, 2010, and the Company
intends to extend it an additional year at that time.
The
Company believes that available cash and marketable securities, cash provided by
operations, and available borrowing facilities will provide adequate support for
the cash needs of the business in 2010. Management continues to
evaluate ways to best utilize the Company’s cash including continued repurchases
of the Company’s stock, increased dividends and potential
acquisitions.
Off-Balance Sheet
Arrangements
The
Company does not utilize any special purpose entities or other off-balance sheet
arrangements.
Commitments
The
Company’s significant contractual obligations are its supplemental pension plan
and its operating leases, which are discussed further in the Notes to
Consolidated Financial Statements. The Company also has significant
obligations to purchase inventory. The pension obligations are
recorded on the Company’s Consolidated Balance Sheets. Future
obligations under operating leases are disclosed in Note 12 of the Notes to
Consolidated Financial Statements. The table below provides summary
information about these obligations as of December 31, 2009.
|
Payments
Due
by
Period
(dollars
in
thousands)
|
||||||||||||||||||||
|
Total
|
Less
Than
a
Year
|
2
-
3
Years
|
4
-
5
Years
|
More
Than
5
Years
|
||||||||||||||||
|
Pension
obligations
|
$ | 10,240 | $ | 407 | $ | 812 | $ | 838 | $ | 8,183 | ||||||||||
|
Operating
leases
|
36,821 | 7,458 | 12,235 | 9,998 | 7,130 | |||||||||||||||
|
Purchase
obligations*
|
39,599 | 39,599 | - | - | - | |||||||||||||||
|
Total
|
$ | 86,660 | $ | 47,464 | $ | 13,047 | $ | 10,836 | $ | 15,313 | ||||||||||
* Purchase
obligations relate entirely to commitments to purchase inventory.
OTHER
Critical Accounting
Policies
The
Company’s accounting policies are more fully described in Note 2 of the Notes to
Consolidated Financial Statements. As disclosed in Note 2, the
preparation of financial statements in conformity with accounting principles
generally accepted in the United States of America requires management to make
estimates and assumptions about future events that affect the amounts reported
in the financial statements and accompanying notes. Future events and
their effects cannot be determined with absolute
certainty. Therefore, the determination of estimates requires the
exercise of judgment. Actual results inevitably will differ from
those estimates, and such differences may be material to the financial
statements. The following policies are considered by management to be
the most critical in understanding the significant accounting estimates inherent
in the preparation of the Company’s financial statements and the uncertainties
that could impact the Company’s results of operations, financial position and
cash flows.
Sales
Returns, Sale Allowances and Doubtful Accounts
The
Company records reserves for sales returns, sales allowances and accounts
receivable balances that will ultimately not be collected. The reserves are
based on such factors as specific customer situations, historical experience, a
review of the current aging status of customer receivables and current and
expected economic conditions. The reserve for doubtful accounts
includes a specific reserve for accounts identified as potentially
uncollectible, plus an additional reserve for the balance of
accounts. The Company evaluates the reserves and the estimation
process and makes adjustments when appropriate. Historically, losses
have been within the Company’s expectations. Changes in these
reserves may be required if actual returns, discounts and bad debt activity
varies from the original estimates. These changes could impact the
Company’s results of operations, financial position and cash flows
.
Pension
Plan Accounting
The
Company’s pension expense and corresponding obligation are determined on an
actuarial basis and require certain actuarial assumptions. Management
believes the two most critical of these assumptions are the discount rate and
the expected rate of return on plan assets. The Company evaluates its
actuarial assumptions annually on the measurement date (December 31) and makes
modifications based on such factors as market interest rates and historical
asset performance. Changes in these assumptions can result in
different expense and liability amounts, and future actual experience can differ
from these assumptions.
Discount
Rate
– Pension expense and projected benefit obligation both increase as
the discount rate is reduced. See Note 10 of the Notes to
Consolidated Financial Statements for discount rates used in determining the net
periodic pension cost for the years ended December 31, 2009, 2008 and 2007 and
the funded status at December 31, 2009 and 2008. The rates are based
on the plan’s projected cash flows. The Company utilizes the cash
flow matching method which discounts each year’s projected cash flows at the
associated spot interest rate back to the measurement date. A 0.5%
decrease in the discount rate would increase annual pension expense and the
projected benefit obligation by approximately $335,000 and $2.9 million,
respectively.
Expected
Rate of Return
- Pension expense increases as the expected rate of return
on pension plan assets decreases. In estimating the expected return
on plan assets, the Company considers the historical returns on plan assets and
future expectations of asset returns. The Company utilized an
expected rate of return on plan assets of 8.0% in 2009, 2008 and
2007. This rate was based on the Company’s long-term investment
policy of equity securities: 20% - 80%; fixed income securities: 20% - 80%; and
other, principally cash: 0% - 20%. A 0.5% decrease in the
expected return on plan assets would increase annual pension expense by
approximately $112,000.
Recent Accounting
Pronouncements
See Note
2 of the Notes to Consolidated Financial Statements.
The
Company is exposed to market risk from changes in foreign exchange and interest
rates. To reduce the risk from changes in foreign exchange rates, the
Company selectively uses forward exchange contracts. The Company does
not hold or issue financial instruments for trading purposes. The
Company does not have significant market risk on its marketable securities as
those investments consist of high-grade securities and are held to
maturity. The Company has reviewed its portfolio of investments as of
December 31, 2009 and has determined that no other-than-temporary market value
impairment exists.
Foreign
Currency
The
Company’s earnings are affected by fluctuations in the value of the U.S. dollar
against foreign currencies, primarily as a result of the sale of product to
Canadian customers and its intercompany loans with Florsheim
Australia. Forward exchange contracts are used to partially hedge
against the earnings effects of such fluctuations. Based on the
Company’s Canadian derivative instruments outstanding as of December 31, 2009, a
10% change in the Canadian exchange rate would not have a material effect on the
Company’s financial position, results of operations or cash
flows. Based on the Company’s outstanding intercompany loans with
Florsheim Australia at December 31, 2009, a 10% change in the Australian
exchange rate would not have a material effect on the Company’s financial
position, results of operations or cash flows.
Interest
Rates
The
Company is exposed to interest rate fluctuations on borrowings under its
revolving line of credit. As of December 31, 2009, there were no
outstanding borrowings under the revolving line of credit. The interest expense
related to borrowings under the line during 2009 was $25,000. A 10%
increase in the Company’s weighted average interest rate on borrowings would not
have a material effect on the Company’s financial position, results of
operations or cash flows.
Management’s
Annual Report on Internal Control Over Financial Reporting
The
Company’s management is responsible for establishing and maintaining effective
internal control over financial reporting. The Company’s management,
with the participation of the Company’s Chief Executive Officer and Chief
Financial Officer, assessed the effectiveness of the Company’s internal control
over financial reporting as of December 31, 2009. In making this
assessment, management used the criteria set forth by the Committee of
Sponsoring Organizations of the Treadway Commission in
Internal Control – Integrated
Framework
. Based on the assessment, the Company’s management
has concluded that, as of December 31, 2009, the Company’s internal control over
financial reporting was effective based on those criteria.
The
Company’s internal control system was designed to provide reasonable assurance
to the Company’s management and Board of Directors regarding the preparation and
fair presentation of published financial statements. All internal
control systems, no matter how well designed, have inherent limitations.
Therefore, even those systems determined to be effective can provide only
reasonable assurance with respect to financial statement preparation and
presentation.
Management
has excluded its Florsheim Australia operations from its assessment of internal
control over financial reporting as of December 31, 2009 because it was acquired
by the Company in 2009. The total assets and total net sales of these
operations represented approximately 8% and 12%, respectively, of the Company’s
consolidated financial statement amounts as of and for the year ended December
31, 2009.
The
Company’s independent registered public accounting firm has audited the
Company’s consolidated financial statements and the effectiveness of internal
controls over financial reporting as of December 31, 2009 as stated in its
report below.
REPORT
OF INDEPENDENT REGISTERED PUBLIC ACCOUNTING FIRM
To the
Shareholders and Board of Directors of
Weyco
Group, Inc.:
We have
audited the accompanying consolidated balance sheets of Weyco Group, Inc. and
subsidiaries (the “Company”) as of December 31, 2009 and 2008, and the related
consolidated statements of earnings, equity, and cash flows for each of the
three years in the period ended December 31, 2009. We have also
audited the Company's internal control over financial reporting as of December
31, 2009, based on the criteria established in
Internal Control—Integrated
Framework
issued by the Committee of Sponsoring Organizations of the
Treadway Commission. As described in Management’s Report on Internal Control
Over Financial Reporting, management excluded from its assessment the internal
control over financial reporting at Florsheim Australia Pty Ltd which was
acquired on January 23, 2009 and whose financial statements constitute 8% of
total assets and 12% of net sales of the consolidated financial statement
amounts as of and for the year ended December 31, 2009. Accordingly,
our audit did not include the internal control over financial reporting at
Florsheim Australia Pty Ltd. The Company’s management is responsible
for these consolidated financial statements, for maintaining effective internal
control over financial reporting, and for its assessment of the effectiveness of
internal control over financial reporting, included in the accompanying
Management’s Report on Internal Control Over Financial Reporting. Our
responsibility is to express an opinion on these consolidated financial
statements and an opinion on the Company’s internal control over financial
reporting based on our audits.
We
conducted our audits in accordance with the standards of the Public Company
Accounting Oversight Board (United States). Those standards require
that we plan and perform the audit to obtain reasonable assurance about whether
the financial statements are free of material misstatement and whether effective
internal control over financial reporting was maintained in all material
respects. Our audits of the financial statements included examining,
on a test basis, evidence supporting the amounts and disclosures in the
financial statements, assessing the accounting principles used and significant
estimates made by management, as well as evaluating the overall financial
statement presentation. Our audit of internal control over financial
reporting included obtaining an understanding of internal control over financial
reporting, assessing the risk that a material weakness exists, and testing and
evaluating the design and operating effectiveness of internal control based on
the assessed risk. Our audits also included performing such other
procedures as we considered necessary in the circumstances. We believe that our
audits provide a reasonable basis for our opinions.
A
company's internal control over financial reporting is a process designed by, or
under the supervision of, the company's principal executive and principal
financial officers, or persons performing similar functions, and effected by the
company's board of directors, management, and other personnel to provide
reasonable assurance regarding the reliability of financial reporting and the
preparation of financial statements for external purposes in accordance with
generally accepted accounting principles. A company's internal control over
financial reporting includes those policies and procedures that (1) pertain to
the maintenance of records that, in reasonable detail, accurately and fairly
reflect the transactions and dispositions of the assets of the company; (2)
provide reasonable assurance that transactions are recorded as necessary to
permit preparation of financial statements in accordance with generally accepted
accounting principles, and that receipts and expenditures of the company are
being made only in accordance with authorizations of management and directors of
the company; and (3) provide reasonable assurance regarding prevention or timely
detection of unauthorized acquisition, use, or disposition of the company's
assets that could have a material effect on the financial
statements.
Because
of the inherent limitations of internal control over financial reporting,
including the possibility of collusion or improper management override of
controls, material misstatements due to error or fraud may not be prevented or
detected on a timely basis. Also, projections of any evaluation of the
effectiveness of the internal control over financial reporting to future periods
are subject to the risk that the controls may become inadequate because of
changes in conditions, or that the degree of compliance with the policies or
procedures may deteriorate.
In our
opinion, such consolidated financial statements referred to above present
fairly, in all material respects, the financial position of Weyco Group, Inc.
and subsidiaries as of December 31, 2009 and 2008, and the results of their
operations and their cash flows for each of the three years in the period ended
December 31, 2009, in conformity with accounting principles generally accepted
in the United States of America. Also, in our opinion, the Company
maintained, in all material respects, effective internal control over financial
reporting as of December 31, 2009, based on the criteria established in
Internal Control — Integrated
Framework
issued by the Committee of Sponsoring Organizations of the
Treadway Commission
.
/s/
DELOITTE & TOUCHE LLP
Milwaukee,
Wisconsin
March 9,
2010
CONSOLIDATED
STATEMENTS OF EARNINGS
For the
years ended December 31, 2009, 2008 and 2007
|
2009
|
2008
|
2007
|
||||||||||
|
(In
thousands, except per share amounts)
|
||||||||||||
|
Net
Sales
|
$ | 225,305 | $ | 221,432 | $ | 232,616 | ||||||
|
Cost
of Sales
|
140,829 | 140,294 | 143,199 | |||||||||
|
Gross
earnings
|
84,476 | 81,138 | 89,417 | |||||||||
|
Selling
and administrative expenses
|
67,696 | 56,639 | 55,285 | |||||||||
|
Earnings
from operations
|
16,780 | 24,499 | 34,132 | |||||||||
|
Interest
income
|
1,850 | 2,016 | 2,159 | |||||||||
|
Interest
expense
|
(26 | ) | (62 | ) | (353 | ) | ||||||
|
Other
income and expense, net
|
1,406 | (21 | ) | 25 | ||||||||
|
Earnings
before provision for income taxes
|
20,010 | 26,432 | 35,963 | |||||||||
|
Provision
for income taxes
|
6,940 | 9,407 | 13,062 | |||||||||
|
Net
earnings
|
13,070 | 17,025 | 22,901 | |||||||||
|
Net
earnings attributable to noncontrolling interest
|
249 | - | - | |||||||||
|
Net
earnings attributable to Weyco Group, Inc.
|
$ | 12,821 | $ | 17,025 | $ | 22,901 | ||||||
|
Basic
earnings per share
|
$ | 1.14 | $ | 1.49 | $ | 1.98 | ||||||
|
Diluted
earnings per share
|
$ | 1.11 | $ | 1.45 | $ | 1.91 | ||||||
The
accompanying notes to consolidated financial statements are an integral part of
these financial statements.
|
2009
|
2008
|
|||||||
|
(in
thousands, except par value and share data)
|
||||||||
|
ASSETS:
|
||||||||
|
Cash
and cash equivalents
|
$ | 30,000 | $ | 11,486 | ||||
|
Marketable
securities, at amortized cost
|
3,954 | 6,623 | ||||||
|
Accounts
receivable, less reserves of $2,658 and $3,180,
respectively
|
33,020 | 29,873 | ||||||
|
Accrued
income tax receivable
|
- | 2,226 | ||||||
|
Inventories
|
40,363 | 47,012 | ||||||
|
Deferred
income tax benefits
|
- | 579 | ||||||
|
Prepaid
expenses and other current assets
|
3,922 | 3,678 | ||||||
|
Total
current assets
|
111,259 | 101,477 | ||||||
|
Marketable
securities, at amortized cost
|
42,823 | 39,447 | ||||||
|
Deferred
income tax benefits
|
2,261 | 736 | ||||||
|
Other
assets
|
13,070 | 10,069 | ||||||
|
Property,
plant and equipment, net
|
26,872 | 28,043 | ||||||
|
Trademark
|
10,868 | 10,868 | ||||||
|
Total
assets
|
$ | 207,153 | $ | 190,640 | ||||
|
LIABILITIES
& EQUITY:
|
||||||||
|
Short-term
borrowings
|
$ | - | $ | 1,250 | ||||
|
Accounts
payable
|
9,202 | 7,494 | ||||||
|
Dividend
payable
|
1,693 | 1,589 | ||||||
|
Accrued
liabilities:
|
||||||||
|
Wages,
salaries and commissions
|
2,824 | 1,772 | ||||||
|
Taxes
other than income taxes
|
747 | 750 | ||||||
|
Other
|
4,275 | 3,968 | ||||||
|
Accrued
income taxes
|
1,241 | - | ||||||
|
Deferred
income tax liabilities
|
295 | - | ||||||
|
Total
current liabilities
|
20,277 | 16,823 | ||||||
|
Long-term
pension liability
|
18,533 | 15,160 | ||||||
|
Equity:
|
||||||||
|
Common
stock, $1.00 par value, authorized 20,000,000 shares in
|
||||||||
|
2009
and 2008, issued and outstanding 11,333,170 shares in
|
||||||||
|
2009
and 11,353,121 shares in 2008
|
11,333 | 11,353 | ||||||
|
Capital
in excess of par value
|
16,788 | 15,203 | ||||||
|
Reinvested
earnings
|
146,241 | 142,617 | ||||||
|
Accumulated
other comprehensive loss
|
(10,066 | ) | (10,516 | ) | ||||
|
Total
Weyco Group, Inc. equity
|
164,296 | 158,657 | ||||||
|
Noncontrolling
interest
|
4,047 | - | ||||||
|
Total
equity
|
168,343 | 158,657 | ||||||
|
Total
liabilities and equity
|
$ | 207,153 | $ | 190,640 | ||||
The
accompanying notes to consolidated financial statements are an integral part of
these financial
statements.
CONSOLIDATED STATEMENTS OF
EQUITY
For the years ended December 31, 2009, 2008 and 2007
(In
thousands, except per share amounts)
|
Common Stock
|
Class B Common
Stock
|
Capital in Excess
of Par Value
|
Reinvested
Earnings
|
Accumulated Other
Comprehensive
Income/(Loss)
|
Noncontrolling
Interest
|
Comprehensive
Income
|
||||||||||||||||||||||
|
Balance,
December 31, 2006
|
$ | 9,129 | $ | 2,585 | $ | 7,576 | $ | 134,265 | $ | (5,382 | ) | $ | - | |||||||||||||||
|
Comprehensive
Income:
|
||||||||||||||||||||||||||||
|
Net
earnings
|
- | - | - | 22,901 | - | - | $ | 22,901 | ||||||||||||||||||||
|
Foreign
currency translation adjustments
|
- | - | - | - | (92 | ) | - | (92 | ) | |||||||||||||||||||
|
Pension
liability adjustment (net of tax of $726)
|
- | - | - | - | 1,135 | - | 1,135 | |||||||||||||||||||||
|
Total
Comprehensive Income
|
$ | 23,944 | ||||||||||||||||||||||||||
|
Cash
dividends declared ($.42 per share)
|
- | - | - | (4,872 | ) | - | - | |||||||||||||||||||||
|
Conversions
of Class B common stock to common stock
|
2,585 | (2,585 | ) | - | - | - | - | |||||||||||||||||||||
|
Stock
options exercised
|
182 | - | 1,672 | - | - | - | ||||||||||||||||||||||
|
Issuance
of restricted stock
|
20 | - | (20 | ) | - | - | - | |||||||||||||||||||||
|
Restricted
stock forfeited
|
(3 | ) | - | 3 | - | - | - | |||||||||||||||||||||
|
Stock-based
compensation expense
|
- | - | 316 | - | - | - | ||||||||||||||||||||||
|
Income
tax benefit from stock options exercised and vesting of restricted
stock
|
- | - | 1,241 | - | - | - | ||||||||||||||||||||||
|
Shares
purchased and retired
|
(379 | ) | - | - | (9,546 | ) | - | - | ||||||||||||||||||||
|
Adjustments
to initially adopt uncertain tax position
guidance
|
- | - | - | 27 | - | - | ||||||||||||||||||||||
|
Balance,
December 31, 2007
|
$ | 11,534 | $ | - | $ | 10,788 | $ | 142,775 | $ | (4,339 | ) | $ | - | |||||||||||||||
|
Comprehensive
Income:
|
||||||||||||||||||||||||||||
|
Net
earnings
|
- | - | - | 17,025 | - | - | $ | 17,025 | ||||||||||||||||||||
|
Foreign
currency translation adjustments
|
- | - | - | - | (665 | ) | - | (665 | ) | |||||||||||||||||||
|
Pension
liability adjustment (net of tax of $3,524)
|
- | - | - | - | (5,512 | ) | - | (5,512 | ) | |||||||||||||||||||
|
Total
Comprehensive Income
|
$ | 10,848 | ||||||||||||||||||||||||||
|
Cash
dividends declared ($.53 per share)
|
- | - | - | (6,057 | ) | - | - | |||||||||||||||||||||
|
Stock
options exercised
|
213 | - | 1,978 | - | - | - | ||||||||||||||||||||||
|
Issuance
of restricted stock
|
20 | - | (20 | ) | - | - | - | |||||||||||||||||||||
|
Restricted
stock forfeited
|
(1 | ) | - | 1 | - | - | - | |||||||||||||||||||||
|
Stock-based
compensation expense
|
- | - | 609 | - | - | - | ||||||||||||||||||||||
|
Income
tax benefit from stock options exercised and vesting of restricted
stock
|
- | - | 1,847 | - | - | - | ||||||||||||||||||||||
|
Shares
purchased and retired
|
(413 | ) | - | - | (11,126 | ) | - | - | ||||||||||||||||||||
|
Balance,
December 31, 2008
|
$ | 11,353 | $ | - | $ | 15,203 | $ | 142,617 | $ | (10,516 | ) | $ | - | |||||||||||||||
|
Comprehensive
Income:
|
||||||||||||||||||||||||||||
|
Net
earnings
|
- | - | - | 12,821 | - | 249 | $ | 13,070 | ||||||||||||||||||||
|
Foreign
currency translation adjustments
|
- | - | - | - | 1,440 | 641 | 2,081 | |||||||||||||||||||||
|
Pension
liability adjustment (net of tax of $633)
|
- | - | - | - | (990 | ) | - | (990 | ) | |||||||||||||||||||
|
Total
Comprehensive Income
|
$ | 14,161 | ||||||||||||||||||||||||||
|
Issuance
of subsidiary shares to
|
||||||||||||||||||||||||||||
|
noncontrolling
interest
|
- | - | - | - | - | 3,157 | ||||||||||||||||||||||
|
Cash
dividends declared ($.59 per share)
|
- | - | - | (6,682 | ) | - | - | |||||||||||||||||||||
|
Stock
options exercised
|
85 | - | 596 | - | - | - | ||||||||||||||||||||||
|
Issuance
of restricted stock
|
12 | - | (12 | ) | - | - | - | |||||||||||||||||||||
|
Stock-based
compensation expense
|
- | - | 877 | - | - | - | ||||||||||||||||||||||
|
Income
tax benefit from stock options exercised and vesting of restricted
stock
|
- | - | 124 | - | - | - | ||||||||||||||||||||||
|
Shares
purchased and retired
|
(117 | ) | - | - | (2,515 | ) | - | - | ||||||||||||||||||||
|
Balance,
December 31, 2009
|
$ | 11,333 | $ | - | $ | 16,788 | $ | 146,241 | $ | (10,066 | ) | $ | 4,047 | |||||||||||||||
The
accompanying notes to consolidated financial statements are an integral part of
these financial statements.
|
2009
|
2008
|
2007
|
||||||||||
|
(Dollars
in thousands)
|
||||||||||||
|
CASH
FLOWS FROM OPERATING ACTIVITIES:
|
||||||||||||
|
Net
Earnings
|
$ | 13,070 | $ | 17,025 | $ | 22,901 | ||||||
|
Adjustments
to reconcile net earnings to net cash provided by operating activities
-
|
||||||||||||
|
Depreciation
|
2,948 | 2,631 | 2,484 | |||||||||
|
Amortization
|
93 | 114 | 90 | |||||||||
|
Deferred
income taxes
|
(18 | ) | 436 | 80 | ||||||||
|
Stock-based
compensation
|
877 | 609 | 316 | |||||||||
|
Net
foreign currency transaction (gains) losses
|
(1,339 | ) | - | - | ||||||||
|
Impairment
of property, plant and equipment
|
1,110 | - | - | |||||||||
|
Pension
contribution
|
(1,000 | ) | (1,000 | ) | - | |||||||
|
Pension
expense
|
2,986 | 1,378 | 1,359 | |||||||||
|
Net
losses (gains) on sale of assets
|
13 | 141 | (15 | ) | ||||||||
|
Increase
in cash surrender value of life insurance
|
(507 | ) | (566 | ) | (681 | ) | ||||||
|
Change
in operating assets and liabilities -
|
||||||||||||
|
Accounts
receivable
|
2,917 | 6,092 | (5,323 | ) | ||||||||
|
Inventories
|
15,758 | (2,380 | ) | 6,369 | ||||||||
|
Prepaids
and other current assets
|
(1,153 | ) | (348 | ) | (1,555 | ) | ||||||
|
Accounts
payable
|
(231 | ) | (3,047 | ) | (1,858 | ) | ||||||
|
Accrued
liabilities and other
|
(1,089 | ) | (2,400 | ) | (685 | ) | ||||||
|
Accrued
income taxes
|
3,467 | (2,941 | ) | 670 | ||||||||
|
Net
cash provided by operating activities
|
37,902 | 15,744 | 24,152 | |||||||||
|
CASH
FLOWS FROM INVESTING ACTIVITIES:
|
||||||||||||
|
Acquisition
of businesses
|
(9,320 | ) | - | - | ||||||||
|
Life
insurance premiums paid
|
(155 | ) | (155 | ) | - | |||||||
|
Purchase
of marketable securities
|
(8,073 | ) | (3,069 | ) | (8,406 | ) | ||||||
|
Proceeds
from maturities of marketable securities
|
7,273 | 5,820 | 1,343 | |||||||||
|
Purchase
of property, plant and equipment
|
(1,318 | ) | (2,178 | ) | (2,727 | ) | ||||||
|
Proceeds
from sales of property, plant and equipment
|
2 | 4 | 77 | |||||||||
|
Net
cash (used for) provided by investing activities
|
(11,591 | ) | 422 | (9,713 | ) | |||||||
|
CASH
FLOWS FROM FINANCING ACTIVITIES:
|
||||||||||||
|
Cash
received from noncontrolling interest
|
1,314 | - | - | |||||||||
|
Cash
dividends paid
|
(6,578 | ) | (5,738 | ) | (4,656 | ) | ||||||
|
Shares
purchased and retired
|
(2,633 | ) | (11,539 | ) | (9,924 | ) | ||||||
|
Proceeds
from stock options exercised
|
683 | 2,191 | 1,853 | |||||||||
|
Net
(repayments) borrowings under revolving credit agreement
|
(1,250 | ) | 700 | (10,408 | ) | |||||||
|
Income
tax benefits from share-based compensation
|
124 | 1,847 | 1,241 | |||||||||
|
Net
cash used for financing activities
|
(8,340 | ) | (12,539 | ) | (21,894 | ) | ||||||
|
Effect
of exchange rate changes on cash
|
543 | - | - | |||||||||
|
Net
increase (decrease) in cash and cash equivalents
|
$ | 18,514 | $ | 3,627 | $ | (7,455 | ) | |||||
|
CASH
AND CASH EQUIVALENTS at beginning of year
|
11,486 | 7,859 | 15,314 | |||||||||
|
CASH
AND CASH EQUIVALENTS at end of year
|
$ | 30,000 | $ | 11,486 | $ | 7,859 | ||||||
|
SUPPLEMENTAL
CASH FLOW INFORMATION:
|
||||||||||||
|
Income
taxes paid, net of refunds
|
$ | 3,055 | $ | 9,996 | $ | 10,901 | ||||||
|
Interest
paid
|
$ | 28 | $ | 62 | $ | 400 | ||||||
The
accompanying notes to consolidated financial statements are an integral part of
these financial statements.
NOTES
TO CONSOLIDATED FINANCIAL STATEMENTS
Years
Ended December 31, 2009, 2008 and 2007
1. NATURE
OF OPERATIONS
Weyco
Group, Inc. is a distributor of men’s casual, dress and fashion
shoes. The Company’s principal brands include “Florsheim”, “Nunn
Bush” and “Stacy Adams.” Inventory is purchased from third-party
overseas manufacturers. The majority of foreign-sourced purchases are
denominated in U.S. dollars. In the North American wholesale segment
(“wholesale”), the Company’s products are sold to shoe specialty stores,
department stores and clothing retailers primarily in the United States and
Canada. The Company also has licensing agreements with third parties
who sell its branded apparel, accessories and specialty footwear in the United
States, as well as its footwear in Mexico and certain markets
overseas. Licensing revenues are included in the Company’s wholesale
division. As of December 31, 2009, the Company’s North American
retail segment (“retail”) consisted of 36 Company-owned retail stores in
the United States and an Internet business. Sales in retail outlets
are made directly to consumers by Company employees. The Company also
has other wholesale and retail businesses overseas (“other”) which includes the
recently acquired businesses in Australia, South Africa, and Asia Pacific (see
Note 3), and its wholesale and retail businesses in Europe. In
conjunction with the acquisition, the Company reorganized its internal reporting
structure and as such, recast its reportable segments (see Note
15). Accordingly, all prior period amounts have been restated to
conform to the current presentation.
2. SUMMARY
OF SIGNIFICANT ACCOUNTING POLICIES
Principles of
Consolidation
- The consolidated financial
statements are prepared in conformity with accounting principles generally
accepted in the United States of America, and include all of the Company’s
majority-owned subsidiaries.
Use of
Estimates
- The preparation of financial statements
in conformity with accounting principles generally accepted in the United States
of America requires management to make estimates and assumptions that affect the
reported amounts of assets and liabilities and disclosure of contingent assets
and liabilities at the date of the financial statements and the reported amounts
of revenues and expenses during the reported periods. Actual results
could differ from those estimates.
Cash and Cash
Equivalents
- The Company considers all highly
liquid investments with maturities of three months or less at the date of
purchase to be cash equivalents. At December 31, 2009 and 2008, the
Company’s cash and cash equivalents included investments in money market
accounts and cash deposits at various banks.
Inventories
- Inventories
are valued at cost, which is not in excess of market. The majority of
inventories are determined on a last-in, first-out (LIFO)
basis. Inventory costs include the cost of shoes purchased from
third-party manufacturers, as well as related freight and duty
costs. The Company takes title to product at the time of shipping.
See Note 6.
Property, Plant and Equipment and
Depreciation
- Property, plant and equipment are
stated at cost. Plant and equipment are depreciated using primarily
the straight-line method over their estimated useful lives as follows: buildings
and improvements, 10 to 39 years; machinery and equipment, 3 to 10 years;
furniture and fixtures, 5 to 7 years.
Impairment of Long-Lived
Assets
- Property, plant and equipment are reviewed
for impairment in accordance with ASC 360,
Property, Plant and Equipment
at least annually or more frequently if events or changes in circumstances
indicate that the carrying amount may not be
recoverable. Recoverability of assets is measured by a
comparison of the carrying amount of an asset to its related estimated
undiscounted future cash flows. If the sum of the expected
undiscounted cash flows is less than the carrying value of the related asset or
group of assets, a loss is recognized for the difference between the fair value
and carrying value of the asset or group of assets. To derive the
fair value, the Company utilizes the income approach and the fair value
determined is categorized as Level 3 in the fair value hierarchy. The
fair value of each asset group is determined using the estimated future cash
flows discounted at an estimated weighted-average cost of
capital. For purposes of the impairment review, the Company groups
assets at the lowest level for which identifiable cash flows are largely
independent of the cash flows of other assets and liabilities. In
2009, in conjunction with the Company’s impairment review, the Company’s retail
segment recognized an impairment charge of $1.1 million which was recorded
within selling and administrative expenses in the Consolidated Statements of
Earnings. In fiscal 2008 and 2007, there were no adjustments to the
carrying value of any of the Company’s property, plant and
equipment.
The
Company’s trademark intangible asset has an indefinite useful life and is tested
for impairment annually on December 31 in accordance with Accounting Standards
Codification (ASC)
350
, Intangibles –Goodwill and
Other
. The Company uses a discounted cash flow methodology to
determine the fair value of the trademark, and a loss would be recognized if the
carrying value exceeded the fair value. In fiscal 2009, 2008 and
2007, there were no adjustments to the carrying value of the Company’s
indefinite lived assets.
Income
Taxes
- Deferred income taxes are provided on
temporary differences arising from differences in the basis of assets and
liabilities for income tax and financial reporting purposes. See Note
11.
Noncontrolling
Interest -
The Company’s noncontrolling interest is
accounted for under ASC 810,
Consolidation
and represents
the minority shareholders’ ownership interest related to the Company’s wholesale
and retail businesses in Australia, South Africa and Asia
Pacific. See Note 3. In accordance with ASC 810, the
Company reports its noncontrolling interest in subsidiaries as a separate
component of equity in the Consolidated Balance Sheets and reports both net
earnings attributable to the noncontrolling interest and net earnings
attributable to the Company’s common shareholders on the face of the
Consolidated Statements of Earnings.
Revenue
Recognition
- Revenue from the sale of product is
recognized when title and risk of loss transfers to the customer and the
customer is obligated to pay the Company. Sales to independent
dealers are recorded at the time of shipment to those dealers. Sales
through Company-owned retail outlets are recorded at the time of delivery to
retail customers. All product sales are recorded net of estimated
allowances for returns and discounts. The Company’s estimates of
allowances for returns and discounts are based on such factors as specific
customer situations, historical experience, and current and expected economic
conditions. The Company evaluates the reserves and the estimation
process and makes adjustments when appropriate. Revenue from
third-party licensing agreements is recognized in the period
earned. Licensing revenues were $2.7 million in 2009, $4.3 million in
2008 and $4.1 million in 2007.
Shipping and Handling
Fees
- The Company classifies shipping and handling
fees billed to customers as revenues. The related shipping and
handling expenses incurred by the Company are included in selling and
administrative expenses and totaled $1.4 million for each of 2009, 2008 and
2007.
Cost of Sales
–
The Company’s cost of sales
includes the cost of products and inbound freight and duty costs.
Selling and Administrative
Expenses
-
Selling
and administrative expenses primarily include salaries and commissions,
advertising costs, employee benefit costs, distribution costs (e.g., receiving,
inspection and warehousing costs), rent and
depreciation. Distribution costs included in selling and
administrative expenses in 2009, 2008 and 2007 were $7.9 million, $7.4 million
and $7.1 million, respectively.
Advertising
Costs
- Advertising costs are expensed as
incurred. Total advertising costs were $8.2 million, $7.5 million and
$7.6 million in 2009, 2008 and 2007, respectively. All advertising
expenses are included in selling and administrative expenses with the exception
of co-op advertising expenses which are recorded as a reduction of net sales.
Co-op advertising expenses, which are included in the above totals, reduced net
sales by $4.2 million, $3.4 million and $3.0 million for 2009, 2008 and 2007,
respectively.
Foreign Currency
Translation
- The Company accounts for currency
translation in accordance with ASC 830,
Foreign Currency Matters
under which non-U.S. subsidiaries’ balance sheet accounts are translated
into U.S. dollars at the rates of exchange in effect at fiscal year end and
income and expense accounts are translated at the weighted average rates of
exchange in effect during the year. Translation adjustments resulting
from this process are recognized as a separate component of accumulated other
comprehensive loss, which is a component of equity.
Foreign Currency Transactions -
Gains and losses from foreign currency transactions are included in other
income and expense, net, in the Consolidated Statements of
Earnings. Net foreign currency transaction gains totaled
approximately $1.3 million in 2009. In 2008 and 2007, there were no
material foreign currency transaction gains or losses.
Earnings Per
Share
- Basic earnings per share excludes any
dilutive effects of options to purchase common stock. Diluted
earnings per share includes any dilutive effects of options to purchase common
stock. See Note 14.
Comprehensive
Income
- Comprehensive income includes net earnings
and changes in accumulated other comprehensive income (loss). The
Company has chosen to report comprehensive income and accumulated other
comprehensive income (loss) in the Consolidated Statements of
Equity. The components of accumulated other comprehensive loss as
recorded on the accompanying Consolidated Balance Sheets were as
follows:
|
2009
|
2008
|
|||||||
|
(Dollars
in thousands)
|
||||||||
|
Foreign
currency translation adjustments
|
$ | 1,121 | $ | (319 | ) | |||
|
Pension
liability, net of tax
|
(11,187 | ) | (10,197 | ) | ||||
|
Total
accumulated other comprehensive loss
|
$ | (10,066 | ) | $ | (10,516 | ) | ||
The
noncontrolling interest as recorded on the Consolidated Balance Sheets at
December 31, 2009 included foreign currency translation adjustments of
$641,000.
Stock-Based
Compensation -
At December 31, 2009, the Company
has two stock-based employee compensation plans, which are described more fully
in Note 16. The Company accounts for these plans under the
recognition and measurement principles of ASC 718,
Compensation – Stock
Compensation
.
Concentration of Credit Risk
- The Company had one individual customer accounts receivable
balance outstanding that represented 17% and 16% of the Company’s gross accounts
receivable balance at December 31, 2009 and 2008,
respectively. During 2009, 2008 and 2007, this customer represented
13%, 14% and 12% of the Company’s net sales, respectively.
Recent Accounting
Pronouncements
– In December 2007, the Financial
Accounting Standards Board (FASB) issued accounting guidance updating ASC 805,
Business Combinations
and ASC 810,
Consolidation
. The
new guidance requires an acquirer to recognize the assets acquired, the
liabilities assumed, and any noncontrolling interest in the acquiree at the
acquisition date, at their fair values as of that date. Additionally,
acquisition-related transaction and restructuring costs under the new rules are
to be expensed rather than treated as acquisition costs and included in the
amount recorded for assets acquired. The new standard on noncontrolling
interests requires that the Company report noncontrolling interests in
subsidiaries as a separate component of equity in the consolidated financial
statements and report both net earnings attributable to noncontrolling interests
and net earnings attributable to the Company’s common shareholders on the face
of the Consolidated Statements of Earnings. These new accounting
standards were effective for the Company on January 1,
2009. Accordingly, the Company’s January 2009 majority interest
acquisition of its Australia, Asia Pacific and South Africa licensees were
accounted for under these new standards in 2009. See Note
3.
In June
2009, the FASB issued further new accounting guidance under ASC 810,
Consolidation
which
introduces a requirement to perform ongoing assessments to determine whether an
entity is a variable interest entity and whether an enterprise is the primary
beneficiary of a variable interest entity. This guidance will be
effective for the Company beginning January 1, 2010. The
implementation of this standard will not have a material impact on the Company’s
consolidated financial statements.
In
February 2008, the FASB issued authoritative guidance to ASC 820,
Fair Value Measurements and
Disclosures
which provided a one year deferral of the effective date of
the fair value guidance for all nonfinancial assets and nonfinancial
liabilities, except those recognized or disclosed at fair value in the financial
statements on a recurring basis. The Company adopted the provisions
of this fair value guidance for nonfinancial assets and nonfinancial liabilities
on January 1, 2009 and did not elect the fair value option for any of its
nonfinancial assets or nonfinancial liabilities. Accordingly, the
adoption had no impact to the Company’s earnings, financial position or cash
flows. See Note 4.
In April
2009, the FASB issued new authoritative accounting guidance under ASC 320,
Investments – Debt and Equity
Securities
which changes the method for determining whether an
other-than-temporary impairment exists for debt securities and the amount of the
impairment to be recorded in earnings. The Company adopted this
guidance in 2009, and the adoption of this standard did not have a material
impact on the Company’s consolidated financial statements.
In May
2009, the FASB issued ASC 855,
Subsequent Events
which
requires entities to evaluate subsequent events through the date financial
statements are issued. It defines two types of subsequent events:
recognized subsequent events, which provide additional evidence about conditions
that existed at the balance sheet date, and non-recognized subsequent events,
which provide evidence about conditions that did not exist at the balance sheet
date, but arose before the consolidated financial statements were
issued. Recognized subsequent events are required to be recognized in
the consolidated financial statements, and non-recognized subsequent events are
required to be disclosed. The Company adopted ASC 855 upon
issuance. This standard had no impact on the Company’s earnings,
financial position or cash flows. See Note 19.
3. ACQUISITION
In
January 2009, the Company acquired a majority interest in a new subsidiary,
Florsheim Australia Pty Ltd (“Florsheim Australia”), which subsequently
purchased the Florsheim wholesale and retail businesses in Australia, South
Africa and Asia Pacific. The vast majority of this business is
conducted under the Florsheim name, with a small amount of business under the
Stacy Adams and Nunn Bush brand names. These businesses were
previously licensed by the Company to a third party, from whom the Company had
collected approximately $1 million of royalty income annually.
On
January 20, 2009, the Company contributed $3.5 million for a majority interest
in the newly formed entity, Florsheim Australia. The noncontrolling
party contributed $1.3 million in cash and $1.9 million of non-cash
consideration to the entity.
On
January 23, 2009, Florsheim Australia acquired the operating assets and certain
liabilities related to the Florsheim business from Figgins Holdings Pty Ltd, the
former Australian licensee, and acquired the stock of Florsheim South Africa Pty
Ltd and Florsheim Asia Pacific Ltd, the Company’s other licensees, for total
consideration of approximately $9.3 million. Florsheim Australia
financed the acquisition with cash generated from the aforementioned equity
contributions and proceeds from intercompany loans from the
Company. The acquisition included both wholesale and retail
businesses, with 24 Florsheim retail stores in Australia, one Florsheim retail
store in New Zealand and one retail store in Macau. The acquisition
has been accounted for in these financial statements as a business combination
under ASC 805,
Business
Combinations
and the noncontrolling interest has been accounted for and
reported in accordance with ASC 810,
Consolidation
. Accordingly,
the allocation of total consideration transferred was completed during 2009 and
was as follows: accounts receivable, $4.7 million; inventory, $7.0 million;
fixed assets, $1.2 million; and other assets and liabilities, net, ($3.6)
million. There were no material intangible assets related to this
acquisition. The consolidated financial statements of Florsheim
Australia for the period of January 23 through December 31, 2009 have been
included in the Company’s consolidated financial
statements. Acquisition costs of $400,000 were expensed and included
in selling and administrative expenses in 2009. Additional
disclosures prescribed by ASC 805 have not been provided as the acquisition was
not material to the Company’s consolidated financial statements.
4.FAIR
VALUE OF FINANCIAL INSTRUMENTS
On
January 1, 2008, the Company adopted the FASB’s updated accounting standards to
ASC 820,
Fair Value
Measurements and Disclosures
, which provides a single definition of fair
value and a common framework for measuring fair value, as well as new disclosure
requirements for fair value measurements used in financial
statements. ASC 820 is applicable whenever another accounting
pronouncement requires or permits assets and liabilities to be measured at fair
value, but does not require any new fair value measurements. The ASC
820 requirements for certain nonfinancial assets and nonfinancial liabilities
were deferred until January 1, 2009 for the Company. See Note
2. Although the implementation of ASC 820 had no impact on the
Company’s consolidated financial statements as of December 31, 2009, it does
result in expanded disclosures regarding fair value measurements as discussed
below and in Notes 5 and 10. ASC 820 establishes a three-level
hierarchy for fair value measurements based upon the sources of data and
assumptions used to develop the fair value measurements. The three
hierarchy levels are broken down as follows:
Level 1 -
unadjusted quoted market prices in active markets for identical assets or
liabilities that are publicly accessible.
Level 2 -
quoted prices for similar assets or liabilities in active markets, quoted prices
for identical or similar assets or liabilities in markets that are not active
and inputs (other than quoted prices) that are observable for the asset or
liability, either directly or indirectly.
Level 3 -
unobservable inputs that reflect the Company’s assumptions, consistent with
reasonably available assumptions made by other market participants.
The
carrying amounts of all short-term financial instruments, except marketable
securities, approximate fair value due to the short-term nature of those
instruments. Marketable securities are carried at amortized cost. The
fair value disclosures of marketable securities are Level 2 valuations as
defined by ASC 820, consisting of quoted prices for identical or similar assets
in markets that are not active. See Note 5.
5. INVESTMENTS
All of
the Company’s investments are classified as held-to-maturity securities and
reported at amortized cost pursuant to ASC 320,
Investments – Debt and Equity
Securities
as the Company has the intent and ability to hold all security
investments to maturity.
Below is
a summary of the amortized cost and estimated market values of investment
securities as of December 31, 2009 and 2008. The estimated market
values provided are Level 2 valuations as defined by ASC 820. See
Note 4.
|
2009
|
2008
|
|||||||||||||||
|
Amortized
Cost
|
Market
Value
|
Amortized
Cost
|
Market
Value
|
|||||||||||||
|
(Dollars in thousands)
|
||||||||||||||||
|
Municipal
bonds:
|
||||||||||||||||
|
Current
|
$ | 3,954 | $ | 4,005 | $ | 6,623 | $ | 6,667 | ||||||||
|
Due
from one through five years
|
28,227 | 29,438 | 24,020 | 24,072 | ||||||||||||
|
Due
from six through ten years
|
14,596 | 15,105 | 15,427 | 15,486 | ||||||||||||
|
Total
|
$ | 46,777 | $ | 48,548 | $ | 46,070 | $ | 46,225 | ||||||||
The
unrealized gains and losses on investment securities at December 31, 2009 and
2008 were:
|
2009
|
2008
|
|||||||||||||||
|
Unrealized
Gains
|
Unrealized
Losses
|
Unrealized
Gains
|
Unrealized
Losses
|
|||||||||||||
|
(Dollars in thousands)
|
||||||||||||||||
|
Municipal
bonds
|
$ | 1,798 | $ | 27 | $ | 523 | $ | 368 | ||||||||
The
Company has reviewed its portfolio of investments as of December 31, 2009 and
has determined that no other-than-temporary market value impairment
exists.
6. INVENTORIES
At
December 31, 2009 and 2008, inventories consisted of:
|
2009
|
2008
|
|||||||
|
(Dollars
in thousands)
|
||||||||
|
Finished
shoes
|
$ | 55,138 | $ | 61,955 | ||||
|
LIFO
reserve
|
(14,775 | ) | (14,943 | ) | ||||
|
Total
inventories
|
$ | 40,363 | $ | 47,012 | ||||
Finished
shoes included inventory in-transit of $11.3 million and $13.6 million as of
December 31, 2009 and 2008, respectively. At December 31, 2009,
approximately 85% of the Company’s inventories were valued by the LIFO method of
accounting while approximately 15% were valued by the FIFO method of
accounting. At December 31, 2008, all of the Company’s inventories
were valued by the LIFO method of accounting. During 2009 inventory
quantities were reduced, which resulted in the liquidation of LIFO
inventory quantities carried at higher costs prevailing in prior years as
compared with the cost of fiscal 2009 purchases. The effect of the
liquidation increased cost of goods sold by $745,000 during 2009. In
both 2008 and 2007, there were liquidations of LIFO inventory quantities which
resulted in immaterial decreases in cost of goods sold during those
years.
7.
PROPERTY, PLANT AND EQUIPMENT, NET
At
December 31, 2009 and 2008, property, plant and equipment consisted
of:
|
2009
|
2008
|
|||||||
|
(Dollars
in thousands)
|
||||||||
|
Land
and land improvements
|
$ | 2,693 | $ | 2,693 | ||||
|
Buildings
and improvements
|
19,719 | 19,719 | ||||||
|
Machinery
and equipment
|
17,169 | 16,766 | ||||||
|
Retail
fixtures and leasehold improvements
|
10,042 | 9,478 | ||||||
|
Property,
plant and equipment
|
49,623 | 48,656 | ||||||
|
Less:
Accumulated depreciation
|
(22,751 | ) | (20,613 | ) | ||||
|
Property,
plant and equipment, net
|
$ | 26,872 | $ | 28,043 | ||||
8. OTHER
ASSETS
Other
assets included the following amounts at December 31, 2009 and
2008:
|
2009
|
2008
|
|||||||
|
(Dollars
in thousands)
|
||||||||
|
Cash
surrender value of life insurance
|
10,701 | 10,039 | ||||||
|
Other
|
2,369 | 30 | ||||||
|
Total
other assets
|
$ | 13,070 | $ | 10,069 | ||||
9. SHORT-TERM
BORROWINGS
At
December 31, 2009, the Company had a 364-day $50 million unsecured revolving
line of credit with a bank expiring April 30, 2010. The line of
credit allows for the issuance of up to $25 million in non-rated commercial
paper at market interest rates and additional bank borrowings at a rate of LIBOR
plus 200 basis points. The line of credit includes a minimum net
worth covenant. As of December 31, 2009, the Company was in
compliance with the covenant. The Company had no outstanding
borrowings under the line of credit at December 31, 2009. At
December 31, 2008, outstanding borrowings under a prior $50 million line of
credit were $1.25 million with an average interest rate of 2.29%.
10. EMPLOYEE
RETIREMENT PLANS
The
Company has a defined benefit pension plan covering substantially all employees,
as well as an unfunded supplemental pension plan for key
executives. Retirement benefits are provided based on employees’
years of credited service and average earnings or stated amounts for years of
service. Normal retirement age is 65 with provisions for earlier
retirement. The plan also has provisions for disability and death
benefits. The Company’s funding policy for the defined benefit
pension plan is to make contributions to the plan such that all employees’
benefits will be fully provided by the time they retire. Plan assets
are stated at market value and consist primarily of equity securities and fixed
income securities, mainly U.S. government and corporate
obligations.
The
Company follows ASC 715,
Compensation – Retirement Benefits
which requires employers to recognize the funded status of defined
benefit pension and other postretirement benefit plans as an asset or liability
in its statement of financial position and to recognize changes in the funded
status in the year in which the changes occur as a component of comprehensive
income. In addition, ASC 715 requires employers to measure the funded
status of its plans as of the date of its yearend statement of financial
position. ASC 715 also requires additional disclosures regarding
amounts included in accumulated other comprehensive income (loss).
The
Company has historically and will continue to use a yearend measurement date for
all of its pension plans.
The
Company’s pension plan’s weighted average asset allocation at December 31, 2009
and 2008, by asset category, was as follows:
|
Plan Assets at December 31,
|
||||||||
|
2009
|
2008
|
|||||||
|
Asset
Category:
|
||||||||
|
Equity
Securities
|
48 | % | 44 | % | ||||
|
Fixed
Income Securities
|
40 | % | 44 | % | ||||
|
Other
|
12 | % | 12 | % | ||||
|
Total
|
100 | % | 100 | % | ||||
The
Company has a Retirement Plan Committee, consisting of the Chief Executive
Officer, Chief Operating Officer and Chief Financial Officer, to manage the
operations and administration of all benefit plans and related
trusts. The committee has an investment policy for the pension plan
assets that establishes target asset allocation ranges for the above listed
asset classes as follows: equity securities: 20% - 80%; fixed income
securities: 20% - 80%; and other, principally cash: 0% - 20%. On a
semi-annual basis, the committee reviews progress towards achieving the pension
plan’s performance objectives.
To
develop the expected long-term rate of return on assets assumption, the Company
considered the historical returns and the future expectations for returns for
each asset class, as well as the target asset allocation of the pension
portfolio. This resulted in the selection of the 8.0% long-term rate
of return on assets assumption.
Assumptions
used in determining the funded status at December 31, 2009 and 2008
were:
|
2009
|
2008
|
|||||||
|
Discount
rate
|
5.95 | % | 6.20 | % | ||||
|
Rate
of compensation increase
|
4.5 | % | 4.5 | % | ||||
The
following is a reconciliation of the change in benefit obligation and plan
assets of both the defined benefit pension plan and the unfunded supplemental
pension plan for the years ended December 31, 2009 and 2008:
|
Defined Benefit Pension Plan
|
Supplemental Pension Plan
|
|||||||||||||||
|
2009
|
2008
|
2009
|
2008
|
|||||||||||||
|
(Dollars in thousands)
|
||||||||||||||||
|
Change
in projected benefit obligation
|
||||||||||||||||
|
Projected
benefit obligation, beginning of year
|
$ | 28,480 | $ | 25,944 | $ | 7,052 | $ | 6,369 | ||||||||
|
Service
cost
|
861 | 717 | 168 | 142 | ||||||||||||
|
Interest
cost
|
1,714 | 1,645 | 427 | 407 | ||||||||||||
|
Actuarial
(gain) loss
|
2,364 | 1,587 | 2,772 | 343 | ||||||||||||
|
Benefits
paid
|
(1,461 | ) | (1,413 | ) | (179 | ) | (209 | ) | ||||||||
|
Projected
benefit obligation, end of year
|
$ | 31,958 | $ | 28,480 | $ | 10,240 | $ | 7,052 | ||||||||
|
Change
in plan assets
|
||||||||||||||||
|
Fair
value of plan assets, beginning of year
|
20,021 | 26,007 | - | - | ||||||||||||
|
Actual
return on plan assets
|
3,748 | (5,522 | ) | - | - | |||||||||||
|
Administrative
expenses
|
(50 | ) | (50 | ) | - | - | ||||||||||
|
Contributions
|
1,000 | 1,000 | 179 | 209 | ||||||||||||
|
Benefits
paid
|
(1,461 | ) | (1,413 | ) | (179 | ) | (209 | ) | ||||||||
|
Fair
value of plan assets, end of year
|
$ | 23,258 | $ | 20,022 | $ | - | $ | - | ||||||||
|
Funded
status of plan
|
$ | (8,700 | ) | $ | (8,458 | ) | $ | (10,240 | ) | $ | (7,052 | ) | ||||
|
Amounts
recognized in the balance sheets consist of:
|
||||||||||||||||
|
Other
assets
|
$ | - | $ | - | $ | - | $ | - | ||||||||
|
Accrued
liabilities - other
|
- | - | (407 | ) | (350 | ) | ||||||||||
|
Long-term
pension liability
|
(8,700 | ) | (8,458 | ) | (9,833 | ) | (6,702 | ) | ||||||||
|
Net
amount recognized
|
$ | (8,700 | ) | $ | (8,458 | ) | $ | (10,240 | ) | $ | (7,052 | ) | ||||
|
Amounts
recognized in accumulated other comprehensive loss consist
of:
|
||||||||||||||||
|
Accumulated
loss, net of income tax benefit of $5,170, $5,529, $1,812 and $781,
respectively
|
$ | 8,086 | $ | 8,648 | $ | 2,835 | $ | 1,222 | ||||||||
|
Prior
service cost, net of income tax benefit of $15, $29, $155 and $180,
respectively
|
23 | 46 | 243 | 281 | ||||||||||||
|
Net
amount recognized
|
$ | 8,109 | $ | 8,694 | $ | 3,078 | $ | 1,503 | ||||||||
The
accumulated benefit obligation for the defined benefit pension plan and the
supplemental pension plan was $27.9 million and $8.3 million, respectively, at
December 31, 2009 and $25.3 million and $6.1 million, respectively, at December
31, 2008.
Assumptions
used in determining net periodic pension cost for the years ended December 31,
2009, 2008 and 2007 were:
|
2009
|
2008
|
2007
|
||||||||||
|
Discount
rate
|
6.20 | % | 6.55 | % | 5.90 | % | ||||||
|
Rate
of compensation increase
|
4.5 | % | 4.5 | % | 4.5 | % | ||||||
|
Long-term
rate of return on plan assets
|
8.0 | % | 8.0 | % | 8.0 | % | ||||||
The
components of net periodic pension cost for the years ended December 31, 2009,
2008 and 2007, were:
|
2009
|
2008
|
2007
|
||||||||||
|
(Dollars
in thousands)
|
||||||||||||
|
Benefits
earned during the period
|
$ | 1,030 | $ | 859 | $ | 882 | ||||||
|
Interest
cost on projected benefit obligation
|
2,140 | 2,052 | 1,902 | |||||||||
|
Expected
return on plan assets
|
(1,531 | ) | (2,011 | ) | (2,053 | ) | ||||||
|
Net
amortization and deferral
|
1,347 | 478 | 628 | |||||||||
|
Net
pension expense
|
$ | 2,986 | $ | 1,378 | $ | 1,359 | ||||||
The
Company expects to recognize $1.4 million of amortization of unrecognized loss
and $100,000 of amortization of prior service cost as components of net periodic
benefit cost in 2010, which are included in accumulated other comprehensive loss
at December 31, 2009.
The
Company does not expect that a contribution to its defined benefit retirement
plan in 2010 will be required; however, any contribution would not be
material.
Projected
benefit payments for the plans as of December 31, 2009 were estimated as
follows:
|
Defined Benefit
Pension Plan
|
Supplemental
Pension Plan
|
|||||||
|
(Dollars in thousands)
|
||||||||
|
2010
|
$ | 1,682 | $ | 407 | ||||
|
2011
|
$ | 1,744 | $ | 406 | ||||
|
2012
|
$ | 1,774 | $ | 406 | ||||
|
2013
|
$ | 1,813 | $ | 406 | ||||
|
2014
|
$ | 1,867 | $ | 432 | ||||
|
2015-2019
|
$ | 10,232 | $ | 2,234 | ||||
The
following table summarizes the fair value of the Company’s pension plan assets
as of December 31, 2009 by asset category within the fair value hierarchy (for
further level information, see Note 4):
|
December
31, 2009
|
||||||||||||||||
|
Quoted Prices
|
Significant
|
Significant
|
||||||||||||||
|
in Active Markets
|
Observable Inputs
|
Unobservable Inputs
|
||||||||||||||
|
Level 1
|
Level 2
|
Level 3
|
Total
|
|||||||||||||
|
(Dollars
in thousands)
|
||||||||||||||||
|
Common
stocks
|
$ | 8,483 | $ | 526 | $ | - | $ | 9,009 | ||||||||
|
Preferred
stocks
|
811 | - | - | 811 | ||||||||||||
|
Exchange
traded funds
|
2,104 | - | - | 2,104 | ||||||||||||
|
Corporate
obligations
|
- | 4,184 | - | 4,184 | ||||||||||||
|
State
and municipal obligations
|
- | 497 | - | 497 | ||||||||||||
|
Foreign
obligations
|
- | 269 | - | 269 | ||||||||||||
|
Pooled
fixed income funds
|
739 | - | - | 739 | ||||||||||||
|
U.S.
government securities
|
- | 2,766 | - | 2,766 | ||||||||||||
|
Cash
and cash equivalents
|
2,790 | - | - | 2,790 | ||||||||||||
|
Subtotal
|
14,927 | 8,242 | - | 23,169 | ||||||||||||
|
Other
assets (1)
|
89 | |||||||||||||||
|
Total
|
$ | 23,258 | ||||||||||||||
(1) This
category represents trust receivables that are not leveled.
The
Company also has a defined contribution plan covering substantially all
employees. The Company contributed approximately $200,000 to the plan
in 2009, 2008 and 2007.
11. INCOME
TAXES
The
provision for income taxes included the following components at December 31,
2009, 2008 and 2007:
|
2009
|
2008
|
2007
|
||||||||||
|
(Dollars
in thousands)
|
||||||||||||
|
Current:
|
||||||||||||
|
Federal
|
$ | 5,313 | $ | 6,872 | $ | 10,640 | ||||||
|
State
|
946 | 1,192 | 1,700 | |||||||||
|
Foreign
|
699 | 907 | 642 | |||||||||
|
Total
|
6,958 | 8,971 | 12,982 | |||||||||
|
Deferred
|
(18 | ) | 436 | 80 | ||||||||
|
Total
provision
|
$ | 6,940 | $ | 9,407 | $ | 13,062 | ||||||
The
differences between the U.S. federal statutory income tax rate and the Company’s
effective tax rate were as follows for the years ended December 31, 2009, 2008
and 2007:
|
2009
|
2008
|
2007
|
||||||||||
|
U.S.
federal statutory income tax rate
|
35.0 | % | 35.0 | % | 35.0 | % | ||||||
|
State
income taxes, net of federal tax benefit
|
3.1 | 2.9 | 3.0 | |||||||||
|
Non-taxable
municipal bond interest
|
(3.1 | ) | (2.5 | ) | (1.8 | ) | ||||||
|
Other
|
(0.3 | ) | 0.2 | 0.1 | ||||||||
|
Effective
tax rate
|
34.7 | % | 35.6 | % | 36.3 | % | ||||||
The
foreign component of pretax net earnings was $2.3 million, $2.7 million and $2.6
million for 2009, 2008 and 2007, respectively. The Company has no
intentions of repatriating any unremitted foreign earnings.
The
components of deferred taxes as of December 31, 2009 and 2008, were as
follows:
|
2009
|
2008
|
|||||||
|
(Dollars
in thousands)
|
||||||||
|
Deferred
tax benefits:
|
||||||||
|
Accounts
receivable reserves
|
$ | 438 | $ | 499 | ||||
|
Pension
liability
|
7,387 | 6,049 | ||||||
|
Accrued
liabilities
|
1,225 | 1,876 | ||||||
| 9,050 | 8,424 | |||||||
|
Deferred
tax liabilities:
|
||||||||
|
Inventory
and related reserves
|
(1,754 | ) | (1,340 | ) | ||||
|
Cash
value of life insurance
|
(2,414 | ) | (2,216 | ) | ||||
|
Property,
plant and equipment
|
(849 | ) | (1,702 | ) | ||||
|
Trademark
|
(1,835 | ) | (1,593 | ) | ||||
|
Prepaid
and other assets
|
(232 | ) | (258 | ) | ||||
| (7,084 | ) | (7,109 | ) | |||||
|
Net
deferred income tax benefits
|
$ | 1,966 | $ | 1,315 | ||||
The net
deferred tax benefit is classified in the Consolidated Balance Sheets as
follows:
|
2009
|
2008
|
|||||||
|
(Dollars
in thousands)
|
||||||||
|
Current
deferred income tax (liabilities) benefits
|
$ | (295 | ) | $ | 579 | |||
|
Noncurrent
deferred income tax benefits
|
2,261 | 736 | ||||||
| $ | 1,966 | $ | 1,315 | |||||
Uncertain
Tax Positions
On
January 1, 2007 the Company adopted the FASB’s authoritative guidance related to
accounting and disclosures for uncertainty in tax positions within ASC 740,
Income
Taxes
. ASC 740 provides that the tax effects from an uncertain
tax position can be recognized in the Company’s financial statements only if the
position is more likely than not of being sustained on audit, based on the
technical merits of the position. As a result of applying the
provisions of ASC 740, the Company recognized a decrease of $27,000 in Accrued
Income Taxes and a corresponding adjustment to the beginning balance of retained
earnings on the balance sheet as of January 1, 2007.
The
following table summarizes the activity related to the Company’s unrecognized
tax benefits:
|
(Dollars
in thousands)
|
||||
|
Balance
at January 1, 2007
|
$ | 212 | ||
|
Increases
related to current year tax positions
|
125 | |||
|
Expiration
of the statute of limitations for the assessment of taxes
|
(16 | ) | ||
|
Balance
at December 31, 2007
|
$ | 321 | ||
|
Increases
related to current year tax positions
|
70 | |||
|
Expiration
of the statute of limitations for the assessment of taxes
|
(16 | ) | ||
|
Balance
at December 31, 2008
|
$ | 375 | ||
|
Increases
related to current year tax positions
|
92 | |||
|
Expiration
of the statute of limitations for the assessment of taxes
|
(18 | ) | ||
|
Balance
at December 31, 2009
|
$ | 449 | ||
The
Company had unrecognized tax benefits of $449,000 and $375,000 at December 31,
2009 and 2008, respectively, all of which, if recognized, would reduce the
Company’s annual effective tax rate. The Company also accrued
potential interest related to these unrecognized tax benefits of $9,000 during
2009 and $7,000 and $20,000 of potential penalties and interest, respectively
during 2008. Included in the Company’s consolidated balance sheet at December
31, 2009, was a liability for potential penalties and interest of $20,000 and
$51,000, respectively. Included in the Company’s consolidated balance
sheet at December 31, 2008, was a liability for potential penalties and interest
of $20,000 and $42,000, respectively. It is reasonably possible that
certain U.S. tax examinations will conclude within the next 12
months. However, it is not possible to reasonably estimate the effect
this may have upon the unrecognized tax benefits.
The
Company files a U.S. federal income tax return, various U.S. state income tax
returns and several other foreign returns. In general, the 2005
through 2009 tax years remain subject to examination by those taxing
authorities.
12. COMMITMENTS
The
Company operates retail shoe stores under both short-term and long-term leases.
Leases provide for a minimum rental plus percentage rentals based upon sales in
excess of a specified amount. The Company also leases its
distribution facilities in Canada and overseas. Total minimum rents were $7.4
million in 2009, $4.6 million in 2008, and $4.2 million in
2007. Percentage rentals were $156,000 in 2009, $12,000 in 2008 and
$9,000 in 2007.
Future
fixed and minimum rental commitments required under operating leases that have
initial or remaining non-cancelable lease terms in excess of one year as of
December 31, 2009, are shown below. Renewal options exist for many
long-term leases.
|
(Dollars
in thousands)
|
||||
|
2010
|
$ | 7,458 | ||
|
2011
|
6,337 | |||
|
2012
|
5,898 | |||
|
2013
|
5,324 | |||
|
2014
|
4,674 | |||
|
Thereafter
|
7,130 | |||
|
Total
|
$ | 36,821 | ||
At
December 31, 2009, the Company also had purchase commitments of approximately
$39.6 million to purchase inventory, all of which were due in less than one
year.
.
13. EQUITY
Prior to
July 1, 2007, the Company had common stock and Class B common stock outstanding.
Each share of Class B common stock had 10 votes, could only be transferred to
certain permitted transferees, was convertible to one share of common stock at
the holder’s option and shared equally with the common stock in cash dividends
and liquidation rights. All outstanding shares of Class B common
stock converted into common stock on July 1, 2007.
In April
1998, the Company’s Board of Directors first authorized a stock repurchase
program to purchase shares of its common stock in open market transactions at
prevailing prices. In February 2009, the Company’s Board of Directors
extended the stock repurchase plan to cover the repurchase of an additional one
million shares. In 2009, the Company purchased 117,837 shares at a
total cost of $2.6 million; in 2008, the Company purchased 413,325 shares at a
total cost of $11.5 million; and in 2007, the Company purchased 378,740 shares
at a total cost of $9.9 million. At December 31, 2009, the Company
was authorized to purchase an additional 1.4 million shares under the
program.
14.
EARNINGS PER
SHARE
The
following table sets forth the computations of basic and diluted earnings per
share for the years ended December 31, 2009, 2008 and 2007:
|
2009
|
2008
|
2007
|
||||||||||
|
(In thousands, except per share amounts)
|
||||||||||||
|
Numerator:
|
||||||||||||
|
Net
earnings attributable to Weyco Group, Inc.
|
$ | 12,821 | $ | 17,025 | $ | 22,901 | ||||||
|
Denominator:
|
||||||||||||
|
Basic
weighted average shares outstanding
|
11,266 | 11,397 | 11,566 | |||||||||
|
Effect
of dilutive securities:
|
||||||||||||
|
Employee
stock-based awards
|
244 | 360 | 447 | |||||||||
|
Diluted
weighted average shares outstanding
|
11,510 | 11,757 | 12,013 | |||||||||
|
Basic
earnings per share
|
$ | 1.14 | $ | 1.49 | $ | 1.98 | ||||||
|
Diluted
earnings per share
|
$ | 1.11 | $ | 1.45 | $ | 1.91 | ||||||
Diluted
weighted average shares outstanding in 2009 exclude outstanding options to
purchase 244,850 shares of common stock at a weighted average price of
$29.16. Diluted weighted average shares outstanding in 2008 exclude
outstanding options to purchase 135,140 shares of common stock at a weighted
average price of $30.64. Diluted weighted average shares outstanding
for 2007 include all outstanding options to purchase common stock as none were
antidilutive.
15. SEGMENT
INFORMATION
In
conjunction with the acquisition of Florsheim Australia during the first quarter
of 2009 (see Note 3), the Company reorganized its internal reporting structure
and as such, recast its reportable segments. All prior period amounts
have been restated to conform to the current presentation.
The
Company has two reportable segments: North American wholesale operations
(“wholesale”) and North American retail operations (“retail”). The
chief operating decision maker, the Company’s Chief Executive Officer, evaluates
the performance of its segments based on earnings from operations and
accordingly, interest income, interest expense and other income or expense are
not allocated to the segments. The “other” category in the table
below includes the Company’s wholesale and retail operations in Australia, South
Africa, Asia Pacific and Europe, which do not meet the criteria for
separate reportable segment classification.
In the
wholesale segment, shoes are marketed through more than 10,000 shoe, clothing
and department stores, primarily in the United States and
Canada. Licensing revenues are also included in the Company’s
wholesale segment. The Company has licensing agreements with third
parties who sell its branded apparel, accessories and specialty footwear in the
United States, as well as its footwear in Mexico and certain markets
overseas. In 2009, 2008 and 2007, sales to the Company’s largest
customer were 13%, 14% and 12%, respectively, of total sales.
In the
retail segment, the Company operates 36 Company-owned stores in principal cities
in the United States and an Internet business. Sales in retail
outlets are made directly to the consumer by Company employees. In
addition to the sale of the Company’s brands of footwear in these retail
outlets, other branded footwear and accessories are also sold in order to
provide the consumer with as complete a selection as practically
possible.
The
accounting policies of the segments are the same as those described in the
Summary of Significant Accounting Policies. The Company evaluates performance
based on earnings from operations. Summarized segment data for the
years ended December 31, 2009, 2008 and 2007 was as follows:
|
Wholesale
|
Retail
|
Other
|
Total
|
|||||||||||||
|
(Dollars in thousands)
|
||||||||||||||||
|
2009
|
||||||||||||||||
|
Product
sales
|
$ | 165,991 | $ | 22,033 | $ | 34,599 | $ | 222,623 | ||||||||
|
Licensing
revenues
|
2,682 | - | - | 2,682 | ||||||||||||
|
Net
sales
|
168,673 | 22,033 | 34,599 | 225,305 | ||||||||||||
|
Depreciation
|
1,747 | 843 | 358 | 2,948 | ||||||||||||
|
Earnings
from operations
|
16,578 | (1,508 | ) | 1,710 | 16,780 | |||||||||||
|
Total
assets
|
176,184 | 8,460 | 22,509 | 207,153 | ||||||||||||
|
Capital
expenditures
|
327 | 34 | 957 | 1,318 | ||||||||||||
|
2008
|
||||||||||||||||
|
Product
sales
|
$ | 182,880 | $ | 26,548 | $ | 7,720 | $ | 217,148 | ||||||||
|
Licensing
revenues
|
4,284 | - | - | 4,284 | ||||||||||||
|
Net
sales
|
187,164 | 26,548 | 7,720 | 221,432 | ||||||||||||
|
Depreciation
|
1,758 | 819 | 54 | 2,631 | ||||||||||||
|
Earnings
from operations
|
22,527 | 1,145 | 827 | 24,499 | ||||||||||||
|
Total
assets
|
175,288 | 10,407 | 4,945 | 190,640 | ||||||||||||
|
Capital
expenditures
|
587 | 1,548 | 43 | 2,178 | ||||||||||||
|
2007
|
||||||||||||||||
|
Product
sales
|
$ | 192,320 | $ | 28,637 | $ | 7,572 | $ | 228,529 | ||||||||
|
Licensing
revenues
|
4,087 | - | - | 4,087 | ||||||||||||
|
Net
sales
|
196,407 | 28,637 | 7,572 | 232,616 | ||||||||||||
|
Depreciation
|
1,775 | 649 | 60 | 2,484 | ||||||||||||
|
Earnings
from operations
|
29,394 | 3,957 | 781 | 34,132 | ||||||||||||
|
Total
assets
|
174,230 | 10,860 | 5,062 | 190,152 | ||||||||||||
|
Capital
expenditures
|
629 | 2,052 | 46 | 2,727 | ||||||||||||
All North
American corporate office assets are included in the wholesale
segment. Net sales above exclude intersegment sales.
Geographic
Segments
Financial
information relating to the Company’s business by geographic area was as follows
for the years ended December 31, 2009, 2008 and 2007:
|
2009
|
2008
|
2007
|
||||||||||
|
(Dollars
in thousands)
|
||||||||||||
|
Net Sales:
|
||||||||||||
|
United
States
|
$ | 182,861 | $ | 203,961 | $ | 214,524 | ||||||
|
Canada
|
7,845 | 9,751 | 10,520 | |||||||||
|
Europe
|
7,338 | 7,720 | 7,572 | |||||||||
|
Australia
|
16,735 | - | - | |||||||||
|
Asia
|
6,019 | - | - | |||||||||
|
South
Africa
|
4,507 | - | - | |||||||||
|
Total
|
$ | 225,305 | $ | 221,432 | $ | 232,616 | ||||||
|
Long-Lived Assets:
|
||||||||||||
|
United
States
|
$ | 34,694 | $ | 38,017 | $ | 38,585 | ||||||
|
Other
|
3,046 | 894 | 960 | |||||||||
| $ | 37,740 | $ | 38,911 | $ | 39,545 | |||||||
Net sales
attributed to geographic locations are based on the location of the assets
producing the sales. Long-lived assets by geographic location consist
of property, plant and equipment, net and trademark.
16. STOCK-BASED
COMPENSATION PLANS
At
December 31, 2009, the Company has two stock-based compensation plans: the 1997
Stock Option Plan and the 2005 Equity Incentive Plan. Under the
plans, options to purchase common stock were granted to officers and key
employees at exercise prices not less than the fair market value of the
Company’s common stock on the date of the grant. The Company issues
new common stock to satisfy stock option exercises and the issuance of
restricted stock awards.
Stock
options and restricted stock awards were granted on December 1, 2009 and 2008
and November 30, 2007. Stock options were granted at the fair market
value of the Company’s stock price, as defined in the 2005 Equity Incentive
Plan, which is the average of the high and low trade prices on the grant
date. The stock options and restricted stock awarded in 2009, 2008
and 2007 vest ratably over four years. Stock options expire five
years from the date of grant. These awards were granted on the date
the Board of Directors approved them. One-fourth of the restricted
stock awards and stock option grants vest annually on the anniversary of the
grant date. Options granted prior to 2006 expire ten years from the
grant date, with the exception of certain incentive stock options, which expire
five years from the grant date. As of December 31, 2009, there were
237,210 shares remaining available for stock-based awards under the 2005 Equity
Incentive Plan.
The
Company expenses stock-based compensation in accordance with ASC 718,
Compensation – Stock Compensation
using the modified prospective method.
The
Company’s policy is to estimate the fair market value of each option granted on
the date of grant using the Black-Scholes option pricing model that uses the
assumptions noted in the table below. The Company estimates the fair
value of each restricted stock award based on the fair market value of the
Company’s stock price on the grant date. The resulting compensation cost for
both the options and restricted stock is amortized on a straight-line basis over
the vesting period of the respective awards.
In
accordance with ASC 718, stock-based compensation was recognized in the 2009,
2008 and 2007 consolidated financial statements for stock options and restricted
stock awards granted since 2006. An estimate of forfeitures, based on
historical data, was included in the calculation of stock-based compensation,
and the estimate was adjusted quarterly to the extent that actual forfeitures
differ, or are expected to materially differ, from such
estimates. The effect of applying the expense recognition provisions
of ASC 718 in 2009, 2008 and 2007 decreased Earnings Before Provision For Income
Taxes by approximately $877,000, $609,000 and $316,000,
respectively.
As of
December 31, 2009, there was $1.6 million of total unrecognized compensation
cost related to non-vested stock options granted in the years 2006 through 2009
which is expected to be recognized over the remaining vesting period of 3.4
years. As of December 31, 2009, there was $1.1 million of total
unrecognized compensation cost related to non-vested restricted stock awards
granted in the years 2006 through 2009 which is also expected to be recognized
over the remaining vesting period of 2.3 years.
The
following weighted-average assumptions were used to determine compensation
expense related to stock options in 2009, 2008 and 2007:
|
2009
|
2008
|
2007
|
||||||||||
|
Risk-free
interest rate
|
1.35 | % | 1.35 | % | 3.00 | % | ||||||
|
Expected
dividend yield
|
2.61 | % | 1.96 | % | 1.60 | % | ||||||
|
Expected
term
|
3.5
years
|
3.5
years
|
3.6
years
|
|||||||||
|
Expected
volatility
|
33.3 | % | 31.7 | % | 28.7 | % | ||||||
The
risk-free interest rate is based on U. S. Treasury bonds with a remaining term
equal to the expected term of the award. The expected dividend yield
is based on the Company’s expected annual dividend as a percentage of the market
value of the Company’s common stock in the year of grant. The
expected term of the stock options is determined using historical experience.
The expected volatility is based upon historical stock prices over the most
recent period equal to the expected term of the award.
The
following tables summarize stock option activity under the Company’s
plans:
Stock
Options
|
Years ended December 31,
|
||||||||||||||||||||||||
|
2009
|
2008
|
2007
|
||||||||||||||||||||||
|
Stock Options
|
Shares
|
Weighted
Average
Exercise Price
|
Shares
|
Weighted
Average
Exercise Price
|
Shares
|
Weighted
Average
Exercise
Price
|
||||||||||||||||||
|
Outstanding
at beginning of year
|
1,100,012 | $ | 17.14 | 1,189,924 | $ | 14.49 | 1,252,190 | $ | 12.62 | |||||||||||||||
|
Granted
|
184,900 | 23.09 | 128,500 | 30.67 | 123,300 | 27.52 | ||||||||||||||||||
|
Exercised
|
(85,586 | ) | 7.98 | (213,012 | ) | 10.29 | (181,466 | ) | 10.21 | |||||||||||||||
|
Forfeited
|
(4,050 | ) | 28.03 | (5,400 | ) | 26.47 | (4,100 | ) | 24.09 | |||||||||||||||
|
Outstanding
at end of year
|
1,195,276 | $ | 18.68 | 1,100,012 | $ | 17.14 | 1,189,924 | $ | 14.49 | |||||||||||||||
|
Exercisable
at end of year
|
846,151 | $ | 15.69 | 860,962 | $ | 13.87 | 1,033,774 | $ | 12.63 | |||||||||||||||
|
Weighted
average fair market value of options granted
|
$ | 4.81 | $ | 4.65 | $ | 5.96 | ||||||||||||||||||
|
Weighted Average Remaining
Contractual Life (in years)
|
Aggregate Intrinsic
Value
|
|||||||
|
Outstanding
- December 31, 2009
|
3.4 | $ | 7,299,000 | |||||
|
Exercisable
- December 31, 2009
|
3.1 | $ | 7,197,000 | |||||
The
aggregate intrinsic value for outstanding and exercisable stock options is
defined as the difference between the market value of the Company’s stock at
December 31, 2009 of $23.64 and the exercise price.
Non-vested
Stock Options
|
Non-vested Stock Options
|
Number of
Options
|
Weighted
Average Exercise
Price
|
Weighted
Average
Fair
Value
|
|||||||||
|
Non-vested -
December 31, 2006
|
47,900 | $ | 24.09 | $ | 6.15 | |||||||
|
Granted
|
123,300 | 27.52 | 5.96 | |||||||||
|
Vested
|
(10,950 | ) | 24.09 | 6.15 | ||||||||
|
Forfeited
|
(4,100 | ) | 24.09 | 6.15 | ||||||||
|
Non-vested -
December 31, 2007
|
156,150 | $ | 26.80 | $ | 6.00 | |||||||
|
Granted
|
128,500 | 30.67 | 4.65 | |||||||||
|
Vested
|
(40,200 | ) | 26.64 | 6.01 | ||||||||
|
Forfeited
|
(5,400 | ) | 26.57 | 6.01 | ||||||||
|
Non-vested
- December 31, 2008
|
239,050 | $ | 28.91 | $ | 5.27 | |||||||
|
Granted
|
184,900 | 23.09 | 4.81 | |||||||||
|
Vested
|
(71,175 | ) | 28.43 | 5.40 | ||||||||
|
Forfeited
|
(3,450 | ) | 28.57 | 5.31 | ||||||||
|
Non-vested
- December 31, 2009
|
349,325 | $ | 25.93 | $ | 5.00 | |||||||
The
following table summarizes information about outstanding and exercisable stock
options at December 31, 2009:
|
Options Outstanding
|
Options Exercisable
|
|||||||||||||||||||
|
Range of Exercise Prices
|
Options
Outstanding
|
Weighted
Average
Remaining
Contractual
Life (in years)
|
Weighted
Average
Exercise
Price
|
Number of
Options
|
Weighted
Average
Exercise
Price
|
|||||||||||||||
|
$7.84
to $8.50
|
198,404 | 1.3 | $ | 8.13 | 198,404 | $ | 8.13 | |||||||||||||
|
$12.04
to $15.46
|
178,946 | 3.0 | 12.78 | 178,946 | 12.78 | |||||||||||||||
|
$16.79
to $18.03
|
336,842 | 4.2 | 17.32 | 336,842 | 17.32 | |||||||||||||||
|
$19.33
to $24.09
|
236,234 | 4.4 | 23.09 | 41,134 | 22.85 | |||||||||||||||
|
$27.38
to $30.67
|
244,850 | 3.4 | 29.16 | 90,825 | 28.63 | |||||||||||||||
| 1,195,276 | 3.4 | $ | 18.68 | 846,151 | $ | 15.69 | ||||||||||||||
The
following table summarizes stock option activity for the years ended December
31:
|
2009
|
2008
|
2007
|
||||||||||
|
(Dollars in thousands)
|
||||||||||||
|
Total
intrinsic value of stock options exercised
|
$ | 943 | $ | 4,355 | $ | 2,885 | ||||||
|
Cash
received from stock option exercises
|
$ | 683 | $ | 2,191 | $ | 1,853 | ||||||
|
Income
tax benefit from the exercise of stock options
|
$ | 368 | $ | 1,695 | $ | 1,125 | ||||||
|
Total
fair value of stock options vested
|
$ | 385 | $ | 242 | $ | 67 | ||||||
Restricted
Stock
The
following table summarizes restricted stock award activity during the years
ended December 31, 2007, 2008 and 2009:
|
Non-vested
Restricted Stock
|
Shares of
Restricted Stock
|
Weighted
Average
Grant Date
Fair Value
|
||||||
|
Non-vested
- December 31, 2006
|
41,000 | $ | 24.09 | |||||
|
Issued
|
20,190 | 27.38 | ||||||
|
Vested
|
(9,450 | ) | 24.09 | |||||
|
Forfeited
|
(3,200 | ) | 24.09 | |||||
|
Non-vested
- December 31, 2007
|
48,540 | $ | 25.46 | |||||
|
Issued
|
20,200 | 27.26 | ||||||
|
Vested
|
(14,247 | ) | 25.24 | |||||
|
Forfeited
|
(825 | ) | 25.29 | |||||
|
Non-vested
- December 31, 2008
|
53,668 | $ | 26.20 | |||||
|
Issued
|
12,300 | $ | 23.09 | |||||
|
Vested
|
(19,298 | ) | 25.77 | |||||
|
Non-vested
- December 31, 2009
|
46,670 | $ | 25.56 | |||||
At
December 31, 2009, the Company expected 46,670 shares of restricted stock to
vest over a weighted-average remaining contractual term of 2.6
years. These shares had an aggregate intrinsic value of $1.1 million
at December 31, 2009. The aggregate intrinsic value is calculated
using the market value of the Company’s stock on December 31, 2009 of $23.64
multiplied by the number of non-vested restricted shares
outstanding. The income tax benefit from the vesting of restricted
stock for the years ended December 31 was $173,000 in 2009, $152,000 in 2008 and
$116,000 in 2007.
17. QUARTERLY
FINANCIAL DATA (Unaudited)
(In
thousands, except per share amounts)
|
2009
|
First
Quarter
|
Second
Quarter
|
Third
Quarter
|
Fourth
Quarter
|
Year
|
|||||||||||||||
|
Net
sales
|
$ | 58,908 | $ | 50,053 | $ | 57,943 | $ | 58,401 | $ | 225,305 | ||||||||||
|
Gross
earnings
|
$ | 19,691 | $ | 18,911 | $ | 21,671 | $ | 24,203 | $ | 84,476 | ||||||||||
|
Net
earnings attributable to Weyco Group, Inc.
|
$ | 2,504 | $ | 2,185 | $ | 3,360 | $ | 4,772 | $ | 12,821 | ||||||||||
|
Net
earnings per share:
|
||||||||||||||||||||
|
Basic
|
$ | 0.22 | $ | 0.19 | $ | 0.30 | $ | 0.42 | $ | 1.14 | ||||||||||
|
Diluted
|
$ | 0.22 | $ | 0.19 | $ | 0.29 | $ | 0.41 | $ | 1.11 | ||||||||||
|
2008
|
First
Quarter
|
Second
Quarter |
Third
Quarter
|
Fourth
Quarter
|
Year
|
|||||||||||||||
|
Net
sales
|
$ | 61,278 | $ | 53,017 | $ | 57,172 | $ | 49,965 | $ | 221,432 | ||||||||||
|
Gross
earnings
|
$ | 22,266 | $ | 19,733 | $ | 20,906 | $ | 18,233 | $ | 81,138 | ||||||||||
|
Net
earnings attributable to Weyco Group, Inc.
|
$ | 5,126 | $ | 4,057 | $ | 4,341 | $ | 3,501 | $ | 17,025 | ||||||||||
|
Net
earnings per share:
|
||||||||||||||||||||
|
Basic
|
$ | 0.45 | $ | 0.35 | $ | 0.38 | $ | 0.31 | $ | 1.49 | ||||||||||
|
Diluted
|
$ | 0.43 | $ | 0.34 | $ | 0.37 | $ | 0.30 | $ | 1.45 | ||||||||||
18. VALUATION
AND QUALIFYING ACCOUNTS
|
Deducted from Assets
|
||||||||||||
|
Doubtful
|
Returns and
|
|||||||||||
|
Accounts
|
Allowances
|
Total
|
||||||||||
|
(Dollars
in thousands)
|
||||||||||||
|
BALANCE,DECEMBER
31,2006
|
$ | 1,393 | $ | 2,321 | $ | 3,714 | ||||||
|
Add-(Reductions)/Additions
charged to earnings
|
(16 | ) | 3,794 | 3,778 | ||||||||
|
Deduct
- Charges for purposes for which reserves were established
|
(195 | ) | (4,121 | ) | (4,316 | ) | ||||||
|
BALANCE,DECEMBER
31,2007
|
1,182 | 1,994 | 3,176 | |||||||||
|
Add-Additions
charged to earnings
|
663 | 3,649 | 4,312 | |||||||||
|
Deduct
- Charges for purposes for which reserves were established
|
(543 | ) | (3,765 | ) | (4,308 | ) | ||||||
|
BALANCE,DECEMBER
31,2008
|
1,302 | 1,878 | 3,180 | |||||||||
|
Add-Additions
charged to earnings
|
631 | 2,881 | 3,512 | |||||||||
|
Deduct
- Charges for purposes for which reserves were established
|
(715 | ) | (3,319 | ) | (4,034 | ) | ||||||
|
BALANCE,DECEMBER
31,2009
|
$ | 1,218 | $ | 1,440 | $ | 2,658 | ||||||
19.
SUBSEQUENT EVENTS
ASC 855,
Subsequent Events
requires disclosure of the date through which subsequent events have been
evaluated, as well as whether the date is the date the financial statements were
issued or the date the financial statements were available to be
issued. The Company has evaluated subsequent events through the date
these financial statements were issued. No significant subsequent
events have occurred through this date requiring adjustment to the financial
statements or disclosures.
|
ITEM 9
|
CHANGES IN AND
DISAGREEMENTS WITH ACCOUNTANTS ON ACCOUNTING AND FINANCIAL
DISCLOSURES
|
None
|
ITEM 9A
|
CONTROLS AND
PROCEDURES
|
Evaluation
of Disclosure Controls and Procedures
The Company maintains disclosure
controls and procedures designed to ensure that the information the Company must
disclose in its filings with the Securities and Exchange Commission is recorded,
processed, summarized and reported on a timely basis. The Company’s
Chief Executive Officer and Chief Financial Officer have reviewed and evaluated
the Company’s disclosure controls and procedures (as defined in Rules 13a-15(e)
and 15d-15(e) under the Securities Exchange Act of 1934, as amended (the
“Exchange Act”)) as of the end of the period covered by this report (the
“Evaluation Date”). Disclosure controls and procedures include,
without limitation, controls and procedures designed to ensure that information
required to be disclosed by an issuer in the reports that it files or submits
under the Act is accumulated and communicated to the issuer’s management,
including its principal executive and principal financial officers, or persons
performing similar functions, as appropriate to allow timely decisions regarding
required disclosure. Based on such evaluation, such officers have
concluded that, as of the Evaluation Date, the Company’s disclosure controls and
procedures are effective in bringing to their attention on a timely basis
information relating to the Company required to be included in the Company’s
periodic filings under the Exchange Act.
Management’s
Report on Internal Control over Financial Reporting
The
report of management required under this Item 9A is contained in Item 8 of Part
II of this Annual Report on Form 10-K under the heading “Management’s Annual
Report on Internal Control over Financial Reporting.”
Report
of Independent Registered Public Accounting Firm
The
attestation report required under this Item 9A is contained in Item 8 of Part II
of this Annual Report on Form 10-K under the heading “Report of Independent
Registered Public Accounting Firm.”
Changes
in Internal Control Over Financial Reporting
There
have not
been any
changes in the Company’s internal control over financial
reporting (as defined
in Exchange Act Rules 13a-15(f) and
15d-15(f)) that
occurred during the Company’s most recent fiscal quarter that have materially
affected, or are reasonably likely to
materially affect, the
Company’s internal control over financial reporting.
|
ITEM 9B
|
OTHER
INFORMATION
|
None
|
ITEM 10
|
DIRECTORS, EXECUTIVE
OFFICERS AND CORPORATE
GOVERNANCE
|
Information
required by this Item is set forth within Part I, “Executive Officers of the
Registrant” of this Form 10-K and within the Company’s Proxy Statement for the
Annual Meeting of Shareholders to be held on May 4, 2010 (the “2010 Proxy
Statement”), and is incorporated herein by reference.
|
ITEM 11
|
EXECUTIVE
COMPENSATION
|
Information
required by this Item is set forth in the Company’s 2010 Proxy Statement, and is
incorporated herein by reference.
|
ITEM 12
|
SECURITY OWNERSHIP OF
CERTAIN BENEFICIAL OWNERS AND MANAGEMENT AND RELATED STOCKHOLDER
MATTERS
|
Information
required by this Item is set forth in the Company’s 2010 Proxy Statement, and is
incorporated herein by reference.
The
following table provides information about the Company’s equity compensation
plans as of December 31, 2009:
|
(a)
|
(b)
|
(c)
|
||||||||||
|
Number of Securities
|
||||||||||||
|
Remaining Available for
|
||||||||||||
|
Future Issuance Under
|
||||||||||||
|
Number of Securities to
|
Weighted-Average
|
Equity Compensation
|
||||||||||
|
be Issued upon Exercise
|
Exercise Price of
|
Plans (Excluding
|
||||||||||
|
Of Outstanding Options,
|
Outstanding Options,
|
Securities Reflected in
|
||||||||||
|
Warrants and Rights
|
Warrants and Rights
|
Column (a))
|
||||||||||
|
Plan
Category
|
||||||||||||
|
Equity
compensation plans approved by shareholders
|
1,195,276 | $ | 18.68 | 237,210 | ||||||||
|
Equity
compensation plans not approved by shareholders
|
- | - | - | |||||||||
|
Total
|
1,195,276 | $ | 18.68 | 237,210 | ||||||||
|
ITEM
13
|
CERTAIN RELATIONSHIPS
AND RELATED TRANSACTIONS, AND DIRECTOR
INDEPENDENCE
|
Information
required by this Item is set forth in the Company’s 2010 Proxy Statement, and is
incorporated herein by reference.
|
ITEM 14
|
PRINCIPAL ACCOUNTANT
FEES AND SERVICES
|
Information
required by this Item is set forth in the Company’s 2010 Proxy Statement, and is
incorporated herein by reference.
|
ITEM
15
|
EXHIBITS AND FINANCIAL
STATEMENT SCHEDULES
3
|
|
(a)
|
Documents
filed as part of this Annual Report on Form
10-K:
|
|
|
(1)
|
Financial
Statements - See the consolidated financial statements included in Part
II, Item 8 “Financial Statements and Supplementary Data” in this 2009
Annual Report on Form 10-K.
|
|
|
(2)
|
Financial
Statement Schedules – Financial statement schedules have been omitted
because information required in these schedules is included in the Notes
to Consolidated Financial
Statements.
|
|
|
(3)
|
List
of Exhibits.
|
|
Incorporated Herein
|
Filed
|
|||||
|
Exhibit
|
Description
|
By Reference To
|
Herewith
|
|||
|
3.1
|
Articles of Incorporation as Restated
|
Exhibit 3.1 to Form
|
||||
|
August 29, 1961, and Last Amended
|
10-K for Year Ended
|
|||||
|
February 16, 2005
|
December 31, 2004
|
|||||
|
3.2
|
Bylaws as Revised January 21, 1991
|
Exhibit 3 to Form 8-K
|
||||
|
and Last Amended July 26, 2007
|
Dated July 26, 2007
|
|||||
|
10.1
|
Subscription Agreement relating to
|
Exhibit 10.1 to Form
|
||||
|
Florsheim Australia Pty Ltd, dated
|
10-K for Year Ended
|
|||||
|
January 23, 2009 by and among
|
December 31, 2008
|
|||||
|
Florsheim Australia Pty Ltd, Seraneuse
|
||||||
|
Pty Ltd as trustee for the Byblose
|
||||||
|
Trust, Weyco Group, Inc. and David
|
||||||
|
Mayne Venner
|
||||||
|
10.2
|
Shareholders Agreement relating to
|
Exhibit 10.2 to Form
|
||||
|
Florsheim Australia Pty Ltd, dated
|
10-K for Year Ended
|
|||||
|
January 23, 2009 by and among
|
December 31, 2008
|
|||||
|
Florsheim Australia Pty Ltd, Seraneuse
|
||||||
|
Pty Ltd as trustee for the Byblose
|
||||||
|
Trust, Weyco Group, Inc, and David
|
||||||
|
Mayne Venner
|
||||||
|
10.3
|
Loan Agreement dated January 23,
|
Exhibit 10.3 to Form
|
||||
|
2009 between Weyco Investments, Inc.
|
10-K for Year Ended
|
|||||
|
and Florsheim Australia Pty Ltd
|
December 31, 2008
|
|||||
|
10.4
|
Fixed and Floating Charge Agreement
|
Exhibit 10.4 to Form
|
||||
|
Between Weyco Investments, Inc.
|
10-K for Year Ended
|
|||||
|
and Florsheim Australia Pty Ltd
|
December 31, 2008
|
|||||
|
10.5*
|
Consulting Agreement - Thomas W.
|
Exhibit 10.1 to Form
|
||||
|
Florsheim, dated December 28, 2000
|
10-K for Year Ended
|
|||||
|
|
December 31, 2001
|
|
Incorporated Herein
|
Filed
|
|||||
|
Exhibit
|
Description
|
By Reference To
|
Herewith
|
|||
|
10.6*
|
Employment Agreement - Thomas W.
|
Exhibit 10.2 to Form
|
||||
|
Florsheim, Jr., dated January 1, 2008
|
10-K for Year Ended
|
|||||
|
December 31, 2007
|
||||||
|
10.7*
|
Employment Agreement - John W.
|
Exhibit 10.3 to Form
|
||||
|
Florsheim, dated January 1, 2008
|
10-K for Year Ended
|
|||||
|
December 31, 2007
|
||||||
|
10.8*
|
Excess Benefits Plan - Amended Effective
|
Exhibit 10.6 to Form
|
||||
|
as of July 1, 2004
|
10-K for Year Ended
|
|||||
|
December 31, 2005
|
||||||
|
10.9*
|
Pension Plan - Amended and Restated
|
Exhibit 10.7 to Form
|
||||
|
Effective January 1, 2006
|
10-K for Year Ended
|
|||||
|
December 31, 2006
|
||||||
|
10.10*
|
Deferred Compensation Plan – Amended
|
Exhibit 10.8 to Form
|
||||
|
Effective as of July 1, 2004
|
10-K for Year Ended
|
|||||
|
December 31, 2005
|
||||||
|
10.11
|
Loan agreement between Weyco
|
Exhibit 10.9 to Form
|
||||
|
Group, Inc. and M&I Marshall
|
10-Q for the Quarter
|
|||||
|
& Ilsley Bank dated April 28, 2006
|
Ended June 30, 2008
|
|||||
|
10.12
|
Amendment to loan agreement dated
|
Exhibit 10.1 to Form
|
||||
|
April 26, 2006 which extends the
|
10-Q for the Quarter
|
|||||
|
revolving loan maturity date to
|
Ended June 30, 2009
|
|||||
|
April 30, 2010
|
||||||
|
10.13*
|
1997 Stock Option Plan
|
Exhibit 10.13 to Form
|
||||
|
10-K for Year Ended
|
||||||
|
December 31, 1997
|
||||||
|
10.14*
|
Change of Control Agreement
|
Exhibit 10.14 to Form
|
||||
|
John Wittkowske, dated
|
10-K for Year Ended
|
|||||
|
January 26, 1998 and restated
|
December 31, 2008
|
|||||
|
December 22, 2008
|
||||||
|
10.15*
|
Change of Control Agreement
|
Exhibit 10.15 to Form
|
||||
|
Peter S. Grossman, dated
|
10-K for Year Ended
|
|||||
|
January 26, 1998 and restated
|
December 31, 2008
|
|||||
|
December 22, 2008
|
||||||
|
10.16*
|
Weyco Group, Inc. Director
|
Exhibit 10.19 to Form
|
||||
|
Nonqualified Stock Option Agreement
|
10-K for Year Ended
|
|||||
|
Robert Feitler, dated May 19, 2003
|
December 31, 2004
|
|||||
|
10.17*
|
Weyco Group, Inc. Director
|
Exhibit 10.20 to Form
|
||||
|
Nonqualified Stock Option Agreement
|
10-K for Year Ended
|
|||||
|
Thomas W. Florsheim, Sr., dated
|
December 31, 2004
|
|||||
|
May 19, 2003
|
|
Incorporated Herein
|
Filed
|
|||||
|
Exhibit
|
Description
|
By Reference To
|
Herewith
|
|||
|
10.18*
|
Weyco Group, Inc. Director
|
Exhibit 10.22 to Form
|
||||
|
Nonqualified Stock Option Agreement
|
10-K for Year Ended
|
|||||
|
Frederick P. Stratton, Jr., dated
|
December 31, 2004
|
|||||
|
May 19, 2003
|
||||||
|
10.19*
|
Weyco Group, Inc. 2005 Equity
|
Appendix C to the
|
||||
|
Incentive Plan
|
Registrant’s Proxy
|
|||||
|
Statement Schedule
|
||||||
|
14A for the Annual
|
||||||
|
Meeting of Shareholders
|
||||||
|
held on April 26, 2005
|
||||||
|
21
|
Subsidiaries of the Registrant
|
X
|
||||
|
23.1
|
Independent Registered Public
|
|||||
|
Accounting Firm’s Consent
|
X
|
|||||
|
Dated March 9, 2010
|
||||||
|
31.1
|
Certification of Chief Executive Officer
|
X
|
||||
|
31.2
|
Certification of Chief Financial Officer
|
X
|
||||
|
32
|
Section 906 Certification of
|
|||||
|
Chief Executive Officer and Chief Financial Officer
|
X
|
*Management
contract or compensatory plan or arrangement
SIGNATURES
Pursuant
to the requirements of Section 13 or 15(d) of the Securities Exchange Act of
1934, the registrant has duly caused this report to be signed on its behalf by
the undersigned, thereunto duly authorized.
|
WEYCO GROUP, INC.
|
||||
|
By
|
/s/ John F. Wittkowske
|
March
|
12, 2010
|
|
|
John F. Wittkowske, Senior Vice President,
|
||||
|
Chief Financial Officer and Secretary
|
||||
KNOW ALL
MEN BY THESE PRESENTS, that each person whose signature appears below
constitutes and appoints Thomas W. Florsheim, Jr., John W. Florsheim, and John
F. Wittkowske, and each of them, his true and lawful attorneys-in-fact and
agents, with full power of substitution and resubstitution, for him and in his
name, place and stead, in any and all capacities, to sign any and all amendments
to this report, and to file the same, with all exhibits thereto, and other
documents in connection therewith, with the Securities and Exchange Commission,
granting unto said attorneys-in-fact and agents, and each of them, full power
and authority to do and perform each and every act and thing requisite and
necessary to be done in and about the premises, as fully to all intents and
purposes as he might or could do in person, hereby ratifying and confirming all
that said attorneys-in-fact and agents or any of them, or their substitutes, may
lawfully do or cause to be done by virtue
thereof.
Pursuant
to the requirements of the Securities Exchange Act of 1934, this report has been
signed below as of March 12, 2010 by the following persons on behalf of the
registrant and in the capacities indicated.
|
/s/ Thomas W. Florsheim
|
|
|
Thomas
W. Florsheim, Chairman Emeritus
|
|
|
/s/ Thomas W. Florsheim,
Jr.
|
|
|
Thomas
W. Florsheim, Jr., Chairman of the Board
|
|
|
and
Chief Executive Officer (Principal Executive Officer)
|
|
|
/s/ John W. Florsheim
|
|
|
John
W. Florsheim, President and Chief
|
|
|
Operating
Officer, Assistant Secretary and Director
|
|
|
/s/ John F. Wittkowske
|
|
|
John
F. Wittkowske, Senior Vice President, Chief
|
|
|
Financial
Officer and Secretary (Principal Financial Officer)
|
|
|
/s/ Tina Chang
|
|
|
Tina
Chang, Director
|
|
|
/s/ Robert Feitler
|
|
|
Robert
Feitler, Director
|
|
|
/s/ Cory L. Nettles
|
|
|
Cory
L. Nettles, Director
|
|
|
/s/ Frederick P. Stratton,
Jr.
|
|
|
Frederick
P. Stratton, Jr., Director
|
|
TABLE OF CONTENTS
Part 1Item 1 BusinessItem 1A Risk FactorsItem 1B Unresolved Staff CommentsItem 2 PropertiesItem 3 Legal ProceedingsItem 4 ReservedPart IIItem 5 Market For Registrant S Common Equity, Related Stockholder Matters and Issuer Purchases Of Equity SecuritiesItem 6 Selected Financial DataItem 7 Management S Discussion and Analysis Of Financial Condition and Results Of OperationsItem 7A Quantitative and Qualitative Disclosures About Market RiskItem 8 Financial Statements and Supplementary DataItem 9 Changes in and Disagreements with Accountants on Accounting and Financial DisclosuresItem 9A Controls and ProceduresItem 9B Other InformationPart IIIItem 10 Directors, Executive Officers and Corporate GovernanceItem 11 Executive CompensationItem 12 Security Ownership Of Certain Beneficial Owners and Management and Related Stockholder MattersItem 13 Certain Relationships and Related Transactions, and Director IndependenceItem 14 Principal Accountant Fees and ServicesPart IVItem 15 Exhibits and Financial Statement Schedules3