WHIRLPOOL CORP /DE/
10-Ks and 10-Qs
|
|
|
|
|
|
|
|
|
|
|
|
|
|
|
|
|
|
|
|
|
|
|
|
|
|
|
|
|
|
|
|
|
|
|
|
|
|
|
|
|
|
|
|
|
|
|
|
|
|
|
|
|
|
|
|
UNITED STATES SECURITIES AND EXCHANGE COMMISSION
WASHINGTON, D.C. 20549
FORM 10-K
(Mark One)
|
x
|
ANNUAL REPORT PURSUANT TO SECTION 13 OR 15(d) OF THE SECURITIES EXCHANGE ACT OF 1934
|
|
For the fiscal year ended
December 31, 2016
OR
|
o
|
TRANSITION REPORT PURSUANT TO SECTION 13 OR 15(d) OF THE SECURITIES EXCHANGE ACT OF 1934
|
|
For the transition period from _______ to _______
Commission file number 1-3932

WHIRLPOOL CORPORATION
(Exact name of registrant as specified in its charter)
|
Delaware
|
|
38-1490038
|
|
(State of Incorporation)
|
|
(I.R.S. Employer Identification No.)
|
|
2000 North M-63, Benton Harbor, Michigan
|
|
49022-2692
|
|
(Address of principal executive offices)
|
|
(Zip Code)
|
Registrant’s telephone number, including area code (269) 923-5000
Securities registered pursuant to Section 12(b) of the Act:
|
Title of each class
|
|
Name of each exchange on which registered
|
|
Common stock, par value $1 per share
|
|
Chicago Stock Exchange and New York Stock Exchange
|
|
0.625% Senior Notes due 2020
|
New York Stock Exchange
|
|
Securities registered pursuant to Section 12(g) of the Act: NONE
|
Indicate by check mark if the registrant is a well-known seasoned issuer, as defined in Rule 405 of the Securities Act.
|
Yes
ý
No
¨
|
|||
|
Indicate by check mark if the registrant is not required to file reports pursuant to Section 13 or Section 15(d) of the Exchange Act.
|
Yes
¨
No
ý
|
|||
|
Indicate by check mark whether the registrant (1) has filed all reports required to be filed by Section 13 or 15(d) of the Exchange Act during
|
||||
|
the preceding 12 months (or for such shorter period that the registrant was required to file such report), and (2) has been subject to such
|
||||
|
filing requirements for the past 90 days.
|
Yes
ý
No
¨
|
|||
|
Indicate by check mark whether the registrant has submitted electronically and posted on its corporate Web site, if any, every Interactive Data
|
||||
|
File required to be submitted and posted pursuant to Rule 405 of Regulation S-T (§ 232.405 of this chapter) during the preceding 12 months
|
||||
|
(or for such shorter period that the registrant was required to submit and post such files).
|
Yes
ý
No
¨
|
|||
|
Indicate by check mark if disclosure of delinquent filers pursuant to Item 405 of Regulation S-K (§229.405 of this chapter) is not contained
|
||||
|
herein, and will not be contained, to the best of the registrant’s knowledge, in definitive proxy or information statements incorporated by
|
||||
|
reference in Part III of this Form 10-K or any amendment to this Form 10-K.
|
ý
|
|||
|
Indicate by check mark whether the registrant is a large accelerated filer, an accelerated filer, a non-accelerated filer, or a smaller reporting
|
||||
|
company. See the definitions of “large accelerated filer,” “accelerated filer,” and “smaller reporting company” in Rule 12b-2 of the Exchange Act.
|
||||
|
(Check one)
|
||||
|
Large accelerated filer
ý
|
Accelerated filer
¨
|
|||
|
Non-accelerated filer
¨
(Do not check if a smaller reporting company)
|
Smaller reporting company
¨
|
|||
|
Indicate by check mark whether the registrant is a shell company (as defined in Rule 12b-2 of the Exchange Act).
|
Yes
¨
No
ý
|
|||
On
February 3, 2017
, the registrant had
74,467,790
shares of common stock outstanding.
DOCUMENTS INCORPORATED BY REFERENCE
Portions of the following documents are incorporated herein by reference into the Part of the Form 10-K indicated:
|
Document
|
|
Part of Form 10-K into which incorporated
|
|
The registrant’s proxy statement for the 2017 annual meeting of stockholders (the “Proxy Statement”)
|
Part III
|
|
WHIRLPOOL CORPORATION
ANNUAL REPORT ON FORM 10-K
For the fiscal year ended
December 31, 2016
TABLE OF CONTENTS
|
|
|
PAGE
|
|
Item 1.
|
||
|
Item 1A.
|
||
|
Item 1B.
|
||
|
Item 2.
|
||
|
Item 3.
|
||
|
Item 4.
|
||
|
Item 5.
|
||
|
Item 6.
|
||
|
Item 7.
|
||
|
Item 7A.
|
||
|
Item 8.
|
||
|
Item 9.
|
||
|
Item 9A.
|
||
|
Item 9B.
|
||
|
Item 10.
|
||
|
Item 11.
|
||
|
Item 12.
|
||
|
Item 13.
|
||
|
Item 14.
|
|
|
|
Item 15.
|
||
|
Item 16
|
||
|
|
||||
|
ITEM 1.
|
BUSINESS
|
Whirlpool Corporation ("Whirlpool"), the number one major appliance manufacturer in the world, was incorporated in 1955 under the laws of Delaware as the successor to a business that traces its origin to 1898. Whirlpool manufactures products in
14
countries and markets products in nearly every country around the world under brand names such as
Whirlpool
,
KitchenAid
,
Maytag
,
Consul
,
Brastemp
,
Amana
,
Bauknecht
,
Jenn-Air, Indesit, and Hotpoint
*.
Whirlpool’s reportable segments consist of North America, Europe, Middle East and Africa ("EMEA"), Latin America and Asia.
As of
December 31, 2016
, Whirlpool had approximately
93,000
employees.
As used herein, and except where the context otherwise requires, “Whirlpool,” “the Company,” “we,” “us,” and “our” refer to Whirlpool Corporation and its consolidated subsidiaries.
Products and Regions
Whirlpool manufactures and markets a full line of major home appliances and related products. Our principal products are laundry appliances, refrigerators and freezers, cooking appliances, dishwashers, mixers and other small domestic appliances. We also produce hermetic compressors for refrigeration systems.
The following table provides the percentage of net sales for each class of products which accounted for 10% or more of our consolidated net sales over the last three years:
|
2016
|
2015
|
2014
|
|||||||
|
Laundry Appliances
|
28
|
%
|
29
|
%
|
27
|
%
|
|||
|
Refrigerators and Freezers
|
28
|
%
|
28
|
%
|
28
|
%
|
|||
|
Cooking Appliances
|
18
|
%
|
18
|
%
|
18
|
%
|
|||
|
Other
|
26
|
%
|
25
|
%
|
27
|
%
|
|||
|
Net Sales
|
100
|
%
|
100
|
%
|
100
|
%
|
|||
In North America, Whirlpool markets and distributes major home appliances and small domestic appliances under a variety of brand names. In the United States, we market and distribute products primarily under the
Whirlpool
,
Maytag
,
KitchenAid
,
Jenn-Air
,
Amana
,
Roper
,
Admiral
,
Affresh
and
Gladiator
brand names primarily to retailers, distributors and builders. In Canada, we market and distribute major home appliances primarily under the
Inglis
,
Admiral
,
Whirlpool
,
Maytag
,
Jenn-Air
,
Amana
,
Roper
,
Estate
and
KitchenAid
brand names. In Mexico, we market and distribute major home appliances primarily under the
Whirlpool
,
Maytag
,
Acros
,
KitchenAid
and
Supermatic
brand names. We sell some products to other manufacturers, distributors, and retailers for resale in North America under those manufacturers’ and retailers’ respective brand names.
In EMEA, we market and distribute our major home appliances primarily under the
Whirlpool, Bauknecht, Ignis, Maytag, Laden, Indesit and Privileg
brand names, and major and small domestic appliances under the
KitchenAid, Hotpoint
*
,
and
Hotpoint-Ariston
brand name. In addition to our operations in Western and Eastern Europe, Turkey and Russia, we have sales subsidiaries in Morocco and Dubai. We market and distribute a full line of products under the
Whirlpool
and
KIC
brand names in South Africa. Our European operations also market and distribute products under the
Whirlpool, Bauknecht, Maytag, Amana
and
Ignis
brand names to distributors and dealers in Africa and the Middle East.
In Latin America, we market and distribute our major home appliances and small domestic appliances primarily under the
Consul
,
Brastemp
,
Whirlpool
and
KitchenAid
brand names. We manage sales and distribution through our local entities in Brazil, Argentina, Chile, Peru, Ecuador, Colombia and Guatemala. We also serve the countries of Bolivia, Paraguay, Uruguay, Venezuela, and certain Caribbean and Central America countries, where we manage appliances sales and distribution through our accredited distributors. Our Latin America operations also produce hermetic compressors for refrigeration systems.
*Whirlpool ownership of the Hotpoint brand in the EMEA and Asia Pacific regions is not affiliated with the Hotpoint brand sold in the Americas
3
In Asia, we have organized the marketing and distribution of our major home appliances and small domestic appliances into five operating groups: (1) mainland China; (2) Hong Kong and Taiwan; (3) India, which includes Bangladesh, Sri Lanka, Nepal and Pakistan; (4) Oceania, which includes Australia, New Zealand and Pacific Islands; and (5) Southeast Asia, which includes Thailand, Singapore, Malaysia, Indonesia, Vietnam, the Philippines, Korea, Myanmar and Japan. We market and distribute our products in Asia primarily under the
Whirlpool
,
Maytag
,
KitchenAid
,
Amana
,
Bauknecht
,
Jenn-Air
,
Diqua, and Royalstar
brand names through a combination of direct sales to appliance retailers and chain stores and through full-service distributors to a large network of retail stores.
Competition
Competition in the major home appliance industry is intense, including competitors such as Arcelik, Bosch Siemens, Electrolux, Haier, Kenmore, LG, Mabe, Midea, Panasonic and Samsung, many of which are increasingly expanding beyond their existing manufacturing footprint. Moreover, our customer base includes large, sophisticated trade customers who have many choices and demand competitive products, services and prices. Competition in our business is based upon a wide variety of factors, including selling price, product features and design, performance, innovation, energy efficiency, quality, cost, distribution and financial incentives. These financial incentives include cooperative advertising, co-marketing funds, salesperson incentives, volume rebates and terms. We believe that we can best compete in the current environment by focusing on introducing new and innovative products, building strong brands, enhancing trade customer and consumer value with our product and service offerings, expanding our regional footprint and trade distribution channels, increasing productivity, improving quality, lowering costs, and taking other efficiency-enhancing measures.
Raw Materials and Purchased Components
We are generally not dependent upon any one source for raw materials or purchased components essential to our business. In areas where a single supplier is used, alternative sources are generally available and can be developed within the normal manufacturing environment. Some supply disruptions and unanticipated costs may be incurred in transitioning to a new supplier if a prior single supplier relationship was abruptly interrupted or terminated. In the event of a disruption, we believe that we will be able to qualify and use alternate materials, sometimes at premium costs, and that such raw materials and components will be available in adequate quantities to meet forecasted production schedules.
Trademarks, Licenses and Patents
We consider the trademarks, copyrights, patents, and trade secrets we own, and the licenses we hold, in the aggregate, to be a valuable asset. Whirlpool is the owner of a number of trademarks in the United States and foreign countries. The most important trademarks to North America are
Whirlpool
,
Maytag
,
Jenn-Air
,
KitchenAid
,
Amana
and
Acros
. The most important trademarks to Latin America are
Consul,
Brastemp,
Whirlpool
and
KitchenAid
. The most important trademarks to EMEA are
Whirlpool
,
KitchenAid, Bauknecht, Indesit, Hotpoint
*
, Hotpoint-Ariston
and
Ignis
. The most important trademarks to Asia are
Whirlpool, Royalstar and Diqua
. We receive royalties from licensing our trademarks to third parties to manufacture, sell and service certain products bearing the
Whirlpool, Maytag, KitchenAid,
and
Amana
brand names. We continually apply for and obtain United States and foreign patents. The primary purpose in obtaining patents is to protect our designs and technologies.
Research and Development
Expenditures for research and development relating to new and innovative products and the improvement of existing products were approximately $
604 million
,
$579 million
and
$563 million
in
2016
,
2015
and
2014
, respectively.
Protection of the Environment
Our manufacturing facilities are subject to numerous laws and regulations designed to protect or enhance the environment, many of which require federal, state, or other governmental licenses and permits with regard to wastewater discharges, air emissions, and hazardous waste management. Our policy is to comply with all such laws and regulations. Where laws and regulations are less restrictive, we have established and are following our own standards, consistent with our commitment to environmental responsibility.
*Whirlpool ownership of the Hotpoint brand in the EMEA and Asia Pacific regions is not affiliated with the Hotpoint brand sold in the Americas
4
We believe that we are in compliance, in all material respects, with presently applicable governmental provisions relating to environmental protection in the countries in which we have manufacturing operations. Compliance with these environmental laws and regulations did not have a material effect on capital expenditures, earnings, or our competitive position during
2016
and is not expected to be material in
2017
.
The entire major home appliance industry, including Whirlpool, must contend with the adoption of stricter governmental energy and environmental standards. These standards were phased-in over the past several years and include the general phase-out of ozone-depleting chemicals used in refrigeration, and energy standards for selected major appliances, regulatory restrictions on the materials content specified for use in our products by some jurisdictions and mandated recycling of our products at the end of their useful lives. Compliance with these various standards, as they become effective, will require some product redesign. However, we believe, based on our understanding of the current state of proposed regulations, that we will be able to develop, manufacture, and market products that comply with these regulations.
Whirlpool participates in environmental assessments and cleanup at a number of locations globally. These include operating and non-operating facilities, previously owned properties and waste sites, including "Superfund" (under the Comprehensive Environmental Response, Compensation and Liability Act (CERCLA)) sites. However, based upon our evaluation of the facts and circumstances relating to these sites along with the evaluation of our technical consultants, we do not presently anticipate any material adverse effect upon our earnings, financial condition, or competitive position arising out of the resolution of these matters or the resolution of any other known governmental proceeding regarding environmental protection matters.
Acquisitions
Whirlpool China
On
October 24, 2014
, Whirlpool's wholly-owned subsidiary, Whirlpool (China) Investment Co., Ltd., completed its acquisition of a
51%
equity stake in Hefei Rongshida Sanyo Electric Co., Ltd. ("Hefei Sanyo"), a joint stock company whose shares are listed and traded on the Shanghai Stock Exchange, which we have since renamed to Whirlpool (China) Co., Ltd. ("
Whirlpool China
"). The aggregate purchase price for the transaction was RMB
3.4 billion
(approximately
$551 million
at the date of purchase for each step of the transaction) net of cash acquired.
Indesit
Company S.p.A.
On
December 3, 2014
, Whirlpool completed the final step in its acquisition of Indesit Company S.p.A. ("Indesit") and on the same day Indesit delisted from the Electronic Stock Market organized and managed by Borsa Italiana S.p.A. Total consideration paid for Indesit was
€1.1 billion
(approximately
$1.4 billion
at the dates of purchase of each step in the transaction) in aggregate net of cash acquired.
Further discussion of these transactions can be found in the Financial Condition and Liquidity section of Management's Discussion and Analysis.
Other Information
For information about the challenges and risks associated with our foreign operations, see “Risks Factors” under Item 1A.
For certain other financial information concerning our business segments and foreign and domestic operations, see Note
13
to the Consolidated Financial Statements.
For information on our global restructuring plans, and the impact of these plans on our operating segments, see Note
10
to the Consolidated Financial Statements.
5
Executive Officers of the Registrant
The following table sets forth the names and ages of our executive officers on
February 13, 2017
, the positions and offices they held on that date, and the year they first became executive officers:
|
Name
|
Office
|
First Became
an Executive
Officer
|
Age
|
|||
|
Jeff M. Fettig
|
Director, Chairman of the Board and Chief Executive Officer
|
1994
|
59
|
|||
|
Marc R. Bitzer
|
Director, President and Chief Operating Officer
|
2006
|
52
|
|||
|
Esther Berrozpe Galindo
|
Executive Vice President and President, Whirlpool EMEA
|
2013
|
47
|
|||
|
João C. Brega
|
Executive Vice President and President, Whirlpool Latin America
|
2012
|
53
|
|||
|
Joseph T. Liotine
|
Executive Vice President and President, Whirlpool North America
|
2014
|
44
|
|||
|
James W. Peters
|
Executive Vice President and Chief Financial Officer
|
2016
|
47
|
|||
|
David T. Szczupak
|
Executive Vice President, Global Product Organization
|
2008
|
61
|
|||
The executive officers named above were elected by our Board of Directors to serve in the office indicated until the first meeting of the Board of Directors following the annual meeting of stockholders in
2017
and until a successor is chosen and qualified or until the executive officer's earlier resignation or removal. Each of our executive officers has held the position set forth in the table above or has served Whirlpool in various executive or administrative capacities for at least the past five years.
Available Information
Financial results and investor information (including Whirlpool’s Form 10-K, 10-Q, and 8-K reports) are accessible at Whirlpool’s website:
investors.whirlpoolcorp.com
. Copies of our Form 10-K, 10-Q, and 8-K reports and amendments, if any, are available free of charge through our website on the same day they are filed with, or furnished to, the Securities and Exchange Commission.
6
|
ITEM 1A.
|
RISK FACTORS
|
This report contains statements referring to Whirlpool that are not historical facts and are considered “forward-looking statements” within the meaning of the Private Securities Litigation Reform Act of 1995. These statements, which are intended to take advantage of the “safe harbor” provisions of the Private Securities Litigation Reform Act of 1995, are based on current projections about operations, industry conditions, financial condition and liquidity. Words that identify forward-looking statements include words such as “may,” “could,” “will,” “should,” “possible,” “plan,” “predict,” “forecast,” “potential,” “anticipate,” “estimate,” “expect,” “project,” “intend,” “believe,” “may impact,” “on track,” and words and terms of similar substance used in connection with any discussion of future operating or financial performance, a merger, or our businesses. In addition, any statements that refer to expectations, projections, or other characterizations of future events or circumstances, including any underlying assumptions, are forward-looking statements. Those statements are not guarantees and are subject to risks, uncertainties, and assumptions that are difficult to predict. Therefore, actual results could differ materially and adversely from these forward-looking statements.
We have listed below the most significant strategic, operational, financial, and legal and compliance risks relating to our business.
STRATEGIC RISKS
|
Key Risk
|
Risk Description
|
|
|
We face intense competition in the major home appliance industry and failure to successfully compete could negatively affect our business and financial performance.
|
Each of our operating segments operates in a highly competitive business environment and faces intense competition from a growing number of competitors, many of which have strong consumer brand equity. Several of these competitors, such as Arcelik, Bosch Siemens, Electrolux, Haier, LG, Mabe, Midea, Panasonic and Samsung are large, well-established companies, many ranking among the Global Fortune 150, and have demonstrated a commitment to success in the global market. Moreover, our customer base includes large, sophisticated trade customers who have many choices and demand competitive products, services and prices. Competition in the global appliance market is based on a number of factors including selling price, product features and design, performance, innovation, reputation, energy efficiency, quality, cost, distribution, and financial incentives, such as cooperative advertising, co-marketing funds, sales person incentives, volume rebates and terms. Many of our competitors are increasingly expanding beyond their existing manufacturing footprints. Our competitors, especially global competitors with low-cost sources of supply and/or highly protected home markets outside the United States, have aggressively priced their products and/or introduced new products to increase market share and expand into new geographies. If we are unable to successfully compete in this highly competitive environment, our business and financial performance could be negatively affected.
|
|
|
The loss of, or substantial decline in, sales to any of our key trade customers, major buying groups, and builders could adversely affect our financial performance.
|
We sell to a sophisticated customer base of large trade customers that have significant leverage as buyers over their suppliers. Most of our products are not sold through long-term contracts, allowing trade customers to change volume among suppliers. As the trade customers continue to become larger, they may seek to use their position to improve their profitability by various means, including improved efficiency, lower pricing, and increased promotional programs. If we are unable to meet their demand requirements, our volume growth and financial results could be negatively affected. The loss of, or substantial decline in volume of, sales to our key trade customers, major buying groups, builders, or any other trade customers to which we sell a significant amount of products, could adversely affect our financial performance. Additionally, the loss of market share or financial difficulties, including bankruptcy and financial restructuring, by these trade customers could have a material adverse effect on our liquidity, financial position and results of operations.
|
|
7
|
Failure to maintain our reputation and brand image could negatively impact our business.
|
Our brands have worldwide recognition, and our success depends on our ability to maintain and enhance our brand image and reputation. Maintaining, promoting and growing our brands depends on our marketing efforts, including advertising and consumer campaigns, as well as product innovation. We could be adversely impacted if we fail to achieve any of these objectives or if, whether or not justified, the reputation or image of our company or any of our brands is tarnished or receives negative publicity. In addition, adverse publicity about regulatory or legal action against us, or product quality issues, could damage our reputation and brand image, undermine our customers' confidence in us and reduce long-term demand for our products, even if the regulatory or legal action is unfounded or not material to our operations.
In addition, our success in maintaining, extending and expanding our brand image depends on our ability to adapt to a rapidly changing media environment, including our increasing reliance on social media and online dissemination of advertising campaigns. Inaccurate or negative posts or comments about us on social networking and other websites that spread rapidly through such forums could seriously damage our reputation and brand image. If we do not maintain, extend and expand our brand image, then our product sales, financial condition and results of operations could be materially and adversely affected.
|
|
|
An inability to effectively execute and manage our business objectives could adversely affect our financial performance.
|
The highly competitive nature of our industry requires that we effectively execute and manage our business objectives including our global operating platform initiative. Our global operating platform initiative aims to reduce costs, expand margins, drive productivity and quality improvements, accelerate our rate of innovation, and drive shareholder value. Our inability to effectively control costs and drive productivity improvements could affect our profits. In addition, our inability to provide high-quality, innovative products could adversely affect our ability to maintain or increase our sales, which could negatively affect our revenues and overall financial performance. Additionally, our success is dependent on anticipating and appropriately reacting to changes in customer preferences and on successful new product and process development and product relaunches in response to such changes. Our future results and our ability to maintain or improve our competitive position will depend on our capacity to gauge the direction of our key markets and upon our ability to successfully and timely identify, develop, manufacture, market, and sell new or improved products in these changing markets.
|
|
|
Our intellectual property rights are valuable, and any inability to protect them could reduce the value of our products, services and brands.
|
We consider our intellectual property rights, including patents, trademarks, copyrights and trade secrets, and the licenses we hold, to be a significant part and valuable aspect of our business. We attempt to protect our intellectual property rights through a combination of patent, trademark, copyright and trade secret laws, as well as licensing agreements and third party nondisclosure and assignment agreements. Our failure to obtain or adequately protect our trademarks, products, new features of our products, or our processes may diminish our competitiveness.
We have applied for intellectual property protection in the United States and other jurisdictions with respect to certain innovations and new products, design patents, product features, and processes. We cannot be assured that the U.S. Patent and Trademark Office or any similar authority in other jurisdictions will approve any of our patent applications. Additionally, the patents we own could be challenged or invalidated, others could design around our patents or the patents may not be of sufficient scope or strength to provide us with any meaningful protection or commercial advantage. Further, the laws of certain foreign countries in which we do business, or contemplate doing business in the future, do not recognize intellectual property rights or protect them to the same extent as United States law. As a result, these factors could weaken our competitive advantage with respect to our products, services, and brands in foreign jurisdictions, which could adversely affect our financial performance.
Moreover, while we do not believe that any of our products infringe on enforceable intellectual property rights of third parties, others may assert intellectual property rights that cover some of our technology, brands, products, or services. Any litigation regarding patents or other intellectual property could be costly and time-consuming and could divert the attention of our management and key personnel from our business operations. Claims of intellectual property infringement might also require us to enter into costly license agreements or modify our products or services. We also may be subject to significant damages, injunctions against development and sale of certain products or services, or limited in the use of our brands.
|
|
8
OPERATIONAL RISKS
|
Key Risk
|
Risk Description
|
|
|
We face risks associated with our acquisitions and other investments and risks associated with our increased presence in emerging markets.
|
From time to time, we make strategic acquisitions, investments and participate in joint ventures. For example, we acquired Indesit and a majority interest in Hefei Sanyo in the fourth quarter of 2014. These transactions, and other transactions that we have entered into or which we may enter into in the future, can involve significant challenges and risks, including that the transaction does not advance our business strategy or fails to produce a satisfactory return on our investment. We may encounter difficulties in integrating acquisitions with our operations, applying our internal control processes to these acquisitions, and in managing strategic investments. Integrating acquisitions is often costly and may require significant attention from management. Furthermore, we may not realize the degree, or timing, of benefits we anticipate when we first enter into a transaction. While our evaluation of any potential acquisition includes business, legal and financial due diligence with the goal of identifying and evaluating the material risks involved, our due diligence reviews may not identify all of the issues necessary to accurately estimate the cost and potential loss contingencies of a particular transaction, including potential exposure to regulatory sanctions resulting from an acquisition target’s previous activities or costs associated with any quality issues with an acquisition target's legacy products.
Our growth plans include efforts to increase revenue from emerging markets, including through acquisitions. Local business practices in these countries may not comply with U.S. laws, local laws or other laws applicable to us or our compliance policies, which non-compliant practices may result in increased liability risks. For example, we may incur unanticipated costs, expenses or other liabilities as a result of an acquisition target’s violation of applicable laws, such as the U.S. Foreign Corrupt Practices Act (FCPA) or similar worldwide anti-bribery laws in non-U.S. jurisdictions. We may incur unanticipated costs or expenses, including post-closing asset impairment charges, expenses associated with eliminating duplicate facilities, litigation, and other liabilities. In addition, our recent and future acquisitions may increase our exposure to other risks associated with operating internationally, including foreign currency exchange rate fluctuations; political, legal and economic instability; inflation; changes in tax rates and tax laws; and work stoppages and labor relations.
|
|
9
|
Risks associated with our international operations may decrease our revenues and increase our costs.
|
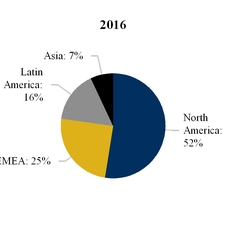
For the year ended December 31, 2016, international operations represent approximately 54% of our net sales, including 25% in EMEA, 16% in Latin America, 7% in Asia, 4% in Canada and 2% in Mexico. We expect that international sales will continue to account for a significant percentage of our net sales in the foreseeable future. Accordingly, we face numerous risks associated with conducting international operations, any of which could negatively affect our financial performance. These risks include the following:
•political, legal, and economic instability and uncertainty;
•foreign currency exchange rate fluctuations;
•changes in foreign tax rules, regulations and other requirements, such as changes in tax rates
and statutory and judicial interpretations of tax laws;
•changes in diplomatic and trade relationships, including sanctions resulting from the current
political situation in countries in which we do business;
•inflation and/or deflation
•changes in foreign country regulatory requirements;
•various import/export restrictions and disruptions and the availability of required
import/export licenses;
•imposition of tariffs and other trade barriers;
•managing widespread operations and enforcing internal policies and procedures such as
compliance with U.S. and foreign anti-bribery and anti-corruption regulations, such as the
FCPA, and antitrust laws;
•labor disputes and work stoppages at our operations and suppliers;
•government price controls;
•the inability to collect accounts receivable; and
•limitations on the repatriation or movement of earnings and cash.
As a U.S. corporation, we are subject to the FCPA, which may place us at a competitive disadvantage to foreign companies that are not subject to similar regulations. Additionally, any determination that we have violated the FCPA or other anti-corruption laws could have a material adverse effect on us.
Terrorist attacks, armed conflicts, civil unrest, natural disasters, governmental actions and epidemics could affect our domestic and international sales, disrupt our supply chain, and impair our ability to produce and deliver our products. Such events could directly impact our physical facilities or those of our suppliers or customers.
|
|
|
We may be subject to information technology system failures, network disruptions, cybersecurity attacks and breaches in data security, which may materially adversely affect our operations, financial condition and operating results.
|
We depend on information technology to improve the effectiveness of our operations and to interface with our customers, as well as to maintain financial accuracy and efficiency. Information technology system failures, including suppliers' or vendors' system failures, could disrupt our operations by causing transaction errors, processing inefficiencies, delays or cancellation of customer orders, the loss of customers, impediments to the manufacture or shipment of products, other business disruptions, or the loss of or damage to intellectual property through security breach.
In addition, we have outsourced certain information technology support services and administrative functions, such as payroll processing and benefit plan administration, to third-party service providers and may outsource other functions in the future to achieve cost savings and efficiencies. If these service providers do not perform effectively, we may not achieve the expected cost savings and may incur additional costs to correct errors made by such service providers. Depending on the function involved, such errors may also lead to business disruption, processing inefficiencies or the loss of or damage to intellectual property through security breach, or harm employee morale.
Our information systems, or those of our third-party service providers, could also be penetrated by outside parties intent on extracting or corrupting information or disrupting business processes. Such unauthorized access could disrupt our business and could result in the loss of assets. Cybersecurity attacks are becoming more sophisticated and include malicious software, attempts to gain unauthorized access to data, and other electronic security breaches that could lead to disruptions in critical systems, unauthorized release of confidential or otherwise protected information, and corruption of data. These events could impact our customers and reputation and lead to financial losses from remediation actions, loss of business or potential liability or an increase in expense, all of which may have a material adverse effect on our business.
|
|
10
|
Product-related liability or product recall costs could adversely affect our business and financial performance.
|
We may be exposed to product-related liabilities, which in some instances may result in product redesigns, product recalls, or other corrective action. In addition, any claim or product recall that results in significant adverse publicity, particularly if those claims or recalls cause customers to question the safety or reliability of our products, may negatively affect our business, financial condition, or results of operations. We maintain product liability insurance, but it may not be adequate to cover losses related to product liability claims brought against us. Product liability insurance could become more expensive and difficult to maintain and may not be available on commercially reasonable terms, if at all. We may also be involved in certain class action and other litigation, for which no insurance is available. A cost effective market for product recall insurance does not exist, so any product recall we initiate could have a significant impact on our operating results and/or cash flows.
We regularly engage in investigations of potential quality and safety issues as part of our ongoing effort to deliver quality products to our customers. We are currently investigating a limited number of potential quality and safety issues, and as appropriate, we undertake to effect repair or replacement of appliances. Currently we are implementing a corrective action plan affecting certain of our
Indesit
and
Hotpoint
*
branded dryers (see Note 6 of the Notes to the Consolidated Financial Statements for additional information on these matters). Actual costs of these and any future issues depend upon several factors, including the number of consumers who respond to a particular recall, repair and administrative costs, whether the cost of any corrective action is borne by Whirlpool or the supplier, and, if borne by Whirlpool, whether we will be successful in recovering our costs from the supplier. The actual costs incurred as a result of these issues and any future issues could have a material adverse effect on our business, financial condition or results of operations.
|
|
|
The ability of suppliers to deliver parts, components and manufacturing equipment to our manufacturing facilities, and our ability to manufacture without disruption, could affect our global business performance.
|
We use a wide range of materials and components in the global production of our products, which come from numerous suppliers. Because not all of our business arrangements provide for guaranteed supply and some key parts may be available only from a single supplier or a limited group of suppliers, we are subject to supply and pricing risk. In addition, certain proprietary component parts used in some of our products are provided by single-source unaffiliated third-party suppliers. We would be unable to obtain these proprietary components for an indeterminate period of time if these single-source suppliers were to cease or interrupt production or otherwise fail to supply these components to us, which could adversely affect our product sales and operating results. Our operations and those of our suppliers are subject to disruption for a variety of reasons, including work stoppages, labor relations, intellectual property claims against suppliers, information technology failures, and hazards such as fire, earthquakes, flooding, or other natural disasters, insurance for any of which may not be available, affordable or adequate. Such disruption could interrupt our ability to manufacture certain products. Any significant disruption could negatively impact our revenue and/or earnings performance.
|
|
|
Our ability to attract, develop and retain executives and other qualified employees is crucial to our results of operations and future growth.
|
We depend upon the continued services and performance of our key executives, senior management and skilled personnel, particularly professionals with experience in our business and operations and the home appliance industry. We cannot be sure that any of these individuals will continue to be employed by us. Significant time is required to hire and develop skilled replacement personnel. An inability to hire, develop, engage and retain a sufficient number of qualified employees could materially hinder our business by, for example, delaying our ability to bring new products to market or impairing the success of our operations.
|
|
|
A deterioration in labor relations could adversely impact our global business.
|
As of December 31, 2016, we had approximately 93,000 employees. We are subject to separate collective bargaining agreements with certain labor unions, which generally have two to three year terms, as well as various other commitments regarding our workforce. We periodically negotiate with certain unions representing our employees and may be subject to work stoppages or may be unable to renew collective bargaining agreements on the same or similar terms, or at all, all of which may also have a material adverse effect on our business, financial condition, or results of operations.
|
|
*Whirlpool ownership of the Hotpoint brand in the EMEA and Asia Pacific regions is not affiliated with the Hotpoint brand sold in the Americas
11
FINANCIAL RISKS
|
Key Risk
|
Risk Description
|
|
|
Fluctuations and volatility in the cost of raw materials and purchased components could adversely affect our operating results.
|
The sources and prices of the primary materials (such as steel, resins, and base metals) used to manufacture our products and components containing those materials are susceptible to significant global and regional price fluctuations due to supply/demand trends, transportation costs, government regulations (such as conflict mineral provisions) and tariffs, changes in currency exchange rates, price controls, the economic climate, and other unforeseen circumstances. Significant increases in these and other costs in the future could have a material adverse effect on our operating results.
|
|
|
Foreign currency fluctuations may affect our financial performance.
|
We generate a significant portion of our revenue and incur a significant portion of our expenses in foreign currencies. Changes in the exchange rates of functional currencies of those operations affect the U.S. dollar value of our revenue and earnings from our foreign operations. We use currency forwards, net investment hedges, and options to manage our foreign currency transaction exposures. We cannot completely eliminate our exposure to foreign currency fluctuations, which may adversely affect our financial performance. In addition, because our consolidated financial results are reported in U.S. dollars, if we generate sales or earnings in other currencies, the translation of those results into U.S. dollars can result in a significant increase or decrease in the amount of those sales or earnings. Finally, the amount of legal contingencies related to foreign operations may fluctuate significantly based upon changes in exchange rates and usually cannot be managed with currency forwards, options or other arrangements. Such fluctuations in exchange rates can significantly increase or decrease the amount of any legal contingency related to our foreign operations and make it difficult to assess and manage the potential exposure.
|
|
|
We face inventory and other asset risk.
|
We write down product and component inventories that have become obsolete or do not meet anticipated demand or net realizable value. We also review our long-lived and intangible assets for impairment whenever events or changed circumstances indicate the carrying amount of an asset may not be recoverable. If we determine that impairment has occurred, we record a write-down to adjust carrying value to fair value. No assurance can be given that, given the unpredictable pace of product obsolescence and business conditions with trade customers and in general, we will not incur additional inventory or asset related charges. Such charges could negatively affect our financial condition and operating results.
|
|
12
|
We are exposed to risks associated with the uncertain global economy.
|
Uncertain and changing economic conditions within our regions, along with national debt and fiscal concerns in various regions and government austerity measures, are posing challenges to the industry in which Whirlpool operates. A number of economic factors, including gross domestic product, availability of consumer credit, interest rates, consumer sentiment and debt levels, retail trends, housing starts, sales of existing homes, the level of mortgage refinancing and defaults, fiscal and credit market uncertainty, and foreign currency exchange rates, generally affect demand for our products.
Economic uncertainty and related factors exacerbate negative trends in business and consumer spending and may cause certain customers to push out, cancel, or refrain from placing orders for our products. Uncertain market conditions, difficulties in obtaining capital, or reduced profitability may also cause some customers to scale back operations, exit markets, merge with other retailers, or file for bankruptcy protection and potentially cease operations, which can also result in lower sales and/or additional inventory. These conditions may similarly affect key suppliers, which could impair their ability to deliver parts and result in delays for our products or added costs. In addition, these conditions may lead to strategic alliances by, or consolidation of, other appliance manufacturers, which could adversely affect our ability to compete effectively.
A decline in economic activity and conditions in certain areas in which we operate have had an adverse effect on our financial condition and results of operations in recent years, and future declines and adverse conditions could have a similar adverse effect. Regional, political and economic instability in countries in which we do business may adversely affect business conditions, disrupt our operations, and have an adverse effect on our financial condition and results of operations. Uncertainty about future economic and industry conditions also makes it more challenging for us to forecast our operating results, make business decisions, and identify and prioritize the risks that may affect our businesses, sources and uses of cash, financial condition and results of operations. We may be required to implement additional cost reduction efforts, including restructuring activities, which may adversely affect our ability to capitalize on opportunities in a market recovery. In addition, our operations are subject to general credit, liquidity, foreign exchange, market and interest rate risks. Our ability to invest in our businesses, fund strategic acquisitions and refinance maturing debt obligations depends in part on access to the capital markets.
If we do not timely and appropriately adapt to changes resulting from the uncertain macroeconomic environment and industry conditions, or to difficulties in the financial markets, or if we are unable to continue to access the capital markets, our business, financial condition and results of operations may be materially and adversely affected.
|
|
|
Significant differences between actual results and estimates of the amount of future funding for our pension plans and postretirement health care benefit programs, and significant changes in funding assumptions or significant increases in funding obligations due to regulatory changes, could adversely affect our financial results.
|
We have both funded and unfunded defined benefit pension plans that cover certain employees around the world. We also have unfunded postretirement health care benefit plans for eligible retired employees. The Employee Retirement Income Security Act of 1974 (ERISA) and the Internal Revenue Code, as amended, govern the funding obligations for our U.S. pension plans, which are our principal pension plans. Our U.S. defined benefit plans were frozen as of December 31, 2006 for substantially all participants. For 2007 and beyond, Whirlpool employees may participate in an enhanced defined contribution plan.
As of December 31, 2016, our projected benefit obligations under our pension plans and postretirement health and welfare benefit programs exceeded the fair value of plan assets by an aggregate of approximately $1.5 billion, ($1.1 billion of which was attributable to pension plans and $0.4 billion of which was attributable to postretirement health care benefits). Estimates for the amount and timing of the future funding obligations of these pension plans and postretirement health and welfare benefit plans are based on various assumptions. These assumptions include discount rates, expected long-term rate of return on plan assets, life expectancies and health care cost trend rates. These assumptions are subject to change based on changes in interest rates on high quality bonds, stock and bond market returns, and health care cost trend rates, all of which are largely outside our control. Significant differences in results or significant changes in assumptions may materially affect our postretirement obligations and related future contributions and expenses.
|
|
13
LEGAL & COMPLIANCE RISKS
|
Key Risk
|
Risk Description
|
|
|
Unfavorable results of legal and regulatory proceedings could materially adversely affect our business and financial condition and performance.
|
We are subject to a variety of litigation and legal compliance risks relating to, among other things, products, intellectual property rights, income and non-income taxes, environmental matters, corporate matters, commercial matters, competition laws and distribution, marketing and trade practices, anti-bribery, anti-corruption, energy regulations, and employment and benefit matters. For example, we are currently disputing certain income and non-income tax related assessments issued by the Brazilian authorities (see Note 6 and Note 11 of the Notes to the Consolidated Financial Statements for additional information on these matters). Unfavorable outcomes regarding these assessments could have a material adverse effect on our financial position, liquidity, or results of operations in any particular reporting period. Results of such proceedings cannot be predicted with certainty and for some matters, such as class actions, no insurance is cost effectively available. Regardless of merit, such proceedings may be both time-consuming and disruptive to our operations and could divert the attention of our management and key personnel from our business operations. We estimate loss contingencies and establish accruals as required by generally accepted accounting principles, based on our assessment of contingencies where liability is deemed probable and reasonably estimable, in light of the facts and circumstances known to us at a particular point in time. Subsequent developments in legal proceedings, volatility in foreign currency exchange rates and other factors may affect our assessment and estimates of the loss contingency recorded and could result in an adverse effect on our results of operations in the period in which a liability would be recognized or cash flows for the period in which amounts would be paid. Actual results may significantly vary from our reserves.
|
|
|
We are subject to, and could be further subject to, governmental investigations or actions by other third parties.
|
We are subject to various federal, foreign and state laws, including antitrust laws, violations of which can involve civil or criminal sanctions. Responding to governmental investigations or other actions may be both time-consuming and disruptive to our operations and could divert the attention of our management and key personnel from our business operations. The impact of these and other investigations and lawsuits could have a material adverse effect on our financial position, liquidity and results of operations.
|
|
|
Changes in the legal and regulatory environment could limit our business activities, increase our operating costs, reduce demand for our products or result in litigation.
|
The conduct of our businesses, and the production, distribution, sale, advertising, labeling, safety, transportation and use of many of our products, are subject to various laws and regulations administered by federal, state and local governmental agencies in the United States, as well as to foreign laws and regulations administered by government entities and agencies in markets in which we operate. These laws and regulations may change, sometimes dramatically, as a result of political, economic or social events. Changes in laws, regulations or governmental policy and the related interpretations may alter the environment in which we do business and may impact our results or increase our costs or liabilities. In addition, we incur and will continue to incur capital and other expenditures to comply with various laws and regulations, especially relating to protection of the environment, human health and safety and energy efficiency. These types of costs could adversely affect our financial performance. Additionally, we could be subjected to future liabilities, fines or penalties or the suspension of product production for failing to comply with various laws and regulations, including environmental regulations. Cleanup obligations that might arise at any of our manufacturing sites or the imposition of more stringent environmental laws in the future could adversely affect us.
|
|
14
|
ITEM 1B.
|
UNRESOLVED STAFF COMMENTS
|
None.
|
ITEM 2.
|
PROPERTIES
|
Our principal executive offices are located in Benton Harbor, Michigan. On
December 31, 2016
, our principal manufacturing operations were carried on at
42
locations in
14
countries worldwide. We occupied a total of approximately
86.4 million
square feet devoted to manufacturing, service, sales and administrative offices, warehouse and distribution space. Over
37.9 million
square feet of such space was occupied under lease. Whirlpool properties include facilities which are suitable and adequate for the manufacture and distribution of Whirlpool’s products. The Company’s principal manufacturing sites by operating segment were as follows:
|
Segment
|
Country
|
Principal Manufacturing Locations
|
|
North America
|
United States
|
10
|
|
Mexico
|
3
|
|
|
Europe, Middle East and Africa
|
France
|
1
|
|
Italy
|
5
|
|
|
Poland
|
3
|
|
|
Russia
|
1
|
|
|
Slovakia
|
1
|
|
|
South-Africa
|
1
|
|
|
Turkey
|
1
|
|
|
United Kingdom
|
1
|
|
|
Latin America
|
Brazil
|
4
|
|
China
|
1
|
|
|
Colombia
|
1
|
|
|
Italy
|
1
|
|
|
Slovakia
|
1
|
|
|
Mexico
|
1
|
|
|
Asia
|
China
|
3
|
|
India
|
3
|
|
|
Total
|
42
|
|
|
ITEM 3.
|
LEGAL PROCEEDINGS
|
Information regarding legal proceedings can be found in Note
6
to the Consolidated Financial Statements and is incorporated herein by reference.
|
ITEM 4.
|
MINE SAFETY DISCLOSURES
|
Not applicable.
15
|
|
||||
|
ITEM 5.
|
MARKET FOR REGISTRANT’S COMMON EQUITY, RELATED STOCKHOLDER MATTERS
|
|
AND ISSUER PURCHASES OF EQUITY SECURITIES
|
|
Whirlpool’s common stock is traded on the New York Stock Exchange and the Chicago Stock Exchange. As of
February 3, 2017
, the number of holders of record of Whirlpool common stock was approximately
10,474
.
Quarterly market and dividend information can be found in Note
14
to the Consolidated Financial Statements.
On April 14, 2014, our Board of Directors authorized a share repurchase program of up to
$500 million
. During the first quarter of 2016, we repurchased
1,507,100
shares at an aggregate purchase price of approximately
$225 million
under this program. As of March 31, 2016, there were no remaining funds authorized under this program.
On
April 18, 2016
, our Board of Directors authorized a new share repurchase program of up to
$1 billion
. For the year ended
December 31, 2016
, we repurchased
1,749,600
shares at an aggregate purchase price of approximately
$300 million
under this program. At
December 31, 2016
, there were approximately
$700 million
in remaining funds authorized under this program.
Share repurchases are made from time to time on the open market as conditions warrant. The program does not obligate us to repurchase any of our shares.
The following table summarizes repurchases of Whirlpool's common stock in the
three months ended
December 31, 2016
:
|
Period (Millions of dollars, except number and price per share)
|
Total Number of Shares Purchased
|
Average Price Paid per Share
|
Total Number of Shares Purchased as Part of Publicly Announced Plans or Programs
|
Approximate Dollar Value of Shares that May Yet Be Purchased Under the Plan
|
|||||
|
October 1, 2016 through October 31, 2016
|
265,000
|
|
$
|
150.89
|
265,000
|
|
$
|
760
|
|
|
November 1, 2016 through November 30, 2016
|
396,200
|
|
151.37
|
396,200
|
|
700
|
|
||
|
December 1, 2016 through December 31, 2016
|
—
|
|
—
|
—
|
|
700
|
|
||
|
Total
|
661,200
|
|
$
|
151.17
|
661,200
|
|
|||
16
|
ITEM 6.
|
SELECTED FINANCIAL DATA
|
FIVE-YEAR SELECTED FINANCIAL DATA
|
(Millions of dollars, except share and employee data)
|
2016
|
2015
|
2014
|
2013
|
2012
|
|||||||||||||||
|
CONSOLIDATED OPERATIONS
|
|
|
|
|
|
|||||||||||||||
|
Net sales
|
$
|
20,718
|
|
$
|
20,891
|
|
$
|
19,872
|
|
$
|
18,769
|
|
$
|
18,143
|
|
|||||
|
Restructuring costs
|
173
|
|
201
|
|
136
|
|
196
|
|
237
|
|
||||||||||
|
Depreciation and amortization
|
655
|
|
668
|
|
560
|
|
540
|
|
551
|
|
||||||||||
|
Operating profit
|
1,354
|
|
1,285
|
|
1,188
|
|
1,249
|
|
869
|
|
||||||||||
|
Earnings before income taxes and other items
|
1,114
|
|
1,031
|
|
881
|
|
917
|
|
558
|
|
||||||||||
|
Net earnings
|
928
|
|
822
|
|
692
|
|
849
|
|
425
|
|
||||||||||
|
Net earnings available to Whirlpool
|
888
|
|
783
|
|
650
|
|
827
|
|
401
|
|
||||||||||
|
Capital expenditures
|
660
|
|
689
|
|
720
|
|
578
|
|
476
|
|
||||||||||
|
Dividends paid
|
294
|
|
269
|
|
224
|
|
187
|
|
155
|
|
||||||||||
|
CONSOLIDATED FINANCIAL POSITION
|
|
|
|
|
|
|||||||||||||||
|
Current assets
|
$
|
7,339
|
|
$
|
7,325
|
|
$
|
8,098
|
|
$
|
7,022
|
|
$
|
6,827
|
|
|||||
|
Current liabilities
|
7,662
|
|
7,744
|
|
8,403
|
|
6,794
|
|
6,510
|
|
||||||||||
|
Accounts receivable, inventories and accounts payable, net
|
918
|
|
746
|
|
778
|
|
548
|
|
694
|
|
||||||||||
|
Property, net
|
3,810
|
|
3,774
|
|
3,981
|
|
3,041
|
|
3,034
|
|
||||||||||
|
Total assets
|
19,153
|
|
19,010
|
|
20,002
|
|
15,544
|
|
15,396
|
|
||||||||||
|
Long-term debt
|
3,876
|
|
3,470
|
|
3,544
|
|
1,846
|
|
1,944
|
|
||||||||||
|
Total debt
(1)
|
4,470
|
|
3,998
|
|
4,347
|
|
2,463
|
|
2,461
|
|
||||||||||
|
Whirlpool stockholders’ equity
|
4,773
|
|
4,743
|
|
4,885
|
|
4,924
|
|
4,260
|
|
||||||||||
|
PER SHARE DATA
|
|
|
|
|
|
|||||||||||||||
|
Basic net earnings available to Whirlpool
|
$
|
11.67
|
|
$
|
9.95
|
|
$
|
8.30
|
|
$
|
10.42
|
|
$
|
5.14
|
|
|||||
|
Diluted net earnings available to Whirlpool
|
11.50
|
|
9.83
|
|
8.17
|
|
10.24
|
|
5.06
|
|
||||||||||
|
Dividends
|
3.90
|
|
3.45
|
|
2.88
|
|
2.38
|
|
2.00
|
|
||||||||||
|
Book value
(2)
|
61.82
|
|
59.54
|
|
61.39
|
|
60.97
|
|
53.70
|
|
||||||||||
|
Closing Stock Price—NYSE
|
181.77
|
|
146.87
|
|
193.74
|
|
156.86
|
|
101.75
|
|
||||||||||
|
KEY RATIOS
|
|
|
|
|
|
|||||||||||||||
|
Operating profit margin
|
6.5
|
%
|
6.2
|
%
|
6.0
|
%
|
6.7
|
%
|
4.8
|
%
|
||||||||||
|
Pre-tax margin
(3)
|
5.4
|
%
|
4.9
|
%
|
4.4
|
%
|
4.9
|
%
|
3.1
|
%
|
||||||||||
|
Net margin
(4)
|
4.3
|
%
|
3.7
|
%
|
3.3
|
%
|
4.4
|
%
|
2.2
|
%
|
||||||||||
|
Return on average Whirlpool stockholders’ equity
(5)
|
18.7
|
%
|
16.3
|
%
|
13.3
|
%
|
18.0
|
%
|
9.5
|
%
|
||||||||||
|
Return on average total assets
(6)
|
4.7
|
%
|
4.0
|
%
|
3.7
|
%
|
5.3
|
%
|
2.6
|
%
|
||||||||||
|
Current assets to current liabilities
|
1.0
|
|
0.9
|
|
1.0
|
|
1.0
|
|
1.0
|
|
||||||||||
|
Total debt as a percent of invested capital
(7)
|
43.8
|
%
|
41.3
|
%
|
42.9
|
%
|
33.0
|
%
|
36.0
|
%
|
||||||||||
|
Price earnings ratio
(8)
|
15.8
|
|
14.9
|
|
23.7
|
|
15.3
|
|
20.1
|
|
||||||||||
|
OTHER DATA
|
|
|
|
|
|
|||||||||||||||
|
Common shares outstanding (in thousands):
|
||||||||||||||||||||
|
Average number—on a diluted basis
|
77,211
|
|
79,667
|
|
79,578
|
|
80,761
|
|
79,337
|
|
||||||||||
|
Year-end common shares outstanding
|
74,465
|
|
77,221
|
|
77,956
|
|
77,417
|
|
78,407
|
|
||||||||||
|
Year-end number of stockholders
|
10,528
|
|
10,663
|
|
11,225
|
|
11,889
|
|
12,759
|
|
||||||||||
|
Year-end number of employees
|
93,000
|
|
97,000
|
|
100,000
|
|
69,000
|
|
68,000
|
|
||||||||||
|
Five-year annualized total return to stockholders
(9)
|
33.6
|
%
|
13.0
|
%
|
22.0
|
%
|
34.0
|
%
|
7.6
|
%
|
||||||||||
(1) Total debt includes notes payable and current and long-term debt.
(2) Total Whirlpool stockholders’ equity divided by average number of shares on a diluted basis.
(3) Earnings (loss) before income taxes, as a percent of net sales.
(4) Net earnings available to Whirlpool, as a percent of net sales.
(5) Net earnings available to Whirlpool, divided by average Whirlpool stockholders’ equity.
(6) Net earnings available to Whirlpool, divided by average total assets.
(7) Total debt divided by total debt and total stockholders’ equity.
(8) Closing stock price divided by diluted net earnings available to Whirlpool.
(9) Stock appreciation plus reinvested dividends, divided by share price at the beginning of the period.
17
|
ITEM 7.
|
MANAGEMENT’S DISCUSSION AND ANALYSIS OF FINANCIAL CONDITION AND
|
|
RESULTS OF OPERATIONS
|
|
This Management Discussion and Analysis should be read in connection with the Consolidated Financial Statements, Notes to the Consolidated Financial Statements and Selected Financial Data included in this Form 10-K. Certain references to particular information in the Notes to the Consolidated Financial Statements are made to assist readers.
ABOUT WHIRLPOOL
Whirlpool is the number one major appliance manufacturer in the world with net sales of approximately
$21 billion
in
2016
. We are a leading producer of major home appliances in North America, Europe and Latin America, and have a significant presence throughout China and India. We have received worldwide recognition for accomplishments in a variety of business and social efforts, including leadership, diversity, innovative product design, business ethics, social responsibility and community involvement. We conduct our business through four reportable segments, which we define based on geography. Our reportable segments consist of North America, EMEA, Latin America and Asia. Our customer base includes large, sophisticated trade customers who have many choices and demand competitive products, services and prices. The major home appliance industry operates in an intensely competitive environment, reflecting the impact of both new and established global competitors, including Asian and European manufacturers.
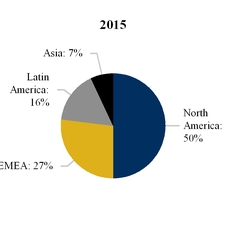
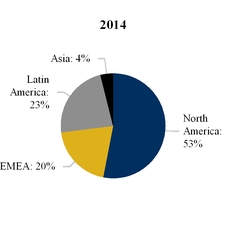
The charts below summarize the balance of net sales by reportable segment for
2016
,
2015
and
2014
, respectively:
We monitor country-specific economic factors such as gross domestic product, unemployment, consumer confidence, retail trends, housing starts and completions, sales of existing homes and mortgage interest rates as key indicators of industry demand. In addition to profitability, we also focus on country, brand, product and channel sales when assessing and forecasting financial results.
Our leading portfolio of brands includes
Whirlpool, Maytag, KitchenAid, Embraco, Brastemp, Consul
and
Indesit
. Our global branded consumer products strategy is to introduce innovative new products, increase brand customer loyalty, expand our presence outside the United States, enhance our trade management platform, improve total cost and quality by expanding and leveraging our global operating platform and, where appropriate, make strategic acquisitions and investments.
As we grow revenues in our core products, our strategy is to extend our business by offering products and services that are dependent on and related to our core business and expand into adjacent products, such as
Affresh
cleaners
and
Gladiator
GarageWorks
,
through businesses that leverage our core competencies and business infrastructure.
OVERVIEW
During 2016, we had another year of strong performance for Whirlpool Corporation, as we delivered record results through strong operational execution and decisive actions to adjust to changes in global markets.
Over the last few years, macroeconomic volatility has been a factor in many of the countries where we operate. We continued to experience volatility during 2016. The Brexit decision in June had a negative impact on British currency and demand, while uncertainty in emerging markets generated additional currency and demand weakness, especially in Brazil, Russia and China.
18
MANAGEMENT'S DISCUSSION AND ANALYSIS OF FINANCIAL CONDITION AND
RESULTS OF OPERATIONS - (CONTINUED)
These challenges, along with a further strengthening U.S. dollar, had a combined negative impact of approximately $600 million in revenue and $2 per share of earnings.
Our earnings growth and strong cash generation enabled us to create long-term shareholder value through the execution of our balanced capital allocation approach. We invested in our innovation pipeline through $660 million in capital expenditures while increasing our dividend by 11% and repurchasing $525 million in common stock. These investments continue to be supported by a strong balance sheet, an increased capacity to invest and the confidence that our operating plans will deliver extraordinary levels of shareholder value both now and in the future.
Our long-term value creation framework is built upon the strong foundation we have in place: our industry-leading brand portfolio and robust product innovation pipeline, supported by our best cost global operating platform and executed by our exceptional employees throughout the world. We will measure these value-creation components by focusing on the following key metrics:
|
•
|
Deliver 3 to 5 percent annual organic net sales growth across our global footprint
|
|
•
|
Grow earnings per share by 10 to 15 percent annually
|
|
•
|
Expand EBIT margins to 10 percent plus by 2020 through strong cost productivity programs and further leveraging our strong brands and innovative new products
|
|
•
|
Generate free cash flow of 5 to 6 percent of net sales by 2018, which represents over 85 percent earnings to free cash conversion
|
We remain confident in our ability to effectively manage our business regardless of the operating environment and expect to continue delivering long-term value for all of our shareholders.
RESULTS OF OPERATIONS
The following table summarizes the consolidated results of operations:
|
December 31,
|
||||||||||||||||
|
Consolidated - Millions of dollars (except per share data)
|
2016
|
Better/(Worse)
|
2015
|
Better/(Worse)
|
2014
|
|||||||||||
|
Net sales
|
$
|
20,718
|
|
(0.8)%
|
$
|
20,891
|
|
5.1%
|
$
|
19,872
|
|
|||||
|
Gross margin
|
3,682
|
|
(0.2)
|
3,690
|
|
8.7
|
3,395
|
|
||||||||
|
Selling, general and administrative
|
2,084
|
|
2.2
|
2,130
|
|
(4.6)
|
2,038
|
|
||||||||
|
Restructuring costs
|
173
|
|
13.9
|
201
|
|
(48.2)
|
136
|
|
||||||||
|
Interest and sundry (income) expense
|
79
|
|
11.2
|
89
|
|
36.7
|
142
|
|
||||||||
|
Interest expense
|
161
|
|
2.4
|
165
|
|
—
|
165
|
|
||||||||
|
Income tax expense
|
186
|
|
11.3
|
209
|
|
(10.1)
|
189
|
|
||||||||
|
Net earnings available to Whirlpool
|
888
|
|
13.4
|
783
|
|
20.4
|
650
|
|
||||||||
|
Diluted net earnings available to Whirlpool per share
|
$
|
11.50
|
|
17.0%
|
$
|
9.83
|
|
20.3%
|
$
|
8.17
|
|
|||||
Consolidated Net Sales
The following charts summarize units sold and consolidated net sales by operating segment:
19
MANAGEMENT'S DISCUSSION AND ANALYSIS OF FINANCIAL CONDITION AND
RESULTS OF OPERATIONS - (CONTINUED)

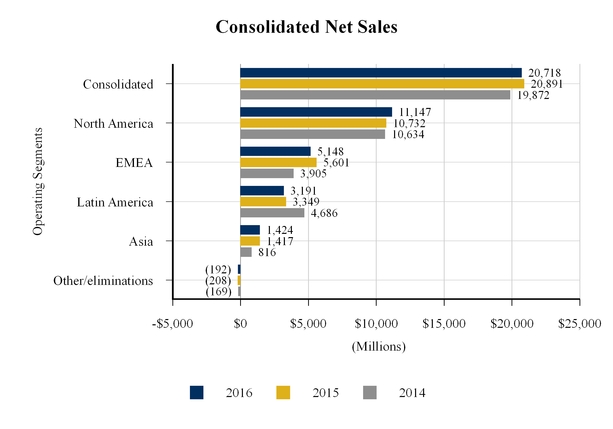
20
MANAGEMENT'S DISCUSSION AND ANALYSIS OF FINANCIAL CONDITION AND
RESULTS OF OPERATIONS - (CONTINUED)
Consolidated net sales
decrease
d
0.8%
compared to
2015
primarily driven by unfavorable impacts from foreign currency and product price/mix, partially offset by higher unit volumes. Excluding the impact of foreign currency, consolidated net sales
increased 1.6%
compared to
2015
. Consolidated net sales for
2015
increase
d
5.1%
compared to
2014
primarily driven by increased volume due to acquisitions and favorable product price/mix, partially offset by the unfavorable impact of foreign currency and a weakened demand environment in emerging markets. Excluding the impact of foreign currency and BEFIEX in 2014, consolidated net sales for
2015
increased 18.1%
compared to
2014
.
We provide the percentage change in net sales, excluding the impact of foreign currency and BEFIEX, as a supplement to the change in net sales as determined by U.S. generally accepted accounting principles ("GAAP") to provide stockholders with a clearer basis to assess Whirlpool's results over time. This measure is considered a non-GAAP financial measure and is calculated by translating the current period net sales in functional currency, to U.S. dollars using the prior-year's exchange rate compared to the prior-year period net sales and BEFIEX.
Significant regional trends were as follows:
|
•
|
North America net sales
increase
d
3.9%
compared to
2015
primarily due to a
7.7%
increase
in units sold, partially offset by unfavorable impacts from product price/mix and foreign currency. Excluding the impact of foreign currency, net sales
increased 5.0%
in
2016
. North America net sales for
2015
increase
d
0.9%
compared to
2014
primarily due to a
1.4%
increase
in units sold and favorable product/price mix, partially offset by foreign currency. Excluding the impact of foreign currency, net sales
increased 3.2%
in
2015
.
|
|
•
|
EMEA net sales
decrease
d
8.1%
compared to
2015
, primarily due to unfavorable impacts from foreign currency, product price/mix, and a
1.9%
decrease
in units sold. Excluding the impact of foreign currency, net sales
decreased 4.3%
in
2016
. EMEA net sales for
2015
increase
d
43.4%
compared to
2014
, primarily due to a
59.7%
increase
in units sold due to the acquisition of Indesit and favorable product mix, partially offset by unfavorable foreign currency. Excluding the impact of foreign currency, net sales
increased 75.3%
in
2015
.
|
|
•
|
Latin America net sales
decrease
d
4.7%
compared to
2015
primarily due to a
11.5%
decrease
in units sold and unfavorable impacts from foreign currency, partially offset by favorable product price/mix. Excluding the impact of foreign currency, Latin America net sales
decreased 1.5%
in
2016
. Latin America net sales for
2015
decrease
d
28.5%
compared to
2014
primarily due to a
21.3%
decrease in units sold and unfavorable foreign currency, partially offset by favorable product mix. Excluding the impact of foreign currency and BEFIEX, Latin America net sales
decreased 5.9%
in
2015
.
|
|
•
|
Asia net sales
increase
d
0.5
% compared to
2015
primarily due to a
12.3%
increase
in units sold, partially offset by unfavorable impacts from product price/mix and foreign currency. Excluding the impact of foreign currency, Asia net sales
increased 5.4%
in
2016
. Asia net sales for
2015
increase
d
73.6%
compared to
2014
primarily due to a 78.8% increase in units sold driven by the acquisition of Hefei Sanyo. Excluding the impact of foreign currency, Asia net sales
increased 78.3%
in
2015
.
|
21
MANAGEMENT'S DISCUSSION AND ANALYSIS OF FINANCIAL CONDITION AND
RESULTS OF OPERATIONS - (CONTINUED)
Gross Margin
The chart below summarizes gross margin percentages by operating segment:
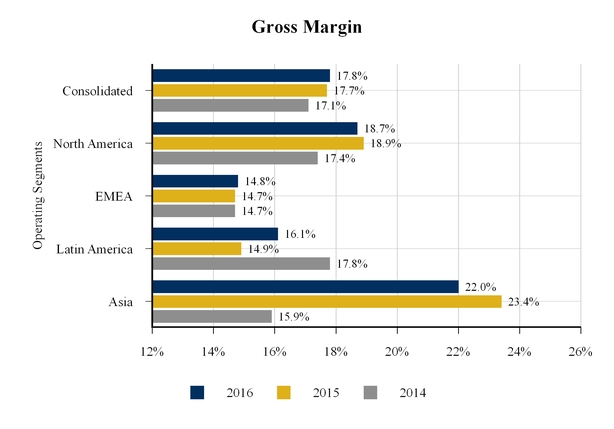
The consolidated gross margin percentage increased by
10
basis points to
17.8%
compared to
2015
, primarily due to ongoing cost productivity and acquisition synergies, unit volume growth, and benefits from cost and capacity-reduction initiatives, partially offset by the unfavorable impacts from product price/mix and foreign currency.
Significant regional trends were as follows:
|
•
|
North America gross margin percentage decreased compared to
2015
primarily due to unfavorable product price/mix, recognition of postretirement-benefit curtailment gains in 2015, and foreign currency, partially offset by unit volume growth and ongoing cost productivity. North America gross margin for
2015
increased compared to
2014
primarily due to ongoing cost productivity and recognition of postretirement-benefit curtailment gains, partially offset by unfavorable foreign currency.
|
|
•
|
EMEA gross margin percentage increased compared to
2015
primarily due to favorable impacts from acquisition synergies, partially offset by unfavorable impacts from foreign currency, product price/mix, unit volume declines, and acquisition-related integration costs. During
2015
, EMEA gross margin was flat compared to
2014
primarily due to benefits from the Indesit acquisition, favorable product price/mix, ongoing cost productivity, and capacity optimization initiatives, offset by unfavorable foreign currency, legacy Indesit product corrective action costs and increased investments in marketing, technology and products.
|
|
•
|
Latin America gross margin percentage increased compared to
2015
primarily due to favorable product price/mix and benefits from cost and capacity reduction initiatives, partially offset by unit volume declines due to the weakened demand environment in Brazil. During
2015
, Latin America gross margin decreased compared to
2014
primarily due to unfavorable foreign currency and the weakened demand environment in Brazil, partially offset by higher product price/mix.
|
22
MANAGEMENT'S DISCUSSION AND ANALYSIS OF FINANCIAL CONDITION AND
RESULTS OF OPERATIONS - (CONTINUED)
|
•
|
Asia gross margin percentage decreased in
2016
, compared to
2015
, primarily due to unfavorable product price/mix and increased investments in marketing, technology and products, partially offset by unit volume growth and benefits from ongoing cost productivity. During
2015
, Asia gross margin increased compared to
2014
primarily due to acquisition synergies, partially offset by increased investments in marketing, technology and products.
|
Selling, General and Administrative
The following table summarizes selling, general and administrative expenses as a percentage of sales by operating segment:
|
December 31,
|
|||||||||||||||||||||
|
Millions of dollars
|
2016
|
As a %
of Net Sales |
2015
|
As a %
of Net Sales |
2014
|
As a %
of Net Sales |
|||||||||||||||
|
North America
|
$
|
783
|
|
7.0
|
%
|
$
|
762
|
|
7.1
|
%
|
$
|
761
|
|
7.2
|
%
|
||||||
|
EMEA
|
577
|
|
11.2
|
604
|
|
10.8
|
506
|
|
13.0
|
||||||||||||
|
Latin America
|
305
|
|
9.6
|
315
|
|
9.4
|
359
|
|
7.7
|
||||||||||||
|
Asia
|
216
|
|
15.2
|
226
|
|
16.0
|
146
|
|
17.9
|
||||||||||||
|
Corporate/other
|
203
|
|
—
|
223
|
|
—
|
266
|
|
—
|
||||||||||||
|
Consolidated
|
$
|
2,084
|
|
10.1
|
%
|
$
|
2,130
|
|
10.2
|
%
|
$
|
2,038
|
|
10.3
|
%
|
||||||
Consolidated selling, general and administrative expenses as a percent of consolidated net sales in
2016
and
2015
, compared to the previous years, reflect the favorable impact of acquisition synergies, partially offset by foreign currency.
Restructuring
We incurred restructuring charges of
$173 million
,
$201 million
, and
$136 million
for the years ended
December 31
,
2016
,
2015
and
2014
, respectively. For the full year 2017, we expect to incur up to $200 million of restructuring charges, which will result in ongoing substantial cost reductions.
Additional information about restructuring activities can be found in Note
10
of the Notes to the Consolidated Financial Statements.
Interest and Sundry (Income) Expense
Interest and sundry (income) expense
decrease
d
$10 million
compared to
2015
, primarily due to amounts received pursuant to an agreement, reached in the fourth quarter of 2016, with the seller of Indesit to recover a portion of our acquisition related costs. During
2015
, interest and sundry (income) expense
decrease
d
$53 million
compared to
2014
, primarily due to a
$64 million
gain related to a business investment in Brazil during
2015
and previous year investment expenses related to the Hefei Sanyo and Indesit acquisitions, partially offset by impact from foreign currency.
For additional information about the Embraco antitrust matters and legacy product warranty cost, see Note
6
of the Notes to the Consolidated Financial Statements. For additional information about the acquisitions of
Hefei Sanyo
and
Indesit
, see the Financial Condition and Liquidity section of Management's Discussion and Analysis.
Interest Expense
Interest expense decreased by $
4 million
compared to
2015
. This was a result of lower average interest rates on long-term debt, offset by higher average long-term debt balances. During
2015
, interest expense was unchanged compared to
2014
. This was a result of higher average long-term debt balances, offset by lower average interest rates on long-term debt.
Income Taxes
Income tax expenses were
$186 million
,
$209 million
, and
$189 million
in
2016
,
2015
and
2014
, respectively. The decrease in tax expense in
2016
compared to
2015
is primarily due to favorable audits and settlements and tax planning resulting in valuation allowance releases, partially offset by higher pre-tax earnings. The increase in tax expense in
2015
compared to
2014
is primarily due to higher pre-tax earnings, partially offset by a lower effective tax rate.
For additional information about our consolidated tax provision, see Note
11
of the Notes to the Consolidated Financial Statements.
23
MANAGEMENT'S DISCUSSION AND ANALYSIS OF FINANCIAL CONDITION AND
RESULTS OF OPERATIONS - (CONTINUED)
FORWARD-LOOKING PERSPECTIVE
Earnings per diluted share presented below are net of tax, while each adjustment is presented on a pre-tax basis. The aggregate income tax impact of the taxable components of each adjustment is presented in the income tax impact line item at our anticipated
2017
full-year tax rate of
22%
. We currently estimate earnings per diluted share and industry demand for
2017
to be within the following ranges:
|
2017
|
|||
|
Current Outlook
|
|||
|
Estimated earnings per diluted share, for the year ending December 31, 2017
|
$13.25
|
—
|
$14.25
|
|
Including:
|
|||
|
Restructuring Expense
|
$(2.62)
|
||
|
Income Tax Impact
|
$0.58
|
||
|
Industry demand
|
|||
|
North America
(1)
|
+4%
|
—
|
+6%
|
|
EMEA
|
+1%
|
—
|
+2%
|
|
Latin America
(2)
|
Flat
|
||
|
Asia
|
Flat
|
—
|
+2%
|
(1)
Reflects industry demand in the United States.
(2)
Reflects industry demand in Brazil.
For the full-year
2017
, we expect to generate cash from operating activities of
$1.7 billion
to
$1.75 billion
and free cash flow of approximately
$1 billion
, including primarily acquisition related restructuring cash outlays of up to
$165 million
, legacy product warranty and liability costs of
$69 million
, pension contributions of
$42 million
and, with respect to free cash flow, capital expenditures of
$700 million
to
$750 million
.
The table below reconciles projected
2017
cash provided by operating activities determined in accordance with GAAP to free cash flow, a non-GAAP measure. Management believes that free cash flow provides stockholders with a relevant measure of liquidity and a useful basis for assessing Whirlpool’s ability to fund its activities and obligations. There are limitations to using non-GAAP financial measures, including the difficulty associated with comparing companies that use similarly named non-GAAP measures whose calculations may differ from our calculations. We define free cash flow as cash provided by continuing operations less capital expenditures and including proceeds from the sale of assets/businesses, and changes in restricted cash. The change in restricted cash relates to the private placement funds paid by Whirlpool to acquire majority control of Hefei Sanyo in 2014 and which are
used to fund capital expenditures and technical resources to enhance Whirlpool China’s research and development and working capital, as required by the terms of the Hefei Sanyo acquisition made in October 2014.
|
2017
|
|||||||
|
Millions of dollars
|
Current Outlook
|
||||||
|
Cash provided by operating activities
(1)
|
$
|
1,700
|
|
—
|
$
|
1,750
|
|
|
Capital expenditures, proceeds from sale of assets/businesses and changes in restricted cash
|
(700
|
)
|
—
|
(750
|
)
|
||
|
Free cash flow
|
~ $1,000
|
||||||
(1)
Financial guidance on a GAAP basis for cash provided by (used in) financing activities and cash provided by (used in) investing activities has not been provided because in order to prepare any such estimate or projection, the Company would need to rely on market factors and certain other conditions and assumptions that are outside of its control.
The projections above are based on many estimates and are inherently subject to change based on future decisions made by management and the Board of Directors of Whirlpool, and significant economic, competitive and other uncertainties and contingencies.
FINANCIAL CONDITION AND LIQUIDITY
Our objective is to finance our business through operating cash flow and the appropriate mix of long-term and short-term debt. By diversifying the maturity structure, we avoid concentrations of debt, reducing liquidity risk. We have varying needs for short-term working capital financing as a result of the nature of our business. We regularly review our capital structure and liquidity priorities, which include funding the business through capital and engineering spending to support innovation and productivity initiatives, funding our pension plan and term debt liabilities, providing return to shareholders and potential acquisitions.
24
MANAGEMENT'S DISCUSSION AND ANALYSIS OF FINANCIAL CONDITION AND
RESULTS OF OPERATIONS - (CONTINUED)
Our short term potential uses of liquidity include funding our ongoing capital spending, restructuring activities, funding pension plans and returns to shareholders. We also have
$560 million
of term debt maturing in the next twelve months, and are currently evaluating our options in connection with this maturing debt, which may include repayment through refinancing, through free cash flow generation, or cash on hand.
We monitor the credit ratings and market indicators of credit risk of our lending, depository, and derivative counterparty banks regularly, and take certain action to manage credit risk. We diversify our deposits and investments in short term cash equivalents to limit the concentration of exposure by counterparty.
As of
December 31, 2016
, the only country where we had cash or cash equivalents greater than 1% of our consolidated assets was China, which represented 2.4%. In addition, we did not have any third-party accounts receivable greater than 1% of our consolidated assets in any single country outside of North America, with the exceptions of Italy, China, and Brazil which represented 1.0%, 1.0%, and 1.3% respectively. We continue to monitor general financial instability and uncertainty globally.
As of December 31,
2016
, we had
€67 million
(approximately
$71 million
as of
December 31, 2016
) in outstanding trade receivables and short-term and long-term notes due to us associated with Alno AG, a long-standing European customer. Approximately
€49 million
(approximately
$51 million
as of
December 31, 2016
) of the outstanding receivables were overdue as of
December 31, 2016
. Our exposure includes not only the outstanding receivables but also the potential risks of an Alno AG bankruptcy and impacts to our distribution process. We believe our reserves related to these outstanding receivables are sufficient. In the fourth quarter of 2016, Whirlpool sold its remaining investment of approximately 10.6 million shares in Alno AG for approximately €5 million (approximately $6 million). We continue to monitor customer financial conditions globally.
The Company had cash and cash equivalents of approximately
$1.1 billion
at
December 31, 2016
, of which approximately
$1.0 billion
was held by subsidiaries in foreign countries. For each of its foreign subsidiaries, the Company makes an assertion regarding the amount of earnings intended for permanent reinvestment, with the balance available to be repatriated to the United States. The cash held by foreign subsidiaries for permanent reinvestment is generally used to finance the subsidiaries' operational activities and future foreign investments. Our intent is to permanently reinvest these funds outside of the United States and our current plans do not demonstrate a need to repatriate these funds to fund our U.S. operations. However, if these funds were repatriated, then we would be required to accrue and pay applicable United States taxes (subject to an adjustment for foreign tax credits) and withholding taxes payable to various countries. The repatriation could result in an adjustment to the tax liability after considering available foreign tax credits and other tax attributes. It is not practicable to estimate the amount of the deferred tax liability associated with these unremitted earnings due to the complexity of its hypothetical calculation.
Sources and Uses of Cash
We met our cash needs during
2016
through cash flows from operations, cash and cash equivalents, and financing arrangements. Our cash and cash equivalents at
December 31, 2016
increased
$313 million
compared to the same period in
2015
.
The following table summarizes the net increase (decrease) in cash and cash equivalents for the periods presented. Significant drivers of changes in our cash and cash equivalents balance during
2016
are discussed below:
Cash Flow Summary
|
Millions of dollars
|
2016
|
2015
|
2014
|
|||||||||
|
Cash provided by (used in):
|
||||||||||||
|
Operating activities
|
$
|
1,203
|
|
$
|
1,225
|
|
$
|
1,479
|
|
|||
|
Investing activities
|
(588
|
)
|
(681
|
)
|
(2,456
|
)
|
||||||
|
Financing activities
|
(278
|
)
|
(707
|
)
|
705
|
|
||||||
|
Effect of exchange rate changes
|
(24
|
)
|
(91
|
)
|
(82
|
)
|
||||||
|
Net increase (decrease) in cash and cash equivalents
|
$
|
313
|
|
$
|
(254
|
)
|
$
|
(354
|
)
|
|||
25
MANAGEMENT'S DISCUSSION AND ANALYSIS OF FINANCIAL CONDITION AND
RESULTS OF OPERATIONS - (CONTINUED)
Cash Flows from Operating Activities
The decrease in cash provided by operating activities during
2016
reflects strong cash earnings and effective credit management, more than offset by cash expenditures related to the legacy product corrective action.
The timing of cash flows from operations varies significantly throughout the year primarily due to changes in production levels, sales patterns, promotional programs, funding requirements, credit management, as well as receivable and payment terms. Depending on the timing of cash flows, the location of cash balances, as well as the liquidity requirements of each country, external sources of funding are used to support working capital requirements.
Cash Flows from Investing Activities
Changes in cash used in investing activities during
2016
primarily reflect a reduction in capital expenditures and investment in related businesses, partially offset by increased proceeds from the sale of business assets.
In June 2016, Whirlpool China Co., Ltd. (“Whirlpool China”), our majority-owned indirect subsidiary, entered into an agreement to return land use rights for land now occupied by two Whirlpool China plants in Hefei, China to a division of the Hefei municipal government. The aggregate price for the return of land use rights was approximately RMB 687 million (approximately $103 million as of June 27, 2016). Whirlpool China received RMB 280 million (approximately $42 million as of June 27, 2016) of the aggregate return price on June 27, 2016 with the remainder to be paid in installments in 2017 and 2018. The remaining balance is RMB
407 million
(approximately
$59 million
as of
December 31, 2016
).
Cash Flows from Financing Activities
Cash used in financing activities during
2016
primarily reflects share repurchase activity and repayments of long-term debt. Cash used in financing activities during
2015
primarily reflects share repurchase activity under our share repurchase program. Cash provided by financing activities during 2014 primarily reflects funding required to complete the acquisitions of
Hefei Sanyo
and Indesit.
Whirlpool Subsidiary Share Repurchase
On July 12, 2016, Whirlpool S.A. (“WHR SA”) and Brasmotor S.A. (“BMT”), both majority-owned indirect subsidiaries of Whirlpool Corporation, issued public announcements in Brazil reporting that Whirlpool do Brasil Ltda., the controlling shareholder of both WHR SA and BMT, intended to acquire the outstanding common and preferred shares of WHR SA and BMT by means of tender offers for the publicly-held shares. At that time, Whirlpool do Brasil Ltda. and other Whirlpool entities held 99.20% of the common and 95.68% of the preferred shares of WHR SA and 99.40% of the common and 93.55% of the preferred shares of BMT. The tender offers were launched in November 2016 and concluded in December 2016. The offer for BMT was successful and will result in the acquisition of 100% of the shares of BMT after the squeeze-out of the remaining minority shareholders. The cost related to this offer was approximately $25 million as of December 2016. The squeeze-out was completed in January 2017, bringing the total cost to approximately $31 million. The WHR SA tender offer was abandoned because the minimum number of interested minority shareholders was not obtained.
Financing Arrangements
On July 15, 2016,
$244 million
of
7.75%
notes matured and were repaid. On June 15, 2016,
$250 million
of
6.50%
notes matured and were repaid.
On May 23, 2016, we completed a debt offering of
$500 million
principal amount of
4.50%
notes due in 2046. The notes contain covenants that limit our ability to incur certain liens or enter into certain sale and lease-back transactions. In addition, if we experience a specific kind of change of control, we are required to make an offer to purchase all of the notes at a purchase price of
101%
of the principal amount thereof, plus accrued and unpaid interest. The notes are registered under the Securities Act of 1933, as amended, pursuant to our Registration Statement on Form S-3 (File No. 333-203704) filed with the Securities and Exchange Commission on April 29, 2015.
On November 2, 2016, Whirlpool Finance Luxembourg S.à. r.l., an indirect, wholly-owned finance subsidiary of Whirlpool Corporation, completed a debt offering of
€500 million
(approximately $555 million as of the date of issuance) principal amount of
1.250%
notes due in 2026. The Company has fully and unconditionally guaranteed these notes. The notes contain covenants that limit Whirlpool Corporation's ability to incur certain liens or enter into certain sale and lease-back transactions. In addition, if we experience a specific kind of change of control, we are required to make an offer to purchase all of the notes at a purchase price of 101% of the principal amount thereof, plus accrued and unpaid interest. The notes are registered under the Securities Act
26
MANAGEMENT'S DISCUSSION AND ANALYSIS OF FINANCIAL CONDITION AND
RESULTS OF OPERATIONS - (CONTINUED)
of 1933, as amended, pursuant to our Registration Statement on Form S-3 (File No.333-203704-1) filed with the Securities and Exchange Commission on October 25, 2016
The Company had a total committed credit facilities of approximately $3.1 billion as of
December 31, 2016
, which is fundamentally unchanged from the committed credit facilitates as of
December 31, 2015
. The facilities are more geographically diverse and reflect the Company’s growing global operations. The Company believes these facilities are sufficient to support its global operations.
We had
no
borrowings outstanding under the committed credit facilities at
December 31, 2016
and
2015
, respectively.
For additional information about our financing arrangements, see Note
5
of the Notes to the Consolidated Financial Statements.
WHIRLPOOL CHINA ACQUISITION
On
August 12, 2013
, Whirlpool's wholly-owned subsidiary, Whirlpool (China) Investment Co., Ltd., reached agreements to acquire a
51%
equity stake in
Hefei Sanyo
, a joint stock company whose shares are listed and traded on the Shanghai Stock Exchange. This transaction was completed on
October 24, 2014
.
Hefei Sanyo
has since been renamed to "Whirlpool China Co., Ltd." The aggregate purchase price was RMB
3.4 billion
(approximately
$551 million
at the dates of purchase). The Company funded the total consideration for the shares with cash on hand. The cash paid for the private placement portion of the transaction is considered restricted cash, which is
used to fund capital expenditures and technical resources to enhance Whirlpool China’s research and development and working capital, as required by the terms of the Hefei Sanyo acquisition made in October 2014.
We expect the acquisition will accelerate Whirlpool's profitable growth in China. During 2014, Whirlpool began integrating the manufacturing, administrative, supply chain and technology operations of
Hefei Sanyo
. The results of
Hefei Sanyo
’s operations have been included in the Consolidated Financial Statements beginning
October 24, 2014
.
Hefei Sanyo
has an established and broad distribution network that includes a very large number of distribution outlets throughout China. Its significant presence in rural areas complements Whirlpool’s presence in China’s higher-tier cities. With this acquisition, Whirlpool also gained manufacturing scale and a competitive cost structure in the city of Hefei. The ability to consolidate operations offers strong synergies as Whirlpool will provide extensive technical, marketing and product development, combined with
Hefei Sanyo
’s sales execution and operational strengths, to support the next phase of development in the advancement of
Whirlpool China
as an important global production and research and development center for the home appliance sector.
INDESIT ACQUISITION
On
December 3, 2014
, Whirlpool completed the final step in its acquisition of Indesit. Total consideration paid for Indesit was €
1.1 billion
(approximately
$1.4 billion
at the dates of purchase of each step in the transaction) in aggregate net of cash acquired. The Company funded the aggregate purchase price for Indesit through borrowings under its credit facility and commercial paper programs, and repaid a portion of such borrowings through the issuance of an aggregate principal amount of
$650 million
in senior notes on
November 4, 2014
and an aggregate principal amount of €
500 million
(approximately
$525 million
as of the date of issuance) in senior notes on
March 12, 2015
.
This transaction has built Whirlpool’s market position within Europe, and we believe will continue to enable sustainable growth given the complementary market positions, product offerings and distribution channels of Whirlpool and
Indesit
throughout Europe. We expect efficiencies in R&D, capital spending and value chain costs, as well as operational scale with increased volume and the ability to more effectively integrate our product platforms. The results of
Indesit
’s operations have been included in the Consolidated Financial Statements beginning
October 14, 2014
.
Dividends
In April 2016, our Board of Directors approved an 11% increase in our quarterly dividend on our common stock to $1 per share from 90 cents per share.
Repurchase Program
For additional information about our repurchase program, see Note
8
of the Notes to the Consolidated Financial Statements.
27
MANAGEMENT'S DISCUSSION AND ANALYSIS OF FINANCIAL CONDITION AND
RESULTS OF OPERATIONS - (CONTINUED)
CONTRACTUAL OBLIGATIONS AND FORWARD-LOOKING CASH REQUIREMENTS
The following table summarizes our expected cash outflows resulting from financial contracts and commitments:
|
|
Payments due by period
|
|||||||||||||||||||
|
Millions of dollars
|
Total
|
2017
|
2018 & 2019
|
2020 & 2021
|
Thereafter
|
|||||||||||||||
|
Long-term debt obligations
(1)
|
$
|
5,960
|
|
$
|
709
|
|
$
|
835
|
|
$
|
1,025
|
|
$
|
3,391
|
|
|||||
|
Operating lease obligations
|
936
|
|
206
|
|
311
|
|
214
|
|
205
|
|
||||||||||
|
Purchase obligations
(2)
|
764
|
|
164
|
|
295
|
|
194
|
|
111
|
|
||||||||||
|
United States & Foreign pension plans
(3)
|
823
|
|
57
|
|
161
|
|
175
|
|
430
|
|
||||||||||
|
Other postretirement benefits
(4)
|
307
|
|
42
|
|
68
|
|
65
|
|
132
|
|
||||||||||
|
Legal settlements
(5)
|
7
|
|
7
|
|
—
|
|
—
|
|
—
|
|
||||||||||
|
Total
(6)
|
$
|
8,797
|
|
$
|
1,185
|
|
$
|
1,670
|
|
$
|
1,673
|
|
$
|
4,269
|
|
|||||
|
(1)
|
Interest payments related to long-term debt are included in the table above. For additional information about our financing arrangements, see Note
5
of the Notes to the Consolidated Financial Statements.
|
|
(2)
|
Purchase obligations include our “take-or-pay” contracts with materials vendors and minimum payment obligations to other suppliers.
|
|
(3)
|
Represents the minimum contributions required for foreign and domestic pension plans based on current interest rates, asset return assumptions, legislative requirements and other actuarial assumptions at
December 31, 2016
. Management may elect to contribute amounts in addition to those required by law. See Note
12
of the Notes to the Consolidated Financial Statements for additional information.
|
|
(4)
|
Represents our portion of expected benefit payments under our retiree healthcare plans.
|
|
(5)
|
For additional information regarding legal settlements, see Note
6
of the Notes to the Consolidated Financial Statements.
|
|
(6)
|
This table does not include credit facility and commercial paper borrowings. For additional information about short-term borrowings, see Note
5
of the Notes to the Consolidated Financial Statements. This table does not include future anticipated income tax settlements; see Note
11
of the Notes to the Consolidated Financial Statements.
|
OFF-BALANCE SHEET ARRANGEMENTS
We have guarantee arrangements in a Brazilian subsidiary. As a standard business practice in Brazil, the subsidiary guarantees customer lines of credit at commercial banks to support purchases following its normal credit policies. If a customer were to default on its line of credit with the bank, our subsidiary would be required to satisfy the obligation with the bank and the receivable would revert back to the subsidiary. At
December 31, 2016
and
December 31, 2015
, the guaranteed amounts totaled
$258 million
and
$260 million
, respectively. The fair value of these guarantees were nominal at
December 31, 2016
and
December 31, 2015
. Our subsidiary insures against credit risk for these guarantees, under normal operating conditions, through policies purchased from high-quality underwriters. We had
no
losses associated with these guarantees in
2016
or
2015
.
We have guaranteed a
$40 million
five
-year revolving credit facility between certain financial institutions and a not-for-profit entity in connection with a community and economic development project (“Harbor Shores”). The credit facility, which originated in 2008, was refinanced in December 2012 and we renewed our guarantee through 2017. It was also amended in 2015 and reduced from
$43 million
to
$40 million
by Harbor Shores in 2016. The fair value of this guarantee was nominal at
December 31, 2016
and
December 31, 2015
. The purpose of Harbor Shores is to stimulate employment and growth in the areas of Benton Harbor and St. Joseph, Michigan. In the event of default, we must satisfy the guarantee of the credit facility up to the amount borrowed at the date of default.
In the ordinary course of business, we enter into agreements with financial institutions to issue bank guarantees, letters of credit and surety bonds. These agreements are primarily associated with unresolved tax matters in Brazil, as is customary under local regulations, and governmental obligations related to certain employee benefit arrangements. As of
December 31, 2016
and
2015
, we had approximately
$327 million
and
$290 million
outstanding under these agreements, respectively.
CRITICAL ACCOUNTING POLICIES AND ESTIMATES
The preparation of financial statements in conformity with generally accepted accounting principles in the United States (GAAP) requires management to make certain estimates and assumptions. We periodically evaluate these estimates and assumptions, which are based on historical experience, changes in the business environment and other factors that management believes to be reasonable under the circumstances. Actual results may differ materially from these estimates.
28
MANAGEMENT'S DISCUSSION AND ANALYSIS OF FINANCIAL CONDITION AND
RESULTS OF OPERATIONS - (CONTINUED)
Pension and Other Postretirement Benefits
Accounting for pensions and other postretirement benefits involves estimating the costs of future benefits and attributing the cost over the employee’s expected period of employment. The determination of our obligation and expense for these costs requires the use of certain assumptions. Those key assumptions include the discount rate, expected long-term rate of return on plan assets, life expectancy, and health care cost trend rates. These assumptions are subject to change based on interest rates on high quality bonds, stock and bond markets and medical cost inflation, respectively. Actual results that differ from our assumptions are accumulated and amortized over future periods and therefore, generally affect our recognized expense and accrued liability in such future periods. While we believe that our assumptions are appropriate given current economic conditions and actual experience, significant differences in results or significant changes in our assumptions may materially affect our pension and other postretirement benefit obligations and related future expense.
Our pension and other postretirement benefit obligations at
December 31, 2016
and preliminary retirement benefit costs for
2017
were prepared using the assumptions that were determined as of
December 31, 2016
. The following table summarizes the sensitivity of our
December 31, 2016
retirement obligations and
2017
retirement benefit costs of our United States plans to changes in the key assumptions used to determine those results:
|
|
|
Estimated increase (decrease) in
|
||||
|
Millions of dollars
|
Percentage
Change
|
2017 Expense
|
PBO/APBO*
for 2016
|
|||
|
United States Pension Plans
|
||||||
|
Discount rate
|
+/-50bps
|
$ 1/(1)
|
$ (174)/187
|
|||
|
Expected long-term rate of return on plan assets
|
+/-50bps
|
(13)/13
|
–
|
|||
|
United States Other Postretirement Benefit Plan
|
||||||
|
Discount rate
|
+/-50bps
|
1/(1)
|
(14)/15
|
|||
|
Health care cost trend rate
|
+/-100bps
|
–
|
–
|
|||
|
*
|
Projected benefit obligation (PBO) for pension plans and accumulated postretirement benefit obligation (APBO) for other postretirement benefit plans.
|
These sensitivities may not be appropriate to use for other years’ financial results. Furthermore, the impact of assumption changes outside of the ranges shown above may not be approximated by using the above results. For additional information about our pension and other postretirement benefit obligations, see Note
12
of the Notes to the Consolidated Financial Statements.
Income Taxes
We estimate our income taxes in each of the taxing jurisdictions in which we operate. This involves estimating actual current tax expense together with assessing any temporary differences resulting from the different treatment of certain items, such as the timing for recognizing expenses, for tax and accounting purposes. These differences may result in deferred tax assets or liabilities, which are included in our Consolidated Balance Sheets. We are required to assess the likelihood that deferred tax assets, which include net operating loss carryforwards, foreign tax credits and deductible temporary differences, that are expected to be realizable in future years. Realization of our net operating loss and foreign tax credit deferred tax assets is supported by specific tax planning strategies and, where possible, considers projections of future profitability. If recovery is not more likely than not, we provide a valuation allowance based on estimates of future taxable income in the various taxing jurisdictions, and the amount of deferred taxes that are ultimately realizable. If future taxable income is lower than expected or if tax planning strategies are not available as anticipated, we may record additional valuation allowances through income tax expense in the period such determination is made. Likewise, if we determine that we are able to realize our deferred tax assets in the future in excess of net recorded amounts, an adjustment to the deferred tax asset will benefit income tax expense in the period such determination is made.
As of
December 31, 2016
and
2015
, we had total deferred tax assets of
$3.2 billion
and
$3.3 billion
, respectively, net of valuation allowances of
$150 million
and
$286 million
, respectively. Our income tax expense has fluctuated considerably over the last five years from $133 million in 2012 to $
186 million
in the current year. The tax expense has been influenced primarily by U.S. energy tax credits, foreign tax credits, audit settlements and adjustments, tax planning strategies, enacted legislation, and dispersion of global income. Future changes in the effective tax rate will be subject to several factors, including business profitability, tax planning strategies, and enacted tax laws.
In addition, we operate within multiple taxing jurisdictions and are subject to audit in these jurisdictions. These audits can involve complex issues, which may require an extended period of time to resolve. For additional information about income taxes, see Notes
1
,
6
and
11
of the Notes to the Consolidated Financial Statements.
29
MANAGEMENT'S DISCUSSION AND ANALYSIS OF FINANCIAL CONDITION AND
RESULTS OF OPERATIONS - (CONTINUED)
Legacy Product Corrective Action Reserves
In the normal course of business, we engage in investigations of potential quality and safety issues. As part of our ongoing effort to deliver quality products to consumers, we are currently investigating a limited number of potential quality and safety issues globally. As necessary, we undertake to effect repair or replacement of appliances in the event that an investigation leads to the conclusion that such action is warranted.
As part of that process, in 2015, Whirlpool engaged in thorough investigations of incident reports associated with
two
of its dryer production platforms developed by Indesit. These dryer production platforms were developed prior to Whirlpool's acquisition of Indesit in October 2014. This led to Indesit reporting the issue to regulatory authorities for consideration. These discussions determined that corrective action of the affected dryers was required. Whirlpool has implemented modifications at the point of manufacture to ensure that dryers produced after October 2015 are not affected by this issue. An outreach and service campaign is underway to modify dryers that have already been sold. Such dryers were manufactured between April 2004 and October 2015 and sold in the UK and other countries in the EMEA region under the
Hotpoint
* and
Indesit
brand names, as well as various other brands owned by other manufacturers, distributors and retailers whose products Indesit produced.
As of
December 31, 2016
, Whirlpool had
$162 million
of cash expenditures related to the corrective action. We expect the corrective action affecting these dryers to have future cash expenditures in 2017 of
$69 million
.
For additional information about the legacy product corrective action, see Note
6
of the Notes to the Consolidated Financial Statements.
Warranty Obligations
The estimation of warranty obligations is determined in the same period that revenue from the sale of the related products is recognized. The warranty obligation is based on historical experience and represents our best estimate of expected costs at the time products are sold. Warranty accruals are adjusted for known or anticipated warranty claims as new information becomes available. New product launches require a greater use of judgment in developing estimates until historical experience becomes available. Future events and circumstances could materially change our estimates and require adjustments to the warranty obligations. For additional information about warranty obligations, see Note
6
of the Notes to the Consolidated Financial Statements.
Goodwill and Other Intangibles
Certain business acquisitions have resulted in the recording of goodwill and trademark assets. Upon acquisition, the purchase price is first allocated to identifiable assets and liabilities, including trademark assets, based on estimated fair value, with any remaining purchase price recorded as goodwill. Primarily, Whirlpool's trademarks and goodwill are considered indefinite-life intangible assets and as such, are not amortized. At
December 31, 2016
, we had goodwill of approximately
$3.0 billion
. There have been no changes to our reporting units or allocations of goodwill by reporting units except for the impact of foreign currency.
We primarily have trademark assets in our North America, EMEA and Asia operating segments with a total carrying value of approximately
$2.6 billion
as of
December 31, 2016
.
We perform our annual impairment assessment for goodwill and other indefinite-life intangible assets as of October 1
st
and more frequently if indicators of impairment exist.
In 2016, the Company primarily elected to perform a quantitative analysis using a discounted cash flow model and other valuation techniques, to evaluate goodwill and certain indefinite-life intangible assets.
Goodwill Valuations
In performing a quantitative assessment, we estimate each reporting units' fair value using the income approach. The income approach uses operating segments projection of estimated operating results and cash flows that are discounted using a weighted-average cost of capital that is determined based on current market conditions. The projection uses management’s best estimates of economic and market conditions over the projected period including growth rates in sales, costs and number of units, estimates of future expected changes in operating margins and cash expenditures. Other estimates and assumptions include terminal value growth rates, future estimates of capital expenditures and changes in future working capital requirements. The estimated fair value of each operating segment is compared to their respective carrying values.
*Whirlpool ownership of the Hotpoint brand in the EMEA and Asia Pacific regions is not affiliated with the Hotpoint brand sold in the Americas
30
MANAGEMENT'S DISCUSSION AND ANALYSIS OF FINANCIAL CONDITION AND
RESULTS OF OPERATIONS - (CONTINUED)
Additionally we validate our estimates of fair value under the income approach by comparing the values of fair value estimates using a market approach. A market approach estimates fair value by applying cash flow multiples to the reporting unit’s operating performance. The multiples are derived from comparable publicly traded companies with similar operating and investment characteristics of the reporting units. We consider the implied control premium and conclude whether the implied control premium is reasonable based on other recent market transactions.
If actual results are not consistent with managements’ estimate and assumptions, goodwill may be overstated and a charge against net income would be required, which would adversely affect the Company’s financial statements.
Based on the results of our quantitative assessment conducted on October 1, 2016, the fair values of Whirlpool's reporting units continue to exceed their respective carrying values. The range by which the excess fair value of our reporting units' goodwill exceeded their respective carrying values was 4% to 142%. The EMEA reporting unit has excess fair value of 4%. During the fourth quarter 2014, Whirlpool acquired Indesit, resulting in substantially all of the goodwill included in this reporting unit. The range by which the excess fair value of our remaining reporting units' goodwill exceeded their respective carrying values was 70% to 142%.
Other Intangible Valuations
In performing a quantitative assessment of indefinite life intangible assets other than goodwill, primarily trademarks, we estimate the fair value of these intangible assets using the relief-from-royalty method, which requires assumptions related to projected revenues from our annual long-range plan; assumed royalty rates that could be payable if we did not own the trademark; and a discount rate based on our weighted average cost of capital. If the estimated fair value of the indefinite-lived intangible asset is less than its carrying value, we would recognize an impairment loss.
Three trademarks acquired in fourth quarter of 2014 have fair values that exceed their carrying values by less than 10%. The fair values of all other trademarks exceeded their carrying values by more than 10% with the exception of one North American trademark.
The fair value of this North American trademark exceeded its carrying value of approximately $1 billion by 6% in
2016
and 5% in
2015
. We expect revenue trends for this brand to improve as we continue to execute specific brand investments and product development plans. Additionally, we performed a sensitivity analysis on our estimated fair value noting that a 10% reduction of forecasted revenues, a 50 basis point decrease in royalty rate, or a 50 basis point increase in discount rate would result in an impairment ranging from approximately $22 million to $78 million.
If actual results are not consistent with management's estimate and assumptions, trademarks or other indefinite-life intangible assets may be overstated and a charge against net income would be required, which would adversely affect the Company’s financial results of operations.
Based on the results of our quantitative assessment performed as of October 1, 2014, impairment of two trademarks was determined to exist, primarily driven by a change in our brand strategy in EMEA as a result of the acquisition of Indesit and resulted in a charge of approximately
$12 million
in 2014.
Our assessment indicates no impairment of any trademarks as of
December 31, 2016
.
For additional information about goodwill and intangible valuations, see Note
2
of the Notes to the Consolidated Financial Statements.
ISSUED BUT NOT YET EFFECTIVE ACCOUNTING PRONOUNCEMENTS
Additional information regarding recently issued accounting pronouncements can be found in Note
1
of the Notes to the Consolidated Financial Statements.
OTHER MATTERS
For information regarding certain of our loss contingencies/litigation, see Note
6
of the Consolidated Financial Statements.
Antidumping Petition
In December 2015, we filed a petition with the U.S. Department of Commerce (DOC) and the United States International Trade Commission (ITC) to address Samsung and LG dumping large residential washers from China. The petition was filed to
31
MANAGEMENT'S DISCUSSION AND ANALYSIS OF FINANCIAL CONDITION AND
RESULTS OF OPERATIONS - (CONTINUED)
restore fair competition in the United States that will support significant investment in the production of large residential washers and the creation of U.S. jobs. The Whirlpool washers affected by the imports subject in this case are made in Clyde, Ohio.
In December 2016, the DOC issued a final determination that Samsung and LG violated U.S. and international trade laws by dumping washers from China into the U.S. As part of the final determination, the DOC also announced certain antidumping margins for Samsung and LG. In January 2017, the ITC voted unanimously that Samsung and LG's dumping had caused material injury to the U.S. washer industry. As in the case of our December 2011 petition, the DOC and ITC decisions will be followed by administrative review procedures and possible appeals over the next several years.
Post-Retirement Benefit Litigation
For information regarding post-retirement benefit litigation, see Note
12
of the Consolidated Financial Statements.
FORWARD-LOOKING STATEMENTS
The Private Securities Litigation Reform Act of 1995 provides a safe harbor for forward-looking statements made by us or on our behalf. Certain statements contained in this annual report, including those within the forward-looking perspective section within this Management's Discussion and Analysis, and other written and oral statements made from time to time by us or on our behalf do not relate strictly to historical or current facts and may contain forward-looking statements that reflect our current views with respect to future events and financial performance. As such, they are considered “forward-looking statements” which provide current expectations or forecasts of future events. Such statements can be identified by the use of terminology such as “may,” “could,” “will,” “should,” “possible,” “plan,” “predict,” “forecast,” “potential,” “anticipate,” “estimate,” “expect,” “project,” “intend,” “believe,” “may impact,” “on track,” and similar words or expressions. Our forward-looking statements generally relate to our growth strategies, financial results, product development, and sales efforts. These forward-looking statements should be considered with the understanding that such statements involve a variety of risks and uncertainties, known and unknown, and may be affected by inaccurate assumptions. Consequently, no forward-looking statement can be guaranteed and actual results may vary materially.
This document contains forward-looking statements about Whirlpool Corporation and its consolidated subsidiaries (“Whirlpool”) that speak only as of this date. Whirlpool disclaims any obligation to update these statements. Forward-looking statements in this document may include, but are not limited to, statements regarding expected earnings per share, cash flow, productivity and raw material prices. Many risks, contingencies and uncertainties could cause actual results to differ materially from Whirlpool's forward-looking statements. Among these factors are: (1) intense competition in the home appliance industry reflecting the impact of both new and established global competitors, including Asian and European manufacturers; (2) Whirlpool's ability to maintain or increase sales to significant trade customers and the ability of these trade customers to maintain or increase market share; (3) Whirlpool's ability to maintain its reputation and brand image; (4) the ability of Whirlpool to achieve its business plans, productivity improvements, and cost control objectives, and to leverage its global operating platform, and accelerate the rate of innovation; (5) Whirlpool's ability to obtain and protect intellectual property rights; (6) acquisition and investment-related risks, including risks associated with our past acquisitions, and risks associated with our increased presence in emerging markets; (7) risks related to our international operations, including changes in foreign regulations, regulatory compliance and disruptions arising from political, legal and economic instability; (8) information technology system failures, data security breaches, network disruptions, and cybersecurity attacks; (9) product liability and product recall costs; (10) the ability of suppliers of critical parts, components and manufacturing equipment to deliver sufficient quantities to Whirlpool in a timely and cost-effective manner; (11) our ability to attract, develop and retain executives and other qualified employees; (12) the impact of labor relations; (13) fluctuations in the cost of key materials (including steel, resins, copper and aluminum) and components and the ability of Whirlpool to offset cost increases; (14) Whirlpool’s ability to manage foreign currency fluctuations; (15) inventory and other asset risk; (16) the uncertain global economy and changes in economic conditions which affect demand for our products; (17) health care cost trends, regulatory changes and variations between results and estimates that could increase future funding obligations for pension and postretirement benefit plans; (18) litigation, tax, and legal compliance risk and costs, especially if materially different from the amount we expect to incur or have accrued for, and any disruptions caused by the same; (19) the effects and costs of governmental investigations or related actions by third parties; and (20) changes in the legal and regulatory environment including environmental, health and safety regulations.
We undertake no obligation to update any forward-looking statement, and investors are advised to review disclosures in our filings with the SEC. It is not possible to foresee or identify all factors that could cause actual results to differ from expected or historic results. Therefore, investors should not consider the foregoing factors to be an exhaustive statement of all risks, uncertainties, or factors that could potentially cause actual results to differ from forward-looking statements.
Additional information concerning these and other factors can be found in “Risk Factors” in Item 1A of this report.
32
|
ITEM 7A.
|
QUANTITATIVE AND QUALITATIVE DISCLOSURES ABOUT MARKET RISK
|
MARKET RISK
We have in place an enterprise risk management process that involves systematic risk identification and mitigation covering the categories of enterprise, strategic, financial, operation and compliance and reporting risk. The enterprise risk management process receives Board of Directors and Management oversight, drives risk mitigation decision-making and is fully integrated into our internal audit planning and execution cycle.
We are exposed to market risk from changes in foreign currency exchange rates, domestic and foreign interest rates, and commodity prices, which can affect our operating results and overall financial condition. We manage exposure to these risks through our operating and financing activities and, when deemed appropriate, through the use of derivatives. Derivatives are viewed as risk management tools and are not used for speculation or for trading purposes. Derivatives are generally contracted with a diversified group of investment grade counterparties to reduce exposure to nonperformance on such instruments.
We use foreign currency forward contracts, currency options, and currency swaps to hedge the price risk associated with firmly committed and forecasted cross-border payments and receipts related to ongoing business and operational financing activities. Foreign currency contracts are sensitive to changes in foreign currency exchange rates. At December 31,
2016
, a 10% favorable or unfavorable exchange rate movement in each currency in our portfolio of foreign currency contracts would have resulted in an incremental unrealized gain of approximately $125 million or loss of approximately $145 million. Consistent with the use of these contracts to neutralize the effect of exchange rate fluctuations, such unrealized losses or gains would be offset by corresponding gains or losses, respectively, in the re-measurement of the underlying exposures.
We enter into commodity swap contracts to hedge the price risk associated with firmly committed and forecasted commodities purchases, the prices of which are not fixed directly through supply contracts. As of December 31,
2016
, a 10% favorable or unfavorable shift in commodity prices would have resulted in an incremental gain or loss of approximately $30 million, respectively, related to these contracts.
33
|
ITEM 8.
|
FINANCIAL STATEMENTS AND SUPPLEMENTARY DATA
|
WHIRLPOOL CORPORATION
Year Ended December 31,
(Millions of dollars, except per share data)
|
|
||||||||||||
|
2016
|
2015
|
2014
|
||||||||||
|
Net sales
|
$
|
20,718
|
|
$
|
20,891
|
|
$
|
19,872
|
|
|||
|
Expenses
|
||||||||||||
|
Cost of products sold
|
17,036
|
|
17,201
|
|
16,477
|
|
||||||
|
Gross margin
|
3,682
|
|
3,690
|
|
3,395
|
|
||||||
|
Selling, general and administrative
|
2,084
|
|
2,130
|
|
2,038
|
|
||||||
|
Intangible amortization
|
71
|
|
74
|
|
33
|
|
||||||
|
Restructuring costs
|
173
|
|
201
|
|
136
|
|
||||||
|
Operating profit
|
1,354
|
|
1,285
|
|
1,188
|
|
||||||
|
Other (income) expense
|
||||||||||||
|
Interest and sundry (income) expense
|
79
|
|
89
|
|
142
|
|
||||||
|
Interest expense
|
161
|
|
165
|
|
165
|
|
||||||
|
Earnings before income taxes
|
1,114
|
|
1,031
|
|
881
|
|
||||||
|
Income tax expense
|
186
|
|
209
|
|
189
|
|
||||||
|
Net earnings
|
928
|
|
822
|
|
692
|
|
||||||
|
Less: Net earnings available to noncontrolling interests
|
40
|
|
39
|
|
42
|
|
||||||
|
Net earnings available to Whirlpool
|
$
|
888
|
|
$
|
783
|
|
$
|
650
|
|
|||
|
Per share of common stock
|
||||||||||||
|
Basic net earnings available to Whirlpool
|
$
|
11.67
|
|
$
|
9.95
|
|
$
|
8.30
|
|
|||
|
Diluted net earnings available to Whirlpool
|
$
|
11.50
|
|
$
|
9.83
|
|
$
|
8.17
|
|
|||
|
Weighted-average shares outstanding (in millions)
|
||||||||||||
|
Basic
|
76.1
|
|
78.7
|
|
78.3
|
|
||||||
|
Diluted
|
77.2
|
|
79.7
|
|
79.6
|
|
||||||
The accompanying notes are an integral part of these Consolidated Financial Statements.
34
WHIRLPOOL CORPORATION
CONSOLIDATED STATEMENTS OF COMPREHENSIVE INCOME
Year Ended December 31,
(Millions of dollars)
|
2016
|
2015
|
2014
|
|||||||||||
|
Net earnings
|
$
|
928
|
|
$
|
822
|
|
$
|
692
|
|
||||
|
Other comprehensive income (loss), before tax:
|
|||||||||||||
|
Foreign currency translation adjustments
|
(30
|
)
|
(432
|
)
|
(392
|
)
|
|||||||
|
Derivative instruments:
|
|
|
|
||||||||||
|
Net gain (loss) arising during period
|
106
|
|
(25
|
)
|
10
|
|
|||||||
|
Less: reclassification adjustment for gain (loss) included in net earnings
|
35
|
|
(2
|
)
|
11
|
|
|||||||
|
Derivative instruments, net
|
71
|
|
(23
|
)
|
(1
|
)
|
|||||||
|
Marketable securities:
|
|||||||||||||
|
Net gain (loss) arising during period
|
(2
|
)
|
3
|
|
—
|
|
|||||||
|
Marketable securities, net
|
(2
|
)
|
3
|
|
—
|
|
|||||||
|
Defined benefit pension and postretirement plans:
|
|||||||||||||
|
Prior service (cost) credit arising during period
|
30
|
|
(5
|
)
|
(11
|
)
|
|||||||
|
Net gain (loss) arising during period
|
(139
|
)
|
(55
|
)
|
(242
|
)
|
|||||||
|
Less: amortization of prior service credit (cost) and actuarial (loss)
|
(39
|
)
|
19
|
|
(20
|
)
|
|||||||
|
Defined benefit pension and postretirement plans, net:
|
(70
|
)
|
(79
|
)
|
(233
|
)
|
|||||||
|
Other comprehensive (loss), before tax
|
(31
|
)
|
(531
|
)
|
(626
|
)
|
|||||||
|
Income tax benefit (expense) related to items of other comprehensive income (loss)
|
(37
|
)
|
30
|
|
80
|
|
|||||||
|
Other comprehensive income (loss), net of tax
|
$
|
(68
|
)
|
$
|
(501
|
)
|
$
|
(546
|
)
|
||||
|
Comprehensive income
|
$
|
860
|
|
$
|
321
|
|
$
|
146
|
|
||||
|
Less: comprehensive income, available to noncontrolling interests
|
40
|
|
30
|
|
38
|
|
|||||||
|
Comprehensive income available to Whirlpool
|
$
|
820
|
|
$
|
291
|
|
$
|
108
|
|
||||
The accompanying notes are an integral part of these Consolidated Financial Statements.
35
WHIRLPOOL CORPORATION
At December 31,
(Millions of dollars)
|
2016
|
2015
|
||||||
|
Assets
|
|||||||
|
Current assets
|
|||||||
|
Cash and cash equivalents
|
$
|
1,085
|
|
$
|
772
|
|
|
|
Accounts receivable, net of allowance of $185 and $160, respectively
|
2,711
|
|
2,530
|
|
|||
|
Inventories
|
2,623
|
|
2,619
|
|
|||
|
Prepaid and other current assets
|
920
|
|
953
|
|
|||
|
Total current assets
|
7,339
|
|
6,874
|
|
|||
|
Property, net of accumulated depreciation of $6,055 and $5,953, respectively
|
3,810
|
|
3,774
|
|
|||
|
Goodwill
|
2,956
|
|
3,006
|
|
|||
|
Other intangibles, net of accumulated amortization of $387 and $327, respectively
|
2,552
|
|
2,678
|
|
|||
|
Deferred income taxes
|
2,154
|
|
2,301
|
|
|||
|
Other noncurrent assets
|
342
|
|
377
|
|
|||
|
Total assets
|
$
|
19,153
|
|
$
|
19,010
|
|
|
|
Liabilities and stockholders’ equity
|
|||||||
|
Current liabilities
|
|||||||
|
Accounts payable
|
$
|
4,416
|
|
$
|
4,403
|
|
|
|
Accrued expenses
|
649
|
|
675
|
|
|||
|
Accrued advertising and promotions
|
742
|
|
706
|
|
|||
|
Employee compensation
|
390
|
|
452
|
|
|||
|
Notes payable
|
34
|
|
20
|
|
|||
|
Current maturities of long-term debt
|
560
|
|
508
|
|
|||
|
Other current liabilities
|
871
|
|
980
|
|
|||
|
Total current liabilities
|
7,662
|
|
7,744
|
|
|||
|
Noncurrent liabilities
|
|||||||
|
Long-term debt
|
3,876
|
|
3,470
|
|
|||
|
Pension benefits
|
1,074
|
|
1,025
|
|
|||
|
Postretirement benefits
|
334
|
|
390
|
|
|||
|
Other noncurrent liabilities
|
479
|
|
707
|
|
|||
|
Total noncurrent liabilities
|
5,763
|
|
5,592
|
|
|||
|
Stockholders’ equity
|
|||||||
|
Common stock, $1 par value, 250 million shares authorized, 111 million shares issued, and 74 million and 77 million shares outstanding, respectively
|
111
|
|
111
|
|
|||
|
Additional paid-in capital
|
2,672
|
|
2,641
|
|
|||
|
Retained earnings
|
7,314
|
|
6,722
|
|
|||
|
Accumulated other comprehensive loss
|
(2,400
|
)
|
(2,332
|
)
|
|||
|
Treasury stock, 37 million and 33 million shares, respectively
|
(2,924
|
)
|
(2,399
|
)
|
|||
|
Total Whirlpool stockholders’ equity
|
4,773
|
|
4,743
|
|
|||
|
Noncontrolling interests
|
955
|
|
931
|
|
|||
|
Total stockholders’ equity
|
5,728
|
|
5,674
|
|
|||
|
Total liabilities and stockholders’ equity
|
$
|
19,153
|
|
$
|
19,010
|
|
|
The accompanying notes are an integral part of these Consolidated Financial Statements.
36
WHIRLPOOL CORPORATION
Year Ended December 31,
(Millions of dollars)
|
2016
|
2015
|
2014
|
|||||||||
|
Operating activities
|
|||||||||||
|
Net earnings
|
$
|
928
|
|
$
|
822
|
|
$
|
692
|
|
||
|
Adjustments to reconcile net earnings to cash provided by (used in) operating activities:
|
|
|
|
||||||||
|
Depreciation and amortization
|
655
|
|
668
|
|
560
|
|
|||||
|
Curtailment gain
|
—
|
|
(63
|
)
|
—
|
|
|||||
|
Changes in assets and liabilities (net of effects of acquisitions):
|
|
|
|
||||||||
|
Accounts receivable
|
(291
|
)
|
(89
|
)
|
(90
|
)
|
|||||
|
Inventories
|
(18
|
)
|
(141
|
)
|
49
|
|
|||||
|
Accounts payable
|
37
|
|
14
|
|
359
|
|
|||||
|
Accrued advertising and promotions
|
46
|
|
74
|
|
121
|
|
|||||
|
Accrued expenses and current liabilities
|
46
|
|
(43
|
)
|
(232
|
)
|
|||||
|
Taxes deferred and payable, net
|
(116
|
)
|
(42
|
)
|
49
|
|
|||||
|
Accrued pension and postretirement benefits
|
(43
|
)
|
(129
|
)
|
(181
|
)
|
|||||
|
Employee compensation
|
(38
|
)
|
8
|
|
(17
|
)
|
|||||
|
Other
|
(3
|
)
|
146
|
|
169
|
|
|||||
|
Cash provided by operating activities
|
1,203
|
|
1,225
|
|
1,479
|
|
|||||
|
Investing activities
|
|||||||||||
|
Capital expenditures
|
(660
|
)
|
(689
|
)
|
(720
|
)
|
|||||
|
Proceeds from sale of assets and business
|
63
|
|
37
|
|
21
|
|
|||||
|
Change in restricted cash
|
24
|
|
47
|
|
74
|
|
|||||
|
Acquisition of Indesit Company S.p.A.
|
—
|
|
—
|
|
(1,356
|
)
|
|||||
|
Acquisition of Hefei Rongshida Sanyo Electric Co., Ltd.
|
—
|
|
—
|
|
(453
|
)
|
|||||
|
Investment in related businesses
|
(12
|
)
|
(70
|
)
|
(16
|
)
|
|||||
|
Other
|
(3
|
)
|
(6
|
)
|
(6
|
)
|
|||||
|
Cash used in investing activities
|
(588
|
)
|
(681
|
)
|
(2,456
|
)
|
|||||
|
Financing activities
|
|||||||||||
|
Proceeds from borrowings of long-term debt
|
1,012
|
|
531
|
|
1,483
|
|
|||||
|
Repayments of long-term debt
|
(522
|
)
|
(283
|
)
|
(606
|
)
|
|||||
|
Net proceeds from short-term borrowings
|
55
|
|
(465
|
)
|
63
|
|
|||||
|
Dividends paid
|
(294
|
)
|
(269
|
)
|
(224
|
)
|
|||||
|
Repurchase of common stock
|
(525
|
)
|
(250
|
)
|
(25
|
)
|
|||||
|
Purchase of noncontrolling interest shares
|
(25
|
)
|
—
|
|
(5
|
)
|
|||||
|
Common stock issued
|
26
|
|
38
|
|
38
|
|
|||||
|
Other
|
(5
|
)
|
(9
|
)
|
(19
|
)
|
|||||
|
Cash provided by (used in) financing activities
|
(278
|
)
|
(707
|
)
|
705
|
|
|||||
|
Effect of exchange rate changes on cash and cash equivalents
|
(24
|
)
|
(91
|
)
|
(82
|
)
|
|||||
|
Increase (decrease) in cash and cash equivalents
|
313
|
|
(254
|
)
|
(354
|
)
|
|||||
|
Cash and cash equivalents at beginning of year
|
772
|
|
1,026
|
|
1,380
|
|
|||||
|
Cash and cash equivalents at end of year
|
$
|
1,085
|
|
$
|
772
|
|
$
|
1,026
|
|
||
|
Supplemental disclosure of cash flow information
|
|||||||||||
|
Cash paid for interest
|
$
|
198
|
|
$
|
178
|
|
$
|
172
|
|
||
|
Cash paid for income taxes
|
$
|
300
|
|
$
|
251
|
|
$
|
140
|
|
||
The accompanying notes are an integral part of these Consolidated Financial Statements.
37
WHIRLPOOL CORPORATION
CONSOLIDATED STATEMENTS OF CHANGES IN STOCKHOLDERS’ EQUITY
Year ended December 31,
(Millions of dollars)
|
|
|
Whirlpool Stockholders’ Equity
|
|
|||||||||||||||||||||
|
|
Total
|
Retained
Earnings
|
Accumulated Other
Comprehensive Income (Loss)
|
Treasury Stock/
Additional Paid-
in-Capital
|
Common
Stock
|
Non-
Controlling
Interests
|
||||||||||||||||||
|
Balances, December 31, 2013
|
$
|
5,034
|
|
$
|
5,784
|
|
|
$
|
(1,298
|
)
|
|
$
|
329
|
|
|
$
|
109
|
|
|
$
|
110
|
|
||
|
Comprehensive income
|
||||||||||||||||||||||||
|
Net earnings
|
692
|
|
650
|
|
|
—
|
|
|
—
|
|
|
—
|
|
|
42
|
|
||||||||
|
Other comprehensive (loss)
|
(546
|
)
|
—
|
|
|
(542
|
)
|
|
—
|
|
|
—
|
|
|
(4
|
)
|
||||||||
|
Comprehensive income
|
146
|
|
650
|
|
(542
|
)
|
—
|
|
—
|
|
38
|
|
||||||||||||
|
Stock issued (repurchased)
|
59
|
|
—
|
|
|
—
|
|
|
58
|
|
|
1
|
|
|
—
|
|
||||||||
|
Dividends declared
|
(244
|
)
|
(225
|
)
|
|
—
|
|
|
—
|
|
|
—
|
|
|
(19
|
)
|
||||||||
|
Acquisitions
|
801
|
|
—
|
|
—
|
|
19
|
|
—
|
|
782
|
|
||||||||||||
|
Balances, December 31, 2014
|
5,796
|
|
6,209
|
|
(1,840
|
)
|
406
|
|
110
|
|
911
|
|
||||||||||||
|
Comprehensive income
|
||||||||||||||||||||||||
|
Net earnings
|
822
|
|
783
|
|
|
—
|
|
|
—
|
|
|
—
|
|
|
39
|
|
||||||||
|
Other comprehensive (loss)
|
(501
|
)
|
—
|
|
|
(492
|
)
|
|
—
|
|
|
—
|
|
|
(9
|
)
|
||||||||
|
Comprehensive income
|
321
|
|
783
|
|
(492
|
)
|
—
|
|
—
|
|
30
|
|
||||||||||||
|
Stock issued (repurchased)
|
(163
|
)
|
—
|
|
|
—
|
|
|
(164
|
)
|
|
1
|
|
|
—
|
|
||||||||
|
Dividends declared
|
(280
|
)
|
(270
|
)
|
|
—
|
|
|
—
|
|
|
—
|
|
|
(10
|
)
|
||||||||
|
Balances, December 31, 2015
|
5,674
|
|
6,722
|
|
(2,332
|
)
|
242
|
|
111
|
|
931
|
|
||||||||||||
|
Comprehensive income
|
||||||||||||||||||||||||
|
Net earnings
|
928
|
|
888
|
|
|
—
|
|
|
—
|
|
|
—
|
|
|
40
|
|
||||||||
|
Other comprehensive (loss)
|
(68
|
)
|
—
|
|
|
(68
|
)
|
|
—
|
|
|
—
|
|
|
—
|
|
||||||||
|
Comprehensive income
|
860
|
|
888
|
|
(68
|
)
|
—
|
|
—
|
|
40
|
|
||||||||||||
|
Stock issued (repurchased)
|
(506
|
)
|
—
|
|
|
—
|
|
|
(494
|
)
|
|
—
|
|
|
(12
|
)
|
||||||||
|
Dividends declared
|
(300
|
)
|
(296
|
)
|
|
—
|
|
|
—
|
|
|
—
|
|
|
(4
|
)
|
||||||||
|
Balances, December 31, 2016
|
$
|
5,728
|
|
$
|
7,314
|
|
$
|
(2,400
|
)
|
$
|
(252
|
)
|
$
|
111
|
|
$
|
955
|
|
||||||
The accompanying notes are an integral part of these Consolidated Financial Statements.
38
NOTES TO THE CONSOLIDATED FINANCIAL STATEMENTS
(
1
)
SUMMARY OF PRINCIPAL ACCOUNTING POLICIES
General Information
Whirlpool Corporation, a Delaware corporation, is the world's leading manufacturer and marketer of major home appliances. Whirlpool manufactures products in
14
countries and markets products in nearly every country around the world under brand names such as
Whirlpool
,
KitchenAid
,
Maytag
,
Consul
,
Brastemp
,
Amana
,
Bauknecht
,
Jenn-Air, Indesit, and Hotpoint
* .
Whirlpool’s reportable segments consist of North America, Europe, Middle East and Africa ("EMEA"), Latin America and Asia.
Principles of Consolidation
The consolidated financial statements are prepared in conformity with United States (U.S.) generally accepted accounting principles (GAAP), and include all majority-owned subsidiaries. All material intercompany transactions have been eliminated upon consolidation. We do not consolidate the financial statements of any company in which we have an ownership interest of 50% or less unless that company is deemed to be a variable interest entity ("VIE") of which we are the primary beneficiary. Certain VIEs are consolidated when the company is the primary beneficiary of these entities and has the ability to directly impact the activities of these entities, and have a nominal effect on the Company's results.
Reclassifications
We reclassified certain prior period amounts in our Consolidated Financial Statements to be consistent with current period presentation.
Use of Estimates
We are required to make estimates and assumptions that affect the amounts reported in the Consolidated Financial Statements and accompanying notes. The most significant assumptions are estimates in determining the fair value of intangible assets, legal contingencies, income taxes and pension and postretirement benefits. Actual results could differ materially from those estimates.
Revenue Recognition
Sales are recognized when revenue is realized or realizable and has been earned. Revenue is recognized when the sales price is determinable and the risk and rewards of ownership are transferred to the customer as determined by the shipping terms. For the majority of our sales, title is transferred to the customer as soon as products are shipped. For a portion of our sales, title is transferred to the customer upon receipt of products at the customer’s location. Sales are net of allowances for product returns, which are based on historical return rates and certain promotions.
Accounts Receivable and Allowance for Doubtful Accounts
We carry accounts receivable at sales value less an allowance for doubtful accounts. We periodically evaluate accounts receivable and establish an allowance for doubtful accounts based on a combination of specific customer circumstances, credit conditions and the history of write-offs and collections. We evaluate items on an individual basis when determining accounts receivable write-offs. In general, our policy is to not charge interest on trade receivables after the invoice becomes past due. A receivable is considered past due if payment has not been received within agreed upon invoice terms.
Freight and Warehousing Costs
We classify freight and warehousing costs within cost of products sold in our Consolidated Statements of Income.
Cash and Cash Equivalents
All highly liquid debt instruments purchased with an initial maturity of three months or less are considered cash equivalents.
*Whirlpool ownership of the Hotpoint brand in the EMEA and Asia Pacific regions is not affiliated with the Hotpoint brand sold in the Americas
39
NOTES TO THE CONSOLIDATED FINANCIAL STATEMENTS - (CONTINUED)
Restricted Cash
The restricted cash can only be
used to fund capital expenditures and technical resources to enhance Whirlpool China’s research and development and working capital, as required by the terms of the Hefei Sanyo acquisition made in October 2014.
As of
December 31, 2016
and
2015
, restricted cash was approximately
$155 million
and
$191 million
, respectively. Approximately
$45 million
and
$48 million
is recorded in other current assets as of
December 31, 2016
and
2015
, respectively, with the remaining portion recorded in other non-current assets.
Fair Value Measurements
We measure fair value based on an exit price, representing the amount that would be received to sell an asset or paid to transfer a liability in an orderly transaction between market participants. As such, fair value is a market-based measurement that should be determined based on assumptions that market participants would use in pricing an asset or liability. As a basis for considering such assumptions, a three-tiered fair value hierarchy is established, which prioritizes the inputs used in measuring fair value as follows: (Level 1) observable inputs such as quoted prices in active markets; (Level 2) inputs, other than the quoted prices in active markets that are observable, either directly or indirectly; and (Level 3) unobservable inputs in which there is little or no market data, which require the reporting entity to develop its own assumptions. We had
no
Level 3 assets or liabilities at
December 31, 2016
and
2015
, with the exception of those disclosed in Note
12
.
We measured fair value for money market funds and available for sale investments using quoted market prices in active markets for identical or comparable assets. We measured fair value for derivative contracts, all of which have counterparties with high credit ratings, based on model driven valuations using significant inputs derived from observable market data. For assets measured at net asset values, we have no unfunded commitments or significant restraints.
Inventories
United States production inventories are stated at last-in, first-out (“LIFO”) cost. Latin America, Asia and certain EMEA inventories which are stated at average cost. The remaining inventories are stated at first-in, first-out (“FIFO”) cost. Costs do not exceed net realizable values. Changes in the amount that FIFO cost exceed LIFO cost are recognized in cost of goods sold. See Note
4
for additional information about inventories.
Property
Property is stated at cost, net of accumulated depreciation. For production machinery and equipment, we record depreciation based on units produced, unless units produced drop below a minimum threshold at which point depreciation is recorded using the straight-line method, excluding property acquired from the
Hefei Sanyo
acquisition and certain property acquired from the
Indesit
acquisition. For non-production assets and assets acquired from
Hefei Sanyo
and certain production assets acquired from
Indesit
, we depreciate costs based on the straight-line method. Depreciation expense for property, including accelerated depreciation classified as restructuring expense in our Consolidated Statements of Income, was
$584 million
,
$594 million
and
$527 million
in
2016
,
2015
and
2014
, respectively.
The following table summarizes our property as of
December 31, 2016
and
2015
:
|
Millions of dollars
|
2016
|
2015
|
Estimated Useful Life
|
|||||||
|
Land
|
$
|
128
|
|
$
|
131
|
|
n/a
|
|||
|
Buildings
|
1,652
|
|
1,614
|
|
10 to 50 years
|
|||||
|
Machinery and equipment
|
8,085
|
|
7,982
|
|
3 to 30 years
|
|||||
|
Accumulated depreciation
|
(6,055
|
)
|
(5,953
|
)
|
||||||
|
Property plant and equipment, net
|
$
|
3,810
|
|
$
|
3,774
|
|
||||
We classify gains and losses associated with asset dispositions in the same line item as the underlying depreciation of the disposed asset in the Consolidated Statements of Income. During
2016
, we retired primarily machinery and equipment with a net book value of approximately
$38 million
that was no longer in use. During
2015
, we retired primarily machinery and equipment with a net book value of approximately
$11 million
that was no longer in use. Net gains and losses recognized in cost of products sold were not material for
2016
,
2015
and
2014
.
We record impairment losses on long-lived assets, excluding goodwill and indefinite lived intangibles, when events and circumstances indicate the assets may be impaired and the estimated future cash flows generated by those assets are less than their carrying amounts. There were no significant impairments recorded during
2016
,
2015
and
2014
.
40
NOTES TO THE CONSOLIDATED FINANCIAL STATEMENTS - (CONTINUED)
Goodwill and Other Intangibles
We perform our annual impairment assessment for goodwill and other indefinite-life intangible assets as of October 1st and more frequently if indicators of impairment exist. In 2016, the Company primarily elected to perform a quantitative analysis using a discounted cash flow model and other valuation techniques, to evaluate goodwill and certain indefinite-life intangible assets.
Goodwill
In performing a quantitative assessment of goodwill, we estimate each reporting units fair value using fair value using the best information available to us, including market information and discounted cash flow projections also referred to as the income approach. The income approach uses reporting unit’s projections of estimated operating results and cash flows that are discounted using a weighted-average cost of capital, which that is determined based on current market conditions. Additionally we validate our estimates of fair value under the income approach by comparing the values to fair value estimates using a market approach. We performed our assessment as of October 1,
2016
, and determined there was
no
impairment of goodwill.
Other Intangible Assets
We perform a quantitative assessment of other indefinite life intangible assets, which are primarily comprised of trademarks. We estimate the fair value of these intangible assets using the relief-from-royalty method, which primarily requires assumptions related to projected revenues from our annual long-range plan, assumed royalty rates that could be payable if we did not own the trademark, and a discount rate based on our weighted average cost of capital. We performed our assessment as of October 1,
2016
, and determined there was
no
impairments of indefinite life intangible assets.
Other definite life intangible assets are amortized over their useful life and are assessed for impairment when impairment indicators are present.
Accounts Payable Outsourcing
We offer our suppliers access to third party payable processors, independent to Whirlpool. The processors allow suppliers to sell their receivables to financial institutions at the sole discretion of both the supplier and the financial institution. In China, as a common practice we pay suppliers with banker’s acceptance drafts. Banker’s acceptance drafts allow suppliers to sell their receivables to financial institutions at the sole discretion of both the supplier and the financial institution. We have no economic interest in the sale of these receivables and no direct financial relationship with the financial institutions concerning these services. All of our obligations, including amounts due, remain to our suppliers as stated in our supplier agreements. As of
December 31, 2016
and
2015
, approximately
$1.3 billion
and
$1.2 billion
, respectively, have been issued to participating financial institutions.
Derivative Financial Instruments
We use derivative instruments designated as cash flow and fair value hedges to manage our exposure to the volatility in material costs, foreign currency and interest rates on certain debt instruments. Changes in the fair value of derivative assets or liabilities (i.e., gains or losses) are recognized depending upon the type of hedging relationship and whether a hedge has been designated. For those derivative instruments that qualify for hedge accounting, we designate the hedging instrument, based upon the exposure being hedged, as a cash flow hedge, fair value hedge, or a hedge of a net investment in a foreign operation. For a derivative instrument designated as a fair value hedge, the gain or loss on the derivative is recognized in earnings in the period of change in fair value together with the offsetting gain or loss on the hedged item. For a derivative instrument designated as a cash flow hedge, the effective portion of the derivative’s gain or loss is initially reported as a component of Other Comprehensive Income and is subsequently recognized in earnings when the hedged exposure affects earnings. For a derivative instrument designated as a hedge of a net investment in a foreign operation, the effective portion of the derivative’s gain or loss is reported in Other Comprehensive Income (Loss) as part of the cumulative translation adjustment. Changes in fair value of derivative instruments that do not qualify for hedge accounting are recognized immediately in current net earnings. See Note
7
for additional information about hedges and derivative financial instruments.
Foreign Currency Translation and Transactions
Foreign currency denominated assets and liabilities are translated into United States dollars at exchange rates existing at the respective balance sheet dates. Translation adjustments resulting from fluctuations in exchange rates are recorded as a separate component of Accumulated Other Comprehensive Income (Loss) within stockholders’ equity. The results of operations of foreign subsidiaries are translated at the average exchange rates during the respective periods. Gains and losses resulting from foreign currency transactions are included in net earnings.
41
NOTES TO THE CONSOLIDATED FINANCIAL STATEMENTS - (CONTINUED)
Research and Development Costs
Research and development costs are charged to expense and totaled $
604 million
,
$579 million
and
$563 million
in
2016
,
2015
and
2014
, respectively.
Advertising Costs
Advertising costs are charged to expense when the advertisement is first communicated and totaled
$366 million
,
$310 million
and
$269 million
in
2016
,
2015
and
2014
, respectively.
Income Taxes
We account for income taxes using the asset and liability method. Under this method, deferred tax assets and liabilities are recognized for the future tax consequences of temporary differences between the financial statement and tax basis of assets and liabilities using enacted rates. The effect of a change in tax rates on deferred tax assets is recognized in income in the period of enactment date.
We recognize, primarily in other noncurrent liabilities, in the Consolidated Balance Sheets, the effects of uncertain income tax positions. We record liabilities net of the amount, based on technical merits, that will be sustained upon examination. We accrue for other non income tax contingencies when it is probable that a liability to a taxing authority has been incurred and the amount of the contingency can be reasonably estimated.
Provision is made for taxes on undistributed earnings of foreign subsidiaries and related companies to the extent that such earnings are not deemed to be permanently invested. See Note
11
for additional information about income taxes.
Stock Based Compensation
Stock based compensation expense is based on the grant date fair value and is expensed over the period during which an employee is required to provide service in exchange for the award (generally the vesting period). The Company's stock based compensation includes stock options, performance stock units, performance shares, restricted stock and restricted stock units. The fair value of stock options are determined using the Black-Scholes option-pricing model, which incorporates assumptions regarding the risk-free interest rate, expected volatility, expected option life, expected forfeitures and dividend yield. Expected forfeitures are based on historical experience. Stock options are granted with an exercise price equal to the stock price on the date of grant. The fair value of restricted stock units and performance stock units is generally based on the closing market price of Whirlpool common stock on the grant date. See Note
9
for additional information about stock based compensation.
BEFIEX Credits
In previous years, our Brazilian operations earned tax credits under the Brazilian government’s export incentive program (BEFIEX). These credits reduce Brazilian federal excise taxes on domestic sales, resulting in an increase in the operations’ recorded net sales. We recognized export credits as they were monetized. See Note
6
and Note
11
for additional information regarding BEFIEX credits.
Adoption of New Accounting Standards
In November 2015, the Financial Accounting Standards Board (“FASB”) issued Accounting Standards Update ("ASU") No. 2015-17, "Income Taxes (Topic 740): Balance Sheet Classification of Deferred Taxes", which supersedes the guidance in Topic 740, Income Taxes, that requires an entity to separate deferred tax liabilities and assets into a current amount and noncurrent amount in a classified statement of financial position. The amendment requires entities that present a classified balance sheet to classify all deferred tax liabilities and assets as a noncurrent amount. This pronouncement is effective for fiscal years and interim periods within those years beginning after December 15, 2016, and may be early adopted on a prospective basis or on a retrospective basis to all periods presented. On December 31, 2016, we retrospectively adopted the new accounting standard. The change resulted in the reclassification, from current to noncurrent, of deferred tax assets of approximately
$451 million
and deferred tax liabilities of approximately
$19 million
, as of December 31, 2015. The impact of this reclassification as of December 31, 2016 has no impact on net income or cash flow, and is comparable to December 31, 2015.
The following standards were adopted during 2016, none of which have a material impact on our Consolidated Financial Statements:
42
NOTES TO THE CONSOLIDATED FINANCIAL STATEMENTS - (CONTINUED)
|
Standard
|
Effective Year
(a)
|
|
|
2015-03
|
Interest - Imputation of Interest (Subtopic 835-30): Simplifying the Presentation of Debt Issuance Costs
|
2016
|
|
2015-07
|
Fair Value Measurement (Topic 820): Disclosures for investments in certain assets that calculate net asset value per share
|
2016
|
|
2015-11
|
Inventory (Topic 330): Simplifying the Measurement of Inventory
|
2016
(b)
|
|
2015-12
|
Plan Accounting-Defined Benefit Pension Plans (Topic 960), Defined Contribution Pension Plans (Topic 962) Health and Welfare Benefit Plans (Topic 965)
|
2016
|
|
2016-09
|
Compensation—Stock Compensation (Topic 718): Improvements to Employee Share-Based Payment Accounting
|
2016
(b)
|
(a) Represents date standard becomes effective or date standard becomes effective to our Company as a result of early adoption
(b) Early adoption
All other issued and effective accounting standards were not relevant to Whirlpool Corporation.
Accounting Pronouncements Issued But Not Yet Effective
In February 2016, the FASB issued ASU No. 2016-02, "Leases (Topic 842)". The guidance in ASU 2016-02 supersedes the lease recognition requirements in ASC Topic 840, Leases (FAS 13). The new standard establishes a right-of-use (ROU) model that requires a lessee to record a ROU asset and a lease liability on the balance sheet for leases with terms longer than 12 months. Leases will be classified as either finance or operating, with classification affecting the pattern of expense recognition in the income statement. The new standard is effective for fiscal years beginning after December 15, 2018, including interim periods within those fiscal years, with early adoption permitted. A modified retrospective transition approach is required for lessees for capital and operating leases existing at, or entered into after, the beginning of the earliest comparative period presented in the financial statements. Early adoption of the amendments in the update is permitted. The Company is currently evaluating the effect this standard will have on our Consolidated Financial Statements.
FASB has issued the following standards, which are not expected to have a material impact on our Consolidated Financial Statements:
|
Standard
|
Effective Date
(a)
|
|
|
2014-09
|
Revenue from Contracts with Customers (Topic 606)
(b)
|
January 1, 2018
|
|
2016-01
|
Financial Instruments - Overall (Subtopic 825-10): Recognition and Measurement of Financial Assets and Financial Liabilities
|
January 1, 2018
|
(a) Represents date standard becomes effective as indicated in the ASU.
(b) In 2014, we established a global project management team to analyze the impact of this standard by reviewing our current accounting policies and practices in each reporting segment to identify potential differences that would result from the application of this standard. We determined minimal changes are required to our business processes, systems and controls to effectively report revenue recognition and disclosure under the new standard. Based on our evaluation, we expect to adopt the requirements of the new standard in the first quarter of 2018 and anticipate using the modified retrospective transition method.
.
All other issued and not yet effective accounting standards are not relevant to Whirlpool Corporation.
(
2
)
GOODWILL AND OTHER INTANGIBLES
Goodwill
The following table summarizes goodwill attributable to our reporting units at
December 31, 2016
and
2015
:
|
Millions of dollars
|
2016
|
2015
|
||||
|
North America
|
$
|
1,734
|
|
$
|
1,732
|
|
|
EMEA
|
808
|
|
832
|
|
||
|
Latin America
|
4
|
|
3
|
|
||
|
Asia
|
410
|
|
439
|
|
||
|
Total
|
$
|
2,956
|
|
$
|
3,006
|
|
The change in the carrying value of goodwill was primarily due to the impact of foreign currency.
43
NOTES TO THE CONSOLIDATED FINANCIAL STATEMENTS - (CONTINUED)
Other Intangible Assets
The following table summarizes other intangible assets at
December 31, 2016
and
2015
:
|
2016
|
2015
|
|||||||||||||||||||||||
|
Millions of dollars
|
Gross Carrying Amount
|
Accumulated Amortization
|
Net
|
Gross Carrying Amount
|
Accumulated Amortization
|
Net
|
||||||||||||||||||
|
Other intangible assets, finite lives:
|
||||||||||||||||||||||||
|
Customer relationships
(1)
|
$
|
617
|
|
$
|
(237
|
)
|
$
|
380
|
|
$
|
632
|
|
$
|
(200
|
)
|
$
|
432
|
|
||||||
|
Patents and other
(2)
|
337
|
|
(150
|
)
|
187
|
|
359
|
|
(127
|
)
|
232
|
|
||||||||||||
|
Total other intangible assets, finite lives
|
$
|
954
|
|
$
|
(387
|
)
|
$
|
567
|
|
$
|
991
|
|
$
|
(327
|
)
|
$
|
664
|
|
||||||
|
Trademarks, indefinite lives
|
1,985
|
|
—
|
|
1,985
|
|
2,014
|
|
—
|
|
2,014
|
|
||||||||||||
|
Total other intangible assets
|
$
|
2,939
|
|
$
|
(387
|
)
|
$
|
2,552
|
|
$
|
3,005
|
|
$
|
(327
|
)
|
$
|
2,678
|
|
||||||
(1) Customer relationships have an estimated useful life of
3
to
16
years.
(2) Patents and other intangibles have an estimated useful life of
1
to
41
years.
The change in the gross carrying value of other intangible assets was primarily due to the impact of foreign currency. Amortization expense was
$71 million
and
$74 million
for the years ended
December 31, 2016
and
2015
, respectively. The following table summarizes our future estimated amortization expense by year:
|
Millions of dollars
|
|
||
|
2017
|
$
|
68
|
|
|
2018
|
65
|
|
|
|
2019
|
62
|
|
|
|
2020
|
62
|
|
|
|
2021
|
52
|
|
|
(
3
)
FAIR VALUE MEASUREMENTS
Fair value is measured based on an exit price, representing the amount that would be received to sell an asset or paid to transfer a liability in an orderly transaction between market participants. As such, fair value is a market-based measurement that should be determined based on assumptions market participants would use in pricing an asset or liability. Assets and liabilities measured at fair value are based on a market valuation approach using prices and other relevant information generated by market transactions involving identical or comparable assets or liabilities. As a basis for considering such assumptions, a three-tiered fair value hierarchy is established, which prioritizes the inputs used in measuring fair value as follows: (Level 1) observable inputs such as quoted prices in active markets; (Level 2) inputs, other than the quoted prices in active markets that are observable, either directly or indirectly; and (Level 3) unobservable inputs in which there is little or no market data, which require the reporting entity to develop its own assumptions. We had
no
(Level 3) assets or liabilities at
December 31, 2016
.
Assets and liabilities measured at fair value on a recurring basis at
December 31, 2016
and
2015
are as follows:
|
Total Cost Basis
|
Quoted Prices In
Active Markets for
Identical Assets
(Level 1)
|
Significant Other
Observable Inputs
(Level 2)
|
Total Fair Value
|
|||||||||||||||||||||||||||||
|
Millions of dollars
|
2016
|
2015
|
2016
|
2015
|
2016
|
2015
|
2016
|
2015
|
||||||||||||||||||||||||
|
Money market funds
(1)
|
$
|
29
|
|
$
|
13
|
|
$
|
29
|
|
$
|
13
|
|
$
|
—
|
|
$
|
—
|
|
$
|
29
|
|
$
|
13
|
|
||||||||
|
Net derivative contracts
|
—
|
|
—
|
|
—
|
|
—
|
|
41
|
|
(42
|
)
|
41
|
|
(42
|
)
|
||||||||||||||||
|
Available for sale investments
|
4
|
|
11
|
|
16
|
|
25
|
|
—
|
|
—
|
|
16
|
|
25
|
|
||||||||||||||||
(1)
Money market funds are comprised primarily of government obligations and other first tier obligations.
44
NOTES TO THE CONSOLIDATED FINANCIAL STATEMENTS - (CONTINUED)
Other Fair Value Measurements
The fair value of long-term debt (including current maturities) was
$4.5 billion
and
$4.0 billion
at
December 31, 2016
and
2015
, respectively, and was estimated using a discounted cash flow analysis based on incremental borrowing rates for similar types of borrowing arrangements (Level 2 input).
(
4
)
INVENTORIES
The following table summarizes our inventories at
December 31, 2016
and
2015
:
|
Millions of dollars
|
2016
|
2015
|
||||||
|
Finished products
|
$
|
2,070
|
|
$
|
2,093
|
|
||
|
Raw materials and work in process
|
651
|
|
655
|
|
||||
|
2,721
|
|
2,748
|
|
|||||
|
Less: excess of FIFO cost over LIFO cost
|
(98
|
)
|
(129
|
)
|
||||
|
Total inventories
|
$
|
2,623
|
|
|
$
|
2,619
|
|
|
LIFO inventories represented
37%
of total inventories at
December 31, 2016
and
2015
, respectively.
(
5
)
FINANCING ARRANGEMENTS
The following table summarizes our long-term debt at
December 31, 2016
and
2015
:
|
Millions of dollars
|
2016
|
2015
|
||||
|
Senior note - 6.5%, matured 2016
|
$
|
—
|
|
$
|
250
|
|
|
Debentures - 7.75%, matured 2016
|
—
|
|
244
|
|
||
|
Senior note - 1.35%, maturing 2017
|
250
|
|
250
|
|
||
|
Senior note - 1.65%, maturing 2017
|
300
|
|
300
|
|
||
|
Senior note - 4.5%, maturing 2018
|
327
|
|
345
|
|
||
|
Senior note - 2.4%, maturing 2019
|
250
|
|
250
|
|
||
|
Senior note - 0.625% maturing 2020
|
525
|
|
541
|
|
||
|
Senior note - 4.85%, maturing 2021
|
300
|
|
300
|
|
||
|
Senior note - 4.70%, maturing 2022
|
300
|
|
300
|
|
||
|
Senior note - 3.70%, maturing 2023
|
250
|
|
250
|
|
||
|
Senior note - 4.0%, maturing 2024
|
300
|
|
300
|
|
||
|
Senior note - 3.7%, maturing 2025
|
350
|
|
350
|
|
||
|
Senior note - 1.25% maturing 2026
|
517
|
|
—
|
|
||
|
Senior note - 5.15% maturing 2043
|
249
|
|
249
|
|
||
|
Senior note - 4.50% maturing 2046
|
496
|
|
—
|
|
||
|
Other
|
22
|
|
49
|
|
||
|
$
|
4,436
|
|
$
|
3,978
|
|
|
|
Less current maturities
|
560
|
|
508
|
|
||
|
Total long-term debt
|
$
|
3,876
|
|
$
|
3,470
|
|
45
NOTES TO THE CONSOLIDATED FINANCIAL STATEMENTS - (CONTINUED)
The following table summarizes the contractual maturities of our long-term debt, including current maturities, at
December 31, 2016
:
|
Millions of dollars
|
|
||
|
2017
|
$
|
560
|
|
|
2018
|
342
|
|
|
|
2019
|
259
|
|
|
|
2020
|
524
|
|
|
|
2021
|
299
|
|
|
|
Thereafter
|
2,452
|
|
|
|
Long-term debt, including current maturities
|
$
|
4,436
|
|
On July 15, 2016,
$244 million
of
7.75%
notes matured and were repaid. On June 15, 2016,
$250 million
of
6.50%
notes matured and were repaid.
On May 23, 2016, we completed a debt offering of
$500 million
principal amount of
4.50%
notes due in 2046. The notes contain covenants that limit our ability to incur certain liens or enter into certain sale and lease-back transactions. In addition, if we experience a specific kind of change of control, we are required to make an offer to purchase all of the notes at a purchase price of
101%
of the principal amount thereof, plus accrued and unpaid interest. The notes are registered under the Securities Act of 1933, as amended, pursuant to our Registration Statement on Form S-3 (File No. 333-203704) filed with the Securities and Exchange Commission on April 29, 2015.
On November 2, 2016, Whirlpool Finance Luxembourg S.à. r.l., an indirect, wholly-owned finance subsidiary of Whirlpool Corporation, completed a debt offering of
€500 million
(approximately $555 million as of the date of issuance) principal amount of
1.250%
notes due in 2026. The Company has fully and unconditionally guaranteed these notes. The notes contain covenants that limit Whirlpool Corporation's ability to incur certain liens or enter into certain sale and lease-back transactions. In addition, if we experience a specific kind of change of control, we are required to make an offer to purchase all of the notes at a purchase price of 101% of the principal amount thereof, plus accrued and unpaid interest. The notes are registered under the Securities Act of 1933, as amended, pursuant to our Registration Statement on Form S-3 (File No.333-203704-1) filed with the Securities and Exchange Commission on October 25, 2016
On May 17, 2016, we and certain of our subsidiaries entered into a Third Amended and Restated Long-Term Credit Agreement (the “Amended Long-Term Facility”). The Amended Long-Term Facility provides aggregate borrowing capacity of
$2.5 billion
, which combines amounts previously available under our prior Original Long-Term Facility and Terminated 364-Day Facility. The Amended Long-Term Facility has a maturity date of May 17, 2021 and amends and restates in its entirety our previously existing Second Amended and Restated Long-Term Credit Agreement, dated September 26, 2014 (the "Original Long-Term Facility"), and replaces aggregate borrowing capacity of
$500 million
available under our previously existing Amended and Restated Short-Term Credit Agreement, dated as of September 25, 2015, which agreement was terminated on May 17, 2016 (the "Terminated 364-Day Facility").
The interest and fee rates payable with respect to the Amended Long-Term Facility based on our current debt rating are as follows: (1) the spread over LIBOR is
1.125%
; (2) the spread over prime is
0.125%
; and (3) the unused commitment fee is
0.125%
. The Amended Long-Term Facility contains customary covenants and warranties including, among other things, a debt to capitalization ratio of less than or equal to
0.60
to 1.00 as of the last day of each fiscal quarter, and a rolling twelve month interest coverage ratio required to be greater than or equal to
3.0
to 1.0 for each fiscal quarter. In addition, the covenants limit our ability to (or to permit any subsidiaries to), subject to various exceptions and limitations: (i) merge with other companies; (ii) create liens on its property; (iii) incur debt or off-balance sheet obligations at the subsidiary level; (iv) enter into transactions with affiliates, except on an arms-length basis; (v) enter into agreements restricting the payment of subsidiary dividends or restricting the making of loans or repayment of debt by subsidiaries to the Company or other subsidiaries; and (vi) enter into agreements restricting the creation of liens on our assets.
In addition to the committed
$2.5 billion
Amended Long-Term Facility, we have a committed European facility and committed credit facilities in Brazil. The European facility provides borrowings up to
€250 million
(approximately
$263 million
at
December 31, 2016
), expiring in 2019. The committed credit facilities in Brazil provide borrowings up to
1.0 billion
Brazilian reais (approximately
$307 million
at
December 31, 2016
), expiring in 2017.
We had
no
borrowings outstanding under the committed credit facilities at
December 31, 2016
and
2015
, respectively.
46
NOTES TO THE CONSOLIDATED FINANCIAL STATEMENTS - (CONTINUED)
Notes Payable
The notes payable consist of short-term borrowings payable to banks of
$34 million
and
$20 million
as of
December 31, 2016
and
2015
, respectively.
(
6
)
COMMITMENTS AND CONTINGENCIES
OTHER MATTERS
Embraco Antitrust Matters
Beginning in February 2009, our compressor business headquartered in Brazil ("Embraco") was notified of antitrust investigations of the global compressor industry by government authorities in various jurisdictions. Embraco has resolved government investigations in various jurisdictions as well as all related civil lawsuits in the United States and no payments are owed in connection with such resolutions. Embraco also has resolved certain other claims and certain claims remain pending. Additional lawsuits could be filed.
At December 31,
2016
, a nominal amount remains accrued. We continue to defend these actions and take other steps to minimize our potential exposure. The final outcome and impact of these matters, and any related claims and investigations that may be brought in the future are subject to many variables, and cannot be predicted. We establish accruals only for those matters where we determine that a loss is probable and the amount of loss can be reasonably estimated. While it is currently not possible to reasonably estimate the aggregate amount of costs which we may incur in connection with these matters, such costs could have a material adverse effect on our financial position, liquidity, or results of operations in any particular reporting period.
BEFIEX Credits and Other Brazil Tax Matters
In previous years, our Brazilian operations earned tax credits under the Brazilian government's export incentive program (BEFIEX). These credits reduced Brazilian federal excise taxes on domestic sales, resulting in an increase in the operations' recorded net sales, as the credits were monetized. We did not monetize any BEFIEX credits during the years ended December 31, 2016 or 2015.
We began recognizing BEFIEX credits in accordance with prior favorable court decisions allowing for the credits to be recognized. We recognized export credits as they were monetized.
In December 2013, the Brazilian government reinstituted the monetary adjustment index applicable to BEFIEX credits that existed prior to July 2009, when the Brazilian government required companies to apply a different monetary adjustment index to BEFIEX credits. As of
December 31, 2016
, no BEFIEX credits deemed to be available prior to this action remained to be monetized. Whether use of the reinstituted index should be given retroactive effect for the July 2009 to December 2013 period has been subject to review by the Brazilian courts. If the reinstituted index is given retroactive effect, we would be entitled to recognize additional credits. We are awaiting the resolution of additional proceedings on the retroactive effect of the reinstituted index.
Our Brazilian operations have received governmental assessments related to claims for income and social contribution taxes associated with certain monetized BEFIEX credits. We do not believe BEFIEX export credits are subject to income or social contribution taxes. We are disputing these tax matters in various courts and intend to vigorously defend our positions. We have not provided for income or social contribution taxes on these export credits, and based on the opinions of tax and legal advisors, we have not accrued any amount related to these assessments as of
December 31, 2016
. The total amount of outstanding tax assessments received for income and social contribution taxes relating to the BEFIEX credits, including interest and penalties, is approximately
1.8 billion
Brazilian reais (approximately
$541 million
as of
December 31, 2016
).
Relying on existing Brazilian legal precedent, in 2003 and 2004, we recognized tax credits in an aggregate amount of
$26 million
, adjusted for currency, on the purchase of raw materials used in production (“IPI tax credits”). The Brazilian tax authority subsequently challenged the recording of IPI tax credits. No credits have been recognized since 2004. In 2009, we entered into a Brazilian government program which provided extended payment terms and reduced penalties and interest to encourage tax payers to resolve this and certain other disputed tax credit amounts. As permitted by the program, we elected to settle certain debts through the use of other existing tax credits and recorded charges of approximately
$34 million
in 2009 associated with these matters. In July 2012, the Brazilian revenue authority notified us that a portion of our proposed settlement was rejected and we received tax assessments of
232 million
Brazilian reais (approximately
$71 million
as of
December 31, 2016
)
, reflecting interest and penalties to date. We are disputing these assessments and we intend to vigorously defend our position. Based on the opinion of our tax and legal advisors, we have not recorded an additional reserve related to these matters.
In 2001, Brazil adopted a law making the profits of controlled foreign corporations of Brazilian entities subject to income and social contribution tax regardless of whether the profits were repatriated ("CFC Tax"). Our Brazilian subsidiary, along with other corporations, challenged tax assessments on foreign profits on constitutionality and other grounds. In April 2013, the Brazilian
47
NOTES TO THE CONSOLIDATED FINANCIAL STATEMENTS - (CONTINUED)
Supreme Court ruled on one of our cases, finding that the law is constitutional, but remanding the case to a lower court for consideration of other arguments raised in our appeal, including the existence of tax treaties with jurisdictions in which controlled foreign corporations are domiciled. As of
December 31, 2016
, our potential exposure for income and social contribution taxes relating to profits of controlled foreign corporations, including interest and penalties and net of expected foreign tax credits, is approximately
171 million
Brazilian reais (approximately
$52 million
as of
December 31, 2016
). We believe these assessments are without merit and we intend to continue to vigorously dispute them. Based on the opinion of our tax and legal advisors, we have not accrued any amount related to these assessments as of
December 31, 2016
.
In addition to the IPI tax credit and CFC Tax matters noted above, we are currently disputing other assessments issued by the Brazilian tax authorities related to non-income and income tax matters, including for the monetization of BEFIEX credits and other matters, which are at various stages of review in numerous administrative and judicial proceedings. The amounts related to these assessments will continue to be increased by monetary adjustments at the Selic rate, which is the benchmark rate set by the Brazilian Central Bank. In accordance with our accounting policies, we routinely assess these matters and, when necessary, record our best estimate of a loss. We believe these tax assessments are without merit and are vigorously defending our positions.
Litigation is inherently unpredictable and the conclusion of these matters may take many years to ultimately resolve. Accordingly, it is possible that an unfavorable outcome in these proceedings could have a material adverse effect on our financial position, liquidity, or results of operations in any particular reporting period.
Other Litigation
We have vigorously defended against numerous lawsuits pending in the United States relating to certain of our front load washing machines. In 2016, we reached final agreement on a settlement that will resolve all such class action lawsuits (except for attorneys fees in an immaterial case) and received court approval. We are proceeding through the administrative consumer claims process to implement the terms of the settlement, which will be complete in 2017.
In addition, we are currently vigorously defending a number of other lawsuits in federal and state courts in the United States related to the manufacturing and sale of our products which include class action allegations, and have and may become involved in similar actions in other jurisdictions. These lawsuits allege claims which include negligence, breach of contract, breach of warranty, product liability and safety claims, false advertising, fraud, and violation of federal and state regulations, including consumer protection laws. In general, we do not have insurance coverage for class action lawsuits. We are also involved in various other legal actions in the United States and other jurisdictions around the world arising in the normal course of business, for which insurance coverage may or may not be available depending on the nature of the action. We dispute the merits of these suits and actions, and intend to vigorously defend them. Management believes, based upon its current knowledge, after taking into consideration legal counsel's evaluation of such suits and actions, and after taking into account current litigation accruals, that the outcome of these matters currently pending against Whirlpool should not have a material adverse effect, if any, on our financial position, liquidity, or results of operations.
Competition Investigation
In 2013, the French Competition Authority commenced an investigation of appliance manufacturers and retailers in France. The investigation includes (among others) Whirlpool and Indesit operations in France. Although it is currently not possible to assess the impact, if any, this matter may have on our Consolidated Financial Statements, the resolution of this matter could have a material adverse effect on our financial position, liquidity, or results of operations in any particular reporting period.
48
NOTES TO THE CONSOLIDATED FINANCIAL STATEMENTS - (CONTINUED)
Product Warranty and Legacy Product Corrective Action Reserves
Product warranty reserves are included in other current and other noncurrent liabilities in our Consolidated Balance Sheets. The following table summarizes the changes in total product warranty and legacy product warranty liability reserves for the periods presented:
|
Product Warranty
|
Legacy Product Warranty
|
Total
|
||||||||||||||||||||||
|
Millions of dollars
|
2016
|
2015
|
2016
|
2015
|
2016
|
2015
|
||||||||||||||||||
|
Balance at January 1
|
$
|
239
|
|
$
|
235
|
|
$
|
254
|
|
$
|
—
|
|
$
|
493
|
|
$
|
235
|
|
||||||
|
Issuances/accruals during the period
|
316
|
|
286
|
|
—
|
|
274
|
|
316
|
|
560
|
|
||||||||||||
|
Settlements made during the period/other
|
(304
|
)
|
(282
|
)
|
(185
|
)
|
(20
|
)
|
(489
|
)
|
(302
|
)
|
||||||||||||
|
Balance at December 31
|
$
|
251
|
|
$
|
239
|
|
$
|
69
|
|
$
|
254
|
|
$
|
320
|
|
$
|
493
|
|
||||||
|
Current portion
|
$
|
189
|
|
$
|
185
|
|
$
|
69
|
|
$
|
155
|
|
$
|
258
|
|
$
|
340
|
|
||||||
|
Non-current portion
|
62
|
|
54
|
|
—
|
|
99
|
|
62
|
|
153
|
|
||||||||||||
|
Total
|
$
|
251
|
|
$
|
239
|
|
$
|
69
|
|
$
|
254
|
|
$
|
320
|
|
$
|
493
|
|
||||||
In the normal course of business, we engage in investigations of potential quality and safety issues. As part of our ongoing effort to deliver quality products to consumers, we are currently investigating a limited number of potential quality and safety issues globally. As necessary, we undertake to effect repair or replacement of appliances in the event that an investigation leads to the conclusion that such action is warranted. As part of that process, in 2015, Whirlpool engaged in thorough investigations of incident reports associated with
two
of its dryer production platforms developed by Indesit, prior to Whirlpool's acquisition of Indesit in October 2014. This led to Indesit reporting the issue to regulatory authorities for consideration. These discussions determined that corrective action of the affected dryers was required.
In September 2015, we recorded a liability related to this corrective action cost of
€245 million
(approximately
$274 million
as of September 30, 2015). Approximately 90% of the affected units were manufactured by Indesit prior to its acquisition by the Company in October 2014. Accordingly, in September 2015 we increased the warranty liability as a purchase accounting adjustment in the opening balance sheet with a corresponding increase to goodwill of
€210 million
(approximately
$235 million
as of September 30, 2015). The establishment of this liability is based on several assumptions such as customer response rate, consumer options, field repair costs, inventory repair costs, and timing of tax deductibility. Our experience with respect to these factors may cause our actual costs to differ significantly from our estimated costs. During 2015, we recognized expenses of
$39 million
related to legacy product warranty and liability corrective action on heritage Indesit product in Europe. Cash settlements related to this corrective action are recognized in other operating activities in the Consolidated Statement of Cash Flows. As of
December 31, 2016
, Whirlpool had
$162 million
of cash expenditures related to the corrective action.
In addition, we sought recovery under the terms of the Indesit agreements and reached an agreement with the seller in the fourth quarter of 2016 to recover a portion of our acquisition-related costs. We recognized such amount in interest and sundry (income) expense.
Guarantees
We have guarantee arrangements in a Brazilian subsidiary. As a standard business practice in Brazil, the subsidiary guarantees customer lines of credit at commercial banks to support purchases following its normal credit policies. If a customer were to default on its line of credit with the bank, our subsidiary would be required to satisfy the obligation with the bank and the receivable would revert back to the subsidiary. At
December 31, 2016
and
December 31, 2015
, the guaranteed amounts totaled
$258 million
and
$260 million
, respectively. The fair value of these guarantees were nominal at
December 31, 2016
and
December 31, 2015
. Our subsidiary insures against credit risk for these guarantees, under normal operating conditions, through policies purchased from high-quality underwriters.
We provide guarantees of indebtedness and lines of credit for various consolidated subsidiaries. The maximum contractual amount of indebtedness and credit facilities available under these lines for consolidated subsidiaries totaled
$2.4 billion
at
December 31, 2016
and
$2.0 billion
at
December 31, 2015
. Our total outstanding bank indebtedness under guarantees was nominal at
December 31, 2016
and
December 31, 2015
, respectively.
49
NOTES TO THE CONSOLIDATED FINANCIAL STATEMENTS - (CONTINUED)
We have guaranteed a
$40 million
five
-year revolving credit facility between certain financial institutions and a not-for-profit entity in connection with a community and economic development project (“Harbor Shores”). The credit facility, which originated in 2008, was refinanced in December 2012 and we renewed our guarantee through 2017. It was also amended in 2015 and 2016 by Harbor Shores and reduced to
$43 million
and
$40 million
, respectively. The fair value of this guarantee was nominal at
December 31, 2016
and
December 31, 2015
The purpose of Harbor Shores is to stimulate employment and growth in the areas of Benton Harbor and St. Joseph, Michigan. In the event of default, we must satisfy the guarantee of the credit facility up to the amount borrowed at the date of default.
Operating Lease Commitments
At
December 31, 2016
, we had noncancelable operating lease commitments totaling
$936 million
. The annual future minimum lease payments are summarized by year in the table below
:
|
Millions of dollars
|
||||
|
2017
|
$
|
206
|
|
|
|
2018
|
170
|
|
||
|
2019
|
141
|
|
||
|
2020
|
118
|
|
||
|
2021
|
96
|
|
||
|
Thereafter
|
205
|
|
||
|
Total noncancelable operating lease commitments
|
$
|
936
|
|
|
Rent expense was
$234 million
,
$238 million
and
$228 million
for
2016
,
2015
and
2014
, respectively.
Purchase Obligations
Our expected cash outflows resulting from non-cancellable purchase obligations are summarized by year in the table below
:
|
Millions of dollars
|
|
|||
|
2017
|
$
|
164
|
|
|
|
2018
|
148
|
|
||
|
2019
|
147
|
|
||
|
2020
|
125
|
|
||
|
2021
|
69
|
|
||
|
Thereafter
|
111
|
|
||
|
Total purchase obligations
|
$
|
764
|
|
|
(
7
)
HEDGES AND DERIVATIVE FINANCIAL INSTRUMENTS
Derivative instruments are accounted for at fair value based on market rates. Derivatives where we elect hedge accounting are designated as either cash flow or fair value hedges. Derivatives that are not accounted for based on hedge accounting are marked to market through earnings. The accounting for changes in the fair value of a derivative depends on the intended use and designation of the derivative instrument. Hedging ineffectiveness and a net earnings impact occur when the change in the fair value of the hedge does not offset the change in the fair value of the hedged item. The ineffective portion of the gain or loss is recognized in earnings.
Using derivative instruments means assuming counterparty credit risk. Counterparty credit risk relates to the loss we could incur if a counterparty were to default on a derivative contract. We generally deal with investment grade counterparties and monitor the overall credit risk and exposure to individual counterparties. We do not anticipate nonperformance by any counterparties. The amount of counterparty credit exposure is limited to the unrealized gains, if any, on such derivative contracts. We do not require nor do we post collateral or security on such contracts.
Hedging Strategy
In the normal course of business, we manage risks relating to our ongoing business operations including those arising from changes in foreign exchange rates, interest rates and commodity prices. Fluctuations in these rates and prices can affect our operating results and financial condition. We use a variety of strategies, including the use of derivative instruments, to manage these risks. We do not enter into derivative financial instruments for trading or speculative purposes.
50
NOTES TO THE CONSOLIDATED FINANCIAL STATEMENTS - (CONTINUED)
Foreign Currency Exchange Rate Risk
We incur expenses associated with the procurement and production of products in a limited number of countries, while we sell in the local currencies of a large number of countries. Our primary foreign currency exchange exposures result from cross-currency sales of products. As a result, we enter into foreign exchange contracts to hedge certain firm commitments and forecasted transactions to acquire products and services that are denominated in foreign currencies.
We enter into certain undesignated non-functional currency asset and liability hedges that relate primarily to short-term payables, receivables and intercompany loans. These forecasted cross-currency cash flows relate primarily to foreign currency denominated expenditures and intercompany financing agreements, royalty agreements and dividends. When we hedge a foreign currency denominated payable or receivable with a derivative, the effect of changes in the foreign exchange rates are reflected currently in interest and sundry (income) expense for both the payable/receivable and the derivative. Therefore, as a result of the economic hedge, we do not elect hedge accounting.
Commodity Price Risk
We enter into commodity derivative contracts on various commodities to manage the price risk associated with forecasted purchases of materials used in our manufacturing process. The objective of these hedges is to reduce the variability of cash flows associated with the forecasted purchase of commodities.
Interest Rate Risk
We may enter into interest rate swap agreements to manage interest rate risk exposure. Our interest rate swap agreements, if any, effectively modify our exposure to interest rate risk, primarily through converting certain of our floating rate debt to a fixed rate basis, and certain fixed rate debt to a floating rate basis. These agreements involve either the receipt or payment of floating rate amounts in exchange for fixed rate interest payments or receipts, respectively, over the life of the agreements without an exchange of the underlying principal amounts. We also may utilize a cross-currency interest rate swap agreement to manage our exposure relating to certain intercompany debt denominated in one foreign currency that will be repaid in another foreign currency.
At
December 31, 2016
and
2015
there were
no
outstanding swap agreements.
We may enter into treasury rate lock agreements to effectively modify our exposure to interest rate risk by locking-in interest rates on probable long-term debt issuances.
Net Investment Hedging
We primarily use foreign currency denominated debt to hedge our investments in certain foreign subsidiaries. In the fourth quarter of 2016, we designated approximately
€700 million
of foreign currency denominated debt instruments as net investment hedges, and as of
December 31, 2016
, the outstanding principal amount of foreign currency denominated debt instruments designated as net investment hedges totaled
€500 million
. We had no net investment hedges as of December 31, 2015.
At
December 31, 2016
, our foreign currency denominated debt designated as net investment hedge consisted of:
|
Instrument
|
Notional (local)
|
Notional (USD)
|
Maturity
|
|||||||
|
Senior note - 0.625%
|
€
|
500
|
|
$
|
527
|
|
March 2020
|
|||
For instruments that are designated and qualify as a net investment hedge, the effective portion of the instruments' gain or loss is reported as a component of OCI and recorded in accumulated other comprehensive loss. The gain or loss will be subsequently reclassified into net earnings when the hedged net investment is either sold or substantially liquidated. The remaining change in fair value of the hedge instruments represents the ineffective portion, which is immediately recognized in interest and sundry (income) expense on our consolidated statements of income. As of
December 31, 2016
, there was
no
ineffectiveness on hedges designated as net investment hedges.
51
NOTES TO THE CONSOLIDATED FINANCIAL STATEMENTS - (CONTINUED)
The following tables summarize our outstanding derivative contracts and their effects on our Consolidated Balance Sheets at
December 31, 2016
and
2015
:
|
|
|
Fair Value of
|
Type of
Hedge
(1)
|
|
||||||||||||||||||||||||||
|
Notional Amount
|
Hedge Assets
|
Hedge Liabilities
|
Maximum Term (Months)
|
|||||||||||||||||||||||||||
|
Millions of dollars
|
2016
|
2015
|
2016
|
2015
|
2016
|
2015
|
2016
|
2015
|
||||||||||||||||||||||
|
Derivatives accounted for as hedges
|
||||||||||||||||||||||||||||||
|
Foreign exchange forwards/options
|
$
|
1,813
|
|
$
|
886
|
|
$
|
32
|
|
$
|
31
|
|
$
|
10
|
|
$
|
8
|
|
(CF)
|
58
|
12
|
|||||||||
|
Commodity swaps/options
|
299
|
|
322
|
|
7
|
|
1
|
|
11
|
|
66
|
|
(CF)
|
36
|
33
|
|||||||||||||||
|
Total derivatives accounted for as hedges
|
$
|
39
|
|
$
|
32
|
|
$
|
21
|
|
$
|
74
|
|
||||||||||||||||||
|
Derivatives not accounted for as hedges
|
||||||||||||||||||||||||||||||
|
Foreign exchange forwards/options
|
$
|
3,262
|
|
$
|
2,886
|
|
$
|
39
|
|
$
|
22
|
|
$
|
16
|
|
$
|
21
|
|
N/A
|
35
|
11
|
|||||||||
|
Commodity swaps/options
|
2
|
|
7
|
|
—
|
|
—
|
|
—
|
|
1
|
|
N/A
|
2
|
6
|
|||||||||||||||
|
Total derivatives not accounted for as hedges
|
39
|
|
22
|
|
16
|
|
22
|
|
||||||||||||||||||||||
|
Total derivatives
|
$
|
78
|
|
$
|
54
|
|
$
|
37
|
|
$
|
96
|
|
||||||||||||||||||
|
Current
|
$
|
54
|
|
$
|
54
|
|
$
|
35
|
|
$
|
79
|
|
||||||||||||||||||
|
Noncurrent
|
24
|
|
—
|
|
2
|
|
17
|
|
||||||||||||||||||||||
|
Total derivatives
|
$
|
78
|
|
$
|
54
|
|
$
|
37
|
|
$
|
96
|
|
||||||||||||||||||
(1)
Derivatives accounted for as hedges are considered cash flow (CF) hedges.
The increase in the notional amount of derivatives is due to increased inter-company funding activity.
The effects of derivative instruments on our Consolidated Statements of Income and Comprehensive Income for OCI for the years ended
December 31, 2016
and
2015
are as follows:
|
Gain (Loss)
Recognized in OCI
(Effective Portion)
|
Gain (Loss)
Reclassified from OCI into Income (Effective Portion) (1) |
|
||||||||||||||||
|
Cash Flow Hedges - Millions of dollars
|
2016
|
2015
|
2016
|
2015
|
|
|||||||||||||
|
Foreign exchange forwards/options
|
$
|
27
|
|
|
$
|
77
|
|
|
$
|
66
|
|
|
$
|
56
|
|
(a)
|
||
|
Commodity swaps/options
|
53
|
|
|
(102
|
)
|
|
(30
|
)
|
|
(57
|
)
|
(a)
|
||||||
|
Interest rate derivatives
|
—
|
|
|
—
|
|
|
(1
|
)
|
|
(1
|
)
|
(b)
|
||||||
|
Net Investment Hedges
|
||||||||||||||||||
|
Foreign currency
|
28
|
|
—
|
|
—
|
|
—
|
|
||||||||||
|
$
|
108
|
|
$
|
(25
|
)
|
$
|
35
|
|
$
|
(2
|
)
|
|||||||
|
Gain (Loss) Recognized on Derivatives not
Accounted for as Hedges
(2)
|
||||||||
|
Derivatives not Accounted for as Hedges - Millions of dollars
|
2016
|
2015
|
||||||
|
Foreign exchange forwards/options
|
$
|
26
|
|
|
$
|
29
|
|
|
(1)
Gains and losses reclassified from accumulated OCI and recognized in income are recorded in (a) cost of products sold; or (b) interest expense.
(2)
Mark to market gains and losses recognized in income are recorded in interest and sundry income (expense).
For cash flow hedges, the amount of ineffectiveness recognized in interest and sundry income (expense) was nominal during
2016
and
2015
. There were no hedges designated as fair value in 2016 and 2015. The net amount of unrealized gain or loss on derivative instruments included in accumulated OCI related to contracts maturing and expected to be realized during the next twelve months is a loss of
$38 million
at
December 31, 2016
.
52
NOTES TO THE CONSOLIDATED FINANCIAL STATEMENTS - (CONTINUED)
(
8
)
STOCKHOLDERS’ EQUITY
Comprehensive Income
Comprehensive income primarily includes (1) our reported net earnings, (2) foreign currency translation, (3) changes in the effective portion of our open derivative contracts designated as cash flow hedges, (4) changes in our unrecognized pension and other postretirement benefits and (5) changes in fair value of our available for sale marketable securities.
The following table shows the components of accumulated other comprehensive income (loss) available to Whirlpool at December 31,
2014
,
2015
, and
2016
, and the activity for the years then ended:
|
Millions of dollars
|
Foreign
Currency
|
Derivative
Instruments
|
Pension and
Postretirement
Liability
|
Marketable
Securities
|
Total
|
|||||||||||||||
|
December 31, 2013
|
$
|
(532
|
)
|
$
|
(6
|
)
|
$
|
(770
|
)
|
$
|
10
|
|
$
|
(1,298
|
)
|
|||||
|
Unrealized gain (loss)
|
(392
|
)
|
(1
|
)
|
—
|
|
—
|
|
(393
|
)
|
||||||||||
|
Unrealized actuarial gain(loss) and prior service credit (cost)
|
—
|
|
—
|
|
(233
|
)
|
—
|
|
(233
|
)
|
||||||||||
|
Tax effect
|
(5
|
)
|
—
|
|
85
|
|
—
|
|
80
|
|
||||||||||
|
Other comprehensive income (loss), net of tax
|
(397
|
)
|
(1
|
)
|
(148
|
)
|
—
|
|
(546
|
)
|
||||||||||
|
Less: Other comprehensive loss available to noncontrolling interests
|
(4
|
)
|
—
|
|
—
|
|
—
|
|
(4
|
)
|
||||||||||
|
Other comprehensive income (loss) available to Whirlpool
|
(393
|
)
|
(1
|
)
|
(148
|
)
|
—
|
|
(542
|
)
|
||||||||||
|
December 31, 2014
|
$
|
(925
|
)
|
$
|
(7
|
)
|
$
|
(918
|
)
|
$
|
10
|
|
$
|
(1,840
|
)
|
|||||
|
Unrealized gain (loss)
|
(432
|
)
|
(23
|
)
|
—
|
|
3
|
|
(452
|
)
|
||||||||||
|
Unrealized actuarial gain (loss) and prior service credit (cost)
|
—
|
|
—
|
|
(79
|
)
|
—
|
|
(79
|
)
|
||||||||||
|
Tax effect
|
—
|
|
—
|
|
30
|
|
—
|
|
30
|
|
||||||||||
|
Other comprehensive income (loss), net of tax
|
(432
|
)
|
(23
|
)
|
(49
|
)
|
3
|
|
(501
|
)
|
||||||||||
|
Less: Other comprehensive loss available to noncontrolling interests
|
(9
|
)
|
—
|
|
—
|
|
—
|
|
(9
|
)
|
||||||||||
|
Other comprehensive income (loss) available to Whirlpool
|
(423
|
)
|
(23
|
)
|
(49
|
)
|
3
|
|
(492
|
)
|
||||||||||
|
December 31, 2015
|
$
|
(1,348
|
)
|
$
|
(30
|
)
|
$
|
(967
|
)
|
$
|
13
|
|
$
|
(2,332
|
)
|
|||||
|
Unrealized gain (loss)
|
(30
|
)
|
71
|
|
—
|
|
(2
|
)
|
39
|
|
||||||||||
|
Unrealized actuarial gain (loss) and prior service credit (cost)
|
—
|
|
—
|
|
(70
|
)
|
—
|
|
(70
|
)
|
||||||||||
|
Tax effect
|
(17
|
)
|
(26
|
)
|
6
|
|
—
|
|
(37
|
)
|
||||||||||
|
Other comprehensive income (loss), net of tax
|
(47
|
)
|
45
|
|
(64
|
)
|
(2
|
)
|
(68
|
)
|
||||||||||
|
Less: Other comprehensive loss available to noncontrolling interests
|
—
|
|
—
|
|
—
|
|
—
|
|
—
|
|
||||||||||
|
Other comprehensive income (loss) available to Whirlpool
|
$
|
(47
|
)
|
$
|
45
|
|
$
|
(64
|
)
|
$
|
(2
|
)
|
$
|
(68
|
)
|
|||||
|
December 31, 2016
|
$
|
(1,395
|
)
|
$
|
15
|
|
$
|
(1,031
|
)
|
$
|
11
|
|
$
|
(2,400
|
)
|
|||||
Net Earnings per Share
Diluted net earnings per share of common stock include the dilutive effect of stock options and other share-based compensation plans. Basic and diluted net earnings per share of common stock were calculated as follows:
|
Millions of dollars and shares
|
2016
|
2015
|
2014
|
|||||||||
|
Numerator for basic and diluted earnings per share – net earnings available to Whirlpool
|
$
|
888
|
|
$
|
783
|
|
$
|
650
|
|
|||
|
Denominator for basic earnings per share – weighted-average shares
|
76.1
|
|
78.7
|
|
78.3
|
|
||||||
|
Effect of dilutive securities – stock-based compensation
|
1.1
|
|
1.0
|
|
1.3
|
|
||||||
|
Denominator for diluted earnings per share – adjusted weighted-average shares
|
77.2
|
|
79.7
|
|
79.6
|
|
||||||
|
Anti-dilutive stock options/awards excluded from earnings per share
|
0.3
|
|
0.2
|
|
0.2
|
|
||||||
53
NOTES TO THE CONSOLIDATED FINANCIAL STATEMENTS - (CONTINUED)
Dividends
Dividends per share paid to shareholders were
$3.90
,
$3.45
and
$2.88
during
2016
,
2015
and
2014
, respectively.
Repurchase Program
On
April 14, 2014
, our Board of Directors authorized a share repurchase program of up to
$500 million
. During the first quarter of 2016, we repurchased
1,507,100
shares at an aggregate purchase price of approximately
$225 million
under this program. As of March 31, 2016, there were
no
remaining funds authorized under this program.
On
April 18, 2016
, our Board of Directors authorized a new share repurchase program of up to
$1 billion
. For the year ended
December 31, 2016
, we repurchased
1,749,600
shares at an aggregate purchase price of approximately
$300 million
under this program. At
December 31, 2016
, there were approximately
$700 million
in remaining funds authorized under this program.
Share repurchases are made from time to time on the open market as conditions warrant. The program does not obligate us to repurchase any of our shares.
(
9
)
SHARE-BASED INCENTIVE PLANS
We sponsor several share-based employee incentive plans. Share-based compensation expense for grants awarded under these plans was
$39 million
,
$52 million
and
$47 million
in
2016
,
2015
, and
2014
, respectively. Related income tax benefits recognized in earnings were
$14 million
,
$18 million
and
$16 million
in
2016
,
2015
, and
2014
, respectively.
At
December 31, 2016
, unrecognized compensation cost related to non-vested stock option and stock unit awards totaled
$49 million
. The cost of these non-vested awards is expected to be recognized over a weighted-average remaining vesting period of
27
months.
Share-Based Employee Incentive Plans
On April 16, 2013, our stockholders approved the Amended and Restated 2010 Omnibus Stock and Incentive Plan (“2010 OSIP”). This plan was previously adopted by our Board of Directors on February 19, 2013 and provides for the issuance of stock options, performance stock units, performance shares, restricted stock and restricted stock units. No new awards may be granted under the 2010 OSIP after the tenth anniversary of the date that the stockholders approved the plan. However, the term and exercise of awards granted before then may extend beyond that date. At
December 31, 2016
, approximately
5.8 million
shares remain available for issuance under the 2010 OSIP.
Stock Options
Eligible employees may receive stock options as a portion of their total compensation. Such options generally become exercisable over a
3
-year period, expire
10
years from the date of grant and are subject to forfeiture upon termination of employment, other than by death, disability or retirement. We use the Black-Scholes option-pricing model to measure the fair value of stock options granted to employees. Granted options have exercise prices equal to the market price of Whirlpool common stock on the grant date. The principal assumptions used in valuing options include: (1) risk-free interest rate—an estimate based on the yield of United States zero coupon securities with a maturity equal to the expected life of the option; (2) expected volatility—an estimate based on the historical volatility of Whirlpool common stock for a period equal to the expected life of the option; and (3) expected option life—an estimate based on historical experience. Stock options are expensed on a straight-line basis, net of estimated forfeitures. Based on the results of the model, the weighted-average grant date fair value of stock options granted for
2016
,
2015
, and
2014
were
$31.21
,
$63.40
and
$42.09
, respectively, using the following assumptions:
|
Weighted Average Black-Scholes Assumptions
|
2016
|
2015
|
2014
|
||||||
|
Risk-free interest rate
|
1.2
|
%
|
1.5
|
%
|
1.5
|
%
|
|||
|
Expected volatility
|
33.5
|
%
|
35.5
|
%
|
38.2
|
%
|
|||
|
Expected dividend yield
|
2.8
|
%
|
1.4
|
%
|
1.8
|
%
|
|||
|
Expected option life, in years
|
5
|
|
5
|
|
5
|
|
|||
54
NOTES TO THE CONSOLIDATED FINANCIAL STATEMENTS - (CONTINUED)
Stock Option Activity
The following table summarizes stock option activity during
2016
:
|
In thousands, except per share data
|
Number
of Options |
Weighted-
Average Exercise Price |
|||||
|
Outstanding at January 1
|
1,938
|
|
$
|
105.46
|
|
||
|
Granted
|
561
|
|
132.66
|
|
|||
|
Exercised
|
(249
|
)
|
103.11
|
|
|||
|
Canceled or expired
|
(35
|
)
|
144.40
|
|
|||
|
Outstanding at December 31
|
2,215
|
|
$
|
112.00
|
|
||
|
Exercisable at December 31
|
1,401
|
|
$
|
90.30
|
|
||
The total intrinsic value of stock options exercised was
$20 million
,
$48 million
, and
$36 million
for
2016
,
2015
, and
2014
, respectively. The related tax benefits were
$7 million
,
$18 million
and
$13 million
for
2016
,
2015
, and
2014
, respectively. Cash received from the exercise of stock options was
$26 million
,
$38 million
, and
$38 million
for
2016
,
2015
, and
2014
, respectively.
The table below summarizes additional information related to stock options outstanding at
December 31, 2016
:
|
Options in thousands / dollars in millions, except share data
|
Outstanding Net of
Expected Forfeitures
|
Options
Exercisable
|
||||||
|
Number of options
|
2,116
|
|
1,401
|
|
||||
|
Weighted-average exercise price per share
|
$
|
111.93
|
|
$
|
90.30
|
|
||
|
Aggregate intrinsic value
|
$
|
156
|
|
$
|
131
|
|
||
|
Weighted-average remaining contractual term, in years
|
6
|
|
5
|
|
||||
Stock Units
Eligible employees may receive restricted stock units or performance stock units as a portion of their total compensation.
Restricted stock units are typically granted to selected management employees on an annual basis and vest over
three
years. Periodically, restricted stock units may be granted to selected executives based on special recognition or retention circumstances and generally vest from
three
years to
seven
years. Some previously granted awards accrue dividend equivalents on outstanding units (in the form of additional stock units) based on dividends declared on Whirlpool common stock. These awards convert to unrestricted common stock at the conclusion of the vesting period.
Performance stock units are granted to executives on an annual basis and generally vest over a
three
year period, converting to unrestricted common stock at the conclusion of the vesting period. The final award may equal
0%
to
200%
of a target based on pre-established Whirlpool financial performance measures.
We measure compensation cost for stock units based on the closing market price of Whirlpool common stock at the grant date, with adjustments for performance stock units to reflect the final award granted. The weighted average grant date fair values of awards granted during
2016
,
2015
, and
2014
were
$127.88
,
$155.37
and
$133.31
, respectively. The total fair value of stock units vested during
2016
,
2015
, and
2014
was
$33 million
,
$41 million
and
$25 million
, respectively.
The following table summarizes stock unit activity during
2016
:
|
Stock units in thousands, except per-share data
|
Number of
Stock Units
|
Weighted- Average
Grant Date Fair
Value
|
|||||
|
Non-vested, at January 1
|
833
|
|
$
|
125.71
|
|
||
|
Granted
|
314
|
|
127.88
|
|
|||
|
Canceled
|
(20
|
)
|
151.50
|
|
|||
|
Vested and transferred to unrestricted
|
(312
|
)
|
106.41
|
|
|||
|
Non-vested, at December 31
|
815
|
|
$
|
134.21
|
|
||
55
NOTES TO THE CONSOLIDATED FINANCIAL STATEMENTS - (CONTINUED)
Nonemployee Director Equity Awards
In 2016, each nonemployee director received an annual grant of Whirlpool common stock, with the number of shares to be issued to the director determined by dividing
$125,000
by the closing price of Whirlpool common stock on the date of the annual meeting of our stockholders. Nonemployee directors receive a one-time grant of
1,000
shares of Whirlpool common stock made at the time they first join the Board.
(
10
)
RESTRUCTURING CHARGES
We periodically take action to improve operating efficiencies, typically in connection with business acquisitions or changes in the economic environment. Our footprint and headcount reductions and organizational integration actions relate to discrete, unique restructuring events, primarily reflected in the following plans.
During 2014 and 2015, we announced the following restructuring plans: (a) the closure of a microwave oven manufacturing facility and other organizational efficiency actions in EMEA and Latin America, (b) organizational integration activities in China and Europe to support the integration of Whirlpool China and Indesit, and (c) the closure of a research and development facility in Germany in 2016. All of these actions were substantially completed in 2016.
In the second quarter of 2015, we committed to a restructuring plan to integrate our Italian legacy operations with those of Indesit. The industrial restructuring plan, which was approved by the relevant labor unions in July 2015 and signed by the Italian government in August 2015, provides for the closure or repurposing of certain manufacturing facilities and headcount reductions at other facilities. In addition, the restructuring plan provides for headcount reductions in the salaried employee workforce. We estimate that we will incur up to
€179 million
(approximately
$189 million
as of
December 31, 2016
) in employee-related costs,
€25 million
(approximately
$26 million
as of
December 31, 2016
) in asset impairment costs, and
€37 million
(approximately
$39 million
as of
December 31, 2016
) in other associated costs in connection with these actions. These actions will be substantially complete in 2018. We estimate
€209 million
(approximately
$220 million
as of
December 31, 2016
) of the estimated
€241 million
total cost will result in future cash expenditures.
On January 24, 2017 the Company and certain subsidiary companies began consultations with certain works councils and other regulatory agencies in connection with the Company’s proposal to restructure its EMEA dryer manufacturing operations. Company management authorized the initiation of such consultations on December 30, 2016. These actions are expected to result in changing the operations at the Yate, U.K. facility to focus on manufacturing for U.K. consumer needs only; ending production in 2018 in Amiens, France; and concentrating the production of dryers for non-UK consumer needs in Lodz, Poland. The Company currently anticipates that approximately
500
positions would be impacted by these actions. The Company would expect these actions to be substantially complete in 2018. The Company estimates that it will incur up to approximately
$65 million
in employee-related costs, approximately
$12 million
in asset impairment costs, and approximately
$11 million
in other associated costs in connection with these actions. The Company estimates that approximately
$76 million
of the estimated
$88 million
total cost will result in future cash expenditures. The actions outlined above resulted in a 2016 charge of
$20 million
which fell within the reported charges for 2016.
The following tables summarize the changes to our restructuring liability for the years ended
December 31, 2016
and
2015
:
|
Millions of dollars
|
12/31/2015
|
Charges to Earnings
|
Cash Paid
|
Non-Cash and Other
|
Revision of Estimate
|
12/31/2016
|
||||||||||||
|
Employee termination costs
|
$
|
30
|
|
$
|
133
|
|
$
|
(90
|
)
|
$
|
(2
|
)
|
$
|
—
|
|
$
|
71
|
|
|
Asset impairment costs
|
—
|
|
17
|
|
(1
|
)
|
(16
|
)
|
—
|
|
—
|
|
||||||
|
Facility exit costs
|
3
|
|
15
|
|
(16
|
)
|
—
|
|
—
|
|
2
|
|
||||||
|
Other exit costs
|
18
|
|
8
|
|
(12
|
)
|
—
|
|
—
|
|
14
|
|
||||||
|
Total
|
$
|
51
|
|
$
|
173
|
|
$
|
(119
|
)
|
$
|
(18
|
)
|
$
|
—
|
|
$
|
87
|
|
|
Millions of dollars
|
12/31/2014
|
Charge to Earnings
|
Cash Paid
|
Non-cash and Other
|
Revision of Estimate
|
12/31/2015
|
||||||||||||
|
Employee termination costs
|
$
|
58
|
|
$
|
136
|
|
$
|
(168
|
)
|
$
|
1
|
|
$
|
3
|
|
$
|
30
|
|
|
Asset impairment costs
|
—
|
|
30
|
|
—
|
|
(30
|
)
|
—
|
|
—
|
|
||||||
|
Facility exit costs
|
4
|
|
12
|
|
(13
|
)
|
—
|
|
—
|
|
3
|
|
||||||
|
Other exit costs
|
16
|
|
23
|
|
(21
|
)
|
—
|
|
—
|
|
18
|
|
||||||
|
Total
|
$
|
78
|
|
$
|
201
|
|
$
|
(202
|
)
|
$
|
(29
|
)
|
$
|
3
|
|
$
|
51
|
|
56
NOTES TO THE CONSOLIDATED FINANCIAL STATEMENTS - (CONTINUED)
The following table summarizes
2016
restructuring charges by operating segment:
|
Millions of dollars
|
2016 Charges
|
||
|
North America
|
$
|
14
|
|
|
EMEA
|
146
|
|
|
|
Latin America
|
9
|
|
|
|
Asia
|
3
|
|
|
|
Corporate / Other
|
1
|
|
|
|
Total
|
$
|
173
|
|
(
11
)
INCOME TAXES
Income tax expense was
$186 million
,
$209 million
, and
$189 million
in
2016
,
2015
and
2014
, respectively. The following table summarizes the difference between income tax expense at the United States statutory rate of
35%
and the income tax expense at effective worldwide tax rates for the respective periods:
|
Millions of dollars
|
2016
|
2015
|
2014
|
|||||||||
|
Earnings before income taxes
|
||||||||||||
|
United States
|
$
|
605
|
|
$
|
555
|
|
$
|
325
|
|
|||
|
Foreign
|
509
|
|
476
|
|
556
|
|
||||||
|
Earnings before income taxes
|
1,114
|
|
1,031
|
|
881
|
|
||||||
|
Income tax computed at United States statutory rate
|
390
|
|
361
|
|
308
|
|
||||||
|
U.S. government tax incentives
|
(9
|
)
|
(13
|
)
|
(10
|
)
|
||||||
|
Foreign government tax incentives, including BEFIEX
|
(11
|
)
|
(19
|
)
|
(46
|
)
|
||||||
|
Foreign tax rate differential
|
(50
|
)
|
(36
|
)
|
(17
|
)
|
||||||
|
U.S. foreign tax credits
|
(86
|
)
|
(103
|
)
|
(148
|
)
|
||||||
|
Valuation allowances
|
(121
|
)
|
(95
|
)
|
9
|
|
||||||
|
State and local taxes, net of federal tax benefit
|
20
|
|
18
|
|
5
|
|
||||||
|
Foreign withholding taxes
|
36
|
|
16
|
|
16
|
|
||||||
|
U.S. tax on foreign dividends and subpart F income
|
63
|
|
57
|
|
56
|
|
||||||
|
Settlement of global tax audits
|
(40
|
)
|
16
|
|
(5
|
)
|
||||||
|
Changes in enacted tax rates
|
32
|
|
—
|
|
—
|
|
||||||
|
Other items, net
|
(38
|
)
|
7
|
|
21
|
|
||||||
|
Income tax computed at effective worldwide tax rates
|
$
|
186
|
|
$
|
209
|
|
$
|
189
|
|
|||
Current and Deferred Tax Provision
The following table summarizes our income tax (benefit) provision for
2016
,
2015
and
2014
:
|
|
2016
|
2015
|
2014
|
|||||||||||||||||||||
|
Millions of dollars
|
Current
|
Deferred
|
Current
|
Deferred
|
Current
|
Deferred
|
||||||||||||||||||
|
United States
|
$
|
34
|
|
$
|
120
|
|
$
|
98
|
|
$
|
55
|
|
$
|
7
|
|
$
|
8
|
|
||||||
|
Foreign
|
167
|
|
(154
|
)
|
181
|
|
(143
|
)
|
182
|
|
12
|
|
||||||||||||
|
State and local
|
7
|
|
12
|
|
10
|
|
8
|
|
(2
|
)
|
(18
|
)
|
||||||||||||
|
$
|
208
|
|
$
|
(22
|
)
|
$
|
289
|
|
$
|
(80
|
)
|
$
|
187
|
|
$
|
2
|
|
|||||||
|
Total income tax expense
|
$
|
186
|
|
$
|
209
|
|
$
|
189
|
|
|||||||||||||||
United States Government Tax Incentives
On December 18, 2015, the Protecting Americans from Tax Hikes Act of 2015 (the "Act") was signed into law. The Act makes permanent certain provisions including the Research and Development Credit. The Act extends through 2019 certain provisions including Bonus Depreciation and exempts certain types of income payments between related controlled foreign corporations.
57
NOTES TO THE CONSOLIDATED FINANCIAL STATEMENTS - (CONTINUED)
United States Tax on Foreign Dividends
We have historically reinvested all unremitted earnings of our foreign subsidiaries and affiliates. We plan to distribute approximately
$5 million
of foreign earnings over the next several years. This distribution is forecasted to result in tax benefits which have not been recorded because of their contingent nature. There has been no deferred tax liability provided on the remaining amount of unremitted earnings of
$4.6 billion
at December 31,
2016
. The Company had cash and cash equivalents of approximately
$1.1 billion
at
December 31, 2016
, of which approximately
$1.0 billion
was held by subsidiaries in foreign countries. Our intent is to permanently reinvest these funds outside of the United States and our current plans do not demonstrate a need to repatriate these funds to fund our U.S. operations. However, if these funds were repatriated, then we would be required to accrue and pay applicable United States taxes (subject to an adjustment for foreign tax credits) and withholding taxes payable to various countries. The repatriation could result in an adjustment to the tax liability after considering available foreign tax credits and other tax attributes. It is not practicable to estimate the amount of the deferred tax liability associated with these unremitted earnings due to the complexity of its hypothetical calculation.
Valuation Allowances
At December 31,
2016
, we had net operating loss carryforwards of
$3.5 billion
,
$1.0 billion
of which were United States State net operating loss carryforwards. Of the total net operating loss carryforwards,
$2.2 billion
do not expire, with substantially all of the remaining carryforwards expiring in various years through 2036. As of December 31,
2016
, we had
$310 million
of foreign tax credit carryforwards and
$964 million
of United States general business credit carryforwards available to offset future payments of federal income taxes, expiring between 2017 and 2036.
We routinely review the future realization of deferred tax assets based on projected future reversal of taxable temporary differences, available tax planning strategies and projected future taxable income. We have recorded a valuation allowance to reflect the net estimated amount of certain deferred tax assets associated with net operating loss and other deferred tax assets we believe will be realized. Our recorded valuation allowance of
$150 million
at December 31,
2016
consists of
$128 million
of net operating loss carryforward deferred tax assets and
$22 million
of other deferred tax assets. Our recorded valuation allowance was
$286 million
at December 31, 2015 and consisted of
$239 million
of net operating loss carryforward deferred tax assets and
$47 million
of other deferred tax assets. The reduction in our valuation allowance includes
$121 million
recognized in net earnings which consist of
$163 million
of valuation allowance releases and
$42 million
of additional valuation allowances. The remaining change relates to reclassification within our net deferred tax asset. We believe that it is more likely than not that we will realize the benefit of existing deferred tax assets, net of valuation allowances mentioned above.
Settlement of Global Tax Audits
We are in various stages of audits by certain governmental tax authorities. We establish liabilities for the difference between tax return provisions and the benefits recognized in our financial statements. Such amounts represent a reasonable provision for taxes ultimately expected to be paid, and may need to be adjusted over time as more information becomes known. We are no longer subject to any significant United States federal tax examinations for the years before 2008, or any state, local or foreign income tax examinations by tax authorities for years before 2004.
58
NOTES TO THE CONSOLIDATED FINANCIAL STATEMENTS - (CONTINUED)
Deferred Tax Liabilities and Assets
Deferred income taxes reflect the net tax effects of temporary differences between the carrying amounts of assets and liabilities used for financial reporting purposes and the amounts used for income tax purposes. The following table summarizes the significant components of our deferred tax liabilities and assets at December 31,
2016
and
2015
:
|
Millions of dollars
|
2016
|
2015
|
||||||
|
Deferred tax liabilities
|
||||||||
|
Intangibles
|
$
|
765
|
|
$
|
770
|
|
||
|
Property, net
|
199
|
|
175
|
|
||||
|
LIFO inventory
|
59
|
|
57
|
|
||||
|
Other
|
156
|
|
214
|
|
||||
|
Total deferred tax liabilities
|
1,179
|
|
1,216
|
|
||||
|
Deferred tax assets
|
||||||||
|
U.S. general business credit carryforwards, including Energy Tax Credits
|
964
|
|
1,010
|
|
||||
|
Pensions
|
322
|
|
315
|
|
||||
|
Loss carryforwards
|
668
|
|
683
|
|
||||
|
Postretirement obligations
|
144
|
|
168
|
|
||||
|
Foreign tax credit carryforwards
|
310
|
|
253
|
|
||||
|
Research and development capitalization
|
273
|
|
306
|
|
||||
|
Employee payroll and benefits
|
111
|
|
164
|
|
||||
|
Accrued expenses
|
106
|
|
133
|
|
||||
|
Product warranty accrual
|
64
|
|
64
|
|
||||
|
Receivable and inventory allowances
|
59
|
|
106
|
|
||||
|
Other
|
344
|
|
353
|
|
||||
|
Total deferred tax assets
|
3,365
|
|
3,555
|
|
||||
|
Valuation allowances for deferred tax assets
|
(150
|
)
|
(286
|
)
|
||||
|
Deferred tax assets, net of valuation allowances
|
3,215
|
|
3,269
|
|
||||
|
Net deferred tax assets
|
$
|
2,036
|
|
$
|
2,053
|
|
||
Unrecognized Tax Benefits
The following table represents a reconciliation of the beginning and ending amount of unrecognized tax benefits that if recognized would impact the effective tax rate, excluding federal benefits of state and local tax positions, and interest and penalties:
|
Millions of dollars
|
2016
|
2015
|
2014
|
|||||||||
|
Balance, January 1
|
$
|
143
|
|
$
|
141
|
|
$
|
113
|
|
|||
|
Additions for tax positions of the current year
|
14
|
|
12
|
|
17
|
|
||||||
|
Additions for tax positions of prior years
|
1
|
|
27
|
|
4
|
|
||||||
|
Reductions for tax positions of prior years
|
(33
|
)
|
(25
|
)
|
(23
|
)
|
||||||
|
Settlements during the period
|
(20
|
)
|
(5
|
)
|
(11
|
)
|
||||||
|
Positions assumed in acquisitions
|
—
|
|
—
|
|
42
|
|
||||||
|
Lapses of applicable statute of limitation
|
(3
|
)
|
(7
|
)
|
(1
|
)
|
||||||
|
Balance, December 31
|
$
|
102
|
|
$
|
143
|
|
$
|
141
|
|
|||
In connection with our acquisitions of
Hefei Sanyo
and
Indesit
in 2014, the Company assumed
$72 million
of uncertain tax position liabilities, including
$31 million
of interest and penalties. The acquisition of
Hefei Sanyo
resulted in an assumed uncertain tax position of
$62 million
that was reflected in the opening balance sheet, while the acquisition of
Indesit
resulted in an assumed uncertain tax position of
$10 million
.
Interest and penalties associated with unrecognized tax benefits resulted in a net benefit of
$19 million
as of December 31,
2016
, a net expense of
$5 million
in
2015
, and a net benefit of
$6 million
in
2014
. We have accrued a total of
$42 million
at December 31,
2016
and
$63 million
at December 31,
2015
and
2014
, respectively.
It is reasonably possible that certain unrecognized tax benefits of
$21 million
could be settled with various related jurisdictions during the next 12 months.
59
NOTES TO THE CONSOLIDATED FINANCIAL STATEMENTS - (CONTINUED)
(
12
)
PENSION AND OTHER POSTRETIREMENT BENEFIT PLANS
We have funded and unfunded defined benefit pension plans that cover certain employees in North America, Europe, Asia and Brazil. For the United States plan, which comprises the majority of our obligation, the plans are frozen for the majority of participants. The formula for United States salaried employees covered under the qualified defined benefit plan was based on years of service and final average salary, while the formula for United States hourly employees covered under the defined benefit plans was based on specific dollar amounts for each year of service. There were multiple formulas for employees covered under the qualified and nonqualified defined benefit plans sponsored by Maytag, including a cash balance formula. In addition, we sponsor an unfunded Supplemental Executive Retirement Plan. This plan is nonqualified and provides certain key employees defined pension benefits that supplement those provided by the Company’s other retirement plans.
A defined contribution plan is being provided to all United States employees subsequent to the pension plan freezes and is not classified within the net periodic benefit cost. The company provides annual match and automatic company contributions, in cash or company stock, of up to
7%
of employees’ eligible pay. Our contributions during
2016
,
2015
and
2014
were
$77 million
,
$76 million
and
$71 million
, respectively.
We provide postretirement health care benefits for eligible retired employees in the United States, Canada and Brazil. For our United States plan, which comprises the majority of our obligation, eligible retirees include those who were full-time employees with
10
years of service who attained age
55
while in service with us and those union retirees who met the eligibility requirements of their collective bargaining agreements. In general, the postretirement health and welfare benefit plans include cost-sharing provisions that limit our exposure for recent and future retirees and are contributory, with participants’ contributions adjusted annually. The plans are unfunded. We reserve the right to modify these benefits in the future.
During the second quarter 2011, we modified retiree medical benefits for certain retirees to be consistent with those benefits provided by the Whirlpool Corporation Group Benefit Plan. We accounted for these changes as a plan amendment in 2011, resulting in a reduction in the postretirement benefit obligation of
$138 million
of which approximately
$104 million
of benefit has been recognized in net earnings since 2011, with an offset to accumulated other comprehensive loss, net of tax. In response, a group of retirees initiated legal proceedings against Whirlpool asserting the above benefits are vested and changes to the plan are not permitted. We disagree with plaintiffs' assertion and are continuing to vigorously defend our position, including through any necessary appeal process. However, an unfavorable ruling in any particular reporting period could require us to immediately reverse the benefit we have recognized to that point, and remeasure the associated postretirement benefit obligation, the impact of which will depend on timing and the actuarial assumptions then in effect.
Defined Benefit - Pensions and Postretirement Benefit Plans
Obligations and Funded Status at End of Year
|
|
United States
Pension Benefits
|
Foreign
Pension Benefits
|
Other Postretirement
Benefits
|
|||||||||||||||||||||
|
Millions of dollars
|
2016
|
2015
|
2016
|
2015
|
2016
|
2015
|
||||||||||||||||||
|
Funded status
|
||||||||||||||||||||||||
|
Fair value of plan assets
|
$
|
2,664
|
|
$
|
2,741
|
|
$
|
510
|
|
$
|
552
|
|
$
|
—
|
|
$
|
—
|
|
||||||
|
Benefit obligations
|
3,415
|
|
3,470
|
|
855
|
|
865
|
|
376
|
|
441
|
|
||||||||||||
|
Funded status
|
$
|
(751
|
)
|
$
|
(729
|
)
|
$
|
(345
|
)
|
$
|
(313
|
)
|
$
|
(376
|
)
|
$
|
(441
|
)
|
||||||
|
Amounts recognized in the consolidated balance sheet
|
|
|||||||||||||||||||||||
|
Noncurrent asset
|
$
|
—
|
|
$
|
—
|
|
$
|
2
|
|
$
|
5
|
|
$
|
—
|
|
$
|
—
|
|
||||||
|
Current liability
|
(14
|
)
|
(10
|
)
|
(10
|
)
|
(12
|
)
|
(42
|
)
|
(51
|
)
|
||||||||||||
|
Noncurrent liability
|
(737
|
)
|
(719
|
)
|
(337
|
)
|
(306
|
)
|
(334
|
)
|
(390
|
)
|
||||||||||||
|
Amount recognized
|
$
|
(751
|
)
|
$
|
(729
|
)
|
$
|
(345
|
)
|
$
|
(313
|
)
|
$
|
(376
|
)
|
$
|
(441
|
)
|
||||||
|
Amounts recognized in accumulated other comprehensive loss (pre-tax)
|
||||||||||||||||||||||||
|
Net actuarial loss
|
$
|
1,426
|
|
$
|
1,404
|
|
$
|
176
|
|
$
|
99
|
|
$
|
3
|
|
$
|
20
|
|
||||||
|
Prior service (credit) cost
|
(7
|
)
|
(11
|
)
|
(3
|
)
|
(3
|
)
|
(40
|
)
|
(25
|
)
|
||||||||||||
|
Amount recognized
|
$
|
1,419
|
|
$
|
1,393
|
|
$
|
173
|
|
$
|
96
|
|
$
|
(37
|
)
|
$
|
(5
|
)
|
||||||
60
NOTES TO THE CONSOLIDATED FINANCIAL STATEMENTS - (CONTINUED)
Change in Benefit Obligation
|
|
United States
Pension Benefits
|
Foreign
Pension Benefits
|
Other Postretirement
Benefits
|
|||||||||||||||||||||
|
Millions of dollars
|
2016
|
2015
|
2016
|
2015
|
2016
|
2015
|
||||||||||||||||||
|
Benefit obligation, beginning of year
|
$
|
3,470
|
|
$
|
3,796
|
|
$
|
865
|
|
$
|
1,026
|
|
$
|
441
|
|
$
|
502
|
|
||||||
|
Service cost
|
3
|
|
3
|
|
5
|
|
5
|
|
7
|
|
2
|
|
||||||||||||
|
Interest cost
|
147
|
|
150
|
|
27
|
|
31
|
|
18
|
|
19
|
|
||||||||||||
|
Plan participants’ contributions
|
—
|
|
—
|
|
1
|
|
1
|
|
6
|
|
7
|
|
||||||||||||
|
Actuarial loss (gain)
|
92
|
|
(164
|
)
|
105
|
|
(11
|
)
|
(16
|
)
|
(32
|
)
|
||||||||||||
|
Benefits paid
|
(286
|
)
|
(315
|
)
|
(31
|
)
|
(31
|
)
|
(54
|
)
|
(55
|
)
|
||||||||||||
|
Plan amendments
|
—
|
|
—
|
|
—
|
|
(3
|
)
|
(30
|
)
|
8
|
|
||||||||||||
|
Settlements / curtailment (gain)
|
(11
|
)
|
—
|
|
(16
|
)
|
(66
|
)
|
—
|
|
—
|
|
||||||||||||
|
Foreign currency exchange rates
|
—
|
|
—
|
|
(101
|
)
|
(87
|
)
|
4
|
|
(10
|
)
|
||||||||||||
|
Benefit obligation, end of year
|
$
|
3,415
|
|
$
|
3,470
|
|
$
|
855
|
|
$
|
865
|
|
$
|
376
|
|
$
|
441
|
|
||||||
|
Accumulated benefit obligation, end of year
|
$
|
3,406
|
|
$
|
3,459
|
|
$
|
816
|
|
$
|
806
|
|
N/A
|
|
N/A
|
|
||||||||
Change in Plan Assets
|
|
United States Pension Benefits
|
Foreign
Pension Benefits
|
Other Postretirement
Benefits
|
|||||||||||||||||||||
|
Millions of dollars
|
2016
|
2015
|
2016
|
2015
|
2016
|
2015
|
||||||||||||||||||
|
Fair value of plan assets, beginning of year
|
$
|
2,741
|
|
$
|
3,042
|
|
$
|
552
|
|
$
|
640
|
|
$
|
—
|
|
$
|
—
|
|
||||||
|
Actual return on plan assets
|
206
|
|
(62
|
)
|
47
|
|
16
|
|
—
|
|
—
|
|
||||||||||||
|
Employer contribution
|
14
|
|
76
|
|
30
|
|
39
|
|
48
|
|
48
|
|
||||||||||||
|
Plan participants’ contributions
|
—
|
|
—
|
|
1
|
|
1
|
|
6
|
|
7
|
|
||||||||||||
|
Benefits paid
|
(286
|
)
|
(315
|
)
|
(31
|
)
|
(31
|
)
|
(54
|
)
|
(55
|
)
|
||||||||||||
|
Other Adjustments
|
—
|
|
—
|
|
—
|
|
4
|
|
—
|
|
—
|
|
||||||||||||
|
Settlements
|
(11
|
)
|
—
|
|
(14
|
)
|
(73
|
)
|
—
|
|
—
|
|
||||||||||||
|
Foreign currency exchange rates
|
—
|
|
—
|
|
(75
|
)
|
(44
|
)
|
—
|
|
—
|
|
||||||||||||
|
Fair value of plan assets, end of year
|
$
|
2,664
|
|
$
|
2,741
|
|
$
|
510
|
|
$
|
552
|
|
$
|
—
|
|
$
|
—
|
|
||||||
Components of Net Periodic Benefit Cost
|
|
United States
Pension Benefits
|
Foreign
Pension Benefits
|
Other Postretirement
Benefits
|
|||||||||||||||||||||||||||||||||
|
Millions of dollars
|
2016
|
2015
|
2014
|
2016
|
2015
|
2014
|
2016
|
2015
|
2014
|
|||||||||||||||||||||||||||
|
Service cost
|
$
|
3
|
|
$
|
3
|
|
$
|
2
|
|
$
|
5
|
|
$
|
5
|
|
$
|
5
|
|
$
|
7
|
|
$
|
2
|
|
$
|
3
|
|
|||||||||
|
Interest cost
|
147
|
|
150
|
|
167
|
|
27
|
|
31
|
|
22
|
|
18
|
|
19
|
|
24
|
|
||||||||||||||||||
|
Expected return on plan assets
|
(186
|
)
|
(191
|
)
|
(193
|
)
|
(30
|
)
|
(33
|
)
|
(16
|
)
|
—
|
|
—
|
|
—
|
|
||||||||||||||||||
|
Amortization:
|
|
|
|
|
|
|
||||||||||||||||||||||||||||||
|
Actuarial loss
|
46
|
|
53
|
|
43
|
|
4
|
|
5
|
|
5
|
|
—
|
|
—
|
|
—
|
|
||||||||||||||||||
|
Prior service cost (credit)
|
(3
|
)
|
(3
|
)
|
(3
|
)
|
—
|
|
—
|
|
1
|
|
(15
|
)
|
(23
|
)
|
(36
|
)
|
||||||||||||||||||
|
Curtailment gain
|
4
|
|
—
|
|
—
|
|
(1
|
)
|
—
|
|
—
|
|
—
|
|
(63
|
)
|
—
|
|
||||||||||||||||||
|
Settlement loss
|
—
|
|
—
|
|
—
|
|
3
|
|
12
|
|
4
|
|
—
|
|
—
|
|
—
|
|
||||||||||||||||||
|
Net periodic benefit cost
|
$
|
11
|
|
$
|
12
|
|
$
|
16
|
|
$
|
8
|
|
$
|
20
|
|
$
|
21
|
|
$
|
10
|
|
$
|
(65
|
)
|
$
|
(9
|
)
|
|||||||||
During the first quarter of 2015, we recognized approximately
$47 million
from a curtailment gain due to the elimination of amounts credited to notional retiree health accounts for certain employees under age 50. The curtailment gain was recognized in our Consolidated Condensed Statement of Comprehensive Income with
$43 million
recorded in cost of products sold and the remaining balance in selling, general and administrative, with an offset to accumulated other comprehensive loss, net of tax.
During the third quarter of 2015, we recognized approximately
$16 million
from a curtailment gain due to the elimination of retiree medical eligibility for certain employees under age 50. The curtailment gain was recognized in our Consolidated Condensed Statement of Comprehensive Income with
$15 million
recorded in cost of products sold and the remaining balance in selling, general and administrative, with an offset to accumulated other comprehensive loss, net of tax.
61
NOTES TO THE CONSOLIDATED FINANCIAL STATEMENTS - (CONTINUED)
Other Changes in Plan Assets and Benefit Obligations Recognized in Other Comprehensive Loss (Pre-Tax) in
2016
|
Millions of dollars
|
United States
Pension Benefits
|
Foreign
Pension Benefits
|
Other Postretirement
Benefits
|
|||||||||
|
Current year actuarial loss
|
$
|
73
|
|
$
|
83
|
|
$
|
(17
|
)
|
|||
|
Actuarial (loss) recognized during the year
|
(51
|
)
|
(6
|
)
|
—
|
|
||||||
|
Current year prior service cost (credit)
|
—
|
|
—
|
|
(30
|
)
|
||||||
|
Prior service credit (cost) recognized during the year
|
3
|
|
—
|
|
15
|
|
||||||
|
Total recognized in other comprehensive loss (pre-tax)
|
$
|
25
|
|
$
|
77
|
|
$
|
(32
|
)
|
|||
|
Total recognized in net periodic benefit costs and other comprehensive loss (pre-tax)
|
$
|
36
|
|
$
|
85
|
|
$
|
(22
|
)
|
|||
Estimated Pre-Tax Amounts that will be amortized from Accumulated Other Comprehensive Loss into Net Periodic Pension Cost in
2017
|
Millions of dollars
|
United States
Pension Benefits
|
Foreign
Pension Benefits
|
Other Postretirement
Benefits
|
|||||||||
|
Actuarial loss
|
$
|
50
|
|
$
|
7
|
|
$
|
—
|
|
|||
|
Prior service (credit)
|
(3
|
)
|
—
|
|
(15
|
)
|
||||||
|
Total
|
$
|
47
|
|
$
|
7
|
|
$
|
(15
|
)
|
|||
Additionally, we amortize prior service credits over a period of up to
28
years.
Assumptions
Weighted-Average Assumptions used to Determine Benefit Obligation at End of Year
|
|
United States
Pension Benefits
|
Foreign
Pension Benefits
|
Other Postretirement
Benefits
|
|||||||||||||||
|
|
2016
|
2015
|
2016
|
2015
|
2016
|
2015
|
||||||||||||
|
Discount rate
|
4.15
|
%
|
4.45
|
%
|
2.64
|
%
|
3.40
|
%
|
4.42
|
%
|
4.51
|
%
|
||||||
|
Rate of compensation increase
|
4.50
|
%
|
4.50
|
%
|
3.08
|
%
|
3.06
|
%
|
N/A
|
|
N/A
|
|
||||||
Weighted-Average Assumptions used to Determine Net Periodic Cost
|
|
United States
Pension Benefits
|
Foreign
Pension Benefits
|
Other Postretirement
Benefits
|
||||||||||||||||||||||||
|
|
2016
|
2015
|
2014
|
2016
|
2015
|
2014
|
2016
|
2015
|
2014
|
||||||||||||||||||
|
Discount rate
|
4.45
|
%
|
4.05
|
%
|
4.95
|
%
|
3.40
|
%
|
3.32
|
%
|
3.89
|
%
|
4.88
|
%
|
4.74
|
%
|
5.25
|
%
|
|||||||||
|
Expected long-term rate of return on plan assets
|
7.00
|
%
|
7.00
|
%
|
7.25
|
%
|
5.81
|
%
|
5.63
|
%
|
5.44
|
%
|
N/A
|
|
N/A
|
|
N/A
|
|
|||||||||
|
Rate of compensation increase
|
4.50
|
%
|
4.50
|
%
|
4.50
|
%
|
3.06
|
%
|
3.23
|
%
|
3.35
|
%
|
N/A
|
|
N/A
|
|
N/A
|
|
|||||||||
|
Health care cost trend rate
|
|||||||||||||||||||||||||||
|
Initial rate
|
N/A
|
|
N/A
|
|
N/A
|
|
N/A
|
|
N/A
|
|
N/A
|
|
7.00
|
%
|
7.00
|
%
|
7.00
|
%
|
|||||||||
|
Ultimate rate
|
N/A
|
|
N/A
|
|
N/A
|
|
N/A
|
|
N/A
|
|
N/A
|
|
5.00
|
%
|
5.00
|
%
|
5.00
|
%
|
|||||||||
|
Year that ultimate rate will be reached
|
N/A
|
|
N/A
|
|
N/A
|
|
N/A
|
|
N/A
|
|
N/A
|
|
2019
|
|
2019
|
|
2017
|
|
|||||||||
Discount Rate
For our United States pension and postretirement benefit plans, the discount rate was selected using a hypothetical portfolio of high quality bonds outstanding at December 31 that would provide the necessary cash flows to match our projected benefit payments. For our foreign pension and postretirement benefit plans, the discount rate was primarily selected using high quality bond yields for the respective country or region covered by the plan.
62
NOTES TO THE CONSOLIDATED FINANCIAL STATEMENTS - (CONTINUED)
Expected Return on Plan Assets
In the United States, the expected rate of return on plan assets was determined by using the historical asset returns for publicly traded equity and fixed income securities tracked since 1926 and the historical returns for private equity. The historical equity returns were adjusted downward to reflect future expectations. The expected returns are weighted by the targeted asset allocations. The resulting weighted-average return was rounded to the nearest quarter of one percent and applied to the fair value of plan assets as of
December 31, 2016
.
For foreign pension plans, the expected rate of return on plan assets was primarily determined by observing historical returns in the local fixed income and equity markets and computing the weighted average returns with the weights being the asset allocation of each plan.
Estimated Impact of One Percentage-Point Change in Assumed Health Care Cost Trend Rate
A one percentage point change in assumed health care cost trend rates would have the following effects on our health care plan:
|
Millions of dollars
|
One Percentage
Point Increase
|
One Percentage
Point Decrease
|
||||||
|
Effect on total of service and interest cost
|
$
|
—
|
|
$
|
—
|
|
||
|
Effect on postretirement benefit obligations
|
3
|
|
(2
|
)
|
||||
Cash Flows
Funding Policy
Our funding policy is to contribute to our United States pension plans amounts sufficient to meet the minimum funding requirement as defined by employee benefit and tax laws, plus additional amounts which we may determine to be appropriate. In certain countries other than the United States, the funding of pension plans is not common practice. Contributions to our United States pension plans may be made in the form of cash or company stock. We pay for retiree medical benefits as they are incurred.
Expected Employer Contributions to Funded Plans
|
Millions of dollars
|
United States
Pension Benefits
(1)
|
Foreign
Pension Benefits
|
||||||
|
2017
|
$
|
42
|
|
$
|
15
|
|
||
Expected Benefit Payments
|
Millions of dollars
|
United States
Pension Benefits
|
Foreign
Pension Benefits
|
Other Postretirement Benefits
|
|||||||||
|
2017
|
$
|
295
|
|
$
|
33
|
|
$
|
42
|
|
|||
|
2018
|
272
|
|
32
|
|
34
|
|
||||||
|
2019
|
269
|
|
36
|
|
34
|
|
||||||
|
2020
|
259
|
|
36
|
|
33
|
|
||||||
|
2021
|
255
|
|
35
|
|
32
|
|
||||||
|
2022-2026
|
1,162
|
|
189
|
|
132
|
|
||||||
Plan Assets
Our overall investment strategy is to achieve an appropriate mix of investments for long-term growth and for near-term benefit payments with a wide diversification of asset types, fund strategies, and investment fund managers. The target allocation for plan assets is generally
40%
equity and
60%
fixed income, with exceptions for foreign pension plans. For our U.S. plan, the target allocation for equity securities is approximately
50%
allocated to United States large-cap,
25%
to international equity,
13%
to United States mid and small-cap companies and
12%
in venture capital. The target allocation for fixed income is allocated with
75%
to corporate bonds and
25%
to United States treasury and other government securities. The fixed income securities duration is intended to match that of our United States pension liabilities.
63
NOTES TO THE CONSOLIDATED FINANCIAL STATEMENTS - (CONTINUED)
Plan assets are reported at fair value based on an exit price, representing the amount that would be received to sell an asset in an orderly transaction between market participants. As such, fair value is a market-based measurement that should be determined based on assumptions that market participants would use in pricing an asset. As a basis for considering such assumptions, a three-tiered fair value hierarchy is established, which prioritizes the inputs used in measuring fair value as follows: (Level 1) observable inputs such as quoted prices in active markets; (Level 2) inputs, other than the quoted prices in active markets that are observable, either directly or indirectly; and (Level 3) unobservable inputs in which there is little or no market data, which require the reporting entity to develop its own assumptions. We manage the process and approve the results of a third party pricing service to value the majority of our securities and to determine the appropriate level in the fair value hierarchy.
The fair values of our pension plan assets at
December 31, 2016
and
2015
, by asset category were as follows:
|
December 31,
|
||||||||||||||||||||||||||||||||||||||||
|
Quoted prices
(Level 1)
|
Other significant
observable inputs
(Level 2)
|
Significant
unobservable inputs
(Level 3)
|
Net Asset Value
|
Total
|
||||||||||||||||||||||||||||||||||||
|
Millions of dollars
|
2016
|
2015
|
2016
|
2015
|
2016
|
2015
|
2016
|
2015
|
2016
|
2015
|
||||||||||||||||||||||||||||||
|
Cash and cash equivalents
|
$
|
47
|
|
$
|
26
|
|
$
|
—
|
|
$
|
—
|
|
$
|
—
|
|
$
|
—
|
|
$
|
—
|
|
$
|
—
|
|
$
|
47
|
|
$
|
26
|
|
||||||||||
|
Government and government agency securities
(a)
|
||||||||||||||||||||||||||||||||||||||||
|
U.S. securities
|
—
|
|
—
|
|
455
|
|
494
|
|
—
|
|
—
|
|
—
|
|
—
|
|
455
|
|
494
|
|
||||||||||||||||||||
|
International securities
|
—
|
|
—
|
|
163
|
|
212
|
|
—
|
|
—
|
|
—
|
|
—
|
|
163
|
|
212
|
|
||||||||||||||||||||
|
Corporate bonds and notes
(a)
|
||||||||||||||||||||||||||||||||||||||||
|
U.S. companies
|
—
|
|
—
|
|
892
|
|
909
|
|
—
|
|
—
|
|
—
|
|
—
|
|
892
|
|
909
|
|
||||||||||||||||||||
|
International companies
|
—
|
|
—
|
|
190
|
|
160
|
|
—
|
|
—
|
|
—
|
|
—
|
|
190
|
|
160
|
|
||||||||||||||||||||
|
Equity securities
(b)
|
||||||||||||||||||||||||||||||||||||||||
|
U.S. companies
|
14
|
|
13
|
|
—
|
|
—
|
|
—
|
|
—
|
|
—
|
|
—
|
|
14
|
|
13
|
|
||||||||||||||||||||
|
International companies
|
454
|
|
472
|
|
—
|
|
—
|
|
—
|
|
—
|
|
—
|
|
—
|
|
454
|
|
472
|
|
||||||||||||||||||||
|
Mutual funds
(c)
|
64
|
|
59
|
|
—
|
|
—
|
|
—
|
|
—
|
|
—
|
|
—
|
|
64
|
|
59
|
|
||||||||||||||||||||
|
Common and collective funds
(d)
|
||||||||||||||||||||||||||||||||||||||||
|
U.S. equity securities
|
—
|
|
—
|
|
—
|
|
—
|
|
—
|
|
—
|
|
650
|
|
648
|
|
650
|
|
648
|
|
||||||||||||||||||||
|
International equity securities
|
—
|
|
—
|
|
—
|
|
—
|
|
—
|
|
—
|
|
56
|
|
65
|
|
56
|
|
65
|
|
||||||||||||||||||||
|
Short-term investment fund
|
—
|
|
—
|
|
—
|
|
—
|
|
—
|
|
—
|
|
30
|
|
55
|
|
30
|
|
55
|
|
||||||||||||||||||||
|
Limited partnerships
(e)
|
||||||||||||||||||||||||||||||||||||||||
|
U.S. private equity investments
|
—
|
|
—
|
|
—
|
|
—
|
|
104
|
|
120
|
|
—
|
|
—
|
|
104
|
|
120
|
|
||||||||||||||||||||
|
Diversified fund of funds
|
—
|
|
—
|
|
—
|
|
—
|
|
14
|
|
21
|
|
—
|
|
—
|
|
14
|
|
21
|
|
||||||||||||||||||||
|
Emerging growth
|
—
|
|
—
|
|
—
|
|
—
|
|
14
|
|
15
|
|
—
|
|
—
|
|
14
|
|
15
|
|
||||||||||||||||||||
|
Real estate
(f)
|
—
|
|
—
|
|
—
|
|
—
|
|
—
|
|
—
|
|
10
|
|
10
|
|
10
|
|
10
|
|
||||||||||||||||||||
|
All other investments
|
—
|
|
—
|
|
17
|
|
14
|
|
—
|
|
—
|
|
—
|
|
—
|
|
17
|
|
14
|
|
||||||||||||||||||||
|
$
|
579
|
|
$
|
570
|
|
$
|
1,717
|
|
$
|
1,789
|
|
$
|
132
|
|
$
|
156
|
|
$
|
746
|
|
$
|
778
|
|
$
|
3,174
|
|
$
|
3,293
|
|
|||||||||||
|
(a)
|
Valued using pricing vendors who use proprietary models to estimate the price a dealer would pay to buy a security using significant observable inputs, such as interest rates, yield curves, and credit risk.
|
|
(b)
|
Valued using the closing stock price on a national securities exchange, which reflects the last reported sales price on the last business day of the year.
|
|
(c)
|
Valued using the net asset value (NAV) of the fund, which is based on the fair value of underlying securities. The fund primarily invests in a diversified portfolio of equity securities issued by non-U.S. companies.
|
|
(d)
|
Valued using the NAV of the fund, which is based on the fair value of underlying securities.
|
|
(e)
|
Valued at estimated fair value based on the proportionate share of the limited partnership's fair value, as determined by the general partner.
|
|
(f)
|
Valued using the NAV of the fund, which is based on the fair value of underlying assets.
|
64
NOTES TO THE CONSOLIDATED FINANCIAL STATEMENTS - (CONTINUED)
Fair Value Measurements Using Significant Unobservable Inputs (Level 3)
|
Millions of dollars
|
Limited
Partnerships
|
|||
|
Balance, December 31, 2015
|
$
|
156
|
|
|
|
Realized gains (net)
|
16
|
|
||
|
Unrealized gains (net)
|
(9
|
)
|
||
|
Purchases
|
2
|
|
||
|
Settlements
|
(33
|
)
|
||
|
Balance, December 31, 2016
|
$
|
132
|
|
|
Additional Information
The projected benefit obligation and fair value of plan assets for pension plans with a projected benefit obligation in excess of plan assets at
December 31, 2016
and
2015
were as follows:
|
|
United States
Pension Benefits
|
Foreign
Pension Benefits
|
||||||||||||||
|
Millions of dollars
|
2016
|
2015
|
2016
|
2015
|
||||||||||||
|
Projected benefit obligation
|
$
|
3,415
|
|
$
|
3,470
|
|
$
|
759
|
|
$
|
776
|
|
||||
|
Fair value of plan assets
|
2,664
|
|
2,741
|
|
421
|
|
469
|
|
||||||||
The projected benefit obligation, accumulated benefit obligation and fair value of plan assets for pension plans with an accumulated benefit obligation in excess of plan assets at
December 31, 2016
and
2015
were as follows:
|
|
United States
Pension Benefits
|
Foreign
Pension Benefits
|
||||||||||||||
|
Millions of dollars
|
2016
|
2015
|
2016
|
2015
|
||||||||||||
|
Projected benefit obligation
|
$
|
3,415
|
|
$
|
3,470
|
|
$
|
720
|
|
$
|
730
|
|
||||
|
Accumulated benefit obligation
|
3,406
|
|
3,459
|
|
699
|
|
690
|
|
||||||||
|
Fair value of plan assets
|
2,664
|
|
2,741
|
|
383
|
|
424
|
|
||||||||
(
13
)
OPERATING SEGMENT INFORMATION
Operating segments are defined as components of an enterprise about which separate financial information is available that is evaluated on a regular basis by the chief operating decision maker, or decision making group, in deciding how to allocate resources to an individual segment and in assessing performance.
We identify such segments based upon geographical regions of operations because each operating segment manufactures home appliances and related components, but serves strategically different markets. The chief operating decision maker evaluates performance based upon each segment’s operating income, which is defined as income before interest and sundry (income) expense, interest expense, income taxes, noncontrolling interests, intangible asset impairment and restructuring costs. Total assets by segment are those assets directly associated with the respective operating activities. The “Other/Eliminations” column primarily includes corporate expenses, assets and eliminations, as well as restructuring costs and intangible asset impairments, if any. Intersegment sales are eliminated within each region except compressor sales out of Latin America, which are included in Other/Eliminations.
We conduct business in three countries - the United States, Brazil, and China - which individually comprised at least 10% of consolidated net sales or long-lived assets within the country in the last three years.
The following table summarizes net sales and long-lived assets by geographic area:
65
NOTES TO THE CONSOLIDATED FINANCIAL STATEMENTS - (CONTINUED)
|
Millions of dollars
|
United States
|
Brazil
|
China
|
All Other
Countries
|
Total
|
|||||||||||||||
|
2016:
|
||||||||||||||||||||
|
Sales to external customers
|
$
|
9,901
|
|
$
|
1,895
|
|
$
|
945
|
|
$
|
7,977
|
|
$
|
20,718
|
|
|||||
|
Long-lived assets
|
4,587
|
|
336
|
|
981
|
|
3,414
|
|
9,318
|
|
||||||||||
|
2015:
|
||||||||||||||||||||
|
Sales to external customers
|
$
|
9,189
|
|
$
|
1,915
|
|
$
|
1,003
|
|
$
|
8,784
|
|
$
|
20,891
|
|
|||||
|
Long-lived assets
|
4,558
|
|
253
|
|
1,038
|
|
3,609
|
|
9,458
|
|
||||||||||
|
2014:
|
||||||||||||||||||||
|
Sales to external customers
|
$
|
9,064
|
|
$
|
3,204
|
|
$
|
437
|
|
$
|
7,167
|
|
$
|
19,872
|
|
|||||
|
Long-lived assets
|
4,529
|
|
321
|
|
1,081
|
|
3,660
|
|
9,591
|
|
||||||||||
As described above, our chief operating decision maker reviews each operating segment’s performance based upon operating income which excludes restructuring costs and intangible asset impairment, if any. Intangible asset impairment and restructuring costs are included in operating profit on a consolidated basis and included in the Other/Eliminations column in the table below:
|
|
OPERATING SEGMENTS
|
|||||||||||||||||||||||
|
Millions of dollars
|
North
America
|
EMEA
|
Latin
America
|
Asia
|
Other/
Eliminations
|
Total
Whirlpool
|
||||||||||||||||||
|
Net sales
|
||||||||||||||||||||||||
|
2016
|
11,147
|
|
5,148
|
|
|
3,191
|
|
|
1,424
|
|
|
(192
|
)
|
|
20,718
|
|
||||||||
|
2015
|
10,732
|
|
5,601
|
|
|
3,349
|
|
|
1,417
|
|
|
(208
|
)
|
|
20,891
|
|
||||||||
|
2014
|
10,634
|
|
3,905
|
|
4,686
|
|
816
|
|
(169
|
)
|
19,872
|
|
||||||||||||
|
Intersegment sales
|
||||||||||||||||||||||||
|
2016
|
$
|
162
|
|
$
|
67
|
|
|
$
|
196
|
|
|
$
|
276
|
|
|
$
|
(701
|
)
|
|
$
|
—
|
|
||
|
2015
|
218
|
|
52
|
|
|
211
|
|
|
271
|
|
|
(752
|
)
|
|
—
|
|
||||||||
|
2014
|
244
|
|
79
|
|
180
|
|
266
|
|
(769
|
)
|
—
|
|
||||||||||||
|
Depreciation and amortization
|
||||||||||||||||||||||||
|
2016
|
$
|
261
|
|
$
|
204
|
|
|
$
|
72
|
|
|
$
|
63
|
|
|
$
|
55
|
|
|
$
|
655
|
|
||
|
2015
|
259
|
|
199
|
|
|
67
|
|
|
61
|
|
|
82
|
|
|
668
|
|
||||||||
|
2014
|
263
|
|
104
|
|
86
|
|
29
|
|
78
|
|
560
|
|
||||||||||||
|
Operating profit (loss)
|
||||||||||||||||||||||||
|
2016
|
$
|
1,284
|
|
$
|
158
|
|
|
$
|
207
|
|
|
$
|
74
|
|
|
$
|
(369
|
)
|
|
$
|
1,354
|
|
||
|
2015
|
1,252
|
|
188
|
|
|
184
|
|
|
80
|
|
|
(419
|
)
|
|
1,285
|
|
||||||||
|
2014
|
1,072
|
|
59
|
|
475
|
|
(21
|
)
|
(397
|
)
|
1,188
|
|
||||||||||||
|
Total assets
|
||||||||||||||||||||||||
|
2016
|
$
|
8,009
|
|
$
|
7,497
|
|
$
|
2,601
|
|
$
|
2,788
|
|
$
|
(1,742
|
)
|
$
|
19,153
|
|
||||||
|
2015
|
7,683
|
|
7,351
|
|
2,260
|
|
2,738
|
|
(1,022
|
)
|
19,010
|
|
||||||||||||
|
2014
|
7,736
|
|
7,597
|
|
2,917
|
|
2,734
|
|
(982
|
)
|
20,002
|
|
||||||||||||
|
Capital expenditures
|
||||||||||||||||||||||||
|
2016
|
$
|
199
|
|
$
|
199
|
|
|
$
|
105
|
|
|
$
|
68
|
|
|
$
|
89
|
|
|
$
|
660
|
|
||
|
2015
|
243
|
|
220
|
|
|
106
|
|
|
47
|
|
|
73
|
|
|
689
|
|
||||||||
|
2014
|
271
|
|
187
|
|
133
|
|
29
|
|
100
|
|
720
|
|
||||||||||||
66
NOTES TO THE CONSOLIDATED FINANCIAL STATEMENTS - (CONTINUED)
(
14
)
QUARTERLY RESULTS OF OPERATIONS (UNAUDITED)
|
|
Three months ended
|
|||||||||||||||||||||||||||||||
|
Dec. 31
|
Sept. 30
|
Jun. 30
|
Mar. 31
|
|||||||||||||||||||||||||||||
|
Millions of dollars, except per share data
|
2016
|
2015
|
2016
|
2015
|
2016
|
2015
|
2016
|
2015
|
||||||||||||||||||||||||
|
Net sales
|
$
|
5,656
|
|
$
|
5,560
|
|
$
|
5,248
|
|
$
|
5,277
|
|
$
|
5,198
|
|
$
|
5,208
|
|
$
|
4,616
|
|
$
|
4,846
|
|
||||||||
|
Cost of products sold
|
4,701
|
|
4,558
|
|
4,310
|
|
4,347
|
|
4,230
|
|
4,303
|
|
3,795
|
|
3,993
|
|
||||||||||||||||
|
Operating profit
|
335
|
|
380
|
|
370
|
|
329
|
|
366
|
|
273
|
|
283
|
|
303
|
|
||||||||||||||||
|
Interest and sundry (income) expense
|
(16
|
)
|
57
|
|
26
|
|
21
|
|
39
|
|
(42
|
)
|
30
|
|
53
|
|
||||||||||||||||
|
Net earnings
|
186
|
|
189
|
|
244
|
|
250
|
|
342
|
|
185
|
|
156
|
|
198
|
|
||||||||||||||||
|
Net earnings available to Whirlpool
|
180
|
|
180
|
|
238
|
|
235
|
|
320
|
|
177
|
|
150
|
|
191
|
|
||||||||||||||||
|
Per share of common stock:
(1)
|
||||||||||||||||||||||||||||||||
|
Basic net earnings
|
$
|
2.40
|
|
$
|
2.31
|
|
$
|
3.14
|
|
$
|
2.98
|
|
$
|
4.20
|
|
$
|
2.24
|
|
$
|
1.94
|
|
$
|
2.42
|
|
||||||||
|
Diluted net earnings
|
2.36
|
|
2.28
|
|
3.10
|
|
2.95
|
|
4.15
|
|
2.21
|
|
1.92
|
|
2.38
|
|
||||||||||||||||
|
Dividends
|
1.00
|
|
0.90
|
|
1.00
|
|
0.90
|
|
1.00
|
|
0.90
|
|
0.90
|
|
0.75
|
|
||||||||||||||||
|
Market price range of common stock:
(2)
|
||||||||||||||||||||||||||||||||
|
High
|
$
|
185.24
|
|
$
|
167.72
|
|
$
|
194.10
|
|
$
|
186.82
|
|
$
|
193.59
|
|
$
|
202.50
|
|
$
|
180.59
|
|
$
|
217.11
|
|
||||||||
|
Low
|
145.91
|
|
140.50
|
|
159.55
|
|
143.75
|
|
152.19
|
|
172.85
|
|
123.60
|
|
186.14
|
|
||||||||||||||||
|
Close
|
181.77
|
|
146.87
|
|
162.16
|
|
147.26
|
|
166.64
|
|
173.05
|
|
180.34
|
|
202.06
|
|
||||||||||||||||
(1)
The quarterly earnings per share amounts will not necessarily add to the earnings per share computed for the year due to the method used in calculating per share data.
(2)
Composite price as reported by the New York Stock Exchange.
67
|
ITEM 9.
|
CHANGES IN AND DISAGREEMENTS WITH ACCOUNTANTS ON ACCOUNTING AND
|
|
FINANCIAL DISCLOSURE
|
|
None.
|
ITEM 9A.
|
CONTROLS AND PROCEDURES
|
Disclosure controls and procedures.
Whirlpool maintains disclosure controls and procedures (as defined in Rule 13a-15(e) of the Securities Exchange Act of 1934, as amended (the "Securities Exchange Act")) that are designed to provide reasonable assurance that information required to be disclosed in our filings under the Securities Exchange Act is recorded, processed, summarized, and reported within the periods specified in the rules and forms of the SEC and that such information is accumulated and communicated to Whirlpool’s management, including its Chief Executive Officer and Chief Financial Officer, as appropriate, to allow timely decisions regarding required disclosure.
Prior to filing this report, we completed an evaluation under the supervision and with the participation of Whirlpool management, including the Chief Executive Officer and Chief Financial Officer, of the effectiveness of the design and operation of our disclosure controls and procedures as of
December 31, 2016
. Based on this evaluation, the Chief Executive Officer and Chief Financial Officer concluded that our disclosure controls and procedures were effective at the reasonable assurance level as of
December 31, 2016
.
Management’s annual report on internal control over financial reporting.
Pursuant to Section 404 of the Sarbanes-Oxley Act of 2002 and the rules and regulations adopted pursuant thereto, we included a report of management’s assessment of the effectiveness of our internal control over financial reporting as part of this report. Management’s report is included on page 75 of this report under the caption entitled “Management’s Report on Internal Control Over Financial Reporting”.
Our internal control over financial reporting as of
December 31, 2016
has been audited by Ernst & Young LLP, an independent registered public accounting firm, as stated in their report, which is included on page 77 of this report under the caption entitled “Report of Independent Registered Public Accounting Firm” and is incorporated herein by reference.
There were no changes in our internal control over financial reporting during the quarter ended
December 31, 2016
that have materially affected, or are reasonably likely to materially affect, our internal control over financial reporting.
|
ITEM 9B.
|
OTHER INFORMATION
|
None.
68
|
|
||||
|
ITEM 10.
|
DIRECTORS, EXECUTIVE OFFICERS AND CORPORATE GOVERNANCE
|
Information regarding our executive officers is included in ITEM 1 of PART I of this report.
Information regarding the background of the directors, matters related to the Audit Committee, Section 16(a) compliance, and the process by which our shareholders may recommend nominees to our Board of Directors can be found under the captions “Directors and Nominees for Election as Directors,” “Board of Directors and Corporate Governance - Board of Directors and Committees,”, “Section 16(a) Beneficial Ownership Reporting Compliance”, and "Board of Directors and Corporate Governance - Director Nominations to be Considered by Stockholders" in our Proxy Statement, which is incorporated herein by reference.
We have adopted a code of ethics that applies to all of our employees, officers and directors, including our principal executive officer, principal financial officer and principal accounting officer. The text of our code of ethics is posted on our website: www.whirlpoolcorp.com (scroll to the bottom of the main page and click on “Policies,” then on “Code of Ethics.”) Whirlpool intends to disclose future amendments to, or waivers from, certain provisions of the code of ethics for executive officers and directors on the website within four business days following the date of such amendment or waiver. Stockholders may request a free copy of the code of ethics from:
Investor Relations
Whirlpool Corporation
2000 North M-63
Mail Drop 2609
Benton Harbor, MI 49022-2692
Telephone: (269) 923-2641
Whirlpool has also adopted Corporate Governance Guidelines and written charters for its Audit, Finance, Human Resources and Corporate Governance and Nominating Committees, all of which are posted on our website: www.whirlpoolcorp.com (scroll to the bottom of the main page and click on “Policies.”) Stockholders may request a free copy of the charters and guidelines from the address or telephone number set forth above.
|
ITEM 11.
|
EXECUTIVE COMPENSATION
|
Information regarding compensation of our executive officers and directors can be found under the captions “Nonemployee Director Compensation,” “Compensation Discussion and Analysis,” “Executive Compensation Tables,” and “Human Resources Committee Interlocks and Insider Participation” in the Proxy Statement, which is incorporated herein by reference. See also the information under the caption “Human Resources Committee Report” in our Proxy Statement, which is incorporated herein by reference; however, such information is only “furnished” hereunder and not deemed “soliciting material” or “filed” with the SEC or subject to Regulation 14A or 14C or to the liabilities of Section 18 of the Securities Exchange Act of 1934.
|
ITEM 12.
|
SECURITY OWNERSHIP OF CERTAIN BENEFICIAL OWNERS AND MANAGEMENT AND
|
|
RELATED STOCKHOLDER MATTERS
|
|
Information regarding the security ownership of any person that we know to beneficially own more than 5% of Whirlpool stock and by each Whirlpool director, each Whirlpool named executive officer, and all directors and executive officers as a group, can be found under the captions “Security Ownership” and “Beneficial Ownership” in the Proxy Statement, which is incorporated herein by reference. Information relating to securities authorized under equity compensation plans can be found under the caption “Equity Compensation Plan Information” in the Proxy Statement, which is incorporated herein by reference.
|
ITEM 13.
|
CERTAIN RELATIONSHIPS AND RELATED TRANSACTIONS, AND DIRECTOR
|
|
INDEPENDENCE
|
|
Information regarding certain relationships and related transactions (if any) and the independence of Whirlpool’s directors, can be found under the captions “Related Person Transactions” and “Board of Directors and Corporate Governance—Board of Directors and Committees” in the Proxy Statement, which is incorporated herein by reference.
69
|
ITEM 14.
|
PRINCIPAL ACCOUNTING FEES AND SERVICES
|
Information regarding our auditors and the Audit Committee’s pre-approval policies can be found under the caption “Matters Relating to Independent Registered Public Accounting Firm” in the Proxy Statement, which is incorporated herein by reference.
70
|
|
||||
|
ITEM 15.
|
EXHIBITS, FINANCIAL STATEMENT SCHEDULES
|
(a) The following documents are filed as a part of this report:
1. Financial statements
|
PAGE
|
|
|
Consolidated Statements of Income
|
|
|
Consolidated Statements of Comprehensive Income
|
|
|
Consolidated Balance Sheets
|
|
|
Consolidated Statements of Cash Flows
|
|
|
Consolidated Statements of Changes in Stockholders' Equity
|
|
|
Notes to the Consolidated Financial Statements
|
|
|
Report by Management on the Consolidated Financial Statements
|
|
|
Report of Independent Registered Public Accounting Firm
|
|
2. Financial Statement Schedules - “Schedule II—Valuation and Qualifying Accounts” is contained on page 78 of this report. Certain schedules for which provisions are made in the applicable accounting regulations of the Securities and Exchange Commission are not required under the related instructions or are inapplicable, and therefore have been omitted.
(b) The exhibits listed in the “Exhibit Index” are attached to this report.
(c) Individual financial statements of the registrant’s affiliated foreign companies, accounted for by the equity method, have been omitted since no such company individually constitutes a significant subsidiary.
|
ITEM 16.
|
Form 10-K Summary
|
None.
71
SIGNATURES
Pursuant to the requirements of Section 13 or 15(d) of the Securities Exchange Act of 1934, the registrant has duly caused this report to be signed on its behalf by the undersigned, thereunto duly authorized.
|
W
HIRLPOOL
C
ORPORATION
(Registrant)
|
|||
|
By:
|
|
/s/ JAMES W. PETERS
|
February 13, 2017
|
|
|
James W. Peters
Executive Vice President and Chief Financial Officer
|
||
Pursuant to the requirements of the Securities Exchange Act of 1934, this report has been signed below by the following persons on behalf of the registrant and in the capacities and on the date indicated.
|
Signature
|
|
Title
|
|
/s/ JEFF M. FETTIG
|
Director, Chairman of the Board and Chief Executive Officer
(Principal Executive Officer)
|
|
|
Jeff M. Fettig
|
|
|
|
/s/ MARC R. BITZER
|
Director, President and Chief Operating Officer
|
|
|
Marc R. Bitzer
|
|
|
|
/s/ JAMES W. PETERS
|
Executive Vice President and Chief Financial Officer
(Principal Financial Officer)
|
|
|
James W. Peters
|
|
|
|
/s/ JOSEPH A. LOVECHIO
|
Vice President and Corporate Controller
(Principal Accounting Officer)
|
|
|
Joseph A. Lovechio
|
||
|
SAMUEL R. ALLEN*
|
Director
|
|
|
Samuel R. Allen
|
|
|
|
GARY T. DICAMILLO*
|
Director
|
|
|
Gary T. DiCamillo
|
|
|
|
DIANE M. DIETZ*
|
Director
|
|
|
Diane M. Dietz
|
|
|
|
GERRI T. ELLIOTT*
|
Director
|
|
|
Gerri T. Elliott
|
||
|
MICHAEL F. JOHNSTON*
|
Director
|
|
|
Michael F. Johnston
|
|
|
|
JOHN D. LIU*
|
Director
|
|
|
John D. Liu
|
||
|
HARISH MANWANI*
|
Director
|
|
|
Harish Manwani
|
||
|
WILLIAM D. PEREZ*
|
Director
|
|
|
William D. Perez
|
|
|
|
LARRY O. SPENCER*
|
Director
|
|
|
Larry O. Spencer
|
||
|
MICHAEL D. WHITE*
|
Director
|
|
|
Michael D. White
|
|
|
72
|
*By:
|
|
/s/ KIRSTEN J. HEWITT
|
|
Attorney-in-Fact
|
|
February 13, 2017
|
|
|
Kirsten J. Hewitt
|
|
|
|||
73
REPORT BY MANAGEMENT ON THE CONSOLIDATED FINANCIAL STATEMENTS
The management of Whirlpool Corporation has prepared the accompanying financial statements. The financial statements have been audited by Ernst & Young LLP, an independent registered public accounting firm, whose report, based upon their audits, expresses the opinion that these financial statements present fairly the consolidated financial position, statements of income and cash flows of Whirlpool and its subsidiaries in accordance with accounting principles generally accepted in the United States. Their audits are conducted in conformity with the auditing standards of the Public Company Accounting Oversight Board (United States).
The financial statements were prepared from the Company’s accounting records, books and accounts which, in reasonable detail, accurately and fairly reflect all material transactions. The Company maintains a system of internal controls designed to provide reasonable assurance that the Company’s books and records, and the Company’s assets are maintained and accounted for, in accordance with management’s authorizations. The Company’s accounting records, compliance with policies and internal controls are regularly reviewed by an internal audit staff.
The audit committee of the Board of Directors of the Company is composed of four independent directors who, in the opinion of the board, meet the relevant financial experience, literacy, and expertise requirements. The audit committee provides independent and objective oversight of the Company’s accounting functions and internal controls and monitors (1) the objectivity of the Company’s financial statements, (2) the Company’s compliance with legal and regulatory requirements, (3) the independent registered public accounting firm’s qualifications and independence, and (4) the performance of the Company’s internal audit function and independent registered public accounting firm. In performing these functions, the committee has the responsibility to review and discuss the annual audited financial statements and quarterly financial statements and related reports with management and the independent registered public accounting firm, including the Company’s disclosures under “Management’s Discussion and Analysis of Financial Condition and Results of Operations,” to monitor the adequacy of financial disclosure. The committee also has the responsibility to retain and terminate the Company’s independent registered public accounting firm and exercise the committee’s sole authority to review and approve all audit engagement fees and terms and pre-approve the nature, extent, and cost of all non-audit services provided by the independent registered public accounting firm.
|
/s/ JAMES W. PETERS
|
|
James W. Peters
|
|
Executive Vice President and Chief Financial Officer
|
|
February 13, 2017
|
74
MANAGEMENT’S REPORT ON INTERNAL CONTROL OVER FINANCIAL REPORTING
The management of Whirlpool Corporation is responsible for establishing and maintaining adequate internal control over financial reporting as defined in Rules 13a – 15(f) and 15d – 15(f) under the Securities Exchange Act of 1934. Whirlpool’s internal control system is designed to provide reasonable assurance to Whirlpool’s management and board of directors regarding the reliability of financial reporting and the preparation and fair presentation of published financial statements.
All internal control systems, no matter how well designed, have inherent limitations. Therefore, even those systems determined to be effective can provide only reasonable assurance with respect to financial statement preparation and presentation.
The management of Whirlpool assessed the effectiveness of Whirlpool’s internal control over financial reporting as of
December 31, 2016
.
In making this assessment, it used the criteria set forth by the Committee of Sponsoring Organizations of the Treadway Commission (COSO) in Internal Control—Integrated Framework (2013 Framework). Based on the assessment and those criteria, management believes that Whirlpool maintained effective internal control over financial reporting as of
December 31, 2016
.
Whirlpool’s independent registered public accounting firm has issued an audit report on its assessment of Whirlpool’s internal control over financial reporting. This report appears on page
77.
|
/s/ JEFF M. FETTIG
|
|
/s/ JAMES W. PETERS
|
|
Jeff M. Fettig
|
|
James W. Peters
|
|
Chairman of the Board and
Chief Executive Officer |
|
Executive Vice President and
Chief Financial Officer |
|
February 13, 2017
|
|
February 13, 2017
|
75
REPORT OF INDEPENDENT REGISTERED PUBLIC ACCOUNTING FIRM
The Board of Directors and Stockholders of Whirlpool Corporation
We have audited the accompanying consolidated balance sheets of Whirlpool Corporation as of
December 31, 2016
and
2015
, and the related consolidated statements of income, comprehensive income, shareholders' equity and cash flows for each of the three years in the period ended
December 31, 2016
. Our audits also included the financial statement schedule listed in the index at Item 15(a). These financial statements and schedule are the responsibility of the Company's management. Our responsibility is to express an opinion on these financial statements and schedule based on our audits.
We conducted our audits in accordance with the standards of the Public Company Accounting Oversight Board (United States). Those standards require that we plan and perform the audit to obtain reasonable assurance about whether the financial statements are free of material misstatement. An audit includes examining, on a test basis, evidence supporting the amounts and disclosures in the financial statements. An audit also includes assessing the accounting principles used and significant estimates made by management, as well as evaluating the overall financial statement presentation. We believe that our audits provide a reasonable basis for our opinion.
In our opinion, the financial statements referred to above present fairly, in all material respects, the consolidated financial position of Whirlpool Corporation at
December 31, 2016
and
2015
, and the consolidated results of its operations and its cash flows for each of the three years in the period ended
December 31, 2016
, in conformity with U.S. generally accepted accounting principles.
We also have audited, in accordance with the standards of the Public Company Accounting Oversight Board (United States), Whirlpool Corporation’s internal control over financial reporting as of
December 31, 2016
, based on criteria established in Internal Control-Integrated Framework issued by the Committee of Sponsoring Organizations of the Treadway Commission 2013 framework and our report dated
February 13, 2017
expressed an unqualified opinion thereon.
/s/ Ernst & Young LLP
Chicago, Illinois
February 13, 2017
76
REPORT OF INDEPENDENT REGISTERED PUBLIC ACCOUNTING FIRM
The Board of Directors and Stockholders of Whirlpool Corporation
We have audited Whirlpool Corporation’s internal control over financial reporting as of
December 31, 2016
, based on criteria established in Internal Control-Integrated Framework issued by the Committee of Sponsoring Organizations of the Treadway Commission 2013 framework (the COSO criteria). Whirlpool Corporation’s management is responsible for maintaining effective internal control over financial reporting, and for its assessment of the effectiveness of internal control over financial reporting included in the accompanying Management’s Report on Internal Control Over Financial Reporting. Our responsibility is to express an opinion on the company’s internal control over financial reporting based on our audit.
We conducted our audit in accordance with the standards of the Public Company Accounting Oversight Board (United States). Those standards require that we plan and perform the audit to obtain reasonable assurance about whether effective internal control over financial reporting was maintained in all material respects. Our audit included obtaining an understanding of internal control over financial reporting, assessing the risk that a material weakness exists, testing and evaluating the design and operating effectiveness of internal control based on the assessed risk, and performing such other procedures as we considered necessary in the circumstances. We believe that our audit provides a reasonable basis for our opinion.
A company’s internal control over financial reporting is a process designed to provide reasonable assurance regarding the reliability of financial reporting and the preparation of financial statements for external purposes in accordance with generally accepted accounting principles. A company’s internal control over financial reporting includes those policies and procedures that (1) pertain to the maintenance of records that, in reasonable detail, accurately and fairly reflect the transactions and dispositions of the assets of the company; (2) provide reasonable assurance that transactions are recorded as necessary to permit preparation of financial statements in accordance with generally accepted accounting principles, and that receipts and expenditures of the company are being made only in accordance with authorizations of management and directors of the company; and (3) provide reasonable assurance regarding prevention or timely detection of unauthorized acquisition, use, or disposition of the company’s assets that could have a material effect on the financial statements.
Because of its inherent limitations, internal control over financial reporting may not prevent or detect misstatements. Also, projections of any evaluation of effectiveness to future periods are subject to the risk that controls may become inadequate because of changes in conditions, or that the degree of compliance with the policies or procedures may deteriorate.
In our opinion, Whirlpool Corporation maintained, in all material respects, effective internal control over financial reporting as of
December 31, 2016
, based on the COSO criteria.
We also have audited, in accordance with the standards of the Public Company Accounting Oversight Board (United States), the consolidated balance sheets of Whirlpool Corporation as of
December 31, 2016
and
2015
, and the related consolidated statements of income, comprehensive income, shareholders’ equity and cash flows for each of the three years in the period ended
December 31, 2016
and our report dated
February 13, 2017
expressed an unqualified opinion thereon.
/s/ Ernst & Young LLP
Chicago, Illinois
February 13, 2017
77
SCHEDULE II—VALUATION AND QUALIFYING ACCOUNTS
WHIRLPOOL CORPORATION AND SUBSIDIARIES
Years Ended
December 31, 2016
,
2015
and
2014
(Millions of dollars)
|
COL. A
|
COL. B
|
COL. C
|
COL. D
|
COL. E
|
||||||||||||
|
|
|
ADDITIONS
|
|
|
||||||||||||
|
Description
|
Balance at Beginning
of Period |
(1)
Charged to Costs
and Expenses
|
(2)
Acquisition Impact |
(3)
Charged to Other Accounts / Other |
Deductions
—Describe (A)
|
Balance at End
of Period |
||||||||||
|
Year Ended December 31, 2016:
|
||||||||||||||||
|
Allowance for doubtful accounts— accounts receivable
|
160
|
|
57
|
|
—
|
|
—
|
|
(32
|
)
|
185
|
|
||||
|
Year Ended December 31, 2015:
|
||||||||||||||||
|
Allowance for doubtful accounts— accounts receivable
|
154
|
|
5
|
|
24
|
|
—
|
|
(23
|
)
|
160
|
|
||||
|
Year Ended December 31, 2014:
|
||||||||||||||||
|
Allowance for doubtful accounts— accounts receivable
|
73
|
|
76
|
|
45
|
|
—
|
|
(40
|
)
|
154
|
|
||||
Note A—The amounts represent accounts charged off, net of translation adjustments and transfers. Recoveries were nominal for
2016
,
2015
and
2014
.
78
[THIS PAGE INTENTIONALLY LEFT BLANK]
ANNUAL REPORT ON FORM 10-K
ITEMS 15(a)(3) and 15(c)
EXHIBIT INDEX
YEAR ENDED DECEMBER 31,
2016
The following exhibits are submitted herewith or incorporated herein by reference in response to Items 15(a)(3) and 15(c). Each exhibit that is considered a management contract or compensatory plan or arrangement required to be filed pursuant to Item 15(a)(3) of Form 10-K is identified by a “(Z).”
|
Number and Description of Exhibit
|
|
|
3(i)
|
Restated Certificate of Incorporation of Whirlpool Corporation (amended and restated as of April 22, 2009). [Incorporated by reference from Exhibit 3.1 to the Company's Form 8-K (Commission file number 1-3932) filed on April 23, 2009]
|
|
|
|
|
3(ii)
|
By-Laws of Whirlpool Corporation (amended and restated effective October 18, 2016). [Incorporated by reference from Exhibit 3.2 to the Company’s Form 8-K (Commission file number 1-3932) filed on October 21, 2016]
|
|
|
|
|
4(i)
|
The registrant hereby agrees to furnish to the Securities and Exchange Commission, upon request, a copy of instruments defining the rights of holders of each issue of long-term debt of the registrant and its subsidiaries.
|
|
|
|
|
4(ii)
|
Indenture dated as of April 15, 1990 between Whirlpool Corporation and Citibank, N.A. [Incorporated by reference from Exhibit 4(a) to the Company’s Registration Statement on Form S-3 (Commission file number 33-40249) filed on May 6, 1991]
|
|
|
|
|
4(iii)
|
Indenture dated as of March 20, 2000 between Whirlpool Corporation and U.S. Bank, National Association (as successor to Citibank, N.A.) [Incorporated by reference from Exhibit 4(a) to the Company’s Registration Statement on Form S-3 (Commission file number 333-32886) filed on March 21, 2000]
|
|
|
|
|
4(iv)
|
Indenture dated as of June 15, 1987 between Maytag Corporation and The First National Bank of Chicago. [Incorporated by reference from Maytag Corporation’s Quarterly Report on Form 10-Q (Commission file number 1-00655) for the quarter ended June 30, 1987]
|
|
|
|
|
4(v)
|
Ninth Supplemental Indenture dated as of October 30, 2001 between Maytag Corporation and Bank One, National Association. [Incorporated by reference from Exhibit 4.1 to Maytag Corporation’s Form 8-K (Commission file number 1-00655) filed on October 31, 2001]
|
|
|
|
|
4(vi)
|
Tenth Supplemental Indenture dated as of December 30, 2010, between Maytag Corporation, Whirlpool Corporation and The Bank of New York Mellon Trust Company, N.A. [Incorporated by reference from Exhibit 4(vi) to the Company’s Annual Report on Form 10-K (Commission file number 1-3932) for the fiscal year ended December 31, 2010]
|
|
|
|
|
4(vii)
|
Indenture, dated November 2, 2016, among Whirlpool Finance Luxembourg S.à. r.l., Whirlpool Corporation and U.S. Bank National Association. [Incorporated by reference from Exhibit 4.1 to the Company’s Form 8-K (Commission file number 1-3932) filed on November 2, 2016]
|
|
|
|
|
10(i)(a)
|
Share Purchase Agreement dated July 10, 2014 among Whirlpool Corporation and Fineldo S.p.A., Franca Carloni, Andrea Merloni, Aristide Merloni, Maria Paola Merloni, and Antonella Merloni [Incorporated by reference from Exhibit 10.1 to the Company’s Quarterly Report on Form 10-Q (Commission file number 1-3932) for the quarter ended September 30, 2014]
|
|
|
|
|
10(i)(b)
|
Share Purchase Agreement dated July 10, 2014 among Whirlpool Corporation and Fineldo S.p.A., Fines S.p.A., Franca Carloni, Andrea Merloni, Aristide Merloni, Maria Paola Merloni, Ester Merloni, Vittorio Merloni and Antonella Merloni [Incorporated by reference from Exhibit 10.2 to the Company’s Quarterly Report on Form 10-Q (Commission file number 1-3932) for the quarter ended September 30, 2014]
|
E-1
|
|
|
|
10(i)(c)
|
Share Purchase Agreement dated July 10, 2014 between Whirlpool Corporation and Claudia Merloni [Incorporated by reference from Exhibit 10.3 to the Company’s Quarterly Report on Form 10-Q (Commission file number 1-3932) for the quarter ended September 30, 2014]
|
|
|
|
|
10(i)(d)
|
Exclusivity Agreement dated July 10, 2014 among Whirlpool Corporation and Fineldo S.p.A., Fines S.p.A., Vittorio Merloni, Franca Carloni, Aristide Merloni, Andrea Merloni, Maria Paola Merloni, Antonella Merloni, and Ester Merloni [Incorporated by reference from Exhibit 10.4 to the Company’s Quarterly Report on Form 10-Q (Commission file number 1-3932) for the quarter ended September 30, 2014]
|
|
|
|
|
10(i)(e)
|
Amendment dated October 14, 2014 to Share Purchase Agreement dated July 10, 2014, among Whirlpool Italia Holdings S.r.l., Whirlpool Corporation and Fineldo S.p.A., Franca Carloni, Andrea Merloni, Aristide Merloni, Maria Paola Merloni, and Antonella Merloni [Incorporated by reference from Exhibit 10.5 to the Company’s Quarterly Report on Form 10-Q (Commission file number 1-3932) for the quarter ended September 30, 2014]
|
|
|
|
|
10(i)(f)
|
Third Amended and Restated Long-Term Five-Year Credit Agreement dated as of May 17, 2016 among Whirlpool Corporation, Whirlpool Europe B.V., Whirlpool Finance B.V., Whirlpool Canada Holding Co., certain Financial Institutions and JPMorgan Chase Bank, N.A. as Administrative Agent, The Royal Bank of Scotland PLC, BNP Paribas and Citibank, N.A. as Syndication Agents, and J.P. Morgan Securities LLC, RBS Securities Inc., BNP Paribas Securities Corp., and Citigroup Global Markets Inc., as Joint Lead Arrangers and Joint Bookrunners [Incorporated by reference from Exhibit 10.1 to the Company’s Quarterly Report on Form 10-Q (Commission file number 1-3932) for the quarter ended June 30, 2016]
|
|
10(iii)(a)
|
Whirlpool Corporation Nonemployee Director Stock Ownership Plan (amended as of February 16, 1999, effective April 20, 1999) (Z) [Incorporated by reference from Exhibit A to the Company’s Proxy Statement (Commission file number 1-3932) for the 1999 annual meeting of stockholders]
|
|
|
|
|
10(iii)(b)
|
Whirlpool Corporation Charitable Award Contribution and Additional Life Insurance Plan for Directors (effective April 20, 1993) (Z) [Incorporated by reference from Exhibit 10(iii)(p) to the Company’s Annual Report on Form 10-K (Commission file number 1-3932) for the fiscal year ended December 31, 1994]
|
|
|
|
|
10(iii)(c)
|
Whirlpool Corporation Deferred Compensation Plan for Directors (as amended effective January 1, 1992 and April 20, 1993) (Z) [Incorporated by reference from Exhibit 10(iii)(f) to the Company’s Annual Report on Form 10-K (Commission file number 1-3932) for the fiscal year ended December 31, 1993]
|
|
|
|
|
10(iii)(d)
|
Whirlpool Corporation Deferred Compensation Plan II for Non-Employee Directors (as amended and restated, effective January 1, 2009) (Z) [Incorporated by reference from Exhibit 10(iii)(e) to the Company’s Annual Report on Form 10-K (Commission file number 1-3932) for the fiscal year ended December 31, 2008]
|
|
|
|
|
10(iii)(e)
|
Whirlpool Corporation Nonemployee Director Equity Plan (effective January 1, 2005) (Z) [Incorporated by reference from Exhibit 99.1 to the Company’s Form 8-K (Commission file number 1-3932) filed on April 21, 2005]
|
|
|
|
|
10(iii)(f)
|
Amendment of the Whirlpool Corporation Nonemployee Director Equity Plan (effective January 1, 2008) (Z) [Incorporated by reference to Exhibit 10(iii)(a) to the Company’s Quarterly Report on Form 10-Q (Commission file number 1-3932) filed on April 24, 2008]
|
|
|
|
|
10(iii)(g)
|
Nonemployee Director Stock Option Form of Agreement (Z) [Incorporated by reference from Exhibit 10(iii)(b) to the Company’s Quarterly Report on Form 10-Q (Commission file number 1-3932) filed on April 24, 2008]
|
|
|
|
|
10(iii)(h)
|
Nonemployee Director Stock Option Form of Agreement (Z) [Incorporated by reference from Exhibit 10.2 to the Company’s Form 8-K (Commission file number 1-3932) filed on April 26, 2010]
|
E-2
|
|
|
|
10(iii)(i)
|
Transition Agreement dated December 23, 2015 between Whirlpool Corporation and Michael A. Todman (Z)
[Incorporated by reference from Exhibit 10(iii)(i) to the Company’s Annual Report on Form 10-K (Commission file number 1-3932) for the fiscal year ended December 31, 2015]
|
|
|
|
|
10(iii)(j)
|
Whirlpool Corporation 2000 Omnibus Stock and Incentive Plan (effective January 1, 2000) (Z) [Incorporated by reference from Exhibit A to the Company’s Proxy Statement (Commission file number 1-3932) for the 2000 annual meeting of stockholders filed on March 13, 2000]
|
|
10(iii)(k)
|
Whirlpool Corporation 2002 Omnibus Stock and Incentive Plan (effective January 1, 2002) (Z) [Incorporated by reference from Exhibit A to the Company’s Proxy Statement (Commission file number 1-3932) for the 2002 annual meeting of stockholders filed on March 8, 2002]
|
|
|
|
|
10(iii)(l)
|
Whirlpool Corporation 2007 Omnibus Stock and Incentive Plan (effective January 1, 2007) (Z) [Incorporated by reference from Annex A to the Company’s Proxy Statement (Commission file number 1-3932) for the 2007 annual meeting of stockholders filed on March 12, 2007]
|
|
|
|
|
10(iii)(m)
|
Omnibus Equity Plans 409A Amendment (effective December 19, 2008) (Z) [Incorporated by reference from Exhibit 10(iii)(n) to the Company’s Annual Report on Form 10-K (Commission file number 1-3932) for the fiscal year ended December 31, 2008]
|
|
10(iii)(n)
|
Whirlpool Corporation 2010 Omnibus Stock and Incentive Plan (Z) [Incorporated by reference from Exhibit 10.1 to the Company’s Form 8-K (Commission file number 1-3932) filed on April 26, 2010]
|
|
|
|
|
10(iii)(o)
|
Whirlpool Corporation Amended and Restated 2010 Omnibus Stock and Incentive Plan (Z) [Incorporated by reference from Exhibit 10.1 to the Company’s Registration Statement on Form S-8 (Commission file number 333-187948) filed on April 16, 2013]
|
|
|
|
|
10(iii)(p)
|
Form of Agreement for the Whirlpool Corporation Career Stock Grant Program (pursuant to one or more of Whirlpool’s Omnibus Stock and Incentive Plans) (Z) [Incorporated by reference from Exhibit 10(iii)(q) to the Company’s Annual Report on Form 10-K (Commission file number 1-3932) for the fiscal year ended December 31, 1995]
|
|
|
|
|
10(iii)(q)
|
Form of Amendment to Whirlpool Corporation Career Stock Grant Agreement (Z) [Incorporated by reference from Exhibit 10(iii)(p) to the Company’s Annual Report on Form 10-K (Commission file number 1-3932) for the fiscal year ended December 31, 2008]
|
|
|
|
|
10(iii)(r)
|
Form of Stock Option Grant Document for the Whirlpool Corporation Stock Option Program (pursuant to one or more of Whirlpool’s Omnibus Stock and Incentive Plans)(Rev. 02/17/04) (Z) [Incorporated by reference from Exhibit 10(i) to the Company’s Form 8-K (Commission file number 1-3932) filed on January 25, 2005]
|
|
|
|
|
10(iii)(s)
|
Form of Restricted Stock Unit Agreement (pursuant to one or more of Whirlpool’s Omnibus Stock and Incentive Plans) (Z) [Incorporated by reference from Exhibit 10.1 to the Company’s Form 8-K (Commission file number 1-3932) filed on June 21, 2010]
|
|
|
|
|
10(iii)(t)
|
Whirlpool Corporation 2010 Omnibus Stock and Incentive Plan Restricted Stock Unit Award (Z) [Incorporated by reference from Exhibit 10(iii)(a) to the Company’s Form 10-Q (Commission file number 1-3932) for the quarter ended March 31, 2011]
|
|
|
|
|
10(iii)(u)
|
Whirlpool Corporation 2010 Omnibus Stock and Incentive Plan Strategic Excellence Program Performance Unit Award (Z) [Incorporated by reference from Exhibit 10(iii)(b) to the Company’s Form 10-Q (Commission file number 1-3932) for the quarter ended March 31, 2011]
|
|
|
|
E-3
|
10(iii)(v)
|
Whirlpool Corporation 2010 Omnibus Stock and Incentive Plan Strategic Excellence Program Stock Option Grant (Z) [Incorporated by reference from Exhibit 10(iii)(c) to the Company’s Form 10-Q (Commission file number 1-3932) for the quarter ended March 31, 2011]
|
|
|
|
|
10(iii)(w)
|
Whirlpool Corporation 2010 Omnibus Stock and Incentive Plan Strategic Excellence Program Restricted Stock Unit Award (Z) [Incorporated by reference from Exhibit 10(iii)(d) to the Company’s Form 10-Q (Commission file number 1-3932) for the quarter ended March 31, 2011]
|
|
|
|
|
10(iii)(x)
|
Whirlpool Corporation 2010 Omnibus Stock and Incentive Plan Strategic Excellence Program Stock Option Grant Document (Z) [Incorporated by reference from Exhibit 10(iii)(a) to the Company’s form 10-Q (Commission file number 1-3932) for the quarter ended March 31, 2012]
|
|
|
|
|
10(iii)(y)
|
Whirlpool Corporation 2010 Omnibus Stock and Incentive Plan Strategic Excellence Program Performance Restricted Stock Unit / Performance Unit Grant Document (Z) [Incorporated by reference from Exhibit 10(iii)(b) to the Company’s form 10-Q (Commission file number 1-3932) for the quarter ended March 31, 2012]
|
|
|
|
|
10(iii)(z)
|
Form of Compensation and Benefits Assurance Agreements (Z) [Incorporated by reference from Exhibit 10.1 to the Company’s Form 8-K (Commission file number 1-3932) filed on August 23, 2010]
|
|
|
|
|
10(iii)(aa)
|
Whirlpool Corporation Executive Deferred Savings Plan (as amended effective January 1, 1992) (Z) [Incorporated by reference from Exhibit 10(iii)(n) to the Company’s Annual Report on Form 10-K (Commission file number 1-3932) for the fiscal year ended December 31, 1993]
|
|
|
|
|
10(iii)(bb)
|
Whirlpool Corporation Executive Deferred Savings Plan II (as amended and restated, effective January 1, 2009), including Supplement A, Whirlpool Executive Restoration Plan (as amended and restated, effective January 1, 2009) (Z) [Incorporated by reference from Exhibit 10(iii)(y) to the Company’s Annual Report on Form 10-K (Commission file number 1-3932) for the fiscal year ended December 31, 2008]
|
|
|
|
|
10(iii)(cc)
|
Amendment to the Whirlpool Corporation Executive Deferred Savings Plan II (dated December 21, 2009) (Z) [Incorporated by reference from Exhibit 10(iii)(x) to the Company’s Annual Report on Form 10-K (Commission file number 1-3932) for the fiscal year ended December 31, 2009]
|
|
10(iii)(dd)
|
Whirlpool Retirement Benefits Restoration Plan (as amended and restated effective January 1, 2009) (Z) [Incorporated by reference from Exhibit 10(iii)(dd) to the Company’s Annual Report on Form 10-K (Commission file number 1-3932) for the fiscal year ended December 31, 2008]
|
|
|
|
|
10(iii)(ee)
|
Whirlpool Supplemental Executive Retirement Plan (as amended and restated, effective January 1, 2009) (Z) [Incorporated by reference from Exhibit 10(iii)(ee) to the Company’s Annual Report on Form 10-K (Commission file number 1-3932) for the fiscal year ended December 31, 2008]
|
|
|
|
|
10(iii)(ff)
|
Whirlpool Corporation Form of Indemnity Agreement (Z) [Incorporated by reference from Exhibit 10.1 to the Company’s Form 8-K (Commission file number 1-3932) filed on February 23, 2006]
|
|
|
|
|
10(iii)(gg)
|
Whirlpool Corporation Performance Excellence Plan (Z) [Incorporated by reference from Exhibit 10(iii)(a) to the Company’s Quarterly Report on Form 10-Q (Commission file number 1-3932) for the quarter ended March 31, 2014]
|
|
|
|
E-4
|
10(iii)(hh)
|
Whirlpool Corporation 2014 Executive Performance Excellence Plan (Z) [Incorporated by reference from Exhibit 10.1 to the Company’s Form 8-K (Commission file number 1-3932) filed on April 17, 2014]
|
|
|
|
|
10(iii)(ii)
|
Agreement dated May 1, 2012 by and between Whirlpool Corporation and Mr. João Carlos Costa Brega (Z) [Incorporated by reference from Exhibit 10(iii)(ii) to the Company’s Annual Report on Form 10-K (Commission file number 1-3932) for the fiscal year ended December 31, 2015]
|
|
|
|
|
10(iii)(jj)
|
Transition Agreement, dated June 22, 2016, between Whirlpool Corporation and Larry M. Venturelli. [Incorporated by reference from Exhibit 10.1 to the Company’s Form 8-K (Commission file number 1-3932) filed on June 24, 2016]
|
|
|
|
|
12
|
Ratio of Earnings to Fixed Charges
|
|
|
|
|
21
|
List of Subsidiaries
|
|
|
|
|
23
|
Consent of Independent Registered Public Accounting Firm
|
|
|
|
|
24
|
Power of Attorney
|
|
|
|
|
31(a)
|
Certification of Chief Executive Officer, Pursuant to Section 302 of the Sarbanes-Oxley Act of 2002
|
|
|
|
|
31(b)
|
Certification of Chief Financial Officer, Pursuant to Section 302 of the Sarbanes-Oxley Act of 2002
|
|
|
|
|
32
|
Certifications Pursuant to 18 U.S.C. Section 1350, as Adopted Pursuant to Section 906 of the Sarbanes-Oxley Act of 2002
|
|
|
|
|
101.INS
|
XBRL Instance Document
|
|
|
|
|
101.SCH
|
XBRL Taxonomy Extension Schema Document
|
|
|
|
|
101.CAL
|
XBRL Taxonomy Extension Calculation Linkbase Document
|
|
|
|
|
101.LAB
|
XBRL Taxonomy Extension Label Linkbase Document
|
|
|
|
|
101.PRE
|
XBRL Taxonomy Extension Presentation Linkbase Document
|
|
|
|
|
101.DEF
|
XBRL Taxonomy Extension Definition Linkbase Document
|
E-5
TABLE OF CONTENTS
Part IItem 1. BusinessItem 1A. Risk FactorsItem 1B. Unresolved Staff CommentsItem 2. PropertiesItem 3. Legal ProceedingsItem 4. Mine Safety DisclosuresPart IIItem 5. Market For Registrant S Common Equity, Related Stockholder Matters and Issuer Purchases Of Equity SecuritiesItem 5. Market For Registrant S Common Equity, Related Stockholder MattersItem 6. Selected Financial DataItem 7. Management S Discussion and Analysis Of Financial Condition and Results Of OperationsItem 7. Management S Discussion and Analysis Of Financial Condition andItem 7A. Quantitative and Qualitative Disclosures About Market RiskItem 8. Financial Statements and Supplementary DataItem 9. Changes in and Disagreements with Accountants on Accounting and Financial DisclosureItem 9. Changes in and Disagreements with Accountants on Accounting andItem 9A. Controls and ProceduresItem 9B. Other InformationPart IIIItem 10. Directors, Executive Officers and Corporate GovernanceItem 11. Executive CompensationItem 12. Security Ownership Of Certain Beneficial Owners and Management and Related Stockholder MattersItem 12. Security Ownership Of Certain Beneficial Owners and Management andItem 13. Certain Relationships and Related Transactions, and Director IndependenceItem 13. Certain Relationships and Related Transactions, and DirectorItem 14. Principal Accounting Fees and ServicesPart IVItem 15. Exhibits, Financial Statement SchedulesItem 16. Form 10-k Summary