WHIRLPOOL CORP /DE/
10-Ks and 10-Qs
|
|
|
|
|
|
|
|
|
|
|
|
|
|
|
|
|
|
|
|
|
|
|
|
|
|
|
|
|
|
|
|
|
|
|
|
|
|
|
|
|
|
|
|
|
|
|
|
|
|
|
|
|
|
|
|
UNITED STATES SECURITIES AND EXCHANGE COMMISSION
WASHINGTON, D.C. 20549
FORM 10-K
(Mark One)
|
x
|
ANNUAL REPORT PURSUANT TO SECTION 13 OR 15(d) OF THE SECURITIES EXCHANGE ACT OF 1934
|
|
For the fiscal year ended
December 31, 2018
OR
|
o
|
TRANSI
TION REPORT PURSUANT TO SECTION 13 OR 15(d) OF THE SECURITIES EXCHANGE ACT OF 1934
|
|
For the transition period from _______ to _______
Commission file number 1-3932

WHIRLPOOL CORPORATION
(Exact name of registrant as specified in its charter)
|
Delaware
|
|
38-1490038
|
|
(State of Incorporation)
|
|
(I.R.S. Employer Identification No.)
|
|
2000 North M-63, Benton Harbor, Michigan
|
|
49022-2692
|
|
(Address of principal executive offices)
|
|
(Zip Code)
|
Registrant's telephone number, including area code (269) 923-5000
Securities registered pursuant to Section 12(b) of the Act:
|
Title of each class
|
|
Name of each exchange on which registered
|
|
Common stock, par value $1 per share
|
|
Chicago Stock Exchange and New York Stock Exchange
|
|
0.625% Senior Notes due 2020
|
New York Stock Exchange
|
|
Securities registered pursuant to Section 12(g) of the Act: NONE
|
Indicate by check mark if the registrant is a well-known seasoned issuer, as defined in Rule 405 of the Securities Act.
|
Yes
ý
No
¨
|
|||
|
Indicate by check mark if the registrant is not required to file reports pursuant to Section 13 or Section 15(d) of the Exchange Act.
|
Yes
¨
No
ý
|
|||
|
Indicate by check mark whether the registrant (1) has filed all reports required to be filed by Section 13 or 15(d) of the Exchange Act during
|
||||
|
the preceding 12 months (or for such shorter period that the registrant was required to file such reports), and (2) has been subject to such
|
||||
|
filing requirements for the past 90 days.
|
Yes
ý
No
¨
|
|||
|
Indicate by check mark whether the registrant has submitted electronically every Interactive Data File required to be submitted pursuant to
|
||||
|
Rule 405 of Regulation S-T (§ 232.405 of this chapter) during the preceding 12 months (or for such shorter period that the registrant
|
||||
|
was required to submit such files).
|
Yes
ý
No
¨
|
|||
|
Indicate by check mark if disclosure of delinquent filers pursuant to Item 405 of Regulation S-K (§229.405 of this chapter) is not contained
|
||||
|
herein, and will not be contained, to the best of the registrant's knowledge, in definitive proxy or information statements incorporated by
|
||||
|
reference in Part III of this Form 10-K or any amendment to this Form 10-K.
|
ý
|
|||
|
Indicate by check mark whether the registrant is a large accelerated filer, an accelerated filer, a non-accelerated filer, a smaller reporting
|
||||
|
company, or an emerging growth company. See the definitions of "large accelerated filer," "accelerated filer," "smaller reporting company," and "emerging growth company" in Rule 12b-2 of the Exchange Act.
|
||||
|
(Check one)
|
||||
|
Large accelerated filer
ý
|
Accelerated filer
¨
|
|||
|
Non-accelerated filer
¨
(Do not check if a smaller reporting company)
|
Smaller reporting company
¨
|
|||
|
Emerging growth company
¨
|
||||
|
If an emerging growth company, indicate by check mark if the registrant has elected not to use the extended transition period for complying with any new or revised financial accounting standards provided pursuant to Section 13(a) of the Exchange Act.
o
|
||||
|
Indicate by check mark whether the registrant is a shell company (as defined in Rule 12b-2 of the Act).
|
Yes
¨
No
ý
|
|||
On
February 8, 2019
, the registrant had
63,569,688
shares of common stock outstanding.
DOCUMENTS INCORPORATED BY REFERENCE
Portions of the following documents are incorporated herein by reference into the Part of the Form 10-K indicated:
|
Document
|
Part of Form 10-K into which incorporated
|
|
The registrant's proxy statement for the 2019 annual meeting of stockholders (the "Proxy Statement")
|
Part III
|
WHIRLPOOL CORPORATION
ANNUAL REPORT ON FORM 10-K
For the fiscal year ended
December 31, 2018
TABLE OF CONTENTS
|
|
|
PAGE
|
|
Item 1.
|
||
|
Item 1A.
|
||
|
Item 1B.
|
||
|
Item 2.
|
||
|
Item 3.
|
||
|
Item 4.
|
||
|
Item 5.
|
||
|
Item 6.
|
||
|
Item 7.
|
||
|
Item 7A.
|
||
|
Item 8.
|
||
|
Item 9.
|
||
|
Item 9A.
|
||
|
Item 9B.
|
||
|
Item 10.
|
||
|
Item 11.
|
||
|
Item 12.
|
||
|
Item 13.
|
||
|
Item 14.
|
||
|
Item 15.
|
||
|
Item 16.
|
||
|
PART I
|
||||
|
ITEM 1.
|
BUSINESS
|
|
Our Company
More than 100 years of delivering value one moment at a time
|
|
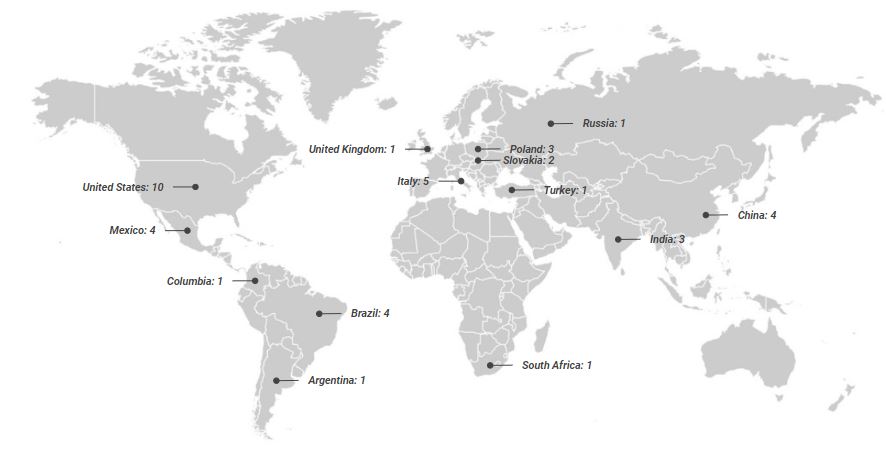
Whirlpool Corporation ("Whirlpool"), the world's leading major home appliance company, was incorporated in 1955 under the laws of Delaware and was founded in 1911. Whirlpool manufactures products in 14 countries and markets products in nearly every country around the world. We have received worldwide recognition for accomplishments in a variety of business and social efforts, including leadership, diversity, innovative product design, business ethics, social responsibility and community involvement.
We conduct our business through four operating segments, which we define based on geography. Whirlpool's operating segments consist of North America, Europe, Middle East and Africa ("EMEA"), Latin America and Asia.
Whirlpool had approximately
$21 billion
in annual sales and
92,000
employees in 2018.
As used herein, and except where the context otherwise requires, "Whirlpool," "the Company," "we," "us," and "our" refer to Whirlpool Corporation and its consolidated subsidiaries. The world's leading major home appliance company claim is based on most recently available publicly reported annual revenues among leading appliance manufacturers.
Our Strategic Architecture
Our strategic architecture is the foundational component that drives our shareholder value creation. Below are the key components of our strategic architecture.

Unique Global Position
Whirlpool Corporation is committed to delivering significant, long-term value to both our consumers and our shareholders. For consumers, we deliver value through innovative, high-quality products that solve everyday problems. For our shareholders, we seek to deliver differentiated value through our four strategic pillars: global leading manufacturer, best brand portfolio, legacy of innovation and best cost position.
3
|
Global Leading Manufacturer
|
Best Brand
Portfolio
|
Legacy of Innovation
|
Best Cost
Position
|
||||||||||||||

|

|

|
|
|

|

|
|||||||||||

|
|||||||||||||||||

|

|
||||||||||||||||

|

|

|

|

|
|||||||||||||

|

|
||||||||||||||||

|

|

|
|||||||||||||||
Global Leading Manufacturer
We are the world's leading major home appliance company.
Our leading position includes a balance of developed countries and emerging markets. As demand recovers in key emerging markets, we believe we are well positioned to benefit and convert this demand into profitable growth.
Best Brand Portfolio
We have the best brand portfolio in the industry, including six brands with more than $1 billion in revenue.

We aim to position these desirable brands across many consumer segments. Our sales are led by our global brands, including
Whirlpool
and
KitchenAid
.
Whirlpool
is trusted throughout the world as a brand that delivers innovative care daily. Our
KitchenAid
brand brings a combination of innovation and design that inspires and fuels the passion of chefs, bakers and kitchen enthusiasts worldwide. These two brands are the backbone of our strategy to offer differentiated products that provide exceptional performance and desirable features while remaining affordable to consumers.
We also have a number of strong regional and local brands, including
Maytag, Brastemp, Consul, Hotpoint*, Indesit,
and
Bauknecht
. These brands add to our unmatched depth and breadth of appliance offerings and help us provide products that are tailored to local consumer needs and preferences.
Legacy of Innovation
Whirlpool Corporation has been responsible for a number of first-to-market innovations. These include the first electric wringer washer in 1911, the first residential stand mixer in 1919, the first countertop microwave in 1967 and the first energy and water efficient top-load washer in 1998. We are proud of our legacy of innovation.
While we are proud of that legacy, we are also committed to innovating for a new generation of consumers. Our world-class innovation pipeline has accelerated over the last few years, driven by consistent innovation funding and a
*Whirlpool ownership of the Hotpoint brand in the EMEA and Asia Pacific regions is not affiliated with the Hotpoint brand sold in the Americas.
4
passionate culture of employees focused on bringing new technologies to market. This year, we launched more than 100 new products throughout the world, and we are committed to further accelerating our pace of innovation.
As the shift to digital continues, consumers are beginning to desire connected appliances which fit seamlessly into the larger home ecosystem. We are excited to bring new connected technologies to market, including scan-to-cook, voice control, and remote service diagnostics. Whether developed internally or with one of our many collaborators, we believe these digitally-enabled services will increasingly enhance the appliance experience for our consumers.
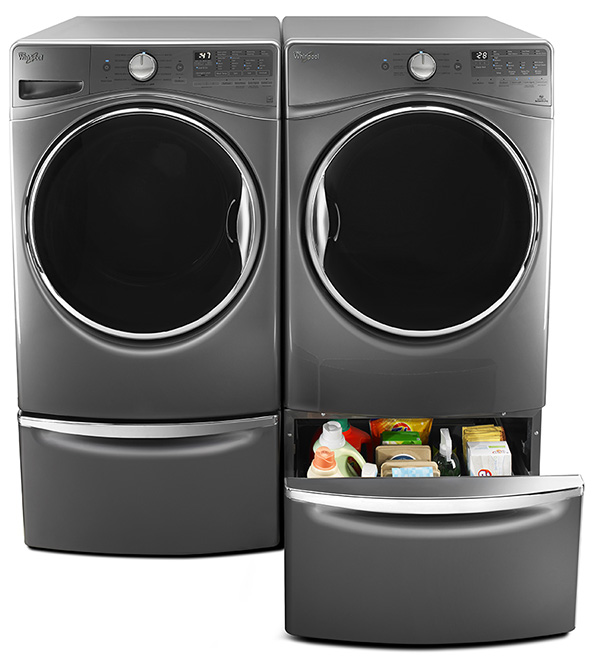
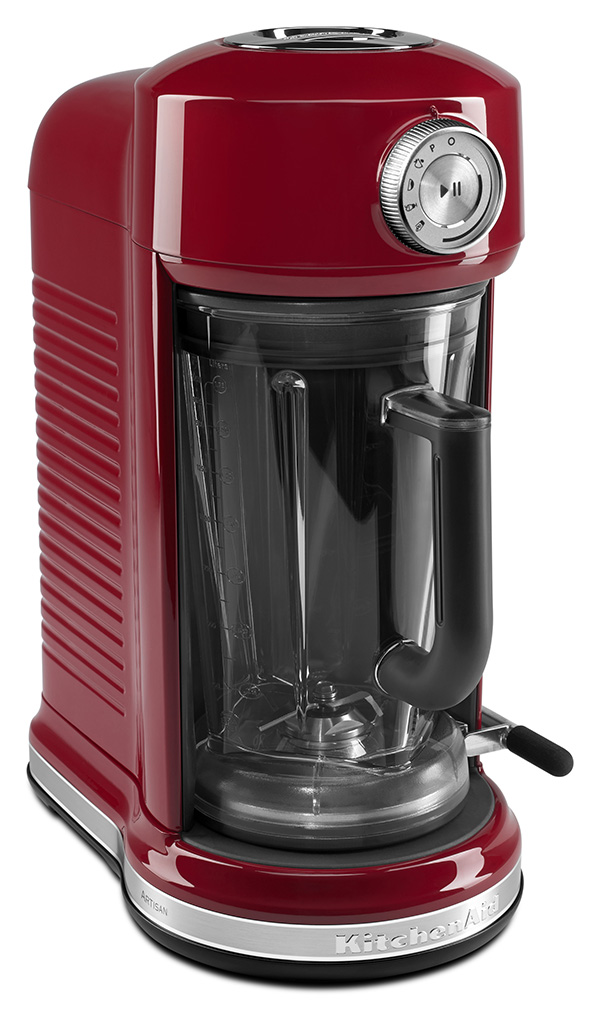
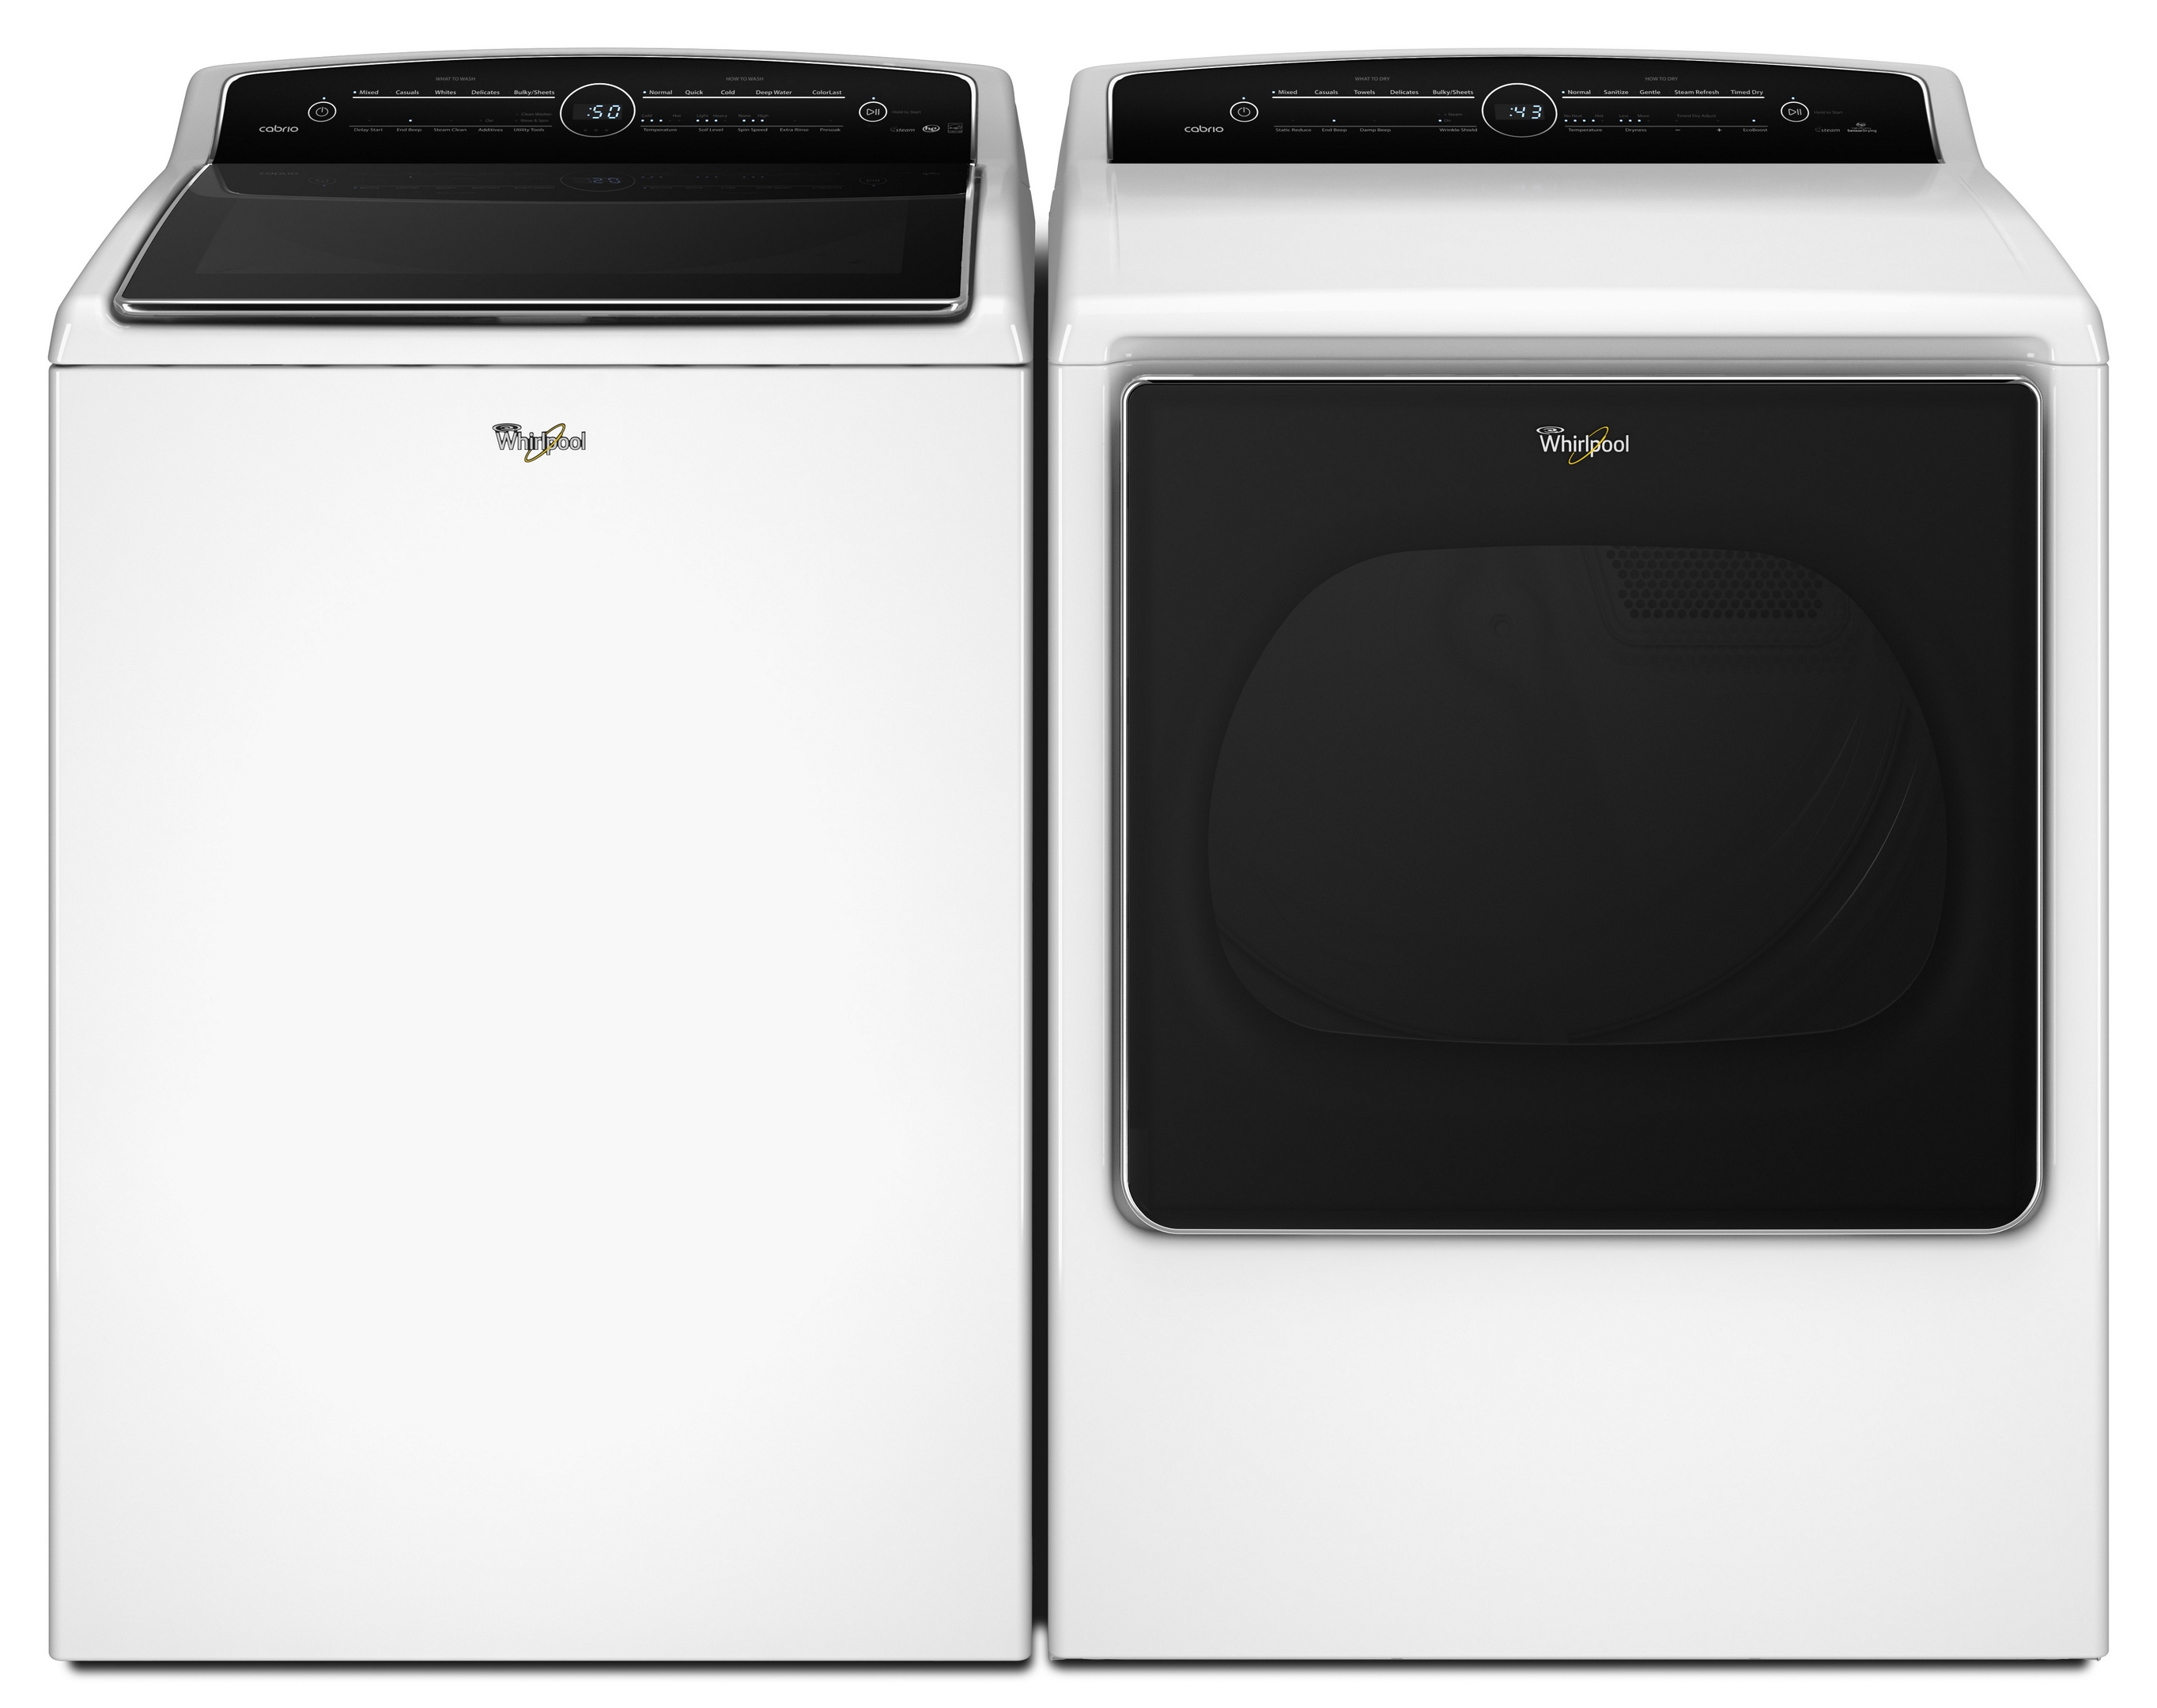
Whirlpool manufactures and markets a full line of major home appliances and related products. Our principal products are laundry appliances, refrigerators and freezers, cooking appliances, dishwashers, mixers and other small domestic appliances. We also produce hermetic compressors for refrigeration systems. The following chart provides the percentage of net sales for each of our product categories which accounted for 10% or more of our consolidated net sales over the last three years:

|

|

|

|

|

|
Best Cost Position
As the number one major appliance manufacturer in the world, we have a cost benefit on everything we do based on scale, and are committed to a relentless focus on cost efficiency. Our global scale enables our local-for-local production model. We are focused on producing as efficiently as possible and at scale throughout the world.
As the global environment continues to change, we believe our strong capabilities for cost takeout allow us to effectively cope with macroeconomic challenges, and we see additional opportunities to further streamline our cost structure. For example, we are on a journey to reduce the complexity of our designs and product platforms. This initiative, among many others, will enable us to utilize increased modular production, improved scale in global procurement, and further streamline our day-to-day manufacturing operations.
We believe our cost position is clearly differentiated in the appliance industry and we are committed to even further improvement, creating strong levels of value for our shareholders, regardless of the external environment.
5
Value Creation Framework
Our long-term value creation framework is built upon the strong foundation we have in place: our industry-leading brand portfolio and robust product innovation pipeline, supported by our global operating platform and executed by our exceptional employees throughout the world. We measure these value-creation components by focusing on the following key metrics:
|
Profitable Growth
|
Margin Expansion
|
Cash Conversion
|
||||||||
|
Innovation-fueled growth at or above
the market
|
Drive cost and price/mix to grow profitability
|
Asset efficiency converts profitable growth to cash
|
||||||||
|
3-5%
|
10%
|
5-6%
|
||||||||
|
Annual Organic
Net Sales Growth
|
EBIT Margin
|
FCF as % of Net Sales
|
||||||||
|
Net Sales
|
YoY Change
|
Net Earnings (Loss) Available to Whirlpool
(1)
|
Ongoing EBIT Margin
(1)
|
Ongoing EBIT Margin YoY Change
|
Cash Provided by Operating Activities
(1)
|
Free Cash Flow
(1)
|
FCF as % of Net Sales
|
|||
|
2018
|
$21.0B
|
(1.0)%
|
($183)M
|
6.3%
|
(0.1)%
|
$1,229M
|
$853M
|
4.1%
|
||
|
2017
|
$21.3B
|
2.6%
|
$350M
|
6.4%
|
(0.9)%
|
$1,264M
|
$707M
|
3.3%
|
||
|
2016
|
$20.7B
|
(0.8)%
|
$888M
|
7.3%
|
0.4%
|
$1,203M
|
$630M
|
3.0%
|
||
(1) Net Earnings (Loss) Available to Whirlpool and Cash Provided by Operating Activities are the most comparable GAAP measures to Ongoing Earnings before Interest and Taxes (EBIT) Margin and Free Cash Flow, respectively, which are non-GAAP financial measures. For additional information and a reconciliation of these non-GAAP financial measures, see the Non-GAAP Financial Measures section in Management's Discussion and Analysis of this Form 10-K.
Capital Allocation Strategy
We take a balanced approach to capital allocation by focusing on the following key metrics:
|
Fund the Business
|
Target
|
|
Capex / R&D
|
Capex: 3%+ of net sales
R&D: ~3% of net sales
|
|
Mergers & Acquisitions
|
Explore value-creating M&A to accelerate strategy
|
|
Return to Shareholders
|
Target
|
|
Dividends
|
25-30% of trailing 12-month ongoing net earnings
|
|
Share Repurchase
|
Continued repurchasing opportunistically
|
|
Targeted Capital Structure
|
Maintain strong investment grade rating; target gross Debt/EBITDA of ~2.0
|
We remain confident in our ability to effectively manage our business through macroeconomic volatility and expect to continue delivering long-term value for our shareholders.
6
Regional Business Summary
|
North America
|
•
In the United States, we market and distribute major home appliances and small domestic appliances primarily under the
Whirlpool, Maytag, KitchenAid, JennAir, Amana, Roper, Admiral, Affresh
and
Gladiator
brand names primarily to retailers, distributors and builders.
•
In Canada, we market and distribute major home appliances primarily under the
Admiral, Whirlpool, Maytag, JennAir, Amana, Roper, Estate, Inglis, Speed Queen
and
KitchenAid
brand names.
•
We sell some products to other manufacturers, distributors, and retailers for resale in North America under those manufacturers' and retailers' respective brand names.
|

|
|
|
Europe, Middle East and Africa
(EMEA)
|
•
In EMEA, we market and distribute our major home appliances primarily under the
Whirlpool, Hotpoint*, Bauknecht, Indesit, Ignis, Maytag, Laden
and
Privileg
brand names. We also market major home appliances and small domestic appliances under the
KitchenAid
brand name.
•
We market and distribute a full line of products under the
Whirlpool
and
KIC
brand names in South Africa. We also market and distribute products under the
Whirlpool, Bauknecht, Maytag, Indesit, Amana
and
Ignis
brand names to distributors and dealers in Africa and the Middle East.
•
In addition to our operations in Western and Eastern Europe, Turkey and Russia, we have a sales subsidiary in Morocco.
|
|
|
|
Latin America
|
•
In Latin America, we market and distribute our major home appliances and small domestic appliances primarily under the
Consul, Brastemp, Whirlpool,
KitchenAid
and
Acros
brand names.
•
We manage sales and distribution through our local entities in Brazil, Argentina, Mexico, Chile, Peru, Ecuador, Colombia and Guatemala.
•
We also serve the countries of Bolivia, Paraguay, Uruguay, Venezuela, and certain Caribbean and Central America countries, where we manage appliances sales and distribution through accredited distributors.
•
Our Latin America operations also produce hermetic compressors for refrigeration systems, which business is currently in the process of sale.
|
|
|
|
Asia
|
•
In Asia, we have organized the marketing and distribution of our major home appliances and small domestic appliances into five operating groups.
•
These five groups are: (1) mainland China; (2) Hong Kong, Taiwan, Korea and Japan; (3) India, which includes Bangladesh, Sri Lanka, Nepal and Pakistan; (4) Oceania, which includes Australia, New Zealand and Pacific Islands; and (5) Southeast Asia, which includes Thailand, Singapore, Malaysia, Indonesia, Vietnam, the Philippines, and Myanmar.
•
We market and distribute our products in Asia primarily under the
Whirlpool, Maytag, KitchenAid, Ariston, Indesit, Bauknecht, Sanyo, Diqua,
and
Royalstar
brand names through a combination of direct sales to appliance retailers and chain stores and through full-service distributors to a large network of retail stores.
|
|
|
*Whirlpool ownership of the Hotpoint brand in the EMEA and Asia Pacific regions is not affiliated with the Hotpoint brand sold in the Americas.
7
Competition
Competition in the major home appliance industry is intense, including competitors such as Arcelik, Bosch Siemens, Electrolux, Haier, Kenmore, LG, Mabe, Midea, Panasonic and Samsung, many of which are increasingly expanding beyond their existing manufacturing footprint. The competitive environment includes the impact of a changing retail environment, including the shifting of consumer purchase practices towards e-commerce and other channels. Moreover, our customer base includes large, sophisticated trade customers who have many choices and demand competitive products, services and prices. We believe that we can best compete in the current environment by focusing on introducing new and innovative products, building strong brands, enhancing trade customer and consumer value with our product and service offerings, optimizing our regional footprint and trade distribution channels, increasing productivity, improving quality, lowering costs, and taking other efficiency-enhancing measures.
Raw Materials and Purchased Components
We are generally not dependent upon any one source for raw materials or purchased components essential to our business. In areas where a single supplier is used, alternative sources are generally available and can be developed within the normal manufacturing environment. Some supply disruptions and unanticipated costs may be incurred in transitioning to a new supplier if a prior single supplier relationship was abruptly interrupted or terminated. In the event of a disruption, we believe that we will be able to qualify and use alternate materials, sometimes at premium costs, and that such raw materials and components will be available in adequate quantities to meet forecasted production schedules.
Trademarks, Licenses and Patents
We consider the trademarks, copyrights, patents, and trade secrets we own, and the licenses we hold, in the aggregate, to be a valuable asset. Whirlpool is the owner of a number of trademarks in the United States and foreign countries. The m
ost important trademarks to North America are
Whirlpool, Maytag, JennAir, KitchenAid
and
Amana. T
he most important trademarks to EMEA are
Whirlpool, KitchenAid, Bauknecht, Indesit, Hotpoint*
and
Ignis.
The most important trademarks to Latin America are
Consul, Brastemp, Whirlpool,
KitchenAid
and
Acros
. The most important trademarks to Asia are
Whirlpool
and
Royalstar
(which is licensed to us).
We receive royalties from licensing our trademarks to third parties to manufacture, sell and service certain products bearing the
Whirlpool, Maytag, KitchenAid, Amana
and
Bauknecht
brand names. We continually apply for and obtain United States and foreign patents. The primary purpose in obtaining patents is to protect our designs, technologies and products.
Protection of the Environment
Our manufacturing facilities are subject to numerous laws and regulations designed to protect or enhance the environment, many of which require federal, state, or other governmental licenses and permits with regard to wastewater discharges, air emissions, and hazardous waste management. Our policy is to comply with all such laws and regulations. Where laws and regulations are less restrictive, we have established and are following our own standards, consistent with our commitment to environmental responsibility.
We believe that we are in compliance, in all material respects, with presently applicable governmental provisions relating to environmental protection in the countries in which we have manufacturing operations. Compliance with these environmental laws and regulations did not have a material effect on capital expenditures, earnings, or our competitive position during
2018
and is not expected to be material in
2019
.
The entire major home appliance industry, including Whirlpool, must contend with the adoption of stricter government energy and environmental standards. These standards have been and continue to be phased in over the past several years and include the general phase-out of ozone-depleting chemicals used in refrigeration, and energy and related standards for selected major appliances, regulatory restrictions on the materials content specified for use in our products by some jurisdictions and mandated recycling of our products at the end of their useful lives. Compliance with these various standards, as they become effective, will require some product redesign. However, we believe, based on our understanding of the current state of proposed regulations, that we will be able to develop, manufacture, and market products that comply with these regulations.
Whirlpool participates in environmental assessments and cleanup at a number of locations globally. These include operating and non-operating facilities, previously owned properties and waste sites, including "Superfund" (under the Comprehensive Environmental Response, Compensation and Liability Act (CERCLA)) sites. However, based upon our
*Whirlpool ownership of the Hotpoint brand in the EMEA and Asia Pacific regions is not affiliated with the Hotpoint brand sold in the Americas.
8
evaluation of the facts and circumstances relating to these sites along with the evaluation of our technical consultants, we do not presently anticipate any material adverse effect on our financial statements arising out of the resolution of these matters or the resolution of any other known governmental proceeding regarding environmental protection matters.
Other Information
For information about the challenges and risks associated with our foreign operations, see "Risk Factors" under Item 1A.
Whirlpool is a major supplier of laundry, refrigeration, cooking and dishwasher home appliances to Lowe's, a North American retailer. Net sales attributable to Lowe's in 2018, 2017 and 2016, were approximately 12%, 10% and 9%, respectively, of our consolidated net sales. For certain other financial information concerning our business segments and foreign and domestic operations, see Note
15
to the Consolidated Financial Statements.
For information on our global restructuring plans, and the impact of these plans on our operating segments, see Note
13
to the Consolidated Financial Statements.
Executive Officers of the Registrant
The following table sets forth the names and ages of our executive officers on
February 12, 2019
, the positions and offices they held on that date, and the year they first became executive officers:
|
Name
|
Office
|
First Became
an Executive
Officer
|
Age
|
|||
|
Marc R. Bitzer
|
Chairman of the Board, President and Chief Executive Officer
|
2006
|
54
|
|||
|
James W. Peters
|
Executive Vice President and Chief Financial Officer
|
2016
|
49
|
|||
|
João C. Brega
|
Executive Vice President and President, Whirlpool Latin America
|
2012
|
55
|
|||
|
Joseph T. Liotine
|
Executive Vice President and President, Whirlpool North America
|
2014
|
46
|
|||
|
Shengpo (Samuel) Wu
|
Executive Vice President and President, Whirlpool Asia
|
2019
|
52
|
|||
The executive officers named above were elected by our Board of Directors to serve in the office indicated until the first meeting of the Board of Directors following the annual meeting of stockholders in
2019
and until a successor is chosen and qualified or until the executive officer's earlier resignation or removal. Each of our executive officers has held the position set forth in the table above or has served Whirlpool in various executive or administrative capacities for at least the past five years, except for Mr. Wu. Prior to joining Whirlpool in February 2017, Mr. Wu for the previous five years served as President and Chief Executive Officer, Asia Pacific, of Osram GmbH, and before joining Osram in 2012, worked for Honeywell Process Solutions and General Electric in various leadership roles.
Available Information
Financial results and investor information (including Whirlpool's Form 10-K, 10-Q, and 8-K reports) are accessible at Whirlpool's website:
investors.whirlpoolcorp.com
. Copies of our Form 10-K, 10-Q, and 8-K reports and amendments, if any, are available free of charge through our website on the same day they are filed with, or furnished to, the Securities and Exchange Commission.
|
ITEM 1A.
|
RISK FACTORS
|
This report contains statements referring to Whirlpool that are not historical facts and are considered "forward-looking statements" within the meaning of the Private Securities Litigation Reform Act of 1995. These statements, which are intended to take advantage of the "safe harbor" provisions of the Private Securities Litigation Reform Act of 1995, are based on current projections about operations, industry conditions, financial condition and liquidity. Words that identify forward-looking statements include words such as "may," "could," "will," "should," "possible," "plan," "predict," "forecast," "potential," "anticipate," "estimate," "expect," "project," "intend," "believe," "may impact," "on track," and words and terms of similar substance used in connection with any discussion of future operating or financial performance, an acquisition or merger, or our businesses. In addition, any statements that refer to expectations, projections, or other characterizations of future events or circumstances, including any underlying assumptions, are forward-looking
9
statements. Those statements are not guarantees and are subject to risks, uncertainties, and assumptions that are difficult to predict. Therefore, actual results could differ materially and adversely from these forward-looking statements.
We have listed below what we believe to be the most significant strategic, operational, financial, and legal and compliance risks relating to our business.
STRATEGIC RISKS
We face intense competition in the major home appliance industry and failure to successfully compete could negatively affect our business and financial performance.
Each of our operating segments operates in a highly competitive business environment and faces intense competition from a growing number of competitors, many of which have strong consumer brand equity. Several of these competitors, such as those set forth in the Business section of this annual report, are large, well-established companies, many ranking among the Global Fortune 150, and have demonstrated a commitment to global success.
We also face competition that may be able to quickly adapt to changing consumer preferences, particularly in the connected appliance space. Moreover, our customer base includes large, sophisticated trade customers who have many choices and demand competitive products, services and prices. Competition in the global appliance industry is based on a number of factors including selling price, product features and design, performance, innovation, reputation, energy efficiency, quality, cost, distribution, and financial incentives, such as promotional funds, sales incentives, volume rebates and terms. Many of our competitors are increasingly expanding beyond their existing manufacturing footprints. Our competitors, especially global competitors with low-cost sources of supply and/or highly protected home marketplaces outside the United States, have aggressively priced their products and/or introduced new products to increase market share and expand into new geographies. Many of our competitors have established and may expand their presence in the rapidly changing retail environment, including the shifting of consumer purchasing practices towards e-commerce and other channels. If we are unable to successfully compete in this highly competitive environment, our business and financial performance could be negatively affected.
The loss of, or substantial decline in, sales to any of our key trade customers, major buying groups, and builders could adversely affect our financial performance.
We sell to a sophisticated customer base of large trade customers, including Lowe's and other large domestic and international trade customers, that have significant leverage as buyers over their suppliers. Most of our products are not sold through long-term contracts, allowing trade customers to change volume among suppliers. As the trade customers continue to become larger, they may seek to use their position to improve their profitability by various means, including improved efficiency, lower pricing, and increased promotional programs. If we are unable to meet their demand requirements, our volume growth and financial results could be negatively affected. The loss or substantial decline in volume of sales to our key trade customers, major buying groups, builders, or any other trade customers to which we sell a significant amount of products, could adversely affect our financial performance. Additionally, the loss of market share or financial difficulties, including bankruptcy and financial restructuring, by these trade customers could have a material adverse effect on our liquidity, financial position and results of operations.
Failure to maintain our reputation and brand image could negatively impact our business.
Our brands have worldwide recognition, and our success depends on our ability to maintain and enhance our brand image and reputation. Maintaining, promoting and growing our brands depends on our marketing efforts, including advertising and consumer campaigns, as well as product innovation. We could be adversely impacted if we fail to achieve any of these objectives or if, whether or not justified, the reputation or image of our company or any of our brands is tarnished or receives negative publicity. In addition, adverse publicity about regulatory or legal action against us, or product quality issues, could damage our reputation and brand image, undermine our customers' confidence in us and reduce long-term demand for our products, even if the regulatory or legal action is unfounded or not material to our operations.
10
In addition, our success in maintaining, extending and expanding our brand image depends on our ability to adapt to a rapidly changing media environment, including an ever-increasing reliance on social media and online dissemination of advertising campaigns. Inaccurate or negative posts or comments about us on social networking and other websites that spread rapidly through such forums could seriously damage our reputation and brand image. If we do not maintain, extend and expand our brand image, then our product sales, financial condition and results of operations could be materially and adversely affected.
An inability to effectively execute and manage our business objectives could adversely affect our financial performance.
The highly competitive nature of our industry requires that we effectively execute and manage our business objectives including our global operating platform initiative. Our global operating platform initiative aims to reduce costs, expand margins, drive productivity and quality improvements, accelerate our rate of innovation, generate free cash flow and drive shareholder value. An inability to effectively control costs and drive productivity improvements could affect our profitability. In addition, an inability to provide high-quality, innovative products could adversely affect our ability to maintain or increase our sales, which could negatively affect our revenues and overall financial performance. Additionally, our success is dependent on anticipating and appropriately reacting to changes in customer preferences, including the shifting of consumer purchasing practices towards e-commerce and other channels, and on successful new product development, including in the connected appliance space, and process development and product relaunches in response to such changes. Our future results and our ability to maintain or improve our competitive position will depend on our capacity to gauge the direction of our key product categories and geographic regions and upon our ability to successfully and timely identify, develop, manufacture, market, and sell new or improved products in these changing environments.
Our intellectual property rights are valuable, and any inability to protect them could reduce the value of our products, services and brands.
We consider our intellectual property rights, including patents, trademarks, copyrights and trade secrets, and the licenses we hold, to be a significant part and valuable aspect of our business. We attempt to protect our intellectual property rights through a combination of patent, trademark, copyright and trade secret laws, as well as licensing agreements and third party nondisclosure and assignment agreements. Our failure to obtain or adequately protect our trademarks, products, new features of our products, or our processes may diminish our competitiveness.
We have applied for intellectual property protection in the United States and other jurisdictions with respect to certain innovations and new products, design patents, product features, and processes. We cannot be assured that the U.S. Patent and Trademark Office or any similar authority in other jurisdictions will approve any of our patent applications. Additionally, the patents we own could be challenged or invalidated, others could design around our patents or the patents may not be of sufficient scope or strength to provide us with any meaningful protection or commercial advantage. Further, the laws of certain foreign countries in which we do business, or contemplate doing business in the future, do not recognize intellectual property rights or protect them to the same extent as United States law. As a result, these factors could weaken our competitive advantage with respect to our products, services, and brands in foreign jurisdictions, which could adversely affect our financial performance.
Moreover, while we do not believe that any of our products infringe on enforceable intellectual property rights of third parties, others may assert intellectual property rights that cover some of our technology, brands, products, or services. Any litigation regarding patents or other intellectual property could be costly and time-consuming and could divert the attention of our management and key personnel from our business operations. Claims of intellectual property infringement might also require us to enter into costly license agreements or modify our products or services. We also may be subject to significant damages, injunctions against development and sale of certain products or services, or limited in the use of our brands.
OPERATIONAL RISKS
We face risks associated with our acquisitions and other investments and risks associated with our increased presence in emerging markets.
From time to time, we make strategic acquisitions or divestitures, investments and participate in joint ventures. For example, we acquired Indesit and a majority interest in Hefei Sanyo in the fourth quarter of 2014, and we signed an agreement to sell our Embraco compressor business in 2018. These transactions, and other transactions that we have entered into or which we may enter into in the future, can involve significant challenges and risks, including
11
that the transaction does not advance our business strategy or fails to produce a satisfactory return on our investment. We may encounter difficulties in integrating acquisitions with our operations, applying our internal control processes to these acquisitions, managing strategic investments, and in overseeing the operations, systems and controls of acquired companies. For example, in 2017, we recorded an adjustment primarily for trade promotion accruals by our China business, which has been and remains subject to investigation by the relevant Chinese governmental authorities. We took certain remedial actions to strengthen internal controls as a result of our review of the conduct and processes involved. Integrating acquisitions and carving out divestitures is often costly and may require significant attention from management. Furthermore, we may not realize the degree, or timing, of benefits we anticipate when we first enter into a transaction. While our evaluation of any potential transaction includes business, legal and financial due diligence with the goal of identifying and evaluating the material risks involved, our due diligence reviews may not identify all of the issues necessary to accurately estimate the cost and potential loss contingencies of a particular transaction, including potential exposure to regulatory sanctions resulting from an acquisition target's previous activities or costs associated with any quality issues with an acquisition target's legacy products. In addition, liabilities may be retained by Whirlpool when closing a facility, divesting an entity or selling physical assets, and such liabilities may be material.
Our growth plans include efforts to increase revenue from emerging markets, including through acquisitions. Local business practices in these countries may not comply with U.S. laws, local laws or other laws applicable to us or our compliance policies, which non-compliant practices may result in increased liability risks. For example, we may incur unanticipated costs, expenses or other liabilities as a result of an acquisition target's violation of applicable laws, such as the U.S. Foreign Corrupt Practices Act (FCPA) or similar worldwide anti-bribery laws in non-U.S. jurisdictions. We may incur unanticipated costs or expenses, including post-closing asset impairment charges, expenses associated with eliminating duplicate facilities, litigation, and other liabilities. In addition, our recent and future acquisitions may increase our exposure to other risks associated with operating internationally, including foreign currency exchange rate fluctuations; political, legal and economic instability; inflation; changes in tax rates and tax laws; and work stoppages and labor relations.
Risks associated with our international operations may decrease our revenues and increase our costs.
For the year ended
December 31
,
2018
, international operations represent approximately
49%
of our net sales. We expect that international sales will continue to account for a significant percentage of our net sales. Accordingly, we face numerous risks associated with conducting international operations, any of which could negatively affect our financial performance. These risks include the following:
|
•
|
Political, legal, and economic instability and uncertainty
|
|
•
|
Foreign currency exchange rate fluctuations
|
|
•
|
Changes in foreign tax rules, regulations and other requirements, such as changes in tax rates and statutory and judicial interpretations of tax laws
|
|
•
|
Changes in diplomatic and trade relationships, including sanctions resulting from the current political situation in countries in which we do business
|
|
•
|
Inflation and/or deflation
|
|
•
|
Changes in foreign country regulatory requirements, including data privacy laws.
|
|
•
|
Various import/export restrictions and disruptions and the availability of required import/export licenses
|
|
•
|
Imposition of tariffs and other trade barriers
|
|
•
|
Managing widespread operations and enforcing internal policies and procedures such as compliance with U.S. and foreign anti-bribery, anti-corruption regulations and anti-money laundering, such as the FCPA, and antitrust laws
|
|
•
|
Labor disputes and work stoppages at our operations and suppliers
|
|
•
|
Government price controls
|
|
•
|
The inability to collect accounts receivable
|
12
|
•
|
Limitations on the repatriation or movement of earnings and cash
|
As a U.S. corporation, we are subject to the FCPA, which may place us at a competitive disadvantage to foreign companies that are not subject to similar regulations. Additionally, any determination that we have violated the FCPA or other anti-corruption laws could have a material adverse effect on us.
Terrorist attacks, cyber events, armed conflicts, civil unrest, natural disasters, governmental actions and epidemics could affect our domestic and international sales, disrupt our supply chain, and impair our ability to produce and deliver our products. Such events could directly impact our physical facilities or those of our suppliers or customers.
We may be subject to information technology system failures, network disruptions, cybersecurity attacks and breaches in data security, which may materially adversely affect our operations, financial condition and operating results.
We depend on information technology to improve the effectiveness of our operations and to interface with our customers, consumers and employees, as well as to maintain financial accuracy and efficiency. Our business processes and data sharing across functions, suppliers, and vendors is dependent on information technology integration. The failure of any systems, whether internal or third-party, during normal operation, system upgrades, implementations, or connections, could disrupt our operations by causing transaction errors, processing inefficiencies, delays or cancellation of customer orders, the loss of customers, impediments to the manufacture or shipment of products, other financial and business disruptions, or the loss of or damage to intellectual property and the personally identifiable data of consumers and employees.
In addition, we have outsourced certain information technology support services and administrative functions, such as system application maintenance and benefit plan administration, to third-party service providers and may outsource other functions in the future to achieve cost savings and efficiencies. If these service providers do not perform effectively, we may not achieve the expected cost savings and may incur additional costs to correct errors made by such service providers. Depending on the function involved, such errors may also lead to business disruption, processing inefficiencies or the loss of or damage to intellectual property and personally identifiable information through system compromise, or harm employee morale.
Our information systems, or those of our third-party service providers, could also be impacted by inappropriate or mistaken activity of parties intent on extracting or corrupting information or disrupting business processes. Such unauthorized access could disrupt our business and could result in the loss of assets. Cybersecurity attacks are becoming more sophisticated and include malicious software, attempts to gain unauthorized access to data, and other electronic security breaches that could lead to disruptions in critical systems, unauthorized release of confidential or otherwise protected information, and corruption of data. These events could impact our customers, consumers, employees, third-parties and reputation and lead to financial losses from remediation actions, loss of business or potential liability or an increase in expense, all of which may have a material adverse effect on our business.
Product-related liability or product recall costs could adversely affect our business and financial performance.
We may be exposed to product-related liabilities, which in some instances may result in product redesigns, product recalls, or other corrective action. In addition, any claim, product recall or other corrective action that results in significant adverse publicity, particularly if those claims or recalls cause customers to question the safety or reliability of our products, may negatively affect our business, financial condition, or results of operations. We maintain product liability insurance, but it may not be adequate to cover losses related to product liability claims brought against us. Product liability insurance could become more expensive and difficult to maintain and may not be available on commercially reasonable terms, if at all. We may be involved in class action litigation for which we generally have not purchased insurance, and may be involved in certain other product recalls or other litigations or events for which insurance products may have limitations.
13
We regularly engage in investigations of potential quality and safety issues as part of our ongoing effort to deliver quality products to our customers. We are currently investigating certain potential quality and safety issues, and as appropriate, we undertake to effect repair or replacement of appliances. Actual costs of these and any future issues depend upon several factors, including the number of consumers who respond to a particular recall, repair and administrative costs, whether the cost of any corrective action is borne by us or the supplier, and, if borne by us, whether we will be successful in recovering our costs from the supplier. The actual costs incurred as a result of these issues and any future issues could have a material adverse effect on our business, financial condition or results of operations.
The ability of suppliers to deliver parts, components and manufacturing equipment to our manufacturing facilities, and our ability to manufacture without disruption, could affect our global business performance.
We use a wide range of materials and components in the global production of our products, which come from numerous suppliers around the world. Because not all of our business arrangements provide for guaranteed supply and some key parts may be available only from a single supplier or a limited group of suppliers, we are subject to supply and pricing risk. In addition, certain proprietary component parts used in some of our products are provided by single-source unaffiliated third-party suppliers. We would be unable to obtain these proprietary components for an indeterminate period of time if these single-source suppliers were to cease or interrupt production or otherwise fail to supply these components to us, which could adversely affect our product sales and operating results. Our operations and those of our suppliers are subject to disruption for a variety of reasons, including work stoppages, labor relations, intellectual property claims against suppliers, information technology failures, and hazards such as fire, earthquakes, flooding, or other natural disasters. Insurance for certain disruptions may not be available, affordable or adequate. Such disruption could interrupt our ability to manufacture certain products. Any significant disruption could negatively impact our revenue and/or earnings performance.
Our ability to attract, develop and retain executives and other qualified employees is crucial to our results of operations and future growth.
We depend upon the continued services and performance of our key executives, senior management and skilled personnel, particularly professionals with experience in our business and operations and the home appliance industry. We cannot be sure that any of these individuals will continue to be employed by us. In the case of talent losses, significant time is required to hire, develop and train skilled replacement personnel. An inability to hire, develop, transfer retained knowledge, engage and retain a sufficient number of qualified employees could materially hinder our business by, for example, delaying our ability to bring new products to market or impairing the success of our operations.
A deterioration in labor relations could adversely impact our global business.
As of
December 31
,
2018
, we had approximately
92,000
employees. We are subject to separate collective bargaining agreements with certain labor unions, as well as various other commitments regarding our workforce. We periodically negotiate with certain unions representing our employees and may be subject to work stoppages or may be unable to renew collective bargaining agreements on the same or similar terms, or at all, all of which may also have a material adverse effect on our business, financial condition, or results of operations.
FINANCIAL RISKS
Fluctuations and volatility in the cost of raw materials and purchased components could adversely affect our operating results.
The sources and prices of the primary materials (such as steel, resins, and base metals) used to manufacture our products and components containing those materials are susceptible to significant global and regional price fluctuations due to supply/demand trends, transportation costs, labor costs, government regulations and tariffs, changes in currency exchange rates, price controls, the economic climate, and other unforeseen circumstances. For example, we experienced significant inflation in raw materials and certain manufactured components during 2018, which negatively impacted our operating results. Significant increases in these and other costs now and in the future could have a material adverse effect on our operating results.
14
Foreign currency fluctuations may affect our financial performance.
We generate a significant portion of our revenue and incur a significant portion of our expenses in foreign currencies. Changes in the exchange rates of functional currencies of those operations affect the U.S. dollar value of our revenue and earnings from our foreign operations. We use currency forwards, net investment hedges, and options to manage our foreign currency transaction exposures. We cannot completely eliminate our exposure to foreign currency fluctuations, which may adversely affect our financial performance. In addition, because our consolidated financial results are reported in U.S. dollars, if we generate sales or earnings in other currencies, the translation of those results into U.S. dollars can result in a significant increase or decrease in the amount of those sales or earnings. Finally, the amount of legal contingencies related to foreign operations may fluctuate significantly based upon changes in exchange rates and usually cannot be managed with currency forwards, options or other arrangements. Such fluctuations in exchange rates can significantly increase or decrease the amount of any legal contingency related to our foreign operations and make it difficult to assess and manage the potential exposure.
Goodwill and indefinite-life intangible asset impairment charges may adversely affect our operating results.
We have a substantial amount of goodwill and indefinite-life intangible assets, primarily trademarks, on our balance sheet. We test the goodwill and intangible assets for impairment on an annual basis and when events occur or circumstances change that indicate that the fair value of the reporting unit or intangible asset may be below its carrying amount. Fair value determinations require considerable judgment and are sensitive to inherent uncertainties and changes in estimates and assumptions regarding revenue growth rates, EBIT margins, capital expenditures, working capital requirements, tax rates, terminal growth rates, discount rates, royalty rates, benefits associated with a taxable transaction and synergistic benefits available to market participants. Declines in market conditions, a trend of weaker than anticipated financial performance for our reporting units or declines in projected revenue for our trademarks, a decline in our share price for a sustained period of time, an increase in the market-based weighted average cost of capital or a decrease in royalty rates, among other factors, are indicators that the carrying value of our goodwill or indefinite-life intangible assets may not be recoverable. We may be required to record a goodwill or intangible asset impairment charge that, if incurred, could have a material adverse effect on our financial condition and results of operations.
Impairment of long-lived assets may adversely affect our operating results.
Our long-lived asset groups are subject to an impairment assessment when certain triggering events or circumstances indicate that their carrying value may be impaired. If the carrying value exceeds our estimate of future undiscounted cash flows of the operations related to the asset group, an impairment is recorded for the difference between the carrying amount and the fair value of the asset group. The results of these tests for potential impairment may be adversely affected by unfavorable market conditions, our financial performance trends, or an increase in interest rates, among other factors. If as a result of the impairment test we determine that the fair value of any of our long-lived asset groups is less than its carrying amount, we may incur an impairment charge that could have a material adverse effect on our financial condition and results of operations.
We face inventory valuation risk.
We write down product and component inventories that have become obsolete or do not meet anticipated demand or net realizable value. No assurance can be given that, given the unpredictable pace of product obsolescence and business conditions with trade customers and in general, we will not incur additional inventory related charges. Such charges could negatively affect our financial condition and operating results.
We are exposed to risks associated with the uncertain global economy.
The current domestic and international political and economic environment are posing challenges to the industry in which we operate. A number of economic factors, including gross domestic product, availability of consumer credit, interest rates, consumer sentiment and debt levels, retail trends, housing starts, sales of existing homes, the level of mortgage refinancing and defaults, fiscal and credit market uncertainty, and foreign currency exchange rates, currency controls, inflation and deflation, generally affect demand for our products.
15
Economic uncertainty and related factors exacerbate negative trends in business and consumer spending and may cause certain customers to push out, cancel, or refrain from placing orders for our products. Uncertain market conditions, difficulties in obtaining capital, or reduced profitability may also cause some customers to scale back operations, exit markets, merge with other retailers, or file for bankruptcy protection and potentially cease operations, which can also result in lower sales and/or additional inventory. These conditions may similarly affect key suppliers, which could impair their ability to deliver parts and result in delays for our products or added costs. In addition, these conditions may lead to strategic alliances by, or consolidation of, other appliance manufacturers, which could adversely affect our ability to compete effectively.
A decline in economic activity and conditions in certain areas in which we operate have had an adverse effect on our financial condition and results of operations in recent years, and future declines and adverse conditions could have a similar adverse effect. Regional, political and economic instability in countries in which we do business may adversely affect business conditions, disrupt our operations, and have an adverse effect on our financial condition and results of operations. Uncertainty about future economic and industry conditions also makes it more challenging for us to forecast our operating results, make business decisions, and identify and prioritize the risks that may affect our businesses, sources and uses of cash, financial condition and results of operations. We may be required to implement additional cost reduction efforts, including restructuring activities, which may adversely affect our ability to capitalize on opportunities in a market recovery. In addition, our operations are subject to general credit, liquidity, foreign exchange, market and interest rate risks. Our ability to invest in our businesses, fund strategic acquisitions and refinance maturing debt obligations depends in part on access to the capital markets.
If we do not timely and appropriately adapt to changes resulting from the uncertain macroeconomic environment and industry conditions, or to difficulties in the financial markets, or if we are unable to continue to access the capital markets, our business, financial condition and results of operations may be materially and adversely affected.
Significant differences between actual results and estimates of the amount of future funding for our pension plans and postretirement health care benefit programs, and significant changes in funding assumptions or significant increases in funding obligations due to regulatory changes, could adversely affect our financial results.
We have both funded and unfunded defined benefit pension plans that cover certain employees around the world. We also have unfunded postretirement health care benefit plans for eligible retired employees. The Employee Retirement Income Security Act of 1974 (ERISA) and the Internal Revenue Code, as amended, govern the funding obligations for our U.S. pension plans, which are our principal pension plans. Our U.S. defined benefit plans were frozen on or before December 31, 2006 for substantially all participants. Since 2007, U.S. employees have been eligible for an enhanced employer contribution under Whirlpool's defined contribution (401(k)) plan.
As of
December 31
,
2018
, our projected benefit obligations under our pension plans and postretirement health and
welfare benefit programs exceeded the fair value of plan assets by an aggregate of approximately
$1.0 billion
, including
$0.6 billion
of which was attributable to pension plans and
$0.4 billion
of which was attributable to postretirement health care benefits. Estimates for the amount and timing of the future funding obligations of these pension plans and postretirement health and welfare benefit plans are based on various assumptions. These assumptions include discount rates, expected long-term rate of return on plan assets, life expectancies and health care cost trend rates. These assumptions are subject to change based on changes in interest rates on high quality bonds, stock and bond market returns, health care cost trend rates and regulatory changes, all of which are largely outside our control. Significant differences in results or significant changes in assumptions may materially affect our postretirement obligations and related future contributions and expenses.
LEGAL & COMPLIANCE RISKS
Unfavorable results of legal and regulatory proceedings could materially adversely affect our business and financial condition and performance.
We are subject to a variety of litigation and legal compliance risks relating to, among other things: products; intellectual property rights; income and non–income taxes; environmental matters; corporate matters; commercial matters; credit matters; competition laws; distribution, marketing and trade practice matters; anti–bribery and anti–corruption regulations; energy regulations; financial regulations; and employment and benefit matters. For example, we are currently disputing certain income and non-income tax related assessments issued by Brazilian authorities (see Note
7
and Note
14
to the Consolidated Financial Statements for additional information on these matters). Unfavorable outcomes regarding these assessments could have a material adverse effect on our financial
16
statements in any particular reporting period. Results of legal and regulatory proceedings cannot be predicted with certainty and for some matters, such as class actions, no insurance is cost effectively available. Regardless of merit, legal and regulatory proceedings may be both time-consuming and disruptive to our operations and could divert the attention of our management and key personnel from our business operations. Such proceedings could also generate significant adverse publicity and have a negative impact on our reputation and brand image, regardless of the existence or amount of liability. We estimate loss contingencies and establish accruals as required by generally accepted accounting principles, based on our assessment of contingencies where liability is deemed probable and reasonably estimable, in light of the facts and circumstances known to us at a particular point in time. Subsequent developments in legal proceedings, volatility in foreign currency exchange rates and other factors may affect our assessment and estimates of the loss contingency recorded and could result in an adverse effect on our results of operations in the period in which a liability would be recognized or cash flows for the period in which amounts would be paid. Actual results may significantly vary from our reserves.
We are subject to, and could be further subject to, governmental investigations or actions by other third parties.
We are subject to various federal, foreign and state laws, including antitrust and product-related laws and regulations, violations of which can involve civil or criminal sanctions. Responding to governmental investigations or other actions may be both time-consuming and disruptive to our operations and could divert the attention of our management and key personnel from our business operations. The impact of these and other investigations and lawsuits could have a material adverse effect on our financial position, liquidity and results of operations.
Changes in the legal and regulatory environment, including changes in taxes and tariffs, could limit our business activities, increase our operating costs, reduce demand for our products or result in litigation.
The conduct of our businesses, and the production, distribution, sale, advertising, labeling, safety, transportation and use of many of our products, are subject to various laws and regulations administered by federal, state and local governmental agencies in the United States, as well as to foreign laws and regulations administered by government entities and agencies in countries in which we operate. These laws and regulations may change, sometimes dramatically, as a result of political, economic or social events. Changes in laws, regulations or governmental policy and the related interpretations may alter the environment in which we do business and may impact our results or increase our costs or liabilities. In addition, we incur and will continue to incur capital and other expenditures to comply with various laws and regulations, especially relating to the protection of the environment, human health and safety and energy efficiency. These types of costs could adversely affect our financial performance. Additionally, we could be subjected to future liabilities, fines or penalties or the suspension of product production for failing to comply with various laws and regulations, including environmental regulations. Cleanup obligations that might arise
at any of our manufacturing sites or the imposition of more stringent environmental laws in the future could also adversely affect us.
Additionally, as a global company based in the United States, we are exposed to the impact of U.S. tax changes, especially those that affect the effective corporate income tax rate, including the recently enacted Tax Cuts and Jobs Act. In addition, the current domestic and international political environment, including government shutdowns and changes to U.S. policies related to global trade and tariffs, has resulted in uncertainty surrounding the future state of the global economy. The U.S. federal government may propose additional changes to international trade agreements, tariffs, taxes, and other government rules and regulations. These regulatory changes could significantly impact our business and financial performance. For additional information about our consolidated tax provision, see Note
14
to the Consolidated Financial Statements, and for additional information about global trade and tariffs, please see "Other Matters" in the Management's Discussion and Analysis section of this Annual Report on Form 10-K.
|
ITEM 1B.
|
UNRESOLVED STAFF COMMENTS
|
None.
17
|
ITEM 2.
|
PROPERTIES
|
Our principal executive offices are located in Benton Harbor, Michigan. On
December 31, 2018
, our principal manufacturing operations were carried on at
41
locations in 14 countries worldwide. We occupied a total of approximately
90.5 million
square feet devoted to manufacturing, service, sales and administrative offices, warehouse and distribution space. Over
46.6 million
square feet of such space was occupied under lease. Whirlpool properties include facilities which are suitable and adequate for the manufacture and distribution of Whirlpool's products.
The Company's principal manufacturing sites by operating segment were as follows:
|
Operating Segment
|
North America
|
Europe, Middle East and Africa
|
Latin America
(1)
|
Asia
|
|
Manufacturing Locations
|
10
|
13
|
13
|
5
|
(1)
Latin America operating segment includes two Embraco plants located in China and one located in Slovakia.
|
ITEM 3.
|
LEGAL PROCEEDINGS
|
Information regarding legal proceedings can be found in Note
7
to the Consolidated Financial Statements and is incorporated herein by reference.
|
ITEM 4.
|
MINE SAFETY DISCLOSURES
|
Not applicable.
18
|
PART II
|
||||
|
ITEM 5.
|
MARKET FOR REGISTRANT'S COMMON EQUITY, RELATED STOCKHOLDER MATTERS AND ISSUER PURCHASES OF EQUITY SECURITIES
|
Whirlpool's common stock is listed on the New York Stock Exchange and the Chicago Stock Exchange under the ticker symbol WHR. As of
February 8, 2019
, the number of holders of record of Whirlpool common stock was approximately
9,200
.
On
July 25, 2017
, our Board of Directors authorized an additional share repurchase program of up to
$2 billion
. For the year ended
December 31, 2018
, we repurchased
7,456,038
shares at an aggregate purchase price of approximately
$1.2 billion
under this program. At
December 31, 2018
, there were approximately
$800 million
in remaining funds authorized under this program.
Share repurchases are made from time to time on the open market as conditions warrant. These programs do not obligate us to repurchase any of our shares and they have no expiration date.
The following table summarizes repurchases of Whirlpool's common stock in the
three months ended
December 31, 2018
:
|
Period (Millions of dollars, except number and price per share)
|
Total Number of Shares Purchased
|
Average Price Paid per Share
|
Total Number of Shares Purchased as Part of Publicly Announced Plans or Programs
|
Approximate Dollar Value of Shares that May Yet Be Purchased Under the Plans
|
|||||
|
October 1, 2018 through October 31, 2018
|
—
|
|
$
|
—
|
—
|
|
$
|
850
|
|
|
November 1, 2018 through November 30, 2018
|
211,493
|
|
116.86
|
211,493
|
|
825
|
|
||
|
December 1, 2018 through December 31, 2018
|
210,183
|
|
120.26
|
210,183
|
|
$
|
800
|
|
|
|
Total
|
421,676
|
|
$
|
118.55
|
421,676
|
|
|||
19
|
ITEM 6.
|
SELECTED FINANCIAL DATA
|
FIVE-YEAR SELECTED FINANCIAL DATA
|
(Millions of dollars, except share and employee data)
|
2018
|
2017
|
2016
|
2015
|
2014
|
|||||||||||||||
|
CONSOLIDATED OPERATIONS
|
|
|
|
|
|
|||||||||||||||
|
Net sales
|
$
|
21,037
|
|
$
|
21,253
|
|
$
|
20,718
|
|
$
|
20,891
|
|
$
|
19,872
|
|
|||||
|
Restructuring costs
|
247
|
|
275
|
|
173
|
|
201
|
|
136
|
|
||||||||||
|
Impairment of goodwill and other intangibles
|
747
|
|
—
|
|
—
|
|
—
|
|
—
|
|
||||||||||
|
Depreciation and amortization
|
645
|
|
654
|
|
655
|
|
668
|
|
560
|
|
||||||||||
|
Operating profit
|
279
|
|
1,136
|
|
1,368
|
|
1,242
|
|
1,216
|
|
||||||||||
|
Earnings (loss) before income taxes and other items
|
(21
|
)
|
887
|
|
1,114
|
|
1,031
|
|
881
|
|
||||||||||
|
Net earnings (loss)
|
(159
|
)
|
337
|
|
928
|
|
822
|
|
692
|
|
||||||||||
|
Net earnings (loss) available to Whirlpool
|
(183
|
)
|
350
|
|
888
|
|
783
|
|
650
|
|
||||||||||
|
Capital expenditures
|
590
|
|
684
|
|
660
|
|
689
|
|
720
|
|
||||||||||
|
Dividends paid
|
306
|
|
312
|
|
294
|
|
269
|
|
224
|
|
||||||||||
|
Repurchase of common stock
|
1,153
|
|
750
|
|
525
|
|
250
|
|
25
|
|
||||||||||
|
CONSOLIDATED FINANCIAL POSITION
|
|
|
|
|
|
|||||||||||||||
|
Current assets
|
$
|
7,898
|
|
$
|
7,930
|
|
$
|
7,339
|
|
$
|
7,325
|
|
$
|
8,098
|
|
|||||
|
Current liabilities
|
9,678
|
|
8,505
|
|
7,662
|
|
7,744
|
|
8,403
|
|
||||||||||
|
Accounts receivable, inventories and accounts payable, net
|
256
|
|
856
|
|
918
|
|
746
|
|
778
|
|
||||||||||
|
Property, net
|
3,414
|
|
4,033
|
|
3,810
|
|
3,774
|
|
3,981
|
|
||||||||||
|
Total assets
|
18,347
|
|
20,038
|
|
19,153
|
|
19,010
|
|
20,002
|
|
||||||||||
|
Long-term debt
|
4,046
|
|
4,392
|
|
3,876
|
|
3,470
|
|
3,544
|
|
||||||||||
|
Total debt
(1)
|
6,027
|
|
5,218
|
|
4,470
|
|
3,998
|
|
4,347
|
|
||||||||||
|
Whirlpool stockholders' equity
|
2,291
|
|
4,198
|
|
4,773
|
|
4,743
|
|
4,885
|
|
||||||||||
|
PER SHARE DATA
|
|
|
|
|
|
|||||||||||||||
|
Basic net earnings (loss) available to Whirlpool
|
$
|
(2.72
|
)
|
$
|
4.78
|
|
$
|
11.67
|
|
$
|
9.95
|
|
$
|
8.30
|
|
|||||
|
Diluted net earnings (loss) available to Whirlpool
|
(2.72
|
)
|
4.70
|
|
11.50
|
|
9.83
|
|
8.17
|
|
||||||||||
|
Dividends
|
4.55
|
|
4.30
|
|
3.90
|
|
3.45
|
|
2.88
|
|
||||||||||
|
Book value
(2)
|
34.08
|
|
56.42
|
|
61.82
|
|
59.54
|
|
61.39
|
|
||||||||||
|
Closing Stock Price—NYSE
|
106.87
|
|
168.64
|
|
181.77
|
|
146.87
|
|
193.74
|
|
||||||||||
|
KEY RATIOS
|
|
|
|
|
|
|||||||||||||||
|
Operating profit margin
|
1.3
|
%
|
5.3
|
%
|
6.6
|
%
|
5.9
|
%
|
6.1
|
%
|
||||||||||
|
Pre-tax margin
(3)
|
(0.1
|
)%
|
4.2
|
%
|
5.4
|
%
|
4.9
|
%
|
4.4
|
%
|
||||||||||
|
Net margin
(4)
|
(0.9
|
)%
|
1.6
|
%
|
4.3
|
%
|
3.7
|
%
|
3.3
|
%
|
||||||||||
|
Return on average Whirlpool stockholders' equity
(5)
|
(5.6
|
)%
|
7.8
|
%
|
18.7
|
%
|
16.3
|
%
|
13.3
|
%
|
||||||||||
|
Return on average total assets
(6)
|
(1.0
|
)%
|
1.8
|
%
|
4.7
|
%
|
4.0
|
%
|
3.7
|
%
|
||||||||||
|
Current assets to current liabilities
|
0.8
|
|
0.9
|
|
1.0
|
|
0.9
|
|
1.0
|
|
||||||||||
|
Total debt as a percent of invested capital
(7)
|
65.3
|
%
|
50.4
|
%
|
43.8
|
%
|
41.2
|
%
|
42.9
|
%
|
||||||||||
|
Price earnings ratio
(8)
|
(39.3
|
)
|
35.9
|
|
15.8
|
|
14.9
|
|
23.7
|
|
||||||||||
|
OTHER DATA
|
|
|
|
|
|
|||||||||||||||
|
Common shares outstanding (in thousands):
|
||||||||||||||||||||
|
Average number-on a diluted basis
|
67,225
|
|
74,400
|
|
77,211
|
|
79,667
|
|
79,578
|
|
||||||||||
|
Year-end common shares outstanding
|
63,528
|
|
70,646
|
|
74,465
|
|
77,221
|
|
77,956
|
|
||||||||||
|
Year-end number of stockholders
|
9,248
|
|
9,960
|
|
10,528
|
|
10,663
|
|
11,225
|
|
||||||||||
|
Year-end number of employees
|
92,000
|
|
92,000
|
|
93,000
|
|
97,000
|
|
100,000
|
|
||||||||||
|
Five-year annualized total return to stockholders
(9)
|
(5.1
|
)%
|
13.0
|
%
|
33.6
|
%
|
13.0
|
%
|
22.0
|
%
|
||||||||||
(1) Total debt includes notes payable and current and long-term debt.
(2) Total Whirlpool stockholders' equity divided by average number of shares on a diluted basis.
(3) Earnings (loss) before income taxes, as a percent of net sales.
2018 includes the effect of a $747 million impairment charge of goodwill and other
intangibles and a $103 million charge related to the French Competition Authority (FCA) settlement agreement. See Note 5 and Note 7 to the Consolidated Financial Statements.
(4) Net earnings (loss) available to Whirlpool, as a percent of net sales.
2018 includes the effect of a $747 million impairment charge of goodwill and other
intangibles and a $103 million charge related to the FCA settlement agreement. See Note 5 and Note 7 to the Consolidated Financial Statements.
20
(5) Net earnings (loss) available to Whirlpool, divided by average Whirlpool stockholders' equity.
2018 includes the effect of a $747 million impairment
charge of goodwill and other intangibles and a $103 million charge related to the FCA settlement agreement. See Note 5 and Note 7 to the Consolidated
Financial Statements.
(6) Net earnings (loss) available to Whirlpool, divided by average total assets.
2018 includes the effect of a $747 million impairment charge of goodwill and
other intangibles and a $103 million charge related to the FCA settlement agreement. See Note 5 and Note 7 to the Consolidated Financial Statements.
(7) Total debt divided by total debt and total stockholders' equity.
(8) Closing stock price divided by diluted net earnings (loss) available to Whirlpool.
(9) Stock appreciation plus reinvested dividends, divided by share price at the beginning of the period.
21
|
ITEM 7.
|
MANAGEMENT'S DISCUSSION AND ANALYSIS OF FINANCIAL CONDITION AND RESULTS OF OPERATIONS
|
This Management Discussion and Analysis should be read in connection with the Consolidated Financial Statements, Notes to the Consolidated Financial Statements and Selected Financial Data included in this Form 10-K. Certain references to particular information in the Notes to the Consolidated Financial Statements are made to assist readers.
OVERVIEW
Whirlpool had a full-year GAAP net loss available to Whirlpool of $183 million compared to GAAP net earnings available to Whirlpool of $350 million in the same prior-year period. Non-recurring items negatively impacted full-year net loss available to Whirlpool by approximately $850 million, including asset impairment charges related to the EMEA region and a settlement with the French Competition Authority ("FCA").
Whirlpool delivered ongoing (non-GAAP) EBIT margin of 6.3% for the full-year, overcoming significant external challenges. These results were driven by positive global price/mix and strong cost discipline, which were offset by significant cost inflation and lower EMEA results. In addition, we delivered very strong cash provided by operating activities and free cash flow driven by sustainable working capital improvement and the timing of certain payments.
We are pleased with the successful execution of our cost-based price increases, delivering positive price/mix in all regions. In addition, we took strong actions to address the weaker than anticipated results in EMEA and offset significant cost and currency challenges.
We are confident that our strategy and actions will drive positive results in 2019 and remain committed to generating strong free cash flow and margin expansion.
22
MANAGEMENT'S DISCUSSION AND ANALYSIS OF FINANCIAL CONDITION AND
RESULTS OF OPERATIONS - (CONTINUED)
RESULTS OF OPERATIONS
The following table summarizes the consolidated results of operations:
|
December 31,
|
||||||||||||||||
|
Consolidated - In Millions (except per share data)
|
2018
|
Better/(Worse)
|
2017
|
Better/(Worse)
|
2016
|
|||||||||||
|
Units (in thousands)
|
68,440
|
|
(4.6)%
|
71,704
|
|
—%
|
71,692
|
|
||||||||
|
Net sales
|
$
|
21,037
|
|
(1.0)
|
$
|
21,253
|
|
2.6
|
$
|
20,718
|
|
|||||
|
Gross margin
|
3,537
|
|
(1.8)
|
3,602
|
|
(2.2)
|
3,692
|
|
||||||||
|
Selling, general and administrative
|
2,189
|
|
(3.6)
|
2,112
|
|
(1.5)
|
2,080
|
|
||||||||
|
Restructuring costs
|
247
|
|
10.0
|
275
|
|
(58.9)
|
173
|
|
||||||||
|
Impairment of goodwill and other intangibles
|
747
|
|
nm
|
—
|
|
—
|
—
|
|
||||||||
|
Interest and sundry (income) expense
|
108
|
|
(24.3)
|
87
|
|
6.5
|
93
|
|
||||||||
|
Interest expense
|
192
|
|
(18.2)
|
162
|
|
(0.7)
|
161
|
|
||||||||
|
Income tax expense
|
138
|
|
74.7
|
550
|
|
nm
|
186
|
|
||||||||
|
Net earnings (loss) available to Whirlpool
|
(183
|
)
|
nm
|
350
|
|
(60.6)
|
888
|
|
||||||||
|
Diluted net earnings (loss) available to Whirlpool per share
|
$
|
(2.72
|
)
|
nm
|
$
|
4.70
|
|
(59.1)%
|
$
|
11.50
|
|
|||||
nm: not meaningful
Consolidated net sales for
2018
decrease
d
1.0%
compared to
2017
, primarily driven by unit volume declines and unfavorable foreign currency, partially offset by favorable impacts from product price/mix. Excluding the impact of foreign currency, consolidated net sales for
2018
decreased 0.1%
compared to
2017
. Consolidated net sales for
2017
increased
2.6%
compared to
2016
primarily driven by favorable impacts from product price/mix and foreign currency. Excluding the impact of foreign currency, consolidated net sales for
2017
increased 1.5%
compared to
2016
.
Effective January 1, 2018, we realigned the composition of certain segments to align with our new leadership reporting structure. We now report our Mexico business as a part of our Latin America segment and have shifted certain adjacent business from the North America segment to the Asia segment. The determination of the Company's reportable segments was not affected by these changes. Prior year amounts have been reclassified to conform with current year presentation.
For additional information regarding non-GAAP financial measures including net sales excluding the impact of foreign currency, see the Non-GAAP Financial Measures section of this Management's Discussion and Analysis.
The chart below summarizes the balance of net sales by operating segments for
2018
,
2017
and
2016
, respectively.
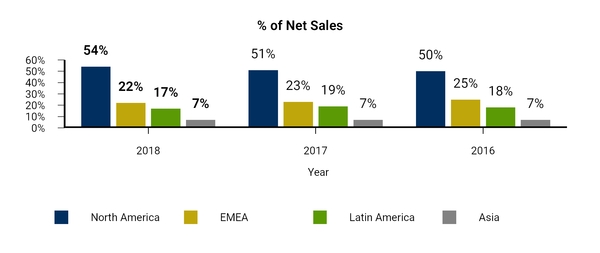
23
MANAGEMENT'S DISCUSSION AND ANALYSIS OF FINANCIAL CONDITION AND
RESULTS OF OPERATIONS - (CONTINUED)
The consolidated gross margin percentage for
2018
decreased to
16.8%
compared to 16.9% in
2017
, primarily driven by the unfavorable impact from raw material inflation across all regions, tariffs and higher freight costs in the North America region, lower unit volumes in the EMEA region, partially offset by the favorable impact of product price/mix and restructuring benefits. The consolidated gross margin percentage for 2017 decreased to 16.9% compared to 17.8% in 2016, primarily driven by unfavorable impacts from raw material inflation across all regions and product price/mix in the EMEA region, partially offset by cost productivity and restructuring benefits.
24
MANAGEMENT'S DISCUSSION AND ANALYSIS OF FINANCIAL CONDITION AND
RESULTS OF OPERATIONS - (CONTINUED)
North America
Following are the results for the North America region:
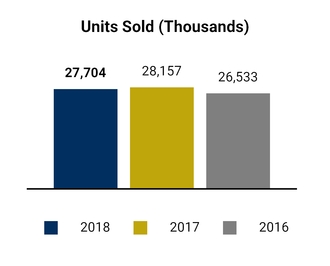
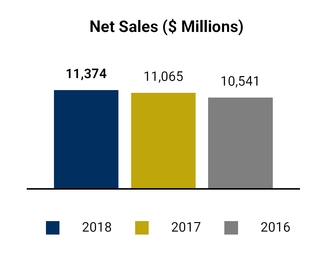
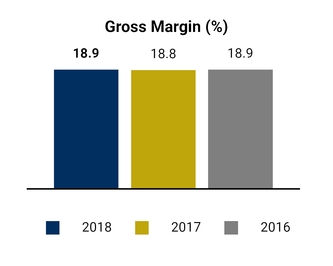
2018
compared to
2017
Units sold for
2018
decreased 1.6% compared to
2017
.
2017
compared to
2016
Units sold for
2017
increased 6.1% compared to
2016
.
2018
compared to
2017
Net sales for
2018
increased 2.8%
compared to
2017
primarily due to the favorable impact of product price/mix, partially offset by unit volume declines. Excluding the impact of foreign currency, net sales increased
2.8%
in
2018
.
2017
compared to
2016
Net sales for
2017
increased 5.0% compared to
2016
primarily due to unit volume growth. Excluding the impact of foreign currency, net sales increased 4.8% in
2017
.
2018
compared to
2017
Gross margin percentage for
2018
increased compared to
2017
primarily due to the favorable impact of product price/mix which was partially offset by raw material inflation, tariffs and higher freight costs.
2017
compared to
2016
Gross margin percentage for
2017
decreased compared to
2016
primarily due to raw material inflation, partially offset by unit volume growth and favorable cost productivity.
25
MANAGEMENT'S DISCUSSION AND ANALYSIS OF FINANCIAL CONDITION AND
RESULTS OF OPERATIONS - (CONTINUED)
EMEA
Following are the results for the EMEA region:
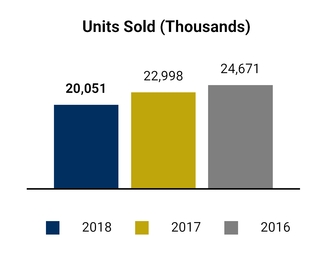
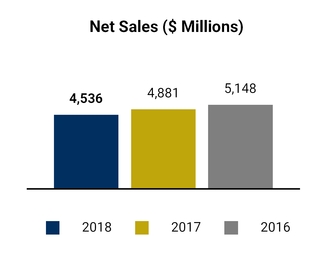
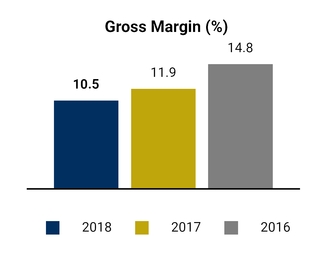
2018
compared to
2017
Units sold for
2018
decreased 12.8% compared to
2017
.
2017
compared to
2016
Units sold for
2017
decreased 6.8% compared to
2016
.
2018
compared to
2017
Net sales for
2018
decreased 7.1%
compared to
2017
primarily due to unit volume declines, partially offset by the favorable impacts of product/price mix and foreign currency. Excluding the impact of foreign currency, net sales decreased
8.5%
in
2018
.
2017
compared to
2016
Net sales for
2017
decreased 5.2% compared to
2016
, primarily due to unit volume declines, partially offset by a favorable impact from foreign currency. Excluding the impact of foreign currency, net sales decreased 6.8% in
2017
.
2018
compared to
2017
Gross margin percentage for
2018
decreased compared to
2017
primarily due to the unfavorable productivity from unit volume declines and raw material inflation, partially offset by the favorable impact of product price/mix and foreign currency.
2017
compared to
2016
Gross margin percentage for
2017
decreased compared to
2016
primarily due to unfavorable impacts of product price/mix, unit volume declines and raw material inflation, partially offset by cost productivity and restructuring benefits.
26
MANAGEMENT'S DISCUSSION AND ANALYSIS OF FINANCIAL CONDITION AND
RESULTS OF OPERATIONS - (CONTINUED)
Latin America
Following are the results for the Latin America Region:
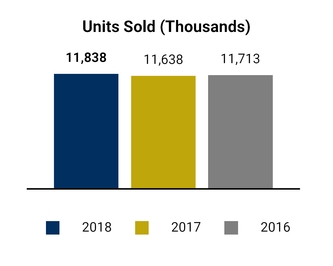
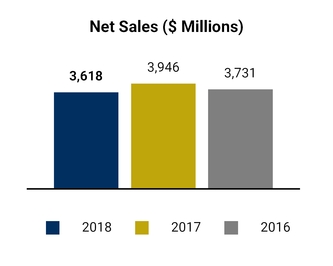

2018
compared to
2017
Units sold for
2018
increased 1.7% compared to
2017
.
2017
compared to
2016
Units sold for
2017
decreased 0.6% compared to
2016
.
2018
compared to
2017
Net sales for
2018
decreased 8.3%
compared to
2017
primarily due to the unfavorable impacts of foreign currency and product price/mix, partially offset by unit volume growth. Excluding the impact of foreign currency, net sales
decreased 2.4%
in
2018
.
2017
compared to
2016
Net sales for
2017
increased 5.8% compared to
2016
primarily due to the favorable impacts of foreign currency, unit volume growth, product price/mix and the sale and monetization of certain tax credits. Excluding the impact of foreign currency, net sales increased 2.5% in
2017
.
2018
compared to
2017
Gross margin percentage for
2018
decreased compared to
2017
primarily due to raw material inflation and foreign currency impacts, partially offset by the favorable impact of product price/mix. The prior period was positively impacted by the sale and monetization of certain tax credits.
2017
compared to
2016
Gross margin percentage for
2017
increased compared to
2016
primarily due to favorable cost productivity and the sale and monetization of certain tax credits, partially offset by raw material inflation.
27
MANAGEMENT'S DISCUSSION AND ANALYSIS OF FINANCIAL CONDITION AND
RESULTS OF OPERATIONS - (CONTINUED)
Asia
Following are the results of the Asia region:
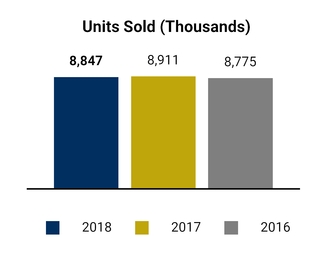
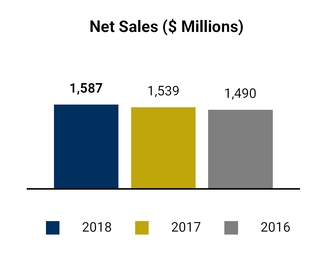
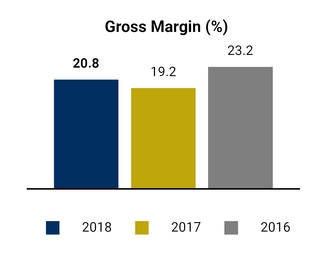
2018
compared to
2017
Units sold for
2018
decreased 0.7% compared to
2017
.
2017
compared to
2016
Units sold for
2017
increased 1.5% compared to
2016
.
2018
compared to
2017
Net sales for
2018
increased 3.2%
compared to
2017
primarily due to the favorable impacts of product price/mix, partially offset by the unfavorable impacts of foreign currency and unit volume declines. Excluding the impact of foreign currency, net sales increased by
4.5%
in
2018
.
2017
compared to
2016
Net sales for
2017
increased 3.3% compared to
2016
primarily due to the favorable impacts of product price/mix and unit volume growth. Excluding the impact of foreign currency, net sales increased 3.2% in
2017
.
2018
compared to
2017
Gross margin percentage increased in
2018
compared to
2017
, primarily due to the favorable impacts of product price/mix and cost productivity, partially offset by raw material inflation and foreign currency impacts. The gross margin in 2017 also includes an adjustment related to trade promotion accruals in prior periods.
2017
compared to
2016
Gross margin percentage decreased in
2017
compared to
2016
, primarily due to raw material inflation, partially offset by restructuring benefits, favorable cost productivity, unit volume growth and a favorable impact of Chinese government incentives. Additionally, gross margin also includes an adjustment primarily related to trade promotion accruals in prior periods.
28
MANAGEMENT'S DISCUSSION AND ANALYSIS OF FINANCIAL CONDITION AND
RESULTS OF OPERATIONS - (CONTINUED)
Selling, General and Administrative
The following table summarizes selling, general and administrative expenses as a percentage of sales by operating segment:
|
December 31,
|
|||||||||||||||||||||
|
Millions of dollars
|
2018
|
As a %
of Net Sales |
2017
|
As a %
of Net Sales |
2016
|
As a %
of Net Sales |
|||||||||||||||
|
North America
|
$
|
787
|
|
6.9
|
%
|
$
|
751
|
|
6.8
|
%
|
$
|
742
|
|
7.0
|
%
|
||||||
|
EMEA
|
564
|
|
12.4
|
557
|
|
11.4
|
577
|
|
11.2
|
||||||||||||
|
Latin America
|
369
|
|
10.2
|
356
|
|
9.0
|
330
|
|
8.8
|
||||||||||||
|
Asia
|
244
|
|
15.4
|
258
|
|
16.8
|
231
|
|
15.5
|
||||||||||||
|
Corporate/other
|
225
|
|
—
|
190
|
|
—
|
200
|
|
—
|
||||||||||||
|
Consolidated
|
$
|
2,189
|
|
10.4
|
%
|
$
|
2,112
|
|
9.9
|
%
|
$
|
2,080
|
|
10.0
|
%
|
||||||
Consolidated selling, general and administrative expenses as a percent of consolidated net sales in
2018
increased compared to 2017 due to expenses related to the bad debt expense from a Brazilian retailer, expenses related to the pending sale of the Embraco compressor business and the negative impact of unit volume declines. Consolidated selling, general and administrative expenses as a percent of consolidated net sales in
2017
remained flat compared to
2016
.
Restructuring
We incurred restructuring charges of
$247 million
,
$275 million
and
$173 million
for the years ended
December 31
,
2018
,
2017
and
2016
, respectively. For the full year 2019, we expect to incur up to $100 million of restructuring charges, as we reduce fixed costs primarily in the EMEA region.
For additional information about restructuring activities, see Note
13
to the Consolidated Financial Statements.
Impairment of Goodwill and Other Intangibles
We recorded an impairment charge of $747 million related to goodwill ($579 million) and other intangibles ($168 million) for the
twelve months ended
December 31, 2018
related to the EMEA reporting unit.
For additional information, see Note
5
and Note
10
to the Consolidated Financial Statements and the Critical Accounting Policies and Estimates section of this Management's Discussion and Analysis.
Interest and Sundry (Income) Expense
Interest and sundry (income) expenses were
$108 million
,
$87 million
and
$93 million
for the years ended
December 31
,
2018
,
2017
and
2016
, respectively. Interest and sundry (income) expense
increase
d
$21 million
in 2018 compared to
2017
, primarily due to the French Competition Authority (FCA) settlement agreement, partially offset by Latin America tax credits and a favorable impact from foreign currency. During
2017
, interest and sundry (income) expense
decrease
d
$6 million
compared to
2016
, primarily due to a favorable impact from foreign currency.
Interest Expense
Interest expense was
$192 million
,
$162 million
and
$161 million
for the years ended
December 31
,
2018
,
2017
and
2016
, respectively. Interest expense increased by $
30 million
in 2018 compared to
2017
. This was primarily due to higher average debt and notes payable balances and higher average interest rates. During
2017
, interest expense
increase
d by
$1 million
compared to 2016. This was primarily due to higher average long-term debt balances.
Income Taxes
Income tax expense was
$138 million
,
$550 million
and
$186 million
for the years ended
December 31
,
2018
,
2017
and
2016
, respectively. The decrease in tax expense in
2018
compared to
2017
is primarily due to lower level of earnings, the reduction in statutory U.S. tax rate from 35% to 21%, impact of non deductible goodwill impairments and government payment accruals, valuation allowances and tax planning actions.
29
MANAGEMENT'S DISCUSSION AND ANALYSIS OF FINANCIAL CONDITION AND
RESULTS OF OPERATIONS - (CONTINUED)
The increase in tax expense in
2017
compared to
2016
is primarily due to the one-time charge of approximately $420 million as result of the enactment of the Tax Cuts and Jobs Act, including the impact from a reduced tax rate on the valuations of deferred tax assets, the one-time deemed repatriation tax and other related items. Excluding the impact from tax reform, the decrease in tax expense compared to 2016 is primarily due to increased tax planning benefits.
For additional information about our consolidated tax provision, see Note
14
to the Consolidated Financial Statements.
FORWARD-LOOKING PERSPECTIVE
Full year 2019 guidance measures of GAAP earnings per diluted share and free cash flow do not reflect the anticipated gain on sale and, in the case of free cash flow, proceeds from the sale of the Embraco compressor business. The final amounts are subject to a number of variables that are subject to change, including the net book value of held for sale assets, closing costs, taxes and customary adjustments for indebtedness, cash and working capital at closing.
Earnings per diluted share presented below are net of tax, while each adjustment is presented on a pre-tax basis. The aggregate income tax impact of the taxable components of each adjustment is presented in the income tax impact line item at our anticipated
2019
full-year tax rate between 15% and 20%. We currently estimate earnings per diluted share and industry demand for
2019
to be within the following ranges:
|
2019
|
|||
|
Current Outlook
|
|||
|
Estimated earnings per diluted share, for the year ending December 31, 2019
|
$12.75
|
—
|
$13.75
|
|
Including:
|
|||
|
Restructuring Expense
|
$(1.55)
|
||
|
Income Tax Impact
|
$0.30
|
||
|
Industry demand
|
|||
|
North America
(1)
|
0%
|
—
|
1%
|
|
EMEA
|
(1)%
|
—
|
1%
|
|
Latin America
(2)
|
~ 5%
|
||
|
Asia
|
1%
|
—
|
2%
|
(1)
Reflects industry demand in the United States.
(2)
Reflects industry demand in Brazil.
For the full-year
2019
, we expect to generate cash from operating activities of $1.4 billion to $1.5 billion and free cash flow of approximately $800 million to $900 million, including restructuring cash outlays of up to $100 million and, with respect to free cash flow, capital expenditures of approximately $625 million.
The table below reconciles projected
2019
cash provided by operating activities determined in accordance with GAAP to free cash flow, a non-GAAP measure. Management believes that free cash flow provides stockholders with a relevant measure of liquidity and a useful basis for assessing Whirlpool's ability to fund its activities and obligations. There are limitations to using non-GAAP financial measures, including the difficulty associated with comparing companies that use similarly named non-GAAP measures whose calculations may differ from our calculations. We define free cash flow as cash provided by continuing operations less capital expenditures and including proceeds from the sale of assets/businesses, and changes in restricted cash. The change in restricted cash relates to the private placement funds paid by Whirlpool to acquire majority control of Whirlpool China (formerly Hefei Sanyo) in 2014 and which are
used to fund capital expenditures and technical resources to enhance Whirlpool China's research and development and working capital, as required by the terms of the Hefei Sanyo acquisition completed in October 2014.
For additional information regarding non-GAAP financial measures, see the Non-GAAP Financial Measures section of Management's Discussion and Analysis.
30
MANAGEMENT'S DISCUSSION AND ANALYSIS OF FINANCIAL CONDITION AND
RESULTS OF OPERATIONS - (CONTINUED)
|
2019
|
|||||||
|
Millions of dollars
|
Current Outlook
|
||||||
|
Cash provided by operating activities
(1)
|
$
|
1,425
|
|
—
|
$
|
1,525
|
|
|
Capital expenditures, proceeds from sale of assets/businesses and changes in restricted cash
|
~ (625)
|
||||||
|
Free cash flow
|
$
|
800
|
|
—
|
$
|
900
|
|
(1)
Financial guidance on a GAAP basis for cash provided by (used in) financing activities and cash provided by (used in) investing activities has not been provided because in order to prepare any such estimate or projection, the Company would need to rely on market factors and certain other conditions and assumptions that are outside of its control.
The projections above are based on many estimates and are inherently subject to change based on future decisions made by management and the Board of Directors of Whirlpool, and significant economic, competitive and other uncertainties and contingencies.
NON-GAAP FINANCIAL MEASURES
We supplement the reporting of our financial information determined under U.S. generally accepted accounting principles (GAAP) with certain non-GAAP financial measures, some of which we refer to as "ongoing" measures, including:
|
•
|
Earnings before interest and taxes (EBIT)
|
|
•
|
Ongoing EBIT
|
|
•
|
Ongoing EBIT margin
|
|
•
|
Sales excluding currency
|
|
•
|
Ongoing net sales
|
|
•
|
Free cash flow
|
Ongoing measures exclude items that may not be indicative of, or are unrelated to, results from our ongoing operations and provide a better baseline for analyzing trends in our underlying businesses. Ongoing EBIT margin is calculated by dividing ongoing EBIT by net sales for 2018 and ongoing net sales for 2017. Ongoing net sales for 2017 excludes $32 million primarily related to an adjustment for trade promotion accruals in prior periods. Sales excluding foreign currency is calculated by translating the current period net sales, in functional currency, to U.S. dollars using the prior-year period's exchange rate compared to the prior-year period net sales. Management believes that sales excluding foreign currency provides stockholders with a clearer basis to assess our results over time, excluding the impact of exchange rate fluctuations. We also disclose segment EBIT, which we define as operating profit less interest and sundry (income) expense, and ongoing segment EBIT as important financial metrics used by the Company's Chief Operating Decision Maker to evaluate performance and allocate resources in accordance with ASC 280 - Segment Reporting. The Company provides free cash flow related metrics, such as free cash flow as a percentage of net sales, as long-term management goals, not an element of its annual financial guidance, and as such does not provide a reconciliation of free cash flow to cash provided by (used in) operating activities, the most directly comparable GAAP measure, for these long-term goal metrics. Any such reconciliation would rely on market factors and certain other conditions and assumptions that are outside of the Company's control.
We believe that these non-GAAP measures provide meaningful information to assist investors and stockholders in understanding our financial results and assessing our prospects for future performance, and reflect an additional way of viewing aspects of our operations that, when viewed with our GAAP financial measures, provide a more complete understanding of our business. Because non-GAAP financial measures are not standardized, it may not be possible to compare these financial measures with other companies' non-GAAP financial measures having the same or similar names. These non-GAAP financial measures should not be considered in isolation or as a substitute for reported net earnings available to Whirlpool, net sales, and cash provided by (used in) operating activities, the most directly comparable GAAP financial measures. We strongly encourage investors and stockholders to review our financial statements and publicly-filed reports in their entirety and not to rely on any single financial measure.
Please refer to a reconciliation of these non-GAAP financial measures to the most directly comparable GAAP financial measures below.
31
MANAGEMENT'S DISCUSSION AND ANALYSIS OF FINANCIAL CONDITION AND
RESULTS OF OPERATIONS - (CONTINUED)
|
Ongoing Earnings Before Interest & Taxes (EBIT) Reconciliation:
in millions
|
Twelve Months Ended December 31,
|
||||||||
|
2018
|
2017
|
2016
|
|||||||
|
Net earnings (loss) available to Whirlpool
|
$
|
(183
|
)
|
$
|
350
|
|
$
|
888
|
|
|
Net earnings (loss) available to noncontrolling interests
|
24
|
|
(13
|
)
|
40
|
|
|||
|
Income tax expense
|
138
|
|
550
|
|
186
|
|
|||
|
Interest expense
|
192
|
|
162
|
|
161
|
|
|||
|
Earnings before interest & taxes
|
$
|
171
|
|
$
|
1,049
|
|
$
|
1,275
|
|
|
Restructuring expense
|
247
|
|
275
|
|
173
|
|
|||
|
France antitrust settlement
|
103
|
|
—
|
|
—
|
|
|||
|
Impairment of goodwill and intangibles
|
747
|
|
—
|
|
—
|
|
|||
|
Trade customer insolvency
|
30
|
|
—
|
|
—
|
|
|||
|
Divestiture related transition costs
|
21
|
|
—
|
|
—
|
|
|||
|
Out-of-period adjustment
|
—
|
|
40
|
|
—
|
|
|||
|
Legacy product warranty and liability expense
|
—
|
|
—
|
|
(23
|
)
|
|||
|
Acquisition related transition costs
|
—
|
|
—
|
|
86
|
|
|||
|
Ongoing EBIT
|
$
|
1,319
|
|
$
|
1,364
|
|
$
|
1,511
|
|
|
Free Cash Flow (FCF) Reconciliation:
in millions
|
Twelve Months Ended December 31,
|
||
|
2018
|
2017
|
2016
|
|
|
Cash provided by operating activities
|
$1,229
|
$1,264
|
$1,203
|
|
Capital expenditures
|
(590)
|
(684)
|
(660)
|
|
Proceeds from sale of assets and businesses
|
160
|
61
|
63
|
|
Change in restricted cash
(1)
|
54
|
66
|
24
|
|
Free cash flow
|
$853
|
$707
|
$630
|
(1)
For additional information regarding restricted cash, see Note
3
to the Consolidated Financial Statements.
FINANCIAL CONDITION AND LIQUIDITY
Our objective is to finance our business through operating cash flow and the appropriate mix of long-term and short-term debt. By diversifying the maturity structure, we avoid concentrations of debt and reduce liquidity risk. We have varying needs for short-term working capital financing as a result of the nature of our business. We regularly review our capital structure and liquidity priorities, which include funding the business through capital and research and development spending to support innovation and productivity initiatives, funding our pension plan and term debt liabilities, providing return to shareholders and potential acquisitions.
Our short term potential uses of liquidity include funding our ongoing capital spending, restructuring activities, and returns to shareholders. We also have
$947 million
of term debt maturing in the next twelve months, and are currently evaluating our options, which may include repayment through refinancing, free cash flow generation, or cash on hand.
Notes payable consists of short-term borrowings payable to banks or commercial paper, which are generally used to fund working capital requirements. As of December 31, 2018, we have $1,034 million of notes payable outstanding which consists of short-term borrowings payable to banks. We have no commercial paper outstanding at December 31, 2018. See Note 6 to the Consolidated Financial Statements for additional information.
Whirlpool of India Limited (Whirlpool India), a majority-owned subsidiary of Whirlpool Corporation, announced in June 2018 that it had reached an agreement to acquire a 49% equity interest in Elica PB India. As part of the agreement, Whirlpool India received an option to acquire the remaining equity interest in the future for fair value, and the non-Whirlpool India shareholders of Elica PB India received an option to sell their remaining equity interest to Whirlpool India in the future for fair value, which could be material to the financial statements depending on the performance of the venture. This transaction closed in the third quarter of 2018.
32
MANAGEMENT'S DISCUSSION AND ANALYSIS OF FINANCIAL CONDITION AND
RESULTS OF OPERATIONS - (CONTINUED)
We monitor the credit ratings and market indicators of credit risk of our lending, depository, and derivative counterparty banks regularly, and take certain action to manage credit risk. We diversify our deposits and investments in short-term cash equivalents to limit the concentration of exposure by counterparty.
As of
December 31, 2018
, we had cash or cash equivalents greater than 1% of our consolidated assets in China and Brazil, which represented 3.2% and 1.4%, respectively. In addition, we did not have any third-party accounts receivable greater than 1% of our consolidated assets in any single country outside of the United States, with the exception of Italy and Mexico, which represented 1.3% and 1.1%, respectively. We continue to monitor general financial instability and uncertainty globally.
The Company had cash and cash equivalents of approximately
$1.5 billion
at
December 31, 2018
, of which substantially all was held by subsidiaries in foreign countries. For each of its foreign subsidiaries, the Company makes an assertion regarding the amount of earnings intended for permanent reinvestment, with the balance available to be repatriated to the United States. The cash held by foreign subsidiaries for permanent reinvestment is generally used to finance the subsidiaries' operational activities and future foreign investments. Our intent is to permanently reinvest these funds outside of the United States and our current plans do not demonstrate a need to repatriate the cash to fund our U.S. operations. However, if these funds were repatriated, we would be required to accrue and pay applicable United States taxes (if any) and withholding taxes payable to various countries. It is not practical to estimate the amount of the deferred tax liability associated with the repatriation of cash due to the complexity of its hypothetical calculation.
We continue to review customer conditions globally. As of December 31, 2018, we had 286 million reais (approximately $74 million) in short and long-term receivables due to us from Maquina de Vendas S.A. In 2018, as part of their extrajudicial recovery plan, we agreed to receive payment of our outstanding receivable, plus interest, over eight years under a tiered payment schedule. As of December 31, 2018, we have 127 million reais (approximately $32 million) of insurance against this credit risk through policies purchased from high-quality underwriters.
On October 15, 2018, Sears Holdings Corporation ("Sears") announced that it had filed for bankruptcy protection. As of December 31, 2018, we had an immaterial accounts receivable and inventory exposure related to Sears. We believe the Sears bankruptcy will have a very limited short-term impact on our results of operations as consumers adjust to the new retail landscape. Furthermore, we do not believe that the bankruptcy will materially impact our financial results over the long term.
In the past, when faced with a potential volume reduction from any one particular segment of our trade distribution network, we generally have been able to offset such declines through increased sales throughout our broad distribution network.
For additional information on transfers and servicing of financial assets, accounts payable outsourcing and guarantees, see Note 1 and Note 7 to the Consolidated Financial Statements. For additional information on guarantees, see Note
7
to the Consolidated Financial Statements.
Embraco Sale Transaction
On April 24, 2018, we and certain of our subsidiaries entered into a purchase agreement with Nidec Corporation, a leading manufacturer of electric motors incorporated under the laws of Japan, to sell our Embraco business unit.
Pursuant to the purchase agreement, at the closing of the transaction, Nidec will pay a purchase price of approximately $1.08 billion for the sale of Embraco. The purchase price is subject to customary adjustments including for indebtedness, cash and working capital of Embraco at closing. Whirlpool has agreed to retain certain liabilities relating to tax, environmental, labor and products following closing of the transaction. The purchase agreement contains customary representations, conditions, warranties and covenants of the parties, including the requirement to obtain necessary antitrust approvals, which have been received in the U.S., Brazil and China, and are still being considered in Europe and certain other jurisdictions.
The purchase agreement contains a closing deadline of April 24, 2019. In the unlikely event that closing does not occur by the closing deadline, the agreement permits closing up to six months later. The specific rights and obligations of the parties can be found in the purchase agreement, which is incorporated by reference into Exhibit 2(i) to this annual report of Form 10-K.
For additional information on the Embraco sale transaction, see Note
16
to the Consolidated Financial Statements.
33
MANAGEMENT'S DISCUSSION AND ANALYSIS OF FINANCIAL CONDITION AND
RESULTS OF OPERATIONS - (CONTINUED)
Share Repurchase Program
For additional information about our share repurchase program, see Note
11
to the Consolidated Financial Statements.
Sources and Uses of Cash
We met our cash needs during
2018
through cash flows from operations, cash and cash equivalents, and financing arrangements. Our cash, cash equivalents and restricted cash at
December 31, 2018
increased $245 million compared to the same period in
2017
.
The following table summarizes the net increase (decrease) in cash, cash equivalents and restricted cash for the periods presented. Significant drivers of changes in our cash and cash equivalents balance during
2018
are discussed below:
Cash Flow Summary
|
Millions of dollars
|
2018
|
2017
|
2016
|
|||||||||
|
Cash provided by (used in):
|
||||||||||||
|
Operating activities
|
$
|
1,229
|
|
$
|
1,264
|
|
$
|
1,203
|
|
|||
|
Investing activities
|
(399
|
)
|
(721
|
)
|
(612
|
)
|
||||||
|
Financing activities
|
(518
|
)
|
(553
|
)
|
(278
|
)
|
||||||
|
Effect of exchange rate changes
|
(67
|
)
|
63
|
|
(36
|
)
|
||||||
|
Net increase in cash, cash equivalents and restricted cash
|
$
|
245
|
|
$
|
53
|
|
$
|
277
|
|
|||
Cash Flows from Operating Activities
The decrease in cash provided by operating activities during
2018
primarily reflects $350 million of discretionary pension funding, partially offset by the working capital impact from inventory reduction efforts, lower volumes and credit management activities. Net loss includes the non-cash impacts from impairment of goodwill and other intangibles.
The increase in cash provided by operating activities during 2017 was primarily driven by effective credit management, improvement in working capital and lower cash expenditures related to legacy product corrective action, partially offset by lower net earnings.
Cash provided by operating activities in 2016 reflects strong cash earnings and effective credit management and the impact of cash expenditures related to legacy product corrective action.
The timing of cash flows from operations varies significantly throughout the year primarily due to changes in production levels, sales patterns, promotional programs, funding requirements, credit management, as well as receivable and payment terms. Depending on the timing of cash flows, the location of cash balances, as well as the liquidity requirements of each country, external sources of funding are used to support working capital requirements.
Cash Flows from Investing Activities
The decrease in cash used in investing activities during
2018
primarily reflects a decrease in capital expenditures (approximately $95 million), proceeds from a real estate sale-leaseback transaction (approximately $130 million) and the proceeds related to held-to-maturity securities (approximately $60 million).
The increase in cash used in investing activities during 2017 primarily reflects an increase in capital expenditures (approximately $25 million) and the net impact of purchases (approximately $170 million) and proceeds (approximately $110 million) related to held-to-maturity securities.
Cash used in investing activities in 2016 primarily reflects capital expenditures (approximately $660 million).
34
MANAGEMENT'S DISCUSSION AND ANALYSIS OF FINANCIAL CONDITION AND
RESULTS OF OPERATIONS - (CONTINUED)
In June 2016, Whirlpool China Co., Ltd. ("Whirlpool China"), our majority-owned indirect subsidiary, entered into an agreement to return land use rights for land now occupied by two Whirlpool China plants in Hefei, China to a division of the Hefei municipal government. The aggregate price for the return of land use rights was approximately RMB 687 million (approximately $103 million as of June 27, 2016). Whirlpool China received RMB 127 million (approximately $20 million) in 2018 and RMB 280 million (approximately $42 million) in 2017 and 2016. The related cash flow impact from these transactions is included in investing activities in each respective year.
Cash Flows from Financing Activities
The decrease in cash used in financing activities during
2018
primarily reflects higher proceeds from borrowings of short-term debt (increase of approximately $300 million) and lower repayments of long-term debt (decrease of approximately $175 million), partially offset by higher share repurchase activity (increase of approximately $400 million). We also acquired the remaining minority interest in a subsidiary.
Cash used in financing activities during
2017
primarily reflects share repurchase activity and proceeds from borrowings (short-term and long-term) and repayments of long-term debt. The increase in cash used in financing activities in 2017 compared to 2016 was primarily due to higher share repurchase activity (increase of approximately $225 million).
Cash used in financing activities during 2016 primarily reflects share repurchase activity and proceeds from borrowings (short-term and long-term) and repayments of long-term debt.
Dividends paid in financing activities approximated $300 million during 2018, 2017 and 2016.
Whirlpool Subsidiary Share Repurchase
On July 12, 2016, Whirlpool S.A. ("WHR SA") and Brasmotor S.A. ("BMT"), both majority-owned indirect subsidiaries of Whirlpool Corporation, issued public announcements in Brazil reporting that Whirlpool do Brasil Ltda., the controlling shareholder of both WHR SA and BMT, intended to acquire the outstanding common and preferred shares of WHR SA and BMT by means of tender offers for the publicly-held shares. At that time, Whirlpool do Brasil Ltda. and other Whirlpool entities held 99.20% of the common and 95.68% of the preferred shares of WHR SA and 99.40% of the common and 93.55% of the preferred shares of BMT. The tender offers were launched in November 2016 and concluded in December 2016. The offer for BMT was successful and the squeeze-out was completed in January 2017 at a total cost of approximately $31 million. The WHR SA tender offer was abandoned because the minimum number of interested minority shareholders was not obtained.
Financing Arrangements
The Company had total committed credit facilities of approximately $3.5 billion as of
December 31, 2018
. The facilities reflect the Company's growing global operations. The Company believes these facilities are sufficient to support its global operations.
We had
no
borrowings outstanding under the committed credit facilities at
December 31, 2018
and
2017
, respectively.
For additional information about our financing arrangements, see Note
6
to the Consolidated Financial Statements.
Dividends
In April 2018, our Board of Directors approved a 4.5% increase in our quarterly dividend on our common stock to $1.15 per share from $1.10 per share.
35
MANAGEMENT'S DISCUSSION AND ANALYSIS OF FINANCIAL CONDITION AND
RESULTS OF OPERATIONS - (CONTINUED)
CONTRACTUAL OBLIGATIONS AND FORWARD-LOOKING CASH REQUIREMENTS
The following table summarizes our expected cash outflows resulting from financial contracts and commitments:
|
|
Payments due by period
|
|||||||||||||||||||
|
Millions of dollars
|
Total
|
2019
|
2020 & 2021
|
2022 & 2023
|
Thereafter
|
|||||||||||||||
|
Long-term debt obligations
(1)
|
$
|
6,317
|
|
$
|
1,071
|
|
$
|
1,087
|
|
$
|
712
|
|
$
|
3,447
|
|
|||||
|
Operating lease obligations
|
1,050
|
|
238
|
|
327
|
|
217
|
|
268
|
|
||||||||||
|
Purchase obligations
(2)
|
648
|
|
210
|
|
253
|
|
150
|
|
35
|
|
||||||||||
|
United States & Foreign pension plans
(3)
|
474
|
|
17
|
|
15
|
|
97
|
|
345
|
|
||||||||||
|
Other postretirement benefits
(4)
|
299
|
|
38
|
|
69
|
|
63
|
|
129
|
|
||||||||||
|
Legal settlements
(5)
|
110
|
|
110
|
|
—
|
|
—
|
|
—
|
|
||||||||||
|
Total
(6)
|
$
|
8,898
|
|
$
|
1,684
|
|
$
|
1,751
|
|
$
|
1,239
|
|
$
|
4,224
|
|
|||||
|
(1)
|
Principal and interest payments related to long-term debt are included in the table above. For additional information about our financing arrangements, see Note
6
to the Consolidated Financial Statements.
|
|
(2)
|
Purchase obligations include our "take-or-pay" contracts with materials vendors and minimum payment obligations to other suppliers.
|
|
(3)
|
Represents the minimum contributions required for foreign and domestic pension plans based on current interest rates, asset return assumptions, legislative requirements and other actuarial assumptions at
December 31, 2018
. Management may elect to contribute amounts in addition to those required by law. See Note
8
to the Consolidated Financial Statements for additional information.
|
|
(4)
|
Represents our portion of expected benefit payments under our retiree healthcare plans.
|
|
(5)
|
Legal settlements includes $103 million for the FCA settlement agreement. For additional information regarding legal settlements, see Note
7
to the Consolidated Financial Statements.
|
|
(6)
|
This table does not include credit facility, short-term borrowings to banks and commercial paper borrowings. Approximately $1.0 billion of short-term borrowings to banks is due in 2019. For additional information, see Note
6
to the Consolidated Financial Statements. This table does not include future anticipated income tax settlements. See Note
14
to the Consolidated Financial Statements for additional information.
|
OFF-BALANCE SHEET ARRANGEMENTS
In the ordinary course of business, we enter into agreements with financial institutions to issue bank guarantees, letters of credit and surety bonds. These agreements are primarily associated with unresolved tax matters in Brazil, as is customary under local regulations, and other governmental obligations and debt agreements. As of
December 31, 2018
and
2017
, we had approximately
$355 million
and
$407 million
outstanding under these agreements, respectively.
For additional information about our off-balance sheet arrangements, see Note 1 and Note
7
to the Consolidated Financial Statements.
CRITICAL ACCOUNTING POLICIES AND ESTIMATES
The preparation of financial statements, in conformity with GAAP, requires management to make certain estimates and assumptions. We periodically evaluate these estimates and assumptions, which are based on historical experience, changes in the business environment and other factors that management believes to be reasonable under the circumstances. Actual results may differ materially from these estimates.
Pension and Other Postretirement Benefits
Accounting for pensions and other postretirement benefits involves estimating the costs of future benefits and attributing the cost over the employee's expected period of employment. The determination of our obligation and expense for these costs requires the use of certain assumptions. Those key assumptions include the discount rate, expected long-term rate of return on plan assets, life expectancy, and health care cost trend rates. These assumptions are subject to change based on interest rates on high quality bonds, stock and bond markets and medical cost inflation, respectively. Actual results that differ from our assumptions are accumulated and amortized over future periods and therefore, generally affect our recognized expense and accrued liability in such future periods. While we believe that our assumptions are appropriate given current economic conditions and actual experience, significant differences in results or significant changes in our assumptions may materially affect our pension and other postretirement benefit obligations and related future expense.
36
MANAGEMENT'S DISCUSSION AND ANALYSIS OF FINANCIAL CONDITION AND
RESULTS OF OPERATIONS - (CONTINUED)
Our pension and other postretirement benefit obligations at
December 31, 2018
and preliminary retirement benefit costs for
2019
were prepared using the assumptions that were determined as of
December 31, 2018
. The following table summarizes the sensitivity of our
December 31, 2018
retirement obligations and
2019
retirement benefit costs of our United States plans to changes in the key assumptions used to determine those results:
|
|
|
Estimated increase (decrease) in
|
|
|
Millions of dollars
|
Percentage
Change
|
2019 Expense
|
PBO/APBO
(1)
for 2018
|
|
United States Pension Plans
|
|||
|
Discount rate
|
+/-50bps
|
$ 1/(1)
|
$ (146)/161
|
|
Expected long-term rate of return on plan assets
|
+/-50bps
|
(14)/14
|
–
|
|
United States Other Postretirement Benefit Plan
|
|||
|
Discount rate
|
+/-50bps
|
0/(1)
|
(12)/13
|
|
Health care cost trend rate
|
+/-100bps
|
–
|
–
|
|
(1)
|
Projected benefit obligation (PBO) for pension plans and accumulated postretirement benefit obligation (APBO) for other postretirement benefit plans.
|
These sensitivities may not be appropriate to use for other years' financial results. Furthermore, the impact of assumption changes outside of the ranges shown above may not be approximated by using the above results. For additional information about our pension and other postretirement benefit obligations, see Note
8
to the Consolidated Financial Statements.
Income Taxes
We estimate our income taxes in each of the taxing jurisdictions in which we operate. This involves estimating actual current tax expense together with assessing any temporary differences resulting from the different treatment of certain items, such as the timing for recognizing expenses, for tax and accounting purposes. These differences may result in deferred tax assets or liabilities, which are included in our Consolidated Balance Sheets. We are required to assess the likelihood that deferred tax assets, which include net operating loss carryforwards, general business credits and deductible temporary differences, will be realizable in future years. Realization of our net operating loss and general business credit deferred tax assets is supported by specific tax planning strategies and, where possible, considers projections of future profitability. If recovery is not more likely than not, we provide a valuation allowance based on estimates of future taxable income in the various taxing jurisdictions, for the amount of deferred taxes that are ultimately realizable. If future taxable income is lower than expected or if tax planning strategies are not available as anticipated, we may record additional valuation allowances through income tax expense in the period such determination is made. Likewise, if we determine that we are able to realize our deferred tax assets in the future in excess of net recorded amounts, an adjustment to the deferred tax asset will benefit income tax expense in the period such determination is made.
As of
December 31, 2018
and
2017
, we had total deferred tax assets of
$2.9 billion
, net of valuation allowances of
$348 million
and
$178 million
, respectively. Our income tax expense has fluctuated considerably over the last five years. The tax expense has been influenced primarily by U.S. energy tax credits, foreign tax credits, audit settlements and adjustments, tax planning strategies, enacted legislation, and dispersion of global income. Future changes in the effective tax rate will be subject to several factors, including business profitability, tax planning strategies, and enacted tax laws.
In addition, we operate within multiple taxing jurisdictions and are subject to audit in these jurisdictions. These audits can involve complex issues, which may require an extended period of time to resolve. For additional information about income taxes, see Note
1
, Note
7
and Note
14
to the Consolidated Financial Statements.
Warranty Obligations
The estimation of warranty obligations is determined in the same period that revenue from the sale of the related products is recognized. The warranty obligation is based on historical experience and represents our best estimate of expected costs at the time products are sold. Warranty accruals are adjusted for known or anticipated warranty claims as new information becomes available. New product launches require a greater use of judgment in developing estimates
37
MANAGEMENT'S DISCUSSION AND ANALYSIS OF FINANCIAL CONDITION AND
RESULTS OF OPERATIONS - (CONTINUED)
until historical experience becomes available. Future events and circumstances could materially change our estimates and require adjustments to the warranty obligations. For additional information about warranty obligations, see Note
7
to the Consolidated Financial Statements.
Goodwill and Indefinite-Life Intangibles
Certain business acquisitions have resulted in the recording of goodwill and trademark assets which are not amortized. At December 31, 2018 and 2017, we had goodwill of approximately $2.5 billion and $3.1 billion, respectively. We have trademark assets with a carrying value of approximately $1.9 billion and $2.0 billion as of December 31, 2018 and 2017, respectively.
We perform our annual impairment assessment for goodwill and other indefinite-life intangible assets as of October 1st or more frequently if events or changes in circumstances indicate that the asset might be impaired. We consider qualitative factors to assess if it is more likely than not that the fair value for goodwill or indefinite-life intangible assets is below the carrying amount. We may also elect to bypass the qualitative assessment and perform a quantitative assessment.
In conducting a qualitative assessment, the Company analyzes a variety of events or factors that may influence the fair value of the reporting unit or indefinite-life intangible, including, but not limited to: the results of prior quantitative assessments performed; changes in the carrying amount of the reporting unit or indefinite-life intangible; actual and projected revenue and EBIT margin; relevant market data for both the Company and its peer companies; industry outlooks; macroeconomic conditions; liquidity; changes in key personnel; and the Company's competitive position. Significant judgment is used to evaluate the totality of these events and factors to make the determination of whether it is more likely than not that the fair value of the reporting unit or indefinite-life intangible is less than its carrying value.
For our annual impairment assessment as of October 1, 2018, the Company elected to bypass the qualitative assessment and perform a quantitative assessment to evaluate goodwill and certain brand trademarks. The Company elected to perform a qualitative assessment on the other indefinite-life intangible assets noting no events that indicated that the fair value was less than carrying value that would require a quantitative impairment assessment.
During the second quarter of 2018, we identified impairment indicators for the goodwill in our EMEA reporting unit and the
Indesit
and
Hotpoint*
trademarks based on our qualitative assessment, which required us to complete an interim quantitative impairment assessment.
Goodwill Valuations
In performing a quantitative assessment, we estimate each reporting unit's fair value primarily by using the income approach. The income approach uses each reporting unit's projection of estimated operating results and cash flows that are discounted using a market participant discount rate based on a weighted-average cost of capital. The financial projections reflect management's best estimate of economic and market conditions over the projected period including forecasted revenue growth, EBIT margin, tax rate, capital expenditures, depreciation and amortization and changes in working capital requirements. Other assumptions include discount rate and terminal growth rate. The estimated fair value of each reporting unit is compared to their respective carrying values.
Additionally we validate our estimates of fair value under the income approach by comparing the values to fair value estimates using a market approach. A market approach estimates fair value by applying cash flow multiples to the operating performance of each reporting unit. The multiples are derived from comparable publicly traded companies with operating and investment characteristics similar to the reporting units. We also corroborate the fair value through a market capitalization reconciliation to determine whether the implied control premium is reasonable based on recent market transactions and other qualitative considerations.
Interim impairment assessment
In connection with the preparation of our Consolidated Condensed Financial Statements for the three months ended June 30, 2018, we identified indicators of goodwill impairment for our EMEA reporting unit based on our qualitative assessment, which required us to complete an interim quantitative impairment assessment. The primary indicator of
*Whirlpool ownership of the Hotpoint brand in the EMEA and Asia Pacific regions is not affiliated with the Hotpoint brand sold in the Americas.
38
MANAGEMENT'S DISCUSSION AND ANALYSIS OF FINANCIAL CONDITION AND
RESULTS OF OPERATIONS - (CONTINUED)
impairment for our EMEA reporting unit was the segment's continuing negative financial performance in 2018 that did not improve as anticipated, primarily driven by significant volume loss. The actual operating results for the three-months ended June 30, 2018 were significantly lower than forecasted resulting in weak business performance. While the Indesit integration activities were substantially complete, as of the interim impairment date, the operating and macro-environment in the EMEA region continued to be very challenging and had not improved as anticipated. While our commercial transformation and supply chain initiatives were progressing, as of the impairment determination date, progress on market share recovery was slower than previously anticipated and the business has been impacted by raw material inflation and currency headwinds.
In evaluating the EMEA reporting unit, significant weight was provided to the forecasted EBIT margins and discount rate used in the discounted cash flow model, as we determined that these items have the most significant impact on the fair value of this reporting unit.
The average 5-year forecasted EBIT margin in the discounted cash flow model was approximately 5% and the discount rate was 12% based on market participant assumptions.
Based on our interim quantitative impairment assessment, the carrying value of the EMEA reporting unit exceeded its fair value by $579 million and we recorded a goodwill impairment charge during the second quarter of 2018.
Annual impairment assessment
Based on the results of our annual quantitative assessment performed as of October 1, 2018, the fair values of our NAR, Asia and LAR reporting units exceeded their respective carrying values by 111%, 165% and 31%, respectively.
Based on the quantitative assessment performed for the EMEA reporting unit, the fair value of the reporting unit exceeded its carrying value by less than 1%, which was consistent with management's expectation given the short time period between our interim and annual impairment assessments. The EMEA reporting unit has goodwill of approximately $300 million at December 31, 2018.
In evaluating the EMEA reporting unit, significant weight was provided to the forecasted EBIT margins and discount rate used in the discounted cash flow model, as we determined that these items have the most significant impact on the fair value of this reporting unit.
|
•
|
Forecasted EBIT margins are expected to recover as we stabilize volumes, sustain price/mix and recover market share and benefit from the recently announced strategic actions to rightsize and refocus the business. The 5-year average forecasted EBIT margin in the discounted cash flow model was approximately 4%.
|
|
•
|
We used a discount rate of 11.25% based on market participant assumptions.
|
We performed a sensitivity analysis on our estimated fair value noting that a 100 basis point increase in the discount rate or a 5% reduction in the projected EBIT margins in the forecasted periods would result in an impairment charge of $278 million and $148 million, respectively.
If actual results are not consistent with management's estimates and assumptions, a material impairment charge of goodwill could occur, which would have a material adverse effect on our consolidated financial statements.
Indefinite-Life Intangible Valuations
In performing a quantitative assessment of indefinite life intangible assets other than goodwill, primarily trademarks, we estimate the fair value of these intangible assets using the relief-from-royalty method which requires assumptions related to projected revenues from our annual long-range plan; assumed royalty rates that could be payable if we did not own the trademark; and a market participant discount rate based on a weighted-average cost of capital. If the estimated fair value of the indefinite-lived intangible asset is less than its carrying value, we would recognize an impairment loss.
39
MANAGEMENT'S DISCUSSION AND ANALYSIS OF FINANCIAL CONDITION AND
RESULTS OF OPERATIONS - (CONTINUED)
Interim impairment assessment
In connection with the preparation of our Consolidated Condensed Financial Statements for three months ended June 30, 2018, we identified indicators of impairment associated with other intangible assets in our EMEA reporting unit based on our qualitative assessment, which required us to complete an interim quantitative impairment assessment. The primary indicator of impairment was the continuing decline in revenue from weaker volumes through the six months ended June 30, 2018 that did not improve as anticipated. The actual operating results for the three months ended June 30, 2018 were significantly lower than forecasted.
In performing the quantitative analysis on these assets, significant assumptions used in our relief-from-royalty method includes revenue growth rates, assumed royalty rates and the discount rate.
We used a royalty rate and discount rate of 3% and 15%, respectively, for Indesit and a royalty rate and discount rate of 3.5% and 15.5%, respectively, for
Hotpoint*
.
Based on our interim quantitative impairment assessment, the carrying value of certain other intangible assets, including
Indesit
and
Hotpoint*
, exceeded their fair value, and we recorded an impairment charge of $168 million during the second quarter of 2018.
Annual impairment assessment
Based on the results of our annual quantitative assessment performed as of October 1, 2018, we determined there was an immaterial impairment as a result of the restructuring initiative to exit from domestic sales operations (not including manufacturing operations) in Turkey. There were no other impairments of indefinite-life intangible assets in 2018.
The fair value of the
Indesit
trademark exceeded its carrying value of $220 million by less than 1%. The fair value of the
Hotpoint*
trademark approximated its carrying value of $155 million. We expect revenue trends for both these brands to improve as we stabilize volumes, recover market share and benefit from our new product investments in the EMEA region.
The fair value of the
Maytag
trademark exceeded its carrying value of $1,021 million by approximately 2%. We expect revenue trends for this brand to improve as we recover temporary volume loss from previously announced cost-based price increases, and continue to execute our brand leadership strategy and benefit from our new product investments.
The fair values of all other trademarks exceeded their carrying values by more than 20%.
In performing the quantitative assessment on these assets, significant assumptions used in our relief-from-royalty model included revenue growth rates, assumed royalty rates and the discount rate, which are discussed further below.
Revenue growth rates relate to projected revenues from our financial planning and analysis process and vary from brand to brand. Adverse changes in the operating environment or our inability to grow revenues at the forecasted rates may result in a material impairment charge. We performed a sensitivity analysis on our estimated fair values noting a 10% reduction of forecasted revenues in the
Indesit
,
Hotpoint*
and
Maytag
trademarks would result in an impairment charge of approximately $23 million, $23 million and $81 million, respectively.
In determining royalty rates for the valuation of our trademarks, we considered factors that affect the assumed royalty rates that would hypothetically be paid for the use of trademarks. The most significant factors in determining the assumed royalty rates include the overall role and importance of the trademarks in the particular industry, the profitability of the products utilizing the trademarks, and the position of the trademarked products in the given market segment. Based on this analysis, we determined a royalty rate of 3%, 3.5% and 4% for our
Indesit
,
Hotpoint*
and
Maytag
trademarks, respectively. We performed a sensitivity analysis on our estimated fair values for
Indesit
,
Hotpoint*
and
Maytag
noting a 50 basis point reduction of the royalty rates from each brand would result in an impairment charge of approximately $35 million, $46 million and $106 million, respectively.
*Whirlpool ownership of the Hotpoint brand in the EMEA and Asia Pacific regions is not affiliated with the Hotpoint brand sold in the Americas.
40
MANAGEMENT'S DISCUSSION AND ANALYSIS OF FINANCIAL CONDITION AND
RESULTS OF OPERATIONS - (CONTINUED)
In developing discount rates for the valuation of our trademarks, we used a market participant discount rate based on a weighted-average cost of capital, adjusted for higher relative level of risks associated with doing business in other countries, as applicable, as well as the higher relative levels of risks associated with intangible assets. Based on this analysis, we determined the discount rates to be 15%, 15.5% and 10% for
Indesit
,
Hotpoint*
and
Maytag
, respectively. We performed a sensitivity analysis on our estimated fair values for
Indesit
,
Hotpoint*
and
Maytag
noting a 100 basis point increase in the discount rate would result in an impairment charge of approximately $17 million, $17 million and $101 million, respectively.
If actual results are not consistent with management's estimate and assumptions, a material impairment charge of our trademarks could occur, which could have a material adverse effect on our consolidated financial statements.
For additional information about goodwill and indefinite-life intangible valuations, see Note 5 and Note 10 to the Consolidated Financial Statements.
The estimates of future cash flows used in determining the fair value of goodwill and intangible assets involve significant management judgment and are based upon assumptions about expected future operating performance, economic conditions, market conditions and cost of capital. Inherent in estimating the future cash flows are uncertainties beyond our control, such as changes in capital markets. The actual cash flows could differ materially from management's estimates due to changes in business conditions, operating performance and economic conditions.
ISSUED BUT NOT YET EFFECTIVE ACCOUNTING PRONOUNCEMENTS
Additional information regarding recently issued accounting pronouncements can be found in Note
1
to the Consolidated Financial Statements.
OTHER MATTERS
For additional information regarding certain of our loss contingencies/litigation, see Note
7
to the Consolidated Financial Statements.
Grenfell Tower
On June 23, 2017, London's Metropolitan Police Service released a statement that it had identified a Hotpoint–branded refrigerator as the initial source of the Grenfell Tower fire in West London. U.K. authorities are conducting investigations, including regarding the cause and spread of the fire. The model in question was manufactured by Indesit Company between 2006 and 2009, prior to Whirlpool's acquisition of Indesit in 2014. We are fully cooperating with the investigating authorities. As these matters are ongoing, we cannot speculate on their eventual outcomes or potential impact on our financial statements; accordingly, we have not recorded any significant charges in 2017 and 2018. Claims may be filed related to this incident.
Antidumping and Safeguard Petition
As previously reported, Whirlpool filed petitions in 2011 and 2015 alleging that Samsung, LG and Electrolux violated U.S. and international trade laws by dumping washers into the U.S. Those petitions resulted in orders imposing antidumping duties on certain washers imported from South Korea, Mexico, and China, and countervailing duties on certain washers from South Korea. These orders could be subject to administrative reviews and possible appeals. The South Korea and Mexico orders are currently being reviewed to determine whether the orders should continue to remain in effect for another five years.
Whirlpool also filed a safeguard petition in May 2017 to address our concerns that Samsung and LG are evading U.S. trade laws by moving production from countries covered by antidumping orders. A safeguard remedy went into effect in February 2018, implementing tariffs on finished washers and certain covered parts for three years. During the second year of the remedy, beginning February 7, 2019, the remedy imposes an 18% tariff on the first 1.2 million large residential
washing machines imported into the United States and a 45% tariff on such imports in excess of 1.2 million, and also imposes a 45% tariff on washer tub, drum, and cabinet imports in excess of 70,000 units. The tariff rates on washers
and covered parts will decline slightly during the third year of the remedy. The safeguard remedy will be subject to an interim review by the International Trade Commission during 2019.
*Whirlpool ownership of the Hotpoint brand in the EMEA and Asia Pacific regions is not affiliated with the Hotpoint brand sold in the Americas.
41
MANAGEMENT'S DISCUSSION AND ANALYSIS OF FINANCIAL CONDITION AND
RESULTS OF OPERATIONS - (CONTINUED)
U.S. Tariffs and Global Economy
The current domestic and international political environment, including existing and potential changes to U.S. policies related to global trade and tariffs, have resulted in uncertainty surrounding the future state of the global economy. The impact of previously-announced U.S. tariffs on steel and aluminum was a component of increased raw material costs during the year ended
December 31, 2018
. We expect these and other tariffs to impact material costs in future quarters, which could require us to modify our current business practices and could have a material adverse effect on our financial statements in any particular reporting period.
Post-Retirement Benefit Litigation
For information regarding post-retirement benefit litigation, see Note
8
to the Consolidated Financial Statements.
FORWARD-LOOKING STATEMENTS
The Private Securities Litigation Reform Act of 1995 provides a safe harbor for forward-looking statements made by us or on our behalf. Certain statements contained in this annual report, including those within the forward-looking perspective section within this Management's Discussion and Analysis, and other written and oral statements made from time to time by us or on our behalf do not relate strictly to historical or current facts and may contain forward-looking statements that reflect our current views with respect to future events and financial performance. As such, they are considered "forward-looking statements" which provide current expectations or forecasts of future events. Such statements can be identified by the use of terminology such as "may," "could," "will," "should," "possible," "plan," "predict," "forecast," "potential," "anticipate," "estimate," "expect," "project," "intend," "believe," "may impact," "on track," and similar words or expressions. Our forward-looking statements generally relate to our growth strategies, financial results, product development, and sales efforts. These forward-looking statements should be considered with the understanding that such statements involve a variety of risks and uncertainties, known and unknown, and may be affected by inaccurate assumptions. Consequently, no forward-looking statement can be guaranteed and actual results may vary materially.
This document contains forward-looking statements about Whirlpool Corporation and its consolidated subsidiaries ("Whirlpool") that speak only as of this date. Whirlpool disclaims any obligation to update these statements. Forward-looking statements in this document may include, but are not limited to, statements regarding expected earnings per share, cash flow, productivity and raw material prices. Many risks, contingencies and uncertainties could cause actual results to differ materially from Whirlpool's forward-looking statements. Among these factors are: (1) intense competition in the home appliance industry reflecting the impact of both new and established global competitors, including Asian and European manufacturers, and the impact of the changing retail environment; (2) Whirlpool's ability to maintain or increase sales to significant trade customers and the ability of these trade customers to maintain or increase market share; (3) Whirlpool's ability to maintain its reputation and brand image; (4) the ability of Whirlpool to achieve its business plans, productivity improvements, and cost control objectives, and to leverage its global operating platform, and accelerate the rate of innovation; (5) Whirlpool's ability to obtain and protect intellectual property rights; (6) acquisition and investment-related risks, including risks associated with our past acquisitions, and risks associated with our increased presence in emerging markets; (7) risks related to our international operations, including changes in foreign regulations, regulatory compliance and disruptions arising from political, legal and economic instability; (8) information technology system failures, data security breaches, network disruptions, and cybersecurity attacks; (9) product liability and product recall costs; (10) the ability of suppliers of critical parts, components and manufacturing equipment to deliver sufficient quantities to Whirlpool in a timely and cost-effective manner; (11) our ability to attract, develop and retain executives and other qualified employees; (12) the impact of labor relations; (13) fluctuations in the cost of key materials (including steel, resins, copper and aluminum) and components and the ability of Whirlpool to offset cost increases; (14) Whirlpool's ability to manage foreign currency fluctuations; (15) impacts from goodwill impairment and related charges; (16) triggering events or circumstances impacting the carrying value of our long-lived assets; (17) inventory and other asset risk; (18) the uncertain global economy and changes in economic conditions which affect demand for our products; (19) health care cost trends, regulatory changes and variations between results and estimates that could increase future funding obligations for pension and postretirement benefit plans; (20) litigation, tax, and legal compliance risk and costs, especially if materially different from the amount we expect to incur or have accrued for, and any disruptions caused by the same; (21) the effects and costs of governmental investigations or related actions by third parties; and (22) changes in the legal and regulatory environment including environmental, health and safety regulations, and taxes and tariffs.
42
MANAGEMENT'S DISCUSSION AND ANALYSIS OF FINANCIAL CONDITION AND
RESULTS OF OPERATIONS - (CONTINUED)
We undertake no obligation to update any forward-looking statement, and investors are advised to review disclosures in our filings with the SEC. It is not possible to foresee or identify all factors that could cause actual results to differ from expected or historic results. Therefore, investors should not consider the foregoing factors to be an exhaustive statement of all risks, uncertainties, or factors that could potentially cause actual results to differ from forward-looking statements.
Additional information concerning these and other factors can be found in "Risk Factors" in Item 1A of this report.
|
ITEM 7A.
|
QUANTITATIVE AND QUALITATIVE DISCLOSURES ABOUT MARKET RISK
|
MARKET RISK
We have in place an enterprise risk management process that involves systematic risk identification and mitigation covering the categories of enterprise, strategic, financial, operational and compliance and reporting risks. The enterprise risk management process receives Board of Directors and management oversight, drives risk mitigation decision-making and is fully integrated into our internal audit planning and execution cycle.
We are exposed to market risk from changes in foreign currency exchange rates, domestic and foreign interest rates, and commodity prices, which can affect our operating results and overall financial condition. We manage exposure to these risks through our operating and financing activities and, when deemed appropriate, through the use of derivatives. Derivatives are viewed as risk management tools and are not used for speculation or for trading purposes. Derivatives are generally contracted with a diversified group of investment grade counterparties to reduce exposure to nonperformance on such instruments.
We use foreign currency forward contracts, currency options, and currency swaps to hedge the price risk associated with firmly committed and forecasted cross-border payments and receipts related to ongoing business and operational financing activities. We also use forward or option contracts to hedge our investment in the net assets of certain international subsidiaries to offset foreign currency translation adjustments related to our net investment in those subsidiaries. Foreign currency contracts are sensitive to changes in foreign currency exchange rates. At December 31,
2018
, a 10% favorable or unfavorable exchange rate movement in each currency in our portfolio of foreign currency contracts would have resulted in an incremental unrealized gain of approximately $234 million or loss of approximately $241 million, respectively. Consistent with the use of these contracts to neutralize the effect of exchange rate fluctuations, such unrealized losses or gains would be offset by corresponding gains or losses, respectively, in the re-measurement of the underlying exposures.
We enter into commodity swap contracts to hedge the price risk associated with firmly committed and forecasted commodities purchases, the prices of which are not fixed directly through supply contracts. As of December 31,
2018
, a 10% favorable or unfavorable shift in commodity prices would have resulted in an incremental gain or loss of approximately $21 million, respectively, related to these contracts.
43
|
ITEM 8.
|
FINANCIAL STATEMENTS AND SUPPLEMENTARY DATA
|
TABLE OF CONTENTS
|
PAGE
|
|
|
FINANCIAL STATEMENTS AND SUPPLEMENTARY DATA
|
|
|
PAGE
|
||
|
NOTES TO THE CONSOLIDATED FINANCIAL STATEMENTS
|
||
|
1.
|
||
|
2.
|
||
|
3.
|
||
|
4.
|
||
|
5.
|
||
|
6.
|
||
|
7.
|
||
|
8.
|
||
|
9.
|
||
|
10.
|
||
|
11.
|
||
|
12.
|
||
|
13.
|
||
|
14.
|
||
|
15.
|
||
|
16.
|
||
|
17
|
||
44
WHIRLPOOL CORPORATION
CONSOLIDATED STATEMENTS OF INCOME (LOSS)
Year Ended December 31,
(Millions of dollars, except per share data)
|
|
||||||||||||
|
2018
|
2017
|
2016
|
||||||||||
|
Net sales
|
$
|
21,037
|
|
$
|
21,253
|
|
$
|
20,718
|
|
|||
|
Expenses
|
||||||||||||
|
Cost of products sold
|
17,500
|
|
17,651
|
|
17,026
|
|
||||||
|
Gross margin
|
3,537
|
|
3,602
|
|
3,692
|
|
||||||
|
Selling, general and administrative
|
2,189
|
|
2,112
|
|
2,080
|
|
||||||
|
Intangible amortization
|
75
|
|
79
|
|
71
|
|
||||||
|
Restructuring costs
|
247
|
|
275
|
|
173
|
|
||||||
|
Impairment of goodwill and other intangibles
|
747
|
|
—
|
|
—
|
|
||||||
|
Operating profit
|
279
|
|
1,136
|
|
1,368
|
|
||||||
|
Other (income) expense
|
||||||||||||
|
Interest and sundry (income) expense
|
108
|
|
87
|
|
93
|
|
||||||
|
Interest expense
|
192
|
|
162
|
|
161
|
|
||||||
|
Earnings (loss) before income taxes
|
(21
|
)
|
887
|
|
1,114
|
|
||||||
|
Income tax expense
|
138
|
|
550
|
|
186
|
|
||||||
|
Net earnings (loss)
|
(159
|
)
|
337
|
|
928
|
|
||||||
|
Less: Net earnings (loss) available to noncontrolling interests
|
24
|
|
(13
|
)
|
40
|
|
||||||
|
Net earnings (loss) available to Whirlpool
|
$
|
(183
|
)
|
$
|
350
|
|
$
|
888
|
|
|||
|
Per share of common stock
|
||||||||||||
|
Basic net earnings (loss) available to Whirlpool
|
$
|
(2.72
|
)
|
$
|
4.78
|
|
$
|
11.67
|
|
|||
|
Diluted net earnings (loss) available to Whirlpool
|
$
|
(2.72
|
)
|
$
|
4.70
|
|
$
|
11.50
|
|
|||
|
Weighted-average shares outstanding (in millions)
|
||||||||||||
|
Basic
|
67.2
|
|
73.3
|
|
76.1
|
|
||||||
|
Diluted
|
67.2
|
|
74.4
|
|
77.2
|
|
||||||
The accompanying notes are an integral part of these Consolidated Financial Statements.
45
WHIRLPOOL CORPORATION
CONSOLIDATED STATEMENTS OF COMPREHENSIVE INCOME (LOSS)
Year Ended December 31,
(Millions of dollars)
|
2018
|
2017
|
2016
|
|||||||||||
|
Net earnings (loss)
|
$
|
(159
|
)
|
$
|
337
|
|
$
|
928
|
|
||||
|
Other comprehensive income (loss), before tax:
|
|||||||||||||
|
Foreign currency translation adjustments
|
(272
|
)
|
32
|
|
(30
|
)
|
|||||||
|
Derivative instruments:
|
|
|
|
||||||||||
|
Net gain (loss) arising during period
|
77
|
|
(84
|
)
|
106
|
|
|||||||
|
Less: reclassification adjustment for gain (loss) included in net earnings (loss)
|
107
|
|
(80
|
)
|
35
|
|
|||||||
|
Derivative instruments, net
|
(30
|
)
|
(4
|
)
|
71
|
|
|||||||
|
Marketable securities:
|
|||||||||||||
|
Net gain (loss) arising during period
|
—
|
|
6
|
|
(2
|
)
|
|||||||
|
Marketable securities, net
|
—
|
|
6
|
|
(2
|
)
|
|||||||
|
Defined benefit pension and postretirement plans:
|
|||||||||||||
|
Prior service (cost) credit arising during period
|
(5
|
)
|
(16
|
)
|
30
|
|
|||||||
|
Net gain (loss) arising during period
|
(102
|
)
|
(51
|
)
|
(139
|
)
|
|||||||
|
Less: amortization of prior service credit (cost) and actuarial (loss)
|
(59
|
)
|
(52
|
)
|
(39
|
)
|
|||||||
|
Defined benefit pension and postretirement plans, net
|
(48
|
)
|
(15
|
)
|
(70
|
)
|
|||||||
|
Other comprehensive income (loss), before tax
|
(350
|
)
|
19
|
|
(31
|
)
|
|||||||
|
Income tax benefit (expense) related to items of other comprehensive income (loss)
|
5
|
|
50
|
|
(37
|
)
|
|||||||
|
Other comprehensive income (loss), net of tax
|
$
|
(345
|
)
|
$
|
69
|
|
$
|
(68
|
)
|
||||
|
Comprehensive income (loss)
|
$
|
(504
|
)
|
$
|
406
|
|
$
|
860
|
|
||||
|
Less: comprehensive income (loss), available to noncontrolling interests
|
26
|
|
(13
|
)
|
40
|
|
|||||||
|
Comprehensive income (loss) available to Whirlpool
|
$
|
(530
|
)
|
$
|
419
|
|
$
|
820
|
|
||||
The accompanying notes are an integral part of these Consolidated Financial Statements.
46
WHIRLPOOL CORPORATION
CONSOLIDATED BALANCE SHEETS
At December 31,
(Millions of dollars)
|
2018
|
2017
|
||||||
|
Assets
|
|||||||
|
Current assets
|
|||||||
|
Cash and cash equivalents
|
$
|
1,498
|
|
$
|
1,196
|
|
|
|
Accounts receivable, net of allowance of $136 and $157, respectively
|
2,210
|
|
2,665
|
|
|||
|
Inventories
|
2,533
|
|
2,988
|
|
|||
|
Prepaid and other current assets
|
839
|
|
1,081
|
|
|||
|
Assets held for sale
|
818
|
|
—
|
|
|||
|
Total current assets
|
7,898
|
|
7,930
|
|
|||
|
Property, net of accumulated depreciation of $6,190 and $6,825, respectively
|
3,414
|
|
4,033
|
|
|||
|
Goodwill
|
2,451
|
|
3,118
|
|
|||
|
Other intangibles, net of accumulated amortization of $527 and $476, respectively
|
2,296
|
|
2,591
|
|
|||
|
Deferred income taxes
|
1,989
|
|
2,013
|
|
|||
|
Other noncurrent assets
|
299
|
|
353
|
|
|||
|
Total assets
|
$
|
18,347
|
|
$
|
20,038
|
|
|
|
Liabilities and stockholders' equity
|
|||||||
|
Current liabilities
|
|||||||
|
Accounts payable
|
$
|
4,487
|
|
$
|
4,797
|
|
|
|
Accrued expenses
|
690
|
|
674
|
|
|||
|
Accrued advertising and promotions
|
827
|
|
853
|
|
|||
|
Employee compensation
|
393
|
|
414
|
|
|||
|
Notes payable
|
1,034
|
|
450
|
|
|||
|
Current maturities of long-term debt
|
947
|
|
376
|
|
|||
|
Other current liabilities
|
811
|
|
941
|
|
|||
|
Liabilities held for sale
|
489
|
|
—
|
|
|||
|
Total current liabilities
|
9,678
|
|
8,505
|
|
|||
|
Noncurrent liabilities
|
|||||||
|
Long-term debt
|
4,046
|
|
4,392
|
|
|||
|
Pension benefits
|
637
|
|
1,029
|
|
|||
|
Postretirement benefits
|
318
|
|
352
|
|
|||
|
Other noncurrent liabilities
|
463
|
|
632
|
|
|||
|
Total noncurrent liabilities
|
5,464
|
|
6,405
|
|
|||
|
Stockholders' equity
|
|||||||
|
Common stock, $1 par value, 250 million shares authorized, 112 million shares issued, and 64 million and 71 million shares outstanding, respectively
|
112
|
|
112
|
|
|||
|
Additional paid-in capital
|
2,768
|
|
2,739
|
|
|||
|
Retained earnings
|
6,933
|
|
7,352
|
|
|||
|
Accumulated other comprehensive loss
|
(2,695
|
)
|
(2,331
|
)
|
|||
|
Treasury stock, 48 million and 41 million shares, respectively
|
(4,827
|
)
|
(3,674
|
)
|
|||
|
Total Whirlpool stockholders' equity
|
2,291
|
|
4,198
|
|
|||
|
Noncontrolling interests
|
914
|
|
930
|
|
|||
|
Total stockholders' equity
|
3,205
|
|
5,128
|
|
|||
|
Total liabilities and stockholders' equity
|
$
|
18,347
|
|
$
|
20,038
|
|
|
The accompanying notes are an integral part of these Consolidated Financial Statements.
47
WHIRLPOOL CORPORATION
CONSOLIDATED STATEMENTS OF CASH FLOWS
Year Ended December 31,
(Millions of dollars)
|
2018
|
2017
|
2016
|
|||||||||
|
Operating activities
|
|||||||||||
|
Net earnings (loss)
|
$
|
(159
|
)
|
$
|
337
|
|
$
|
928
|
|
||
|
Adjustments to reconcile net earnings (loss) to cash provided by (used in) operating activities:
|
|
|
|
||||||||
|
Depreciation and amortization
|
645
|
|
654
|
|
655
|
|
|||||
|
Impairment of goodwill and other intangibles
|
747
|
|
—
|
|
—
|
|
|||||
|
Changes in assets and liabilities:
|
|
|
|
||||||||
|
Accounts receivable
|
79
|
|
160
|
|
(291
|
)
|
|||||
|
Inventories
|
73
|
|
(229
|
)
|
(18
|
)
|
|||||
|
Accounts payable
|
210
|
|
180
|
|
37
|
|
|||||
|
Accrued advertising and promotions
|
12
|
|
76
|
|
46
|
|
|||||
|
Accrued expenses and current liabilities
|
162
|
|
(230
|
)
|
46
|
|
|||||
|
Taxes deferred and payable, net
|
(67
|
)
|
239
|
|
(116
|
)
|
|||||
|
Accrued pension and postretirement benefits
|
(434
|
)
|
(58
|
)
|
(43
|
)
|
|||||
|
Employee compensation
|
44
|
|
36
|
|
(38
|
)
|
|||||
|
Other
|
(83
|
)
|
99
|
|
(3
|
)
|
|||||
|
Cash provided by operating activities
|
1,229
|
|
1,264
|
|
1,203
|
|
|||||
|
Investing activities
|
|||||||||||
|
Capital expenditures
|
(590
|
)
|
(684
|
)
|
(660
|
)
|
|||||
|
Proceeds from sale of assets and business
|
160
|
|
61
|
|
63
|
|
|||||
|
Purchase of held-to-maturity securities
|
—
|
|
(173
|
)
|
—
|
|
|||||
|
Proceeds from held-to-maturity securities
|
60
|
|
113
|
|
—
|
|
|||||
|
Investment in related businesses
|
(25
|
)
|
(35
|
)
|
(12
|
)
|
|||||
|
Other
|
(4
|
)
|
(3
|
)
|
(3
|
)
|
|||||
|
Cash used in investing activities
|
(399
|
)
|
(721
|
)
|
(612
|
)
|
|||||
|
Financing activities
|
|||||||||||
|
Proceeds from borrowings of long-term debt
|
705
|
|
691
|
|
1,012
|
|
|||||
|
Repayments of long-term debt
|
(386
|
)
|
(564
|
)
|
(522
|
)
|
|||||
|
Net proceeds from short-term borrowings
|
653
|
|
367
|
|
55
|
|
|||||
|
Dividends paid
|
(306
|
)
|
(312
|
)
|
(294
|
)
|
|||||
|
Repurchase of common stock
|
(1,153
|
)
|
(750
|
)
|
(525
|
)
|
|||||
|
Purchase of noncontrolling interest shares
|
(41
|
)
|
(5
|
)
|
(25
|
)
|
|||||
|
Common stock issued
|
17
|
|
34
|
|
26
|
|
|||||
|
Other
|
(7
|
)
|
(14
|
)
|
(5
|
)
|
|||||
|
Cash used in financing activities
|
(518
|
)
|
(553
|
)
|
(278
|
)
|
|||||
|
Effect of exchange rate changes on cash, cash equivalents and restricted cash
|
(67
|
)
|
63
|
|
(36
|
)
|
|||||
|
Increase in cash, cash equivalents and restricted cash
|
245
|
|
53
|
|
277
|
|
|||||
|
Cash, cash equivalents and restricted cash at beginning of year
|
1,293
|
|
1,240
|
|
963
|
|
|||||
|
Cash, cash equivalents and restricted cash at end of year
|
$
|
1,538
|
|
$
|
1,293
|
|
$
|
1,240
|
|
||
|
Supplemental disclosure of cash flow information
|
|||||||||||
|
Cash paid for interest
|
$
|
183
|
|
$
|
181
|
|
$
|
198
|
|
||
|
Cash paid for income taxes
|
$
|
206
|
|
$
|
311
|
|
$
|
300
|
|
||
The accompanying notes are an integral part of these Consolidated Financial Statements.
48
WHIRLPOOL CORPORATION
CONSOLIDATED STATEMENTS OF CHANGES IN STOCKHOLDERS' EQUITY
Year ended December 31,
(Millions of dollars)
|
|
|
Whirlpool Stockholders' Equity
|
|
|||||||||||||||||||||
|
|
Total
|
Retained
Earnings
|
Accumulated Other
Comprehensive Income (Loss)
|
Treasury Stock/
Additional Paid-
in-Capital
|
Common
Stock
|
Non-
Controlling
Interests
|
||||||||||||||||||
|
Balances, December 31, 2015
|
$
|
5,674
|
|
$
|
6,722
|
|
$
|
(2,332
|
)
|
$
|
242
|
|
$
|
111
|
|
$
|
931
|
|
||||||
|
Comprehensive income
|
||||||||||||||||||||||||
|
Net earnings
|
928
|
|
888
|
|
—
|
|
—
|
|
—
|
|
40
|
|
||||||||||||
|
Other comprehensive income (loss)
|
(68
|
)
|
—
|
|
(68
|
)
|
—
|
|
—
|
|
—
|
|
||||||||||||
|
Comprehensive income
|
860
|
|
888
|
|
(68
|
)
|
—
|
|
—
|
|
40
|
|
||||||||||||
|
Stock issued (repurchased)
|
(506
|
)
|
—
|
|
—
|
|
(494
|
)
|
—
|
|
(12
|
)
|
||||||||||||
|
Dividends declared
|
(300
|
)
|
(296
|
)
|
—
|
|
—
|
|
—
|
|
(4
|
)
|
||||||||||||
|
Balances, December 31, 2016
|
5,728
|
|
7,314
|
|
(2,400
|
)
|
(252
|
)
|
111
|
|
955
|
|
||||||||||||
|
Comprehensive income
|
||||||||||||||||||||||||
|
Net earnings (loss)
|
337
|
|
350
|
|
—
|
|
—
|
|
—
|
|
(13
|
)
|
||||||||||||
|
Other comprehensive income (loss)
|
69
|
|
—
|
|
69
|
|
—
|
|
—
|
|
—
|
|
||||||||||||
|
Comprehensive income
|
406
|
|
350
|
|
69
|
|
—
|
|
—
|
|
(13
|
)
|
||||||||||||
|
Stock issued (repurchased)
|
(682
|
)
|
—
|
|
—
|
|
(683
|
)
|
1
|
|
—
|
|
||||||||||||
|
Dividends declared
|
(324
|
)
|
(312
|
)
|
—
|
|
—
|
|
—
|
|
(12
|
)
|
||||||||||||
|
Balances, December 31, 2017
|
5,128
|
|
7,352
|
|
(2,331
|
)
|
(935
|
)
|
112
|
|
930
|
|
||||||||||||
|
Comprehensive income
|
||||||||||||||||||||||||
|
Net earnings (loss)
|
(159
|
)
|
(183
|
)
|
—
|
|
—
|
|
—
|
|
24
|
|
||||||||||||
|
Other comprehensive income (loss)
|
(345
|
)
|
—
|
|
(347
|
)
|
—
|
|
—
|
|
2
|
|
||||||||||||
|
Comprehensive income
|
(504
|
)
|
(183
|
)
|
(347
|
)
|
—
|
|
—
|
|
26
|
|
||||||||||||
|
Adjustment to beginning retained earnings
|
72
|
|
72
|
|
—
|
|
—
|
|
—
|
|
—
|
|
||||||||||||
|
Adjustment to beginning accumulated other comprehensive loss
|
(17
|
)
|
—
|
|
(17
|
)
|
—
|
|
—
|
|
—
|
|
||||||||||||
|
Stock issued (repurchased)
|
(1,160
|
)
|
—
|
|
—
|
|
(1,124
|
)
|
—
|
|
(36
|
)
|
||||||||||||
|
Dividends declared
|
(314
|
)
|
(308
|
)
|
—
|
|
—
|
|
—
|
|
(6
|
)
|
||||||||||||
|
Balances, December 31, 2018
|
$
|
3,205
|
|
$
|
6,933
|
|
$
|
(2,695
|
)
|
$
|
(2,059
|
)
|
$
|
112
|
|
$
|
914
|
|
||||||
The accompanying notes are an integral part of these Consolidated Financial Statements.
49
NOTES TO THE CONSOLIDATED FINANCIAL STATEMENTS
(
1
)
SUMMARY OF PRINCIPLE ACCOUNTING POLICIES
General Information
Whirlpool Corporation, a Delaware corporation, manufactures products in
14
countries and markets products in nearly
every country around the world under brand names such as
Whirlpool
,
KitchenAid
,
Maytag
,
Consul
,
Brastemp
,
Amana
,
Bauknecht
,
JennAir, Indesit
and
Hotpoint
*.
We conduct our business through four operating segments, which we define based on geography. Whirlpool's operating segments consist of North America, Europe, Middle East and Africa ("EMEA"), Latin America and Asia.
Principles of Consolidation
The consolidated financial statements are prepared in conformity with GAAP, and include all majority-owned subsidiaries. All material intercompany transactions have been eliminated upon consolidation. We do not consolidate the financial statements of any company in which we have an ownership interest of 50% or less, unless that company is deemed to be a variable interest entity ("VIE") of which we are the primary beneficiary. Our primary business purpose and involvement with VIE's is for product development and distribution.
Reclassifications
We reclassified certain prior period amounts in the Consolidated Financial Statements to conform with current year presentation.
Use of Estimates
We are required to make estimates and assumptions that affect the amounts reported in the Consolidated Financial Statements. The most significant assumptions are estimates in determining the fair value of goodwill and indefinite-lived intangible assets, legal contingencies, income taxes and pension and postretirement benefits. Actual results could differ materially from those estimates.
Revenue Recognition
Revenue is recognized when performance obligations under the terms of a contract with our customers are satisfied, the sales price is determinable, and the risk and rewards of ownership are transferred. Generally the risk and rewards of ownership are transferred with the transfer of control of our products and services. For the majority of our sales, control is transferred to the customer as soon as products are shipped. For a portion of our sales, control is transferred to the customer upon receipt of products at the customer's location. Sales are net of allowances for product returns, which are based on historical return rates and certain promotions. For additional information on revenue recognition, see Note 2 to the Consolidated Financial Statements.
Sales Incentives
The cost of sales incentives is accrued at the date at which revenue is recognized by Whirlpool as a reduction of revenue. If new incentives are added after the product has been shipped, then they are accrued at that time, also as a reduction of revenue. These accrued promotions are recognized based on the expected value amount of incentives that will be ultimately claimed by trade customers or consumers. The expected value is the sum of probability-weighted amounts in a range of possible consideration amounts. If the amount of incentives cannot be reasonably estimated, an accrued promotion liability is recognized for the maximum potential amount.
Accounts Receivable and Allowance for Doubtful Accounts
We carry accounts receivable at sales value less an allowance for doubtful accounts. We periodically evaluate accounts receivable and establish an allowance for doubtful accounts based on a combination of specific customer circumstances, credit conditions and the history of write-offs and collections. We evaluate items on an individual basis when determining accounts receivable write-offs. In general, our policy is to not charge interest on trade receivables after the invoice becomes past due. A receivable is considered past due if payment has not been received within agreed upon invoice terms.
*Whirlpool ownership of the Hotpoint brand in the EMEA and Asia Pacific regions is not affiliated with the Hotpoint brand sold in the Americas.
50
NOTES TO THE CONSOLIDATED FINANCIAL STATEMENTS - (CONTINUED)
Transfers and Servicing of Financial Assets
In an effort to manage economic and geographic trade customer risk, from time to time, the Company will transfer, primarily without recourse, accounts receivable balances of certain customers to financial institutions resulting in a nominal impact recorded in interest and sundry (income) expense. These transactions are accounted for as sales of the receivables resulting in the receivables being de-recognized from the Consolidated Balance Sheets. These transfers primarily do not require continuing involvement from the Company, however certain arrangements include servicing of transferred receivables by Whirlpool. Outstanding accounts receivable transferred under arrangements where the Company continues to service the transferred asset were
$161 million
and
$137 million
as of December 31, 2018 and December 31, 2017, respectively.
Freight and Warehousing Costs
We classify freight and warehousing costs within cost of products sold in our Consolidated Statements of Income (Loss).
Cash and Cash Equivalents
All highly liquid debt instruments purchased with an initial maturity of three months or less are considered cash equivalents.
Restricted Cash
Restricted cash can only be
used to fund capital expenditures and technical resources to enhance Whirlpool China's research and development and working capital, as required by the terms of the Hefei Sanyo acquisition completed in October 2014.
As of
December 31, 2018
and
2017
, restricted cash was approximately
$40 million
and
$97 million
, respectively. Approximately
$40 million
and
$48 million
is recorded in other current assets as of
December 31, 2018
and
2017
, respectively, with the remaining portion recorded in other non-current assets. For additional information, see Note 3 to the Consolidated Financial Statements.
Fair Value Measurements
We measure fair value based on an exit price, representing the amount that would be received to sell an asset or paid to transfer a liability in an orderly transaction between market participants. As such, fair value is a market-based measurement that should be determined based on assumptions that market participants would use in pricing an asset or liability. As a basis for considering such assumptions, a three-tiered fair value hierarchy is established, which prioritizes the inputs used in measuring fair value as follows: (Level 1) observable inputs such as quoted prices in active markets; (Level 2) inputs, other than the quoted prices in active markets that are observable, either directly or indirectly; and (Level 3) unobservable inputs in which there is little or no market data, which require the reporting entity to develop its own assumptions. Certain investments are valued based on net asset value (NAV), which approximates fair value. Such basis is determined by referencing the respective fund's underlying assets. There are no unfunded commitments or other restrictions associated with these investments. We had
no
Level 3 assets or liabilities at
December 31, 2018
and
2017
, with the exception of goodwill and other intangibles disclosed in Note 5 and Note
10
and pension plan assets disclosed in Note 8 to the Consolidated Financial Statements.
We measured fair value for money market funds, available for sale investments and held-to-maturity securities using quoted market prices in active markets for identical or comparable assets. We measured fair value for derivative contracts, all of which have counterparties with high credit ratings, based on model driven valuations using significant inputs derived from observable market data. For assets measured at net asset values, we have
no
unfunded commitments or significant restraints. We measured fair value (non-recurring) for goodwill and other intangibles using a discounted cash flow model and a relief-from-royalty method, respectively, with inputs based on both observable and unobservable market data.
Inventories
United States production inventories are stated at last-in, first-out ("LIFO") cost. Latin America, Asia and certain EMEA inventories are stated at average cost. The remaining inventories are stated at first-in, first-out ("FIFO") cost. Costs include materials, labor and production overhead at normal production capacity. Costs do not exceed net realizable values. Changes in the amount that FIFO cost exceed LIFO cost are recognized in cost of goods sold. See Note
4
to the Consolidated Financial Statements for additional information about inventories.
51
NOTES TO THE CONSOLIDATED FINANCIAL STATEMENTS - (CONTINUED)
Property
Property is stated at cost, net of accumulated depreciation. For production machinery and equipment, we record depreciation based on units produced, unless units produced drop below a minimum threshold at which point depreciation is recorded using the straight-line method, excluding property acquired from the
Hefei Sanyo
acquisition and certain property acquired from the
Indesit
acquisition in 2014. For non-production assets and assets acquired from
Hefei Sanyo
and certain production assets acquired from
Indesit
, we depreciate costs based on the straight-line method. Depreciation expense for property, including accelerated depreciation classified as restructuring expense in our Consolidated Statements of Income (Loss), was
$570 million
,
$575 million
and
$584 million
in
2018
,
2017
and
2016
, respectively.
The following table summarizes our property as of
December 31, 2018
and
2017
:
|
Millions of dollars
|
2018
|
2017
|
Estimated Useful Life
|
|||||||
|
Land
|
$
|
102
|
|
$
|
123
|
|
n/a
|
|||
|
Buildings
|
1,593
|
|
1,789
|
|
10 to 50 years
|
|||||
|
Machinery and equipment
|
7,909
|
|
8,946
|
|
3 to 30 years
|
|||||
|
Accumulated depreciation
|
(6,190
|
)
|
(6,825
|
)
|
||||||
|
Property plant and equipment, net
|
$
|
3,414
|
|
$
|
4,033
|
|
||||
We classify gains and losses associated with asset dispositions in the same line item as the underlying depreciation of the disposed asset in the Consolidated Statements of Income (Loss). During
2018
, we primarily retired land and buildings related to a sale lease back transaction and machinery and equipment with a net book value of approximately
$100 million
that was no longer in use. During
2017
, we primarily retired machinery and equipment with a net book value of
$63 million
that was no longer in use. Net gains and losses recognized in cost of products sold were not material for
2018
,
2017
and
2016
.
We record impairment losses on long-lived assets, excluding goodwill and indefinite-life intangibles, when events and circumstances indicate the assets may be impaired and the estimated undiscounted future cash flows generated by those assets are less than their carrying amounts. There were no significant impairments recorded during
2018
,
2017
and
2016
.
In the fourth quarter of 2018, the Company sold and leased back a group of properties in our Latin American region for net proceeds of approximately
$133 million
.The initial total annual rent for the properties is approximately
$11 million
per year over an initial
10
year lease term and is subject to consumer price index increases. Under the terms of the lease agreements, the Company is responsible for all taxes, insurance and utilities and is required to adequately maintain the property. The Company also has
two
, sequential
five
year renewal options and the right of first refusal in the event that the purchaser agrees to sell the property to an unrelated third party at a future date.
This transaction met the requirements for sale leaseback accounting. Accordingly, the Company recorded the sale of the property, which resulted in a deferred gain of approximately
$69 million
, and removed the related land, buildings and equipment from the Consolidated Balance Sheets. Upon adoption of ASU No. 2016-02, "Leases (Topic 842)" substantially all of the deferred gain will be recognized as a cumulative adjustment to retained earnings.
Goodwill and Other Intangibles
We perform our annual impairment assessment for goodwill and indefinite-life intangible assets as of October 1st and more frequently if indicators of impairment exist. We consider qualitative factors to assess if it is more likely than not that the fair value for goodwill or indefinite-life intangible assets is below the carrying amount. We may also elect to bypass the qualitative assessment and perform a quantitative assessment.
In conducting a qualitative assessment, the Company analyzes a variety of events or factors that may influence the fair value of the reporting unit or indefinite-life intangible, including, but not limited to: macroeconomic conditions, industry and market considerations, cost factors, overall financial performance, share price and other relevant factors.
Goodwill
In performing a quantitative assessment of goodwill, we estimate each reporting unit's fair value using the best information available to us, including market information and discounted cash flow projections also referred to as the income approach. The income approach uses reporting unit's projections of estimated operating results and cash
52
NOTES TO THE CONSOLIDATED FINANCIAL STATEMENTS - (CONTINUED)
flows that are discounted using a market participant discount rate based on a weighted-average cost of capital. Additionally, we validate our estimates of fair value under the income approach by comparing the values to fair value estimates using a market approach.
Intangible Assets
We perform a quantitative assessment of other indefinite-life intangible assets, which are primarily comprised of trademarks. We estimate the fair value of these intangible assets using the relief-from-royalty method, which primarily requires assumptions related to projected revenues from our long-range plan, assumed royalty rates that could be payable if we did not own the trademark, and a market participant discount rate based on a weighted-average cost of capital.
Other definite-life intangible assets are amortized over their useful life and are assessed for impairment when impairment indicators are present.
In 2018, we recorded an impairment charge on goodwill of
$579 million
and other intangibles of
$168 million
. There was
no
impairment of goodwill and other intangibles in 2017 and 2016. See Note 5 and Note 10 to the Consolidated Financial Statements for additional information about goodwill and other intangibles.
Accounts Payable Outsourcing
We offer our suppliers access to third party payable processors, independent from Whirlpool. The processors allow suppliers to sell their receivables to financial institutions at the sole discretion of both the supplier and the financial institution. In China, as a common practice, we pay suppliers with banker's acceptance drafts. Banker's acceptance drafts allow suppliers to sell their receivables to financial institutions at the sole discretion of both the supplier and the financial institution. We have no economic interest in the sale of these receivables and no direct financial relationship with the financial institutions concerning these services. All of our obligations, including amounts due, remain to our suppliers as stated in our supplier agreements. As of
December 31, 2018
and
2017
, approximately
$1.4 billion
and
$1.5 billion
, respectively, have been issued to participating financial institutions.
Derivative Financial Instruments
We use derivative instruments designated as cash flow and fair value hedges to manage our exposure to the volatility in material costs, foreign currency and interest rates on certain debt instruments. Changes in the fair value of derivative assets or liabilities (i.e., gains or losses) are recognized depending upon the type of hedging relationship and whether a hedge has been designated. For those derivative instruments that qualify for hedge accounting, we designate the hedging instrument, based upon the exposure being hedged, as a cash flow hedge, fair value hedge, or a hedge of a net investment in a foreign operation. For a derivative instrument designated as a fair value hedge, the gain or loss on the derivative is recognized in earnings immediately with the offsetting gain or loss on the hedged item. For a derivative instrument designated as a cash flow hedge, the effective portion of the derivative's gain or loss is initially reported as a component of Other Comprehensive Income (Loss) and is subsequently recognized in earnings when the hedged exposure affects earnings. For a derivative instrument designated as a hedge of a net investment in a foreign operation, the effective portion of the derivative's gain or loss is reported in Other Comprehensive Income (Loss) as part of the cumulative translation adjustment. Changes in fair value of derivative instruments that do not qualify for hedge accounting are recognized immediately in current net earnings. See Note
9
to the Consolidated Financial Statements for additional information about hedges and derivative financial instruments.
Foreign Currency Translation and Transactions
Foreign currency denominated assets and liabilities are translated into United States dollars at exchange rates existing at the respective balance sheet dates. Translation adjustments resulting from fluctuations in exchange rates are recorded as a separate component of Accumulated Other Comprehensive Income (Loss). The results of operations of foreign subsidiaries are translated at the average exchange rates during the respective periods. Gains and losses resulting from foreign currency transactions are included in net earnings.
Research and Development Costs
Research and development costs are charged to expense and totaled $
572 million
,
$596 million
and
$604 million
in
2018
,
2017
and
2016
, respectively.
53
NOTES TO THE CONSOLIDATED FINANCIAL STATEMENTS - (CONTINUED)
Advertising Costs
Advertising costs are charged to expense when the advertisement is first communicated and totaled
$343 million
,
$330 million
and
$366 million
in
2018
,
2017
and
2016
, respectively.
Income Taxes
We account for income taxes using the asset and liability method. Under this method, deferred tax assets and liabilities are recognized for the future tax consequences of temporary differences between the financial statement and tax basis of assets and liabilities using enacted rates. The effect of a change in tax rates on deferred tax assets is recognized in income in the period of the enactment date.
We recognize, primarily in other noncurrent liabilities, in the Consolidated Balance Sheets, the effects of uncertain income tax positions. Interest and penalties related to uncertain tax positions are reflected in income tax expense. We record liabilities net of the amount, based on technical merits, that will be sustained upon examination. We accrue for other non income tax contingencies when it is probable that a liability to a taxing authority has been incurred and the amount of the contingency can be reasonably estimated.
Provision is made for taxes on undistributed earnings of foreign subsidiaries and related companies to the extent that such earnings are not deemed to be permanently invested.
The Tax Cuts and Jobs Act created a new requirement that certain income earned by foreign subsidiaries, known as global intangible low-tax income (GILTI), must be included in the gross income of their U.S. shareholder. The Company can apply an accounting policy election of either recognizing deferred taxes for temporary differences expected to reverse as GILTI in future years or recognizing such taxes as a current-period expense when incurred. As of December 31, 2018, we have not made a provision for GILTI, however, if in the future we are subject to GILTI, we have elected to treat the tax effect of GILTI as a current-period expense when incurred.
See Note
14
to the Consolidated Financial Statements for additional information about income taxes.
Stock Based Compensation
Stock based compensation expense is based on the grant date fair value and is expensed over the period during which an employee is required to provide service in exchange for the award (generally the vesting period). The Company's stock based compensation includes stock options, performance stock units, performance shares, restricted stock and restricted stock units. The fair value of stock options are determined using the Black-Scholes option-pricing model, which incorporates assumptions regarding the risk-free interest rate, expected volatility, expected option life, expected forfeitures and dividend yield. Expected forfeitures are based on historical experience. Stock options are granted with an exercise price equal to the stock price on the date of grant. The fair value of restricted stock units and performance stock units is generally based on the closing market price of Whirlpool common stock on the grant date. Stock based compensation is recorded in selling, general and administrative expense on our Consolidated Statements of Income (Loss). See Note
12
to the Consolidated Financial Statements for additional information about stock based compensation.
BEFIEX Credits
In previous years, our Brazilian operations earned tax credits under the Brazilian government's export incentive program (BEFIEX). These credits reduced Brazilian federal excise taxes on domestic sales, resulting in an increase in the operations' recorded net sales in 2017 and 2016. In 2018, these credit are reflected in interest and sundry income. We recognized export credits as they were monetized. See Note 2, Note
7
and Note
14
to the Consolidated Financial Statements for additional information regarding BEFIEX credits.
Out-of-Period Adjustment
During 2017, we recorded prior period adjustments in our Asia reportable segment primarily related to trade promotion incentives. The 2017 net impact of these out-of-period adjustments was a decrease to net sales of approximately
$35 million
and an increase to other operating expenses of approximately
$8 million
before tax. We determined that the impact was immaterial to prior periods. These adjustments resulted in a decrease to net earnings available to Whirlpool of approximately
$16 million
and a decrease of
$0.22
in diluted earnings per share.
54
NOTES TO THE CONSOLIDATED FINANCIAL STATEMENTS - (CONTINUED)
Related Party Transaction
In 2018, Whirlpool of India Limited (Whirlpool India), a majority-owned subsidiary of Whirlpool Corporation, acquired a
49%
equity interest in Elica PB India for
$22 million
. Whirlpool Corporation owns
12.54%
of Elica S.p.A, the parent of Elica PB India. As part of the agreement, Whirlpool India received an option to acquire the remaining equity interest in the future for fair value, and the non-Whirlpool India shareholders of Elica PB India received an option to sell their remaining equity interest to Whirlpool India in the future for fair value, which could be material to the financial statements depending on the performance of the venture. We account for our minority interest under the equity method of accounting.
Adoption of New Accounting Standards
On January 1, 2018, we adopted Accounting Standards Update ("ASU") No. 2014-09, "Revenue from Contracts with Customers (Topic 606)" using the modified retrospective method. Under the modified retrospective method, we recognized the cumulative effect of initially applying the new revenue standard as an increase to the opening balance of retained earnings. This adjustment did not have a material impact on our financial statements. For additional information on the required disclosures related to the impact of adopting this standard, see Note
2
to the Consolidated Financial Statements.
In October 2016, the Financial Accounting Standards Board ("FASB") issued ASU 2016-16, "Income Taxes (Topic 740): Intra-Entity Transfers of Assets Other Than Inventory," which requires an entity to recognize the income tax consequences of an intra-entity transfer of an asset other than inventory when the transfer occurs. The amendments were effective for fiscal years, and interim periods within those fiscal years, beginning after December 15, 2017, and should be applied on a modified retrospective basis through a cumulative-effect adjustment directly to retained earnings at the beginning of the period of adoption. The Company adopted the accounting standard on January 1, 2018 and recognized a
$56 million
increase to the opening balance of retained earnings.
In January 2017, the FASB issued ASU 2017-04, "Intangibles - Goodwill and Other (Topic 350): Simplifying the Test for Goodwill Impairment". The guidance in ASU 2017-04 eliminates the requirement to determine the fair value of individual assets and liabilities of a reporting unit to measure goodwill impairment. Under the amendments in the new standard, goodwill impairment testing will be performed by comparing the fair value of the reporting unit with its carrying amount and recognizing an impairment charge for the amount by which the carrying amount exceeds the reporting unit's fair value. The new standard is effective for annual and interim goodwill impairment tests in fiscal years beginning after December 15, 2019, and should be applied on a prospective basis. Early adoption is permitted for annual or interim goodwill impairment testing performed after January 1, 2017. The Company elected to early adopt the accounting standard in the second quarter of 2018. For additional information related to the impact of goodwill impairment, see Note
5
to the Consolidated Financial Statements.
We adopted the following standards, none of which have a material impact on our Consolidated Financial Statements:
|
Standard
|
Effective Date
|
|
|
2016-01
|
Financial Instruments - Overall (Subtopic 825-10): Recognition and Measurement of Financial Assets and Financial Liabilities
|
January 1, 2018
|
|
2016-04
|
Liabilities-Extinguishments of Liabilities (Subtopic 405-20): Recognition of Breakage for Certain Prepaid Stored-Value Products
|
January 1, 2018
|
|
2016-15
|
Statement of Cash Flows (Topic 230): Classification of Certain Cash Receipts and Cash Payments
|
January 1, 2018
|
|
2016-18
|
Statement of Cash Flows (Topic 230): Restricted Cash
|
January 1, 2018
|
|
2017-01
|
Business Combinations (Topic 805): Clarifying the Definition of a Business
|
January 1, 2018
|
|
2017-09
|
Compensation-Stock Compensation (Topic 718): Scope of Modification Accounting
|
January 1, 2018
|
All other new issued and effective accounting standards during 2018 were not relevant or material to the Company.
Accounting Pronouncements Issued But Not Yet Effective
In November 2018, the FASB issued ASU 2018-18, "Collaborative Arrangements (Topic 808): Clarifying the Interaction between Topic 808 and Topic 606." The new standard is effective for fiscal years beginning after December 15, 2019, and interim periods within those fiscal years. Early adoption is permitted in any interim period for entities that have adopted ASC 606. The standard should be applied retrospectively to the period when initially adopted ASC 606. The Company is currently evaluating the impact of adopting this guidance.
55
NOTES TO THE CONSOLIDATED FINANCIAL STATEMENTS - (CONTINUED)
In October 2018, the FASB issued ASU 2018-17, "Consolidation (Topic 810): Targeted Improvements to Related Party Guidance for Variable Interest Entities". The new standard changes how entities evaluate decision-making fees under the variable interest entity guidance. The new standard is effective for fiscal years beginning after December 15, 2019, and interim periods within those fiscal years. Early adoption is permitted in any interim period after issuance. The standard should be applied on a modified retrospective basis through a cumulative-effect adjustment directly to retained earnings at the beginning of the period of adoption. The Company is currently evaluating the impact of adopting this guidance.
In February 2018, the FASB issued ASU 2018-02, "Income Statement - Reporting Comprehensive Income (Topic 220): Reclassification of Certain Tax Effects from Accumulated Other Comprehensive Income". The new standard gives entities the option to reclassify to retained earnings tax effects related to items in accumulated other comprehensive income as a result of the tax reform. The new standard is effective for fiscal years beginning after December 15, 2018, and interim periods within those fiscal years. Early adoption is permitted in any interim period after issuance. The Company is currently evaluating the impact of adopting this guidance.
In August 2017, the FASB issued ASU 2017-12, "Derivatives and Hedging (Topic 815): Targeted Improvements to Accounting for Hedging Activities". The new standard is effective for fiscal years beginning after December 15, 2018, and interim periods within those fiscal years. Early adoption is permitted in any interim period after issuance. All transition requirements and elections should be applied to hedging relationships existing (that is, hedging relationships in which the hedging instrument has not expired, been sold, terminated, or exercised or the entity has not removed the designation of the hedging relationship) on the date of adoption. The effect of adoption should be reflected as of the beginning of the fiscal year in which the entity adopts. The Company is currently evaluating the impact of adopting this guidance.
In February 2016, the FASB issued ASU No. 2016-02, "Leases (Topic 842)". The guidance in ASU 2016-02 supersedes the lease recognition requirements in ASC Topic 840, Leases (FAS 13). The new standard establishes a right-of-use (ROU) model that requires a lessee to record a ROU asset and a lease liability on the balance sheet for leases with terms longer than 12 months. Leases will be classified as either finance or operating, with classification affecting the pattern of expense recognition in the income statement. The new standard is effective for fiscal years beginning after December 15, 2018, including interim periods within those fiscal years, with early adoption permitted. The Company has elected the package of practical expedients to not reassess prior conclusions related to contracts containing leases, lease classification and initial direct costs. In March 2018, the FASB approved a new, optional transition method that will give companies the option to use the effective date as the date of initial application on transition. The Company is electing the transition method, and as a result, the Company will not adjust its comparative period financial information or make the new required lease disclosures for periods before the effective date. The Company has elected to make the accounting policy election for short-term leases. The lease payments will be recorded as an expense on a straight-line basis over the lease term. The Company has elected to not separate lease and non-lease components. The Company will not elect the hindsight practical expedient. The Company will not elect the land easement practical expedient.
In connection with the adoption of the new lease accounting standard, we established a cross-functional implementation team. As part of that process, we have completed scoping reviews and updated business process, systems, accounting policies and internal controls.
The implementation strategy to obtain and summarize our leases includes utilizing surveys to centrally gather more information about the Company's existing leases, lease processes, and contracts that may contain leases, including service agreements. The Company selected a new system to maintain all lease data. To ensure completeness of the population of lease contracts, the results of the survey were being cross-referenced against other available lease information such as prior year-end disclosures and recorded lease expense. As of December 31, 2018, the Company has obtained the relevant lease contract data points.
The Company anticipates the adoption of this new standard will recognize approximately
$800 million
to
$900 million
of ROU assets and liabilities on our consolidated balance sheet. The impact on the Company's consolidated statements of income is being evaluated. As the impact of this standard is non–cash in nature, we do not anticipate its adoption having an impact on the consolidated statements of cash flows. There will also be no impact on existing debt covenants.
Upon adoption there will be a decrease of approximately
$78 million
to other liabilities as this amount represents deferred gains on sale leaseback transactions which will be recognized as a cumulative adjustment to retained earnings on the date of adoption.
56
NOTES TO THE CONSOLIDATED FINANCIAL STATEMENTS - (CONTINUED)
The FASB has issued the following relevant standards, which are not expected to have a material impact on our Consolidated Financial Statements:
|
Standard
|
Effective Date
|
|
|
2016-13
|
Financial Instruments - Credit Losses (Topic 326): Measurement of Credit Losses on Financial Instruments
|
January 1, 2020
|
|
2018-13
|
Fair Value Measurement (Topic 820): Disclosure Framework - Changes to the Disclosure Requirements for Fair Value Measurement
|
January 1, 2020
|
|
2018-14
|
Compensation - Retirement Benefits - Defined Benefit Plans - General (Subtopic 715-20): Disclosure Framework - Changes to the Disclosure Requirements for Defined Benefit Plans
|
January 1, 2021
|
|
2018-15
|
Intangibles - Goodwill and Other - Internal-Use Software (Subtopic 350-40): Customer's Accounting for Implementation Costs Incurred In a Cloud Computing Arrangement That Is a Service Contract
|
January 1, 2020
|
All other issued and not yet effective accounting standards are not relevant to the Company.
(
2
)
REVENUE RECOGNITION
Revenue from Contracts with Customers
On January 1, 2018, we adopted Topic 606 using the modified retrospective method, as a result, we recognized the cumulative effect of initially applying the new revenue standard as an adjustment to the opening balance of retained earnings. This adjustment did not have a material impact on our Consolidated Financial Statements. Results for reporting periods beginning after January 1, 2018 are presented under Topic 606, while prior period amounts are not adjusted and continue to be reported in accordance with our historic accounting under Revenue Recognition ("Topic 605"). The adoption of Topic 606 did not have a material impact on our Consolidated Statements of Comprehensive Income (Loss) and Consolidated Balance Sheets.
The adoption of Topic 606 represents a change in accounting principle that will provide financial statement readers with enhanced revenue recognition disclosures. In accordance with Topic 606, revenue is recognized when performance obligations under the terms of a contract with our customer are satisfied; generally this occurs with the transfer of control of our products or services. Revenue is measured as the amount of consideration we expect to receive in exchange for transferring products or providing services. Certain customers may receive cash and/or non-cash incentives, which are accounted for as variable consideration. To achieve this core principle, the Company applies the following five steps:
1. Identify the contract with a customer
A contract with a customer exists when (i) the Company enters into an agreement with a customer that defines each party's rights regarding the products or services to be transferred and identifies the payment terms related to these products or services, (ii) both parties to the contract are committed to perform their respective obligations, (iii) the contract has commercial substance, and (iv) the Company determines that collection of substantially all consideration for products or services that are transferred is probable based on the customer's intent and ability to pay the promised consideration. The Company applies judgment in determining the customer's ability and intention to pay, which is based on a variety of factors including the customer's payment history or, in the case of a new customer, published credit and financial information pertaining to the customer.
2. Identify the performance obligations in the contract
Performance obligations promised in a contract are identified based on the products or services that will be transferred to the customer that are both capable of being distinct, whereby the customer can benefit from the product or service either on its own or together with other resources that are readily available from third parties or from the Company, and are distinct in the context of the contract, whereby the transfer of the products or services is separately identifiable from other promises in the contract. To the extent a contract includes multiple promised products or services, the Company must apply judgment to determine whether promised products or services are capable of being distinct and distinct in the context of the contract. If these criteria are not met, the promised products or services are accounted for as a combined performance obligation. The Company has elected to account for shipping and handling activities as a fulfillment cost as permitted by the standard.
57
NOTES TO THE CONSOLIDATED FINANCIAL STATEMENTS - (CONTINUED)
3. Determine the transaction price
The transaction price is determined based on the consideration to which the Company will be entitled in exchange for transferring products or services to the customer. To the extent the transaction price is variable, revenue is recognized at an amount equal to the consideration to which the Company expects to be entitled. This estimate includes customer sales incentives which are accounted for as a reduction to revenue and estimated primarily using the expected value method. Determining the transaction price requires significant judgment, which is discussed by revenue category in further detail below.
In practice, we do not offer extended payment terms beyond one year to customers. As such, we do not adjust our consideration for financing arrangements.
4. Allocate the transaction price to performance obligations in the contract
If the contract contains a single performance obligation, the entire transaction price is allocated to the single performance obligation. Contracts that contain multiple performance obligations require an allocation of the transaction price to each performance obligation based on a relative standalone selling price basis unless a portion of the variable consideration related to the contract is allocated entirely to a performance obligation. The Company determines standalone selling price based on the price at which the performance obligation is sold separately.
5. Recognize revenue when or as the Company satisfies a performance obligation
The Company generally satisfies performance obligations at a point in time. Revenue is recognized based on the transaction price at the time the related performance obligation is satisfied by transferring a promised product or service to a customer. The impact to revenue related to prior period performance obligations in the twelve months ended
December 31, 2018
is immaterial.
Disaggregation of Revenue
The following table presents our disaggregated revenues by revenue source. We sell products within all product categories in each operating segment. Revenues related to compressors are fully reflected in our Latin America segment. For additional information on the disaggregated revenues by geographical regions, see Note
15
to the Consolidated Financial Statements.
|
Twelve Months Ended December 31,
|
||||
|
Millions of dollars
|
2018
|
|||
|
Major product categories:
|
||||
|
Laundry
|
$
|
6,200
|
|
|
|
Refrigeration
|
6,051
|
|
||
|
Cooking
|
4,821
|
|
||
|
Dishwashing
|
1,645
|
|
||
|
Total major product category net sales
|
$
|
18,717
|
|
|
|
Compressors
|
1,135
|
|
||
|
Spare parts and warranties
|
1,030
|
|
||
|
Other
|
155
|
|
||
|
Total net sales
|
$
|
21,037
|
|
|
Major Product Category Sales
Whirlpool Corporation manufactures and markets a full line of home appliances and related products and services. Our major product categories include the following: refrigeration, laundry, cooking, and dishwashing. The refrigeration product category includes refrigerators, freezers, ice makers and refrigerator water filters. The laundry product category includes laundry appliances and related laundry accessories. The cooking category includes cooking appliances and other small domestic appliances. The dishwashing product category includes dishwasher appliances and related
58
NOTES TO THE CONSOLIDATED FINANCIAL STATEMENTS - (CONTINUED)
accessories. In addition, we also produce hermetic compressors for refrigeration systems which is not considered a major product category.
For product sales and compressors, we transfer control and recognize a sale when we ship the product from our manufacturing facility to our customer or when the customer receives the product based upon agreed shipping terms. Each unit sold is considered an independent, unbundled performance obligation. We do not have any additional performance obligations other than product sales that are material in the context of the contract. The amount of consideration we receive and revenue we recognize varies due to sales incentives and returns we offer to our customers. When we give our customers the right to return eligible products, we reduce revenue for our estimate of the expected returns which is primarily based on an analysis of historical experience.
Spare Parts & Warranties
Spare parts are primarily sold to parts distributors and retailers, with a small number of sales to end consumers. For spare part sales, we transfer control and recognize a sale when we ship the product to our customer or when the customer receives product based upon agreed shipping terms. Each unit sold is considered an independent, unbundled performance obligation. We do not have any additional performance obligations other than spare part sales that are material in the context of the contract. The amount of consideration we receive and revenue we recognize varies due to sales incentives and returns we offer to our customers. When we give our customers the right to return eligible products, we reduce revenue for our estimate of the expected returns which is primarily based on an analysis of historical experience.
Warranties are classified as either assurance type or service type warranties. A warranty is considered an assurance type warranty if it provides the consumer with assurance that the product will function as intended. A warranty that goes above and beyond ensuring basic functionality is considered a service type warranty. The Company offers certain limited warranties that are assurance type warranties and extended service arrangements that are service type warranties. Assurance type warranties are not accounted for as separate performance obligations under the revenue model. If a service type warranty is sold with a product or separately, revenue is recognized over the life of the warranty. The Company evaluates warranty offerings in comparison to industry standards and market expectations to determine appropriate warranty classification. Industry standards and market expectations are determined by jurisdictional laws, competitor offerings and customer expectations. Market expectations and industry standards can vary based on product type and geography. The Company primarily offers assurance type warranties.
Whirlpool sells certain extended service arrangements separately from the sale of products. Whirlpool acts as a sales agent under some of these arrangements whereby the Company receives a fee that is recognized as revenue upon the sale of the extended service arrangement. The Company is also the principal for certain extended service arrangements. Revenue related to these arrangements is recognized ratably over the contract term.
Other Revenue
Other revenue sources include subscription arrangements and licenses as described below.
The Company has a water subscription business in our Latin America segment which provides the customer with a water filtration system that is delivered to the consumer's home. Our water subscription contracts represent a performance obligation that is satisfied over time and revenue is recognized as the performance obligation is completed. The installation and maintenance of the water filtration system are not distinct services in the context of the contract (i.e., the customer views all activities associated with the arrangement as one singular value proposition). The contract term is generally
less than one year
for these arrangements and revenue is recognized based on the monthly invoiced amount which directly corresponds to the value of our performance completed to date.
We license our brands in arrangements that do not include other performance obligations. Whirlpool licensing provides a right of access to the Company's intellectual property throughout the license period. Whirlpool recognizes licensing revenue over the life of the license contract as the underlying sale or usage occurs. As a result, we recognize revenue for these contracts at the amount which directly corresponds to the value provided to the customer.
59
NOTES TO THE CONSOLIDATED FINANCIAL STATEMENTS - (CONTINUED)
Costs to Obtain or Fulfill a Contract
We do not capitalize costs to obtain a contract because a nominal number of contracts have terms that extend beyond one year. The Company does not have a significant amount of capitalized costs related to fulfillment.
Sales Tax and Other Non Income Taxes
The Company is subject to certain non-income taxes in certain jurisdictions including but not limited to sales tax, value added tax, excise tax and other taxes we collect concurrent with revenue-producing activities that are excluded from the transaction price, and therefore, excluded from revenue.
Bad Debt Expense
For the twelve months ended
December 31, 2018
, we recorded approximately
$27 million
of bad debt expense related to trade customer insolvency of a Brazilian retailer. There was an immaterial amount of bad debt expense recorded in the prior periods.
Financial Statement Impact of Adopting Topic 606
On January 1, 2018, we adopted Topic 606 using the modified retrospective method. In previous years, our Brazilian operations earned tax credits under the Brazilian government's export incentive program (BEFIEX). These credits reduced Brazilian federal excise taxes on domestic sales. Prior to the adoption of Topic 606, the excise taxes in our Brazilian operations were reflected in revenue. In accordance with Topic 606, we made a policy election to exclude non-income taxes from the transaction price. As a result, these credits in 2018 are reflected in interest and sundry income. Based on our evaluation, we determined no significant changes are required to our business processes, systems and controls to effectively report revenue recognition under the new standard. Adoption of the new standard does not materially change the timing or amount of revenue recognized in our Consolidated Financial Statements.
(
3
)
CASH, CASH EQUIVALENTS AND RESTRICTED CASH
The following table provides a reconciliation of cash, cash equivalents and restricted cash as reported within our Consolidated Statements of Cash Flows:
|
December 31
|
|||||||||||
|
Millions of dollars
|
2018
|
2017
|
2016
|
||||||||
|
Cash and cash equivalents as presented in our Consolidated Balance Sheets
|
$
|
1,498
|
|
$
|
1,196
|
|
$
|
1,085
|
|
||
|
Restricted cash included in prepaid and other current assets
(1)
|
40
|
|
48
|
|
45
|
|
|||||
|
Restricted cash included in other noncurrent assets
(1)
|
—
|
|
49
|
|
110
|
|
|||||
|
Cash, cash equivalents and restricted cash as presented in our Consolidated Statements of Cash Flows
|
$
|
1,538
|
|
$
|
1,293
|
|
$
|
1,240
|
|
||
(1)
Change in restricted cash resulted in realization of foreign currency translation adjustments of
$3 million
and (
$8 million
), respectively, for the twelve months ended December 31, 2018 and 2017 compared to the prior year.
60
NOTES TO THE CONSOLIDATED FINANCIAL STATEMENTS - (CONTINUED)
(
4
)
INVENTORIES
The following table summarizes our inventories at
December 31, 2018
and
2017
:
|
Millions of dollars
|
2018
|
2017
|
||||||
|
Finished products
|
$
|
2,076
|
|
$
|
2,374
|
|
||
|
Raw materials and work in process
|
617
|
|
725
|
|
||||
|
2,693
|
|
3,099
|
|
|||||
|
Less: excess of FIFO cost over LIFO cost
|
(160
|
)
|
(111
|
)
|
||||
|
Total inventories
|
$
|
2,533
|
|
|
$
|
2,988
|
|
|
LIFO inventories represented
41%
and
38%
of total inventories at
December 31, 2018
and
2017
, respectively.
(
5
)
GOODWILL AND OTHER INTANGIBLES
Goodwill
The following table summarizes goodwill attributable to our reporting units for the periods presented:
|
Millions of dollars
|
North
America |
EMEA
|
Latin
America |
Asia
|
Total
Whirlpool |
||||||||||||||
|
Beginning balance December 31, 2017
|
$
|
1,755
|
|
$
|
920
|
|
$
|
5
|
|
$
|
438
|
|
$
|
3,118
|
|
||||
|
Reassignment of goodwill
(1)
|
(54
|
)
|
—
|
|
53
|
|
1
|
|
—
|
|
|||||||||
|
Impairment
(2)
|
—
|
|
(579
|
)
|
—
|
|
—
|
|
(579
|
)
|
|||||||||
|
Reclassification to asset held for sale
|
—
|
|
—
|
|
(23
|
)
|
—
|
|
(23
|
)
|
|||||||||
|
Currency translation adjustment
|
(8
|
)
|
(32
|
)
|
(2
|
)
|
(23
|
)
|
(65
|
)
|
|||||||||
|
Ending net balance December 31, 2018
|
$
|
1,693
|
|
$
|
309
|
|
$
|
33
|
|
$
|
416
|
|
$
|
2,451
|
|
||||
(1)
Effective January 1, 2018, we realigned the composition of certain segments to align with our new leadership reporting structure. We now report our Mexico business as a part of our Latin America segment. As a result, we reassigned approximately
$53 million
of goodwill, using a relative fair value approach, from the North America reporting unit to the Latin America reporting unit.
(2)
The EMEA reporting unit has
$579 million
of accumulated impairment losses as of December 31, 2018. No other reporting units have accumulated impairment losses as of December 31, 2018.
Interim impairment assessment
In connection with the preparation of our Consolidated Condensed Financial Statements for three months ended June 30, 2018, we identified indicators of goodwill impairment for our EMEA reporting unit based on our qualitative assessment, which required us to complete an interim quantitative impairment assessment. The primary indicator of impairment for our EMEA reporting unit was the segment's continuing negative financial performance in 2018 that did not improve as anticipated, primarily driven by significant volume loss. The actual operating results for the three-months ended June 30, 2018 were significantly lower than forecasted resulting in weak business performance. While the Indesit integration activities are substantially complete, as of the impairment date, the operating and macro-environment in the EMEA region continued to be very challenging and had not improved as anticipated. While our commercial transformation and supply chain initiatives are progressing, as of the impairment determination date, progress on market share recovery was slower than previously anticipated and the business had been impacted by raw material inflation and currency headwinds.
In performing our quantitative assessment of goodwill during the second quarter of 2018, we estimated the reporting unit's fair value under an income approach using a discounted cash flow model. The income approach used the reporting unit's projections of estimated operating results and cash flows that were discounted using a market participant discount rate based on the weighted-average cost of capital. The main assumptions supporting the cash flow projections included revenue growth, EBIT margins and the discount rate. The financial projections reflect management's best estimate of economic and market conditions over the projected period including forecasted revenue growth, EBIT margins, tax rate, capital expenditures, depreciation and amortization, changes in working capital requirements and the terminal growth rate.
61
NOTES TO THE CONSOLIDATED FINANCIAL STATEMENTS - (CONTINUED)
Based on our interim quantitative impairment assessment as of June 30, 2018, the carrying value of the EMEA reporting unit exceeded its fair value by
$579 million
and we recorded a goodwill impairment charge in this amount in 2018.
Future impairments could result if the reporting unit experiences further deterioration in business performance or if there is a significant change in other qualitative or quantitative factors, including an increase in discount rates or a decrease in forecasted EBIT margin.
Annual impairment assessment
We completed our annual impairment test for goodwill as of October 1,
2018
. The Company elected to bypass the qualitative assessment and perform a quantitative assessment to evaluate goodwill for all our reporting units. Based on the quantitative assessment we determined there was no impairment of goodwill.
Other Intangible Assets
The following table summarizes other intangible assets for the period presented:
|
|
|
December 31, 2018
|
|
December 31, 2017
|
||||||||||||||||||||
|
Millions of dollars
|
|
Gross Carrying Amount
|
|
Accumulated Amortization
|
|
Net
|
|
Gross Carrying Amount
|
|
Accumulated Amortization
|
|
Net
|
||||||||||||
|
Other intangible assets, finite lives:
|
|
|
|
|
|
|
|
|
|
|
|
|
||||||||||||
|
Customer relationships
(1)
|
|
$
|
622
|
|
|
$
|
(330
|
)
|
|
$
|
292
|
|
|
$
|
639
|
|
|
$
|
(297
|
)
|
|
$
|
342
|
|
|
Patents and other
(2)
|
|
328
|
|
|
(197
|
)
|
|
131
|
|
|
387
|
|
|
(179
|
)
|
|
208
|
|
||||||
|
Total other intangible assets, finite lives
|
|
$
|
950
|
|
|
$
|
(527
|
)
|
|
$
|
423
|
|
|
$
|
1,026
|
|
|
$
|
(476
|
)
|
|
$
|
550
|
|
|
Trademarks, indefinite lives
(3)
|
|
1,873
|
|
|
—
|
|
|
1,873
|
|
|
2,041
|
|
|
—
|
|
|
2,041
|
|
||||||
|
Total other intangible assets
|
|
$
|
2,823
|
|
|
$
|
(527
|
)
|
|
$
|
2,296
|
|
|
$
|
3,067
|
|
|
$
|
(476
|
)
|
|
$
|
2,591
|
|
(1)
Customer relationships have an estimated useful life of
5
to
19
years.
(2)
Patents and other intangibles have an estimated useful life of
3
to
43
years
.
Includes impairment charges of
$60 million
at June 30, 2018 and the transfer of certain intangible land use rights to the China government resulting in a
$27 million
gain, as well as the impact of foreign currency.
(3)
Includes impairment charges of
$108 million
at June 30, 2018.
Interim impairment assessment
In connection with the preparation of our Consolidated Condensed Financial Statements for three months ended June 30, 2018, we identified indicators of impairment associated with other intangible assets in our EMEA reporting unit based on our qualitative assessment, which required us to complete an interim quantitative impairment assessment. The primary indicator of impairment was the continuing decline in revenue from weaker volumes through the six months ended June 30, 2018 that did not improve as anticipated. The actual operating results for the three months ended June 30, 2018 were significantly lower than forecasted.
In performing our quantitative assessment of other intangible assets, primarily brands, we estimate the fair value using the relief-from-royalty method which requires assumptions related to projected revenues from our long-range plans; assumed royalty rates that could be payable if we did not own the brand; and a market participant discount rate based on a weighted-average cost of capital.
Based on our interim quantitative impairment assessment as of June 30, 2018, the carrying value of certain other intangible assets, including
Indesit
and
Hotpoint*
, exceeded their fair value, and we recorded an impairment charge of
$168 million
in 2018.
Annual impairment assessment
We completed our annual impairment assessment for other intangible assets as of October 1,
2018
. The Company elected to bypass the qualitative assessment and perform a quantitative assessment to evaluate certain brand trademarks. Based on the results of the quantitative assessment, we determined there was an immaterial impairment
*Whirlpool ownership of the Hotpoint brand in the EMEA and Asia Pacific regions is not affiliated with the Hotpoint brand sold in the Americas.
62
NOTES TO THE CONSOLIDATED FINANCIAL STATEMENTS - (CONTINUED)
as a result of the restructuring initiative announced in the fourth quarter to exit from the domestic sales operations in Turkey (not including manufacturing operations). See Note 13 to the Consolidated Financial Statements for additional information. There was no impairment of any other indefinite-life intangible assets.
The Company elected to perform a qualitative assessment on the other indefinite-life intangible assets noting no events that indicated that the fair value was less than carrying value that would require a quantitative impairment assessment.
See Note
10
to the Consolidated Financial Statements for additional information on the fair value measurement and disclosures related to the goodwill and other intangibles impairment.
The estimates of future cash flows used in determining the fair value of goodwill and intangible assets involve significant management judgment and are based upon assumptions about expected future operating performance, economic conditions, market conditions and cost of capital. Inherent in estimating the future cash flows are uncertainties beyond our control, such as changes in capital markets. The actual cash flows could differ materially from management's estimates due to changes in business conditions, operating performance and economic conditions.
Amortization expense was
$75 million
,
$79 million
and
$71 million
for the years ended
December 31, 2018
,
2017
and
2016
, respectively.
The following table summarizes our future estimated amortization expense by year:
|
Millions of dollars
|
|
||
|
2019
|
$
|
67
|
|
|
2020
|
58
|
|
|
|
2021
|
56
|
|
|
|
2022
|
49
|
|
|
|
2023
|
43
|
|
|
63
NOTES TO THE CONSOLIDATED FINANCIAL STATEMENTS - (CONTINUED)
(
6
)
FINANCING ARRANGEMENTS
Long-Term Debt
The following table summarizes our long-term debt at
December 31, 2018
and
2017
:
|
Millions of dollars
|
2018
|
2017
|
||||
|
Senior note - 4.50%, maturing 2018
|
$
|
—
|
|
$
|
363
|
|
|
Senior note - 2.40%, maturing 2019
|
250
|
|
250
|
|
||
|
Senior note - 1.00%, maturing 2019
|
687
|
|
—
|
|
||
|
Senior note - 0.625% maturing 2020
|
572
|
|
599
|
|
||
|
Senior note - 4.85%, maturing 2021
|
300
|
|
300
|
|
||
|
Senior note - 4.70%, maturing 2022
|
300
|
|
300
|
|
||
|
Senior note - 3.70%, maturing 2023
|
250
|
|
250
|
|
||
|
Senior note - 4.00%, maturing 2024
|
300
|
|
300
|
|
||
|
Senior note - 3.70%, maturing 2025
|
350
|
|
350
|
|
||
|
Senior note - 1.25% maturing 2026
|
567
|
|
594
|
|
||
|
Senior note - 1.10% maturing 2027
|
681
|
|
713
|
|
||
|
Senior note - 5.15% maturing 2043
|
250
|
|
249
|
|
||
|
Senior note - 4.50% maturing 2046
|
496
|
|
496
|
|
||
|
Other, net
|
(10
|
)
|
4
|
|
||
|
$
|
4,993
|
|
$
|
4,768
|
|
|
|
Less current maturities
|
947
|
|
376
|
|
||
|
Total long-term debt
|
$
|
4,046
|
|
$
|
4,392
|
|
The following table summarizes the contractual maturities of our long-term debt, including current maturities, at
December 31, 2018
:
|
Millions of dollars
|
|
||
|
2019
|
$
|
947
|
|
|
2020
|
570
|
|
|
|
2021
|
298
|
|
|
|
2022
|
298
|
|
|
|
2023
|
248
|
|
|
|
Thereafter
|
2,632
|
|
|
|
Long-term debt, including current maturities
|
$
|
4,993
|
|
Debt Offering
On November 9, 2017, Whirlpool Luxembourg, an indirect, wholly-owned finance subsidiary of Whirlpool Corporation, completed a debt offering of
€600 million
(approximately
$699 million
as of the date of issuance) principal amount of
1.100%
notes due in 2027. The Company has fully and unconditionally guaranteed these notes. The notes contain covenants that limit Whirlpool Corporation's ability to incur certain liens or enter into certain sale and lease-back transactions. In addition, if we experience a specific kind of change of control, we are required to make an offer to purchase all of the notes at a purchase price of
101%
of the principal amount thereof, plus accrued and unpaid interest. The notes are registered under the Securities Act of 1933, as amended, pursuant to our Registration Statement on Form S-3 (File No.333-203704-1) filed with the Securities and Exchange Commission on October 25, 2016.
Debt Repayment
On April 26, 2018,
$363 million
of
4.50%
senior notes matured and were repaid. On November 1, 2017,
$300 million
of
1.65%
senior notes matured and were repaid. On March 1, 2017,
$250 million
of
1.35%
senior notes matured and were repaid.
64
NOTES TO THE CONSOLIDATED FINANCIAL STATEMENTS - (CONTINUED)
Term Loan Agreements
On June 5, 2018, the Company and its indirect wholly-owned subsidiary, Whirlpool EMEA Finance S.à. r.l., entered into a Term Loan Agreement (the "Whirlpool EMEA Finance Term Loan") with Wells Fargo Bank, National Association, as Administrative Agent, and certain other financial institutions. Wells Fargo Securities, LLC acted as Sole Lead Arranger and Sole Bookrunner for the Whirlpool EMEA Finance Term Loan. The Whirlpool EMEA Finance Term Loan Agreement provides for an aggregate lender commitment of
€600 million
(approximately
$703 million
as of June 5, 2018) and is recorded in current maturities of long-term debt in our Consolidated Balance Sheets as of December 31, 2018. The Whirlpool EMEA Finance Term Loan has a maturity date of December 1, 2019, and contains an unconditional Company guarantee for repayment of amounts borrowed by Whirlpool EMEA Finance S.à. r.l. under the term loan facility. The Company and Whirlpool EMEA Finance S.à. r.l. also agree to repay outstanding loan amounts with the proceeds received from any future capital markets transaction involving Whirlpool EMEA Finance S.à. r.l. as issuer or the Company as issuer or guarantor.
The interest and fee rates payable with respect to the term loan facility based on the Company's current debt rating are as follows: (1) the spread over EURIBOR is
1.00%
; (2) the spread over prime is
0.125%
; and (3) the ticking fee is
0.125%
, as of the date hereof. The Whirlpool EMEA Finance Term Loan Agreement, as amended August 30, 2018, contains customary covenants and warranties including, among other things, a Company debt to capitalization ratio of less than or equal to
0.65
to 1.00 as of the last day of each fiscal quarter, and a Company rolling twelve month interest coverage ratio required to be greater than or equal to
3.0
to 1.0 for each fiscal quarter. In addition, the covenants limit the Company's ability to (or to permit any subsidiaries to), subject to various exceptions and limitations: (i) merge with other companies; (ii) create liens on its property; (iii) incur debt or off-balance sheet obligations at the subsidiary level; (iv) enter into transactions with affiliates, except on an arms-length basis or with or between subsidiaries; (v) enter into agreements restricting the payment of subsidiary dividends or restricting the making of loans or repayment of debt by subsidiaries to the Company or other subsidiaries; and (vi) enter into agreements restricting the creation of liens on its assets. The covenants also provide that Whirlpool EMEA Finance S.à. r.l must at all times remain a wholly-owned subsidiary of the Company.
On April 23, 2018 the Company entered into, and on May 14, 2018 and August 30, 2018 the Company amended, a Term Loan Agreement (the "Term Loan Agreement") by and among the Company, Citibank, N.A., as Administrative Agent, JPMorgan Chase Bank, N.A. as Syndication Agent, and certain other financial institutions. Citibank, N.A., JPMorgan Chase Bank, N.A., BNP Paribas Securities Corp., Mizuho Bank, Ltd., and Wells Fargo Securities, LLC acted as Joint Lead Arrangers and Joint Bookrunners for the Term Loan Agreement. The Term Loan Agreement provides for an aggregate lender commitment of
$1.0 billion
and is recorded in notes payable in our Consolidated Balance Sheets as of December 31, 2018. The Term Loan Agreement has a maturity date of April 22, 2019, which date may be extended by the Company, in its discretion, prior to the maturity date for an additional
six
months. The Company also has agreed to repay the outstanding term loan amounts with the net cash proceeds received from the closing of the Embraco sale transaction. The proceeds of the Term Loan Agreement were used to fund accelerated share repurchases through a modified Dutch auction tender offer.
The interest and fee rates payable with respect to the term loan facility based on the Company's current debt rating are as follows: (1) the spread over LIBOR is
1.125%
; (2) the spread over prime is
0.125%
; and (3) the ticking fee is
0.125%
, as of the date hereof. The Term Loan Agreement, as amended, contains customary covenants and warranties including, among other things, a debt to capitalization ratio of less than or equal to
0.65
to 1.00 as of the last day of each fiscal quarter, and a rolling twelve month interest coverage ratio required to be greater than or equal to
3.0
to 1.0 for each fiscal quarter. In addition, the covenants limit the Company's ability to (or to permit any subsidiaries to), subject to various exceptions and limitations: (i) merge with other companies; (ii) create liens on its property; (iii) incur debt or off-balance sheet obligations at the subsidiary level; (iv) enter into transactions with affiliates, except on an arms-length basis or with or between subsidiaries; (v) enter into agreements restricting the payment of subsidiary dividends or restricting the making of loans or repayment of debt by subsidiaries to the Company or other subsidiaries; and (vi) enter into agreements restricting the creation of liens on its assets.
Credit Facilities
On September 27, 2017, Whirlpool Corporation exercised its commitment increase and term extension rights under the Third Amended and Restated Long-Term Credit Agreement (the "Amended Long-Term Facility") by and among the Company, certain other borrowers, the lenders referred to therein, JPMorgan Chase Bank, N.A. as Administrative Agent, and Citibank, N.A., as Syndication Agent. In connection with this exercise, the Company entered into a Consent to Commitment Increase agreement with the Administrative Agent , which increases aggregate borrowing capacity under
65
NOTES TO THE CONSOLIDATED FINANCIAL STATEMENTS - (CONTINUED)
the Amended Long-Term Facility from
$2.5 billion
to
$3.0 billion
, and the Administrative Agent received extension request consents from a majority of lenders, which extends the termination date of the Amended Long-Term Facility by one year, to May 17, 2022.
The interest and fee rates payable with respect to the Amended Long-Term Facility based on our current debt rating are as follows: (1) the spread over LIBOR is
1.125%
; (2) the spread over prime is
0.125%
; and (3) the unused commitment fee is
0.125%
. The Amended Long-Term Facility, as amended August 30, 2018, contains customary covenants and warranties including, among other things, a debt to capitalization ratio of less than or equal to
0.65
to 1.00 as of the last day of each fiscal quarter, and a rolling twelve month interest coverage ratio required to be greater than or equal to
3.0
to 1.0 for each fiscal quarter. In addition, the covenants limit our ability to (or to permit any subsidiaries to), subject to various exceptions and limitations: (i) merge with other companies; (ii) create liens on our property; (iii) incur debt or off-balance sheet obligations at the subsidiary level; (iv) enter into transactions with affiliates, except on an arms-length basis; (v) enter into agreements restricting the payment of subsidiary dividends or restricting the making of loans or repayment of debt by subsidiaries to the Company or other subsidiaries; and (vi) enter into agreements restricting the creation of liens on our assets.
In addition to the committed
$3.0 billion
Amended Long-Term Facility, we have a committed European facility and committed credit facilities in Brazil. The European facility provides borrowings up to
€250 million
(approximately
$286 million
at
December 31, 2018
), maturing on September 26, 2019. The committed credit facilities in Brazil provide borrowings up to
1.0 billion
Brazilian reais (approximately
$258 million
at
December 31, 2018
), maturing through 2020.
We had
no
borrowings outstanding under the committed credit facilities at
December 31, 2018
and
2017
, respectively.
Notes Payable
Notes payable, which consist of short-term borrowings payable to banks or commercial paper, are generally used to fund working capital requirements. The proceeds of the term loan, included in short-term borrowings, were used to fund accelerated share repurchases through a modified Dutch auction tender offer in the second quarter of 2018. The fair value of our notes payable approximates the carrying amount due to the short maturity of these obligations. The following table summarizes the carrying value of notes payable at
December 31, 2018
and
2017
, respectively.
|
Millions of dollars
|
2018
|
2017
|
||||||
|
Commercial paper
|
$
|
—
|
|
$
|
401
|
|
||
|
Short-term borrowings to banks
|
1,034
|
|
49
|
|
||||
|
Total notes payable
|
$
|
1,034
|
|
$
|
450
|
|
||
(
7
)
COMMITMENTS AND CONTINGENCIES
OTHER MATTERS
Embraco Antitrust Matters
Beginning in February 2009, our compressor business headquartered in Brazil ("Embraco") was notified of antitrust investigations of the global compressor industry by government authorities in various jurisdictions. Embraco has resolved government investigations and related claims in various jurisdictions and certain other claims remain pending.
We continue to defend these actions. While it is currently not possible to reasonably estimate the aggregate amount of costs which we may incur in connection with these matters, such costs could have a material adverse effect on our financial statements in any particular reporting period.
BEFIEX Credits and Other Brazil Tax Matters
In previous years, our Brazilian operations earned tax credits under the Brazilian government's export incentive program (BEFIEX). These credits reduced Brazilian federal excise taxes on domestic sales. Prior to the adoption of Topic 606, the excise taxes in our Brazilian operations were reflected in revenue. In accordance with Topic 606, we made a policy election to exclude non-income taxes from the transaction price. As a result, these credits in 2018 are reflected in interest and sundry income. For additional information, see Note
2
to the Consolidated Financial Statements.
66
NOTES TO THE CONSOLIDATED FINANCIAL STATEMENTS - (CONTINUED)
In December 2013, the Brazilian government reinstituted the monetary adjustment index applicable to BEFIEX credits that existed prior to July 2009, when the Brazilian government required companies to apply a different monetary adjustment index to BEFIEX credits. Whether use of the reinstituted index should be given retroactive effect for the July 2009 to December 2013 period has been subject to review by the Brazilian courts. In the third quarter of 2017, the Brazilian Supreme Court ruled that the reinstituted index should be given retroactive effect for the July 2009 to December 2013 period, which ruling has been appealed by the Brazilian government. Based on this ruling, we were entitled to recognize, and by the second quarter of 2018 had monetized,
$72 million
in additional credits. As of
December 31, 2018
,
no
BEFIEX credits remain to be monetized.
Our Brazilian operations have received tax assessments for income and social contribution taxes associated with certain monetized BEFIEX credits. We do not believe BEFIEX credits are subject to income or social contribution taxes. We believe these tax assessments are without merit and are vigorously defending our positions. We have not provided for income or social contribution taxes on these BEFIEX credits, and based on the opinions of tax and legal advisors, we have not accrued any amount related to these assessments as of
December 31, 2018
. The total amount of outstanding tax assessments received for income and social contribution taxes relating to the BEFIEX credits, including interest and penalties, is approximately
1.8 billion
Brazilian reais (approximately
$476 million
as of
December 31, 2018
).
Relying on existing Brazilian legal precedent, in 2003 and 2004, we recognized tax credits in an aggregate amount of
$26 million
, adjusted for currency, on the purchase of raw materials used in production ("IPI tax credits"). The Brazilian tax authority subsequently challenged the recording of IPI tax credits. No credits have been recognized since 2004. In 2009, we entered into a Brazilian government program ("IPI Amnesty") which provided extended payment terms and reduced penalties and interest to encourage tax payers to resolve this and certain other disputed tax credit amounts. As permitted by the program, we elected to settle certain debts through the use of other existing tax credits and recorded charges of approximately
$34 million
in 2009 associated with these matters. In July 2012, the Brazilian revenue authority notified us that a portion of our proposed settlement was rejected and we received tax assessments of
248 million
Brazilian reais (approximately
$64 million
as of
December 31, 2018
)
, reflecting interest and penalties to date. We believe these tax assessments are without merit and are vigorously defending our position. The government's assessment in this case relies heavily on its arguments regarding taxability of BEFIEX credits for certain years, which we are disputing in one of the BEFIEX government assessment cases cited in the prior paragraph.
Because the IPI Amnesty case is moving faster than the BEFIEX taxability case, we could be required to pay the IPI Amnesty assessment before obtaining a final decision in BEFIEX taxability case.
In 2001, Brazil adopted a law making the profits of controlled foreign corporations of Brazilian entities subject to income and social contribution tax regardless of whether the profits were repatriated ("CFC Tax"). Our Brazilian subsidiary, along with other corporations, challenged tax assessments on foreign profits on constitutionality and other grounds. In April 2013, the Brazilian Supreme Court ruled on one of our cases, finding that the law is constitutional, but remanded the case to a lower court for consideration of other arguments raised in our appeal, including the existence of tax treaties with jurisdictions in which controlled foreign corporations are domiciled. As of
December 31, 2018
, our potential exposure for income and social contribution taxes relating to profits of controlled foreign corporations, including interest and penalties and net of expected foreign tax credits, is approximately
208 million
Brazilian reais (approximately
$54 million
as of
December 31, 2018
). We believe these assessments are without merit and are vigorously defending our positions. Based on the opinion of our tax and legal advisors, we have
no
t accrued any amount related to these assessments as of
December 31, 2018
.
In addition to the IPI tax credit and CFC Tax matters noted above, other assessments issued to us by the Brazilian tax authorities related to non-income and income tax matters, and other matters, are at various stages of review in numerous administrative and judicial proceedings. The amounts related to these assessments will continue to be increased by monetary adjustments at the Selic rate, which is the benchmark rate set by the Brazilian Central Bank. In accordance with our accounting policies, we routinely assess these matters and, when necessary, record our best estimate of a loss. We believe these tax assessments are without merit and are vigorously defending our positions.
We also filed legal actions to recover certain social integration and social contribution taxes paid over gross sales including ICMS receipts, which is a form of Value Added Tax in Brazil. During 2017, we sold the rights to certain portions of this litigation to a third party for
90 million
Brazilian reais (approximately
$27 million
as of December 31, 2017). Approximately
$219 million
in face value of credits related to this litigation remain. While the Company's recovery with respect to the remaining litigation may be material, there is substantial uncertainty about both the amount and timing of any recovery. A nominal amount has been recorded related to outstanding credits.
67
NOTES TO THE CONSOLIDATED FINANCIAL STATEMENTS - (CONTINUED)
Litigation is inherently unpredictable and the conclusion of these matters may take many years to ultimately resolve. Accordingly, it is possible that an unfavorable outcome in these proceedings could have a material adverse effect on our financial statements in any particular reporting period.
Competition Investigation
In 2013, the French Competition Authority ("FCA") commenced an investigation of appliance manufacturers and retailers in France. The investigation includes a number of manufacturers, including the Whirlpool and Indesit operations in France.
On June 26, 2018, Whirlpool France SAS, a subsidiary of the Company, reached an agreement with the staff of the FCA to settle the first part of its investigation, which relates to a
14
-month period during parts of 2006-07 and 2008-09. In the third quarter of 2018, we accrued
€95 million
after entering into a preliminary settlement agreement with the FCA. On December 6, 2018, the FCA's college issued its final decision, setting the final amount of the fine at
€102 million
, with
€56 million
attributable to Whirlpool's France business and
€46 million
attributable to Indesit's France business. Under the terms of a settlement with Indesit's former owners, the former owners are obligated to pay
€17 million
out of escrow to the Company. The Company expects payment of the FCA fine and payment to the Company from Indesit's former owners to both be made in the second quarter of 2019.
The second part of the FCA investigation, which is expected to focus primarily on manufacturer interactions with retailers, is ongoing but at a less advanced stage. The Company is cooperating with this investigation. Although it is currently not possible to assess the impact, if any, this matter may have on our financial statements, the resolution of the second part of the FCA investigation could have a material adverse effect on our financial statements in any particular reporting period.
Trade Customer Insolvency
In 2017, Alno AG and certain affiliated companies filed for insolvency protection in Germany. Bauknecht Hausgeräte GmbH, a subsidiary of the Company, was a long-standing supplier to Alno and certain of its affiliated companies. The Company was also a former indirect minority shareholder of Alno. In August 2018, the insolvency trustee asserted
€174.5 million
in clawback and related claims against Bauknecht. We are reviewing the claims made by the insolvency trustee. Based on our preliminary understanding of the facts and the applicable law, we expect to vigorously defend against the claims. Although it is currently not possible to assess the impact this matter may have on our Consolidated Financial Statements, the resolution of this matter could have a material adverse effect on our financial statements in any particular reporting period.
Other Litigation
We are currently defending against a lawsuit that has been certified for treatment as a class action in U.S. federal court, relating to two top-load washing machine models. We believe this lawsuit is without merit and are vigorously defending it. Given the preliminary stage of the proceeding, we cannot reasonably estimate a range of loss, if any, at this time. The resolution of this matter could have a material adverse effect on our financial statements in any particular reporting period.
We are currently vigorously defending a number of other lawsuits related to the manufacture and sale of our products which include class action allegations, and may become involved in similar actions. These lawsuits allege claims which include negligence, breach of contract, breach of warranty, product liability and safety claims, false advertising, fraud, and violation of federal and state regulations, including consumer protection laws. In general, we do not have insurance coverage for class action lawsuits. We are also involved in various other legal actions arising in the normal course of business, for which insurance coverage may or may not be available depending on the nature of the action. We dispute the merits of these suits and actions, and intend to vigorously defend them. Management believes, based upon its current knowledge, after taking into consideration legal counsel's evaluation of such suits and actions, and after taking into account current litigation accruals, that the outcome of these matters currently pending against Whirlpool should not have a material adverse effect, if any, on our financial statements.
68
NOTES TO THE CONSOLIDATED FINANCIAL STATEMENTS - (CONTINUED)
Product Warranty and Legacy Product Corrective Action Reserves
Product warranty reserves are included in other current and other noncurrent liabilities in our Consolidated Balance Sheets. The following table summarizes the changes in total product warranty and legacy product warranty liability reserves for the periods presented:
|
Product Warranty
|
Legacy Product Warranty
|
Total
|
||||||||||||||||||||||
|
Millions of dollars
|
2018
|
2017
|
2018
|
2017
|
2018
|
2017
|
||||||||||||||||||
|
Balance at January 1
|
$
|
277
|
|
$
|
251
|
|
$
|
—
|
|
$
|
69
|
|
$
|
277
|
|
$
|
320
|
|
||||||
|
Issuances/accruals during the period
|
289
|
|
331
|
|
—
|
|
1
|
|
289
|
|
332
|
|
||||||||||||
|
Settlements made during the period/other
|
(294
|
)
|
(305
|
)
|
—
|
|
(70
|
)
|
(294
|
)
|
(375
|
)
|
||||||||||||
|
Reclassification of product warranty to held for sale
|
(4
|
)
|
—
|
|
—
|
|
—
|
|
(4
|
)
|
—
|
|
||||||||||||
|
Balance at December 31
|
$
|
268
|
|
$
|
277
|
|
$
|
—
|
|
$
|
—
|
|
$
|
268
|
|
$
|
277
|
|
||||||
|
Current portion
|
$
|
194
|
|
$
|
203
|
|
$
|
—
|
|
$
|
—
|
|
$
|
194
|
|
$
|
203
|
|
||||||
|
Non-current portion
|
74
|
|
74
|
|
—
|
|
|
|
74
|
|
74
|
|
||||||||||||
|
Total
|
$
|
268
|
|
$
|
277
|
|
$
|
—
|
|
$
|
—
|
|
$
|
268
|
|
$
|
277
|
|
||||||
In the normal course of business, we engage in investigations of potential quality and safety issues. As part of our ongoing effort to deliver quality products to consumers, we are currently investigating certain potential quality and safety issues globally. As necessary, we undertake to effect repair or replacement of appliances in the event that an investigation leads to the conclusion that such action is warranted.
As part of that process, in 2015, Whirlpool engaged in thorough investigations of incident reports associated with
two
of its dryer production platforms developed by Indesit. These dryer production platforms were developed prior to Whirlpool's acquisition of Indesit in October 2014. During 2017, the corrective action was substantially complete and any remaining charges related to the action were recorded under product warranty for 2018.
Guarantees
We have guarantee arrangements in a Brazilian subsidiary. For certain credit worthy customers,
the subsidiary guarantees customer lines of credit at commercial banks to support purchases following its normal credit policies. If a customer were to default on its line of credit with the bank, our subsidiary would be required to assume the line of credit and satisfy the obligation with the bank. At
December 31, 2018
and
December 31, 2017
, the guaranteed amounts totaled
$146 million
and
$284 million
, respectively. The fair value of these guarantees were nominal at
December 31, 2018
and
December 31, 2017
. Our subsidiary insures against a significant portion of this credit risk for these guarantees, under normal operating conditions, through policies purchased from high-quality underwriters.
We provide guarantees of indebtedness and lines of credit for various consolidated subsidiaries. The maximum contractual amount of indebtedness and credit facilities available under these lines for consolidated subsidiaries totaled
$3.5 billion
at
December 31, 2018
and
$2.8 billion
at
December 31, 2017
. Our total short-term outstanding bank indebtedness under guarantees was
$21 million
at
December 31, 2018
and
$49 million
at
December 31, 2017
.
Operating Lease Commitments
At
December 31, 2018
, we had noncancelable operating lease commitments totaling
$1,050 million
. The annual future minimum lease payments are summarized by year in the table below
:
|
Millions of dollars
|
|||
|
2019
|
$
|
238
|
|
|
2020
|
183
|
|
|
|
2021
|
144
|
|
|
|
2022
|
114
|
|
|
|
2023
|
103
|
|
|
|
Thereafter
|
268
|
|
|
|
Total noncancelable operating lease commitments
|
$
|
1,050
|
|
69
NOTES TO THE CONSOLIDATED FINANCIAL STATEMENTS - (CONTINUED)
Rent expense was
$250 million
,
$238 million
and
$234 million
for
2018
,
2017
and
2016
, respectively.
Purchase Obligations
Our expected cash outflows resulting from non-cancellable purchase obligations are summarized by year in the table below
:
|
Millions of dollars
|
|
||
|
2019
|
$
|
210
|
|
|
2020
|
151
|
|
|
|
2021
|
102
|
|
|
|
2022
|
89
|
|
|
|
2023
|
61
|
|
|
|
Thereafter
|
35
|
|
|
|
Total purchase obligations
|
$
|
648
|
|
(
8
)
PENSION AND OTHER POSTRETIREMENT BENEFIT PLANS
We have funded and unfunded defined benefit pension plans that cover certain employees in North America, Europe, Asia and Brazil. For the United States plan, which comprises the majority of our obligation, the plans are frozen for the majority of participants. The formula for United States salaried employees covered under the qualified defined benefit plan was based on years of service and final average salary, while the formula for United States hourly employees covered under the defined benefit plans was based on specific dollar amounts for each year of service. There were multiple formulas for employees covered under the qualified and nonqualified defined benefit plans that were sponsored by Maytag, including a cash balance formula. In addition, we sponsor an unfunded Supplemental Executive Retirement Plan. This plan is nonqualified and provides certain key employees additional defined pension benefits that supplement those provided by the Company's other retirement plans.
A defined contribution plan is being provided to all United States employees and is not classified within the net periodic benefit cost. The Company provides annual match and automatic company contributions, in cash or company stock, of up to
7%
of employees' eligible pay. Our contributions during
2018
,
2017
and
2016
were
$81 million
,
$82 million
and
$77 million
, respectively.
We provide postretirement health care benefits for eligible retired employees in the United States, Canada and Brazil. For our United States plan, which comprises the majority of our obligation, eligible retirees include those who were full-time employees with
10
years of service who attained age
55
while in service with us and those union retirees who met the eligibility requirements of their collective bargaining agreements. In general, the postretirement health and welfare benefit plans include cost-sharing provisions that limit our exposure for recent and future retirees and are contributory, with participants' contributions adjusted annually. The plans are unfunded. We reserve the right to modify these benefits in the future.
During the second quarter 2011, we modified retiree medical benefits for certain retirees to be consistent with those benefits provided by the Whirlpool Corporation Group Benefit Plan. We accounted for these changes as a plan amendment in 2011, resulting in a reduction in the postretirement benefit obligation of
$138 million
of which approximately
$83 million
of benefit has been recognized in net earnings since 2011, with an offset to accumulated other comprehensive loss, net of tax. In response, a group of retirees initiated legal proceedings against Whirlpool asserting the above benefits are vested and changes to the plan are not permitted. In October 2018, we reached preliminary agreement on a settlement to resolve plaintiffs’ claims. However, we were unable to reach final agreement and have terminated the preliminary settlement agreement.
We will continue to vigorously defend our position, including through any necessary appeal process. However, an unfavorable final result could require us to immediately reverse the benefit we have recognized to that point, and remeasure the associated postretirement benefit obligation, the impact of which will depend on timing and the actuarial assumptions then in effect.
70
NOTES TO THE CONSOLIDATED FINANCIAL STATEMENTS - (CONTINUED)
Defined Benefit - Pensions and Postretirement Benefit Plans
Obligations and Funded Status at End of Year
|
|
United States
Pension Benefits
|
Foreign
Pension Benefits
|
Other Postretirement
Benefits
|
|||||||||||||||||||||
|
Millions of dollars
|
2018
|
2017
|
2018
|
2017
|
2018
|
2017
|
||||||||||||||||||
|
Funded status
|
||||||||||||||||||||||||
|
Fair value of plan assets
|
$
|
2,676
|
|
$
|
2,746
|
|
$
|
518
|
|
$
|
571
|
|
$
|
—
|
|
$
|
—
|
|
||||||
|
Benefit obligations
|
3,033
|
|
3,415
|
|
834
|
|
952
|
|
356
|
|
394
|
|
||||||||||||
|
Funded status
|
$
|
(357
|
)
|
$
|
(669
|
)
|
$
|
(316
|
)
|
$
|
(381
|
)
|
$
|
(356
|
)
|
$
|
(394
|
)
|
||||||
|
Amounts recognized in the consolidated balance sheets
|
|
|||||||||||||||||||||||
|
Noncurrent asset
|
$
|
—
|
|
$
|
—
|
|
$
|
12
|
|
$
|
11
|
|
$
|
—
|
|
$
|
—
|
|
||||||
|
Current liability
|
(38
|
)
|
(16
|
)
|
(10
|
)
|
(16
|
)
|
(38
|
)
|
(42
|
)
|
||||||||||||
|
Noncurrent liability
|
(319
|
)
|
(653
|
)
|
(318
|
)
|
(376
|
)
|
(318
|
)
|
(352
|
)
|
||||||||||||
|
Amount recognized
|
$
|
(357
|
)
|
$
|
(669
|
)
|
$
|
(316
|
)
|
$
|
(381
|
)
|
$
|
(356
|
)
|
$
|
(394
|
)
|
||||||
|
Amounts recognized in accumulated other comprehensive loss (pre-tax)
|
||||||||||||||||||||||||
|
Net actuarial loss
|
$
|
1,445
|
|
$
|
1,380
|
|
$
|
192
|
|
$
|
201
|
|
$
|
1
|
|
$
|
17
|
|
||||||
|
Prior service (credit) cost
|
(1
|
)
|
(4
|
)
|
(2
|
)
|
(4
|
)
|
(16
|
)
|
(20
|
)
|
||||||||||||
|
Amount recognized
|
$
|
1,444
|
|
$
|
1,376
|
|
$
|
190
|
|
$
|
197
|
|
$
|
(15
|
)
|
$
|
(3
|
)
|
||||||
Change in Benefit Obligation
|
|
United States
Pension Benefits
|
Foreign
Pension Benefits
|
Other Postretirement
Benefits
|
|||||||||||||||||||||
|
Millions of dollars
|
2018
|
2017
|
2018
|
2017
|
2018
|
2017
|
||||||||||||||||||
|
Benefit obligation, beginning of year
|
$
|
3,415
|
|
$
|
3,415
|
|
$
|
952
|
|
$
|
855
|
|
$
|
394
|
|
$
|
376
|
|
||||||
|
Service cost
|
2
|
|
2
|
|
5
|
|
5
|
|
7
|
|
7
|
|
||||||||||||
|
Interest cost
|
118
|
|
134
|
|
23
|
|
23
|
|
15
|
|
16
|
|
||||||||||||
|
Plan participants' contributions
|
—
|
|
—
|
|
1
|
|
1
|
|
—
|
|
—
|
|
||||||||||||
|
Actuarial loss (gain)
|
(197
|
)
|
188
|
|
(33
|
)
|
30
|
|
(16
|
)
|
15
|
|
||||||||||||
|
Benefits paid
|
(305
|
)
|
(260
|
)
|
(31
|
)
|
(32
|
)
|
(36
|
)
|
(40
|
)
|
||||||||||||
|
Plan amendments
|
—
|
|
—
|
|
1
|
|
—
|
|
4
|
|
16
|
|
||||||||||||
|
Transfer of liabilities
|
—
|
|
(64
|
)
|
—
|
|
—
|
|
—
|
|
—
|
|
||||||||||||
|
Special termination benefit
|
—
|
|
—
|
|
(5
|
)
|
—
|
|
—
|
|
4
|
|
||||||||||||
|
Settlements / curtailment (gain)
|
—
|
|
—
|
|
(22
|
)
|
(12
|
)
|
—
|
|
—
|
|
||||||||||||
|
Foreign currency exchange rates
|
—
|
|
—
|
|
(53
|
)
|
82
|
|
(5
|
)
|
—
|
|
||||||||||||
|
Reclassification of obligation to held for sale
|
—
|
|
—
|
|
(4
|
)
|
—
|
|
(7
|
)
|
—
|
|
||||||||||||
|
Benefit obligation, end of year
|
$
|
3,033
|
|
$
|
3,415
|
|
$
|
834
|
|
$
|
952
|
|
$
|
356
|
|
$
|
394
|
|
||||||
|
Accumulated benefit obligation, end of year
|
$
|
3,022
|
|
$
|
3,403
|
|
$
|
804
|
|
$
|
914
|
|
N/A
|
|
N/A
|
|
||||||||
71
NOTES TO THE CONSOLIDATED FINANCIAL STATEMENTS - (CONTINUED)
Change in Plan Assets
|
|
United States Pension Benefits
|
Foreign
Pension Benefits
|
Other Postretirement
Benefits
|
|||||||||||||||||||||
|
Millions of dollars
|
2018
|
2017
|
2018
|
2017
|
2018
|
2017
|
||||||||||||||||||
|
Fair value of plan assets, beginning of year
|
$
|
2,746
|
|
$
|
2,664
|
|
$
|
571
|
|
$
|
510
|
|
$
|
—
|
|
$
|
—
|
|
||||||
|
Actual return on plan assets
|
(145
|
)
|
359
|
|
(7
|
)
|
28
|
|
—
|
|
—
|
|
||||||||||||
|
Employer contribution
|
380
|
|
47
|
|
39
|
|
30
|
|
36
|
|
40
|
|
||||||||||||
|
Plan participants' contributions
|
—
|
|
—
|
|
1
|
|
1
|
|
—
|
|
—
|
|
||||||||||||
|
Benefits paid
|
(305
|
)
|
(260
|
)
|
(31
|
)
|
(32
|
)
|
(36
|
)
|
(40
|
)
|
||||||||||||
|
Transfer of plan assets
|
—
|
|
(64
|
)
|
—
|
|
—
|
|
—
|
|
—
|
|
||||||||||||
|
Settlements
|
—
|
|
—
|
|
(22
|
)
|
(12
|
)
|
—
|
|
—
|
|
||||||||||||
|
Foreign currency exchange rates
|
—
|
|
—
|
|
(31
|
)
|
46
|
|
—
|
|
—
|
|
||||||||||||
|
Reclassification of plan assets to held for sale
|
—
|
|
—
|
|
(2
|
)
|
—
|
|
—
|
|
—
|
|
||||||||||||
|
Fair value of plan assets, end of year
|
$
|
2,676
|
|
$
|
2,746
|
|
$
|
518
|
|
$
|
571
|
|
$
|
—
|
|
$
|
—
|
|
||||||
Components of Net Periodic Benefit Cost
|
|
United States
Pension Benefits
|
Foreign
Pension Benefits
|
Other Postretirement
Benefits
|
|||||||||||||||||||||||||||||||||
|
Millions of dollars
|
2018
|
2017
|
2016
|
2018
|
2017
|
2016
|
2018
|
2017
|
2016
|
|||||||||||||||||||||||||||
|
Service cost
|
$
|
2
|
|
$
|
2
|
|
$
|
3
|
|
$
|
5
|
|
$
|
5
|
|
$
|
5
|
|
$
|
7
|
|
$
|
7
|
|
$
|
7
|
|
|||||||||
|
Interest cost
|
118
|
|
134
|
|
147
|
|
23
|
|
23
|
|
27
|
|
15
|
|
16
|
|
18
|
|
||||||||||||||||||
|
Expected return on plan assets
|
(170
|
)
|
(175
|
)
|
(186
|
)
|
(32
|
)
|
(30
|
)
|
(30
|
)
|
—
|
|
—
|
|
—
|
|
||||||||||||||||||
|
Amortization:
|
|
|
|
|
|
|
||||||||||||||||||||||||||||||
|
Actuarial loss
|
53
|
|
50
|
|
46
|
|
9
|
|
6
|
|
4
|
|
—
|
|
—
|
|
—
|
|
||||||||||||||||||
|
Prior service cost (credit)
|
(3
|
)
|
(3
|
)
|
(3
|
)
|
—
|
|
—
|
|
—
|
|
—
|
|
(4
|
)
|
(15
|
)
|
||||||||||||||||||
|
Special termination benefit
|
—
|
|
—
|
|
—
|
|
—
|
|
—
|
|
—
|
|
—
|
|
4
|
|
—
|
|
||||||||||||||||||
|
Curtailment gain
|
—
|
|
—
|
|
4
|
|
(4
|
)
|
—
|
|
(1
|
)
|
—
|
|
—
|
|
—
|
|
||||||||||||||||||
|
Settlement loss
|
—
|
|
—
|
|
—
|
|
3
|
|
2
|
|
3
|
|
—
|
|
—
|
|
—
|
|
||||||||||||||||||
|
Net periodic benefit cost
|
$
|
—
|
|
$
|
8
|
|
$
|
11
|
|
$
|
4
|
|
$
|
6
|
|
$
|
8
|
|
$
|
22
|
|
$
|
23
|
|
$
|
10
|
|
|||||||||
The following table summarizes the net periodic cost recognized in operating profit and interest and sundry (income) expense for the years ending
December 31, 2018
,
2017
and
2016
:
|
|
United States
Pension Benefits
|
Foreign
Pension Benefits
|
Other Postretirement
Benefits
|
|||||||||||||||||||||||||||||||||
|
Millions of dollars
|
2018
|
2017
|
2016
|
2018
|
2017
|
2016
|
2018
|
2017
|
2016
|
|||||||||||||||||||||||||||
|
Operating profit (loss)
|
$
|
2
|
|
$
|
2
|
|
$
|
3
|
|
$
|
5
|
|
$
|
5
|
|
$
|
5
|
|
$
|
7
|
|
$
|
7
|
|
$
|
7
|
|
|||||||||
|
Interest and sundry (income) expense
|
(2
|
)
|
6
|
|
8
|
|
(1
|
)
|
1
|
|
3
|
|
15
|
|
16
|
|
3
|
|
||||||||||||||||||
|
Net periodic benefit cost
|
$
|
—
|
|
$
|
8
|
|
$
|
11
|
|
$
|
4
|
|
$
|
6
|
|
$
|
8
|
|
$
|
22
|
|
$
|
23
|
|
$
|
10
|
|
|||||||||
During the fourth quarter of 2017, we transferred a portion of small-benefit retirees under the pension plans to an insurance company. The liability and asset transfer was
$64 million
and did not have an impact on the Consolidated Balance Sheets as of December 31, 2017.
72
NOTES TO THE CONSOLIDATED FINANCIAL STATEMENTS - (CONTINUED)
Other Changes in Plan Assets and Benefit Obligations Recognized in Other Comprehensive Income (Loss) (Pre-Tax) in
2018
|
Millions of dollars
|
United States
Pension Benefits
|
Foreign
Pension Benefits
|
Other Postretirement
Benefits
|
|||||||||
|
Current year actuarial loss
|
$
|
118
|
|
$
|
—
|
|
$
|
(16
|
)
|
|||
|
Actuarial (loss) recognized during the year
|
(53
|
)
|
(9
|
)
|
—
|
|
||||||
|
Current year prior service cost (credit)
|
—
|
|
1
|
|
4
|
|
||||||
|
Prior service credit (cost) recognized during the year
|
3
|
|
—
|
|
—
|
|
||||||
|
Total recognized in other comprehensive income (loss) (pre-tax)
|
$
|
68
|
|
$
|
(8
|
)
|
$
|
(12
|
)
|
|||
|
Total recognized in net periodic benefit costs and other comprehensive income (loss) (pre-tax)
|
$
|
68
|
|
$
|
(4
|
)
|
$
|
10
|
|
|||
Estimated Pre-Tax Amounts that will be amortized from Accumulated Other Comprehensive Loss into Net Periodic Pension Cost in
2019
|
Millions of dollars
|
United States
Pension Benefits
|
Foreign
Pension Benefits
|
Other Postretirement
Benefits
|
|||||||||
|
Actuarial loss
|
$
|
47
|
|
$
|
8
|
|
$
|
1
|
|
|||
|
Prior service (credit)
|
(2
|
)
|
—
|
|
(9
|
)
|
||||||
|
Total
|
$
|
45
|
|
$
|
8
|
|
$
|
(8
|
)
|
|||
We amortize prior service costs (credits) over a period of up to
21
years.
Assumptions
Weighted-Average Assumptions used to Determine Benefit Obligation at End of Year
|
|
United States
Pension Benefits
|
Foreign
Pension Benefits
|
Other Postretirement
Benefits
|
|||||||||||||||
|
|
2018
|
2017
|
2018
|
2017
|
2018
|
2017
|
||||||||||||
|
Discount rate
|
4.30
|
%
|
3.65
|
%
|
2.90
|
%
|
2.57
|
%
|
4.64
|
%
|
4.00
|
%
|
||||||
|
Rate of compensation increase
|
4.50
|
%
|
4.50
|
%
|
3.29
|
%
|
3.20
|
%
|
N/A
|
|
N/A
|
|
||||||
Weighted-Average Assumptions used to Determine Net Periodic Cost
|
|
United States
Pension Benefits
|
Foreign
Pension Benefits
|
Other Postretirement
Benefits
|
||||||||||||||||||||||||
|
|
2018
|
2017
|
2016
|
2018
|
2017
|
2016
|
2018
|
2017
|
2016
|
||||||||||||||||||
|
Discount rate
|
3.65
|
%
|
4.15
|
%
|
4.45
|
%
|
2.57
|
%
|
2.64
|
%
|
3.40
|
%
|
4.35
|
%
|
4.73
|
%
|
4.88
|
%
|
|||||||||
|
Expected long-term rate of return on plan assets
|
6.75
|
%
|
6.75
|
%
|
7.00
|
%
|
5.81
|
%
|
5.78
|
%
|
5.81
|
%
|
N/A
|
|
N/A
|
|
N/A
|
|
|||||||||
|
Rate of compensation increase
|
4.50
|
%
|
4.50
|
%
|
4.50
|
%
|
3.20
|
%
|
3.08
|
%
|
3.06
|
%
|
N/A
|
|
N/A
|
|
N/A
|
|
|||||||||
|
Health care cost trend rate
|
|||||||||||||||||||||||||||
|
Initial rate
|
N/A
|
|
N/A
|
|
N/A
|
|
N/A
|
|
N/A
|
|
N/A
|
|
6.50
|
%
|
6.75
|
%
|
7.00
|
%
|
|||||||||
|
Ultimate rate
|
N/A
|
|
N/A
|
|
N/A
|
|
N/A
|
|
N/A
|
|
N/A
|
|
5.00
|
%
|
5.00
|
%
|
5.00
|
%
|
|||||||||
|
Year that ultimate rate will be reached
|
N/A
|
|
N/A
|
|
N/A
|
|
N/A
|
|
N/A
|
|
N/A
|
|
2025
|
|
2025
|
|
2019
|
|
|||||||||
Discount Rate
For our United States pension and postretirement benefit plans, the discount rate was selected using a hypothetical portfolio of high quality bonds outstanding at December 31 that would provide the necessary cash flows to match our projected benefit payments. For our foreign pension and postretirement benefit plans, the discount rate was primarily selected using high quality bond yields for the respective country or region covered by the plan.
73
NOTES TO THE CONSOLIDATED FINANCIAL STATEMENTS - (CONTINUED)
Expected Return on Plan Assets
In the United States, the expected rate of return on plan assets was determined by using the historical asset returns for publicly traded equity and fixed income securities tracked since 1926 and the historical returns for private equity. The historical equity returns were adjusted downward to reflect future expectations. The expected returns are weighted by the targeted asset allocations. The resulting weighted-average return was rounded to the nearest quarter of one percent and applied to the fair value of plan assets as of
December 31, 2018
.
For foreign pension plans, the expected rate of return on plan assets was primarily determined by observing historical returns in the local fixed income and equity markets and computing the weighted average returns with the weights being the asset allocation of each plan.
Estimated Impact of One Percentage-Point Change in Assumed Health Care Cost Trend Rate
A one percentage point change in assumed health care cost trend rates would have the following effects on our health care plan:
|
Millions of dollars
|
One Percentage
Point Increase
|
One Percentage
Point Decrease
|
||||||
|
Effect on total of service and interest cost
|
$
|
—
|
|
$
|
—
|
|
||
|
Effect on postretirement benefit obligations
|
4
|
|
(3
|
)
|
||||
Cash Flows
Funding Policy
Our funding policy is to contribute to our United States pension plans amounts sufficient to meet the minimum funding requirement as defined by employee benefit and tax laws, plus additional amounts which we may determine to be appropriate. In certain countries other than the United States, the funding of pension plans is not common practice. Contributions to our United States pension plans may be made in the form of cash or company stock. We pay for retiree medical benefits as they are incurred.
On September 15, 2018, we contributed
$358 million
in cash contributions to the pension trust for our U.S. defined benefit pension plans, which included
$350 million
of discretionary contributions.
Expected Employer Contributions to Funded Plans
|
Millions of dollars
|
United States
Pension Benefits
|
Foreign
Pension Benefits
|
||||||
|
2019
|
$
|
—
|
|
$
|
17
|
|
||
Expected Benefit Payments
|
Millions of dollars
|
United States
Pension Benefits
|
Foreign
Pension Benefits
|
Other Postretirement Benefits
|
|||||||||
|
2019
|
$
|
308
|
|
$
|
39
|
|
$
|
38
|
|
|||
|
2020
|
243
|
|
37
|
|
35
|
|
||||||
|
2021
|
245
|
|
37
|
|
34
|
|
||||||
|
2022
|
238
|
|
39
|
|
32
|
|
||||||
|
2023
|
231
|
|
40
|
|
31
|
|
||||||
|
2024-2028
|
1,055
|
|
209
|
|
129
|
|
||||||
74
NOTES TO THE CONSOLIDATED FINANCIAL STATEMENTS - (CONTINUED)
Plan Assets
Our overall investment strategy is to achieve an appropriate mix of investments for long-term growth and for near-term benefit payments with a wide diversification of asset types, fund strategies, and investment fund managers. The target allocation for plan assets is generally
35%
equity and
65%
fixed income (with variance based on the plan's funded status), with exceptions for foreign pension plans. For our U.S. plans, the target allocation for equity securities is approximately
50%
allocated to United States large-cap,
25%
to international equity,
13%
to United States mid and small-cap companies and
12%
in venture capital. The target allocation for fixed income is allocated with
75%
to corporate bonds and
25%
to United States treasury and other government securities. The fixed income securities duration is intended to match that of our United States pension liabilities.
Plan assets are reported at fair value based on an exit price, representing the amount that would be received to sell an asset in an orderly transaction between market participants. As such, fair value is a market-based measurement that should be determined based on assumptions that market participants would use in pricing an asset. As a basis for considering such assumptions, a three-tiered fair value hierarchy is established, which prioritizes the inputs used in measuring fair value as follows: (Level 1) observable inputs such as quoted prices in active markets; (Level 2) inputs, other than the quoted prices in active markets that are observable, either directly or indirectly; and (Level 3) unobservable inputs in which there is little or no market data, which require the reporting entity to develop its own assumptions. Certain investments are valued based on net asset value (NAV), which approximates fair value. Such basis is determined by referencing the respective fund's underlying assets. There are no unfunded commitments or other restrictions associated with these investments. We manage the process and approve the results of a third-party pricing service to value the majority of our securities and to determine the appropriate level in the fair value hierarchy.
75
NOTES TO THE CONSOLIDATED FINANCIAL STATEMENTS - (CONTINUED)
The fair values of our pension plan assets at
December 31, 2018
and
2017
, by asset category were as follows:
|
December 31,
|
|||||||||||||||||||||||||||||||||||
|
Quoted prices
(Level 1)
|
Other significant
observable inputs
(Level 2)
|
Significant
unobservable inputs
(Level 3)
|
Net Asset Value
|
Total
|
|||||||||||||||||||||||||||||||
|
Millions of dollars
|
2018
|
2017
|
2018
|
2017
|
2018
|
2017
|
2018
|
2017
|
2018
|
2017
|
|||||||||||||||||||||||||
|
Cash and cash equivalents
|
$
|
—
|
|
$
|
—
|
|
$
|
10
|
|
$
|
36
|
|
$
|
—
|
|
$
|
—
|
|
$
|
—
|
|
$
|
—
|
|
$
|
10
|
|
$
|
36
|
|
|||||
|
Government and government agency securities
(a)
|
|
|
|
|
|
|
|
|
|||||||||||||||||||||||||||
|
U.S. securities
|
—
|
|
—
|
|
761
|
|
439
|
|
—
|
|
—
|
|
—
|
|
—
|
|
761
|
|
439
|
|
|||||||||||||||
|
International securities
|
—
|
|
—
|
|
97
|
|
117
|
|
—
|
|
—
|
|
—
|
|
—
|
|
97
|
|
117
|
|
|||||||||||||||
|
Corporate bonds and notes
(a)
|
|
|
|
|
|
|
|
|
|||||||||||||||||||||||||||
|
U.S. companies
|
—
|
|
—
|
|
860
|
|
976
|
|
—
|
|
—
|
|
—
|
|
—
|
|
860
|
|
976
|
|
|||||||||||||||
|
International companies
|
—
|
|
—
|
|
155
|
|
153
|
|
—
|
|
—
|
|
—
|
|
—
|
|
155
|
|
153
|
|
|||||||||||||||
|
Equity securities
(b)
|
|
|
|
|
|
|
|
|
|||||||||||||||||||||||||||
|
U.S. companies
|
18
|
|
19
|
|
—
|
|
—
|
|
—
|
|
—
|
|
—
|
|
—
|
|
18
|
|
19
|
|
|||||||||||||||
|
International companies
|
185
|
|
235
|
|
—
|
|
—
|
|
—
|
|
—
|
|
—
|
|
—
|
|
185
|
|
235
|
|
|||||||||||||||
|
Mutual funds
(c)
|
35
|
|
59
|
|
—
|
|
—
|
|
—
|
|
—
|
|
—
|
|
—
|
|
35
|
|
59
|
|
|||||||||||||||
|
Investments at net asset value
|
|
|
|
|
|
|
|
|
|||||||||||||||||||||||||||
|
U.S. equity securities
(d)
|
—
|
|
—
|
|
—
|
|
—
|
|
—
|
|
—
|
|
501
|
|
689
|
|
501
|
|
689
|
|
|||||||||||||||
|
International equity securities
(d)
|
—
|
|
—
|
|
—
|
|
—
|
|
—
|
|
—
|
|
52
|
|
70
|
|
52
|
|
70
|
|
|||||||||||||||
|
Short-term investment fund
(d)
|
—
|
|
—
|
|
—
|
|
—
|
|
—
|
|
—
|
|
102
|
|
70
|
|
102
|
|
70
|
|
|||||||||||||||
|
International debt securities
(e)
|
—
|
|
—
|
|
—
|
|
—
|
|
—
|
|
—
|
|
209
|
|
229
|
|
209
|
|
229
|
|
|||||||||||||||
|
International equity securities
(e)
|
—
|
|
—
|
|
—
|
|
—
|
|
—
|
|
—
|
|
50
|
|
46
|
|
50
|
|
46
|
|
|||||||||||||||
|
Real estate
(f)
|
—
|
|
—
|
|
—
|
|
—
|
|
—
|
|
—
|
|
36
|
|
44
|
|
36
|
|
44
|
|
|||||||||||||||
|
Limited partnerships
(g)
|
|
|
|
|
|
|
|
|
|
||||||||||||||||||||||||||
|
U.S. private equity investments
|
—
|
|
—
|
|
—
|
|
—
|
|
68
|
|
86
|
|
—
|
|
—
|
|
68
|
|
86
|
|
|||||||||||||||
|
Diversified fund of funds
|
—
|
|
—
|
|
—
|
|
—
|
|
6
|
|
8
|
|
—
|
|
—
|
|
6
|
|
8
|
|
|||||||||||||||
|
Emerging growth
|
—
|
|
—
|
|
—
|
|
—
|
|
12
|
|
12
|
|
—
|
|
—
|
|
12
|
|
12
|
|
|||||||||||||||
|
All other investments
|
—
|
|
—
|
|
18
|
|
18
|
|
—
|
|
—
|
|
19
|
|
11
|
|
37
|
|
29
|
|
|||||||||||||||
|
$
|
238
|
|
$
|
313
|
|
$
|
1,901
|
|
$
|
1,739
|
|
$
|
86
|
|
$
|
106
|
|
$
|
969
|
|
$
|
1,159
|
|
$
|
3,194
|
|
$
|
3,317
|
|
||||||
|
(a)
|
Valued using pricing vendors who use proprietary models to estimate the price a dealer would pay to buy a security using significant observable inputs, such as interest rates, yield curves, and credit risk.
|
|
(b)
|
Valued using the closing stock price on a national securities exchange, which reflects the last reported sales price on the last business day of the year.
|
|
(c)
|
Valued using the net asset value (NAV) of the fund, which is based on the fair value of underlying securities. The fund primarily invests in a diversified portfolio of equity securities issued by non-U.S. companies.
|
|
(d)
|
Common and collective trust funds valued using the NAV of the fund, which is based on the fair value of underlying securities.
|
|
(e)
|
Fund of funds valued using the NAV of the fund, which is based on the fair value of underlying securities. International debt securities includes corporate bonds and notes and government and government agency securities.
|
|
(f)
|
Valued using the NAV of the fund, which is based on the fair value of underlying assets.
|
|
(g)
|
Valued at estimated fair value based on the proportionate share of the limited partnership's fair value, as determined by the general partner.
|
76
NOTES TO THE CONSOLIDATED FINANCIAL STATEMENTS - (CONTINUED)
Fair Value Measurements Using Significant Unobservable Inputs (Level 3)
|
Millions of dollars
|
Limited
Partnerships |
|||
|
Balance, December 31, 2017
|
$
|
106
|
|
|
|
Realized gains (net)
|
16
|
|
||
|
Unrealized gains (net)
|
(4
|
)
|
||
|
Purchases
|
—
|
|
||
|
Settlements
|
(32
|
)
|
||
|
Balance, December 31, 2018
|
$
|
86
|
|
|
Additional Information
The projected benefit obligation and fair value of plan assets for pension plans with a projected benefit obligation in excess of plan assets at
December 31, 2018
and
2017
were as follows:
|
|
United States
Pension Benefits
|
Foreign
Pension Benefits
|
||||||||||||||
|
Millions of dollars
|
2018
|
2017
|
2018
|
2017
|
||||||||||||
|
Projected benefit obligation
|
$
|
3,033
|
|
$
|
3,415
|
|
$
|
753
|
|
$
|
822
|
|
||||
|
Fair value of plan assets
|
2,676
|
|
2,746
|
|
430
|
|
437
|
|
||||||||
The projected benefit obligation, accumulated benefit obligation and fair value of plan assets for pension plans with an accumulated benefit obligation in excess of plan assets at
December 31, 2018
and
2017
were as follows:
|
|
United States
Pension Benefits
|
Foreign
Pension Benefits
|
||||||||||||||
|
Millions of dollars
|
2018
|
2017
|
2018
|
2017
|
||||||||||||
|
Projected benefit obligation
|
$
|
3,033
|
|
$
|
3,415
|
|
$
|
720
|
|
$
|
816
|
|
||||
|
Accumulated benefit obligation
|
3,022
|
|
3,403
|
|
699
|
|
793
|
|
||||||||
|
Fair value of plan assets
|
2,676
|
|
2,746
|
|
396
|
|
432
|
|
||||||||
(
9
)
HEDGES AND DERIVATIVE FINANCIAL INSTRUMENTS
Derivative instruments are accounted for at fair value based on market rates. Derivatives where we elect hedge accounting are designated as either cash flow, fair value or net investment hedges. Derivatives that are not accounted for based on hedge accounting are marked to market through earnings. The accounting for changes in the fair value of a derivative depends on the intended use and designation of the derivative instrument. Hedging ineffectiveness and a net earnings impact occur when the change in the fair value of the hedge does not offset the change in the fair value of the hedged item. The ineffective portion of the gain or loss is recognized in earnings. The fair value of the hedge asset or liability is present in either other current assets/liabilities or other noncurrent assets/liabilities on the Consolidated Balance Sheets and in other within cash used in operating activities in the Consolidated Statements of Cash Flows.
Using derivative instruments means assuming counterparty credit risk. Counterparty credit risk relates to the loss we could incur if a counterparty were to default on a derivative contract. We generally deal with investment grade counterparties and monitor the overall credit risk and exposure to individual counterparties. We do not anticipate nonperformance by any counterparties. The amount of counterparty credit exposure is limited to the unrealized gains, if any, on such derivative contracts. We do not require nor do we post collateral on such contracts.
Hedging Strategy
In the normal course of business, we manage risks relating to our ongoing business operations including those arising from changes in foreign exchange rates, interest rates and commodity prices. Fluctuations in these rates and prices can affect our operating results and financial condition. We use a variety of strategies, including the use of derivative instruments, to manage these risks. We do not enter into derivative financial instruments for trading or speculative purposes.
77
NOTES TO THE CONSOLIDATED FINANCIAL STATEMENTS - (CONTINUED)
Foreign Currency Exchange Rate Risk
We incur expenses associated with the procurement and production of products in a limited number of countries, while we sell in the local currencies of a large number of countries. Our primary foreign currency exchange exposures result from cross-currency sales of products. As a result, we enter into foreign exchange contracts to hedge certain firm commitments and forecasted transactions to acquire products and services that are denominated in foreign currencies.
We enter into certain undesignated non-functional currency asset and liability hedges that relate primarily to short-term payables, receivables and intercompany loans. These forecasted cross-currency cash flows relate primarily to foreign currency denominated expenditures and intercompany financing agreements, royalty agreements and dividends. When we hedge a foreign currency denominated payable or receivable with a derivative, the effect of changes in the foreign exchange rates are reflected currently in interest and sundry (income) expense for both the payable/receivable and the derivative. Therefore, as a result of the economic hedge, we do not elect hedge accounting.
Commodity Price Risk
We enter into commodity derivative contracts on various commodities to manage the price risk associated with forecasted purchases of materials used in our manufacturing process. The objective of these hedges is to reduce the variability of cash flows associated with the forecasted purchase of commodities.
Interest Rate Risk
We may enter into interest rate swap agreements to manage interest rate risk exposure. Our interest rate swap agreements, if any, effectively modify our exposure to interest rate risk, primarily through converting certain floating rate debt to a fixed rate basis, and certain fixed rate debt to a floating rate basis. These agreements involve either the receipt or payment of floating rate amounts in exchange for fixed rate interest payments or receipts, respectively, over the life of the agreements without an exchange of the underlying principal amounts. We also may utilize a cross-currency interest rate swap agreement to manage our exposure relating to certain intercompany debt denominated in one foreign currency that will be repaid in another foreign currency. At
December 31, 2018
and
2017
there were
no
outstanding swap agreements.
We may enter into treasury rate lock agreements to effectively modify our exposure to interest rate risk by locking-in interest rates on probable long-term debt issuances.
Net Investment Hedging
The following table summarizes our foreign currency denominated debt and foreign exchange forwards/options designated as net investment hedges at
December 31, 2018
and
2017
:
|
Notional (local)
|
Notional (USD)
|
Current Maturity
|
||||||||||||||
|
Instrument
|
2018
|
2017
|
2018
|
2017
|
||||||||||||
|
Senior note - 0.625%
|
€
|
500
|
|
€
|
500
|
|
$
|
573
|
|
$
|
600
|
|
March 2020
|
|||
|
Commercial Paper
|
€
|
—
|
|
€
|
150
|
|
$
|
—
|
|
$
|
180
|
|
|
|||
|
Foreign exchange forwards/options
|
MXN 7,200
|
|
MXN 7,200
|
|
$
|
366
|
|
$
|
366
|
|
August 2022
|
|||||
For instruments that are designated and qualify as a net investment hedge, the effective portion of the instruments' gain or loss is reported as a component of other comprehensive income (OCI) and recorded in accumulated other comprehensive loss. The gain or loss will be subsequently reclassified into net earnings when the hedged net investment is either sold or substantially liquidated. The remaining change in fair value of the hedge instruments represents the ineffective portion, which is immediately recognized in interest and sundry (income) expense on our consolidated statements of income. As of
December 31, 2018
, there was
no
ineffectiveness on hedges designated as net investment hedges.
78
NOTES TO THE CONSOLIDATED FINANCIAL STATEMENTS - (CONTINUED)
The following tables summarize our outstanding derivative contracts and their effects on our Consolidated Balance Sheets at
December 31, 2018
and
2017
:
|
|
|
Fair Value of
|
Type of
Hedge
(1)
|
|
||||||||||||||||||||||||||
|
Notional Amount
|
Hedge Assets
|
Hedge Liabilities
|
Maximum Term (Months)
|
|||||||||||||||||||||||||||
|
Millions of dollars
|
2018
|
2017
|
2018
|
2017
|
2018
|
2017
|
2018
|
2017
|
||||||||||||||||||||||
|
Derivatives accounted for as hedges
|
||||||||||||||||||||||||||||||
|
Foreign exchange forwards/options
|
$
|
3,126
|
|
$
|
3,113
|
|
$
|
49
|
|
$
|
55
|
|
$
|
48
|
|
$
|
157
|
|
(CF/NI)
|
44
|
56
|
|||||||||
|
Commodity swaps/options
|
216
|
|
269
|
|
1
|
|
29
|
|
27
|
|
1
|
|
(CF)
|
30
|
36
|
|||||||||||||||
|
Total derivatives accounted for as hedges
|
$
|
50
|
|
$
|
84
|
|
$
|
75
|
|
$
|
158
|
|
||||||||||||||||||
|
Derivatives not accounted for as hedges
|
||||||||||||||||||||||||||||||
|
Foreign exchange forwards/options
|
$
|
4,382
|
|
$
|
3,390
|
|
$
|
27
|
|
$
|
58
|
|
$
|
69
|
|
$
|
50
|
|
N/A
|
21
|
33
|
|||||||||
|
Commodity swaps/options
|
3
|
|
1
|
|
—
|
|
—
|
|
—
|
|
—
|
|
N/A
|
0
|
5
|
|||||||||||||||
|
Total derivatives not accounted for as hedges
|
27
|
|
58
|
|
69
|
|
50
|
|
||||||||||||||||||||||
|
Total derivatives
|
$
|
77
|
|
$
|
142
|
|
$
|
144
|
|
$
|
208
|
|
||||||||||||||||||
|
Current
|
$
|
60
|
|
$
|
89
|
|
$
|
95
|
|
$
|
81
|
|
||||||||||||||||||
|
Noncurrent
|
17
|
|
53
|
|
49
|
|
127
|
|
||||||||||||||||||||||
|
Total derivatives
|
$
|
77
|
|
$
|
142
|
|
$
|
144
|
|
$
|
208
|
|
||||||||||||||||||
(1)
Derivatives accounted for as hedges are considered either cash flow (CF) or net investment (NI) hedges.
The effects of derivative instruments on our Consolidated Statements of Income (Loss) and Consolidated Statements of Comprehensive Income (Loss) for the years ended
December 31, 2018
and
2017
are as follows:
|
Gain (Loss)
Recognized in OCI
(Effective Portion)
(1)
|
Gain (Loss)
Reclassified from OCI into Income (Effective Portion) (2) |
|
||||||||||||||||
|
Cash Flow Hedges - Millions of dollars
|
2018
|
2017
|
2018
|
2017
|
|
|||||||||||||
|
Foreign exchange forwards/options
|
$
|
131
|
|
|
$
|
(178
|
)
|
|
$
|
86
|
|
|
$
|
(122
|
)
|
(a)
|
||
|
Commodity swaps/options
|
(51
|
)
|
|
64
|
|
|
22
|
|
|
43
|
|
(a)
|
||||||
|
Interest rate derivatives
|
(3
|
)
|
|
—
|
|
|
(1
|
)
|
|
(1
|
)
|
(b)
|
||||||
|
Net Investment Hedges
|
||||||||||||||||||
|
Foreign currency
|
23
|
|
(82
|
)
|
—
|
|
—
|
|
||||||||||
|
$
|
100
|
|
$
|
(196
|
)
|
$
|
107
|
|
$
|
(80
|
)
|
|||||||
|
Gain (Loss) Recognized on Derivatives not
Accounted for as Hedges
(3)
|
||||||||
|
Derivatives not Accounted for as Hedges - Millions of dollars
|
2018
|
2017
|
||||||
|
Foreign exchange forwards/options
|
$
|
99
|
|
|
$
|
(40
|
)
|
|
(1)
The tax impact of the cash flow hedges was
$7 million
and
$9 million
in 2018 and 2017, respectively. The tax impact of the net investment hedges was
$15 million
and
$33 million
in 2018 and 2017, respectively.
|
(2)
|
Gains and losses reclassified from accumulated OCI and recognized in income are recorded in (a) cost of products sold, (b) interest expense or (c) interest and sundry (income) expense.
|
(3)
Mark to market gains and losses recognized in income are recorded in interest and sundry (income) expense.
79
NOTES TO THE CONSOLIDATED FINANCIAL STATEMENTS - (CONTINUED)
For cash flow hedges, the amount of ineffectiveness recognized in interest and sundry (income) expense was nominal during
2018
and
2017
. There were no hedges designated as fair value in 2018 and 2017. The net amount of unrealized gain or loss on derivative instruments included in accumulated OCI related to contracts maturing and expected to be realized during the next twelve months is a loss of
$44 million
at
December 31, 2018
.
(
10
)
FAIR VALUE MEASUREMENTS
Fair value is measured based on an exit price, representing the amount that would be received to sell an asset or paid to transfer a liability in an orderly transaction between market participants. As such, fair value is a market-based measurement that should be determined based on assumptions market participants would use in pricing an asset or liability. Assets and liabilities measured at fair value are based on a market valuation approach using prices and other relevant information generated by market transactions involving identical or comparable assets or liabilities. As a basis for considering such assumptions, a three-tiered fair value hierarchy is established, which prioritizes the inputs used in measuring fair value as follows: (Level 1) observable inputs such as quoted prices in active markets; (Level 2) inputs, other than the quoted prices in active markets that are observable, either directly or indirectly; and (Level 3) unobservable inputs in which there is little or no market data, which require the reporting entity to develop its own assumptions.
The non-recurring fair values represent only those assets whose carrying values were adjusted to fair value during the reporting period. See Note
5
to the Consolidated Financial Statements for additional information on the goodwill and other intangibles impairment during 2018.
Assets and liabilities measured at fair value on a recurring basis at
December 31, 2018
and
2017
are as follows:
|
Total Cost Basis
|
Quoted Prices In
Active Markets for
Identical Assets
(Level 1)
|
Significant Other
Observable Inputs
(Level 2)
|
Total Fair Value
|
|||||||||||||||||||||||||||||
|
Millions of dollars
|
2018
|
2017
|
2018
|
2017
|
2018
|
2017
|
2018
|
2017
|
||||||||||||||||||||||||
|
Short-term investments
(1)
|
$
|
511
|
|
$
|
455
|
|
$
|
5
|
|
$
|
2
|
|
$
|
506
|
|
$
|
453
|
|
$
|
511
|
|
$
|
455
|
|
||||||||
|
Net derivative contracts
|
—
|
|
—
|
|
—
|
|
—
|
|
(67
|
)
|
(66
|
)
|
(67
|
)
|
(66
|
)
|
||||||||||||||||
|
Available for sale investments
|
7
|
|
6
|
|
12
|
|
22
|
|
—
|
|
—
|
|
12
|
|
22
|
|
||||||||||||||||
|
Held-to-maturity investments
(2)
|
—
|
|
60
|
|
—
|
|
—
|
|
—
|
|
60
|
|
—
|
|
60
|
|
||||||||||||||||
(1)
Short-term investments are primarily comprised of money market funds and highly liquid, low risk investments less than 90 days.
(2)
Held-to-maturity investments are primarily comprised of certificate of deposits with an approximate maturity term of less than six months.
The following table summarizes the valuation of our assets measured at fair value on a non-recurring basis as of June 30, 2018.
|
Fair Value
|
||||||
|
Millions of dollars
|
Level 3
|
|||||
|
Measured at fair value on a non-recurring basis:
|
2018
|
2017
|
||||
|
Assets:
|
||||||
|
Goodwill
(3)
|
$
|
315
|
|
$
|
—
|
|
|
Indefinite-lived intangible assets
(4)
|
384
|
|
—
|
|
||
|
Definite-lived intangible assets
(5)
|
—
|
|
—
|
|
||
|
Total level 3 assets
|
$
|
699
|
|
$
|
—
|
|
(3)
Goodwill with a carrying amount of
$894 million
was written down to a fair value of
$315 million
resulting in a goodwill impairment charge of
$579 million
.
(4)
Indefinite-lived intangible assets with a carrying amount of approximately
$492 million
were written down to a fair value of
$384 million
resulting in an impairment charge of
$108 million
.
(5)
A definite-lived intangible asset with a carrying amount of approximately
$60 million
was written down to a fair value of
$0 million
resulting in an impairment charge of
$60 million
.
Goodwill
We have
four
reporting units for which we assess for impairment. We use a discounted cash flow analysis to determine fair value and consistent projected financial information in our analysis of goodwill and intangible assets. The discounted cash flow analysis for the quantitative impairment assessment for the EMEA reporting unit during the
80
NOTES TO THE CONSOLIDATED FINANCIAL STATEMENTS - (CONTINUED)
second quarter of 2018 utilized a discount rate of
12%
. Based on the quantitative assessment performed, the carrying value of the EMEA reporting unit exceeded its fair value resulting in a goodwill impairment charge of
$579 million
during the second quarter and for the twelve-months ended December 31, 2018.
Other Intangible Assets
The relief-from-royalty method for the quantitative impairment assessment for other intangible assets in the EMEA reporting unit during the second quarter of 2018 utilized discount rates ranging from
11.5%
-
16%
and royalty rates ranging from
1.5%
-
3.5%
. Based on the quantitative impairment assessment performed, the carrying value of certain other intangible assets, primarily the
Indesit
and
Hotpoint*
brands, exceeded their fair value, resulting in an impairment charge of
$168 million
during the second quarter and for the twelve-months ended December 31, 2018.
See Note
5
to the Consolidated Financial Statements for additional information.
Other Fair Value Measurements
The fair value of long-term debt (including current maturities) was
$4.17 billion
and
$4.95 billion
at
December 31, 2018
and
2017
, respectively, and was estimated using a discounted cash flow analysis based on incremental borrowing rates for similar types of borrowing arrangements (Level 2 input).
(
11
)
STOCKHOLDERS' EQUITY
Comprehensive Income (Loss)
Comprehensive income (loss) primarily includes (1) our reported net earnings (loss), (2) foreign currency translation, including net investment hedges, (3) changes in the effective portion of our open derivative contracts designated as cash flow hedges, (4) changes in our unrecognized pension and other postretirement benefits and (5) changes in fair value of our available for sale marketable securities (prior to the adoption of ASU 2016-01 in 2018).
*Whirlpool ownership of the Hotpoint brand in the EMEA and Asia Pacific regions is not affiliated with the Hotpoint brand sold in the Americas.
81
NOTES TO THE CONSOLIDATED FINANCIAL STATEMENTS - (CONTINUED)
The following table shows the components of accumulated other comprehensive income (loss) available to Whirlpool at December 31,
2016
,
2017
, and
2018
, and the activity for the years then ended:
|
Millions of dollars
|
Foreign
Currency
|
Derivative
Instruments
|
Pension and
Postretirement
Liability
|
Marketable
Securities
|
Total
|
||||||||||||||
|
December 31, 2015
|
$
|
(1,348
|
)
|
$
|
(30
|
)
|
$
|
(967
|
)
|
$
|
13
|
|
$
|
(2,332
|
)
|
||||
|
Unrealized gain (loss)
|
(30
|
)
|
71
|
|
—
|
|
(2
|
)
|
39
|
|
|||||||||
|
Unrealized actuarial gain(loss) and prior service credit (cost)
|
—
|
|
—
|
|
(70
|
)
|
—
|
|
(70
|
)
|
|||||||||
|
Tax effect
|
(17
|
)
|
(26
|
)
|
6
|
|
—
|
|
(37
|
)
|
|||||||||
|
Other comprehensive income (loss), net of tax
|
(47
|
)
|
45
|
|
(64
|
)
|
(2
|
)
|
(68
|
)
|
|||||||||
|
Less: Other comprehensive loss available to noncontrolling interests
|
—
|
|
—
|
|
—
|
|
—
|
|
—
|
|
|||||||||
|
Other comprehensive income (loss) available to Whirlpool
|
(47
|
)
|
45
|
|
(64
|
)
|
(2
|
)
|
(68
|
)
|
|||||||||
|
December 31, 2016
|
$
|
(1,395
|
)
|
$
|
15
|
|
$
|
(1,031
|
)
|
$
|
11
|
|
$
|
(2,400
|
)
|
||||
|
Unrealized gain (loss)
|
32
|
|
(4
|
)
|
—
|
|
6
|
|
34
|
|
|||||||||
|
Unrealized actuarial gain (loss) and prior service credit (cost)
|
—
|
|
—
|
|
(15
|
)
|
—
|
|
(15
|
)
|
|||||||||
|
Tax effect
|
43
|
|
—
|
|
7
|
|
—
|
|
50
|
|
|||||||||
|
Other comprehensive income (loss), net of tax
|
75
|
|
(4
|
)
|
(8
|
)
|
6
|
|
69
|
|
|||||||||
|
Less: Other comprehensive loss available to noncontrolling interests
|
—
|
|
—
|
|
—
|
|
—
|
|
—
|
|
|||||||||
|
Other comprehensive income (loss) available to Whirlpool
|
75
|
|
(4
|
)
|
(8
|
)
|
6
|
|
69
|
|
|||||||||
|
December 31, 2017
|
$
|
(1,320
|
)
|
$
|
11
|
|
$
|
(1,039
|
)
|
$
|
17
|
|
$
|
(2,331
|
)
|
||||
|
Unrealized gain (loss)
|
(272
|
)
|
(30
|
)
|
—
|
|
—
|
|
(302
|
)
|
|||||||||
|
Unrealized actuarial gain (loss) and prior service credit (cost)
|
—
|
|
—
|
|
(48
|
)
|
—
|
|
(48
|
)
|
|||||||||
|
Tax effect
|
(15
|
)
|
7
|
|
13
|
|
—
|
|
5
|
|
|||||||||
|
Other comprehensive income (loss), net of tax
|
(287
|
)
|
(23
|
)
|
(35
|
)
|
—
|
|
(345
|
)
|
|||||||||
|
Less: Other comprehensive loss available to noncontrolling interests
|
2
|
|
—
|
|
—
|
|
—
|
|
2
|
|
|||||||||
|
Other comprehensive income (loss) available to Whirlpool
|
(289
|
)
|
(23
|
)
|
(35
|
)
|
—
|
|
(347
|
)
|
|||||||||
|
Adjustment to beginning accumulated other comprehensive loss
|
21
|
|
(21
|
)
|
—
|
|
(17
|
)
|
(17
|
)
|
|||||||||
|
December 31, 2018
|
$
|
(1,588
|
)
|
$
|
(33
|
)
|
$
|
(1,074
|
)
|
$
|
—
|
|
$
|
(2,695
|
)
|
||||
Net Earnings per Share
Diluted net earnings per share of common stock include the dilutive effect of stock options and other share-based compensation plans. Basic and diluted net earnings per share of common stock were calculated as follows:
|
Millions of dollars and shares
|
2018
|
2017
|
2016
|
|||||||||
|
Numerator for basic and diluted earnings per share – net earnings (loss) available to Whirlpool
|
$
|
(183
|
)
|
$
|
350
|
|
$
|
888
|
|
|||
|
Denominator for basic earnings per share – weighted-average shares
|
67.2
|
|
73.3
|
|
76.1
|
|
||||||
|
Effect of dilutive securities – stock-based compensation
|
—
|
|
1.1
|
|
1.1
|
|
||||||
|
Denominator for diluted earnings per share – adjusted weighted-average shares
|
67.2
|
|
74.4
|
|
77.2
|
|
||||||
|
Anti-dilutive stock options/awards excluded from earnings per share
|
1.9
|
|
0.6
|
|
0.3
|
|
||||||
82
NOTES TO THE CONSOLIDATED FINANCIAL STATEMENTS - (CONTINUED)
Dividends
Dividends per share paid to shareholders were
$4.55
,
$4.30
and
$3.90
during
2018
,
2017
and
2016
, respectively.
Share Repurchase Program
On
July 25, 2017
, our Board of Directors authorized an additional share repurchase program of up to
$2 billion
. For the year ended
December 31, 2018
, we repurchased
7,456,038
shares at an aggregate purchase price of approximately
$1.2 billion
under this program. At
December 31, 2018
, there were approximately
$800 million
in remaining funds authorized under this program.
Share repurchases are made from time to time on the open market as conditions warrant. These programs do not obligate us to repurchase any of our shares and they have no expiration date.
Retained Earnings
The increase to beginning retained earnings in 2018 of
$72 million
was a result of the adoption of the following accounting standards: ASU 2016-16 (
$56 million
), ASU 2016-01 (
$17 million
) and ASU 2014-09 (
$0.4 million
). For additional information regarding the adoption of these accounting standards, see Note 1 to the Consolidated Financial Statements.
(
12
)
SHARE-BASED INCENTIVE PLANS
We sponsor several share-based employee incentive plans. Share-based compensation expense for grants awarded under these plans was
$51 million
,
$48 million
and
$39 million
in
2018
,
2017
, and
2016
, respectively. Related income tax benefits recognized in earnings were
$9 million
,
$16 million
and
$14 million
in
2018
,
2017
, and
2016
, respectively.
At
December 31, 2018
, unrecognized compensation cost related to non-vested stock option and stock unit awards totaled
$54 million
. The cost of these non-vested awards is expected to be recognized over a weighted-average remaining vesting period of
23
months.
Share-Based Employee Incentive Plans
On April 17, 2018, our stockholders approved the 2018 Omnibus Stock and Incentive Plan ("2018 OSIP"). This plan was adopted by our Board of Directors on February 20, 2018 and provides for the issuance of stock options, performance stock units, performance shares, restricted stock and restricted stock units. No new awards may be granted under the 2018 OSIP after the tenth anniversary of the date that the stockholders approved the plan. However, the term and exercise of awards granted before then may extend beyond that date. At
December 31, 2018
, approximately
6.7 million
shares remain available for issuance under the 2018 OSIP.
Stock Options
Eligible employees may receive stock options as a portion of their total compensation. Such options generally become exercisable over a
3
-year period, expire
10
years from the date of grant and are subject to forfeiture upon termination of employment, other than by death, disability or retirement. We use the Black-Scholes option-pricing model to measure the fair value of stock options granted to employees. Granted options have exercise prices equal to the market price of Whirlpool common stock on the grant date. The principal assumptions used in valuing options include: (1) risk-free interest rate - an estimate based on the yield of United States zero coupon securities with a maturity equal to the expected life of the option; (2) expected volatility - an estimate based on the historical volatility of Whirlpool common stock for a period equal to the expected life of the option; and (3) expected option life - an estimate based on historical experience. Stock options are expensed on a straight-line basis, net of estimated forfeitures. Based on the results of the model, the weighted-average grant date fair value of stock options granted for
2018
,
2017
, and
2016
were
$38.34
,
$44.01
and
$31.21
, respectively, using the following assumptions:
|
Weighted Average Black-Scholes Assumptions
|
2018
|
2017
|
2016
|
||||||
|
Risk-free interest rate
|
2.6
|
%
|
1.9
|
%
|
1.2
|
%
|
|||
|
Expected volatility
|
28.2
|
%
|
32.0
|
%
|
33.5
|
%
|
|||
|
Expected dividend yield
|
2.6
|
%
|
2.3
|
%
|
2.8
|
%
|
|||
|
Expected option life, in years
|
5
|
|
5
|
|
5
|
|
|||
83
NOTES TO THE CONSOLIDATED FINANCIAL STATEMENTS - (CONTINUED)
Stock Option Activity
The following table summarizes stock option activity during
2018
:
|
In thousands, except per share data
|
Number
of Options |
Weighted-
Average Exercise Price |
|||||
|
Outstanding at January 1
|
2,265
|
|
$
|
123.27
|
|
||
|
Granted
|
481
|
|
172.70
|
|
|||
|
Exercised
|
(367
|
)
|
$
|
46.22
|
|
||
|
Canceled or expired
|
(88
|
)
|
168.28
|
|
|||
|
Outstanding at December 31
|
2,291
|
|
$
|
144.21
|
|
||
|
Exercisable at December 31
|
1,455
|
|
$
|
131.07
|
|
||
The total intrinsic value of stock options exercised was
$30 million
,
$22 million
, and
$20 million
for
2018
,
2017
, and
2016
, respectively. The related tax benefits were
$7 million
,
$8 million
and
$7 million
for
2018
,
2017
, and
2016
, respectively. Cash received from the exercise of stock options was
$17 million
,
$34 million
, and
$26 million
for
2018
,
2017
, and
2016
, respectively.
The table below summarizes additional information related to stock options outstanding at
December 31, 2018
:
|
Options in thousands / dollars in millions, except share data
|
Outstanding Net of
Expected Forfeitures
|
Options
Exercisable
|
||||||
|
Number of options
|
2,186
|
|
1,455
|
|
||||
|
Weighted-average exercise price per share
|
$
|
144.17
|
|
$
|
131.07
|
|
||
|
Aggregate intrinsic value
|
$
|
13
|
|
$
|
14
|
|
||
|
Weighted-average remaining contractual term, in years
|
6
|
|
5
|
|
||||
Stock Units
Eligible employees may receive restricted stock units or performance stock units as a portion of their total compensation.
Restricted stock units are typically granted to selected management employees on an annual basis and vest over
three
years. Periodically, restricted stock units may be granted to selected executives based on special recognition or retention circumstances and generally vest from
three
years to
seven
years. Some previously granted awards accrue dividend equivalents on outstanding units (in the form of additional stock units) based on dividends declared on Whirlpool common stock. These awards convert to unrestricted common stock at the conclusion of the vesting period.
Performance stock units are granted to executives on an annual basis and generally vest over a
three
year period, converting to unrestricted common stock at the conclusion of the vesting period. The final award may equal
0%
to
200%
of a target based on pre-established Whirlpool financial performance measures.
We measure compensation cost for stock units based on the closing market price of Whirlpool common stock at the grant date, with adjustments for performance stock units to reflect the final award granted. The weighted average grant date fair values of awards granted during
2018
,
2017
, and
2016
were
$157.09
,
$164.26
and
$127.88
, respectively. The total fair value of stock units vested during
2018
,
2017
, and
2016
was
$29 million
,
$29 million
and
$33 million
, respectively.
The following table summarizes stock unit activity during
2018
:
|
Stock units in thousands, except per-share data
|
Number of
Stock Units
|
Weighted- Average
Grant Date Fair
Value
|
|||||
|
Non-vested, at January 1
|
779
|
|
$
|
155.17
|
|
||
|
Granted
|
249
|
|
157.09
|
|
|||
|
Canceled
|
(67
|
)
|
158.96
|
|
|||
|
Vested and transferred to unrestricted
|
(233
|
)
|
178.91
|
|
|||
|
Non-vested, at December 31
|
728
|
|
$
|
150.63
|
|
||
84
NOTES TO THE CONSOLIDATED FINANCIAL STATEMENTS - (CONTINUED)
Nonemployee Director Equity Awards
In 2018, each nonemployee director received an annual grant of Whirlpool common stock, with the number of shares issued to the director determined by dividing
$130,000
by the closing price of Whirlpool common stock on the date of the annual meeting of our stockholders. Nonemployee directors receive a one-time grant of
1,000
shares of Whirlpool common stock made at the time they first join the Board.
(
13
)
RESTRUCTURING CHARGES
We periodically take action to improve operating efficiencies, typically in connection with business acquisitions or changes in the economic environment. Our footprint and headcount reductions and organizational integration actions relate to discrete, unique restructuring events, primarily reflected in the following plans:
In the second quarter of 2015, we committed to a restructuring plan to integrate our Italian legacy operations with those of Indesit. The industrial restructuring plan, which was approved by the relevant labor unions in July 2015 and signed by the Italian government in August 2015, provided for the closure or repurposing of certain manufacturing facilities and headcount reductions at other facilities. In addition, the restructuring plan provided for headcount reductions in the salaried employee workforce. We estimate that we will incur up to
€179 million
(approximately
$205 million
as of
December 31, 2018
) in employee-related costs,
€25 million
(approximately
$29 million
as of
December 31, 2018
) in asset impairment costs and
€37 million
(approximately
$42 million
as of
December 31, 2018
) in other associated costs in connection with these actions. We expect these actions will be complete in 2019. We estimate
€209 million
(approximately
$240 million
as of
December 31, 2018
) of the estimated
€241 million
(approximately
$276 million
as of
December 31, 2018
) total cost will result or has resulted in cash expenditures. As of
December 31, 2018
,
€10 million
(approximately
$11 million
) remains to be expensed.
In January 2017 the Company and certain of its subsidiary companies began consultations with certain works councils and other regulatory agencies in connection with the Company's proposal to restructure its EMEA dryer manufacturing operations. Company management authorized the initiation of such consultations on December 30, 2016. These actions resulted in changing the operations at the Company's Yate, U.K. facility to focus on manufacturing for U.K. consumer needs only; ending production in 2018 in Amiens, France; and concentrating the production of dryers for non-U.K. consumer needs in Lodz, Poland. These actions were substantially complete in 2018 with approximately
500
positions being impacted. The Company estimates that it will incur up to approximately
€59 million
(approximately
$68 million
as of
December 31, 2018
) in employee-related costs, approximately
€11 million
(approximately
$13 million
as of
December 31, 2018
) in asset impairment costs and approximately
€10 million
(approximately
$11 million
as of
December 31, 2018
) in other associated costs in connection with these actions. The Company estimates that approximately
€69 million
(approximately
$79 million
as of
December 31, 2018
) of the estimated
€80 million
(approximately
$92 million
as of
December 31, 2018
) total cost will result or has resulted in cash expenditures. As of
December 31, 2018
,
€3 million
(approximately
$4 million
) remains to be expensed.
In the fourth quarter of 2017, the Company announced an initiative to reduce fixed overhead costs by
$150 million
, which was implemented in 2018. This initiative primarily impacted our overhead costs, including salary headcount and third-party services. The restructuring actions pursuant to this initiative are complete.
In January 2018, we announced certain restructuring actions related to streamlining operations in our Embraco compressor business. These actions resulted in ceasing operations and ending production at Embraco's Riva Presso Chieri, Turin, Italy facility in 2018, and concentrating the assembly and manufacturing of compressors in Embraco's other manufacturing centers. The restructuring actions pursuant to these actions are complete.
In the fourth quarter of 2018, the Company announced actions in EMEA to reduce fixed overhead costs by
$50 million
. The initiatives primarily include the exit from domestic sales operations (which does not include manufacturing operations) in Turkey and headcount reductions throughout the EMEA region. The Company estimates that it will incur up to
€56 million
(approximately
$64 million
as of
December 31, 2018
) in employee-related costs, approximately
€6 million
(approximately
$7 million
as of
December 31, 2018
) in asset impairment costs and approximately
€11 million
(approximately
$13 million
as of
December 31, 2018
) in other associated costs in connection with these actions. We expect these actions will be substantially complete in 2019.
85
NOTES TO THE CONSOLIDATED FINANCIAL STATEMENTS - (CONTINUED)
The following tables summarize the changes to our restructuring liability for the years ended
December 31, 2018
and
2017
:
|
Millions of dollars
|
12/31/2017
|
Charges to Earnings
|
Cash Paid
|
Non-Cash and Other
|
12/31/2018
|
||||||||||
|
Employee termination costs
|
$
|
131
|
|
$
|
155
|
|
$
|
(202
|
)
|
$
|
—
|
|
$
|
84
|
|
|
Asset impairment costs
|
—
|
|
43
|
|
—
|
|
(43
|
)
|
—
|
|
|||||
|
Facility exit costs
|
2
|
|
41
|
|
(52
|
)
|
—
|
|
(9
|
)
|
|||||
|
Other exit costs
|
29
|
|
8
|
|
(11
|
)
|
(5
|
)
|
21
|
|
|||||
|
Total
|
$
|
162
|
|
$
|
247
|
|
$
|
(265
|
)
|
$
|
(48
|
)
|
$
|
96
|
|
|
Millions of dollars
|
12/31/2016
|
Charge to Earnings
|
Cash Paid
|
Non-cash and Other
|
12/31/2017
|
||||||||||
|
Employee termination costs
|
$
|
71
|
|
$
|
185
|
|
$
|
(125
|
)
|
$
|
—
|
|
$
|
131
|
|
|
Asset impairment costs
|
—
|
|
40
|
|
—
|
|
(40
|
)
|
—
|
|
|||||
|
Facility exit costs
|
2
|
|
28
|
|
(28
|
)
|
—
|
|
2
|
|
|||||
|
Other exit costs
|
14
|
|
22
|
|
(19
|
)
|
12
|
|
29
|
|
|||||
|
Total
|
$
|
87
|
|
$
|
275
|
|
$
|
(172
|
)
|
$
|
(28
|
)
|
$
|
162
|
|
The following table summarizes
2018
restructuring charges by operating segment:
|
Millions of dollars
|
2018 Charges
|
||
|
North America
|
$
|
5
|
|
|
EMEA
|
125
|
|
|
|
Latin America
|
99
|
|
|
|
Asia
|
—
|
|
|
|
Corporate / Other
|
18
|
|
|
|
Total
|
$
|
247
|
|
86
NOTES TO THE CONSOLIDATED FINANCIAL STATEMENTS - (CONTINUED)
(
14
)
INCOME TAXES
Income tax expense was
$138 million
,
$550 million
, and
$186 million
in
2018
,
2017
and
2016
, respectively. The following table summarizes the difference between an income tax benefit at the United States statutory rate of
21%
in 2018, and
35%
in 2017 and 2016, respectively, and the income tax expense at effective worldwide tax rates for the respective periods:
|
Millions of dollars
|
2018
|
2017
|
2016
|
|||||||||
|
Earnings (loss) before income taxes
|
||||||||||||
|
United States
|
$
|
729
|
|
$
|
671
|
|
$
|
605
|
|
|||
|
Foreign
|
(750
|
)
|
216
|
|
509
|
|
||||||
|
Earnings (loss) before income taxes
|
(21
|
)
|
887
|
|
1,114
|
|
||||||
|
Income tax (benefit) expense computed at United States statutory rate
|
(4
|
)
|
310
|
|
390
|
|
||||||
|
U.S. government tax incentives
|
(11
|
)
|
(13
|
)
|
(9
|
)
|
||||||
|
Foreign government tax incentives, including BEFIEX
|
(21
|
)
|
(29
|
)
|
(11
|
)
|
||||||
|
Foreign tax rate differential
|
(24
|
)
|
(14
|
)
|
(50
|
)
|
||||||
|
U.S. foreign tax credits
|
(260
|
)
|
17
|
|
(86
|
)
|
||||||
|
Valuation allowances
|
75
|
|
(68
|
)
|
(121
|
)
|
||||||
|
State and local taxes, net of federal tax benefit
|
23
|
|
29
|
|
20
|
|
||||||
|
Foreign withholding taxes
|
24
|
|
41
|
|
36
|
|
||||||
|
U.S. tax on foreign dividends and subpart F income
|
72
|
|
12
|
|
63
|
|
||||||
|
Settlement of global tax audits
|
72
|
|
48
|
|
(40
|
)
|
||||||
|
U.S. Transition Tax
|
40
|
|
190
|
|
—
|
|
||||||
|
Changes in enacted tax rates
|
(54
|
)
|
49
|
|
32
|
|
||||||
|
Nondeductible goodwill
|
139
|
|
—
|
|
—
|
|
||||||
|
Nondeductible fines & penalties
|
30
|
|
—
|
|
—
|
|
||||||
|
Other items, net
|
37
|
|
(22
|
)
|
(38
|
)
|
||||||
|
Income tax computed at effective worldwide tax rates
|
$
|
138
|
|
$
|
550
|
|
$
|
186
|
|
|||
Current and Deferred Tax Provision
The following table summarizes our income tax (benefit) provision for
2018
,
2017
and
2016
:
|
|
2018
|
2017
|
2016
|
||||||||||||||||||||
|
Millions of dollars
|
Current
|
Deferred
|
Current
|
Deferred
|
Current
|
Deferred
|
|||||||||||||||||
|
United States
|
$
|
(70
|
)
|
$
|
120
|
|
$
|
138
|
|
$
|
386
|
|
$
|
34
|
|
$
|
120
|
|
|||||
|
Foreign
|
182
|
|
(119
|
)
|
213
|
|
(233
|
)
|
167
|
|
(154
|
)
|
|||||||||||
|
State and local
|
12
|
|
13
|
|
12
|
|
34
|
|
7
|
|
12
|
|
|||||||||||
|
$
|
124
|
|
$
|
14
|
|
$
|
363
|
|
$
|
187
|
|
$
|
208
|
|
$
|
(22
|
)
|
||||||
|
Total income tax expense
|
$
|
138
|
|
$
|
550
|
|
$
|
186
|
|
||||||||||||||
United States Government Tax Legislation
On December 22, 2017, H.R.1 (the “Tax Cuts and Jobs Act”) was signed into law. Significant provisions impacting Whirlpool's 2017 and 2018 effective tax rate include the reduction in corporate tax rate from 35% to 21% effective in 2018, a one-time deemed repatriation (“Transition Tax”) on earnings of certain foreign subsidiaries that were previously tax deferred, and the creation of new taxes on certain foreign sourced earnings.
As of December 31, 2017, pursuant to the SEC guidance under SAB118, the Company made a reasonable estimate of the provisional effects of the rate reduction on its existing deferred tax balances and the impact of the one-time Transition Tax. For the items for which the Company was able to determine a reasonable estimate, it recognized the following provisional impacts. The reduction in corporate tax rate resulted in a one-time tax expense in the amount of
$49 million
related to the revaluation of our U.S. net deferred tax asset. Transition Tax resulted in a one-time tax expense in the amount of
$190 million
. These amounts represented the Company's best estimate of the impact of the Tax Cuts and Jobs act, at that time.
87
NOTES TO THE CONSOLIDATED FINANCIAL STATEMENTS - (CONTINUED)
As of December 31, 2018, the Company has revised these estimated amounts and recognized an additional tax benefit in the amount of
$54 million
on the difference between the 2017 U.S. enacted tax rate of 35%, and the 2018 enacted tax rate of 21%, primarily related to a
$350 million
tax deductible pension plan contribution included on the Company's 2017 U.S. Corporation income tax return. The Company recognized additional tax expense of
$95 million
related to the Transition Tax, including
$55 million
of unrecognized tax benefits during the fourth quarter. As of December 31, 2018, we have recognized
$285 million
tax expense related to Transition Tax inclusive of the amount recorded during 2017. As of December 31, 2018, the Company has completed its accounting for the tax effects of the enactment of the Tax Cuts and Jobs Act; however, we continue to expect the United States Treasury to issue regulations that could have a material financial statement impact on the Company's effective tax rate in future periods. In addition, to the extent there are settlements in the future for certain foreign unrecognized tax benefits, the Transition Tax may also be revised in future period.
United States Tax on Foreign Dividends
We have historically reinvested all unremitted earnings of the majority of our foreign subsidiaries and affiliates, and therefore have not recognized any U.S. deferred tax liability on those earnings. However, upon the enactment of the Tax Cuts and Jobs Act, the unremitted earnings and profits of our foreign subsidiaries and affiliates, subsequent to 1986, are subject to U.S. tax under the Transition Tax provision. The Company has estimated U.S. GAAP earnings as of December 31, 2018 of
$2.8 billion
. Under the Transition Tax provision, the Company recognized a deemed remittance of
$3.3 billion
. The Company had cash and cash equivalents of approximately
$1.5 billion
at December 31, 2018, of which substantially all was held by subsidiaries in foreign countries. Our intent is to permanently reinvest these funds outside of the United States and our current plans do not demonstrate a need to repatriate the cash to fund our U.S. operations. However, if these funds were repatriated, we would be required to accrue and pay applicable United States taxes (if any) and withholding taxes payable to various countries. It is not practicable to estimate the tax impact of the reversal of the outside basis difference, or the repatriation of cash due to the complexity of its hypothetical calculation.
Valuation Allowances
At December 31,
2018
, we had net operating loss carryforwards of
$4.9 billion
,
$801 million
of which were U.S. state net operating loss carryforwards. Of the total net operating loss carryforwards,
$3.2 billion
do not expire, with substantially all of the remaining carryforwards expiring in various years through 2038. As of December 31,
2018
, we had
$875 million
of United States general business credit carryforwards available to offset future payments of federal income taxes, expiring between 2029 and 2038.
We routinely review the future realization of deferred tax assets based on projected future reversal of taxable temporary differences, available tax planning strategies and projected future taxable income. We have recorded a valuation allowance to reflect the net estimated amount of certain deferred tax assets associated with net operating loss and other deferred tax assets we believe will be realized. Our recorded valuation allowance of
$348 million
at December 31,
2018
consists of
$286 million
of net operating loss carryforward deferred tax assets and
$62 million
of other deferred tax assets. Our recorded valuation allowance was
$178 million
at December 31, 2017 and consisted of
$156 million
of net operating loss carryforward deferred tax assets and
$22 million
of other deferred tax assets. The increase in our valuation allowance includes
$75 million
recognized in net earnings, with the remaining change related to reclassification within our net deferred tax asset. We believe that it is more likely than not that we will realize the benefit of existing deferred tax assets, net of valuation allowances mentioned above.
Settlement of Global Tax Audits
We are in various stages of audits by certain governmental tax authorities. We establish liabilities for the difference between tax return provisions and the benefits recognized in our financial statements. Such amounts represent a reasonable provision for taxes ultimately expected to be paid, and may need to be adjusted over time as more information becomes known. We are no longer subject to any significant United States federal tax examinations for the years before 2009, or any state, local or foreign income tax examinations by tax authorities for years before 2004.
88
NOTES TO THE CONSOLIDATED FINANCIAL STATEMENTS - (CONTINUED)
Deferred Tax Liabilities and Assets
Deferred income taxes reflect the net tax effects of temporary differences between the carrying amounts of assets and liabilities used for financial reporting purposes and the amounts used for income tax purposes. The following table summarizes the significant components of our deferred tax liabilities and assets at December 31,
2018
and
2017
:
|
Millions of dollars
|
2018
|
2017
|
||||||
|
Deferred tax liabilities
|
||||||||
|
Intangibles
|
$
|
450
|
|
$
|
610
|
|
||
|
Property, net
|
195
|
|
185
|
|
||||
|
LIFO inventory
|
37
|
|
38
|
|
||||
|
Other
|
262
|
|
177
|
|
||||
|
Total deferred tax liabilities
|
944
|
|
1,010
|
|
||||
|
Deferred tax assets
|
||||||||
|
U.S. general business credit carryforwards, including Energy Tax Credits
|
875
|
|
927
|
|
||||
|
Pensions
|
144
|
|
220
|
|
||||
|
Loss carryforwards
|
1,051
|
|
880
|
|
||||
|
Postretirement obligations
|
99
|
|
109
|
|
||||
|
Research and development capitalization
|
135
|
|
129
|
|
||||
|
Employee payroll and benefits
|
98
|
|
56
|
|
||||
|
Accrued expenses
|
154
|
|
170
|
|
||||
|
Product warranty accrual
|
55
|
|
55
|
|
||||
|
Receivable and inventory allowances
|
85
|
|
56
|
|
||||
|
Other
|
536
|
|
521
|
|
||||
|
Total deferred tax assets
|
3,232
|
|
3,123
|
|
||||
|
Valuation allowances for deferred tax assets
|
(348
|
)
|
(178
|
)
|
||||
|
Deferred tax assets, net of valuation allowances
|
2,884
|
|
2,945
|
|
||||
|
Net deferred tax assets
|
$
|
1,940
|
|
$
|
1,935
|
|
||
Unrecognized Tax Benefits
The following table represents a reconciliation of the beginning and ending amount of unrecognized tax benefits that if recognized would impact the effective tax rate, excluding federal benefits of state and local tax positions, and interest and penalties:
|
Millions of dollars
|
2018
|
2017
|
2016
|
|||||||||
|
Balance, January 1
|
$
|
219
|
|
$
|
102
|
|
$
|
143
|
|
|||
|
Additions for tax positions of the current year
|
21
|
|
25
|
|
14
|
|
||||||
|
Additions for tax positions of prior years
|
60
|
|
110
|
|
1
|
|
||||||
|
Reductions for tax positions of prior years
|
(5
|
)
|
(1
|
)
|
(33
|
)
|
||||||
|
Settlements during the period
|
(8
|
)
|
(10
|
)
|
(20
|
)
|
||||||
|
Lapses of applicable statute of limitation
|
(9
|
)
|
(7
|
)
|
(3
|
)
|
||||||
|
Balance, December 31
|
$
|
278
|
|
$
|
219
|
|
$
|
102
|
|
|||
Interest and penalties associated with unrecognized tax benefit resulted in a net expense of
$2 million
as of December 31,
2018
, a net expense of
$8 million
in
2017
, and a net benefit of
$19 million
in
2016
. We have accrued a total of
$46 million
,
$45 million
and
$42 million
at December 31,
2018
,
2017
and
2016
, respectively.
It is reasonably possible that certain unrecognized tax benefits of
$15 million
could be settled with various related jurisdictions during the next 12 months.
(
15
)
SEGMENT INFORMATION
Our reportable segments are based upon geographic region and are defined as North America, EMEA, Latin America and Asia. These regions also represent our operating segments. Each segment manufactures home appliances and related components, but serves strategically different marketplaces. The chief operating decision maker evaluates performance based upon each segment's earning (loss) before interest and taxes (EBIT), which we define as operating profit less interest and sundry (income) expense and excluding restructuring costs, asset impairment charges and
89
NOTES TO THE CONSOLIDATED FINANCIAL STATEMENTS - (CONTINUED)
certain other items that management believes are not indicative of the Company's ongoing performance, if any. Total assets by segment are those assets directly associated with the respective operating activities. The "Other/Eliminations" column primarily includes corporate expenses, assets and eliminations, as well as restructuring costs and asset impairments, if any. Intersegment sales are eliminated within each region except compressor sales out of Latin America, which are included in Other/Eliminations.
Effective January 1, 2018, we realigned the composition of certain segments to align with our new leadership reporting structure. We now report our Mexico business as a part of our Latin America segment, and have shifted certain adjacent business from the North America segment to the Asia segment. The determination of the Company's reportable segments was not affected by these changes. Prior year amounts have been reclassified to conform with current year presentation.
Sales to Lowe's, a North American retailer, represented approximately
12%
,
10%
and
9%
of our consolidated net sales in 2018, 2017 and 2016, respectively. The Company did not have any customer with accounts receivable of more than 10% of consolidated accounts receivable as of December 31, 2018 and 2017, respectively.
In the last three years, two countries - the United States and China - individually comprised at least 10% of consolidated net sales or long-lived assets within the country in the last three years.
The following table summarizes net sales and long-lived assets by geographic area:
|
Millions of dollars
|
United States
|
China
|
All Other
Countries
|
Total
|
||||||||||||
|
2018:
|
||||||||||||||||
|
Sales to external customers
|
$
|
10,642
|
|
$
|
851
|
|
$
|
9,544
|
|
$
|
21,037
|
|
||||
|
Long-lived assets
|
4,556
|
|
907
|
|
2,698
|
|
8,161
|
|
||||||||
|
2017:
|
||||||||||||||||
|
Sales to external customers
|
$
|
10,378
|
|
$
|
824
|
|
$
|
10,051
|
|
$
|
21,253
|
|
||||
|
Long-lived assets
|
4,577
|
|
1,066
|
|
4,099
|
|
9,742
|
|
||||||||
|
2016:
|
||||||||||||||||
|
Sales to external customers
|
$
|
9,901
|
|
$
|
945
|
|
$
|
9,872
|
|
$
|
20,718
|
|
||||
|
Long-lived assets
|
4,587
|
|
981
|
|
3,750
|
|
9,318
|
|
||||||||
90
NOTES TO THE CONSOLIDATED FINANCIAL STATEMENTS - (CONTINUED)
|
|
OPERATING SEGMENTS
|
|||||||||||||||||||||||
|
Millions of dollars
|
North
America
|
EMEA
|
Latin
America
|
Asia
|
Other/
Eliminations
|
Total
Whirlpool
|
||||||||||||||||||
|
Net sales
|
||||||||||||||||||||||||
|
2018
|
11,374
|
|
4,536
|
|
|
3,618
|
|
|
1,587
|
|
|
(78
|
)
|
|
21,037
|
|
||||||||
|
2017
|
11,065
|
|
4,881
|
|
|
3,946
|
|
|
1,539
|
|
|
(178
|
)
|
|
21,253
|
|
||||||||
|
2016
|
10,541
|
|
5,148
|
|
3,731
|
|
1,490
|
|
(192
|
)
|
20,718
|
|
||||||||||||
|
Intersegment sales
|
||||||||||||||||||||||||
|
2018
|
$
|
267
|
|
$
|
101
|
|
|
$
|
1,313
|
|
|
$
|
358
|
|
|
$
|
(2,039
|
)
|
|
$
|
—
|
|
||
|
2017
|
271
|
|
118
|
|
|
1,273
|
|
|
289
|
|
|
(1,951
|
)
|
|
—
|
|
||||||||
|
2016
|
263
|
|
67
|
|
1,257
|
|
291
|
|
(1,878
|
)
|
—
|
|
||||||||||||
|
Depreciation and amortization
|
||||||||||||||||||||||||
|
2018
|
$
|
196
|
|
$
|
204
|
|
|
$
|
111
|
|
|
$
|
72
|
|
|
$
|
62
|
|
|
$
|
645
|
|
||
|
2017
|
210
|
|
197
|
|
|
126
|
|
|
63
|
|
|
58
|
|
|
654
|
|
||||||||
|
2016
|
212
|
|
204
|
|
121
|
|
63
|
|
55
|
|
655
|
|
||||||||||||
|
EBIT
|
||||||||||||||||||||||||
|
2018
|
$
|
1,338
|
|
$
|
(106
|
)
|
|
$
|
184
|
|
|
$
|
83
|
|
|
$
|
(1,328
|
)
|
|
$
|
171
|
|
||
|
2017
|
1,282
|
|
(19
|
)
|
|
248
|
|
|
14
|
|
|
(476
|
)
|
|
1,049
|
|
||||||||
|
2016
|
1,224
|
|
150
|
|
192
|
|
93
|
|
(384
|
)
|
1,275
|
|
||||||||||||
|
Total assets
|
||||||||||||||||||||||||
|
2018
|
$
|
7,161
|
|
$
|
7,299
|
|
$
|
4,745
|
|
$
|
2,636
|
|
$
|
(3,494
|
)
|
$
|
18,347
|
|
||||||
|
2017
|
6,956
|
|
8,781
|
|
4,847
|
|
2,745
|
|
(3,291
|
)
|
20,038
|
|
||||||||||||
|
2016
|
7,018
|
|
7,497
|
|
4,242
|
|
2,829
|
|
(2,433
|
)
|
19,153
|
|
||||||||||||
|
Capital expenditures
|
||||||||||||||||||||||||
|
2018
|
$
|
180
|
|
$
|
154
|
|
|
$
|
110
|
|
|
$
|
71
|
|
|
$
|
75
|
|
|
$
|
590
|
|
||
|
2017
|
172
|
|
219
|
|
|
137
|
|
|
106
|
|
|
50
|
|
|
684
|
|
||||||||
|
2016
|
172
|
|
199
|
|
132
|
|
68
|
|
89
|
|
660
|
|
||||||||||||
A reconciliation of our segment information to the corresponding amounts in the Consolidated Statements of Comprehensive Income (Loss) is shown in the table below:
|
in millions
|
December 31, 2018
|
December 31, 2017
|
December 31, 2016
|
||||
|
Total EBIT
|
171
|
|
1,049
|
|
1,275
|
|
|
|
Less: Interest expense
|
192
|
|
162
|
|
161
|
|
|
|
Less: Income tax (benefit) expense
|
138
|
|
550
|
|
186
|
|
|
|
Net earnings (loss)
|
(159
|
)
|
337
|
|
928
|
|
|
(
16
)
ASSETS AND LIABILITIES HELD FOR SALE
Embraco Sale Transaction
On April 23, 2018, our Board of Directors approved the sale of Embraco and we subsequently entered into an agreement to sell the compressor business for a cash purchase price of
$1.08 billion
, subject to customary adjustments including for indebtedness, cash and working capital at closing. Please see "Embraco Sale Transaction" in the Management's Discussion and Analysis section for additional information on the agreement. We expect the transaction to close in early 2019.
Embraco is reported within our Latin America reportable segment and meets the criteria for held for sale accounting. The operations of Embraco do not meet the criteria to be presented as discontinued operations.
91
NOTES TO THE CONSOLIDATED FINANCIAL STATEMENTS - (CONTINUED)
The carrying amounts of the major classes of Embraco's assets and liabilities as of
December 31, 2018
and
December 31, 2017
include the following:
|
Millions of dollars
|
December 31, 2018
|
December 31, 2017
|
|||||
|
Accounts receivable, net of allowance of $8 and $7, respectively
|
198
|
|
202
|
|
|||
|
Inventories
|
165
|
|
215
|
|
|||
|
Prepaid and other current assets
|
42
|
|
61
|
|
|||
|
Property, net of accumulated depreciation of $616 and $740, respectively
|
364
|
|
390
|
|
|||
|
Other noncurrent assets
|
49
|
|
36
|
|
|||
|
Total assets
|
$
|
818
|
|
$
|
904
|
|
|
|
Accounts payable
|
$
|
361
|
|
$
|
392
|
|
|
|
Accrued expenses
|
27
|
|
25
|
|
|||
|
Accrued advertising and promotion
|
12
|
|
24
|
|
|||
|
Other current liabilities
|
55
|
|
42
|
|
|||
|
Other noncurrent liabilities
|
34
|
|
45
|
|
|||
|
Total liabilities
|
$
|
489
|
|
$
|
528
|
|
|
The following table summarizes Embraco's earnings before income taxes for the twelve months ended
December 31, 2018
, 2017 and 2016:
|
Millions of dollars
|
2018
|
2017
|
2016
|
|||||
|
Earnings before income taxes
|
53
|
|
90
|
|
110
|
|
||
(
17
)
QUARTERLY RESULTS OF OPERATIONS (UNAUDITED)
|
|
Three months ended
|
||||||||||||||||||||||||||
|
Dec. 31
|
Sept. 30
|
Jun. 30
|
Mar. 31
|
||||||||||||||||||||||||
|
Millions of dollars, except per share data
|
2018
|
2017
|
2018
|
2017
|
2018
(2)
|
2017
|
2018
|
2017
|
|||||||||||||||||||
|
Net sales
|
$
|
5,660
|
|
$
|
5,702
|
|
$
|
5,326
|
|
$
|
5,418
|
|
$
|
5,140
|
|
$
|
5,347
|
|
$
|
4,911
|
|
$
|
4,786
|
|
|||
|
Cost of products sold
|
4,710
|
|
4,717
|
|
4,431
|
|
4,503
|
|
4,260
|
|
4,471
|
|
4,099
|
|
3,960
|
|
|||||||||||
|
Gross margin
|
950
|
|
985
|
|
895
|
|
915
|
|
880
|
|
876
|
|
812
|
|
826
|
|
|||||||||||
|
Operating profit (loss)
|
309
|
|
267
|
|
299
|
|
331
|
|
(472
|
)
|
274
|
|
143
|
|
264
|
|
|||||||||||
|
Interest and sundry (income) expense
|
2
|
|
18
|
|
24
|
|
21
|
|
90
|
|
23
|
|
(8
|
)
|
25
|
|
|||||||||||
|
Net earnings (loss)
|
170
|
|
(272
|
)
|
216
|
|
272
|
|
(639
|
)
|
179
|
|
94
|
|
158
|
|
|||||||||||
|
Net earnings (loss) available to Whirlpool
|
170
|
|
(268
|
)
|
210
|
|
276
|
|
(657
|
)
|
189
|
|
94
|
|
153
|
|
|||||||||||
|
Per share of common stock:
(1)
|
|||||||||||||||||||||||||||
|
Basic net earnings (loss)
|
$
|
2.66
|
|
$
|
(3.74
|
)
|
$
|
3.25
|
|
$
|
3.78
|
|
$
|
(9.50
|
)
|
$
|
2.55
|
|
$
|
1.31
|
|
$
|
2.05
|
|
|||
|
Diluted net earnings (loss)
|
2.64
|
|
(3.74
|
)
|
3.22
|
|
3.72
|
|
(9.50
|
)
|
2.52
|
|
1.30
|
|
2.01
|
|
|||||||||||
|
Dividends
|
1.15
|
|
1.10
|
|
1.15
|
|
1.10
|
|
1.15
|
|
1.10
|
|
1.10
|
|
1.00
|
|
|||||||||||
|
(1)
|
The quarterly earnings per share amounts will not necessarily add to the earnings per share computed for the year due to the method used in calculating per share data.
|
(2)
The operating loss and net loss for the three months ended June 30, 2018 includes an impairment of goodwill and other intangibles of
$747 million
. The net loss for the three months ended June 30, 2018 also includes a
$103 million
charge related to the FCA settlement agreement.
See Note 5, Note 7 and Note 10 to the Consolidated Financial Statements for additional information.
92
|
ITEM 9.
|
CHANGES IN AND DISAGREEMENTS WITH ACCOUNTANTS ON ACCOUNTING AND FINANCIAL DISCLOSURE
|
None.
|
ITEM 9A.
|
CONTROLS AND PROCEDURES
|
Disclosure controls and procedures.
Whirlpool maintains disclosure controls and procedures (as defined in Rule 13a-15(e) of the Securities Exchange Act of 1934, as amended (the "Securities Exchange Act")) that are designed to provide reasonable assurance that information required to be disclosed in our filings under the Securities Exchange Act is recorded, processed, summarized, and reported within the periods specified in the rules and forms of the SEC and that such information is accumulated and communicated to Whirlpool's management, including its Chief Executive Officer and Chief Financial Officer, as appropriate, to allow timely decisions regarding required disclosure.
Prior to filing this report, we completed an evaluation under the supervision and with the participation of Whirlpool management, including the Chief Executive Officer and Chief Financial Officer, of the effectiveness of the design and operation of our disclosure controls and procedures as of
December 31, 2018
. Based on this evaluation, the Chief Executive Officer and Chief Financial Officer concluded that our disclosure controls and procedures were effective at the reasonable assurance level as of
December 31, 2018
.
Management's annual report on internal control over financial reporting.
Pursuant to Section 404 of the Sarbanes-Oxley Act of 2002 and the rules and regulations adopted pursuant thereto, we included a report of management's assessment of the effectiveness of our internal control over financial reporting as part of this report. Management's report is included on page 105 of this report under the caption entitled "Management's Report on Internal Control Over Financial Reporting" and is incorporated herein by reference.
Our internal control over financial reporting as of
December 31, 2018
has been audited by Ernst & Young LLP, an independent registered public accounting firm, as stated in their report, which is included on page 107 of this report under the caption entitled "Report of Independent Registered Public Accounting Firm" and is incorporated herein by reference.
There were no changes in our internal control over financial reporting during the quarter ended
December 31, 2018
that have materially affected, or are reasonably likely to materially affect, our internal control over financial reporting.
|
ITEM 9B.
|
OTHER INFORMATION
|
None.
93
|
PART III
|
||||
|
ITEM 10.
|
DIRECTORS, EXECUTIVE OFFICERS AND CORPORATE GOVERNANCE
|
Information regarding our executive officers is included in ITEM 1 of PART I of this report.
Information regarding the background of the directors, matters related to the Audit Committee, Section 16(a) compliance, and the process by which our shareholders may recommend nominees to our Board of Directors can be found under the captions "Directors and Nominees for Election as Directors," "Board of Directors and Corporate Governance - Board of Directors and Committees," "Section 16(a) Beneficial Ownership Reporting Compliance," and "Board of Directors and Corporate Governance - Director Nominations by Stockholders" in our Proxy Statement, which is incorporated herein by reference.
We have recently adopted a refreshed code of ethics that applies to all of our employees, officers and directors, including our principal executive officer, principal financial officer and principal accounting officer. The text of our refreshed code of ethics, or Integrity Manual, is posted on our website: www.whirlpoolcorp.com (scroll to the bottom of the main page and click on "Policies," then on "Integrity Manual.") Whirlpool intends to disclose future amendments to, or waivers from, certain provisions of the code of ethics for executive officers and directors on this website within four business days following the date of such amendment or waiver. Stockholders may request a free copy of the Integrity Manual from:
Investor Relations
Whirlpool Corporation
2000 North M-63
Mail Drop 2609
Benton Harbor, MI 49022-2692
Telephone: (269) 923-2641
Whirlpool has also adopted Corporate Governance Guidelines and written charters for its Audit, Finance, Human Resources and Corporate Governance and Nominating Committees, all of which are posted on our website: www.whirlpoolcorp.com (scroll to the bottom of the main page and click on "Policies.") Stockholders may request a free copy of the charters and guidelines from the address or telephone number set forth above.
|
ITEM 11.
|
EXECUTIVE COMPENSATION
|
Information regarding compensation of our executive officers and directors can be found under the captions "Nonemployee Director Compensation," "Compensation Discussion and Analysis," "Executive Compensation Tables," "Pay Ratio Disclosure," and "Human Resources Committee Interlocks and Insider Participation" in the Proxy Statement,
which is incorporated herein by reference. See also the information under the caption "Human Resources Committee Report" in our Proxy Statement, which is incorporated herein by reference; however, such information is only "furnished" hereunder and not deemed "soliciting material" or "filed" with the SEC or subject to Regulation 14A or 14C or to the liabilities of Section 18 of the Securities Exchange Act of 1934.
|
ITEM 12.
|
SECURITY OWNERSHIP OF CERTAIN BENEFICIAL OWNERS AND MANAGEMENT AND RELATED STOCKHOLDER MATTERS
|
Information regarding the security ownership of any person that we know to beneficially own more than 5% of Whirlpool stock and by each Whirlpool director, each Whirlpool named executive officer, and all directors and executive officers as a group, can be found under the captions "Security Ownership" and "Beneficial Ownership" in the Proxy Statement, which is incorporated herein by reference. Information relating to securities authorized under equity compensation plans can be found under the caption "Equity Compensation Plan Information" in the Proxy Statement, which is incorporated herein by reference.
94
|
ITEM 13.
|
CERTAIN RELATIONSHIPS AND RELATED TRANSACTIONS, AND DIRECTOR INDEPENDENCE
|
Information regarding certain relationships and related transactions (if any) and the independence of Whirlpool's directors, can be found under the captions "Related Person Transactions" and "Board of Directors and Corporate Governance - Board of Directors and Committees" in the Proxy Statement, which is incorporated herein by reference.
|
ITEM 14.
|
PRINCIPAL ACCOUNTING FEES AND SERVICES
|
Information regarding our auditors and the Audit Committee's pre-approval policies can be found under the caption "Matters Relating to Independent Registered Public Accounting Firm" in the Proxy Statement, which is incorporated herein by reference.
95
|
PART IV
|
||||
|
ITEM 15.
|
EXHIBITS, FINANCIAL STATEMENT SCHEDULES
|
(a) The following documents are filed as a part of this report:
1. Financial statements
|
PAGE
|
|
2. Financial Statement Schedules - "Schedule II—Valuation and Qualifying Accounts" is contained on page 108 of this report. Certain schedules for which provisions are made in the applicable accounting regulations of the Securities and Exchange Commission are not required under the related instructions or are inapplicable, and therefore have been omitted.
(b) The exhibits listed in the "Exhibit Index" is contained on page 97 of this report.
(c) Individual financial statements of the registrant's affiliated foreign companies, accounted for by the equity method, have been omitted since no such company individually constitutes a significant subsidiary.
|
ITEM 16.
|
Form 10-K Summary
|
None.
96
ANNUAL REPORT ON FORM 10-K
ITEMS 15(a)(3) and 15(c)
EXHIBIT INDEX
YEAR ENDED DECEMBER 31,
2018
The following exhibits are submitted herewith or incorporated herein by reference in response to Items 15(a)(3) and 15(c). Each exhibit that is considered a management contract or compensatory plan or arrangement required to be filed pursuant to Item 15(a)(3) of Form 10-K is identified by a "(Z)."
|
Number and Description of Exhibit
|
|
|
2(i)
|
|
|
3(i)
|
|
|
3(ii)
|
|
|
4(i)
|
The registrant hereby agrees to furnish to the Securities and Exchange Commission, upon request, a copy of instruments defining the rights of holders of each issue of long-term debt of the registrant and its subsidiaries.
|
|
4(ii)
|
Indenture dated as of April 15, 1990 between Whirlpool Corporation and Citibank, N.A. [Incorporated by reference from Exhibit 4(a) to the Company's Registration Statement on Form S-3 (Commission file number 33-40249) filed on May 6, 1991]
|
|
4(iii)
|
|
|
4(iv)
|
Indenture dated as of June 15, 1987 between Maytag Corporation and The First National Bank of Chicago [Incorporated by reference from Maytag Corporation's Quarterly Report on Form 10-Q (Commission file number 1-00655) for the quarter ended June 30, 1987]
|
|
4(v)
|
|
|
4(vi)
|
|
|
4(vii)
|
|
97
|
10(i)(a)
|
|
|
|
|
|
10(i)(b)
|
|
|
10(i)(c)
|
|
|
10(i)(d)
|
|
|
10(i)(e)
|
|
|
10(i)(f)
|
|
|
10(i)(g)
|
|
|
10(i)(h)
|
|
|
10(i)(i)
|
|
|
10(i)(j)
|
|
|
10(i)(k)
|
|
98
|
10(i)(l)
|
|
|
10(i)(m)
|
|
|
10(i)(n)
|
|
|
10(iii)(a)
|
|
|
10(iii)(b)
|
Whirlpool Corporation Charitable Award Contribution and Additional Life Insurance Plan for Directors (effective April 20, 1993) (Z) [Incorporated by reference from Exhibit 10(iii)(p) to the Company's Annual Report on Form 10-K (Commission file number 1-3932) for the fiscal year ended December 31, 1994]
|
|
10(iii)(c)
|
Whirlpool Corporation Deferred Compensation Plan for Directors (as amended effective January 1, 1992 and April 20, 1993) (Z) [Incorporated by reference from Exhibit 10(iii)(f) to the Company's Annual Report on Form 10-K (Commission file number 1-3932) for the fiscal year ended December 31, 1993]
|
|
|
|
|
10(iii)(d)
|
|
|
|
|
|
10(iii)(e)
|
|
|
10(iii)(f)
|
|
|
10(iii)(g)
|
|
|
10(iii)(h)
|
|
|
10(iii)(i)
|
|
|
10(iii)(j)
|
|
|
|
|
99
|
10(iii)(l)
|
|
|
10(iii)(m)
|
Form of Agreement for the Whirlpool Corporation Career Stock Grant Program (pursuant to one or more of Whirlpool's Omnibus Stock and Incentive Plans) (Z) [Incorporated by reference from Exhibit 10(iii)(q) to the Company's Annual Report on Form 10-K (Commission file number 1-3932) for the fiscal year ended December 31, 1995]
|
|
10(iii)(n)
|
|
|
10(iii)(o)
|
|
|
10(iii)(p)
|
|
|
10(iii)(q)
|
|
|
10(iii)(r)
|
|
|
10(iii)(s)
|
|
|
10(iii)(t)
|
|
|
10(iii)(u)
|
|
|
10(iii)(v)
|
|
|
10(iii)(w)
|
|
100
|
10(iii)(x)
|
|
|
10(iii)(y)
|
|
|
10(iii)(z)
|
Whirlpool Corporation Executive Deferred Savings Plan (as amended effective January 1, 1992) (Z) [Incorporated by reference from Exhibit 10(iii)(n) to the Company's Annual Report on Form 10-K (Commission file number 1-3932) for the fiscal year ended December 31, 1993]
|
|
10(iii)(aa)
|
|
|
10(iii)(bb)
|
|
|
10(iii)(cc)
|
|
|
10(iii)(dd)
|
|
|
10(iii)(ee)
|
|
|
10(iii)(ff)
|
|
|
10(iii)(gg)
|
|
|
10(iii)(hh)
|
|
|
10(iii)(ii)
|
|
|
21
|
|
|
23
|
|
|
24
|
|
|
31.1
|
|
101
|
31.2
|
|
|
32
|
|
|
101.INS
|
XBRL Instance Document
|
|
101.SCH
|
XBRL Taxonomy Extension Schema Document
|
|
101.CAL
|
XBRL Taxonomy Extension Calculation Linkbase Document
|
|
101.LAB
|
XBRL Taxonomy Extension Label Linkbase Document
|
|
101.PRE
|
XBRL Taxonomy Extension Presentation Linkbase Document
|
|
101.DEF
|
XBRL Taxonomy Extension Definition Linkbase Document
|
102
SIGNATURES
Pursuant to the requirements of Section 13 or 15(d) of the Securities Exchange Act of 1934, the registrant has duly caused this report to be signed on its behalf by the undersigned, thereunto duly authorized.
|
W
HIRLPOOL
C
ORPORATION
(Registrant)
|
|||
|
By:
|
|
/s/ JAMES W. PETERS
|
February 12, 2019
|
|
|
James W. Peters
Executive Vice President and Chief Financial Officer
|
||
Pursuant to the requirements of the Securities Exchange Act of 1934, this report has been signed below by the following persons on behalf of the registrant and in the capacities and on the date indicated.
|
Signature
|
|
Title
|
|
/s/ MARC R. BITZER
|
Chairman of the Board, President and Chief Executive Officer
(Principal Executive Officer) |
|
|
Marc R. Bitzer
|
|
|
|
/s/ JAMES W. PETERS
|
Executive Vice President and Chief Financial Officer
(Principal Financial Officer) |
|
|
James W. Peters
|
|
|
|
/s/ MATTHEW M. NOCHOWITZ
|
Vice President and Corporate Controller
(Principal Accounting Officer) |
|
|
Matthew M. Nochowitz
|
||
|
SAMUEL R. ALLEN*
|
Director
|
|
|
Samuel R. Allen
|
|
|
|
GREG CREED*
|
Director
|
|
|
Greg Creed
|
||
|
GARY T. DICAMILLO*
|
Director
|
|
|
Gary T. DiCamillo
|
|
|
|
DIANE M. DIETZ*
|
Director
|
|
|
Diane M. Dietz
|
||
|
GERRI T. ELLIOTT*
|
Director
|
|
|
Gerri T. Elliott
|
||
|
MICHAEL F. JOHNSTON*
|
Director
|
|
|
Michael F. Johnston
|
|
|
|
JOHN D. LIU*
|
Director
|
|
|
John D. Liu
|
||
|
JAMES M. LOREE*
|
Director
|
|
|
James M. Loree
|
||
|
HARISH MANWANI*
|
Director
|
|
|
Harish Manwani
|
||
|
WILLIAM D. PEREZ*
|
Director
|
|
|
William D. Perez
|
|
|
|
LARRY O. SPENCER*
|
Director
|
|
|
Larry O. Spencer
|
||
|
MICHAEL D. WHITE*
|
Director
|
|
|
Michael D. White
|
|
|
|
*By:
|
|
/s/ JAMES W. PETERS
|
|
Attorney-in-Fact
|
|
February 12, 2019
|
|
|
James W. Peters
|
|
|
|||
103
REPORT BY MANAGEMENT ON THE CONSOLIDATED FINANCIAL STATEMENTS
The management of Whirlpool Corporation has prepared the accompanying financial statements. The financial statements have been audited by Ernst & Young LLP, an independent registered public accounting firm, whose report, based upon their audits, expresses the opinion that these financial statements present fairly the consolidated financial position, statements of income and cash flows of Whirlpool and its subsidiaries in accordance with accounting principles generally accepted in the United States. Their audits are conducted in conformity with the auditing standards of the Public Company Accounting Oversight Board (United States).
The financial statements were prepared from the Company's accounting records, books and accounts which, in reasonable detail, accurately and fairly reflect all material transactions. The Company maintains a system of internal controls designed to provide reasonable assurance that the Company's books and records, and the Company's assets are maintained and accounted for, in accordance with management's authorizations. The Company's accounting records, compliance with policies and internal controls are regularly reviewed by an internal audit staff.
The audit committee of the Board of Directors of the Company is composed of six independent directors who, in the opinion of the board, meet the relevant financial experience, literacy, and expertise requirements. The audit committee provides independent and objective oversight of the Company's accounting functions and internal controls and monitors (1) the objectivity of the Company's financial statements, (2) the Company's compliance with legal and regulatory requirements, (3) the independent registered public accounting firm's qualifications and independence, and (4) the performance of the Company's internal audit function and independent registered public accounting firm. In performing these functions, the committee has the responsibility to review and discuss the annual audited financial statements and quarterly financial statements and related reports with management and the independent registered public accounting firm, including the Company's disclosures under "Management's Discussion and Analysis of Financial Condition and Results of Operations," to monitor the adequacy of financial disclosure. The committee also has the responsibility to retain and terminate the Company's independent registered public accounting firm and exercise the committee's sole authority to review and approve all audit engagement fees and terms and pre-approve the nature, extent, and cost of all non-audit services provided by the independent registered public accounting firm.
|
/s/ JAMES W. PETERS
|
|
James W. Peters
|
|
Executive Vice President and Chief Financial Officer
|
|
February 12, 2019
|
104
MANAGEMENT'S REPORT ON INTERNAL CONTROL OVER FINANCIAL REPORTING
The management of Whirlpool Corporation is responsible for establishing and maintaining adequate internal control over financial reporting as defined in Rules 13a – 15(f) and 15d – 15(f) under the Securities Exchange Act of 1934. Whirlpool's internal control system is designed to provide reasonable assurance to Whirlpool's management and board of directors regarding the reliability of financial reporting and the preparation and fair presentation of published financial statements.
All internal control systems, no matter how well designed, have inherent limitations. Therefore, even those systems determined to be effective can provide only reasonable assurance with respect to financial statement preparation and presentation.
The management of Whirlpool assessed the effectiveness of Whirlpool's internal control over financial reporting as of
December 31, 2018
.
In making this assessment, it used the criteria set forth by the Committee of Sponsoring Organizations of the Treadway Commission (COSO) in Internal Control—Integrated Framework (2013 Framework). Based on the assessment and those criteria, management believes that Whirlpool maintained effective internal control over financial reporting as of
December 31, 2018
.
Whirlpool's independent registered public accounting firm has issued an audit report on its assessment of Whirlpool's internal control over financial reporting. This report appears on page
107.
|
/s/ MARC R. BITZER
|
|
/s/ JAMES W. PETERS
|
|
Marc R. Bitzer
|
|
James W. Peters
|
|
Chairman of the Board, President and Chief Executive Officer
|
|
Executive Vice President and Chief Financial Officer
|
|
February 12, 2019
|
|
February 12, 2019
|
105
REPORT OF INDEPENDENT REGISTERED PUBLIC ACCOUNTING FIRM
To the Shareholders and Board of Directors of Whirlpool Corporation
Opinion on the Financial Statements
We have audited the accompanying consolidated balance sheets of Whirlpool Corporation (the Company) as of
December 31, 2018
and
2017
, the related consolidated statements of income (loss), comprehensive income (loss), shareholders' equity and cash flows for each of the three years in the period ended
December 31, 2018
, and the related notes and financial statement schedule listed in the index at Item 15(a) (collectively referred to as the "financial statements"). In our opinion, the financial statements present fairly, in all material respects, the consolidated financial position at
December 31, 2018
and
2017
, and the consolidated results of its operations and its cash flows for each of the three years in the period ended
December 31, 2018
, in conformity with U.S. generally accepted accounting principles.
We also have audited, in accordance with the standards of the Public Company Accounting Oversight Board (United States) (PCAOB), the Company's internal control over financial reporting as of
December 31, 2018
, based on criteria established in Internal Control-Integrated Framework issued by the Committee of Sponsoring Organizations of the Treadway Commission (2013 framework) and our report dated
February 12, 2019
expressed an unqualified opinion thereon.
Basis for Opinion
These financial statements are the responsibility of the Company's management. Our responsibility is to express an opinion on the Company's financial statements based on our audits. We are a public accounting firm registered with the PCAOB and are required to be independent with respect to the Company in accordance with the U.S. federal securities laws and the applicable rules and regulations of the Securities and Exchange Commission and the PCAOB.
We conducted our audits in accordance with the standards of the PCAOB. Those standards require that we plan and perform the audit to obtain reasonable assurance about whether the financial statements are free of material misstatement, whether due to error or fraud. Our audits included performing procedures to assess the risks of material misstatement of the financial statements, whether due to error or fraud, and performing procedures that respond to those risks. Such procedures included examining, on a test basis, evidence regarding the amounts and disclosures in the financial statements. Our audits also included evaluating the accounting principles used and significant estimates made by management, as well as evaluating the overall presentation of the financial statements. We believe that our audits provide a reasonable basis for our opinion.
/s/ Ernst & Young LLP
We have served as the Company's auditor since 1927.
Chicago, Illinois
February 12, 2019
106
REPORT OF INDEPENDENT REGISTERED PUBLIC ACCOUNTING FIRM
To the Shareholders and Board of Directors of Whirlpool Corporation
Opinion on Internal Control over Financial Reporting
We have audited Whirlpool Corporation's internal control over financial reporting as of
December 31, 2018
, based on criteria established in Internal Control-Integrated Framework issued by the Committee of Sponsoring Organizations of the Treadway Commission (2013 framework) (the COSO criteria). In our opinion, Whirlpool Corporation (the Company) maintained, in all material respects, effective internal control over financial reporting as of
December 31, 2018
, based on the COSO criteria.
We also have audited, in accordance with the standards of the Public Company Accounting Oversight Board (United States) (PCAOB), the consolidated balance sheets of the Company as of
December 31, 2018
and
2017
, the related consolidated statements of income (loss), comprehensive income (loss), shareholders' equity and cash flows for each of the three years in the period ended
December 31, 2018
, and the related notes and financial statement schedule listed in the index at Item 15(a) and our report dated
February 12, 2019
expressed an unqualified opinion thereon.
Basis for Opinion
The Company's management is responsible for maintaining effective internal control over financial reporting and for its assessment of the effectiveness of internal control over financial reporting included in the accompanying Management's Report on Internal Control over Financial Reporting. Our responsibility is to express an opinion on the Company's internal control over financial reporting based on our audit. We are a public accounting firm registered with the PCAOB and are required to be independent with respect to the Company in accordance with the U.S. federal securities laws and the applicable rules and regulations of the Securities and Exchange Commission and the PCAOB.
We conducted our audit in accordance with the standards of the PCAOB. Those standards require that we plan and perform the audit to obtain reasonable assurance about whether effective internal control over financial reporting was maintained in all material respects.
Our audit included obtaining an understanding of internal control over financial reporting, assessing the risk that a material weakness exists, testing and evaluating the design and operating effectiveness of internal control based on the assessed risk, and performing such other procedures as we considered necessary in the circumstances. We believe that our audit provides a reasonable basis for our opinion.
Definition and Limitations of Internal Control Over Financial Reporting
A company's internal control over financial reporting is a process designed to provide reasonable assurance regarding the reliability of financial reporting and the preparation of financial statements for external purposes in accordance with generally accepted accounting principles. A company's internal control over financial reporting includes those policies and procedures that (1) pertain to the maintenance of records that, in reasonable detail, accurately and fairly reflect the transactions and dispositions of the assets of the company; (2) provide reasonable assurance that transactions are recorded as necessary to permit preparation of financial statements in accordance with generally accepted accounting principles, and that receipts and expenditures of the company are being made only in accordance with authorizations of management and directors of the company; and (3) provide reasonable assurance regarding prevention or timely detection of unauthorized acquisition, use, or disposition of the company's assets that could have a material effect on the financial statements.
Because of its inherent limitations, internal control over financial reporting may not prevent or detect misstatements. Also, projections of any evaluation of effectiveness to future periods are subject to the risk that controls may become inadequate because of changes in conditions, or that the degree of compliance with the policies or procedures may deteriorate.
/s/ Ernst & Young LLP
Chicago, Illinois
February 12, 2019
107
SCHEDULE II—VALUATION AND QUALIFYING ACCOUNTS
WHIRLPOOL CORPORATION AND SUBSIDIARIES
Years Ended
December 31, 2018
,
2017
and
2016
(Millions of dollars)
|
COL. A
|
COL. B
|
COL. C
|
COL. D
|
COL. E
|
||||||||||
|
Description
|
Balance at Beginning
of Period |
Charged to Costs
and Expenses
|
Deductions (1)
|
Balance at End
of Period |
||||||||||
|
Allowance for doubtful accounts
|
||||||||||||||
|
Year Ended December 31, 2018:
|
$
|
157
|
|
54
|
|
(75
|
)
|
$
|
136
|
|
||||
|
Year Ended December 31, 2017:
|
$
|
185
|
|
73
|
|
(101
|
)
|
$
|
157
|
|
||||
|
Year Ended December 31, 2016:
|
$
|
160
|
|
57
|
|
(32
|
)
|
$
|
185
|
|
||||
|
Deferred tax valuation allowance
(2)
|
||||||||||||||
|
Year Ended December 31, 2018:
|
$
|
178
|
|
75
|
|
95
|
|
$
|
348
|
|
||||
|
Year Ended December 31, 2017:
|
$
|
150
|
|
(64
|
)
|
92
|
|
$
|
178
|
|
||||
|
Year Ended December 31, 2016:
|
$
|
286
|
|
(121
|
)
|
(15
|
)
|
$
|
150
|
|
||||
(1)
With respect to allowance for doubtful accounts, the amounts represent accounts charged off, net of translation adjustments and transfers. In 2018 the amount also includes an adjustment for Embraco compressor business, for additional information refer to Note 16 to the Consolidated Financial Statements. Recoveries were nominal for
2018
,
2017
and
2016
.
(2)
For additional information about our deferred tax valuation allowances, refer to Note 14 to the Consolidated Financial Statements.
108
[THIS PAGE INTENTIONALLY LEFT BLANK]
TABLE OF CONTENTS
Part IItem 1. BusinessItem 1A. Risk FactorsItem 1B. Unresolved Staff CommentsItem 2. PropertiesItem 3. Legal ProceedingsItem 4. Mine Safety DisclosuresPart IIItem 5. Market For Registrant's Common Equity, Related Stockholder Matters and Issuer Purchases Of Equity SecuritiesItem 6. Selected Financial DataItem 7. Management's Discussion and Analysis Of Financial Condition and Results Of OperationsItem 7A. Quantitative and Qualitative Disclosures About Market RiskItem 8. Financial Statements and Supplementary DataItem 9. Changes in and Disagreements with Accountants on Accounting and Financial DisclosureItem 9A. Controls and ProceduresItem 9B. Other InformationPart IIIItem 10. Directors, Executive Officers and Corporate GovernanceItem 11. Executive CompensationItem 12. Security Ownership Of Certain Beneficial Owners and Management and Related Stockholder MattersItem 13. Certain Relationships and Related Transactions, and Director IndependenceItem 14. Principal Accounting Fees and ServicesPart IVItem 15. Exhibits, Financial Statement SchedulesItem 16. Form 10-k Summary