WINGSTOP INC.
10-Ks and 10-Qs
|
|
|
|
|
|
|
|
|
|
|
|
|
|
|
|
|
|
|
|
|
|
|
|
|
|
|
|
|
|
|
|
|
|
|
|
|
|
UNITED STATES
SECURITIES AND EXCHANGE COMMISSION
Washington, D.C. 20549
|
FORM 10-K
|
(Mark one)
|
x
|
ANNUAL REPORT PURSUANT TO SECTION 13 OR 15(d) OF THE SECURITIES EXCHANGE ACT OF 1934
|
For the fiscal year ended
December 30, 2017
or
|
¨
|
TRANSITION REPORT PURSUANT TO SECTION 13 OR 15(d) OF THE SECURITIES EXCHANGE ACT OF 1934
|
For the transition period from _____ to _____
Commission File No. 001-37425
|
WINGSTOP INC.
|
|
(Exact name of registrant as specified in its charter)
|
|
Delaware
|
47-3494862
|
|
|
(State or other jurisdiction of incorporation or organization)
|
(IRS Employer Identification No.)
|
|
|
5501 LBJ Freeway, 5th Floor,
Dallas, Texas
|
75240
|
|
|
(Address of principal executive offices)
|
(Zip Code)
|
|
(972) 686-6500
(Registrant’s telephone number, including area code)
|
Securities registered pursuant to Section 12(b) of the Act:
|
||
|
Title of each class
|
Name of each exchange on which registered
|
|
|
Common Stock, par value $0.01 per share
|
NASDAQ Global Market
|
|
|
Securities registered pursuant to Section 12(g) of the Act: None
|
||
Indicate by check mark whether the registrant is a well-known seasoned issuer, as defined in Rule 405 of the Securities Act.
x
Yes
¨
No
Indicate by check mark if the Registrant is not required to file reports pursuant to Section 13 or Section 15(d) of the Act.
¨
Yes
x
No
Indicate by check mark whether the registrant (1) has filed all reports required to be filed by Section 13 or 15(d) of the Securities Exchange Act of 1934 during the preceding 12 months (or for such shorter period that the registrant was required to file such reports), and (2) has been subject to such filing requirements for the past 90 days.
x
Yes
¨
No
Indicate by check mark whether the registrant has submitted electronically and posted on its corporate Web site, if any, every Interactive Data File required to be submitted and posted pursuant to Rule 405 of Regulation S-T (§232.405 of this chapter) during the preceding 12 months (or for such shorter period that the registrant was required to submit and post such files).
x
Yes
¨
No
Indicate by check mark if disclosure of delinquent filers pursuant to Item 405 of Regulation S-K (§229.405 of this chapter) is not contained herein, and will not be contained, to the best of registrant’s knowledge, in definitive proxy or information statements incorporated by reference in Part III of this Form 10-K or any amendment to this Form10-K.
x
Indicate by check mark whether the registrant is a large accelerated filer, an accelerated filer, a non-accelerated filer, smaller reporting company, or an emerging growth company. See the definitions of “large accelerated filer,” “accelerated filer”, “smaller reporting company”, and “emerging growth company” in Rule 12b-2 of the Exchange Act.
|
Large accelerated filer
|
x
|
Accelerated filer
|
¨
|
|
|
Non-accelerated filer
|
¨
|
(Do not check if a smaller reporting company)
|
Smaller reporting company
|
¨
|
|
Emerging growth company
|
¨
|
|||
If an emerging growth company, indicate by check mark if the registrant has elected not to use the extended transition period for complying with any new or revised financial accounting standards provided pursuant to Section 13(a) of the Exchange Act.
¨
Indicate by check mark whether the registrant is a shell company (as defined in Rule 12b-2 of the Exchange Act).
¨
Yes
x
No
As of June 30, 2017, the aggregate market value of the registrant’s outstanding common equity held by non-affiliates was
$892.8 million
, based on the closing price of the registrant’s common stock on such date, the last trading day of the registrant’s most recently completed second fiscal quarter.
As of
February 23, 2018
, there were
29,112,040
shares of common stock, par value of $0.01 per share, outstanding.
DOCUMENTS INCORPORATED BY REFERENCE
Portions of the proxy statement for the
2018
annual meeting of shareholders, which will be filed no later than 120 days after the close of the registrant’s fiscal year ended
December 30, 2017
, are incorporated by reference into Part III of this report.
TABLE OF CONTENTS
PART I
|
Page
|
||
|
Item 1.
|
||
|
Item 1A.
|
||
|
Item 1B.
|
||
|
Item 2.
|
||
|
Item 3.
|
||
|
Item 4.
|
||
PART II
|
Item 5.
|
||
|
Item 6.
|
||
|
Item 7.
|
||
|
Item 7A.
|
||
|
Item 8.
|
||
|
Item 9.
|
||
|
Item 9A.
|
||
|
Item 9B.
|
||
PART III
|
Item 10.
|
||
|
Item 11.
|
||
|
Item 12.
|
||
|
Item 13.
|
||
|
Item 14.
|
||
PART IV
|
Item 15.
|
||
|
Signatures
|
||
3
Cautionary Note Regarding Forward-Looking Statements
This report includes statements of our expectations, intentions, plans and beliefs that constitute “forward-looking statements” within the meaning of Section 27A of the Securities Act of 1933 and Section 21E of the Securities Exchange Act of 1934 and are intended to come within the safe harbor protection provided by those sections. These statements, which involve risks and uncertainties, relate to the discussion of our business strategies and our expectations concerning future operations, margins, profitability, trends, liquidity and capital resources and to analyses and other information that are based on forecasts of future results and estimates of amounts not yet determinable. These forward-looking statements can generally by identified by the use of forward-looking terminology, including the terms “may,” “will,” “should,” “expect,” “intend,” “plan,” “anticipate,” “believe,” “think,” “estimate,” “seek,” “expect,” “predict,” “could,” “project,” “potential” or, in each case, their negative or other variations or comparable terminology, although not all forward-looking statements are accompanied by such terms. Examples of forward-looking statements in this Annual Report on Form 10-K include, but are not limited to, our expectations with respect to our future liquidity, expenses and consumer appeal. These forward-looking statements are made based on expectations and beliefs concerning future events affecting us and are subject to uncertainties, risks and factors relating to our operations and business environments, all of which are difficult to predict and many of which are beyond our control, that could cause our actual results to differ materially from those matters expressed or implied by these forward-looking statements. Such risks and other factors include those listed in Item 1A., “Risk Factors,” and elsewhere in this report.
When considering forward-looking statements in this report or that we make in other reports or statements, you should keep in mind the cautionary statements in this report and future reports we file with the SEC. New risks and uncertainties arise from time to time, and we cannot predict when they may arise or how they may affect us. Except as required by law, we assume no obligation to update or revise any forward-looking statements for any reason, or to update the reasons actual results could differ materially from those anticipated in any forward-looking statements, even if new information becomes available in the future.
Overview
The Wing Experts
Wingstop is a high-growth franchisor and operator of restaurants that specialize in cooked-to-order, hand-sauced and tossed chicken wings. We believe we pioneered the concept of wings as a “center-of-the-plate” item for all of our meal occasions. We offer our guests 11 bold, distinctive and craveable flavors on our bone-in and boneless chicken wings and tenders paired with hand-cut, seasoned fries and sides made fresh daily. Our menu is highly customizable for different dining occasions, and we believe it delivers a compelling value proposition for groups, families, and individuals.
Wings are our “center-of-the-plate” specialty. While other concepts include wings as add-on menu items or focus on wings in a bar or sports-centric setting, we are focused on wings, fries and sides, which generate approximately
92%
of our sales. We are the largest fast casual chicken wings-focused restaurant chain in the world, and have demonstrated strong, consistent growth on a global scale. The Company is primarily a franchisor, with approximately
98%
of Wingstop’s restaurants currently owned and operated by independent franchisees.
We believe our simple and efficient restaurant operating model, low initial cash investment and compelling restaurant economics help drive continued system growth through both existing and new franchisees. Our focused restaurant operating model requires few ingredients and easy preparation within a small, flexible real estate footprint. During fiscal year
2017
, carry-out orders constituted
approximately 75%
of our sales. We believe our efficient model offers an attractive investment opportunity for our franchisees as evidenced by our domestic average sales-to-investment ratio of
3 to 1
and is further evidenced by the fact that we have more than doubled our global restaurant count since the end of 2011. We believe our asset-light, highly-franchised business model generates strong operating margins and requires low capital expenditures, creating stockholder value through strong and consistent free cash flow and capital-efficient growth.
Our Industry
We operate in the rapidly growing, fast casual segment of the restaurant industry. According to Technomic, the fast casual segment generated approximately $52 billion of sales in 2017, representing a 10% increase from 2016. Technomic projects the fast casual
4
segment will exceed $76 billion in annual sales by 2022. According to Technomic, 2017 total sales for restaurants categorized as limited service restaurants, or LSRs, which includes the fast casual segment, increased 4.4% to $280 billion. We believe that fast casual concepts, such as Wingstop, attract customers away from other restaurant segments and, accordingly, are generating faster growth than the overall restaurant industry and increasing market share relative to other segments.
Segments
Our business is structured into two reporting segments based on the organizational units used by our management to monitor performance and make operating decisions. Our reporting segments are franchise operations and company restaurant operations. Financial data for our reporting segments is included in the audited consolidated financial statements and the related notes thereto included elsewhere in this report.
Our Strengths
Our Menu
Wingstop is
the
destination when our guests crave fresh, cooked-to-order wings with bold, layered flavors that touch all of the senses. People who prioritize flavor prioritize Wingstop because it is more than a meal, it is a flavor experience. We speak in bold, distinctive and craveable flavors. Our dialect is our 11 proprietary flavors, which range from extremely hot to mild: Atomic, Mango Habanero, Cajun, Original Hot, Louisiana Rub, Mild, Hickory Smoked BBQ, Lemon Pepper, Garlic Parmesan, Hawaiian and Teriyaki.
Our diverse flavor offerings allow our guests to customize their experience. All of our wings are cooked-to-order, hand-sauced and tossed and served fresh to our guests for dine-in or carry-out. We never use heat lamps or microwaves in the preparation of our food. To complement our wings, we serve hand-cut, seasoned fries, crafted from carefully selected whole Russet potatoes. We complete the flavor experience with fresh, hand-cut carrots and celery and ranch and bleu cheese dips made with buttermilk in-house daily. We believe our bold and distinctive flavors leave our guests craving more and create a differentiated and tailor-made flavor experience that drives repeat business and brand loyalty.
Our customizable menu and craveable flavors drive demand across multiple day-parts and occasions. Our 11 flavors, signature fries, freshly-prepared sides and numerous order options (eat-in / to go; individual / combo meals / family packs) allow guests to eat Wingstop during any occasion, whether it is a quick carry-out snack, dine-in dinner with friends or picking up a party size order for their favorite sporting event.
Compelling Unit Economics
We believe the growing popularity of the Wingstop experience and the operational simplicity of our restaurants translate into attractive economics at our franchised and company-owned locations. Existing franchisees accounted for approximately
80%
of franchised restaurants opened in
2017
and
2016
, which we believe further underscores our restaurant model’s financial appeal.
Upon opening, our restaurant volume generally builds year after year. Our domestic average unit volume (“AUV”) has grown consistently, achieving
$1.1 million
during fiscal year
2017
. Our restaurants are approximately
1,700
square feet on average and yield average sales per square foot of
$647
based on
2017
domestic AUV due to the high average carry-out mix of
approximately 75%
in
2017
. Our operational simplicity results in low labor costs, further improving the profitability of our concept. Our operating model targets a low average estimated initial investment of approximately
$370,000
, excluding real estate purchase or lease costs and pre-opening expenses. In year two of operation, we target a franchisee unlevered cash-on-cash return of approximately
35%
to
40%
. We believe low entry costs and high returns provide a compelling investment opportunity for our franchisees that has helped drive the continued growth of our system.
Proven Portability
Our concept has demonstrated success across the globe, with restaurants operating in
42
states across varying geographic regions, population densities and real estate settings within the United States and in
8
international markets. We have had positive same store sales growth across a wide variety of major markets over the last five years, and on average have only closed
seven
restaurants per year. Global demand for chicken, broad appeal and the simplicity of our restaurant operating model have supported our success across
eight
international markets. While our concept has succeeded in a variety of real estate formats and locations, our preferred real estate site is an in-line or end-cap retail strip center location available in most shopping centers. The flexibility of our real estate model coupled with the broad appeal of our food has enabled us to profitably locate restaurants in both urban and suburban areas. Accordingly, we believe our concept is well-positioned for continued system growth in both existing and new markets.
5
Strength In Numbers
We have demonstrated a consistent track record of strong financial performance:
|
•
|
Domestic same store sales increased
9.9%
in
2013
,
12.5%
in
2014
,
7.9%
in
2015
,
3.2%
in
2016
and
2.6%
in
2017
, representing five year cumulative domestic same store sales growth of
36.1%
, driven primarily by an increase in transactions, which demonstrates the growing awareness and popularity of our brand;
|
|
•
|
Our domestic same store sales growth is even more meaningful given that we have had
14
consecutive years of positive same store sales;
|
|
•
|
From
2013
to
2017
, our system-wide sales increased from
$550 million
to
$1.1 billion
, which represents growth of
98%
over the period;
|
|
•
|
Total revenue increased from
$59.0 million
in
2013
, to
$67.4 million
in
2014
, to
$78.0 million
in
2015
, to
$91.4 million
in
2016
, to
$105.6 million
in
2017
; and
|
|
•
|
Since
2013
our net income has grown f
rom
$7.5 million
to
$27.3 million
in
2017
; and Adjusted EBITDA, increased from
$19.5 million
in
2013
,
to
$41.5 million
in
2017
.
|
For a reconciliation of Adjusted EBITDA to net income and a further discussion of how we utilize this non-GAAP financial measure, see “Selected Historical Consolidated Financial and Other Data.”
Experienced Management Team
Our strategic vision and results-driven culture are directed by our executive management team under the leadership of our Chairman and Chief Executive Officer, Charlie Morrison. Charlie joined Wingstop in 2012, bringing more than 20 years of experience in the restaurant and multi-unit retail industry, including leadership positions at Pizza Hut, Boston Market, Kinko’s, Steak & Ale and, most recently, Rave Restaurant Group, a publicly traded restaurant company, where he served as Chief Executive Officer and led the creation of the award winning Pie Five restaurant concept. Charlie is supported by a strong executive team with significant retail and restaurant experience. Our Chief Financial Officer, Michael Skipworth, came to us from KPMG LLP and, most recently Cardinal Logistics, where he was the Senior Vice President of Finance and Accounting. Our Chief Experience Officer, Stacy Peterson, brings 15 years of information technology experience and came to us from multi-unit retailers, including Blockbuster and Kinko’s. Heading up our marketing efforts is Flynn Dekker, who has over 20 years of experience and was previously the Chief Marketing Officer of Fogo de Chao and Rave Restaurant Group. Madison Jobe, our Chief Development Officer, joined us from Development Strategies International, a restaurant advisory firm where he was Founder and Chief Executive Officer, and brings 40 years of experience in the restaurant industry to oversee our franchise development efforts. Larry Kruguer, Chief Operating Officer, joined us in June 2015 from Wendy’s International, where he served as Vice President, International Joint Ventures. Darryl Marsch, our General Counsel, has over 25 years of legal experience and previously served as the General Counsel of Krispy Kreme Doughnuts, Inc. during its turnaround and growth phase. We believe our management team is a key driver of our success and positions us well for long-term growth.
Our Growth Strategy
Franchise Expansion
We believe that there is significant opportunity to expand globally, and we intend to focus our efforts on increasing our geographic penetration in both existing and new domestic markets as well as international markets. We believe our highly-franchised model positions us for continued strong unit growth over the medium and long-term. We expect high franchisee demand for our brand, supported by compelling unit economics, operational simplicity, low entry costs and flexible real estate profile, to drive global restaurant growth. Based on our internal analysis, we believe there is opportunity for our brand to grow to approximately
2,500
restaurants across the United States. Further, we believe there is a long term opportunity to expand our brand internationally to become a top 10 global restaurant company.
We intend to achieve our domestic restaurant potential by expanding in our existing markets where we believe we have the opportunity to more than double our current restaurant count. In addition, we will continue to expand into new markets. Our “inside out” domestic market expansion strategy focuses our initial development in urban centers where our core demographic is most densely populated and then builds outward into suburban areas as our brand awareness grows in the market. We have a robust domestic development pipeline, including
450
total commitments to open new franchised restaurants as of
December 30, 2017
. Approximately
80%
of our current domestic commitments are from existing franchisees, supporting the attractiveness of our restaurant business model as well as our positive franchisor/franchisee relationships. We believe that our highly-franchised business model provides a platform for continued growth as it allows us to focus on our core strengths of flavor innovation, marketing and
6
guest engagement, and franchisee selection and support, while growing our restaurant presence and brand recognition with limited capital investment by us.
We also believe that there is a significant opportunity to grow our business internationally. We opened our first international location in Mexico in 2009. As of
December 30, 2017
, we had
106
international restaurants located in Colombia, Indonesia, Malaysia, Mexico, the Philippines, Saudi Arabia, Singapore, and the United Arab Emirates, all of which are franchised. In
2017
, we opened
32
international locations. We currently have
584
international restaurant commitments sold as of
December 30, 2017
. During
2017
, we entered into international expansion agreements to open 30 locally operated franchise locations in Malaysia over the next 6 years, 100 locations in the United Kingdom over the next 12 years, 110 locations in Australia and New Zealand over the next 10 years, and 75 locations in France over the next 12 years. We believe that our restaurant operating model will translate well internationally based on our small real estate footprint, our simplicity of operations, the universal and broad appeal of chicken, and our ability to customize our wide variety of flavors to local tastes.
Long-term Domestic Same Store Sales Growth
|
•
|
National Advertising
|
In February 2017, we launched our national advertising program. This transition to national advertising from our advertising cooperatives, a more locally driven advertising approach, provided us with more reach and frequency in existing media markets in addition to coverage for smaller and newer markets where we did not previously utilize television advertising. In 2016, approximately half of our domestic restaurants experienced some benefit of TV advertising across 10 markets. In 2017, we covered 100% of our domestic system with TV advertising, reaching over 80% of adults ages 18 to 49. We also utilize an extensive range of social media and digital marketing tools including search engine, programmatic, native, digital video and social media advertising. At a national level, we advertise on Google, Yahoo and Bing through search engine advertising and also through Facebook, Twitter, Instagram and Snapchat via paid social advertising.
|
•
|
Digital Expansion
|
We are making focused investments in technology to provide the most convenient, engaging, and cutting edge brand experience for our fans and drive increased sales. In 2014, we launched an updated online ordering system and mobile ordering application, or app, that simplifies the ordering process and integrates into our point-of-sale (“POS”) system, uniting online and register ordering across our system. We were one of the first to launch bot technology and customizable ordering on Facebook Messenger, Twitter and Amazon Alexa. We believe that we are poised for continued digital growth. Digital sales totaled
23%
of sales during the
fourth
quarter of
2017
, compared to the fast casual industry average of 6%. Digital sales in the
fourth
quarter of
2017
have more than doubled from the launch of our digital tools in the fourth quarter of 2014. Additionally, average transaction size for online orders is approximately
$5
higher than the average for all other orders.
|
•
|
Delivery
|
In 2017, we initiated a delivery test in three markets utilizing a third party delivery service provider. Our initial test market was Las Vegas where we have ten restaurants, five company-owned and five franchised, and we experienced approximately a 10% lift in sales from offering delivery. The results of our initial tests have also suggested that the majority of this sales lift was incremental sales, or sales from new Wingstop customers. Similar to our digital expansion, the average transaction size for delivery orders that is approximately $5 higher than the average for all other orders. We anticipate that our rollout of delivery to additional markets will occur throughout 2018 and 2019 market-by-market as delivery coverage from our third party delivery service provider improves. Further, we believe adding delivery will continue to drive domestic same store sales growth.
Our Franchise
Franchise Overview
Our franchisees operated a total of
1,110
restaurants in
42
states, Latin America, the Middle East and Southeast Asia as of
December 30, 2017
. We have rigorous qualification criteria and training programs for our franchisees and require them to adhere to strict operating standards. We work hard to ensure that every Wingstop franchise location meets the same quality and customer service benchmarks in order to preserve the consistency and reliability of the Wingstop brand.
We have a broad and diversified domestic franchisee base. Since 2014, the number of franchisees who own more than ten restaurants has doubled. This increase is consistent with our strategy to grow with our existing franchisees. Our domestic franchise base has an average restaurant ownership of approximately
3
restaurants per franchisee.
Franchise Agreements
. Our franchisees execute a separate franchise agreement for each restaurant opened, typically providing for a 10-year initial term, with an opportunity to enter into one or more renewal franchise agreements subject to certain conditions.
7
Our standard franchise agreement changes from time to time, and terms may vary among franchisees. We generally update and/or revise our franchise agreement on an annual basis and, as a result, the agreements we enter into with individual franchisees may vary. Through
2017
, our franchise documents provided that franchisees must pay a franchise fee of
$20,000
for the first restaurant opened under a development agreement and
$12,500
for each additional restaurant opened. If a franchisee has entered into an area development agreement with us (which occurs, in most cases, even if a franchisee wants to develop only one restaurant), the aggregate initial fee currently is
$30,000
for the first restaurant and
$22,500
for each subsequent restaurant under such development agreement, in each case including a
$10,000
development fee per restaurant. The
$10,000
development fee per restaurant to-be-developed is paid in full at the time a development agreement is signed for the grant of development rights and is not refundable.
Effective March 1, 2017, we eliminated the franchise fee discount for all new development agreements. This change will require franchisees to pay a franchise fee of
$20,000
for each restaurant opened. The majority of our existing franchise agreements require our franchisees to pay us a royalty of
5%
of their gross sales net of discounts. New franchise agreements signed pursuant to development agreements entered into on or after July 1, 2014 require our franchisees to pay us a royalty of
6%
of their gross sales net of discounts. Our franchise agreements allow us to assess franchisees an advertising fund contribution based on their gross sales net of discounts. In
2017
, we charged a national advertising fund contribution equal to
3%
of gross sales under all existing franchise agreements. In addition, franchisees may vote to increase their required advertising fund contribution. Our current form of franchise agreement also requires franchisees to spend at least
1%
of their gross sales on local advertising and promotions. Franchisees operating under pre-2014 forms of franchise agreement were not contractually required to spend any minimum amount on local advertising, although we recommended that they spend at least
4%
of their restaurants’ gross sales on advertising and marketing.
The boundaries of the area in which a franchisee may locate its restaurant, which we refer to as the development area, depend on the population and other demographic features of the market in which the franchisee wants to locate its restaurant(s). The development area may range from a sector of a large metropolitan area to the city or county limits of a smaller municipality. Based on the franchisee’s proposal and our analysis, we identify and describe in the development agreement the boundaries of an appropriately-sized development area and, if we expect the franchisee to operate more than one restaurant, the number of restaurants that must be developed in the development area. The development agreement does not permit us to change the development area after it is established. Whether a development agreement covers one or several restaurants, it contains a schedule of the dates by which the franchisee must sign leases and open each restaurant, and failure by the franchisee to adhere to the development agreement’s schedule is an event of default under the development agreement.
All of our franchise agreements require that each franchised restaurant be operated in accordance with our defined operating procedures, adhere to the menu we establish and meet applicable quality, service, health and cleanliness standards. We may terminate the franchise rights of any franchisee who does not comply with our standards and requirements. We believe that maintaining superior food quality, an inviting and energetic atmosphere and excellent guest service are critical to the reputation and success of our concept. Therefore, we aggressively enforce the contractual requirements of our franchise agreements.
How We Support our Franchisees
Site Selection and Development
. Franchisees operating in the United States must use our approved real estate broker in their markets during the site search, review, and leasing process. We also have lists of approved site surveyors, permit expeditors and architectural and engineering consultants for restaurant development and build-out. We give franchisees general guidelines to follow and consider in choosing a site for any new restaurant. We do not own any real estate in the United States on which franchised restaurants are located and do not lease restaurant sites to franchisees.
We provide franchisees information about a typical restaurant’s lay-out, utility requirements and signs and, in the United States, a lease rider containing provisions we require to be attached to every restaurant lease. Once a domestic franchisee has selected one or more proposed sites, we will evaluate and critique the written site proposals required to be submitted for our consideration and may, at our option, visit the development area to inspect the sites proposed. Franchisees may not proceed with negotiations to lease a site before we approve that site.
We currently are not significantly involved in our international franchisees’ site selection process. We review but do not pre-approve the sites they select for their franchised restaurants. However, we give our international franchisees general guidelines to follow and request them to complete a site analysis for our oversight as they finalize the site selections for their restaurants. We do not own any real estate internationally on which franchised restaurants are located and do not lease restaurant sites to franchisees.
Training, Pre-Opening Assistance and Ongoing Support
. Franchisees (along with their managers) must attend and successfully complete a 4-week training program before we will issue an opening date for a restaurant. Our training program covers various topics, including Wingstop culture, food preparation and storage, food safety, specific position training, uniforms, cleaning and sanitation, marketing and advertising, POS systems, accounting and hospitality, among others. Unless a franchisee commits to
8
operate his or her own restaurant (
i.e.
, “owner-operated”), the franchisee must hire a general manager who either has roots in the general area where the restaurant is located or is willing to move to the general area. Our international franchisees likewise must complete required training and are principally responsible for training their managers and other employees.
When a domestic franchisee opens his or her first Wingstop restaurant, we provide the owner with an opening restaurant trainer for up to six days and may elect to send an opening restaurant trainer to a franchisee’s second or later restaurant location for an amount of time we determine to be appropriate. We also provide lists of approved inventory, suppliers and small-wares that are needed to stock and operate each restaurant and help franchisees locate qualified suppliers of chicken and other supplies and ingredients that meet our specifications.
We also have an internal operations infrastructure that provides ongoing support to our franchisees. We utilize a field-based team of franchise business consultants who act as local resources to assist our franchisees to run their restaurants in accordance with Wingstop standards and who also assist with efforts to grow restaurant sales. The main responsibilities of our franchise business consultants include communicating and conveying certain initiatives and process enhancements to our franchisees and conducting business reviews in order to assist franchisees to operate more efficiently, with a focus on increasing restaurant sales and profits. Additionally, we maintain programs to monitor and evaluate the adherence of franchised restaurants to our quality, service and cleanliness standards. For example, we have a group of field alignment managers who conduct standardized quarterly reviews of each of our franchised restaurants’ operations to help ensure that our brand standards are maintained. We also employ a third-party customer survey program to monitor guest experience and quality standards at franchised restaurants.
In addition to our hands-on training and assistance, we provide an operations manual to each restaurant location that includes sections on topics such as business operations, food safety, crew, hospitality, quality products, guest services, packaging and presentation, restaurant cleaning, restaurant and equipment maintenance, POS systems, quality control, advertising and marketing and emergency management.
Franchise Advisory Council
. In December 2002, we organized a Franchise Advisory Council, which we refer to as the Council, to consult with us about system-wide advertising themes and campaigns and other operational matters. The Council is composed of franchise members, all of whom are elected by our franchisees, and meets quarterly to review marketing strategies and provide input on topics such as advertising messages, operational standards and system-wide initiatives. While the Council functions only in an advisory capacity, and we may disregard its recommendations if we choose, we view the Council as an important component of our domestic franchisee support program.
Point-of-Sale System
. We require that our domestic franchisees utilize a uniform POS system. As of the end of 2016, we have substantially completed upgrading to a more robust POS system from prior legacy systems. Our POS system, in conjunction with our Intranet system, allows us to track sales at each restaurant location. Our restaurant operations require no other
computers for a restaurant location. Our POS system integrates with our online ordering app, allowing for seamless recording and tracking of sales. Furthermore, our POS system provides our franchisees with additional back office tools that we believe will assist in cost control, create operational efficiencies and drive sales.
Supply Chain Assistance
. We assist our franchisees by negotiating regional and national contracts for chicken and other commodities and other items needed to develop and operate a Wingstop restaurant. We designate and approve suppliers in order to ensure that all ingredients and supplies utilized in our restaurants satisfy our grade and quality standards. As we negotiate regional and national contracts, we seek to promote the overall interests of our franchise system and our interests as the franchisor. We approve suppliers based on their ability to meet our specifications and quality control requirements and to supply products to our franchisees at competitive prices.
Research and Development
. We lead product innovation and testing efforts for our franchisees, including new wing sauce flavors, side items, new chicken wing, chicken strip or other menu additions, and new beverage options. New product research and development is located in our headquarters facility in Dallas, Texas. We rely on our internal culinary team and, from time to time, third party experts, leveraging consumer research to develop and test new products for our franchised and company-owned restaurants.
Marketing and Advertising Support
We utilize three levels of advertising: (1) system-wide advertising, which is coordinated through our ad fund; (2) local advertising, which franchisees handle with materials we create or approve; and (3) cooperative advertising among multiple franchisees in a given market.
Ad Fund
.
We created a not-for-profit advertising fund in July 1999, which we refer to as the ad fund. All restaurants, including our company-owned restaurants, must contribute to the ad fund. Our franchise agreements allow us to assess an ad fund contribution
9
from domestic franchisees based on their gross sales net of discounts. Beginning in fiscal year
2017
, we charged
3%
of gross sales under all existing domestic franchise agreements.
We direct and retain sole control over all advertising and promotions that the ad fund finances. We use a national advertising agency to create our advertising and promotional materials. We use another agency to create localized versions of our advertising and promotional materials.
Digital Advertising
. We currently utilize an extensive range of social media and digital marketing tools including, search engine, programmatic, native, digital video and social media advertising. We also maintain website hosting and manage the development and maintenance of the mobile Wingstop app. We market Wingstop products, services and restaurants through our website that we maintain at www.wingstop.com. Our website features a site locator page on the website showing the addresses, telephone numbers and ability to online order for each restaurant. At a national level, we advertise on Google, Yahoo and Bing through search engine advertising and also through Facebook, Twitter, Instagram and Snapchat via paid social advertising. Additionally, we assist franchisees in planning and executing localized geo-targeted digital marketing for their restaurants, including internet and mobile marketing.
Franchisees may not use electronic media, including the Internet or mobile, to advertise their restaurants without first obtaining our written consent and complying with any conditions and restrictions we wish to impose. We may assess franchisees a fee of up to $100 per month to pay for our website’s and Intranet’s maintenance and improvement costs.
Social Media
. Wingstop has a strong brand presence on both emerging and well-established social media platforms for digital collaboration, including smartphone apps and native sites such as Facebook, Twitter, Instagram, and Snapchat. We adhere to social media guidelines that embody our strategic vision and apply to both company-owned and franchised restaurants. These guidelines will continually evolve as new technologies and social networking tools emerge.
Local Advertising
. We advertise our company-owned restaurants primarily through online and mobile advertising and paid search, and expect franchisees to follow the same pattern. Our current form of franchise agreement requires franchisees to spend at least
1%
of their gross sales on local advertising and promotions, which is in addition to amounts contributed to the ad fund as described above. Franchisees operating under pre-2014 forms of franchise agreement are not contractually required to spend any minimum amount on local advertising, although we recommended that they spend at least
4%
of their restaurants’ gross sales on local advertising and marketing.
Advertising Cooperatives
. When a franchisee and at least one other restaurant operator have opened restaurants in the same designated market area (“DMA”), we may require the franchisee and the other operator(s) to form a cooperative advertising association. Each cooperative’s members will set their cooperative’s required contribution rate, but we retain the right to disapprove a rate lower than
1%
of gross sales. Contributions to advertising cooperatives are credited toward a franchisee’s
1%
local advertising obligation. Currently, the members of an advertising cooperative administer the cooperative, and we intervene only to resolve disputes. In that event, our decision is binding.
As of
December 30, 2017
, advertising cooperatives have been formed in the following DMAs: Phoenix, Arizona; Los Angeles, California; Sacramento-Stockton-Modesto, California; San Diego, California; San Francisco, California; Denver, Colorado; Miami-Ft. Lauderdale, Florida; Chicago, Illinois; Austin, Texas; Dallas / Ft. Worth, Texas; Houston, Texas; and San Antonio, Texas.
National Advertising
.
In 2017, we transitioned to a national advertising program. Under this new program, franchisees contributed
3%
of gross sales to the ad fund that is utilized to create advertising content and purchase digital and television advertising at a national level. This change is not an increase in the
4%
of the restaurants’ gross sales that has historically been spent on advertising, but rather a reallocation of the
4%
. Franchisees will spend the remaining
1%
of gross sales on local advertising or cooperative advertising. This transition to national advertising from our advertising cooperatives, a more locally driven advertising approach, provided us with more reach and frequency in existing media markets in addition to coverage for smaller and newer markets where we did not previously leverage television.
Competition
The restaurant industry is intensely competitive. We compete on the basis of the taste, quality and price of food offered, guest service, ambiance, location and overall dining experience. We believe that our attractive price-value relationship, our flexible service model and the quality and distinctive flavor of our food enable us to differentiate ourselves from our competitors.
We believe we compete primarily with fast casual establishments and quick service restaurants such as other wing-based take-out concepts, local and regional sports bars and casual dining restaurants. Many fast casual and carry-out concepts offer wings as add-
10
on items to other food categories such as pizza, but typically do not focus on wings. Other competitors emphasize wings in a bar or sports-centric setting. Many of these direct and indirect competitors are well-established national, regional or local chains. We also compete with many restaurant and retail establishments for site locations and restaurant-level employees.
Suppliers and Distribution
We insist that all ingredients and supplies utilized in Wingstop restaurants satisfy our grade and quality standards. Our franchisees are required to purchase all chicken, groceries, produce, beverages, equipment and signage, furniture, fixtures, logo-imprinted paper goods and cleaning supplies solely from suppliers that we designate and approve. We regularly inspect vendors to ensure that products purchased conform to our standards and that prices offered are competitive.
The principal raw materials for a Wingstop restaurant operation are bone-in and boneless chicken wings. Therefore, chicken is our largest product cost item and represented approximately
70%
of all purchases for
2017
. Company-owned and franchised restaurants purchase their bone-in and boneless chicken wings from suppliers that we designate and approve. We designate sources for potatoes to ensure that they are grown to our specifications. We also require franchisees to use our proprietary sauces, seasonings and spice blends and purchase them and other proprietary products only from designated sources.
All food items and packaging goods for our restaurants can be sourced through one vendor, The Sygma Network, Inc., which we refer to as Sygma. There are nine regional Sygma distribution centers which carry all products required for a Wingstop restaurant and service all of our domestic locations. Sygma is obligated under our agreement to deliver at least twice weekly to our restaurants. We contract directly with manufacturers to sell products to Sygma, who in turn receives a fee for delivering these items to our restaurants. The majority of our highest spend items are formula or fixed contract priced. We have also negotiated agreements with our soft drink suppliers to offer soft drink dispensing systems, along with associated branded products, in all Wingstop restaurants.
As the Wingstop system grows, we will continue to negotiate regional or national contracts for chicken and other commodities and other items needed to develop and operate all of our restaurants and may use a designated or approved supplier approach.
Management Information / Technology Systems
We have core management information systems in place and believe they are scalable to support our future growth plans. We specify a standard POS system in all of our company-owned restaurants and virtually all franchised restaurants that helps facilitate the operation of the restaurants by recording sales, cost of sales and labor and other operating metrics and allows managers to create various reports to assess performance. Our POS system is configured to record and store financial information in a manner that we specify, and we require franchisees to provide us with continual and unlimited independent access to all information on each POS system. We believe our current information systems are sufficient to support our planned expansion for the foreseeable future.
We have an online ordering system and mobile ordering app, which makes it easy for our guests to order-ahead, which we believe increases the frequency of our guests’ visits and leads to higher check averages.
We require that our franchisees’ electronic information systems, including POS systems, comply with and maintain established network security standards, including applicable Payment Card Industry (PCI) standards.
Intellectual Property and Trademarks
We own a number of trademarks and service marks registered with the U.S. Patent and Trademark Office and with foreign trademark authorities.
We believe that our trademarks and other proprietary rights are important to our success and our competitive position, and, therefore, we devote resources to the protection of our trademarks and proprietary rights.
Seasonality
Our restaurants have not experienced significant revenue fluctuations that can be attributed to seasonal factors.
Employees
As of
December 30, 2017
, we employed
530
persons, of whom
149
were full-time corporate-based and regional personnel. The remainder was part-time or restaurant-level employees. None of our employees is represented by a labor union or covered by a collective bargaining agreement, and we believe that we have good relations with our employees. Our franchise owners are independent business owners, so they and their employees are not included in our employee count.
11
Government Regulation
Federal
.
We and our franchisees are subject to various federal regulations affecting the operation of our business. We and our franchisees are subject to the U.S. Fair Labor Standards Act, the U.S. Immigration Reform and Control Act of 1986, the Occupational Safety and Health Act and various other federal and state laws governing matters such as minimum wage requirements, overtime, fringe benefits, workplace safety and other working conditions and citizenship requirements. A significant number of our and our franchisees’ food service personnel are paid at rates related to the applicable minimum wage, and past increases in the minimum wage have increased our and our franchisees’ labor costs, as would future increases. Our distributors and suppliers also may be affected by higher minimum wage and benefit standards, which could result in higher costs for goods and services supplied to us and our franchisees.
We and our franchisees are also required to comply with the accessibility standards mandated by the U.S. Americans with Disabilities Act of 1990 and related federal and state statutes, which generally prohibit discrimination in accommodations or employment based on disability. We and our franchisees may in the future have to modify our restaurants to provide service to or make reasonable accommodations for disabled persons. While these expenses could be material, our current expectation is that any such actions will not require us to expend substantial funds.
The Patient Protection and Affordable Care Act of 2010 (PPACA), enacted in March 2010, requires chain restaurants with 20 or more locations in the United States to comply with federal nutritional disclosure requirements. The U.S. Food and Drug Administration (FDA) published the final rules on menu and vending machine nutrition labeling, which amended section 403(q) of the Federal Food, Drug, and Cosmetic Act (FFDCA) to establish requirements for the nutrition labeling of standard menu items at restaurants or similar retail food establishments with 20 or more locations. Under the rule, calorie information must be provided clearly and conspicuously next to the listed standard menu item on a menu or menu board. In addition to calorie information, each menu or menu board must prominently include a succinct statement concerning suggested caloric intake. Upon request, covered establishments must provide information about the total calories, calories from fat, total fat, saturated fat, trans fat, cholesterol, sodium, total carbohydrates, fiber, sugars, and protein in their standard menu items. The rule contains detailed requirements for providing calorie and nutrition information and determining nutrient content. The effect of such labeling requirements on consumer choices, if any, is unclear at this time, and it is also unclear whether these regulations will be implemented on May 7, 2018 as announced, or further postponed by the FDA as was the case in 2016 and 2017.
Furthermore, a number of states, counties and cities have previously enacted menu labeling laws requiring multi-unit restaurant operators to disclose certain nutritional information to customers, or have enacted legislation restricting the use of certain types of ingredients in restaurants. Although the federal legislation is intended to preempt conflicting state or local laws on nutritional labeling, until our system is required to comply with the federal law we and our franchisees will be subject to a patchwork of state and local laws and regulations regarding nutritional content disclosure requirements. Many of these requirements are inconsistent or are interpreted differently from one jurisdiction to another.
There is also a potential for increased regulation of food in the United States, such as recent changes in the Hazard Analysis and Critical Control Points (HACCP) system requirements. HACCP refers to a management system in which food safety is addressed through the analysis and control of potential hazards from production, procurement and handling, to manufacturing, distribution and consumption of the finished product. Many states have adopted legislation or implemented regulations which require restaurants to develop and implement HACCP systems. Similarly, the United States Congress and the FDA continue to expand the sectors of the food industry that must adopt and implement HACCP programs. The Food Safety Modernization Act (FSMA) was signed into law in January 2011 and significantly expanded the FDA’s authority over food safety, granting the FDA authority to proactively ensure the safety of the entire food system, including through new and additional hazard analysis, food safety planning, increased inspections and permitting mandatory food recalls. Although restaurants are specifically exempted from some of these new requirements and not directly implicated by other requirements, we anticipate that some of the FSMA provisions and the FDA’s implementation of the new requirements may impact our industry. We cannot assure you that we will not have to expend additional time and resources to comply with new food safety requirements required by either the FSMA or future federal food safety regulation or legislation. Additionally, our suppliers may initiate or otherwise be subject to food recalls that may impact the availability of certain products, result in adverse publicity or require us to take actions that could be costly for us or otherwise harm our business.
We and our franchisees are also subject to anti-corruption laws, including the FCPA, and other anti-corruption laws that apply in countries where we do business. The FCPA, UK Bribery Act and these other laws generally prohibit us, our food service personnel, our franchisees, their food service personnel and intermediaries from bribing, being bribed or making other prohibited payments to government officials or other persons to obtain or retain business or gain some other business advantage. We operate in a number of jurisdictions that pose a high risk of potential FCPA violations, and we participate in relationships with third parties whose actions could potentially subject us to liability under the FCPA or local anti-corruption laws. In addition, we cannot predict the nature, scope or effect of future regulatory requirements to which our international operations might be subject or the manner in which existing laws might be administered or interpreted.
12
We and our franchisees are also subject to other laws and regulations governing our international operations, including regulations administered by the U.S. Department of Commerce’s Bureau of Industry and Security, the U.S. Department of Treasury’s Office of Foreign Asset Control, and various non-U.S. government entities, including applicable export control regulations, economic sanctions on countries and persons, customs requirements, currency exchange regulations and transfer pricing regulations.
One of the legal foundations fundamental to the franchise business model has been that, absent special circumstances, a franchisor is generally not responsible for the acts, omissions or liabilities of its franchisees. Recently, established law has been challenged by the plaintiffs’ bar. Although recent pronouncements from the National Labor Relations Board indicate that it will adhere to traditional tests for determining when a "joint-employer" relationship exists, if these challenges are successful in altering currently settled law, it could significantly change the way we and other franchisors conduct business and adversely impact our profitability. For example, a determination that we are a “joint employer” with our franchisees or that franchisees are part of one unified system with joint and several liability under the National Labor Relations Act, statutes administered by the Equal Employment Opportunity Commission, Occupational Safety and Health Administration, or OSHA, regulations and other areas of labor and employment law could subject us and/or our franchisees to liability for the unfair labor practices, wage-and-hour law violations, employment discrimination law violations, OSHA regulation violations and other employment-related liabilities of one or more franchisees. In September 2017, Australia enacted a law potentially making franchisors liable as a "joint employer" of their franchisees. The impact of this legislation has yet to be determined.
State
.
We are subject to extensive and varied state and local government regulation affecting the operation of our business, as are our franchisees, including regulations relating to public and occupational health and safety, sanitation, fire prevention and franchise operation. Each franchised restaurant is subject to licensing and regulation by a number of governmental authorities, including with respect to zoning, health, safety, sanitation, nutritional information disclosure, environmental and building and fire safety, in the jurisdiction in which the franchised restaurant is located. Our and our franchisees’ licenses to sell alcoholic beverages must be renewed annually and may be suspended or revoked at any time for cause, including violation by us or our employees, or our franchisees or their employees, of any law or regulation pertaining to alcoholic beverage control, such as those regulating the minimum age of patrons or employees, advertising, wholesale purchasing and inventory control.
We require our franchisees to operate in accordance with standards and procedures designed to comply with applicable codes and regulations. However, our or our franchisees’ inability to obtain or retain health department or other licenses would adversely affect operations at the impacted restaurant or restaurants. Although we have not experienced, and do not anticipate, any significant difficulties, delays or failures in obtaining required licenses, permits or approvals, any such problem could delay or prevent the opening, or adversely impact the viability, of a particular restaurant.
We and our franchisees may be subject in certain states to “dram-shop” statutes, which generally provide a person injured by an intoxicated person the right to recover damages from an establishment that wrongfully served alcoholic beverages to the intoxicated person.
In addition, in order to develop and construct our restaurants, we and our franchisees need to comply with applicable zoning and land use regulations. Federal and state regulations have not had a material effect on our operations to date, but more stringent and varied requirements of local governmental bodies with respect to zoning and land use could delay or even prevent construction and increase development costs of new restaurants.
In addition, we are subject to the rules and regulations of the Federal Trade Commission and various state laws regulating the offer and sale of franchises. The Federal Trade Commission and various state franchise laws require that we furnish a franchise disclosure document containing certain information to prospective franchisees in advance of any franchise sale or the receipt of any consideration for the franchise, and a number of states require registration of the franchise disclosure document at least annually with state authorities. We are operating under exemptions from registration (though not disclosure) in several states based on our qualifications for exemption as set forth in each such state’s laws. Substantive state laws that regulate the franchisor-franchisee relationship, including in the areas of termination and non-renewal, presently exist in a substantial number of states. We believe that our franchise disclosure document and franchising procedures comply in all material respects with both the Federal Trade Commission guidelines and all applicable state laws regulating franchising in those states in which we have offered franchises.
International
.
Our franchised restaurants in Mexico, the Middle East, South America and Southeast Asia are subject to national and local laws and regulations. We believe that our international franchised restaurants and procedures comply in all material respects with the laws of the applicable foreign jurisdiction. As noted above, Australia enacted "joint employer" legislation in September 2017.
Environmental
.
Our operations, including the selection and development of company-owned and franchised restaurants and any construction or improvements we or our franchisees make at those locations, are subject to a variety of federal, state and local
13
laws and regulations concerning waste disposal, pollution, protection of the environment and the presence, discharge, storage, handling, release and disposal of (or exposure to), hazardous or toxic substances. We provide training to, and require compliance with applicable laws by, our employees and franchisees in the use of chemicals, which are primarily used in small quantities for cleaning our restaurants. Storage, discharge and disposal of hazardous substances are not a significant part of our operations. Generally, our restaurants are located in residential neighborhoods but sometimes might be located in areas which were previously occupied by more environmentally significant operations. Environmental laws can provide for significant fines and penalties for non-compliance and liabilities for remediation and sometimes require owners or operators of contaminated property to remediate the property, regardless of fault. We are not aware of any environmental laws that will materially affect our results of operations, or result in material capital expenditures relating to our operations. However, we cannot predict what environmental laws will be enacted in the future, how existing or future environmental laws will be administered, interpreted or enforced, or the amount of future expenditures that we may need to comply with, or to satisfy claims relating to, environmental laws.
Available Information
We maintain a website at www.wingstop.com, including an investor relations section at ir.wingstop.com in which we routinely post important information, such as webcast of quarterly calls and other investor events in which we participate or host, and any related materials. Our Code of Business Conduct and Ethics is also in this section of our website. You may access our annual reports on Form 10-K, quarterly reports on Form 10-Q, current reports on Form 8-K and amendments to those reports, as well as other reports relating to us that are filed with or furnished to the SEC, free of charge in the investor relations section of our website as soon as reasonably practicable after such material is electronically filed with or furnished to the SEC. The public may also read and copy materials we file with or furnish to the SEC at the SEC’s Public Reference Room, which is located at 100 F Street, NE, Room 1580, Washington, DC 20549. You can obtain information on the operation of the Public Reference Room by calling the SEC at 1-800-SEC-0330. The SEC also maintains a website that contains reports, proxy and information statements and other information regarding issuers that file electronically with the SEC at www.SEC.gov.
The contents of the website mentioned above are not incorporated into and should not be considered part of this report. The references to URLs for these websites are intended to be inactive textual references only.
14
Risks Related to Our Business and Our Industry
If we fail to successfully implement our growth strategy, which includes opening new restaurants, our ability to increase our revenue and operating profits could be adversely affected.
Our growth strategy relies substantially upon new restaurant development by existing and new franchisees and we are continuously seeking to identify target markets where we can enter or expand, taking into account numerous factors such as the location of our current restaurants, demographics, traffic patterns and information gathered from local employees. While we believe there is opportunity for our brand to grow to up to approximately
2,500
domestic restaurants over the long term, we do not currently target a specific number of annual new restaurant openings over a multi-year period. We and our franchisees face many challenges in opening new restaurants, including:
|
•
|
availability of financing;
|
|
•
|
selection and availability of suitable restaurant locations;
|
|
•
|
competition for restaurant sites;
|
|
•
|
negotiation of acceptable lease and financing terms;
|
|
•
|
securing required governmental permits and approvals, including zoning approvals;
|
|
•
|
expansion into new markets, consumer tastes in new markets and acceptance of our products;
|
|
•
|
employment and training of qualified personnel in local markets;
|
|
•
|
impact of inclement weather, natural disasters, and other acts of nature;
|
|
•
|
general economic and business conditions;
|
|
•
|
unanticipated increases in construction and development costs; and
|
|
•
|
the general legal and regulatory landscape in which we and our restaurants operate.
|
In particular, because the majority of our new restaurant development is funded by franchisee investment, our growth strategy is dependent on our franchisees’ (or prospective franchisees’) ability to access funds to finance such development. We do not provide our franchisees with direct financing and therefore their ability to access borrowed funds generally depends on their independent relationships with various financial institutions. Some of our existing franchisees utilize loans guaranteed by the U.S. Small Business Administration (“SBA”) which guarantees loans made by financial institutions to small businesses in the U.S., including franchisees. If SBA guaranteed loans are no longer available to our franchisees (or potential franchisees), their ability to obtain the requisite financing at attractive rates, or at all, could be adversely affected. Moreover, if our franchisees (or prospective franchisees) are not able to obtain financing from any source at commercially reasonable rates, or at all, they may be unwilling or unable to invest in the development of new restaurants, and our future growth could be adversely affected.
As a result of the foregoing, we cannot predict the time period over which we may achieve our anticipated level of domestic restaurant growth or whether we will achieve this level of growth at all. In addition, as we continue to grow our business, our rate of expansion relative to the size of our restaurant base will eventually decline.
To the extent our franchisees are unable to open new restaurants as we anticipate, our revenue growth would come primarily from growth in same store sales. Our failure to add a significant number of new restaurants or grow domestic same store sales would adversely affect our ability to increase our revenue and operating income and could materially and adversely harm our business and operating results.
Changes in food and supply costs could adversely affect our results of operations.
Our profitability depends in part on our ability to anticipate and react to changes in food and supply costs. Any increase in the prices of the ingredients most critical to our menu, particularly chicken, could adversely affect our operating results. Bone-in chicken wing prices, which we do not effectively hedge, in our company-owned restaurants in
2017
averaged
18%
higher than in
2016
as the average price per pound increased. If there is a significant rise in the price or size of bone-in chicken wings, and we are unable to successfully adjust menu prices or otherwise make operational adjustments to account for the higher wing prices, our operating results could be adversely affected. For example, bone-in chicken wings accounted for approximately
31%
of our costs of sales in fiscal
2017
and
2016
. A hypothetical
10%
increase in the bone-in chicken wing costs for fiscal
2017
would have increased cost of sales by approximately
$0.9 million
for fiscal
2017
.
15
Although we try to manage the impact that these fluctuations have on our operating results, we remain susceptible to increases in food costs as a result of factors beyond our control, such as general economic conditions, seasonal fluctuations, weather conditions, demand, food safety concerns, product recalls and government regulations. Inflation also increases the costs of our food frequently. Additionally, avian influenza, or similar poultry-related diseases, may negatively affect the supply chain by increasing costs and limiting availability of chicken. As a result, we may not be able to anticipate or react to changing food costs by adjusting our purchasing practices or menu prices, which could cause our operating results to deteriorate. In addition, because we provide moderately-priced food, we may choose not to, or be unable to, pass along commodity price increases to our customers.
Our success depends in significant part on the future performance of existing and new franchise restaurants, and we are subject to a variety of additional risks associated with our franchisees.
A substantial portion of our revenue comes from royalties generated by our franchised restaurants. We anticipate that franchise royalties will represent a substantial part of our revenue in the future. As of
December 30, 2017
, we had
314
domestic franchisees operating
1,004
domestic restaurants and
8
international franchisees operating
106
international restaurants. Our largest franchisee operated
67
restaurants and our top 10 franchisees operated a total of
283
restaurants as of
December 30, 2017
. Accordingly, we are reliant on the performance of our franchisees in successfully operating their restaurants and paying royalties to us on a timely basis. Our franchise system subjects us to a number of risks, any one of which may impact our ability to collect royalty payments from our franchisees, may harm the goodwill associated with our franchise, and may materially adversely affect our business and results of operations.
Our franchisees are an integral part of our business. We may be unable to successfully implement our growth strategy without the participation of our franchisees and the adherence by our franchisees of our restaurant operation guidelines. Because our ability to control our franchisees is limited, our franchisees may fail to focus on the fundamentals of restaurant operations, such as quality, service and cleanliness, which would have a negative impact on our success. In addition, our franchisees may fail to participate in our marketing initiatives, which could materially adversely affect their sales trends, average weekly sales and results of operations. Although we provide frequent training opportunities to our franchisees to ensure consistency among our operations, there may be differences in product quality of operations at our franchised restaurants that impacts the profitability of those restaurants.
In addition, if our franchisees fail to renew their franchise agreements, our royalty revenue may decrease which in turn could materially and adversely affect our business and operating results. It also may be difficult for us to monitor our international franchisees’ implementation of our growth strategy due to our lack of personnel in the markets served by such franchisees.
Furthermore, a bankruptcy of any multi-unit franchisee could negatively impact our ability to collect payments due under such franchisee’s franchise agreements. In a franchisee bankruptcy, the bankruptcy trustee may reject its franchise agreements pursuant to Section 365 under the United States bankruptcy code, in which case there would be no further royalty payments from such franchisee. The amount of the proceeds, if any, that may ultimately be recovered in a bankruptcy proceeding of such franchisee may not be sufficient to satisfy a damage claim resulting from such rejection.
If we fail to identify, recruit and contract with a sufficient number of qualified franchisees, our ability to open new franchised restaurants and increase our revenue could be materially adversely affected.
The opening of additional franchised restaurants depends, in part, upon the availability of prospective franchisees who meet our criteria. We may not be able to identify, recruit or contract with suitable franchisees in our target markets on a timely basis or at all. Although we have developed criteria to evaluate and screen prospective franchisees, our franchisees may not ultimately have the business acumen or be able to access the financial or management resources that they need to open and successfully operate the restaurants contemplated by their agreements with us, or they may elect to cease restaurant development for other reasons and state franchise laws may limit our ability to terminate or modify these license agreements. If we are unable to recruit suitable franchisees or if franchisees are unable or unwilling to open new restaurants as planned, our growth may be slower than anticipated, which could materially adversely affect our ability to increase our revenue and materially adversely affect our business, financial condition and results of operations.
Our success depends on our ability to compete with many other restaurants.
The restaurant industry in general, and the fast casual category in particular, are intensely competitive, and we compete with many well-established restaurant companies on the basis of food taste and quality, price, service, value, location, convenience and overall customer experience. Our competitors include restaurant chains and individual restaurants that range from independent local operators to well-capitalized national and regional restaurant companies, including restaurants offering chicken wing products, as well as dine-in, carry-out and delivery services offering other types of food.
16
Some of our competitors have substantially greater financial and other resources than we do, which may allow them to react to changes in the restaurant industry better than we can. Other competitors are local restaurants that in some cases have a loyal guest base and strong brand recognition within a particular market. As our competitors expand their operations or as new competitors enter the industry, we expect competition to intensify. Should our competitors increase their spending on advertising and promotions, we could experience a loss of customer traffic to our competitors. Also, if our advertising and promotions become less effective than those of our competitors, we could experience a material adverse effect on our results of operations. We and our franchisees also compete with other restaurant chains and other retail businesses for quality site locations, management and hourly employees.
Additionally, we face the risk that new or existing competitors will copy our business model, menu options, presentation or ambiance, among other things. Consumer tastes, nutritional and dietary trends, traffic patterns and the type, number and location of competing restaurants often affect the restaurant business, and our competitors may react more efficiently and effectively to those conditions. In addition, many of our competitors offer lower-priced menu options or meal packages, or have loyalty programs. Several of our competitors compete by offering a broader range of menu items, including items that are specifically identified as low in carbohydrates or healthier, a strategy that we do not currently pursue. This competition in the variety of products offered and the price of products may adversely impact our sales.
Moreover, we may also compete with companies outside the fast casual and quick service and casual dining segments of the restaurant industry. For example, competitive pressures can come from deli sections and in-store cafés of several major grocery store chains, including those targeted at customers who want healthier food, as well as from convenience stores and other dining outlets. These competitors may have, among other things, a more diverse menu, lower operating costs, better locations, better facilities, better management, more effective marketing and more efficient operations than we have.
If we are unable to compete effectively, it could decrease our traffic, sales and profit margins, which could adversely affect our business, financial condition and results of operations.
Our expansion into new markets may present increased risks.
Some of our new restaurants are planned for markets where there may be limited or no market recognition of our brand. Those markets may have competitive conditions, consumer tastes and discretionary spending patterns that are different from those in our existing markets, and we may encounter well-established competitors with substantially greater financial resources than us. As a result, those new restaurants may be less successful than restaurants in our existing markets.
We may need to build brand awareness in that market through greater investments in advertising and promotional activity than we originally planned, which could negatively impact the profitability of our operations in new markets. Our franchisees may find it more difficult in new markets to hire, motivate and keep qualified employees who can project our vision, passion and culture. In addition, we may have difficulty finding reliable suppliers or distributors or ones that can provide us, either initially or over time, with adequate supplies of ingredients meeting our quality standards. Restaurants opened in new markets may also have lower average restaurant sales than restaurants opened in existing markets. Sales at restaurants opened in new markets may take longer to ramp up and reach expected sales and profit levels, and may never do so, thereby affecting our overall profitability. Additionally, new markets may have higher rents and labor rates as compared to existing markets that negatively affect unit economics.
Food safety, food-borne illness and other health concerns may have an adverse effect on our business.
Food safety is a top priority, and we dedicate substantial resources to ensure that our customers enjoy safe, quality food products. However, food-borne illnesses, such as salmonella, E. coli or hepatitis A, and food safety issues have occurred in the food industry in the past, and could occur in the future. Any report or publicity linking our restaurants to instances of food-borne illness or other food safety issues, including food tampering or contamination, could adversely affect our brand and reputation as well as our revenue and profits. Even instances of food-borne illness, food tampering or food contamination occurring solely at restaurants of our competitors could result in negative publicity about the food service industry or fast casual restaurants generally and adversely impact our restaurants.
In addition, our reliance on third-party food suppliers and distributors increases the risk that food-borne illness incidents could be caused by factors outside of our control and that multiple restaurants would be affected rather than a single restaurant. We cannot assure that all food items are properly maintained during transport throughout the supply chain and that our employees and our franchisees and their employees will identify all products that may be spoiled and should not be used in our restaurants. In addition, our industry has long been subject to the threat of food tampering by suppliers, employees, and others such as the addition of foreign objects in the food that we sell. Reports, whether or not true, of injuries caused by food tampering have in the past severely injured the reputations and brands of restaurant chains in the quick service restaurant segment and could affect us in the future as well. If our customers become ill from food-borne illnesses, we could also be forced to temporarily close some restaurants.
17
Furthermore, any instances of food contamination, whether or not at our restaurants, could subject our restaurants or our suppliers to a food recall pursuant to the Food and Drug Administration Food Safety Modernization Act.
Furthermore, the United States and other countries have also experienced, and may experience in the future, outbreaks of viruses, such as H1N1, avian influenza, various other forms of influenza, enterovirus, SARS and Ebola. To the extent that a virus is transmitted by human-to-human contact, our employees or customers could become infected or could choose, or be advised, to avoid gathering in public places and avoid eating in restaurant establishments such as our restaurants, which could adversely affect our business.
Interruptions in the supply of product to company-owned restaurants and franchisees could adversely affect our revenue.
In order to maintain quality-control standards and consistency among restaurants, we require through our franchise agreements that our franchisees obtain food and other supplies from preferred suppliers approved in advance. In this regard, we and our franchisees depend on a group of suppliers for food ingredients, beverages, paper goods, and distribution, including, but not limited to, four primary chicken suppliers, Sygma for distribution, The Coca-Cola Company, and other suppliers. In
2017
, we and our franchisees purchased products from approximately
120
approved suppliers, with approximately 10 of such suppliers providing
85%
, based on dollar volume, of all products purchased. We look to approve multiple suppliers for most products, and require any single sourced supplier, such as The Coca-Cola Company, to have contingency plans in place to ensure continuity of supply. In addition, we believe that, if necessary, we could obtain readily available alternative sources of supply for each product that we currently source through a single supplier. To facilitate the efficiency of our franchisees’ supply chain, we have historically entered into several preferred-supplier arrangements for particular food or beverage items. In addition, our restaurants bear risks associated with the timeliness, solvency, reputation, labor relations, freight costs, price of raw materials, and compliance with health and safety standards of each supplier, including, but not limited to, risks associated with contamination to food and beverage products. We have little control over such suppliers. Disruptions in these relationships may reduce franchisee sales and, in turn, our royalty income. Overall difficulty of suppliers meeting restaurant product demand, interruptions in the supply chain, obstacles or delays in the process of renegotiating or renewing agreements with preferred suppliers, financial difficulties experienced by suppliers, or the deficiency, lack, or poor quality of alternative suppliers could adversely impact franchisee sales and our company-owned restaurant sales, which, in turn, would reduce our royalty income and revenue and could materially and adversely affect our business and operating results.
You should not rely on past increases in our domestic same store sales or our AUV as an indication of our future results of operations because they may fluctuate significantly.
A number of factors have historically affected, and will continue to affect, our domestic same store sales and AUV, including, among other factors:
|
•
|
competition;
|
|
•
|
consumer trends and confidence;
|
|
•
|
our ability to execute our business strategy effectively;
|
|
•
|
unusually strong initial sales performance by new restaurants; and
|
|
•
|
regional and national macroeconomic conditions.
|
The level of domestic same store sales is a critical factor affecting our ability to generate profits because the profit margin on domestic same store sales is generally higher than the profit margin on new restaurant sales. Domestic same store sales reflects the change in year-over-year sales for the domestic same store base. We define the domestic same store base to include those restaurants open for at least 52 full weeks.
Our quarterly operating results may fluctuate significantly and could fall below the expectations of securities analysts and investors due to certain factors, some of which are beyond our control, resulting in a decline in our stock price.
Our quarterly operating results may fluctuate significantly because of several factors, including:
|
•
|
the timing of new restaurant openings;
|
|
•
|
profitability of our restaurants, especially in new markets;
|
|
•
|
changes in interest rates;
|
|
•
|
increases and decreases in average weekly sales and domestic same store sales, including due to the timing and popularity of sporting and other events;
|
18
|
•
|
macroeconomic conditions, both nationally and locally;
|
|
•
|
changes in consumer preferences and competitive conditions;
|
|
•
|
impairment of long-lived assets and any loss on restaurant closures;
|
|
•
|
|
|
•
|
increases in infrastructure costs; and
|
|
•
|
fluctuations in commodity prices.
|
As a result, our quarterly and annual operating results and domestic same store sales may fluctuate significantly as a result of the factors discussed above. Accordingly, results for any one fiscal quarter are not necessarily indicative of results to be expected for any other fiscal quarter or for any fiscal year and domestic same store sales for any particular future period may decrease. The planned increase in the number of our restaurants may make our future results unpredictable and, if we fail to manage such growth effectively, our business, financial condition and results of operations may be materially adversely affected. In the future, operating results may fall below the expectations of securities analysts and investors. In that event, the price of our common stock would likely decrease.
If we or our franchisees or licensees are unable to protect our customers’ credit card data and other personal information, we or our franchisees could be exposed to data loss, litigation, and liability, and our reputation could be significantly harmed.
Privacy protection is increasingly demanding, and the use of electronic payment methods and collection of other personal information expose us and our franchisees to increased risk of privacy and/or security breaches as well as other risks. The majority of our restaurant sales are by credit or debit cards. In connection with credit or debit card transactions in-restaurant, we and our franchisees collect and transmit confidential information by way of private retail networks. Additionally, we collect and store personal information from individuals, including our customers, franchisees, and employees.
Our franchisees have experienced security breaches in which credit and debit card information could have been stolen and we and our franchisees may experience security breaches in which credit and debit card information is stolen in the future. Although we use private networks to transmit confidential information, third parties may have the technology or know-how to breach the security of the customer information transmitted in connection with credit and debit card sales, and our security measures and those of technology vendors may not effectively prohibit others from obtaining improper access to this information. The techniques used to obtain unauthorized access, disable or degrade service, or sabotage systems change frequently and are often difficult to detect for long periods of time, which may cause a breach to go undetected for an extensive period of time. Advances in computer and software capabilities, new tools, and other developments may increase the risk of such a breach. Further, the systems currently used for transmission and approval of electronic payment transactions, and the technology utilized in electronic payment themselves, all of which can put electronic payment at risk, are determined and controlled by the payment card industry, not by us, through enforcement of compliance with the Payment Card Industry - Data Security Standards, or PCI DSS. We and our franchisees must abide by the PCI DSS, as modified from time to time, in order to accept electronic payment transactions. Furthermore, the payment card industry is requiring vendors to become compatible with smart chip technology for payment cards, or EMV-Compliant, or else bear full responsibility for certain fraud losses, referred to as the EMV Liability Shift, which could adversely affect our business. To become EMV-Compliant, merchants must utilize EMV-Compliant payment card terminals at the point of sale, or POS, and also obtain a variety of certifications. At present, our company-owned and franchised restaurants are not required to upgrade their POS systems to include such EMV-Compliant payment card terminals and as a result, may be at increased risk for breaches, which could adversely affect our business and operating results. In addition, our franchisees, contractors, or third parties with whom we do business or to whom we outsource business operations may attempt to circumvent our security measures in order to misappropriate such information, and may purposefully or inadvertently cause a breach involving such information. If a person is able to circumvent our security measures or those of third parties, he or she could destroy or steal valuable information or disrupt our operations. We may become subject to claims for purportedly fraudulent transactions arising out of the actual or alleged theft of credit or debit card information, and we may also be subject to lawsuits or other proceedings relating to these types of incidents. Any such claim or proceeding could cause us to incur significant unplanned expenses, which could have an adverse impact on our financial condition, results of operations and cash flows. Further, adverse publicity resulting from these allegations could significantly harm our reputation and may have a material adverse effect on us and our restaurants. While we currently maintain a cyber liability insurance policy, our cyber liability coverage may be inadequate or may not be available in the future on acceptable terms, or at all. In addition, our cyber liability insurance policy may not cover all claims made against us, and defending a suit, regardless of its merit, could be costly and divert management’s attention.
19
Our business activities subject us to litigation risk that could affect us adversely by subjecting us to significant money damages and other remedies or by increasing our litigation expense.
We and our franchisees are, from time to time, the subject of, or potentially the subject of, complaints or litigation, including customer claims, personal-injury claims, environmental claims, employee allegations of improper termination and discrimination, claims related to violations of the Americans with Disabilities Act of 1990, or the ADA, religious freedom, the Fair Labor Standards Act, or the FLSA, other employment-related laws, the Occupational Safety and Health Act, or OSHA, the Employee Retirement Income Security Act of 1974, as amended, or ERISA, advertising laws and intellectual property claims. Each of these claims may increase costs and limit the funds available to make royalty payments and reduce the execution of new franchise agreements. Litigation against a franchisee or its affiliates by third parties or regulatory agencies, whether in the ordinary course of business or otherwise, may also include claims against us by virtue of our relationship with the defendant-franchisee, whether under vicarious liability, joint employer, or other theories. In addition to decreasing the ability of a defendant-franchisee to make royalty payments in the event of such claims and diverting our management and financial resources, adverse publicity resulting from such allegations may materially and adversely affect us and our brand, regardless of whether these allegations are valid or whether we are liable. Our international operations may be subject to additional risks related to litigation, including difficulties in enforcement of contractual obligations governed by foreign law due to differing interpretations of rights and obligations, compliance with multiple and potentially conflicting laws, new and potentially untested laws and judicial systems, and reduced or diminished protection of intellectual property. A substantial judgment against us or one of our subsidiaries could materially and adversely affect our business and operating results.
We could also become subject to class action or other lawsuits related to the above-described or different matters in the future. Regardless, however, of whether any claim brought against us in the future is valid or whether we are liable, such a claim would be expensive to defend and may divert time, money and other valuable resources away from our operations and, thereby, hurt our business.
We and our franchisees are also subject to state and local “dram shop” statutes, which may subject us and our franchisees to uninsured liabilities. These statutes generally allow a person injured by an intoxicated person to recover damages from an establishment that wrongfully served alcoholic beverages to the intoxicated person. Because a plaintiff may seek punitive damages, which may not be fully covered by insurance, this type of action could have an adverse impact on our financial condition and results of operations. A judgment in such an action significantly in excess of insurance coverage could adversely affect our financial condition, results of operations or cash flows. Further, adverse publicity resulting from any such allegations may adversely affect us and our restaurants taken as a whole.
Although we maintain what we believe to be adequate levels of insurance, insurance may not be available at all or in sufficient amounts to cover any liabilities with respect to these or other matters. A judgment or other liability in excess of our insurance coverage for any claims or any adverse publicity resulting from claims could adversely affect our business and results of operations.
We may engage in litigation with our franchisees.
Although we believe we generally enjoy a positive working relationship with the vast majority of our franchisees, the nature of the franchisor-franchisee relationship may give rise to litigation with our franchisees. In the ordinary course of business, we are the subject of complaints or litigation from franchisees, usually related to alleged breaches of contract or wrongful termination under the franchise arrangements. We may also engage in future litigation with franchisees to enforce the terms of our franchise agreements and compliance with our brand standards as determined necessary to protect our brand, the consistency of our products and the customer experience. We may also engage in future litigation with franchisees to enforce our contractual indemnification rights if we are brought into a matter involving a third party due to the franchisee’s alleged acts or omissions. In addition, we may be subject to claims by our franchisees relating to our Franchise Disclosure Document, or FDD, including claims based on financial information contained in our FDD. Engaging in such litigation may be costly and time-consuming and may distract management and materially adversely affect our relationships with franchisees and our ability to attract new franchisees. Any negative outcome of these or any other claims could materially adversely affect our results of operations as well as our ability to expand our franchise system and may damage our reputation and brand. Furthermore, existing and future franchise-related legislation could subject us to additional litigation risk in the event we terminate or fail to renew a franchise relationship.
Changes to the current law with respect to the assignment of liabilities in the franchise business model could adversely impact our profitability.
One of the legal foundations fundamental to the franchise business model has been that, absent special circumstances, a franchisor is generally not responsible for the acts, omissions or liabilities of its franchisees, whether with respect to the franchisees’ employees or otherwise. However, in an August 27, 2015, National Labor Relations Board, or NLRB, decision,
Browning-Ferris Industries of California, Inc.
, the NLRB adopted a broader and looser standard for determining joint employer status. Under the NLRB’s
20
new joint employer standard, a putative joint employer is no longer required to exercise “direct and immediate” control over workers’ terms and conditions of employment. “Indirect” or even “reserved” control is now potentially sufficient to establish a joint employment relationship. Although
Browning-Ferris Industries of California, Inc.
was not a case involving a franchise relationship, and while the NLRB’s opinion explicitly stated it was not addressing the franchise industry, it is unclear how the NLRB will apply the expanded joint employer definition adopted in
Browning-Ferris Industries of California, Inc.
to franchise relationships overall or to particular franchise relationships sharing certain characteristics or controls. If the NLRB’s new position is applied broadly to franchise relationships, it could significantly change the way we and other franchisors conduct business and adversely impact our profitability. For example, the General Counsel of the NLRB continues to prosecute complaints in Regional Offices across the country (first issued in December 2014) charging that McDonald’s and its franchisees are joint employers and seeking to hold McDonald’s liable for unfair labor practices allegedly committed by its franchisees. The position taken by the NLRB General Counsel has set in motion what are expected to be lengthy hearings before the NLRB. The decision of the NLRB is subject to subsequent federal court litigation and is not expected to be resolved until a final decision in the federal appellate courts. A determination, due to the new standard adopted in
Browning-Ferris Industries of California, Inc.
, that we are a “joint employer” with our franchisees or that our franchisees are part of one unified system with joint and several liability under the National Labor Relations Act, statutes administered by the Equal Employment Opportunity Commission, Occupational Safety and Health Administration, or OSHA, regulations and other areas of labor and employment law could subject us and/or our franchisees to liability for the unfair labor practices, wage-and-hour law violations, employment discrimination law violations, OSHA regulation violations and other employment-related liabilities of one or more franchisees. Furthermore, this change in the law could create an increased likelihood that certain franchised networks will be required to employ unionized labor, which could impact franchisors like us through, among other things, increased labor costs, increased menu prices to offset labor costs and difficulty in attracting new franchisees. In addition, if these changes are expanded outside of the employment context, we could be held liable for other claims against franchisees such as personal injury claims by customers at franchised restaurants. Therefore, any regulatory action or court decisions expanding the vicarious liability of franchisors could impact our ability or desire to grow our franchised base and have a material adverse effect on our results of operations.
Macroeconomic conditions could adversely affect our ability to increase sales at existing restaurants or open new restaurants.
Recessionary economic cycles, higher fuel and other energy costs, lower housing values, low consumer confidence, inflation, increases in commodity prices, higher interest rates, higher levels of unemployment, higher consumer debt levels, higher tax rates and other changes in tax laws or other economic factors that may affect discretionary consumer spending could adversely affect our revenue and profit margins and make opening new restaurants more difficult. Our customers may have lower disposable income and reduce the frequency with which they dine out during economic downturns. This could result in fewer transactions and reduced transaction size or limitations on the prices we can charge for our menu items, any of which could reduce our sales and profit margins. Also, businesses in the shopping vicinity in which some of our restaurants are located may experience difficulty as a result of macroeconomic trends or cease to operate, which could, in turn, further negatively affect customer traffic at our restaurants. All of these factors could have a material adverse impact on our results of operations and growth strategy.
In addition, negative effects on our and our franchisees’ existing and potential landlords due to the inaccessibility of credit and other unfavorable economic factors may, in turn, adversely affect our business and results of operations. If our or our franchisees’ landlords are unable to obtain financing or remain in good standing under their existing financing arrangements, they may be unable to provide construction contributions or satisfy other lease obligations owed to us or our franchisees. In addition, if our and our franchisees’ landlords are unable to obtain sufficient credit to continue to properly manage their retail sites, we may experience a drop in the level of quality of such retail centers. The development of new restaurants may also be adversely affected by negative economic factors affecting developers and potential landlords. Developers and/or landlords may try to delay or cancel recent development projects (as well as renovations of existing projects) due to instability in the credit markets and declines in consumer spending, which could reduce the number of appropriate locations available that we would consider for our new restaurants. Furthermore, other tenants at the properties in which our restaurants are located may delay their openings, fail to open or cease operations. Decreases in total tenant occupancy in the properties in which our restaurants are located may affect customer traffic at our restaurants.
If any of the foregoing affect any of our or our franchisees’ landlords, developers and/or surrounding tenants, our business and results of operations may be adversely affected. To the extent our restaurants are part of a larger retail project or tourist destination, customer traffic could be negatively impacted by economic factors affecting surrounding tenants.
Because many of our restaurants are concentrated in local or regional areas, we are susceptible to economic and other trends and developments, including adverse weather conditions, in these areas.
As of
December 30, 2017
,
60%
of our
1,027
domestic restaurants were spread across Texas (
31%
), California (
23%
) and Illinois (
6%
). Given our geographic concentrations, negative publicity regarding any of our restaurants in these areas could have a material
21
adverse effect on our business and operations, as could other regional occurrences such as local strikes, terrorist attacks, increases in energy prices, or natural or man-made disasters and more stringent state and local laws and regulations. In particular, adverse weather conditions, such as regional winter storms, floods, severe thunderstorms, earthquakes, tornadoes and hurricanes, could negatively impact our results of operations.
We and our franchisees rely on computer systems to process transactions and manage our business, and a disruption or a failure of such systems or technology could harm our ability to effectively manage our business.
Network and information technology systems are integral to our business. We utilize various computer systems, including our franchisee reporting system, by which our franchisees report their weekly sales and pay their corresponding royalty fees and required advertising fund contributions. When sales are reported by a franchisee, a withdrawal for the authorized amount is initiated from the franchisee’s bank on a set date each week based on gross sales during the week ended the prior Saturday. This system is critical to our ability to accurately track sales and compute royalties and advertising fund contributions due from our franchisees. We also rely on computer systems and network infrastructure across other areas of our operations, including marketing programs, employee engagement, management of our supply chain and POS processing in our restaurants.
Our operations depend upon our ability to protect our computer equipment and systems against damage from physical theft, fire, power loss, telecommunications failure or other catastrophic events, as well as from internal and external security breaches, viruses, worms and other disruptive problems. Any damage or failure of our computer systems or network infrastructure that causes an interruption in our operations could have a material adverse effect on our business and subject us to litigation or actions by regulatory authorities.
Despite the implementation of protective measures, our systems are subject to damage and/or interruption as a result of power outages, computer and network failures, computer viruses and other disruptive software, security breaches, catastrophic events, and improper usage by employees. Such events could result in a material disruption in operations, a need for a costly repair, upgrade or replacement of systems, or a decrease in, or in the collection of, royalties and advertising fund contributions paid to us by our franchisees. To the extent that any disruption or security breach were to result in a loss of, or damage to, our data or applications, or inappropriate disclosure of confidential or proprietary information, we could incur liability which could materially affect our results of operations.
It is also critical that we establish and maintain certain licensing and software agreements for the software we use in our day-to-day operations. A failure to procure or maintain these licenses could have a material adverse effect on our business operations.
Failure to obtain and maintain required licenses and permits or to comply with alcoholic beverage or food control regulations could lead to the loss of liquor and food service licenses and, thereby, harm our business.
The restaurant industry is subject to various federal, state and local government regulations, including those relating to the sale of food and alcoholic beverages. Such regulations are subject to change from time to time. The failure of our restaurants to obtain and maintain these licenses, permits and approvals could adversely affect our operating results. Typically, licenses must be renewed annually and may be revoked, suspended or denied renewal for cause at any time if governmental authorities determine that a restaurant’s conduct violates applicable regulations. Difficulties or failure to maintain or obtain the required licenses and approvals could adversely affect our existing restaurants and delay or result in our decision to cancel the opening of new restaurants, which would adversely affect our results of operations.
Alcoholic beverage control regulations require each of our restaurants to apply to a state authority and, in certain locations, county or municipal authorities for a license or permit to sell alcoholic beverages on-premises and to provide service for extended hours and on Sundays. Alcoholic beverage control regulations relate to numerous aspects of daily operations of our restaurants, including minimum age of patrons and employees, hours of operation, advertising, trade practices, wholesale purchasing, other relationships with alcohol manufacturers, wholesalers and distributors, inventory control and handling, and storage and dispensing of alcoholic beverages. Any future failure to comply with these regulations and obtain or retain liquor licenses could adversely affect our results of operations.
Our current insurance and the insurance of our franchisees may not provide adequate levels of coverage against claims.
We currently maintain insurance customary for businesses of our size and type. However, there are types of losses we may incur that cannot be insured against or that we believe are not economically reasonable to insure. Such losses could have a material adverse effect on our business and results of operations.
22
Our franchise agreements require each franchisee to maintain certain insurance types and levels. Certain extraordinary hazards, however, may not be covered, and insurance may not be available (or may be available only at prohibitively expensive rates) with respect to many other risks. Moreover, any loss incurred could exceed policy limits and policy payments made to franchisees may not be made on a timely basis. Any such loss or delay in payment could have a material and adverse effect on a franchisee’s ability to satisfy obligations under the franchise agreement, including the ability to make royalty payments.
We also require franchisees to maintain general liability insurance coverage to protect against the risk of product liability and other risks and demand strict franchisee compliance with health and safety regulations. However, franchisees may receive or produce defective food or beverage products, which may materially adversely affect our brand’s goodwill and our business. Further, a franchisee’s failure to comply with health and safety regulations, including requirements relating to food quality or preparation, could subject them, and possibly us, to litigation. Any litigation, including the imposition of fines or damage awards, could adversely affect the ability of a franchisee to make royalty payments or could generate negative publicity or otherwise adversely affect us.
Our business is subject to various laws and regulations and changes in such laws and regulations, and/or failure to comply with existing or future laws and regulations, could adversely affect us.
We are subject to state franchise registration requirements, the rules and regulations of the Federal Trade Commission, or FTC, various state laws regulating the offer and sale of franchises in the United States through the provision of franchise disclosure documents containing certain mandatory disclosures, various state laws regulating the franchise relationship, and certain rules and requirements regulating franchising arrangements in foreign countries. Although we believe that our franchise disclosure documents, together with any applicable state-specific versions or supplements, and franchising procedures that we use comply in all material respects with both the FTC guidelines and all applicable state laws regulating franchising in those states in which we offer and grant new franchise arrangements, noncompliance could reduce anticipated royalty income, which in turn could materially and adversely affect our business and operating results.
We and our franchisees are subject to various existing United States federal, state, local, and foreign laws affecting the operation of the restaurants, including various health, sanitation, fire, and safety standards. Franchisees may in the future become subject to regulation (or further regulation) seeking to tax or regulate high-fat foods, to limit the serving size of beverages containing sugar, to ban the use of certain packaging materials, or to require the display of detailed nutrition information. Each of these regulations would be costly to comply with and/or could result in reduced demand for our products.
There is also a potential for increased regulation of certain food establishments in the United States, where compliance with a Hazard Analysis and Critical Control Points, or the HACCP, approach may now be required. HACCP refers to a management system in which food safety is addressed through the analysis and control of potential hazards from production, procurement and handling, to manufacturing, distribution and consumption of the finished product. Many states have required restaurants to develop and implement HACCP Systems, and the United States government continues to expand the sectors of the food industry that must adopt and implement HACCP programs. For example, the Food Safety Modernization Act, or the FSMA, signed into law in January 2011, granted the U.S. Food and Drug Administration, the FDA, new authority regarding the safety of the entire food system, including through increased inspections and mandatory food recalls. Although restaurants are specifically exempted from or not directly implicated by some of these new requirements, we anticipate that the new requirements may impact our industry. Additionally, our suppliers may initiate or otherwise be subject to food recalls that may impact the availability of certain products, result in adverse publicity or require us to take actions that could be costly for us or otherwise impact our business.
We and our franchisees may also have a substantial number of hourly employees who are required to be paid pursuant to applicable federal or state minimum wage laws. The federal minimum wage has been $7.25 per hour since July 24, 2009. From time to time, various federal and state legislators have proposed changes to the minimum wage requirements, especially for fast-food workers. Certain regions such as Los Angeles, Seattle, San Francisco and New York, have approved phased-in increases that eventually will take their minimum wage to as high as $15 an hour. These and any future similar increases in other regions in states in which our restaurants operate may negatively affect our and our franchisees profit margins as we and our franchisees may be unable to increase our menu prices in order to pass future increased labor costs on to our guests. Also, reduced margins of franchisees could make it more difficult to sell franchises. If menu prices are increased by us and our franchisees to cover increased labor costs, the higher prices could adversely affect transactions which could lower sales and thereby reduce our margins and the royalties that we receive from franchisees.
The impact of current laws and regulations, the effect of future changes in laws or regulations that impose additional requirements and the consequences of litigation relating to current or future laws and regulations, or our inability to respond effectively to significant regulatory or public policy issues, could increase our compliance and other costs of doing business and therefore have an adverse effect on our results of operations. Failure to comply with the laws and regulatory requirements of federal, state, local and foreign authorities could result in, among other things, revocation of required licenses, administrative enforcement actions,
23
fines and civil and criminal liability. In addition, certain laws, including the ADA, could require us or our franchisees to expend significant funds to make modifications to our restaurants if we failed to comply with applicable standards. Compliance with all of these laws and regulations can be costly and can increase our exposure to litigation or governmental investigations or proceedings.
Damage to our reputation or lack of acceptance of our brand in existing or new markets could negatively impact our business, financial condition and results of operations.
We believe we have built our reputation on the high quality and bold, distinctive and craveable flavors of our food, value and service, and we must protect and grow the value of our brand to continue to be successful in the future. Any incident that erodes consumer affinity for our brand could significantly reduce its value and damage our business. For example, our brand value could suffer and our business could be adversely affected if customers perceive a reduction in the quality of our food, value or service or otherwise believe we have failed to deliver a consistently positive experience. We may also be adversely affected by customers’ experiences with third-party delivery from our restaurants.
We may be adversely affected by news reports or other negative publicity, regardless of their accuracy, regarding food quality issues, public health concerns, illness, safety, injury, security breaches of confidential guest or employee information, employee related claims relating to alleged employment discrimination, wage and hour violation, labor standards or health care and benefit issues or government or industry findings concerning our restaurants, restaurants operated by other foodservice providers, or others across the food industry supply chain. The risks associated with such negative publicity cannot be eliminated or completely mitigated and may materially affect our business.
Also, there has been a marked increase in the use of social media platforms and similar channels, including weblogs (blogs), websites and other forms of internet-based communications that provide individuals with access to a broad audience of consumers and other interested persons. The availability of information on social media platforms is virtually immediate as is its impact. Many social media platforms immediately publish the content their subscribers and participants can post, often without filters or checks on accuracy of the content posted. The opportunity for dissemination of information, including inaccurate information, is seemingly limitless and readily available. Information concerning us may be posted on such platforms at any time. Information posted may be adverse to our interests or may be inaccurate, each of which may harm our performance, prospects, brand or business. The harm may be immediate without affording us an opportunity for redress or correction.
Ultimately, the risks associated with any such negative publicity or incorrect information cannot be eliminated or completely mitigated and may materially adversely affect our reputation, business, financial condition and results of operations.
Opening new restaurants in existing markets may negatively affect sales at existing restaurants.
We intend to continue opening new franchised restaurants in our existing markets as a core part of our growth strategy. Expansion in existing markets may be affected by local economic and market conditions. Further, the customer target area of our restaurants varies by location, depending on a number of factors, including population density, other local retail and business attractions, area demographics and geography. As a result, the opening of a new restaurant in or near markets in which our restaurants already exist could adversely affect the sales of these existing restaurants. We and our franchisees may selectively open new restaurants in and around areas of existing restaurants. Sales cannibalization between restaurants may become significant in the future as we continue to expand our operations and could affect sales growth, which could, in turn, materially adversely affect our business, financial condition or results of operations.
Our expansion into international markets exposes us to a number of risks that may differ in each country where we have franchise restaurants.
As of
December 30, 2017
, we have franchised restaurants in Mexico, Singapore, Indonesia, the Philippines, the United Arab Emirates, Malaysia, Saudi Arabia, and Colombia and plan to continue to grow internationally. However, international operations are in early stages. Expansion in international markets may be affected by local economic and market conditions. Therefore, as we expand internationally, our franchisees may not experience the operating margins we expect, and our results of operations and growth may be materially and adversely affected. Our financial condition and results of operations may be adversely affected if the global markets in which our franchised restaurants compete are affected by changes in political, economic or other factors. These factors, over which neither our franchisees nor we have control, may include:
|
•
|
recessionary or expansive trends in international markets;
|
|
•
|
changing labor conditions and difficulties in staffing and managing our foreign operations;
|
|
•
|
increases in the taxes we pay and other changes in applicable tax laws;
|
24
|
•
|
legal and regulatory changes, and the burdens and costs of our compliance with a variety of foreign laws;
|
|
•
|
changes in inflation rates;
|
|
•
|
changes in exchange rates and the imposition of restrictions on currency conversion or the transfer of funds;
|
|
•
|
difficulty in protecting our brand, reputation and intellectual property;
|
|
•
|
difficulty in collecting our royalties and longer payment cycles;
|
|
•
|
expropriation of private enterprises;
|
|
•
|
anti-American sentiment in certain locations and the identification of the Wingstop brand as an American brand;
|
|
•
|
political and economic instability; and
|
|
•
|
other external factors.
|
Our success depends in part upon effective advertising and marketing campaigns, which may not be successful, and franchisee support of such advertising and marketing campaigns.
We believe the Wingstop brand is critical to our business and expend resources in our marketing efforts using a variety of media. We expect to continue to conduct brand awareness programs and customer initiatives to attract and retain customers. Should our advertising and promotions not be effective, our business, financial condition and results of operations could be materially adversely affected.
The support of our franchisees is critical for the success of the advertising and marketing campaigns we seek to undertake, and the successful execution of these campaigns will depend on our ability to maintain alignment with our franchisees. Our franchisees are currently required to contribute two percent of their gross sales to a common ad fund to support the development of new products, brand development and national marketing programs. Our current form of franchise agreement also requires franchisees to spend at least one percent of gross sales directly on local advertising, but the majority of our franchisees are not subject to such requirement. Franchisees also may be required to contribute approximately two percent of gross sales to a cooperative advertising association when a franchisee and at least one other restaurant operator have opened restaurants in the same DMA (the cooperative advertising contribution is credited toward the 1% minimum spend). While we maintain control over advertising and marketing materials and can mandate certain strategic initiatives pursuant to our franchise agreements, we need the active support of our franchisees if the implementation of these initiatives is to be successful. If our initiatives are not successful, resulting in expenses incurred without the benefit of higher revenue, our business, financial condition and results of operations could be materially adversely effected.
We are vulnerable to changes in consumer preferences and regulation of consumer eating habits that could harm our business, financial condition, results of operations and cash flow.
Consumer preferences often change rapidly and without warning, moving from one trend to another among many product or retail concepts. We depend on trends regarding away-from-home or take-out dining. Consumer preferences towards away-from-home and take-out dining or certain food products might shift as a result of, among other things, health concerns or dietary trends related to cholesterol, carbohydrate, fat and salt content of certain food items, including chicken wings, in favor of foods that are perceived as more healthy. Our menu is currently comprised primarily of chicken wings and a change in consumer preferences away from these offerings would have a material adverse effect on our business. Negative publicity over the health aspects of the food items we sell may adversely affect demand for our menu items and could result in lower traffic, sales and results of operations. Our continued success will depend in part on our ability to anticipate, identify and respond to changing consumer preferences.
Regulations and consumer eating habits may continue to change as a result of new information and attitudes regarding diet and health. These changes may include regulations that impact the ingredients and nutritional content of our menu items. The federal government, as well as a number of states, counties and cities, have enacted menu labeling laws requiring multi-unit restaurant operators to make certain nutritional information available to customers or have enacted legislation prohibiting the sales of certain types of ingredients in restaurants. For example, the PPACA establishes a uniform, federal requirement for certain restaurants to post nutritional information on their menus, which must be implemented upon the promulgation of regulations by the FDA. California, a state in which
23%
of our domestic restaurants are located, has also enacted menu labeling laws. Altering our recipes in response to such legislation could increase our costs and/or change the flavor profile of our menu offerings which could have an adverse impact on our results of operations. Additionally, if our customers perceive our menu items to contain unhealthy caloric, sugar, sodium, or fat content, our results of operations could be adversely affected. The success of our restaurant operations depends, in part, upon our ability to effectively respond to changes in consumer health and disclosure regulations and to adapt our menu offerings to fit the dietary needs and eating habits of our customers without sacrificing flavor. To the extent we are unable to
25
respond with appropriate changes to our menu offerings, it could materially affect customer traffic and our results of operations. Furthermore, a change in our menu could result in a decrease in customer traffic.
We depend upon our executive officers and management team and may not be able to retain or replace these individuals or recruit additional personnel, which could harm our business.
We believe that we have already benefited and expect to benefit substantially in the future from the leadership and experience of our executive officers and management team. The loss of the services of any of these individuals could have a material adverse effect on our business and prospects, as we may not be able to find suitable individuals to replace such personnel on a timely basis. In addition, any such departure could be viewed in a negative light by investors and analysts, which could cause our common stock price to decline. As our business expands, our future success will depend greatly on our continued ability to attract and retain highly-skilled and qualified executive-level personnel. Our inability to attract and retain qualified executive officers in the future could impair our growth and harm our business.
The number of new franchised Wingstop restaurants that actually open in the future may differ materially from the number of signed commitments from potential existing and new franchisees.
The number of new franchised Wingstop restaurants that actually open in the future may differ materially from the number of signed commitments from potential existing and new franchisees. Historically, a portion of our commitments sold have not ultimately opened as new franchised Wingstop restaurants. On an annual basis for the past four years approximately 10% - 20% of the total domestic commitments sold have been terminated. Based on our limited history of international restaurant openings, we believe the termination rate of international commitments is likely to approximate the historic termination rate of domestic commitments. The historic conversion rate of signed commitments to new franchised Wingstop locations may not be indicative of the conversion rates we will experience in the future and the total number of new franchised Wingstop restaurants actually opened in the future may differ materially from the number of signed commitments disclosed at any point in time.
Our stated sales to investment ratio and target unlevered cash-on-cash return may not be indicative of future results of any new franchised restaurant.
Initial investment levels, AUV levels, restaurant-level operating costs and restaurant-level operating profit of any new restaurant may differ from average levels experienced by franchisees in prior periods due to a variety of factors, and these differences may be material. Accordingly, our stated sales to investment ratio and average unlevered cash-on-cash return may not be indicative of future results of any new franchised restaurant. In addition, estimated initial investment costs and restaurant-level operating costs are based on information self-reported by our franchisees and have not been verified by us. Furthermore, performance of new restaurants is impacted by a range of risks and uncertainties beyond our or our franchisees’ control, including those described by other risk factors described in this report.
Our failure or inability to enforce our trademarks or other proprietary rights could adversely affect our competitive position or the value of our brand.
We believe that our trademarks and other proprietary rights are important to our success and our competitive position, and, therefore, we devote resources to the protection of our trademarks and proprietary rights. The protective actions that we take, however, may not be enough to prevent unauthorized use or imitation by others, which could harm our image, brand or competitive position. If we commence litigation to enforce our rights, we will incur significant legal fees.
We cannot assure you that third parties will not claim infringement by us of their proprietary rights in the future. Any such claim, whether or not it has merit, could be time-consuming and distracting for executive management, result in costly litigation, cause changes to existing menu items or delays in introducing new menu items, or require us to enter into royalty or licensing agreements. As a result, any such claim could have a material adverse effect on our business, results of operations and financial condition.
We are subject to the U.S. Foreign Corrupt Practices Act and other anti-corruption laws or trade control laws, as well as other laws governing our operations. If we fail to comply with these laws, we could be subject to civil or criminal penalties, other remedial measures, and legal expenses, which could adversely affect our business, financial condition and results of operations.
We and our franchisees are subject to anti-corruption laws, including the U.S. Foreign Corrupt Practices Act, or FCPA, and other anti-corruption laws that apply in countries where we do business. The FCPA, U.K. Bribery Act and these other laws generally prohibit us, our food service personnel, our franchisees, their food service personnel and intermediaries from bribing, being bribed or making other prohibited payments to government officials or other persons to obtain or retain business or gain some other business advantage. We operate in a number of jurisdictions that pose a high risk of potential FCPA violations, and we participate
26
in joint ventures and relationships with third parties whose actions could potentially subject us to liability under the FCPA or local anti-corruption laws. In addition, we cannot predict the nature, scope or effect of future regulatory requirements to which our international operations might be subject or the manner in which existing laws might be administered or interpreted.
We and our franchisees are also subject to other laws and regulations governing our international operations, including regulations administered by the U.S. Department of Commerce’s Bureau of Industry and Security, the U.S. Department of Treasury’s Office of Foreign Asset Control, and various non-U.S. government entities, including applicable export control regulations, economic sanctions on countries and persons, customs requirements, currency exchange regulations and transfer pricing regulations, or collectively, Trade Control laws.
However, we and our franchisees may not be completely effective in ensuring our compliance with all applicable anticorruption laws, including the FCPA, Trade Control Laws or other legal requirements. If we or our franchisees are not in compliance with the FCPA and other anti-corruption laws or Trade Control laws, we or our franchisees may be subject to criminal and civil penalties, disgorgement and other sanctions and remedial measures, and legal expenses, which could have an adverse impact on our business, financial condition, results of operations and liquidity. Likewise, any investigation of any potential violations of the FCPA other anti-corruption laws or Trade Control laws by United States or foreign authorities could also have an adverse impact on our reputation, business, financial condition and results of operations.
Our existing senior secured credit facility contains financial covenants, negative covenants and other restrictions and failure to comply with these requirements could cause the related indebtedness to become due and payable and limit our ability to incur additional debt.
The lenders’ obligation to extend credit under our existing senior secured credit facility depends upon our maintaining certain financial covenants. In particular, our senior secured credit facility requires us to maintain a consolidated leverage ratio and a consolidated fixed charge coverage ratio. Failure to maintain these ratios could result in an acceleration of outstanding amounts under the term loan and revolver and restrict us from borrowing amounts under the revolving credit facility to fund our future liquidity requirements. In addition, our senior secured credit facility contains certain negative covenants, which, among other things, limit our ability to:
|
•
|
incur additional indebtedness;
|
|
•
|
pay dividends and make other restrictive payments beyond specified levels;
|
|
•
|
create or permit liens;
|
|
•
|
dispose of certain assets;
|
|
•
|
make certain investments;
|
|
•
|
engage in certain transactions with affiliates; and
|
|
•
|
consolidate, merge or transfer all or substantially all of our assets.
|
Our ability to make scheduled payments and comply with financial covenants will depend on our operating and financial performance, which, in turn, is subject to prevailing economic conditions and to other financial, business and other factors beyond our control described herein.
If we fail to maintain effective internal controls over financial reporting and disclosure controls and procedures, we may not be able to accurately report our financial results, or report them in a timely manner.
As a public reporting company we are subject to the rules and regulations established from time to time by the SEC and Nasdaq. These rules and regulations require, among other things, that we establish and periodically evaluate procedures with respect to our internal controls over financial reporting. Reporting obligations as a public company have placed, and may continue to place, a considerable strain on our financial and management systems, processes and controls, as well as on our personnel. In addition, as a public company we are required to document and test our internal controls over financial reporting pursuant to Section 404 of the Sarbanes-Oxley Act so that our management can certify as to the effectiveness of our internal controls over financial reporting by the time our second annual report is filed with the SEC and thereafter, which will require us to document and make significant changes to our internal controls over financial reporting. Likewise, our independent registered public accounting firm will be required to provide an attestation report on the effectiveness of our internal control over financial reporting.
If our senior management is unable to conclude that we have effective internal control over financial reporting, or to certify the effectiveness of such controls, or if our independent registered public accounting firm cannot render an unqualified opinion on management’s assessment and the effectiveness of our internal control over financial reporting, when required, or if material
27
weaknesses in our internal controls are identified, we could be subject to regulatory scrutiny and a loss of public and investor confidence, which could have a material adverse effect on our business and our stock price. In addition, if we do not maintain adequate financial and management personnel, processes and controls, we may not be able to manage our business effectively or accurately report our financial performance on a timely basis, which could cause a decline in our common stock price and adversely affect our results of operations and financial condition.
An impairment in the carrying value of our goodwill or other intangible assets could adversely affect our financial condition and consolidated results of operations.
We review goodwill for impairment annually, or whenever circumstances change in a way which could indicate that impairment may have occurred, and record an impairment loss whenever we determine impairment factors are present. Significant impairment charges could have a material adverse effect on our business, results of operations and financial condition.
Risks Related to Ownership of our Common Stock
Our stock price may be volatile or may decline regardless of our operating performance.
The market price of our common stock may fluctuate significantly in response to a number of factors, most of which we cannot control, including those described under “Risks Related to Our Business and Our Industry” and the following:
|
•
|
potential fluctuation in our annual or quarterly operating results;
|
|
•
|
changes in capital market conditions that could affect valuations of restaurant companies in general or our goodwill in particular or other adverse economic conditions;
|
|
•
|
changes in financial estimates by any securities analysts who follow our common stock, our failure to meet these estimates or failure of those analysts to initiate or maintain coverage of our common stock;
|
|
•
|
downgrades by any securities analysts who follow our common stock;
|
|
•
|
future sales of our common stock by our officers, directors and significant stockholders;
|
|
•
|
global economic, legal and regulatory factors unrelated to our performance;
|
|
•
|
investors’ perceptions of our prospects;
|
|
•
|
announcements by us or our competitors of significant contracts, acquisitions, joint ventures or capital commitments; and
|
|
•
|
investor perceptions of the investment opportunity associated with our common stock relative to other investment alternatives.
|
In addition, the stock markets, and in particular Nasdaq, have experienced extreme price and volume fluctuations that have affected and continue to affect the market prices of equity securities of many food service companies. In the past, stockholders have instituted securities class action litigation following periods of market volatility. If we were involved in securities litigation, we could incur substantial costs and our resources and the attention of management could be diverted from our business.
Anti-takeover provisions in our charter documents and under Delaware law could make an acquisition of us more difficult, limit attempts by our stockholders to replace or remove our current management and limit the market price of our common stock.
Provisions in our amended and restated certificate of incorporation and bylaws may have the effect of delaying or preventing a change of control or changes in our management. Our amended and restated certificate of incorporation and amended and restated bylaws include provisions that:
|
•
|
authorize our board of directors to issue, without further action by the stockholders, up to 15,000,000 shares of undesignated preferred stock;
|
|
•
|
require that, any action to be taken by our stockholders be effected at a duly called annual or special meeting and not by written consent;
|
|
•
|
specify that special meetings of our stockholders can be called only upon the request of a majority of our board of directors;
|
28
|
•
|
establish an advance notice procedure for stockholder proposals to be brought before an annual meeting, including proposed nominations of persons for election to our board of directors;
|
|
•
|
establish that our board of directors is divided into three classes, with each class serving three-year staggered terms; and
|
|
•
|
prohibit cumulative voting in the election of directors.
|
These provisions may frustrate or prevent any attempts by our stockholders to replace or remove our current management by making it more difficult for stockholders to replace members of our board of directors, which is responsible for appointing the members of our management, and may discourage, delay or prevent a transaction involving a change of control of our company that is in the best interest of our minority stockholders. Even in the absence of a takeover attempt, the existence of these provisions may adversely affect the prevailing market price of our common stock if stockholders view them as discouraging future takeover attempts. In addition, we have opted out of the Delaware General Corporation Law (“DGCL”) Section 203, relating to business combinations with interested stockholders, but our amended and restated certificate of incorporation provides that engaging in any of a broad range of business combinations with any “interested” stockholder (any stockholder with 15% or more of our capital stock) for a period of three years following the date on which the stockholder became an “interested” stockholder is prohibited, subject to certain exceptions.
Our amended and restated certificate of incorporation designates the Court of Chancery of the State of Delaware as the sole and exclusive forum for certain types of actions and proceedings that may be initiated by our stockholders, which could limit our stockholders’ ability to obtain a favorable judicial forum for disputes with us or our directors, officers or employees.
Our amended and restated certificate of incorporation provides that, unless we consent in writing to an alternative forum, the Court of Chancery of the State of Delaware will be the sole and exclusive forum for (i) any derivative action or proceeding brought on our behalf, (ii) any action asserting a claim of breach of a fiduciary duty owed by any of our directors, officers and employees to us or our stockholders, (iii) any action asserting a claim arising pursuant to any provision of the DGCL, our amended and restated certificate of incorporation or our amended and restated bylaws or (iv) any action asserting a claim that is governed by the internal affairs doctrine, in each case subject to the Court of Chancery having personal jurisdiction over the indispensable parties named as defendants therein. Any person purchasing or otherwise acquiring any interest in any shares of our capital stock shall be deemed to have notice of and to have consented to this provision of our amended and restated certificate of incorporation. This choice of forum provision may limit our stockholders’ ability to bring a claim in a judicial forum that it finds favorable for disputes with us or our directors, officers or employees, which may discourage such lawsuits against us and our directors, officers
and
employees even though an action, if successful, might benefit our stockholders. Stockholders who do bring a claim in the Court of Chancery could face additional litigation costs in pursuing any such claim, particularly if they do not reside in or near Delaware. The Court of Chancery may also reach different judgments or results than would other courts, including courts where a stockholder considering an action may be located or would otherwise choose to bring the action, and such judgments or results may be more favorable to us than to our stockholders. Alternatively, if a court were to find this provision of our amended and restated certificate of incorporation inapplicable to, or unenforceable in respect of, one or more of the specified types of actions or proceedings, we may incur additional costs which could have a material adverse effect on our business, financial condition or results of operations.
We may not continue to declare cash dividends in the future.
In August 2017, we announced that our board of directors authorized a regular dividend program under which we intend to pay quarterly dividends on our common stock, subject to quarterly declarations by our Board of Directors. In addition, in July 2016 and February 2018, we paid special cash dividends of $2.90 per share and $3.17 per share, respectively, in connection with refinancings of our credit facilities. Any future declarations of dividends, as well as the amount and timing of such dividends, are subject to capital availability and the discretion of our Board of Directors, which must evaluate, among other things, whether cash dividends are in the best interest of our stockholders and are in compliance with all applicable laws and any agreements containing provisions that limit our ability to declare and pay cash dividends.
Our ability to pay dividends in the future will depend upon, among other factors, our cash balances and potential future capital requirements, debt service requirements, earnings, financial condition, the general economic and regulatory climate and other factors beyond our control that our Board of Directors may deem relevant. Our dividend payments may change from time to time, and we may not continue to declare dividends in the future. A reduction in or elimination of our dividend payments could have a negative effect on our stock price.
29
None.
30
Due to lower square footage requirements, our restaurants can be located in a variety of locations. They tend to be located primarily in shopping centers, as in-line and end-cap locations. Our restaurants tend to occupy between
1,300
and
2,900
square feet (average
1,700
square feet) of leased retail space. As of
December 30, 2017
, we and our franchisees operated
1,133
restaurants in
42
states and
9
countries.
The chart below shows the locations of our restaurants as of
December 30, 2017
:
|
State
|
Franchise restaurants
|
Company-owned restaurants
|
Total restaurants
|
||||||
|
Alabama
|
4
|
|
—
|
|
4
|
|
|||
|
Alaska
|
1
|
|
—
|
|
1
|
|
|||
|
Arizona
|
30
|
|
—
|
|
30
|
|
|||
|
Arkansas
|
8
|
|
—
|
|
8
|
|
|||
|
California
|
241
|
|
—
|
|
241
|
|
|||
|
Colorado
|
23
|
|
—
|
|
23
|
|
|||
|
Connecticut
|
3
|
|
—
|
|
3
|
|
|||
|
Florida
|
49
|
|
—
|
|
49
|
|
|||
|
Georgia
|
29
|
|
—
|
|
29
|
|
|||
|
Hawaii
|
2
|
|
—
|
|
2
|
|
|||
|
Idaho
|
3
|
|
—
|
|
3
|
|
|||
|
Illinois
|
61
|
|
—
|
|
61
|
|
|||
|
Indiana
|
8
|
|
—
|
|
8
|
|
|||
|
Iowa
|
2
|
|
—
|
|
2
|
|
|||
|
Kansas
|
4
|
|
—
|
|
4
|
|
|||
|
Kentucky
|
4
|
|
—
|
|
4
|
|
|||
|
Louisiana
|
21
|
|
—
|
|
21
|
|
|||
|
Maryland
|
17
|
|
—
|
|
17
|
|
|||
|
Massachusetts
|
4
|
|
—
|
|
4
|
|
|||
|
Michigan
|
6
|
|
—
|
|
6
|
|
|||
|
Minnesota
|
2
|
|
—
|
|
2
|
|
|||
|
Mississippi
|
10
|
|
—
|
|
10
|
|
|||
|
Missouri
|
16
|
|
—
|
|
16
|
|
|||
|
Nebraska
|
2
|
|
—
|
|
2
|
|
|||
|
Nevada
|
9
|
|
5
|
|
14
|
|
|||
|
New Jersey
|
10
|
|
—
|
|
10
|
|
|||
|
New Mexico
|
8
|
|
—
|
|
8
|
|
|||
|
New York
|
9
|
|
—
|
|
9
|
|
|||
|
North Carolina
|
9
|
|
—
|
|
9
|
|
|||
|
Ohio
|
20
|
|
—
|
|
20
|
|
|||
|
Oklahoma
|
13
|
|
—
|
|
13
|
|
|||
|
Oregon
|
3
|
|
—
|
|
3
|
|
|||
|
Pennsylvania
|
6
|
|
—
|
|
6
|
|
|||
|
South Carolina
|
8
|
|
—
|
|
8
|
|
|||
|
South Dakota
|
1
|
|
—
|
|
1
|
|
|||
|
Tennessee
|
15
|
|
—
|
|
15
|
|
|||
|
Texas
|
299
|
|
18
|
|
317
|
|
|||
|
Utah
|
4
|
|
—
|
|
4
|
|
|||
|
Virginia
|
17
|
|
—
|
|
17
|
|
|||
|
Washington
|
12
|
|
—
|
|
12
|
|
|||
|
West Virginia
|
1
|
|
—
|
|
1
|
|
|||
|
Wisconsin
|
10
|
|
—
|
|
10
|
|
|||
|
Domestic Total
|
1,004
|
|
23
|
|
1,027
|
|
|||
31
|
International
|
|||||||||
|
Colombia
|
2
|
|
—
|
|
2
|
|
|||
|
Indonesia
|
21
|
|
—
|
|
21
|
|
|||
|
Malaysia
|
2
|
|
—
|
|
2
|
|
|||
|
Mexico
|
60
|
|
—
|
|
60
|
|
|||
|
Philippines
|
11
|
|
—
|
|
11
|
|
|||
|
Saudi Arabia
|
1
|
|
—
|
|
1
|
|
|||
|
Singapore
|
5
|
|
—
|
|
5
|
|
|||
|
United Arab Emirates
|
4
|
|
—
|
|
4
|
|
|||
|
International Total
|
106
|
|
—
|
|
106
|
|
|||
|
Worldwide Total
|
1,110
|
|
23
|
|
1,133
|
|
|||
We are obligated under non-cancelable leases for our company-owned restaurants and our corporate office. Lease terms for company-owned restaurants are generally between five to ten years of original term with an additional five to ten years of tenant option period, often contain rent escalation provisions, and generally require us to pay a proportionate share of real estate taxes, insurance and common area and other operating costs in addition to base or fixed rent.
32
From time to time we may be involved in claims and legal actions that arise in the ordinary course of business. To our knowledge, there are no material pending legal proceedings to which we are a party or of which any of our property is the subject.
Not applicable.
33
On
June 17, 2015
, we completed our initial public offering of our common stock at a public offering price of
$19.00
per share. Our common stock has traded on the NASDAQ Global Market under the symbol “WING” since it began trading on
June 12, 2015
. Before then, there was no public market for our common stock.
The following table sets forth, for the periods indicated, the high and low sales prices per share of our common stock:
|
Common Stock Price Range
|
|||||||
|
High
|
Low
|
||||||
|
Fiscal Year 2016
|
|||||||
|
First quarter (December 27, 2015 - March 26, 2016)
|
$
|
26.42
|
|
$
|
20.73
|
|
|
|
Second quarter (March 27, 2016 - June 25, 2016)
|
$
|
28.67
|
|
$
|
22.01
|
|
|
|
Third quarter (June 26, 2016 - September 24, 2016)
|
$
|
33.10
|
|
$
|
25.24
|
|
|
|
Fourth quarter (September 25, 2016 - December 31, 2016)
|
$
|
33.42
|
|
$
|
26.06
|
|
|
|
Fiscal Year 2017
|
|||||||
|
First quarter (January 1, 2017 - April 1, 2017)
|
$
|
30.04
|
|
$
|
24.74
|
|
|
|
Second quarter (April 2, 2017 - July 1, 2017)
|
$
|
33.25
|
|
$
|
27.29
|
|
|
|
Third quarter (July 2, 2017 - September 30, 2016)
|
$
|
35.91
|
|
$
|
29.54
|
|
|
|
Fourth quarter (October 1, 2017 - December 30, 2017)
|
$
|
43.25
|
|
$
|
31.53
|
|
|
As of
February 23, 2018
, there were
4
shareholders of record of our common stock. This number excludes stockholders whose stock is held in nominee or street name by brokers.
Dividends
In August 2017, we announced that our board of directors authorized a regular dividend program under which we intend to pay quarterly dividends on our common stock, subject to quarterly declarations by our board of directors. A dividend of
$0.07
was announced in both the third and fourth quarters of 2017, which was paid on
September 18, 2017
and
December 19, 2017
, respectively. On
February 22, 2018
, our Board of Directors declared a quarterly dividend of
$0.07
per common share payable on
March 23, 2018
to shareholders of record at the close of business on
March 9, 2018
.
In addition, in July 2016 and February 2018, we paid special cash dividends of $2.90 per share and $3.17 per share, respectively, in connection with refinancings of our credit facilities.
Any future declarations of dividends, as well as the amount and timing of such dividends, is subject to capital availability and the discretion of our board of directors, which must evaluate, among other things, whether cash dividends are in the best interest of our stockholders and are in compliance with all applicable laws and any agreements containing provisions that limit our ability to declare and pay cash dividends, including the restrictions in our senior secured credit facility. For additional information on the restrictions in our senior secured credit facility limiting our ability to pay dividends, see “Management’s Discussion and Analysis of Financial Condition and Results of Operations - Liquidity and Capital Resources.”
Recent Sales of Unregistered Securities
There were no sales of unregistered securities during the fiscal year ended December 30, 2017 that were not previously reported on a Quarterly Report on Form 10-Q or a Current Report on Form 8-K.
Issuer Purchases of Equity Securities
We did not repurchase any of our equity securities during the fourth quarter of the fiscal year ended December 30, 2017.
34
Performance Graph
The following performance graph compares the dollar change in the cumulative shareholder return on our common stock with the cumulative total returns of the NASDAQ Composite Index and the S&P 600 Restaurants Index. This graph assumes a $100 investment in our common stock on
June 12, 2015
(the date when our common stock first started trading) and in each of the foregoing indices on
June 12, 2015
, and assumes the reinvestment of dividends, if any. The indices are included for comparative purposes only. They do not necessarily reflect management’s opinion that such indices are an appropriate measure of the relative performance of our common stock, and historical stock price performance should not be relied upon as an indication of future stock price performance. This graph is furnished and not “filed” with the Securities and Exchange Commission and it is not “soliciting material”, and should not be incorporated by reference in any of our filings under the Securities Act of 1933, as amended, or the Securities Exchange Act of 1934, as amended, whether made before or after the date hereof and irrespective of any general incorporation language in such filing.
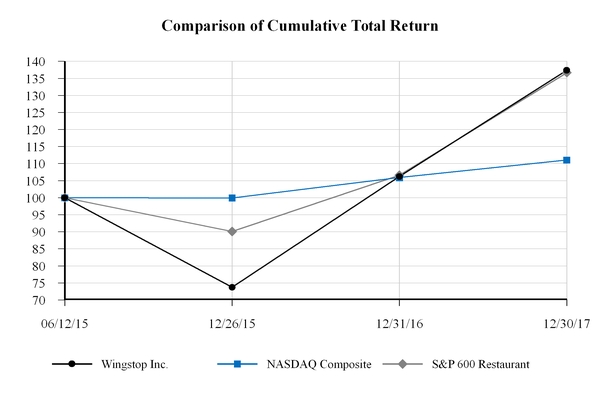
35
The selected historical consolidated financial and other data presented below, with the exception of our key performance indicators, including restaurant counts, same store sales, AUVs, system-wide sales and Adjusted EBITDA, has been derived from the audited consolidated financial statements of Wingstop.
Wingstop utilizes a 52- or 53-week fiscal year that ends on the last Saturday of the calendar year. The fiscal years ended
December 30, 2017
,
December 26, 2015
,
December 27, 2014
, and
December 28, 2013
included 52 weeks, and the fiscal year ended on
December 31, 2016
included 53 weeks. The first three quarters of our fiscal year consist of 13 weeks and our fourth quarter consists of 13 weeks for 52-week fiscal years and 14 weeks for 53-week fiscal years.
The consolidated financial data and other financial data presented below should be read in conjunction with the section entitled “Management’s Discussion and Analysis of Financial Condition and Results of Operations,” and our audited consolidated financial statements and the related notes thereto included elsewhere in this report. Our historical consolidated financial data may not be indicative of our future performance.
|
Year ended
|
|||||||||||||||||||
|
(in thousands)
|
December 30, 2017
|
December 31, 2016
|
December 26, 2015
|
December 27, 2014
|
December 28, 2013
|
||||||||||||||
|
Consolidated Statements of Income Data:
|
|||||||||||||||||||
|
Revenue:
|
|||||||||||||||||||
|
Royalty revenue and franchise fees
|
$
|
68,483
|
|
$
|
57,071
|
|
$
|
46,688
|
|
$
|
38,032
|
|
$
|
30,202
|
|
||||
|
Company-owned restaurant sales
|
37,069
|
|
34,288
|
|
31,281
|
|
29,417
|
|
28,797
|
|
|||||||||
|
Total revenue
|
105,552
|
|
91,359
|
|
77,969
|
|
67,449
|
|
58,999
|
|
|||||||||
|
Cost and expenses:
|
|||||||||||||||||||
|
Cost of sales
|
28,745
|
|
25,308
|
|
22,219
|
|
20,473
|
|
22,176
|
|
|||||||||
|
Selling, general and administrative
|
37,151
|
|
33,840
|
|
33,350
|
|
26,006
|
|
18,913
|
|
|||||||||
|
Depreciation and amortization
|
3,376
|
|
3,008
|
|
2,682
|
|
2,904
|
|
3,030
|
|
|||||||||
|
Total costs and expenses
|
69,272
|
|
62,156
|
|
58,251
|
|
49,383
|
|
44,119
|
|
|||||||||
|
Operating income
|
36,280
|
|
29,203
|
|
19,718
|
|
18,066
|
|
14,880
|
|
|||||||||
|
Interest expense, net
|
5,131
|
|
4,396
|
|
3,477
|
|
3,684
|
|
2,863
|
|
|||||||||
|
Other expense (income), net
|
—
|
|
254
|
|
396
|
|
84
|
|
(6
|
)
|
|||||||||
|
Income before income taxes
|
31,149
|
|
24,553
|
|
15,845
|
|
14,298
|
|
12,023
|
|
|||||||||
|
Income tax expense
|
3,845
|
|
9,119
|
|
5,739
|
|
5,312
|
|
4,493
|
|
|||||||||
|
Net income
|
$
|
27,304
|
|
$
|
15,434
|
|
$
|
10,106
|
|
$
|
8,986
|
|
$
|
7,530
|
|
||||
|
Consolidated Statement of Cash Flows Data:
|
|||||||||||||||||||
|
Net cash provided by operating activities
|
$
|
27,049
|
|
$
|
23,329
|
|
$
|
13,860
|
|
$
|
15,119
|
|
$
|
11,481
|
|
||||
|
Net cash provided by (used in) investing activities
|
(6,484
|
)
|
(2,056
|
)
|
(1,915
|
)
|
(363
|
)
|
(2,144
|
)
|
|||||||||
|
Net cash provided by (used in) financing activities
|
(20,252
|
)
|
(28,213
|
)
|
(10,978
|
)
|
(8,206
|
)
|
(10,417
|
)
|
|||||||||
|
Net increase (decrease) in cash and cash equivalents
|
$
|
313
|
|
$
|
(6,940
|
)
|
$
|
967
|
|
$
|
6,550
|
|
$
|
(1,080
|
)
|
||||
36
|
Year ended
|
|||||||||||||||||||
|
(in thousands)
|
December 30, 2017
|
December 31, 2016
|
December 26, 2015
|
December 27, 2014
|
December 28, 2013
|
||||||||||||||
|
Per Share data:
|
|||||||||||||||||||
|
Earnings per share
|
|||||||||||||||||||
|
Basic
|
$
|
0.94
|
|
$
|
0.54
|
|
$
|
0.37
|
|
$
|
0.35
|
|
$
|
0.30
|
|
||||
|
Diluted
|
$
|
0.93
|
|
$
|
0.53
|
|
$
|
0.36
|
|
$
|
0.34
|
|
$
|
0.29
|
|
||||
|
Weighted average shares outstanding
|
|||||||||||||||||||
|
Basic
|
29,025
|
|
28,637
|
|
27,497
|
|
25,846
|
|
25.168
|
|
|||||||||
|
Diluted
|
29,424
|
|
28,983
|
|
27,816
|
|
26,204
|
|
25.648
|
|
|||||||||
|
Dividends per share
|
$
|
0.14
|
|
$
|
2.90
|
|
$
|
1.83
|
|
$
|
—
|
|
$
|
—
|
|
||||
|
Selected Other Data
(1)
:
|
|||||||||||||||||||
|
Number of system-wide restaurants open at end of period
|
1,133
|
|
998
|
|
845
|
|
712
|
|
614
|
|
|||||||||
|
Number of domestic company restaurants open at end of period
|
23
|
|
21
|
|
19
|
|
19
|
|
24
|
|
|||||||||
|
Number of domestic franchise restaurants open at end of period
|
1,004
|
|
901
|
|
767
|
|
652
|
|
569
|
|
|||||||||
|
Number of international franchise restaurants open at end of period
|
106
|
|
76
|
|
59
|
|
41
|
|
21
|
|
|||||||||
|
System-wide sales
(2)
|
$
|
1,087,434
|
|
$
|
972,270
|
|
$
|
821,248
|
|
$
|
678.771
|
|
$
|
549.904
|
|
||||
|
Domestic restaurant AUV
(3)
|
$
|
1,100
|
|
$
|
1,113
|
|
$
|
1,126
|
|
$
|
1,073
|
|
$
|
974
|
|
||||
|
Company-owned domestic AUV
(3)
|
$
|
1,712
|
|
$
|
1,729
|
|
$
|
1,646
|
|
$
|
1,504
|
|
$
|
1,206
|
|
||||
|
Number of restaurants opened (during period)
|
147
|
|
159
|
|
142
|
|
102
|
|
74
|
|
|||||||||
|
Number of restaurants closed (during period)
|
12
|
|
6
|
|
9
|
|
4
|
|
6
|
|
|||||||||
|
Company-owned restaurants refranchised (during period)
|
(2
|
)
|
—
|
|
—
|
|
5
|
|
—
|
|
|||||||||
|
EBITDA
(4)
|
$
|
39,656
|
|
$
|
31,957
|
|
$
|
22,004
|
|
$
|
20,886
|
|
$
|
17,916
|
|
||||
|
Adjusted EBITDA
(4)
|
$
|
41,507
|
|
$
|
35,576
|
|
$
|
28,879
|
|
$
|
24,378
|
|
$
|
19,495
|
|
||||
|
Same Store Sales Data
(5)
:
|
|||||||||||||||||||
|
System-wide domestic same store sales base (end of period)
|
904
|
|
779
|
|
667
|
|
589
|
|
527
|
|
|||||||||
|
System-wide domestic same store sales growth
|
2.6
|
%
|
3.2
|
%
|
7.9
|
%
|
12.5
|
%
|
9.9
|
%
|
|||||||||
|
As of
|
|||||||||||||||||||
|
(in thousands)
|
December 30, 2017
|
December 31, 2016
|
December 26, 2015
|
December 27, 2014
|
December 28, 2013
|
||||||||||||||
|
Consolidated Balance Sheet Data:
|
|||||||||||||||||||
|
Cash and cash equivalents
|
$
|
4,063
|
|
$
|
3,750
|
|
$
|
10,690
|
|
$
|
9,723
|
|
$
|
3,173
|
|
||||
|
Working capital
|
(2,971
|
)
|
(5,616
|
)
|
7,050
|
|
276
|
|
(3,308
|
)
|
|||||||||
|
Total assets
|
119,836
|
|
111,800
|
|
120,650
|
|
118,827
|
|
113,451
|
|
|||||||||
|
Total debt
|
133,750
|
|
151,250
|
|
95,500
|
|
93,721
|
|
102,500
|
|
|||||||||
|
Total shareholders’ deficit
|
(48,252
|
)
|
(74,628
|
)
|
(9,673
|
)
|
(8,994
|
)
|
(20,262
|
)
|
|||||||||
|
(1)
|
See the definitions of key performance indicators under “Management’s Discussion and Analysis of Financial Condition and Results of Operations - Key Performance Indicators.”
|
|
(2)
|
The percentage of system-wide sales attributable to company-owned restaurants was
3.4%
,
3.5%
,
3.8%
,
4.3%
, and
5.2%
for the fiscal years ended
December 30, 2017
,
December 31, 2016
,
December 26, 2015
,
December 27, 2014
, and
December 28, 2013
, respectively. The remainder was generated by franchised restaurants, as reported by our franchisees.
|
|
(3)
|
Domestic AUV and company-owned domestic AUV are calculated using the 52-week trailing period.
|
|
(4)
|
EBITDA and Adjusted EBITDA are supplemental measures of our performance that are not required by, or presented in accordance with, U.S. GAAP. EBITDA and Adjusted EBITDA are not measurements of our financial performance under U.S. GAAP and should not be considered as an alternative to net income or any other performance measure derived in accordance with U.S. GAAP, or as an alternative to cash flows from operating activities as a measure of our liquidity.
|
We define “EBITDA” as net income before interest expense, net, income tax expense, and depreciation and amortization. We define “Adjusted EBITDA” as EBITDA further adjusted for management fees and expense reimbursement, a management agreement termination fee, transaction costs, gains and losses on the disposal of assets, and stock-based compensation expense. We caution investors that amounts presented in accordance with our definitions of EBITDA and Adjusted EBITDA may not be comparable to similar measures disclosed by our competitors, because not all companies and analysts calculate EBITDA and Adjusted EBITDA in the same manner. We present EBITDA and Adjusted EBITDA
37
because we consider them to be important supplemental measures of our performance and believe they are frequently used by securities analysts, investors and other interested parties in the evaluation of companies in our industry. Management believes that investors’ understanding of our performance is enhanced by including these non-GAAP financial measures as a reasonable basis for comparing our ongoing results of operations. Many investors are interested in understanding the performance of our business by comparing our results from ongoing operations period over period and would ordinarily add back non-cash expenses such as depreciation and amortization, as well as items that are not part of normal day-to-day operations of our business.
Management uses EBITDA and Adjusted EBITDA:
|
•
|
as a measurement of operating performance because they assist us in comparing the operating performance of our restaurants on a consistent basis, as they remove the impact of items not directly resulting from our core operations;
|
|
•
|
for planning purposes, including the preparation of our internal annual operating budget and financial projections;
|
|
•
|
to evaluate the performance and effectiveness of our operational strategies;
|
|
•
|
to evaluate our capacity to fund capital expenditures and expand our business; and
|
|
•
|
to calculate incentive compensation payments for our employees, including assessing performance under our annual incentive compensation plan and determining the vesting of performance shares.
|
By providing these non-GAAP financial measures, together with a reconciliation to the most comparable GAAP measure, we believe we are enhancing investors’ understanding of our business and our results of operations, as well as assisting investors in evaluating how well we are executing our strategic initiatives. Items excluded from these non-GAAP measures are significant components in understanding and assessing financial performance. In addition, the instruments governing our indebtedness use EBITDA (with additional adjustments) to measure our compliance with covenants such as fixed charge coverage, lease adjusted leverage and debt incurrence. EBITDA and Adjusted EBITDA have limitations as analytical tools, and should not be considered in isolation, or as an alternative to or a substitute for, net income or other financial statement data presented in our consolidated financial statements as indicators of financial performance. Some of the limitations are:
|
•
|
such measures do not reflect our cash expenditures or future requirements for capital expenditures or contractual commitments;
|
|
•
|
such measures do not reflect changes in, or cash requirements for, our working capital needs;
|
|
•
|
such measures do not reflect the interest expense, or the cash requirements necessary to service interest or principal payments on our debt;
|
|
•
|
such measures do not reflect our tax expense or the cash requirements to pay our taxes;
|
|
•
|
although depreciation and amortization are non-cash charges, the assets being depreciated and amortized will often have to be replaced in the future, and such measures do not reflect any cash requirements for such replacements; and
|
|
•
|
other companies in our industry may calculate such measures differently than we do, limiting their usefulness as comparative measures.
|
Due to these limitations, EBITDA and Adjusted EBITDA should not be considered as measures of discretionary cash available to us to invest in the growth of our business. We compensate for these limitations by relying primarily on our U.S. GAAP results and using these non-GAAP measures only supplementally. As noted in the table below, Adjusted EBITDA includes adjustments for transaction costs, gains and losses on disposal of assets and stock-based compensation, among other items. It is reasonable to expect that these items will occur in future periods. However, we believe these adjustments are appropriate because the amounts recognized can vary significantly from period to period, do not directly relate to the ongoing operations of our restaurants and complicate comparisons of our internal operating results and operating results of other restaurant companies over time. In addition, Adjusted EBITDA includes adjustments for other items that we do not expect to regularly record, such as transaction costs, management fees and expense reimbursement. Each of the normal recurring adjustments and other adjustments described in this paragraph and in the reconciliation table below help management with a measure of our core operating performance over time by removing items that are not related to day-to-day operations.
38
The following table reconciles EBITDA and Adjusted EBITDA to the most directly comparable U.S. GAAP financial performance measure, which is net income:
|
Year ended
|
|||||||||||||||||||
|
(in thousands)
|
December 30, 2017
|
December 31, 2016
|
December 26, 2015
|
December 27, 2014
|
December 28, 2013
|
||||||||||||||
|
Net income
|
$
|
27,304
|
|
$
|
15,434
|
|
$
|
10,106
|
|
$
|
8,986
|
|
$
|
7,530
|
|
||||
|
Interest expense, net
|
5,131
|
|
4,396
|
|
3,477
|
|
3,684
|
|
2,863
|
|
|||||||||
|
Income tax expense
|
3,845
|
|
9,119
|
|
5,739
|
|
5,312
|
|
4,493
|
|
|||||||||
|
Depreciation and amortization
|
3,376
|
|
3,008
|
|
2,682
|
|
2,904
|
|
3,030
|
|
|||||||||
|
EBITDA
|
$
|
39,656
|
|
$
|
31,957
|
|
$
|
22,004
|
|
$
|
20,886
|
|
$
|
17,916
|
|
||||
|
Adjustments:
|
|||||||||||||||||||
|
Management fees (a)
|
—
|
|
—
|
|
237
|
|
449
|
|
436
|
|
|||||||||
|
Management agreement termination fee (b)
|
—
|
|
—
|
|
3,297
|
|
—
|
|
—
|
|
|||||||||
|
Transaction costs (c)
|
—
|
|
2,388
|
|
2,186
|
|
2,169
|
|
395
|
|
|||||||||
|
Gains and losses on disposal of assets (d)
|
—
|
|
—
|
|
—
|
|
(86
|
)
|
—
|
|
|||||||||
|
Stock-based compensation expense (e)
|
1,851
|
|
1,231
|
|
1,155
|
|
960
|
|
748
|
|
|||||||||
|
Adjusted EBITDA
|
$
|
41,507
|
|
$
|
35,576
|
|
$
|
28,879
|
|
$
|
24,378
|
|
$
|
19,495
|
|
||||
|
(a)
|
Includes management fees and other out-of-pocket expenses paid to Roark Capital Management, LLC.
|
|
(b)
|
Represents a one-time fee of
$3.3 million
that was paid in consideration for the termination of our management agreement with Roark Capital Management during the second quarter of 2015 in connection with our initial public offering. There are no further obligations related to management fees paid to Roark Capital Management.
|
|
(c)
|
Represents costs and expenses related to refinancings of our credit agreement and our public offerings; all transaction costs are included in SG&A with the exception of
$215,000
during the
year ended
December 31, 2016
and
$172,000
during the
year ended
December 26, 2015
that is included in Other expense, net.
|
|
(d)
|
Represents non-cash gains and losses resulting from disposal of company-owned restaurants and associated goodwill write-off.
|
|
(e)
|
Includes non-cash, stock-based compensation.
|
|
(5)
|
We define the domestic same store base to include those domestic restaurants open for at least 52 full weeks. Change in domestic same store sales reflects the change in year-over-year sales for the domestic same store base.
|
39
The following discussion and analysis of our financial condition and results of operations should be read in conjunction with “Item 6 - Selected Consolidated Financial Data” and with the audited consolidated financial statements and the related notes included in “Item 8 - Financial Statements and Supplementary Data.” The statements in this discussion regarding industry outlook, our expectations regarding our future performance, liquidity and capital resources and other non-historical statements in this discussion are forward-looking statements. See Part I “Cautionary Note Regarding Forward-Looking Statements” for a discussion of the uncertainties, risks, and assumptions associated with those statements. These forward-looking statements are subject to risks and uncertainties, including, but not limited to, the risks and uncertainties described in “Item 1A - Risk Factors.” Our actual results may differ materially from those contained in or implied by any forward-looking statements.
We operate on a 52 or 53 week fiscal year ending on the last Saturday of each calendar year. Our fiscal quarters are comprised of 13 weeks, with the exception of the fourth quarter of a 53 week year, which contains 14 weeks. Fiscal year
2017
contains 52 weeks, and fiscal year
2016
contains 53 weeks.
Overview
Wingstop is a high-growth franchisor and operator of restaurants that offers cooked-to-order, hand-sauced and tossed chicken wings.
We believe we pioneered the concept of wings as a “center-of-the-plate” item for all of our meal occasions. While other concepts include wings as add-on menu items or focus on wings in a bar or sports-centric setting, we are focused on wings, fries and sides, which generate approximately
92%
of our system-wide sales.
We offer 11 bold, distinctive and craveable flavors on our bone-in and boneless chicken wings paired with hand-cut, seasoned fries and sides made fresh daily. Our menu is highly-customizable for different dining occasions, and we believe it delivers a compelling value proposition for groups, families, and individuals. We have broad and growing consumer appeal anchored by a sought after core demographic of 18-34 year old Millennials, which we believe is a loyal consumer group that dines at fast casual restaurants more frequently.
Wingstop is the largest fast casual chicken wings-focused restaurant chain in the world and has demonstrated strong, consistent growth. As of
December 30, 2017
, we had a total
1,133
restaurants across
42
states and
nine
countries in our system. Our restaurant base is
98%
franchised, with
1,110
franchised locations (including
106
international locations) and
23
company-owned restaurants.
We plan to grow our business by opening new franchised restaurants and increasing our same store sales, while leveraging our franchise model to create shareholder value.
|
•
|
Domestic restaurant count has increased
73%
since the end of 2013. We believe our domestic unit potential is approximately
2,500
units. Further, we believe there is opportunity to expand our brand internationally to become a top 10 global brand.
|
|
•
|
We had
135
net unit openings in
2017
and ended the year with a domestic development pipeline of
450
total commitments to open new franchised restaurants with approximately
80%
of our current domestic commitments from existing franchisees.
|
|
•
|
Domestic same store sales have increased for
14
consecutive years beginning in 2004, which includes 5-year cumulative domestic same stores sales growth of
36.1%
since fiscal
2013
. We anticipate further increases in domestic same store sales through improvements in brand awareness from national advertising, flavor innovation, increases in digital expansion, and the rollout of delivery.
|
|
•
|
We believe our asset-light, highly-franchised business model generates strong operating margins and requires low capital expenditures, creating shareholder value through strong and consistent free cash flow and capital-efficient growth.
|
Highlights for Fiscal Year
2017
:
|
•
|
System-wide restaurant count increased
13.5%
over the prior year to a total of
1,133
worldwide locations, driven by
135
net unit openings;
|
|
•
|
Domestic same store sales increased
2.6%
over the prior year;
|
|
•
|
Company-owned restaurant same store sales increased
1.6%
over the prior year;
|
|
•
|
System-wide sales increased
11.8%
over the prior year to
$1.1 billion
;
|
|
•
|
Total revenue increased
15.5%
over the prior year to
$105.6 million
;
|
|
•
|
Net income increased
76.9%
over the prior year to
$27.3 million
; and
|
|
•
|
Adjusted EBITDA increased
16.7%
over the prior year to
$41.5 million
;
|
40
In August 2017, we initiated a regular quarterly dividend program, and paid a quarterly dividend of $0.07 per share of common stock in each of September and December 2017.
Key Performance Indicators
Key measures that we use in evaluating our restaurants and assessing our business include the following:
Number of restaurants.
Management reviews the number of new restaurants, the number of closed restaurants, and the number of acquisitions and divestitures of restaurants to assess net new restaurant growth, system-wide sales, royalty and franchise fee revenue and company-owned restaurant sales.
|
Year Ended
|
|||||
|
December 30,
2017 |
December 31,
2016 |
||||
|
Domestic Franchised Activity:
|
|||||
|
Beginning of period
|
901
|
|
767
|
|
|
|
Openings
|
115
|
|
137
|
|
|
|
Closures
|
(10
|
)
|
(3
|
)
|
|
|
Acquired by Company
|
(2
|
)
|
—
|
|
|
|
Restaurants end of period
|
1,004
|
|
901
|
|
|
|
Domestic Company-Owned Activity:
|
|||||
|
Beginning of period
|
21
|
|
19
|
|
|
|
Openings
|
—
|
|
2
|
|
|
|
Closures
|
—
|
|
—
|
|
|
|
Acquired from franchisees
|
2
|
|
—
|
|
|
|
Restaurants end of period
|
23
|
|
21
|
|
|
|
Total Domestic Restaurants
|
1,027
|
|
922
|
|
|
|
International Franchised Activity:
|
|||||
|
Beginning of period
|
76
|
|
59
|
|
|
|
Openings
|
32
|
|
20
|
|
|
|
Closures
|
(2
|
)
|
(3
|
)
|
|
|
Restaurants end of period
|
106
|
|
76
|
|
|
|
Total System-wide Restaurants
|
1,133
|
|
998
|
|
|
System-wide sales.
System-wide sales represents net sales for all of our company-owned and franchised restaurants. This measure allows management to better assess changes in our royalty revenue, our overall store performance, the health of our brand and the strength of our market position relative to competitors. Our system-wide sales growth is driven by new restaurant openings as well as increases in same store sales.
Average unit volume (AUV).
AUV consists of the average annual sales of all restaurants that have been open for a trailing 52-week period or longer. AUV allows management to assess our company-owned and franchised restaurant economics. Our AUV growth is primarily driven by increases in same store sales and is also influenced by opening new restaurants.
Same store sales.
Same store sales reflects the change in year-over-year sales for the same store base. We define the same store base to include those restaurants open for at least 52 full weeks. This measure highlights the performance of existing restaurants, while excluding the impact of new restaurant openings and closures. We review same store sales for company-owned restaurants as well as system-wide restaurants. Same store sales growth is driven by increases in transactions and average transaction size. Transaction size increases are driven by price increases or favorable mix shift from either an increase in items purchased or shifts into higher priced items.
41
Adjusted EBITDA.
We define Adjusted EBITDA as net income before interest expense, net, income tax expense, and depreciation and amortization, with further adjustments for management fees and expense reimbursement,
transaction costs, gains and losses on the disposal of assets, and stock-based compensation expense. Adjusted EBITDA may not be comparable to other similarly titled captions of other companies due to differences in methods of calculation. For a reconciliation of Adjusted EBITDA to net income and a further discussion of how we utilize this non-GAAP financial measure, see “Selected Historical Consolidated Financial and Other Data.”
The following table sets forth our key performance indicators for the fiscal years ended
December 30, 2017
,
December 31, 2016
and
December 26, 2015
(in thousands, except unit data):
|
Year ended
|
|||||||||||
|
December 30, 2017
|
December 31, 2016
|
December 26, 2015
|
|||||||||
|
Number of system-wide restaurants at period end
|
1,133
|
|
998
|
|
845
|
|
|||||
|
System-wide sales
|
$
|
1,087,434
|
|
$
|
972,270
|
|
$
|
821,248
|
|
||
|
Domestic restaurant AUV
|
$
|
1,100
|
|
$
|
1,113
|
|
$
|
1,126
|
|
||
|
System-wide domestic same store sales growth
|
2.6
|
%
|
3.2
|
%
|
7.9
|
%
|
|||||
|
Company-owned domestic same store sales growth
|
1.6
|
%
|
5.4
|
%
|
9.4
|
%
|
|||||
|
Total revenue
|
$
|
105,552
|
|
$
|
91,359
|
|
$
|
77,969
|
|
||
|
Net income
|
$
|
27,304
|
|
$
|
15,434
|
|
$
|
10,106
|
|
||
|
Adjusted EBITDA
|
$
|
41,507
|
|
$
|
35,576
|
|
$
|
28,879
|
|
||
Key Financial Definitions
Revenue.
Our revenue is comprised of the collection of development fees, franchise fees, royalties, other fees associated with franchise and development rights, and sales of wings and other food and beverage products by our company-owned restaurants. The following is a brief description of our components of revenue:
Royalty revenue and franchise fees includes revenue we earn from our franchise business segment in the form of royalties, fees, and vendor contributions and rebates. Royalties consist primarily of fees earned from franchisees equal to a percentage of gross franchise restaurant sales of all restaurants developed under the applicable franchise agreement. The majority of our franchise agreements require our franchise owners to pay us a royalty of
5.0%
of their gross sales net of discounts. Development agreements entered into on or after July 1, 2014 require our franchisees to pay us a royalty of
6.0%
of their gross sales net of discounts. Franchise fees consist of initial development and franchise fees related to new restaurants, master license fees for international territories, fees to renew or extend franchise agreements and transfer fees. Initial franchise fees are recognized upon the opening of a restaurant and are impacted by the number of new franchise store openings in a specified period. Development and territory fees related to an individual restaurant are recognized upon the opening of each individual restaurant. Royalty revenue and franchise fees also include revenue from vendor contributions and rebates that are attributable to system-wide volume purchases and are received for general marketing and other purposes.
Sales from company-owned restaurants are generated through sales of food and beverage at company-owned restaurants.
Cost of sales.
Cost of sales consists of direct food, beverage, paper goods, packaging, labor costs and other restaurant operating costs such as rent, restaurant maintenance costs and property insurance, at our company-owned restaurants. Additionally, a portion of vendor rebates attributable to system-wide volumes purchases are netted against cost of sales. The components of cost of sales are partially variable in nature and fluctuate with changes in sales volume, product mix, menu pricing and commodity costs.
Selling, general and administrative.
SG&A costs consist of wages, benefits, franchise development expenses, other compensation, travel, marketing, accounting fees, legal fees, sponsor management fees and other
expenses related to the infrastructure required to support our franchise and company-owned stores.
Depreciation and amortization.
Depreciation and amortization includes the depreciation of fixed assets, capitalized leasehold improvements and amortization of intangible assets.
Interest expense.
Interest expense includes expenses related to borrowings under our senior secured credit facility and amortization of deferred debt issuance costs.
Income tax expense.
Income tax expense includes current and deferred federal tax expenses as well as state and local income taxes.
42
Results of Operations
The following table presents the Consolidated Statement of Operations for the past three fiscal years expressed as a percentage of revenue.
|
Fiscal Year
|
||||||||
|
December 30,
2017 |
December 31,
2016 |
December 26,
2015 |
||||||
|
Revenue:
|
||||||||
|
Royalty revenue and franchise fees
|
64.9
|
%
|
62.5
|
%
|
59.9
|
%
|
||
|
Company-owned restaurant sales
|
35.1
|
%
|
37.5
|
%
|
40.1
|
%
|
||
|
Total revenue
|
100.0
|
%
|
100.0
|
%
|
100.0
|
%
|
||
|
Costs and expenses:
|
||||||||
|
Cost of sales
(1)
|
77.5
|
%
|
73.8
|
%
|
71.0
|
%
|
||
|
Selling, general and administrative
|
35.2
|
%
|
37.0
|
%
|
42.8
|
%
|
||
|
Depreciation and amortization
|
3.2
|
%
|
3.3
|
%
|
3.4
|
%
|
||
|
Total costs and expenses
|
65.6
|
%
|
68.0
|
%
|
74.7
|
%
|
||
|
Operating income
|
34.4
|
%
|
32.0
|
%
|
25.3
|
%
|
||
|
Interest expense, net
|
4.9
|
%
|
4.8
|
%
|
4.5
|
%
|
||
|
Other (income) expense, net
|
—
|
%
|
0.3
|
%
|
0.5
|
%
|
||
|
Income before income taxes
|
29.5
|
%
|
26.9
|
%
|
20.3
|
%
|
||
|
Income tax expense
|
3.6
|
%
|
10.0
|
%
|
7.4
|
%
|
||
|
Net income
|
25.9
|
%
|
16.9
|
%
|
13.0
|
%
|
||
(1)
As a percentage of company-owned restaurant sales. Exclusive of depreciation and amortization, shown separately. The percentages reflected have been subject to rounding adjustments. Accordingly, figures expressed as percentages when aggregated may not be the arithmetic aggregation of the percentages that precede them.
43
Year ended
December 30, 2017
compared to year ended
December 31, 2016
The following table sets forth information comparing the components of net income in fiscal year
2017
and fiscal year
2016
(in thousands):
|
Year ended
|
Increase / (Decrease)
|
|||||||||||||
|
December 30,
2017 |
December 31,
2016 |
$
|
%
|
|||||||||||
|
Revenue:
|
||||||||||||||
|
Royalty revenue and franchise fees
|
$
|
68,483
|
|
$
|
57,071
|
|
$
|
11,412
|
|
20.0
|
%
|
|||
|
Company-owned restaurant sales
|
37,069
|
|
34,288
|
|
2,781
|
|
8.1
|
%
|
||||||
|
Total revenue
|
105,552
|
|
91,359
|
|
14,193
|
|
15.5
|
%
|
||||||
|
Costs and expenses:
|
|
|
|
|
||||||||||
|
Cost of sales
(1)
|
28,745
|
|
25,308
|
|
3,437
|
|
13.6
|
%
|
||||||
|
Selling, general and administrative
|
37,151
|
|
33,840
|
|
3,311
|
|
9.8
|
%
|
||||||
|
Depreciation and amortization
|
3,376
|
|
3,008
|
|
368
|
|
12.2
|
%
|
||||||
|
Total costs and expenses
|
69,272
|
|
62,156
|
|
7,116
|
|
11.4
|
%
|
||||||
|
Operating income
|
36,280
|
|
29,203
|
|
7,077
|
|
24.2
|
%
|
||||||
|
Interest expense, net
|
5,131
|
|
4,396
|
|
735
|
|
16.7
|
%
|
||||||
|
Other expense, net
|
—
|
|
254
|
|
(254
|
)
|
(100.0
|
)%
|
||||||
|
Income before income tax expense
|
31,149
|
|
24,553
|
|
6,596
|
|
26.9
|
%
|
||||||
|
Income tax expense
|
3,845
|
|
9,119
|
|
(5,274
|
)
|
(57.8
|
)%
|
||||||
|
Net income
|
$
|
27,304
|
|
$
|
15,434
|
|
$
|
11,870
|
|
76.9
|
%
|
|||
(1)
Exclusive of depreciation and amortization, shown separately.
Total revenue.
Total revenue was
$105.6 million
in fiscal year
2017
,
an increase
of
$14.2 million
, or
15.5%
, compared to
$91.4 million
in the prior fiscal year.
Royalty revenue and franchise fees.
Royalty revenue and franchise fees were
$68.5 million
in fiscal year
2017
,
an increase
of
$11.4 million
, or
20.0%
, compared to
$57.1 million
in the prior fiscal year. Royalty revenue
increased
by
$6.4 million
primarily due to
147
franchise restaurant openings and domestic same store sales growth of
2.6%
, partially offset by revenue of approximately $0.9 million related to the 53rd week in
2016
. Other revenue increased
$4.8 million
primarily due to an increase in vendor rebates, including a one-time payment, based on system-wide volumes purchased in the prior year, received in conjunction with a new vendor agreement that was executed during the first quarter of 2017. The funding from this agreement was primarily used to support our national advertising campaign.
Company-owned restaurant sales.
Company-owned restaurant sales were
$37.1 million
in fiscal year
2017
,
an increase
of
$2.8 million
, or
8.1%
, compared to
$34.3 million
in the prior fiscal year. The increase is the result of the acquisition of
two
company-owned restaurants from a franchisee in the third quarter of
2017
and company-owned domestic same store sales growth of
1.6%
, driven by an increase in transactions, partially offset by revenue of approximately $0.6 million related to the 53rd week in
2016
.
Cost of sales.
Cost of sales was
$28.7 million
in fiscal year
2017
,
an increase
of
$3.4 million
, or
13.6%
, compared to
$25.3 million
in the prior fiscal year. Cost of sales as a percentage of company-owned restaurant sales was
77.5%
in fiscal year
2017
compared to
73.8%
in the prior fiscal year.
44
The table below presents the major components of Cost of sales (in thousands):
|
Year ended
|
As a % of company-owned restaurant sales
|
Year ended
|
As a % of company-owned restaurant sales
|
||||||||||
|
December 30,
2017 |
December 31,
2016 |
||||||||||||
|
Cost of sales:
|
|||||||||||||
|
Food, beverage and packaging costs
|
14,810
|
|
40.0
|
%
|
12,827
|
|
37.4
|
%
|
|||||
|
Labor costs
|
8,878
|
|
23.9
|
%
|
7,680
|
|
22.4
|
%
|
|||||
|
Other restaurant operating expenses
|
6,004
|
|
16.2
|
%
|
5,760
|
|
16.8
|
%
|
|||||
|
Vendor rebates
|
(947
|
)
|
(2.6
|
)%
|
(959
|
)
|
(2.8
|
)%
|
|||||
|
Total cost of sales
|
$
|
28,745
|
|
77.5
|
%
|
$
|
25,308
|
|
73.8
|
%
|
|||
Food, beverage and packaging costs as a percentage of company-owned restaurant sales were
40.0%
in fiscal year
2017
compared to
37.4%
in the prior fiscal year. The increase is primarily due to an
18.0%
increase
in commodities rates for bone-in chicken wings compared to the prior fiscal year.
Labor costs as a percentage of company-owned restaurant sales were
23.9%
in fiscal year
2017
compared to
22.4%
in the prior fiscal year. The increase as a percentage of company-owned restaurant sales is primarily due to investments in roster sizes and staffing we made in the third and fourth quarters of fiscal year 2016 to support the continued sales growth in our company-owned restaurants.
Other restaurant operating expenses as a percentage of company-owned restaurant sales were
16.2%
in fiscal year
2017
compared to
16.8%
in the prior fiscal year. The decrease as a percentage of company-owned restaurant sales is primarily due to a decrease in repairs and maintenance expenses, as well as a decrease in pre-opening expenses associated with the opening of
two
company-owned restaurants in the prior fiscal year.
Selling, general and administrative.
SG&A expense was
$37.2 million
in fiscal year
2017
,
an increase
of
$3.3 million
, or
9.8%
, compared to
$33.8 million
in the prior fiscal year. The increase in SG&A expense is primarily due to an increase in voluntary contributions of
$3.2 million
made to the advertising fund, including a one-time payment made in conjunction with a new vendor agreement executed during the first quarter of 2017, which provided support for the Company’s national advertising campaign. SG&A expense also increased due to planned headcount additions and an increase in stock based compensation and travel expenses. These increases are partially offset by a decrease in nonrecurring expenses of $2.2 million related to the refinancing of our credit agreement and expenses related to the special dividend, which occurred in the prior fiscal year, as well as a decrease in incremental costs of approximately $0.6 million related to the 53rd week in 2016.
Depreciation and amortization.
Depreciation and amortization was
$3.4 million
in fiscal year
2017
,
an increase
of
$0.4 million
, or
12.2%
, compared to
$3.0 million
in the prior fiscal year. The increase in depreciation is primarily due to the capital expenditures during the period, including the acquisition of two company-owned locations.
Interest expense, net.
Interest expense was
$5.1 million
in fiscal year
2017
,
an increase
of
$0.7 million
, or
16.7%
, from
$4.4 million
in the prior fiscal year. The increase is primarily due to an increase in the principal amount of indebtedness we had outstanding and the applicable interest rate related to the refinancing of our credit agreement in June 2016.
Income tax expense.
Income tax expense was
$3.8 million
in fiscal year
2017
, yielding an effective tax rate of
12.3%
, compared to an effective tax rate of
37.1%
in the prior fiscal year. The income tax provision for fiscal year
2017
included a benefit of approximately
$5.5 million
, primarily associated with the revaluation of deferred tax liabilities as a result of the enactment of the Tax Cuts and Jobs Act on December 22, 2017, which reduced the federal corporate income tax rate from
35%
to
21%
effective January 1, 2018. Additionally, tax benefits of
$2.5 million
were realized in fiscal year
2017
resulting from the recognition of excess tax benefits from share-based compensation in income tax expense rather than paid-in capital as a result of the adoption of a new accounting standard.
45
Segment results.
The following table sets forth our revenue and operating profit for each of our segments for the period presented (in thousands):
|
Year Ended
|
Increase / (Decrease)
|
|||||||||||||
|
December 30,
2017 |
December 31,
2016 |
$
|
%
|
|||||||||||
|
Revenue:
|
||||||||||||||
|
Franchise segment
|
$
|
68,483
|
|
$
|
57,071
|
|
$
|
11,412
|
|
20.0
|
%
|
|||
|
Company segment
|
37,069
|
|
34,288
|
|
2,781
|
|
8.1
|
%
|
||||||
|
Total segment revenue
|
$
|
105,552
|
|
$
|
91,359
|
|
$
|
14,193
|
|
15.5
|
%
|
|||
|
|
|
|||||||||||||
|
Segment Profit:
|
|
|
||||||||||||
|
Franchise segment
|
$
|
31,637
|
|
$
|
25,850
|
|
$
|
5,787
|
|
22.4
|
%
|
|||
|
Company segment
|
4,643
|
|
5,526
|
|
(883
|
)
|
(16.0
|
)%
|
||||||
|
Total segment profit
|
$
|
36,280
|
|
$
|
31,376
|
|
$
|
4,904
|
|
15.6
|
%
|
|||
Franchise segment.
Franchise segment revenue was
$68.5 million
in fiscal year
2017
, an increase of
$11.4 million
, or
20.0%
, from
$57.1 million
in the prior fiscal year. Royalty revenue
increased
by
$6.4 million
primarily due to
147
franchise restaurant openings and domestic same store sales growth of
2.6%
during the current fiscal year, partially offset by revenue of approximately $0.9 million related to the 53rd week in 2016. Other revenue increased
$4.8 million
primarily due to an increase in vendor rebates, including a one-time payment, based on system-wide volumes purchased in the prior year, received under a new vendor agreement executed during the first quarter of 2017.
Franchise segment profit was
$31.6 million
in fiscal year
2017
, an increase of
$5.8 million
, or
22.4%
, from
$25.9 million
in the prior fiscal year primarily due to the growth in revenue.
Company Segment.
Company-owned restaurant sales were
$37.1 million
in fiscal year
2017
, an increase of
$2.8 million
, or
8.1%
, compared to
$34.3 million
in the prior fiscal year. The increase is primarily due to the opening of
two
company-owned restaurants during the third quarter of the current fiscal year and company-owned domestic same store sales growth of
1.6%
, driven by an increase in transactions, partially offset by revenue of approximately $0.6 million related to the 53rd week in 2016.
Company segment profit was
$4.6 million
in fiscal year
2017
,
a decrease
of
$0.9 million
, or
16.0%
, compared to
$5.5 million
in the prior fiscal year. The decrease is primarily due to an
18.0%
increase
in commodities rates for bone-in chicken wings and investments in roster sizes and staffing to support the continued sales growth in our company-owned restaurants. The decrease is partially offset by the company-owned comparable same store sales increase of
1.6%
, as well as a decrease in repairs and maintenance and pre-opening expenses.
46
Year ended
December 31, 2016
compared to year ended
December 26, 2015
The following table sets forth information comparing the components of net income in fiscal year
2016
and fiscal year
2015
(in thousands):
|
Year ended
|
Increase / (Decrease)
|
|||||||||||||
|
December 31,
2016 |
December 26,
2015 |
$
|
%
|
|||||||||||
|
Revenue:
|
||||||||||||||
|
Royalty revenue and franchise fees
|
$
|
57,071
|
|
$
|
46,688
|
|
$
|
10,383
|
|
22.2
|
%
|
|||
|
Company-owned restaurant sales
|
34,288
|
|
31,281
|
|
3,007
|
|
9.6
|
%
|
||||||
|
Total revenue
|
91,359
|
|
77,969
|
|
13,390
|
|
17.2
|
%
|
||||||
|
Costs and expenses:
|
||||||||||||||
|
Cost of sales
(1)
|
25,308
|
|
22,219
|
|
3,089
|
|
13.9
|
%
|
||||||
|
Selling, general and administrative
|
33,840
|
|
33,350
|
|
490
|
|
1.5
|
%
|
||||||
|
Depreciation and amortization
|
3,008
|
|
2,682
|
|
326
|
|
12.2
|
%
|
||||||
|
Total costs and expenses
|
62,156
|
|
58,251
|
|
3,905
|
|
6.7
|
%
|
||||||
|
Operating income
|
29,203
|
|
19,718
|
|
9,485
|
|
48.1
|
%
|
||||||
|
Interest expense, net
|
4,396
|
|
3,477
|
|
919
|
|
26.4
|
%
|
||||||
|
Other expense, net
|
254
|
|
396
|
|
(142
|
)
|
(35.9
|
)%
|
||||||
|
Income before income tax expense
|
24,553
|
|
15,845
|
|
8,708
|
|
55.0
|
%
|
||||||
|
Income tax expense
|
9,119
|
|
5,739
|
|
3,380
|
|
58.9
|
%
|
||||||
|
Net income
|
$
|
15,434
|
|
$
|
10,106
|
|
$
|
5,328
|
|
52.7
|
%
|
|||
(1) Exclusive of depreciation and amortization, shown separately.
Total revenue.
Total revenue was
$91.4 million
in fiscal year
2016
,
an increase
of
$13.4 million
, or
17.2%
, compared to
$78.0 million
in the prior fiscal year.
Royalty revenue and franchise fees.
Royalty revenue and franchise fees were
$57.1 million
in fiscal year
2016
,
an increase
of
$10.4 million
, or
22.2%
, compared to
$46.7 million
in the prior fiscal year. Royalty revenue
increased
by
$8.3 million
primarily due to
157
franchise restaurant openings, domestic same store sales growth of
3.2%
, and approximately
$0.9 million
of additional revenue from the 53rd week. Franchise fees
increased
by
$0.7 million
driven by
15
additional franchise restaurant openings in
2016
compared to restaurant openings in
2015
. Other revenue
increased
$1.4 million
primarily due to contributions received for our franchisee convention. The convention is held every 18 months, and there was no convention in 2015.
Company-owned restaurant sales.
Company-owned restaurant sales were
$34.3 million
in fiscal year
2016
,
an increase
of
$3.0 million
, or
9.6%
, compared to
$31.3 million
in the prior fiscal year. The increase is the result of company-owned domestic same store sales growth of
5.4%
, resulting primarily from an increase in transaction counts, the addition of two company-owned restaurants during 2016, and approximately
$0.6 million
of additional revenue from the 53rd week.
Cost of sales.
Cost of sales was
$25.3 million
in fiscal year
2016
,
an increase
of
$3.1 million
, or
13.9%
, compared to
$22.2 million
in the prior fiscal year. Cost of sales as a percentage of company-owned restaurant sales was
73.8%
in fiscal year
2016
compared to
71.0%
in the prior fiscal year.
47
The table below presents the major components of cost of sales (in thousands):
|
Year ended
|
As a % of company-owned restaurant sales
|
Year ended
|
As a % of company-owned restaurant sales
|
||||||||||
|
December 31,
2016 |
December 26,
2015 |
||||||||||||
|
Cost of sales:
|
|||||||||||||
|
Food, beverage and packaging costs
|
12,827
|
|
37.4
|
%
|
11,504
|
|
36.8
|
%
|
|||||
|
Labor costs
|
7,680
|
|
22.4
|
%
|
6,493
|
|
20.8
|
%
|
|||||
|
Other restaurant operating expenses
|
5,760
|
|
16.8
|
%
|
4,956
|
|
15.8
|
%
|
|||||
|
Vendor rebates
|
(959
|
)
|
(2.8
|
)%
|
(734
|
)
|
(2.3
|
)%
|
|||||
|
Total cost of sales
|
$
|
25,308
|
|
73.8
|
%
|
$
|
22,219
|
|
71.0
|
%
|
|||
Food, beverage and packaging costs as a percentage of company-owned restaurant sales were
37.4%
in fiscal year
2016
compared to
36.8%
in the prior fiscal year. The increase is primarily due to a
4.4%
increase
in commodities rates for bone-in chicken wings compared to the prior fiscal year and an increase in the average size of chicken wings.
Labor costs as a percentage of company-owned restaurant sales were
22.4%
in fiscal year
2016
compared to
20.8%
in the prior fiscal year. The increase as a percentage of company-owned restaurant sales is primarily due to investments in roster sizes and staffing to support the continued sales growth in our company-owned restaurants, as well as the ramp up of two company-owned restaurants that opened during 2016 as they achieve normal efficiency.
Other restaurant operating expenses as a percentage of company-owned restaurant sales were
16.8%
in fiscal year
2016
compared to
15.8%
in the prior fiscal year. The increase as a percentage of company-owned restaurant sales is primarily due to increased rent expense and pre-opening expenses associated with the opening of two company-owned restaurants.
Vendor rebates
increased
$0.2 million
primarily due to contributions received from vendors during the second quarter of 2016 related to the franchisee convention.
Selling, general and administrative.
SG&A expense was
$33.8 million
in fiscal year
2016
,
an increase
of
$0.5 million
, or
1.5%
, compared to
$33.4 million
in the prior fiscal year. The increase is primarily due to $1.1 million in expenses related to the franchisee convention, incremental costs of
$0.6 million
related to the 53rd week, and increases related to headcount additions and other recurring costs associated with being a public company incurred in the current fiscal year. These increases in SG&A are offset by a one-time fee of
$3.3 million
, paid in consideration for the termination of our management agreement with Roark Capital Management in the prior fiscal year.
Depreciation and amortization.
Depreciation and amortization was
$3.0 million
in fiscal year
2016
,
an increase
of
$0.3 million
, or
12.2%
, compared to
$2.7 million
in the prior fiscal year. The increase in depreciation is primarily due to capital expenditures during the period.
Interest expense, net.
Interest expense was
$4.4 million
in fiscal year
2016
,
an increase
of
$0.9 million
, or
26.4%
, from
$3.5 million
in the prior fiscal year. The increase is primarily due to an increase in the principal amount of indebtedness we had outstanding and the applicable interest rate related to the refinancing of our credit agreement in June 2016.
Income tax expense.
Income tax expense was
$9.1 million
in fiscal year
2016
, yielding an effective tax rate of
37.1%
, compared to an effective tax rate of
36.2%
in the prior fiscal year. The increase in the rate is largely driven by an increase in the effective state rate, driven by a shift in state apportionment rates and total revenue mix.
48
Segment results.
The following table sets forth our revenue and operating profit for each of our segments for the period presented (in thousands):
|
Year Ended
|
Increase / (Decrease)
|
|||||||||||||
|
December 31,
2016 |
December 26,
2015 |
$
|
%
|
|||||||||||
|
Revenue:
|
||||||||||||||
|
Franchise segment
|
$
|
57,071
|
|
$
|
46,688
|
|
$
|
10,383
|
|
22.2
|
%
|
|||
|
Company segment
|
34,288
|
|
31,281
|
|
3,007
|
|
9.6
|
%
|
||||||
|
Total segment revenue
|
$
|
91,359
|
|
$
|
77,969
|
|
$
|
13,390
|
|
17.2
|
%
|
|||
|
|
|
|||||||||||||
|
Segment Profit:
|
|
|
||||||||||||
|
Franchise segment
|
$
|
25,850
|
|
$
|
19,701
|
|
$
|
6,149
|
|
31.2
|
%
|
|||
|
Company segment
|
5,526
|
|
5,737
|
|
(211
|
)
|
(3.7
|
)%
|
||||||
|
Total segment profit
|
$
|
31,376
|
|
|
$
|
25,438
|
|
$
|
5,938
|
|
23.3
|
%
|
||
Franchise segment.
Franchise segment revenue was
$57.1 million
in fiscal year
2016
,
an increase
of
$10.4 million
, or
22.2%
, from
$46.7 million
in the prior fiscal year. The
increase
is primarily due to
157
franchise restaurant openings and domestic same store sales growth of
3.2%
during the current fiscal year, as well as approximately
$0.9 million
of additional revenue from the 53rd week.
Franchise segment profit was
$25.9 million
in fiscal year
2016
, an
increase
of
$6.1 million
, or
31.2%
, from
$19.7 million
in the prior fiscal year due to the growth in revenue offset by increases in SG&A, including
$1.1 million
in expenses related to the franchisee convention, expenses related to the 53rd week, and increases related to headcount additions and other recurring costs associated with being a public company incurred in the current fiscal year.
Company Segment.
Company-owned restaurant sales were
$34.3 million
in fiscal year
2016
,
an increase
of
$3.0 million
, or
9.6%
, compared to
$31.3 million
in the prior fiscal year. The
increase
is primarily due to company-owned domestic same store sales growth of
5.4%
,
resulting primarily from an increase in transaction counts,
the opening of two company-owned restaurants during the current fiscal year, as well as approximately
$0.6 million
of additional revenue from the 53rd week.
Company segment profit was
$5.5 million
in fiscal year
2016
,
a decrease
of
$0.2 million
, or
3.7%
, compared to
$5.7 million
in the prior fiscal year. The
decrease
is primarily due to an increase in the average size of wings as well as a
4.4%
increase in commodities rates for bone-in chicken wings and investments in roster sizes and staffing to support the continued sales growth in our company-owned restaurants, as well as pre-opening costs and the ramp up of two company-owned restaurants that opened during 2016 as they achieve normal efficiency. The
decrease
is partially offset by the company-owned comparable same store sales increase of
5.4%
.
Liquidity and Capital Resources
General.
Our primary sources of liquidity and capital resources are cash provided from operating activities, cash and cash equivalents on hand, and proceeds from the incurrence of debt. Our primary requirements for liquidity and capital are working capital and general corporate needs. Historically, we have operated with minimal positive working capital or with negative working capital. We believe that our sources of liquidity and capital will be sufficient to finance our continued operations and growth strategy.
The following table shows summary cash flows information for the fiscal years
2017
,
2016
and
2015
(in thousands):
|
Year ended
|
|||||||||||
|
December 30,
2017 |
December 31,
2016 |
December 26,
2015 |
|||||||||
|
Net cash provided by (used in):
|
|||||||||||
|
Operating activities
|
27,049
|
|
23,329
|
|
13,860
|
|
|||||
|
Investing activities
|
(6,484
|
)
|
(2,056
|
)
|
(1,915
|
)
|
|||||
|
Financing activities
|
(20,252
|
)
|
(28,213
|
)
|
(10,978
|
)
|
|||||
|
Net change in cash and cash equivalents
|
$
|
313
|
|
$
|
(6,940
|
)
|
$
|
967
|
|
||
49
Operating activities
. Our cash flows from operating activities are driven by sales at both franchise restaurants and company-owned restaurants, as well as franchise and development fees. We collect franchise royalties from our franchise owners on a weekly basis. Restaurant-level operating costs at our company-owned restaurants, unearned franchise and development fees and corporate overhead costs also impact our cash flows from operating activities.
Net cash
provided by
operating activities was
$27.0 million
in fiscal year
2017
,
an increase
of
$3.7 million
, from
$23.3 million
in fiscal year
2016
. The increase was primarily due to an increase in net income, offset by timing of changes in working capital.
Net cash
provided by
operating activities was
$23.3 million
in fiscal year
2016
,
an increase
of
$9.5 million
, from
$13.9 million
in fiscal year
2015
primarily due to increased net income over the prior year, and the timing of changes in working capital.
Investing activities
. Our net cash
used in
investing activities was
$6.5 million
in fiscal year
2017
,
an increase
of
$4.4 million
, from
$2.1 million
in fiscal year
2016
. The increase was due to cash paid for the acquisition of two restaurants from a franchisee during the third quarter 2017, as well as an increase in capital expenditures over the prior year.
Net cash
used in
investing activities was
$2.1 million
in fiscal year
2016
,
an increase
of
$0.1 million
, from
$1.9 million
in fiscal year
2015
. The
increase
in the use of cash was due to an increase in capital expenditures over the comparable period primarily driven by opening two corporate restaurants.
Financing activities
. Our net cash
used in
financing activities was
$20.3 million
in fiscal year
2017
,
a decrease
of
$8.0 million
, from
$28.2 million
in fiscal year
2016
. In fiscal year
2016
, we paid a special dividend of
$83.3 million
in connection with the refinancing of our credit agreement, which was funded by net borrowings of
$55.8 million
. In fiscal year
2017
, we paid regular dividends of
$4.1 million
and net payments of
$17.5 million
on our long-term debt.
Our net cash
used in
financing activities was
$28.2 million
in fiscal year
2016
,
an increase
of
$17.2 million
, from
$11.0 million
in fiscal year
2015
. The
increase
was due to
increased
special cash dividend payments to stockholders of
$35.3 million
over the prior year amount paid. This was partially offset by
an increase
in net borrowings of
$54.0 million
in
2016
, compared to $34.7 million in net proceeds from the sale of common stock in our IPO in
2015
.
Senior secured credit facilities
. In
June 2016
, the Company entered into a
$180.0 million
new senior secured credit facility (the “2016 Facility”), which replaced the Company’s second amended and restated credit facility dated March 18, 2015 (the “2015 Facility”). The aggregate 2016 Facility size was
$180.0 million
, and was comprised of a
$70.0 million
term loan and a
$110.0 million
revolving credit facility. We used the proceeds from the 2016 Facility and cash on hand to refinance
$85.5 million
of indebtedness under the 2015 Facility and to pay a special dividend of
$83.3 million
to our stockholders. Borrowings under the 2016 Facility bore interest, payable quarterly, at the base rate plus a margin (
1.00%
to
2.00%
, dependent on our reported leverage ratio) or LIBOR plus a margin (
2.00%
to
3.00%
, dependent on our reported leverage ratio), at the Company’s discretion. The 2016 Facility had a maturity date of
June 2021
.
We made payments of
$21.0 million
and borrowings of
$3.5 million
on the 2016 Facility in
2017
. As of
December 30, 2017
, we were in compliance with all of the financial and non-financial covenants under the 2016 Facility, including the fixed charge coverage and leverage requirements.
On January 30, 2018, we entered into an amended $250 million senior secured credit facility (the “2018 Facility”), which replaced the 2016 Facility. The 2018 Facility consists of a term loan facility in the aggregate amount of $100 million and a revolving credit facility up to an aggregate amount of $150 million. The 2018 Facility has a five year term and matures on January 30, 2023.
In connection with the entry into the 2018 Facility, we utilized approximately $230 million of proceeds from the 2018 Facility to refinance approximately $134 million of indebtedness under the 2016 Facility and to pay a special cash dividend of approximately $95 million to our stockholders.
The 2018 Facility bears interest, at our option, at either the prime rate plus an applicable margin ranging from 0.75% to 1.75% or at an adjusted LIBOR rate plus an applicable margin ranging from 1.75% to 2.75%, in each case based on our lease adjusted leverage ratio. Failure to comply with these covenants in the future could cause an acceleration of outstanding amounts under the term loan and revolver and restrict us from borrowing under the revolving credit facility to fund our liquidity requirements.
The 2018 Facility is secured by a first-priority security interest in substantially all of our assets. Obligations under the 2018 Facility are guaranteed by the Company and its subsidiaries. The 2018 Facility also requires compliance with certain financial and non-financial covenants, including a specified lease adjusted leverage ratio and a specified fixed charge coverage ratio.
50
Dividends
. In August 2017, we announced that our board of directors authorized a regular dividend program under which we intend to pay quarterly dividends on our common stock, subject to quarterly declarations by our board of directors. A dividend of
$0.07
was announced during each of the second and third quarters of 2017, which was paid on
September 18, 2017
and
December 19, 2017
, respectively.
On
February 22, 2018
, our Board of Directors declared a quarterly dividend of
$0.07
per common share payable on
March 23, 2018
to stockholders of record at the close of business on
March 9, 2018
. In addition, in July 2016 and February 2018, we paid special cash dividends of
$2.90
per share and
$3.17
per share, respectively, in connection with refinancings of our credit facilities.
We do not currently expect the restrictions in the 2018 Facility to impact our ability to make regularly quarterly dividends pursuant to our quarterly dividend program. However, any future declarations of dividends, as well as the amount and timing of such dividends, is subject to capital availability and the discretion of our board of directors, which must evaluate, among other things, whether cash dividends are in the best interest of our stockholders.
Contractual Obligations
The following table sets forth our contractual obligations and commercial commitments as of
December 30, 2017
(in thousands):
|
|
Payments due by period
|
||||||||||||||
|
|
Fiscal year 2018
|
Fiscal years 2019-2020
|
Fiscal years 2021-2022
|
Thereafter
|
|||||||||||
|
Senior credit facility
|
$
|
3,500
|
|
$
|
6,125
|
|
$
|
124,125
|
|
$
|
—
|
|
|||
|
Operating leases
(a)
|
1,783
|
|
2,997
|
|
2,508
|
|
4,037
|
|
|||||||
|
Interest payments
|
4,926
|
|
8,309
|
|
2,293
|
|
—
|
|
|||||||
|
Total
|
$
|
10,209
|
|
$
|
17,431
|
|
$
|
128,926
|
|
$
|
4,037
|
|
|||
(a)
Includes base lease terms and certain optional renewal periods that are included in the lease term in accordance with accounting guidance related to leases.
Indemnifications.
We are parties to certain indemnifications to third parties in the ordinary course of business. The probability of incurring an actual liability under such indemnifications is sufficiently remote so that no liability has been recorded.
Off-Balance Sheet Arrangements
At
December 30, 2017
, we did not have any off-balance sheet arrangements, except for leases.
Critical Accounting Policies and Estimates
Our consolidated financial statements and accompanying notes are prepared in accordance with GAAP. Preparing consolidated financial statements requires us to make estimates and assumptions that affect the reported amounts of assets, liabilities, revenues and expenses. These estimates and assumptions are affected by the application of our accounting policies. Critical accounting estimates are those that require application of management’s most difficult, subjective or complex judgments, often as a result of matters that are inherently uncertain and may change in subsequent periods. While we apply our judgment based on assumptions believed to be reasonable under the circumstances, actual results could vary from these assumptions. It is possible that materially different amounts would be reported using different assumptions. Our critical accounting policies and estimates are more fully described in Note 1 to our consolidated financial statements. However, we believe the accounting policies described below are particularly important to the portrayal and understanding of our financial position and results of operations.
Revenue Recognition
Revenues consist of sales from franchise and development fees, international territory fees, franchise royalties and company-owned stores. Franchise fees are recognized as revenue when all material services or conditions relating to the store have been substantially performed or satisfied by WRI, which is typically when a franchised store begins operations. Development fees for the right to develop a store are recognized as revenue when all material services or conditions relating to the sale have been substantially performed, which is typically when the franchised store begins operations. International territory fees and development fees determined based on the number of stores to open in an area are deferred and recognized as revenue on a pro rata basis at the same time the individual franchise fee is recognized, typically when individual stores are opened. Franchise fee, development fee and international territory fee payments received by WRI before the restaurant opens are recorded as deferred revenue in the Consolidated Balance Sheets.
51
Continuing royalties, which are a percentage of net sales of the franchisee, are recognized as revenue when earned. The Company records food and beverage revenues from company-owned stores upon sale to the customer. The Company collects and remits sales, food and beverage, alcoholic beverage and hospitality taxes on transactions with customers and reports such amounts under the net method in its Consolidated Statements of Operations. Accordingly, these taxes are not included in gross revenue.
Our revenue recognition policies will be impacted by new guidance for revenue recognition beginning in fiscal year 2018. See “Recently Issued Accounting Standards” in Note 1 to our consolidated financial statements for further discussion.
Advertising Expenses
WRI administers the Wingstop Restaurants Advertising Fund (“Ad Fund”), for which WRI collects a percentage of gross sales from Wingstop restaurant franchisees and WRI-owned restaurants to be used for various forms of advertising for the Wingstop brand.
WRI administers and directs the development of all advertising and promotion programs in the advertising fund for which it collects advertising contributions, in accordance with the provisions of its franchise agreements. WRI has a contractual obligation with regard to these advertising contributions. The Company consolidates and reports all assets and liabilities of the advertising fund as restricted assets of the advertising fund and restricted liabilities of the advertising fund within current assets and current liabilities, respectively, in the Consolidated Balance Sheets. The assets and liabilities of the advertising fund consist primarily of cash, receivables, accrued expenses, other liabilities, and any cumulative surplus related specifically to the advertising fund. The revenues, expenses and cash flows of the advertising fund are not included in the Consolidated Statements of Operations or the Consolidated Statements of Cash Flows because the Company does not have complete discretion over the usage of the funds. Rather, under the franchise agreements, contributions to the advertising fund are restricted to advertising, public relations, merchandising, similar activities, and administrative expenses to increase sales and further enhance the public reputation of the Wingstop brand. The aforementioned administrative expenses may also include personnel expenses and allocated costs incurred by the Company which are directly associated with administering the advertising fund, as outlined in the provisions of the franchise agreements.
Income Taxes
Income taxes are accounted for under the asset and liability method. Under this method, a deferred tax asset or liability is recognized for the estimated future tax effects attributable to temporary differences between the financial statement basis and the tax basis of assets and liabilities as well as tax credit carry-forwards. Deferred tax assets and liabilities are measured using enacted tax rates expected to apply to taxable income in the years in which those temporary differences are expected to be recovered or settled. The effect on deferred tax assets and liabilities of a change in tax rates is recognized in the period of the change. The Company files a consolidated federal income tax return including all of its subsidiaries.
Significant judgment is required in evaluating the Company’s uncertain tax positions and determining the Company’s income tax expense. The Company assesses the income tax position and records the liabilities for all years subject to examination based upon management’s evaluation of the facts, circumstances, and information available at the reporting date.
Impact of Inflation.
The primary inflationary factors affecting our and our franchisees’ operations are food and beverage costs, labor costs, energy costs and the costs and materials used in the construction of new restaurants. Our restaurant operations are subject to federal and state minimum wage laws governing such matters as working conditions, overtime and tip credits. Significant numbers of our and our franchisees’ restaurant personnel are paid at rates related to the federal and/or state minimum wage and, accordingly, increases in the minimum wage increase our and our franchisees’ labor costs. To the extent permitted by competition and the economy, we have mitigated increased costs by increasing menu prices and may continue to do so if deemed necessary in future years. Substantial increases in costs and expenses could impact our operating results to the extent such increases cannot be passed through to our customers. Historically, inflation has not had a material effect on our results of operations. Severe increases in inflation, however, could affect the global and U.S. economies and could have an adverse impact on our business, financial condition and results of operations.
Commodity Price Risk.
We are exposed to market risks from changes in commodity prices. Many of the food products purchased by us are affected by weather, production, availability and other factors outside our control. Although we attempt to minimize the effect of price volatility by negotiating fixed price contracts for the supply of key ingredients, there are no established fixed price markets for bone-in chicken wings so we are subject to prevailing market conditions. Bone-in chicken wings accounted for approximately
31.4%
and
29.1%
of our company-owned restaurant costs of sales in fiscal years
2017
and
2016
. A hypothetical
52
10.0%
increase in the bone-in chicken wing costs in fiscal year
2017
would have increased costs of sales by approximately
$0.9 million
during the year. We do not engage in speculative financial transactions nor do we hold or issue financial instruments for trading purposes.
Interest Rate Risk.
We are subject to interest rate risk in connection with borrowings under our senior secured credit facility, which bear interest at variable rates. At
December 30, 2017
, we had
$133.8 million
outstanding under our credit facility. Derivative financial instruments, such as interest rate swap agreements and interest rate cap agreements, may be used for the purpose of managing fluctuating interest rate exposures that exist from our variable rate debt obligations that are expected to remain outstanding. Interest rate changes do not affect the market value of such debt, but could impact the amount of our interest payments, and accordingly, our future earnings and cash flows, assuming other factors are held constant. A hypothetical
1.0%
percentage point increase or decrease in the interest rate associated with our credit facilities would have resulted in a
$1.3 million
impact on interest expense for the year ended
December 30, 2017
.
Information with respect to this Item is set forth beginning on page F-1. See “Item 15 - Exhibits and Financial Schedule” below.
None.
Evaluation of Disclosure Controls and Procedures
Our management, with the participation of our Chief Executive Officer and Chief Financial Officer, evaluated the effectiveness of the design and operation of our disclosure controls and procedures, pursuant to Rule 13a-15 under the Securities Exchange Act of 1934, as amended (the “Exchange Act”), as of the end of the period covered by this annual Report on Form 10-K. In designing and evaluating the disclosure controls and procedures, management recognized that any controls and procedures, no matter how well designed and operated, can provide only reasonable assurance of achieving the desired control objectives. In addition, the design of disclosure controls and procedures must reflect the fact that there are resource constraints and that management is required to apply its judgment in evaluating the benefits of possible controls and procedures relative to their costs.
Based on that evaluation, our Chief Executive Officer and Chief Financial Officer concluded that our disclosure controls and procedures were effective as of
December 30, 2017
to provide reasonable assurance that information we are required to disclose in reports that we file or submit under the Exchange Act is recorded, processed, summarized and reported within the time periods specified in SEC rules and forms, and that such information is accumulated and communicated to our management, including our Chief Executive Officer and Chief Financial Officer, as appropriate, to allow timely decisions regarding required disclosure.
Changes in Internal Control over Financial Reporting
There have been no other changes in our internal control over financial reporting (as defined in Rule 13a-15(f) of the Exchange Act) that occurred during our most recently completed fiscal quarter that have materially affected, or are reasonably likely to materially affect, our internal control over financial reporting.
53
Management’s Report on Internal Control Over Financial Reporting
The management of Wingstop Inc. is responsible for establishing and maintaining adequate internal control over financial reporting as defined in Rule 13a-15(f) under the Exchange Act. Internal control over financial reporting is a process to provide reasonable assurance regarding the reliability of our financial reporting for external purposes in accordance with accounting principles generally accepted in the United States. Because of its inherent limitations, internal control over financial reporting may not prevent or detect misstatements. Projections of any evaluation of effectiveness to future periods are subject to the risk that controls may become inadequate because of changes in conditions, or that the degree of compliance with the policies or procedures may deteriorate.
Our management, including our Chief Executive Officer and Chief Financial Officer, assessed the effectiveness of our internal control over financial reporting as of
December 30, 2017
. In making this assessment, we used the criteria set forth by the Committee of Sponsoring Organizations of the Treadway Commission ("COSO") in
Internal Control-Integrated Framework (2013)
. Based on such assessment our management has concluded that, as of
December 30, 2017
, our internal control over financial reporting is effective based on those criteria.
Ernst & Young LLP, an independent registered public accounting firm, has issued an attestation report, included herein, on the effectiveness of our internal control over financial reporting as of
December 30, 2017
.
54
Report of Independent Registered Public Accounting Firm
To the Stockholders and the Board of Directors of Wingstop Inc. and Subsidiaries
Opinion on Internal Control over Financial Reporting
We have audited Wingstop Inc. and Subsidiaries’ internal control over financial reporting as of December 30, 2017, based on criteria established in Internal Control-Integrated Framework issued by the Committee of Sponsoring Organizations of the Treadway Commission 2013 framework, (the COSO criteria). In our opinion, Wingstop Inc. and Subsidiaries (the Company) maintained, in all material respects, effective internal control over financial reporting as of December 30, 2017, based on the COSO criteria.
We also have audited, in accordance with the standards of the Public Company Accounting Oversight Board (United States) (PCAOB), the consolidated balance sheets as of December 30, 2017 and December 31, 2016, and the related consolidated statements of operations, stockholders’ deficit and cash flows for each of the three fiscal years in the period ended December 30, 2017, and the related notes and our report dated February 23, 2018 expressed an unqualified opinion thereon.
Basis for Opinion
The Company’s management is responsible for maintaining effective internal control over financial reporting and for its assessment of the effectiveness of internal control over financial reporting included in the accompanying Management’s Report on Internal Control Over Financial Reporting. Our responsibility is to express an opinion on the Company’s internal control over financial reporting based on our audit. We are a public accounting firm registered with the PCAOB and are required to be independent with respect to the Company in accordance with the U.S. federal securities laws and the applicable rules and regulations of the Securities and Exchange Commission and the PCAOB.
We conducted our audit in accordance with the standards of the PCAOB. Those standards require that we plan and perform the audit to obtain reasonable assurance about whether effective internal control over financial reporting was maintained in all material respects.
Our audit included obtaining an understanding of internal control over financial reporting, assessing the risk that a material weakness exists, testing and evaluating the design and operating effectiveness of internal control based on the assessed risk, and performing such other procedures as we considered necessary in the circumstances. We believe that our audit provides a reasonable basis for our opinion.
Definition and Limitations of Internal Control Over Financial Reporting
A company’s internal control over financial reporting is a process designed to provide reasonable assurance regarding the reliability of financial reporting and the preparation of financial statements for external purposes in accordance with generally accepted accounting principles. A company’s internal control over financial reporting includes those policies and procedures that (1) pertain to the maintenance of records that, in reasonable detail, accurately and fairly reflect the transactions and dispositions of the assets of the company; (2) provide reasonable assurance that transactions are recorded as necessary to permit preparation of financial statements in accordance with generally accepted accounting principles, and that receipts and expenditures of the company are being made only in accordance with authorizations of management and directors of the company; and (3) provide reasonable assurance regarding prevention or timely detection of unauthorized acquisition, use, or disposition of the company’s assets that could have a material effect on the financial statements.
Because of its inherent limitations, internal control over financial reporting may not prevent or detect misstatements. Also, projections of any evaluation of effectiveness to future periods are subject to the risk that controls may become inadequate because of changes in conditions, or that the degree of compliance with the policies or procedures may deteriorate.
/s/ ERNST & YOUNG LLP
Dallas, Texas
February 23, 2018
55
Amendments to Code of Business Conduct and Ethics
On February 21, 2018, our board of directors, acting upon the recommendation of our nominating and corporate governance committee, approved amendments to our Code of Business Conduct and Ethics to, among other things:
|
•
|
remove references to Roark Capital Management and its affiliates; and
|
|
•
|
clarify and modernize the provisions of the Code of Business Conduct and Ethics.
|
The updated Code of Business Conduct and Ethics is available on the investor relations section of our website, ir.wingstop.com. The amendments to the Code of Business Conduct and Ethics did not result in the waiver of any provision thereof.
Amendments to Amended and Restated Bylaws
On February 21, 2018, our board of directors, acting upon the recommendation of our nominating and corporate governance committee, amended and restated our Amended and Restated Bylaws to, among other things:
|
•
|
revise the advance notice provisions of the Amended and Restated Bylaws to require stockholders to provide additional information to the Company when proposing business for an annual meeting or nominating a director for election to our board of directors, including information concerning:
|
|
◦
|
whether the proposing stockholder or its associated persons is a party to any material ongoing or pending legal proceedings with the Company;
|
|
◦
|
whether the proposing stockholder or its associated persons have any direct or indirect material interest in any material contract or agreement of the Company or its principal competitors;
|
|
◦
|
with respect to a stockholder nominee for election to our board of directors, whether such nominee:
|
|
▪
|
is a party to any voting commitments or arrangements related to his or her service as a director;
|
|
▪
|
is a party to any compensatory arrangements with the stockholder (or its associated persons) nominating such person for election to our board of directors; and
|
|
•
|
remove references to Roark Capital Management and its affiliates; and
|
|
•
|
clarify and modernize the provisions of the Amended and Restated Bylaws.
|
The foregoing description of the Amended and Restated Bylaws, as amended and restated, is qualified in its entirety by reference to the full text of the Amended and Restated Bylaws, as amended and restated, a copy of which is filed as Exhibit 3.2 hereto.
Adoption of 2018 Bonus Plan
On February 21, 2018, our compensation committee adopted the Wingstop 2018 Bonus Plan (the “2018 Bonus Plan”), which provides for the payment of annual cash bonuses to certain eligible employees, including our named executive officers, up to a specified percentage of such eligible employee’s annual base salary. The purpose of the 2018 Bonus Plan is to advance our interests and the interests of our stockholders by (i) providing certain employees, including our named executive officers, with incentive compensation that is tied to the achievement of pre-established, objective performance goals, (ii) identifying and rewarding superior performance and providing competitive compensation to attract, motivate and retain employees who have outstanding skills and abilities, and who achieve superior performance, and (iii) fostering accountability and teamwork throughout Wingstop. The compensation committee administers the 2018 Bonus Plan.
Pursuant to the 2018 Bonus Plan, each of our named executive officers is eligible to earn a target bonus ranging from 50% of base salary, for certain senior executives, to 100% of base salary, for our Chief Executive Officer. The actual amount of the bonus payable under the 2018 Bonus Plan ranges from 0% to 150% of the target bonus amount based on the achievement of certain Adjusted EBITDA target goals more fully set forth in the 2018 Bonus Plan.
56
Information regarding our directors, executive officers, audit committee and our audit committee financial expert required by this Item 10 will be included in our definitive Proxy Statement for the
2018
Annual Meeting of Shareholders and such disclosure is incorporated herein by reference.
Information regarding executive compensation required by this Item 11 will be included in our definitive Proxy Statement for the
2018
Annual Meeting of Shareholders and such disclosure is incorporated herein by reference.
Information regarding security ownership of certain beneficial owners and management and related stockholder matters, including the disclosures required by Item 201(d) of Regulation S-K, required by this Item 12 will be included in our definitive Proxy Statement for the
2018
Annual Meeting of Stockholders and such disclosure is incorporated herein by reference.
Information regarding certain relationships and related transactions and director independence required by this Item 13 will be included in our definitive Proxy Statement for the
2018
Annual Meeting of Stockholders and such disclosure is incorporated herein by reference.
The Company’s independent registered public accounting firm is Ernst & Young LLP. Information regarding principal accountant fees and services required by this Item 14 will be included in our definitive Proxy Statement for the
2018
Annual Meeting of Shareholders and such disclosure is incorporated herein by reference.
57
(a)
Financial Statements
Refer to Index to Financial Statements appearing on page F-1.
(b)
Financial Statement Schedules
No financial statement schedules are provided because the information called for is not required or is shown in the financial statements or the notes thereto.
(c)
Exhibits
The exhibits listed below are filed or incorporated by reference as a part of this report.
Index to exhibits
|
Exhibit No.
|
Description
|
|
3.1
|
|
|
3.2*
|
|
|
4.1
|
|
|
10.1
|
|
|
10.2
|
|
|
10.3
†
|
|
|
10.4
†
|
|
|
10.5†
|
|
|
10.6
†
|
|
|
10.7†
|
|
|
10.8†
|
|
|
10.9†
|
|
|
10.10*†
|
|
58
|
10.11†
|
|
|
10.12†
|
|
|
10.13†
|
|
|
10.14†
|
|
|
10.15†
|
|
|
10.16†
|
|
|
10.17†
|
|
|
10.18†
|
|
|
10.19
†
|
|
|
21.1*
|
|
|
23.2*
|
|
|
31.1*
|
|
|
31.2*
|
|
|
32.1*
|
|
|
32.2*
|
|
|
101.INS*
|
XBRL Instance Document
|
|
101.SCH*
|
XBRL Taxonomy Extension Schema Document
|
|
101.CAL*
|
XBRL Taxonomy Extension Calculation Linkbase Document
|
|
101.DEF*
|
XBRL Taxonomy Extension Definition Linkbase Document
|
|
101.LAB*
|
XBRL Taxonomy Extension Label Linkbase Document
|
|
101.PRE*
|
XBRL Taxonomy Extension Presentation Linkbase Document
|
* Filed herewith.
† Indicates management agreement.
59
Signatures
In accordance with Section 13 or 15(d) of the Exchange Act, the registrant has duly caused this report to be signed on its behalf by the undersigned, thereunto duly authorized.
|
Wingstop Inc.
|
|
/s/ Charles R. Morrison
|
|
Charles R. Morrison
|
|
Chairman and Chief Executive Officer (Principal Executive Officer)
|
Pursuant to the requirements of Section 13 or 15(d) of the Exchange Act, this report has been signed below by the following persons on behalf of the registrant and in the capacities and on the dates indicated.
|
Name
|
Title
|
Date
|
||
|
/s/ Charles R. Morrison
|
February 23, 2018
|
|||
|
Charles R. Morrison
|
Chairman and Chief Executive Officer (Principal Executive Officer)
|
|||
|
/s/ Michael J. Skipworth
|
February 23, 2018
|
|||
|
Michael J. Skipworth
|
Chief Financial Officer (Principal Financial and Accounting Officer)
|
|||
|
/s/ Lynn Crump-Caine
|
February 23, 2018
|
|||
|
Lynn Crump-Caine
|
Lead Independent Director
|
|||
|
/s/ David L. Goebel
|
February 23, 2018
|
|||
|
David L. Goebel
|
Director
|
|||
|
/s/ Michael J. Hislop
|
February 23, 2018
|
|||
|
Michael J. Hislop
|
Director
|
|||
|
/s/ Kilandigalu M. Madati
|
February 23, 2018
|
|||
|
Kilandigalu M. Madati
|
Director
|
|||
|
/s/ Wesley S. McDonald
|
February 23, 2018
|
|||
|
Wesley S. McDonald
|
Director
|
|||
60
INDEX TO CONSOLIDATED FINANCIAL STATEMENTS
Consolidated Financial Statements
F-1
Report of Independent Registered Public Accounting Firm
To the Stockholders and the Board of Directors of Wingstop Inc. and Subsidiaries
Opinion on the Financial Statements
We have audited the accompanying consolidated balance sheets of Wingstop Inc. and Subsidiaries (the Company) as of December 30, 2017 and December 31, 2016, and the related consolidated statements of operations, stockholders’ deficit and cash flows for each of the three fiscal years in the period ended December 30, 2017, and the related notes (collectively referred to as the “financial statements”). In our opinion, the financial statements present fairly, in all material respects, the consolidated financial position of the Company at December 30, 2017 and December 31, 2016, and the consolidated results of its operations and its cash flows for each of the three years in the period ended December 30, 2017, in conformity with U.S. generally accepted accounting principles.
We also have audited, in accordance with the standards of the Public Company Accounting Oversight Board (United States) (PCAOB), the Company's internal control over financial reporting as of December 30, 2017, based on criteria established in Internal Control-Integrated Framework issued by the Committee of Sponsoring Organizations of the Treadway Commission (2013 framework), and our report dated February 23, 2018 expressed an unqualified opinion thereon.
Basis for Opinion
These financial statements are the responsibility of the Company's management. Our responsibility is to express an opinion on the Company’s financial statements based on our audits. We are a public accounting firm registered with the PCAOB and are required to be independent with respect to the Company in accordance with the U.S. federal securities laws and the applicable rules and regulations of the Securities and Exchange Commission and the PCAOB.
We conducted our audits in accordance with the standards of the PCAOB. Those standards require that we plan and perform the audit to obtain reasonable assurance about whether the financial statements are free of material misstatement, whether due to error or fraud. Our audits included performing procedures to assess the risks of material misstatement of the financial statements, whether due to error or fraud, and performing procedures that respond to those risks. Such procedures included examining, on a test basis, evidence regarding the amounts and disclosures in the financial statements. Our audits also included evaluating the accounting principles used and significant estimates made by management, as well as evaluating the overall presentation of the financial statements. We believe that our audits provide a reasonable basis for our opinion.
/s/ ERNST & YOUNG LLP
We have served as the Company’s auditor since 2012.
Dallas, Texas
February 23, 2018
F-2
WINGSTOP INC. AND SUBSIDIARIES
(amounts in thousands, except share and par value data)
|
|
December 30,
2017 |
|
December 31,
2016 |
||||
|
|
|
|
|||||
|
Assets
|
|
|
|
|
|
||
|
Current assets
|
|
|
|
|
|
||
|
Cash and cash equivalents
|
$
|
4,063
|
|
$
|
3,750
|
|
|
|
Accounts receivable, net
|
4,567
|
|
3,199
|
|
|||
|
Prepaid expenses and other current assets
|
4,334
|
|
1,634
|
|
|||
|
Advertising fund assets, restricted
|
2,944
|
|
2,533
|
|
|||
|
Total current assets
|
15,908
|
|
11,116
|
|
|||
|
Property and equipment, net
|
5,826
|
|
4,999
|
|
|||
|
Goodwill
|
46,557
|
|
45,128
|
|
|||
|
Trademarks
|
32,700
|
|
32,700
|
|
|||
|
Customer relationships, net
|
15,567
|
|
16,914
|
|
|||
|
Other non-current assets
|
3,278
|
|
943
|
|
|||
|
Total assets
|
$
|
119,836
|
|
$
|
111,800
|
|
|
|
Liabilities and stockholders' deficit
|
|||||||
|
Current liabilities
|
|||||||
|
Accounts payable
|
$
|
1,752
|
|
$
|
1,458
|
|
|
|
Other current liabilities
|
10,683
|
|
9,241
|
|
|||
|
Current portion of debt
|
3,500
|
|
3,500
|
|
|||
|
Advertising fund liabilities, restricted
|
2,944
|
|
2,533
|
|
|||
|
Total current liabilities
|
18,879
|
|
16,732
|
|
|||
|
Long-term debt, net
|
129,841
|
|
147,217
|
|
|||
|
Deferred revenues, net of current
|
8,427
|
|
7,868
|
|
|||
|
Deferred income tax liabilities, net
|
8,799
|
|
12,304
|
|
|||
|
Other non-current liabilities
|
2,142
|
|
2,307
|
|
|||
|
Total liabilities
|
168,088
|
|
186,428
|
|
|||
|
Commitments and contingencies (see note 11)
|
|
|
|
|
|||
|
Stockholders' deficit
|
|||||||
|
Common stock, $0.01 par value; 100,000,000 shares authorized; 29,092,669 and 28,747,392 shares issued and outstanding as of December 30, 2017 and December 31, 2016, respectively
|
291
|
|
287
|
|
|||
|
Additional paid-in-capital
|
262
|
|
1,194
|
|
|||
|
Accumulated deficit
|
(48,805
|
)
|
(76,109
|
)
|
|||
|
Total stockholders' deficit
|
(48,252
|
)
|
(74,628
|
)
|
|||
|
Total liabilities and stockholders' deficit
|
$
|
119,836
|
|
$
|
111,800
|
|
|
See accompanying notes to consolidated financial statements
F-3
WINGSTOP INC. AND SUBSIDIARIES
(amounts in thousands, except per share data)
|
|
Fiscal Year Ended
|
||||||||||
|
|
December 30,
2017 |
December 31,
2016 |
December 26,
2015 |
||||||||
|
|
|
|
|
||||||||
|
Revenue:
|
|
|
|
|
|
|
|
|
|||
|
Royalty revenue and franchise fees
|
$
|
68,483
|
|
$
|
57,071
|
|
$
|
46,688
|
|
||
|
Company-owned restaurant sales
|
37,069
|
|
34,288
|
|
31,281
|
|
|||||
|
Total revenue
|
105,552
|
|
91,359
|
|
77,969
|
|
|||||
|
Costs and expenses:
|
|
|
|
|
|
|
|
|
|||
|
Cost of sales
(1)
|
28,745
|
|
25,308
|
|
22,219
|
|
|||||
|
Selling, general and administrative
|
37,151
|
|
33,840
|
|
33,350
|
|
|||||
|
Depreciation and amortization
|
3,376
|
|
3,008
|
|
2,682
|
|
|||||
|
Total costs and expenses
|
69,272
|
|
62,156
|
|
58,251
|
|
|||||
|
Operating income
|
36,280
|
|
29,203
|
|
19,718
|
|
|||||
|
Interest expense, net
|
5,131
|
|
4,396
|
|
3,477
|
|
|||||
|
Other expense, net
|
—
|
|
254
|
|
396
|
|
|||||
|
Income before income tax expense
|
31,149
|
|
24,553
|
|
15,845
|
|
|||||
|
Income tax expense
|
3,845
|
|
9,119
|
|
5,739
|
|
|||||
|
Net income
|
$
|
27,304
|
|
$
|
15,434
|
|
$
|
10,106
|
|
||
|
Earnings per share
|
|||||||||||
|
Basic
|
$
|
0.94
|
|
$
|
0.54
|
|
$
|
0.37
|
|
||
|
Diluted
|
$
|
0.93
|
|
$
|
0.53
|
|
$
|
0.36
|
|
||
|
Weighted average shares outstanding
|
|||||||||||
|
Basic
|
29,025
|
|
28,637
|
|
27,497
|
|
|||||
|
Diluted
|
29,424
|
|
28,983
|
|
27,816
|
|
|||||
|
Dividends per share
|
$
|
0.14
|
|
$
|
2.90
|
|
$
|
1.83
|
|
||
|
(1)
exclusive of depreciation and amortization, shown separately
|
|||||||||||
See accompanying notes to consolidated financial statements.
F-4
WINGSTOP INC. AND SUBSIDIARIES
Consolidated Statements of Stockholders’ Deficit
(amounts in thousands, except share data)
|
|
Common Stock
|
|
|
|
||||||||||||||
|
|
Shares
|
|
Amount
|
|
Additional
Paid-In Capital
|
|
Accumulated Deficit
|
|
Total Stockholders’ Deficit
|
|||||||||
|
Balance at December 27, 2014
|
26,101,755
|
|
$
|
261
|
|
$
|
2,313
|
|
$
|
(11,568
|
)
|
$
|
(8,994
|
)
|
||||
|
Net income
|
—
|
|
—
|
|
—
|
|
10,106
|
|
10,106
|
|
||||||||
|
Issuance of common stock in connection with the IPO, net of transaction expenses
|
2,150,000
|
|
21
|
|
34,967
|
|
—
|
|
34,988
|
|
||||||||
|
Exercise of stock options
|
329,427
|
|
4
|
|
474
|
|
—
|
|
478
|
|
||||||||
|
Stock-based compensation expense
|
—
|
|
—
|
|
1,155
|
|
—
|
|
1,155
|
|
||||||||
|
Excess tax benefit of stock-based compensation
|
—
|
|
—
|
|
593
|
|
—
|
|
593
|
|
||||||||
|
Dividends paid
|
—
|
|
—
|
|
(2,632
|
)
|
(45,367
|
)
|
(47,999
|
)
|
||||||||
|
Balance at December 26, 2015
|
28,581,182
|
|
286
|
|
36,870
|
|
(46,829
|
)
|
(9,673
|
)
|
||||||||
|
Net income
|
—
|
|
—
|
|
—
|
|
15,434
|
|
15,434
|
|
||||||||
|
Exercise of stock options
|
166,210
|
|
1
|
|
484
|
|
—
|
|
485
|
|
||||||||
|
Stock-based compensation expense
|
—
|
|
—
|
|
1,231
|
|
—
|
|
1,231
|
|
||||||||
|
Excess tax benefit of stock-based compensation
|
—
|
|
—
|
|
1,163
|
|
—
|
|
1,163
|
|
||||||||
|
Dividends paid
|
—
|
|
—
|
|
(38,554
|
)
|
(44,714
|
)
|
(83,268
|
)
|
||||||||
|
Balance at December 31, 2016
|
28,747,392
|
|
287
|
|
1,194
|
|
(76,109
|
)
|
(74,628
|
)
|
||||||||
|
Net income
|
—
|
|
—
|
|
—
|
|
27,304
|
|
27,304
|
|
||||||||
|
Issuance of common stock, net
|
19,168
|
|
1
|
|
(1
|
)
|
—
|
|
—
|
|
||||||||
|
Exercise of stock options
|
326,109
|
|
3
|
|
1,315
|
|
—
|
|
1,318
|
|
||||||||
|
Stock-based compensation expense
|
—
|
|
—
|
|
1,851
|
|
—
|
|
1,851
|
|
||||||||
|
Dividends paid
|
—
|
|
—
|
|
(4,097
|
)
|
—
|
|
(4,097
|
)
|
||||||||
|
Balance at December 30, 2017
|
29,092,669
|
|
$
|
291
|
|
$
|
262
|
|
$
|
(48,805
|
)
|
$
|
(48,252
|
)
|
||||
See accompanying notes to consolidated financial statements.
F-5
WINGSTOP INC. AND SUBSIDIARIES
(amounts in thousands)
|
|
Fiscal Year Ended
|
||||||||||
|
|
December 30,
2017 |
December 31,
2016 |
December 26,
2015 |
||||||||
|
Operating activities
|
|
|
|
|
|
|
|||||
|
Net income
|
$
|
27,304
|
|
$
|
15,434
|
|
$
|
10,106
|
|
||
|
Adjustments to reconcile net income to cash provided by operating activities:
|
|||||||||||
|
Depreciation and amortization
|
3,376
|
|
3,008
|
|
2,682
|
|
|||||
|
Deferred income taxes
|
(3,505
|
)
|
(714
|
)
|
(1,046
|
)
|
|||||
|
Stock-based compensation expense
|
1,851
|
|
1,231
|
|
1,155
|
|
|||||
|
Amortization of debt issuance costs
|
292
|
|
437
|
|
330
|
|
|||||
|
Changes in operating assets and liabilities:
|
|||||||||||
|
Accounts receivable
|
(1,368
|
)
|
205
|
|
(1,004
|
)
|
|||||
|
Prepaid expenses and other assets
|
(503
|
)
|
(171
|
)
|
(196
|
)
|
|||||
|
Accounts payable and other current liabilities
|
(876
|
)
|
3,648
|
|
1,169
|
|
|||||
|
Deferred revenue
|
645
|
|
48
|
|
450
|
|
|||||
|
Other non-current liabilities
|
(167
|
)
|
203
|
|
214
|
|
|||||
|
Cash provided by operating activities
|
27,049
|
|
23,329
|
|
13,860
|
|
|||||
|
Investing activities
|
|||||||||||
|
Purchases of property and equipment
|
(2,535
|
)
|
(2,056
|
)
|
(1,915
|
)
|
|||||
|
Acquisition of restaurants from franchisees
|
(3,949
|
)
|
—
|
|
—
|
|
|||||
|
Cash used in investing activities
|
(6,484
|
)
|
(2,056
|
)
|
(1,915
|
)
|
|||||
|
Financing activities
|
|||||||||||
|
Proceeds from issuance of common stock, net of expenses
|
—
|
|
—
|
|
34,988
|
|
|||||
|
Proceeds from exercise of stock options
|
1,318
|
|
485
|
|
478
|
|
|||||
|
Borrowings of long-term debt
|
3,500
|
|
165,000
|
|
40,000
|
|
|||||
|
Repayments of long-term debt
|
(21,000
|
)
|
(109,250
|
)
|
(38,218
|
)
|
|||||
|
Payment of deferred financing costs
|
—
|
|
(1,180
|
)
|
(227
|
)
|
|||||
|
Dividends paid
|
(4,070
|
)
|
(83,268
|
)
|
(47,999
|
)
|
|||||
|
Cash used in financing activities
|
(20,252
|
)
|
(28,213
|
)
|
(10,978
|
)
|
|||||
|
Net change in cash and cash equivalents
|
313
|
|
(6,940
|
)
|
967
|
|
|||||
|
Cash and cash equivalents at beginning of period
|
3,750
|
|
10,690
|
|
9,723
|
|
|||||
|
Cash and cash equivalents at end of period
|
$
|
4,063
|
|
$
|
3,750
|
|
$
|
10,690
|
|
||
|
Supplemental information:
|
|||||||||||
|
Cash paid for interest
|
$
|
4,842
|
|
$
|
4,775
|
|
$
|
3,409
|
|
||
|
Cash paid for taxes
|
$
|
10,096
|
|
$
|
7,230
|
|
$
|
5,362
|
|
||
See accompanying notes to consolidated financial statements.
F-6
(1)
Basis of Presentation and Summary of Significant Accounting Policies
Overview
Wingstop Inc. was incorporated in Delaware on March 18, 2015 (“Wingstop” or the “Company”). Wing Stop Holding Corporation was merged with and into Wingstop Inc. pursuant to the reorganization that occurred on May 18, 2015 as described below. Wing Stop Holding Corporation was originally formed on March 16, 2010 to purchase
100%
of the equity interests of Wingstop Holdings, Inc. (“WHI”). WHI owns
100%
of the common stock of Wingstop Restaurants Inc. (“WRI”). Wingstop, through its primary operating subsidiary, WRI, collectively referred to as the “Company”, is in the business of franchising and operating Wingstop restaurants. As of
December 30, 2017
,
1,004
franchised restaurants were in operation domestically and
106
international franchised restaurants were in operation across
eight
countries. As of
December 30, 2017
, WRI owned and operated
23
restaurants.
On May 28, 2015, Wing Stop Holding Corporation merged with and into Wingstop Inc., with Wingstop Inc. as the surviving corporation in the merger. Pursuant to the merger, each holder of Wing Stop Holding Corporation common stock received
0.545
shares of common stock of Wingstop Inc. for each one share of Wing Stop Holding Corporation. Additionally, each option to purchase common stock of Wing Stop Holding Corporation was assumed by Wingstop Inc. and converted into an option to purchase
0.545
shares of common stock of Wingstop Inc. for each one share of Wing Stop Holding Corporation with the remaining terms of each such option remaining unchanged, except as was necessary to reflect the reorganization. All references to shares in the financial statements and the notes to the financial statements, including but not limited to the number of shares and per share amounts, unless otherwise noted, have been adjusted to reflect the reorganization retrospectively.
Summary of Significant Accounting Policies
(a)
Principles of Consolidation
The accompanying consolidated financial statements include the accounts of Wingstop Inc. and its wholly owned subsidiaries. All intercompany balances and transactions have been eliminated in consolidation.
(b)
Fiscal Year End
The Company uses a 52/53-week fiscal year that ends on the last Saturday of the calendar year. Fiscal years
2017
and
2015
each consisted of 52 weeks, and fiscal year
2016
consisted of 53 weeks.
(c)
Use of Estimates
The preparation of financial statements in conformity with U.S. generally accepted accounting principles (“GAAP”) requires management to make estimates and assumptions, primarily related to long-lived asset (valuation), indefinite and finite lived intangible asset valuation, income taxes, leases, stock-based compensation, contingencies and common stock equity valuations. These estimates and assumptions affect the reported amounts of assets and liabilities and disclosure of contingent assets and liabilities as of the date of the financial statements and the reported amounts of revenues and expenses during the period. Although management bases its estimates on historical experience and assumptions that are believed to be reasonable under the circumstances, actual results could differ from those estimates.
(d)
Comprehensive Income (Loss)
Comprehensive income (loss) is defined as the change in equity of a business enterprise during a period from transactions and other events and circumstances from non-owner sources. Comprehensive income is the same as net income for all periods presented. Therefore, a separate statement of comprehensive income (loss) is not included in the accompanying consolidated financial statements.
(e)
Cash and Cash Equivalents
Cash and cash equivalents are comprised of credit card receivables and all highly liquid investments with an initial maturity of three months or less when purchased. Cash and cash equivalents are carried at cost which approximates fair value. The Company maintains its cash in bank deposit accounts that, at times, may exceed federally insured limits; however, the Company has not experienced any losses in these accounts. The Company believes it is not exposed to any significant credit risk.
F-7
(f)
Accounts Receivable
Accounts receivable, net of allowance for doubtful accounts, consists primarily of accrued royalty fee receivables, collected weekly in arrears, and vendor rebates. Management determines the allowance for doubtful accounts based on historical losses and current economic conditions. On a continuing basis, management analyzes delinquent receivables, which are charged off against the existing allowance account when determined to be uncollectible.
(g)
Inventories
Inventories, which consist of food and beverage products, paper goods and supplies, are valued at the lower of cost (first-in, first-out) or market.
(h)
Property and Equipment
Property and equipment is recorded at cost less accumulated depreciation. Property and equipment is depreciated based on the straight-line method over the following estimated useful lives:
|
Property and Equipment
|
Estimated Useful Lives
|
|
Leasehold improvements
|
Lesser of the expected lease term or useful life
|
|
Equipment, furniture and fixtures
|
3 to 7 years
|
At the time property and equipment are retired, the asset and accumulated depreciation are removed from the accounts and any resulting gain or loss is included in earnings. The Company expenses repair and maintenance costs that maintain the appearance and functionality of the restaurant but do not extend the useful life of any restaurant asset. Improvements to leased properties are depreciated over the shorter of their useful life or the lease term, which includes a fixed, non-cancelable lease term plus any reasonably assured renewal periods.
(i)
Impairment or Disposal of Long-Lived Assets
Property and equipment and finite-life intangible assets are reviewed for impairment periodically and whenever events or changes in circumstances indicate the carrying amount of an asset may not be recoverable. The Company’s assessment of recoverability of property and equipment and finite-lived intangible assets is performed at the component level, which is generally an individual restaurant and requires judgment and an estimate of future restaurant generated cash flows. The Company’s estimates of fair values are based on the best information available and require the use of estimates, judgments, and projections. The actual results may vary significantly from the estimates.
(j)
Goodwill and Indefinite-Lived Intangible Assets
The Company’s indefinite-lived intangible assets consist of goodwill and trademarks, which are not subject to amortization. On an annual basis (October 1
st
of the fiscal year) and whenever events or changes in circumstances indicate that the carrying amounts may not be recoverable, the Company reviews the recoverability of goodwill and indefinite-lived intangible assets. No indications of impairment were identified during fiscal years
2017
,
2016
or
2015
.
Impairment indicators that may necessitate goodwill impairment testing in between the Company’s annual impairment tests include, but are not limited to the following:
|
•
|
A significant adverse change in legal factors or in the business climate;
|
|
•
|
An adverse action or assessment by a regulator;
|
|
•
|
Unanticipated competition;
|
|
•
|
A loss of key personnel;
|
|
•
|
A more-likely-than-not expectation that a reporting unit or a significant portion of a reporting unit will be sold or otherwise disposed of; and
|
|
•
|
The testing for recoverability of a significant asset group within a reporting unit.
|
Impairment indicators that may necessitate indefinite-lived intangible asset impairment testing in between the Company’s annual impairment tests are consistent with those of its long-lived assets.
Sales declines at Wingstop restaurants, commodity or labor costs, deterioration in overall economic conditions and challenges in the restaurant industry may result in future impairment charges. It is possible that changes in circumstances or changes in
F-8
management’s judgments, assumptions and estimates could result in an impairment charge of a portion or all of its goodwill or other intangible assets.
(k)
Revenue Recognition
Revenues consist of sales from franchise and development fees, international territory fees, franchise royalties and company-owned stores. Franchise fees are recognized as revenue when all material services or conditions relating to the store have been substantially performed or satisfied by WRI, which is typically when a franchised store begins operations. Development fees for the right to develop a store are recognized as revenue when all material services or conditions relating to the sale have been substantially performed, which is typically when the franchised store begins operations. International territory fees and development fees determined based on the number of stores to open in an area are deferred and recognized as revenue on a pro rata basis at the same time the individual franchise fee is recognized, typically when individual stores are opened. Franchise fee, development fee and international territory fee payments received by WRI before the restaurant opens are recorded as deferred revenue in the Consolidated Balance Sheets.
Continuing royalties, which are a percentage of net sales of the franchisee, are recognized as revenue when earned. The Company records food and beverage revenues from company-owned stores upon sale to the customer. The Company collects and remits sales, food and beverage, alcoholic beverage and hospitality taxes on transactions with customers and reports such amounts under the net method in its Consolidated Statements of Operations. Accordingly, these taxes are not included in gross revenue.
The Company records a liability in the period in which a gift card is sold and recognizes costs associated with our administration of the gift card program as prepaid assets when the costs are incurred. As gift cards are redeemed, the liability and prepaid asset are reduced. When gift cards are redeemed at a franchisee-operated restaurant, the revenue and related administrative costs are recognized by the franchisee. The Company recognizes revenue and related administrative costs when gift cards are redeemed at company-operated restaurants.
(l)
Consideration from Vendors
The Company has entered into food and beverage supply agreements with certain major vendors. Pursuant to the terms of these arrangements, rebates are provided to the Company from the vendors based upon the dollar volume of purchases for company-operated restaurants and franchised restaurants. Additionally, the Company receives certain incentives from vendors to sponsor its annual franchisee convention. These incentives are recognized as earned throughout the year and are classified as a reduction in Cost of sales with any consideration received in excess of the total expense of the vendor’s products included within Royalty revenue and franchise fees within the Consolidated Statements of Operations. The incentives recognized were approximately
$11.2 million
,
$6.5 million
and
$4.8 million
, during fiscal years
2017
,
2016
and
2015
, respectively, of which
$0.9 million
,
$1.0 million
and
$0.7 million
was classified as a reduction in Cost of sales during fiscal years
2017
,
2016
and
2015
, respectively.
(m)
Advertising Expenses
WRI administers the Wingstop Restaurants Advertising Fund (“Ad Fund”), for which WRI collects a percentage of gross sales from Wingstop restaurant franchisees and WRI-owned restaurants to be used for various forms of advertising for the Wingstop brand. Beginning in fiscal year
2017
, in conjunction with the launch of national advertising, the advertising fund contribution collected from Wingstop restaurant franchisees and WRI-owned restaurants increased from
2%
to
3%
of gross sales. This change is not an increase to the existing
4%
of the restaurants’ gross sales that has historically been required to be spent on advertising according to our franchise agreement, but rather a reallocation of the types of advertising on which the
4%
advertising fee will be spent.
WRI administers and directs the development of all advertising and promotion programs in the advertising fund for which it collects advertising contributions, in accordance with the provisions of its franchise agreements. WRI has a contractual obligation with regard to these advertising contributions. The Company consolidates and reports all assets and liabilities of the advertising fund as restricted assets of the advertising fund and restricted liabilities of the advertising fund within current assets and current liabilities, respectively, in the Consolidated Balance Sheets. The assets and liabilities of the advertising fund consist primarily of cash, receivables, accrued expenses, other liabilities, and any cumulative surplus related specifically to the advertising fund. The revenues, expenses and cash flows of the advertising fund are not included in the Consolidated Statements of Operations or the Consolidated Statements of Cash Flows because the Company does not have complete discretion over the usage of the funds. Rather, under the franchise agreements, contributions to the advertising fund are restricted to advertising, public relations, merchandising, similar activities, and administrative expenses to increase sales and further enhance the public reputation of the Wingstop brand. The aforementioned administrative expenses may also include personnel expenses and allocated costs incurred by the Company which are directly associated with administering the advertising fund, as outlined in the provisions of the franchise agreements.
F-9
WRI made discretionary contributions to the advertising fund for the purpose of supplementing the national advertising campaign of
$5.6 million
,
$2.4 million
, and
$2.3 million
during fiscal years
2017
,
2016
and
2015
, respectively, which are included in Selling, general and administrative expenses in the Consolidated Statements of Operations. Company operated restaurants incurred advertising expenses of
$1.5 million
in fiscal years
2017
and
2016
, and
$1.4 million
in fiscal year
2015
, which are included in cost of sales in the Consolidated Statements of Operations and include the company-operated restaurants’ advertising fund contributions that are equal to
3%
of gross sales for each respective year.
In addition to the above, the Company incurred advertising expenses related to franchise sales of
$0.1 million
for fiscal years
2017
and
2016
, and
$0.2 million
for fiscal year
2015
, which are included in Selling, general and administrative expenses in the Consolidated Statements of Operations.
(n)
Leases
WRI leases restaurants and office space under operating leases. Most lease agreements contain tenant improvement allowances, rent holidays, rent escalation clauses, and/or contingent rent provisions. For purposes of recognizing incentives and minimum rental payments on the straight-line basis over the terms of the leases, WRI uses the date it takes possession of the leased space for construction purposes as the beginning of the term, which is generally
two
to
three
months prior to a restaurant’s opening date. For leases with renewal periods at WRI’s option, WRI determines the expected lease period based on whether the renewal of any options are reasonably assured at the inception of the lease. In addition to rental expense, certain leases require WRI to pay a portion of real estate taxes, utilities, building operating expenses, insurance and other charges in addition to rent.
For tenant improvement allowances, rent escalations, and rent holidays, WRI records a deferred rent liability in its Consolidated Balance Sheets and amortizes the deferred rent in the Consolidated Statements of Operations over the terms of the leases as charges to cost of sales and SG&A for company-owned stores and the corporate office, respectively.
(o)
Stock-Based Compensation
The Company measures stock-based compensation cost at fair value on the date of grant for all share-based awards and recognizes compensation expense over the service period that the awards are expected to vest. The Company has elected to recognize compensation cost for graded-vesting awards subject only to a service condition over the requisite service period of the entire award. For performance awards, the Company recognizes expense in the period in which vesting becomes probable.
(p)
Income Taxes
Income taxes are accounted for under the asset and liability method. Under this method, a deferred tax asset or liability is recognized for the estimated future tax effects attributable to temporary differences between the financial statement basis and the tax basis of assets and liabilities as well as tax credit carry-forwards. Deferred tax assets and liabilities are measured using enacted tax rates expected to apply to taxable income in the years in which those temporary differences are expected to be recovered or settled. The effect on deferred tax assets and liabilities of a change in tax rates is recognized in the period of the change. The Company files a consolidated federal income tax return including all of its subsidiaries.
Significant judgment is required in evaluating the Company’s uncertain tax positions and determining the Company’s income tax expense. The Company assesses the income tax position and records the liabilities for all years subject to examination based upon management’s evaluation of the facts, circumstances, and information available at the reporting date.
(q)
Business Segments
The Company identifies its reporting segments based on the organizational units used by management to monitor performance and make operating decisions. These reporting segments are as follows: franchise operations and company restaurant operations.
Franchise segment
The Franchise segment consists of our domestic and international franchise restaurants, which represent the majority of our system-wide restaurants. As of
December 30, 2017
, the franchise operations segment consisted of
1,110
restaurants operated by Wingstop franchisees in the United States and
eight
countries outside of the United States as compared to
977
franchised restaurants in operation as of
December 31, 2016
. Franchise operations revenue consists primarily of franchise royalty revenue, sales of franchise and development fees and international territory fees. Additionally, vendor rebates received for system-wide volume purchases in excess of the total expense of the vendor’s products are recognized as revenue of franchise operations.
F-10
Company Segment
As of
December 30, 2017
, the Company segment consisted of
23
company-owned restaurants, located in the United States, as compared to
21
company-owned restaurants as of
December 31, 2016
. Company restaurant sales are for food and beverage sales at company-operated restaurants. Company restaurant expenses are operating expenses at company-operated restaurants and include food, beverage, labor, benefits, utilities, rent and other operating costs.
Certain corporate related items are not allocated to the reportable segments and consist primarily of expenses associated with the Company’s initial public offering and management fees. The Company allocates selling, general and administrative expenses based on the relative support provided to each reportable segment.
(r)
Recent Accounting Pronouncements
In May 2014, the Financial Accounting Standards Board (“FASB”) issued new guidance for revenue recognition related to contracts with customers, except for contracts within the scope of other standards, which supersedes nearly all existing revenue recognition guidance. The new guidance provides a single framework in which revenue is required to be recognized to depict the transfer of goods or services to customers in amounts that reflect the consideration to which a company expects to be entitled in exchange for those goods or services.
The new guidance is effective for the Company in fiscal year 2018. The Company will adopt this new guidance in fiscal year 2018 using the full retrospective transition method, which will result in restating each prior reporting period presented, fiscal years 2017 and 2016, in the year of adoption. Additionally, a cumulative effect adjustment will be recorded to the opening balance of accumulated deficit as of the first day of fiscal year 2016, the earliest period presented, which we expect to be
$5.1 million
.
The expected impact of the new guidance is summarized below. In addition to these expected impacts to our financial results, the Company continues to evaluate the impact the adoption of this new guidance will have on financial statement disclosures, in addition to evaluating business processes and internal controls related to revenue recognition to assist in the ongoing application of the new guidance.
Franchise Fees
The adoption of the new guidance will change the timing of recognition of initial franchise fees, development fees, territory fees for our international business, and renewal and transfer fees. Currently, these fees are generally recognized upfront upon either opening of the respective restaurant, when a renewal agreement becomes effective, or upon transfer of a franchise agreement. The new guidance will generally require these fees to be recognized over the term of the related franchise license for the respective restaurant, which will result in an impact to revenue recognized for initial franchise fees and renewal fees. The new guidance will not change the recognition of royalty income.
Advertising
The adoption of the new guidance will change the reporting of advertising fund contributions from franchisees and the related advertising fund expenditures, which are not currently included in the consolidated statements of operations. The new guidance requires these advertising fund contributions and expenditures to be reported on a gross basis in the consolidated statements of operations, which will have an impact to our total revenues and expenses. However, we expect such advertising fund contributions and expenditures will be largely offsetting and therefore do not expect a significant impact on our reported net income. Additionally, advertising costs that have been incurred by the Company outside of the advertising funds have historically been included within general and administrative expenses, net, but will be included within advertising expenses in the consolidated statements of operations. Advertising expenses incurred by company-owned restaurants will continue to be included within cost of sales in the consolidated statements of operations.
F-11
The table below presents the expected effects upon adoption these changes would have had on the Company’s financial statements in 2017 and 2016 (amounts in thousands, except per share data):
|
Fiscal Year 2017
|
Fiscal Year 2016
|
||||||||||||||||||||||
|
As reported
|
Effects of Adoption
|
Upon Adoption
|
As reported
|
Effects of Adoption
|
Upon Adoption
|
||||||||||||||||||
|
Royalty revenue and franchise fees
|
$
|
68,483
|
|
$
|
(2,407
|
)
|
$
|
66,076
|
|
$
|
57,071
|
|
$
|
(2,596
|
)
|
$
|
54,475
|
|
|||||
|
Advertising fees and related income
|
—
|
|
30,174
|
|
30,174
|
|
—
|
|
14,561
|
|
14,561
|
|
|||||||||||
|
Advertising expenses
|
—
|
|
32,427
|
|
32,427
|
|
—
|
|
13,849
|
|
13,849
|
|
|||||||||||
|
Selling, general and administrative
|
37,151
|
|
(2,253
|
)
|
34,898
|
|
33,840
|
|
712
|
|
34,552
|
|
|||||||||||
|
Net income
|
$
|
27,304
|
|
$
|
(3,364
|
)
|
$
|
23,940
|
|
$
|
15,434
|
|
$
|
(1,665
|
)
|
$
|
13,769
|
|
|||||
|
Basic EPS
|
$
|
0.94
|
|
$
|
(0.12
|
)
|
$
|
0.82
|
|
$
|
0.54
|
|
$
|
(0.06
|
)
|
$
|
0.48
|
|
|||||
|
Diluted EPS
|
$
|
0.93
|
|
$
|
(0.11
|
)
|
$
|
0.82
|
|
$
|
0.53
|
|
$
|
(0.06
|
)
|
$
|
0.47
|
|
|||||
In February 2016, the FASB issued ASU 2016-02,
Leases (Topic 842)
. ASU 2016-02 amends the existing accounting standards for lease accounting, including requiring lessees to recognize most leases on their balance sheets and making targeted changes to lessor accounting. ASU 2016-02 will be effective beginning in the first quarter of 2019. Early adoption of ASU 2016-02 as of its issuance is permitted. The new leases standard requires a modified retrospective transition approach for all leases existing at, or entered into after, the date of initial application, with an option to use certain transition relief. The Company is currently evaluating the impact of adopting the new leases standard on the consolidated financial statements.
In March 2016, the FASB issued ASU 2016-09,
Compensation - Stock Compensation (Topic 718): Improvements to Employee Share-Based Payment Accounting
, which was issued to simplify accounting for several aspects of share-based payment transactions, including the income tax impact, classification on the statement of cash flows and forfeitures. The Company adopted this new standard on January 1, 2017. As a result, the recognition of excess tax benefits are reflected in our provision for income taxes in the Consolidated Statements of Operations rather than Stockholders’ deficit in the Consolidated Balance Sheet for all periods after fiscal year 2016. This provision was required to be applied prospectively. For the fiscal year ended
December 30, 2017
, we recognized
$2.5 million
of excess tax benefits in income tax expense in the Consolidated Statements of Operations.
Excess tax benefits are included in cash flows from operating activities rather than cash flows from financing activities in the Consolidated Statement of Cash Flows. We elected to apply this change in presentation retrospectively, and thus, prior periods have been adjusted, resulting in an increase to cash provided by operating activities and cash used in financing activities of
$1.2 million
and
$0.8 million
for the fiscal years ended
December 31, 2016
and
December 26, 2015
, respectively. This new standard allows entities to make an accounting policy election to either estimate the number of equity awards that are expected to vest, as previously required, or account for forfeitures when they occur. We have elected to recognize forfeitures in the period they occur. This change in accounting policy did not result in a material impact to the Consolidated Statements of Operations.
(2)
Earnings Per Share
Basic earnings per share is computed by dividing income available to common shareholders by the weighted average number of common shares outstanding for the reporting period. Diluted earnings per share reflects the potential dilution that could occur if securities or other contracts to issue common stock were exercised or converted into common stock. For the calculation of diluted net income per share, the basic weighted average number of shares is increased by the dilutive effect of stock options and restricted stock units, determined using the treasury stock method. We had approximately
6,000
,
4,000
and
11,000
equity awards outstanding at
December 30, 2017
,
December 31, 2016
, and
December 26, 2015
, respectively, that were not included in the dilutive earnings per share calculation because the effect would have been anti-dilutive.
F-12
Basic weighted average shares outstanding is reconciled to diluted weighted average shares outstanding as follows (in thousands):
|
Fiscal Year
|
|||||||||
|
December 30,
2017 |
December 31,
2016 |
December 26,
2015 |
|||||||
|
Basic weighted average shares outstanding
|
29,025
|
|
28,637
|
|
27,497
|
|
|||
|
Dilutive shares
|
399
|
|
346
|
|
319
|
|
|||
|
Diluted weighted average shares outstanding
|
29,424
|
|
28,983
|
|
27,816
|
|
|||
(3) Dividends
On
August 3, 2017
, the Company’s Board of Directors declared a quarterly dividend of
$0.07
per share of common stock for shareholders of record as of
September 3, 2017
, which was paid on
September 18, 2017
, totaling
$2.0 million
. On
November 2, 2017
, the Company’s Board of Directors declared a quarterly dividend of
$0.07
per share of common stock for shareholders of record as of
December 4, 2017
, to be paid on
December 19, 2017
, totaling approximately
$2.0 million
.
Subsequent to the fourth quarter, on
January 30, 2018
, the Board of Directors of the Company declared a special cash dividend of
$3.17
per share payable on
February 14, 2018
to its holders of common stock of record as of
February 9, 2018
. Additionally, on
February 22, 2018
, the Company’s Board of Directors declared a quarterly dividend of
$0.07
per share of common stock for shareholders of record as of
March 9, 2018
, to be paid on
March 23, 2018
, totaling approximately
$2.1 million
.
(4) Fair Value Measurements
Fair value is the price that would be received upon sale of an asset or paid upon transfer of a liability in an orderly transaction between market participants at the measurement date and in the principal or most advantageous market for that asset or liability. Assets and liabilities are classified using a fair value hierarchy that prioritizes the inputs to valuation techniques used to measure fair value as follows:
Level 1 - Unadjusted quoted prices for identical instruments traded in active markets.
Level 2 - Observable market-based inputs or unobservable inputs corroborated by market data.
Level 3 - Unobservable inputs reflecting management’s estimates and assumptions.
The carrying values of cash and cash equivalents, accounts receivable and accounts payable approximate fair value due to their short-term nature. Fair value of debt is determined on a non-recurring basis, which results are summarized as follows (in thousands):
|
|
Fair Value
Hierarchy
|
|
December 30, 2017
|
|
December 31, 2016
|
||||||||||||
|
|
|
Carrying
Value
|
|
Fair Value
|
|
Carrying
Value
|
|
Fair Value
|
|||||||||
|
Senior Secured Credit Facility:
|
|||||||||||||||||
|
Term loan facility
(1)
|
Level 2
|
$
|
64,750
|
|
$
|
64,750
|
|
$
|
68,250
|
|
$
|
68,250
|
|
||||
|
Revolving credit facility
(1)
|
Level 2
|
$
|
69,000
|
|
$
|
69,000
|
|
$
|
83,000
|
|
$
|
83,000
|
|
||||
(1)
The fair value of long-term debt was estimated using available market information.
The Company also measures certain non-financial assets at fair value on a non-recurring basis, primarily long-lived assets, intangible assets and goodwill, in connection with our periodic evaluations of such assets for potential impairment.
F-13
(5)
Accounts Receivable, net
Accounts receivables, net, consist of the following (in thousands):
|
|
December 30,
2017 |
|
December 31,
2016 |
||||
|
Vendor rebates receivable
|
$
|
2,145
|
|
$
|
1,459
|
|
|
|
Royalties receivable
|
987
|
|
883
|
|
|||
|
Gift card receivable
|
1,184
|
|
672
|
|
|||
|
Other receivables, net
|
251
|
|
185
|
|
|||
|
Accounts receivable, net
|
$
|
4,567
|
|
$
|
3,199
|
|
|
(6) Property and Equipment
Property and equipment, net consisted of the following (in thousands):
|
|
December 30,
2017 |
|
December 31,
2016 |
||||
|
Equipment, furniture and fixtures
|
$
|
9,298
|
|
|
$
|
7,682
|
|
|
Leasehold improvements
|
7,005
|
|
|
6,081
|
|
||
|
Construction in progress
|
183
|
|
|
201
|
|
||
|
Property and equipment, gross
|
16,486
|
|
|
13,964
|
|
||
|
Less: accumulated depreciation
|
(10,660
|
)
|
|
(8,965
|
)
|
||
|
Property and equipment, net
|
$
|
5,826
|
|
|
$
|
4,999
|
|
Depreciation expense was
$1.9 million
,
$1.6 million
and
$1.3 million
for the fiscal years ended
December 30, 2017
,
December 31, 2016
and
December 26, 2015
, respectively.
(7)
Intangible Assets and Goodwill
The Company’s goodwill and other intangible assets arose from Wingstop’s acquisition of the equity interests of WHI in April 2010, as well as the acquisition of restaurants from franchisees in 2017. Goodwill has been allocated to
two
reporting units, company-owned restaurants and franchised restaurants and represents the excess of purchase consideration transferred for the respective reporting unit over the fair value of the business at the time of the acquisition. See Note 16 for the allocation of goodwill among the
two
reporting units.
The following is a summary of goodwill balances and activity (in thousands):
|
December 30,
2017 |
December 31,
2016 |
||||||
|
Balance, beginning of period
|
$
|
45,128
|
|
$
|
45,128
|
|
|
|
Acquisition of restaurants
|
1,429
|
|
—
|
|
|||
|
Balance, end of period
|
$
|
46,557
|
|
$
|
45,128
|
|
|
F-14
Intangible assets, excluding goodwill, consisted of the following (in thousands):
|
|
December 30,
2017 |
|
December 31,
2016 |
|
Weighted Average Amortization Period
(in years)
|
||||
|
Intangible assets:
|
|
|
|
|
|
|
|||
|
Trademarks
|
$
|
32,700
|
|
$
|
32,700
|
|
|||
|
Indefinite-lived assets
|
32,700
|
|
32,700
|
|
|||||
|
Customer relationships
|
26,300
|
|
26,300
|
|
20.0
|
||||
|
Franchise rights
(1)
|
2,323
|
|
—
|
|
7.5
|
||||
|
Proprietary software
(1)
|
115
|
|
115
|
|
5.0
|
||||
|
Noncompete agreements
(1)
|
250
|
|
250
|
|
2.8
|
||||
|
Less: accumulated amortization
|
(11,249
|
)
|
(9,751
|
)
|
|||||
|
Definite-lived assets
|
17,739
|
|
16,914
|
|
18.8
|
||||
|
Intangible assets, net
|
$
|
50,439
|
|
$
|
49,614
|
|
|||
|
(1)
Included within Other non-current assets net of associated accumulated amortization within the Consolidated Balance Sheets.
|
|||||||||
Amortization expense for definite-lived intangibles was
$1.5 million
for fiscal year
2017
and
$1.4 million
for fiscal years
2016
and
2015
. Estimated amortization expense, principally related to customer relationships, for the five succeeding years and the aggregate thereafter is (in thousands):
|
Fiscal year 2018
|
$
|
1,661
|
|
|
Fiscal year 2019
|
1,649
|
|
|
|
Fiscal year 2020
|
1,637
|
|
|
|
Fiscal year 2021
|
1,625
|
|
|
|
Fiscal year 2022
|
1,620
|
|
|
|
Thereafter
|
9,547
|
|
|
|
Total
|
$
|
17,739
|
|
(8) Prepaid Expenses and Other Current Assets and Other Current Liabilities
Prepaid expenses and other current assets consisted of the following (in thousands):
|
|
December 30,
2017 |
December 31,
2016 |
|||||
|
Prepaid expenses
|
$
|
946
|
|
$
|
1,021
|
|
|
|
Federal income tax receivable
|
2,500
|
|
—
|
|
|||
|
Prepaid gift card expenses
|
672
|
|
387
|
|
|||
|
Inventories
|
216
|
|
226
|
|
|||
|
Total
|
$
|
4,334
|
|
$
|
1,634
|
|
|
Other current liabilities consisted of the following (in thousands):
|
|
December 30,
2017 |
December 31,
2016 |
|||||
|
Accrued payroll and bonuses
|
$
|
4,192
|
|
$
|
3,880
|
|
|
|
Current portion of deferred revenues
|
1,795
|
|
1,547
|
|
|||
|
Gift card liability
|
2,074
|
|
936
|
|
|||
|
Taxes payable
|
163
|
|
895
|
|
|||
|
Other accrued liabilities
|
2,459
|
|
1,983
|
|
|||
|
Total
|
$
|
10,683
|
|
$
|
9,241
|
|
|
F-15
(9)
Income Taxes
On December 22, 2017, the Tax Cuts and Jobs Act, (the “TCJA”) was enacted. The TCJA includes a number of changes to existing U.S. tax laws that impact the Company, most notably a reduction of the U.S. corporate tax rate from
35%
to
21%
, for tax years beginning after December 31, 2017. We recorded a benefit of
$5.5 million
in deferred income tax expense for the remeasurement of our net deferred tax liability at the
21%
tax rate. The TCJA also provides for acceleration of depreciation for certain assets placed into service after September 27, 2017, as well as prospective changes beginning in 2018, including additional limitations on deductibility of executive compensation and employee meal benefits.
The
$5.5 million
benefit represents what we believe is the impact of the TCJA. As the benefit is based on currently available information and interpretations, which are continuing to evolve, the benefit should be considered provisional. We will continue to analyze additional information and guidance related to the TCJA as supplemental legislation, regulatory guidance, or evolving technical interpretations become available. The final impacts may differ from the recorded amounts as of December 31, 2017, and we will continue to refine such amounts within the measurement period provided by Staff Accounting Bulletin No. 118. We expect to complete our analysis no later than the fourth quarter of 2018.
Income tax expense (benefit) for the fiscal years
2017
,
2016
and
2015
consists of the following (in thousands):
|
Fiscal Year
|
|||||||||||
|
|
December 30,
2017 |
December 31,
2016 |
December 26,
2015 |
||||||||
|
Current expense
|
|
|
|
|
|
|
|||||
|
Federal
|
$
|
6,204
|
|
$
|
8,854
|
|
$
|
5,813
|
|
||
|
State
|
800
|
|
847
|
|
736
|
|
|||||
|
Foreign
|
346
|
|
132
|
|
236
|
|
|||||
|
Deferred expense (benefit)
|
|||||||||||
|
Federal
|
(3,645
|
)
|
(662
|
)
|
(802
|
)
|
|||||
|
State
|
140
|
|
(52
|
)
|
(244
|
)
|
|||||
|
Income tax expense
|
$
|
3,845
|
|
$
|
9,119
|
|
$
|
5,739
|
|
||
A reconciliation of income tax at the United States federal statutory tax rate (using a statutory tax rate of
35%
) to income tax expense for fiscal years
2017
,
2016
and
2015
in dollars is as follows (in thousands):
|
Fiscal Year
|
|||||||||||
|
December 30,
2017 |
December 31,
2016 |
December 26,
2015 |
|||||||||
|
Expected income tax expense at statutory rate
|
$
|
10,902
|
|
$
|
8,594
|
|
$
|
5,546
|
|
||
|
Tax Act impact on deferred taxes
|
(5,473
|
)
|
—
|
|
—
|
|
|||||
|
Permanent differences
|
(2,300
|
)
|
92
|
|
64
|
|
|||||
|
State tax expense, net of federal benefit
|
616
|
|
395
|
|
544
|
|
|||||
|
Foreign tax expense
|
347
|
|
132
|
|
236
|
|
|||||
|
Foreign tax credits
|
(347
|
)
|
(132
|
)
|
(236
|
)
|
|||||
|
Increase in unrecognized tax benefit
|
114
|
|
185
|
|
104
|
|
|||||
|
Valuation allowance
|
—
|
|
—
|
|
(317
|
)
|
|||||
|
Other
|
(14
|
)
|
(147
|
)
|
(202
|
)
|
|||||
|
Income tax expense
|
$
|
3,845
|
|
$
|
9,119
|
|
$
|
5,739
|
|
||
F-16
The components of deferred tax assets (liabilities) are as follows (in thousands):
|
|
December 30, 2017
|
December 31, 2016
|
|||||
|
Deferred tax assets:
|
|
|
|
|
|
||
|
Deferred revenue
|
$
|
1,403
|
|
$
|
3,394
|
|
|
|
Accrued bonus
|
53
|
|
706
|
|
|||
|
Property and equipment
|
—
|
|
136
|
|
|||
|
Stock based compensation
|
607
|
|
818
|
|
|||
|
Deferred rent
|
270
|
|
453
|
|
|||
|
Intangible assets
|
191
|
|
593
|
|
|||
|
Other
|
157
|
|
248
|
|
|||
|
Net operating loss carryforwards and credits
|
443
|
|
443
|
|
|||
|
Valuation allowance
|
(482
|
)
|
(482
|
)
|
|||
|
|
2,642
|
|
6,309
|
|
|||
|
Deferred tax liabilities:
|
|||||||
|
Intangible assets
|
(11,302
|
)
|
(18,613
|
)
|
|||
|
Property and equipment
|
(139
|
)
|
—
|
|
|||
|
|
(11,441
|
)
|
(18,613
|
)
|
|||
|
Net deferred tax liability
|
$
|
(8,799
|
)
|
$
|
(12,304
|
)
|
|
The Company had a state net operating loss carry-forward of
$23.3 million
at
December 30, 2017
and
December 31, 2016
. The state net operating loss carry forwards begin to expire in 2030.
As of
December 30, 2017
, the Company had a valuation allowance of
$482,000
against its deferred tax assets. In assessing whether a deferred tax asset will be realized, the Company considers whether it is more likely than not that some portion, or all of the deferred tax assets will not be realized. The Company considers the reversal of existing taxable temporary differences, projected future taxable income and tax planning strategies in making this assessment. Based upon the level of historical taxable income and projections for future taxable income over the periods in which the deferred tax assets are deductible, we believe it is more likely than not we will realize a portion of the benefits of the federal and state deductible differences with the exception of
$39,000
and
$443,000
, respectively.
As of
December 31, 2016
, the Company had not recognized a deferred tax asset for excess tax benefits of
$4.3 million
related to net operating losses that result from excess stock-based compensation. Beginning in 2017, losses resulting from excess stock-based compensation are recognized immediately as a result of the adoption of ASU 2016-09.
The Company files income tax returns, which are periodically audited by various federal and state jurisdictions. The Company was not subject to federal or state tax examinations prior to 2009. In fiscal 2013 the Internal Revenue Service (“IRS”) commenced an examination of the Company’s U.S. income tax returns for fiscal 2010 and 2011, which was subsequently settled and closed.
F-17
A reconciliation of the beginning and ending amount of unrecognized tax benefits is as follows (in thousands):
|
Balance as of December 27, 2014
|
$
|
129
|
|
|
Additions for tax positions of prior years
|
—
|
|
|
|
Subtractions for tax positions of prior years
|
—
|
|
|
|
Additions for tax positions of current year
|
336
|
|
|
|
Subtractions for tax positions of current year
|
—
|
|
|
|
Balance as of December 26, 2015
|
465
|
|
|
|
Additions for tax positions of prior years
|
—
|
|
|
|
Subtractions for tax positions of prior years
|
—
|
|
|
|
Additions for tax positions of current year
|
137
|
|
|
|
Subtractions for tax positions of current year
|
—
|
|
|
|
Balance as of December 31, 2016
|
602
|
|
|
|
Additions for tax positions of prior years
|
—
|
|
|
|
Subtractions for tax positions of prior years
|
—
|
|
|
|
Additions for tax positions of current year
|
78
|
|
|
|
Subtractions for tax positions of current year
|
—
|
|
|
|
Balance as of December 30, 2017
|
$
|
680
|
|
The Company currently anticipates that
none
of the
$680,000
of unrecognized tax benefits will be recognized as of
December 30, 2017
.
As of
December 30, 2017
and
December 31, 2016
, the accrued interest and penalties on the unrecognized tax benefits were
$151,000
and
$116,000
, respectively, excluding any related income tax benefits. The Company recorded accrued interest related to the unrecognized tax benefits and penalties as a component of the provision for income taxes recognized in the Consolidated Statement of Operations.
(10)
Debt Obligations
Long-term debt consists of the following components (in thousands):
|
December 30, 2017
|
December 31, 2016
|
||||||
|
Term loan
|
$
|
64,750
|
|
$
|
68,250
|
|
|
|
Revolving credit facility
|
69,000
|
|
83,000
|
|
|||
|
Debt issuance costs
|
(409
|
)
|
(533
|
)
|
|||
|
Less: current portion of debt
|
(3,500
|
)
|
(3,500
|
)
|
|||
|
Long-term debt, net
|
$
|
129,841
|
|
$
|
147,217
|
|
|
On June 30, 2016, the Company entered into a
$180.0 million
new senior secured credit facility (the “2016 Facility”), which replaced the Company’s second amended and restated credit facility dated March 18, 2015 (the “2015 Facility”). The 2016 Facility includes a term loan facility in an aggregate amount of
$70.0 million
and a revolving credit facility up to an aggregate amount of
$110.0 million
. The Company used the proceeds from the 2016 Facility and cash on hand to refinance
$85.5 million
of indebtedness under the 2015 Facility and to pay a dividend of
$83.3 million
to its shareholders. Borrowings under the term loan facility bear interest, payable quarterly, at our option, at the base rate plus a margin (
1.00%
to
2.00%
, dependent on the Company’s reported leverage ratio) or LIBOR plus a margin (
2.00%
to
3.00%
, dependent on the Company’s reported leverage ratio). The 2016 Facility matures in
June 2021
. As of
December 30, 2017
and
December 31, 2016
, the term loan facility had an outstanding balance of
$64.8 million
and
$68.3 million
, respectively, which bears interest at
3.69%
and
3.27%
, respectively. During the fiscal year ended
December 30, 2017
, the Company made payments on the term loan totaling
$3.5 million
.
The revolving credit facility bears interest, payable quarterly, at our option, at the base rate plus a margin or LIBOR plus a margin, with all unpaid amounts due at maturity in
June 2021
. Any unused portion of the revolving credit facility bears a commitment fee (
0.375%
to
0.50%
, dependent on the Company’s reported leverage ratio). As of
December 30, 2017
and
December 31, 2016
, the revolving credit facility had an outstanding balance of
$69.0 million
and
$83.0 million
, respectively, which bears interest at
3.69%
and
3.27%
, respectively. During the fiscal year ended
December 30, 2017
, the Company made payments on the revolving credit
F-18
facility totaling
$17.5 million
and borrowings on the revolving credit facility of
$3.5 million
. During the fiscal year ended
December 31, 2016
, the Company made payments on the revolving credit facility totaling
$12.0 million
.
In conjunction with the 2016 Facility, the Company evaluated the refinancing of the 2015 Facility and determined
$90.0 million
was accounted for as a debt modification and
$90.0 million
was new debt issuance. The Company incurred
$1.3 million
in financing costs of which
$0.1 million
was expensed and
$1.2 million
was capitalized and is being amortized using the effective interest rate method. Previously capitalized financing costs of
$0.2 million
were expensed as a result of the refinancing during the current period.
In
March 2015
, the Company amended and restated the senior secured credit facility. In connection with the 2015 Facility, the facility size was increased from
$107.5 million
to
$137.5 million
and was comprised of a
$132.5 million
term loan and a
$5.0 million
revolving credit facility. The Company used a portion of the proceeds from the 2015 Facility and cash on hand to pay a dividend of
$48.0 million
to its shareholders. Borrowings under the facility bore interest, payable quarterly, at our option, at the base rate plus a margin (
1.50%
to
2.25%
, dependent on the Company’s reported leverage ratio) or LIBOR plus a margin (
2.50%
to
3.25%
, dependent on our reported leverage ratio). The 2015 Facility had a maturity date of
March 2020
.
In conjunction with the 2015 Facility, the Company evaluated the refinancing of the amended facility and determined substantially all of the
$132.5 million
was accounted for as a debt modification. The Company incurred
$728,000
in financing costs of which
$528,000
was expensed and
$200,000
was capitalized.
In June 2015, in connection with the IPO, the Company used a portion of the IPO proceeds to make a
$32.0 million
prepayment of the outstanding principle balance of the 2015 Facility. As a result of the prepayment, the Company expensed
$172,000
of previously capitalized financing costs, which are included in Other (income) expense in the Consolidated Statements of Operations.
The credit facility is secured by substantially all assets of the Company and requires compliance with certain financial and non-financial covenants. As of
December 30, 2017
, the Company was in compliance with all financial covenants.
As of
December 30, 2017
, the scheduled principle payments on debt were as follows (in thousands):
|
Fiscal year 2018
|
$
|
3,500
|
|
|
Fiscal year 2019
|
2,625
|
|
|
|
Fiscal year 2020
|
3,500
|
|
|
|
Fiscal year 2021
|
124,125
|
|
|
|
Total
|
$
|
133,750
|
|
(11) Commitments and Contingencies
WRI leases certain office and retail space and equipment under non-cancelable operating leases with terms expiring at various dates through
July 2032
.
A schedule of future minimum rental payments required under our operating leases, excluding contingent rent, that have initial or remaining non-cancelable lease terms in excess of one year, as of
December 30, 2017
, is as follows (in thousands):
|
Fiscal year 2018
|
$
|
1,783
|
|
|
Fiscal year 2019
|
1,561
|
|
|
|
Fiscal year 2020
|
1,436
|
|
|
|
Fiscal year 2021
|
1,282
|
|
|
|
Fiscal year 2022
|
1,226
|
|
|
|
Thereafter
|
4,037
|
|
|
|
Total
|
$
|
11,325
|
|
Rent expense under cancelable and non-cancelable leases was
$2.0 million
,
$1.9 million
, and
$2.0 million
for the fiscal years ended
December 30, 2017
,
December 31, 2016
, and
December 26, 2015
, respectively.
The Company is subject to legal proceedings, claims and liabilities, such as employment-related claims and other cases, which arise in the ordinary course of business and are generally covered by insurance. In the opinion of management, the amount of
F-19
ultimate liability with respect to those actions should not have a material adverse impact on financial position, results of operations or cash flows.
Many of the food products the Company purchases are subject to changes in the price and availability of food commodities, including chicken. The Company works with its suppliers and uses a mix of forward pricing protocols for certain items under which we agree with our supplier on fixed prices for deliveries at some time in the future, fixed pricing protocols under which we agree on a fixed price with our supplier for the duration of that protocol, and formula pricing protocols under which the prices we pay are based on a specified formula related to the prices of the goods, such as spot prices.
The Company’s use of any forward pricing arrangements varies substantially from time to time and these arrangements tend to cover relatively short periods (i.e., typically twelve months or less). Such contracts are used in the normal purchases of our food products and not for speculative purposes, and as such are not required to be evaluated as derivative instruments. The Company does not enter into futures contracts or other derivative instruments.
(12)
Employee Benefit Plan
The Company sponsors a 401(k) profit sharing plan for all employees who are eligible based upon age and length of service. The Company made matching contributions of approximately
$450,000
,
$425,000
and
$332,000
for fiscal years
2017
,
2016
and
2015
, respectively.
(13)
Stock-Based Compensation
In connection with the IPO, the Wingstop Inc. 2015 Omnibus Equity Incentive Plan, or the 2015 Plan, was adopted and became effective upon completion of the offering. The 2015 Plan provides for the grant or award of stock options, stock appreciation rights, restricted stock awards, restricted stock units, performance unit awards, performance share awards, cash-based awards and other stock-based awards to employees, directors, and other eligible persons. Under the 2015 Plan, Wingstop had
2,143,589
shares authorized for issuance,
263,876
shares of common stock issuable upon exercise of currently outstanding options or vesting of restricted stock awards, and
1,871,698
shares available for future grants as of
December 30, 2017
.
The options and restricted stock awards granted under the 2015 Plan are subject to either service-based or performance-based vesting. Service-based options contain a service-based, or time-based, vesting provision. Performance-based options contain performance-based vesting provisions based on the Company meeting certain Adjusted EBITDA profitability targets for each fiscal year during the vesting period. In the event of a change in control of the Company (as defined in the 2015 Plan), each outstanding award will be treated as the compensation committee determines, either by the terms of the award agreement or by resolution adopted by the compensation committee, including without limitation, that the awards may be vested, assumed replaced with substitute awards, cashed-out or terminated.
Additionally, Wingstop had previously adopted the 2010 Stock Option Plan, or the 2010 Plan, which permits the granting of awards to employees, directors and other eligible persons of the Company in the form of stock options. The Plan is administered by Wingstop’s Board of Directors. The options granted under the 2010 Plan are generally exercisable within a
10
-year period from the date of grant.
Under the 2010 Plan, options are subject to either service-based or performance-based vesting. Service-based options contain a service-based, or time-based, vesting provision. Performance-based options contain performance-based vesting provisions based on the Company meeting certain Adjusted EBITDA profitability targets for each fiscal year during the vesting period. Any options that have not vested prior to a change of control or do not vest in connection with a change of control or do vest but are not exercised will be forfeited by the grantee upon a change of control for no consideration. The IPO in June 2015 was not considered a change of control event as defined in the 2010 Plan. Options issued and outstanding expire on various dates up to fiscal year
2025
.
Under the 2010 Plan, Wingstop had
3,304,115
shares authorized for issuance. There are
350,063
shares of common stock issuable upon exercise of currently outstanding options, and
456,407
shares available for future grants at
December 30, 2017
.
F-20
Stock Options
The following table summarizes stock option activity (in thousands, except per share data):
|
|
Stock Options
|
Weighted Average Exercise Price
|
Aggregate Intrinsic Value
|
Weighted Average Remaining Term
|
||||||||
|
Outstanding - December 27, 2014
|
1,466
|
|
$
|
3.74
|
|
$
|
7,551
|
|
8.0
|
|||
|
Granted
|
106
|
|
16.75
|
|
||||||||
|
Exercised
|
(329
|
)
|
1.45
|
|
||||||||
|
Canceled
|
(66
|
)
|
1.17
|
|
||||||||
|
Outstanding - December 26, 2015
|
1,177
|
|
4.66
|
|
$
|
21,059
|
|
7.7
|
||||
|
Granted
|
36
|
|
24.34
|
|
||||||||
|
Exercised
|
(166
|
)
|
2.92
|
|
||||||||
|
Canceled
|
(192
|
)
|
5.99
|
|
||||||||
|
Outstanding - December 31, 2016
|
855
|
|
5.14
|
|
$
|
20,905
|
|
6.8
|
||||
|
Granted
|
—
|
|
—
|
|
||||||||
|
Exercised
|
(326
|
)
|
4.04
|
|
||||||||
|
Canceled
|
(109
|
)
|
7.23
|
|
||||||||
|
Outstanding - December 30, 2017
|
420
|
|
$
|
5.45
|
|
$
|
14,068
|
|
5.7
|
|||
The total grant-date fair value of stock options vested during each of the fiscal years
2017
,
2016
and
2015
was
$1.0 million
,
$1.0 million
and
$0.7 million
, respectively. The total intrinsic value of stock options exercised was
$8.1 million
,
$3.8 million
and
$3.0 million
for fiscal years
2017
,
2016
and
2015
, respectively.
Stock-based compensation is measured at the grant date, based on the calculated fair value of the award, and is recognized as an expense over the requisite employee service period (generally the vesting period of the grant). The Company recognized approximately
$1.9 million
,
$1.2 million
and
$1.2 million
in stock compensation expense for fiscal years
2017
,
2016
and
2015
, respectively, with a corresponding increase to additional paid-in-capital. Stock compensation expense is included in Selling, general and administrative expenses in the Consolidated Statements of Operations.
A summary of the status of non-vested shares as of
December 30, 2017
and the changes during the period then ended is presented below (in thousands, except per share data):
|
|
December 30, 2017
|
|||||
|
|
Shares
|
|
Weighted average
grant-date fair value
|
|||
|
Non-vested shares at beginning of year
|
500
|
|
$
|
7.19
|
|
|
|
Granted
|
—
|
|
$
|
—
|
|
|
|
Vested
|
(220
|
)
|
$
|
5.33
|
|
|
|
Forfeited
|
(109
|
)
|
$
|
7.23
|
|
|
|
Non-vested shares at end of year
|
171
|
|
$
|
9.54
|
|
|
As of
December 30, 2017
, there was
$0.8 million
of total unrecognized stock compensation expense related to non-vested stock options and restricted stock awards, which will be recognized over a weighted average period of approximately
1.5 years
.
F-21
The estimated fair value of each option granted is calculated using the Black-Scholes option-pricing model. Expected volatilities are based on volatilities from publicly traded companies operating in the Company’s industry. The Company uses historical data to estimate expected employee forfeiture of stock options. The expected life of options granted is management’s best estimate using recent and expected transactions. The risk-free rate for periods within the expected life of the option is based on the U.S. Treasury yield curve in effect at the time of grant. The weighted-average assumptions used in the model were as follows:
|
|
2016
|
|
2015
|
||||
|
Risk-free interest
|
1.44
|
%
|
|
1.96
|
%
|
||
|
Expected life (years)
|
6.2
|
|
|
6.5
|
|
||
|
Expected dividend yield
|
0
|
%
|
|
0
|
%
|
||
|
Volatility
|
52.0
|
%
|
|
52.0
|
%
|
||
|
Weighted-average Black-Scholes fair value per share at date of grant
|
$
|
13.74
|
|
$
|
8.87
|
|
|
The Company used the simplified method for determining the expected life of the options. In addition, assumptions made regarding forfeitures in determining the remaining unamortized share-based compensation are re-evaluated periodically.
Restricted Stock Units and Performance Stock Units
The following table summarizes activity related to restricted stock units and performance stock units (in thousands, except per share data):
|
Restricted Stock Units
|
Weighted Average Grant Date Fair Value
|
Performance Stock Units
|
Weighted Average Grant Date Fair Value
|
||||||||||
|
Outstanding - December 31, 2016
|
—
|
|
$
|
—
|
|
—
|
|
$
|
—
|
|
|||
|
Granted
|
105
|
|
27.02
|
|
94
|
|
27.52
|
|
|||||
|
Released
|
—
|
|
—
|
|
—
|
|
—
|
|
|||||
|
Canceled
|
(11
|
)
|
26.30
|
|
(8
|
)
|
26.30
|
|
|||||
|
Outstanding - December 30, 2017
|
94
|
|
$
|
27.11
|
|
86
|
|
$
|
27.63
|
|
|||
The fair value of restricted stock units and performance stock units is based on the closing price on the date of grant. The restricted stock units granted during fiscal year
2017
vest over a three year service period. As of
December 30, 2017
, total unrecognized compensation expense related to unvested restricted stock units was
$1.9 million
which is expected to be recognized over a weighted-average period of
2.2 years
.
The performance stock units vest based on the outcome of certain performance criteria. For performance stock units granted during fiscal year
2017
, the amount of units that can be earned range from
0%
to
100%
of the number of performance awards granted, based on the achievement of certain adjusted EBITDA targets, as defined by the plan, over a performance period of one to three years. The compensation expense related to the performance stock units is recognized over the vesting period when the achievement of the performance conditions become probable. As of
December 30, 2017
, total unrecognized compensation expense related to unvested performance stock units was
$1.4 million
, which is expected to be recognized over a weighted-average period of
2.2 years
.
Restricted Stock Awards
The following table summarizes activity related to restricted stock awards (in thousands, except per share data):
|
Restricted Stock Awards
|
Weighted Average Grant Date Fair Value
|
|||||
|
Outstanding - December 31, 2016
|
12
|
|
$
|
25.59
|
|
|
|
Granted
|
10
|
|
29.68
|
|
||
|
Released
|
(4
|
)
|
26.06
|
|
||
|
Canceled
|
(3
|
)
|
27.62
|
|
||
|
Outstanding - December 30, 2017
|
15
|
|
$
|
27.89
|
|
|
F-22
The fair value of the non-vested restricted stock awards is based on the closing price on the date of grant. As of
December 30, 2017
, total unrecognized compensation expense related to unvested restricted stock awards was
$0.3 million
, which will be recognized over a weighted average period of approximately
2.2 years
.
Strike Price Reduction
During
2016
, the Board of Directors authorized a dividend in the amount of
$2.90
per share, or
$83.3 million
. In connection with the declaration and payment of the dividend, the exercise price of some of the outstanding options on July 12, 2016 was reduced by an amount of
$2.90
per share. During
2015
, the Board of Directors authorized a dividend in the amount of
$1.83
per share or
$48.0 million
. In connection with the declaration and payment of the dividend, the exercise price of some of the outstanding options on March 27, 2015 was reduced by an amount of
$1.83
per share. At each dividend date, management evaluated the option modification for incremental compensation expense and calculated
$94,000
and
$537,000
of total incremental compensation for the modifications during fiscal years
2016
and
2015
, respectively.
(14) Restaurant Acquisition
On
July 16, 2017
, the Company acquired
two
existing Wingstop restaurants from a franchisee. The total purchase price was
$3.9 million
and was paid in cash funded by operations and proceeds from our revolving credit facility. The results of operations of these locations are included in our Consolidated Statements of Operations since the date of acquisition. The acquisition was accounted for as a business combination.
The following table summarizes the final allocation of the purchase price to the estimated fair values of assets acquired and liabilities assumed at the date of the acquisition, inclusive of adjustments made during the measurement period (in thousands):
|
Final Purchase Price Allocation
|
|||
|
Inventory
|
$
|
16
|
|
|
Property and equipment
|
183
|
|
|
|
Reacquired franchise rights
|
2,323
|
|
|
|
Goodwill
|
1,429
|
|
|
|
Gift card liability
|
(2
|
)
|
|
|
Total purchase price
|
$
|
3,949
|
|
The excess of the purchase price over the aggregate fair value of assets acquired was allocated to goodwill and is attributable to the benefits expected as a result of the acquisition, including sales and growth opportunities. As of
December 30, 2017
,
$1.4 million
of the goodwill from the acquisition is expected to be deductible for federal income tax purposes.
Pro-forma financial information of the combined entities is not presented due to the immaterial impact of the financial results of the acquired restaurants on our consolidated financial statements.
The fair value measurement of tangible and intangible assets and liabilities as of the acquisition date is based on significant inputs not observed in the market and thus represents a Level 3 fair value measurement. Fair value measurements for reacquired franchise rights were determined using the income approach. Fair value measurements for property and equipment were determined using the cost approach.
(15)
Related Party Transactions
The Company was party to a management agreement with Roark Capital Management, LLC, or Roark Capital Management, an affiliate of Wingstop’s former majority shareholder (prior to the secondary offering completed in March, 2016). Pursuant to this management agreement, Roark Capital Management agreed to provide the Company with advice concerning finance, strategic planning and other services. In
June 2015
, the Company paid a one-time fee to Roark Capital Management in consideration for the termination of our management agreement of
$3.3 million
. The Company paid Roark Capital Management fees and expense reimbursement totaling
$3.5 million
for the fiscal year ended
December 26, 2015
, inclusive of the termination fee.
F-23
(16)
Business Segments
Information on segments and a reconciliation to income (loss) before taxes are as follows (in thousands):
|
Fiscal Year
|
|||||||||||
|
December 30,
2017 |
December 31,
2016 |
December 26,
2015 |
|||||||||
|
Revenue:
|
|||||||||||
|
Franchise segment
|
$
|
68,483
|
|
$
|
57,071
|
|
$
|
46,688
|
|
||
|
Company segment
|
37,069
|
|
34,288
|
|
31,281
|
|
|||||
|
Total segment revenue
|
$
|
105,552
|
|
$
|
91,359
|
|
$
|
77,969
|
|
||
|
Segment Profit:
|
|||||||||||
|
Franchise segment
|
$
|
31,637
|
|
$
|
25,850
|
|
$
|
19,701
|
|
||
|
Company segment
|
4,643
|
|
5,526
|
|
5,737
|
|
|||||
|
Total segment profit
|
36,280
|
|
31,376
|
|
|
25,438
|
|
||||
|
Corporate and other
(1)
|
—
|
|
2,173
|
|
5,720
|
|
|||||
|
Interest expense, net
|
5,131
|
|
4,396
|
|
3,477
|
|
|||||
|
Other (income) expense, net
|
—
|
|
254
|
|
396
|
|
|||||
|
Income before taxes
|
$
|
31,149
|
|
$
|
24,553
|
|
$
|
15,845
|
|
||
|
Depreciation and amortization:
|
|||||||||||
|
Franchise segment
|
$
|
2,220
|
|
$
|
2,092
|
|
$
|
1,812
|
|
||
|
Company segment
|
1,156
|
|
916
|
|
870
|
|
|||||
|
Total depreciation and amortization
|
3,376
|
|
3,008
|
|
2,682
|
|
|||||
|
Capital expenditures:
|
|||||||||||
|
Franchise segment
|
$
|
864
|
|
$
|
387
|
|
$
|
1,308
|
|
||
|
Company segment
(2)
|
1,671
|
|
1,669
|
|
607
|
|
|||||
|
Total capital expenditures
|
$
|
2,535
|
|
$
|
2,056
|
|
$
|
1,915
|
|
||
|
|
(1)
Corporate and other includes corporate related items not allocated to reportable segments and consists primarily of transaction costs associated with the refinancings of our credit agreement and our public offerings, and management fees (discussed in Note 15).
(2)
Company segment excludes capital expenditures related to the acquisition of restaurants from franchisees (discussed in Note 14).
Information on segment assets and a reconciliation to consolidated assets are as follows (in thousands):
|
As of
|
|||||||
|
December 30, 2017
|
December 31, 2016
|
||||||
|
Segment assets:
|
|||||||
|
Franchise segment
|
$
|
98,069
|
|
$
|
94,889
|
|
|
|
Company segment
|
14,166
|
|
9,864
|
|
|||
|
Total segment assets
|
112,235
|
|
104,753
|
|
|||
|
Corporate and other
(3)
|
7,601
|
|
7,047
|
|
|||
|
Total assets
|
$
|
119,836
|
|
$
|
111,800
|
|
|
(3)
Corporate and other includes corporate related items not allocated to reportable segments and consists primarily of cash and cash equivalents, advertising fund restricted assets and capitalized costs associated with the issuance of indebtedness.
F-24
|
Segment goodwill:
|
|||||||
|
Franchise segment
|
$
|
39,930
|
|
$
|
39,930
|
|
|
|
Company segment
|
6,627
|
|
5,198
|
|
|||
|
Total goodwill
|
$
|
46,557
|
|
$
|
45,128
|
|
|
(17) Quarterly Financial Data (unaudited)
The following tables set forth certain unaudited consolidated financial information for each of the four quarters in
2017
and
2016
(in thousands, except per share data):
|
Quarter Ended
|
|||||||||||||||||||||||||||||||
|
December 30, 2017
|
September 30, 2017
|
July 1, 2017
|
April 1, 2017
|
December 31, 2016
(1)
|
September 24, 2016
|
June 25, 2016
|
March 26, 2016
|
||||||||||||||||||||||||
|
Total revenue
|
$
|
28,285
|
|
$
|
26,026
|
|
$
|
24,672
|
|
$
|
26,569
|
|
$
|
24,752
|
|
$
|
21,810
|
|
$
|
22,723
|
|
$
|
22,074
|
|
|||||||
|
Operating income
|
9,404
|
|
9,178
|
|
8,747
|
|
8,952
|
|
8,255
|
|
6,080
|
|
7,240
|
|
7,628
|
|
|||||||||||||||
|
Net income
|
10,497
|
|
5,012
|
|
5,266
|
|
6,530
|
|
4,312
|
|
2,753
|
|
4,079
|
|
4,290
|
|
|||||||||||||||
|
Earnings per share
|
|||||||||||||||||||||||||||||||
|
Basic
|
$
|
0.36
|
|
$
|
0.17
|
|
$
|
0.18
|
|
$
|
0.23
|
|
$
|
0.15
|
|
$
|
0.10
|
|
$
|
0.14
|
|
$
|
0.15
|
|
|||||||
|
Diluted
|
$
|
0.36
|
|
$
|
0.17
|
|
$
|
0.18
|
|
$
|
0.22
|
|
$
|
0.15
|
|
$
|
0.09
|
|
$
|
0.14
|
|
$
|
0.15
|
|
|||||||
|
Weighted average shares outstanding
|
|||||||||||||||||||||||||||||||
|
Basic
|
29,094
|
|
29,081
|
|
29,032
|
|
28,895
|
|
28,745
|
|
28,725
|
|
28,646
|
|
28,586
|
|
|||||||||||||||
|
Diluted
|
29,459
|
|
29,384
|
|
29,394
|
|
29,336
|
|
29,114
|
|
29,014
|
|
28,989
|
|
28,967
|
|
|||||||||||||||
(1)
Fiscal 2016 consisted of 53 calendar weeks, with the fourth quarter containing 14 calendar weeks.
(18) Subsequent Events
Debt Recapitalization and Special Dividend
On January 30, 2018, the Company entered into an amended senior secured credit facility (the “2018 Facility”), which replaced the 2016 Facility. The 2018 Facility includes a term loan facility in an aggregate amount of
$100.0 million
and a revolving credit facility up to an aggregate amount of
$150.0 million
. The Company used the proceeds from the 2018 Facility to refinance
$133.8 million
of indebtedness under the 2016 Facility and to pay a dividend of approximately
$95 million
to its shareholders. Borrowings under the facility bear interest, payable quarterly, at our option, at the base rate plus a margin (
0.75%
to
1.75%
, dependent on the Company’s reported leverage ratio) or LIBOR plus a margin (
1.75%
to
2.75%
, dependent on the Company’s reported leverage ratio). The 2018 Facility matures in January 2023.
On January 30, 2018, the Board of Directors of the Company declared a special cash dividend of
$3.17
per share payable on February 14, 2018 to its holders of common stock of record as of February 9, 2018.
Restaurant Acquisition
On February 19, 2018, the Company acquired an existing restaurant from a franchisee. The total purchase price was
$1.9 million
and was paid in cash funded by operations and proceeds from our revolving credit facility. The acquisition will be accounted for as a business combination. The Company is still determining the estimated fair value of assets acquired and liabilities assumed. The excess of the purchase price over the aggregate fair value of assets acquired will be allocated to goodwill. The results of operations of these locations will be included in our consolidated statements of earnings as of the date of acquisition.
F-25
TABLE OF CONTENTS
Part IItem 1. BusinessItem 1A. Risk FactorsItem 1B. Unresolved Staff CommentsItem 2. PropertiesItem 3. Legal ProceedingsItem 4. Mine Safety DisclosuresPart IIItem 5. Market For Registrant S Common Equity, Related Stockholder Matters and Issuer Purchases Of Equity SecuritiesItem 6. Selected Historical Consolidated Financial and Other DataItem 7. Management S Discussion and Analysis Of Financial Condition and Results Of OperationsItem 7A. Quantitative and Qualitative Disclosures Of Market RisksItem 8. Financial Statements and Supplementary DataItem 9. Changes in and Disagreements with Accountants on Accounting and Financial DisclosureItem 9A. Controls and ProceduresItem 9B. Other InformationPart IIIItem 10. Directors, Executive Officers and Corporate GovernanceItem 11. Executive CompensationItem 12. Security Ownership Of Certain Beneficial Owners and Management and Related Stockholder MattersItem 13. Certain Relationships and Related Transactions, and Director IndependenceItem 14. Principal Accountant Fees and ServicesPart IVItem 15. Exhibits and Financial Statement Schedules