WILLIAMS COMPANIES, INC.
10-Ks and 10-Qs
|
|
|
|
|
|
|
|
|
|
|
|
|
|
|
|
|
|
|
|
|
|
|
|
|
|
|
|
|
|
|
|
|
|
|
|
|
|
|
|
|
|
|
|
|
|
|
|
|
|
|
|
|
|
|
|
UNITED STATES SECURITIES AND EXCHANGE COMMISSION
Washington, D.C. 20549
Form 10-K
(Mark One)
|
þ
|
ANNUAL REPORT PURSUANT TO SECTION 13 OR 15(d) OF THE SECURITIES EXCHANGE ACT OF 1934
|
|
For the fiscal year ended December 31, 2015
|
|
|
OR
|
|
|
¨
|
TRANSITION REPORT PURSUANT TO SECTION 13 OR 15(d) OF THE SECURITIES EXCHANGE ACT OF 1934
|
|
For the transition period from to
|
|
Commission file number 1-4174
The Williams Companies, Inc.
(Exact Name of Registrant as Specified in Its Charter)
|
Delaware
|
|
73-0569878
|
|
(State or Other Jurisdiction of
Incorporation or Organization)
|
|
(IRS Employer
Identification No.)
|
|
One Williams Center, Tulsa, Oklahoma
|
|
74172
|
|
(Address of Principal Executive Offices)
|
|
(Zip Code)
|
918-573-2000
(Registrant’s Telephone Number, Including Area Code)
Securities registered pursuant to Section 12(b) of the Act:
|
Title of Each Class
|
|
Name of Each Exchange on Which Registered
|
|
Common Stock, $1.00 par value
|
|
New York Stock Exchange
|
|
Preferred Stock Purchase Rights
|
|
New York Stock Exchange
|
Securities registered pursuant to Section 12(g) of the Act:
5.50% Junior Subordinated Convertible Debentures due 2033
I
ndicate by check mark if the registrant is a well-known seasoned issuer, as defined in Rule 405 of the Securities Act. Yes
þ
No
¨
Indicate by check mark if the registrant is not required to file reports pursuant to Section 13 or Section 15(d) of the Act. Yes
¨
No
þ
Indicate by check mark whether the registrant: (1) has filed all reports required to be filed by Section 13 or 15(d) of the Securities Exchange Act of 1934 during the preceding 12 months (or for such shorter period that the registrant was required to file such reports), and (2) has been subject to such filing requirements for the past 90 days. Yes
þ
No
¨
Indicate by check mark whether the registrant has submitted electronically and posted on its corporate Web site, if any, every Interactive Data File required to be submitted and posted pursuant to Rule 405 of Regulation S-T (§232.405 of this chapter) during the preceding 12 months (or for such shorter period that the registrant was required to submit and post such files). Yes
þ
No
¨
Indicate by check mark if disclosure of delinquent filers pursuant to Item 405 of Regulation S-K (§229.405 of this chapter) is not contained herein, and will not be contained, to the best of registrant’s knowledge, in definitive proxy or information statements incorporated by reference in Part III of this Form 10-K or any amendment to this Form 10-K.
þ
Indicate by check mark whether the registrant is a large accelerated filer, an accelerated filer, a non-accelerated filer, or a smaller reporting company. See the definitions of “large accelerated filer,” “accelerated filer” and “smaller reporting company” in Rule 12b-2 of the Exchange Act. (Check one):
|
Large accelerated filer
þ
|
Accelerated filer
¨
|
Non-accelerated filer
¨
|
Smaller reporting company
¨
|
||||||
|
(Do not check if a smaller reporting company)
|
|||||||||
Indicate by check mark whether the registrant is a shell company (as defined in Rule 12b-2 of the Act). Yes
¨
No
þ
The aggregate market value of the voting and non-voting common equity held by non-affiliates computed by reference to the price at which the common equity was last sold as of the last business day of the registrant’s most recently completed second quarter was approximately
$39,345,468,396
.
The number of shares outstanding of the registrant’s common stock outstanding at
February 22, 2016
was
750,065,665
.
DOCUMENTS INCORPORATED BY REFERENCE
None
THE WILLIAMS COMPANIES, INC.
FORM 10-K
TABLE OF CONTENTS
|
|
Page
|
|
|
PART I
|
||
|
Item 1.
|
||
|
Item 1A.
|
||
|
Item 1B.
|
||
|
Item 2.
|
||
|
Item 3.
|
||
|
Item 4.
|
||
|
PART II
|
||
|
Item 5.
|
||
|
Item 6.
|
||
|
Item 7.
|
||
|
Item 7A.
|
||
|
Item 8.
|
||
|
Item 9.
|
||
|
Item 9A.
|
||
|
Item 9B.
|
||
|
PART III
|
||
|
Item 10.
|
||
|
Item 11.
|
||
|
Item 12.
|
||
|
Item 13.
|
||
|
Item 14.
|
||
|
PART IV
|
||
|
Item 15.
|
||
1
DEFINITIONS
The following is a listing of certain abbreviations, acronyms and other industry terminology used throughout this Annual Report.
Measurements
:
Barrel
: One barrel of petroleum products that equals 42 U.S. gallons
Bcf
: One billion cubic feet of natural gas
Bcf/d
: One billion cubic feet of natural gas per day
British Thermal Unit (Btu)
: A unit of energy needed to raise the temperature of one pound of water by one degree
Fahrenheit
Dekatherms (Dth)
: A unit of energy equal to one million British thermal units
Mbbls/d
: One thousand barrels per day
Mdth/d
: One thousand dekatherms per day
MMcf/d
: One million cubic feet per day
MMdth
: One million dekatherms or approximately one trillion British thermal units
MMdth/d
: One million dekatherms per day
Tbtu
: One trillion British thermal units
Consolidated Entities
:
ACMP:
Access Midstream Partners, L.P. prior to its merger with Pre-Merger WPZ
Cardinal:
Cardinal Gas Services, L.L.C.
Constitution:
Constitution Pipeline Company, LLC
Gulfstar One:
Gulfstar One LLC
Jackalope:
Jackalope Gas Gathering Services, L.L.C.
Pre-merger WPZ:
Williams Partners L.P. prior to its merger with ACMP
Northwest Pipeline:
Northwest Pipeline LLC
Transco:
Transcontinental Gas Pipe Line Company, LLC
WPZ:
Williams Partners L.P.
Partially Owned Entities
: Entities in which we do not own a 100 percent ownership interest and which, as of December 31, 2015, we account for as an equity-method investment, including principally the following:
Aux Sable:
Aux Sable Liquid Products LP
Bluegrass:
Bluegrass Pipeline Company LLC
Caiman II:
Caiman Energy II, LLC
Discovery:
Discovery Producer Services LLC
Gulfstream:
Gulfstream Natural Gas System, L.L.C.
Laurel Mountain:
Laurel Mountain Midstream, LLC
Moss Lake:
Moss Lake Fractionation LLC and Moss Lake LPG Terminal LLC
OPPL:
Overland Pass Pipeline Company LLC
UEOM:
Utica East Ohio Midstream LLC
2
Government and Regulatory:
Code, the:
Internal Revenue Code of 1986
EPA:
Environmental Protection Agency
Exchange Act, the:
Securities and Exchange Act of 1934, as amended
FERC:
Federal Energy Regulatory Commission
IRS:
Internal Revenue Service
SEC:
Securities and Exchange Commission
Other
:
Energy Transfer:
Energy Transfer Equity, L.P.
ETC:
Energy Transfer Corp LP
Merger Agreement
: Merger Agreement and Plan of Merger of Williams with Energy Transfer and certain of its affiliates
ETC Merger:
Merger wherein Williams will be merged into ETC
CCR:
Contingent consideration right
Caiman Acquisition:
WPZ’s April 2012 purchase of 100 percent of Caiman Eastern Midstream, LLC located in the Ohio River Valley area of the Marcellus Shale region
Fractionation
: The process by which a mixed stream of natural gas liquids is separated into its constituent products,
such as ethane, propane, and butane
IDR:
Incentive distribution right
Laser Acquisition:
WPZ’s February 2012 purchase from Delphi Midstream Partners, LLC of 100 percent of certain entities that operate in Susquehanna County, PA and southern New York
LNG:
Liquefied natural gas; natural gas which has been liquefied at cryogenic temperatures
MVC:
Minimum volume commitment
NGLs:
Natural gas liquids; natural gas liquids result from natural gas processing and crude oil refining and are
used as petrochemical feedstocks, heating fuels, and gasoline additives, among other applications
NGL margins
:
NGL revenues less Btu replacement cost, plant fuel, transportation, and fractionation
PDH facility
:
Propane dehydrogenation facility
RGP Splitter
:
Refinery grade propylene splitter
Throughput
:
The volume of product transported or passing through a pipeline, plant, terminal, or other facility
3
Item 1.
Business
In this report, Williams (which includes The Williams Companies, Inc. and, unless the context otherwise indicates, all of our subsidiaries) is at times referred to in the first person as “we,” “us” or “our.” We also sometimes refer to Williams as the “Company.”
WEBSITE ACCESS TO REPORTS AND OTHER INFORMATION
We file our annual report on Form 10-K, quarterly reports on Form 10-Q, current reports on Form 8-K, proxy statements and other documents electronically with the SEC under the Exchange Act. You may read and copy any materials that we file with the SEC at the SEC’s Public Reference Room at 100 F Street, N.E., Washington, DC 20549. You may obtain information on the operation of the Public Reference Room by calling the SEC at 1-800-SEC-0330. You may also obtain such reports from the SEC’s Internet website at www.sec.gov.
Our Internet website is www.williams.com
.
We make available free of charge through the Investor tab of our Internet website our annual report on Form 10-K, quarterly reports on Form 10-Q, current reports on Form 8-K and amendments to those reports filed or furnished pursuant to Section 13(a) or 15(d) of the Exchange Act as soon as reasonably practicable after we electronically file such material with, or furnish it to, the SEC. Our Corporate Governance Guidelines, Code of Ethics for Senior Officers, Board committee charters and the Williams Code of Business Conduct are also available on our Internet website. We will also provide, free of charge, a copy of any of our corporate documents listed above upon written request to our Corporate Secretary, One Williams Center, Suite 4700, Tulsa, Oklahoma 74172.
GENERAL
We are primarily an energy infrastructure company focused on connecting North America’s significant hydrocarbon resource plays to markets for natural gas, NGLs, and olefins. Our operations are located principally in the United States, but span from the deepwater Gulf of Mexico to the Canadian oil sands.
As of December 31, 2015, our interstate gas pipelines, midstream, and olefins production interests were largely held through our significant investment in Williams Partners L.P. (WPZ). We own the general partner interest and a 58 percent limited-partner interest in WPZ.
We were founded in 1908, originally incorporated under the laws of the state of Nevada in 1949 and reincorporated under the laws of the state of Delaware in 1987. Williams’ headquarters are located in Tulsa, Oklahoma, with other major offices in Salt Lake City, Utah; Houston, Texas; Oklahoma City, Oklahoma; Pittsburgh, Pennsylvania; Calgary, Alberta; and the Four Corners Area. Our telephone number is 918-573-2000.
DIVIDENDS
We increased our quarterly dividends from $0.57 per share in the fourth quarter of 2014 to $0.64 per share in the fourth quarter of 2015.
ENERGY TRANSFER MERGER AGREEMENT
On September 28, 2015, we entered into a Merger Agreement with Energy Transfer and certain of its affiliates. The Merger Agreement, subject to approval of our stockholders and certain regulatory approvals, provides that we will be merged with and into the newly formed ETC with ETC surviving the ETC Merger. Energy Transfer formed ETC as a limited partnership that will be treated as a corporation for U.S. federal income tax purposes. ETC will be publicly traded on the New York Stock Exchange under the symbol “ETC.”
At the effective time of the ETC Merger, each issued and outstanding share of our common stock (except for certain shares such as those held by us or our subsidiaries and any held by ETC and its affiliates) will be canceled and automatically converted into the right to receive stock, cash, or a combination of both, at the election of each holder
4
and subject to proration as set forth in the Merger Agreement. (See
Note 1 – General, Description of Business, Basis of Presentation, and Summary of Significant Accounting Policies
for additional information.)
FINANCIAL INFORMATION ABOUT SEGMENTS
See “
Item 8 — Financial Statements and Supplementary Data — Notes to Consolidated Financial Statements —
Note 19 – Segment Disclosures
”.
BUSINESS SEGMENTS
Substantially all our operations are conducted through our subsidiaries. Our activities in 2015 were primarily operated through the following business segments as presented in the accompanying financial statements and management’s discussion and analysis.
|
•
|
Williams Partners
— comprised of our consolidated master limited partnership, WPZ, which includes gas pipeline and midstream businesses. The gas pipeline business includes interstate natural gas pipelines and pipeline joint project investments. The midstream business provides natural gas gathering, treating, processing and compression services; NGL production, fractionation, storage, marketing and transportation; deepwater production handling and crude oil transportation services; an olefin production business and is comprised of several wholly owned and partially owned subsidiaries and joint project investments.
|
Our Canadian midstream operations include an oil sands offgas processing plant near Fort McMurray, Alberta, an NGL/olefin fractionation facility, and the Boreal Pipeline.
|
•
|
Williams NGL & Petchem Services
— comprised of our Texas Belle pipeline and certain other domestic olefins pipeline assets and certain Canadian growth projects under development, including a propane dehydrogenation facility and a liquids extraction plant.
|
|
•
|
Other
— primarily comprised of corporate operations and our Canadian construction services company.
|
Detailed discussion of each of our business segments follows. For a discussion of our ongoing expansion projects, see Item 7. Management’s Discussion and Analysis of Financial Condition and Results of Operations.
Williams Partners
Gas Pipeline Business
Williams Partners' gas pipeline businesses consist primarily of Transco and Northwest Pipeline. Our gas pipeline business also holds interests in joint venture interstate and intrastate natural gas pipeline systems including a 50 percent equity-method investment in Gulfstream and a 41 percent interest in Constitution (a consolidated entity), which is under development. Transco and Northwest Pipeline own and operate a combined total of approximately13,600 miles of pipelines with a total annual throughput of approximately 4,136 TBtu of natural gas and peak-day delivery capacity of approximately 15.4 MMdth of natural gas.
Transco
Transco is an interstate natural gas transmission company that owns and operates a 9,700-mile natural gas pipeline system, which is regulated by the FERC, extending from Texas, Louisiana, Mississippi and the offshore Gulf of Mexico through Alabama, Georgia, South Carolina, North Carolina, Virginia, Maryland, Delaware, Pennsylvania and New Jersey to the New York City metropolitan area. The system serves customers in Texas and 12 southeast and Atlantic seaboard states, including major metropolitan areas in Georgia, North Carolina, Washington, D.C., Maryland, New York, New Jersey, and Pennsylvania.
Pipeline system and customers
At
December 31, 2015
, Transco’s system had a mainline delivery capacity of approximately 6.4
MMdth
of natural gas per day from its production areas to its primary markets, including delivery capacity from the mainline
5
to locations on its Mobile Bay Lateral. Using its Leidy Line along with market-area storage and transportation capacity, Transco can deliver an additional 5.1
MMdth
of natural gas per day for a system-wide delivery capacity total of approximately 11.5
MMdth
of natural gas per day. Transco’s system includes 45 compressor stations, four underground storage fields, and an LNG storage facility. Compression facilities at sea level-rated capacity total approximately 1.8 million horsepower.
Transco’s major natural gas transportation customers are public utilities and municipalities that provide service to residential, commercial, industrial and electric generation end users. Shippers on Transco’s system include public utilities, municipalities, intrastate pipelines, direct industrial users, electrical generators, natural gas marketers and producers. Transco’s firm transportation agreements are generally long-term agreements with various expiration dates and account for the major portion of Transco’s business. Additionally, Transco offers interruptible transportation services under shorter-term agreements.
Transco has natural gas storage capacity in four underground storage fields located on or near its pipeline system or market areas and operates two of these storage fields. Transco also has storage capacity in an LNG storage facility that it owns and operates. The total usable gas storage capacity available to Transco and its customers in such underground storage fields and LNG storage facility and through storage service contracts is approximately 200
Bcf
of natural gas. At
December 31, 2015
, Transco’s customers had stored in its facilities approximately 161
Bcf
of natural gas. In addition, wholly owned subsidiaries of Transco operate and hold a 35 percent equity-method investment in Pine Needle LNG Company, LLC, an LNG storage facility with 4
Bcf
of storage capacity. Storage capacity permits Transco’s customers to inject gas into storage during the summer and off-peak periods for delivery during peak winter demand periods.
Northwest Pipeline
Northwest Pipeline is an interstate natural gas transmission company that owns and operates a natural gas pipeline system, which is regulated by the FERC, extending from the San Juan basin in northwestern New Mexico and southwestern Colorado through Colorado, Utah, Wyoming, Idaho, Oregon, and Washington to a point on the Canadian border near Sumas, Washington. Northwest Pipeline provides services for markets in Washington, Oregon, Idaho, Wyoming, Nevada, Utah, Colorado, New Mexico, California, and Arizona, either directly or indirectly through interconnections with other pipelines.
Pipeline system and customers
At
December 31, 2015
, Northwest Pipeline’s system, having long-term firm transportation and storage redelivery agreements with aggregate capacity reservations of approximately 3.8 MMdth/d, was composed of approximately 3,900 miles of mainline and lateral transmission pipeline and 41 transmission compressor stations having a combined sea level-rated capacity of approximately 472,000 horsepower.
Northwest Pipeline transports and stores natural gas for a broad mix of customers, including local natural gas distribution companies, municipal utilities, direct industrial users, electric power generators, and natural gas marketers and producers. Northwest Pipeline’s firm transportation and storage redelivery contracts are generally long-term contracts with various expiration dates and account for the major portion of Northwest Pipeline’s business. Additionally, Northwest Pipeline offers interruptible and short-term firm transportation service.
Northwest Pipeline owns a one-third interest in the Jackson Prairie underground storage facility in Washington and contracts with a third party for natural gas storage services in the Clay basin underground field in Utah. Northwest Pipeline also owns and operates an LNG storage facility in Washington. These storage facilities have an aggregate working natural gas storage capacity of 14.2 MMdth of natural gas, which is substantially utilized for third-party natural gas. These natural gas storage facilities enable Northwest Pipeline to balance daily receipts and deliveries and provide storage services to customers.
Gulfstream
Gulfstream is a 745-mile interstate natural gas pipeline system extending from the Mobile Bay area in Alabama to markets in Florida, which has a capacity to transport 1.3 Bcf/d. Williams Partners owns, through a subsidiary, a 50 percent equity-method investment in Gulfstream. Williams Partners shares operating responsibilities for Gulfstream with the other 50 percent owner.
6
Midstream Business
Williams Partners’ midstream business, one of the nation’s largest natural gas gatherers and processors, has primary service areas concentrated in major producing basins in Arkansas, Colorado, New Mexico, Oklahoma, Texas, Wyoming, the Gulf of Mexico, Louisiana, Pennsylvania, West Virginia, New York, and Ohio. The primary businesses are: (1) natural gas gathering, treating, and processing; (2) NGL fractionation, storage and transportation; (3) crude oil transportation; and (4) olefins production. These fall within the middle of the process of taking raw natural gas and crude oil from the producing fields to the consumer. We also own and operate gas gathering and processing assets and pipelines primarily within the onshore, offshore shelf, and deepwater areas in and around the Gulf Coast states of Texas, Louisiana, Mississippi, and Alabama.
Key variables for this business will continue to be:
|
•
|
Producer drilling activities impacting natural gas supplies supporting our gathering and processing volumes;
|
|
•
|
Prices impacting commodity-based activities.
|
|
•
|
Retaining and attracting customers by continuing to provide reliable services;
|
|
•
|
Revenue growth associated with additional infrastructure either completed or currently under construction;
|
|
•
|
Disciplined growth in core service areas and new step-out areas;
|
Gathering, Processing, and Treating
Williams Partners’ gathering systems receive natural gas from producers’ oil and natural gas wells and gather these volumes to gas processing, treating or redelivery facilities. Typically, natural gas, in its raw form, is not acceptable for transportation in major interstate natural gas pipelines or for commercial use as a fuel. Williams Partners’ treating facilities remove water vapor, carbon dioxide, and other contaminants and collect condensate, but do not extract NGLs. Williams Partners’ is generally paid a fee based on the volume of natural gas gathered and/or treated, generally measured in the Btu heating value.
In addition, natural gas contains various amounts of NGLs, which generally have a higher value when separated from the natural gas stream. Our processing plants extract the NGLs in addition to removing water vapor, carbon dioxide, and other contaminants. NGL products include:
|
•
|
Ethane, primarily used in the petrochemical industry as a feedstock for ethylene production, one of the basic building blocks for plastics;
|
|
•
|
Propane, used for heating, fuel and as a petrochemical feedstock in the production of ethylene and propylene, another building block for petrochemical-based products such as carpets, packing materials, and molded plastic parts;
|
|
•
|
Normal butane, isobutane and natural gasoline, primarily used by the refining industry as blending stocks for motor gasoline or as a petrochemical feedstock.
|
Our domestic gas processing services generate revenues primarily from the following three types of contracts:
|
•
|
Fee-based: We are paid a fee based on the volume of natural gas processed, generally measured in the Btu heating value. Our customers are entitled to the NGLs produced in connection with this type of processing agreement. A portion of our fee-based processing revenues includes a share of the margins on the NGLs produced. For the year ended December 31, 2015, 76 percent of the NGL production volumes were under fee-based contracts.
|
|
•
|
Keep-whole: Under keep-whole contracts, we (1) process natural gas produced by customers, (2) retain some or all of the extracted NGLs as compensation for our services, (3) replace the Btu content of the retained NGLs
|
7
that were extracted during processing with natural gas purchases, also known as shrink replacement gas, and (4) deliver an equivalent Btu content of natural gas for customers at the plant outlet. NGLs we retain in connection with this type of processing agreement are referred to as our equity NGL production. Under these agreements, we have commodity price exposure on the difference between NGL and natural gas prices. For the year ended December 31, 2015, 20 percent of the NGL production volumes were under keep-whole contracts.
|
•
|
Percent-of-Liquids: Under percent-of-liquids processing contracts, we (1) process natural gas produced by customers, (2) deliver to customers an agreed-upon percentage of the extracted NGLs, (3) retain a portion of the extracted NGLs as compensation for our services, and (4) deliver natural gas to customers at the plant outlet. Under this type of contract, we are not required to replace the Btu content of the retained NGLs that were extracted during processing, and are therefore only exposed to NGL price movements. NGLs we retain in connection with this type of processing agreement are also referred to as our equity NGL production. For the year ended December 31, 2015, 4 percent of the NGL production volumes were under percent-of-liquids contracts.
|
Our gathering and processing agreements have terms ranging from month-to-month to the life of the producing lease. Generally, our gathering and processing agreements are long-term agreements. Some contracts have price escalators which annually increase our gathering rates. In addition, certain contracts include fee redetermination or cost of service mechanisms that are designed to support a return on invested capital and allow our gathering rates to be adjusted, subject to specified caps in certain cases, to account for variability in volume, capital expenditures, compression and other expenses. Our gas gathering agreements with two major customers include MVCs covering their respective producing regions. If the minimum annual or semi-annual volume commitment is not met, these customers are obligated to pay a fee equal to the applicable fee for each Mcf by which the applicable customer’s minimum annual or semi-annual volume commitment exceeds the actual volume gathered. The revenue associated with such shortfall fees is recognized in the fourth quarter of each year.
Demand for gas gathering and processing services is dependent on producers’ drilling activities, which is impacted by the strength of the economy, natural gas prices, and the resulting demand for natural gas by manufacturing and industrial companies and consumers. Williams Partners’ gas gathering and processing customers are generally natural gas producers who have proved and/or producing natural gas fields in the areas surrounding its infrastructure. During 2015, Williams Partners’ facilities gathered and processed gas for approximately 230 customers. Williams Partners’ top six gathering and processing customers accounted for approximately 74 percent of our gathering and processing fee revenue and NGL margins from our keepwhole and percent-of-liquids agreements.
Demand for our equity NGLs is affected by economic conditions and the resulting demand from industries using these commodities to produce petrochemical-based products such as plastics, carpets, packing materials and blending stocks for motor gasoline and the demand from consumers using these commodities for heating and fuel. NGL products are currently the preferred feedstock for ethylene and propylene production, which has been shifting away from the more expensive crude-based feedstocks.
Geographically, the midstream natural gas assets are positioned to maximize commercial and operational synergies with our other assets. For example, most of the offshore gathering and processing assets attach and process or condition natural gas supplies delivered to the Transco pipeline. Our San Juan basin, southwest Wyoming, and Piceance systems are capable of delivering residue gas volumes into Northwest Pipeline’s interstate system in addition to third-party interstate systems. Our gathering systems in Pennsylvania delivers residue gas volumes into Transco’s pipeline in addition to third-party interstate systems.
8
The following table summarizes our significant consolidated natural gas gathering assets:
|
|
Natural Gas Gathering Assets
|
||||||||
|
|
Location
|
Pipeline
Miles
|
Inlet
Capacity
(Bcf/d)
|
Ownership
Interest
|
Supply Basins/Shale Formations
|
||||
|
Central
|
|||||||||
|
Barnett Shale
|
Texas
|
860
|
0.9
|
100%
|
Barnett Shale
|
||||
|
Eagle Ford Shale
|
Texas
|
1,118
|
0.7
|
100%
|
Eagle Ford Shale
|
||||
|
Haynesville Shale
|
Louisiana
|
592
|
1.7
|
100%
|
Haynesville Shale
|
||||
|
Permian
|
Texas
|
346
|
0.1
|
100%
|
Permian
|
||||
|
Mid-Continent
|
Arkansas, Oklahoma, Texas
|
2,112
|
0.9
|
100%
|
Miss-Lime, Granite Wash, Colony Wash
|
||||
|
Northeast
|
|||||||||
|
Ohio Valley
|
West Virginia & Pennsylvania
|
210
|
0.8
|
100%
|
Appalachian
|
||||
|
Susquehanna Supply Hub
|
Pennsylvania & New York
|
370
|
2.7
|
100%
|
Appalachian
|
||||
|
Cardinal (1)
|
Ohio
|
349
|
1.0
|
66%
|
Appalachian
|
||||
|
Atlantic-Gulf
|
|||||||||
|
Canyon Chief, including Blind Faith and Gulfstar extensions
|
Deepwater Gulf of Mexico
|
156
|
0.5
|
100%
|
Eastern Gulf of Mexico
|
||||
|
Other Eastern Gulf
|
Offshore shelf and other
|
46
|
0.2
|
100%
|
Eastern Gulf of Mexico
|
||||
|
Seahawk
|
Deepwater Gulf of Mexico
|
115
|
0.4
|
100%
|
Western Gulf of Mexico
|
||||
|
Perdido Norte
|
Deepwater Gulf of Mexico
|
105
|
0.3
|
100%
|
Western Gulf of Mexico
|
||||
|
Other Western Gulf
|
Offshore shelf and other
|
120
|
0.9
|
100%
|
Western Gulf of Mexico
|
||||
|
West
|
|||||||||
|
Four Corners
|
Colorado & New Mexico
|
3,743
|
1.8
|
100%
|
San Juan
|
||||
|
Wamsutter
|
Wyoming
|
1,973
|
0.6
|
100%
|
Wamsutter
|
||||
|
Southwest Wyoming
|
Wyoming
|
1,614
|
0.5
|
100%
|
Southwest Wyoming
|
||||
|
Piceance
|
Colorado
|
336
|
1.5
|
(2)
|
Piceance
|
||||
|
Niobrara
|
Wyoming
|
184
|
0.2
|
(3)
|
Powder River
|
||||
__________
|
(1)
|
Statistics reflect 100 percent of the assets from our 66 percent ownership of Cardinal gathering system.
|
|
(2)
|
Includes our 60 percent ownership of a gathering system in the Ryan Gulch area with 140 miles of pipeline and 200 MMcf/d of inlet capacity, and our 67 percent ownership of a gathering system at Allen Point with 8 miles of pipeline and 60 MMcf/d of inlet capacity. We operate both systems. We own and operate 100 percent of the balance of the Piceance gathering assets.
|
|
(3)
|
Includes our 50 percent ownership of the Jackalope gathering system, which we operate, with 184 miles of pipeline and 165 MMcf/d of inlet capacity.
|
9
The following table summarizes our significant consolidated natural gas processing facilities:
|
|
Natural Gas Processing Facilities
|
||||||||
|
|
Location
|
Inlet
Capacity
(Bcf/d)
|
NGL
Production
Capacity
(Mbbls/d)
|
Ownership
Interest
|
Supply Basins
|
||||
|
Northeast
|
|||||||||
|
Fort Beeler
|
Marshall County, WV
|
0.5
|
62
|
100%
|
Appalachian
|
||||
|
Oak Grove
|
Marshall County, WV
|
0.2
|
25
|
100%
|
Appalachian
|
||||
|
Atlantic-Gulf
|
|||||||||
|
Markham
|
Markham, TX
|
0.5
|
45
|
100%
|
Western Gulf of Mexico
|
||||
|
Mobile Bay
|
Coden, AL
|
0.7
|
30
|
100%
|
Eastern Gulf of Mexico
|
||||
|
West
|
|||||||||
|
Echo Springs
|
Echo Springs, WY
|
0.7
|
58
|
100%
|
Wamsutter
|
||||
|
Opal
|
Opal, WY
|
1.1
|
47
|
100%
|
Southwest Wyoming
|
||||
|
Willow Creek
|
Rio Blanco County, CO
|
0.5
|
30
|
100%
|
Piceance
|
||||
|
Ignacio
|
Ignacio, CO
|
0.5
|
29
|
100%
|
San Juan
|
||||
|
Kutz
|
Bloomfield, NM
|
0.2
|
12
|
100%
|
San Juan
|
||||
|
Bucking Horse (1)
|
Converse County, WY
|
0.1
|
7
|
50%
|
Powder River
|
||||
|
Parachute
|
Garfield County, CO
|
1.2
|
6
|
100%
|
Piceance
|
||||
__________
|
(1)
|
Statistics reflect 100 percent of the assets from our 50 percent ownership of Bucking Horse gas processing facility.
|
In addition, we own and operate several natural gas treating facilities in New Mexico, Colorado, Texas, and Louisiana which bring natural gas to specifications allowable by major interstate pipelines.
We also own and operate fractionation facilities at Moundsville, de-ethanization and condensate facilities at our Oak Grove processing plant, another condensate stabilization facility near our Oak Grove plant, and an ethane transportation pipeline. Our two condensate stabilizers are capable of handling more than 14 Mbbls/d of field condensate. NGLs are extracted from the natural gas stream in our cryogenic processing plants. Our Oak Grove de-ethanizer is capable of handling up to approximately 80 Mbbls/d of mixed NGLs to extract up to approximately 40 Mbbls/d of ethane. The remaining mixed NGL stream from the de-ethanizer is then transported and fractionated at our Moundsville facilities, which are capable of handling more than 42 Mbbls/d of mixed NGLs. Ethane produced at our de-ethanizer is transported to markets via our 50-mile ethane pipeline from Oak Grove to Houston, Pennsylvania.
Crude Oil Transportation and Production Handling Assets
In addition to our natural gas assets, we own and operate four deepwater crude oil pipelines and own production platforms serving the deepwater in the Gulf of Mexico. Our crude oil transportation revenues are typically volumetric-based fee arrangements. However, a portion of our marketing revenues are recognized from purchase and sale arrangements whereby the oil that we transport is purchased and sold as a function of the same index-based price. Our offshore floating production platforms provide centralized services to deepwater producers such as compression, separation, production handling, water removal, and pipeline landings. Revenue sources have historically included a combination of fixed-fee, volumetric-based fee and cost reimbursement arrangements. Fixed fees associated with the resident production at our Devils Tower facility are recognized on a units-of-production basis. Fixed fees associated with the resident production at our Gulfstar One facility are recognized as the guaranteed capacity is made available.
10
The following tables summarize our significant crude oil transportation pipelines and production handling platforms:
|
|
Crude Oil Pipelines
|
||||||
|
|
Pipeline
Miles
|
Capacity
(Mbbls/d)
|
Ownership
Interest
|
Supply Basins
|
|||
|
Mountaineer, including Blind Faith and Gulfstar extensions
|
172
|
150
|
100%
|
Eastern Gulf of Mexico
|
|||
|
BANJO
|
57
|
90
|
100%
|
Western Gulf of Mexico
|
|||
|
Alpine
|
96
|
85
|
100%
|
Western Gulf of Mexico
|
|||
|
Perdido Norte
|
74
|
150
|
100%
|
Western Gulf of Mexico
|
|||
|
|
Production Handling Platforms
|
||||||
|
|
Gas Inlet
Capacity
(MMcf/d)
|
Crude/NGL
Handling
Capacity
(Mbbls/d)
|
Ownership
Interest
|
Supply Basins
|
|||
|
Devils Tower
|
210
|
60
|
100%
|
Eastern Gulf of Mexico
|
|||
|
Gulfstar I FPS (1)
|
172
|
80
|
51%
|
Eastern Gulf of Mexico
|
|||
__________
|
(1)
|
Statistics reflect 100 percent of the assets from our 51 percent interest in Gulfstar One.
|
Canadian Operations
Our Canadian operations include an oil sands offgas processing plant located near Fort McMurray, Alberta, and an NGL/olefin fractionation facility located at Redwater, Alberta, which is near Edmonton, Alberta, and the Boreal Pipeline which transports NGLs and associated olefins from our Fort McMurray plant to our Redwater fractionation facility. We operate the Fort McMurray area processing plant and the Boreal Pipeline, while another party operates the Redwater facilities on our behalf. Our Fort McMurray area facilities extract liquids from the offgas produced by a third-party oil sands bitumen upgrader. Our arrangement with the third-party upgrader is a “keep-whole” type where we remove a mix of NGLs and olefins from the offgas and return the equivalent heating value to the third-party upgrader in the form of natural gas, as well as a profit share whereby a portion of the profit above a threshold is shared with the third party. We extract, fractionate, treat, store, terminal and sell the ethane/ethylene, propane, propylene, normal butane (butane), iso-butane, alky feedstock, and condensate recovered from this process. The commodity price exposure of this asset is the spread between the price for natural gas and the NGL and olefin products we produce. We continue to be the only NGL/olefins fractionator in western Canada and the only processor of oil sands upgrader offgas. Our extraction of liquids from upgrader offgas streams allows the upgraders to burn cleaner natural gas streams and reduces their overall air emissions.
The Fort McMurray extraction plant has processing capacity of 121 MMcf/d with the ability to recover 26 Mbbls/d of olefin and NGL products. Our Redwater fractionator has a liquids handling capacity of 26 Mbbls/d. We also purchase small volumes of olefin/NGLs mixes from third-party gas processors, fractionate the olefins and NGLs at our Redwater plant and sell the resulting products. The Boreal Pipeline is a 261-mile pipeline in Canada that transports recovered NGLs and olefins from our extraction plant in Fort McMurray to our Redwater fractionation facility. The pipeline has an initial capacity of 43 Mbbls/d that can be increased to an ultimate capacity of 125 Mbbls/d with additional pump stations.
Our products are sold within Canada and the United States.
Operating Statistics
The following table summarizes our significant operating statistics:
|
2015
|
2014
|
2013
|
||||||
|
Volumes:
|
||||||||
|
Canadian propylene sales (millions of pounds)
|
161
|
|
143
|
|
118
|
|
||
|
Canadian NGL sales (millions of gallons)
|
284
|
|
218
|
|
123
|
|
||
11
Gulf Olefins
We have an 88.5 percent undivided interest and operatorship of the olefins production facility in Geismar, Louisiana, along with a refinery grade propylene splitter, and pipelines in the Gulf region. Our olefins business also operates an ethylene storage hub at Mont Belvieu using leased third-party underground storage caverns.
In 2015, we placed in service an expansion of the olefins production facility that increased its ethylene production capacity by 600 million pounds per year, for a total production capacity of 1.95 billion pounds of ethylene and 114 million pounds of propylene per year. Our feedstocks for the cracker are ethane and propane; as a result, these assets are primarily exposed to the price spread between ethane and propane, and ethylene and propylene, respectively. Ethane and propane are available for purchase from third parties and from affiliates. We own ethane and propane pipeline systems in Louisiana that provide feedstock transportation to the Geismar plant and other third-party crackers. We also own a pipeline that has the capacity to supply 12 Mbbls/d of ethane from Discovery’s Paradis fractionator to the Geismar plant. Following an explosion and fire that occurred in 2013, the Geismar plant resumed consistent operations in late March 2015 and reached full production capacity in the third quarter of 2015.
Our refinery grade propylene splitter has a production capacity of approximately 500 million pounds per year of propylene. At our propylene splitter, we purchase refinery grade propylene and fractionate it into polymer grade propylene and propane; as a result, this asset is exposed to the price spread between those commodities.
As a merchant producer of ethylene and propylene, our product sales are to customers for use in making plastics and other downstream petrochemical products destined for both domestic and export markets.
Marketing Services
We market NGL products to a wide range of users in the energy and petrochemical industries. The NGL marketing business transports and markets our equity NGLs from the production at our processing plants, and also markets NGLs on behalf of third-party NGL producers, including some of our fee-based processing customers, and the NGL volumes owned by Discovery. The NGL marketing business bears the risk of price changes in these NGL volumes while they are being transported to final sales delivery points. In order to meet sales contract obligations, we may purchase products in the spot market for resale. Other than a long-term agreement to sell our equity NGLs transported on OPPL, the majority of sales are based on supply contracts of one year or less in duration.
In certain situations to facilitate our gas gathering and processing activities, we buy natural gas from our producer customers for resale.
We also market olefin products to a wide range of users in the energy and petrochemical industries. In order to meet sales contract obligations, we may purchase olefin products for resale.
Other NGL & Petchem Operations
We own interests in and/or operate NGL fractionation and storage assets in central Kansas near Conway. These assets include a 50 percent interest in an NGL fractionation facility with capacity of slightly more than 100 Mbbls/d and we own approximately 20 million barrels of NGL storage capacity.
We own approximately 115 miles of pipelines in the Houston Ship Channel area which transport a variety of products including ethane, propane, ammonia, tertiary butyl alcohol, and other industrial products used in the petrochemical industry. We also own a tunnel crossing pipeline under the Houston Ship Channel. A portion of these pipelines are leased to third parties.
We own the roughly 280-mile Bayou Ethane Pipeline, which operates between Texas and Louisiana. The pipeline connects a 57-mile pipeline segment from Mont Belvieu to Port Arthur, Texas, and a 50-mile pipeline segment from Lake Charles, Louisiana, to Port Arthur. The pipeline provides ethane transportation capacity from fractionation and storage facilities in Mont Belvieu, Texas, to the WPZ Geismar olefins plant in south Louisiana and serves customers along the way.
12
We also own a 14.6 percent equity-method investment in Aux Sable and its Channahon, Illinois, gas processing and NGL fractionation facility near Chicago. The facility is capable of processing up to 2.1 Bcf/d of natural gas from the Alliance Pipeline system and fractionating approximately 107 Mbbls/d of extracted liquids into NGL products. Additionally, Aux Sable owns an 80 MMcf/d gas conditioning plant and a 12-inch, 83-mile gas pipeline infrastructure in North Dakota that provides additional NGLs to Channahon from the Bakken Shale in the Williston basin.
WPZ Operating Areas
Effective January 1, 2016, WPZ organizes these businesses into the following operating areas:
Central is comprised of domestic gathering, treating, and compression services to producers under long-term, fixed fee contracts. Its primary operating areas are in the Barnett Shale region of north-central Texas, the Eagle Ford Shale region of south Texas, the Haynesville Shale region of northwest Louisiana, and the Mid-Continent region which includes the Anadarko, Arkoma, Delaware and Permian basins. Central also includes a 50 percent equity-method investment in the Delaware basin gas gathering system in the Permian region.
Northeast G&P is comprised of natural gas gathering and processing and NGL fractionation businesses in the Marcellus Shale region primarily in Pennsylvania, New York, and West Virgina and the Utica Shale region of eastern Ohio, as well as a 62 percent equity-method investment in UEOM, a 69 percent equity-method investment in Laurel Mountain, a 58 percent equity-method investment in Caiman II, and Appalachia Midstream Services, LLC, which owns an approximate average 45 percent equity-method investment in multiple gas gathering systems in the Marcellus Shale (Appalachia Midstream Investments).
Atlantic-Gulf is comprised of an interstate natural gas pipeline, Transco, and significant natural gas gathering and processing and crude oil production handling and transportation in the Gulf Coast region, including a 51 percent interest in Gulfstar One (a consolidated entity) which is a proprietary floating production system, as well as a 50 percent equity-method investment in Gulfstream, a 41 percent interest in Constitution (a consolidated entity) which is under development, and a 60 percent equity-method investment in Discovery.
West is comprised of the natural gas gathering, processing, and treating operations in New Mexico, Colorado, and Wyoming and an interstate natural gas pipeline, Northwest Pipeline.
NGL & Petchem Services is comprised of our 88.5 percent undivided interest in an olefins production facility in Geismar, Louisiana, along with a refinery grade propylene splitter and various petrochemical and feedstock pipelines in the Gulf Coast region, an oil sands offgas processing plant near Fort McMurray, Alberta, and an NGL/olefin fractionation facility. This segment also includes an NGL and natural gas marketing business, storage facilities and an undivided 50 percent interest in an NGL fractionator near Conway, Kansas, and a 50 percent equity-method investment in OPPL.
Certain Equity-Method Investments
Discovery
We own a 60 percent interest in and operate the facilities of Discovery. Discovery’s assets include a 600 MMcf/d cryogenic natural gas processing plant near Larose, Louisiana, a 32 Mbbls/d NGL fractionator plant near Paradis, Louisiana, and a 614-mile offshore natural gas gathering and transportation system in the Gulf of Mexico with an inlet capacity of 1,350 MMcf/d, including the Keathley Canyon Connector, a 209-mile deepwater lateral pipeline in the central deepwater Gulf of Mexico that contributed 400 MMcf/d of inlet capacity when it was placed in service in late 2014. Discovery’s assets also include a crude oil production handling platform with a crude oil/NGL handling capacity of 10 Mbbls/d and natural gas processing capacity of 75 MMcf/d.
Laurel Mountain
We own a 69 percent interest in a joint venture, Laurel Mountain, that includes a 2,053-mile gathering system that we operate in western Pennsylvania with the capacity to gather 0.7 Bcf/d of natural gas. Laurel Mountain has a long-term, dedicated, volumetric-based fee agreement, with exposure to natural gas prices, to gather the anchor customer’s production in the western Pennsylvania area of the Marcellus Shale.
13
Caiman II
We own a 58 percent interest in Caiman II, which owns a 50 percent interest in Blue Racer, a joint project to own, operate, develop and acquire midstream assets in the Utica Shale and certain adjacent areas in the Marcellus Shale. Blue Racer’s assets include 688 miles of natural gas gathering pipelines, including 422 miles of large-diameter pipelines, the Natrium complex in Marshall County, West Virginia, with a cryogenic processing capacity of 400 MMcf/d and fractionation capacity of approximately 123,000 Bbls/d, the Berne complex in Monroe County, Ohio, with a cryogenic processing capacity of 400 MMcf/d, and NGL and condensate pipelines connecting Natrium to Berne.
Overland Pass Pipeline
We own and operate a 50 percent interest in OPPL. OPPL is capable of transporting 255 Mbbls/d and includes approximately 1,096 miles of NGL pipeline extending from Opal, Wyoming, to the Mid-Continent NGL market center near Conway, Kansas, along with extensions into the Piceance and Denver-Julesberg basins in Colorado. In 2013, a pipeline connection and capacity expansions were installed to accommodate volumes coming from the Bakken Shale in the Williston basin in North Dakota. Our equity NGL volumes from our two Wyoming plants and our Willow Creek facility in Colorado are dedicated for transport on OPPL under a long-term transportation agreement.
Delaware Basin Gas Gathering System
We own a non-operated 50 percent interest in the Delaware basin gas gathering system in the Permian region. The system is comprised of 403 miles of gathering pipeline, located in west Texas.
Utica East Ohio Midstream
We own a 62 percent interest in UEOM, a joint project to develop infrastructure for the gathering, processing and fractionation of natural gas and NGLs in the Utica Shale play in Eastern Ohio. We, along with other equity owners, operate the infrastructure complex which consists of natural gas gathering and compression facilities, four processing plants with a total capacity of 800 MMcf per day, 41 Mbbls/d of condensate stabilization capacity, a 135 Mbbls/d NGL fractionation facility, approximately 950,000 barrels of NGL storage capacity and other ancillary assets, including loading and terminal facilities that are operated by our partner. These assets earn a fixed fee that escalates annually within a specified range.
Appalachia Midstream
Through our wholly owned subsidiary Appalachia Midstream, we operate 100 percent of and own an approximate average 45 percent interest in multiple natural gas gathering systems that consist of approximately 970 miles of gathering pipeline in the Marcellus Shale region. The majority of our volumes in the region are gathered from northern Pennsylvania, southwestern Pennsylvania and the northwestern panhandle of West Virginia in core areas of the Marcellus Shale. Appalachia Midstream operates the assets under long-term, 100 percent fixed-fee gathering agreements that include significant acreage dedications and cost of service mechanisms.
Operating Statistics
The following table summarizes our significant operating statistics for Williams Partners’ midstream business:
|
2015
|
2014
|
2013
|
||||||
|
Volumes: (1)
|
||||||||
|
Gathering (Tbtu)
|
3,298
|
|
2,482
|
|
1,731
|
|
||
|
Plant inlet natural gas (Tbtu)
|
1,448
|
|
1,419
|
|
1,549
|
|
||
|
NGL production (Mbbls/d) (2)
|
130
|
|
128
|
|
143
|
|
||
|
NGL equity sales (Mbbls/d) (2)
|
31
|
|
27
|
|
40
|
|
||
|
Crude oil transportation (Mbbls/d) (2)
|
126
|
|
105
|
|
117
|
|
||
|
Geismar ethylene sales (millions of pounds)
|
1,066
|
|
—
|
|
467
|
|
||
__________
|
(1)
|
Excludes volumes associated with equity-method investments.
|
|
(2)
|
Annual average Mbbls/d.
|
14
Williams NGL & Petchem Services
The Williams NGL & Petchem Services segment is comprised of our Texas Belle pipeline and certain other domestic olefins pipeline assets and certain Canadian growth projects under development, including a propane dehydrogenation facility and a liquids extraction plant. As this segment is currently comprised primarily of projects under development, reported revenues to-date are nominal.
Additional Business Segment Information
Our ongoing business segments are presented as continuing operations in the accompanying financial statements and Notes to Consolidated Financial Statements included in Part II.
We perform certain management, legal, financial, tax, consultation, information technology, administrative and other services for our subsidiaries.
Our principal sources of cash are from dividends, distributions and advances from our subsidiaries, investments, payments by subsidiaries for services rendered, and, if needed, external financings, and net proceeds from asset sales. The terms of certain subsidiaries’ borrowing arrangements may limit the transfer of funds to us under certain conditions.
We believe that we have adequate sources and availability of raw materials and commodities for existing and anticipated business needs. Our interstate pipeline systems are all regulated in various ways resulting in the financial return on the investments made in the systems being limited to standards permitted by the regulatory agencies. Each of the pipeline systems has ongoing capital requirements for efficiency and mandatory improvements, with expansion opportunities also necessitating periodic capital outlays.
Revenues by service that exceeded 10 percent of consolidated revenue include:
|
Total
|
|||
|
(Millions)
|
|||
|
2015
|
|||
|
Service:
|
|
|
|
|
Regulated natural gas transportation & storage
|
$
|
1,938
|
|
|
Gathering, processing, and production handling
|
2,804
|
|
|
|
2014
|
|||
|
Service:
|
|||
|
Regulated natural gas transportation & storage
|
$
|
1,781
|
|
|
Gathering, processing, and production handling
|
1,838
|
|
|
|
2013
|
|||
|
Service:
|
|||
|
Regulated natural gas transportation & storage
|
$
|
1,704
|
|
|
Gathering, processing and production handling
|
966
|
|
|
We have one customer, Chesapeake Energy Corporation, and its affiliates, that accounts for 18 percent of our total revenue. (See
Note 17 – Fair Value Measurements, Guarantees, and Concentration of Credit Risk
for additional details.)
REGULATORY MATTERS
FERC
Our gas pipeline interstate transmission and storage activities are subject to FERC regulation under the Natural Gas Act of 1938 (NGA) and under the Natural Gas Policy Act of 1978, and, as such, our rates and charges for the transportation of natural gas in interstate commerce, accounting, and the extension, enlargement or abandonment of our jurisdictional facilities, among other things, are subject to regulation. Each gas pipeline company holds certificates
15
of public convenience and necessity issued by the FERC authorizing ownership and operation of all pipelines, facilities and properties for which certificates are required under the NGA. FERC Standards of Conduct govern how our interstate pipelines communicate and do business with gas marketing employees. Among other things, the Standards of Conduct require that interstate pipelines not operate their systems to preferentially benefit gas marketing functions.
FERC regulation requires all terms and conditions of service, including the rates charged, to be filed with and approved by the FERC before any changes can go into effect. Each of our interstate natural gas pipeline companies establishes its rates primarily through the FERC’s ratemaking process. Key determinants in the ratemaking process are:
|
•
|
Costs of providing service, including depreciation expense;
|
|
•
|
Allowed rate of return, including the equity component of the capital structure and related income taxes;
|
|
•
|
Contract and volume throughput assumptions.
|
The allowed rate of return is determined in each rate case. Rate design and the allocation of costs between the reservation and commodity rates also impact profitability. As a result of these proceedings, certain revenues previously collected may be subject to refund.
We also own interests in and operate two offshore transmission pipelines that are regulated by the FERC because they are deemed to transport gas in interstate commerce. Black Marlin Pipeline Company provides transportation service for offshore Texas production in the High Island area and redelivers that gas to intrastate pipeline interconnects near Texas City. Discovery provides transportation service for offshore Louisiana production from the South Timbalier, Grand Isle, Ewing Bank, and Green Canyon (deepwater) areas to an onshore processing facility and downstream interconnect points with major interstate pipelines. In addition, Williams Partners owns a 50 percent interest in and is the operator of OPPL, which is an interstate natural gas liquids pipeline regulated by the FERC pursuant to the Interstate Commerce Act. OPPL provides transportation service pursuant to tariffs filed with the FERC.
Pipeline Safety
Our gas pipelines are subject to the Natural Gas Pipeline Safety Act of 1968, as amended, the Pipeline Safety Improvement Act of 2002, and the Pipeline Safety, Regulatory Certainty, and Jobs Creation Act of 2011 (Pipeline Safety Act), which regulates safety requirements in the design, construction, operation and maintenance of interstate natural gas transmission facilities. The United States Department of Transportation Pipeline and Hazardous Materials Safety Administration (PHMSA) administers federal pipeline safety laws.
Federal pipeline safety laws authorize PHMSA to establish minimum safety standards for pipeline facilities and persons engaged in the transportation of gas or hazardous liquids by pipeline. These safety standards apply to the design, construction, testing, operation, and maintenance of gas and hazardous liquids pipeline facilities affecting interstate or foreign commerce. PHMSA has also established reporting requirements for operators of gas and hazardous liquid pipeline facilities, as well as provisions for establishing the qualification of pipeline personnel and requirements for managing the integrity of gas transmission and distribution lines and certain hazardous liquid pipelines. To ensure compliance with these provisions, PHMSA performs pipeline safety inspections and has the authority to initiate enforcement actions.
Federal pipeline safety regulations contain an exemption that applies to gathering lines in certain rural locations. A substantial portion of our gathering lines qualify for that exemption and are currently not regulated under federal law. However, PHMSA is completing a congressionally-mandated review of the adequacy of the existing federal and state regulations for gathering lines and has indicated that it may apply additional safety standards to rural gas gathering lines in the future.
States are preempted by federal law from regulating pipeline safety for interstate pipelines but most are certified by PHMSA to assume responsibility for enforcing intrastate pipeline safety regulations and inspecting intrastate pipelines. In practice, because states can adopt stricter standards for intrastate pipelines than those imposed by the federal government for interstate lines, they vary considerably in their authority and capacity to address pipeline safety.
16
On January 3, 2012, the Pipeline Safety Act was enacted. The Pipeline Safety Act requires PHMSA to complete a number of reports in preparation for potential rulemakings. The issues addressed in these rulemaking provisions include, but are not limited to, the use of automatic or remotely controlled shut-off valves on new or replaced transmission line facilities, modifying the requirements for pipeline leak detection systems, and expanding the scope of the pipeline integrity management requirements for both gas and liquid pipeline systems. PHMSA is considering these and other provisions in the Pipeline Safety Act and has sought public comment on changes to the standards in its pipeline safety regulations.
Pipeline Integrity Regulations
We have developed an enterprise wide Gas Integrity Management Plan that we believe meets the PHMSA final rule that was issued pursuant to the requirements of the Pipeline Safety Improvement Act of 2002. The rule requires gas pipeline operators to develop an integrity management program for gas transmission pipelines that could affect high consequence areas in the event of pipeline failure. The integrity management program includes a baseline assessment plan along with periodic reassessments to be completed within required time frames. In meeting the integrity regulations, we have identified high consequence areas and developed baseline assessment plans. Ongoing periodic reassessments and initial assessments of any new high consequence areas have been completed. We estimate that the cost to be incurred in 2016 associated with this program to be approximately $68 million. Management considers the costs associated with compliance with the rule to be prudent costs incurred in the ordinary course of business and, therefore, recoverable through Northwest Pipeline’s and Transco’s rates.
We developed a Liquid Integrity Management Plan that we believe meets the PHMSA final rule that was issued pursuant to the requirements of the Pipeline Safety Improvement Act of 2002. The rule requires liquid pipeline operators to develop an integrity management program for liquid transmission pipelines that could affect high consequence areas in the event of pipeline failure. The integrity management program includes a baseline assessment plan along with periodic reassessments expected to be completed within required time frames. In meeting the integrity regulations, we utilized government defined high consequence areas and developed baseline assessment plans. We completed assessments within the required time frames. We estimate that the cost to be incurred in 2016 associated with this program will be approximately $8 million. Ongoing periodic reassessments and initial assessments of any new high consequence areas are expected to be completed within the time frames required by the rule. Management considers the costs associated with compliance with the rule to be prudent costs incurred in the ordinary course of business.
State Gathering Regulation
Our onshore midstream gathering operations are subject to regulation by states in which we operate. Of the states where our midstream business gathers gas, currently only Texas and New York actively regulate gathering activities. Texas regulates gathering primarily through complaint mechanisms under which the state commission may resolve disputes involving an individual gathering arrangement. New York has specific regulations pertaining to the design, construction and operations of gathering lines in New York.
OCSLA
Our offshore midstream gathering is subject to the Outer Continental Shelf Lands Act (OCSLA). Although offshore gathering facilities are not subject to the NGA, offshore transmission pipelines are subject to the NGA, and in recent years the FERC has taken a broad view of offshore transmission, finding many shallow-water pipelines to be jurisdictional transmission. Most offshore gathering facilities are subject to the OCSLA, which provides in part that outer continental shelf pipelines “must provide open and nondiscriminatory access to both owner and nonowner shippers.”
Olefins
Our olefins assets are regulated by the Louisiana Department of Environmental Quality, the Texas Railroad Commission, and various other state and federal entities regarding our liquids pipelines.
These olefins assets are also subject to the liquid pipeline safety and integrity regulations previously discussed above since both Louisiana and Texas have adopted the integrity management regulations defined by PHMSA.
17
Canadian Operations
Our Canadian assets are regulated by the Alberta Energy Regulator (AER) and we also have certain facilities that are regulated by the Alberta Environment and Parks (AEP). The two agencies, AER and AEP, include specifics to pipeline safety and integrity. The regulatory system for the Alberta oil and gas industry incorporates a large measure of self-regulation, providing that licensed operators are held responsible for ensuring that their operations are conducted in accordance with all provincial regulatory requirements. For situations in which noncompliance with the applicable regulations is at issue, the AER has an enforcement process with escalating consequences.
See
Note 18 – Contingent Liabilities and Commitments
of our Notes to Consolidated Financial Statements for further details on our regulatory matters. For additional information regarding regulatory matters, please also refer to “Risk Factors —
The operation of our businesses might also be adversely affected by changes in government regulations or in their interpretation or implementation, or the introduction of new laws or regulations applicable to our businesses or our customers,”
“-
Our investments and projects located outside of the United States expose us to risks related to the laws of other countries, and the taxes, economic conditions, fluctuations in currency rates, political conditions and policies of foreign governments. These risks might delay or reduce our realization of value from our international projects;" and "- The natural gas sales, transportation and storage operations of our gas pipelines are subject to regulation by the FERC, which could have an adverse impact on their ability to establish transportation and storage rates that would allow them to recover the full cost of operating their respective pipelines, including a reasonable rate of return.
"
ENVIRONMENTAL MATTERS
Our operations are subject to federal environmental laws and regulations as well as the state, local and tribal laws and regulations adopted by the jurisdictions in which we operate. We could incur liability to governments or third parties for any unlawful discharge of pollutants into the air, soil, or water, as well as liability for cleanup costs. Materials could be released into the environment in several ways including, but not limited to:
|
•
|
Leakage from gathering systems, underground gas storage caverns, pipelines, processing or treating facilities, transportation facilities and storage tanks;
|
|
•
|
Damage to facilities resulting from accidents during normal operations;
|
|
•
|
Damages to onshore and offshore equipment and facilities resulting from storm events or natural disasters;
|
|
•
|
Blowouts, cratering and explosions.
|
In addition, we may be liable for environmental damage caused by former owners or operators of our properties.
We believe compliance with current environmental laws and regulations will not have a material adverse effect on our capital expenditures, earnings or current competitive position. However, environmental laws and regulations could affect our business in various ways from time to time, including incurring capital and maintenance expenditures, fines and penalties, and creating the need to seek relief from the FERC for rate increases to recover the costs of certain capital expenditures and operation and maintenance expenses.
For additional information regarding the potential impact of federal, state, tribal or local regulatory measures on our business and specific environmental issues, please refer to “Risk Factors —
“Our operations are subject to environmental laws and regulations, including laws and regulations relating to climate change and greenhouse gas emissions, which may expose us to significant costs, liabilities and expenditures that could exceed current expectations,”
and “Management’s Discussion and Analysis of Financial Condition and Results of Operations — Environmental” and “Environmental Matters” in
Note 18 – Contingent Liabilities and Commitments
of our Notes to Consolidated Financial Statements.
18
COMPETITION
Gas Pipeline Business
The natural gas industry has a highly-liquid competitive commodity market in natural gas and increasingly competitive markets for natural gas services, including competitive secondary markets in pipeline capacity. Large reserves of shale gas have been discovered, in many cases much closer to major market centers. As a result, pipeline capacity is being used more efficiently and competition among pipeline suppliers to connect growing supply to market has increased.
States have developed new plans that require utilities to encourage energy saving measures and diversify their energy supplies to include renewable sources. This has lowered the growth of residential gas demand. However, due to relatively low prices of natural gas, demand for electric power generation has increased.
Local distribution company (LDC) and electric industry restructuring by states have affected pipeline markets. Pipeline operators are increasingly challenged to accommodate the flexibility demanded by customers and allowed under tariffs. The state plans have in some cases discouraged LDCs from signing long-term contracts for new capacity. In addition, LDCs are entering the long haul transportation business through joint venture pipelines.
These factors have increased the risk that customers will reduce their contractual commitments for pipeline capacity from traditional producing areas. Future utilization of pipeline capacity will depend on these factors and others impacting both U.S. and global demand for natural gas.
Midstream Business
Generally, our gathering and processing agreements are long-term agreements that may include acreage dedication. We primarily face competition to the extent these agreements approach renewal or new volume opportunities arise. Competition for natural gas volumes is primarily based on reputation, commercial terms, reliability, service levels, location, available capacity, capital expenditures and fuel efficiencies. Our gathering and processing business competes with other midstream companies, interstate and intrastate pipelines, producers and independent gatherers and processors. We primarily compete with five to ten companies across all basins in which we provide services.
Ethylene and propylene markets, and therefore our olefins business, compete in a worldwide marketplace. At Geismar, we currently benefit from the lower cost natural gas based feedstocks in North America versus other crude based feedstocks worldwide. The majority of North American olefins producers have significant downstream petrochemical manufacturing for plastics and other products. As such, they buy or sell ethylene and propylene as required. We operate as a merchant seller of olefins with no downstream manufacturing, and therefore can be either a supplier or a competitor at any given time to these other companies. We compete on the basis of service, price and availability of the products we produce.
Our Canadian midstream facilities continue to be the only NGL/olefins fractionator in western Canada and the only processor of oil sands upgrader offgas. Our extraction of liquids from the upgrader offgas stream allows the upgraders to burn cleaner natural gas streams and reduce their overall air emissions. Our Canadian midstream business competes for the sale of its products with traditional Canadian midstream companies on the basis of operational expertise, price, service offerings and availability of the products we produce. The sales of our NGL and olefin products compete in the worldwide marketplace.
For additional information regarding competition for our services or otherwise affecting our business, please refer to “Risk Factors -
The long-term financial condition of our natural gas transportation and midstream businesses is dependent on the continued availability of natural gas supplies in the supply basins that we access, and demand for those supplies in our traditional markets,
“-
Our industry is highly competitive and increased competitive pressure could adversely affect our business and operating results
,” and “-
We may not be able to replace, extend, or add additional customer contracts or contracted volumes on favorable terms, or at all, which could affect our financial condition, the amount of cash available to pay dividends, and our ability to grow.
”
19
EMPLOYEES
At February 1, 2016, we had approximately 6,578 full-time employees.
FINANCIAL INFORMATION ABOUT GEOGRAPHIC AREAS
See
Note 19 – Segment Disclosures
of our Notes to Consolidated Financial Statements for amounts of revenues during the last three fiscal years from external customers attributable to the United States and all foreign countries. Also see
Note 19 – Segment Disclosures
of our Notes to Consolidated Financial Statements for information relating to long-lived assets during the last three fiscal years, located in the United States and all foreign countries.
20
Item 1A.
Risk Factors
FORWARD-LOOKING STATEMENTS AND CAUTIONARY STATEMENT
FOR PURPOSES OF THE “SAFE HARBOR” PROVISIONS OF
THE PRIVATE SECURITIES LITIGATION REFORM ACT OF 1995
The reports, filings and other public announcements of The Williams Companies, Inc. (Williams) may contain or incorporate by reference statements that do not directly or exclusively relate to historical facts. Such statements are “forward-looking statements” within the meaning of Section 27A of the Securities Act of 1933, as amended (the “Securities Act”), and Section 21E of the Securities Exchange Act of 1934, as amended (the “Exchange Act”). These forward-looking statements relate to anticipated financial performance, management’s plans and objectives for future operations, business prospects, outcome of regulatory proceedings, market conditions and other matters. We make these forward-looking statements in reliance on the safe harbor protections provided under the Private Securities Litigation Reform Act of 1995.
All statements, other than statements of historical facts, included in this report that address activities, events or developments that we expect, believe or anticipate will exist or may occur in the future, are forward-looking statements. Forward-looking statements can be identified by various forms of words such as “anticipates,” “believes,” “seeks,” “could,” “may,” “should,” “continues,” “estimates,” “expects,” “forecasts,” “intends,” “might,” “goals,” “objectives,” “targets,” “planned,” “potential,” “projects,” “scheduled,” “will,” “assumes,” “guidance,” “outlook,” “in service date,” or other similar expressions. These forward-looking statements are based on management’s beliefs and assumptions and on information currently available to management and include, among others, statements regarding:
|
•
|
The status, expected timing and expected outcome of the proposed ETC Merger;
|
|
•
|
Statements regarding the proposed ETC Merger;
|
|
•
|
Our beliefs relating to value creation as a result of the proposed ETC Merger;
|
|
•
|
Benefits and synergies of the proposed ETC Merger;
|
|
•
|
Future opportunities for the combined company;
|
|
•
|
Other statements regarding Williams’ and Energy Transfer’s future beliefs, expectations, plans, intentions, financial condition or performance;
|
|
•
|
Expected levels of cash distributions by Williams Partners L.P. (WPZ) with respect to general partner interests, incentive distribution rights and limited partner interests;
|
|
•
|
Levels of dividends to Williams stockholders;
|
|
•
|
Future credit ratings of Williams and WPZ;
|
|
•
|
Amounts and nature of future capital expenditures;
|
|
•
|
Expansion and growth of our business and operations;
|
|
•
|
Financial condition and liquidity;
|
|
•
|
Business strategy;
|
|
•
|
Cash flow from operations or results of operations;
|
|
•
|
Seasonality of certain business components;
|
21
|
•
|
Natural gas, natural gas liquids, and olefins prices, supply, and demand;
|
|
•
|
Demand for our services.
|
Forward-looking statements are based on numerous assumptions, uncertainties and risks that could cause future events or results to be materially different from those stated or implied in this report. Many of the factors that will determine these results are beyond our ability to control or predict. Specific factors that could cause actual results to differ from results contemplated by the forward-looking statements include, among others, the following:
|
•
|
Satisfaction of the conditions to the completion of the proposed ETC Merger, including receipt of the approval of Williams’ stockholders;
|
|
•
|
The timing and likelihood of completion of the proposed ETC Merger, including the timing, receipt and terms and conditions of any required governmental and regulatory approvals for the proposed merger that could reduce anticipated benefits or cause the parties to abandon the proposed transaction;
|
|
•
|
The possibility that the expected synergies and value creation from the proposed ETC Merger will not be realized or will not be realized within the expected time period;
|
|
•
|
The risk that the businesses of Williams and Energy Transfer will not be integrated successfully;
|
|
•
|
Disruption from the proposed ETC Merger making it more difficult to maintain business and operational relationships;
|
|
•
|
The risk that unexpected costs will be incurred in connection with the proposed ETC Merger;
|
|
•
|
The possibility that the proposed ETC Merger does not close, including due to the failure to satisfy the closing conditions;
|
|
•
|
Whether WPZ will produce sufficient cash flows to provide the level of cash distributions we expect;
|
|
•
|
Whether Williams is able to pay current and expected levels of dividends;
|
|
•
|
Availability of supplies, market demand and volatility of prices;
|
|
•
|
Inflation, interest rates, fluctuation in foreign exchange rates and general economic conditions (including future disruptions and volatility in the global credit markets and the impact of these events on customers and suppliers);
|
|
•
|
The strength and financial resources of our competitors and the effects of competition;
|
|
•
|
Whether we are able to successfully identify, evaluate and execute investment opportunities;
|
|
•
|
Our ability to acquire new businesses and assets and successfully integrate those operations and assets into our existing businesses as well as successfully expand our facilities;
|
|
•
|
Development of alternative energy sources;
|
|
•
|
The impact of operational and developmental hazards and unforeseen interruptions;
|
|
•
|
Costs of, changes in, or the results of laws, government regulations (including safety and environmental regulations), environmental liabilities, litigation, and rate proceedings;
|
|
•
|
Williams’ costs and funding obligations for defined benefit pension plans and other postretirement benefit plans;
|
|
•
|
Changes in maintenance and construction costs;
|
22
|
•
|
Changes in the current geopolitical situation;
|
|
•
|
Our exposure to the credit risk of our customers and counterparties;
|
|
•
|
Risks related to financing, including restrictions stemming from debt agreements, future changes in credit ratings as determined by nationally-recognized credit rating agencies and the availability and cost of capital;
|
|
•
|
The amount of cash distributions from and capital requirements of our investments and joint ventures in which we participate;
|
|
•
|
Risks associated with weather and natural phenomena, including climate conditions;
|
|
•
|
Acts of terrorism, including cybersecurity threats and related disruptions;
|
|
•
|
Additional risks described in our filings with the SEC.
|
Given the uncertainties and risk factors that could cause our actual results to differ materially from those contained in any forward-looking statement, we caution investors not to unduly rely on our forward-looking statements. We disclaim any obligations to and do not intend to update the above list or announce publicly the result of any revisions to any of the forward-looking statements to reflect future events or developments.
In addition to causing our actual results to differ, the factors listed above and referred to below may cause our intentions to change from those statements of intention set forth in this report. Such changes in our intentions may also cause our results to differ. We may change our intentions, at any time and without notice, based upon changes in such factors, our assumptions, or otherwise.
Because forward-looking statements involve risks and uncertainties, we caution that there are important factors, in addition to those listed above, that may cause actual results to differ materially from those contained in the forward-looking statements. These factors are described in the following section.
RISK FACTORS
You should carefully consider the following risk factors in addition to the other information in this report. Each of these factors could adversely affect our business, operating results, and financial condition, as well as adversely affect the value of an investment in our securities.
The pendency of the proposed ETC Merger could adversely affect our business and operations.
In connection with the proposed ETC Merger, some of our customers or vendors may delay or defer decisions, which could negatively impact our revenues, earnings, cash flows and expenses, regardless of whether the proposed ETC Merger is completed. Similarly, our current and prospective employees may experience uncertainty about their future roles following the proposed ETC Merger, which may materially adversely affect our ability to attract and retain key personnel during the pendency of the proposed ETC Merger. If we fail to complete the proposed ETC Merger, it may be difficult and expensive to recruit and hire replacements for departed employees. The proposed ETC Merger, its effects and related matters may also distract our employees from day-to-day operations and require substantial commitments of time and resources. In addition, due to operating covenants in the Merger Agreement, we may be unable, during the pendency of the proposed ETC Merger, to pursue certain strategic transactions, undertake certain significant capital projects, undertake certain significant financing transactions and otherwise pursue other actions that are not in the ordinary course of business. Such risks relating to vendors, customers, employees and those risks arising from operating covenants in the Merger Agreement will also apply to varying degrees to our subsidiaries and affiliates and thereby have a corresponding impact on us.
There can be no assurance when or even if the proposed ETC Merger will be completed.
Completion of the proposed ETC Merger is subject to the satisfaction or waiver of a number of conditions that must be satisfied or waived, including approval of the proposed ETC Merger by our stockholders, the expiration or termination of the waiting period applicable to the proposed ETC Merger under antitrust laws, the absence of any law
23
or order prohibiting the closing of the proposed ETC Merger, the declaration by the SEC of the effectiveness of the registration statement on Form S-4 of which the proxy statement/prospectus forms a part and the authorization of the listing on the NYSE of the ETC common shares. There can be no assurance that we, ETC, and Energy Transfer will be able to satisfy the closing conditions or that closing conditions beyond their or our control will be satisfied or waived. Completion of the proposed ETC Merger is also conditioned on the accuracy of representations and warranties made by the parties to the Merger Agreement (subject to customary materiality qualifiers and other customary exceptions) and the performance in all material respects by the parties of obligations imposed under the Merger Agreement.We and Energy Transfer can mutually agree at any time to terminate the Merger Agreement, even if our stockholders have already voted to approve the Merger Agreement. We and Energy Transfer can also terminate the Merger Agreement under other specified circumstances.
If the proposed ETC Merger is not completed, we will be subject to a number of risks, including the following:
|
•
|
Because the current price of shares of our common stock may reflect a market premium based on the assumption that we will complete the proposed ETC Merger, a failure to complete the proposed ETC Merger could result in a decline in the price of shares of our common stock;
|
|
•
|
In specified circumstances, we may be required to pay Energy Transfer a termination fee of $1.48 billion and certain of their expenses;
|
|
•
|
We will not realize the benefits expected from being part of a larger combined organization;
|
|
•
|
We have incurred and expect to continue incurring a number of non-recurring ETC Merger-related expenses that must be paid even if the proposed ETC Merger is not completed.
|
In addition, if the proposed ETC Merger is not completed, we may experience negative reactions from the financial markets and from our customers and employees. We also could be subject to litigation related to any failure to complete the proposed ETC Merger or to proceedings commenced against us to attempt to force us to perform our obligations under the Merger Agreement.
The Merger Agreement contains provisions that could discourage a potential competing acquirer of us or could result in any competing proposal being at a lower price than it might otherwise be.
The Merger Agreement contains provisions that, subject to certain exceptions, restrict our ability to solicit, encourage, facilitate or discuss competing third-party proposals to acquire all or a significant part of us. In addition, Energy Transfer will have an opportunity to negotiate with us in response to any competing proposal that may be made before our board of directors is permitted to withdraw or qualify its recommendation. In some circumstances, upon termination of the Merger Agreement, we may be required to pay to Energy Transfer a termination fee of $1.48 billion.
These provisions could discourage a potential competing acquirer that might have an interest in acquiring all or a significant part of us from considering or proposing that acquisition, even if it were prepared to pay consideration with a higher value than the consideration proposed to be received or realized in the proposed ETC Merger, or might result in a potential competing acquirer proposing to pay a lower price than it might otherwise have proposed to pay because of the added expense of the termination fee that may become payable in certain circumstances.
The integration of our business following the proposed ETC Merger will involve considerable risks and may not be successful.
Achieving the anticipated benefits of the proposed ETC Merger will depend in part upon whether Energy Transfer can integrate our businesses in an effective and efficient manner. Energy Transfer may not be able to accomplish this integration process successfully. The integration of any business may be complex and time-consuming. The difficulties that could be encountered include the following:
•
Integrating personnel, operations and systems;
•
Coordinating the geographically dispersed organizations;
24
•
Distraction of management and employees from operations changes in corporate culture;
•
Retaining existing customers and attracting new customers;
•
Maintaining business relationships; and
•
Inefficiencies associated with the integration of the operations of ETC.
In addition, there will be integration costs and non-recurring transaction costs associated with the proposed ETC Merger (such as fees paid to legal, financial, accounting and other advisors and other fees paid in connection with the proposed ETC Merger) and achieving the expected cost savings and synergies associated therewith, and such costs may be significant.
An inability to realize the full extent of the anticipated benefits of the proposed ETC Merger, as well as any delays encountered in the integration process and the realization of such benefits, could have an adverse effect upon the revenues, level of expenses and operating results of Energy Transfer, which may adversely affect the value of Energy Transfer common units and, in turn, the value of ETC common shares after the completion of the merger.
Stockholder litigation could prevent or delay the closing of the proposed ETC Merger or otherwise negatively impact our business and operations.
We have incurred and may continue to incur additional costs in connection with the defense or settlement of the currently pending and any future stockholder litigation in connection with the proposed ETC Merger. Such litigation may adversely affect our ability to complete the proposed ETC Merger and could also have an adverse effect on our financial condition and results of operations.
We are exposed to the credit risk of our customers and counterparties, including Chesapeake Energy Corporation and its affiliates, and our credit risk management will not be able to completely eliminate such risk.
We are subject to the risk of loss resulting from nonpayment and/or nonperformance by our customers and counterparties in the ordinary course of our business. Generally, our customers are rated investment grade, are otherwise considered creditworthy or are required to make prepayments or provide security to satisfy credit concerns. However, our credit procedures and policies will not completely eliminate customer and counterparty credit risk. Our customers and counterparties include industrial customers, local distribution companies, natural gas producers and marketers whose creditworthiness may be suddenly and disparately impacted by, among other factors, commodity price volatility, deteriorating energy market conditions, and public and regulatory opposition to energy producing activities. The current low commodity price environment has, in particular, negatively impacted natural gas producers causing them significant economic stress including, in some cases, to file for bankruptcy protection or to renegotiate contracts.To the extent one or more of our key customers commences bankruptcy proceedings, our contracts with the customers may be subject to rejection under applicable provisions of the United States Bankruptcy Code, or may be renegotiated. Further, during any such bankruptcy proceeding, prior to assumption, rejection or renegotiation of such contracts, the bankruptcy court may temporarily authorize the payment of value for our services less than contractually required, which could have a material adverse effect on our business, results of operations, cash flows and financial conditions. For example, Chesapeake Energy Corporation and its affiliates, which accounted for approximately 18 percent of our 2015 consolidated revenues, have experienced significant, negative financial results due to sustained low commodity prices. If we fail to adequately assess the creditworthiness of existing or future customers and counterparties or otherwise do not take or are unable to take sufficient mitigating actions, including obtaining sufficient collateral, deterioration in their creditworthiness and any resulting increase in nonpayment and/or nonperformance by them could cause us to write down or write off accounts receivable. Such write-downs or write-offs could negatively affect our operating results in the periods in which they occur, and, if significant, could have a material adverse effect on our business, results of operations, cash flows and financial condition.
Prices for NGLs, olefins, natural gas, oil and other commodities, are volatile and this volatility has and could continue to adversely affect our financial results, cash flows, access to capital and ability to maintain our existing businesses.
25
Our revenues, operating results, future rate of growth and the value of certain components of our businesses depend primarily upon the prices of NGLs, olefins, natural gas, oil or other commodities, and the differences between prices of these commodities, and could be materially adversely affected by an extended period of current low commodity prices or a further decline in commodity prices. Price volatility has and could continue to impact both the amount we receive for our products and services and the volume of products and services we sell. Prices affect the amount of cash flow available for capital expenditures and our ability to borrow money or raise additional capital. Price volatility has and could continue to have an adverse effect on our business, results of operations, financial condition and cash flows.
The markets for NGLs, olefins, natural gas, oil and other commodities are likely to continue to be volatile. Wide fluctuations in prices might result from one or more factors beyond our control, including:
|
•
|
Worldwide and domestic supplies of and demand for natural gas, NGLs, olefins, oil, and related commodities;
|
|
•
|
Turmoil in the Middle East and other producing regions;
|
|
•
|
The activities of the Organization of Petroleum Exporting Countries;
|
|
•
|
The level of consumer demand;
|
|
•
|
The price and availability of other types of fuels or feedstocks;
|
|
•
|
The availability of pipeline capacity;
|
|
•
|
Supply disruptions, including plant outages and transportation disruptions;
|
|
•
|
The price and quantity of foreign imports of natural gas and oil;
|
|
•
|
Domestic and foreign governmental regulations and taxes;
|
|
•
|
The credit of participants in the markets where products are bought and sold.
|
Downgrades of our credit ratings, which are determined outside of our control by independent third parties, impact our liquidity, access to capital and our costs of doing business.
Our credit ratings have recently been downgraded. Downgrades of our credit ratings increase our cost of borrowing and could require us to provide collateral to our counterparties, negatively impacting our available liquidity. In addition, our ability to access capital markets could continue to be limited by the downgrading of our credit ratings.
Credit rating agencies perform independent analysis when assigning credit ratings. This analysis includes a number of criteria such as, business composition, market and operational risks, as well as various financial tests. Credit rating agencies continue to review the criteria for industry sectors and various debt ratings and may make changes to those criteria from time to time. Credit ratings are subject to revision or withdrawal at any time by the ratings agencies. As of the date of the filing of this report, we have been assigned sub investment-grade credit ratings by each of the three ratings agencies.
Our ability to obtain credit in the future could be affected by WPZ’s credit ratings.
A substantial portion of our operations are conducted through, and our cash flows are substantially derived from distributions paid to us by, WPZ. Due to our relationship with WPZ, our ability to obtain credit will be affected by WPZ’s credit ratings. WPZ’s credit ratings have recently been downgraded. If WPZ were to experience a further deterioration in its credit standing or financial condition, our access to capital and our ratings could be further adversely affected. Any future downgrading of a WPZ credit rating could also result in a further downgrading of our credit rating. A downgrading of a WPZ credit rating could limit our ability to obtain financing in the future upon favorable terms, if at all.
26
The long-term financial condition of our natural gas transportation and midstream businesses is dependent on the continued availability of natural gas supplies in the supply basins that we access, and demand for those supplies in our traditional markets.
Our ability to maintain and expand our natural gas transportation and midstream businesses depends on the level of drilling and production by third parties in our supply basins. Production from existing wells and natural gas supply basins with access to our pipeline and gathering systems will naturally decline over time. The amount of natural gas reserves underlying these existing wells may also be less than anticipated, and the rate at which production from these reserves declines may be greater than anticipated. We do not obtain independent evaluations of natural gas and NGL reserves connected to our systems and processing facilities. Accordingly, we do not have independent estimates of total reserves dedicated to our systems or the anticipated life of such reserves. In addition, low prices for natural gas, regulatory limitations, or the lack of available capital could adversely affect the development and production of additional natural gas reserves, the installation of gathering, storage, and pipeline transportation facilities and the import and export of natural gas supplies. The competition for natural gas supplies to serve other markets could also reduce the amount of natural gas supply for our customers. A failure to obtain access to sufficient natural gas supplies will adversely impact our ability to maximize the capacities of our gathering, transportation and processing facilities.
Demand for our services is dependent on the demand for gas in the markets we serve. Alternative fuel sources such as electricity, coal, fuel oils or nuclear energy could reduce demand for natural gas in our markets and have an adverse effect on our business.
A failure to obtain access to sufficient natural gas supplies or a reduction in demand for our services in the markets we serve could result in impairments of our assets and have a material adverse effect on our business, financial condition and results of operations.
We may not be able to grow or effectively manage our growth.
As part of our growth strategy, we consider acquisition opportunities and engage in significant capital projects. We have both a project lifecycle process and an investment evaluation process. These are processes we use to identify, evaluate and execute on acquisition opportunities and capital projects. We may not always have sufficient and accurate information to identify and value potential opportunities and risks or our investment evaluation process may be incomplete or flawed. Regarding potential acquisitions, suitable acquisition candidates may not be available on terms and conditions we find acceptable or, where multiple parties are trying to acquire an acquisition candidate, we may not be chosen as the acquirer. If we are able to acquire a targeted business, we may not be able to successfully integrate the acquired businesses and realize anticipated benefits in a timely manner. Our growth may also be dependent upon the construction of new natural gas gathering, transportation, compression, processing or treating pipelines and facilities, NGL transportation, fractionation or storage facilities or olefins processing facilities, as well as the expansion of existing facilities. We also face all the risks associated with construction. These risks include the inability to obtain skilled labor, equipment, materials, permits, rights-of-way and other required inputs in a timely manner such that projects are completed on time and the risk that construction cost overruns could cause total project costs to exceed budgeted costs. Additional risks associated with growing our business include, among others, that:
|
•
|
Changing circumstances and deviations in variables could negatively impact our investment analysis, including our projections of revenues, earnings and cash flow relating to potential investment targets, resulting in outcomes which are materially different than anticipated;
|
|
•
|
We could be required to contribute additional capital to support acquired businesses or assets;
|
|
•
|
We may assume liabilities that were not disclosed to us, that exceed our estimates and for which contractual protections are either unavailable or prove inadequate;
|
|
•
|
Acquisitions could disrupt our ongoing business, distract management, divert financial and operational resources from existing operations and make it difficult to maintain our current business standards, controls and procedures;
|
27
|
•
|
Acquisitions and capital projects may require substantial new capital, including the issuance of debt or equity, and we may not be able to access capital markets or obtain acceptable terms.
|
If realized, any of these risks could have an adverse impact on our results of operations, including the possible impairment of our assets, and could also have an adverse impact on our financial position or cash flows.
We do not own all of the interests in the Partially Owned Entities, which could adversely affect our ability to operate and control these assets in a manner beneficial to us.
Because we do not control the Partially Owned Entities, we may have limited flexibility to control the operation of or cash distributions received from these entities. The Partially Owned Entities’ organizational documents generally require distribution of their available cash to their members on a quarterly basis; however, in each case, available cash is reduced, in part, by reserves appropriate for operating the businesses. As of December 31, 2015, our investments in the Partially Owned Entities accounted for approximately 8 percent
of our total consolidated assets. Conflicts of interest may arise in the future between us, on the one hand, and our Partially Owned Entities, on the other hand, with regard to our Partially Owned Entities’ governance, business and operations. If a conflict of interest arises between us and a Partially Owned Entity, other owners may control the Partially Owned Entity’s actions with respect to such matter (subject to certain limitations), which could be detrimental to our business. Any future disagreements with the other co-owners of these assets could adversely affect our ability to respond to changing economic or industry conditions, which could have a material adverse effect on our business, financial condition, results of operations and cash flows.
Holders of our common stock may not receive dividends in the amount expected or any dividends.
We may not have sufficient cash each quarter to pay dividends or maintain current or expected levels of dividends. The actual amount of cash we dividend may fluctuate from quarter to quarter and will depend on various factors, some of which are beyond our control, including:
|
•
|
The amount of cash that WPZ and our other subsidiaries distribute to us;
|
|
•
|
The amount of cash we generate from our operations, our working capital needs, our level of capital expenditures, and our ability to borrow;
|
|
•
|
The restrictions contained in our indentures and credit facility and our debt service requirements;
|
|
•
|
The cost of acquisitions, if any.
|
A failure either to pay dividends or to pay dividends at expected levels could result in a loss of investor confidence, reputational damage and a decrease in the value of our stock price.
Our cash flow depends heavily on the earnings and distributions of WPZ.
Our partnership interest, including the general partner’s holding of incentive distribution rights in WPZ, is currently our largest cash-generating asset. Therefore, we are, at the least, indirectly exposed to all the risks to which WPZ is subject and our cash flow is heavily dependent upon the ability of WPZ to make distributions to its partners. A significant decline in WPZ’s earnings and/or distributions would have a corresponding negative impact on us.
We may not be able to sell assets or, if we are able to sell assets, to raise a sufficient amount of capital from such asset sales. In addition, the timing to enter into and close any asset sales could be significantly different than our expected timeline.
In addition to the recent announcement that WPZ plans to monetize assets during 2016 to fund capital and investment expenditures, it is possible that we could also engage in asset sales. Given the commodity markets, financial markets and other challenges currently facing the energy sector, our competitors may also engage in asset sales leading to lower demand for the assets we wish to sell. We may not be able to sell the assets we identify for sale on favorable terms or at all. If we are able to sell assets, the timing of the receipt of the asset sale proceeds may not align with the timing of our capital requirements. A failure to raise sufficient capital from asset sales or a misalignment of the timing of capital raised and capital funding needs could have an adverse impact on our business, financial condition, results of operations and cash flows.
28
An impairment of our assets, including goodwill, property, plant and equipment, intangible assets, and/or equity-method investments, could reduce our earnings.
GAAP requires us to test certain assets for impairment on either an annual basis or when events or circumstances occur which indicate that the carrying value of such assets might be impaired. If the current depressed energy commodity price environment persists for a prolonged period or further declines, such circumstances could result in additional impairments of our assets beyond those incurred in 2015 including impairments of our goodwill, property, plant and equipment, intangible assets, and/or equity method investments. Additionally any asset monetization could result in impairments if any assets are sold for amounts less than their carrying value. If we determine that an impairment has occurred, we would be required to take an immediate noncash charge to earnings.
Our industry is highly competitive and increased competitive pressure could adversely affect our business and operating results.
We have numerous competitors in all aspects of our businesses, and additional competitors may enter our markets. Some of our competitors are large oil, natural gas and petrochemical companies that have greater access to supplies of natural gas and NGLs than we do. In addition, current or potential competitors may make strategic acquisitions or have greater financial resources than we do, which could affect our ability to make strategic investments or acquisitions. Our competitors may be able to respond more quickly to new laws or regulations or emerging technologies or to devote greater resources to the construction, expansion or refurbishment of their facilities than we can. Similarly, a highly-liquid competitive commodity market in natural gas and increasingly competitive markets for natural gas services, including competitive secondary markets in pipeline capacity, have developed. As a result, pipeline capacity is being used more efficiently, and peaking and storage services are increasingly effective substitutes for annual pipeline capacity. Failure to successfully compete against current and future competitors could have a material adverse effect on our business, results of operations, financial condition and cash flows.
We may not be able to replace, extend, or add additional customer contracts or contracted volumes on favorable terms, or at all, which could affect our financial condition, the amount of cash available to pay dividends, and our ability to grow.
We rely on a limited number of customers and producers for a significant portion of our revenues and supply of natural gas and NGLs. Although many of our customers and suppliers are subject to long-term contracts, if we are unable to replace or extend such contracts, add additional customers, or otherwise increase the contracted volumes of natural gas provided to us by current producers, in each case on favorable terms, if at all, our financial condition, growth plans, and the amount of cash available to pay dividends could be adversely affected. Our ability to replace, extend, or add additional customer or supplier contracts, or increase contracted volumes of natural gas from current producers, on favorable terms, or at all, is subject to a number of factors, some of which are beyond our control, including:
|
•
|
The level of existing and new competition in our businesses or from alternative fuel sources, such as electricity, coal, fuel oils, or nuclear energy;
|
|
•
|
Natural gas, NGL, and olefins prices, demand, availability and margins in our markets. Higher prices for energy commodities related to our businesses could result in a decline in the demand for those commodities and, therefore, in customer contracts or throughput on our pipeline systems. Also, lower energy commodity prices could negatively impact our ability to maintain or achieve favorable contractual terms, including pricing, and could also result in a decline in the production of energy commodities resulting in reduced customer contracts, supply contracts, and throughput on our pipeline systems;
|
|
•
|
General economic, financial markets and industry conditions;
|
|
•
|
The effects of regulation on us, our customers and our contracting practices;
|
|
•
|
Our ability to understand our customers’ expectations, efficiently and reliably deliver high quality services and effectively manage customer relationships. The results of these efforts will impact our reputation and positioning in the market.
|
29
Some of our businesses, including WPZ’s Central business, are exposed to supplier concentration risks arising from dependence on a single or a limited number of suppliers.
Some of our businesses may be dependent on a small number of suppliers for delivery of critical goods or services. For instance, pursuant to a compression services agreement, WPZ’s Central business receives a substantial portion of its compression capacity on certain gathering systems from EXLP Operating LLC (“Exterran Operating”). Exterran Operating has, until December 31, 2020, the exclusive right to provide WPZ’s Central business with compression services on certain gas gathering systems located in Wyoming, Texas, Oklahoma, Louisiana, and Arkansas, in return for the payment of specified monthly rates for the services provided, subject to an annual escalation provision. If a supplier on which one of our businesses depends were to fail to timely supply required goods and services such business may not be able to replace such goods and services in a timely manner or otherwise on favorable terms or at all. If our business is unable to adequately diversify or otherwise mitigate such supplier concentration risks and such risks were realized, such businesses could be subject to reduced revenues and increased expenses, which could have a material adverse effect on our financial condition, results of operation and cash flows.
We will conduct certain operations through joint ventures that may limit our operational flexibility or require us to make additional capital contributions.
Some of our operations are conducted through joint venture arrangements, and we may enter additional joint ventures in the future. In a joint venture arrangement, we have less operational flexibility, as actions must be taken in accordance with the applicable governing provisions of the joint venture. In certain cases we:
|
•
|
Have limited ability to influence or control certain day to day activities affecting the operations;
|
|
•
|
Cannot control the amount of capital expenditures that we are required to fund with respect to these operations;
|
|
•
|
Are dependent on third parties to fund their required share of capital expenditures;
|
|
•
|
May be subject to restrictions or limitations on our ability to sell or transfer our interests in the jointly owned assets;
|
|
•
|
May be forced to offer rights of participation to other joint venture participants in the area of mutual interest.
|
In addition, joint venture participants may have obligations that are important to the success of the joint venture, such as the obligation to pay substantial carried costs pertaining to the joint venture and to pay their share of capital and other costs of the joint venture. The performance and ability of third parties to satisfy their obligations under joint venture arrangements is outside our control. If these third parties do not satisfy their obligations under these arrangements, our business may be adversely affected. Joint venture partners may be in a position to take actions contrary to instructions or requests or contrary to our policies or objectives, and disputes between us and our joint venture partners may result in delays, litigation or operational impasses.
If we fail to make a required capital contribution under the applicable governing provisions of a joint venture arrangements, we could be deemed to be in default under the joint venture agreement. Joint venture partners may be permitted to fund any deficiency resulting from our failure to make such capital contribution, which would result in a dilution of our ownership interest, or such joint venture partners may have the option to purchase all of our existing interest in the subject joint venture.
The risks described above or the failure to continue joint ventures, or to resolve disagreements with joint venture partners could adversely affect our ability to conduct our operation that is the subject of a joint venture, which could in turn negatively affect our financial condition and results of operations.
Our operations are subject to operational hazards and unforeseen interruptions.
There are operational risks associated with the gathering, transporting, storage, processing and treating of natural gas, the fractionation, transportation and storage of NGLs, the processing of olefins, and crude oil transportation and production handling, including:
30
|
•
|
Aging infrastructure and mechanical problems;
|
|
•
|
Damages to pipelines and pipeline blockages or other pipeline interruptions;
|
|
•
|
Uncontrolled releases of natural gas (including sour gas), NGLs, olefins products, brine or industrial chemicals;
|
|
•
|
Collapse or failure of storage caverns;
|
|
•
|
Operator error;
|
|
•
|
Damage caused by third-party activity, such as operation of construction equipment;
|
|
•
|
Pollution and other environmental risks;
|
|
•
|
Fires, explosions, craterings and blowouts;
|
|
•
|
Truck and rail loading and unloading;
|
|
•
|
Operating in a marine environment.
|
Any of these risks could result in loss of human life, personal injuries, significant damage to property, environmental pollution, impairment of our operations, loss of services to our customers, reputational damage and substantial losses to us. The location of certain segments of our facilities in or near populated areas, including residential areas, commercial business centers and industrial sites, could increase the level of damages resulting from these risks. An event such as those described above could have a material adverse effect on our financial condition and results of operations, particularly if the event is not fully covered by insurance.
We do not insure against all potential risks and losses and could be seriously harmed by unexpected liabilities or by the inability of our insurers to satisfy our claims.
In accordance with customary industry practice, we maintain insurance against some, but not all, risks and losses, and only at levels we believe to be appropriate. We currently maintain excess liability insurance with limits of $820 million per occurrence and in the annual aggregate with a $2 million per occurrence deductible. This insurance covers us, our subsidiaries, and certain of our affiliates for legal and contractual liabilities arising out of bodily injury or property damage, including resulting loss of use to third parties. This excess liability insurance includes coverage for sudden and accidental pollution liability for full limits, with the first $135 million of insurance also providing gradual pollution liability coverage for natural gas and NGL operations.
Although we maintain property insurance on certain physical assets that we own, lease or are responsible to insure, the policy may not cover the full replacement cost of all damaged assets or the entire amount of business interruption loss we may experience. In addition, certain perils may be excluded from coverage or be sub-limited. We may not be able to maintain or obtain insurance of the type and amount we desire at reasonable rates. We may elect to self-insure a portion of our risks. We do not insure our onshore underground pipelines for physical damage, except at certain locations such as river crossings and compressor stations. Offshore assets are covered for property damage when loss is due to a named windstorm event, but coverage for loss caused by a named windstorm is significantly sub-limited and subject to a large deductible. All of our insurance is subject to deductibles.
In addition, to the insurance coverage described above, we are a member of Oil Insurance Limited (“OIL”), an energy industry mutual insurance company, which provides coverage for damage to our property. As an insured member of OIL, we share in the losses among other OIL members even if our property is not damaged.
The occurrence of any risks not fully covered by insurance could have a material adverse effect on our business, results of operations, financial condition, cash flows and our ability to repay our debt.
Our assets and operations, as well as our customers’ assets and operations, can be adversely affected by weather and other natural phenomena.
31
Our assets and operations, especially those located offshore, and our customers’ assets and operations can be adversely affected by hurricanes, floods, earthquakes, landslides, tornadoes, fires and other natural phenomena and weather conditions, including extreme or unseasonable temperatures, making it more difficult for us to realize the historic rates of return associated with our assets and operations. A significant disruption in our or our customers’ operations or a significant liability for which we are not fully insured could have a material adverse effect on our business, financial condition, results of operations and cash flows.
Acts of terrorism could have a material adverse effect on our business, financial condition, results of operations and cash flows.
Given the volatile nature of the commodities we transport, process, store and sell, our assets and the assets of our customers and others in our industry may be targets of terrorist activities. A terrorist attack could create significant price volatility, disrupt our business, limit our access to capital markets or cause significant harm to our operations, such as full or partial disruption to our ability to produce, process, transport or distribute natural gas, NGLs or other commodities. Acts of terrorism, as well as events occurring in response to or in connection with acts of terrorism, could cause environmental repercussions that could result in a significant decrease in revenues or significant reconstruction or remediation costs, which could have a material adverse effect on our business, financial condition, results of operations and cash flows.
Our business could be negatively impacted by security threats, including cybersecurity threats, and related disruptions.
We rely on our information technology infrastructure to process, transmit and store electronic information, including information we use to safely operate our assets. While we believe that we maintain appropriate information security policies, practices and protocols, we face cybersecurity and other security threats to our information technology infrastructure, which could include threats to our operational industrial control systems and safety systems that operate our pipelines, plants and assets. We could face unlawful attempts to gain access to our information technology infrastructure, including coordinated attacks from hackers, whether state-sponsored groups, “hacktivists,” or private individuals. The age, operating systems or condition of our current information technology infrastructure and software assets and our ability to maintain and upgrade such assets could affect our ability to resist cybersecurity threats. We could also face attempts to gain access to information related to our assets through attempts to obtain unauthorized access by targeting acts of deception against individuals with legitimate access to physical locations or information.
Breaches in our information technology infrastructure or physical facilities, or other disruptions including those arising from theft, vandalism, fraud or unethical conduct, could result in damage to our assets, unnecessary waste, safety incidents, damage to the environment, reputational damage, potential liability or the loss of contracts, and have a material adverse effect on our operations, financial position and results of operations.
The natural gas sales, transportation and storage operations of our gas pipelines are subject to regulation by the FERC, which could have an adverse impact on their ability to establish transportation and storage rates that would allow them to recover the full cost of operating their respective pipelines, including a reasonable rate of return.
In addition to regulation by other federal, state and local regulatory authorities, under the Natural Gas Act of 1938, interstate pipeline transportation and storage service is subject to regulation by the FERC. Federal regulation extends to such matters as:
|
•
|
Transportation and sale for resale of natural gas in interstate commerce;
|
|
•
|
Rates, operating terms, types of services and conditions of service;
|
|
•
|
Certification and construction of new interstate pipelines and storage facilities;
|
|
•
|
Acquisition, extension, disposition or abandonment of existing interstate pipelines and storage facilities;
|
|
•
|
Accounts and records;
|
|
•
|
Depreciation and amortization policies;
|
32
|
•
|
Relationships with affiliated companies who are involved in marketing functions of the natural gas business;
|
|
•
|
Market manipulation in connection with interstate sales, purchases or transportation of natural gas.
|
Regulatory or administrative actions in these areas, including successful complaints or protests against the rates of the gas pipelines, can affect our business in many ways, including decreasing tariff rates and revenues, decreasing volumes in our pipelines, increasing our costs and otherwise altering the profitability of our pipeline business.
Our operations are subject to environmental laws and regulations, including laws and regulations relating to climate change and greenhouse gas emissions, which may expose us to significant costs, liabilities and expenditures that could exceed expectations.
Our operations are subject to extensive federal, state, tribal and local laws and regulations governing environmental protection, endangered and threatened species, the discharge of materials into the environment and the security of chemical and industrial facilities. Substantial costs, liabilities, delays and other significant issues related to environmental laws and regulations are inherent in the gathering, transportation, storage, processing and treating of natural gas, fractionation, transportation and storage of NGLs, processing of olefins, and crude oil transportation and production handling as well as waste disposal practices and construction activities. Failure to comply with these laws, regulations and permits may result in the assessment of administrative, civil and/or criminal penalties, the imposition of remedial obligations, the imposition of stricter conditions on or revocation of permits, the issuance of injunctions limiting or preventing some or all of our operations and delays in granting permits.
Joint and several, strict liability may be incurred without regard to fault under certain environmental laws and regulations, for the remediation of contaminated areas and in connection with spills or releases of materials associated with natural gas, oil and wastes on, under or from our properties and facilities. Private parties, including the owners of properties through which our pipeline and gathering systems pass and facilities where our wastes are taken for reclamation or disposal, may have the right to pursue legal actions to enforce compliance as well as to seek damages for noncompliance with environmental laws and regulations or for personal injury or property damage arising from our operations. Some sites at which we operate are located near current or former third-party hydrocarbon storage and processing or oil and natural gas operations or facilities, and there is a risk that contamination has migrated from those sites to ours.
We are generally responsible for all liabilities associated with the environmental condition of our facilities and assets, whether acquired or developed, regardless of when the liabilities arose and whether they are known or unknown. In connection with certain acquisitions and divestitures, we could acquire, or be required to provide indemnification against, environmental liabilities that could expose us to material losses, which may not be covered by insurance. In addition, the steps we could be required to take to bring certain facilities into compliance could be prohibitively expensive, and we might be required to shut down, divest or alter the operation of those facilities, which might cause us to incur losses.
In addition, climate change regulations and the costs associated with the regulation of emissions of greenhouse gases (“GHGs”) have the potential to affect our business. Regulatory actions by the Environmental Protection Agency or the passage of new climate change laws or regulations could result in increased costs to (i) operate and maintain our facilities, (ii) install new emission controls on our facilities and (iii) administer and manage our GHG compliance program. If we are unable to recover or pass through a significant level of our costs related to complying with climate change regulatory requirements imposed on us, it could have a material adverse effect on our results of operations and financial condition. To the extent financial markets view climate change and GHG emissions as a financial risk, this could negatively impact our cost of and access to capital. Climate change and GHG regulation could also reduce demand for our services.
If third-party pipelines and other facilities interconnected to our pipelines and facilities become unavailable to transport natural gas and NGLs or to treat natural gas, our revenues could be adversely affected.
We depend upon third-party pipelines and other facilities that provide delivery options to and from our pipelines and facilities for the benefit of our customers. Because we do not own these third-party pipelines or other facilities, their continuing operation is not within our control. If these pipelines or facilities were to become temporarily or
33
permanently unavailable for any reason, or if throughput were reduced because of testing, line repair, damage to pipelines or facilities, reduced operating pressures, lack of capacity, increased credit requirements or rates charged by such pipelines or facilities or other causes, we and our customers would have reduced capacity to transport, store or deliver natural gas or NGL products to end use markets or to receive deliveries of mixed NGLs, thereby reducing our revenues. Any temporary or permanent interruption at any key pipeline interconnect or in operations on third-party pipelines or facilities that would cause a material reduction in volumes transported on our pipelines or our gathering systems or processed, fractionated, treated or stored at our facilities could have a material adverse effect on our business, results of operations, financial condition and cash flows.
The operation of our businesses might also be adversely affected by changes in government regulations or in their interpretation or implementation, or the introduction of new laws or regulations applicable to our businesses or our customers.
Public and regulatory scrutiny of the energy industry has resulted in the proposal and/or implementation of increased regulations. Such scrutiny has also resulted in various inquiries, investigations and court proceedings, including litigation of energy industry matters. Both the shippers on our pipelines and regulators have rights to challenge the rates we charge under certain circumstances. Any successful challenge could materially affect our results of operations.
Certain inquiries, investigations and court proceedings are ongoing. Adverse effects may continue as a result of the uncertainty of ongoing inquiries, investigations and court proceedings, or additional inquiries and proceedings by federal or state regulatory agencies or private plaintiffs. In addition, we cannot predict the outcome of any of these inquiries or whether these inquiries will lead to additional legal proceedings against us, civil or criminal fines and/or penalties, or other regulatory action, including legislation, which might be materially adverse to the operation of our business and our results of operations or increase our operating costs in other ways. Current legal proceedings or other matters, including environmental matters, suits, regulatory appeals and similar matters might result in adverse decisions against us which, among other outcomes, could result in the imposition of substantial penalties and fines and could damage our reputation. The result of such adverse decisions, either individually or in the aggregate, could be material and may not be covered fully or at all by insurance.
In addition, existing regulations might be revised or reinterpreted, and new laws and regulations, including those pertaining to oil and gas hedging and cash collateral requirements, might be adopted or become applicable to us, our customers or our business activities. If new laws or regulations are imposed relating to oil and gas extraction, or if additional levels of reporting, regulation or permitting moratoria are required or imposed, including those related to hydraulic fracturing, the volumes of natural gas and other products that we transport, gather, process and treat could decline and our results of operations could be adversely affected.
Certain of our gas pipeline services are subject to long-term, fixed-price contracts that are not subject to adjustment, even if our cost to perform such services exceeds the revenues received from such contracts.
Our gas pipelines provide some services pursuant to long-term, fixed-price contracts. It is possible that costs to perform services under such contracts will exceed the revenues our pipelines collect for their services. Although most of the services are priced at cost-based rates that are subject to adjustment in rate cases, under FERC policy, a regulated service provider and a customer may mutually agree to sign a contract for service at a “negotiated rate” that may be above or below the FERC regulated cost-based rate for that service. These “negotiated rate” contracts are not generally subject to adjustment for increased costs that could be produced by inflation or other factors relating to the specific facilities being used to perform the services.
Our operating results for certain components of our business might fluctuate on a seasonal basis.
Revenues from certain components of our business can have seasonal characteristics. In many parts of the country, demand for natural gas and other fuels peaks during the winter. As a result, our overall operating results in the future might fluctuate substantially on a seasonal basis. Demand for natural gas and other fuels could vary significantly from our expectations depending on the nature and location of our facilities and pipeline systems and the terms of our natural gas transportation arrangements relative to demand created by unusual weather patterns.
We do not own all of the land on which our pipelines and facilities are located, which could disrupt our operations.
34
We do not own all of the land on which our pipelines and facilities have been constructed. As such, we are subject to the possibility of increased costs to retain necessary land use. In those instances in which we do not own the land on which our facilities are located, we obtain the rights to construct and operate our pipelines and gathering systems on land owned by third parties and governmental agencies for a specific period of time. In addition, some of our facilities cross Native American lands pursuant to rights-of-way of limited term. We may not have the right of eminent domain over land owned by Native American tribes. Our loss of these rights, through our inability to renew right-of-way contracts or otherwise, could have a material adverse effect on our business, results of operations, financial condition and cash flows.
Difficult conditions in the global financial markets and the economy in general could negatively affect our business and results of operations.
Our businesses may be negatively impacted by adverse economic conditions or future disruptions in global financial markets. Included among these potential negative impacts are industrial or economic contraction leading to reduced energy demand and lower prices for our products and services and increased difficulty in collecting amounts owed to us by our customers. If financing is not available when needed, or is available only on unfavorable terms, we may be unable to implement our business plans or otherwise take advantage of business opportunities or respond to competitive pressures. In addition, financial markets have periodically been affected by concerns over U.S. fiscal and monetary policies. These concerns, as well as actions taken by the U.S. federal government in response to these concerns, could significantly and adversely impact the global and U.S. economies and financial markets, which could negatively impact us in the manners described above.
Restrictions in our debt agreements and the amount of our indebtedness may affect our future financial and operating flexibility.
Our total outstanding long-term debt (including current portion) as of December 31, 2015, was
$23.99 billion.
The agreements governing our indebtedness contain covenants that restrict our and our material subsidiaries’ ability to incur certain liens to support indebtedness and our ability to merge or consolidate or sell all or substantially all of our assets in certain circumstances. In addition, certain of our debt agreements contain various covenants that restrict or limit, among other things, our ability to make certain distributions during the continuation of an event of default, the ability of our subsidiaries to incur additional debt, and our and our material subsidiaries’ ability to enter into certain affiliate transactions and certain restrictive agreements. Certain of our debt agreements also contain, and those we enter into in the future may contain, financial covenants and other limitations with which we will need to comply.
Our debt service obligations and the covenants described above could have important consequences. For example, they could:
|
•
|
Make it more difficult for us to satisfy our obligations with respect to our indebtedness, which could in turn result in an event of default on such indebtedness;
|
|
•
|
Impair our ability to obtain additional financing in the future for working capital, capital expenditures,acquisitions, general corporate purposes or other purposes;
|
|
•
|
Diminish our ability to withstand a continued or future downturn in our business or the economy generally;
|
|
•
|
Require us to dedicate a substantial portion of our cash flow from operations to debt service payments, thereby reducing the availability of cash for working capital, capital expenditures, acquisitions, the payments of dividends, general corporate purposes or other purposes;
|
|
•
|
Limit our flexibility in planning for, or reacting to, changes in our business and the industry in which we operate, including limiting our ability to expand or pursue our business activities and preventing us from engaging in certain transactions that might otherwise be considered beneficial to us.
|
Our ability to comply with our debt covenants, to repay, extend or refinance our existing debt obligations and to obtain future credit will depend primarily on our operating performance. Our ability to refinance existing debt obligations or obtain future credit will also depend upon the current conditions in the credit markets and the availability of credit
35
generally. If we are unable to comply with these covenants, meet our debt service obligations or obtain future credit on favorable terms, or at all, we could be forced to restructure or refinance our indebtedness, seek additional equity capital or sell assets. We may be unable to obtain financing or sell assets on satisfactory terms, or at all.
Our failure to comply with the covenants in the documents governing our indebtedness could result in events of default, which could render such indebtedness due and payable. We may not have sufficient liquidity to repay our indebtedness in such circumstances. In addition, cross-default or cross-acceleration provisions in our debt agreements could cause a default or acceleration to have a wider impact on our liquidity than might otherwise arise from a default or acceleration of a single debt instrument. For more information regarding our debt, please read
Note 14 – Debt, Banking Arrangements, and Leases
.
Institutional knowledge residing with current employees nearing retirement eligibility or with our former employees might not be adequately preserved.
We expect that a significant percentage of employees will become eligible for retirement over the next several years. In certain areas of our business, institutional knowledge resides with employees who have many years of service. As these employees reach retirement age or their services are no longer available to us, we may not be able to replace them with employees of comparable knowledge and experience. In addition, we may not be able to retain or recruit other qualified individuals, and our efforts at knowledge transfer could be inadequate. If knowledge transfer, recruiting and retention efforts are inadequate, access to significant amounts of internal historical knowledge and expertise could become unavailable to us.
Our hedging activities might not be effective and could increase the volatility of our results.
In an effort to manage our financial exposure related to commodity price and market fluctuations, we have entered, and may in the future enter into contracts to hedge certain risks associated with our assets and operations. In these hedging activities, we have used and may in the future use fixed-price, forward, physical purchase and sales contracts, futures, financial swaps and option contracts traded in the over-the-counter markets or on exchanges. Nevertheless, no single hedging arrangement can adequately address all risks present in a given contract. For example, a forward contract that would be effective in hedging commodity price volatility risks would not hedge the contract’s counterparty credit or performance risk. Therefore, unhedged risks will always continue to exist. While we attempt to manage counterparty credit risk within guidelines established by our credit policy, we may not be able to successfully manage all credit risk and as such, future cash flows and results of operations could be impacted by counterparty default.
One of our subsidiaries acts as the general partner of a publicly traded limited partnership, Williams Partners L.P. As such, this subsidiary’s operations may involve a greater risk of liability than ordinary business operations.
One of our subsidiaries acts as the general partner of WPZ, a publicly traded limited partnership. This subsidiary may be deemed to have undertaken contractual obligations with respect to WPZ as the general partner and to the limited partners of WPZ. Activities determined to involve such obligations to other persons or entities typically involve a higher standard of conduct than ordinary business operations and therefore may involve a greater risk of liability, particularly when a conflict of interest is found to exist. Our control of the general partner of WPZ may increase the possibility of claims of breach of such duties, including claims brought due to conflicts of interest (including conflicts of interest that may arise between WPZ, on the one hand, and its general partner and that general partner’s affiliates, including us, on the other hand). Any liability resulting from such claims could be material.
Our investments and projects located outside of the United States expose us to risks related to the laws of other countries, and the taxes, economic conditions, fluctuations in currency rates, political conditions and policies of foreign governments. These risks might delay or reduce our realization of value from our international projects.
We currently own and might acquire and/or dispose of material energy-related investments and projects outside the United States. The economic, political and legal conditions and regulatory environment in the countries in which we have interests or in which we might pursue acquisition or investment opportunities present risks that are different from or greater than those in the United States. These risks include, among others, delays in construction and interruption of business, as well as risks of renegotiation, trade sanctions or nullification of existing contracts and changes in law or tax policy, including with respect to the prices we realize for the commodities we produce and sell. The uncertainty of the legal environment in certain foreign countries in which we develop or acquire projects or make investments
36
could make it more difficult to obtain nonrecourse project financing or other financing on suitable terms, could adversely affect the ability of certain customers to honor their obligations with respect to such projects or investments and could impair our ability to enforce our rights under agreements relating to such projects or investments.
Operations and investments in foreign countries also can present currency exchange rate and convertibility, inflation and repatriation risk. In certain situations under which we develop or acquire projects or make investments, economic and monetary conditions and other factors could affect our ability to convert to U.S. dollars our earnings denominated in foreign currencies. In addition, risk from fluctuations in currency exchange rates can arise when our foreign subsidiaries expend or borrow funds in one type of currency, but receive revenue in another. In such cases, an adverse change in exchange rates can reduce our ability to meet expenses, including debt service obligations. We may or may not put contracts in place designed to mitigate our foreign currency exchange risks. We have some exposures that are not hedged and which could result in losses or volatility in our results of operations.
Failure of our service providers or disruptions to our outsourcing relationships might negatively impact our ability to conduct our business.
Certain of our accounting and information technology services are currently provided by third-party vendors, and sometimes from service centers outside of the United States. Services provided pursuant to these agreements could be disrupted. Similarly, the expiration of such agreements or the transition of services between providers could lead to loss of institutional knowledge or service disruptions. Our reliance on others as service providers could have a material adverse effect on our business, results of operations and financial condition.
The execution of the integration strategy following WPZ’s merger with Access Midstream Partners, L.P. (“ACMP”) in February 2015 (the “ACMP Merger”) may not be successful.
The ultimate success of the ACMP Merger will depend, in part, on the ability of the combined company to realize the anticipated benefits from combining these formerly separate businesses. Realizing the benefits of the ACMP Merger will depend in part on the effective integration of assets, operations, functions and personnel while maintaining adequate focus on our core businesses. Any expected cost savings, economies of scale, enhanced liquidity or other operational efficiencies, as well as revenue enhancement opportunities, or other synergies, may not occur.
If management is unable to minimize the potential disruption of our ongoing business and the distraction of management during the integration process, the anticipated benefits of the ACMP Merger may not be realized or may only be realized to a lesser extent than expected. In addition, the inability to successfully manage the integration could have an adverse effect on us.
The integration process could result in the loss of key employees, as well as the disruption of each of our ongoing businesses or the creation of inconsistencies in standards, controls, procedures and policies. Any or all of those occurrences could adversely affect our businesses’ ability to maintain relationships with service providers, customers and employees or to achieve the anticipated benefits of the ACMP Merger. Integration may also result in additional and unforeseen expenses, which could reduce the anticipated benefits of the ACMP Merger and materially and adversely affect our business, operating results and financial condition.
Our costs and funding obligations for our defined benefit pension plans and costs for our other postretirement benefit plans are affected by factors beyond our control.
We have defined benefit pension plans covering substantially all of our U.S. employees and other post-retirement benefit plans covering certain eligible participants. The timing and amount of our funding requirements under the defined benefit pension plans depend upon a number of factors that we control, including changes to pension plan benefits, as well as factors outside of our control, such as asset returns, interest rates and changes in pension laws. Changes to these and other factors that can significantly increase our funding requirements could have a significant adverse effect on our financial condition and results of operations.
If there is a determination that the spin-off of WPX Energy, Inc. (WPX) stock to our stockholders is taxable for U.S. federal income tax purposes because the facts, representations or undertakings underlying an IRS private letter ruling or a tax opinion are incorrect or for any other reason, then we and our stockholders could incur significant income tax liabilities.
37
In connection with our original separation plan that called for an initial public offering (IPO) of stock of WPX and a subsequent spin-off of our remaining shares of WPX to our stockholders, we obtained a private letter ruling from the IRS and an opinion of our outside tax advisor, to the effect that the distribution by us of WPX shares to our stockholders, and any related restructuring transaction undertaken by us, would not result in recognition for U.S. federal income tax purposes, of income, gain or loss to us or our stockholders under section 355 and section 368(a)(1)(D) of the Code, except for cash payments made to our stockholders in lieu of fractional shares of WPX common stock. In addition, we received an opinion from our outside tax advisor to the effect that the spin-off pursuant to our revised separation plan which was ultimately consummated on December 31, 2011, which did not involve an IPO of WPX shares, would not result in the recognition, for federal income tax purposes, of income, gain or loss to us or our stockholders under section 355 and section 368(a)(1)(D) of the Code, except for cash payments made to our stockholders in lieu of fractional shares of WPX. The private letter ruling and opinion have relied on or will rely on certain facts, representations, and undertakings from us and WPX regarding the past and future conduct of the companies’ respective businesses and other matters. If any of these facts, representations, or undertakings are, or become, incorrect or are not otherwise satisfied, including as a result of certain significant changes in the stock ownership of us or WPX after the spin-off, or if the IRS disagrees with any such facts and representations upon audit, we and our stockholders may not be able to rely on the private letter ruling or the opinion of our tax advisor and could be subject to significant income tax liabilities.
The spin-off may expose us to potential liabilities arising out of state and federal fraudulent conveyance laws and legal dividend requirements that we did not assume in our agreements with WPX.
The spin-off is subject to review under various state and federal fraudulent conveyance laws. A court could deem the spin-off or certain internal restructuring transactions undertaken by us in connection with the separation to be a fraudulent conveyance or transfer. Fraudulent conveyances or transfers are defined to include transfers made or obligations incurred with the actual intent to hinder, delay or defraud current or future creditors or transfers made or obligations incurred for less than reasonably equivalent value when the debtor was insolvent, or that rendered the debtor insolvent, inadequately capitalized or unable to pay its debts as they become due. A court could void the transactions or impose substantial liabilities upon us, which could adversely affect our financial condition and our results of operations. Whether a transaction is a fraudulent conveyance or transfer will vary depending upon the jurisdiction whose law is being applied. Under the separation and distribution agreement between us and WPX, from and after the spin-off, each of WPX and we are responsible for the debts, liabilities and other obligations related to the business or businesses which each owns and operates. Although we do not expect to be liable for any such obligations not expressly assumed by us pursuant to the separation and distribution agreement, it is possible that a court would disregard the allocation agreed to between the parties, and require that we assume responsibility for obligations allocated to WPX, particularly if WPX were to refuse or were unable to pay or perform the subject allocated obligations
.
Increases in interest rates could adversely impact our share price, our ability to issue equity or incur debt for acquisitions or other purposes, and our ability to make cash dividends at our intended levels.
Interest rates may increase further in the future. As a result, interest rates on future credit facilities and debt offerings could be higher than current levels, causing our financing costs to increase accordingly. As with other yield-oriented securities, our share price will be impacted by the level of our cash distributions and implied distribution yield. The distribution yield is often used by investors to compare and rank yield-oriented securities for investment decision-making purposes. Therefore, changes in interest rates, either positive or negative, may affect the yield requirements of investors who invest in our shares, and a rising interest rate environment could have an adverse impact on our share price and our ability to issue equity or incur debt for acquisitions or other purposes and to pay cash dividends at our intended levels.
Item 1B.
Unresolved Staff Comments
Not applicable.
Item 2.
Properties
Please read “Business” for a description of the location and general character of our principal physical properties. We generally own our facilities, although a substantial portion of our pipeline and gathering facilities is constructed
38
and maintained pursuant to rights-of-way, easements, permits, licenses or consents on and across properties owned by others.
Item 3.
Legal Proceedings
Environmental
Certain reportable legal proceedings involving governmental authorities under federal, state and local laws regulating the discharge of materials into the environment are described below. While it is not possible for us to predict the final outcome of the proceedings which are still pending, we do not anticipate a material effect on our consolidated financial position if we receive an unfavorable outcome in any one or more of such proceedings.
In November 2013, we became aware of deficiencies with the air permit for the Fort Beeler gas processing facility located in West Virginia. We notified the EPA and the West Virginia Department of Environmental Protection and are working to bring the Fort Beeler facility into full compliance. At December 31, 2015, we have accrued liabilities of $140,000 for potential penalties arising out of the deficiencies.
On January 21, 2016, we received a Compliance Order from the Pennsylvania Department of Environmental Protection requiring the correction of several alleged deficiencies arising out of the construction of the Springville Gathering Line, the Pennsylvania Mainline Gathering Line, and the 2008 Core Zone Gathering Line. The Order also identifies civil penalties in the amount of approximately $712,000. We are currently evaluating the Order and our response.
Other
The additional information called for by this item is provided in
Note 18 – Contingent Liabilities and Commitments
of the Notes to Consolidated Financial Statements included under Part II, Item 8. Financial Statements of this report, which information is incorporated by reference into this item.
Item 4.
Mine Safety Disclosures
Not applicable.
39
Executive Officers of the Registrant
The name, age, period of service, and title of each of our executive officers as of
February 26, 2016
, are listed below. As previously discussed, Williams Partners L.P. merged with ACMP in February 2015 (the ACMP Merger). ACMP was the surviving entity in the ACMP Merger and changed its name to Williams Partners L.P. References in the biographical information below to (a) “Pre-merger WPZ” will mean Williams Partners L.P. prior to the ACMP Merger and (b) “ACMP/WPZ” will refer to both ACMP prior to and after the ACMP Merger, when it changed its name to Williams Partners L.P.
|
Alan S. Armstrong
|
Director, Chief Executive Officer, and President
|
|
Age: 53
|
|
|
Position held since 2011.
|
|
|
From 2002 to 2011, Mr. Armstrong served as Senior Vice President - Midstream and acted as President of our midstream business. From 1999 to 2002, Mr. Armstrong was Vice President, Gathering and Processing in our midstream business and from 1998 to 1999 was Vice President, Commercial Development. Mr. Armstrong has served as a director of the general partner of ACMP/WPZ since 2012, as Chief Executive Officer since December 31, 2014, and as Chairman of the Board since February 2, 2015. Mr. Armstrong has served as a director of BOK Financial Corporation, a financial services company, since 2013. Mr. Armstrong also served as Chairman of the Board and Chief Executive Officer of the general partner of Pre-merger WPZ from 2011 until the ACMP Merger, as Senior Vice President - Midstream from 2010 to 2011, and director and Chief Operating Officer from 2005 to 2010.
|
|
|
Walter J. Bennett
|
Senior Vice President — West
|
|
Age: 46
|
|
|
Position held since January 2015.
|
|
|
Mr. Bennett was formerly Chief Operating Officer of Chesapeake Midstream Development and served as Senior Vice President-Operations at Boardwalk Pipeline Partners. Previously, Mr. Bennett served in a variety of senior positions at Gulf South Pipeline Company that included operations and commercial responsibilities. Mr. Bennett began his career at a subsidiary of Koch Industries. Mr. Bennett has served as Senior Vice President - West of the general partner of ACMP/WPZ since December 2013 and served as Senior Vice President - West of the general partner of Pre-merger WPZ from January 2015 until the ACMP Merger.
|
|
40
|
Francis (Frank) E. Billings
|
Senior Vice President — Corporate Strategic Development
|
|
Age: 53
|
|
|
Position held since January 2014.
|
|
|
Mr. Billings served as Senior Vice President - Northeast G&P of us and Pre-merger WPZ from January 2013 to January 2014. Mr. Billings served as Vice President of our midstream gathering and processing business from 2011 until 2013 and as Vice President, Business Development from 2010 to 2011. Mr. Billings served as President of Cumberland Plateau Pipeline Company, a privately held company developing an ethane pipeline to serve the Marcellus Shale area, from 2009 until 2010. From 2008 to 2009, Mr. Billings served as Senior Vice President of Commercial for Crosstex Energy, Inc. and Crosstex Energy L.P., an independent midstream energy services master limited partnership and its parent corporation. In 1988, Mr. Billings joined MAPCO Inc., which merged with one of our subsidiaries in 1998, serving in various management roles, including in 2008 as a Vice President in the midstream business. Mr. Billings served as Senior Vice President - Corporate Strategic Development of the general partner of Pre-merger WPZ from January 2014 until the ACMP Merger. He has served as a director of the general partner of ACMP/WPZ since February 2014 and as Senior Vice President - Corporate Strategic Development since the ACMP Merger.
|
|
|
Donald R. Chappel
|
Senior Vice President and Chief Financial Officer
|
|
Age: 64
|
|
|
Position held since 2003.
|
|
|
Prior to joining us, Mr. Chappel held various financial, administrative and operational leadership positions. Mr. Chappel has served as a director of the general partner of ACMP/WPZ since 2012 and as Chief Financial Officer of the general partner of ACMP/WPZ since December 31, 2014. Mr. Chappel has also served as a member of the Management Committee of Northwest Pipeline since 2007. Mr. Chappel served as Chief Financial Officer and a director of the general partner of Pre-merger WPZ from 2005 until the ACMP Merger. Mr. Chappel was Chief Financial Officer from 2007 and a director from 2008 of the general partner of Williams Pipeline Partners L.P. (WMZ), until its merger with Pre-merger WPZ in 2010. Mr. Chappel is a director of SUPERVALU, Inc. (a grocery and pharmacy company).
|
|
|
John R. Dearborn
|
Senior Vice President — NGL & Petchem Services
|
|
Age: 58
|
|
|
Position held since 2013.
|
|
|
Mr. Dearborn served as a senior leader for Saudi Basic Industries Corporation, a petrochemical company, from 2011 to 2013. From 2001 to 2011, Mr. Dearborn served in a variety of leadership positions with the Dow Chemical Company. Mr. Dearborn also worked for Union Carbide Corporation, prior to its merger with DOW, from 1981 to 2001 where he served in several leadership roles. Mr. Dearborn also served as Senior Vice President - NGL & Petchem Services of the general partner of Pre-merger WPZ from 2013 until the ACMP Merger and has served in that role for the general partner of ACMP/WPZ since the ACMP Merger.
|
|
41
|
Robyn L. Ewing
|
Senior Vice President and Chief Administrative Officer
|
|
Age: 60
|
|
|
Position held since 2008.
|
|
|
From 2004 to 2008, Ms. Ewing was Vice President of Human Resources. Prior to joining Williams, Ms. Ewing worked at MAPCO, which merged with Williams in 1998. Ms. Ewing began her career with Cities Service Company in 1976.
|
|
|
Rory L. Miller
|
Senior Vice President — Atlantic - Gulf
|
|
Age: 55
|
|
|
Position held since 2013.
|
|
|
From 2011 until 2013, Mr. Miller was Senior Vice President - Midstream of Williams and the general partner of Pre-merger WPZ, acting as President of Williams’ midstream business. Mr. Miller was a Vice President of Williams’ midstream business from 2004 until 2011. Mr. Miller served as a director and Senior Vice-President - Atlantic-Gulf of the general partner of Pre-merger WPZ from 2011 until the ACMP Merger and has served in those roles for the general partner of ACMP/WPZ since the ACMP Merger. Mr. Miller has also served as a member of the Management Committee of Transco, since 2013.
|
|
|
Sarah C. Miller
|
Senior Vice President, General Counsel, and Secretary
|
|
Age: 44
|
|
|
Position held since 2015.
|
|
|
Ms. Miller joined Williams in 2000, where she has served in a variety of legal leadership positions, including Vice President, Corporate Secretary and Assistant General Counsel for the company’s corporate secretary team, Senior Counsel for the company’s midstream business, and as Senior Attorney for the legal department’s business development team. She was named Senior Vice President and General Counsel on June 20, 2015. Prior to joining Williams, Ms. Miller was a litigation associate at Crowe & Dunlevy.
|
|
|
Fred E. Pace
|
Senior Vice President — E&C (Engineering and Construction)
|
|
Age: 54
|
|
|
Position held since 2013.
|
|
|
From 2011 until 2013, Mr. Pace served Williams in project engineering and development roles, including service as Vice President Engineering and Construction for our midstream business. From 2009 to 2011, Mr. Pace was the managing member of PACE Consulting, LLC, an engineering and consulting firm serving the energy industry. In 2003, Mr. Pace co-founded Clear Creek Natural Gas, LLC, later known as Clear Creek Energy Services, LLC, a provider of engineering, construction, and operational services to the energy industry where he served as Chief Executive Officer until 2009. Mr. Pace has over 30 years of experience in the engineering, construction, operation, and project management areas of the energy industry, including prior service with Williams from 1985 to 1990. Mr. Pace also served as Senior Vice President - E&C of the general partner of Pre-merger WPZ from 2013 until the ACMP Merger and has served in that role for the general partner of Pre-merger WPZ since the ACMP Merger.
|
|
42
|
Brian L. Perilloux
|
Senior Vice President — Operational Excellence
|
|
Age: 54
|
|
|
Position held since 2013.
|
|
|
Mr. Perilloux served as a Vice President of our midstream business from 2011 until 2013. From 2007 to 2011, Mr. Perilloux served in various roles in our midstream business, including engineering and construction roles. Prior to joining Williams, Mr. Perilloux was an officer of a private international engineering and construction company. Mr. Perilloux served as Senior Vice President - Operational Excellence of the general partner of Pre-merger WPZ from 2013 until the ACMP Merger and has served in that role for the general partner of ACMP/WPZ since the ACMP Merger.
|
|
|
Robert S. Purgason
|
Senior Vice President — Central
|
|
Age: 59
|
|
|
Position held since January 2015.
|
|
|
Mr. Purgason has served as a director of the general partner of ACMP/WPZ since 2012 and as Senior Vice President-Access of the general partner of ACMP/WPZ since the ACMP Merger. Mr. Purgason served as Chief Operating Officer of the general partner of ACMP/WPZ from 2010 until the ACMP Merger. Prior to joining the general partner of ACMP/WPZ, Mr. Purgason spent five years at Crosstex Energy Services, L.P. and was promoted to Senior Vice President - Chief Operating Officer in 2006. Prior to Crosstex, Mr. Purgason spent 19 years with us in various senior business development and operational roles. Mr. Purgason began his career at Perry Gas Companies in Odessa, Texas working in all facets of the natural gas treating business. Mr. Purgason has also served on the Board of Directors of L.B. Foster Company (a manufacturer, fabricator, and distributor of products and services for the rail, construction, energy, and utility markets) since December 2014.
|
|
|
James E. Scheel
|
Senior Vice President — Northeast G&P
|
|
Age: 51
|
|
|
Position held since January 2014.
|
|
|
From 2012 to 2014, Mr. Scheel served as Senior Vice President - Corporate Strategic Development of us and the general partner of Pre-merger WPZ. From 2011 until 2012, Mr. Scheel served as Vice President of Business Development for our midstream business. Mr. Scheel joined Williams in 1988 and has served in leadership roles in business strategic development, engineering and operations, our NGL business, and international operations. Mr. Scheel has served as a director and Senior Vice President - Northeast G&P of the general partner of ACMP/WPZ since the ACMP Merger, having previously served as a director of the general partner of ACMP/WPZ from 2012 to February 2014. Mr. Scheel served as a director of the general partner of Pre-merger WPZ from 2012 until the ACMP Merger.
|
|
43
|
John D. Seldenrust
|
Senior Vice President — E&C (Engineering & Construction)
|
|
Age: 51
|
|
|
Position held since July 2015.
|
|
|
Mr. Seldenrust served as Senior Vice President - Eastern Operations for us from January 2015 to July 2015, and for ACMP/WPZ from 2013 to July 2015. Mr. Seldenrust also previously served in a variety of operations and engineering leadership roles at ACMP and Chesapeake Energy from 2004 to August 2013. Prior to joining Chesapeake, Mr. Seldenrust held reservoir, production and facilities engineering positions with ARCO Oil & Gas, Vastar Resources and BP America.
|
|
|
Ted T. Timmermans
|
Vice President, Controller, and Chief Accounting Officer
|
|
Age: 59
|
|
|
Position held since 2005.
|
|
|
Mr. Timmermans served as Assistant Controller of Williams from 1998 to 2005. Mr. Timmermans served as Vice President, Controller & Chief Accounting Officer of the general partner of Pre-merger WPZ until the ACMP Merger and has served in those roles for the general partner of ACMP/WPZ since the ACMP Merger. Mr. Timmermans served as Chief Accounting Officer of the general partner of WMZ from 2008 until its merger with Pre-merger WPZ in 2010.
|
|
44
Item 5.
Market for Registrant’s Common Equity, Related Stockholder Matters and Issuer Purchases of Equity Securities
Our common stock is listed on the New York Stock Exchange under the symbol “WMB.” At the close of business on February 16, 2016, we had approximately 7,754
holders of record of our common stock. The high and low sales price ranges (New York Stock Exchange composite transactions) and dividends declared by quarter for each of the past two years are as follows:
|
High
|
Low
|
Dividend
|
|||||||||
|
2015
|
|||||||||||
|
First Quarter
|
$
|
51.15
|
|
$
|
40.07
|
|
$
|
0.58
|
|
||
|
Second Quarter
|
61.38
|
|
46.28
|
|
0.59
|
|
|||||
|
Third Quarter
|
58.77
|
|
34.64
|
|
0.64
|
|
|||||
|
Fourth Quarter
|
44.51
|
|
20.95
|
|
0.64
|
|
|||||
|
2014
|
|||||||||||
|
First Quarter
|
$
|
42.94
|
|
$
|
37.77
|
|
$
|
0.4025
|
|
||
|
Second Quarter
|
59.68
|
|
39.31
|
|
0.425
|
|
|||||
|
Third Quarter
|
59.77
|
|
54.28
|
|
0.56
|
|
|||||
|
Fourth Quarter
|
57.00
|
|
41.21
|
|
0.57
|
|
|||||
Some of our subsidiaries’ borrowing arrangements may limit the transfer of funds to us. These terms have not impeded, nor are they expected to impede, our ability to pay dividends.
Performance Graph
Set forth below is a line graph comparing our cumulative total stockholder return on our common stock (assuming reinvestment of dividends) with the cumulative total return of the S&P 500 Stock Index and the Bloomberg U.S. Pipeline Index for the period of five fiscal years commencing January 1, 2011. The Bloomberg U.S. Pipeline Index is composed of Columbia Pipeline Group, Inc., Enbridge, Inc., Inter Pipeline Ltd., Kinder Morgan, Inc., ONEOK, Inc., Pembina Pipeline Corp, Plains GP Holdings LP, Spectra Energy Corp, TransCanada Corp., and Williams. The graph below assumes an investment of $100 at the beginning of the period.
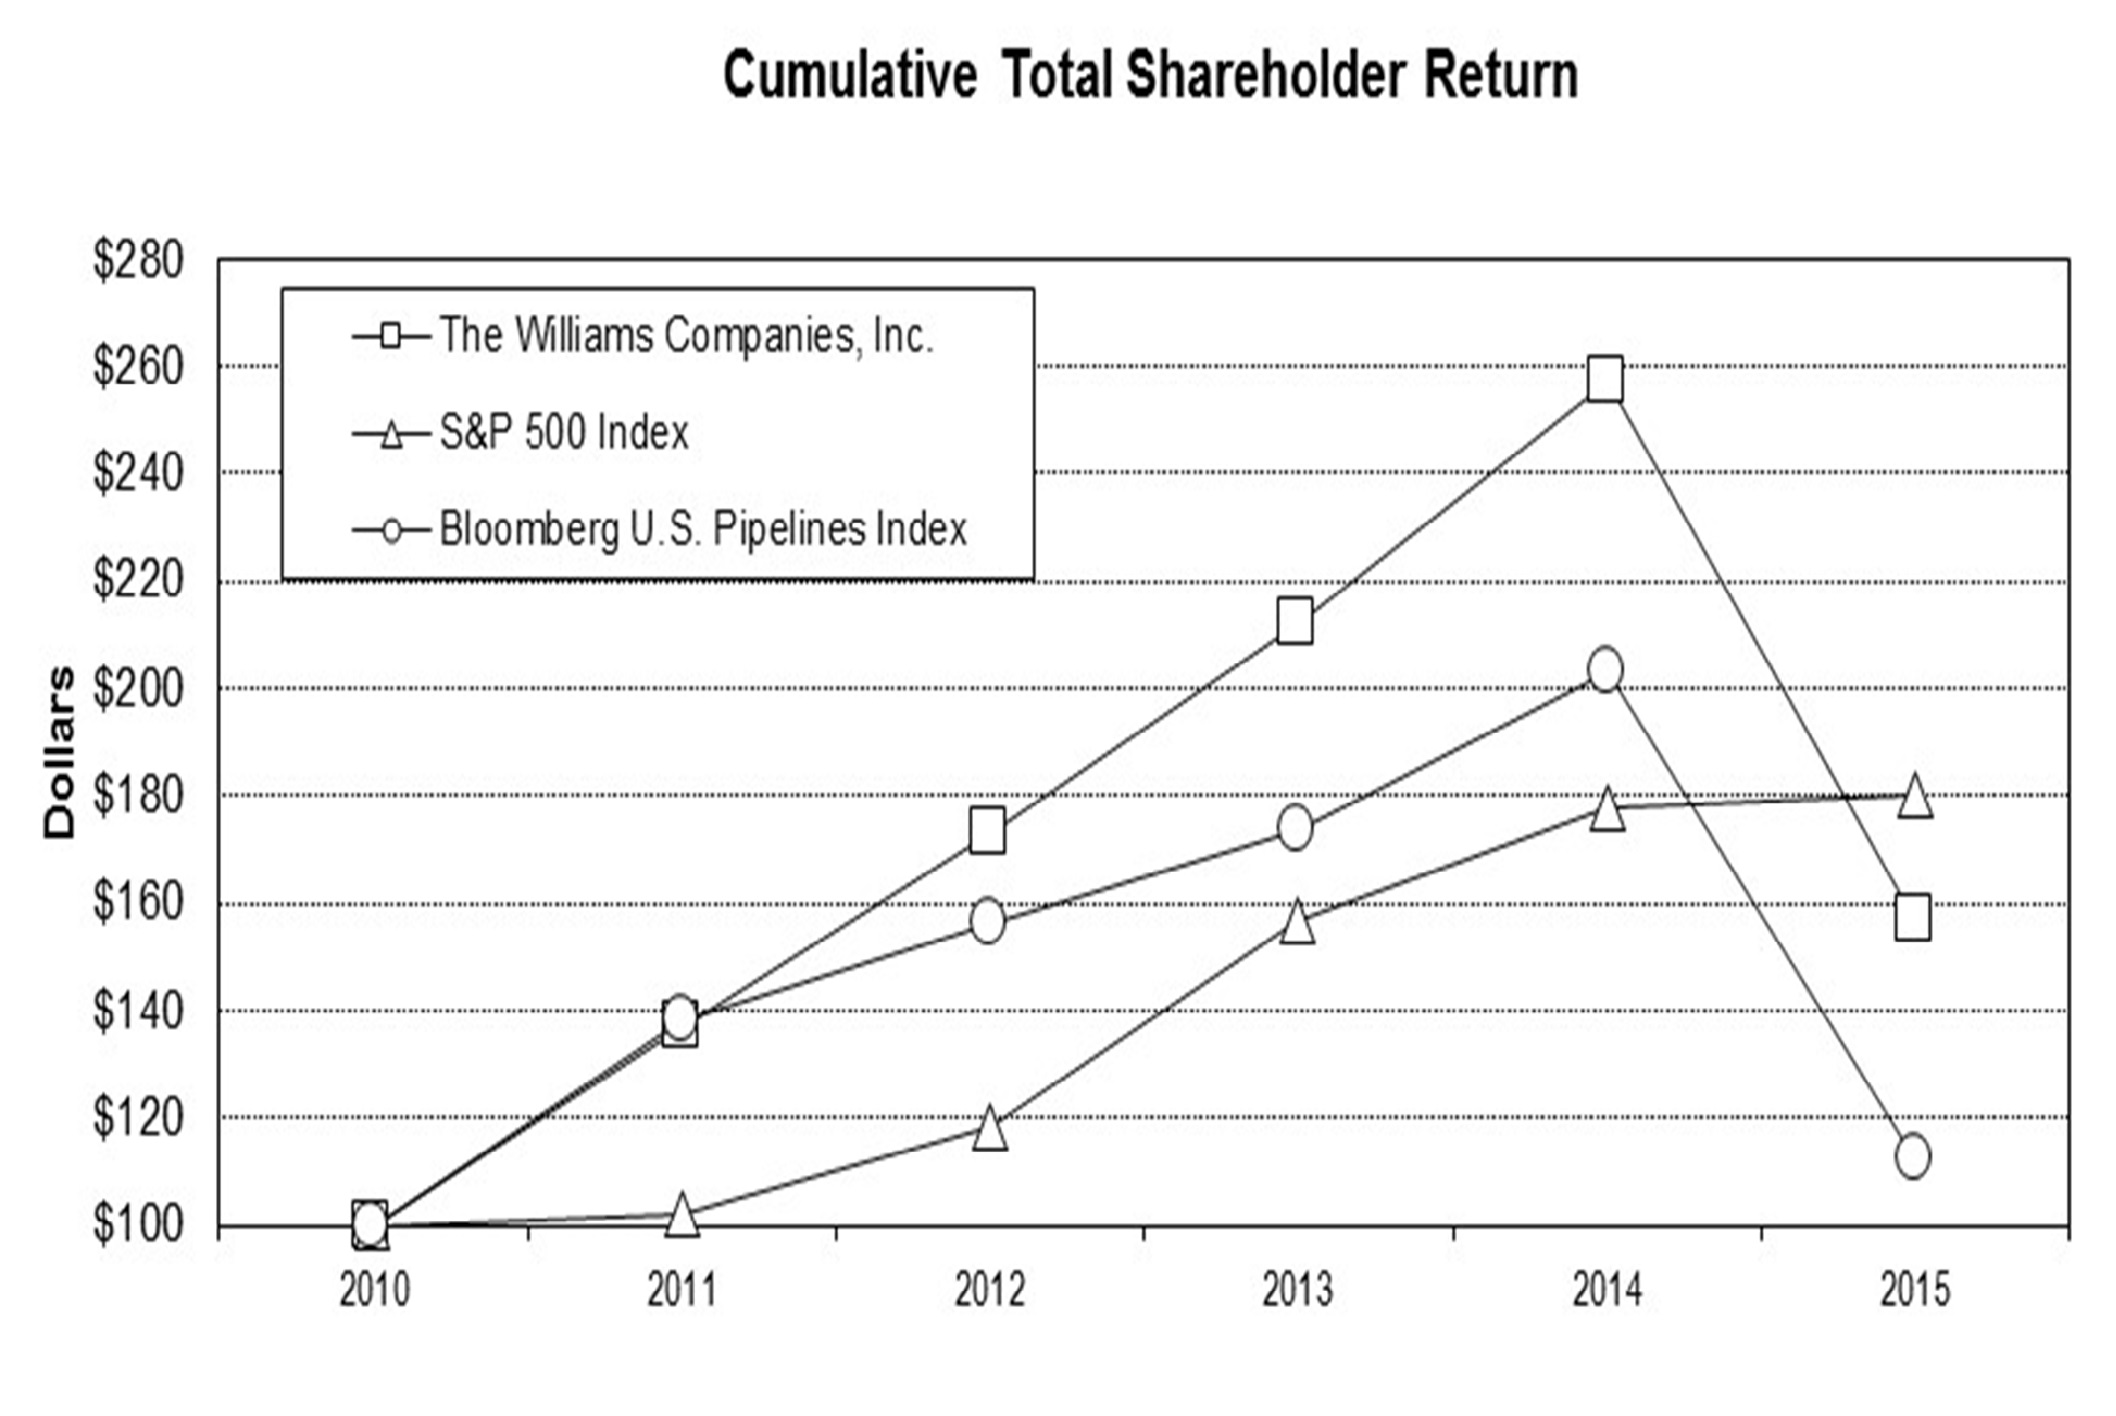
|
2010
|
2011
|
2012
|
2013
|
2014
|
2015
|
||||||
|
The Williams Companies, Inc.
|
100.0
|
137.1
|
172.9
|
211.9
|
256.9
|
156.6
|
|||||
|
S&P 500 Index
|
100.0
|
102.1
|
118.4
|
156.6
|
178.0
|
180.5
|
|||||
|
Bloomberg U.S. Pipelines Index
|
100.0
|
137.9
|
156.4
|
173.6
|
203.1
|
112.3
|
|||||
45
Item 6.
Selected Financial Data
The following financial data at
December 31, 2015
and
2014
, and for each of the three years in the period ended
December 31, 2015
, should be read in conjunction with the other financial information included in Part II, Item 7,
Management’s Discussion and Analysis of Financial Condition and Results of Operations
and Part II, Item 8,
Financial
Statements and Supplementary Data
of this Form 10-K. All other financial data has been prepared from our accounting records.
|
2015
|
2014
|
2013
|
2012
|
2011
|
|||||||||||||||
|
|
(Millions, except per-share amounts)
|
||||||||||||||||||
|
Revenues (1)
|
$
|
7,360
|
|
$
|
7,637
|
|
$
|
6,860
|
|
$
|
7,486
|
|
$
|
7,930
|
|
||||
|
Income (loss) from continuing operations (2)
|
(1,314
|
)
|
2,335
|
|
679
|
|
929
|
|
1,078
|
|
|||||||||
|
Amounts attributable to The Williams Companies, Inc.:
|
|||||||||||||||||||
|
Income (loss) from continuing operations (2)
|
(571
|
)
|
2,110
|
|
441
|
|
723
|
|
803
|
|
|||||||||
|
Diluted earnings (loss) per common share:
|
|||||||||||||||||||
|
Income (loss) from continuing operations (2)
|
(.76
|
)
|
2.91
|
|
.64
|
|
1.15
|
|
1.34
|
|
|||||||||
|
Total assets at December 31 (3) (4) (6)
|
49,020
|
|
50,455
|
|
27,065
|
|
24,248
|
|
16,432
|
|
|||||||||
|
Commercial paper and long-term debt due within one year at December 31 (5)
|
675
|
|
802
|
|
226
|
|
1
|
|
352
|
|
|||||||||
|
Long-term debt at December 31 (3) (4) (6)
|
23,812
|
|
20,780
|
|
11,276
|
|
10,656
|
|
8,300
|
|
|||||||||
|
Stockholders’ equity at December 31 (3) (4)
|
6,148
|
|
8,777
|
|
4,864
|
|
4,752
|
|
1,296
|
|
|||||||||
|
Cash dividends declared per common share
|
2.450
|
|
1.958
|
|
1.438
|
|
1.196
|
|
.78
|
|
|||||||||
|
(1)
|
Revenues for 2014 increased reflecting the consolidation of ACMP beginning in third quarter and new Canadian construction management services.
|
|
(2)
|
Income (loss) from continuing operations:
|
|
•
|
For 2015 includes a $1.4 billion impairment of certain equity-method investments and a $1.1 billion impairment of goodwill;
|
|
•
|
For 2014 includes $2.5 billion pretax gain recognized as a result of remeasuring to fair value the equity-method investment we held before we acquired a controlling interest in ACMP, $246 million of insurance recoveries related to the 2013 Geismar Incident, and $154 million of cash received related to a contingency settlement. 2014 also includes $78 million of pretax equity losses from Bluegrass Pipeline and Moss Lake related primarily to the underlying write-off of previously capitalized project development costs and $76 million of pretax acquisition, merger, and transition expenses related to our acquisition of ACMP;
|
|
•
|
For 2013 includes $99 million of deferred income tax expense incurred on undistributed earnings of our foreign operations that are no longer considered permanently reinvested;
|
|
•
|
For 2011 includes $271 million of pretax early debt retirement costs.
|
|
(3)
|
The increases in 2014 reflect assets acquired and debt assumed primarily related to our acquisition of ACMP (see
Note 2 – Acquisitions
)
in third quarter as well as $1.9 billion of related debt issuances and $2.8 billion of debt issuances at WPZ. Additionally, we issued $3.4 billion of equity (see
Note 14 – Debt, Banking Arrangements, and Leases
and
Note 15 – Stockholders' Equity
).
|
|
(4)
|
The increases in 2012 reflect assets and investments acquired, primarily related to the Caiman and Laser Acquisitions and our investment in ACMP, as well as debt and equity issuances.
|
|
(5)
|
The increases in 2015, 2014, and 2013 reflects borrowings under WPZ’s commercial paper program, which was initiated in 2013.
|
|
(6)
|
Amounts for 2014 and preceding periods presented have been adjusted to reflect the early adoption of ASU 2015-03 and ASU 2015-15, which address the presentation of debt issuance costs (see
Note 14 – Debt, Banking Arrangements, and Leases
).
|
46
Item 7.
Management’s Discussion and Analysis of Financial Condition and Results of Operations
General
We are an energy infrastructure company focused on connecting North America’s significant hydrocarbon resource plays to growing markets for natural gas, NGLs, and olefins. Our operations are located principally in the United States, but span from the deepwater Gulf of Mexico to the Canadian oil sands, and are organized into the Williams Partners and Williams NGL & Petchem Services reportable segments. All remaining business activities are included in Other.
Williams Partners
Williams Partners consists of our consolidated master limited partnership, WPZ, which includes gas pipeline and midstream businesses. The gas pipeline businesses include interstate natural gas pipelines and pipeline joint project investments; and the midstream businesses provide natural gas gathering, treating, and processing services; NGL production, fractionation, storage, marketing and transportation; deepwater production handling and crude oil transportation services; an olefin production business and is comprised of several wholly owned and partially owned subsidiaries and joint project investments. As of December 31, 2015, we own approximately 60 percent of the interests in WPZ, including the interests of the general partner which are wholly owned by us, and IDRs.
Williams Partners' gas pipeline businesses consist primarily of Transco and Northwest Pipeline. Our gas pipeline businesses also hold interests in joint venture interstate and intrastate natural gas pipeline systems including a 50 percent equity-method investment in Gulfstream and a 41 percent interest in Constitution (a consolidated entity), which is under development. As of December 31, 2015, Transco and Northwest Pipeline own and operate a combined total of approximately 13,600 miles of pipelines with a total annual throughput of approximately 4,136 TBtu of natural gas and peak-day delivery capacity of approximately 15 MMdth of natural gas.
Williams Partners' midstream businesses primarily consist of (1) natural gas gathering, treating, and processing; (2) NGL fractionation, storage and transportation; (3) crude oil transportation; and (4) olefins production. The primary service areas are concentrated in major producing basins in Colorado, Texas, Oklahoma, Kansas, New Mexico, Wyoming, the Gulf of Mexico, Louisiana, Pennsylvania, West Virginia, New York, and Ohio which include the Marcellus and Utica shale plays as well as the Eagle Ford, Haynesville, Barnett, Mid-Continent, and Niobrara areas.
The midstream businesses include equity-method investments in natural gas gathering and processing assets and NGL fractionation and transportation assets, including a 62 percent equity-method investment in UEOM, a 50 percent equity-method investment in the Delaware basin gas gathering system in the Mid-Continent region, a 69 percent equity-method investment in Laurel Mountain Midstream, LLC, a 58 percent equity-method investment in Caiman Energy II, LLC, a 60 percent equity-method investment in Discovery Producer Services LLC, a 50 percent equity-method investment in Overland Pass Pipeline, LLC, and Appalachia Midstream Services, LLC, which owns an approximate average 45 percent equity-method investment in multiple gas gathering systems in the Marcellus Shale (Appalachia Midstream Investments).
The midstream businesses also include our Canadian midstream operations which are comprised of an oil sands offgas processing plant near Fort McMurray, Alberta and NGL/olefin fractionation facility at Redwater, Alberta, and the Boreal Pipeline.
Williams Partners’ ongoing strategy is to safely and reliably operate large-scale, interstate natural gas transmission and midstream infrastructures where our assets can be fully utilized and drive low per-unit costs. We focus on consistently attracting new business by providing highly reliable service to our customers and investing in growing markets, including the deepwater Gulf of Mexico, the Marcellus Shale, the Gulf Coast Region, the Canadian oil sands, and areas of increasing natural gas demand.
Williams Partners’ interstate transmission and related storage activities are subject to regulation by the FERC and as such, our rates and charges for the transportation of natural gas in interstate commerce, and the extension, expansion
47
or abandonment of jurisdictional facilities and accounting, among other things, are subject to regulation. The rates are established through the FERC’s ratemaking process. Changes in commodity prices and volumes transported have little near-term impact on revenues because the majority of cost of service is recovered through firm capacity reservation charges in transportation rates.
Williams NGL & Petchem Services
Williams NGL & Petchem Services is comprised of our Texas Belle pipeline and certain other domestic olefins pipeline assets and certain Canadian growth projects under development, including a propane dehydrogenation facility and a liquids extraction plant. The Williams NGL & Petchem Services segment is currently comprised primarily of projects under development and thus have had limited operating revenues to date.
Unless indicated otherwise, the following discussion and analysis of results of operations and financial condition and liquidity relates to our current continuing operations and should be read in conjunction with the consolidated financial statements and notes thereto included in Part II, Item 8 of this report.
Dividends
In December 2015, we paid a regular quarterly dividend of $0.64 per share, which was 12 percent higher than the same period last year.
Overview
Income (loss) from continuing operations attributable to The Williams Companies, Inc.
, for the year ended
December 31, 2015
, decreased
$2.68 billion
compared to the year ended
December 31, 2014
, primarily due to the absence of a $2.5 billion gain as a result of remeasuring our previous equity-method investment in ACMP to fair value, impairment charges associated with certain goodwill, equity-method investments, and other assets (see
Note 17 – Fair Value Measurements, Guarantees, and Concentration of Credit Risk
), declines in NGL margins driven by 65 percent lower prices, higher depreciation expense caused by significant projects that have gone into service in 2014 and 2015, a gain of $154 million resulting from cash proceeds received for a contingency settlement in 2014, as well as increased interest expense associated with new debt issuances. These decreases were partially offset by new fee-based revenue associated with certain growth projects that were placed in service in 2014 and 2015 and the absence of equity losses in 2014 associated with the discontinuance of the Bluegrass Pipeline project. See additional discussion in Results of Operations.
Energy Transfer Merger Agreement
On September 28, 2015, we entered into an Agreement and Plan of Merger (Merger Agreement) with Energy Transfer Equity, L.P. (Energy Transfer) and certain of its affiliates. The Merger Agreement provides that, subject to the satisfaction of customary closing conditions, we will be merged with and into the newly formed Energy Transfer Corp LP (ETC) (ETC Merger), with ETC surviving the ETC Merger. Energy Transfer formed ETC as a limited partnership that will be treated as a corporation for U.S. federal income tax purposes. Upon completion of the ETC Merger, ETC will be publicly traded on the New York Stock Exchange under the symbol “ETC.”
At the effective time of the ETC Merger, each issued and outstanding share of our common stock (except for certain shares such as those held by us or our subsidiaries and any held by ETC and its affiliates) will be canceled and automatically converted into the right to receive stock, cash, or a combination thereof as described in Note 1 of Notes to Consolidated Financial Statements.
In connection with the ETC Merger, Energy Transfer will subscribe for a number of ETC common shares at the transaction price, in exchange for the amount of cash needed by ETC to fund the cash portion of the Merger Consideration (the Parent Cash Deposit), and, as a result, based on the number of shares of Williams common stock outstanding as of the date thereof, will own approximately 19 percent of the outstanding ETC common shares immediately after the effective time of the ETC Merger.
48
Immediately following the completion of the ETC Merger and of the LE GP, LLC (the general partner for Energy Transfer) merger with and into Energy Transfer Equity GP, LLC, ETC will contribute to Energy Transfer all of the assets and liabilities of Williams in exchange for the issuance by Energy Transfer to ETC of a number of Energy Transfer Class E common units equal to the number of ETC common shares issued to our stockholders in the ETC Merger plus the number of ETC common shares issued to Energy Transfer in consideration for the Parent Cash Deposit (such contribution, together with the ETC Merger and the other transactions contemplated by the Merger Agreement, the Merger Transactions).
To address potential uncertainty as to how the newly listed ETC common shares, as a new security, will trade relative to Energy Transfer common units, each ETC common share issued in the ETC Merger, as well as the ETC common shares issued to Energy Transfer in connection with the Parent Cash Deposit, will have attached to it one contingent consideration right (CCR). The terms of the CCRs are fully described in the form of CCR Agreement attached to the Merger Agreement as Exhibit H to Exhibit 2.1 of our Current Report on Form 8-K dated September 29, 2015.
The receipt of the Merger Consideration is expected to be tax-free to our stockholders, except with respect to any cash consideration received.
We expect the transaction to close in the first half of 2016. Completion of the Merger Transactions is subject to the satisfaction or waiver of a number of customary closing conditions as set forth in the Merger Agreement, including approval of the ETC Merger by our stockholders, receipt of required regulatory approvals in connection with the Merger Transactions, including the expiration or termination of the applicable waiting period under the Hart-Scott-Rodino Antitrust Improvements Act of 1976, as amended, and effectiveness of a registration statement on Form S-4 registering the ETC common shares (and attached CCRs) to be issued in connection with the Merger Transactions.
ETC filed its initial Form S-4 registration statement on November 24, 2015, and Amendment No. 1 to Form S-4 on January 12, 2016. On December 14, 2015, we and Energy Transfer issued a joint press release announcing the entry into a timing agreement with the United States Federal Trade Commission (FTC) pursuant to which both parties have agreed not to consummate ETC’s proposed acquisition of us until after the later of (i) 60 days after substantial compliance with the FTC’s request for additional information and documentary material and (ii) March 18, 2016.
Termination of WPZ Merger Agreement
On May 12, 2015, we entered into an agreement for a unit-for-stock transaction whereby we would have acquired all of the publicly held outstanding common units of WPZ in exchange for shares of our common stock (WPZ Merger Agreement).
On September 28, 2015, prior to our entry into the Merger Agreement, we entered into a Termination Agreement and Release (Termination Agreement), terminating the WPZ Merger Agreement. Under the terms of the Termination Agreement, we are required to pay a $428 million termination fee to WPZ, of which we currently own approximately 60 percent, including the interests of the general partner and IDRs. Such termination fee will settle through a reduction of quarterly incentive distributions we are entitled to receive from WPZ (such reduction not to exceed $209 million per quarter). The distributions from WPZ in November 2015 and February 2016 were each reduced by
$209 million
related to this termination fee.
Williams Partners
ACMP Merger
We owned an equity-method investment in ACMP until July 1, 2014, at which time we acquired all of the interests in ACMP held by Global Infrastructure Partners II (GIP) which included 50 percent of the general partner interest and 55.1 million limited partner units for $5.995 billion in cash (ACMP Acquisition).
On October 26, 2014, we announced that our consolidated master limited partnerships Pre-merger WPZ and ACMP entered into a merger agreement and on February 2, 2015, the merger was completed (ACMP Merger). The merged partnership is named Williams Partners L.P. Under the terms of the merger agreement, each ACMP unitholder received
49
1.06152 ACMP units for each ACMP unit owned immediately prior to the ACMP Merger. In conjunction with the ACMP Merger, each Pre-merger WPZ common unit held by the public was exchanged for 0.86672 ACMP common units. Each WPZ common unit held by us was exchanged for 0.80036 ACMP common units. Prior to the closing of the ACMP Merger, the Class D limited partner units of Pre-merger WPZ, all of which were held by us, were converted into common units on a one-for-one basis pursuant to the terms of the Pre-merger WPZ partnership agreement. Following the ACMP Merger, we own an approximate 60 percent interest in the merged partnership, including the general partner interest and incentive distribution rights.
Geismar Incident and plant expansion
On June 13, 2013, an explosion and fire occurred at Williams Partners’ Geismar olefins plant. The incident rendered the facility temporarily inoperable (Geismar Incident).
Our total property damage and business interruption loss exceeded our $500 million policy limit. Since June 2013, we have settled claims associated with $480 million of available property damage and business interruption coverage for a total of $422 million. This total includes $126 million which we received in the second quarter of 2015. The remaining insurance limits total approximately $20 million and we are vigorously pursuing collection.
Leidy Southeast
In January 2016, Leidy Southeast was placed into service, which expands Transco’s existing natural gas transmission system from the Marcellus Shale production region on Transco’s Leidy Line in Pennsylvania to delivery points along its mainline as far south as Station 85 in west central Alabama. In March 2015, we began providing firm transportation service through the mainline portion of the project on an interim basis until the in-service date of the project as a whole. We placed the remainder of the project into service during January 2016 increasing capacity by 525 Mdth/d.
Utica and Haynesville gas gathering agreements
In September 2015, Williams announced an expansion of gas gathering services for a certain major producer customer in dry gas production areas of the Utica Shale in eastern Ohio and a consolidation of contracts in the Haynesville Shale in northwestern Louisiana.
In the Utica, WPZ executed a long-term fee-based contract that extends the length of certain acreage dedication to 2035, increases the area of dedication from 140,000 acres to 190,000 net acres and converts the cost-of-service mechanism to a fixed-fee structure with minimum volume commitments (MVCs).
A new Haynesville contract consolidates the Springridge and Mansfield contracts into a single agreement with a fixed-fee structure and extends the contract term to 2035. The consolidated contract is supported by MVCs and a drilling commitment to turn 140 equivalent wells online before the end of 2017.
Virginia Southside
In September 2015, Transco’s Virginia Southside expansion from New Jersey to a power station in Virginia and delivery points in North Carolina was placed into service. On December 1, 2014, we placed a portion of the project into service, which enabled us to begin providing 250 Mdth/d of additional firm transportation service through the mainline portion of the project on an interim basis, until the in-service date of the project as a whole. We placed the remainder of the project into service in September 2015. In total, the project increased capacity by 270 Mdth/d.
Northeast Connector
In May 2015, the Northeast Connector project was placed into service, which increased firm transportation capacity by 100 Mdth/d from Transco’s Station 195 in southeastern Pennsylvania to the Rockaway Delivery Lateral.
50
Rockaway Delivery Lateral
In May 2015, Transco’s Rockaway Delivery Lateral expansion between Transco’s transmission pipeline and the National Grid distribution system was placed in service, which enabled us to begin providing 647 Mdth/d of additional firm transportation service to a distribution system in New York.
Mobile Bay South III
In April 2015, Transco’s Mobile Bay South III expansion south from Station 85 in west central Alabama to delivery points along the Mobile Bay line was placed into service, which enabled us to begin providing 225 Mdth/d of additional firm transportation service on the Mobile Bay Lateral.
Bucking Horse gas processing facility
The Bucking Horse gas processing plant (Bucking Horse) began operating in February 2015. Bucking Horse is located in Converse County, Wyoming, and adds 120 MMcf/d of processing capacity in the Powder River basin Niobrara Shale play. Processed volumes at Bucking Horse have continued to increase throughout 2015 as existing rich gas production was re-directed from other third-party processing facilities. Bucking Horse has led to higher gathering volumes in 2015 as previously curtailed production has increased due to the additional processing capability.
Eagle Ford gathering system
In May 2015, WPZ acquired a gathering system comprised of approximately 140 miles of pipeline and a sour gas compression facility capable of handling up to 100 MMcf/d in the Eagle Ford shale for $112 million. The acquisition is contributing approximately 20 MMcf/d to the existing Eagle Ford throughput of approximately 400 MMcf/d.
UEOM
In June 2015, WPZ acquired an approximate 13 percent equity interest in UEOM for approximately $357 million, increasing our ownership from 49 percent to approximately 62 percent.
Volatile commodity prices
NGL margins were approximately 59 percent lower in 2015 compared to 2014 driven primarily by 58 percent lower
non-ethane prices partially offset by lower natural gas feedstock prices
.
NGL margins are defined as NGL revenues less any applicable Btu replacement cost, plant fuel, and third-party transportation and fractionation. Per-unit NGL margins are calculated based on sales of our own equity volumes at the processing plants. Our equity volumes include NGLs where we own the rights to the value from NGLs recovered at our plants under both “keep-whole” processing agreements, where we have the obligation to replace the lost heating value with natural gas, and “percent-of-liquids” agreements whereby we receive a portion of the extracted liquids with no obligation to replace the lost heating value.
The following graph illustrates the effects of this margin volatility and NGL production and sales volumes, as well as the margin differential between ethane and non-ethane products and the relative mix of those products.
51
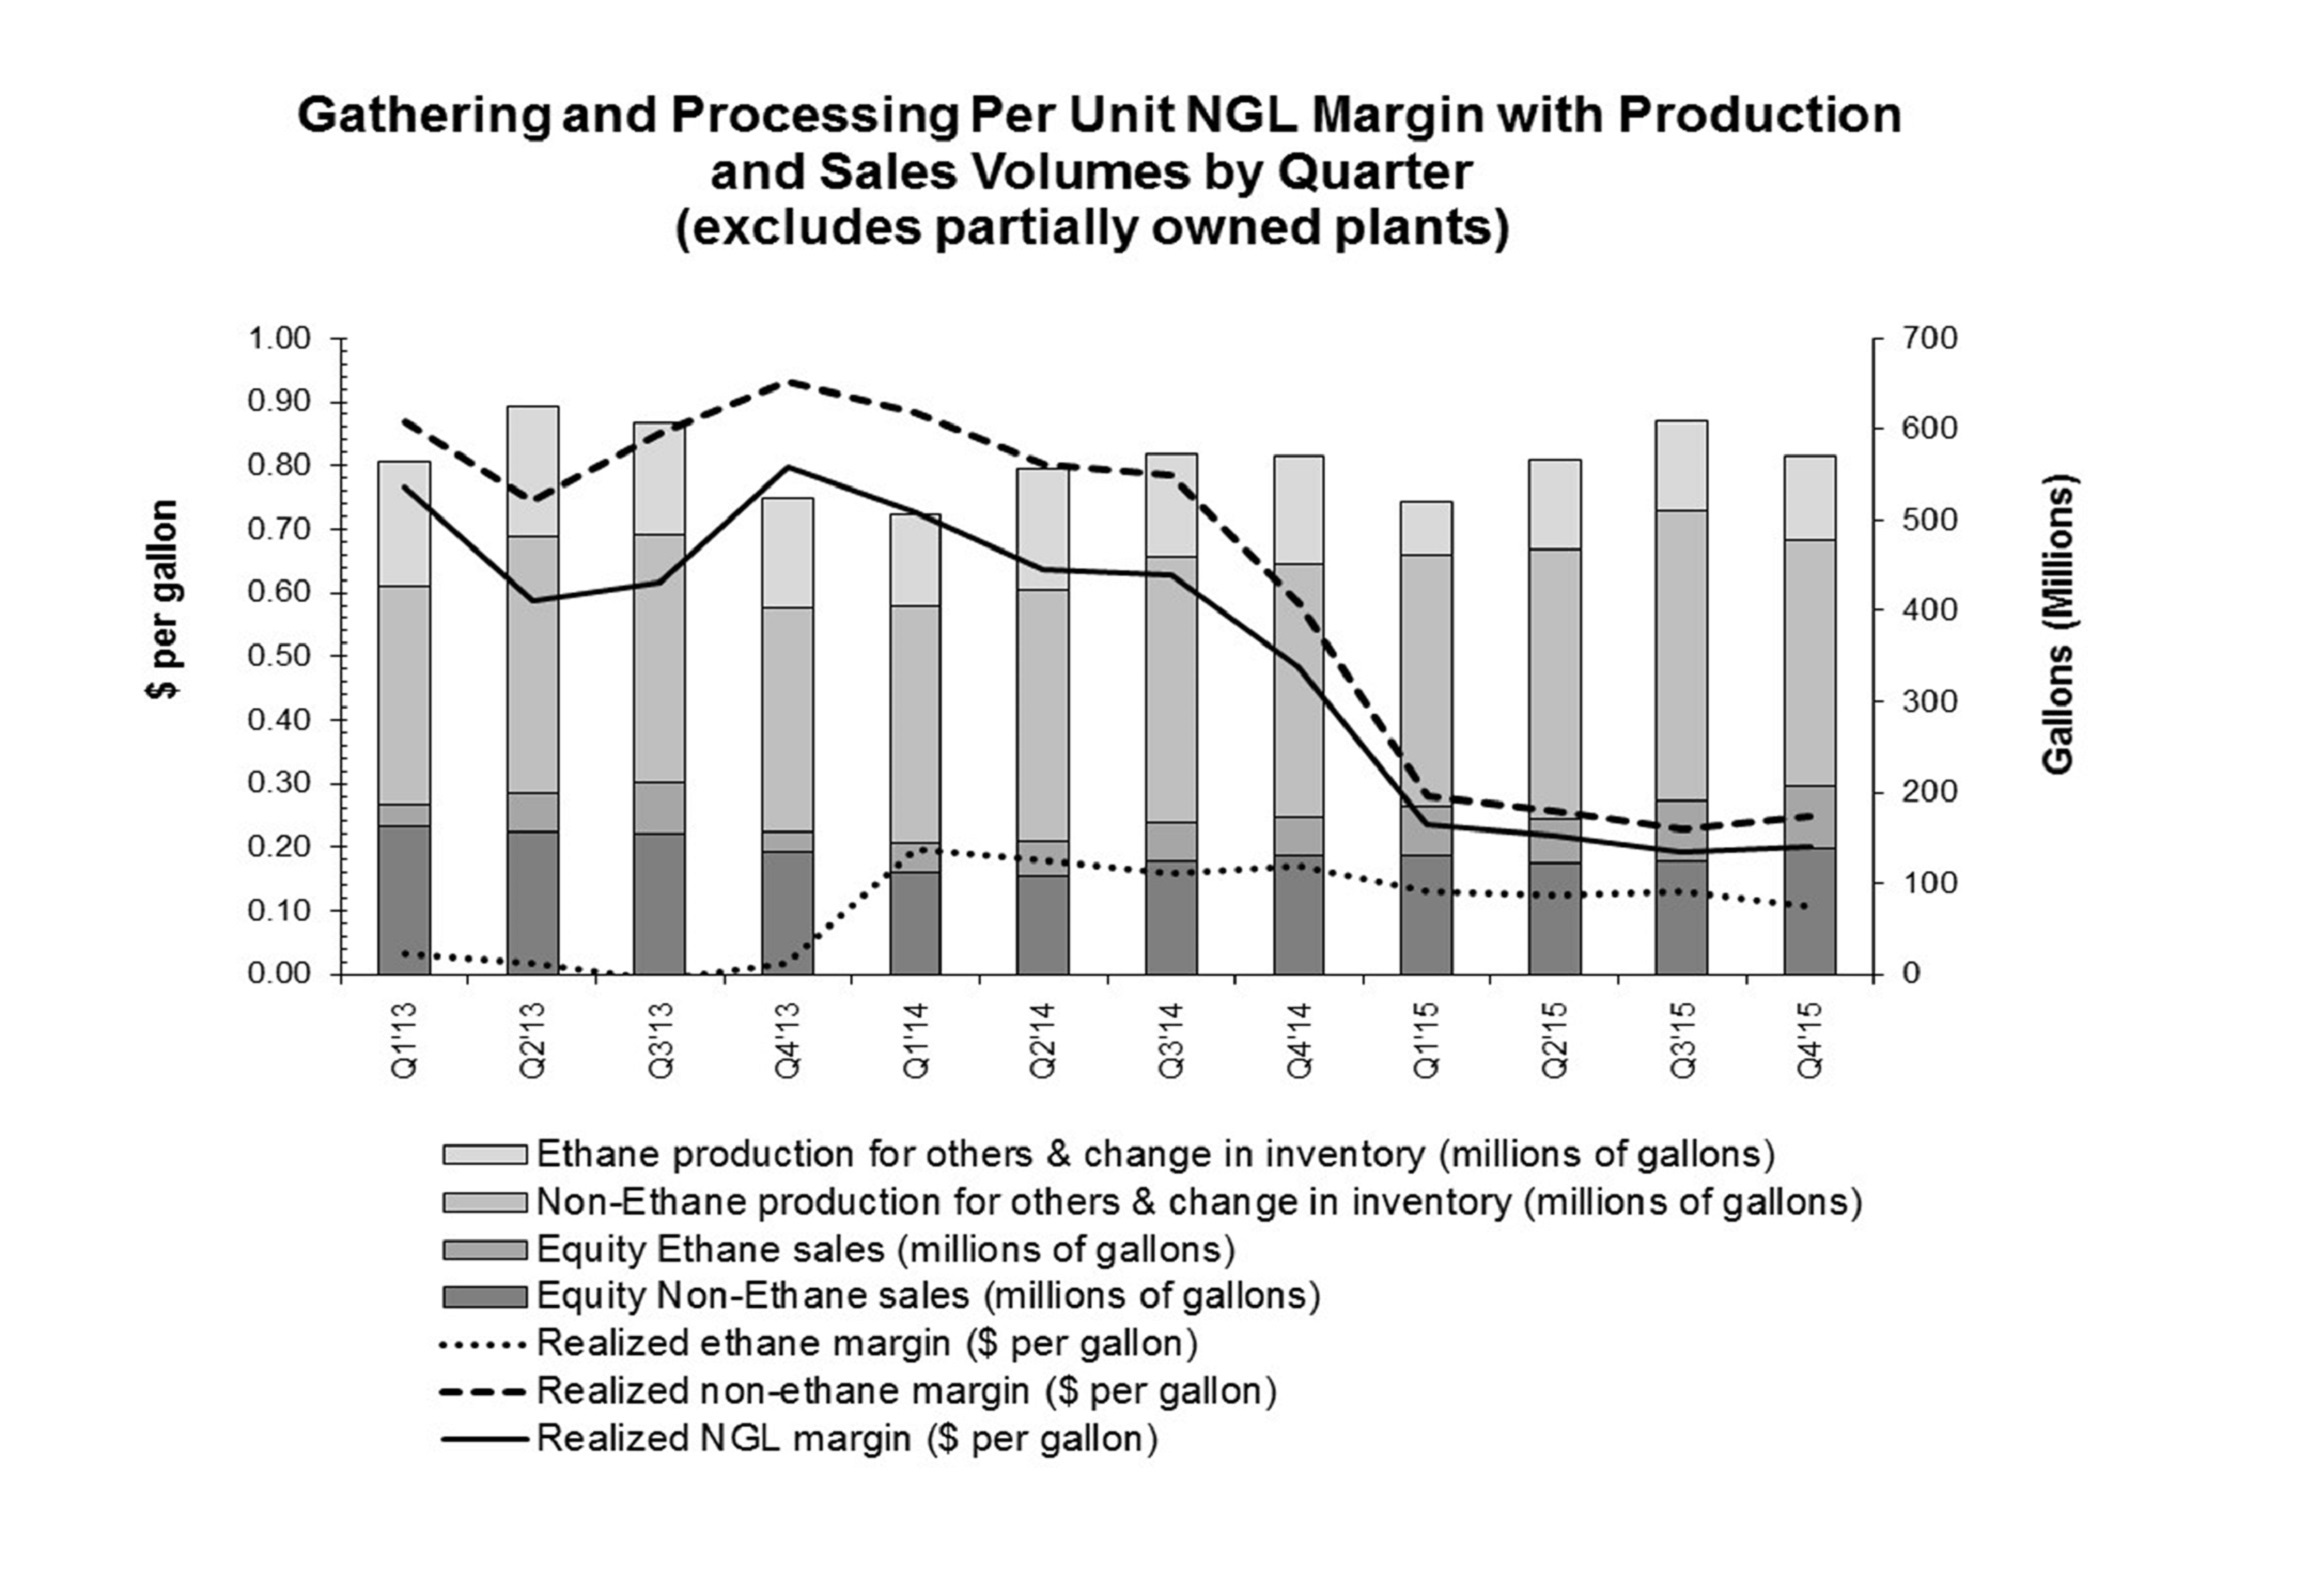
|
The potential impact of commodity price volatility on our business is further discussed in the following Company Outlook.
Williams NGL & Petchem Services
Texas Belle Pipeline
In March 2015, the Texas Belle Pipeline (Texas Belle) went into service in the Houston Ship Channel area. Texas Belle is a 32-mile open access, service focused pipeline that transports NGLs and was designed to deliver butanes and natural gasolines from Mont Belvieu, Texas, to new demand in the Houston Ship Channel area.
Company Outlook
As previously discussed, we entered into a Merger Agreement with Energy Transfer and certain of its affiliates and expect the ETC Merger to close in the first half of 2016. The following discussion reflects our operating plan for 2016.
Our strategy is to provide large-scale energy infrastructure designed to maximize the opportunities created by the vast supply of natural gas, natural gas products, and crude oil that exists in North America. We seek to accomplish this through further developing our scale positions in current key markets and basins and entering new growth markets and basins where we can become the large-scale service provider. We will continue to maintain a strong commitment to safety, environmental stewardship, operational excellence and customer satisfaction. We believe that accomplishing these goals will position us to deliver safe and reliable service to our customers and an attractive return to our shareholders.
This strategy remains intact and we continue to execute on infrastructure projects that serve long-term natural gas needs. We expect commodity prices to remain challenged and costs of capital to remain sharply higher throughout
52
2016 as compared to 2015. Anticipating these conditions, our business plan for 2016 includes significant reductions in capital investment and expenses from our previous plans. In addition, we expect proceeds from planned asset monetizations in excess of $1 billion during 2016.
Our growth capital and investment expenditures in 2016 are expected to total $2.2 billion, which is a $1.5 billion reduction from our previous plans. Approximately $1.3 billion of our growth capital funding needs include Transco expansions and other interstate pipeline growth projects, most of which are fully contracted with firm transportation agreements. The remaining non-interstate pipeline growth capital spending in 2016 primarily reflects investment in gathering and processing systems limited to known new producer volumes, including wells drilled and completed awaiting connecting infrastructure. We also remain committed to projects that maintain our assets for safe and reliable operations, as well as projects that meet legal, regulatory, and/or contractual commitments.
Fee-based businesses are a significant component of our portfolio, which serves to somewhat reduce the influence of commodity price fluctuations on our operating results and cash flows. However, producer activities are being impacted by lower energy commodity prices which will reduce our gathering volumes. The credit profiles of certain of our producer customers are increasingly challenged by the current market conditions, which ultimately may result in a further reduction of our gathering volumes. Such reductions as well as further or prolonged declines in energy commodity prices may result in noncash impairments of our assets.
Commodity margins are highly dependent upon regional supply/demand balances of natural gas as they relate to NGL margins, while olefins are impacted by global supply and demand fundamentals. We anticipate the following trends in energy commodity prices in 2016, compared to 2015 that may impact our operating results and cash flows:
|
•
|
Natural gas and ethane prices are expected to be lower.
|
|
•
|
Non-ethane prices, including propane, are expected to be lower.
|
|
•
|
Olefins prices, including propylene, ethylene, and the overall ethylene crack spread, are expected to be lower.
|
In 2016, we anticipate our operating results will reflect increases from our fee-based businesses primarily as a result of Transco projects placed in service in 2015 and those anticipated to be placed in service in 2016, increases in our olefins volumes associated with a full year of operations at our Geismar plant following its 2015 repair and expansion, and anticipated lower general and administrative costs. Additionally, we anticipate these improvements will be partially offset by the absence of operating results associated with certain asset monetizations, lower NGL margins, and additional operating expenses associated with growth projects placed in service in 2015 and those anticipated to be placed in service in 2016.
Potential risks and obstacles that could impact the execution of our plan include:
|
•
|
Further downgrades of our credit ratings and associated increase in cost of borrowings;
|
|
•
|
Higher cost of capital and/or limited availability of capital due to a change in our financial condition, interest rates, market or industry conditions;
|
|
•
|
Counterparty credit and performance risk, including that of Chesapeake Energy Corporation and its affiliates;
|
|
•
|
Inability to execute or delay in completing planned asset monetizations;
|
|
•
|
Delay in capturing planned cost reductions;
|
|
•
|
Lower than anticipated energy commodity prices and margins;
|
|
•
|
Decreased volumes from third parties served by our midstream business;
|
|
•
|
Unexpected significant increases in capital expenditures or delays in capital project execution;
|
53
|
•
|
Lower than expected distributions, including IDRs, from WPZ;
|
|
•
|
General economic, financial markets, or further industry downturn;
|
|
•
|
Lower than expected levels of cash flow from operations;
|
|
•
|
Changes in the political and regulatory environments;
|
|
•
|
Physical damages to facilities, including damage to offshore facilities by named windstorms;
|
|
•
|
Reduced availability of insurance coverage.
|
We continue to address these risks through maintaining a strong financial position and liquidity, as well as through managing a diversified portfolio of energy infrastructure assets which continue to serve key markets and basins in North America.
Expansion Projects
Our ongoing major expansion projects include the following:
Williams Partners
Access Midstream Projects
We plan to expand our gathering infrastructure in the Eagle Ford, Utica, and Marcellus shale regions in order to meet our customers’ production plans. The expansion of the gathering infrastructure includes the addition of new facilities, well connections, and gathering pipeline to the existing systems.
Oak Grove Expansion
We plan to expand our processing capacity at our Oak Grove facility by adding a second 200MMcf/d cryogenic natural gas processing plant, which, based on our customers’ needs, is expected to be placed into service in 2019.
Susquehanna Supply Hub
We will continue to expand the gathering system in the Susquehanna Supply Hub in northeastern Pennsylvania that is needed to meet our customers’ production plans. The expansion of the gathering infrastructure includes additional compression and gathering pipeline to the existing system.
Atlantic Sunrise
In March 2015, we filed an application with the FERC to expand Transco’s existing natural gas transmission system along with greenfield facilities to provide incremental firm transportation capacity from the northeastern Marcellus producing area to markets along Transco’s mainline as far south as Station 85 in west central Alabama. We plan to place the project into service during the second half of 2017, assuming timely receipt of all necessary regulatory approvals, and it is expected to increase capacity by 1,700 Mdth/d.
Constitution Pipeline
In December 2014, we received approval from the FERC to construct and operate the jointly owned Constitution pipeline. We also received a Notice of Complete Application from the New York Department of Environmental Conservation (NYDEC) in December 2014, but we continue to seek issuance of Clean Water Act Section 401 certification by the NYDEC. We currently own 41 percent of Constitution with three other parties holding 25 percent, 24 percent, and 10 percent, respectively. We will be the operator of Constitution. The 124-mile Constitution pipeline will connect our gathering system in Susquehanna County, Pennsylvania, to the Iroquois Gas Transmission and Tennessee Gas Pipeline systems in New York. We plan to place the project into service in the fourth quarter of 2016, assuming timely receipt of all necessary regulatory approvals, with an expected capacity of 650 Mdth/d.
54
Rock Springs
In March 2015, we received approval from the FERC to expand Transco’s existing natural gas transmission system from New Jersey to a proposed generation facility in Maryland. The project is planned to be placed into service in third quarter 2016 and is expected to increase capacity by 192 Mdth/d.
Hillabee
In February 2016, the FERC issued a certificate order for the initial phases of Transco’s Hillabee Expansion Project. We may seek rehearing of certain aspects of the FERC order. The Hillabee Expansion Project involves an expansion of Transco’s existing natural gas transmission system from Station 85 in west central Alabama to a proposed new interconnection with Sabal Trail Transmission's system in Alabama. The project will be constructed in phases, and all of the project expansion capacity will be leased to Sabal Trail Transmission. We plan to place the initial phases of the project into service during the second quarters of 2017 and 2020, assuming timely receipt of all necessary regulatory approvals, and together they are expected to increase capacity by 1,025 Mdth/d.
Gulf Trace
In October 2015, we received approval from the FERC to expand Transco’s existing natural gas transmission system together with greenfield facilities to provide incremental firm transportation capacity from Station 65 in St. Helena Parish, Louisiana westward to a new interconnection with Sabine Pass Liquefaction in Cameron Parish, Louisiana. We plan to place the project into service during the first quarter of 2017, assuming timely receipt of all other necessary regulatory approvals, and it is expected to increase capacity by 1,200 Mdth/d.
Dalton
In March 2015, we filed an application with the FERC to expand Transco’s existing natural gas transmission system together with greenfield facilities to provide incremental firm transportation capacity from Station 210 in New Jersey to markets in northwest Georgia. We plan to place the project into service in 2017, assuming timely receipt of all necessary regulatory approvals, and it is expected to increase capacity by 448 Mdth/d.
Garden State
In February 2015, we filed an application with the FERC to expand Transco’s existing natural gas transmission system to provide incremental firm transportation capacity from Station 210 in New Jersey to a new interconnection on our Trenton Woodbury Lateral in New Jersey. The project will be constructed in phases and is expected to increase capacity by 180 Mdth/d. We plan to place the initial phase of the project into service during the fourth quarter of 2016 and the remaining portion in the third quarter of 2017, assuming timely receipt of all necessary regulatory approvals.
Virginia Southside II
In March 2015, we filed an application with the FERC to expand Transco’s existing natural gas transmission system together with greenfield facilities to provide incremental firm transportation capacity from New Jersey and Virginia to a new lateral extending from our Brunswick Lateral in Virginia. We plan to place the project into service during the fourth quarter of 2017, assuming timely receipt of all necessary regulatory approvals, and expect it to increase capacity by 250 Mdth/d.
New York Bay
In July 2015, we filed an application with the FERC to expand Transco’s existing natural gas transmission system to provide incremental firm transportation capacity from Pennsylvania to the Rockaway Delivery Lateral transfer point and the Narrows meter station in Richmond County, New York. We plan to place the project into service during the fourth quarter of 2017, assuming timely receipt of all necessary regulatory approvals, and it is expected to increase capacity by 115 Mdth/d.
55
Redwater Expansion
As part of a long-term agreement to provide gas processing services to a second bitumen upgrader in Canada’s oil sands near Fort McMurray, Alberta, we are increasing the capacity of the Redwater facilities where NGL/olefins mixtures will be fractionated into an ethane/ethylene mix, propane, polymer grade propylene, normal butane, an alkylation feed and condensate. This capacity increase is expected to be placed into service during the first quarter of 2016.
Williams NGL & Petchem Services
Canadian PDH Facility
We are developing a project to construct a PDH facility in Alberta that will significantly increase production of polymer-grade propylene. The new PDH facility would produce approximately 1.1 billion pounds annually. Due to our current capital allocation considerations, in the first quarter of 2016, management determined to substantially slow the pace of development activities, limit further investment, and proceed with a strategy that could result in the potential sale of this project, entering into a partnership to fund additional development, or deferring development of the project.
Canadian NGL Infrastructure Expansion
As part of a long-term agreement to provide gas processing to a second bitumen upgrader in Canada’s oil sands near Fort McMurray, Alberta, we are building a new liquids extraction plant and an extension of the Boreal Pipeline, owned by our Williams Partners segment. The extension will enable transportation of the NGL/olefins mixture on the Boreal pipeline from the new liquids extraction plant to the expanded Redwater facilities, owned by our Williams Partners segment. We plan to place the new liquids extraction plant and interconnection with Boreal into service during the first quarter of 2016, and expect initial NGL/olefins recoveries of approximately 12 Mbbls/d. To mitigate ethane price risk associated with our processing services, we have a long-term agreement with a minimum price for ethane sales to a third-party customer.
Gulf Coast NGL and Olefin Infrastructure Expansion
Certain previously acquired liquids pipelines in the Gulf Coast region will be combined with an organic build-out of several projects to expand our petrochemical services in that region. The projects include the construction and commissioning of pipeline systems capable of transporting various purity natural gas liquids and olefins products in the Gulf Coast region. In response to the current conditions in the midstream industry, we are slowing the pace of development and may seek partners for these projects.
Critical Accounting Estimates
The preparation of financial statements in conformity with generally accepted accounting principles requires management to make estimates and assumptions. We have reviewed the selection, application, and disclosure of these critical accounting estimates with our Audit Committee. We believe that the nature of these estimates and assumptions is material due to the subjectivity and judgment necessary, or the susceptibility of such matters to change, and the impact of these on our financial condition or results of operations.
Pension and Postretirement Obligations
We have employee benefit plans that include pension and other postretirement benefits. Net periodic benefit cost and obligations for these plans are impacted by various estimates and assumptions. These estimates and assumptions include the expected long-term rates of return on plan assets, discount rates, expected rate of compensation increase, health care cost trend rates, and employee demographics, including retirement age and mortality. These assumptions are reviewed annually and adjustments are made as needed. The assumptions utilized to compute cost and the benefit obligations are shown in
Note 9 – Employee Benefit Plans
of Notes to Consolidated Financial Statements.
56
The following table presents the estimated increase (decrease) in net periodic benefit cost and obligations resulting from a one-percentage-point change in the specific assumption.
|
|
Benefit Cost
|
Benefit Obligation
|
|||||||||||||
|
|
One-
Percentage-
Point
Increase
|
One-
Percentage-
Point
Decrease
|
One-
Percentage-
Point
Increase
|
One-
Percentage-
Point
Decrease
|
|||||||||||
|
|
(Millions)
|
||||||||||||||
|
Pension benefits:
|
|||||||||||||||
|
Discount rate
|
$
|
(9
|
)
|
$
|
11
|
|
$
|
(130
|
)
|
$
|
154
|
|
|||
|
Expected long-term rate of return on plan assets
|
(13
|
)
|
13
|
|
—
|
|
—
|
|
|||||||
|
Rate of compensation increase
|
3
|
|
(2
|
)
|
9
|
|
(7
|
)
|
|||||||
|
Other postretirement benefits:
|
|||||||||||||||
|
Discount rate
|
1
|
|
2
|
|
(21
|
)
|
26
|
|
|||||||
|
Expected long-term rate of return on plan assets
|
(2
|
)
|
2
|
|
—
|
|
—
|
|
|||||||
|
Assumed health care cost trend rate
|
1
|
|
(1
|
)
|
7
|
|
(6
|
)
|
|||||||
Our expected long-term rates of return on plan assets, as determined at the beginning of each fiscal year, are based on the average rate of return expected on the funds invested in the plans. We determine our long-term expected rates of return on plan assets using our expectations of capital market results, which include an analysis of historical results as well as forward-looking projections. These capital market expectations are based on a period of at least 10 years and take into account our investment strategy and mix of assets, which are weighted toward domestic and international equity securities. We develop our expectations using input from several external sources, including consultation with our third-party independent investment consultant. The forward-looking capital market projections are developed using a consensus of economists’ expectations for inflation, GDP growth, and dividend yield along with expected changes in risk premiums. The capital market return projections for specific asset classes in the investment portfolio are then applied to the relative weightings of the asset classes in the investment portfolio. The resulting rates are an estimate of future results and, thus, likely to be different than actual results.
In
2015
, the benefit plans’ assets outperformed their respective benchmarks for non-U.S. equity and fixed income strategies, but underperformed the respective benchmark for U.S. equity strategies. While the
2015
investment performance was less than our expected rates of return, the expected rates of return on plan assets are long-term in nature and are not significantly impacted by short-term market performance. Changes to our asset allocation would also impact these expected rates of return. Our expected long-term rate of return on plan assets used for our pension plans was 6.38 percent in
2015
. The
2015
actual return on plan assets for our pension plans was a loss of approximately 1.0 percent. The 10-year average rate of return on pension plan assets through December
2015
was approximately 4.4 percent.
The discount rates are used to measure the benefit obligations of our pension and other postretirement benefit plans. The objective of the discount rates is to determine the amount, if invested at the December 31 measurement date in a portfolio of high-quality debt securities, that will provide the necessary cash flows when benefit payments are due. Increases in the discount rates decrease the obligation and, generally, decrease the related cost. The discount rates for our pension and other postretirement benefit plans are determined separately based on an approach specific to our plans and their respective expected benefit cash flows as described in
Note 1 – General, Description of Business, Basis of Presentation, and Summary of Significant Accounting Policies
and
Note 9 – Employee Benefit Plans
of Notes to Consolidated Financial Statements. Our discount rate assumptions are impacted by changes in general economic and market conditions that affect interest rates on long-term, high-quality debt securities as well as by the duration of our plans’ liabilities.
The expected rate of compensation increase represents average long-term salary increases. An increase in this rate causes the pension obligation and cost to increase.
The assumed health care cost trend rates are based on national trend rates adjusted for our actual historical cost rates and plan design. An increase in this rate causes the other postretirement benefit obligation and cost to increase.
57
Goodwill
As disclosed within the Critical Accounting Estimates discussion in Item 2. Management’s Discussion and Analysis of Financial Condition and Results of Operations of our Form 10-Q dated October 29, 2015, we performed an interim impairment evaluation of the goodwill associated with the Access Midstream reporting unit as of September 30, 2015. The goodwill associated with this reporting unit was initially recorded during the third quarter of 2014 in conjunction with our acquisition of ACMP. At September 30, 2015, the fair value of this reporting unit, determined using an income approach, exceeded the carrying value and thus no impairment was recorded. For such a measurement, the book basis of the reporting unit was reduced by the associated deferred tax liabilities. We disclosed that the evaluation utilized a discount rate of approximately 9.4 percent.
On October 1, 2015, we performed our annual review of the goodwill within the Northeast G&P and West reporting units. At that date, the fair value of each reporting unit exceeded the carrying value and no impairment was recorded. The discount rates utilized for the reporting units at October 1, 2015, were approximately 10.8 percent and 9.6 percent, respectively.
During the fourth quarter of 2015, we observed a significant decline in the market values of WPZ and comparable midstream companies within the industry. This served to reduce our estimate of enterprise value and increased our estimates of discount rates. As a result, we performed an impairment assessment of the goodwill associated with all of our reporting units as of December 31, 2015. Prior to this assessment, the book value of goodwill by reporting unit was as follows:
|
Reporting Segment
|
Reporting Unit
|
Goodwill
|
||||
|
(Millions)
|
||||||
|
Williams Partners
|
Access Midstream
|
$
|
452
|
|
||
|
Williams Partners
|
Northeast G&P
|
646
|
|
|||
|
Williams Partners
|
West
|
47
|
|
|||
|
$
|
1,145
|
|
||||
For our evaluation at December 31, 2015, we continued to estimate the fair value of each reporting unit based on an income approach utilizing discount rates specific to the underlying businesses of each reporting unit. These discount rates considered variables unique to each business area, including equity yields of comparable midstream businesses, expectations for future growth and customer performance considerations. Weighted-average discount rates utilized for the reporting units were 12.8 percent for Access Midstream, 12.5 percent for Northeast G&P, and 10.4 percent for the West. As a result of the increases in discount rates during the fourth quarter, coupled with certain reductions in estimated future cash flows determined during the same period, the fair values of the Access Midstream and Northeast G&P reporting units were determined to be below their respective carrying values. For these reporting units, we calculated the implied fair value of goodwill by performing a hypothetical application of the acquisition method wherein the estimated fair value was assigned to the underlying assets and liabilities of each reporting unit. As a result of this analysis, we determined that the goodwill associated with each of these reporting units was fully impaired. For the West reporting unit, the estimated fair value significantly exceeded the carrying value and no impairment was recorded.
These results were corroborated with a market capitalization analysis whereby we reconciled the enterprise value at December 31, 2015, to the aggregate fair value of all of the reporting units and operating areas.
Judgments and assumptions are inherent in our estimates of future cash flows, discount rates, and market measures used to evaluate these assets. The use of alternate judgments and assumptions could result in a different calculation of fair value, which could ultimately result in the recognition of a different impairment charge in the consolidated financial statements.
During the first quarter of 2016 to-date, we have observed further significant decline in the market value of WPZ. Continuation of this condition may require evaluating our remaining goodwill for potential impairment in the future.
58
Equity-method Investments
As disclosed within the Critical Accounting Estimates discussion in Item 2. Management’s Discussion and Analysis of Financial Condition and Results of Operations of our Form 10-Q dated October 29, 2015, in the third quarter of 2015 in response to declining market conditions, we assessed whether the carrying amounts of certain of our equity-method investments exceeded their fair value. As a result, we recognized other-than-temporary impairment charges of $458 million and $3 million in the third-quarter related to our equity-method investments in the Delaware basin gas gathering system and certain of the Appalachia Midstream Investments, respectively. The historical carrying value of these investments was initially recorded based on estimated fair value during the third quarter of 2014 in conjunction with our acquisition of ACMP. We estimated the fair value of these investments using an income approach and discount rates of 11.8 percent and 8.8 percent, respectively.
In response to declining market conditions in the fourth quarter as previously discussed, we again assessed whether the carrying amounts of certain of our equity-method investments exceeded their fair value. In the fourth quarter, we recognized additional impairment charges of $45 million and $559 million related to the Delaware basin gas gathering system and certain of the Appalachia Midstream Investments, respectively, and impairment charges of $241 million and $45 million associated with UEOM and Laurel Mountain, respectively. The historical carrying value of our original 49 percent interest in UEOM was initially recorded based on estimated fair value during the third quarter of 2014 in conjunction with our acquisition of ACMP and the remaining 13 percent interest reflected our cost of acquiring that additional interest in June 2015.
We estimated the fair value of these investments using an income approach and discounts rates ranging from 10.8 percent to 14.4 percent. These discount rates considered variables unique to each business area, including equity yields of comparable midstream businesses, expectations for future growth and customer performance considerations. We estimate that an overall increase in the discount rates utilized of 50 basis points would have resulted in additional impairment charges on these investments of approximately $286 million.
Judgments and assumptions are inherent in our estimates of future cash flows, discount rates, and market measures utilized. The use of alternate judgments and assumptions could result in a different calculation of fair value, which could ultimately result in the recognition of a different impairment charge in the consolidated financial statements.
At December 31, 2015, our Consolidated Balance Sheet includes approximately $7.3 billion of investments that are accounted for under the equity-method of accounting. We evaluate these investments for impairment when events or changes in circumstances indicate, in our management’s judgment, that the carrying value of such investments may have experienced an other-than-temporary decline in value. When evidence of loss in value has occurred, we compare our estimate of fair value of the investment to the carrying value of the investment to determine whether an impairment has occurred. We generally estimate the fair value of our investments using an income approach where significant judgments and assumptions include expected future cash flows and the appropriate discount rate. In some cases, we may utilize a form of market approach to estimate the fair value of our investments.
If the estimated fair value is less than the carrying value and we consider the decline in value to be other-than-temporary, the excess of the carrying value over the fair value is recognized in the consolidated financial statements as an impairment charge. Events or changes in circumstances that may be indicative of an other-than-temporary decline in value will vary by investment, but may include:
|
•
|
A significant or sustained decline in the market value of an investee;
|
|
•
|
Lower than expected cash distributions from investees;
|
|
•
|
Significant asset impairments or operating losses recognized by investees;
|
|
•
|
Significant delays in or lack of producer development or significant declines in producer volumes in markets served by investees;
|
|
•
|
Significant delays in or failure to complete significant growth projects of investees.
|
59
During the first quarter of 2016 and through the date of this filing, we have observed further significant decline in the market value of WPZ. Continuation of this condition and/or further decline in such value will likely require the evaluation of certain of our equity investments for potential impairment at March 31, 2016, including those that were impaired at December 31, 2015. As a result, there is the potential for significant additional noncash impairments of our investments in the future.
Capitalized Project Development Costs
As of December 31, 2015 our Consolidated Balance Sheet includes approximately $221 million of capitalized costs associated with a limited number of developing and deferred projects, some of which are considered probable of future completion while certain others are only reasonably possible of completion. Following the significant decline in energy commodity prices and market values within our industry in 2015, we either reviewed these capitalized project costs for indicators of impairment or evaluated them for impairment as of December 31, 2015. Where performed, our impairment evaluations considered probability-weighted scenarios of undiscounted future net cash flows, including reasonably possible scenarios assuming the construction and operation of the underlying projects.
As a result of these impairment evaluations, we recognized impairment charges of $158 million associated with certain of these projects. This includes a $94 million impairment charge within our Williams Partners segment associated with development costs for a gas processing plant for which completion is now considered remote due to the unfavorable impact of low natural gas prices on customer drilling activities, and a $64 million impairment charge within our Williams NGL & Petchem Services segment associated with costs for an olefins pipeline project that is now considered remote due to the lack of customer interest.
We will continue to review and evaluate capitalized project costs for impairment in the future if we believe events or changes in circumstances indicate that we may not be able to recover the carrying value. Such events or changes in circumstances may include changes in customer requirements associated with these projects, as well as overall changes in market demand. If, in a future evaluation, our carrying value for any of the projects exceeds the undiscounted future net cash flows, we will recognize an impairment for the difference between the carrying value and our estimate of fair value of the assets.
One of these projects is a Canadian PDH facility for which we have capitalized project development costs of approximately $128 million at December 31, 2015. Due to our current capital allocation considerations, management determined in the first quarter of 2016 to substantially slow the pace of development activities, limit further investment, and proceed with a strategy that could result in the potential sale of this project, entering into a partnership to fund additional development, or deferring development of the project. We have evaluated the recoverability of costs associated with this project under various scenarios of undiscounted future cash flows from the potential outcomes and determined that no impairment was required. As this strategy proceeds and our cash flow and value assumptions are updated, it is possible that some portion of these costs may be determined to be unrecoverable and thus result in an impairment.
Property, plant, and equipment and other identifiable intangible assets
We evaluate our property, plant, and equipment and other identifiable intangible assets for impairment when events or changes in circumstances indicate, in our judgment, that the carrying value of such assets may not be recoverable. When an indicator of impairment has occurred, we compare our estimate of undiscounted future cash flows attributable to the assets to the carrying value of the assets to determine whether an impairment has occurred and we may apply a probability-weighted approach to consider the likelihood of different cash flow assumptions and possible outcomes including selling in the near term or holding for the remaining estimated useful life. If an impairment of the carrying value has occurred, we determine the amount of the impairment recognized by estimating the fair value of the assets and recording a loss for the amount that the carrying value exceeds the estimated fair value. This evaluation is performed at the lowest level for which separately identifiable cash flows exist.
At December 31, 2015, our Consolidated Balance Sheet includes property, plant, and equipment and intangible assets totaling $29.6 billion and $10.0 billion, respectively. Further declines in energy commodity prices and conditions in our industry may affect our estimates of future cash flows and impact assumptions about the performance of our customers. Such indicators may cause us to evaluate these assets for potential impairment in future periods.
60
Judgments and assumptions are inherent in estimating undiscounted future cash flows, fair values, and the probability-weighting of possible outcomes. The use of alternate judgments and assumptions could result in a different determination affecting the consolidated financial statements.
61
Results of Operations
Consolidated Overview
The following table and discussion is a summary of our consolidated results of operations for the three years ended
December 31, 2015
. The results of operations by segment are discussed in further detail following this consolidated overview discussion.
|
|
Years Ended December 31,
|
||||||||||||||||||||||
|
|
2015
|
$ Change
from
2014*
|
% Change
from
2014*
|
2014
|
$ Change
from
2013*
|
% Change
from
2013*
|
2013
|
||||||||||||||||
|
|
(Millions)
|
||||||||||||||||||||||
|
Revenues:
|
|||||||||||||||||||||||
|
Service revenues
|
$
|
5,164
|
|
+1,048
|
|
+25
|
%
|
$
|
4,116
|
|
+1,177
|
|
+40
|
%
|
$
|
2,939
|
|
||||||
|
Product sales
|
2,196
|
|
-1,325
|
|
-38
|
%
|
3,521
|
|
-400
|
|
-10
|
%
|
3,921
|
|
|||||||||
|
Total revenues
|
7,360
|
|
7,637
|
|
6,860
|
|
|||||||||||||||||
|
Costs and expenses:
|
|||||||||||||||||||||||
|
Product costs
|
1,779
|
|
+1,237
|
|
+41
|
%
|
3,016
|
|
+11
|
|
—
|
%
|
3,027
|
|
|||||||||
|
Operating and maintenance expenses
|
1,655
|
|
-163
|
|
-11
|
%
|
1,492
|
|
-395
|
|
-36
|
%
|
1,097
|
|
|||||||||
|
Depreciation and amortization expenses
|
1,738
|
|
-562
|
|
-48
|
%
|
1,176
|
|
-361
|
|
-44
|
%
|
815
|
|
|||||||||
|
Selling, general, and administrative expenses
|
741
|
|
-80
|
|
-12
|
%
|
661
|
|
-149
|
|
-29
|
%
|
512
|
|
|||||||||
|
Impairment of goodwill
|
1,098
|
|
-1,098
|
|
NM
|
|
—
|
|
—
|
|
—
|
%
|
—
|
|
|||||||||
|
Net insurance recoveries – Geismar Incident
|
(126
|
)
|
-106
|
|
-46
|
%
|
(232
|
)
|
+192
|
|
NM
|
|
(40
|
)
|
|||||||||
|
Other (income) expense – net
|
249
|
|
-294
|
|
NM
|
|
(45
|
)
|
+119
|
|
NM
|
|
74
|
|
|||||||||
|
Total costs and expenses
|
7,134
|
|
6,068
|
|
5,485
|
|
|||||||||||||||||
|
Operating income (loss)
|
226
|
|
1,569
|
|
1,375
|
|
|||||||||||||||||
|
Equity earnings (losses)
|
335
|
|
+191
|
|
+133
|
%
|
144
|
|
+10
|
|
+7
|
%
|
134
|
|
|||||||||
|
Gain on remeasurement of equity-method investment
|
—
|
|
-2,544
|
|
-100
|
%
|
2,544
|
|
+2,544
|
|
NM
|
|
—
|
|
|||||||||
|
Impairment of equity-method investments
|
(1,359
|
)
|
-1,359
|
|
NM
|
|
—
|
|
—
|
|
—
|
%
|
—
|
|
|||||||||
|
Other investing income (loss) – net
|
27
|
|
-16
|
|
-37
|
%
|
43
|
|
-38
|
|
-47
|
%
|
81
|
|
|||||||||
|
Interest expense
|
(1,044
|
)
|
-297
|
|
-40
|
%
|
(747
|
)
|
-237
|
|
-46
|
%
|
(510
|
)
|
|||||||||
|
Other income (expense) – net
|
102
|
|
+71
|
|
NM
|
|
31
|
|
+31
|
|
NM
|
|
—
|
|
|||||||||
|
Income (loss) from continuing operations before income taxes
|
(1,713
|
)
|
3,584
|
|
1,080
|
|
|||||||||||||||||
|
Provision (benefit) for income taxes
|
(399
|
)
|
+1,648
|
|
NM
|
|
1,249
|
|
-848
|
|
NM
|
|
401
|
|
|||||||||
|
Income (loss) from continuing operations
|
(1,314
|
)
|
2,335
|
|
679
|
|
|||||||||||||||||
|
Income (loss) from discontinued operations
|
—
|
|
-4
|
|
-100
|
%
|
4
|
|
+15
|
|
NM
|
|
(11
|
)
|
|||||||||
|
Net income (loss)
|
(1,314
|
)
|
2,339
|
|
668
|
|
|||||||||||||||||
|
Less: Net income (loss) attributable to noncontrolling interests
|
(743
|
)
|
+968
|
|
NM
|
|
225
|
|
+13
|
|
+5
|
%
|
238
|
|
|||||||||
|
Net income (loss) attributable to The Williams Companies, Inc.
|
$
|
(571
|
)
|
$
|
2,114
|
|
$
|
430
|
|
||||||||||||||
_______
|
*
|
+ = Favorable change; - = Unfavorable change; NM = A percentage calculation is not meaningful due to a change in signs, a zero-value denominator, or a percentage change greater than 200.
|
62
2015 vs. 2014
Service revenues
increased primarily due to additional revenues associated with a full year of ACMP operations in 2015, increased revenues associated with the start-up of operations at Gulfstar One during the fourth quarter of 2014, and an increase in Transco’s natural gas transportation fees due to new projects placed in service in 2014 and 2015. Revenues from operations associated with the ACMP Acquisition and the northeast region also increased due to higher volumes related to new well connects. A decrease in Canadian construction management revenues, reflecting a shift to internal customer construction projects, partially offset these increases.
Product sales
decreased due to a decrease in marketing revenues primarily associated with lower prices across all products, partially offset by higher non-ethane volumes, and a decrease in revenues from our equity NGLs reflecting lower NGL prices, partially offset by higher NGL volumes.
Product sales
also decreased due to a decrease in olefin sales related to our Canadian operations and our RGP Splitter. The Canadian decrease was primarily due to lower prices partially offset by higher propylene volumes. The RGP Splitter decrease was primarily due to lower propane sales reflecting lower per-unit prices and lower propylene sales. These decreases are partially offset by an increase in olefin sales primarily due to resuming our Geismar operations during 2015.
Product costs
decreased due to a decrease in marketing purchases primarily associated with lower per-unit costs, partially offset by higher non-ethane volumes, and a decrease in natural gas purchases associated with the production of equity NGLs primarily due to lower natural gas prices, partially offset by higher volumes.
Product costs
also decreased due to lower feedstock purchases in our Canadian operations primarily due to lower per-unit feedstock costs across all products as well as lower costs at our RGP Splitter driven by lower per-unit costs, partially offset by significantly higher volumes in 2015. These decreases are partially offset by an increase in olefin feedstock purchases primarily associated with resuming our Geismar operations.
Operating and maintenance expenses
increased primarily due to new expenses associated with operations acquired in the ACMP Acquisition, increased growth of operating activity in certain areas, increased maintenance and repair expenses, and the return to operations of the Geismar plant. These increases are partially offset by a decrease in Canadian construction management expenses that reflect a shift to internal customer construction projects.
Depreciation and amortization expenses
increased primarily due to new expenses associated with operations acquired in the ACMP Acquisition and from depreciation on new projects placed in service, including Gulfstar One and the Geismar expansion.
Selling, general, and administrative expenses
(SG&A)
increased primarily due to administrative expenses associated with operations acquired in the ACMP Acquisition, including $31 million higher ACMP merger and transition-related costs, partially offset by the absence of $16 million of acquisition costs incurred in 2014. In addition, 2015 includes $32 million of costs associated with our evaluation of strategic alternatives. These increases are partially offset by the absence of $18 million of project development costs incurred in 2014 related to the Bluegrass Pipeline reflecting 100 percent of such costs. The 50 percent noncontrolling interest share of these costs are presented in
Net income (loss) attributable to noncontrolling interests.
Impairment of goodwill
reflects a 2015 impairment charge associated with certain goodwill (see
Note 17 – Fair Value Measurements, Guarantees, and Concentration of Credit Risk
of Notes to Consolidated Financial Statements).
Net insurance recoveries – Geismar Incident
changed unfavorably primarily due to the receipt of $126 million of insurance recoveries in 2015 as compared to the receipt of $246 million of insurance recoveries in 2014. (See
Note 6 – Other Income and Expenses
of Notes to Consolidated Financial Statements.)
Other (income) expense – net
within
Operating income (loss)
changed
unfavorably primarily due to increased impairments in 2015, the absence of $154 million of cash proceeds received in 2014 related to a contingency settlement gain, and the absence of a $12 million net gain recognized in 2014 related to a partial acreage dedication release. (See
Note 6 – Other Income and Expenses
.)
Operating income (loss)
changed unfavorably primarily due to 2015 impairment of goodwill, higher impairments of certain assets, higher depreciation, operating, and maintenance expenses related to construction projects placed in
63
service and the start-up of the Geismar plant, $229 million lower NGL margins driven by lower prices, lower insurance recoveries related to the Geismar Incident, higher costs related to the merger and integration of ACMP into WPZ, and 2015 strategic alternative expenses. These decreases were partially offset by increased service revenues related to construction projects placed in service, $116 million higher olefin margins primarily due to our Geismar plant that returned to operations in 2015, and contributions from the operations acquired in the ACMP Acquisition.
Equity earnings (losses)
changed favorably primarily due to the absence of equity losses from Bluegrass Pipeline and Moss Lake in 2014 and due to contributions from investments acquired in the ACMP Acquisition. In addition, equity earnings at Discovery increased $76 million primarily related to the completion of the Keathley Canyon Connector in early 2015. These changes were partially offset by $33 million of losses associated with our share of impairments recognized at equity investees in 2015. (See
Note 5 – Investing Activities
of Notes to Consolidated Financial Statements.)
Gain on remeasurement of equity-method investment
reflects the 2014 gain recognized as a result of remeasuring to fair value the equity-method investment that we held before we acquired a controlling interest in ACMP. (See
Note 2 – Acquisitions
of Notes to Consolidated Financial Statements.)
Impairment of equity-method investments
reflects 2015 impairment charges associated with certain equity-method investments (see
Note 17 – Fair Value Measurements, Guarantees, and Concentration of Credit Risk
of Notes to Consolidated Financial Statements).
Other investing income (loss) – net
changed unfavorably primarily due to lower interest income associated with a receivable related to the sale of certain former Venezuela assets.
Interest expense
increased due to a $230 million increase in
Interest incurred
primarily due to new debt issuances in 2014 and 2015 and interest expense associated with debt assumed in conjunction with the ACMP Acquisition. This increase was partially offset by lower interest due to 2015 debt retirements and the absence of a $9 million ACMP Acquisition transaction-related financing fee incurred in the second quarter of 2014. In addition,
Interest capitalized
decreased $67 million primarily related to construction projects that have been placed into service. (See
Note 2 – Acquisitions
and
Note 14 – Debt, Banking Arrangements, and Leases
of Notes to Consolidated Financial Statements.)
Other income (expense) – net
below
Operating income
(loss)
changed favorably primarily due to a $43 million benefit related to an increase in allowance for equity funds used during construction (AFUDC) associated with an increase in spending on various Transco expansion projects and Constitution, a $14 million gain on early debt retirement in April 2015, and a $9 million contingency gain settlement.
Provision (benefit) for income taxes
changed favorably primarily due to lower pretax income in 2015. See
Note 7 – Provision (Benefit) for Income Taxes
of Notes to Consolidated Financial Statements for a discussion of the effective tax rates compared to the federal statutory rate for both years.
The favorable change in
Net income (loss) attributable to noncontrolling interests
related to our investment in WPZ is primarily due to lower operating results at WPZ, our increased percentage of limited partner ownership of WPZ, and the impact of increased income allocated to the WPZ general partner, held by us, associated with IDRs. These changes are partially offset by an unfavorable change related to our investment in Gulfstar One associated with its start up in 2014.
2014 vs. 2013
Service revenues
increased primarily due to contributions associated with the ACMP Acquisition beginning in third quarter 2014, including $167 million of minimum volume commitment fees, and due to new Canadian construction management services performed for third parties reported within the Other segment. Gathering fees increased driven by higher volumes and a net increase in gathering rates primarily in the Susquehanna Supply Hub. Natural gas transportation fee revenues increased primarily associated with expansion projects placed in service at Transco in 2013. In addition,
Service revenues
increased related to new processing, fractionation, and transportation fees from Ohio Valley Midstream facilities that were placed in service in 2013 and 2014.
64
Product sales
decreased primarily due to lower olefin sales volumes associated with the lack of production in 2014 as a result of the Geismar Incident, partially offset by an increase in olefin sales on the RGP splitter primarily associated with higher volumes. In addition, equity NGL sales decreased primarily reflecting lower non-ethane volumes, partially offset by higher average ethane per-unit sales prices. Crude oil, natural gas, and other marketing revenues decreased primarily related to lower volumes, while NGL marketing revenues increased primarily related to higher volumes partially offset by lower NGL prices.
Product costs
decreased primarily due to lower olefin feedstock purchases related to the lack of production in 2014 as a result of the Geismar Incident. In addition, natural gas purchases associated with the production of equity NGLs decreased slightly reflecting lower volumes, which were substantially offset by higher natural gas prices. These decreases were partially offset by an increase in lower-of-cost-or-market adjustments due to significant declines in NGL prices during the fourth quarter of 2014 and lower crude oil, natural gas, and olefin volumes, partially offset by higher NGL volumes.
Operating and maintenance expenses
increased primarily
due to costs incurred associated with new Canadian construction management services performed for third parties. In addition, increases are due to expenses associated with operations acquired in the ACMP Acquisition beginning in third quarter 2014, including $15 million of transition-related costs, expenses incurred in 2014 associated with the installation of certain safety equipment at the Geismar plant, and higher maintenance and growth in the our operations in the Northeast region of the U.S. These increases were partially offset by a net increase in system gains and reduced gathering fuel expense in the western region operations.
Depreciation and amortization expenses
increased primarily associated with assets acquired in the ACMP Acquisition beginning in third quarter 2014 and due to depreciation on new projects placed in service.
SG&A
increased primarily due to operations acquired in the ACMP Acquisition beginning in third quarter 2014 including $52 million of acquisition, merger, and transition-related costs recognized in 2014, as well as $18 million of project development costs incurred in 2014 related to the Bluegrass Pipeline reflecting 100 percent of such costs. The 50 percent noncontrolling interest share of these costs are presented in
Net income (loss) attributable to noncontrolling interests
. In addition,
SG&A
increased in the Northeast region of the U.S. related to significant operational growth driven by higher gathering fees associated with higher volumes from new well connections and the completion of various compression projects.
The favorable change in
Net insurance recoveries – Geismar Incident
is primarily due to the receipt of $246 million of insurance recoveries in 2014, compared to the receipt of $50 million of insurance recoveries in 2013.
Other (income) expense – net
within
Operating income (loss)
includes the following increases to net income:
|
•
|
$154 million of cash proceeds received in 2014 related to a contingency settlement gain;
|
|
•
|
The absence of a $25 million accrued loss recognized in 2013 associated with a producer claim against us;
|
|
•
|
The absence of a $20 million write-off in 2013 for certain pipeline assets;
|
|
•
|
The absence of $12 million of expense recognized in 2013 and $3 million of expense reversal in 2014, related to the portion of the Eminence abandonment regulatory asset that will not be recovered in rates;
|
|
•
|
A $12 million net gain recognized in 2014 related to the settlement of a partial acreage dedication release.
|
Other (income) expense – net
within
Operating income (loss)
includes the following decreases to net income:
|
•
|
$52 million of impairment charges recognized in 2014 related to certain assets;
|
|
•
|
The absence of $16 million of income from insurance recoveries in 2013 related to the abandonment of certain Eminence storage assets;
|
|
•
|
$10 million loss on the sale of certain assets in 2014;
|
|
•
|
$9 million of expenses in excess of the insurable limit associated with the Geismar Incident;
|
65
|
•
|
A $9 million increase in expenses associated with a regulatory liability for certain employee costs;
|
|
•
|
The absence of a $9 million involuntary conversion gain recognized in 2013 related to a 2012 furnace fire at our Geismar olefins plant.
|
Operating income (loss)
changed favorably primarily due to increased service revenues at Williams Partners associated with higher gathering volumes and new assets placed in service, a $192 million increase in net insurance recoveries related to the Geismar Incident, $167 million of minimum volume commitment fee revenue at Williams Partners related to operations acquired in the ACMP Acquisition, and $154 million of cash proceeds in 2014 related to a contingency gain settlement. These increases are partially offset by $192 million lower olefin margins, $130 million lower NGL margins and $59 million lower marketing margins, as well as higher operating costs at Williams Partners and higher impairment charges recognized in 2014.
Equity earnings (losses)
changed favorably primarily due to the recognition of $96 million of equity earnings in the second half of 2014 related to equity investments acquired in the ACMP Acquisition, and an increase in equity earnings from Caiman II and Laurel Mountain. These increases are partially offset by $78 million of equity losses from Bluegrass Pipeline and Moss Lake in 2014 related primarily to the underlying write-off of previously capitalized project development costs, $19 million of equity losses associated with acquisition-related compensation expenses resulting from the ACMP Acquisition, and $17 million lower equity earnings related to our equity-method investment in ACMP since we consolidate this investment as of July 1, 2014.
Gain on remeasurement of equity-method investment
represents the gain we recognized as a result of remeasuring to fair value the equity-method investment that we held before we acquired a controlling interest in ACMP.
Other investing income (loss) – net
changed unfavorably primarily due to $26 million lower gains resulting from ACMP’s equity issuances prior to our consolidation of that entity beginning in third quarter 2014 and lower interest income.
Interest expense
increased due to a $277 million increase in
Interest incurred
primarily due to new debt issuances in the fourth quarter of 2013 and the first half of 2014, as well as combining ACMP’s debt in third quarter 2014, and $9 million of ACMP Acquisition-related financing costs incurred in 2014. The increase in
Interest incurred
is partially offset by an increase of $40 million in
Interest capitalized
related to construction projects in progress.
Other income (expense) – net
changed favorably primarily due to the benefit from the equity AFUDC associated with ongoing capital projects within our regulated operations.
Provision (benefit) for income taxes
changed unfavorably primarily due to higher pretax income in 2014. This is partially offset by the absence of $99 million deferred income tax expense recognized in 2013, and a benefit of $34 million recorded in 2014 related to the undistributed earnings of certain foreign operations that are no longer considered permanently reinvested. See
Note 7 – Provision (Benefit) for Income Taxes
of Notes to Consolidated Financial Statements for a discussion of the effective tax rates compared to the federal statutory rate for both years.
Income (loss) from discontinued operations
changed favorably primarily due to the absence of a $15 million pretax charge resulting from an unfavorable ruling associated with our former Alaska refinery related to the Trans-Alaska Pipeline System Quality Bank in 2013.
The favorable change in
Net income attributable to noncontrolling interests
includes the following:
|
•
|
$95 million favorable for our investment in WPZ primarily due to the impact of increased income allocated to the WPZ general partner associated with IDRs;
|
|
•
|
$9 million favorable for our investment in Bluegrass Pipeline that includes our partner’s 50 percent share of project development costs expensed by Bluegrass Pipeline during the portion of the first quarter of 2014 that Bluegrass Pipeline was consolidated;
|
|
•
|
$71 million unfavorable for our investment in ACMP due to the consolidation of ACMP in third quarter 2014;
|
66
|
•
|
$13 million unfavorable for our investment in Cardinal resulting from the consolidation of ACMP in third quarter 2014.
|
Year-Over-Year Operating Results - Segments
We evaluate segment operating performance based upon
Modified EBITDA
.
Note 19 – Segment Disclosures
of Notes to Consolidated Financial Statements includes a reconciliation of this non-GAAP measure to
Net income (loss)
. Management uses
Modified EBITDA
because it is an accepted financial indicator used by investors to compare company performance. In addition, management believes that this measure provides investors an enhanced perspective of the operating performance of our assets.
Modified EBITDA
should not be considered in isolation or as a substitute for a measure of performance prepared in accordance with GAAP.
Year-Over-Year Operating Results – Segments
Williams Partners
|
|
Years Ended December 31,
|
||||||||||
|
|
2015
|
2014
|
2013
|
||||||||
|
|
(Millions)
|
||||||||||
|
Service revenues
|
$
|
5,135
|
|
$
|
3,888
|
|
$
|
2,914
|
|
||
|
Product sales
|
2,196
|
|
$
|
3,521
|
|
3,921
|
|
||||
|
Segment revenues
|
7,331
|
|
$
|
7,409
|
|
$
|
6,835
|
|
|||
|
Product costs
|
(1,779
|
)
|
(3,016
|
)
|
(3,027
|
)
|
|||||
|
Other segment costs and expenses
|
(2,374
|
)
|
(1,812
|
)
|
(1,610
|
)
|
|||||
|
Net insurance recoveries – Geismar Incident
|
126
|
|
232
|
|
40
|
|
|||||
|
Proportional Modified EBITDA of equity-method investments
|
699
|
|
431
|
|
209
|
|
|||||
|
Williams Partners Modified EBITDA
|
$
|
4,003
|
|
$
|
3,244
|
|
$
|
2,447
|
|
||
|
NGL margin
|
$
|
159
|
|
$
|
388
|
|
$
|
518
|
|
||
|
Olefin margin
|
226
|
|
110
|
|
302
|
|
|||||
2015
vs.
2014
Modified EBITDA
increased primarily due to the acquisition of ACMP during the third quarter of 2014 and increased fee revenue associated with contributions from new and expanded facilities, including Gulfstar One during the fourth quarter 2014, in addition to resuming our Geismar operations and contributions related to the completion of the Keathley Canyon Connector at Discovery. Partially offsetting these increases to
Modified EBITDA
is a decrease in NGL margins as a result of a significant decline in commodity prices beginning in the fourth quarter of 2014 and lower insurance recoveries related to the Geismar Incident.
The increase in
Service revenues
is primarily due to $810 million additional revenues associated with a full year of ACMP operations in 2015 which includes a $72 million increase in the minimum volume commitment fees, $223 million in increased revenues associated with the start-up of operations at Gulfstar One during the fourth quarter of 2014, and a $155 million increase in Transco’s natural gas transportation fees due to new projects placed in service in 2015 and 2014. Additionally, service revenues reflect higher fees associated with increased volumes and additional contributions in the Northeast. Higher revenues in the Northeast include expanded gathering operations and processing, fractionation and transportation operations, contributing $59 million and $27 million of additional fees, respectively.
The decrease in
Product sales
includes:
|
•
|
A $1,173 million decrease in marketing revenues primarily associated with lower prices across all products, partially offset by higher non-ethane volumes (more than offset in marketing purchases).
|
67
|
•
|
A $324 million decrease in revenues from our equity NGLs reflecting a decrease of $365 million due to lower NGL prices, partially offset by a $41 million increase associated with higher NGL volumes.
|
|
•
|
A $41 million decrease in revenues primarily due to lower condensate prices.
|
|
•
|
A $214 million increase in olefin sales primarily due to $298 million in higher sales from our Geismar plant that returned to operation, partially offset by a $58 million decrease from our Canadian operations and a $26 million decrease from our RGP Splitter. The decrease in Canada is comprised of $68 million in lower prices, partially offset by $10 million associated with higher propylene volumes. The lower prices reflect a 53 percent per-unit decrease in propylene prices and a 39 percent per-unit decrease in alky feedstock prices. The decrease in sales at our RGP Splitter is caused by $15 million in lower propane sales reflecting 56 percent lower per-unit prices and $11 million in lower propylene sales reflecting 47 percent lower per-unit prices, partially offset by favorable volumes.
|
The decrease in
Product costs
includes:
|
•
|
A $1,219 million decrease in marketing purchases primarily due to a decrease in non-ethane per-unit cost (substantial offset in marketing revenues).
|
|
•
|
A $95 million decrease in the natural gas purchases associated with the production of equity NGLs reflecting a decrease of $127 million due to lower natural gas prices, partially offset by a $31 increase associated with higher volumes.
|
|
•
|
A $20 million decrease in costs primarily due to lower gas prices.
|
|
•
|
A $98 million increase in olefin feedstock purchases is comprised of $127 million in higher purchases due to increased volumes at our Geismar plant as it returned to operation, partially offset by $16 million in lower olefin feedstock purchases in our Canadian operations primarily due to lower per-unit feedstock costs across all products and $13 million in lower costs at our RGP Splitter driven by lower per-unit costs, partially offset by significantly higher volumes in 2015. During 2014, the splitter was running at reduced volumes because a third-party storage facility was down during the first quarter and transportation was limited due to the Geismar Incident.
|
The increase in
Other segment costs and expenses
includes:
|
•
|
An increase for new expenses associated with operations acquired in the ACMP Acquisition.
|
|
•
|
The absence of $154 million of cash received in the fourth quarter of 2014 associated with the resolution of a contingent gain related to claims arising from the purchase of a business in a prior period (see
Note 6 – Other Income and Expenses
of Notes to Consolidated Financial Statements).
|
|
•
|
A $94 million impairment charge associated with previously capitalized project development costs for a gas processing plant.
|
|
•
|
A $16 million increase in operating expense due to the Geismar plant returning to operation in 2015.
|
|
•
|
The absence of a $12 million net gain recognized in 2014 related to a partial acreage dedication release.
|
The decrease in
Net insurance recoveries - Geismar Incident
is primarily due to the 2015 receipt of $126 million of insurance proceeds compared to $246 million received in 2014, partially offset by the absence of covered insurable expenses in excess of our retentions (deductibles) related to the Geismar Incident in 2015 compared to $14 million in 2014.
The increase in
Proportional Modified EBITDA of equity-method investments
is primarily due to a full year contribution of $160 million from investments acquired in the ACMP Acquisition and a $103 million increase from
68
Discovery associated with higher fee revenues attributable to the completion of the Keathley Canyon Connector in the first quarter of 2015. Additionally, Caiman II increased $21 million resulting from assets placed into service in 2014 and 2015, partially offset by the absence of business interruption insurance proceeds received in the prior year, and an $11 million decrease at Laurel Mountain. The decrease at Laurel Mountain was primarily due to $13 million of impairments and lower gathering fees due to lower gathering rates indexed to natural gas prices, partially offset by 24 percent higher volumes and an increase in our ownership percentage compared to the prior year.
2014
vs.
2013
Modified EBITDA
increased primarily due to the acquisition of ACMP during the third quarter of 2014, increased fee revenue associated with contributions from new and expanded facilities, higher insurance recoveries related to the Geismar Incident, and a favorable settlement. Partially offsetting these increases to
Modified EBITDA
are lower margins as a result of a significant decline in commodity prices beginning in the fourth quarter of 2014 and higher impairment charges related to certain materials and equipment.
The increase in
Service revenues
is primarily due to a $781 million of increased service revenues associated with operations acquired in the ACMP Acquisition beginning in the third quarter 2014, including $167 million of MVC fees. Additionally, service revenues reflect $88 million higher fee-based revenues resulting from higher gathering volumes driven by new well connections, the completion of various compression projects, and a net increase in gathering rates associated with customer contract modifications primarily in the Susquehanna Supply Hub of the Northeast region. Fee-based revenues also increased $22 million due to contributions from our Ohio Valley Midstream business resulting from the addition of processing, fractionation and transportation facilities placed in service in 2013 and 2014. In addition, natural gas transportation revenues increased $71 million primarily from expansion projects placed into service in 2013 for Transco and $19 million in new service fees associated with the start-up of our Gulfstar One assets.
The decrease in
Product sales
includes:
|
•
|
A $251 million decrease in olefin sales primarily associated with a $295 million decrease due to lower volumes related to the lack of production in 2014 as a result of the Geismar Incident, partially offset by a $42 million increase in revenues from our RGP Splitter associated with a $32 million increase in volumes due to a third-party storage facility resuming operations during 2014, and a $10 million increase due to higher per-unit sales prices (substantially offset in
Product costs
).
|
|
•
|
A $132 million decrease in revenues from our equity NGLs primarily reflecting a decrease of $161 million due to lower non-ethane volumes, partially offset by a $29 million increase associated with higher average ethane per-unit sales prices. Equity non-ethane sales volumes are 22 percent lower primarily due to a customer contract that expired in September 2013.
|
|
•
|
A $26 million decrease in marketing revenues primarily associated with lower crude oil volumes and prices, and lower non-ethane prices, partially offset by increased non-ethane volumes.
|
The decrease in
Product costs
includes:
|
•
|
A $59 million decrease in olefin feedstock purchases primarily associated with a $99 million decrease due to lower volumes related to the lack of production in 2014 as a result of the Geismar Incident. Offsetting this decrease is a $36 million increase from our RGP Splitter facility attributable to a $30 million increase in volumes due to a third-party storage facility resuming operations during 2014 and a $6 million increase in per-unit costs (more than offset in
Product sales
).
|
|
•
|
A $2 million decrease in natural gas purchases associated with the production of equity NGLs reflecting $87 million associated with lower volumes, which were substantially offset by an $85 million increase associated with higher natural gas prices.
|
69
|
•
|
A $33 million increase in marketing purchases primarily due to increased NGL volumes and lower-of-cost-or-market (LCM) inventory adjustments associated with significant declines in NGL prices during the fourth quarter of 2014.
|
The increase in
Other segment costs and expenses
includes:
|
•
|
A $293 million increase in expenses associated with operations acquired in the ACMP Acquisition. These expenses include
Operating and maintenance expenses
and
Selling, general and administrative expenses
(SG&A).
|
|
•
|
A $24 million increase in
SG&A due to higher legal and arbitration costs, consulting expenses and employee costs.
|
|
•
|
A $95 million favorable change in
Other (income) expense – net
primarily due to $154 million settlement arising from the resolution of a contingent gain related to claims associated with the purchase of a business in a prior period and the absence of a $25 million accrued loss recognized in 2013 associated with a producer claim against us. Partially offsetting these gains are $52 million of impairment charges recognized in 2014 related to certain materials and equipment, a $10 million loss related to the sale of certain assets and a $9 million increase in expenses associated with a regulatory liability for certain employee costs.
|
|
•
|
A $13 million benefit related to an increase in equity AFUDC due to higher spending on Constitution and various Transco expansion projects.
|
The increase in
Net insurance recoveries - Geismar Incident
is primarily due to the 2014 receipt of $246 million of insurance proceeds compared to $50 million received in 2013, partially offset by $4 million higher covered insurable expenses in excess of our retentions (deductibles) related to the Geismar Incident in 2014 compared to 2013.
The increase in
Proportional Modified EBITDA of equity-method investments
is primarily due to a $178 million contribution during the second half of 2014 from investments acquired in the ACMP Acquisition. Additionally, Caiman II increased $25 million resulting from assets placed into service in 2014, business interruption insurance proceeds received in 2014 and a higher ownership percentage. Laurel Mountain also increased $12 million due to the absence of certain 2013 write-offs, increased gathering volumes and increased ownership.
Williams NGL & Petchem Services
|
|
Years Ended December 31,
|
||||||||||
|
|
2015
|
2014
|
2013
|
||||||||
|
|
(Millions)
|
||||||||||
|
Service revenues
|
$
|
2
|
|
$
|
—
|
|
$
|
—
|
|
||
|
Segment costs and expenses
|
(85
|
)
|
(37
|
)
|
(33
|
)
|
|||||
|
Proportional Modified EBITDA of equity-method investments
|
—
|
|
(78
|
)
|
—
|
|
|||||
|
Williams NGL & Petchem Services Modified EBITDA
|
$
|
(83
|
)
|
$
|
(115
|
)
|
$
|
(33
|
)
|
||
2015 vs. 2014
The favorable change in
Modified EBITDA
is primarily due to the absence of our share of the 2014 write-off of previously capitalized project development costs at Bluegrass Pipeline and Moss Lake, as well as costs incurred in 2014 relating to the development of the Bluegrass Pipeline, partially offset by the 2015 write-off of previously capitalized project development costs for an olefins pipeline project.
Segment costs and expenses
increased primarily due to the $64 million write-off of previously capitalized project development costs for an olefins pipeline project in 2015, partially offset by the absence of $18 million of project development costs incurred in 2014 relating to the Bluegrass Pipeline.
70
The favorable change in
Proportional Modified EBITDA of equity-method investments
is primarily due to the absence of our share of the 2014 write-off of previously capitalized project development costs at Bluegrass Pipeline and Moss Lake.
2014 vs. 2013
The unfavorable change in
Modified EBITDA
is primarily due to our share of the 2014 write-off of previously capitalized project development costs at Bluegrass Pipeline and Moss Lake, as well as costs incurred in 2014 relating to the development of the Bluegrass Pipeline, partially offset by the absence of a 2013 write-off of an abandoned project.
Segment costs and expenses
increased primarily due to higher expensed costs related to development projects. We expensed $18 million of project development costs during 2014 related to Bluegrass Pipeline. These higher expenses were substantially offset by the absence of a $20 million write-off of an abandoned project during 2013.
The unfavorable change in
Proportional Modified EBITDA of equity-method investments
is due to losses from Bluegrass Pipeline and Moss Lake related primarily to the underlying write-off of previously capitalized project development costs in 2014.
Other
|
|
Years Ended December 31,
|
||||||||||
|
|
2015
|
2014
|
2013
|
||||||||
|
|
(Millions)
|
||||||||||
|
Other Modifed EBITDA
|
$
|
(29
|
)
|
$
|
103
|
|
$
|
197
|
|
||
2015 vs. 2014
Modified EBITDA
decreased significantly as the results from the businesses acquired in the ACMP Acquisition are presented within Williams Partners for periods subsequent to the July 1, 2014, acquisition. Other included the proportional
Modified EBITDA
of $104 million of our former equity-method investment in ACMP for the first half of 2014, which was partially offset by $19 million associated with our share of compensation costs triggered by the ACMP Acquisition recognized in July 2014.
Modified EBITDA
also decreased by $30 million related to costs incurred in 2015 related to evaluating our strategic alternatives and the Merger Agreement with Energy Transfer, as well as $24 million of higher costs associated with integration and re-alignment of resources following the ACMP Acquisition and Merger. These decreases are partially offset by a $9 million contingency gain settlement recognized in fourth quarter 2015.
2014 vs. 2013
Modified EBITDA
decreased significantly as the results from our former equity-method investment in ACMP are included in Other for the first half of 2014, while 2013 included a full year of results.
Modified EBITDA
also decreased related to $19 million of our share of compensation costs triggered by the ACMP Acquisition incurred in 2014, as previously discussed, and integration and re-alignment of resources following the ACMP Acquisition. These decreases are partially offset by lower expenses incurred related to benefits and higher benefit from the allowance for equity funds used for construction associated with capital projects within our regulated operations.
71
Management’s Discussion and Analysis of Financial Condition and Liquidity
Overview
In 2015, we continued to focus upon both growth in our businesses through disciplined investment and growth in our per-share dividends. Examples of this growth included:
|
•
|
Expansion of WPZ’s interstate natural gas pipeline system through projects such as Leidy Southeast and Virginia Southside to meet the demand of growth markets;
|
|
•
|
WPZ’s acquisitions of a gathering system in the Eagle Ford shale and an additional 13 percent interest in its equity-method investment in UEOM;
|
|
•
|
WPZ’s commissioning of the Bucking Horse gas processing facility joint venture in the Powder River basin Niobrara Shale;
|
|
•
|
Total per-share dividends grew 25 percent to
$2.45
in 2015 compared to
$1.9575
in 2014.
|
This growth was funded through cash flow from operations, distributions from WPZ, and additional net borrowings at WPZ.
Outlook
We continue to transition to an overall business mix that is increasingly fee-based. Although our cash flows are impacted by fluctuations in energy commodity prices, that impact is somewhat mitigated by certain of our cash flow streams that are not directly impacted by short-term commodity price movements, including:
|
•
|
Firm demand and capacity reservation transportation revenues under long-term contracts;
|
|
•
|
Fee-based revenues from certain gathering and processing services.
|
However, we are indirectly exposed to longer duration depressed energy commodity prices and the related impact on drilling activities and volumes available for gathering and processing services.
We believe we have, or have access to, the financial resources and liquidity necessary to meet our requirements for working capital, capital and investment expenditures, dividends and distributions, debt service payments, and tax payments, while maintaining a sufficient level of liquidity. In particular, we note that our expected growth capital and investment expenditures total approximately $2.2 billion in 2016, down approximately $1.5 billion from previous plans. Approximately $1.3 billion of our growth capital funding needs include Transco expansions and other interstate pipeline growth projects, most of which are fully contracted with firm transportation agreements. The remaining growth capital and investment expenditures primarily reflect investments in gathering and processing systems limited to known new producer volumes, including wells drilled and completed awaiting connecting infrastructure. We also remain committed to projects that maintain our assets for safe and reliable operations, as well as projects that meet legal, regulatory, and/or contractual commitments. We retain the flexibility to adjust planned levels of capital and investment expenditures in response to changes in economic conditions or business opportunities. In addition, we expect proceeds from planned asset monetizations in excess of $1 billion during 2016.
Liquidity
Based on our forecasted levels of cash flow from operations and other sources of liquidity, we expect to have sufficient liquidity to manage our businesses in 2016. Our internal and external sources of consolidated liquidity to fund working capital requirements, capital and investment expenditures, debt service payments, dividends and distributions, and tax payments include:
|
•
|
Cash and cash equivalents on hand;
|
72
|
•
|
Cash generated from operations, including cash distributions from WPZ and our equity-method investees based on our level of ownership and incentive distribution rights;
|
|
•
|
Cash proceeds from issuances of debt and/or equity securities;
|
|
•
|
Use of our credit facility.
|
WPZ is expected to fund its cash needs through its cash flows from operations and its credit facilities and/or commercial paper program, Transco’s recent debt issuance described further below, and planned asset monetizations as previously mentioned. WPZ does not plan to issue public equity or public debt in 2016. We anticipate the more significant uses of cash to be:
|
•
|
Maintenance and expansion capital and investment expenditures;
|
|
•
|
Interest on long-term debt;
|
|
•
|
Repayment of current debt maturities;
|
|
•
|
Quarterly dividends and distributions.
|
Potential risks associated with our planned levels of liquidity and the planned capital and investment expenditures discussed above include those previously discussed in Company Outlook
.
As of December 31, 2015, we had a working capital deficit (current liabilities, inclusive of commercial paper outstanding and long-term debt due within one year, in excess of current assets) of
$970 million
. Excluding the impact of the
$499 million
in commercial paper outstanding, which we consider to be a reduction of WPZ’s credit facility capacity as noted in the table below, our working capital deficit is
$471 million
. Our available liquidity is as follows:
|
|
December 31, 2015
|
|||||||||||
|
Available Liquidity
|
WPZ
|
WMB
|
Total
|
|||||||||
|
|
(Millions)
|
|||||||||||
|
Cash and cash equivalents
|
$
|
96
|
|
$
|
4
|
|
$
|
100
|
|
|||
|
Capacity available under our $1.5 billion credit facility (1)
|
850
|
|
850
|
|
||||||||
|
Capacity available to WPZ under its $3.5 billion credit facility less amounts outstanding under its $3 billion commercial paper program (2)
|
1,691
|
|
1,691
|
|
||||||||
|
Capacity available to WPZ under its short-term credit facility (3)
|
150
|
|
150
|
|
||||||||
|
$
|
1,937
|
|
$
|
854
|
|
$
|
2,791
|
|
||||
__________
|
(1)
|
The highest amount outstanding under our credit facility during 2015 was $675 million. At
December 31, 2015
, we were in compliance with the financial covenants associated with this credit facility. See
Note 14 – Debt, Banking Arrangements, and Leases
of Notes to Consolidated Financial Statements for additional information on our credit facility. Borrowing capacity available under this facility as of February 25, 2016, was $1.025 billion.
|
|
(2)
|
In managing our available liquidity, we do not expect a maximum outstanding amount in excess of the capacity of WPZ’s credit facility inclusive of any outstanding amounts under its commercial paper program. WPZ has
$499 million
of
commercial paper
outstanding at
December 31, 2015
. The highest amount outstanding under WPZ’s commercial paper program and credit facility during 2015 was $3.1 billion. At
December 31, 2015
, WPZ was in compliance with the financial covenants associated with this credit facility and the commercial paper program. See
Note 14 – Debt, Banking Arrangements, and Leases
of Notes to Consolidated Financial Statements for additional information on WPZ’s credit facility and WPZ’s commercial paper program. Borrowing capacity available under this facility as of February 25, 2016, was $2.507 billion.
|
73
|
(3)
|
See
Note 14 – Debt, Banking Arrangements, and Leases
of Notes to Consolidated Financial Statements for additional information on WPZ’s short-term credit facility entered into August 26, 2015, and amended December 23, 2015. Borrowing capacity available under this facility as of February 25, 2016, was $150 million.
|
On September 24, 2015, WPZ received a special distribution of $396 million from Gulfstream reflecting its proportional share of the proceeds from new debt issued by Gulfstream. The new debt was issued to refinance Gulfstream’s debt maturities. Subsequently, WPZ contributed $248 million to Gulfstream for its proportional share of amounts necessary to fund debt maturities of $500 million due on November 1, 2015. WPZ also expects to contribute its proportional share of amounts necessary to fund debt maturities of $300 million due on June 1, 2016.
As described in
Note 14 – Debt, Banking Arrangements, and Leases
of Notes to Consolidated Financial Statements, we have determined that we have net assets that are technically considered restricted in accordance with Rule 4-08(e) of Regulation S-X of the Securities and Exchange Commission in excess of 25 percent of our consolidated net assets. We do not expect this determination will impact our ability to pay dividends or meet future obligations as the terms of WPZ’s partnership agreement require it to make quarterly distributions of all available cash, as defined, to its unitholders.
WPZ Incentive Distribution Rights
Our ownership interest in WPZ includes the right to incentive distributions determined in accordance with WPZ’s partnership agreement. We have agreed to temporarily waive incentive distributions of approximately $2 million per quarter in connection with WPZ’s acquisition of an approximate 13 percent additional interest in UEOM on June 10, 2015. The waiver will continue through the quarter ending September 30, 2017.
We are required to pay a $428 million termination fee to WPZ, associated with the Termination Agreement (as described in
Note 1 – General, Description of Business, Basis of Presentation, and Summary of Significant Accounting Policies
of Notes to Consolidated Financial Statements), which will settle through a reduction of quarterly incentive distributions we are entitled to receive from WPZ (such reduction not to exceed $209 million per quarter). The November 2015 and February 2016 distributions from WPZ were each reduced by $209 million related to this termination fee.
Debt Issuances and Retirements
On January 22, 2016, Transco issued $1 billion of 7.85 percent senior unsecured notes due 2026 to investors in a private debt placement. Transco intends to use the net proceeds from the offering to repay debt and to fund capital expenditures.
In December 2015, WPZ borrowed $850 million on a variable interest rate loan with certain lenders due 2018. WPZ used the proceeds for working capital, capital expenditures, and for general partnership purposes.
On April 15, 2015, WPZ paid $783 million, including a redemption premium, to retire $750 million of 5.875 percent senior notes due 2021.
On March 3, 2015, WPZ completed a public offering of $1.25 billion of 3.6 percent senior unsecured notes due 2022, $750 million of 4 percent senior unsecured notes due 2025, and $1 billion of 5.1 percent senior unsecured notes due 2045. WPZ used the net proceeds to repay amounts outstanding under its commercial paper program and credit facility, to fund capital expenditures, and for general partnership purposes.
WPZ retired $750 million of 3.8 percent senior unsecured notes that matured on February 15, 2015.
On June 27, 2014, Pre-merger WPZ completed a public offering of $750 million of 3.9 percent senior unsecured notes due 2025 and $500 million of 4.9 percent senior unsecured notes due 2045. Pre-merger WPZ used the net proceeds to repay amounts outstanding under our commercial paper program, to fund capital expenditures, and for general partnership purposes.
On June 24, 2014, we completed a public offering of $1.25 billion of 4.55 percent senior unsecured notes due 2024 and $650 million of 5.75 percent unsecured notes due 2044. We used the net proceeds to finance a portion of the ACMP Acquisition.
74
On March 4, 2014, Pre-merger WPZ completed a public offering of $1 billion of 4.3 percent senior unsecured notes due 2024 and $500 million of 5.4 percent senior unsecured notes due 2044. Pre-merger WPZ used the net proceeds to repay amounts outstanding under our commercial paper program, to fund capital expenditures, and for general partnership purposes.
Equity Offering
On June 23, 2014, we issued 61 million shares of common stock in a public offering at a price of $57.00 per share. That amount includes 8 million shares purchased pursuant to the full exercise of the underwriter’s option to purchase additional shares. The net proceeds of $3.378 billion were used to finance a portion of the ACMP Acquisition.
Shelf Registrations
On May 11, 2015, we filed a shelf registration statement, as a well-known seasoned issuer.
On February 25, 2015, WPZ filed a shelf registration statement, as a well-known seasoned issuer and WPZ also filed a shelf registration statement for the offer and sale from time to time of common units representing limited partner interests in WPZ having an aggregate offering price of up to $1 billion. These sales will be made over a period of time and from time to time in transactions at prices which are market prices prevailing at the time of sale, prices related to market price or at negotiated prices. Such sales will be made pursuant to an equity distribution agreement between WPZ and certain banks who may act as sales agents or purchase for its own accounts as principals. During 2015, 1,790,840 common units were issued under this registration. The net proceeds of $59 million were used for general partnership purposes.
Distributions from Equity-Method Investees
The organizational documents of entities in which we have an equity-method interest generally require distribution of their available cash to their members on a quarterly basis. In each case, available cash is reduced, in part, by reserves appropriate for operating their respective businesses. See
Note 5 – Investing Activities
of Notes to Consolidated Financial Statements for our more significant equity-method investees.
Credit Ratings
Our ability to borrow money is impacted by our credit ratings and the credit ratings of WPZ. The current ratings are as follows:
|
Rating Agency
|
Outlook
|
Senior Unsecured
Debt Rating
|
Corporate
Credit Rating
|
||||
|
WMB:
|
Standard & Poor’s
|
Stable
|
BB
|
BB
|
|||
|
Moody’s Investors Service
|
Ratings Under Review For Downgrade
|
Ba1
|
N/A
|
||||
|
Fitch Ratings
|
Rating Watch Negative
|
BB+
|
N/A
|
||||
|
WPZ:
|
Standard & Poor’s
|
Negative
|
BBB-
|
BBB-
|
|||
|
Moody’s Investors Service
|
Negative
|
Baa3
|
N/A
|
||||
|
Fitch Ratings
|
Stable
|
BBB-
|
N/A
|
||||
During January 2016 Moody’s Investors Service and Fitch Ratings downgraded the rating for WMB below investment grade and Standard & Poor’s revised the WMB outlook. As a result, WMB’s future cost of borrowings could increase. As of
December 31, 2015
, we estimate that we could be required to provide up to $235 million in additional collateral of either cash or letters of credit with third parties under existing contracts. At the present time, we have not provided any additional collateral to third parties but no assurance can be given that we will not be requested to provide collateral in the future. The credit ratings agencies lowered the ratings of WPZ in December 2015 and in January 2016, and Standard & Poor’s and Fitch Ratings revised the WPZ outlook. In February 2016, Standard & Poor’s affirmed WPZ’s ratings and revised WPZ’s outlook. WPZ maintains investment grade ratings. As of
December 31,
75
2015
, we estimate that a downgrade to a rating below investment grade for WPZ could require it to provide up to $271 million in additional collateral with third parties.
Sources (Uses) of Cash
|
|
Years Ended December 31,
|
||||||||||
|
|
2015
|
2014
|
2013
|
||||||||
|
|
(Millions)
|
||||||||||
|
Net cash provided (used) by:
|
|||||||||||
|
Operating activities
|
$
|
2,678
|
|
$
|
2,115
|
|
$
|
2,217
|
|
||
|
Financing activities
|
481
|
|
7,601
|
|
1,677
|
|
|||||
|
Investing activities
|
(3,299
|
)
|
(10,157
|
)
|
(4,052
|
)
|
|||||
|
Increase (decrease) in cash and cash equivalents
|
$
|
(140
|
)
|
$
|
(441
|
)
|
$
|
(158
|
)
|
||
Operating activities
The factors that determine operating activities are largely the same as those that affect
Net income (loss)
, with the exception of noncash items such as
Impairment of goodwill
,
Gain on remeasurement of equity-method investment
,
Impairment of equity-method investments
,
Depreciation and amortization
,
and
Provision (benefit) for deferred income taxes
.
Our
Net cash provided (used) by operating activities
in 2015 increased from 2014 primarily due to the impact of net favorable changes in operating working capital and the absence of contributions from ACMP for the first six months of 2014.
Our
Net cash provided (used) by operating activities
in 2014 decreased from 2013 primarily due to the impact of net unfavorable changes in operating working capital, lower olefins production margins, and increased interest payments on debt. These changes were partially offset by proceeds from insurance recoveries on the Geismar Incident, proceeds from a contingency settlement in 2014, and contributions from consolidating ACMP for the second half of 2014.
Financing activities
Significant transactions include:
2015
|
•
|
$306 million
of net payments of WPZ’s commercial paper;
|
|
•
|
$3.842 billion net received from WPZ’s debt offerings;
|
|
•
|
$1.533 billion paid on WPZ’s debt retirements;
|
|
•
|
$2.097 billion received from our credit facility borrowings;
|
|
•
|
$1.817 billion paid on our credit facility borrowings;
|
|
•
|
$3.832 billion received from WPZ’s credit facility borrowings;
|
|
•
|
$3.162 billion paid on WPZ’s credit facility borrowings;
|
|
•
|
$1.836 billion
paid for quarterly dividends on common stock;
|
|
•
|
$942 million
paid for dividends and distributions to noncontrolling interests;
|
|
•
|
$111 million
received in contributions from noncontrolling interests;
|
|
•
|
$396 million
special distribution from Gulfstream;
|
76
|
•
|
$248 million
contribution to Gulfstream for repayment of debt.
|
2014
|
•
|
$572 million
net proceeds received from WPZ’s commercial paper issuances;
|
|
•
|
$1.895 billion net received from our debt offerings;
|
|
•
|
$2.74 billion net proceeds received from WPZ’s debt offerings;
|
|
•
|
$670 million paid on our credit facility borrowings;
|
|
•
|
$1.040 billion received from our credit facility borrowings;
|
|
•
|
$1.646 billion received from WPZ’s credit facility borrowings;
|
|
•
|
$1.156 billion paid on WPZ’s credit facility borrowings;
|
|
•
|
$3.416 billion
received from our equity offerings;
|
|
•
|
$1.412 billion
paid for quarterly dividends on common stock;
|
|
•
|
$840 million
paid for dividends and distributions to noncontrolling interests;
|
|
•
|
$340 million
received in contributions from noncontrolling interests.
|
2013
|
•
|
$224 million
net proceeds received from WPZ’s commercial paper issuances;
|
|
•
|
$994 million net proceeds received from WPZ’s November 2013 public offering of $600 million of 4.5 percent senior unsecured notes due 2023 and $400 million of 5.8 percent senior unsecured notes due 2043;
|
|
•
|
$1.705 billion received from WPZ’s credit facility borrowings;
|
|
•
|
$2.08 billion paid on WPZ’s credit facility borrowings;
|
|
•
|
$1.819 billion
received from WPZ’s equity offerings;
|
|
•
|
$982 million
paid for quarterly dividends on common stock;
|
|
•
|
$489 million
paid for dividends and distributions to noncontrolling interests;
|
|
•
|
$467 million
received in contributions from noncontrolling interests.
|
Investing activities
Significant transactions include:
2015
|
•
|
Capital expenditures totaled
$3.167 billion
;
|
|
•
|
$112 million
paid to purchase a gathering system comprised of approximately 140 miles of pipeline and a sour gas compression facility in the Eagle Ford shale;
|
77
|
•
|
Purchases of and contributions to our equity-method investments of
$595 million
;
|
2014
|
•
|
Capital expenditures totaled
$4.031 billion
;
|
|
•
|
Purchases of and contributions to our equity-method investments of
$482 million
;
|
|
•
|
$5.958 billion
paid, net of cash acquired, for the ACMP Acquisition.
|
2013
|
•
|
Capital expenditures totaled
$3.572 billion
;
|
|
•
|
Purchases of and contributions to our equity-method investments of
$455 million
.
|
Off-Balance Sheet Arrangements and Guarantees of Debt or Other Commitments
We have various other guarantees and commitments which are disclosed in
Note 3 – Variable Interest Entities
,
Note 11 – Property, Plant, and Equipment
,
Note 14 – Debt, Banking Arrangements, and Leases
,
Note 17 – Fair Value Measurements, Guarantees, and Concentration of Credit Risk
, and
Note 18 – Contingent Liabilities and Commitments
of Notes to Consolidated Financial Statements. We do not believe these guarantees and commitments or the possible fulfillment of them will prevent us from meeting our liquidity needs.
Contractual Obligations
The table below summarizes the maturity dates of our contractual obligations at
December 31, 2015
:
|
2016
|
2017 - 2018
|
2019 - 2020
|
Thereafter
|
Total
|
|||||||||||||||
|
|
|
|
(Millions)
|
|
|
||||||||||||||
|
Long-term debt: (1)
|
|||||||||||||||||||
|
Principal (2)
|
$
|
375
|
|
$
|
2,135
|
|
$
|
4,113
|
|
$
|
17,377
|
|
$
|
24,000
|
|
||||
|
Interest
|
1,078
|
|
2,016
|
|
1,890
|
|
8,454
|
|
13,438
|
|
|||||||||
|
Commercial paper
|
499
|
|
—
|
|
—
|
|
—
|
|
499
|
|
|||||||||
|
Capital leases
|
1
|
|
—
|
|
—
|
|
—
|
|
1
|
|
|||||||||
|
Operating leases
|
95
|
|
130
|
|
84
|
|
119
|
|
428
|
|
|||||||||
|
Purchase obligations (3)
|
1,414
|
|
365
|
|
292
|
|
347
|
|
2,418
|
|
|||||||||
|
Other obligations (4)(5)
|
2
|
|
2
|
|
1
|
|
3
|
|
8
|
|
|||||||||
|
Total
|
$
|
3,464
|
|
$
|
4,648
|
|
$
|
6,380
|
|
$
|
26,300
|
|
$
|
40,792
|
|
||||
______________
|
(1)
|
Includes the borrowings outstanding under credit facilities, but does not include any related variable-rate interest payments.
|
|
(2)
|
The 2016 amount includes $200 million that is presented as long-term debt at
December 31, 2015
on the
Consolidated Balance Sheet
, due to WPZ’s intent and ability to refinance.
|
|
(3)
|
Includes approximately $730 million in open property, plant, and equipment purchase orders. Includes an estimated $269 million long-term ethane purchase obligation with index-based pricing terms that is reflected in this table at
December 31, 2015
prices. This obligation is part of an overall exchange agreement whereby volumes we transport on OPPL are sold at a third-party fractionator near Conway, Kansas, and we are subsequently obligated to purchase ethane volumes at Mont Belvieu. The purchased ethane volumes may be utilized or resold at comparable prices in the Mont Belvieu market. Includes an estimated $411 million long-term NGL purchase obligation with index-based pricing terms that primarily supplies a third party at its plant and is valued in this table at a price calculated using
December 31, 2015
prices. Any excess purchased volumes may be sold at comparable market prices. In addition, we have not included certain natural gas life-of-lease contracts for which
|
78
the future volumes are indeterminable. We have not included commitments, beyond purchase orders, for the acquisition or construction of property, plant, and equipment or expected contributions to our jointly owned investments. (See Company Outlook — Expansion Projects.)
|
(4)
|
Does not include estimated contributions to our pension and other postretirement benefit plans. We made contributions to our pension and other postretirement benefit plans of $70 million in
2015
and $69 million in
2014
. In
2016
, we expect to contribute approximately $69 million to these plans (see
Note 9 – Employee Benefit Plans
of Notes to Consolidated Financial Statements). Tax-qualified pension plans are required to meet minimum contribution requirements. In the past, we have contributed amounts to our tax-qualified pension plans in excess of the minimum required contribution. These excess amounts can be used to offset future minimum contribution requirements. During
2015
, we contributed $60 million to our tax-qualified pension plans. In addition to these contributions, a portion of the excess contributions was used to meet the minimum contribution requirements. During
2016
, we expect to contribute approximately $60 million to our tax-qualified pension plans and use excess amounts to satisfy minimum contribution requirements, if needed. Additionally, estimated future minimum funding requirements may vary significantly from historical requirements if actual results differ significantly from estimated results for assumptions such as returns on plan assets, interest rates, retirement rates, mortality, and other significant assumptions or by changes to current legislation and regulations.
|
|
(5)
|
We have not included income tax liabilities in the table above. See
Note 7 – Provision (Benefit) for Income Taxes
of Notes to Consolidated Financial Statements for a discussion of income taxes, including our contingent tax liability reserves.
|
Effects of Inflation
Our operations have historically not been materially affected by inflation. Approximately 36 percent of our gross property, plant, and equipment is comprised of our interstate natural gas pipeline assets. They are subject to regulation, which limits recovery to historical cost. While amounts in excess of historical cost are not recoverable under current FERC practices, we anticipate being allowed to recover and earn a return based on increased actual cost incurred to replace existing assets. Cost-based regulations, along with competition and other market factors, may limit our ability to recover such increased costs. For our gathering and processing assets, operating costs are influenced to a greater extent by both competition for specialized services and specific price changes in crude oil and natural gas and related commodities than by changes in general inflation. Crude oil, natural gas, and NGL prices are particularly sensitive to the market perceptions concerning the supply and demand balance in the near future, as well as general economic conditions. However, our exposure to certain of these price changes is reduced through the fee-based nature of certain of our services and the use of hedging instruments.
Environmental
We are a participant in certain environmental activities in various stages including assessment studies, cleanup operations and/or remedial processes at certain sites, some of which we currently do not own (see
Note 18 – Contingent Liabilities and Commitments
of Notes to Consolidated Financial Statements). We are monitoring these sites in a coordinated effort with other potentially responsible parties, the EPA, or other governmental authorities. We are jointly and severally liable along with unrelated third parties in some of these activities and solely responsible in others. Current estimates of the most likely costs of such activities are approximately
$40 million
, all of which are included in
Accrued liabilities
and
Other noncurrent liabilities
on the
Consolidated Balance Sheet
at
December 31, 2015
. We will seek recovery of approximately
$8 million
of these accrued costs through future natural gas transmission rates. The remainder of these costs will be funded from operations. During
2015
, we paid approximately
$7 million for cleanup and/or remediation and monitoring activities. We expect to pay approximately $7 million in
2016
for these activities. Estimates of the most likely costs of cleanup are generally based on completed assessment studies, preliminary results of studies, or our experience with other similar cleanup operations. At
December 31, 2015
, certain assessment studies were still in process for which the ultimate outcome may yield different estimates of most likely costs. Therefore, the actual costs incurred will depend on the final amount, type, and extent of contamination discovered at these sites, the final cleanup standards mandated by the EPA or other governmental authorities, and other factors.
In March 2008, the EPA promulgated a new, lower National Ambient Air Quality Standard (NAAQS) for ground-level ozone. In May 2012, the EPA completed designation of new eight-hour ozone nonattainment areas. Several Transco
79
facilities are located in 2008 ozone nonattainment areas. In December 2014, the EPA proposed to further reduce the ground-level ozone NAAQS from the March 2008 levels and subsequently finalized a rule on October 1, 2015. We are monitoring the rule's implementation as the reduction will trigger additional federal and state regulatory actions that may impact our operations. To date, no federal actions have been proposed to mandate additional emission controls at these facilities. Pursuant to pending state regulatory actions associated with implementation of the 2008 ozone standard, we anticipate that some facilities may be subject to increased controls within five years. Implementation of the regulations is expected to result in impacts to our operations and increase the cost of additions to
Property, plant, and equipment – net
on the
Consolidated Balance Sheet
for both new and existing facilities in affected areas. We are unable at this time to estimate with any certainty the cost of additions that may be required to meet the regulations.
On January 22, 2010, the EPA set a new one-hour nitrogen dioxide (NO
2
) NAAQS. The effective date of the new NO
2
standard was April 12, 2010. On January 20, 2012, the EPA determined pursuant to available information that no area in the country is violating the 2010 NO
2
NAAQS and thus designated all areas of the country as “unclassifiable/attainment.” Also, at that time the EPA noted its plan to deploy an expanded NO
2
monitoring network beginning in 2013. However on October 5, 2012, the EPA proposed a graduated implementation of the monitoring network between January 1, 2014 and January 1, 2017. Once three years of data is collected from the new monitoring network, the EPA will reassess attainment status with the one-hour NO
2
NAAQS. Until that time, the EPA or states may require ambient air quality modeling on a case by case basis to demonstrate compliance with the NO
2
standard. Because we are unable to predict the outcome of the EPA’s or states’ future assessment using the new monitoring network, we are unable to estimate the cost of additions that may be required to meet this regulation.
Our interstate natural gas pipelines consider prudently incurred environmental assessment and remediation costs and the costs associated with compliance with environmental standards to be recoverable through rates.
80
Item 7A.
Quantitative and Qualitative Disclosures About Market Risk
Interest Rate Risk
Our current interest rate risk exposure is related primarily to our debt portfolio. Our debt portfolio is primarily comprised of fixed rate debt, which mitigates the impact of fluctuations in interest rates. Any borrowings under the credit facilities and any issuances under WPZ’s commercial paper program could be at a variable interest rate and could expose us to the risk of increasing interest rates. The maturity of our long-term debt portfolio is partially influenced by the expected lives of our operating assets. (See
Note 14 – Debt, Banking Arrangements, and Leases
of Notes to Consolidated Financial Statements.)
The tables below provide information by maturity date about our interest rate risk-sensitive instruments as of
December 31, 2015
and
2014
. Long-term debt in the tables represents principal cash flows, net of (discount) premium and debt issuance costs, and weighted-average interest rates by expected maturity dates. The fair value of our publicly traded long-term debt is valued using indicative year-end traded bond market prices. Private debt is valued based on market rates and the prices of similar securities with similar terms and credit ratings.
|
2016
|
2017
|
2018
|
2019
|
2020
|
Thereafter (1)
|
Total
|
Fair Value December 31, 2015
|
|||||||||||||||||
|
(Millions)
|
||||||||||||||||||||||||
|
Long-term debt, including current portion: (2)
|
||||||||||||||||||||||||
|
Fixed rate
|
$
|
375
|
(*)
|
$
|
785
|
|
$
|
500
|
|
$
|
32
|
|
$
|
2,121
|
|
$
|
17,364
|
|
$
|
21,177
|
|
$
|
16,796
|
|
|
Interest rate
|
5.1
|
%
|
5.1
|
%
|
5.0
|
%
|
5.0
|
%
|
5.0
|
%
|
5.5
|
%
|
||||||||||||
|
Variable rate
|
$
|
—
|
|
$
|
—
|
|
$
|
850
|
|
$
|
—
|
|
$
|
1,960
|
|
$
|
—
|
|
$
|
2,810
|
|
$
|
2,810
|
|
|
Interest rate (3)
|
||||||||||||||||||||||||
|
Commercial paper:
|
||||||||||||||||||||||||
|
Variable rate
|
$
|
499
|
|
$
|
—
|
|
$
|
—
|
|
$
|
—
|
|
$
|
—
|
|
$
|
—
|
|
$
|
499
|
|
$
|
499
|
|
|
Interest rate (4)
|
||||||||||||||||||||||||
|
_____________
|
||||||||||||||||||||||||
|
(*) $200 million presented as long-term debt at December 31, 2015, due to WPZ’s intent and ability to refinance.
|
||||||||||||||||||||||||
|
2015
|
2016
|
2017
|
2018
|
2019
|
Thereafter (1)
|
Total
|
Fair Value December 31, 2014
|
|||||||||||||||||
|
(Millions)
|
||||||||||||||||||||||||
|
Long-term debt, including current portion: (2)
|
||||||||||||||||||||||||
|
Fixed rate
|
$
|
750
|
(**)
|
$
|
375
|
|
$
|
785
|
|
$
|
500
|
|
$
|
32
|
|
$
|
17,327
|
|
$
|
19,769
|
|
$
|
20,121
|
|
|
Interest rate
|
5.2
|
%
|
5.3
|
%
|
5.2
|
%
|
5.2
|
%
|
5.1
|
%
|
5.4
|
%
|
||||||||||||
|
Variable rate
|
$
|
—
|
|
$
|
—
|
|
$
|
—
|
|
$
|
1,010
|
|
$
|
—
|
|
$
|
—
|
|
$
|
1,010
|
|
$
|
1,010
|
|
|
Interest rate (5)
|
||||||||||||||||||||||||
|
Commercial paper:
|
||||||||||||||||||||||||
|
Variable rate
|
$
|
798
|
|
$
|
—
|
|
$
|
—
|
|
$
|
—
|
|
$
|
—
|
|
$
|
—
|
|
$
|
798
|
|
$
|
798
|
|
|
Interest rate (4)
|
||||||||||||||||||||||||
|
_____________
|
||||||||||||||||||||||||
|
(**) Presented as long-term debt at December 31, 2014, due to WPZ’s intent and ability to refinance.
|
||||||||||||||||||||||||
__________________
|
(1)
|
Includes unamortized discount / premium and debt issuance costs.
|
|
(2)
|
Excludes capital leases.
|
|
(3)
|
The weighted-average interest rates for WPZ’s $1.3 billion credit facility borrowing, WPZ’s $850 million term loan, and our $650 million credit facility borrowing at
December 31, 2015
were 1.63 percent, 1.85 percent, and 2.32 percent, respectively.
|
81
|
(4)
|
The weighted-average interest rate was 0.92 percent at both December 31, 2015 and 2014.
|
|
(5)
|
The weighted-average interest rates for WPZ’s $640 million and our $370 million credit facility borrowings at December 31, 2014 were 2.42 percent and 1.67 percent, respectively.
|
Commodity Price Risk
We are exposed to the impact of fluctuations in the market price of NGLs, olefins, and natural gas, as well as other market factors, such as market volatility and energy commodity price correlations. We are exposed to these risks in connection with our owned energy-related assets, our long-term energy-related contracts, and limited proprietary trading activities. Our management of the risks associated with these market fluctuations includes maintaining a conservative capital structure and sufficient liquidity, as well as using various derivatives and nonderivative energy-related contracts. The fair value of derivative contracts is subject to many factors, including changes in energy commodity market prices, the liquidity and volatility of the markets in which the contracts are transacted, and changes in interest rates. At
December 31, 2015
and 2014, our derivative activity was not material. (See
Note 17 – Fair Value Measurements, Guarantees, and Concentration of Credit Risk
of Notes to Consolidated Financial Statements.)
Foreign Currency Risk
Our foreign operations, whose functional currency is the local currency, are located in Canada. Net assets of our foreign operations were approximately $1.4 billion and $1.3 billion at
December 31, 2015
and
2014
, respectively. These investments have the potential to impact our financial position due to fluctuations in the local currency arising from the process of translating the local functional currency into the U.S. dollar. As an example, a 20 percent change in the functional currency against the U.S. dollar would have changed
Total stockholders’ equity
by approximately
$179 million and approximately $157 million at
December 31, 2015
and 2014, respectively.
82
Item 8.
Financial Statements and Supplementary Data
Report of Independent Registered Public Accounting Firm
The Board of Directors and Stockholders of
The Williams Companies, Inc.
We have audited the accompanying consolidated balance sheet of The Williams Companies, Inc. as of December 31, 2015 and 2014, and the related consolidated statements of operations, comprehensive income (loss), changes in equity and cash flows for each of the three years in the period ended December 31, 2015. Our audits also included the financial statement schedules listed in the index at Item 15(a). These financial statements and schedules are the responsibility of the Company's management. Our responsibility is to express an opinion on these financial statements and schedules based on our audits. We did not audit the financial statements of Gulfstream Natural Gas System, L.L.C. (“Gulfstream”) (a limited liability corporation in which the Company has a 50 percent interest) or, prior to 2014, the consolidated financial statements of Access Midstream Partners, L.P. (“ACMP”) (a master limited partnership in which the Company acquired a 50 percent general partner interest and a 23 percent limited partner interest in December 2012 and the remaining 50 percent general partner interest and an additional 27 percent limited partner interest in July 2014). In the consolidated financial statements, the Company’s investment in Gulfstream was $293 million as of December 31, 2015, and the Company’s equity earnings in the net income of Gulfstream were $65 million and $67 million, respectively, for the years ended December 31, 2015 and 2013. In the consolidated financial statements, the Company’s equity earnings in the net income of ACMP was $93 million for the year ended December 31, 2013. For the periods indicated above, Gulfstream’s and ACMP’s financial statements were audited by other auditors whose reports have been furnished to us, and our opinion, insofar as it relates to the amounts included for Gulfstream for 2015 and 2013 and ACMP for 2013, is based solely on the reports of the other auditors.
We conducted our audits in accordance with the standards of the Public Company Accounting Oversight Board (United States). Those standards require that we plan and perform the audit to obtain reasonable assurance about whether the financial statements are free of material misstatement. An audit includes examining, on a test basis, evidence supporting the amounts and disclosures in the financial statements. An audit also includes assessing the accounting principles used and significant estimates made by management, as well as evaluating the overall financial statement presentation. We believe that our audits and the reports of other auditors provide a reasonable basis for our opinion.
In our opinion, based on our audits and, for 2015 and 2013 for Gulfstream and for 2013 for ACMP, the reports of other auditors, the financial statements referred to above present fairly, in all material respects, the consolidated financial position of The Williams Companies, Inc. at December 31, 2015 and 2014, and the consolidated results of its operations and its cash flows for each of the three years in the period ended December 31, 2015, in conformity with U.S. generally accepted accounting principles. Also, in our opinion, the related financial statement schedules, when considered in relation to the basic financial statements taken as a whole, present fairly in all material respects the information set forth therein.
We also have audited, in accordance with the standards of the Public Company Accounting Oversight Board (United States), The Williams Companies, Inc.'s internal control over financial reporting as of December 31, 2015, based on criteria established in Internal Control-Integrated Framework issued by the Committee of Sponsoring Organizations of the Treadway Commission (2013 framework) and our report dated February 26, 2016 expressed an unqualified opinion thereon.
/s/ Ernst & Young LLP
Tulsa, Oklahoma
February 26, 2016
83
REPORT OF INDEPENDENT REGISTERED PUBLIC ACCOUNTING FIRM
To the Members of Gulfstream Natural Gas System, L.L. C.
We have audited the balance sheets of Gulfstream Natural Gas System, L.L.C. as of December 31, 2015 and 2014, and the related statements of operations, comprehensive income, members’ equity, and cash flows for each of the three years in the period ended December 31, 2015. These financial statements are the responsibility of the Company's management. Our responsibility is to express an opinion on these financial statements based on our audits.
We conducted our audits in accordance with the standards of the Public Company Accounting Oversight Board (United States). Those standards require that we plan and perform the audit to obtain reasonable assurance about whether the financial statements are free of material misstatement. The Company is not required to have, nor were we engaged to perform, an audit of its internal control over financial reporting. Our audits included consideration of internal control over financial reporting as a basis for designing audit procedures that are appropriate in the circumstances, but not for the purpose of expressing an opinion on the effectiveness of the Company's internal control over financial reporting. Accordingly, we express no such opinion. An audit also includes examining, on a test basis, evidence supporting the amounts and disclosures in the financial statements, assessing the accounting principles used and significant estimates made by management, as well as evaluating the overall financial statement presentation. We believe that our audits provide a reasonable basis for our opinion.
In our opinion, such financial statements present fairly, in all material respects, the financial position of Gulfstream Natural Gas System, L.L.C. as of December 31, 2015 and 2014, and the results of its operations and its cash flows for each of the three years in the period ended December 31, 2015, in conformity with accounting principles generally accepted in the United States of America.
/s/ Deloitte & Touche LLP
Houston, Texas
February 26, 2016
84
REPORT OF INDEPENDENT REGISTERED PUBLIC ACCOUNTING FIRM
To the Board of Directors of Access Midstream Partners GP, L.L.C., as General Partner of Williams Partners, L.P. formerly known as Access Midstream Partners, L.P. and the Unitholders
In our opinion, the consolidated statement of income, of changes in partners’ capital and of cash flows for the year ended December 31, 2013, present fairly, in all material respects, the results of operations and cash flows of Williams Partners L.P. (formerly known as Access Midstream Partners, L.P.) and its subsidiaries (the “Partnership”) in conformity with accounting principles generally accepted in the United States of America. These financial statements are the responsibility of the Partnership’s management. Our responsibility is to express an opinion on these financial statements based on our audit. We conducted our audit of these statements in accordance with the standards of the Public Company Accounting Oversight Board (United States). Those standards require that we plan and perform the audit to obtain reasonable assurance about whether the financial statements are free of material misstatement. An audit includes examining, on a test basis, evidence supporting the amounts and disclosures in the financial statements, assessing the accounting principles used and significant estimates made by management, and evaluating the overall financial statement presentation. We believe that our audit provides a reasonable basis for our opinion.
/s/ PricewaterhouseCoopers LLP
Tulsa, Oklahoma
February 21, 2014, except for Note 16 to the consolidated financial statements appearing under Item 8 of the Partnership’s 2013 Annual Report on Form 10-K/A (not presented herein), as to which the date is March 3, 2014, and except for the effects of the capital structure change described in Note 1 to the consolidated financial statements appearing under Item 8 of the Partnership’s 2014 Annual Report on Form 10-K (not presented herein), as to which the date is February 25, 2015
85
The Williams Companies, Inc.
|
Years Ended December 31,
|
||||||||||||
|
2015
|
2014
|
2013
|
||||||||||
|
(Millions, except per-share amounts)
|
||||||||||||
|
Revenues:
|
||||||||||||
|
Service revenues
|
$
|
5,164
|
|
|
$
|
4,116
|
|
$
|
2,939
|
|
||
|
Product sales
|
2,196
|
|
|
3,521
|
|
3,921
|
|
|||||
|
Total revenues
|
7,360
|
|
|
7,637
|
|
6,860
|
|
|||||
|
Costs and expenses:
|
|
|
|
|||||||||
|
Product costs
|
1,779
|
|
|
3,016
|
|
3,027
|
|
|||||
|
Operating and maintenance expenses
|
1,655
|
|
|
1,492
|
|
1,097
|
|
|||||
|
Depreciation and amortization expenses
|
1,738
|
|
|
1,176
|
|
815
|
|
|||||
|
Selling, general, and administrative expenses
|
741
|
|
|
661
|
|
512
|
|
|||||
|
Impairment of goodwill
|
1,098
|
|
—
|
|
—
|
|
||||||
|
Net insurance recoveries – Geismar Incident
|
(126
|
)
|
(232
|
)
|
(40
|
)
|
||||||
|
Other (income) expense – net
|
249
|
|
|
(45
|
)
|
74
|
|
|||||
|
Total costs and expenses
|
7,134
|
|
|
6,068
|
|
5,485
|
|
|||||
|
Operating income (loss)
|
226
|
|
|
1,569
|
|
1,375
|
|
|||||
|
Equity earnings (losses)
|
335
|
|
|
144
|
|
134
|
|
|||||
|
Gain on remeasurement of equity-method investment
|
—
|
|
2,544
|
|
—
|
|
||||||
|
Impairment of equity-method investments
|
(1,359
|
)
|
—
|
|
—
|
|
||||||
|
Other investing income (loss) – net
|
27
|
|
43
|
|
81
|
|
||||||
|
Interest incurred
|
|
(1,118
|
)
|
|
(888
|
)
|
(611
|
)
|
||||
|
Interest capitalized
|
|
74
|
|
|
141
|
|
101
|
|
||||
|
Other income (expense) – net
|
102
|
|
|
31
|
|
—
|
|
|||||
|
Income (loss) from continuing operations before income taxes
|
(1,713
|
)
|
|
3,584
|
|
1,080
|
|
|||||
|
Provision (benefit) for income taxes
|
(399
|
)
|
|
1,249
|
|
401
|
|
|||||
|
Income (loss) from continuing operations
|
(1,314
|
)
|
|
2,335
|
|
679
|
|
|||||
|
Income (loss) from discontinued operations
|
—
|
|
|
4
|
|
(11
|
)
|
|||||
|
Net income (loss)
|
(1,314
|
)
|
|
2,339
|
|
668
|
|
|||||
|
Less: Net income (loss) attributable to noncontrolling interests
|
(743
|
)
|
|
225
|
|
238
|
|
|||||
|
Net income (loss) attributable to The Williams Companies, Inc.
|
$
|
(571
|
)
|
|
$
|
2,114
|
|
$
|
430
|
|
||
|
Amounts attributable to The Williams Companies, Inc.:
|
||||||||||||
|
Income (loss) from continuing operations
|
$
|
(571
|
)
|
$
|
2,110
|
|
$
|
441
|
|
|||
|
Income (loss) from discontinued operations
|
—
|
|
4
|
|
(11
|
)
|
||||||
|
Net income (loss)
|
$
|
(571
|
)
|
$
|
2,114
|
|
$
|
430
|
|
|||
|
Basic earnings (loss) per common share:
|
||||||||||||
|
Income (loss) from continuing operations
|
$
|
(.76
|
)
|
$
|
2.93
|
|
$
|
.65
|
|
|||
|
Income (loss) from discontinued operations
|
—
|
|
.01
|
|
(.02
|
)
|
||||||
|
Net income (loss)
|
$
|
(.76
|
)
|
$
|
2.94
|
|
$
|
.63
|
|
|||
|
Weighted-average shares (thousands)
|
749,271
|
|
719,325
|
|
682,948
|
|
||||||
|
Diluted earnings (loss) per common share:
|
||||||||||||
|
Income (loss) from continuing operations
|
$
|
(.76
|
)
|
$
|
2.91
|
|
$
|
.64
|
|
|||
|
Income (loss) from discontinued operations
|
—
|
|
.01
|
|
(.02
|
)
|
||||||
|
Net income (loss)
|
$
|
(.76
|
)
|
$
|
2.92
|
|
$
|
.62
|
|
|||
|
Weighted-average shares (thousands)
|
749,271
|
|
723,641
|
|
687,185
|
|
||||||
See accompanying notes.
86
The Williams Companies, Inc.
Consolidated Statement of Comprehensive Income (Loss)
|
Years Ended December 31,
|
||||||||||||
|
2015
|
2014
|
2013
|
||||||||||
|
(Millions)
|
||||||||||||
|
Net income (loss)
|
$
|
(1,314
|
)
|
$
|
2,339
|
|
$
|
668
|
|
|||
|
Other comprehensive income (loss):
|
||||||||||||
|
Cash flow hedging activities:
|
||||||||||||
|
Net unrealized gain (loss) from derivative instruments, net of taxes
|
6
|
|
—
|
|
1
|
|
||||||
|
Reclassifications into earnings of net derivative instruments (gain) loss, net of taxes of $1 in 2015
|
(6
|
)
|
—
|
|
(1
|
)
|
||||||
|
Foreign currency translation adjustments, net of taxes of $31, $18, and $24 in 2015, 2014, and 2013, respectively
|
(204
|
)
|
(96
|
)
|
(41
|
)
|
||||||
|
Pension and other postretirement benefits:
|
||||||||||||
|
Prior service credit (cost) arising during the year, net of taxes of ($9) in 2013 (Note 9)
|
—
|
|
(1
|
)
|
14
|
|
||||||
|
Amortization of prior service cost (credit) included in net periodic benefit cost, net of taxes of $3, $3, and $1 in 2015, 2014, and 2013, respectively
|
(3
|
)
|
(5
|
)
|
(2
|
)
|
||||||
|
Net actuarial gain (loss) arising during the year, net of taxes of ($5), $60, and ($111) in 2015, 2014, and 2013, respectively (Note 9)
|
8
|
|
(100
|
)
|
189
|
|
||||||
|
Amortization of actuarial (gain) loss included in net periodic benefit cost, net of taxes of ($18), ($15), and ($23) in 2015, 2014, and 2013, respectively
|
28
|
|
26
|
|
38
|
|
||||||
|
Other comprehensive income (loss)
|
(171
|
)
|
(176
|
)
|
198
|
|
||||||
|
Comprehensive income (loss)
|
(1,485
|
)
|
2,163
|
|
866
|
|
||||||
|
Less: Comprehensive income (loss) attributable to noncontrolling interests
|
(813
|
)
|
206
|
|
238
|
|
||||||
|
Comprehensive income (loss) attributable to The Williams Companies, Inc.
|
$
|
(672
|
)
|
$
|
1,957
|
|
$
|
628
|
|
|||
See accompanying notes.
87
The Williams Companies, Inc.
|
December 31,
|
||||||||
|
2015
|
2014
|
|||||||
|
(Millions, except per-share amounts)
|
||||||||
|
ASSETS
|
||||||||
|
Current assets:
|
||||||||
|
Cash and cash equivalents
|
$
|
100
|
|
$
|
240
|
|
||
|
Accounts and notes receivable (net of allowance of $3 at December 31, 2015 and $0 at December 31, 2014):
|
||||||||
|
Trade and other
|
1,034
|
|
972
|
|
||||
|
Income tax receivable
|
7
|
|
167
|
|
||||
|
Deferred income tax assets
|
42
|
|
67
|
|
||||
|
Inventories
|
127
|
|
231
|
|
||||
|
Other current assets and deferred charges
|
217
|
|
213
|
|
||||
|
Total current assets
|
1,527
|
|
1,890
|
|
||||
|
Investments
|
7,336
|
|
8,400
|
|
||||
|
Property, plant, and equipment – net
|
29,579
|
|
28,081
|
|
||||
|
Goodwill
|
47
|
|
1,120
|
|
||||
|
Other intangible assets – net of accumulated amortization
|
9,970
|
|
10,453
|
|
||||
|
Regulatory assets, deferred charges, and other
|
561
|
|
511
|
|
||||
|
Total assets
|
$
|
49,020
|
|
$
|
50,455
|
|
||
|
LIABILITIES AND EQUITY
|
||||||||
|
Current liabilities:
|
||||||||
|
Accounts payable
|
$
|
744
|
|
$
|
865
|
|
||
|
Accrued liabilities
|
1,078
|
|
900
|
|
||||
|
Commercial paper
|
499
|
|
798
|
|
||||
|
Long-term debt due within one year
|
176
|
|
4
|
|
||||
|
Total current liabilities
|
2,497
|
|
2,567
|
|
||||
|
Long-term debt
|
23,812
|
|
20,780
|
|
||||
|
Deferred income tax liabilities
|
4,218
|
|
4,712
|
|
||||
|
Other noncurrent liabilities
|
2,268
|
|
2,224
|
|
||||
|
Contingent liabilities and commitments (Note 18)
|
|
|
||||||
|
Equity:
|
||||||||
|
Stockholders’ equity:
|
||||||||
|
Common stock (960 million shares authorized at $1 par value;
784 million shares issued at December 31, 2015 and 782 million shares issued at December 31, 2014) |
784
|
|
782
|
|
||||
|
Capital in excess of par value
|
14,807
|
|
14,925
|
|
||||
|
Retained deficit
|
(7,960
|
)
|
(5,548
|
)
|
||||
|
Accumulated other comprehensive income (loss)
|
(442
|
)
|
(341
|
)
|
||||
|
Treasury stock, at cost (35 million shares of common stock)
|
(1,041
|
)
|
(1,041
|
)
|
||||
|
Total stockholders’ equity
|
6,148
|
|
8,777
|
|
||||
|
Noncontrolling interests in consolidated subsidiaries
|
10,077
|
|
11,395
|
|
||||
|
Total equity
|
16,225
|
|
20,172
|
|
||||
|
Total liabilities and equity
|
$
|
49,020
|
|
$
|
50,455
|
|
||
See accompanying notes.
88
The Williams Companies, Inc.
Consolidated Statement of Changes in Equity
|
The Williams Companies, Inc., Stockholders
|
|||||||||||||||||||||||||||||||
|
Common
Stock
|
Capital in
Excess of
Par Value
|
Retained
Deficit
|
Accumulated
Other
Comprehensive
Income (Loss)
|
Treasury
Stock
|
Total
Stockholders’
Equity
|
Noncontrolling
Interests
|
Total Equity
|
||||||||||||||||||||||||
|
(Millions)
|
|||||||||||||||||||||||||||||||
|
Balance – December 31, 2012
|
$
|
716
|
|
$
|
11,134
|
|
$
|
(5,695
|
)
|
$
|
(362
|
)
|
$
|
(1,041
|
)
|
$
|
4,752
|
|
$
|
2,675
|
|
$
|
7,427
|
|
|||||||
|
Net income (loss)
|
—
|
|
—
|
|
430
|
|
—
|
|
—
|
|
430
|
|
238
|
|
668
|
|
|||||||||||||||
|
Other comprehensive income (loss)
|
—
|
|
—
|
|
—
|
|
198
|
|
—
|
|
198
|
|
—
|
|
198
|
|
|||||||||||||||
|
Cash dividends – common stock (Note 15)
|
—
|
|
—
|
|
(982
|
)
|
—
|
|
—
|
|
(982
|
)
|
—
|
|
(982
|
)
|
|||||||||||||||
|
Dividends and distributions to noncontrolling interests
|
—
|
|
—
|
|
—
|
|
—
|
|
—
|
|
—
|
|
(489
|
)
|
(489
|
)
|
|||||||||||||||
|
Issuance of common stock from debentures conversion
|
—
|
|
1
|
|
—
|
|
—
|
|
—
|
|
1
|
|
—
|
|
1
|
|
|||||||||||||||
|
Stock-based compensation and related common stock issuances, net of tax
|
2
|
|
54
|
|
—
|
|
—
|
|
—
|
|
56
|
|
—
|
|
56
|
|
|||||||||||||||
|
Sales of limited partner units of Williams Partners L.P.
|
—
|
|
—
|
|
—
|
|
—
|
|
—
|
|
—
|
|
1,819
|
|
1,819
|
|
|||||||||||||||
|
Changes in ownership of consolidated subsidiaries, net
|
—
|
|
409
|
|
—
|
|
—
|
|
—
|
|
409
|
|
(652
|
)
|
(243
|
)
|
|||||||||||||||
|
Contributions from noncontrolling interests
|
—
|
|
—
|
|
—
|
|
—
|
|
—
|
|
—
|
|
467
|
|
467
|
|
|||||||||||||||
|
Other
|
—
|
|
1
|
|
(1
|
)
|
—
|
|
—
|
|
—
|
|
(1
|
)
|
(1
|
)
|
|||||||||||||||
|
Net increase (decrease) in equity
|
2
|
|
465
|
|
(553
|
)
|
198
|
|
—
|
|
112
|
|
1,382
|
|
1,494
|
|
|||||||||||||||
|
Balance – December 31, 2013
|
718
|
|
11,599
|
|
(6,248
|
)
|
(164
|
)
|
(1,041
|
)
|
4,864
|
|
4,057
|
|
8,921
|
|
|||||||||||||||
|
Net income (loss)
|
—
|
|
—
|
|
2,114
|
|
—
|
|
—
|
|
2,114
|
|
225
|
|
2,339
|
|
|||||||||||||||
|
Other comprehensive income (loss)
|
—
|
|
—
|
|
—
|
|
(157
|
)
|
—
|
|
(157
|
)
|
(19
|
)
|
(176
|
)
|
|||||||||||||||
|
Issuance of common stock for acquisition of business (Note 15)
|
61
|
|
3,317
|
|
—
|
|
—
|
|
—
|
|
3,378
|
|
—
|
|
3,378
|
|
|||||||||||||||
|
Noncontrolling interest resulting from acquisition of business (Note 2)
|
—
|
|
—
|
|
—
|
|
—
|
|
—
|
|
—
|
|
7,502
|
|
7,502
|
|
|||||||||||||||
|
Cash dividends – common stock (Note 15)
|
—
|
|
—
|
|
(1,412
|
)
|
—
|
|
—
|
|
(1,412
|
)
|
—
|
|
(1,412
|
)
|
|||||||||||||||
|
Dividends and distributions to noncontrolling interests
|
—
|
|
—
|
|
—
|
|
—
|
|
—
|
|
—
|
|
(840
|
)
|
(840
|
)
|
|||||||||||||||
|
Stock-based compensation and related common stock issuances, net of tax
|
3
|
|
85
|
|
—
|
|
—
|
|
—
|
|
88
|
|
—
|
|
88
|
|
|||||||||||||||
|
Sales of limited partner units of Williams Partners L.P.
|
—
|
|
—
|
|
—
|
|
—
|
|
—
|
|
—
|
|
55
|
|
55
|
|
|||||||||||||||
|
Changes in ownership of consolidated subsidiaries, net
|
—
|
|
(73
|
)
|
—
|
|
(20
|
)
|
—
|
|
(93
|
)
|
137
|
|
44
|
|
|||||||||||||||
|
Contributions from noncontrolling interests
|
—
|
|
—
|
|
—
|
|
—
|
|
—
|
|
—
|
|
340
|
|
340
|
|
|||||||||||||||
|
Deconsolidation of Bluegrass Pipeline (Note 5)
|
—
|
|
—
|
|
—
|
|
—
|
|
—
|
|
—
|
|
(63
|
)
|
(63
|
)
|
|||||||||||||||
|
Other
|
—
|
|
(3
|
)
|
(2
|
)
|
—
|
|
—
|
|
(5
|
)
|
1
|
|
(4
|
)
|
|||||||||||||||
|
Net increase (decrease) in equity
|
64
|
|
3,326
|
|
700
|
|
(177
|
)
|
—
|
|
3,913
|
|
7,338
|
|
11,251
|
|
|||||||||||||||
|
Balance – December 31, 2014
|
782
|
|
14,925
|
|
(5,548
|
)
|
(341
|
)
|
(1,041
|
)
|
8,777
|
|
11,395
|
|
20,172
|
|
|||||||||||||||
|
Net income (loss)
|
—
|
|
—
|
|
(571
|
)
|
—
|
|
—
|
|
(571
|
)
|
(743
|
)
|
(1,314
|
)
|
|||||||||||||||
|
Other comprehensive income (loss)
|
—
|
|
—
|
|
—
|
|
(101
|
)
|
—
|
|
(101
|
)
|
(70
|
)
|
(171
|
)
|
|||||||||||||||
|
Cash dividends – common stock (Note 15)
|
—
|
|
—
|
|
(1,836
|
)
|
—
|
|
—
|
|
(1,836
|
)
|
—
|
|
(1,836
|
)
|
|||||||||||||||
|
Dividends and distributions to noncontrolling interests
|
—
|
|
—
|
|
—
|
|
—
|
|
—
|
|
—
|
|
(942
|
)
|
(942
|
)
|
|||||||||||||||
|
Stock-based compensation and related common stock issuances, net of tax
|
2
|
|
28
|
|
—
|
|
—
|
|
—
|
|
30
|
|
—
|
|
30
|
|
|||||||||||||||
|
Sales of limited partner units of Williams Partners L.P.
|
—
|
|
—
|
|
—
|
|
—
|
|
—
|
|
—
|
|
59
|
|
59
|
|
|||||||||||||||
|
Changes in ownership of consolidated subsidiaries, net
|
—
|
|
(160
|
)
|
—
|
|
—
|
|
—
|
|
(160
|
)
|
254
|
|
94
|
|
|||||||||||||||
|
Contributions from noncontrolling interests
|
—
|
|
—
|
|
—
|
|
—
|
|
—
|
|
—
|
|
111
|
|
111
|
|
|||||||||||||||
|
Other
|
—
|
|
14
|
|
(5
|
)
|
—
|
|
—
|
|
9
|
|
13
|
|
22
|
|
|||||||||||||||
|
Net increase (decrease) in equity
|
2
|
|
(118
|
)
|
(2,412
|
)
|
(101
|
)
|
—
|
|
(2,629
|
)
|
(1,318
|
)
|
(3,947
|
)
|
|||||||||||||||
|
Balance – December 31, 2015
|
$
|
784
|
|
$
|
14,807
|
|
$
|
(7,960
|
)
|
$
|
(442
|
)
|
$
|
(1,041
|
)
|
$
|
6,148
|
|
$
|
10,077
|
|
$
|
16,225
|
|
|||||||
See accompanying notes.
89
The Williams Companies, Inc.
|
|
Years Ended December 31,
|
|||||||||||
|
2015
|
2014
|
2013
|
||||||||||
|
(Millions)
|
||||||||||||
|
OPERATING ACTIVITIES:
|
||||||||||||
|
Net income (loss)
|
$
|
(1,314
|
)
|
$
|
2,339
|
|
$
|
668
|
|
|||
|
Adjustments to reconcile to net cash provided (used) by operating activities:
|
||||||||||||
|
Depreciation and amortization
|
1,738
|
|
1,176
|
|
815
|
|
||||||
|
Provision (benefit) for deferred income taxes
|
(337
|
)
|
1,264
|
|
424
|
|
||||||
|
Impairment of goodwill
|
1,098
|
|
—
|
|
—
|
|
||||||
|
Impairment of equity-method investments
|
1,359
|
|
—
|
|
—
|
|
||||||
|
Impairment of and net (gain) loss on sale of Property, plant, and equipment
|
215
|
|
67
|
|
29
|
|
||||||
|
Amortization of stock-based awards
|
82
|
|
53
|
|
37
|
|
||||||
|
Gain on remeasurement of equity-method investment
|
—
|
|
(2,544
|
)
|
—
|
|
||||||
|
Cash provided (used) by changes in current assets and liabilities:
|
||||||||||||
|
Accounts and notes receivable
|
39
|
|
(276
|
)
|
35
|
|
||||||
|
Inventories
|
105
|
|
(36
|
)
|
(17
|
)
|
||||||
|
Other current assets and deferred charges
|
4
|
|
(44
|
)
|
25
|
|
||||||
|
Accounts payable
|
(90
|
)
|
(8
|
)
|
(35
|
)
|
||||||
|
Accrued liabilities
|
26
|
|
(203
|
)
|
175
|
|
||||||
|
Other, including changes in noncurrent assets and liabilities
|
(247
|
)
|
327
|
|
61
|
|
||||||
|
Net cash provided (used) by operating activities
|
2,678
|
|
2,115
|
|
2,217
|
|
||||||
|
FINANCING ACTIVITIES:
|
||||||||||||
|
Proceeds from (payments of) commercial paper – net
|
(306
|
)
|
572
|
|
224
|
|
||||||
|
Proceeds from long-term debt
|
9,772
|
|
7,321
|
|
2,699
|
|
||||||
|
Payments of long-term debt
|
(6,516
|
)
|
(1,828
|
)
|
(2,081
|
)
|
||||||
|
Proceeds from issuance of common stock
|
27
|
|
3,416
|
|
18
|
|
||||||
|
Proceeds from sale of limited partner units of consolidated partnership
|
59
|
|
55
|
|
1,819
|
|
||||||
|
Dividends paid
|
(1,836
|
)
|
(1,412
|
)
|
(982
|
)
|
||||||
|
Dividends and distributions paid to noncontrolling interests
|
(942
|
)
|
(840
|
)
|
(489
|
)
|
||||||
|
Contributions from noncontrolling interests
|
111
|
|
340
|
|
467
|
|
||||||
|
Payments for debt issuance costs
|
(35
|
)
|
(40
|
)
|
(15
|
)
|
||||||
|
Special distribution from Gulfstream
|
396
|
|
—
|
|
—
|
|
||||||
|
Contribution to Gulfstream for repayment of debt
|
(248
|
)
|
—
|
|
—
|
|
||||||
|
Other – net
|
(1
|
)
|
17
|
|
17
|
|
||||||
|
Net cash provided (used) by financing activities
|
481
|
|
7,601
|
|
1,677
|
|
||||||
|
INVESTING ACTIVITIES:
|
||||||||||||
|
Property, plant, and equipment:
|
||||||||||||
|
Capital expenditures (1)
|
(3,167
|
)
|
(4,031
|
)
|
(3,572
|
)
|
||||||
|
Net proceeds from dispositions
|
3
|
|
34
|
|
3
|
|
||||||
|
Purchases of businesses, net of cash acquired
|
(112
|
)
|
(5,958
|
)
|
(6
|
)
|
||||||
|
Purchases of and contributions to equity-method investments
|
(595
|
)
|
(482
|
)
|
(455
|
)
|
||||||
|
Other – net
|
572
|
|
280
|
|
(22
|
)
|
||||||
|
Net cash provided (used) by investing activities
|
(3,299
|
)
|
(10,157
|
)
|
(4,052
|
)
|
||||||
|
Increase (decrease) in cash and cash equivalents
|
(140
|
)
|
(441
|
)
|
(158
|
)
|
||||||
|
Cash and cash equivalents at beginning of year
|
240
|
|
681
|
|
839
|
|
||||||
|
Cash and cash equivalents at end of year
|
$
|
100
|
|
$
|
240
|
|
$
|
681
|
|
|||
|
_________
|
||||||||||||
|
(1) Increases to property, plant, and equipment
|
$
|
(3,024
|
)
|
$
|
(3,916
|
)
|
$
|
(3,653
|
)
|
|||
|
Changes in related accounts payable and accrued liabilities
|
(143
|
)
|
(115
|
)
|
81
|
|
||||||
|
Capital expenditures
|
$
|
(3,167
|
)
|
$
|
(4,031
|
)
|
$
|
(3,572
|
)
|
|||
See accompanying notes
.
90
|
The Williams Companies, Inc.
|
||
|
Notes to Consolidated Financial Statements
|
||
Note 1 – General, Description of Business, Basis of Presentation, and Summary of Significant Accounting Policies
General
Unless the context clearly indicates otherwise, references in this report to “Williams,” “we,” “our,” “us,” or like terms refer to The Williams Companies, Inc. and its subsidiaries. Unless the context clearly indicates otherwise, references to “Williams,” “we,” “our,” and “us” include the operations in which we own interests accounted for as equity-method investments that are not consolidated in our financial statements. When we refer to our equity investees by name, we are referring exclusively to their businesses and operations.
Energy Transfer Merger Agreement
On September 28, 2015, we entered into an Agreement and Plan of Merger (Merger Agreement) with Energy Transfer Equity, L.P. (Energy Transfer) and certain of its affiliates. The Merger Agreement provides that, subject to the satisfaction of customary closing conditions, we will be merged with and into the newly formed Energy Transfer Corp LP (ETC) (ETC Merger), with ETC surviving the ETC Merger. Energy Transfer formed ETC as a limited partnership that will be treated as a corporation for U.S. federal income tax purposes. Upon completion of the ETC Merger, ETC will be publicly traded on the New York Stock Exchange under the symbol “ETC.”
At the effective time of the ETC Merger, each issued and outstanding share of our common stock (except for certain shares such as those held by us or our subsidiaries and any held by ETC and its affiliates) will be canceled and automatically converted into the right to receive, at the election of each holder and subject to proration as set forth in the Merger Agreement (collectively Merger Consideration):
|
•
|
1.8716
common shares representing limited partnership interests in ETC (ETC common shares) (Stock Consideration); or
|
|
•
|
$43.50
in cash (Cash Consideration); or
|
|
•
|
$8.00
in cash and
1.5274
ETC common shares (Mixed Consideration).
|
Elections to receive the Stock Consideration or the Cash Consideration will be subject to proration to ensure that the aggregate number of ETC common shares and the aggregate amount of cash paid in the ETC Merger will be the same as if all electing shares of our common stock received the Mixed Consideration. In addition, our stockholders will receive a special one-time dividend of
$0.10
per share of Williams common stock, to be paid to holder of record immediately prior to the closing of the ETC Merger and contingent upon consummation of the ETC Merger.
In connection with the ETC Merger, Energy Transfer will subscribe for a number of ETC common shares at the transaction price, in exchange for the amount of cash needed by ETC to fund the cash portion of the Merger Consideration (the Parent Cash Deposit), and, as a result, based on the number of shares of Williams common stock outstanding as of the date thereof, will own approximately
19 percent
of the outstanding ETC common shares immediately after the effective time of the ETC Merger.
Immediately following the completion of the ETC Merger and of the LE GP, LLC (the general partner for Energy Transfer) merger with and into Energy Transfer Equity GP, LLC, ETC will contribute to Energy Transfer all of the assets and liabilities of Williams in exchange for the issuance by Energy Transfer to ETC of a number of Energy Transfer Class E common units equal to the number of ETC common shares issued to our stockholders in the ETC Merger plus the number of ETC common shares issued to Energy Transfer in consideration for the Parent Cash Deposit (such contribution, together with the ETC Merger and the other transactions contemplated by the Merger Agreement, the Merger Transactions).
91
|
The Williams Companies, Inc.
|
||||
|
Notes to Consolidated Financial Statements – (Continued)
|
||||
To address potential uncertainty as to how the newly listed ETC common shares, as a new security, will trade relative to Energy Transfer common units, each ETC common share issued in the ETC Merger, as well as the ETC common shares issued to Energy Transfer in connection with the Parent Cash Deposit, will have attached to it one contingent consideration right (CCR). The terms of the CCRs are fully described in the form of CCR Agreement attached to the Merger Agreement as Exhibit H to Exhibit 2.1 of our Form 8-K dated September 29, 2015.
The receipt of the Merger Consideration is expected to be tax-free to our stockholders, except with respect to any cash consideration received.
Completion of the Merger Transactions is subject to the satisfaction or waiver of a number of customary closing conditions as set forth in the Merger Agreement, including approval of the ETC Merger by our stockholders, receipt of required regulatory approvals in connection with the Merger Transactions, including the expiration or termination of the applicable waiting period under the Hart-Scott-Rodino Antitrust Improvements Act of 1976, as amended, and effectiveness of a registration statement on Form S-4 registering the ETC common shares (and attached CCRs) to be issued in connection with the Merger Transactions.
ETC filed its initial Form S-4 registration statement on November 24, 2015, and Amendment No. 1 to Form S-4 on January 12, 2016. On December 14, 2015, we and Energy Transfer issued a joint press release announcing the entry into a timing agreement with the United States Federal Trade Commission (FTC) pursuant to which both parties have agreed not to consummate ETC’s proposed acquisition of us until after the later of (i) 60 days after substantial compliance with the FTC’s request for additional information and documentary material and (ii) March 18, 2016.
Termination of WPZ Merger Agreement
On May 12, 2015, we entered into an agreement for a unit-for-stock transaction whereby we would have acquired all of the publicly held outstanding common units of WPZ in exchange for shares of our common stock (WPZ Merger Agreement).
On September 28, 2015, prior to our entry into the Merger Agreement, we entered into a Termination Agreement and Release (Termination Agreement), terminating the WPZ Merger Agreement. Under the terms of the Termination Agreement, we are required to pay a
$428 million
termination fee to WPZ, of which we currently own approximately
60 percent
, including the interests of the general partner and incentive distribution rights (IDRs). Such termination fee will settle through a reduction of quarterly incentive distributions we are entitled to receive from WPZ (such reduction not to exceed
$209 million
per quarter). The distributions from WPZ in November 2015 and February 2016 were each reduced by $209 million related to this termination fee.
ACMP Merger
On February 2, 2015, we completed the merger of our consolidated master limited partnerships,
Williams Partners L.P.
(Pre-merger
WPZ
) and
Access Midstream Partners, L.P.
(
ACMP
) (ACMP Merger). The merged partnership is named Williams Partners L.P. Under the terms of the merger agreement, each ACMP unitholder received
1.06152
ACMP units for each ACMP unit owned immediately prior to the ACMP Merger. In conjunction with the ACMP Merger, each Pre-merger WPZ common unit held by the public was exchanged for
0.86672
ACMP common units. Each Pre-merger WPZ common unit held by us was exchanged for
0.80036
ACMP common units. Prior to the closing of the ACMP Merger, the Class D limited partner units of Pre-merger WPZ, all of which were held by us, were converted into common units on a
one
-for-one basis pursuant to the terms of the Pre-merger WPZ partnership agreement. Following the ACMP Merger, we own approximately
60 percent
of the merged partnership, including the general partner interest and IDRs. In this report, we refer to the post-merger partnership as “WPZ” and the pre-merger entities as “Pre-merger WPZ” and “ACMP.”
Description of Business
We are a Delaware corporation whose common stock is listed and traded on the New York Stock Exchange. Our operations are located principally in the United States and are organized into the Williams Partners and Williams NGL &
92
|
The Williams Companies, Inc.
|
||||
|
Notes to Consolidated Financial Statements – (Continued)
|
||||
Petchem Services reportable segments. All remaining business activities are included in Other. For periods after the ACMP Acquisition (See
Note 2 – Acquisitions
), the acquired ACMP business is reported within Williams Partners. For periods prior to the ACMP Acquisition, the results associated with our former equity-method investment in ACMP are reported within Other.
Williams Partners
Williams Partners consists of our consolidated master limited partnership, WPZ, and primarily includes gas pipeline and midstream businesses.
WPZ’s gas pipeline businesses primarily consist of
two
interstate natural gas pipelines, which are Transcontinental Gas Pipe Line Company, LLC (
Transco
) and Northwest Pipeline LLC (
Northwest Pipeline
), and several joint venture investments in interstate and intrastate natural gas pipeline systems, including a
50 percent
equity-method investment in Gulfstream Natural Gas System, L.L.C. (
Gulfstream
), and a
41 percent
interest in Constitution Pipeline Company, LLC (
Constitution
) (a consolidated entity), which is under development.
WPZ’s midstream businesses primarily consist of (1) natural gas gathering, treating, compression, and processing; (2) natural gas liquid (NGL) fractionation, storage, and transportation; (3) crude oil production handling and transportation; and (4) olefins production. The primary service areas are concentrated in major producing basins in Colorado, Texas, Oklahoma, Kansas, New Mexico, Wyoming, the Gulf of Mexico, Louisiana, Pennsylvania, West Virginia, New York, and Ohio which include the Barnett, Eagle Ford, Haynesville, Marcellus, Niobrara, and Utica shale plays as well as the Mid-Continent region.
The midstream businesses include equity-method investments in natural gas gathering and processing assets and NGL fractionation and transportation assets, including a
62 percent
equity-method investment in Utica East Ohio Midstream, LLC (
UEOM
), a
50 percent
equity-method investment in the Delaware basin gas gathering system in the Mid-Continent region, a
69 percent
equity-method investment in Laurel Mountain Midstream, LLC (
Laurel Mountain
), a
58 percent
equity-method investment in Caiman Energy II, LLC (
Caiman II
), a
60 percent
equity-method investment in Discovery Producer Services, LLC (
Discovery
), a
50 percent
equity-method investment in Overland Pass Pipeline, LLC (
OPPL
), and Appalachia Midstream Services, LLC, which owns equity-method investments with an approximate average
45 percent
interest in multiple gathering systems in the Marcellus Shale (
Appalachia Midstream Investments
).
The midstream businesses also include our Canadian midstream operations, which are comprised of an oil sands offgas processing plant near Fort McMurray, Alberta, and an NGL/olefin fractionation facility and butylene/butane splitter facility at Redwater, Alberta.
Williams NGL & Petchem Services
Williams NGL & Petchem Services includes certain other domestic olefins pipeline assets and certain Canadian growth projects under development (including a propane dehydrogenation facility and a liquids extraction plant).
Other
Other includes other business activities that are not operating segments, as well as corporate operations.
Basis of Presentation
Canada Dropdown
In February 2014, we contributed certain Canadian operations to Pre-merger WPZ (Canada Dropdown) for total consideration of
$56 million
of cash from Pre-merger WPZ (including a
$31 million
post-closing adjustment received in the second quarter of 2014),
25,577,521
Pre-merger WPZ Class D limited-partner units, and an increase in the capital account of its general partner to allow us to maintain our
2 percent
general partner interest. In lieu of cash distributions, the Class D units received quarterly distributions of additional paid-in-kind Class D units.
93
|
The Williams Companies, Inc.
|
||||
|
Notes to Consolidated Financial Statements – (Continued)
|
||||
In October 2014, a purchase price adjustment was finalized whereby we paid
$56 million
in cash to Pre-merger WPZ in the fourth quarter and waived
$2 million
in payment of IDRs with respect to the November 2014 distribution.
Consolidated master limited partnership
During the fourth quarter of 2015, WPZ issued
1,790,840
common units pursuant to an equity distribution agreement between WPZ and certain banks. Considering this, as well as WPZ’s quarterly distribution of additional paid-in-kind Class B units to us, we own approximately
60 percent
of the interests in WPZ, including the interests of the general partner, which are wholly owned by us, and IDRs as of
December 31, 2015
.
The previously described ACMP Merger and other equity issuances by WPZ had the combined net impact of increasing
Noncontrolling interests in consolidated subsidiaries
by
$254 million
, and decreasing
Capital in excess of par value
by
$160 million
and
Deferred income tax liabilities
by
$94 million
in the
Consolidated Balance Sheet
.
WPZ is self-funding and maintains separate lines of bank credit and cash management accounts and also has a commercial paper program. (See
Note 14 – Debt, Banking Arrangements, and Leases
.) Cash distributions from WPZ to us, including any associated with our IDRs, occur through the normal partnership distributions from WPZ to all partners.
Discontinued operations
Unless indicated otherwise, the information in the Notes to Consolidated Financial Statements relates to our continuing operations.
Summary of Significant Accounting Policies
Principles of consolidation
The consolidated financial statements include the accounts of all entities that we control and our proportionate interest in the accounts of certain ventures in which we own an undivided interest. Management’s judgment is required to evaluate whether we control an entity. Key areas of that evaluation include:
|
•
|
Determining whether an entity is a variable interest entity (VIE);
|
|
•
|
Determining whether we are the primary beneficiary of a VIE, including evaluating which activities of the VIE most significantly impact its economic performance and the degree of power that we and our related parties have over those activities through our variable interests;
|
|
•
|
Identifying events that require reconsideration of whether an entity is a VIE and continuously evaluating whether we are a VIE’s primary beneficiary;
|
|
•
|
Evaluating whether other owners in entities that are not VIEs are able to effectively participate in significant decisions that would be expected to be made in the ordinary course of business such that we do not have the power to control such entities.
|
We apply the equity method of accounting to investments over which we exercise significant influence but do not control.
Equity-method investment basis differences
Differences between the cost of our equity-method investments and our underlying equity in the net assets of investees are accounted for as if the investees were consolidated subsidiaries.
Equity earnings (losses)
in the
94
|
The Williams Companies, Inc.
|
||||
|
Notes to Consolidated Financial Statements – (Continued)
|
||||
Consolidated Statement of Operations
includes our allocable share of net income (loss) of investees adjusted for any depreciation and amortization, as applicable, associated with basis differences.
Use of estimates
The preparation of financial statements in conformity with accounting principles generally accepted in the United States requires management to make estimates and assumptions that affect the amounts reported in the consolidated financial statements and accompanying notes. Actual results could differ from those estimates.
Significant estimates and assumptions include:
|
•
|
Impairment assessments of investments, property, plant, and equipment, goodwill, and other identifiable intangible assets;
|
|
•
|
Litigation-related contingencies;
|
|
•
|
Environmental remediation obligations;
|
|
•
|
Realization of deferred income tax assets;
|
|
•
|
Depreciation and/or amortization of equity-method investment basis differences;
|
|
•
|
Asset retirement obligations;
|
|
•
|
Pension and postretirement valuation variables;
|
|
•
|
Acquisition related purchase price allocations.
|
These estimates are discussed further throughout these notes.
Regulatory accounting
Transco and Northwest Pipeline are regulated by the Federal Energy Regulatory Commission (FERC). Their rates, which are established by the FERC, are designed to recover the costs of providing the regulated services, and their competitive environment makes it probable that such rates can be charged and collected. Therefore, our management has determined that it is appropriate under Accounting Standards Codification (ASC) Topic 980, “Regulated Operations,” to account for and report regulatory assets and liabilities related to these operations consistent with the economic effect of the way in which their rates are established. Accounting for these operations that are regulated can differ from the accounting requirements for nonregulated operations. For example, for regulated operations, allowance for funds used during construction (AFUDC) represents the estimated cost of debt and equity funds applicable to utility plant in process of construction and is capitalized as a cost of property, plant, and equipment because it constitutes an actual cost of construction under established regulatory practices; nonregulated operations are only allowed to capitalize the cost of debt funds related to construction activities, while a component for equity is prohibited. The components of our regulatory assets and liabilities relate to the effects of deferred taxes on equity funds used during construction, asset retirement obligations, fuel cost differentials, levelized incremental depreciation, negative salvage, and pension and other postretirement benefits. Our current and noncurrent regulatory asset and liability balances for the years ended
December 31, 2015
and
2014
are as follows:
95
|
The Williams Companies, Inc.
|
||||
|
Notes to Consolidated Financial Statements – (Continued)
|
||||
|
December 31,
|
|||||||
|
2015
|
2014
|
||||||
|
(Millions)
|
|||||||
|
Current assets reported within
Other current assets and deferred charges
|
$
|
84
|
|
$
|
81
|
|
|
|
Noncurrent assets reported within
Regulatory assets, deferred charges, and other
|
370
|
|
337
|
|
|||
|
Total regulated assets
|
$
|
454
|
|
$
|
418
|
|
|
|
Current liabilities reported within
Accrued liabilities
|
$
|
4
|
|
$
|
11
|
|
|
|
Noncurrent liabilities reported within
Other noncurrent liabilities
|
434
|
|
375
|
|
|||
|
Total regulated liabilities
|
$
|
438
|
|
$
|
386
|
|
|
Cash and cash equivalents
Cash and cash equivalents
in the
Consolidated Balance Sheet
includes amounts primarily invested in funds with high-quality, short-term securities and instruments that are issued or guaranteed by the U.S. government. These have maturity dates of three months or less when acquired.
Accounts receivable
Accounts receivable are carried on a gross basis, with no discounting, less an allowance for doubtful accounts. We estimate the allowance for doubtful accounts based on existing economic conditions, the financial condition of our customers, and the amount and age of past due accounts. We consider receivables past due if full payment is not received by the contractual due date. Interest income related to past due accounts receivable is generally recognized at the time full payment is received or collectability is assured. Past due accounts are generally written off against the allowance for doubtful accounts only after all collection attempts have been exhausted.
Inventory valuation
All
Inventories
in the
Consolidated Balance Sheet
are stated at the lower of cost or market. The cost of inventories is primarily determined using the average-cost method.
Property, plant, and equipment
Property, plant, and equipment is recorded at cost. We base the carrying value of these assets on estimates, assumptions, and judgments relative to capitalized costs, useful lives, and salvage values.
As regulated entities, Northwest Pipeline and Transco provide for depreciation using the straight-line method at FERC-prescribed rates. Depreciation for nonregulated entities is provided primarily on the straight-line method over estimated useful lives, except for certain offshore facilities that apply an accelerated depreciation method.
Gains or losses from the ordinary sale or retirement of property, plant, and equipment for regulated pipelines are credited or charged to accumulated depreciation. Other gains or losses are recorded in
Other (income) expense – net
included in
Operating income (loss)
in the
Consolidated Statement of Operations
.
Ordinary maintenance and repair costs are generally expensed as incurred. Costs of major renewals and replacements are capitalized as property, plant, and equipment.
We record a liability and increase the basis in the underlying asset for the present value of each expected future asset retirement obligation (ARO) at the time the liability is initially incurred, typically when the asset is acquired or constructed. As regulated entities, Northwest Pipeline and Transco offset the depreciation of the underlying asset that is attributable to capitalized ARO cost to a regulatory asset as management expects to recover these amounts in future rates. We measure changes in the liability due to passage of time by applying an interest rate to the liability balance.
96
|
The Williams Companies, Inc.
|
||||
|
Notes to Consolidated Financial Statements – (Continued)
|
||||
This amount is recognized as an increase in the carrying amount of the liability and as a corresponding accretion expense included in
Operating and maintenance expenses
in the
Consolidated Statement of Operations
, except for regulated entities, for which the liability is offset by a regulatory asset. The regulatory asset is amortized commensurate with our collection of those costs in rates.
Measurements of AROs include, as a component of future expected costs, an estimate of the price that a third party would demand, and could expect to receive, for bearing the uncertainties inherent in the obligations, sometimes referred to as a market-risk premium.
Goodwill
Goodwill
in the
Consolidated Balance Sheet
represents the excess of the consideration plus the fair value of any noncontrolling interest or any previously held equity interest, over the fair value of the net assets acquired. It is not subject to amortization but is evaluated annually as of October 1 for impairment or more frequently if impairment indicators are present that would indicate it is more likely than not that the fair value of the reporting unit is less than its carrying amount. As part of the evaluation, we compare our estimate of the fair value of the reporting unit with its carrying value, including goodwill. If the carrying value of the reporting unit exceeds its fair value, a computation of the implied fair value of the goodwill is compared with its related carrying value. If the carrying value of the reporting unit goodwill exceeds the implied fair value of that goodwill, an impairment loss is recognized in the amount of the excess. Judgments and assumptions are inherent in our management’s estimates of fair value.
Other intangible assets
Our identifiable intangible assets are primarily related to gas gathering, processing, and fractionation contractual customer relationships. Our intangible assets are amortized on a straight-line basis over the period in which these assets contribute to our cash flows. We evaluate these assets for changes in the expected remaining useful lives and would reflect any changes prospectively through amortization over the revised remaining useful life.
Impairment of property, plant, and equipment, other identifiable intangible assets, and investments
We evaluate our property, plant, and equipment and other identifiable intangible assets for impairment when events or changes in circumstances indicate, in our management’s judgment, that the carrying value of such assets may not be recoverable. When an indicator of impairment has occurred, we compare our management’s estimate of undiscounted future cash flows attributable to the assets to the carrying value of the assets to determine whether an impairment has occurred and we may apply a probability-weighted approach to consider the likelihood of different cash flow assumptions and possible outcomes including selling in the near term or holding for the remaining estimated useful life. If an impairment of the carrying value has occurred, we determine the amount of the impairment recognized in the financial statements by estimating the fair value of the assets and recording a loss for the amount that the carrying value exceeds the estimated fair value. This evaluation is performed at the lowest level for which separately identifiable cash flows exist.
For assets identified to be disposed of in the future and considered held for sale, we compare the carrying value to the estimated fair value less the cost to sell to determine if recognition of an impairment is required. Until the assets are disposed of, the estimated fair value, which includes estimated cash flows from operations until the assumed date of sale, is recalculated when related events or circumstances change.
We evaluate our investments for impairment when events or changes in circumstances indicate, in our management’s judgment, that the carrying value of such investments may have experienced an other-than-temporary decline in value. When evidence of loss in value has occurred, we compare our estimate of fair value of the investment to the carrying value of the investment to determine whether an impairment has occurred. If the estimated fair value is less than the carrying value and we consider the decline in value to be other-than-temporary, the excess of the carrying value over the fair value is recognized in the consolidated financial statements as an impairment charge.
97
|
The Williams Companies, Inc.
|
||||
|
Notes to Consolidated Financial Statements – (Continued)
|
||||
Judgments and assumptions are inherent in our management’s estimate of undiscounted future cash flows and an asset’s or investment’s fair value. Additionally, judgment is used to determine the probability of sale with respect to assets considered for disposal.
Contingent liabilities
We record liabilities for estimated loss contingencies, including environmental matters, when we assess that a loss is probable and the amount of the loss can be reasonably estimated. These liabilities are calculated based upon our assumptions and estimates with respect to the likelihood or amount of loss and upon advice of legal counsel, engineers, or other third parties regarding the probable outcomes of the matters. These calculations are made without consideration of any potential recovery from third parties. We recognize insurance recoveries or reimbursements from others when realizable. Revisions to these liabilities are generally reflected in income when new or different facts or information become known or circumstances change that affect the previous assumptions or estimates.
Cash flows from revolving credit facilities and commercial paper program
Proceeds and payments related to borrowings under our credit facilities are reflected in the financing activities in the
Consolidated Statement of Cash Flows
on a gross basis. Proceeds and payments related to borrowings under our commercial paper program are reflected in the financing activities in the
Consolidated Statement of Cash Flows
on a net basis, as the outstanding notes generally have maturity dates less than three months from the date of issuance. (See
Note 14 – Debt, Banking Arrangements, and Leases
.)
Treasury stock
Treasury stock purchases are accounted for under the cost method whereby the entire cost of the acquired stock is recorded as
Treasury stock
in the
Consolidated Balance Sheet
. Gains and losses on the subsequent reissuance of shares are credited or charged to
Capital in excess of par value
in the
Consolidated Balance Sheet
using the average-cost method.
Derivative instruments and hedging activities
We may utilize derivatives to manage a portion of our commodity price risk. These instruments consist primarily of swaps, futures, and forward contracts involving short- and long-term purchases and sales of physical energy commodities. We report the fair value of derivatives, except those for which the normal purchases and normal sales exception has been elected, in
Other current assets and deferred charges
;
Regulatory assets, deferred charges, and other
;
Accrued liabilities
; or
Other noncurrent liabilities
in the
Consolidated Balance Sheet
. We determine the current and noncurrent classification based on the timing of expected future cash flows of individual trades. We report these amounts on a gross basis. Additionally, we report cash collateral receivables and payables with our counterparties on a gross basis. (See
Note 17 – Fair Value Measurements, Guarantees, and Concentration of Credit Risk
.)
The accounting for the changes in fair value of a commodity derivative can be summarized as follows:
|
Derivative Treatment
|
|
Accounting Method
|
|
Normal purchases and normal sales exception
|
|
Accrual accounting
|
|
Designated in a qualifying hedging relationship
|
|
Hedge accounting
|
|
All other derivatives
|
|
Mark-to-market accounting
|
We may elect the normal purchases and normal sales exception for certain short- and long-term purchases and sales of physical energy commodities. Under accrual accounting, any change in the fair value of these derivatives is not reflected on the balance sheet after the initial election of the exception.
We may also designate a hedging relationship for certain commodity derivatives. For a derivative to qualify for designation in a hedging relationship, it must meet specific criteria and we must maintain appropriate documentation.
98
|
The Williams Companies, Inc.
|
||||
|
Notes to Consolidated Financial Statements – (Continued)
|
||||
We establish hedging relationships pursuant to our risk management policies. We evaluate the hedging relationships at the inception of the hedge and on an ongoing basis to determine whether the hedging relationship is, and is expected to remain, highly effective in achieving offsetting changes in fair value or cash flows attributable to the underlying risk being hedged. We also regularly assess whether the hedged forecasted transaction is probable of occurring. If a derivative ceases to be or is no longer expected to be highly effective, or if we believe the likelihood of occurrence of the hedged forecasted transaction is no longer probable, hedge accounting is discontinued prospectively, and future changes in the fair value of the derivative are recognized currently in
Product sales
or
Product costs
in the
Consolidated Statement of Operations
.
For commodity derivatives designated as a cash flow hedge, the effective portion of the change in fair value of the derivative is reported in
Accumulated other comprehensive income (loss)
(AOCI) in the
Consolidated Balance Sheet
and reclassified into earnings in the period in which the hedged item affects earnings. Any ineffective portion of the derivative’s change in fair value is recognized currently in
Product sales
or
Product costs
in the
Consolidated Statement of Operations
. Gains or losses deferred in AOCI associated with terminated derivatives, derivatives that cease to be highly effective hedges, derivatives for which the forecasted transaction is reasonably possible but no longer probable of occurring, and cash flow hedges that have been otherwise discontinued remain in AOCI until the hedged item affects earnings. If it becomes probable that the forecasted transaction designated as the hedged item in a cash flow hedge will not occur, any gain or loss deferred in AOCI is recognized in
Product sales
or
Product costs
in the
Consolidated Statement of Operations
at that time. The change in likelihood of a forecasted transaction is a judgmental decision that includes qualitative assessments made by management.
For commodity derivatives that are not designated in a hedging relationship, and for which we have not elected the normal purchases and normal sales exception, we report changes in fair value currently in
Product sales
or
Product costs
in the
Consolidated Statement of Operations
.
Certain gains and losses on derivative instruments included in the
Consolidated Statement of Operations
are netted together to a single net gain or loss, while other gains and losses are reported on a gross basis. Gains and losses recorded on a net basis include unrealized gains and losses on all derivatives that are not designated as hedges and for which we have not elected the normal purchases and normal sales exception.
Realized gains and losses on derivatives that require physical delivery, as well as natural gas derivatives for NGL processing activities and which are not held for trading purposes nor were entered into as a pre-contemplated buy/sell arrangement, are recorded on a gross basis.
Revenue recognition
Revenues
As a result of the ratemaking process, certain revenues collected by us may be subject to refunds upon the issuance of final orders by the FERC in pending rate proceedings. We record estimates of rate refund liabilities considering our and other third-party regulatory proceedings, advice of counsel, and other risks.
Service revenues
Revenues from our gas pipeline businesses include services pursuant to long-term firm transportation and storage agreements. These agreements provide for a reservation charge based on the volume of contracted capacity and a commodity charge based on the volume of gas delivered, both at rates specified in our FERC tariffs. We recognize revenues for reservation charges ratably over the contract period regardless of the volume of natural gas that is transported or stored. Revenues for commodity charges, from both firm and interruptible transportation services and storage injection and withdrawal services, are recognized when natural gas is delivered at the agreed upon delivery point or when natural gas is injected or withdrawn from the storage facility.
99
|
The Williams Companies, Inc.
|
||||
|
Notes to Consolidated Financial Statements – (Continued)
|
||||
Certain revenues from our midstream operations include those derived from natural gas gathering, processing, treating, and compression services and are performed under volumetric-based fee contracts. These revenues are recorded when services have been performed.
Certain of our gas gathering agreements have minimum volume commitments. If a customer under such an agreement fails to meet its minimum volume commitment for a specified period, generally measured on an annual basis, it is obligated to pay a contractually determined fee based upon the shortfall between actual production volumes and the minimum volume commitment for that period. The revenue associated with minimum volume commitments is recognized in the period that the actual shortfall is determined and is no longer subject to future reduction or offset.
Crude oil gathering and transportation revenues and offshore production handling fees are recognized when the services have been performed. Certain offshore production handling contracts contain fixed payment terms that result in the deferral of revenues until such services have been performed or such capacity has been made available.
Storage revenues from our midstream operations associated with prepaid contracted storage capacity contracts are recognized on a straight-line basis over the life of the contract as services are provided.
Product sales
In the course of providing transportation services to customers of our interstate natural gas pipeline businesses, we may receive different quantities of gas from shippers than the quantities delivered on behalf of those shippers. The resulting imbalances are primarily settled through the purchase and sale of gas with our customers under terms provided for in our FERC tariffs. Revenue is recognized from the sale of gas upon settlement of the transportation and exchange imbalances.
We market NGLs, crude oil, natural gas, and olefins that we purchase from our producer customers as part of the overall service provided to producers. Revenues from marketing NGLs are recognized when the products have been sold and delivered.
Under our keep-whole and percent-of-liquids processing contracts, we retain the rights to all or a portion of the NGLs extracted from the producers’ natural gas stream and recognize revenues when the extracted NGLs are sold and delivered.
Our domestic olefins business produces olefins from purchased or produced feedstock and we recognize revenues when the olefins are sold and delivered.
Our Canadian business has processing and fractionation operations where we retain certain NGLs and olefins from an upgrader’s offgas stream and we recognize revenues when the fractionated products are sold and delivered.
Interest capitalized
We capitalize interest during construction on major projects with construction periods of at least
3 months
and a total project cost in excess of
$1 million
. Interest is capitalized on borrowed funds and, where regulation by the FERC exists, on internally generated funds (equity AFUDC). The latter is included in
Other income (expense) – net
below
Operating income (loss)
in the
Consolidated Statement of Operations
. The rates used by regulated companies are calculated in accordance with FERC rules. Rates used by nonregulated companies are based on our average interest rate on debt.
Employee stock-based awards
We recognize compensation expense on employee stock-based awards, net of estimated forfeitures, on a straight-line basis. (See
Note 16 – Equity-Based Compensation
.)
100
|
The Williams Companies, Inc.
|
||||
|
Notes to Consolidated Financial Statements – (Continued)
|
||||
Pension and other postretirement benefits
The funded status of each of the pension and other postretirement benefit plans is recognized separately in the
Consolidated Balance Sheet
as either an asset or liability. The funded status is the difference between the fair value of plan assets and the plan’s benefit obligation. The plans’ benefit obligations and net periodic benefit costs are actuarially determined and impacted by various assumptions and estimates. (See
Note 9 – Employee Benefit Plans
.)
The discount rates are determined separately for each of our pension and other postretirement benefit plans based on an approach specific to our plans. The year-end discount rates are determined considering a yield curve comprised of high-quality corporate bonds and the timing of the expected benefit cash flows of each plan.
The expected long-term rates of return on plan assets are determined by combining a review of the historical returns within the portfolio, the investment strategy included in the plans’ investment policy statement, and capital market projections for the asset classes in which the portfolio is invested, as well as the weighting of each asset class.
Unrecognized actuarial gains and losses and unrecognized prior service costs and credits are deferred and recorded in AOCI or, for Transco and Northwest Pipeline, as a regulatory asset or liability, until amortized as a component of net periodic benefit cost. Unrecognized actuarial gains and losses in excess of
10 percent
of the greater of the benefit obligation or the market-related value of plan assets are amortized over the participants’ average remaining future years of service, which is approximately
12 years
for our pension plans and approximately
7 years
for our other postretirement benefit plans. Unrecognized prior service costs and credits for the other postretirement benefit plans are amortized on a straight line basis over the average remaining years of service to eligibility for eligible plan participants, which is approximately
4 years
.
The expected return on plan assets component of net periodic benefit cost is calculated using the market-related value of plan assets. For our pension plans, the market-related value of plan assets is equal to the fair value of plan assets adjusted to reflect the amortization of gains or losses associated with the difference between the expected and actual return on plan assets over a
5
-year period. Additionally, the market-related value of assets may be no more than
110 percent
or less than
90 percent
of the fair value of plan assets at the beginning of the year. The market-related value of plan assets for our other postretirement benefit plans is equal to the unadjusted fair value of plan assets at the beginning of the year.
In May 2015, the Financial Accounting Standards Board (FASB) issued Accounting Standards Update (ASU) 2015-07 “Fair Value Measurement (Topic 820): Disclosures for Investments in Certain Entities That Calculate Net Asset Value per Share (or Its Equivalent)” (ASU 2015-07). ASU 2015-07 removes from the fair value hierarchy investments measured using the net asset value per share (or its equivalent) practical expedient. The standard primarily impacts the presentation of certain investments included in our employee benefit plans. The standard is effective for financial statements issued for interim and annual reporting periods beginning after December 15, 2015, and requires retrospective presentation. Early adoption is permitted. Management elected to early adopt the provisions of this new standard. As a result, the plan asset investments measured at fair value using the net asset value per share (or its equivalent) practical expedient have been excluded from the presentation of plan assets within the fair value hierarchy. This standard has been applied retrospectively to the presentation of prior periods, as required upon adoption. (See
Note 9 – Employee Benefit Plans
.)
Income taxes
We include the operations of our domestic corporate subsidiaries and income from our subsidiary partnerships in our consolidated federal income tax return and also file tax returns in various foreign and state jurisdictions as required. Deferred income taxes are computed using the liability method and are provided on all temporary differences between the financial basis and the tax basis of our assets and liabilities. Our management’s judgment and income tax assumptions are used to determine the levels, if any, of valuation allowances associated with deferred tax assets.
101
|
The Williams Companies, Inc.
|
||||
|
Notes to Consolidated Financial Statements – (Continued)
|
||||
Earnings (loss) per common share
Basic earnings (loss) per common share
in the
Consolidated Statement of Operations
is based on the sum of the weighted-average number of common shares outstanding and vested restricted stock units.
Diluted earnings (loss) per common share
in the
Consolidated Statement of Operations
includes any dilutive effect of stock options, nonvested restricted stock units, and convertible debt, unless otherwise noted. Diluted earnings (loss) per common share are calculated using the treasury-stock method.
Foreign currency translation
Certain of our foreign subsidiaries use the Canadian dollar as their functional currency. Assets and liabilities of such foreign subsidiaries are translated at the spot rate in effect at the applicable reporting date, and the combined statements of operations are translated into the U.S. dollar at the average exchange rates in effect during the applicable period. The resulting cumulative translation adjustment is recorded as a separate component of AOCI in the
Consolidated Balance Sheet
.
Transactions denominated in currencies other than the functional currency are recorded based on exchange rates at the time such transactions arise. Subsequent changes in exchange rates when the transactions are settled result in transaction gains and losses which are reflected in
Other (income) expense – net
in the
Consolidated Statement of Operations
.
Accounting standards issued but not yet adopted
In February 2016, the FASB issued ASU 2016-02 “Leases (Topic 842)” (ASU 2016-02). ASU 2016-02 establishes a comprehensive new lease accounting model. The new standard clarifies the definition of a lease, requires a dual approach to lease classification similar to current lease classifications, and causes lessees to recognize leases on the balance sheet as a lease liability with a corresponding right-of-use asset for leases with a lease term of more than twelve months. The new standard is effective for interim and annual periods beginning after December 15, 2018. Early adoption is permitted. The new standard requires a modified retrospective transition for capital or operating leases existing at or entered into after the beginning of the earliest comparative period presented in the financial statements, but it does not require transition accounting for leases that expire prior to the date of initial application. We are evaluating the impact of the new standard on our consolidated financial statements.
In January 2016, the FASB issued ASU 2016-01 “Financial Instruments - Overall (Subtopic 825-10): Recognition and Measurement of Financial Assets and Financial Liabilities” (ASU 2016-01). ASU 2016-01 addresses certain aspects of recognition, measurement, presentation, and disclosure of financial instruments. The new standard is effective for interim and annual periods beginning after December 15, 2017. Early adoption is only permitted for certain applications. We are evaluating the impact of the new standard on our consolidated financial statements and our timing for adoption.
In November 2015, the FASB issued ASU 2015-17 “Income Taxes (Topic 740): Balance Sheet Classification of Deferred Taxes” (ASU 2015-17). ASU 2015-17 requires that deferred income tax liabilities and assets be presented as noncurrent in a classified statement of financial position. The new standard is effective for interim and annual periods beginning after December 15, 2016, with either prospective or retrospective presentation allowed. Early adoption is permitted. Adoption of this standard will result in a change to the presentation of deferred taxes in our
Consolidated Balance Sheet
as the current deferred tax balance will be reclassified to a noncurrent deferred tax balance. The standard will have no impact on our
Consolidated Statement of Operations
and
Consolidated Statement of Cash Flows
.
In September 2015, the FASB issued ASU 2015-16 “Business Combinations (Topic 805): Simplifying the Accounting for Measurement-Period Adjustments” (ASU 2015-16). ASU 2015-16 requires an entity to recognize adjustments to provisional amounts that are identified during the measurement period in the reporting period in which the adjustment amounts are determined; record, in the same period’s financial statements, the effect on earnings of changes in depreciation, amortization, or other income effects, if any, as a result of the change to the provisional amounts, calculated as if the accounting had been completed at the acquisition date; and present separately on the face of the income statement or disclose in the notes the portion of the amount recorded in current-period earnings by line item
102
|
The Williams Companies, Inc.
|
||||
|
Notes to Consolidated Financial Statements – (Continued)
|
||||
that would have been recorded in previous reporting periods if the adjustment to the provisional amounts had been recognized as of the acquisition date. The new standard is effective for interim and annual periods beginning after December 15, 2015, with early adoption permitted for financial statements that have not been issued. We do not expect the new standard will have a significant impact on our consolidated financial statements.
In July 2015, the FASB issued ASU 2015-11 “Simplifying the Measurement of Inventory” (ASU 2015-11). ASU 2015-11 simplifies the guidance on the subsequent measurement of inventory, excluding inventory measured using last-in, first-out or the retail inventory method. Under the new standard, in scope inventory should be measured at the lower of cost and net realizable value. The new standard is effective for interim and annual periods beginning after December 15, 2016, with early adoption permitted. We measure inventory at the lower of cost or market; upon adoption, we will measure inventory at the lower of cost and net realizable value. We do not expect the new standard will have a material impact on the value of inventory reported in our consolidated financial statements.
In February 2015, the FASB issued ASU 2015-02 “Amendments to the Consolidation Analysis” (ASU 2015-02). ASU 2015-02 alters the models used to determine consolidation conclusions for certain entities, including limited partnerships, and may require additional disclosures. The standard is effective for financial statements issued for interim and annual reporting periods beginning after December 15, 2015, with either retrospective or modified retrospective presentation allowed. Upon adoption of the new standard, WPZ will qualify as a VIE and will be disclosed accordingly. The new standard will have no significant impact on our consolidated financial statements.
In May 2014, the FASB issued ASU 2014-09 establishing ASC Topic 606, “Revenue from Contracts with Customers” (ASC 606). ASC 606 establishes a comprehensive new revenue recognition model designed to depict the transfer of goods or services to a customer in an amount that reflects the consideration the entity expects to be entitled to receive in exchange for those goods or services and requires significantly enhanced revenue disclosures. In August 2015, the FASB issued ASU 2015-14 “Revenue from Contracts with Customers (Topic 606): Deferral of the Effective Date” (ASU 2015-14). Per ASU 2015-14, the standard is effective for interim and annual reporting periods beginning after December 15, 2017. ASC 606 allows either full retrospective or modified retrospective transition and early adoption is permitted for annual periods beginning after December 15, 2016. We continue to evaluate both the impact of this new standard on our consolidated financial statements and the transition method we will utilize for adoption.
Note 2 – Acquisitions
ACMP
On December 20, 2012, we purchased approximately
24 percent
of ACMP’s outstanding limited partnership units and
50 percent
of the ACMP general partner
2 percent
interest which includes IDRs for approximately
$2.19 billion
in cash, including transaction costs. We accounted for these acquired interests as equity-method investments.
On July 1, 2014, we acquired control of ACMP (ACMP Acquisition) through the acquisition of an additional
26 percent
of ACMP’s outstanding limited partnership units and the remaining
50 percent
interest in the general partner for
$5.995 billion
in cash. The acquisition was funded through the issuance of equity (see
Note 15 – Stockholders' Equity
) and debt (see
Note 14 – Debt, Banking Arrangements, and Leases
), credit facility borrowings, and cash on hand.
At the time of acquisition, ACMP owned, operated, developed, and acquired natural gas gathering systems and other midstream energy assets. The purpose of the acquisition was to enhance our position in the Marcellus and Utica shale plays, provide additional diversity via the Eagle Ford, Haynesville, Barnett, Mid-Continent, and Niobrara areas, and to fortify our stable, fee-based business model and support our dividend growth strategy.
Our basis in ACMP reflects business combination accounting, which, among other things, requires identifiable assets acquired and liabilities assumed to be measured at their acquisition-date fair values. Prior to the ACMP Acquisition we accounted for our investment in ACMP using the equity method. The acquisition-date fair value of our equity-method investment in ACMP was
$4.6 billion
. As a result of remeasuring our equity-method investment to fair value,
103
|
The Williams Companies, Inc.
|
||||
|
Notes to Consolidated Financial Statements – (Continued)
|
||||
for the year ended December 31, 2014 we recognized a
$2.5 billion
noncash gain within the
Gain on remeasurement of equity-method investment
line item in the
Consolidated Statement of Operations
.
The valuation techniques used to measure the acquisition-date fair value of the ACMP Acquisition, including our previous equity-method investment in ACMP, consisted of valuing the limited partner units and general partner interest separately. The limited partner units, consisting of common and Class B units, were valued based on ACMP’s closing common unit price at July 1, 2014. The general partner interest, including IDRs, was valued on a noncontrolling basis using an income approach based on a discounted cash flow analysis and a market comparison analysis based on comparable guideline companies and an implied fair value from our purchase.
The following table presents the allocation of the acquisition-date fair value of the major classes of the assets acquired, which are presented in the Williams Partners segment, liabilities assumed, and noncontrolling interest at July 1, 2014. The fair value of accounts receivable acquired equaled contractual amounts receivable. Changes to the preliminary allocation disclosed in Exhibit 99.1 of our Form 8-K dated May 6, 2015, which were recorded in the first quarter of 2015, reflect an increase of
$150 million
in
Property, plant, and equipment
and
$25 million
in
Goodwill
, and a decrease of
$168 million
in
Other intangible assets
and
$7 million
in
Investments
. These adjustments during the measurement period were not considered significant to require retrospective revisions of our financial statements.
|
(Millions)
|
|||
|
Accounts receivable
|
$
|
168
|
|
|
Other current assets
|
63
|
|
|
|
Investments
|
5,865
|
|
|
|
Property, plant, and equipment
|
7,165
|
|
|
|
Goodwill
|
499
|
|
|
|
Other intangible assets
|
8,841
|
|
|
|
Current liabilities
|
(408
|
)
|
|
|
Debt
|
(4,052
|
)
|
|
|
Other noncurrent liabilities
|
(9
|
)
|
|
|
Noncontrolling interest in ACMP’s subsidiaries
|
(958
|
)
|
|
|
Noncontrolling interest in ACMP
|
(6,544
|
)
|
|
Other intangible assets recognized in the acquisition are related to contractual customer relationships from gas gathering agreements with our customers. The basis for determining the value of these intangible assets was estimated future net cash flows to be derived from acquired contractual customer relationships discounted using a risk-adjusted discount rate. These intangible assets are being amortized on a straight-line basis over
30 years
during which contractual customer relationships are expected to contribute to our cash flows. As estimated at the time of acquisition, approximately
56 percent
of the expected future revenues from these contractual customer relationships were impacted by our ability and intent to renew or renegotiate existing customer contracts. We expense costs incurred to renew or extend the terms of our gas gathering, processing, and fractionation contracts with customers. Based on the estimated future revenues during the current contract periods (as estimated at the time of acquisition), the weighted-average periods to the next renewal or extension of the existing customer contracts was approximately
17 years
.
The noncash adjustment to record the fair value of the noncontrolling interest in ACMP was determined based on the common units and ACMP’s closing common unit price at July 1, 2014.
The following unaudited pro forma
Revenues
and
Net income attributable to The Williams Companies, Inc.
for the years ended December 31, 2014 and 2013, are presented as if the ACMP Acquisition had been completed on January 1, 2013. These pro forma amounts are not necessarily indicative of what the actual results would have been if the acquisition had in fact occurred on the date or for the periods indicated, nor do they purport to project
Revenues
or
Net income attributable to The Williams Companies, Inc.
for any future periods or as of any date. These amounts do not give effect to any potential cost savings, operating synergies, or revenue enhancements to result from the transactions or the potential costs to achieve these cost savings, operating synergies, and revenue enhancements.
104
|
The Williams Companies, Inc.
|
||||
|
Notes to Consolidated Financial Statements – (Continued)
|
||||
|
December 31,
|
||||||||
|
2014
|
2013
|
|||||||
|
(Millions)
|
||||||||
|
Revenues
|
$
|
8,181
|
|
$
|
7,906
|
|
||
|
Net income attributable to The Williams Companies, Inc.
|
$
|
622
|
|
$
|
356
|
|
||
Significant adjustments to pro forma
Net income attributable to The Williams Companies, Inc.
include the removal of the previously described
$2.5 billion
gain on remeasurement of equity-method investment, and include additional depreciation and amortization expense associated with reflecting the acquired investments, property, plant, and equipment, and other intangible assets at fair value. The adjustments assume estimated useful lives of
30 years
. Other significant adjustments to pro forma
Net income attributable to The Williams Companies, Inc.
include interest expense related to debt financing associated with the acquisition as well as
Net income attributable to noncontrolling interests
.
During the year ended December 31, 2014, ACMP contributed
Revenues
of
$781 million
and
Net income attributable to The Williams Companies, Inc.
of
$165 million
.
Costs related to this acquisition were
$16 million
in 2014 and are reported within our Williams Partners segment and included in
Selling, general, and administrative expenses
in our
Consolidated Statement of Operations
. Direct transaction costs associated with financing commitments were
$9 million
in 2014 and reported within
Interest incurred
in our
Consolidated Statement of Operations
.
Equity earnings (losses)
within our
Consolidated Statement of Operations
in 2014 includes
$19 million
of equity losses associated with certain compensation-related costs at ACMP that were triggered by the acquisition.
Eagle Ford Gathering System
In May 2015, WPZ acquired a gathering system comprised of approximately
140
miles of pipeline and a sour gas compression facility in the Eagle Ford shale for
$112 million
. The acquisition was accounted for as a business combination, and the allocation of the acquisition-date fair value of the major classes of assets acquired includes
$80 million
of
Property, plant, and equipment, at cost
and
$32 million
of
Other intangible assets – net of accumulated amortization
in the
Consolidated Balance Sheet
. Changes to the preliminary allocation disclosed in the second quarter of 2015 reflect an increase of
$20 million
in
Property, plant, and equipment, at cost
, and a decrease of
$20 million
in
Other intangible assets – net of accumulated amortization
.
UEOM Equity-Method Investment
In June 2015, WPZ acquired an approximate
13 percent
additional interest in its equity-method investment, UEOM, for
$357 million
. Following the acquisition WPZ owns approximately
62 percent
of UEOM. However, WPZ continues to account for this as an equity-method investment because WPZ does not control UEOM due to the significant participatory rights of its partner. In connection with the acquisition of the additional interest, we have agreed to waive approximately
$2 million
of our WPZ IDR payments each quarter through 2017.
As of
December 31, 2015
, we consolidate the following VIEs:
Gulfstar One
WPZ owns a
51 percent
interest in Gulfstar One LLC (Gulfstar One), a subsidiary that, due to certain risk-sharing provisions in its customer contracts, is a VIE. Gulfstar One includes a proprietary floating-production system, Gulfstar FPS, and associated pipelines which provide production handling and gathering services for the Tubular Bells oil and gas discovery in the eastern deepwater Gulf of Mexico. WPZ is the primary beneficiary because it has the power to direct the activities that most significantly impact Gulfstar One’s economic performance. Construction of an expansion project is underway that will provide production handling and gathering services for the Gunflint oil and gas discovery
105
|
The Williams Companies, Inc.
|
||||
|
Notes to Consolidated Financial Statements – (Continued)
|
||||
in the eastern deepwater Gulf of Mexico. The expansion project is expected to be in service in the first half of 2016. The current estimate of the total remaining construction cost for the expansion project is approximately
$130 million
,
which is expected to be funded with revenues received from customers and capital contributions from WPZ and the other equity partner on a proportional basis.
Constitution
WPZ owns a
41 percent
interest in Constitution, a subsidiary that, due to shipper fixed-payment commitments under its long-term firm transportation contracts, is a VIE. WPZ is the primary beneficiary because it has the power to direct the activities that most significantly impact Constitution’s economic performance. WPZ, as construction manager for Constitution, is responsible for constructing the proposed pipeline connecting its gathering system in Susquehanna County, Pennsylvania, to the Iroquois Gas Transmission and the Tennessee Gas Pipeline systems. WPZ plans to place the project in service in the fourth quarter of 2016, assuming timely receipt of all necessary regulatory approvals, and estimates the total remaining cost of the project to be approximately
$571 million
, which is expected to be funded with capital contributions from WPZ and the other equity partners on a proportional basis.
Cardinal
WPZ owns a
66 percent
interest in Cardinal Gas Services, L.L.C (Cardinal), a subsidiary that provides gathering services for the Utica region and is a VIE due to certain risks shared with customers. WPZ is the primary beneficiary because it has the power to direct the activities that most significantly impact Cardinal’s economic performance. Future expansion activity is expected to be funded with capital contributions from WPZ and the other equity partner on a proportional basis.
Jackalope
WPZ owns a
50 percent
interest in Jackalope Gas Gathering Services, L.L.C (Jackalope), a subsidiary that provides gathering and processing services for the Powder River basin and is a VIE due to certain risks shared with customers. WPZ is the primary beneficiary because it has the power to direct the activities that most significantly impact Jackalope’s economic performance. Future expansion activity is expected to be funded with capital contributions from WPZ and the other equity partner on a proportional basis.
106
|
The Williams Companies, Inc.
|
||||
|
Notes to Consolidated Financial Statements – (Continued)
|
||||
The following table presents amounts included in our
Consolidated Balance Sheet
that are for the use or obligation of our consolidated VIEs.
|
December 31,
|
|||||||||
|
2015
|
2014
|
Classification
|
|||||||
|
(Millions)
|
|||||||||
|
Assets (liabilities):
|
|||||||||
|
Cash and cash equivalents
|
$
|
70
|
|
$
|
113
|
|
Cash and cash equivalents
|
||
|
Accounts receivable
|
71
|
|
52
|
|
Accounts and notes receivable – net, Trade and other
|
||||
|
Other current assets
|
2
|
|
3
|
|
Other current assets and deferred charges
|
||||
|
Property, plant, and equipment – net
|
3,000
|
|
2,794
|
|
Property, plant, and equipment – net
|
||||
|
Goodwill
|
47
|
|
103
|
|
Goodwill
|
||||
|
Other intangible assets
–
net
|
1,436
|
|
1,493
|
|
Other intangible assets – net of accumulated amortization
|
||||
|
Other noncurrent assets
|
—
|
|
14
|
|
Regulatory assets, deferred charges, and other
|
||||
|
Accounts payable
|
(59
|
)
|
(48
|
)
|
Accounts payable
|
||||
|
Accrued liabilities
|
(14
|
)
|
(36
|
)
|
Accrued liabilities
|
||||
|
Current deferred revenue
|
(62
|
)
|
(45
|
)
|
Accrued liabilities
|
||||
|
Noncurrent deferred income taxes
|
—
|
|
(13
|
)
|
Deferred income tax liabilities
|
||||
|
Asset retirement obligation
|
(93
|
)
|
(94
|
)
|
Other noncurrent liabilities
|
||||
|
Noncurrent deferred revenue associated with customer advance payments
|
(331
|
)
|
(395
|
)
|
Other noncurrent liabilities
|
||||
Transactions with Equity-Method Investees
We have purchases from our equity-method investees included in
Product costs
in the
Consolidated Statement of Operations
of
$187 million
,
$197 million
, and
$161 million
for the years ended 2015, 2014, and 2013, respectively. We have
$12 million
and
$13 million
included in
Accounts payable
in the
Consolidated Balance Sheet
with our equity-method investees at December 31, 2015 and 2014, respectively.
WPZ has operating agreements with certain equity-method investees. These operating agreements typically provide for reimbursement or payment to WPZ for certain direct operational payroll and employee benefit costs, materials, supplies, and other charges and also for management services. We supplied a portion of these services, primarily those related to employees since WPZ does not have any employees, to certain equity-method investees. The total gross charges to equity-method investees for these fees included in the
Consolidated Statement of Operations
are
$64 million
,
$65 million
, and
$67 million
for the years ended 2015, 2014, and 2013, respectively.
Board of Directors
A member of our Board of Directors, who was elected in 2013, is also the current chairman, president, and chief executive officer of an energy services company that is a customer of ours. We recorded
$111 million
,
$115 million
, and
$131 million
in
Service revenues
in the
Consolidated Statement of Operations
from this company for transportation and storage of natural gas for the years ended December 31, 2015, 2014, and 2013, respectively.
Note 5 – Investing Activities
Gain on remeasurement of equity-method investment
in the
Consolidated Statement of Operations
We recognized a
$2.544 billion
noncash gain in 2014 associated with the ACMP Acquisition. (See
Note 2 – Acquisitions
.)
107
|
The Williams Companies, Inc.
|
||||
|
Notes to Consolidated Financial Statements – (Continued)
|
||||
Impairment of equity-method investments
in the
Consolidated Statement of Operations
During the third quarter of 2015, we recognized other-than-temporary impairment charges of
$458 million
and
$3 million
related to WPZ’s equity-method investments in the Delaware basin gas gathering system and certain of the Appalachia Midstream Investments, respectively. During the fourth quarter of 2015, we recognized additional impairment charges for these investments of
$45 million
and
$559 million
, respectively, as well as impairment charges of
$241 million
and
$45 million
associated with WPZ’s equity-method investments in UEOM and Laurel Mountain, respectively. (See
Note 17 – Fair Value Measurements, Guarantees, and Concentration of Credit Risk
.) These charges are reported within the Williams Partners segment.
Equity earnings (losses)
in the
Consolidated Statement of Operations
Equity earnings (losses)
in 2015 includes a loss of
$19 million
associated with WPZ’s share of underlying property impairments at certain of the Appalachia Midstream Investments. This loss is reported within the Williams Partners segment.
Equity earnings (losses)
in 2014 includes:
|
•
|
Write-offs of capitalized project development costs on our discontinued investments in Bluegrass Pipeline of
$67 million
and Moss Lake of
$4 million
;
|
|
•
|
a
$7 million
equity loss recognized from our interest in ACMP that was accounted for under the equity-method of accounting for the first six months of the year, including
$19 million
of equity losses associated with certain compensation-related costs at ACMP that were triggered by the acquisition and
$30 million
noncash amortization of the difference between the cost of our investment and our underlying share of the net assets for the first six months of the year.
|
Equity earnings (losses)
in 2013 includes
$93 million
of equity earnings recognized from our interest in ACMP, acquired at the end of 2012, that was accounted for under the equity-method of accounting, partially offset by
$63 million
noncash amortization of the difference between the cost of our investment and our underlying share of the net assets.
Other investing income (loss) – net
in the
Consolidated Statement of Operations
Other investing income (loss) – net
includes
$27 million
,
$41 million
, and
$50 million
of interest income for 2015, 2014 and 2013, respectively, associated with a receivable related to the sale of certain former Venezuela assets. Due to changes in circumstances that led to late payments and increased uncertainty regarding the recovery of the receivable, we began accounting for the receivable under a cost recovery model in first quarter 2015. Subsequently, we received payments greater than the remaining carrying amount of the receivable, which resulted in the recognition of interest income.
Other investing income (loss) – net
in 2013 also includes a
$31 million
gain resulting from ACMP’s equity issuances during 2013. These equity issuances resulted in the dilution of our limited partner interest at that time from approximately
24 percent
to
23 percent
, which is accounted for as though we sold a portion of our investment.
108
|
The Williams Companies, Inc.
|
||||
|
Notes to Consolidated Financial Statements – (Continued)
|
||||
Investments
in the
Consolidated Balance Sheet
|
|
December 31,
|
||||||
|
|
2015
|
2014
|
|||||
|
|
(Millions)
|
||||||
|
Equity-method investments:
|
|||||||
|
Appalachia Midstream Investments (1)
|
$
|
2,464
|
|
$
|
3,033
|
|
|
|
UEOM — 62% (2)
|
1,525
|
|
1,411
|
|
|||
|
Delaware basin gas gathering system — 50%
|
977
|
|
1,478
|
|
|||
|
Discovery — 60%
|
602
|
|
602
|
|
|||
|
OPPL – 50%
|
445
|
|
453
|
|
|||
|
Caiman II — 58%
|
418
|
|
432
|
|
|||
|
Laurel Mountain — 69%
|
391
|
|
459
|
|
|||
|
Gulfstream — 50%
|
293
|
|
317
|
|
|||
|
Other
|
221
|
|
215
|
|
|||
|
$
|
7,336
|
|
$
|
8,400
|
|
||
___________
|
(1)
|
Includes equity-method investments in multiple gathering systems in the Marcellus Shale with an approximate average
45 percent
interest.
|
|
(2)
|
WPZ acquired an approximate
13 percent
additional interest in
UEOM
in 2015. (See
Note 2 – Acquisitions
).
|
We have differences between the carrying value of our equity-method investments and the underlying equity in the net assets of the investees of
$2.4 billion
at December 31, 2015 and
$3.7 billion
at December 31, 2014. These differences primarily relate to our investments in Appalachian Midstream Investments, Delaware basin gas gathering system, and
UEOM
resulting from property, plant, and equipment, as well as customer-based intangible assets and goodwill.
Purchases of and contributions to equity-method investments
in the
Consolidated Statement of Cash Flows
We generally fund our portion of significant expansion or development projects of these investees through additional capital contributions. These transactions increased the carrying value of our investments and included:
|
Years Ended December 31,
|
|||||||||||
|
|
2015
|
2014
|
2013
|
||||||||
|
|
(Millions)
|
||||||||||
|
UEOM (1)
|
$
|
357
|
|
$
|
57
|
|
$
|
—
|
|
||
|
Appalachia Midstream Investments
|
93
|
|
84
|
|
—
|
|
|||||
|
Delaware basin gas gathering system
|
57
|
|
20
|
|
—
|
|
|||||
|
Discovery
|
35
|
|
106
|
|
193
|
|
|||||
|
Caiman II
|
—
|
|
175
|
|
192
|
|
|||||
|
Other
|
53
|
|
40
|
|
70
|
|
|||||
|
$
|
595
|
|
$
|
482
|
|
$
|
455
|
|
|||
___________
|
(1)
|
2015 includes additional interest in
UEOM
acquired by WPZ. (See
Note 2 – Acquisitions
.)
|
109
|
The Williams Companies, Inc.
|
||||
|
Notes to Consolidated Financial Statements – (Continued)
|
||||
Dividends and distributions
The organizational documents of entities in which we have an equity-method interest generally require distribution of available cash to members on at least a quarterly basis. These transactions reduced the carrying value of our investments and included:
|
Years Ended December 31,
|
|||||||||||
|
2015
|
2014
|
2013
|
|||||||||
|
|
(Millions)
|
||||||||||
|
Appalachia Midstream Investments
|
$
|
219
|
|
$
|
130
|
|
$
|
—
|
|
||
|
Discovery
|
116
|
|
36
|
|
12
|
|
|||||
|
Gulfstream
|
88
|
|
81
|
|
81
|
|
|||||
|
OPPL
|
45
|
|
27
|
|
27
|
|
|||||
|
UEOM
|
42
|
|
—
|
|
—
|
|
|||||
|
Caiman II
|
33
|
|
13
|
|
—
|
|
|||||
|
Delaware basin gas gathering system
|
33
|
|
—
|
|
—
|
|
|||||
|
Laurel Mountain
|
31
|
|
39
|
|
—
|
|
|||||
|
Access Midstream Investments
|
—
|
|
64
|
|
93
|
|
|||||
|
Other
|
26
|
|
50
|
|
34
|
|
|||||
|
$
|
633
|
|
$
|
440
|
|
$
|
247
|
|
|||
In addition, on September 24, 2015, WPZ received a special distribution of
$396 million
from Gulfstream reflecting its proportional share of the proceeds from new debt issued by Gulfstream. The new debt was issued to refinance Gulfstream’s debt maturities. Subsequently, WPZ contributed
$248 million
to Gulfstream for its proportional share of amounts necessary to fund debt maturities of
$500 million
due on November 1, 2015. WPZ also expects to contribute its proportional share of amounts necessary to fund debt maturities of
$300 million
due on June 1, 2016, as reflected by the accrued liability of
$149 million
in
Accrued liabilities
in the
Consolidated Balance Sheet
at December 31, 2015.
Summarized Financial Position and Results of Operations of All Equity-Method Investments
|
|
December 31,
|
||||||
|
|
2015
|
2014
|
|||||
|
|
(Millions)
|
||||||
|
Assets (liabilities):
|
|||||||
|
Current assets
|
$
|
773
|
|
$
|
599
|
|
|
|
Noncurrent assets
|
9,549
|
|
9,135
|
|
|||
|
Current liabilities
|
(633
|
)
|
(850
|
)
|
|||
|
Noncurrent liabilities
|
(1,450
|
)
|
(954
|
)
|
|||
|
|
Years Ended December 31,
|
||||||||||
|
|
2015
|
2014
|
2013
|
||||||||
|
|
(Millions)
|
||||||||||
|
Gross revenue
|
$
|
1,707
|
|
$
|
1,623
|
|
$
|
2,406
|
|
||
|
Operating income
|
690
|
|
534
|
|
699
|
|
|||||
|
Net income
|
611
|
|
460
|
|
627
|
|
|||||
110
|
The Williams Companies, Inc.
|
||||
|
Notes to Consolidated Financial Statements – (Continued)
|
||||
Note 6 – Other Income and Expenses
The following table presents certain gains or losses reflected in
Other (income) expense – net
within
Costs and expenses
in our
Consolidated Statement of Operations
:
|
|
Years Ended December 31,
|
||||||||||
|
|
2015
|
2014
|
2013
|
||||||||
|
|
(Millions)
|
||||||||||
|
Williams Partners
|
|||||||||||
|
Impairment of certain assets (See Note 17)
|
$
|
145
|
|
$
|
52
|
|
$
|
—
|
|
||
|
Amortization of regulatory assets associated with asset retirement obligations
|
33
|
|
33
|
|
30
|
|
|||||
|
Contingency gain settlement (1)
|
—
|
|
(154
|
)
|
—
|
|
|||||
|
Net gain related to partial acreage dedication release
|
—
|
|
(12
|
)
|
—
|
|
|||||
|
Loss related to sale of certain assets
|
—
|
|
10
|
|
—
|
|
|||||
|
Write-off of the Eminence abandonment regulatory asset not recoverable through rates
|
—
|
|
(3
|
)
|
12
|
|
|||||
|
Insurance recoveries associated with the Eminence abandonment
|
—
|
|
—
|
|
(16
|
)
|
|||||
|
Loss associated with a producer claim
|
—
|
|
—
|
|
25
|
|
|||||
|
Williams NGL & Petchem Services
|
|||||||||||
|
Impairment of certain assets (See Note 17)
|
64
|
|
—
|
|
20
|
|
|||||
________________
|
(1)
|
In November 2014, we settled a claim arising from the resolution of a contingent gain related to claims associated with the purchase of a business in a prior period. Pursuant to the settlement, we received $154 million in cash, all of which was recognized as a gain in the fourth quarter of 2014.
|
Geismar Incident
On June 13, 2013, an explosion and fire occurred at Williams Partners’ Geismar olefins plant. The incident rendered the facility temporarily inoperable (Geismar Incident).
In 2015, 2014, and 2013, we received
$126 million
,
$246 million
, and
$50 million
, respectively, of insurance recoveries related to the Geismar Incident. These amounts are reported within the Williams Partners segment and reflected as gains in
Net insurance recoveries – Geismar Incident
in our
Consolidated Statement of Operations
. Also, in 2014 and 2013, we incurred
$14 million
and
$10 million
, respectively, of covered insurable expenses in excess of our retentions (deductibles) also included in
Net insurance recoveries – Geismar Incident
in the
Consolidated Statement of Operations
and we expensed
$13 million
within the Williams Partners segment in 2013 of costs under our insurance deductibles reported in
Operating and maintenance expenses
in the
Consolidated Statement of Operations
.
ACMP Acquisition & Merger
Certain ACMP Acquisition and ACMP Merger costs included in
Selling, general, and administrative expenses
,
Operating and maintenance expenses
,
and
Interest incurred
in the
Consolidated Statement of Operations
are as follows:
|
•
|
Selling, general, and administrative expenses
includes
$26 million
in 2015 and
$27 million
in 2014 (including
$16 million
of ACMP Acquisition costs) primarily related to professional advisory fees associated with the ACMP Acquisition and ACMP Merger within the Williams Partners segment.
|
|
•
|
Selling, general, and administrative expenses
includes
$9 million
in 2015 and
$15 million
in 2014 of related employee transition costs from the ACMP Merger within the Williams Partners segment and
$32 million
in 2015 and
$10 million
in 2014 of general corporate expenses associated with integration and realignment of resources within the Other segment.
|
111
|
The Williams Companies, Inc.
|
||||
|
Notes to Consolidated Financial Statements – (Continued)
|
||||
|
•
|
Operating and maintenance expenses
includes
$12 million
in 2015 and
$15 million
in 2014 of transition costs from the ACMP Merger within the Williams Partners segment.
|
|
•
|
Interest incurred
includes transaction-related financing costs of
$2 million
in 2015 from the ACMP Merger and
$9 million
in 2014 from the ACMP Acquisition.
|
Additional Items
Certain items included in
Service revenues
,
Product costs
,
Selling, general, and administrative expenses
and
Other income (expense) – net
below
Operating income (loss)
in the
Consolidated Statement of Operations
are as follows:
|
•
|
Service revenues
includes
$239 million
recognized in the fourth quarter of 2015 and
$167 million
recognized in the fourth quarter of 2014 from minimum volume commitment fees within the Williams Partners segment.
|
|
•
|
Product costs
includes
$6 million
in 2015 and
$27 million
in 2014 of inventory adjustments within the Williams Partners segment.
|
|
•
|
Selling, general, and administrative expenses
includes
$30 million
in 2015 of costs associated with our evaluation of strategic alternatives within the Other segment.
|
|
•
|
Selling, general, and administrative expenses
includes
$18 million
in 2014 of project development costs related to the Bluegrass Pipeline reported within the Williams NGL & Petchem Services segment.
|
|
•
|
Other income (expense) – net
below
Operating income (loss)
includes
$95 million
,
$44 million
, and
$22 million
for equity AFUDC for 2015, 2014, and 2013, respectively. Equity AFUDC increased during 2015 due to the increase in spending on various Transco expansion projects and Constitution.
|
|
•
|
Other income (expense) – net
below
Operating income (loss)
includes a
$14 million
gain in 2015 resulting from the early retirement of certain debt within the Williams Partners segment.
|
Note 7 – Provision (Benefit) for Income Taxes
The
Provision (benefit) for income taxes
includes:
|
Years Ended December 31,
|
|||||||||||
|
2015
|
2014
|
2013
|
|||||||||
|
(Millions)
|
|||||||||||
|
Current:
|
|||||||||||
|
Federal
|
$
|
—
|
|
$
|
(9
|
)
|
$
|
(17
|
)
|
||
|
State
|
(7
|
)
|
2
|
|
7
|
|
|||||
|
Foreign
|
(55
|
)
|
10
|
|
(13
|
)
|
|||||
|
(62
|
)
|
3
|
|
(23
|
)
|
||||||
|
Deferred:
|
|||||||||||
|
Federal
|
(317
|
)
|
1,108
|
|
348
|
|
|||||
|
State
|
(25
|
)
|
119
|
|
40
|
|
|||||
|
Foreign
|
5
|
|
19
|
|
36
|
|
|||||
|
(337
|
)
|
1,246
|
|
424
|
|
||||||
|
Provision (benefit) for income taxes
|
$
|
(399
|
)
|
$
|
1,249
|
|
$
|
401
|
|
||
112
|
The Williams Companies, Inc.
|
||||
|
Notes to Consolidated Financial Statements – (Continued)
|
||||
Reconciliations from the
Provision (benefit) at statutory rate
to recorded
Provision (benefit) for income taxes
are as follows:
|
|
Years Ended December 31,
|
||||||||||
|
|
2015
|
2014
|
2013
|
||||||||
|
|
(Millions)
|
||||||||||
|
Provision (benefit) at statutory rate
|
$
|
(600
|
)
|
$
|
1,255
|
|
$
|
378
|
|
||
|
Increases (decreases) in taxes resulting from:
|
|||||||||||
|
Impact of nontaxable noncontrolling interests
|
263
|
|
(75
|
)
|
(78
|
)
|
|||||
|
State income taxes (net of federal benefit)
|
(21
|
)
|
82
|
|
26
|
|
|||||
|
Foreign operations – net
|
8
|
|
(11
|
)
|
(32
|
)
|
|||||
|
Taxes on undistributed earnings of foreign subsidiaries – net
|
—
|
|
(37
|
)
|
99
|
|
|||||
|
Translation adjustment of certain unrecognized tax benefits
|
(71
|
)
|
—
|
|
—
|
|
|||||
|
Other – net
|
22
|
|
35
|
|
8
|
|
|||||
|
Provision (benefit) for income taxes
|
$
|
(399
|
)
|
$
|
1,249
|
|
$
|
401
|
|
||
Income (loss) from continuing operations before income taxes
includes
$20 million
,
$102 million
, and
$119 million
of foreign income in
2015
,
2014
, and
2013
, respectively.
The 2015 federal and state income tax provisions include the tax effect of a
$2.7 billion
impairment loss associated with certain goodwill, equity-method investments, and other assets. (See
Note 17 – Fair Value Measurements, Guarantees, and Concentration of Credit Risk
). The
Translation adjustment of certain unrecognized tax benefits
in 2015 reflects the impact of changes in foreign currency exchange rates on the remeasurement of a foreign currency denominated unrecognized tax benefit, including associated penalties and interest.
The 2014 federal and state income tax provisions include the tax effect of a
$2.5 billion
gain associated with remeasuring our equity-method investment to fair value as a result of the ACMP Acquisition. (See
Note 2 – Acquisitions
).
On October 30, 2013, WPZ announced its intent to pursue an agreement to acquire certain of our Canadian operations. As a result, we no longer considered the undistributed earnings from these foreign operations to be permanently reinvested and thus recognized
$99 million
of deferred income tax expense in continuing operations and
$24 million
of deferred income tax benefit in AOCI during 2013.
Taxes on undistributed earnings of foreign subsidiaries – net
decreased in 2014 due to revisions of our estimate of the undistributed earnings, partially offset by an increase of tax expense, which decreased our share of the foreign tax credit due to the Canada Dropdown.
During the course of audits of our business by domestic and foreign tax authorities, we frequently face challenges regarding the amount of taxes due. These challenges include questions regarding the timing and amount of deductions and the allocation of income among various tax jurisdictions. In evaluating the liability associated with our various filing positions, we apply the two-step process of recognition and measurement. In association with this liability, we record an estimate of related interest and tax exposure as a component of our tax provision. The impact of this accrual is included within
Other – net
in our reconciliation of the
Provision (benefit) at statutory rate
to recorded
Provision (benefit) for income taxes
.
113
|
The Williams Companies, Inc.
|
||||
|
Notes to Consolidated Financial Statements – (Continued)
|
||||
Significant components of
Deferred income tax liabilities
and
Deferred income tax assets
are as follows:
|
|
December 31,
|
||||||
|
|
2015
|
2014
|
|||||
|
|
(Millions)
|
||||||
|
Deferred income tax liabilities:
|
|||||||
|
Property, plant, and equipment
|
$
|
4
|
|
$
|
4
|
|
|
|
Investments
|
5,272
|
|
5,472
|
|
|||
|
Other
|
15
|
|
10
|
|
|||
|
Total deferred income tax liabilities
|
5,291
|
|
5,486
|
|
|||
|
Deferred income tax assets:
|
|||||||
|
Accrued liabilities
|
150
|
|
178
|
|
|||
|
Minimum tax credits
|
139
|
|
137
|
|
|||
|
Foreign tax credit
|
193
|
|
251
|
|
|||
|
Federal loss carryovers
|
485
|
|
134
|
|
|||
|
State losses and credits
|
296
|
|
250
|
|
|||
|
Other
|
42
|
|
97
|
|
|||
|
Total deferred income tax assets
|
1,305
|
|
1,047
|
|
|||
|
Less valuation allowance
|
190
|
|
206
|
|
|||
|
Net deferred income tax assets
|
1,115
|
|
841
|
|
|||
|
Overall net deferred income tax liabilities
|
$
|
4,176
|
|
$
|
4,645
|
|
|
The valuation allowance at
December 31, 2015
and
2014
serves to reduce the available deferred income tax assets to an amount that will, more likely than not, be realized. We consider all available positive and negative evidence, including projected future taxable income, and have determined that a portion of our deferred income tax assets related to
State losses and credits
may not be realized. The change in
Valuation allowance
is due to this evaluation. The amounts presented in the table above are, with respect to state items, before any federal benefit. The change from prior year for the
State losses and credits
is primarily due to increases in losses and credits generated in the current and prior years less losses and/or credits utilized in the current year. We have loss and credit carryovers in multiple state taxing jurisdictions. These attributes generally expire between 2016 and 2035 with some carryovers having indefinite carryforward periods. The federal tax
Minimum tax credits
of
$139 million
currently has no expiration date.
Foreign tax credit
of
$139 million
is expected to be utilized prior to expiration in 2025. The remaining
Foreign tax credit
represents unrealized foreign tax credit that will be allocated to us in the future when deferred income tax liabilities associated with temporary differences on foreign assets and liabilities become current income tax liabilities in the foreign jurisdiction.
Federal net operating loss carryovers and charitable contribution carryovers of
$1.5 billion
at the end of 2015 are expected to be utilized by us prior to expiration between 2018 and 2035. Employee share-based compensation attributable to the exercise of stock options and vesting of restricted stock is deductible by us for tax purposes. To the extent these tax deductions exceed the previously accrued deferred income tax benefit for these items, the additional tax benefit is not recognized until the deduction reduces current income taxes payable. Since the additional tax benefit does not reduce our current income taxes payable for 2015 and 2014, these tax benefits are not included in our
Federal loss carryovers
deferred income tax assets. The additional tax benefits deductible for tax purposes but not included in our
Federal loss carryovers
deferred income tax assets were
$23 million
each for 2015 and
2014
.
Cash refunds for income taxes (net of payments and discontinued operations) were
$136 million
and
$50 million
in 2015 and 2013, respectively. Cash payments for income taxes (net of refunds) in 2014 were
$29 million
.
As of
December 31, 2015
, we had approximately
$55 million
of unrecognized tax benefits. If recognized, income tax expense would be reduced by
$51 million
, including the effect of these changes on other tax attributes, with state income tax amounts included net of federal tax effect. A reconciliation of the beginning and ending amount of unrecognized tax benefits is as follows:
114
|
The Williams Companies, Inc.
|
||||
|
Notes to Consolidated Financial Statements – (Continued)
|
||||
|
2015
|
2014
|
||||||
|
|
(Millions)
|
||||||
|
Balance at beginning of period
|
$
|
89
|
|
$
|
66
|
|
|
|
Additions based on tax positions related to the current year
|
—
|
|
11
|
|
|||
|
Additions for tax positions of prior years
|
2
|
|
12
|
|
|||
|
Reductions for tax positions of prior years
|
—
|
|
—
|
|
|||
|
Settlement with taxing authorities
|
—
|
|
—
|
|
|||
|
Changes due to currency translation
|
(36
|
)
|
—
|
|
|||
|
Balance at end of period
|
$
|
55
|
|
$
|
89
|
|
|
We recognize related interest and penalties as a component of
Provision (benefit) for income taxes
. Total interest and penalties recognized as part of income tax provision were benefits of
$22 million
for 2015, including a
$35 million
benefit due to currency fluctuation, and expense of
$8 million
and
$9 million
for 2014 and
2013
, respectively. Approximately
$2 million
and
$24 million
of interest and penalties primarily relating to uncertain tax positions have been accrued as of
December 31, 2015
and
2014
, respectively.
Changes due to currency translation
in 2015 reflects the unrecognized tax benefit portion of the previously described impact of changes in foreign currency exchange rates on the remeasurement of a foreign currency denominated balance.
During the next 12 months, we do not expect ultimate resolution of any unrecognized tax benefit associated with domestic or international matters to have a material impact on our unrecognized tax benefit position.
Consolidated U.S Federal income tax returns are open to IRS examination for years after 2010. As of December 31, 2015, examinations of tax returns for 2011 through 2013 are currently in process. We do not expect material changes in our financial position resulting from these examinations. The statute of limitations for most states expires one year after expiration of the IRS statute. Generally, tax returns for our Canadian entities are open to audit for tax years after 2010.
On September 13, 2013, the IRS issued final regulations providing guidance on the treatment of amounts paid to acquire, produce, or improve tangible property. On August 18, 2014, the IRS issued final regulations providing guidance on the dispositions of such property. The implementation date for these regulations was January 1, 2014. The IRS is expected to issue additional procedural guidance regarding how the requirements may be implemented for the gas transmission and distribution industry. Pending the issuance of this additional procedural guidance from the IRS, we cannot at this time estimate the impact of implementing the regulations for our gas transmission business, although we anticipate that it will result in an immaterial balance sheet only impact.
115
|
The Williams Companies, Inc.
|
||||
|
Notes to Consolidated Financial Statements – (Continued)
|
||||
|
Years Ended December 31,
|
|||||||||||
|
2015
|
2014
|
2013
|
|||||||||
|
(Dollars in millions, except per-share
amounts; shares in thousands)
|
|||||||||||
|
Income (loss) from continuing operations attributable to The Williams Companies, Inc. available to common stockholders for basic and diluted earnings (loss) per common share
|
$
|
(571
|
)
|
$
|
2,110
|
|
$
|
441
|
|
||
|
Basic weighted-average shares
|
749,271
|
|
719,325
|
|
682,948
|
|
|||||
|
Effect of dilutive securities:
|
|||||||||||
|
Nonvested restricted stock units
|
—
|
|
2,234
|
|
1,995
|
|
|||||
|
Stock options
|
—
|
|
2,064
|
|
2,149
|
|
|||||
|
Convertible debentures
|
—
|
|
18
|
|
93
|
|
|||||
|
Diluted weighted-average shares (1)
|
749,271
|
|
723,641
|
|
687,185
|
|
|||||
|
Earnings (loss) per common share from continuing operations:
|
|||||||||||
|
Basic
|
$
|
(.76
|
)
|
$
|
2.93
|
|
$
|
0.65
|
|
||
|
Diluted
|
$
|
(.76
|
)
|
$
|
2.91
|
|
$
|
0.64
|
|
||
|
(1)
|
For the year ended December 31, 2015,
1.7 million
weighted-average nonvested restricted stock units and
1.5 million
weighted-average stock options have been excluded from the computation of diluted earnings (loss) per common share as their inclusion would be antidilutive due to our loss from continuing operations attributable to The Williams Companies, Inc.
|
Note 9 – Employee Benefit Plans
We have noncontributory defined benefit pension plans in which all eligible employees participate. Currently, eligible employees earn benefits primarily based on a cash balance formula. Various other formulas, as defined in the plan documents, are utilized to calculate the retirement benefits for plan participants not covered by the cash balance formula. At the time of retirement, participants may elect, to the extent they are eligible for the various options, to receive annuity payments, a lump sum payment, or a combination of a lump sum and annuity payments. In addition to our pension plans, we currently provide subsidized retiree medical and life insurance benefits (other postretirement benefits) to certain eligible participants. Generally, employees hired after December 31, 1991, are not eligible for the subsidized retiree medical benefits, except for participants that were employees or retirees of Transco Energy Company on December 31, 1995, and other miscellaneous defined participant groups. Subsidized retiree medical benefits for eligible participants age 65 and older are paid through contributions to health reimbursement accounts. Subsidized retiree medical benefits for eligible participants under age 65 are provided through a self-insured medical plan sponsored by us. The self-insured retiree medical plan provides for retiree contributions and contains other cost-sharing features such as deductibles, co-payments, and co-insurance. The accounting for these plans anticipates estimated future increases to our contribution levels to the health reimbursement accounts for participants age 65 and older, as well as future cost-sharing that is consistent with our expressed intent to increase the retiree contribution level generally in line with health care cost increases for participants under age 65.
116
|
The Williams Companies, Inc.
|
||||
|
Notes to Consolidated Financial Statements – (Continued)
|
||||
Funded Status
The following table presents the changes in benefit obligations and plan assets for pension benefits and other postretirement benefits for the years indicated.
|
|
Pension Benefits
|
Other
Postretirement
Benefits
|
|||||||||||||
|
|
2015
|
2014
|
2015
|
2014
|
|||||||||||
|
|
(Millions)
|
||||||||||||||
|
Change in benefit obligation:
|
|||||||||||||||
|
Benefit obligation at beginning of year
|
$
|
1,544
|
|
$
|
1,384
|
|
$
|
233
|
|
$
|
213
|
|
|||
|
Service cost
|
59
|
|
40
|
|
2
|
|
2
|
|
|||||||
|
Interest cost
|
58
|
|
62
|
|
9
|
|
10
|
|
|||||||
|
Plan participants’ contributions
|
—
|
|
—
|
|
2
|
|
2
|
|
|||||||
|
Benefits paid
|
(101
|
)
|
(86
|
)
|
(13
|
)
|
(14
|
)
|
|||||||
|
Plan amendment
|
—
|
|
—
|
|
—
|
|
1
|
|
|||||||
|
Actuarial loss (gain)
|
(91
|
)
|
144
|
|
(31
|
)
|
21
|
|
|||||||
|
Settlements
|
(5
|
)
|
(3
|
)
|
—
|
|
(1
|
)
|
|||||||
|
Curtailments
|
—
|
|
—
|
|
—
|
|
(1
|
)
|
|||||||
|
Other
|
—
|
|
3
|
|
—
|
|
—
|
|
|||||||
|
Benefit obligation at end of year
|
1,464
|
|
1,544
|
|
202
|
|
233
|
|
|||||||
|
Change in plan assets:
|
|||||||||||||||
|
Fair value of plan assets at beginning of year
|
1,293
|
|
1,241
|
|
208
|
|
201
|
|
|||||||
|
Actual return on plan assets
|
(11
|
)
|
78
|
|
(1
|
)
|
13
|
|
|||||||
|
Employer contributions
|
65
|
|
63
|
|
5
|
|
6
|
|
|||||||
|
Plan participants’ contributions
|
—
|
|
—
|
|
2
|
|
2
|
|
|||||||
|
Benefits paid
|
(101
|
)
|
(86
|
)
|
(13
|
)
|
(14
|
)
|
|||||||
|
Settlements
|
(5
|
)
|
(3
|
)
|
—
|
|
—
|
|
|||||||
|
Fair value of plan assets at end of year
|
1,241
|
|
1,293
|
|
201
|
|
208
|
|
|||||||
|
Funded status — underfunded
|
$
|
(223
|
)
|
$
|
(251
|
)
|
$
|
(1
|
)
|
$
|
(25
|
)
|
|||
|
Accumulated benefit obligation
|
$
|
1,432
|
|
$
|
1,516
|
|
|||||||||
The underfunded status of our pension plans and other postretirement benefit plans presented in the previous table are recognized in the Consolidated Balance Sheet within the following accounts:
|
|
December 31,
|
||||||
|
|
2015
|
2014
|
|||||
|
|
(Millions)
|
||||||
|
Underfunded pension plans:
|
|||||||
|
Current liabilities
|
$
|
(2
|
)
|
$
|
(2
|
)
|
|
|
Noncurrent liabilities
|
(221
|
)
|
(249
|
)
|
|||
|
Underfunded other postretirement benefit plans:
|
|||||||
|
Current liabilities
|
(7
|
)
|
(7
|
)
|
|||
|
Noncurrent assets (liabilities)
|
6
|
|
(18
|
)
|
|||
The plan assets within our other postretirement benefit plans are intended to be used for the payment of benefits for certain groups of participants. The
Current liabilities
for the other postretirement benefit plans represent the current portion of benefits expected to be payable in the subsequent year for the groups of participants whose benefits are not expected to be paid from plan assets.
117
|
The Williams Companies, Inc.
|
||||
|
Notes to Consolidated Financial Statements – (Continued)
|
||||
The pension plans’ benefit obligation
Actuarial loss (gain)
of $
(91) million
in
2015
is primarily due to the impact of a decrease in the assumed future interest crediting rate for the cash balance pension formula and an increase in the discount rates utilized to calculate the benefit obligation. The pension plans’ benefit obligation
Actuarial loss (gain)
of
$144 million
in
2014
is primarily due to the impact of updated mortality tables reflecting increased estimated life expectancies and a decrease in the discount rates utilized to calculate the benefit obligation.
The
2015
benefit obligation
Actuarial loss (gain)
of $
(31) million
for our other postretirement benefit plans is primarily due to an increase in the discount rate used to calculate the benefit obligation, tax law changes, and other assumption changes. The
2014
benefit obligation
Actuarial loss (gain)
of
$21 million
for our other postretirement benefit plans is primarily due to the impact of the updated mortality tables and a decrease in the discount rates utilized to calculate the benefit obligation.
At
December 31, 2015
and
2014
, all of our pension plans had a projected benefit obligation and accumulated benefit obligation in excess of plan assets.
Pre-tax amounts not yet recognized in
Net periodic benefit cost
at December 31 are as follows:
|
|
Pension Benefits
|
Other
Postretirement
Benefits
|
|||||||||||||
|
|
2015
|
2014
|
2015
|
2014
|
|||||||||||
|
|
(Millions)
|
||||||||||||||
|
Amounts included in
Accumulated other comprehensive income (loss)
:
|
|||||||||||||||
|
Prior service credit
|
$
|
—
|
|
$
|
—
|
|
$
|
11
|
|
$
|
17
|
|
|||
|
Net actuarial loss
|
(544
|
)
|
(593
|
)
|
(18
|
)
|
(28
|
)
|
|||||||
|
Amounts included in regulatory liabilities associated with Transco and Northwest Pipeline:
|
|||||||||||||||
|
Prior service credit
|
N/A
|
|
N/A
|
|
$
|
19
|
|
$
|
30
|
|
|||||
|
Net actuarial gain (loss)
|
N/A
|
|
N/A
|
|
6
|
|
(4
|
)
|
|||||||
In addition to the regulatory liabilities included in the previous table, differences in the amount of actuarially determined
Net periodic benefit cost
for our other postretirement benefit plans and the other postretirement benefit costs recovered in rates for Transco and Northwest Pipeline are deferred as a regulatory asset or liability. We have regulatory liabilities of
$78 million
at
December 31, 2015
and
$62 million
at
December 31, 2014
, related to these deferrals. These amounts will be reflected in future rates based on the rate structures of these gas pipelines.
118
|
The Williams Companies, Inc.
|
||||
|
Notes to Consolidated Financial Statements – (Continued)
|
||||
Net Periodic Benefit Cost
Net periodic benefit cost
for the years ended December 31 consist of the following:
|
|
Pension Benefits
|
Other
Postretirement Benefits
|
|||||||||||||||||||||
|
|
2015
|
2014
|
2013
|
2015
|
2014
|
2013
|
|||||||||||||||||
|
|
(Millions)
|
||||||||||||||||||||||
|
Components of net periodic benefit cost:
|
|||||||||||||||||||||||
|
Service cost
|
$
|
59
|
|
$
|
40
|
|
$
|
44
|
|
$
|
2
|
|
$
|
2
|
|
$
|
2
|
|
|||||
|
Interest cost
|
58
|
|
62
|
|
51
|
|
9
|
|
10
|
|
11
|
|
|||||||||||
|
Expected return on plan assets
|
(75
|
)
|
(76
|
)
|
(61
|
)
|
(12
|
)
|
(12
|
)
|
(9
|
)
|
|||||||||||
|
Amortization of prior service cost (credit)
|
—
|
|
—
|
|
1
|
|
(17
|
)
|
(20
|
)
|
(12
|
)
|
|||||||||||
|
Amortization of net actuarial loss
|
42
|
|
39
|
|
60
|
|
2
|
|
—
|
|
4
|
|
|||||||||||
|
Net actuarial (gain) loss from settlements and curtailments
|
2
|
|
1
|
|
—
|
|
—
|
|
(1
|
)
|
—
|
|
|||||||||||
|
Reclassification to regulatory liability
|
—
|
|
—
|
|
—
|
|
3
|
|
4
|
|
2
|
|
|||||||||||
|
Net periodic benefit cost
|
$
|
86
|
|
$
|
66
|
|
$
|
95
|
|
$
|
(13
|
)
|
$
|
(17
|
)
|
$
|
(2
|
)
|
|||||
Items Recognized in Other Comprehensive Income (Loss) and Regulatory Assets/Liabilities
Other changes in plan assets and benefit obligations recognized in
Other comprehensive income (loss)
before taxes for the years ended December 31 consist of the following:
|
|
Pension Benefits
|
|
Other
Postretirement Benefits
|
||||||||||||||||||||
|
|
2015
|
|
2014
|
|
2013
|
|
2015
|
|
2014
|
|
2013
|
||||||||||||
|
|
(Millions)
|
||||||||||||||||||||||
|
Other changes in plan assets and benefit obligations recognized in
Other comprehensive income (loss)
:
|
|
|
|
|
|
|
|
|
|
|
|
||||||||||||
|
Net actuarial gain (loss)
|
$
|
5
|
|
|
$
|
(142
|
)
|
|
$
|
277
|
|
|
$
|
8
|
|
|
$
|
(18
|
)
|
|
$
|
23
|
|
|
Prior service (cost) credit
|
—
|
|
|
—
|
|
|
—
|
|
|
—
|
|
|
(1
|
)
|
|
23
|
|
||||||
|
Amortization of prior service cost (credit)
|
—
|
|
|
—
|
|
|
1
|
|
|
(6
|
)
|
|
(8
|
)
|
|
(4
|
)
|
||||||
|
Amortization of net actuarial loss
|
42
|
|
|
39
|
|
|
60
|
|
|
2
|
|
|
—
|
|
|
1
|
|
||||||
|
Loss from settlements and curtailments
|
2
|
|
1
|
|
—
|
|
—
|
|
1
|
|
—
|
|
|||||||||||
|
Other changes in plan assets and benefit obligations recognized in
Other comprehensive income (loss)
|
$
|
49
|
|
|
$
|
(102
|
)
|
|
$
|
338
|
|
|
$
|
4
|
|
|
$
|
(26
|
)
|
|
$
|
43
|
|
Other changes in plan assets and benefit obligations for our other postretirement benefit plans associated with Transco and Northwest Pipeline are recognized in regulatory assets/liabilities.
Amounts recognized in regulatory assets/ liabilities for the years ended December 31 consist of the following:
|
|
2015
|
2014
|
2013
|
|||||||||
|
|
(Millions)
|
|||||||||||
|
Other changes in plan assets and benefit obligations recognized in
regulatory (assets) liabilities:
|
||||||||||||
|
Net actuarial gain (loss)
|
$
|
10
|
|
$
|
(2
|
)
|
$
|
62
|
|
|||
|
Prior service credit
|
—
|
|
—
|
|
36
|
|
||||||
|
Amortization of prior service credit
|
(11
|
)
|
(12
|
)
|
(8
|
)
|
||||||
|
Amortization of net actuarial loss
|
—
|
|
—
|
|
3
|
|
||||||
119
|
The Williams Companies, Inc.
|
||||
|
Notes to Consolidated Financial Statements – (Continued)
|
||||
Pre-tax amounts expected to be amortized in
Net periodic benefit cost
in
2016
are as follows:
|
Pension
Benefits
|
Other
Postretirement
Benefits
|
||||||
|
|
(Millions)
|
||||||
|
Amounts included in
Accumulated other comprehensive income (loss)
:
|
|||||||
|
Prior service credit
|
$
|
—
|
|
$
|
(6
|
)
|
|
|
Net actuarial loss
|
31
|
|
—
|
|
|||
|
Amounts included in regulatory liabilities associated with Transco and Northwest Pipeline:
|
|||||||
|
Prior service credit
|
N/A
|
|
$
|
(9
|
)
|
||
|
Net actuarial loss
|
N/A
|
|
—
|
|
|||
Key Assumptions
The weighted-average assumptions utilized to determine benefit obligations as of December 31 are as follows:
|
|
Pension Benefits
|
Other
Postretirement
Benefits
|
|||||||||
|
|
2015
|
2014
|
2015
|
2014
|
|||||||
|
Discount rate
|
4.38
|
%
|
3.96
|
%
|
4.50
|
%
|
4.12
|
%
|
|||
|
Rate of compensation increase
|
4.88
|
|
4.62
|
|
N/A
|
N/A
|
|||||
The weighted-average assumptions utilized to determine
Net periodic benefit cost
for the years ended December 31 are as follows:
|
|
Pension Benefits
|
Other
Postretirement Benefits
|
|||||||||||||||
|
|
2015
|
2014
|
2013
|
2015
|
2014
|
2013
|
|||||||||||
|
Discount rate
|
3.96
|
%
|
4.68
|
%
|
3.43
|
%
|
4.12
|
%
|
4.80
|
%
|
3.97
|
%
|
|||||
|
Expected long-term rate of return on plan assets
|
6.38
|
|
6.85
|
|
5.90
|
|
5.70
|
|
6.11
|
|
5.26
|
|
|||||
|
Rate of compensation increase
|
4.62
|
|
4.56
|
|
4.57
|
|
N/A
|
N/A
|
N/A
|
||||||||
Effective December 31, 2014, the mortality assumptions used to determine the benefit obligations for our pension and other postretirement benefit plans were updated to reflect generational projection mortality tables. These mortality tables generally reflect increased estimated life expectancy.
The assumed health care cost trend rate for
2016
is
7.9
percent. This rate
decreases
to
4.5
percent by
2025
. A one-percentage-point change in assumed health care cost trend rates would have the following effects:
|
Point increase
|
Point decrease
|
||||||
|
|
(Millions)
|
||||||
|
Effect on total of service and interest cost components
|
$
|
—
|
|
$
|
—
|
|
|
|
Effect on other postretirement benefit obligation
|
7
|
|
(6
|
)
|
|||
Plan Assets
Plan assets for our pension and other postretirement benefit plans consist primarily of equity and fixed income securities including commingled investment funds invested in equity and fixed income securities. The plans’ investment policy provides for a strategy in accordance with the Employee Retirement Income Security Act (ERISA), which governs the investment of the assets in a diversified portfolio. The plans follow a policy of diversifying the investments
120
|
The Williams Companies, Inc.
|
||||
|
Notes to Consolidated Financial Statements – (Continued)
|
||||
across various asset classes and investment managers. Additionally, the investment returns on approximately
38
percent of the other postretirement benefit plan assets are subject to income tax; therefore, certain investments are managed in a tax efficient manner.
The investment policy for the pension plans includes a general target asset allocation at
December 31, 2015
of
60
percent equity securities and
40
percent fixed income securities. The target allocation includes the investments in equity and fixed income commingled investment funds. The investment policy allows for a broad range of asset allocations that permit the plans to de-risk in response to changes in the plans’ funded status.
Equity securities may include U.S. equities and non-U.S. equities. Investment in Williams’ securities or an entity in which Williams has a majority ownership is prohibited in the pension plans except where these securities may be owned in a commingled investment fund in which the plans’ trusts invest. No more than
5
percent of the total stock portfolio valued at market may be invested in the common stock of any one corporation.
Fixed income securities may consist of U.S. as well as international instruments, including emerging markets. The fixed income strategies may invest in government, corporate, asset-backed securities, and mortgage-backed obligations. The weighted-average credit rating of the fixed income strategies must be at least “investment grade” including ratings by Moody’s and/or Standard & Poor’s. No more than
5
percent of the total fixed income portfolio may be invested in the fixed income securities of any one issuer with the exception of bond index funds and U.S. government guaranteed and agency securities.
The following securities and transactions are not authorized: unregistered securities, commodities or commodity contracts, short sales or margin transactions, or other leveraging strategies. Investment strategies using direct investments in derivative securities require approval and, historically, have not been used; however, these instruments may be used in commingled investment funds. Additionally, real estate equity, natural resource property, venture capital, leveraged buyouts, and other high-return, high-risk investments are generally restricted.
As of December 31,
2015
, 12 active investment managers and one passive investment manager managed substantially all of the pension plans’ funds and the other postretirement benefit plans’ funds were substantially managed by four active investment managers and one passive investment manager. Each of the managers had responsibility for managing a specific portion of these assets and each investment manager was responsible for
1
percent to
28
percent of the assets.
There are no significant concentrations of risk within the plans’ investment securities because of the diversity of the types of investments, diversity of the various industries, and the diversity of the fund managers and investment strategies. Generally, the investments held in the plans are publicly traded, therefore, minimizing liquidity risk in the portfolio.
121
|
The Williams Companies, Inc.
|
||||
|
Notes to Consolidated Financial Statements – (Continued)
|
||||
The fair values of our pension plan assets at
December 31, 2015
and
2014
by asset class are as follows:
|
|
2015
|
||||||||||||||
|
|
Quoted Prices
in Active Markets for Identical Assets (Level 1) |
Significant
Other Observable Inputs (Level 2) |
Significant
Unobservable Inputs (Level 3) |
Total
|
|||||||||||
|
|
(Millions)
|
||||||||||||||
|
Pension assets:
|
|||||||||||||||
|
Cash management fund
|
$
|
8
|
|
$
|
—
|
|
$
|
—
|
|
$
|
8
|
|
|||
|
Equity securities:
|
|||||||||||||||
|
U.S. large cap
|
83
|
|
—
|
|
—
|
|
83
|
|
|||||||
|
U.S. small cap
|
64
|
|
—
|
|
—
|
|
64
|
|
|||||||
|
Fixed income securities (1):
|
|||||||||||||||
|
U.S. Treasury securities
|
65
|
|
—
|
|
—
|
|
65
|
|
|||||||
|
Government and municipal bonds
|
—
|
|
8
|
|
—
|
|
8
|
|
|||||||
|
Mortgage and asset-backed securities
|
—
|
|
87
|
|
—
|
|
87
|
|
|||||||
|
Corporate bonds
|
—
|
|
145
|
|
—
|
|
145
|
|
|||||||
|
Insurance company investment contracts and other
|
—
|
|
5
|
|
—
|
|
5
|
|
|||||||
|
$
|
220
|
|
$
|
245
|
|
$
|
—
|
|
465
|
|
|||||
|
Commingled investment funds measured at net asset value practical expedient (3):
|
|||||||||||||||
|
Equities — U.S. large cap
|
367
|
|
|||||||||||||
|
Equities — International small cap
|
27
|
|
|||||||||||||
|
Equities — International emerging markets
|
50
|
|
|||||||||||||
|
Equities — International developed markets
|
153
|
|
|||||||||||||
|
Fixed income — U.S. long duration
|
95
|
|
|||||||||||||
|
Fixed income — Corporate bonds
|
84
|
|
|||||||||||||
|
Total assets at fair value at December 31, 2015
|
$
|
1,241
|
|
||||||||||||
122
|
The Williams Companies, Inc.
|
||||
|
Notes to Consolidated Financial Statements – (Continued)
|
||||
|
|
2014
|
||||||||||||||
|
|
Quoted Prices
in Active Markets for Identical Assets (Level 1) |
Significant
Other Observable Inputs (Level 2) |
Significant
Unobservable Inputs (Level 3) |
Total
|
|||||||||||
|
|
(Millions)
|
||||||||||||||
|
Pension assets:
|
|||||||||||||||
|
Cash management fund
|
$
|
25
|
|
$
|
—
|
|
$
|
—
|
|
$
|
25
|
|
|||
|
Equity securities:
|
|||||||||||||||
|
U.S. large cap
|
221
|
|
—
|
|
—
|
|
221
|
|
|||||||
|
U.S. small cap
|
139
|
|
—
|
|
—
|
|
139
|
|
|||||||
|
International developed markets large cap growth
|
—
|
|
60
|
|
—
|
|
60
|
|
|||||||
|
Fixed income securities (1):
|
|||||||||||||||
|
U.S. Treasury securities
|
31
|
|
—
|
|
—
|
|
31
|
|
|||||||
|
Mortgage-backed securities
|
—
|
|
65
|
|
—
|
|
65
|
|
|||||||
|
Corporate bonds
|
—
|
|
222
|
|
—
|
|
222
|
|
|||||||
|
Insurance company investment contracts and other
|
—
|
|
7
|
|
—
|
|
7
|
|
|||||||
|
$
|
416
|
|
$
|
354
|
|
$
|
—
|
|
770
|
|
|||||
|
Commingled investment funds measured at net asset value practical expedient (3):
|
|||||||||||||||
|
Equities — U.S. large cap
|
189
|
|
|||||||||||||
|
Equities — International small cap
|
24
|
|
|||||||||||||
|
Equities — Emerging markets value
|
27
|
|
|||||||||||||
|
Equities — Emerging markets growth
|
19
|
|
|||||||||||||
|
Equities — International developed markets large cap value
|
101
|
|
|||||||||||||
|
Fixed income — Corporate bonds
|
163
|
|
|||||||||||||
|
Total assets at fair value at December 31, 2014
|
$
|
1,293
|
|
||||||||||||
123
|
The Williams Companies, Inc.
|
||||
|
Notes to Consolidated Financial Statements – (Continued)
|
||||
The fair values of our other postretirement benefits plan assets at
December 31, 2015
and
2014
by asset class are as follows:
|
|
2015
|
||||||||||||||
|
|
Quoted Prices
in Active Markets for Identical Assets (Level 1) |
Significant
Other Observable Inputs (Level 2) |
Significant
Unobservable Inputs (Level 3) |
Total
|
|||||||||||
|
|
(Millions)
|
||||||||||||||
|
Other postretirement benefit assets:
|
|||||||||||||||
|
Cash management funds
|
$
|
11
|
|
$
|
—
|
|
$
|
—
|
|
$
|
11
|
|
|||
|
Equity securities:
|
|||||||||||||||
|
U.S. large cap
|
37
|
|
—
|
|
—
|
|
37
|
|
|||||||
|
U.S. small cap
|
20
|
|
—
|
|
—
|
|
20
|
|
|||||||
|
International developed markets large cap growth
|
1
|
|
9
|
|
—
|
|
10
|
|
|||||||
|
Emerging markets growth
|
—
|
|
1
|
|
—
|
|
1
|
|
|||||||
|
Fixed income securities (2):
|
|||||||||||||||
|
U.S. Treasury securities
|
7
|
|
—
|
|
—
|
|
7
|
|
|||||||
|
Government and municipal bonds
|
—
|
|
12
|
|
—
|
|
12
|
|
|||||||
|
Mortgage and asset-backed securities
|
—
|
|
9
|
|
—
|
|
9
|
|
|||||||
|
Corporate bonds
|
—
|
|
15
|
|
—
|
|
15
|
|
|||||||
|
$
|
76
|
|
$
|
46
|
|
$
|
—
|
|
122
|
|
|||||
|
Commingled investment funds measured at net asset value practical expedient (3):
|
|||||||||||||||
|
Equities — U.S. large cap
|
37
|
|
|||||||||||||
|
Equities — International small cap
|
3
|
|
|||||||||||||
|
Equities — International emerging markets
|
5
|
|
|||||||||||||
|
Equities — International developed markets
|
16
|
|
|||||||||||||
|
Fixed income — U.S. long duration
|
10
|
|
|||||||||||||
|
Fixed income — Corporate bonds
|
8
|
|
|||||||||||||
|
Total assets at fair value at December 31, 2015
|
$
|
201
|
|
||||||||||||
124
|
The Williams Companies, Inc.
|
||||
|
Notes to Consolidated Financial Statements – (Continued)
|
||||
|
|
2014
|
||||||||||||||
|
|
Quoted Prices
in Active Markets for Identical Assets (Level 1) |
Significant
Other Observable Inputs (Level 2) |
Significant
Unobservable Inputs (Level 3) |
Total
|
|||||||||||
|
|
(Millions)
|
||||||||||||||
|
Other postretirement benefit assets:
|
|||||||||||||||
|
Cash management funds
|
$
|
13
|
|
$
|
—
|
|
$
|
—
|
|
$
|
13
|
|
|||
|
Equity securities:
|
|||||||||||||||
|
U.S. large cap
|
53
|
|
—
|
|
—
|
|
53
|
|
|||||||
|
U.S. small cap
|
28
|
|
—
|
|
—
|
|
28
|
|
|||||||
|
International developed markets large cap growth
|
—
|
|
15
|
|
—
|
|
15
|
|
|||||||
|
Emerging markets growth
|
1
|
|
2
|
|
—
|
|
3
|
|
|||||||
|
Fixed income securities (2):
|
|||||||||||||||
|
U.S. Treasury securities
|
3
|
|
—
|
|
—
|
|
3
|
|
|||||||
|
Government and municipal bonds
|
—
|
|
11
|
|
—
|
|
11
|
|
|||||||
|
Mortgage-backed securities
|
—
|
|
7
|
|
—
|
|
7
|
|
|||||||
|
Corporate bonds
|
—
|
|
23
|
|
—
|
|
23
|
|
|||||||
|
$
|
98
|
|
$
|
58
|
|
$
|
—
|
|
156
|
|
|||||
|
Commingled investment funds measured at net asset value practical expedient (3):
|
|||||||||||||||
|
Equities — U.S. large cap
|
19
|
|
|||||||||||||
|
Equities — International small cap
|
2
|
|
|||||||||||||
|
Equities — Emerging markets value
|
3
|
|
|||||||||||||
|
Equities — Emerging markets growth
|
2
|
|
|||||||||||||
|
Equities — International developed markets large cap value
|
10
|
|
|||||||||||||
|
Fixed income — Corporate bonds
|
16
|
|
|||||||||||||
|
Total assets at fair value at December 31, 2014
|
$
|
208
|
|
||||||||||||
____________
|
(1)
|
The weighted-average credit quality rating of the pension assets fixed income security portfolio is investment grade with a weighted-average duration of approximately
8
years for
2015
and
6
years for
2014
.
|
|
(2)
|
The weighted-average credit quality rating of the other postretirement benefit assets fixed income security portfolio is investment grade with a weighted-average duration of approximately
7
years for
2015
and
5
years for
2014
.
|
|
(3)
|
In accordance with our adoption of ASU 2015-07, investments measured at fair value using the net asset value per share (or its equivalent) practical expedient have not been classified within the fair value hierarchy. (See
Note 1 – General, Description of Business, Basis of Presentation, and Summary of Significant Accounting Policies
.)
|
The stated intents of the funds vary based on each commingled fund’s investment objective. These objectives generally include strategies to replicate or outperform various market indices. Certain standard withdrawal restrictions generally apply, which may include redemption notification period restrictions ranging from
10
to
30
days. Additionally, the fund managers retain the right to restrict withdrawals from and/or purchases into the funds so as not to disadvantage other investors in the funds. Generally, the funds also reserve the right to make all or a portion of the redemption in-kind rather than in cash or a combination of cash and in-kind.
125
|
The Williams Companies, Inc.
|
||||
|
Notes to Consolidated Financial Statements – (Continued)
|
||||
The fair value measurement level within the fair value hierarchy is based on the lowest level of any input that is significant to the fair value measurement of an asset.
Shares of the cash management funds are valued at fair value based on published market prices as of the close of business on the last business day of the year, which represents the net asset values of the shares held.
The fair values of equity securities traded on U.S. exchanges are derived from quoted market prices as of the close of business on the last business day of the year. The fair values of equity securities traded on foreign exchanges are also derived from quoted market prices as of the close of business on an active foreign exchange on the last business day of the year. However, the valuation requires translation of the foreign currency to U.S. dollars and this translation is considered an observable input to the valuation.
The fair values of all commingled investment funds are determined based on the net asset values per unit of each of the funds. The net asset values per unit represent the aggregate value of the fund’s assets at fair value less liabilities, divided by the number of units outstanding.
The fair values of fixed income securities, except U.S. Treasury securities, are determined using pricing models. These pricing models incorporate observable inputs such as benchmark yields, reported trades, broker/dealer quotes, and issuer spreads for similar securities to determine fair value. The U.S. Treasury securities are valued at fair value based on closing prices on the last business day of the year reported in the active market in which the security is traded.
The investment contracts with insurance companies are valued at fair value by discounting the cash flow of a bond using a yield to maturity based on an investment grade index or comparable index with a similar maturity value, maturity period, and nominal coupon rate.
There have been no significant changes in the preceding valuation methodologies used at
December 31, 2015
and
2014
. Additionally, there were no transfers or reclassifications of investments between Level 1 and Level 2 from December
2014
to December
2015
. If transfers between levels had occurred, the transfers would have been recognized as of the end of the period.
Plan Benefit Payments and Employer Contributions
Following are the expected benefits to be paid by the plans. These estimates are based on the same assumptions previously discussed and reflect future service as appropriate. The actuarial assumptions are based on long-term expectations and include, but are not limited to, assumptions as to average expected retirement age and form of benefit payment. Actual benefit payments could differ significantly from expected benefit payments if near-term participant behaviors differ significantly from the actuarial assumptions.
|
Pension
Benefits
|
Other
Postretirement
Benefits
|
||||||
|
|
(Millions)
|
||||||
|
2016
|
$
|
95
|
|
$
|
13
|
|
|
|
2017
|
102
|
|
13
|
|
|||
|
2018
|
105
|
|
13
|
|
|||
|
2019
|
106
|
|
13
|
|
|||
|
2020
|
110
|
|
14
|
|
|||
|
2021-2025
|
578
|
|
66
|
|
|||
In
2016
, we expect to contribute approximately
$60 million
to our tax-qualified pension plans and approximately
$2 million
to our nonqualified pension plans, for a total of approximately
$62 million
, and approximately
$7 million
to our other postretirement benefit plans.
126
|
The Williams Companies, Inc.
|
||||
|
Notes to Consolidated Financial Statements – (Continued)
|
||||
Defined Contribution Plans
We also maintain defined contribution plans for the benefit of substantially all of our employees. Generally, plan participants may contribute a portion of their compensation on a pre-tax and after-tax basis in accordance with the plans’ guidelines. We match employees’ contributions up to certain limits. Our matching contributions charged to expense were
$39 million
in
2015
,
$39 million
in
2014
, and
$27 million
in
2013
. The increase in expense beginning in 2014 is primarily due to the impact of the consolidation of ACMP beginning in the third quarter of 2014. (See
Note 2 – Acquisitions
.)
|
December 31,
|
|||||||
|
2015
|
2014
|
||||||
|
(Millions)
|
|||||||
|
Natural gas liquids, olefins, and natural gas in underground storage
|
$
|
57
|
|
$
|
150
|
|
|
|
Materials, supplies, and other
|
70
|
|
81
|
|
|||
|
$
|
127
|
|
$
|
231
|
|
||
The following table presents nonregulated and regulated
Property, plant, and equipment – net
as presented on the
Consolidated Balance Sheet
for the years ended:
|
Estimated
Useful Life (1)
(Years)
|
Depreciation
Rates (1)
(%)
|
December 31,
|
|||||||||
|
2015
|
|
2014
|
|||||||||
|
|
|
|
(Millions)
|
||||||||
|
Nonregulated:
|
|||||||||||
|
Natural gas gathering and processing facilities
|
5 - 40
|
$
|
20,789
|
|
$
|
18,749
|
|
||||
|
Construction in progress
|
Not applicable
|
1,366
|
|
2,648
|
|
||||||
|
Other
|
2 - 45
|
2,170
|
|
1,850
|
|
||||||
|
Regulated:
|
|||||||||||
|
Natural gas transmission facilities
|
1.20 - 6.97
|
12,189
|
|
10,867
|
|
||||||
|
Construction in progress
|
Not applicable
|
Not applicable
|
941
|
|
985
|
|
|||||
|
Other
|
5 - 45
|
1.35 - 33.33
|
1,584
|
|
1,336
|
|
|||||
|
Total property, plant, and equipment, at cost
|
39,039
|
|
36,435
|
|
|||||||
|
Accumulated depreciation and amortization
|
(9,460
|
)
|
(8,354
|
)
|
|||||||
|
Property, plant, and equipment — net
|
$
|
29,579
|
|
$
|
28,081
|
|
|||||
__________
|
(1)
|
Estimated useful life and depreciation rates are presented as of December 31,
2015
. Depreciation rates and estimated useful lives for regulated assets are prescribed by the FERC.
|
Depreciation and amortization expense for
Property, plant, and equipment – net
was
$1,382 million
,
$967 million
, and
$752 million
in
2015
,
2014
, and
2013
, respectively.
Regulated
Property, plant, and equipment – net
includes approximately
$706 million
and
$746 million
at December 31,
2015
and
2014
, respectively, related to amounts in excess of the original cost of the regulated facilities within our gas pipeline businesses as a result of our prior acquisitions. This amount is being amortized over
40 years
using the straight-line amortization method. Current FERC policy does not permit recovery through rates for amounts in excess of original cost of construction.
127
|
The Williams Companies, Inc.
|
||||
|
Notes to Consolidated Financial Statements – (Continued)
|
||||
Asset Retirement Obligations
Our accrued obligations relate to underground storage caverns, offshore platforms and pipelines, fractionation and compression facilities, gas gathering well connections and pipelines, and gas transmission facilities. At the end of the useful life of each respective asset, we are legally obligated to plug storage caverns and remove any related surface equipment, to restore land and remove surface equipment at gas processing, fractionation, and compression facilities, to dismantle offshore platforms and appropriately abandon offshore pipelines, to cap certain gathering pipelines at the wellhead connection and remove any related surface equipment, and to remove certain components of gas transmission facilities from the ground.
The following table presents the significant changes to our ARO, of which
$858 million
and
$791 million
are included in
Other noncurrent liabilities
with the remaining current portion in
Accrued liabilities
at December 31,
2015
and
2014
, respectively.
|
|
December 31,
|
||||||
|
|
2015
|
2014
|
|||||
|
|
(Millions)
|
||||||
|
Beginning balance
|
$
|
831
|
|
$
|
561
|
|
|
|
Liabilities incurred
|
42
|
|
101
|
|
|||
|
Liabilities settled (1)
|
(3
|
)
|
(21
|
)
|
|||
|
Accretion expense
|
60
|
|
44
|
|
|||
|
Revisions (2)
|
(15
|
)
|
146
|
|
|||
|
Ending balance
|
$
|
915
|
|
$
|
831
|
|
|
___________
|
(1)
|
For 2014, liabilities settled include
$7 million
related to the abandonment of certain of Transco’s natural gas storage caverns that are associated with a leak in 2010.
|
|
(2)
|
Several factors are considered in the annual review process, including inflation rates, current estimates for removal cost, discount rates, and the estimated remaining useful life of the assets. The 2015 revisions reflect changes in removal cost estimates and the estimated remaining useful life of assets, a decrease in the inflation rate, and increases in the discount rates used in the annual review process. The 2014 revisions primarily reflect an increase in the estimated retirement costs for our offshore pipelines, an increase in the inflation rate, and decreases in the discount rates used in the annual review process.
|
The funds Transco collects through a portion of its rates to fund its ARO are deposited into an external trust account dedicated to funding its ARO (ARO Trust). (See
Note 17 – Fair Value Measurements, Guarantees, and Concentration of Credit Risk
.) Under its current rate settlement, Transco’s annual funding obligation is approximately
$36 million
, with installments to be deposited monthly.
Goodwill
Changes in the carrying amount of goodwill by reportable segment for the periods indicated are as follows:
|
Williams Partners
|
|||
|
(Millions)
|
|||
|
December 31, 2014
|
$
|
1,120
|
|
|
Purchase accounting adjustment
|
25
|
|
|
|
Impairment
|
(1,098
|
)
|
|
|
December 31, 2015
|
$
|
47
|
|
128
|
The Williams Companies, Inc.
|
||||
|
Notes to Consolidated Financial Statements – (Continued)
|
||||
Our goodwill is not subject to amortization, but is evaluated at least annually for impairment or more frequently if impairment indicators are present. We did not identify or recognize any impairments to goodwill in connection with our annual evaluation of goodwill for impairment (performed as of October 1) during the years ended December 31,
2014
and
2013
. During 2015, we performed an interim assessment of certain goodwill within the Williams Partners segment as of September 30, 2015, but the estimated fair value of the reporting unit evaluated exceeded its carrying amount and thus no impairment charge was recognized. We performed an additional goodwill impairment evaluation as of
December 31, 2015
, of the goodwill recorded within the Williams Partners segment. As a result of this evaluation, we recorded goodwill impairment charges totaling
$1.098 billion
. (See
Note 17 – Fair Value Measurements, Guarantees, and Concentration of Credit Risk
.)
Other Intangible Assets
The gross carrying amount and accumulated amortization of
Other intangible assets – net of accumulated amortization
at December 31 are as follows:
|
2015
|
2014
|
||||||||||||||
|
Gross Carrying Amount
|
Accumulated Amortization
|
Gross Carrying Amount
|
Accumulated Amortization
|
||||||||||||
|
(Millions)
|
|||||||||||||||
|
Contractual customer relationships
|
$
|
10,633
|
|
$
|
(663
|
)
|
$
|
10,763
|
|
$
|
(310
|
)
|
|||
Other intangible assets – net of accumulated amortization
primarily relate to gas gathering, processing, and fractionation contractual customer relationships recognized in the ACMP and Eagle Ford acquisitions (See
Note 2 – Acquisitions
) as well as the 2012 acquisitions from Delphi Midstream Partners, LLC (Laser) and Caiman Energy, LLC (Caiman). The decrease in the gross carrying amount of
Other intangible assets – net of accumulated amortization
during 2015 is primarily related to the
$168 million
decrease from the purchase price allocation adjustment recorded for the ACMP acquisition in the first quarter of 2015, partially offset by the
$32 million
increase due to the Eagle Ford acquisition in the second quarter of 2015 (see
Note 2 – Acquisitions
). The intangible assets are being amortized on a straight-line basis over an initial period of 30 years which represents a portion of the term over which the contractual customer relationships are expected to contribute to our cash flows.
We expense costs incurred to renew or extend the terms of our gas gathering, processing, and fractionation contracts with customers. Based on the estimated future revenues during the contract periods (as estimated at the time of the respective acquisition), the weighted-average periods prior to the next renewal or extension of the contractual customer relationships associated with the ACMP, Eagle Ford, Laser, and Caiman acquisitions were approximately
17 years
,
10 years
,
9 years
, and
18 years
, respectively. Although a significant portion of the expected future cash flows associated with these contractual customer relationships are dependent on our ability to renew or extend the arrangements beyond the initial contract periods, these expected future cash flows are significantly influenced by the scope and pace of our producer customers’ drilling programs. Once producer customers’ wells are connected to our gathering infrastructure, their likelihood of switching to another provider before the wells are abandoned is reduced due to the significant capital investment required.
The amortization expense related to
Other intangible assets – net of accumulated amortization
was
$353 million
,
$209 million
, and
$60 million
in
2015
,
2014
, and
2013
, respectively. The estimated amortization expense for each of the next five succeeding fiscal years is approximately $354 million.
129
|
The Williams Companies, Inc.
|
||||
|
Notes to Consolidated Financial Statements – (Continued)
|
||||
|
|
December 31,
|
||||||
|
|
2015
|
2014
|
|||||
|
|
(Millions)
|
||||||
|
Interest on debt
|
$
|
284
|
|
$
|
268
|
|
|
|
Employee costs
|
215
|
|
167
|
|
|||
|
Special distribution repayable to Gulfstream (See Note 5 - Investing Activities)
|
149
|
|
—
|
|
|||
|
Deferred income
|
94
|
|
82
|
|
|||
|
Asset retirement obligations
|
57
|
|
40
|
|
|||
|
Other, including other loss contingencies
|
279
|
|
343
|
|
|||
|
$
|
1,078
|
|
$
|
900
|
|
||
Note 14 – Debt, Banking Arrangements, and Leases
|
December 31,
|
|||||||
|
|
2015
|
2014
|
|||||
|
|
(Millions)
|
||||||
|
Unsecured:
|
|||||||
|
Transco:
|
|||||||
|
6.4% Notes due 2016 (2)
|
$
|
200
|
|
$
|
200
|
|
|
|
6.05% Notes due 2018
|
250
|
|
250
|
|
|||
|
7.08% Debentures due 2026
|
8
|
|
8
|
|
|||
|
7.25% Debentures due 2026
|
200
|
|
200
|
|
|||
|
5.4% Notes due 2041
|
375
|
|
375
|
|
|||
|
4.45% Notes due 2042
|
400
|
|
400
|
|
|||
|
Northwest Pipeline:
|
|
||||||
|
7% Notes due 2016
|
175
|
|
175
|
|
|||
|
5.95% Notes due 2017
|
185
|
|
185
|
|
|||
|
6.05% Notes due 2018
|
250
|
|
250
|
|
|||
|
7.125% Debentures due 2025
|
85
|
|
85
|
|
|||
|
WPZ:
|
|||||||
|
3.8% Notes due 2015 (1)
|
—
|
|
750
|
|
|||
|
7.25% Notes due 2017
|
600
|
|
600
|
|
|||
|
5.25% Notes due 2020
|
1,500
|
|
1,500
|
|
|||
|
4.125% Notes due 2020
|
600
|
|
600
|
|
|||
|
4% Notes due 2021
|
500
|
|
500
|
|
|||
|
5.875% Notes due 2021
|
—
|
|
750
|
|
|||
|
3.6% Notes due 2022
|
1,250
|
|
—
|
|
|||
|
3.35% Notes due 2022
|
750
|
|
750
|
|
|||
|
6.125% Notes due 2022
|
750
|
|
750
|
|
|||
|
4.5% Notes due 2023
|
600
|
|
600
|
|
|||
|
4.875% Notes due 2023
|
1,400
|
|
1,400
|
|
|||
|
4.3% Notes due 2024
|
1,000
|
|
1,000
|
|
|||
|
4.875% Notes due 2024
|
750
|
|
750
|
|
|||
|
3.9% Notes due 2025
|
750
|
|
750
|
|
|||
|
4.0% Notes due 2025
|
750
|
|
—
|
|
|||
130
|
The Williams Companies, Inc.
|
||||
|
Notes to Consolidated Financial Statements – (Continued)
|
||||
|
December 31,
|
|||||||
|
|
2015
|
2014
|
|||||
|
|
(Millions)
|
||||||
|
6.3% Notes due 2040
|
$
|
1,250
|
|
$
|
1,250
|
|
|
|
5.8% Notes due 2043
|
400
|
|
400
|
|
|||
|
5.4% Notes due 2044
|
500
|
|
500
|
|
|||
|
4.9% Notes due 2045
|
500
|
|
500
|
|
|||
|
5.1% Notes due 2045
|
1,000
|
|
—
|
|
|||
|
Term Loan, variable interest rate, due 2018
|
850
|
|
—
|
|
|||
|
Credit facility loans
|
1,310
|
|
640
|
|
|||
|
WMB:
|
|
||||||
|
7.875% Notes due 2021
|
371
|
|
371
|
|
|||
|
3.7% Notes due 2023
|
850
|
|
850
|
|
|||
|
4.55% Notes due 2024
|
1,250
|
|
1,250
|
|
|||
|
7.5% Debentures due 2031
|
339
|
|
339
|
|
|||
|
7.75% Notes due 2031
|
252
|
|
252
|
|
|||
|
8.75% Notes due 2032
|
445
|
|
445
|
|
|||
|
5.75% Notes due 2044
|
650
|
|
650
|
|
|||
|
Various — 5.5% to 10.25% Notes and Debentures due 2019 to 2033
|
55
|
|
55
|
|
|||
|
Credit facility loans
|
650
|
|
370
|
|
|||
|
Capital lease obligations
|
1
|
|
5
|
|
|||
|
Debt issuance costs
|
(123
|
)
|
(108
|
)
|
|||
|
Net unamortized debt premium (discount)
|
110
|
|
187
|
|
|||
|
Total long-term debt, including current portion
|
23,988
|
|
20,784
|
|
|||
|
Long-term debt due within one year
|
(176
|
)
|
(4
|
)
|
|||
|
Long-term debt
|
$
|
23,812
|
|
$
|
20,780
|
|
|
___________
|
(1)
|
Presented as long-term debt at December 31, 2014, due to WPZ's intent and ability to refinance.
|
|
(2)
|
Presented as long-term debt at December 31, 2015, due to Transco’s intent and ability to refinance.
|
Certain of our debt agreements contain covenants that restrict or limit, among other things, our ability to create liens supporting indebtedness, sell assets, and incur additional debt. Default of these agreements could also restrict our ability to make certain distributions or repurchase equity.
The following table presents aggregate minimum maturities of long-term debt, excluding net unamortized debt premium (discount), debt issuance costs, and capital lease obligations, for each of the next five years:
|
December 31, 2015
|
|||
|
|
(Millions)
|
||
|
2016
|
$
|
175
|
|
|
2017
|
785
|
|
|
|
2018
|
1,350
|
|
|
|
2019
|
32
|
|
|
|
2020
|
2,121
|
|
|
Provisions concerning ACMP long-term debt
Certain long-term debt originally issued by ACMP totaling
$2.9 billion
has provisions that would require WPZ to make an offer to repurchase such notes at
101 percent
of the principle amount should WPZ’s credit be downgraded
131
|
The Williams Companies, Inc.
|
||||
|
Notes to Consolidated Financial Statements – (Continued)
|
||||
by either Moody’s Investor Service or Standard and Poor’s within a period of ninety days following the completion of the proposed ETC Merger.
Issuances and retirements
On January 22, 2016, Transco issued
$1 billion
of
7.85 percent
senior unsecured notes due 2026 to investors in a private debt placement. Transco intends to use the net proceeds from the offering to repay debt and to fund capital expenditures.
In December 2015, WPZ borrowed
$850 million
on a variable interest rate loan with certain lenders due 2018. At December 31, 2015 the interest rate was
1.85 percent
. WPZ used the proceeds for working capital, capital expenditures, and for general partnership purposes.
On April 15, 2015, WPZ paid
$783 million
, including a redemption premium, to early retire
$750 million
of
5.875 percent
senior notes due 2021 with a carrying value of
$797 million
.
On March 3, 2015, WPZ completed a public offering of
$1.25 billion
of
3.6 percent
senior unsecured notes due 2022,
$750 million
of
4 percent
senior unsecured notes due 2025, and
$1 billion
of
5.1 percent
senior unsecured notes due 2045. WPZ used the net proceeds to repay amounts outstanding under its commercial paper program and credit facility, to fund capital expenditures, and for general partnership purposes.
WPZ retired
$750 million
of
3.8 percent
senior unsecured notes that matured on February 15, 2015.
On June 27, 2014, Pre-merger WPZ completed a public offering of
$750 million
of
3.9 percent
senior unsecured notes due 2025 and
$500 million
of
4.9 percent
senior unsecured notes due 2045. Pre-merger WPZ used the net proceeds to repay amounts outstanding under its commercial paper program, to fund capital expenditures, and for general partnership purposes.
On June 24, 2014, we completed a public offering of
$1.25 billion
of
4.55 percent
senior unsecured notes due 2024 and
$650 million
of
5.75 percent
unsecured notes due 2044. We used the net proceeds to finance a portion of the ACMP Acquisition. (See
Note 2 – Acquisitions
.)
On March 4, 2014, Pre-merger WPZ completed a public offering of
$1 billion
of
4.3 percent
senior unsecured notes due 2024 and
$500 million
of
5.4 percent
senior unsecured notes due 2044. Pre-merger WPZ used the net proceeds to repay amounts outstanding under its commercial paper program, to fund capital expenditures, and for general partnership purposes.
Credit Facilities
|
December 31, 2015
|
|||||||
|
Available
|
Outstanding
|
||||||
|
(Millions)
|
|||||||
|
WMB
|
|||||||
|
Long-term credit facility
|
$
|
1,500
|
|
$
|
650
|
|
|
|
Letters of credit under certain bilateral bank agreements
|
14
|
|
|||||
|
WPZ
|
|||||||
|
Long-term credit facility (1)
|
3,500
|
|
1,310
|
|
|||
|
Letters of credit under certain bilateral bank agreements
|
|
2
|
|
||||
|
Short-term credit facility
|
150
|
|
—
|
|
|||
________________
|
(1)
|
In managing our available liquidity, we do not expect a maximum outstanding amount in excess of the capacity of our credit facility inclusive of any outstanding amounts under our commercial paper program.
|
132
|
The Williams Companies, Inc.
|
||||
|
Notes to Consolidated Financial Statements – (Continued)
|
||||
WMB long-term credit facility
On February 2, 2015, we entered into the Second Amended and Restated Credit Agreement. The aggregate commitments available remained at
$1.5 billion
, with up to an additional
$500 million
increase in aggregate commitments available under certain circumstances. The maturity date of the credit facility was extended to February 2, 2020. However, we may request up to two extensions of the maturity date each for an additional one year period to allow a maturity date as late as February 2, 2022, under certain circumstances. The agreement also allows for swing line loans up to an aggregate amount of
$50 million
, subject to available capacity under the credit facility, and the letters of credit up to
$675 million
.
The agreements governing the credit facilities contain the following terms and conditions:
|
•
|
Various covenants may limit, among other things, a borrower’s and its material subsidiaries’ ability to grant certain liens supporting indebtedness, merge or consolidate, sell all or substantially all of its assets, enter into certain affiliate transactions, make certain distributions during an event of default, make investments, and allow any material change in the nature of its business.
|
|
•
|
If an event of default with respect to a borrower occurs under its respective credit facility, the lenders will be able to terminate the commitments for the respective borrowers and accelerate the maturity of any loans of the defaulting borrower under the respective credit facility agreement and exercise other rights and remedies.
|
|
•
|
Each time funds are borrowed under our credit facility, the borrower may choose from two methods of calculating interest: a fluctuating base rate equal to the bank’s alternate base rate plus an applicable margin or a periodic fixed rate equal to LIBOR plus an applicable margin. The borrower is required to pay a commitment fee based on the unused portion of its respective credit facility. The applicable margin and the commitment fee are determined for us by reference to a pricing schedule based on our senior unsecured long-term debt ratings.
|
Significant financial covenants under the agreement require the ratio of debt to EBITDA (each as defined in the credit agreement) be no greater than
5
to 1, except for the fiscal quarter and the two following fiscal quarters in which one or more acquisitions has been executed, in which case the ratio of debt to EBITDA is to be no greater than
5.5
to 1.
We are in compliance with these financial covenants as measured at December 31, 2015.
As of February 25, 2016,
$475 million
is outstanding under our long-term credit facility.
WPZ long-term credit facilities
Prior to their merger both WPZ and ACMP had separate credit facilities that terminated on February 2, 2015.
On February 2, 2015, WPZ along with Transco, Northwest Pipeline, the lenders named therein, and an administrative agent entered into the Second Amended & Restated Credit Agreement with aggregate commitments available of
$3.5 billion
, with up to an additional
$500 million
increase in aggregate commitments available under certain circumstances. The maturity date of the credit facility is February 2, 2020. However, the co-borrowers may request up to two extensions of the maturity date each for an additional one year period to allow a maturity date as late as February 2, 2022, under certain circumstances. The agreement allows for swing line loans up to an aggregate amount of
$150 million
, subject to available capacity under the credit facility, and letters of credit commitments of
$1.125 billion
. Transco and Northwest Pipeline are each able to borrow up to $500 million under this credit facility to the extent not otherwise utilized by the other co-borrowers. On December 18, 2015, WPZ along with Transco, Northwest Pipeline, the lenders named therein and an administrative agent entered into the Amendment No. 1 to Second Amended & Restated Credit Agreement modifying the thresholds specified in the covenant related to the maximum ratio of WPZ’s debt to EBITDA.
133
|
The Williams Companies, Inc.
|
||||
|
Notes to Consolidated Financial Statements – (Continued)
|
||||
The agreement governing this credit facility contains the following terms and conditions:
|
•
|
Various covenants may limit, among other things, a borrower’s and its material subsidiaries’ ability to grant certain liens supporting indebtedness, merge or consolidate, sell all or substantially all of its assets, enter into certain affiliate transactions, make certain distributions during an event of default, enter into certain restrictive agreements, and allow any material change in the nature of its business.
|
|
•
|
If an event of default with respect to a borrower occurs under the credit facility, the lenders will be able to terminate the commitments for all borrowers and accelerate the maturity of any loans of the defaulting borrower under the credit facility agreement and exercise other rights and remedies.
|
|
•
|
Other than swing line loans, each time funds are borrowed, the borrower must choose whether such borrowing will be an alternate base rate borrowing or a Eurodollar borrowing. If such borrowing is an alternate base rate borrowing, interest is calculated on the basis of the greater of (a) the Prime Rate, (b) the Federal Funds Effective Rate plus one half of 1 percent and (c) a periodic fixed rate equal to the London Interbank Offered Rate (LIBOR) plus
1 percent
, plus, in the case of each of (a), (b) and (c), an applicable margin. If the borrowing is a Eurodollar borrowing, interest is calculated on the basis of LIBOR for the relevant period plus an applicable margin. Interest on swingline loans is calculated as the sum of the alternate base rate plus an applicable margin. The borrower is required to pay a commitment fee based on the unused portion of the credit facility. The applicable margin and the commitment fee are determined for each borrower by reference to a pricing schedule based on such borrower’s senior unsecured long-term debt ratings.
|
Significant financial covenants under the agreement require the ratio of debt to EBITDA, each as defined in the credit facility, be no greater than:
|
•
|
5.75
to 1, for the quarters ending December 31, 2015, March 31, 2016 and June 30, 2016;
|
|
•
|
5.50
to 1, for the quarters ending September 30, 2016 and December 31, 2016;
|
|
•
|
5.00
to 1, for the quarter ending March 31, 2017 and each subsequent fiscal quarter, except for the the fiscal quarter and the two following fiscal quarters in which one or more acquisitions has been executed, in which case the ratio of debt to EBITDA is to be no greater than
5.5
to 1.00.
|
The ratio of debt to capitalization (defined as net worth plus debt) must be no greater than 65 percent for each Transco and Northwest Pipeline. WPZ is in compliance with these financial covenants as measured at December 31, 2015.
As of February 25, 2016,
$925 million
is outstanding under the long-term credit facility.
WPZ short-term credit facilities
On February 3, 2015, WPZ entered into a short-term
$1.5 billion
credit facility and terminated it on March 3, 2015.
On August 26, 2015, WPZ entered into a credit agreement providing for a
$1.0 billion
short-term credit facility with a maturity date of August 24, 2016. On December 23, 2015, WPZ’s short-term credit facility capacity decreased to
$150 million
in conjunction with entering into the
$850 million
term loan.
The agreement governing this credit facility contains the following terms and conditions:
|
•
|
This facility becomes available when the aggregate amount of outstanding loans under our long-term credit facility plus outstanding commercial paper borrowings reach a total of
$3.5 billion
.
|
|
•
|
Various covenants that limit, among other things, a borrower’s and its respective material subsidiaries’ ability to grant certain liens supporting indebtedness, merge or consolidate, sell all or substantially all of its assets in
|
134
|
The Williams Companies, Inc.
|
||||
|
Notes to Consolidated Financial Statements – (Continued)
|
||||
certain circumstances, enter into certain affiliate transactions, make certain distributions during an event of default, enter into certain restrictive agreements and allow any material change in the nature of its business.
|
•
|
If an event of default with respect to a borrower occurs under the credit facility, the lenders will be able to terminate the commitments and accelerate the maturity of the loans and exercise other rights and remedies.
|
|
•
|
Each time funds are borrowed under the credit facility, the borrower may choose from two methods of calculating interest: a fluctuating base rate equal to an alternate base rate plus an applicable margin, or a periodic fixed rate equal to LIBOR plus an applicable margin. The borrower is required to pay a commitment fee based on the unused portion of the credit facility. The applicable margin and the commitment fee are determined by reference to a pricing schedule based on the borrower’s senior unsecured long-term debt ratings.
|
The significant financial covenant requires the ratio of debt to EBITDA, each as defined in the credit agreement, as of the last day of any fiscal quarter for which financial statements have been delivered to be no greater than
6.0
to 1.0. WPZ is in compliance with these financial covenants as measured at December 31, 2015.
Commercial Paper Program
On February 2, 2015, WPZ amended and restated the commercial paper program for the ACMP Merger and to allow a maximum outstanding amount of unsecured commercial paper notes of
$3 billion
. The maturities of the commercial paper notes vary but may not exceed
397
days from the date of issuance. The commercial paper notes are sold under customary terms in the commercial paper market and are issued at a discount from par, or, alternatively, are sold at par and bear varying interest rates on a fixed or floating basis. Proceeds from these notes are used for general partnership purposes, including funding capital expenditures, working capital, and partnership distributions. We classify WPZ’s commercial paper outstanding in
Current liabilities
in the
Consolidated Balance Sheet
, as the outstanding notes at
December 31, 2015
and
December 31, 2014
, have maturity dates less than three months from the date of issuance. At
December 31, 2015
, WPZ had
$499 million
in
Commercial paper
outstanding at a weighted average interest rate of
0.92 percent
and at
December 31, 2014
, WPZ had
$798 million
in
Commercial paper
outstanding at a weighted average interest rate of
0.92 percent
.
Cash Payments for Interest (Net of Amounts Capitalized)
Cash payments for interest (net of amounts capitalized)
were
$1.023 billion
in 2015,
$681 million
in 2014, and
$472 million
in 2013.
Restricted Net Assets of Subsidiaries
We have considered the guidance in the Securities and Exchange Commission’s Regulation S-X related to restricted net assets of subsidiaries. In accordance with Rule 4-08(e) of Regulation S-X, we have determined that certain net assets of our subsidiaries are considered restricted under this guidance and exceed
25 percent
of our consolidated net assets. As of December 31, 2015, substantially all of these restricted net assets relate to the net assets of WPZ, which are technically considered restricted under this accounting rule due to terms within WPZ’s partnership agreement that govern the partnerships’ assets. Our interest in WPZ’s net assets that are considered to be restricted at December 31, 2015 was
$14 billion
.
135
|
The Williams Companies, Inc.
|
||||
|
Notes to Consolidated Financial Statements – (Continued)
|
||||
Leases-Lessee
The future minimum annual rentals under noncancelable operating leases, are payable as follows:
|
December 31, 2015
|
|||
|
|
(Millions)
|
||
|
2016
|
$
|
86
|
|
|
2017
|
74
|
|
|
|
2018
|
56
|
|
|
|
2019
|
45
|
|
|
|
2020
|
39
|
|
|
|
Thereafter
|
119
|
|
|
|
Total
|
$
|
419
|
|
Total rent expense was
$164 million
in 2015,
$109 million
in 2014, and
$58 million
in 2013 and primarily included in
Operating and maintenance expenses
and
Selling, general, and administrative expenses
in the
Consolidated Statement of Operations
.
Accounting Standards Issued and Adopted
In April 2015, the FASB issued ASU 2015-03 “Interest - Imputation of Interest: Simplifying the Presentation of Debt Issuance Costs” (ASU 2015-03). ASU 2015-03 simplifies the presentation of debt issuance costs by requiring such costs be presented as a deduction from the corresponding debt liability. Subsequently, in August 2015, the FASB issued ASU 2015-15 “Interest-Imputation of Interest (Subtopic 835-30): Presentation and Subsequent Measurement of Debt Issuance Costs Associated with Line-of-Credit Arrangements-Amendments to SEC Paragraphs Pursuant to Staff Announcement at June 18, 2015 EITF Meeting” (ASU 2015-15). In ASU 2015-15 the FASB stated that the guidance in ASU 2015-03 did not address the presentation or subsequent measurement of debt issuance costs related to line-of-credit arrangements, and entities are permitted to defer and present debt issuance costs related to line-of-credit arrangements as assets. The standards are effective for financial statements issued for interim and annual reporting periods beginning after December 15, 2015, and require retrospective presentation. Early adoption is permitted. We elected to early adopt these standards for the periods presented. Accordingly,
$123 million
and
$108 million
of debt issuance costs as of December 31, 2015 and 2014, respectively, are now reflected as a direct reduction from
Long-term debt
in our
Consolidated Balance Sheet
. Debt issuance costs related to our credit facilities are presented in
Regulatory assets, deferred charges, and other
in the
Consolidated Balance Sheet
.
Cash dividends declared per common share were
$2.45
,
$1.9575
, and
$1.4375
for
2015
,
2014
, and
2013
, respectively.
On June 23, 2014, we issued
61 million
shares of common stock in a public offering at a price of
$57.00
per share. That amount includes
8 million
shares purchased pursuant to the full exercise of the underwriter’s option to purchase additional shares. The net proceeds of
$3.378 billion
were used in July 2014 to finance a portion of the ACMP Acquisition. (See
Note 2 – Acquisitions
.)
136
|
The Williams Companies, Inc.
|
||||
|
Notes to Consolidated Financial Statements – (Continued)
|
||||
AOCI
The following table presents the changes in AOCI by component, net of income taxes:
|
Cash
Flow
Hedges
|
Foreign
Currency
Translation
|
Pension and
Other Post
Retirement
Benefits
|
Total
|
||||||||||||
|
(Millions)
|
|||||||||||||||
|
Balance at December 31, 2014
|
$
|
(1
|
)
|
$
|
31
|
|
$
|
(371
|
)
|
$
|
(341
|
)
|
|||
|
Other comprehensive income (loss)
before reclassifications
|
3
|
|
(134
|
)
|
8
|
|
(123
|
)
|
|||||||
|
Amounts reclassified from
accumulated other
comprehensive income (loss)
|
(3
|
)
|
—
|
|
25
|
|
22
|
|
|||||||
|
Other comprehensive income (loss)
|
—
|
|
(134
|
)
|
33
|
|
(101
|
)
|
|||||||
|
Balance at December 31, 2015
|
$
|
(1
|
)
|
$
|
(103
|
)
|
$
|
(338
|
)
|
$
|
(442
|
)
|
|||
Reclassifications out of AOCI are presented in the following table by component for the year ended
December 31, 2015
:
|
Component
|
Reclassifications
|
Classification
|
||||
|
(Millions)
|
||||||
|
Cash flow hedges:
|
||||||
|
Energy commodity contracts
|
$
|
(3
|
)
|
Product sales
|
||
|
Total cash flow hedges, before income taxes
|
(3
|
)
|
||||
|
Pension and other postretirement benefits:
|
||||||
|
Amortization of prior service cost (credit) included in net periodic benefit cost
|
(6
|
)
|
Note 9 – Employee Benefit Plans
|
|||
|
Amortization of actuarial (gain) loss included in net periodic benefit cost
|
46
|
|
|
|||
|
Total pension and other postretirement benefits, before income taxes
|
40
|
|
||||
|
Reclassifications before income taxes
|
37
|
|
||||
|
Income tax benefit
|
(15
|
)
|
Provision (benefit) for income taxes
|
|||
|
Reclassifications during the period
|
$
|
22
|
|
|||
Williams’ Plan Information
On May 17, 2007, our stockholders approved The Williams Companies, Inc. 2007 Incentive Plan (the Plan) that provides common-stock-based awards to both employees and nonmanagement directors and reserved
19 million
new shares for issuance. On May 20, 2010 and May 22, 2014, our stockholders approved amendments and restatements of the Plan to increase by
11 million
and
10 million
, respectively, the number of new shares authorized for making awards under the Plan, among other changes. The Plan permits the granting of various types of awards including, but not limited to, restricted stock units and stock options. At
December 31, 2015
,
28 million
shares of our common stock were reserved for issuance pursuant to existing and future stock awards, of which
19 million
shares were available for future grants.
Additionally, on May 17, 2007, our stockholders approved an Employee Stock Purchase Plan (ESPP) which authorized up to
2 million
new shares of our common stock to be available for sale under the ESPP. On May 22, 2014,
137
|
The Williams Companies, Inc.
|
||||
|
Notes to Consolidated Financial Statements – (Continued)
|
||||
our stockholders approved an amendment and restatement of the ESPP to increase by
1.6 million
the number of new shares authorized for sale under the ESPP. The ESPP enables eligible participants to purchase our common stock through payroll deductions not exceeding an annual amount of
$15,000
per participant. The ESPP provides for offering periods during which shares may be purchased and continues until the earliest of (1) the Board of Directors terminates the ESPP, (2) the sale of all shares available under the ESPP, or (3) the tenth anniversary of the date the ESPP was approved by the stockholders. Offering periods are from January through June and from July through December. Generally, all employees are eligible to participate in the ESPP, with the exception of executives and international employees. The number of shares eligible for an employee to purchase during each offering period is limited to
750
shares. The purchase price of the stock is
85 percent
of the lower closing price of either the first or the last day of the offering period. The ESPP requires a
one
-year holding period before the stock can be sold. Employees purchased
354 thousand
shares at an average price of
$28.07
per share during
2015
. Approximately
1.5 million
shares were available for purchase under the ESPP at
December 31, 2015
. The plan has been suspended effective January 1, 2016.
Operating and maintenance expenses
and
Selling, general and administrative expenses
include equity-based compensation expense for the years ended December 31,
2015
,
2014
, and
2013
of
$56 million
,
$44 million
, and
$37 million
, respectively. Income tax benefit recognized related to the stock-based compensation expense for the years ended December 31,
2015
,
2014
, and
2013
was
$21 million
,
$17 million
, and
$14 million
, respectively. Measured but unrecognized stock-based compensation expense at
December 31, 2015
, was
$65 million
, which does not include the effect of estimated forfeitures of
$2 million
.
Unrecognized stock-based compensation expense is comprised of
$4 million
related to stock options and
$61 million
related to restricted stock units. These amounts are expected to be recognized over a weighted-average period of
1.9
years.
Stock Options
Stock options are valued at the date of award, which does not precede the approval date. The purchase price per share for stock options may not be less than the market price of the underlying stock on the date of grant. Stock options generally become exercisable over a
three
-year period from the date of grant. Stock options generally expire
ten years
after the grant.
The following summary reflects stock option activity and related information for the year ended
December 31, 2015
:
|
Stock Options
|
Options
|
Weighted-
Average
Exercise
Price
|
Aggregate
Intrinsic
Value
|
|||||||
|
|
(Millions)
|
|
(Millions)
|
|||||||
|
Outstanding at December 31, 2014
|
5.8
|
|
$
|
25.86
|
|
|||||
|
Granted
|
1.0
|
|
$
|
49.15
|
|
|||||
|
Exercised
|
(1.1
|
)
|
$
|
19.30
|
|
|||||
|
Outstanding at December 31, 2015
|
5.7
|
|
$
|
31.51
|
|
$
|
15
|
|
||
|
Exercisable at December 31, 2015
|
4.0
|
|
$
|
25.52
|
|
$
|
15
|
|
||
The following table summarizes additional information related to stock option activity during each of the last three years:
|
Years Ended December 31,
|
|||||||||||
|
2015
|
2014
|
2013
|
|||||||||
|
(Millions)
|
|||||||||||
|
Total intrinsic value of options exercised
|
$
|
37
|
|
$
|
48
|
|
$
|
23
|
|
||
|
Tax benefits realized on options exercised
|
$
|
13
|
|
$
|
18
|
|
$
|
9
|
|
||
|
Cash received from the exercise of options
|
$
|
20
|
|
$
|
31
|
|
$
|
13
|
|
||
138
|
The Williams Companies, Inc.
|
||||
|
Notes to Consolidated Financial Statements – (Continued)
|
||||
The weighted-average remaining contractual life for stock options outstanding and exercisable at
December 31, 2015
, was
5.7
years and
4.4
years, respectively.
The estimated fair value at date of grant of options for our common stock granted in each respective year, using the Black-Scholes option pricing model, is as follows:
|
2015
|
2014
|
2013
|
|||||||||
|
Weighted-average grant date fair value of options for our common stock granted during the year, per share
|
$
|
7.61
|
|
$
|
7.50
|
|
$
|
5.94
|
|
||
|
Weighted-average assumptions:
|
|||||||||||
|
Dividend yield
|
4.8
|
%
|
4.2
|
%
|
4.3
|
%
|
|||||
|
Volatility
|
27.8
|
%
|
28.0
|
%
|
29.7
|
%
|
|||||
|
Risk-free interest rate
|
1.8
|
%
|
2.2
|
%
|
1.4
|
%
|
|||||
|
Expected life (years)
|
6.0
|
|
6.5
|
|
6.5
|
|
|||||
The 2015 expected dividend yield is based on the
2015
dividend forecast and the grant-date market price of our stock. Expected volatility is based on the average of our peer group
10
-year historical volatility adjusted by a ratio of our implied volatility to the average of our peer group’s implied volatility. The adjustment is made because the difference in implied volatility between our peer group and us may indicate that we are expected to be more volatile than our peer group average. The risk-free interest rate is based on the U.S. Treasury Constant Maturity rates as of the grant date. The expected life of the option is based on historical exercise behavior and expected future experience.
Nonvested Restricted Stock Units
The following summary reflects nonvested restricted stock unit activity and related information for the year ended
December 31, 2015
.
|
Restricted Stock Units Outstanding
|
Shares
|
Weighted-
Average
Fair Value (1)
|
||||
|
|
(Millions)
|
|
||||
|
Nonvested at December 31, 2014
|
3.6
|
|
$
|
33.90
|
|
|
|
Granted
|
1.4
|
|
$
|
40.15
|
|
|
|
Forfeited
|
(0.1
|
)
|
$
|
36.49
|
|
|
|
Vested
|
(1.5
|
)
|
$
|
27.45
|
|
|
|
Nonvested at December 31, 2015
|
3.4
|
|
$
|
39.38
|
|
|
______________
|
(1)
|
Performance-based restricted stock units are valued utilizing a Monte Carlo valuation method using measures of total shareholder return. Certain of the performance-based restricted stock units are subject to a holding period of up to
two years
after the vesting date. Discounts for the restrictions of liquidity were applied to the estimated fair value at the date of the awards and ranged from
5.83 percent
to
15.58 percent
. The discounts were developed using the Chaffe model and the Finnerty model. All other restricted stock units are valued at the grant-date market price. Restricted stock units generally vest after
three years
.
|
|
Value of Restricted Stock Units
|
2015
|
2014
|
2013
|
||||||||
|
Weighted-average grant date fair value of restricted stock units granted during the year, per share
|
$
|
40.15
|
|
$
|
42.79
|
|
$
|
30.43
|
|
||
|
Total fair value of restricted stock units vested during the year ($’s in millions)
|
$
|
42
|
|
$
|
27
|
|
$
|
27
|
|
||
Performance-based restricted stock units granted under the Plan represent
40 percent
of nonvested restricted stock units outstanding at
December 31, 2015
. These grants may be earned at the end of the vesting period based on actual
139
|
The Williams Companies, Inc.
|
||||
|
Notes to Consolidated Financial Statements – (Continued)
|
||||
performance against a performance target. Based on the extent to which certain financial targets are achieved, vested shares may range from
zero
percent to
500 percent
of the original grant amount.
WPZ’s Plan Information
During 2014, certain employees of ACMP’s general partner received equity-based compensation through ACMP’s equity-based compensation program. The fair value of the awards issued was based on the fair market value of the common units on the date of grant. This value is being amortized over the vesting period, which is
one
to
four years
from the date of grant. These awards were converted to WPZ equity-based awards in accordance with the terms of the ACMP Merger.
No
additional grants of restricted common units were awarded through WPZ’s equity-based compensation programs in 2015, and no additional grants are expected in the future. Equity-based compensation expense of
$29 million
and
$11 million
related to WPZ’s equity-based compensation program is included in
Operating and maintenance expenses
and
Selling, general, and administrative expenses
for the years ended December 31, 2015 and 2014, respectively. As of December 31, 2015, there was
$32 million
of unrecognized compensation expense attributable to the outstanding awards, which does not include the effect of estimated forfeitures of
$4 million
. These amounts are expected to be recognized over a weighted average period of
1.8 years
.
The following summary reflects nonvested WPZ restricted common unit activity and related information for the year ended
December 31, 2015
:
|
Restricted Common Units Outstanding
|
Units
|
Weighted-
Average
Fair Value
|
||||
|
(Millions)
|
||||||
|
Nonvested at December 31, 2014
|
1.3
|
|
$
|
59.35
|
|
|
|
Adjustment for unit split in ACMP Merger
|
0.1
|
|
$
|
—
|
|
|
|
Forfeited
|
(0.1
|
)
|
$
|
58.05
|
|
|
|
Vested
|
(0.1
|
)
|
$
|
59.28
|
|
|
|
Nonvested at December 31, 2015
|
1.2
|
|
$
|
55.93
|
|
|
140
|
The Williams Companies, Inc.
|
||||
|
Notes to Consolidated Financial Statements – (Continued)
|
||||
Note 17 – Fair Value Measurements, Guarantees, and Concentration of Credit Risk
The following table presents, by level within the fair value hierarchy, certain of our financial assets and liabilities. The carrying values of cash and cash equivalents, accounts receivable, commercial paper, and accounts payable approximate fair value because of the short-term nature of these instruments. Therefore, these assets and liabilities are not presented in the following table.
|
Fair Value Measurements Using
|
|||||||||||||||||||
|
Carrying
Amount
|
Fair
Value
|
Quoted
Prices In
Active
Markets for
Identical
Assets
(Level 1)
|
Significant
Other
Observable
Inputs
(Level 2)
|
Significant
Unobservable
Inputs
(Level 3)
|
|||||||||||||||
|
(Millions)
|
|||||||||||||||||||
|
Assets (liabilities) at December 31, 2015:
|
|||||||||||||||||||
|
Measured on a recurring basis:
|
|||||||||||||||||||
|
ARO Trust investments
|
$
|
67
|
|
$
|
67
|
|
$
|
67
|
|
$
|
—
|
|
$
|
—
|
|
||||
|
Energy derivatives assets not designated as hedging instruments
|
5
|
|
5
|
|
—
|
|
3
|
|
2
|
|
|||||||||
|
Energy derivatives liabilities not designated as hedging instruments
|
(2
|
)
|
(2
|
)
|
—
|
|
—
|
|
(2
|
)
|
|||||||||
|
Additional disclosures:
|
|||||||||||||||||||
|
Notes receivable and other
|
12
|
|
30
|
|
10
|
|
2
|
|
18
|
|
|||||||||
|
Long-term debt, including current portion (1)
|
(23,987
|
)
|
(19,606
|
)
|
—
|
|
(19,606
|
)
|
—
|
|
|||||||||
|
Guarantee
|
(29
|
)
|
(16
|
)
|
—
|
|
(16
|
)
|
—
|
|
|||||||||
|
Assets (liabilities) at December 31, 2014:
|
|||||||||||||||||||
|
Measured on a recurring basis:
|
|||||||||||||||||||
|
ARO Trust investments
|
$
|
48
|
|
$
|
48
|
|
$
|
48
|
|
$
|
—
|
|
$
|
—
|
|
||||
|
Energy derivatives assets not designated as hedging instruments
|
3
|
|
3
|
|
1
|
|
—
|
|
2
|
|
|||||||||
|
Energy derivatives liabilities not designated as hedging instruments
|
(2
|
)
|
(2
|
)
|
—
|
|
—
|
|
(2
|
)
|
|||||||||
|
Additional disclosures:
|
|||||||||||||||||||
|
Notes receivable and other
|
30
|
|
57
|
|
—
|
|
4
|
|
53
|
|
|||||||||
|
Long-term debt, including current portion (1)
|
(20,779
|
)
|
(21,131
|
)
|
—
|
|
(21,131
|
)
|
—
|
|
|||||||||
|
Guarantee
|
(31
|
)
|
(27
|
)
|
—
|
|
(27
|
)
|
—
|
|
|||||||||
___________
|
(1)
|
Excludes capital leases. The carrying value has been reduced by
$123 million
and
$108 million
of debt acquisition costs at December 31, 2015 and 2014, respectively. (See
|
Fair Value Methods
We use the following methods and assumptions in estimating the fair value of our financial instruments:
Assets and liabilities measured at fair value on a recurring basis
ARO Trust investments
:
Transco deposits a portion of its collected rates, pursuant to its rate case settlement, into an external trust that is specifically designated to fund future asset retirement obligations. The ARO Trust invests in a portfolio of actively traded mutual funds that are measured at fair value on a recurring basis based on quoted prices in an active market, is classified as available-for-sale, and is reported in
Regulatory assets, deferred charges, and other
141
|
The Williams Companies, Inc.
|
||||
|
Notes to Consolidated Financial Statements – (Continued)
|
||||
in the Consolidated Balance Sheet. Both realized and unrealized gains and losses are ultimately recorded as regulatory assets or liabilities.
Energy derivatives
:
Energy derivatives include commodity based exchange-traded contracts and over-the-counter (OTC) contracts, which consist of physical forwards, futures, and swaps that are measured at fair value on a recurring basis. The fair value amounts are presented on a gross basis and do not reflect the netting of asset and liability positions permitted under the terms of our master netting arrangements. Further, the amounts do not include cash held on deposit in margin accounts that we have received or remitted to collateralize certain derivative positions. Energy derivatives assets are reported in
Other current assets and deferred charges
and
Regulatory assets, deferred charges, and other
in the Consolidated Balance Sheet. Energy derivatives liabilities are reported in
Accrued liabilities
and
Other noncurrent liabilities
in the Consolidated Balance Sheet.
Reclassifications of fair value between Level 1, Level 2, and Level 3 of the fair value hierarchy, if applicable, are made at the end of each quarter. No transfers between Level 1 and Level 2 occurred during the years ended
December 31, 2015
or
2014
.
Additional fair value disclosures
Notes receivable and other:
Notes receivable and other consists of various notes, including a receivable related to the sale of certain former Venezuela assets. The disclosed fair value of this receivable is determined by an income approach. We calculated the net present value of a probability-weighted set of cash flows utilizing assumptions based on contractual terms, historical payment patterns by the counterparty, future probabilities of default, our likelihood of using arbitration if the counterparty does not perform, and discount rates. We determined the fair value of the receivable to be
$18 million
at
December 31, 2015
. We began accounting for the receivable under a cost recovery model in first-quarter 2015. Subsequently, we received a payment greater than the carrying amount of the receivable, and as a result, the carrying value of this receivable is
zero
at
December 31, 2015
. We received another payment in January 2016. We have the right to receive two remaining quarterly cash installments of
$15 million
plus interest. See
Note 5 – Investing Activities
for interest income associated with this receivable. The current and noncurrent portions of our receivables in 2015 and 2014 are reported in
Accounts and notes receivable,
Other current assets and deferred charges
, and
Regulatory assets, deferred charges, and other
, respectively, in the Consolidated Balance Sheet.
Long-term debt
:
The disclosed fair value of our long-term debt is determined by a market approach using broker quoted indicative period-end bond prices. The quoted prices are based on observable transactions in less active markets for our debt or similar instruments.
Guarantee
:
The guarantee represented in the table consists of a guarantee we have provided in the event of nonpayment by our previously owned communications subsidiary, Williams Communications Group (WilTel), on a lease performance obligation that extends through 2042.
To estimate the disclosed fair value of the guarantee, an estimated default rate is applied to the sum of the future contractual lease payments using an income approach. The estimated default rate is determined by obtaining the average cumulative issuer-weighted corporate default rate based on the credit rating of WilTel’s current owner and the term of the underlying obligation. The default rate is published by Moody’s Investors Service. The carrying value of the guarantee is reported in
Accrued liabilities
in the Consolidated Balance Sheet.
Assets measured at fair value on a nonrecurring basis
We performed an interim assessment of the goodwill associated with our Access Midstream reporting unit as of September 30, 2015, and the annual assessment of goodwill associated with our Northeast G&P and West reporting units as of October 1, 2015.
No
impairment charges were required following these evaluations.
During the fourth quarter of 2015, we observed a significant decline in the market values of WPZ and comparable midstream companies within the industry. This served to reduce our estimate of enterprise value and increased our estimates of discount rates. As a result, we performed an impairment assessment as of December 31, 2015, of the goodwill associated with these reporting units, all within the Williams Partners segment.
142
|
The Williams Companies, Inc.
|
||||
|
Notes to Consolidated Financial Statements – (Continued)
|
||||
We estimated the fair value of each reporting unit based on an income approach utilizing discount rates specific to the underlying businesses of each reporting unit. These discount rates considered variables unique to each business area, including equity yields of comparable midstream businesses, expectations for future growth, and customer performance considerations. Weighted-average discount rates utilized ranged from approximately
10 percent
to
13 percent
across the three reporting units.
As a result of the increases in discount rates during the fourth quarter, coupled with certain reductions in estimated future cash flows determined during the same period, the fair values of the Access Midstream and Northeast G&P reporting units were determined to be below their respective carrying values. For these measurements, the book basis of each reporting unit was reduced by the associated deferred tax liabilities. We then calculated the implied fair value of goodwill by performing a hypothetical application of the acquisition method wherein the estimated fair value was allocated to the underlying assets and liabilities of each reporting unit. As a result of these level 3 measurements, we determined that the previously recorded goodwill associated with each reporting unit was fully impaired, resulting in a fourth quarter noncash charge of
$1,098 million
. For the West reporting unit, the estimated fair value significantly exceeded the carrying value and
no
impairment was recorded.
|
Impairments
|
|||||||||||||
|
Years Ended December 31,
|
|||||||||||||
|
Date of Measurement
|
Fair Value
|
2015
|
2014
|
||||||||||
|
(Millions)
|
|||||||||||||
|
Impairment of certain assets (1)
|
June 30, 2014
|
$
|
46
|
|
$
|
17
|
|
||||||
|
Impairment of certain assets (1)
|
December 31, 2014
|
32
|
|
13
|
|
||||||||
|
Impairment of certain assets (1)
|
June 30, 2015
|
17
|
|
$
|
20
|
|
|||||||
|
Impairment of certain assets (2)
|
December 31, 2014
|
1
|
|
12
|
|
||||||||
|
Impairment of certain assets (3)
|
December 31, 2015
|
13
|
|
94
|
|
||||||||
|
Impairment of certain assets (4)
|
December 31, 2015
|
40
|
|
64
|
|
||||||||
|
Level 3 fair value measurements of certain assets
|
178
|
|
42
|
|
|||||||||
|
Other impairments (5)
|
31
|
|
10
|
|
|||||||||
|
Total impairments of certain assets
|
$
|
209
|
|
$
|
52
|
|
|||||||
______________
|
(1)
|
Reflects impairment charges for our Williams Partners segment associated with certain surplus equipment. Certain of these assets were previously presented as held for sale, but are now considered held for use and reported in
Property, plant, and equipment – net
in the
Consolidated Balance Sheet
at December 31, 2015. The estimated fair value was determined by a market approach based on our analysis of observable inputs in the principal market. These impairment charges are recorded in
Other (income) expense – net
within
Costs and expenses
in the
Consolidated Statement of Operations
.
|
|
(2)
|
Reflects impairment charges for our Williams Partners segment associated with certain surplus equipment considered held for sale and reported in
Other current assets and deferred charges
in the
Consolidated Balance Sheet
. The estimated fair value was determined by a market approach based on our analysis of observable inputs in the principal market. These impairment charges are recorded in
Other (income) expense – net
within
Costs and expenses
in the
Consolidated Statement of Operations
.
|
|
(3)
|
Reflects an impairment charge within our Williams Partners segment associated with previously capitalized project development costs for a gas processing plant, the completion of which is now considered remote due to unfavorable impact of low natural gas prices on customer drilling activities. These impairment charges are recorded in
Other (income) expense – net
within
Costs and expenses
in the
Consolidated Statement of Operations
.The assessed fair value primarily represents the estimated salvage value of certain equipment measured using a market approach
|
143
|
The Williams Companies, Inc.
|
||||
|
Notes to Consolidated Financial Statements – (Continued)
|
||||
based on our analysis of observable inputs in the principal market and is reported in
Property, plant, and equipment – net
in the Consolidated Balance Sheet.
|
(4)
|
Reflects an impairment charge within our Williams NGL & Petchem Services segment associated with previously capitalized project development costs for an olefins pipeline project, the completion of which is now considered remote due to the lack of customer interest. These impairment charges are recorded in
Other (income) expense – net
within
Costs and expenses
in the
Consolidated Statement of Operations
. The assessed fair value primarily represents the estimated value of unused pipeline measured using a market approach based on our analysis of observable inputs in the principal market and is reported in
Property, plant, and equipment – net
in the Consolidated Balance Sheet.
|
|
(5)
|
Reflects multiple individually insignificant impairments of other certain assets that may no longer be in use or are surplus in nature for which the fair value was determined to be zero or an insignificant salvage value. These impairment charges are recorded in
Other (income) expense – net
within
Costs and expenses
in the
Consolidated Statement of Operations
.
|
|
Date of Measurement
|
Fair Value
|
Impairments
|
|||||||
|
(Millions)
|
|||||||||
|
Impairments of equity-method investments (1)
|
September 30, 2015
|
$
|
1,203
|
|
$
|
461
|
|
||
|
Impairments of equity-method investments (2)
|
December 31, 2015
|
4,017
|
|
890
|
|
||||
|
Other impairment of equity-method investment
|
December 31, 2015
|
58
|
|
8
|
|
||||
|
Level 3 fair value measurements of equity-method investments
|
$
|
1,359
|
|
||||||
______________
|
(1)
|
Reflects other-than-temporary impairment charges related to Williams Partners’ equity-method investments in the Delaware basin gas gathering system and certain of the Appalachia Midstream Investments reflected within
Impairment of equity-method investments
in the
Consolidated Statement of Operations
. The historical carrying value of these investments was initially recorded based on estimated fair value during the third quarter of 2014 in conjunction with the ACMP Acquisition. We estimated the fair value of these investments using an income approach based on expected future cash flows and appropriate discount rates. The determination of estimated future cash flows involved significant assumptions regarding gathering volumes and related capital spending. Discount rates utilized were
11.8 percent
and
8.8 percent
for the Delaware basin gas gathering system and certain of the Appalachia Midstream Investments, respectively, and reflected our cost of capital as impacted by market conditions, and risks associated with the underlying businesses.
|
|
(2)
|
Reflects other-than-temporary impairment charges related to Williams Partners’ equity-method investments in the Delaware basin gas gathering system, certain of the Appalachia Midstream Investments, UEOM, and Laurel Mountain, reflected within
Impairment of equity-method investments
in the
Consolidated Statement of Operations
. We estimated the fair value of these investments using an income approach based on expected future cash flows and appropriate discount rates. The determination of estimated future cash flows involved significant assumptions regarding gathering volumes and related capital spending. Discount rates utilized ranged from
10.8 percent
to
14.4 percent
and reflected further fourth quarter increases in our cost of capital, revised estimates of expected future cash flows, and risks associated with the underlying businesses.
|
144
|
The Williams Companies, Inc.
|
||||
|
Notes to Consolidated Financial Statements – (Continued)
|
||||
During the first quarter of 2016, we have observed further significant decline in the market value of WPZ’s publicly traded equity. Continuation of this condition and/or further decline in such value will likely require the evaluation of certain of our equity investments for potential impairment at March 31, 2016, including those that were impaired at December 31, 2015. As a result, there is the potential for significant additional noncash impairments of our investments in the future.
Guarantees
We are required by our revolving credit agreements to indemnify lenders for certain taxes required to be withheld from payments due to the lenders and for certain tax payments made by the lenders. The maximum potential amount of future payments under these indemnifications is based on the related borrowings and such future payments cannot currently be determined. These indemnifications generally continue indefinitely unless limited by the underlying tax regulations and have no carrying value. We have never been called upon to perform under these indemnifications and have no current expectation of a future claim.
Regarding our previously described guarantee of WilTel’s lease performance, the maximum potential undiscounted exposure is approximately
$33 million
at
December 31, 2015
. Our exposure declines systematically throughout the remaining term of WilTel’s obligation.
Concentration of Credit Risk
Cash equivalents
Our cash equivalents are primarily invested in funds with high-quality, short-term securities and instruments that are issued or guaranteed by the U.S. government.
Accounts and notes receivable
The following table summarizes concentration of receivables,
net of allowances.
|
|
December 31,
|
||||||
|
|
2015
|
2014
|
|||||
|
|
(Millions)
|
||||||
|
NGLs, natural gas, and related products and services
|
$
|
823
|
|
$
|
730
|
|
|
|
Transportation of natural gas and related products
|
202
|
|
175
|
|
|||
|
Income tax receivable
|
7
|
|
167
|
|
|||
|
Other
|
9
|
|
67
|
|
|||
|
Total
|
$
|
1,041
|
|
$
|
1,139
|
|
|
Customers include producers, distribution companies, industrial users, gas marketers and pipelines primarily located in the continental United States and Canada. As a general policy, collateral is not required for receivables, but customers’ financial condition and credit worthiness are evaluated regularly. As of December 31,
2015
and 2014, Chesapeake Energy Corporation, and its affiliates, a customer within our Williams Partners segment, accounted for
$364 million
and
$308 million
, respectively, of the consolidated
Accounts and notes receivable
balance. Of this receivable at December 31, 2015,
$198 million
relates to annual minimum volume commitment fees that were subsequently collected in February 2016.
Revenues
In
2015
and 2014, Chesapeake Energy Corporation, and its affiliates, a customer within our Williams Partners segment, accounted for
18 percent
and
9 percent
, respectively, of our consolidated revenues.
145
|
The Williams Companies, Inc.
|
||||
|
Notes to Consolidated Financial Statements – (Continued)
|
||||
Reporting of Natural Gas-Related Information to Trade Publications
Direct and indirect purchasers of natural gas in various states filed class actions against us, our former affiliate WPX and its subsidiaries, and others alleging the manipulation of published gas price indices and seeking unspecified amounts of damages. Such actions were transferred to the Nevada federal district court for consolidation of discovery and pre-trial issues. We have agreed to indemnify WPX and its subsidiaries related to this matter.
Because of the uncertainty around the remaining pending unresolved issues, including an insufficient description of the purported classes and other related matters, we cannot reasonably estimate a range of potential exposure at this time. However, it is reasonably possible that the ultimate resolution of these actions and our related indemnification obligation could result in future charges that may be material to our results of operations. In connection with this indemnification, we have an accrued liability balance associated with this matter, and as a result, have exposure to future developments in this matter.
Geismar Incident
As a result of the previously discussed Geismar Incident, there were two fatalities and numerous individuals (including employees and contractors) reported injuries, which varied from minor to serious. We are addressing the following matters in connection with the Geismar Incident.
On October 21, 2013, the EPA issued an Inspection Report pursuant to the Clean Air Act’s Risk Management Program following its inspection of the facility on June 24 through June 28, 2013. The report notes the EPA’s preliminary determinations about the facility’s documentation regarding process safety, process hazard analysis, as well as operating procedures, employee training, and other matters. On June 16, 2014, we received a request for information related to the Geismar Incident from the EPA under Section 114 of the Clean Air Act to which we responded on August 13, 2014. The EPA could issue penalties pertaining to final determinations.
Multiple lawsuits, including class actions for alleged offsite impacts, property damage, customer claims, and personal injury, have been filed against us. To date, we have settled certain of the personal injury claims for an aggregate immaterial amount that we have recovered from our insurers. The trial for certain plaintiffs claiming personal injury, that was set to begin on June 15, 2015, in Iberville Parish, Louisiana, has been postponed to September 6, 2016. We believe it is probable that additional losses will be incurred on some lawsuits, while for others we believe it is only reasonably possible that losses will be incurred. However, due to ongoing litigation involving defenses to liability, the number of individual plaintiffs, limited information as to the nature and extent of all plaintiffs’ damages, and the ultimate outcome of all appeals, we are unable to reliably estimate any such losses at this time. We believe that it is probable that any ultimate losses incurred will be covered by our general liability insurance policy, which has an aggregate limit of
$610 million
applicable to this event and retention (deductible) of
$2 million
per occurrence.
Alaska Refinery Contamination Litigation
In 2010, James West filed a class action lawsuit in state court in Fairbanks, Alaska on behalf of individual property owners whose water contained sulfolane contamination allegedly emanating from the Flint Hills Oil Refinery in North Pole, Alaska. The suit named our subsidiary, Williams Alaska Petroleum Inc. (WAPI), and Flint Hills Resources Alaska, LLC (FHRA), a subsidiary of Koch Industries, Inc., as defendants. We owned and operated the refinery until 2004 when we sold it to FHRA. We and FHRA made claims under the pollution liability insurance policy issued in connection with the sale of the North Pole refinery to FHRA. We and FHRA also filed claims against each other seeking, among other things, contractual indemnification alleging that the other party caused the sulfolane contamination.
In 2011, we and FHRA settled the James West claim. We and FHRA subsequently filed motions for summary judgment on the other’s claims. On July 8, 2014, the court dismissed all FHRA’s claims and entered judgment for us. On August 6, 2014, FHRA appealed the court’s decision to the Alaska Supreme Court, which heard oral arguments in October of 2015. The Supreme Court’s decision is expected this spring.
146
|
The Williams Companies, Inc.
|
||||
|
Notes to Consolidated Financial Statements – (Continued)
|
||||
We currently estimate that our reasonably possible loss exposure in this matter could range from an insignificant amount up to
$32 million
, although uncertainties inherent in the litigation process, expert evaluations, and jury dynamics might cause our exposure to exceed that amount.
On March 6, 2014, the State of Alaska filed suit against FHRA, WAPI, and us in state court in Fairbanks seeking injunctive relief and damages in connection with sulfolane contamination of the water supply near the Flint Hills Oil Refinery in North Pole, Alaska. On May 5, 2014, FHRA filed cross-claims against us in the State of Alaska suit. FHRA also seeks injunctive relief and damages.
On November 26, 2014, the City of North Pole (North Pole) filed suit in Alaska state court in Fairbanks against FHRA, WAPI, and us alleging nuisance and violations of municipal and state statutes based upon the same alleged sulfolane contamination of the water supply. North Pole claims an unspecified amount of past and future damages as well as punitive damages against WAPI. FHRA filed cross-claims against us.
In October of 2015, the Court consolidated the State of Alaska and North Pole cases. To our knowledge, exposure in these cases is duplicative of the reasonable loss exposure in the James West case.
Independent of the litigation matter described in the preceding paragraphs, in 2013, the Alaska Department of Environmental Conservation indicated that it views FHRA and us as responsible parties, and that it intended to enter a compliance order to address the environmental remediation of sulfolane and other possible contaminants including cleanup work outside the refinery’s boundaries. Due to the ongoing assessment of the level and extent of sulfolane contamination and the ultimate cost of remediation and division of costs among the potentially responsible parties, we are unable to estimate a range of exposure at this time.
Shareholder Litigation
In July 2015, a purported stockholder of us filed a putative class and derivative action on behalf of us in the Court of Chancery of the State of Delaware. The action names as defendants certain members of our Board of Directors as well as WPZ, and names us as a nominal defendant. On December 4, 2015, the plaintiff filed an amended complaint for such action, alleging that the preliminary proxy statement filed in connection with our proposed merger with Energy Transfer is false and misleading. As relief, the complaint requests, among other things, an injunction requiring us to make supplemental disclosures and an award of costs and attorneys’ fees. On December 9, 2015, we moved to dismiss the amended complaint. We cannot reasonably estimate a range of potential loss at this time.
Between October 5, 2015 and January 19, 2016, purported stockholders of us filed seven putative class action lawsuits in the Delaware Court of Chancery, one suit in U.S. District Court in Delaware, and one suit in U.S. District Court in Oklahoma, each challenging our proposed merger with Energy Transfer. The complaints assert various claims against the individual members of our Board of Directors, certain entities affiliated with Energy Transfer (the “ETE defendants”), and us. The allegations include claims that our Board of Directors breached its fiduciary duties to our stockholders by agreeing to sell us through an allegedly unfair process and for an allegedly unfair price, that the ETE defendants and/or we aided and abetted this purported breach of fiduciary duties, and that our directors violated their fiduciary duties by allegedly failing to disclose material information about the merger. Two lawsuits also claim that disclosures about the merger violate federal securities laws and our Directors, we, and ETE defendants are liable for such violations. The complaints seek, among other things, an injunction against the merger and an award of costs and attorneys’ fees. We cannot reasonably estimate a range of potential loss at this time.
Royalty Matters
Certain of our customers, including one major customer, have been named in various lawsuits alleging underpayment of royalties and claiming, among other things, violations of anti-trust laws and the Racketeer Influenced and Corrupt Organizations Act. We have also been named as a defendant in certain of these cases in Texas, Pennsylvania, and Ohio based on allegations that we improperly participated with that major customer in causing the alleged royalty underpayments. We have also received subpoenas from the United States Department of Justice and the Pennsylvania
147
|
The Williams Companies, Inc.
|
||||
|
Notes to Consolidated Financial Statements – (Continued)
|
||||
Attorney General requesting documents relating to the agreements between us and our major customer and calculations of the major customer’s royalty payments. On December 9, 2015, the Pennsylvania Attorney General filed a civil suit against one of our major customers and us alleging breaches of the Pennsylvania Unfair Trade Practices and Consumer Protection Law, and on February 8, 2016, the Pennsylvania Attorney General filed an amended complaint in such civil suit, which omitted us as a party. We believe that the claims asserted are subject to indemnity obligations owed to us by that major customer. Due to the preliminary status of the cases, we are unable to estimate a range of liability at this time.
Environmental Matters
We are a participant in certain environmental activities in various stages including assessment studies, cleanup operations, and remedial processes at certain sites, some of which we currently do not own. We are monitoring these sites in a coordinated effort with other potentially responsible parties, the EPA, and other governmental authorities. We are jointly and severally liable along with unrelated third parties in some of these activities and solely responsible in others. Certain of our subsidiaries have been identified as potentially responsible parties at various Superfund and state waste disposal sites. In addition, these subsidiaries have incurred, or are alleged to have incurred, various other hazardous materials removal or remediation obligations under environmental laws. As of
December 31, 2015
, we have accrued liabilities totaling
$40 million
for these matters, as discussed below. Our accrual reflects the most likely costs of cleanup, which are generally based on completed assessment studies, preliminary results of studies, or our experience with other similar cleanup operations. Certain assessment studies are still in process for which the ultimate outcome may yield significantly different estimates of most likely costs. Any incremental amount in excess of amounts currently accrued cannot be reasonably estimated at this time due to uncertainty about the actual number of contaminated sites ultimately identified, the actual amount and extent of contamination discovered, and the final cleanup standards mandated by the EPA and other governmental authorities.
The EPA and various state regulatory agencies routinely promulgate and propose new rules, and issue updated guidance to existing rules. More recent rules and rulemakings include, but are not limited to, rules for reciprocating internal combustion engine maximum achievable control technology, new air quality standards for one hour nitrogen dioxide emission limits, and new air quality standards impacting storage vessels, pressure valves, and compressors. On October 1, 2015, the EPA issued its new rule regarding National Ambient Air Quality Standards for ground-level ozone, setting a new standard of 70 parts per billion. We are monitoring the rule’s implementation and evaluating potential impacts to our operations. For these and other new regulations, we are unable to estimate the costs of asset additions or modifications necessary to comply due to uncertainty created by the various legal challenges to these regulations and the need for further specific regulatory guidance.
Continuing operations
Our interstate gas pipelines are involved in remediation activities related to certain facilities and locations for polychlorinated biphenyls, mercury, and other hazardous substances. These activities have involved the EPA and various state environmental authorities, resulting in our identification as a potentially responsible party at various Superfund waste sites. At
December 31, 2015
, we have accrued liabilities of
$8 million
for these costs. We expect that these costs will be recoverable through rates.
We also accrue environmental remediation costs for natural gas underground storage facilities, primarily related to soil and groundwater contamination. At
December 31, 2015
, we have accrued liabilities totaling
$7 million
for these costs.
Former operations, including operations classified as discontinued
We have potential obligations in connection with assets and businesses we no longer operate. These potential obligations include remediation activities at the direction of federal and state environmental authorities and the indemnification of the purchasers of certain of these assets and businesses for environmental and other liabilities existing
148
|
The Williams Companies, Inc.
|
||||
|
Notes to Consolidated Financial Statements – (Continued)
|
||||
at the time the sale was consummated. Our responsibilities relate to the operations of the assets and businesses described below.
|
•
|
Former agricultural fertilizer and chemical operations and former retail petroleum and refining operations;
|
|
•
|
Former petroleum products and natural gas pipelines;
|
|
•
|
Former petroleum refining facilities;
|
|
•
|
Former exploration and production and mining operations;
|
|
•
|
Former electricity and natural gas marketing and trading operations.
|
At
December 31, 2015
, we have accrued environmental liabilities of
$25 million
related to these matters.
Other Divestiture Indemnifications
Pursuant to various purchase and sale agreements relating to divested businesses and assets, we have indemnified certain purchasers against liabilities that they may incur with respect to the businesses and assets acquired from us. The indemnities provided to the purchasers are customary in sale transactions and are contingent upon the purchasers incurring liabilities that are not otherwise recoverable from third parties. The indemnities generally relate to breach of warranties, tax, historic litigation, personal injury, property damage, environmental matters, right of way, and other representations that we have provided.
At
December 31, 2015
, other than as previously disclosed, we are not aware of any material claims against us involving the indemnities; thus, we do not expect any of the indemnities provided pursuant to the sales agreements to have a material impact on our future financial position. Any claim for indemnity brought against us in the future may have a material adverse effect on our results of operations in the period in which the claim is made.
In addition to the foregoing, various other proceedings are pending against us which are incidental to our operations.
Summary
We have disclosed our estimated range of reasonably possible losses for certain matters above, as well as all significant matters for which we are unable to reasonably estimate a range of possible loss. We estimate that for all other matters for which we are able to reasonably estimate a range of loss, our aggregate reasonably possible losses beyond amounts accrued are immaterial to our expected future annual results of operations, liquidity, and financial position. These calculations have been made without consideration of any potential recovery from third parties.
Commitments
Commitments for construction and acquisition of property, plant, and equipment are approximately
$770 million
at
December 31, 2015
.
Our reportable segments are Williams Partners and Williams NGL & Petchem Services. All remaining business activities are included in Other. (See
Note 1 – General, Description of Business, Basis of Presentation, and Summary of Significant Accounting Policies
.)
149
|
The Williams Companies, Inc.
|
||||
|
Notes to Consolidated Financial Statements – (Continued)
|
||||
Our segment presentation of Williams Partners, which includes our consolidated master limited partnership, is reflective of the parent-level focus by our chief operating decision-maker, considering the resource allocation and governance provisions associated with the master limited partnership structure. This partnership maintains capital and cash management structures that are separate from ours. It is self-funding and maintains its own lines of bank credit and cash management accounts. These factors, coupled with different costs of capital from our other businesses, serve to differentiate the management of this entity as a whole.
Performance Measurement
Prior to first quarter of 2015, we evaluated segment operating performance based on
Segment profit (loss)
from operations. Beginning in the first quarter of 2015, we evaluate segment operating performance based upon
Modified EBITDA
(earnings before interest, taxes, depreciation, and amortization). This measure represents the basis of our internal financial reporting and is the primary performance measure used by our chief operating decision maker in measuring performance and allocating resources among our reportable segments. Prior period segment disclosures have been recast to reflect this change.
We define
Modified EBITDA
as follows:
•
Net income (loss) before:
◦
Income (loss) from discontinued operations;
◦
Provision (benefit) for income taxes;
◦
Interest incurred, net of interest capitalized;
◦
Equity earnings (losses);
◦
Gain on remeasurement of equity-method investment;
◦
Impairment of equity-method investments;
◦
Other investing income (loss)
–
net;
◦
Impairment of goodwill;
◦
Depreciation and amortization expenses;
◦
Accretion expense associated with asset retirement obligations for nonregulated operations.
|
•
|
This measure is further adjusted to include our proportionate share (based on ownership interest) of
Modified EBITDA
from our equity-method investments calculated consistently with the definition described above.
|
The following geographic area data includes
Revenues from external customers
based on product shipment origin and
Long-lived assets
based upon physical location.
|
United States
|
Canada
|
Total
|
|||||||||||
|
(Millions)
|
|||||||||||||
|
Revenues from external customers:
|
|||||||||||||
|
2015
|
$
|
7,247
|
|
$
|
113
|
|
$
|
7,360
|
|
||||
|
2014
|
7,229
|
|
408
|
|
7,637
|
|
|||||||
|
2013
|
6,703
|
|
157
|
|
6,860
|
|
|||||||
|
Long-lived assets:
|
|||||||||||||
|
2015
|
$
|
38,016
|
|
$
|
1,580
|
|
$
|
39,596
|
|
||||
|
2014
|
38,290
|
|
1,364
|
|
39,654
|
|
|||||||
|
2013
|
19,260
|
|
1,240
|
|
20,500
|
|
|||||||
Long-lived assets
are comprised of property, plant, and equipment, goodwill, and other intangible assets.
150
|
The Williams Companies, Inc.
|
||||
|
Notes to Consolidated Financial Statements – (Continued)
|
||||
The following table reflects the reconciliation of
Segment revenues
to
Total revenues
as reported in the
Consolidated Statement of Operations
and
Other financial information
.
|
Williams
Partners
|
Williams
NGL & Petchem
Services (1)
|
Other
|
Eliminations
|
Total
|
|||||||||||||||
|
(Millions)
|
|||||||||||||||||||
|
2015
|
|||||||||||||||||||
|
Segment revenues:
|
|||||||||||||||||||
|
Service revenues
|
|||||||||||||||||||
|
External
|
$
|
5,134
|
|
$
|
2
|
|
$
|
28
|
|
$
|
—
|
|
$
|
5,164
|
|
||||
|
Internal
|
1
|
|
—
|
|
158
|
|
(159
|
)
|
—
|
|
|||||||||
|
Total service revenues
|
5,135
|
|
2
|
|
186
|
|
(159
|
)
|
5,164
|
|
|||||||||
|
Product sales
|
|||||||||||||||||||
|
External
|
2,196
|
|
—
|
|
—
|
|
—
|
|
2,196
|
|
|||||||||
|
Internal
|
—
|
|
—
|
|
—
|
|
—
|
|
—
|
|
|||||||||
|
Total product sales
|
2,196
|
|
—
|
|
—
|
|
—
|
|
2,196
|
|
|||||||||
|
Total revenues
|
$
|
7,331
|
|
$
|
2
|
|
$
|
186
|
|
$
|
(159
|
)
|
$
|
7,360
|
|
||||
|
Other financial information:
|
|||||||||||||||||||
|
Additions to long-lived assets
|
$
|
2,960
|
|
$
|
360
|
|
$
|
28
|
|
$
|
(12
|
)
|
$
|
3,336
|
|
||||
|
Proportional Modified EBITDA of equity-method investments
|
699
|
|
—
|
|
—
|
|
699
|
|
|||||||||||
|
2014
|
|||||||||||||||||||
|
Segment revenues:
|
|||||||||||||||||||
|
Service revenues
|
|||||||||||||||||||
|
External
|
$
|
3,887
|
|
$
|
—
|
|
$
|
229
|
|
$
|
—
|
|
$
|
4,116
|
|
||||
|
Internal
|
1
|
|
—
|
|
30
|
|
(31
|
)
|
—
|
|
|||||||||
|
Total service revenues
|
3,888
|
|
—
|
|
259
|
|
(31
|
)
|
4,116
|
|
|||||||||
|
Product sales
|
|||||||||||||||||||
|
External
|
3,521
|
|
—
|
|
—
|
|
—
|
|
3,521
|
|
|||||||||
|
Internal
|
—
|
|
—
|
|
—
|
|
—
|
|
—
|
|
|||||||||
|
Total product sales
|
3,521
|
|
—
|
|
—
|
|
—
|
|
3,521
|
|
|||||||||
|
Total revenues
|
$
|
7,409
|
|
$
|
—
|
|
$
|
259
|
|
$
|
(31
|
)
|
$
|
7,637
|
|
||||
|
Other financial information:
|
|||||||||||||||||||
|
Additions to long-lived assets (2)
|
$
|
20,413
|
|
$
|
291
|
|
$
|
54
|
|
$
|
(2
|
)
|
$
|
20,756
|
|
||||
|
Proportional Modified EBITDA of equity-method investments
|
431
|
|
(78
|
)
|
85
|
|
438
|
|
|||||||||||
|
2013
|
|||||||||||||||||||
|
Segment revenues:
|
|||||||||||||||||||
|
Service revenues
|
|||||||||||||||||||
|
External
|
$
|
2,914
|
|
$
|
—
|
|
$
|
25
|
|
$
|
—
|
|
$
|
2,939
|
|
||||
|
Internal
|
—
|
|
—
|
|
11
|
|
(11
|
)
|
—
|
|
|||||||||
|
Total service revenues
|
2,914
|
|
—
|
|
36
|
|
(11
|
)
|
2,939
|
|
|||||||||
|
Product sales
|
|||||||||||||||||||
|
External
|
3,921
|
|
—
|
|
—
|
|
—
|
|
3,921
|
|
|||||||||
|
Internal
|
—
|
|
—
|
|
—
|
|
—
|
|
—
|
|
|||||||||
|
Total product sales
|
3,921
|
|
—
|
|
—
|
|
—
|
|
3,921
|
|
|||||||||
|
Total revenues
|
$
|
6,835
|
|
$
|
—
|
|
$
|
36
|
|
$
|
(11
|
)
|
$
|
6,860
|
|
||||
|
Other financial information:
|
|||||||||||||||||||
|
Additions to long-lived assets
|
$
|
3,409
|
|
$
|
295
|
|
$
|
27
|
|
$
|
—
|
|
$
|
3,731
|
|
||||
|
Proportional Modified EBITDA of equity-method investments
|
209
|
|
—
|
|
197
|
|
406
|
|
|||||||||||
__________
|
(1)
|
Includes certain projects under development and thus nominal reported revenues to date.
|
|
(2)
|
2014
Additions to long-lived assets
within our Williams Partners segment primarily includes the acquisition-date fair value of long-lived assets from the ACMP Acquisition. (See Note 2 - Acquisitions.)
|
151
|
The Williams Companies, Inc.
|
||||
|
Notes to Consolidated Financial Statements – (Continued)
|
||||
The following table reflects the reconciliation of
Modified EBITDA
to
Net income (loss)
as reported in the
Consolidated Statement of Operations
.
|
Years Ended December 31,
|
|||||||||||||||||
|
2015
|
2014
|
2013
|
|||||||||||||||
|
(Millions)
|
|||||||||||||||||
|
Modified EBITDA by segment:
|
|||||||||||||||||
|
Williams Partners
|
$
|
4,003
|
|
$
|
3,244
|
|
$
|
2,447
|
|
||||||||
|
Williams NGL & Petchem Services
|
(83
|
)
|
(115
|
)
|
(33
|
)
|
|||||||||||
|
Other
|
(29
|
)
|
103
|
|
197
|
|
|||||||||||
|
3,891
|
|
3,232
|
|
2,611
|
|
||||||||||||
|
Accretion expense associated with asset retirement obligations for nonregulated operations
|
(28
|
)
|
(18
|
)
|
(15
|
)
|
|||||||||||
|
Depreciation and amortization expenses
|
(1,738
|
)
|
(1,176
|
)
|
(815
|
)
|
|||||||||||
|
Impairment of goodwill
|
(1,098
|
)
|
—
|
|
—
|
|
|||||||||||
|
Equity earnings (losses)
|
335
|
|
144
|
|
134
|
|
|||||||||||
|
Gain on remeasurement of equity-method investment
|
—
|
|
2,544
|
|
—
|
|
|||||||||||
|
Impairment of equity-method investments
|
(1,359
|
)
|
—
|
|
—
|
|
|||||||||||
|
Other investing income (loss) – net
|
27
|
|
43
|
|
81
|
|
|||||||||||
|
Proportional Modified EBITDA of equity-method investments
|
(699
|
)
|
(438
|
)
|
(406
|
)
|
|||||||||||
|
Interest expense
|
(1,044
|
)
|
(747
|
)
|
(510
|
)
|
|||||||||||
|
(Provision) benefit for income taxes
|
399
|
|
(1,249
|
)
|
(401
|
)
|
|||||||||||
|
Income (loss) from discontinued operations, net of tax
|
—
|
|
4
|
|
(11
|
)
|
|||||||||||
|
Net income (loss)
|
$
|
(1,314
|
)
|
$
|
2,339
|
|
$
|
668
|
|
||||||||
The following table reflects
Total assets
and
Equity-method investments
by reportable segments:
|
Total Assets
|
Equity-Method Investments
|
|||||||||||||||
|
December 31, 2015
|
December 31, 2014
|
December 31, 2015
|
December 31, 2014
|
|||||||||||||
|
(Millions)
|
||||||||||||||||
|
Williams Partners
|
$
|
47,870
|
|
$
|
49,248
|
|
$
|
7,336
|
|
|
$
|
8,399
|
|
|||
|
Williams NGL & Petchem Services
|
835
|
|
612
|
|
—
|
|
—
|
|
||||||||
|
Other
|
850
|
|
1,186
|
|
—
|
|
1
|
|
||||||||
|
Eliminations
|
(535
|
)
|
(591
|
)
|
—
|
|
—
|
|
||||||||
|
Total
|
$
|
49,020
|
|
$
|
50,455
|
|
$
|
7,336
|
|
$
|
8,400
|
|
||||
152
|
The Williams Companies Inc.
|
||
|
Quarterly Financial Data
|
||
|
(Unaudited)
|
||
Summarized quarterly financial data are as follows:
|
First
Quarter
|
Second
Quarter
|
Third
Quarter
|
Fourth
Quarter
|
||||||||||||
|
|
(Millions, except per-share amounts)
|
||||||||||||||
|
2015
|
|||||||||||||||
|
Revenues
|
$
|
1,716
|
|
$
|
1,839
|
|
$
|
1,799
|
|
$
|
2,006
|
|
|||
|
Product costs
|
462
|
|
494
|
|
426
|
|
397
|
|
|||||||
|
Income (loss) from continuing operations
|
13
|
|
183
|
|
(173
|
)
|
(1,337
|
)
|
|||||||
|
Net income (loss)
|
13
|
|
183
|
|
(173
|
)
|
(1,337
|
)
|
|||||||
|
Amounts attributable to The Williams Companies, Inc.:
|
|||||||||||||||
|
Income (loss) from continuing operations
|
70
|
|
114
|
|
(40
|
)
|
(715
|
)
|
|||||||
|
Net income (loss)
|
70
|
|
114
|
|
(40
|
)
|
(715
|
)
|
|||||||
|
Basic earnings (loss) per common share:
|
|||||||||||||||
|
Income (loss) from continuing operations
|
.09
|
|
.15
|
|
(.05
|
)
|
(.95
|
)
|
|||||||
|
Diluted earnings (loss) per common share:
|
|||||||||||||||
|
Income (loss) from continuing operations
|
.09
|
|
.15
|
|
(.05
|
)
|
(.95
|
)
|
|||||||
|
2014
|
|||||||||||||||
|
Revenues
|
$
|
1,749
|
|
$
|
1,678
|
|
$
|
2,069
|
|
$
|
2,141
|
|
|||
|
Product costs
|
769
|
|
724
|
|
807
|
|
716
|
|
|||||||
|
Income (loss) from continuing operations
|
196
|
|
123
|
|
1,708
|
|
308
|
|
|||||||
|
Net income (loss)
|
196
|
|
127
|
|
1,708
|
|
308
|
|
|||||||
|
Amounts attributable to The Williams Companies, Inc.:
|
|||||||||||||||
|
Income (loss) from continuing operations
|
140
|
|
99
|
|
1,678
|
|
193
|
|
|||||||
|
Net income (loss)
|
140
|
|
103
|
|
1,678
|
|
193
|
|
|||||||
|
Basic earnings (loss) per common share:
|
|||||||||||||||
|
Income (loss) from continuing operations
|
.20
|
|
.14
|
|
2.24
|
|
.26
|
|
|||||||
|
Diluted earnings (loss) per common share:
|
|||||||||||||||
|
Income (loss) from continuing operations
|
.20
|
|
.14
|
|
2.22
|
|
.26
|
|
|||||||
The sum of earnings (loss) per share for the four quarters may not equal the total earnings (loss) per share for the year due to changes in the average number of common shares outstanding and rounding.
2015
Net income (loss)
for fourth-quarter 2015 includes the following pretax items:
|
•
|
$239 million in revenue associated with minimum volume commitment fees at Williams Partners (see
Note 6 – Other Income and Expenses
of Notes to Consolidated Financial Statements);
|
|
•
|
$14 million of ACMP Merger and transition-related expenses primarily at Other (see
Note 6 – Other Income and Expenses
);
|
|
•
|
$64 million impairment loss on certain assets at Williams NGL & Petchem Services (see
Note 17 – Fair Value Measurements, Guarantees, and Concentration of Credit Risk
);
|
|
•
|
$116 million impairment loss on certain assets at Williams Partners (see
Note 17 – Fair Value Measurements, Guarantees, and Concentration of Credit Risk
);
|
|
•
|
$898 million impairment loss on certain equity-method investments at Williams Partners (see
Note 17 – Fair Value Measurements, Guarantees, and Concentration of Credit Risk
);
|
153
|
The Williams Companies Inc.
|
||
|
Quarterly Financial Data – (Continued)
|
||
|
(Unaudited)
|
||
|
•
|
$1,098 million impairment of goodwill at Williams Partners (see
Note 17 – Fair Value Measurements, Guarantees, and Concentration of Credit Risk
).
|
Net income (loss)
for fourth-quarter 2015 also includes a $71 million income tax benefit related to a translation adjustment of certain unrecognized tax benefits (see
Note 7 – Provision (Benefit) for Income Taxes
).
Net income (loss)
for third-quarter 2015 includes the following pretax items:
|
•
|
$18 million interest income associated with a receivable related to the sale of certain former Venezuela assets (see
Note 5 – Investing Activities
);
|
|
•
|
$9 million of ACMP Acquisition, merger, and transition-related expenses primarily at Other (see
Note 6 – Other Income and Expenses
);
|
|
•
|
$17 million equity losses related to our share of underlying property impairments at certain equity-method investments at Williams Partners (see
Note 5 – Investing Activities
);
|
|
•
|
$19 million of costs associated with our evaluation of strategic alternatives at Other (see
Note 6 – Other Income and Expenses
);
|
|
•
|
$461 million impairment loss on certain equity-method investments at Williams Partners (see
Note 17 – Fair Value Measurements, Guarantees, and Concentration of Credit Risk
).
|
Net income (loss)
for second-quarter 2015 includes the following pretax items:
|
•
|
$126 million gain associated with insurance recoveries related to the Geismar Incident at Williams Partners (see
Note 6 – Other Income and Expenses
);
|
|
•
|
$14 million gain associated with the early retirement of certain debt at Williams Partners (see
Note 6 – Other Income and Expenses
);
|
|
•
|
$9 million interest income associated with a receivable related to the sale of certain former Venezuela assets (see
Note 5 – Investing Activities
);
|
|
•
|
$23 million of ACMP Merger and transition-related expenses primarily at Williams Partners (see
Note 6 – Other Income and Expenses
);
|
|
•
|
$24 million impairment loss on certain assets at Williams Partners (see
Note 17 – Fair Value Measurements, Guarantees, and Concentration of Credit Risk
).
|
Net income (loss)
for first-quarter 2015 includes $40 million of ACMP Merger and transition-related expenses primarily at Williams Partners (see
Note 6 – Other Income and Expenses
).
2014
Net income (loss)
for fourth-quarter 2014 includes the following pretax items:
|
•
|
$167 million in revenue associated with minimum volume commitment fees at Williams Partners, associated with operations acquired in the ACMP Acquisition (see
Note 6 – Other Income and Expenses
);
|
|
•
|
$154 million gain related to a contingency settlement at Williams Partners (see
Note 6 – Other Income and Expenses
);
|
154
|
The Williams Companies Inc.
|
||
|
Quarterly Financial Data – (Continued)
|
||
|
(Unaudited)
|
||
|
•
|
$71 million gain associated with insurance recoveries related to the Geismar Incident at Williams Partners (see
Note 6 – Other Income and Expenses
);
|
|
•
|
$22 million favorable adjustment to gain on remeasurement of equity-method investment at Other (see
Note 2 – Acquisitions
);
|
|
•
|
$17 million unfavorable inventory adjustment related to a decrease in prices at Williams Partners (see
Note 6 – Other Income and Expenses
);
|
|
•
|
$35 million impairment loss on certain assets at Williams Partners (see
Note 17 – Fair Value Measurements, Guarantees, and Concentration of Credit Risk
);
|
|
•
|
$38 million of ACMP Acquisition, merger, and transition-related expenses primarily at Williams Partners (see
Note 2 – Acquisitions
and
Note 6 – Other Income and Expenses
).
|
Net income (loss)
for third-quarter 2014 includes the following pretax items:
|
•
|
$2,522 million gain recognized as a result of remeasuring to fair value the equity-method investment that we held before we acquired a controlling interest in ACMP at Other (see
Note 2 – Acquisitions
);
|
|
•
|
$14 million interest income associated with a receivable related to the sale of certain former Venezuela assets (see
Note 5 – Investing Activities
);
|
|
•
|
$12 million net gain related to a partial acreage dedication release at Williams Partners (see
Note 6 – Other Income and Expenses
);
|
|
•
|
$13 million in ACMP Acquisition expenses at Williams Partners, in addition to $14 million of merger and transition-related expenses (see
Note 2 – Acquisitions
and
Note 6 – Other Income and Expenses
);
|
|
•
|
$24 million of losses associated with acquisition-related compensation expenses that were triggered by the ACMP Acquisition primarily at Other (see
Note 2 – Acquisitions
).
|
Net income (loss)
for second-quarter 2014 includes the following pretax items:
|
•
|
$50 million gain associated with insurance recoveries related to the Geismar Incident at Williams Partners (see
Note 6 – Other Income and Expenses
);
|
|
•
|
$14 million interest income associated with a receivable related to the sale of certain former Venezuela assets (see
Note 5 – Investing Activities
);
|
|
•
|
$11 million of ACMP Acquisition-related expenses, including $9 million of financing expenses (see
|
|
•
|
$17 million impairment loss on certain assets at Williams Partners (see
|
Net income (loss)
for first-quarter 2014 includes the following pretax items:
|
•
|
$125 million gain associated with insurance recoveries related to the Geismar Incident at Williams Partners (see
Note 6 – Other Income and Expenses
);
|
|
•
|
$13 million interest income associated with a receivable related to the sale of certain former Venezuela assets (see
Note 5 – Investing Activities
);
|
155
|
The Williams Companies Inc.
|
||
|
Quarterly Financial Data – (Continued)
|
||
|
(Unaudited)
|
||
|
•
|
$19 million in expenses associated with the Bluegrass Pipeline project development costs at Williams NGL & Petchem Services (see
|
|
•
|
$67 million equity losses related to the write-off of previously capitalized project development costs associated with the Bluegrass Pipeline at Williams NGL & Petchem Services (see
|
Net income (loss)
for first-quarter 2014 also includes a $23 million deferred income tax benefit related to the completion of the Canada Dropdown.
156
The Williams Companies, Inc.
Schedule I — Condensed Financial Information of Registrant
Statement of Comprehensive Income (Loss) (Parent)
|
|
Years Ended December 31,
|
||||||||||
|
|
2015
|
2014
|
2013
|
||||||||
|
|
(Millions, except per-share amounts)
|
||||||||||
|
Equity in earnings of consolidated subsidiaries
|
$
|
232
|
|
$
|
1,799
|
|
$
|
1,564
|
|
||
|
Equity earnings (losses) from investment in Access Midstream Partners
|
—
|
|
(7
|
)
|
30
|
|
|||||
|
Interest incurred — external
|
(255
|
)
|
(206
|
)
|
(156
|
)
|
|||||
|
Interest incurred — affiliate
|
(828
|
)
|
(797
|
)
|
(722
|
)
|
|||||
|
Interest income — affiliate
|
6
|
|
10
|
|
71
|
|
|||||
|
Gain on remeasurement of equity-method investment
|
—
|
|
2,544
|
|
—
|
|
|||||
|
Other income (expense) — net
|
(75
|
)
|
(13
|
)
|
32
|
|
|||||
|
Income (loss) from continuing operations before income taxes
|
(920
|
)
|
3,330
|
|
819
|
|
|||||
|
Provision (benefit) for income taxes
|
(349
|
)
|
1,220
|
|
378
|
|
|||||
|
Income (loss) from continuing operations
|
(571
|
)
|
2,110
|
|
441
|
|
|||||
|
Income (loss) from discontinued operations
|
—
|
|
4
|
|
(11
|
)
|
|||||
|
Net income (loss)
|
$
|
(571
|
)
|
$
|
2,114
|
|
$
|
430
|
|
||
|
Basic earnings (loss) per common share:
|
|||||||||||
|
Income (loss) from continuing operations
|
$
|
(.76
|
)
|
$
|
2.93
|
|
$
|
.65
|
|
||
|
Income (loss) from discontinued operations
|
—
|
|
.01
|
|
(.02
|
)
|
|||||
|
Net income (loss)
|
$
|
(.76
|
)
|
$
|
2.94
|
|
$
|
.63
|
|
||
|
Weighted-average shares (thousands)
|
749,271
|
|
719,325
|
|
682,948
|
|
|||||
|
Diluted earnings (loss) per common share:
|
|||||||||||
|
Income (loss) from continuing operations
|
$
|
(.76
|
)
|
$
|
2.91
|
|
$
|
.64
|
|
||
|
Income (loss) from discontinued operations
|
—
|
|
.01
|
|
(.02
|
)
|
|||||
|
Net income (loss)
|
$
|
(.76
|
)
|
$
|
2.92
|
|
$
|
.62
|
|
||
|
Weighted-average shares (thousands)
|
749,271
|
|
723,641
|
|
687,185
|
|
|||||
|
Other comprehensive income (loss):
|
|||||||||||
|
Equity in other comprehensive income (loss) of consolidated subsidiaries
|
$
|
(204
|
)
|
$
|
(96
|
)
|
$
|
(41
|
)
|
||
|
Other comprehensive income (loss) attributable to The Williams Companies, Inc.
|
33
|
|
(80
|
)
|
239
|
|
|||||
|
Other comprehensive income (loss)
|
(171
|
)
|
(176
|
)
|
198
|
|
|||||
|
Less: Other comprehensive income (loss) attributable to noncontrolling interests
|
(70
|
)
|
(19
|
)
|
—
|
|
|||||
|
Comprehensive income (loss) attributable to The Williams Companies, Inc.
|
$
|
(672
|
)
|
$
|
1,957
|
|
$
|
628
|
|
||
See accompanying notes.
157
The Williams Companies, Inc.
Schedule I — Condensed Financial Information of Registrant – (Continued)
Balance Sheet (Parent)
|
|
December 31,
|
||||||
|
|
2015
|
2014
|
|||||
|
|
(Millions)
|
||||||
|
ASSETS
|
|||||||
|
Current assets:
|
|||||||
|
Cash and cash equivalents
|
$
|
12
|
|
$
|
49
|
|
|
|
Other current assets and deferred charges
|
62
|
|
246
|
|
|||
|
Total current assets
|
74
|
|
295
|
|
|||
|
Investments in and advances to consolidated subsidiaries
|
30,927
|
|
31,405
|
|
|||
|
Property, plant, and equipment — net
|
99
|
|
99
|
|
|||
|
Other noncurrent assets
|
12
|
|
12
|
|
|||
|
Total assets
|
$
|
31,112
|
|
$
|
31,811
|
|
|
|
LIABILITIES AND STOCKHOLDERS’ EQUITY
|
|||||||
|
Current liabilities:
|
|||||||
|
Accounts payable
|
$
|
27
|
|
$
|
27
|
|
|
|
Other current liabilities
|
163
|
|
174
|
|
|||
|
Total current liabilities
|
190
|
|
201
|
|
|||
|
Long-term debt
|
4,811
|
|
4,528
|
|
|||
|
Notes payable — affiliates
|
15,506
|
|
13,295
|
|
|||
|
Pension, other postretirement, and other noncurrent liabilities
|
336
|
|
409
|
|
|||
|
Deferred income tax liabilities
|
4,121
|
|
4,601
|
|
|||
|
Contingent liabilities and commitments
|
|
|
|||||
|
Equity:
|
|||||||
|
Common stock
|
784
|
|
782
|
|
|||
|
Other stockholders’ equity
|
5,364
|
|
7,995
|
|
|||
|
Total stockholders’ equity
|
6,148
|
|
8,777
|
|
|||
|
Total liabilities and stockholders’ equity
|
$
|
31,112
|
|
$
|
31,811
|
|
|
See accompanying notes.
158
The Williams Companies, Inc.
Schedule I — Condensed Financial Information of Registrant – (Continued)
Statement of Cash Flows (Parent)
|
|
Years Ended December 31,
|
||||||||||
|
|
2015
|
2014
|
2013
|
||||||||
|
|
(Millions)
|
||||||||||
|
NET CASH FLOWS PROVIDED (USED) BY OPERATING ACTIVITIES
|
$
|
(1,209
|
)
|
$
|
(500
|
)
|
$
|
19
|
|
||
|
FINANCING ACTIVITIES:
|
|||||||||||
|
Proceeds from long-term debt
|
2,097
|
|
2,935
|
|
—
|
|
|||||
|
Payments of long-term debt
|
(1,817
|
)
|
(671
|
)
|
(1
|
)
|
|||||
|
Changes in notes payable to affiliates
|
2,211
|
|
2,465
|
|
1,892
|
|
|||||
|
Tax benefit of stock-based awards
|
—
|
|
25
|
|
19
|
|
|||||
|
Proceeds from issuance of common stock
|
27
|
|
3,416
|
|
18
|
|
|||||
|
Dividends paid
|
(1,836
|
)
|
(1,412
|
)
|
(982
|
)
|
|||||
|
Other — net
|
(2
|
)
|
(17
|
)
|
(3
|
)
|
|||||
|
Net cash provided (used) by financing activities
|
680
|
|
6,741
|
|
943
|
|
|||||
|
INVESTING ACTIVITIES:
|
|||||||||||
|
Capital expenditures
|
(29
|
)
|
(54
|
)
|
(23
|
)
|
|||||
|
Purchase of Access Midstream Partners
|
—
|
|
(5,995
|
)
|
—
|
|
|||||
|
Changes in investments in and advances to consolidated subsidiaries
|
521
|
|
(450
|
)
|
(985
|
)
|
|||||
|
Other — net
|
—
|
|
25
|
|
(12
|
)
|
|||||
|
Net cash provided (used) by investing activities
|
492
|
|
(6,474
|
)
|
(1,020
|
)
|
|||||
|
Increase (decrease) in cash and cash equivalents
|
(37
|
)
|
(233
|
)
|
(58
|
)
|
|||||
|
Cash and cash equivalents at beginning of year
|
49
|
|
282
|
|
340
|
|
|||||
|
Cash and cash equivalents at end of year
|
$
|
12
|
|
$
|
49
|
|
$
|
282
|
|
||
See accompanying notes.
159
The Williams Companies, Inc.
Schedule I — Condensed Financial Information of Registrant – (Continued)
Notes to Financial Information (Parent)
In addition to the guarantees disclosed in the accompanying consolidated financial statements in Item 8, we have financially guaranteed the performance of certain consolidated subsidiaries. The duration of these guarantees varies, and we estimate the maximum undiscounted potential future payment obligation related to these guarantees as of December 31, 2015, is approximately
$631 million
.
We receive dividends and distributions either directly from our subsidiaries or indirectly through dividends received by subsidiaries and subsequent transfers of cash to us through our corporate cash management system. The total of such receipts ultimately related to dividends and distributions for the years ended December 31, 2015, 2014, and 2013 was approximately
$1.8 billion
,
$1.9 billion
, and
$1.5 billion
, respectively.
160
The Williams Companies, Inc.
Schedule II — Valuation and Qualifying Accounts
|
|
|
Additions
|
|
|
|||||||||||||||
|
|
Beginning
Balance
|
Charged
(Credited)
To Costs and
Expenses
|
Other
|
Deductions
|
Ending
Balance
|
||||||||||||||
|
|
(Millions)
|
||||||||||||||||||
|
2015
|
|||||||||||||||||||
|
Allowance for doubtful accounts — accounts and notes receivable (1)
|
$
|
—
|
|
$
|
3
|
|
$
|
—
|
|
$
|
—
|
|
$
|
3
|
|
||||
|
Deferred tax asset valuation allowance (1)
|
206
|
|
(16
|
)
|
—
|
|
—
|
|
190
|
|
|||||||||
|
2014
|
|||||||||||||||||||
|
Allowance for doubtful accounts — accounts and notes receivable (1)
|
—
|
|
—
|
|
—
|
|
—
|
|
—
|
|
|||||||||
|
Deferred tax asset valuation allowance (1)
|
181
|
|
25
|
|
—
|
|
—
|
|
206
|
|
|||||||||
|
2013
|
|||||||||||||||||||
|
Allowance for doubtful accounts — accounts and notes receivable (1)
|
—
|
|
—
|
|
—
|
|
—
|
|
—
|
|
|||||||||
|
Deferred tax asset valuation allowance (1)
|
144
|
|
37
|
|
—
|
|
—
|
|
181
|
|
|||||||||
__________
(1) Deducted from related assets.
161
Item 9.
Changes in and Disagreements with Accountants on Accounting and Financial Disclosure
None.
Item 9A.
Controls and Procedures
Disclosure Controls and Procedures
Our management, including our Chief Executive Officer and Chief Financial Officer, does not expect that our disclosure controls and procedures (as defined in Rules 13a - 15(e) and 15d - 15(e) of the Securities Exchange Act) (Disclosure Controls) will prevent all errors and all fraud. A control system, no matter how well conceived and operated, can provide only reasonable, not absolute, assurance that the objectives of the control system are met. Further, the design of a control system must reflect the fact that there are resource constraints, and the benefits of controls must be considered relative to their costs. Because of the inherent limitations in all control systems, no evaluation of controls can provide absolute assurance that all control issues and instances of fraud, if any, within the company have been detected. These inherent limitations include the realities that judgments in decision-making can be faulty, and that breakdowns can occur because of simple error or mistake. Additionally, controls can be circumvented by the individual acts of some persons, by collusion of two or more people, or by management override of the control. The design of any system of controls also is based in part upon certain assumptions about the likelihood of future events, and there can be no assurance that any design will succeed in achieving its stated goals under all potential future conditions. Because of the inherent limitations in a cost-effective control system, misstatements due to error or fraud may occur and not be detected. We monitor our Disclosure Controls and make modifications as necessary; our intent in this regard is that the Disclosure Controls will be modified as systems change and conditions warrant.
Evaluation of Disclosure Controls and Procedures
An evaluation of the effectiveness of the design and operation of our Disclosure Controls was performed as of the end of the period covered by this report. This evaluation was performed under the supervision and with the participation of our management, including our Chief Executive Officer and Chief Financial Officer. Based upon that evaluation, our Chief Executive Officer and Chief Financial Officer concluded that these Disclosure Controls are effective at a reasonable assurance level.
Changes in Internal Control Over Financial Reporting
There have been no changes during the fourth quarter of 2015 that have materially affected, or are reasonably likely to materially affect, our Internal Control over Financial Reporting.
Management’s Annual Report on Internal Control over Financial Reporting
Management is responsible for establishing and maintaining adequate internal control over financial reporting (as defined in Rules 13a - 15(f) and 15d - 15(f) under the Securities Exchange Act of 1934). Our internal control over financial reporting is designed to provide reasonable assurance to our management and board of directors regarding the preparation and fair presentation of financial statements in accordance with accounting principles generally accepted in the United States. Our internal control over financial reporting includes those policies and procedures that (i) pertain to the maintenance of records that, in reasonable detail, accurately and fairly reflect the transactions and dispositions of our assets; (ii) provide reasonable assurance that transactions are recorded as to permit preparation of financial statements in accordance with generally accepted accounting principles, and that our receipts and expenditures are being made only in accordance with authorization of our management and board of directors; and (iii) provide reasonable assurance regarding prevention or timely detection of unauthorized acquisition, use or disposition of our assets that could have a material effect on our financial statements.
All internal control systems, no matter how well designed, have inherent limitations including the possibility of human error and the circumvention or overriding of controls. Therefore, even those systems determined to be effective can provide only reasonable assurance with respect to financial statement preparation and presentation.
162
Under the supervision and with the participation of our management, including our Chief Executive Officer and Chief Financial Officer, we assessed the effectiveness of our internal control over financial reporting as of December 31, 2015, based on the criteria set forth by the Committee of Sponsoring Organizations of the Treadway Commission (COSO) in
Internal Control — Integrated Framework
(2013). Based on our assessment, we concluded that, as of December 31, 2015, our internal control over financial reporting was effective.
Ernst & Young LLP, our independent registered public accounting firm, has audited our internal control over financial reporting, as stated in their report which is included in this Annual Report on Form 10-K.
163
Report of Independent Registered Public Accounting Firm
On Internal Control Over Financial Reporting
The Board of Directors and Stockholders of
The Williams Companies, Inc.
We have audited The Williams Companies, Inc.’s internal control over financial reporting as of December 31, 2015, based on criteria established in Internal Control-Integrated Framework issued by the Committee of Sponsoring Organizations of the Treadway Commission (2013 framework) (the COSO criteria). The Williams Companies, Inc.’s management is responsible for maintaining effective internal control over financial reporting, and for its assessment of the effectiveness of internal control over financial reporting included in the accompanying Management’s Annual Report on Internal Control over Financial Reporting. Our responsibility is to express an opinion on the Company’s internal control over financial reporting based on our audit.
We conducted our audit in accordance with the standards of the Public Company Accounting Oversight Board (United States). Those standards require that we plan and perform the audit to obtain reasonable assurance about whether effective internal control over financial reporting was maintained in all material respects. Our audit included obtaining an understanding of internal control over financial reporting, assessing the risk that a material weakness exists, testing and evaluating the design and operating effectiveness of internal control based on the assessed risk, and performing such other procedures as we considered necessary in the circumstances. We believe that our audit provides a reasonable basis for our opinion.
A company’s internal control over financial reporting is a process designed to provide reasonable assurance regarding the reliability of financial reporting and the preparation of financial statements for external purposes in accordance with generally accepted accounting principles. A company’s internal control over financial reporting includes those policies and procedures that (1) pertain to the maintenance of records that, in reasonable detail, accurately and fairly reflect the transactions and dispositions of the assets of the company; (2) provide reasonable assurance that transactions are recorded as necessary to permit preparation of financial statements in accordance with generally accepted accounting principles, and that receipts and expenditures of the company are being made only in accordance with authorizations of management and directors of the company; and (3) provide reasonable assurance regarding prevention or timely detection of unauthorized acquisition, use, or disposition of the company’s assets that could have a material effect on the financial statements.
Because of its inherent limitations, internal control over financial reporting may not prevent or detect misstatements. Also, projections of any evaluation of effectiveness to future periods are subject to the risk that controls may become inadequate because of changes in conditions, or that the degree of compliance with the policies or procedures may deteriorate.
In our opinion, The Williams Companies, Inc. maintained, in all material respects, effective internal control over financial reporting as of December 31, 2015, based on the COSO criteria.
We also have audited, in accordance with the standards of the Public Company Accounting Oversight Board (United States), the consolidated balance sheet of The Williams Companies, Inc. as of December 31, 2015 and 2014, and the related consolidated statements of operations, comprehensive income (loss), changes in equity and cash flows for each of the three years in the period ended December 31, 2015 and our report dated February 26, 2016 expressed an unqualified opinion thereon.
/s/ Ernst & Young LLP
Tulsa, Oklahoma
February 26, 2016
164
Item 9B.
Other Information
None.
Item 10.
Directors, Executive Officers and Corporate Governance
Directors
The names and ages of the members of the Board of Directors of the Company, and information regarding their experience, directorships and qualifications are set forth below.
Alan S. Armstrong
, 53, became one of our directors and our Chief Executive Officer and President in 2011. From 2002 until January 2011, he was Senior Vice President-Midstream and acted as President of our midstream business. From 1999 to 2002, Mr. Armstrong was Vice President, Gathering and Processing for Midstream. From 1998 to 1999 he was Vice President, Commercial Development for our midstream business. Since the ACMP Merger, Mr. Armstrong has served as Chairman of the Board and Chief Executive Officer of the general partner of Williams Partners. Prior to the ACMP Merger, Mr. Armstrong served the general partner of ACMP as a director (since 2012) and its Chief Executive Officer (since December 31, 2014). Prior to the ACMP Merger, Mr. Armstrong served the general partner of Pre-merger WPZ as Chairman of the Board and Chief Executive Officer (2011 until the ACMP Merger), director (2005 until the ACMP Merger), Senior Vice President - Midstream (2010-2011), and Chief Operating Officer (2005-2010). Mr. Armstrong has served as a director of BOK Financial Corporation since 2013. Mr. Armstrong also serves on the National Petroleum Council and as a director for the American Petroleum Institute. Mr. Armstrong serves as 2015 Chair of the Tulsa Regional Chamber’s Board of Directors. He is the past Chairman and a current board member of the University of Oklahoma College of Engineering Board of Visitors.
As our current Chief Executive Officer and as acquired during his roles of increasing responsibilities in our midstream business, Mr. Armstrong’s qualifications include industry, engineering and construction, financial and accounting, corporate governance, securities and capital markets, executive leadership, strategy development and risk management, and operating experiences and marketplace knowledge.
Joseph R. Cleveland
, 71, has served as a director of the Company since 2008. Mr. Cleveland was the Chief Information Officer of Lockheed Martin Corporation (an advanced technology company) from 2001 to 2008. Mr. Cleveland was responsible for Lockheed Martin’s information technology vision, consolidating its resources, implementing e-commerce initiatives, leveraging economies of scale, and supporting its businesses. He was also President of Lockheed Martin Enterprise Information Systems from 1995 to 2008. From 2001 to 2008, Mr. Cleveland served as a director of Exostar (a joint venture formed to support the supply chain and security requirements of the aerospace and defense industry). Prior to the merger of Lockheed and Martin Marietta in 1995, Mr. Cleveland was Vice President and General Manager of Martin Marietta Internal Information Systems. From 1982 to 1986, Mr. Cleveland held an international assignment as Managing Director of GE Medical Systems Operations in Radlett, England. Mr. Cleveland began his career in 1970 as a member of General Electric Medical Systems’ engineering department. Mr. Cleveland is a member of the board of Aerospace Industries Association, the Florida High Tech Corridor Committee, the Metro Orlando Economic Development Commission, and the Dr. Phillips Center for the Performing Arts among other civic and charitable organizations.
As the former Chief Information Officer of Lockheed Martin Corporation, a former Vice President of Martin Marietta, and due to his multiple executive operating positions with G.E., Mr. Cleveland’s qualifications include financial and accounting, executive leadership, strategy development and risk management, operating, and information technology experiences and marketplace knowledge.
Kathleen B. Cooper
, 71, has served as a director of the Company since 2006. Dr. Cooper is Senior Fellow of the Tower Center for Political Studies at Southern Methodist University (since 2007) and President of Cooper Strategies International, LLC (since 2012). From 2005 to 2007, she was the Dean of the College of Business Administration at the University of North Texas. From 2001 to 2005, she was the Under Secretary for Economic Affairs at the U.S.
165
Department of Commerce. Dr. Cooper worked at Exxon Mobil Corporation (an international oil and gas company) from 1990 to 2001, serving as Chief Economist the entire time and adding the position of Manager, Economics & Energy Division, Corporate Planning in 1999. Dr. Cooper also served as Executive Vice President and Chief Economist for Security Pacific Bank from 1981 to 1990 and Chief Economist of United Banks of Colorado from 1971 to 1981. Dr. Cooper is currently a director of Deutsche Bank Trust Corporation and Deutsche Bank Trust Company of the Americas, subsidiaries of Deutsche Bank AG (a financial service provider) and the immediate former chair of the National Bureau of Economic Research. She was a founding director of Texas Security Bank from 2008 to 2010. Dr. Cooper is a member of the National Association of Corporate Director’s Advisory Council on Risk Oversight and has participated in numerous professional and community service organizations, including Harvard University’s Higher Education Leadership Forum, the Oxford Energy Forum, and the International Women’s Forum.
As Senior Fellow of the Tower Center for Political Studies at Southern Methodist University, former Under Secretary for Economic Affairs at the U.S. Department of Commerce, and former executive of a Fortune 500 energy company, Dr. Cooper’s qualifications include industry, financial and accounting, executive leadership, and public policy and government experiences and marketplace knowledge.
John A. Hagg
, 68, has served as a director of the Company since 2012. Since 2006, Mr. Hagg has been a director of Strad Energy Services Ltd. (a drilling services company operating in the United States and Canada), serving as chair of its corporate governance committee and, until 2012, as the Chairman of its Board. Mr. Hagg served as Chairman of Clark Builders (a Canadian subsidiary of Turner Construction Company) from 2007 until 2015, and has been a director for The Fraser Institute (a Canadian economic research and educational organization) since 1999. Mr. Hagg also served as a director of TMX Group, Inc. and the parent company of The Toronto Stock Exchange, The Montreal Exchange, TSX Venture Exchange, and NGX Gas Marketing Inc.) from 2001 to 2012. Mr. Hagg served Northstar Energy Corporation (an oil and gas production company) as its Chief Executive Officer from 1985 to 1999 and its Chairman from 1985 to 2001. In 1977, Mr. Hagg co-founded Canadian Northstar Corporation (the former controlling shareholder of Northstar Energy Corporation, a subsidiary of Devon Energy Corporation since 1998). During his 38 years as a senior executive in the petroleum industry, Mr. Hagg also formerly served as a director of several other companies in Canada and the United States, including S&T Drilling Ltd. (an oil well drilling contractor), Devon Energy Corporation (an independent oil and natural gas exploration and production company), Berry Petroleum Company (an independent oil and natural gas exploration and production company) and Tristone Capital, Inc., an international banking firm in the energy industry.
With 38 years of experience as a senior executive in the exploration, production, service, and financial sectors of the petroleum industry in Canada and the United States, Mr. Hagg’s qualifications include industry, engineering and construction, financial and accounting, corporate governance, securities and capital markets, executive leadership, public policy and government, strategy development and risk management, operating, and human resource management experiences and marketplace knowledge.
Juanita H. Hinshaw
, 71, has served as a director of the Company since 2004. Ms. Hinshaw is President and Chief Executive Officer of H&H Advisors (a financial consulting firm she founded in 2005). From 2000 to 2005 she was Senior Vice President and Chief Financial Officer of Graybar Electric Company (a distributor of electrical and communications products and provider of related supply chain management and logistics services), where she was responsible for the treasury, tax, auditing, and accounting areas. Ms. Hinshaw was a director of Graybar from 2000 to 2005. Prior to joining Graybar, she was with Monsanto Company (an agricultural company that then owned oil and petrochemical businesses) for fifteen years, retiring as Monsanto’s Vice President and Treasurer in 1999. Ms. Hinshaw was a director of IPSCO (a supplier of steel products, tubular products, and coil processing services and products) from 2001 until the company was sold in 2007. Ms. Hinshaw is a director of Aegion Corporation, the parent holding company of Insituform Technologies Inc. (a provider of technologies and services for the rehabilitation of pipeline systems), which Ms. Hinshaw has served as a director since 2000. Ms. Hinshaw is also a director of Synergetics USA, Inc. (which designs, manufactures, and markets instruments used for eye and neurosurgery).
As the President and Chief Executive Officer of a consulting firm, the former Senior Vice President and Chief Financial Officer of Graybar Electric Company, and the former Vice President and Treasurer of Monsanto Company, Ms. Hinshaw’s qualifications include industry, financial and accounting, executive leadership, securities and capital markets, operating, and information technology experiences.
166
Ralph Izzo
, 58, has served as a director of the Company since 2013. Mr. Izzo has served as Chairman of the Board, President, and Chief Executive Officer of Public Services Enterprise Group Incorporated (“PSEG”) (an integrated generation and energy delivery company) since 2007. He was named PSEG’s President, Chief Operating Officer, and a member of its board in 2006. Previously, he was President and Chief Operating Officer of Public Service Electric and Gas Company (“PSE&G”). Mr. Izzo joined PSE&G in 1992, holding roles of increasing responsibilities related to utility operations, appliance services, corporate planning, and electric ventures. Mr. Izzo also serves as a director of PSE&G, PSEG Power LLC, PSEG Energy Holdings L.L.C., and PSEG Services Corporation, which are subsidiaries of PSEG. Mr. Izzo began his career as a research scientist at the Princeton Plasma Physic Laboratory, performing numerical simulation of fusion energy experiments. Mr. Izzo serves as nominating committee chair of the New Jersey Chamber of Commerce and serves on the boards of the New Jersey Utilities Association, the Edison Electric Institute, and the Nuclear Energy Institute. He is also a member of the Board of Trustees of Peddie School, Columbia University School of Engineering Board of Visitors, The Princeton University Andlinger Center for Energy & the Environment Advisory Council, as well as a member of the Visiting Committee for the Department of Nuclear Engineering at MIT. Mr. Izzo is a former Chair of the Rutgers University Board of Governors and the New Jersey Chamber of Commerce.
As the Chairman of the Board, President, and Chief Executive Officer of PSEG, Mr. Izzo’s qualifications include industry, engineering and construction, financial and accounting, corporate governance, securities and capital markets, executive leadership, public policy and government, strategy development and risk management, operating, and human resource management experiences and marketplace knowledge.
Frank T. MacInnis
, 69, has served as a director of the Company since 1998 and was named Chairman of our Board in 2011. He served as a member of the board of directors of EMCOR Group, Inc. (an electrical and mechanical construction company and energy infrastructure service provider), from 1999 to 2015 and served as Chairman of the Board of EMCOR from 1994 to 2013 and as Chief Executive Officer from 1994 to 2010, managing the reorganization and emergence from bankruptcy of its predecessor. Mr. MacInnis also is Chairman of the Board of ComNet Communications, LLC (a provider of turnkey voice, data, and video infrastructure support). He is a director and non-executive Chairman of the Board of ITT Corporation (a high-technology engineering and manufacturing company). Mr. MacInnis has served as a director of Gilbane, Inc. (a real estate development and construction firm) since 2012. From 1981 to 1984, Mr. MacInnis served as Chairman and Chief Executive Officer of H.C. Price Construction (a builder of large diameter oil and gas pipelines). He has managed construction and operations all over the world, including in Tehran, Baghdad, Bangkok, the United Arab Emirates, London, the United States, and Canada. Mr. MacInnis has a law degree, having graduated from the University of Alberta Law School in 1971.
As the Chairman of our Board and ITT Corporation, the former Chairman of the Board and Chief Executive Officer of EMCOR Group, Inc., and the current Chairman of the Board and Chief Executive Officer of ComNet Communications, LLC, Mr. MacInnis’ qualifications include industry, engineering and construction, financial and accounting, corporate governance, executive leadership, legal, strategy development and risk management, operating, and human resource management experiences and marketplace knowledge.
Eric W. Mandelblatt
, 39, has served as a director of the Company since 2014. Since 2010, Mr. Mandelblatt has been the Managing Partner and Chief Investment Officer of Soroban Capital Partners LLC (a New York-based investment firm). Mr. Mandelblatt was previously one of the Partners and Portfolio Managers of TPG-Axon Capital (a global investment firm) and, prior to that, he held a number of positions within the Equities Division at Goldman Sachs & Co. Mr. Mandelblatt currently serves as a board member of the Harlem Children’s Zone, the University of Florida Investment Corporation and the Ronald McDonald House New York City.
As the Managing Partner and Chief Investment Officer of an investment firm and as acquired throughout his prior roles within the investment management industry, Mr. Mandelblatt’s qualifications include financial and accounting, securities and capital markets, executive leadership, and strategy development and risk management experiences and marketplace knowledge.
Keith A. Meister
, 42, has served as a director of the Company since 2014. Mr. Meister has been the Managing Partner of Corvex Management LP (a New York based investment firm) since 2011. From 2003 to August 2010, Mr. Meister served as Chief Executive Officer and then Principal Executive Officer and Vice Chairman of the Board of Icahn Enterprises G.P. Inc., the general partner of Icahn Enterprises L.P. (a diversified holding company). Mr. Meister
167
serves on the board of directors of Yum! Brands, Inc. He previously served on the board of directors of several public companies, including The ADT Corporation (a provider of electronic security, interactive home and business automation and alarm monitoring services), Ralcorp Holdings, Inc. (a food manufacturer), and Motorola Mobility and Motorola, Inc. (a manufacturer of telecommunications equipment).
As the Managing Partner of an investment firm and as acquired throughout his prior roles within the investment management industry and his extensive board service, Mr. Meister’s qualifications include financial and accounting, securities and capital markets, executive leadership, and strategy development and risk management experiences and marketplace knowledge.
Steven W. Nance
, 59, has served as a director of the Company since 2012. Mr. Nance is president and manager of Steele Creek Energy, LLC (a private company with investments primarily in oil and natural gas). He has also served as a director of Cloud Peak Energy, Inc. since 2010 (a coal producing company specializing in the production of low sulfur, subbituminous coal), chairing its health, safety, environment and communities committee and serving as a member of its compensation committee. In addition, Mr. Nance has also served as a director for Newfield Exploration Company since 2013 where he has served as lead director since May 2015, chairs its nominating & corporate governance committee and serves on the compensation and management development committee and the operations and reserves committee. Mr. Nance has more than 35 years of experience in the oil and gas industry, 12 of which he spent performing roles of increasing responsibility for Burlington Resources Inc. and its affiliates (an independent natural gas exploration and production company), departing as its Vice President, Gulf Coast Division, in 1997. From 1997 to 1999, Mr. Nance served XPLOR Energy and its predecessor company (a Gulf Coast-based exploration and production company), acting as its Chairman, President and Chief Executive Officer in 1999 when XPLOR Energy was acquired by Harken Energy Corporation. From 2000 to 2007, Mr. Nance served as President of Peoples Energy Production Company (an oil and gas production company) until it was acquired by a subsidiary of the El Paso Corporation. Mr. Nance serves on the board for The Center for the Performing Arts at the Woodlands.
With his experience in the oil and gas industry, including leadership of XPLOR Energy, Peoples Energy Production Company, and Steele Creek Energy, Mr. Nance’s qualifications include industry, financial and accounting, executive leadership, strategy development and risk management, operating, and human resource management experiences.
Murray D. Smith
, 66, has served as a director of the Company since 2012. Mr. Smith is president of Murray D. Smith and Associates (a consulting firm which provides strategic advice to the North American energy sector). From 1993 to 2004, Mr. Smith was an elected member of the Legislative Assembly of Alberta, Canada, serving in four different Cabinet portfolios. He served as Minister of Energy for Alberta, Canada from 2001 to 2004, where he achieved international recognition of Alberta’s oil sands reserves, oversaw the transformation of its electricity sector to a competitive wholesale generation market, and initiated the largest industrial tax reduction in the Province’s history. Mr. Smith was appointed Representative of the Province of Alberta to the United States of America in Washington, DC, from 2005 to 2007. Prior to serving in elected office, Mr. Smith was an independent businessman, owning a number of Alberta-based energy services companies. He is also a director of Surge Energy Inc. (a public oil- focused oil and gas company with operations throughout Alberta and Saskatchewan) and NSolv Corporation (the owner of proprietary technology for water-free oil sands in-situ extraction).
As a former member of the Legislative Assembly of Alberta, Canada and diplomat and now an energy consultant, Mr. Smith’s qualifications include industry, engineering and construction, corporate governance, securities and capital markets, executive leadership, and public policy and government experiences and marketplace knowledge.
Janice D. Stoney
, 75, has served as a director of the Company since 1999. Ms. Stoney served as Executive Vice President of US West Communications Group, Inc. from 1991 until retiring in 1993 after a 33-year career. Previously she served as the President, Consumer Division, of US West (the Denver-based parent company of Northwestern Bell Telephone Company, Mountain States Telephone & Telegraph Company, and Pacific Northwest Bell Telephone Company) from 1989 to 1991. Beginning in 1980, Ms. Stoney held officer positions at Northwestern Bell, including Chief Operating Officer and President and Chief Executive Officer. Ms. Stoney was the 1994 Nebraska Republican nominee for the U.S. Senate. Through 22 years as a director in manufacturing, consumer products, retailing, and investment funds industries, Ms. Stoney has board experience with director searches, CEO and management succession, management development, executive compensation, and strategic planning. She has chaired compensation and audit
168
committees for other entities. Ms. Stoney was a director of Whirlpool Corporation (a manufacturer of home appliances) from 1987 to 2011 and has served on the Federal Reserve Bank, Tenth District, Omaha Branch and the Omaha Community Foundation.
As a former Executive Vice President of US West Communications Group, Inc., Chief Executive Officer of Northwestern Bell, and through her engagement in the political process, Ms. Stoney’s qualifications include corporate governance, executive leadership, public policy and government, strategy development and risk management, operating, and human resource management experiences.
Laura A. Sugg
, 54, has served as a director of the Company since 2010. Ms. Sugg retired from ConocoPhillips in 2010 (then an international, integrated oil company), having served as President, Australasia Division, a position responsible for the profit & loss and growth responsibility of ConocoPhillip’s operations in Australia and East Timor. Ms. Sugg began her career in 1983 at Sohio Petroleum and joined Phillips Petroleum, now ConocoPhillips, in 1986 and performed various business development, human resources and operations roles. From 2003 to 2005, Ms. Sugg was ConocoPhillip’s General Manager E&P Human Resources, with responsibility for global compensation and benefits, leadership succession planning, and all human resource functions for 10,000 worldwide employees in 16 countries. From 2002 to 2003, Ms. Sugg was a ConocoPhillip’s midstream executive responsible for profit & loss, health, safety and environment, and operations for its gas gathering, processing, and fractionation business in the U.S., Canada, and Trinidad. From 2000 to 2002, Ms. Sugg was Vice President Worldwide Gas for Phillips with responsibility for its global liquefied natural gas and coal bed methane business development and the profit and loss for its North American gas marketing operations. In 2012, Ms. Sugg joined the board of Denbury Resources, Inc. (an independent oil and gas company) where she serves as the chair of the compensation committee. In February 2015, Ms. Sugg joined the board of Murphy Oil Corporation (an independent oil and gas company). Prior to the ACMP Merger, Ms. Sugg served as a director and audit committee member of the general partner of Pre-merger WPZ from December 2011 to May 2012 and from January 2014 until the ACMP Merger in February 2015. Ms. Sugg was a director of Mariner Energy, Inc. (an independent oil and gas exploration and production company) from 2009 until its merger with Apache Corporation in 2010.
As the former President - Australasia Division, General Manager E&P Human Resources, and a midstream executive, each with ConocoPhillips, Ms. Sugg’s qualifications include industry, engineering and construction, financial and accounting, corporate governance, executive leadership, strategy development and risk management, operating, and human resource management experiences.
Information regarding the Company’s executive officers is set forth after Item 4 of Part I of this Annual Report on Form 10-K.
Arrangements for Selection
Corvex Management LP (“Corvex”), Mr. Meister, Soroban Master Fund LP (“Soroban”), Soroban Capital Partners LP, Soroban Capital GP LLC, and Mr. Mandelblatt (collectively, the “Investor Group”) collectively report beneficial ownership of over five percent of our shares and sought Board representation. In February 2014, we entered into an agreement with the Investor Group pursuant to which Messrs. Mandelblatt and Meister were appointed to our Board. Under the terms of the agreement, the Board also nominated Messrs. Mandelblatt and Meister to stand for election at our 2015 annual meeting. Corvex and Soroban agreed to vote their shares in support of all of the Board’s director nominees at that meeting. The agreement provides terms under which Messrs. Mandelblatt and Meister will offer to resign from our Board, including if Corvex and Soroban do not meet minimum share ownership requirements. See Item 12.
Security Ownership of Certain Beneficial Owners and Management and Related Stockholder Matters
for information about the shares reported as beneficially held by the Investor Group and our Current Report on Form 8-K filed with the SEC on February 25, 2014, for more information about our agreement with the Investor Group, including a copy of the agreement.
Section 16(a) Beneficial Ownership Reporting Compliance
Section 16(a) of the Exchange Act requires the Company’s directors and certain of its officers to file reports of their ownership of Williams common stock and of changes in such ownership with the SEC and the NYSE. Regulations also require Williams to identify in this annual report any person subject to this requirement who failed to file any such
169
report on a timely basis. Based solely on a review of the copies of such reports furnished to the Company and written representations from certain reporting persons, we believe that all of our officers, directors, and greater than 10 percent stockholders complied with all Section 16(a) filing requirements applicable to them during the fiscal year ended December 31, 2015.
Corporate Governance
General
Our Board believes that strong corporate governance is critical to achieving our performance goals and to maintaining the trust and confidence of investors, employees, customers, business partners, regulatory agencies, and other stakeholders.
Corporate Governance Guidelines
Our Corporate Governance Guidelines provide a framework for the governance of Williams as a whole and also address the operation, structure, and practice of the Board and its committees. The Nominating and Governance Committee reviews these guidelines at least annually.
Code of Ethics
We have adopted a code of ethics specific to the CEO, Chief Financial Officer, and Chief Accounting Officer, which was filed with the SEC as Exhibit 14 to our annual report on Form 10-K for the year ended December 31, 2003. In addition, we have adopted a code of business conduct that is applicable to all employees and directors.
How to Obtain Copies of our Governance-Related Materials
The following documents are available through the Investors page of our website.
|
•
|
Corporate Governance Guidelines;
|
|
•
|
Code of Ethics for Senior Officers;
|
|
•
|
Williams Code of Business Conduct;
|
|
•
|
Charters for the Audit Committee, the Compensation Committee, the Finance Committee, and the Nominating and Governance Committee.
|
If you want to receive these documents in print, please send a written request to our Corporate Secretary at The Williams Companies, Inc., One Williams Center, MD 49, Tulsa, Oklahoma 74172.
Transfer Agent and Registrar
Computershare Trust Company, N.A. serves as registrar and transfer agent for our common units. Contact information for Computershare is as follows:
Computershare Trust Company, N.A.
P.O. Box 30170
College Station, Texas 77842-3170
Phone: (781) 575-2879 or toll-free, (877) 498-8861
Hearing impaired: (800) 952-9245
Internet: www.computershare.com/investor
170
Send overnight mail to:
Computershare Trust Company, N.A.
211 Quality Circle, Suite 210
College Station, Texas 77845
Board and Committee Structure and Meetings
Board Meetings
Board members actively participate in Board and committee meetings. Generally, materials are distributed one week in advance of each regular Board meeting so that members can be prepared for the discussion.
The full Board met 43 times in 2015. Each director attended at least 75 percent of the aggregate of the Board and applicable committee meetings held in 2015.
Board Committees
The Board has four standing committees - Audit, Compensation, Finance, and Nominating and Governance. Each standing committee has a charter adopted by the Board. The standing committees report to the full Board at each regular Board meeting. The Board elects each committee’s members and chair annually. The Board also has a Special Safety Committee. Each committee has authority to retain, approve fees for, and terminate advisors as it deems necessary to assist in the fulfillment of its responsibilities.
Audit Committee.
The Board has a separately designated standing Audit Committee established in accordance with Section 3(a)(58)(A) of the Exchange Act. The members of the Audit Committee are Kathleen B. Cooper (Chair), Juanita H. Hinshaw, Ralph Izzo, and Keith A. Meister. The Committee met nine times in 2015.
Responsibilities.
The Audit Committee:
|
•
|
Appoints, evaluates, and approves the compensation of our independent registered public accounting firm;
|
|
•
|
Assists the Board in fulfilling its responsibilities for generally overseeing Williams’ financial reporting processes and the audit of Williams’ financial statements, including the integrity of Williams’ financial statements, Williams’ compliance with legal and regulatory requirements, and risk assessment and risk management;
|
|
•
|
Reviews the qualifications and independence of the independent registered public accounting firm;
|
|
•
|
Reviews the performance of Williams’ internal audit function and the independent registered public accounting firm;
|
|
•
|
Reviews Williams’ earnings releases;
|
|
•
|
Reviews transactions between Williams and related persons that are required to be disclosed in our filings with the SEC;
|
|
•
|
Oversees investigations into complaints concerning financial matters;
|
|
•
|
Reviews with the General Counsel, as needed, any actual and alleged violations of the Company’s Code of Business Conduct;
|
|
•
|
Annually reviews its charter and performance;
|
|
•
|
Prepares the Audit Committee report for inclusion in the annual proxy statement.
|
171
Independence Requirements.
The Board has determined that all members of the Audit Committee meet the heightened independence requirements under the NYSE’s rules for persons serving on audit committees.
Financial Literacy Experts.
In addition, the Board has determined that all members of the Audit Committee are “financially literate” as defined by the NYSE rules and qualify as audit committee financial experts as defined by the rules of the SEC.
No Audit Committee member serves on more than three public company audit committees.
Finance Committee
. The members of the Finance Committee are Juanita H. Hinshaw (Chair), Kathleen B. Cooper, John A. Hagg, Ralph Izzo, Eric W. Mandelblatt and Murry D. Smith. The Committee met twice during 2015.
Responsibilities.
The Finance Committee:
|
•
|
Reviews and approves and/or recommends to the Board Williams’ capital spending in accordance with the Board’s delegation of authority;
|
|
•
|
Supports the Board’s oversight of Williams’ financial strategies, plans, and policies;
|
|
•
|
Reviews risks relating to capital, including capital allocation, investment evaluation, and project execution;
|
|
•
|
Reviews and approves any amendments to Williams’ financing agreements;
|
|
•
|
At least annually, reviews and approves Williams’ decision to enter into swaps that are exempt from exchange execution and clearing under the “end-user exception” regulations established by the Commodity Futures Trading Commission and Williams’ policies governing the use of swaps subject to the end-user exception;
|
|
•
|
Reviews annually its charter and performance.
|
Compensation Committee
. The members of the Compensation Committee are Janice D. Stoney (Chair), Joseph R. Cleveland, Frank T. MacInnis, Keith A. Meister, Steven W. Nance and Laura A. Sugg. The Committee met five times during 2015.
Responsibilities.
The Compensation Committee:
|
•
|
Approves executive compensation philosophy, policies, and programs that align the interests of our executive officers with those of our stockholders;
|
|
•
|
Oversees the material risks associated with compensation structure, policies, and programs;
|
|
•
|
Assesses the results of the advisory votes on executive compensation;
|
|
•
|
Recommends to the Board equity-based compensation plans;
|
|
•
|
Recommends to the Board cash-based incentive compensation plans for the NEOs and other executives;
|
|
•
|
Sets corporate goals and objectives for compensation for the NEOs and other executives;
|
|
•
|
Evaluates the NEOs’ and certain other executives’ performance in light of those goals and objectives;
|
|
•
|
Approves the NEOs’ and certain other executives’ compensation, including salary, incentive compensation, equity-based compensation, and any other remuneration;
|
|
•
|
Approves, amends, modifies, or terminates, in its settlor (non-fiduciary) capacity, the terms of any benefit plan that do not require stockholder approval;
|
172
|
•
|
Reviews and discusses with management and, based on the review and discussions, recommends to the Board the Compensation Discussion and Analysis required by the SEC for inclusion in the annual proxy statement and annual report on Form 10-K;
|
|
•
|
Reviews annually and recommends to the Board the appropriate compensation of non-employee directors;
|
|
•
|
Develops, reviews, recommends for Board approval, and then monitors the directors’ and executive officers’ compliance with, Williams’ stock ownership policy;
|
|
•
|
Reviews and recommends the terms of Williams’ change in control program;
|
|
•
|
Assesses any potential conflicts of interest raised by the compensation consultants retained by management or the Committee and assesses the independence of any Compensation Committee advisor;
|
|
•
|
Reviews annually its charter and performance.
|
Independence Requirements.
The Board has determined that all members of the Compensation Committee meet the heightened independence requirements under the NYSE’s rules for persons serving on compensation committees.
Independent Executive Compensation Advisor.
The Compensation Committee has selected and retained Frederic W. Cook & Co., an independent executive compensation consulting firm, to provide competitive market data and advice related to the CEO’s compensation level and incentive design; review and evaluate management-developed market data and recommendations on compensation levels, incentive mix, and incentive design for NEOs and certain other executives (excluding the CEO); develop the selection criteria and recommend comparator companies for executive compensation and performance comparisons; provide information on executive compensation trends and their implications to Williams; and provide competitive market data and advice on non-employee director compensation.
The Compensation Committee evaluates the independence of Frederic W. Cook & Co., including consideration of the factors specified in Rule 10C-1 under the Exchange Act and the NYSE’s rules to ensure that the advisors maintain objectivity and independence when rendering advice to the Committee. Frederic W. Cook & Co. does not provide any additional services to Williams. The compensation consultant reports to the Compensation Committee and is independent of management. The Compensation Committee has determined that the services Frederic W. Cook & Co. provides to the Committee are not subject to a conflict of interest.
Nominating and Governance Committee.
The members of the Nominating and Governance Committee are Frank T. MacInnis (Chair), Joseph R. Cleveland, Eric W. Mandelblatt and Janice D. Stoney. The Committee met three times during 2015.
Responsibilities.
The Nominating and Governance Committee:
|
•
|
Develops and recommends to the Board director qualifications;
|
|
•
|
Identifies and recommends to the Board director candidates;
|
|
•
|
Reviews candidates recommended or nominated by stockholders;
|
|
•
|
Recommends to the Board the individual, or individuals, to be the Chairman of the Board and the CEO;
|
|
•
|
Reviews the CEO’s recommendations for individuals to be officers;
|
|
•
|
Reviews annually succession plans for the positions of CEO and certain other executives;
|
|
•
|
Monitors significant developments in the regulation and practice of corporate governance;
|
|
•
|
Reviews the size and composition of the Board and its committees and recommends to the Board any changes;
|
173
|
•
|
Determines if a Lead Director shall be designated, and if so determined, recommends a director to serve as Lead Director;
|
|
•
|
Conducts a preliminary review of director independence and the financial literacy and expertise of the Audit Committee members;
|
|
•
|
Recommends assignments to the Board committees;
|
|
•
|
Oversees and assists the Board in the review of the Board’s performance and reviews its own performance;
|
|
•
|
Annually reviews each standing committee’s charter, the Corporate Governance Guidelines, and the Williams Code of Business Conduct;
|
|
•
|
Oversees and reviews risks relating to Williams’ ethics and compliance programs and annually reviews Williams’ policies and procedures regarding compliance with the Code of Business Conduct and the results of the Code of Business Conduct and Ethics survey;
|
|
•
|
Reviews, on an annual basis, the implementation and effectiveness of the Company’s ethics and compliance program with the General Counsel, and, as applicable, considers any actual and alleged violations of the codes of conduct, including any matters involving criminal or potential criminal conduct communicated by the General Counsel to the committee;
|
|
•
|
Reviews stockholder proposals and recommends responses to the Board;
|
|
•
|
Reviews our directors’ current service and requests to serve on boards of other companies;
|
|
•
|
Reviews annually the performance of individual directors.
|
Safety Committee
. In addition to its standing committees, in 2014 the Board formed a Special Safety Committee to review and evaluate safety matters and make recommendations to the Board with respect to safety matters. The members of the Safety Committee are Steven W. Nance (Chair), John A. Hagg, Murray D. Smith, and Laura A. Sugg. The Committee met four times in 2015.
Other.
On June 20, 2015, the Board formed a Strategic Review Administration Committee which oversaw the administration of the strategic review process conducted by the Board during 2015. The members of this Committee were Laura A. Sugg (Chair), Steven W. Nance, and Janice D. Stoney. The Committee met 34 times in 2015.
Stockholder Nominations
The Nominating and Governance Committee will consider written recommendations from stockholders for director nominations. To nominate a candidate, a stockholder should forward the candidate’s name and a detailed description of the candidate’s qualifications, a document indicating the candidate’s willingness to serve, and evidence of ownership of Williams’ stock to: The Williams Companies, Inc., One Williams Center, MD 47, Tulsa, Oklahoma 74172, Attn: Corporate Secretary. A stockholder wishing to nominate a director candidate for election at the annual meeting of stockholders must also comply with the notice and other requirements described in the Company’s Bylaws
.
Item 11.
Executive Compensation
Compensation Discussion & Analysis
The Compensation Discussion and Analysis (CD&A) provides a detailed description of the objectives and principles of Williams’ executive compensation programs. It explains how compensation decisions are linked to performance as compared to the Company’s strategic goals and stockholder interests. Generally, Williams’ executive compensation programs apply to all officers; however, this CD&A focuses on the NEOs for the Company for the 2015 fiscal year. The Named Executive Officers (NEOs) for the Company for the 2015 fiscal year are Mr. Armstrong, Mr. Chappel, Mr. Purgason, Mr. Seldenrust, and Mr. Miller.
174
We seek stockholder support on our executive compensation pay programs annually. In 2015, our stockholders supported our programs with 98.04 percent “for” votes. In considering this positive response, along with our analysis of the competitive market, we have not made any material changes to our overall executive compensation program.
Our Commitment to Pay for Performance
Pay for Performance
We design our compensation programs to support our commitment to performance. At target, 76 percent or more of an NEO’s compensation will vary based on our company performance.
The Summary Compensation Table provides required disclosures for the calendar years 2013, 2014, and 2015. The values provided for 2015 primarily reflect compensation program design decisions made in late 2014 and early 2015 which was before the significant downturn in the energy industry and the impact to Williams from the energy commodity price environment. These disclosures do not highlight how the recent industry downturn has impacted our Chief Executive Officer (CEO) and NEOs. We want to highlight how our CEO’s compensation has been impacted.
The largest component of compensation for our CEO and NEOs is long-term incentive compensation in the form of equity awards, specifically designed to align our executive team with the experience of our stockholders. The 2015 equity awards were granted on February 23, 2015, well before the changing environment impacted Williams. As required, the Summary Compensation Table disclosure related to these awards reflects the value of the awards on the date of the grant, not the current value. The following demonstrates the difference in grant date values disclosed and the actual values of WMB stock on December 31, 2015 and, more recently, on February 19, 2016 for our CEO:
|
Alan Armstrong - CEO
|
||||||||||||||||
|
Disclosed Grant Date Values Compared to Actual Values
|
||||||||||||||||
|
Grant Year
|
Disclosed Grant Date Value
|
December 31, 2015 Value
|
Decline from Grant Date Value
|
February 19, 2016 Value (1)
|
Decline from Grant Date Value
|
|||||||||||
|
2015
|
$
|
5,235,556
|
|
$
|
2,680,716
|
|
49%
|
$
|
1,617,817
|
|
69%
|
|||||
|
2014
|
8,242,083
|
|
4,273,139
|
|
48%
|
2,578,848
|
|
69%
|
||||||||
|
2013
|
4,073,615
|
|
3,182,765
|
|
22%
|
597,089
|
|
85%
|
||||||||
_________
|
(1)
|
The February 19, 2016 equity value includes the 2013 performance-based RSU result of just 3.53 percent of target.
|
If we expand this analysis to include all of our CEO’s outstanding WMB equity awards, not just the awards from 2013, 2014, and 2015, the impact is even greater as detailed in the table below:
|
Alan Armstrong - CEO
|
|||||||||||||||||
|
Disclosed Grant Date Values Compared to Actual Values
|
|||||||||||||||||
|
June 30, 2015 Value
|
December 31, 2015 Value
|
Decline in Value ($)
|
Decline %
|
February 19, 2016 Value (1)
|
Decline in Value ($)
|
Decline %
|
|||||||||||
|
Equity Value
|
$
|
47,760,063
|
|
$
|
12,934,436
|
|
$
|
34,825,627
|
|
73%
|
$
|
5,516,943
|
|
$
|
42,243,120
|
|
88%
|
_________
|
(1)
|
The February 19, 2016 equity value includes the 2013 performance-based RSU result of just 3.53 percent of target.
|
The decline in outstanding equity award value experienced by Mr. Armstrong well exceeds the total compensation disclosed for the calendar years 2013 through 2015 in the Summary Compensation Table.
The details provided above demonstrate how the design of our executive compensation program reflects our focus on pay for performance and aligns our CEO and NEOs with our stockholders.
175
Long-term Incentives
Our most significant differentiator in performance is within our equity awards. We use equity awards to align compensation with the long-term interests of our stockholders. Equity awards consist of performance-based restricted stock units (RSUs), time-based RSUs, and stock options. The largest component of an NEO’s long-term incentive award is performance-based RSUs. Both relative and absolute total stockholder return (TSR) are used to determine the actual number of units that will be distributed to an NEO upon vesting. We are unique among our comparator companies in measuring both relative and absolute TSR to determine results and ultimately the number of units that vest. Relative TSR gauges our TSR performance relative to our comparator companies while absolute TSR requires that we deliver a strong absolute TSR to our stockholders. In February 2015, the performance-based RSUs granted in 2012 for the performance period 2012 through 2014 exceeded our three-year annualized TSR targets by achieving a relative TSR performance in the second quartile of our comparator group and by achieving more than 24 percent for the annualized absolute TSR delivered to our stockholders. As a result of this strong performance, the performance pay-out for these awards was 169 percent. The 2013 performance based RSUs for the performance period 2013 through 2015 generated an award of just 3.5 percent of target and will distribute in early 2016. Additionally, we consider stock options to be performance-based compensation. Stock options only provide value to the extent that the Company’s stock price has increased above the grant price and therefore stockholders have benefited.
Annual Incentive Program
Our performance-based cash compensation is paid under our Annual Incentive Program (AIP) which is based on financial performance and individual performance. Under this program, cash compensation reflects annual business performance and is based on weighted measures of distributable cash flow, controllable costs, fee-based revenue, and three safety metrics.
Business Highlights, Projects, and Milestones
Reference item 7. Management’s Discussion and Analysis of Financial Condition and Results of Operations for details regarding 2015 business highlights and projects and milestones.
Compensation Summary
Objective of Our Compensation Programs
The role of compensation is to attract and retain the talent needed to increase stockholder value and to help our businesses meet or exceed financial and operational performance goals. Our compensation programs’ objective is to reward our NEOs and employees for successfully implementing our strategy to grow our business and create long-term stockholder value. To that end, in 2015 we used relative and absolute TSR to measure long term performance; and we used distributable cash flow, controllable costs, fee-based revenue, and safety metrics to measure annual performance. We believe using separate long-term and annual metrics to incent and pay NEOs helped ensure that the business decisions made were aligned with the long-term interests of our stockholders.
Our Pay Philosophy
Our pay philosophy throughout the entire organization is to pay for performance, be competitive in the marketplace, and consider the value a job provides to the Company. Our compensation programs reward NEOs not just for accomplishing goals, but also for how those goals are pursued. We strive to reward the right results and the right behaviors while fostering a culture of collaboration, execution, improvement, teamwork, and safety.
The principles of our pay philosophy influence the design and administration of our pay programs. Decisions about how we pay NEOs are based on these principles. The Compensation Committee (Committee) uses several types of pay that are linked to both our long-term and short-term performance in the executive compensation programs. Included are long-term incentives, annual cash incentives, base pay, and benefits. The chart below illustrates the linkage between the types of pay we use and our pay principles.
176
|
Pay Principles
|
Long-term Incentives
|
Annual Cash Incentives
|
Base Pay
|
Benefits
|
||||
|
Pay should reinforce business objectives and values.
|
•
|
•
|
•
|
|||||
|
A significant portion of an NEO’s total pay should be variable based on performance.
|
•
|
•
|
||||||
|
Incentive pay should balance long-term, intermediate, and short-term performance.
|
•
|
•
|
||||||
|
Incentives should align interest of NEOs with stockholders.
|
•
|
•
|
||||||
|
Pay should foster a culture of collaboration with shared focus and commitment to our Company.
|
•
|
•
|
||||||
|
Incentives should enforce the value of safety within our Company.
|
•
|
|||||||
|
Pay opportunities should be competitive.
|
•
|
•
|
•
|
•
|
||||
|
A portion of pay should be provided to compensate for the core activities required for performing in the role.
|
•
|
•
|
||||||
Our Commitment to Pay for Performance
|
Role of Board of Directors
|
Role of Compensation Committee
|
Role of CEO
|
Role of Independent Consultant
|
Role of Management
|
||||
|
Review CEO performance
|
Seek input from independent consultant
|
Review NEO performance
|
Assists Committee in discussions and decisions regarding NEO compensation
|
Provide CEO with data from comparator group proxies
|
||||
|
Approve Board of Director Pay
|
Engage independent consultant on comparator groups, Board of Director and CEO pay
|
Review competitive market information
|
Provides competitive market data for CEO
|
Provide CEO with pay information from various compensation surveys
|
||||
|
Determine CEO and NEO pay
|
Recommend NEO pay, including base pay adjustments, AIP, LTI and any other compensation
|
Develops comparator group, with input from Committee and Management
|
||||||
|
Recommend Board of Director pay
|
No role in setting compensation for his/her role
|
|||||||
2015 Comparator Group
Determining Our Comparator Group
Companies in our comparator group have a range of revenues, assets, market capitalization, and enterprise value. Business consolidation and unique operating models create some challenges in identifying comparator companies. Accordingly, we take a broad view of comparability to include organizations that are similar to Williams. This results in compensation that is appropriately scaled and reflects comparable complexities in business operations. We typically aim for a comparator group of 15 to 20 companies so our comparisons will be valid. The 2015 comparator group includes 19 companies which comprised a mix of both direct business competitors and companies with whom we compete for talent.
177
|
2015 Comparator Group
|
||
|
Stock Symbol
|
Company Name
|
|
|
CNP
|
CenterPoint Energy, Inc.
|
|
|
DVN
|
Devon Energy Corp.
|
|
|
D
|
Dominion Resources, Inc.
|
|
|
ENB
|
Enbridge Inc.
|
|
|
ETE
|
Energy Transfer Equity, L.P.
|
|
|
EPD
|
Enterprise Products Partners L.P.
|
|
|
EOG
|
EOG Resources, Inc.
|
|
|
KMI
|
Kinder Morgan, Inc.
|
|
|
MWE
|
MarkWest Energy Partners L.P.
|
|
|
NI
|
Nisource Inc.
|
|
|
OKE
|
ONEOK Inc.
|
|
|
PCG
|
PG&E Corp.
|
|
|
PXD
|
Pioneer Natural Resources Co.
|
|
|
PAA
|
Plains All American Pipeline
|
|
|
SRE
|
Sempra Energy
|
|
|
SO
|
Southern Co.
|
|
|
SE
|
Spectra Energy Corp.
|
|
|
TRGP
|
Targa Resources Corp.
|
|
|
TRP
|
Transcanada Corp.
|
|
How We Use Our Comparator Group
We refer to publicly available information to analyze our comparator companies’ practices including how pay is divided among long-term incentives, annual incentives, base pay, and other forms of compensation. This allows the Committee to ensure competitiveness and appropriateness of proposed compensation packages. When setting pay, the Committee uses market median information of our comparator group, as opposed to market averages, to ensure that the impact of any unusual events that may occur at one or two companies during any particular year is diminished from the analysis. If an event is particularly unusual and surrounded by unique circumstances, the data is completely removed from the assessment. Three of our comparator companies are not considered in our aggregate pay statistics due to significant pay practice differences, but are still considered in the analysis of company performance with regard to our performance-based equity awards.
The Committee determined not to makes any changes to the comparator group for 2016.
Our Pay Setting Process
During the first quarter of the year, the Committee completes a review to ensure we are paying competitively, equitably, and in a way that encourages and rewards performance.
The compensation data of our comparator group, disclosed primarily in proxy statements, is the primary market data we use when benchmarking the competitive pay of our NEOs. Aggregate market data obtained from recognized third-party executive compensation survey companies is used to supplement and validate comparator group market data.
Although the Committee reviews relevant data as it designs compensation packages, setting pay is not an exact science. Because market data alone does not reflect the strategic competitive value of various roles within our Company, internal pay equity is also considered when making pay decisions. Other considerations when making pay decisions
178
for the NEOs include individual experience, sustained performance, historical pay, realized and realizable pay over three years, and tally sheets that include annual pay and benefit amounts, wealth accumulated over the past five years, and the total aggregate value of the NEOs’ equity awards and holdings.
When setting pay, we determine a target pay mix (distribution of pay among long-term incentives, annual incentives, base pay, and other forms of compensation) for the NEOs. Consistent with our pay-for-performance philosophy, the actual amounts paid, excluding benefits, are determined based on Company and individual performance. Because performance is a factor, the target versus actual pay mix will vary, specifically as it relates to the annual cash incentives and long-term incentives.
Pay at Risk Shown as a Percentage of Target Pay Mix
|
Base pay
|
Annual cash incentives
|
LTI stock options
|
LTI time-based RSUs
|
LTI performance-based RSUs
|
Total LTI
|
Pay at Risk
|
Total Compensation at Target Pay
|
|
|
CEO
|
14%
|
17%
|
14%
|
17%
|
38%
|
69%
|
86%
|
100%
|
|
NEO Average (excluding CEO)
|
22%
|
16%
|
12%
|
22%
|
28%
|
62%
|
78%
|
100%
|
How We Determine the Amount for Each Type of Pay
Long-term incentives, annual cash incentives, base pay, and benefits accomplish different objectives. The table below illustrates a summary of the primary objectives associated with each component of pay listed in the order of most significant to the NEO’s total compensation. The table is followed by specific details regarding each pay component.
|
Type of Pay and Form
|
Performance Period (years)
|
Objectives
|
|
|
At Risk
|
Long-term incentive:
Performance-based RSU
|
3
|
Incents the accomplishment of long-term sustainable business goals
Aligns interests of executives to our stockholders
Promotes ownership in the Company
Provides attraction and retention
|
|
Long-term incentive:
Time-based RSU
|
3
|
||
|
Long-term incentive:
Stock option
|
Up to
10
|
||
|
Short-term incentive
Annual cash incentive
|
1
|
Incents the accomplishment of annual business goals
Aligns interests of executives to our stockholders
Provides attraction and retention
|
|
|
Fixed
|
Base pay (cash)
|
1
|
Compensates for carrying out the duties of the job
Recognizes individual experiences, skills and sustained performance
Provides attraction and retention
|
Long-Term Incentives
To determine the value for long-term incentives granted to an NEO each year, we consider the following factors:
•
The proportion of long-term incentives relative to base pay;
•
The NEO’s impact on Company performance and ability to create value;
•
Long-term business objectives;
•
Awards made to executives in similar positions within our comparator group of companies;
•
The market demand for the NEO’s particular skills and experience;
179
•
The amount granted to other NEOs in comparable positions at the Company;
•
The NEO’s demonstrated performance over the past few years;
•
The NEO’s leadership performance.
A summary of the long-term incentive program details for 2015 are shown in the table below. The long-term incentive mix for the CEO differs from the mix for the other NEOs. Since the CEO has more opportunity to influence our financial results, the Committee considers it appropriate that a greater percentage of his long-term incentives are directly tied to the performance of the Company’s stock price.
|
|
Performance-based RSUs
|
Time-based RSUs
|
Stock Options
|
|||
|
CEO Equity Mix
|
55%
|
25%
|
20%
|
|||
|
NEO Equity Mix
|
45%
|
35%
|
20%
|
|||
|
Term
|
Three years
|
Three years
|
10 years
|
|||
|
Frequency
|
Granted annually
|
Granted annually
|
Granted annually
|
|||
|
Performance criteria
|
Absolute TSR and
Relative TSR
|
Retention
|
Stock price appreciation
|
|||
|
Vesting
|
Cliff vesting after three years
|
Cliff vesting after three years
|
Ratable vesting over three years
|
|||
|
Payout
|
Upon vesting, shares are distributed based on performance certification
(0% - 200%)
|
Upon vesting, shares are distributed
|
Upon vesting, options are available to exercise
|
|||
|
Dividends
|
No dividends
|
Dividend equivalents accrued and paid in cash upon vesting (1)
|
No dividends
|
|||
___________
(1) Dividend equivalents begin accruing on time-based RSUs with the 2012 grant.
We continued to grant long-term incentives in the form of (1) performance-based RSUs, (2) time-based RSUs, and (3) stock options in 2015 to emphasize our commitment to pay for performance, enable ownership in the Company, and ensure appropriate retention of our NEOs.
Performance-based RSUs.
Performance-based RSUs awarded are only earned if we attain specific TSR results. We measure both relative TSR and absolute TSR as interdependent measures in determining the attainment level of our performance-based awards. Including absolute TSR ensures that we are delivering value to our stockholders, not simply performing well against our peers. Relative TSR may place us at the top of our peers; however, if we have not delivered value to our stockholders, awards would be limited. The majority of companies in our comparator group typically consider only their TSR performance relative to a defined peer group. Performance-based equity is a significant portion of our NEO compensation. The performance-based RSU matrix included in this section shows how the two metrics work together to generate a performance multiple.
A maximum payout is achieved only when we exceed our goals both in absolute and relative terms.
Example 1:
If our Relative TSR performance is below the median (i.e., 50 Percentile) of our comparator company group, we only deliver a payout if our Annualized Absolute TSR performance is at least 7.5 percent during the three-year period. At a 7.5 percent annualized TSR result, the payout would be between 0 percent to 50 percent of the original grant.
180
Example 2:
Relative TSR performance near or at the top of our comparator group would be capped at 60 percent of the original grant if we fail to return at least 7.5 percent to our stockholders. This would result in each NEO receiving well below the targeted award despite high relative TSR compared to our peers.
This philosophy is in contrast to the common market practice of utilizing only relative TSR. Without delivering the threshold absolute return to stockholders, relative TSR that fails to exceed the median of the comparator group will not generate any payout.
|
Relative TSR
TSR performance relative to our comparator companies
|
100 Percentile
|
60%
|
100%
|
125%
|
150%
|
175%
|
200%
|
|
75 Percentile
|
30%
|
75%
|
100%
|
125%
|
150%
|
175%
|
|
|
50 Percentile
|
0%
|
50%
|
75%
|
100%
|
125%
|
150%
|
|
|
25 Percentile
|
0%
|
25%
|
50%
|
75%
|
100%
|
125%
|
|
|
<25 Percentile
|
0%
|
0%
|
0%
|
30%
|
60%
|
100%
|
|
|
<7.5%
|
7.5%
Threshold
|
10%
|
12.5%
Target
|
15%
|
18%
Stretch
|
||
|
Annualized Absolute TSR
Stockholders receive increased return on their investment
|
|||||||
The performance-based RSU granted in 2012 for the 2012-2014 performance period exceeded targets set for both absolute and relative TSR at the beginning of each performance period resulting in a strong performance score of 169 percent. The 2012 awards were distributed in 2015. Of note, the past six vesting periods through 2015, two of our performance-based RSU grants have not achieved the minimum threshold for payout while four have achieved above target performance.
Minimum Vesting Period
. The 2007 Incentive Plan requires a minimum three-year vesting period for all RSU awards and at least a portion of all stock option awards.
2012 Performance-based RSUs Earned
. The three-year performance cycle for our 2012 performance-based RSUs was completed at the end of 2014 and earned awards were distributed in 2015 upon vesting and performance certification. As discussed earlier in the CD&A, we surpassed the stretch goal for the annualized TSR and performed well relative to our comparator companies achieving a relative TSR performance in the top quartile of our comparator company group. Applying these results generated a 169 percent of target performance result.
2013 Performance-based RSUs Earned
. Despite TSR performance in the top half of our comparator company group, we did not meet the three-year performance target for our 2013 performance cycle which ran through 2015. As a result of the decline in the WMB share price in late 2015, we did not achieve the threshold level of absolute TSR performance. We finished in the second quartile of TSR performance among our comparator company group. Applying these results to the displayed matrix generated an award of just 3.5 percent of target and earned awards were distributed in 2016 upon vesting and performance certification.
Time-based RSUs
. We grant time-based RSUs to retain executives and to facilitate stock ownership. The use of time-based RSUs is also consistent with the practices of our comparator group of companies. In 2012, we began accruing dividend equivalents on our time-based RSUs in line with transformation into a high-growth, high-dividend energy infrastructure company. Our quarterly dividend has increased since 2010, growing from $.11 to $.64. Accrued dividend equivalents will only distribute upon vesting.
Stock Option Awards
. For recipients, stock options have value only to the extent the price of our common stock is higher on the date the options are exercised than it was on the date the options were granted.
Grant Practices
. The Committee typically approves our annual equity grant in February or early March of each year, shortly after the annual earnings release. The grant date for awards is on or after the date of such approval to ensure the market has time to absorb material information disclosed in the earnings release and reflect that information in the stock price. Our grant practices in 2015 were consistent with prior years. The grant date for off-cycle grants for individuals who are not NEOs, for reasons such as retention or new hires, is the first business day of the month following the approval of the grant. By using this consistent approach, we remove grant timing from the influence of the release
181
of material information. Consistent with the requirements of our Merger Agreement with Energy Transfer Corp LP, at this time we do not expect to grant WMB equity awards in 2016.
Stock Ownership Guidelines
. Our program provides stock ownership guidelines for each of our NEOs and our Board of Directors as shown in the table below:
|
Position
|
Ownership Multiple
|
As a Multiple of
|
Holding / Retention Requirement
|
|||
|
CEO
|
6x
|
Base Pay
|
50%, after taxes, until guidelines are met
|
|||
|
NEO
|
3x
|
Base Pay
|
50%, after taxes, until guidelines are met
|
|||
|
Board of Directors
|
5x
|
Annual Cash Retainer
|
60% until guidelines are met
|
|||
The Committee annually reviews the guidelines for competitiveness and alignment with best practices and monitors the NEOs’ progress toward compliance. Only WMB and WPZ shares owned outright and outstanding time-based RSUs count as owned for purposes of the program. Stock options and performance-based equity are not included as owned for purposes of the program. (It is important to note that the majority of NEO equity grants are in the form of performance-based RSUs and stock options.) NEOs must retain 50 percent of any vested equity awards, net of taxes, until their ownership guidelines are met. Board members must retain 60 percent of distributed vested equity awards until their ownership guidelines are met. At Williams, NEOs must hold at least 50 percent of any equity transaction if they have not met their ownership guideline regardless of their time in the role.
Annual Cash Incentives
As previously mentioned in the “Our Commitment to Pay for Performance” section, we pay annual cash incentives to encourage and reward our NEOs for making decisions that improve our annual operating performance through our AIP. The objectives of our AIP are to:
|
•
|
Motivate and incent management to choose strategies and investments that maximize long-term stockholder value;
|
|
•
|
Offer sufficient incentive compensation to motivate management to put forth extra effort, take prudent risks, and make effective decisions to maximize stockholder value;
|
|
•
|
Provide sufficient total compensation to retain management;
|
|
•
|
Limit the cost of compensation to levels that will maximize the return of current stockholders without compromising the other objectives.
|
NEOs’ AIP business performance is based on enterprise results of these business metrics in relation to established targets. We only use enterprise-level performance metrics for our NEOs in order to promote teamwork and collaboration by creating a shared goal for the overall Company performance. Our incentive program allows the Committee to make adjustments to these business performance metrics to reflect certain business events. When determining which adjustments are appropriate, we are guided by the principle that incentive payments should not result in unearned windfalls or impose undue penalties. In other words, we make adjustments to ensure NEOs are not rewarded for positive results they did not facilitate nor are they penalized for certain unusual circumstances outside their control.
Management regularly reviews with the Committee a supplemental scorecard reflecting the Company’s adjusted EBITDA, earnings per share, cash flow from operations, stock price performance, capital expenditures, WMB dividend coverage ratio, and safety to provide updates regarding the Company’s performance as well as to ensure alignment between these measures and the AIP’s business performance metrics. This scorecard provides the Committee with additional data to assist in determining final AIP awards.
182
The Committee’s independent compensation consultant annually compares our relative performance on various measures, including TSR and earnings per share with our comparator group of companies. The Committee also uses this analysis to validate the reasonableness of our AIP results.
How We Set the 2015 AIP Goals.
The following table outlines our approach to setting AIP goals:
|
How we establish AIP Goals
|
||
|
CEO, CFO, NEOs
|
Establish business and financial goals
|
|
|
Organizational and Functional Leaders
|
Create specific business and financial goals
|
|
|
Corporate Planning
|
Consolidate into enterprise business and financial goals
|
|
|
CEO, CFO, NEOs
|
Finalize enterprise business and financial plan
Establish AIP goals and recommend to the Committee
|
|
|
Compensation Committee
|
Review and make any necessary adjustments to set AIP goals
Monitor progress throughout the year
|
|
The AIP Calculation
. The 2015 AIP is based on the weighted measures of distributable cash flow, controllable costs, fee-based revenue, and three safety metrics. Each metric is directly aligned with our business strategy to operationally grow the business, operate safely in everything we do, and continue to align with our dividend growth strategy.
|
Business
Performance Metrics
|
Weighting
|
Measures
|
Importance
|
|||
|
Distributable Cash Flow
|
30%
|
Cash generated
|
Enables us to create value for our stockholders by generating cash to grow our business and aligns with our high dividend growth strategy
|
|||
|
Controllable Costs
|
30%
|
Operating & Maintenance and General & Administrative costs
|
Emphasizes the importance of cost management discipline
|
|||
|
Fee-based Revenue
|
30%
|
Revenue created from fee-based contracts
|
Creates a steady cash flow from our fee-based business for day-to-day operational and growth initiatives
Clearly measures growth and profitability without the influence of commodity price volatility
|
|||
|
Safety Metrics
|
10%
|
Lost time, days away from work, and motor vehicle accidents
|
Emphasizes the importance of safety leadership
|
|||
For 2015, there were three safety metrics, each of which are equally weighted. The metrics include Lost Time Incident Rate, Days Away From Work Rate and Motor Vehicle Accident Rate.
The attainment percentage of AIP goals results in payment of annual cash incentives along a continuum between threshold and stretch levels, which corresponds to 0 percent percent through 200 percent of the NEO’s annual cash incentive target. NEOs have the possibility to exceed the stretch level up to 250 percent of their annual cash incentive target. The charts below show the goals for the 2015 annual cash incentive and the resulting payout level.
2015 NEO AIP Targets
. The starting point to determine annual cash incentive targets (expressed as a percentage of base pay) is competitive market information, which gives us an idea of what other companies target to pay in annual
183
cash incentives for similar jobs. We also consider the internal value of each job - i.e., how important the job is to executing our strategy compared to other jobs in the Company- before the target is set for the year. The annual cash incentive targets as a percentage of base pay for the NEOs in 2015 were as follows:
|
Position
|
Target
|
|
|
CEO
|
125%
|
|
|
CFO
|
75%
|
|
|
SVP, Central OA and Operational Excellence
|
70%
|
|
|
SVP, Engineering and Construction
|
70%
|
|
|
SVP, Atlantic - Gulf
|
70%
|
|
Determining 2015 AIP Awards.
To determine the funding of the annual cash incentive, we use the following calculation for each NEO:
|
Base Pay Received in 2015
|
X
|
2015 Incentive Target %
|
X
|
2015 Business Performance Metric Results %
|
=
|
2015 AIP Result
|
Based on business performance relative to the established goals, the Committee certified business performance results as follows and the 2015 AIP award payout at 82 percent of target will occur in early 2016:
|
Metrics
|
Weighting
|
Threshold
|
Target
|
Stretch @ 200%
|
Actual
|
Result
|
Payout %
|
|||||||||||||||
|
(Thousands)
|
||||||||||||||||||||||
|
Distributable Cash Flow
|
30
|
%
|
$2,680
|
|
$3,010
|
|
$3,340
|
|
$
|
2,749
|
|
21
|
%
|
6
|
%
|
|||||||
|
Controllable Costs
|
30
|
|
2,437
|
|
2,237
|
|
2,037
|
|
2,124
|
|
156
|
|
47
|
|
||||||||
|
Fee-based Revenue
|
30
|
|
5,751
|
|
5,951
|
|
6,151
|
|
5,816
|
|
32
|
|
10
|
|
||||||||
|
Safety Metrics
|
10
|
|
188
|
|
19
|
|
||||||||||||||||
|
2015 AIP Business Performance %
|
82
|
|
||||||||||||||||||||
We calculate (a) Distributable Cash Flow as:
Modified EBITDA
, adjusted for certain items of income or loss that we characterize as unrepresentative of our ongoing operations; less maintenance capital expenditures; less interest expense; less cash taxes; less income attributable to non-controlling interests, adjusted for certain items outside of EBITDA that we characterize as unrepresented of our ongoing operations; (b) Controllable Costs as:
operating and maintenance costs and selling
,
general and administrative costs
that are under the responsibility of a cost center manager; less certain expenses that are considered less controllable (such as pension and postretirement benefit costs) or have no net impact on financial performance (such as costs that are passed directly to customers); and (c) Fee-based Revenues as:
total service revenues
from our reportable segments before intercompany eliminations; less certain tracked revenues that have no net impact on financial performance. In addition, each measure above may be further adjusted as appropriate to avoid undue penalties or windfalls. (
Italicized
components include our proportionate share of such items recognized by our equity method investees.)
Individual performance, such as success toward our strategic objectives and individual goals, and successful demonstration of the Company’s leadership competencies, which exceeded expectations may be recognized through adjustments. Payments may also be adjusted downward if performance warrants. The Committee chose to apply an adjustment to certain NEOs. For those receiving an adjustment, the amount of the adjustment was within 11 percent of the original calculated award. Additionally, Mr. Chappel received an incremental adjustment as disclosed in the Summary Compensation Table.
As previously stated, our incentive program allows the Committee to make adjustments to these business performance metrics to reflect certain business events. The Committee rigorously discussed the current industry dynamic of deteriorating commodity prices, and whether or not to adjust NEO annual cash incentives to recognize the negative impact to our stockholders. We have highlighted the loss of value to Mr. Armstrong’s compensation based on
184
his equity holdings earlier in this document. In considering the importance of pay for performance and total compensation including long term incentives, annual cash incentives and base salary, the Committee elected to manage the 2015 incentive program as it was designed and communicated.
John Seldenrust Special Incentive Payment
. Supporting an investment to develop best-in-class engineering and construction capabilities, the Committee provided a special incentive program for John Seldenrust. The program defines performance goals for 2015, 2016 and 2017 and provides an annual payout of $250,000 at target. If the target goal is not achieved, no payment will be made. If both the target and stretch goals are achieved, the payment will be $500,000. In 2015, Mr. Seldenrust achieved the $500,000 payout amount by meeting target and stretch performance goals related to the integration of the gathering compression across our Northeast operating area following the 2014 acquisition of Access Midstream, completing a standard compression facility design, and eliminating more than 90 percent of the identified gathering compression integration gaps. Mr. Seldenrust’s 2015 special incentive was paid in early 2016.
Base Pay
Base pay compensates the NEOs for carrying out the duties of their jobs and serves as the foundation of our pay program. Most other major components of pay are set based on a relationship to base pay, including long-term and annual incentives, and retirement benefits.
Base pay for the NEOs, including the CEO, is set considering the market median, with potential individual variation from the median due to experience, skills, and sustained performance of the individual as part of our pay-for-performance philosophy. Performance is measured in two ways: through the “Right Results” obtained in the “Right Way.” Right Results considers the NEOs’ success in attaining their annual goals, operational and/or functional area strategies, and personal development plans. Right Way reflects the NEOs’ behavior as exhibited through our organizational, operational, and people leadership competencies.
Benefits
Consistent with our philosophy to emphasize pay for performance, our NEOs receive very few perquisites or supplemental benefits. They are as follows:
|
•
|
Retirement Restoration Benefits
. NEOs participate in our qualified retirement program on the same terms as our other employees. We offer a retirement restoration plan to maintain a proportional level of pension benefits to our NEOs as provided to other employees. The Internal Revenue Code of 1986, as amended (the Internal Revenue Code), limits qualified pension benefits based on an annual compensation limit. For 2015, the limit was $265,000. Any limitation in an NEO’s pension benefit in the tax-qualified pension plan due to this limit is made up for (subject to a cap) in the unfunded retirement restoration plan. Benefits for NEOs are not enhanced and are calculated using the same benefit formula as that used to calculate benefits for all employees in the qualified pension plan. The compensation included in the retirement restoration benefit is consistent with pay considered for all employees in the qualified pension plan. Equity compensation, including RSUs and stock options, is not considered. Additionally, we do not provide a nonqualified benefit related to our qualified 401(k) defined contribution retirement plan.
|
|
•
|
Financial Planning Allowance
. We offer financial planning to provide expertise on current tax laws to assist NEOs with personal financial planning and preparations for contingencies such as death and disability. Covered services include estate planning, tax planning, tax return preparation, wealth accumulation planning, and other personal financial planning services. In addition, by working with a financial planner, NEOs gain a better understanding of and appreciation for the programs the Company provides, which helps to maximize the retention and engagement aspects of the dollars the Company spends on these programs.
|
|
•
|
Personal Use of Company Aircraft
. The CEO is allowed, but not required, to use the Company’s private aircraft for personal travel. Our policy for all other executive officers is to discourage personal use of the aircraft, but
|
185
the CEO retains discretion to permit its use when he deems appropriate, such as when the destination is not well served by commercial airlines, personal emergencies, and the aircraft is not being used for business purposes. To the extent that NEOs use the Company’s private aircraft for personal travel, imputed income will be applied to the NEO, in compliance with Internal Revenue Code requirements.
|
•
|
Executive Physicals
. The Committee requires annual physicals for the NEOs. NEO physicals align with our wellness initiative as well as assist in mitigating risk. NEO physicals are intended to identify any health risks and medical conditions as early as possible in an effort to achieve more effective treatment and outcomes.
|
|
•
|
Event Center
. We have a suite and club seats at certain event centers that were purchased for business purposes. If they are not being used for business purposes, we make them available to all employees, including our NEOs, as a form of reward and recognition. This is not a perquisite to our NEOs because it is available to all employees.
|
|
•
|
Spousal Travel
. When it is deemed necessary or appropriate for spouses of employees to travel for Company business purposes, we provide a tax gross-up under our company-wide policy to cover the personal tax obligations associated with spousal travel for business purposes for all employees.
|
Additional Components of our Executive Compensation Program
In addition to establishing the pay elements described above, we have adopted a number of policies to further the goals of the executive compensation program, particularly with respect to strengthening the alignment of our NEOs’ interests with stockholder long-term interests.
Employment Agreements.
We do not have employment agreements with our NEOs.
Termination and Severance Arrangements.
The NEOs are not covered under a severance plan. However, the Committee may exercise judgment and consider the circumstances surrounding each departure and may decide a severance package is appropriate. Considerations include the NEO’s term of employment, past accomplishments, reasons for separation from the Company, and competitive market practice. The only pay or benefits an employee has a right to receive upon termination of employment are those that have already vested or which vest under the terms in place when equity was granted.
Change in Control Agreements.
Our change in control agreements, in conjunction with the NEOs’ RSU agreements, provide separation benefits for our NEOs. Our program includes a double trigger for benefits and equity vesting. This means there must be a change in control and the NEO’s employment must terminate prior to receiving benefits under the agreement. This practice creates security for the NEOs but does not provide an incentive for the NEO to leave the Company. Our program is designed to encourage the NEOs to focus on the best interests of stockholders by alleviating their concerns about a possible detrimental impact to their compensation and benefits under a potential change in control, not to provide compensation advantages to NEOs for executing a transaction.
Our Committee reviews our change in control benefits annually to ensure they are consistent with competitive practice and aligned with our compensation philosophy. As part of the review, calculations are performed to determine the overall program cost to the Company if a change in control event were to occur and all covered NEOs were terminated as a result. An assessment of competitive norms, including the reasonableness of the elements of compensation received, is used to validate benefit levels for a change in control. We do not offer a tax gross-up provision in our change in control agreements but instead include a ‘best net’ provision providing our NEOs with the better of their after-tax benefit capped at the safe harbor amount or their benefit paid in full, subjecting them to possible excise tax payments. The Committee continues to believe that offering a change in control program is appropriate and critical to attracting and retaining executive talent and keeping them aligned with stockholder interests in the event of a change in control.
186
The following chart details the benefits received if an NEO were to be terminated or resigned for a defined good reason following a change in control as well as an analysis of those benefits as it relates to the Company, stockholders, and the NEO. Please also see the “Change in Control Agreements” section following the CD&A for further discussion of our change in control program.
|
Change in Control Benefit
|
What does the benefit provide to
the Company and stockholders?
|
What does the benefit provide to
the NEO?
|
||
|
Multiple of 3x base pay plus annual cash incentive at target
|
Encourages NEOs to remain engaged and stay focused on successfully closing the transaction.
|
Financial security for the NEO equivalent to two or three-years of continued employment.
|
||
|
Accelerated vesting of stock awards
|
An incentive to stay during and after a change in control. If there is risk of forfeiture, NEOs may be less inclined to stay or to support the transaction.
|
The NEOs are kept whole, if they have a separation from service following a change in control.
|
||
|
Up to 18 months of medical or health coverage through COBRA
|
This is a minimal cost to the Company that creates a competitive benefit.
|
Access to health coverage.
|
||
|
3x the previous year’s retirement restoration allocation
|
This is a minimal cost to the Company that creates a competitive benefit.
|
May allow those NEOs who are nearing retirement to receive a cash payment to make up for lost allocations due to a change in control.
|
||
|
Reimbursement of legal fees to enforce benefit
|
Keeps NEOs focused on the Company and not concerned about whether the acquiring company will honor commitments after a change in control.
|
Security during an unstable period of time.
|
||
|
Outplacement assistance
|
Keeps NEOs focused on supporting the transaction and less concerned about trying to secure another position.
|
Assists NEOs in finding a comparable executive position.
|
||
|
‘Best Net’ provision
|
Enables the change in control benefits to be delivered in as close a manner to the intended value of the benefits as possible.
|
Provides NEOs with the better of their after-tax benefit capped at the safe harbor amount or their benefit paid in full, which would subject them to possible excise tax payments.
|
||
Derivative Transactions.
Our insider trading policy applies to transactions in positions or interests whose value is based on the performance or price of our common stock. Because of the inherent potential for abuse, Williams prohibits officers, directors, and certain key employees from entering into short sales or using equivalent derivative securities. Williams also prohibits officers, directors and key employees from including Williams’ securities in a margin account or pledging Williams’ securities as collateral for a loan.
Mitigating Risk
Our compensation plans are effectively designed and functioning to reward positive performance and motivate NEOs and employees to behave in a manner consistent with our stockholder interests, business strategies and objectives, ethical standards, and prudent business practices, along with our Core Values & Beliefs which are the foundation on which we conduct business. Our Core Values & Beliefs can be found on our website at www.williams.com from the Our Company tab. In fact, many elements of our executive pay program serve to mitigate excessive risk taking. For example:
|
•
|
Target Pay Mix.
The target pay mix weighting of long-term incentives, annual cash incentives, and base pay is consistent with comparator company practices and avoids placing too much value on any one element of
|
187
compensation, particularly the annual cash incentive. The mix of our pay program is intended to motivate NEOs to consider the impact of decisions on stockholders in the long, intermediate, and short terms.
|
•
|
Annual Cash Incentive.
Our annual cash incentive program does not allow for unlimited payouts. Cash incentive payments for NEOs cannot exceed 250 percent of target levels.
|
|
•
|
Performance-based Awards.
|
|
•
|
Our annual cash incentive and long-term incentive programs include performance-based awards. The entire annual cash incentive award is measured against performance targets, while a significant portion of the long-term equity awards provided to NEOs is in the form of performance-based RSUs and stock options. Performance-based RSUs have no value unless we achieve pre-determined three-year performance target thresholds. Stock options will have no value unless the stock price increases from the date of grant.
|
|
•
|
To drive a long-term perspective, all RSU awards vest at the end of three years rather than vesting ratably on an annual basis.
|
|
•
|
NEOs’ incentive compensation performance is measured at the enterprise level rather than on a business unit level to ensure a focus on the overall success of the Company.
|
|
•
|
Stock Ownership Guidelines.
As discussed in this CD&A, all NEOs, consistent with their responsibilities to stockholders, must hold an equity interest in the Company equal to a stated multiple of their base pay.
|
|
•
|
Recoupment Policy.
In the event that financial results of the Company are restated due to fraud or intentional misconduct, the Board of Directors will review any performance-based incentive payments, including payments under the AIP and performance-based RSUs, paid to executive officers, who are found by the Board of Directors to be personally responsible for the fraud or intentional misconduct that caused the need for the restatement and will, to the extent permitted by applicable law, seek recoupment from all executive officers of any amounts paid in excess of the amounts that would have been paid based on the restated financial results. In addition, the Company will take action to comply with Section 954 of the Dodd-Frank Wall Street Reform and Consumer Protection Act of 2010 upon promulgation of final rules from the SEC.
|
|
•
|
Insider Trading Policy.
Our insider trading policy prohibits NEOs and directors, directly or through family members or other persons or entities, from buying or selling Williams’ securities or engaging in any other action to take personal advantage of material nonpublic information. In addition, if during the course of working for the Company, the NEO or Director learn of material nonpublic information about a competitor or a company with which Williams or an affiliate of Williams does or anticipates doing business with, they may not trade in that company’s securities until the information becomes public or is no longer material.
|
Accounting and Tax Treatment.
We consider the impact of accounting and tax treatment when designing all aspects of pay, but the primary driver of our program design is to support our business objectives. Stock options and performance-based RSUs are intended to satisfy the requirements for performance-based compensation as defined in Section 162(m) of the Internal Revenue Code and are therefore considered a tax deductible expense. Time-based RSUs do not qualify as performance-based and may not be fully deductible.
The annual cash incentive program satisfies the requirements for performance-based compensation as defined in Section 162(m) of the Internal Revenue Code and is therefore a tax deductible expense. For payments under our annual cash incentive program to be considered performance-based compensation under Section 162(m), the Committee can only exercise negative discretion relative to actual performance when determining the amount to be paid. In order to ensure compliance with Section 162(m), the Committee has established a target in excess of the maximum individual payout allowed to NEOs under our annual cash incentive program. Reductions are made each year and are not a reflection of the performance of the NEOs but rather ensure flexibility with respect to paying based upon performance.
188
Compensation Committee Report on Executive Compensation
We have reviewed and discussed the foregoing CD&A with management. Based on our review and discussions with management, we recommend to the Board of Directors that the CD&A be included in our Annual Report on Form 10-K for the year ended December 31, 2015.
By the members of the Compensation Committee of the Board of Directors as of February 22, 2016:
|
•
|
Janice D. Stoney, Chair
|
|
•
|
Joseph R. Cleveland
|
|
•
|
Frank T. MacInnis
|
|
•
|
Keith A. Meister
|
|
•
|
Steven W. Nance
|
|
•
|
Laura A. Sugg
|
The Compensation Committee Report on Executive Compensation is not deemed filed with the SEC and shall not be deemed incorporated by reference into any prior of future filings made by Williams under the Securities Act or the Exchange Act, except to the extent that Williams specifically incorporates such information by reference.
Compensation Committee Interlocks and Insider Participation
During fiscal year 2015, Mesdames Stoney and Sugg, and Messrs. Cleveland, MacInnis, Meister, Nance, and Smith served on the Compensation Committee. None of these Committee members has ever been an officer or employee of the Company or any of our subsidiaries and none has an interlocking relationship requiring disclosure under applicable SEC rules.
Mr. Armstrong was appointed Chief Executive Officer of the general partner of Williams Partners on December 31, 2014 and is a member of our Board. Mr. Armstrong received no compensation from Williams Partners.
189
Executive Compensation and Other Information
2015 Summary Compensation Table
The following table sets forth certain information with respect to the compensation of the NEOs earned during fiscal years 2015, 2014, and 2013.
|
Name and Principal Position
|
Year
|
Salary
|
Bonus
|
Stock Awards (1)
|
Option Awards (2)
|
Non-Equity Incentive Plan Compensation (3)
|
Change in Pension Value & Nonqualified Deferred Compensation Earnings (4)
|
All Other Compensation (5)
|
Total
|
||||||||||
|
Alan S. Armstrong
President and Chief Executive Officer
|
2015
|
$1,113,846
|
|
$—
|
$4,069,879
|
|
$1,165,677
|
|
$
|
1,141,692
|
|
$
|
(575,545
|
)
|
$41,251
|
|
$
|
6,956,800
|
|
|
2014
|
1,072,308
|
|
—
|
7,243,983
|
|
998,100
|
|
652,455
|
|
1,597,293
|
|
40,476
|
|
11,604,615
|
|
||||
|
2013
|
1,025,385
|
|
—
|
3,239,986
|
|
833,629
|
|
1,042,875
|
|
(444,854
|
)
|
27,402
|
|
5,724,423
|
|
||||
|
Donald R. Chappel
SVP, Chief Financial Officer
|
2015
|
672,385
|
|
—
|
1,449,125
|
|
405,453
|
|
605,000
|
|
(258,872
|
)
|
20,583
|
|
2,893,674
|
|
|||
|
2014
|
656,000
|
|
—
|
4,150,747
|
|
456,278
|
|
262,000
|
|
845,060
|
|
25,738
|
|
6,395,822
|
|
||||
|
2013
|
642,692
|
|
—
|
1,688,482
|
|
421,202
|
|
425,000
|
|
(279,396
|
)
|
22,595
|
|
2,920,575
|
|
||||
|
Robert S. Purgason
SVP, Central OA and Operational Excellence
|
2015
|
531,558
|
|
—
|
1,449,125
|
|
405,453
|
|
310,000
|
|
88,676
|
|
29,930
|
|
2,814,742
|
|
|||
|
2014
|
|||||||||||||||||||
|
2013
|
|||||||||||||||||||
|
John D. Seldenrust
SVP, Engineering and Construction
|
2015
|
431,391
|
|
—
|
1,143,167
|
|
94,204
|
|
710,000
|
|
55,779
|
|
22,139
|
|
2,456,679
|
|
|||
|
2014
|
|||||||||||||||||||
|
2013
|
|||||||||||||||||||
|
Rory L. Miller
SVP, Atlantic Gulf
|
2015
|
487,692
|
|
—
|
1,086,877
|
|
304,088
|
|
310,000
|
|
(201,730
|
)
|
16,848
|
|
2,003,775
|
|
|||
|
2014
|
471,923
|
|
—
|
2,234,009
|
|
285,173
|
|
168,000
|
|
547,729
|
|
21,655
|
|
3,728,488
|
|
||||
|
2013
|
452,692
|
|
—
|
914,600
|
|
228,153
|
|
285,000
|
|
(190,499
|
)
|
16,468
|
|
1,706,414
|
|
||||
___________
|
(1)
|
Stock Awards. Awards were granted under the terms of the 2007 Incentive Plan and include time-based and performance-based RSUs. Amounts shown are the grant date fair value of awards computed in accordance with FASB ASC Topic 718. The assumptions used to value the stock awards can be found in our Annual Report on Form 10-K for the year-ended December 31, 2015. The 2014 stock awards values also include a leveraged RSU award granted on October 25, 2014. The leveraged RSU was a new type of grant for Williams and was not a part of the NEO annual equity awards in 2015.
|
190
The potential maximum values of the performance-based RSUs, subject to changes in performance outcomes, are as follows:
|
2015 Performance-Based RSU Maximum Potential
|
|||
|
Alan S. Armstrong
|
$5,264,779
|
|
|
|
Donald R. Chappel
|
1,498,261
|
|
|
|
Robert S. Purgason
|
1,498,261
|
|
|
|
John D. Seldenrust
|
314,508
|
|
|
|
Rory L. Miller
|
1,123,713
|
|
|
___________
|
(2)
|
Option Awards. Awards are granted under the terms of the 2007 Incentive Plan and include non-qualified stock options. Amounts shown are the grant date fair value of awards computed in accordance with FASB ASC Topic 718. The assumptions used to value the option awards can be found in our Annual Report on Form 10-K for the year-ended December 31, 2015.
|
|
(3)
|
Non-Equity Incentive Plan. The maximum annual incentive pool funding for NEOs is 250 percent of target. Mr. Chappel’s AIP award includes an additional $165,000 awarded by the Compensation Committee recognizing Mr. Chappel’s outstanding contribution in support of the strategic alternatives review process conducted by the Board. Mr. Seldenrust’s amount includes annual incentive award of $210,000 and a special engineering and construction incentive award of $500,000. See “
John Seldenrust Special Incentive Payment”
above
.
|
|
(4)
|
Change in Pension Value and Nonqualified Deferred Compensation Earnings. The amount shown is the aggregate change from December 31, 2014 to December 31, 2015 in the actuarial present value of the accrued benefit under the qualified pension and non-qualified plan. The primary reasons for the decrease in the change in present value is a higher discount rate used to measure these benefits at the end of 2015. Mr. Purgason and Mr. Seldenrust show an increase in the present value in 2015 as they did not have an accrued benefit as of December 31, 2014. The underlying design of these programs did not change from 2014 to 2015. Please refer to the “Pension Benefits” table for further details of the present value of the accrued benefit.
|
|
(5)
|
All Other Compensation. Amounts shown represent payments made on behalf of the NEOs and include life insurance premiums, a 401(k) matching contribution, tax gross-ups on the imputed income related to spousal travel for business purposes and perquisites (if applicable). Perquisites may include financial planning services, mandated annual physical exam and personal use of the Company aircraft. If the NEO used the Company aircraft, the incremental cost method is used to calculate the personal use of the Company aircraft. The incremental cost calculation includes such items as fuel, maintenance, weather and airport services, pilot meals, pilot overnight expenses, aircraft telephone, and catering. Details of perquisites for Mr. Armstrong and Mr. Purgason are included because the individual aggregate amounts exceed $10,000. Amounts do not include arrangements that are generally available to our employees and do not discriminate in scope, terms or operations in favor of our NEOs, such as relocation, medical, dental, and disability programs.
|
|
|
Financial Planning
|
Annual Physical Exam
|
Company Aircraft Personal Usage
|
||||||
|
Alan S. Armstrong
|
$5,000
|
|
$1,650
|
|
$10,560
|
|
|||
|
Robert S. Purgason
|
15,000
|
|
4,654
|
|
—
|
|
|||
Notable Items
The Compensation Committee considers the compensation of CEOs from similarly-sized comparator companies when setting Mr. Armstrong’s pay. It is the competitive norm for CEOs to be paid more than other NEOs. In addition, the Compensation Committee believes the difference in pay between the CEO and other NEOs is consistent with our compensation philosophy (summarized in the CD&A), which considers the external market and internal value of each job to the Company along with the incumbent’s experience and performance of the job in setting pay. The CEO’s job is different from the other NEOs because the CEO has ultimate responsibility for performance results and is accountable
191
to the Board and stockholders. Consequently, the Compensation Committee believes it is appropriate for the CEO’s pay to be higher.
Mr. Chappel’s base pay, annual cash incentive target and long-term incentive amounts for 2015 are higher than other NEOs (other than the CEO) because of the impact of his role and market data. Because Mr. Chappel directly interfaces with stockholders and has greater accountability to stockholders, his pay is greater than that of the other NEOs, excluding the CEO.
Grants of Plan Based Awards
The following table sets forth certain information with respect to the grant of stock options, RSUs, and awards payable under the Company’s annual cash incentive plan during the last fiscal year to the NEOs.
|
Name
|
Grant Date
|
Estimated Future Payouts Under
Non-Equity Incentive Plan
Awards (1)
|
Estimated Future Payouts Under
Equity Incentive Plan
Awards (2)
|
All Other Stock Awards: Number of Shares of Stock or Units (3)
|
All Other Option Awards: Number of Securities Underlying Options (4)
|
Exercise or Base Price of Option Awards
|
Grant Date Fair Value of Stock and Option Awards
|
||||||||
|
Threshold
|
Target
|
Maximum
|
Threshold
|
Target
|
Maximum
|
||||||||||
|
Armstrong
|
2/23/2015
|
$
|
—
|
|
$1,392,308
|
$3,480,770
|
153,177
|
|
$49.15
|
$ 1,165,677
|
|||||
|
2/23/2015
|
—
|
|
75,061
|
150,122
|
2,632,389
|
||||||||||
|
2/23/2015
|
29,247
|
1,437,490
|
|||||||||||||
|
Chappel
|
2/23/2015
|
—
|
|
504,289
|
1,260,723
|
53,279
|
|
49.15
|
405,453
|
||||||
|
2/23/2015
|
—
|
|
21,361
|
42,722
|
749,130
|
||||||||||
|
2/23/2015
|
14,242
|
699,994
|
|||||||||||||
|
Purgason
|
2/23/2015
|
—
|
|
372,091
|
930,228
|
53,279
|
|
49.15
|
405,453
|
||||||
|
2/23/2015
|
—
|
|
21,361
|
42,722
|
749,130
|
||||||||||
|
2/23/2015
|
14,242
|
699,994
|
|||||||||||||
|
Seldenrust
|
2/23/2015
|
—
|
|
266,024
|
665,060
|
12,379
|
|
49.15
|
94,204
|
||||||
|
2/23/2015
|
—
|
|
4,484
|
8,968
|
157,254
|
||||||||||
|
2/23/2015
|
3,782
|
185,885
|
|||||||||||||
|
6/1/2015
|
15,589
|
800,027
|
|||||||||||||
|
Miller
|
2/23/2015
|
—
|
|
341,384
|
853,460
|
39,959
|
|
49.15
|
304,088
|
||||||
|
2/23/2015
|
—
|
|
16,021
|
32,042
|
561,856
|
||||||||||
|
2/23/2015
|
10,682
|
525,020
|
|||||||||||||
___________
Note: Information provided is as of the close of market on December 31, 2015.
|
(1)
|
Non-Equity Incentive Awards. Awards from the 2015 AIP are shown.
|
|
•
|
Threshold: At threshold, the 2015 AIP awards are zero.
|
|
•
|
Target: The amount shown is based upon a business performance attainment of 100 percent.
|
|
•
|
Maximum: The maximum amount the NEOs can receive is 250 percent of their AIP target.
|
|
(2)
|
Represents performance-based RSUs granted on February 23, 2015 under the 2007 Incentive Plan. Performance-based RSUs can be earned over a three year period only if the established performance target is met and the NEO is employed on the certification date, subject to certain exceptions such as the executive’s death, disability or retirement. Under any circumstances, these shares will be distributed no earlier than the third anniversary of the grant other than due to a termination upon a change in control. If performance plan goals are exceeded, the NEO can receive up to 200 percent of target. If plan threshold goals are not met, the NEO’s awards are cancelled in their entirety.
|
192
|
(3)
|
Represents time-based RSUs granted under the 2007 Incentive Plan. Time-based units vest three years from the grant date of February 23, 2015 on February 23, 2018. As part of a promotion, Mr. Seldenrust received a second time-based RSU award grant on June 1, 2015 which will vest three years from the grant date on June 1, 2018.
|
|
(4)
|
Represents stock options granted under the 2007 Incentive Plan. Stock options granted in 2015 become exercisable in three equal annual installments beginning one year after the grant date. One-third of the options vested on February 23, 2016, another one-third will vest on February 23, 2017, with the final one-third vesting on February 23, 2018. Once vested, stock options are exercisable for a period of ten years from the grant date.
|
193
Outstanding Equity Awards
The following table sets forth certain information with respect to the outstanding equity awards held by the NEOs at the end of 2015.
|
|
Option Awards
|
Stock Awards
|
||||||||||||
|
Name
|
Grant
Date (1)
|
Number of
Securities
Underlying
Unexercised
Options (#)
Exercisable
|
Number of
Securities
Underlying
Unexercised
Options (#)
Unexercisable
|
Equity
Incentive
Plan Awards:
Number of
Securities
Underlying
Unexercised
Unearned
Options
|
Option
Exercise
Price
|
Expiration
Date
|
Grant
Date
|
Number of
Shares or
Units of
Stock That
Have Not
Vested
|
Market
Value of
Shares or
Units of
Stock That
Have Not
Vested
|
Equity
Incentive
Plan Awards:
Number of
Unearned
Shares,
Units of
Stock or
Other Rights
That Have
Not Vested
|
Equity
Incentive
Plan Awards:
Market or
Payout Value
of Unearned
Shares, Units
or Other
Rights That
Have Not
Vested(5)
|
|||
|
Armstrong
|
2/23/2015
|
—
|
|
153,177
|
|
|
$49.15
|
2/23/2025
|
2/23/2015
(2)
|
|
|
29,247
|
|
$751,648
|
|
2/24/2014
|
44,360
|
|
88,720
|
|
|
41.77
|
2/24/2024
|
2/23/2015
(3)
|
|
|
75,061
|
|
1,929,068
|
|
|
2/25/2013
|
98,363
|
|
49,182
|
|
|
33.57
|
2/25/2023
|
10/25/2014
(4)
|
|
|
56,807
|
|
1,459,940
|
|
|
2/27/2012
|
159,681
|
|
—
|
|
|
29.11
|
2/27/2022
|
2/24/2014
(2)
|
|
|
31,422
|
|
807,545
|
|
|
2/24/2011
|
72,486
|
|
—
|
|
|
24.21
|
2/24/2021
|
2/24/2014
(3)
|
|
|
78,041
|
|
2,005,654
|
|
|
2/23/2010
|
60,646
|
|
—
|
|
|
17.28
|
2/23/2020
|
2/25/2013
(2)
|
|
|
35,374
|
|
909,112
|
|
|
2/23/2009
|
108,587
|
|
—
|
|
|
8.85
|
2/23/2019
|
2/25/2013
(3)
|
|
|
88,469
|
|
2,273,653
|
|
|
2/25/2008
|
37,420
|
|
—
|
|
|
29.72
|
2/25/2018
|
|
|
|
|
|
|
|
|
2/26/2007
|
41,660
|
|
—
|
|
|
23.04
|
2/26/2017
|
|
|
|
|
|
|
|
|
3/3/2006
|
29,648
|
|
—
|
|
|
17.65
|
3/3/2016
|
|
|
|
|
|
|
|
|
Chappel
|
2/23/2015
|
—
|
|
53,279
|
|
|
49.15
|
2/23/2025
|
2/23/2015
(2)
|
|
|
14,242
|
|
366,019
|
|
2/24/2014
|
20,279
|
|
40,558
|
|
41.77
|
2/24/2024
|
2/23/2015
(3)
|
21,361
|
|
548,978
|
||||
|
2/25/2013
|
49,699
|
|
24,850
|
|
33.57
|
2/25/2023
|
10/25/2014
(4)
|
39,765
|
|
1,021,961
|
||||
|
2/27/2012
|
95,808
|
|
—
|
|
29.11
|
2/27/2022
|
2/24/2014
(2)
|
20,110
|
|
516,827
|
||||
|
2/24/2011
|
60,887
|
|
—
|
|
24.21
|
2/24/2021
|
2/24/2014
(3)
|
29,189
|
|
750,157
|
||||
|
2/23/2010
|
71,348
|
|
—
|
|
17.28
|
2/23/2020
|
2/25/2013
(2)
|
25,022
|
|
643,065
|
||||
|
2/23/2009
|
135,733
|
|
—
|
|
8.85
|
2/23/2019
|
2/25/2013
(3)
|
36,573
|
|
939,926
|
||||
|
2/25/2008
|
62,367
|
|
—
|
|
29.72
|
2/25/2018
|
|
|
||||||
|
2/26/2007
|
59,515
|
|
23.04
|
2/26/2017
|
||||||||||
|
3/3/2006
|
51,495
|
|
—
|
|
|
17.65
|
3/3/2016
|
|
|
|
|
|
|
|
|
Purgason
|
2/23/2015
|
—
|
|
53,279
|
|
|
49.15
|
2/23/2025
|
2/23/2015
(2)
|
|
|
14,242
|
|
366,019
|
|
|
|
|
|
|
|
|
|
2/23/2015
(3)
|
|
|
21,361
|
|
548,978
|
|
|
|
|
|
|
|
|
|
|
10/25/2014
(4)
|
|
|
18,746
|
|
481,772
|
|
|
Seldenrust
|
2/23/2015
|
—
|
|
12,379
|
|
|
49.15
|
2/23/2025
|
6/1/2015
(2)
|
|
|
15,589
|
|
400,637
|
|
2/23/2015
(2)
|
3,782
|
|
97,197
|
|||||||||||
|
|
2/23/2015
(3)
|
4,484
|
|
115,239
|
||||||||||
|
|
|
|
|
|
|
|
|
10/25/2014
(4)
|
|
|
14,202
|
|
364,991
|
|
|
Miller
|
2/23/2015
|
—
|
|
39,959
|
|
|
49.15
|
2/23/2025
|
2/23/2015
(2)
|
|
|
10,682
|
|
274,527
|
|
2/24/2014
|
12,674
|
25,349
|
|
|
41.77
|
2/24/2024
|
2/23/2015
(3)
|
|
|
16,021
|
|
411,740
|
||
|
2/25/2013
|
26,920
|
13,461
|
|
|
33.57
|
2/25/2023
|
10/25/2014
(4)
|
|
|
18,746
|
|
481,772
|
||
|
2/27/2012
|
59,082
|
—
|
|
|
29.11
|
2/27/2022
|
2/24/2014
(2)
|
|
|
12,569
|
|
323,023
|
||
|
2/24/2011
|
36,243
|
—
|
|
|
24.21
|
2/24/2021
|
2/24/2014
(3)
|
|
|
18,243
|
|
468,845
|
||
|
|
|
|
|
|
|
|
|
2/25/2013
(2)
|
|
|
13,554
|
|
348,338
|
|
|
|
|
|
|
|
|
|
|
2/25/2013
(3)
|
|
|
19,810
|
|
509,117
|
|
___________
Note: Information provided is as of the close of market on December 31, 2015.
194
Note: On December 31, 2011, we completed a tax-free spinoff of 100 percent of our exploration and production business, WPX Energy, Inc. (WPX), to our stockholders. At that time, we distributed one share of WPX common stock for every three shares of Williams’ common stock. As required under our 2007 Incentive Plan, we adjusted all outstanding equity awards on December 31, 2011 by applying an equity conversion factor. The intent of the equity conversion was to prevent dilution or enlargement of the benefits available under our incentive plans. The conversion resulted in increasing the number of WMB RSUs and stock options granted after January 1, 2006, in order to maintain the intrinsic value of these grants at the time of the spinoff. Stock options that were granted prior to December 31, 2005 were adjusted to provide both WMB stock options and WPX stock options using a distribution ratio of 3 to 1. All stock awards and option awards, including option exercise price, granted prior to January 1, 2012 have been adjusted accordingly. As of December 31, 2015, no WPX awards remain outstanding.
Stock Options
|
(1)
|
The following table reflects the vesting schedules for associated stock option grant dates for awards that were not 100 percent vested as of December 31, 2015.
|
|
Grant Date
|
Vesting Schedule
|
Vesting Dates
|
||
|
2//23/2015
|
One-third vests each year for three years
|
2/23/2016, 2/23/2017, 2/23/2018
|
||
|
2/24/2014
|
One-third vests each year for three years
|
2/24/2015, 2/24/2016, 2/24/2017
|
||
|
2/25/2013
|
One-third vests each year for three years
|
2/25/2014, 2/25/2015, 2/25/2016
|
||
Stock Awards
|
(2)
|
The following table reflects the vesting dates for associated time-based restricted stock unit award grant dates:
|
|
Grant Date
|
Vesting Schedule
|
Vesting Dates
|
||
|
2/23/2015
|
100% vests in three years
|
2/23/2018
|
||
|
2/24/2014
|
100% vests in three years
|
2/24/2017
|
||
|
2/25/2013
|
100% vests in three years
|
2/25/2016
|
||
Mr. Seldenrust’s June 1, 2015 time-based RSU award will fully vest in three years on June 1, 2018.
|
(3)
|
All performance-based RSUs are subject to attainment of performance targets established by the Compensation Committee. These awards will vest no earlier than three years from the date of grant. The awards included on the table are outstanding as of December 31, 2015.
|
|
(4)
|
All Leveraged RSUs are subject to attainment of performance targets established by the Compensation Committee. The awards are scheduled to vest on October 25, 2017. Any earned units are scheduled to distribute in one-third increments on October 25, 2017, October 25, 2018 and October 25, 2019. With the exception of certain termination provisions, the annualized absolute TSR during the three-year performance period must be at least 7 percent to result in a distribution with the target established at 12 percent. The distribution level is also impacted by relative TSR performance. If the absolute TSR metric is achieved, then the actual number of units earned will vary depending on if the relative TSR performance meets or exceeds the median of our comparator group of companies as compared to if the relative TSR falls below the median of our comparator group of companies.
|
|
(5)
|
Values are based on a closing stock price of $25.70 on December 31, 2015.
|
195
The following table sets forth certain information with respect to the outstanding WPZ equity awards held by the NEOs at the end of 2015.
|
|
Option Awards
|
Stock Awards
|
|||||||||||||||||||
|
Name
|
Grant
Date
|
Number of
Securities
Underlying
Unexercised
Options (#)
Exercisable
|
Number of
Securities
Underlying
Unexercised
Options (#)
Unexercisable
|
Equity
Incentive
Plan Awards:
Number of
Securities
Underlying
Unexercised
Unearned
Options
|
Option
Exercise
Price
|
Expiration
Date
|
Grant
Date
|
Number of
Shares or
Units of
Stock That
Have Not
Vested
|
Market
Value of
Shares or
Units of
Stock That
Have Not
Vested
|
Equity
Incentive
Plan Awards:
Number of
Unearned
Shares,
Units of
Stock or
Other Rights
That Have
Not Vested(1)
|
Equity
Incentive
Plan Awards:
Market or
Payout Value
of Unearned
Shares, Units
or Other
Rights That
Have Not
Vested(2)
|
||||||||||
|
Armstrong
|
|||||||||||||||||||||
|
Chappel
|
|||||||||||||||||||||
|
Purgason
|
—
|
|
—
|
|
—
|
|
—
|
|
7/16/2014
|
—
|
|
—
|
|
83,075
|
|
$
|
2,313,639
|
|
|||
|
Seldenrust
|
—
|
|
—
|
|
—
|
|
—
|
|
7/16/2014
|
—
|
|
—
|
|
66,460
|
|
1,850,911
|
|
||||
|
Miller
|
|||||||||||||||||||||
__________
Note: Information provided is as of the close of market on December 31, 2015.
|
(1)
|
The time-based WPZ RSU awards granted to Mr. Purgason and Mr. Seldenrust on July 16, 2014 are on a four-year graded vesting schedule. The first 25 percent will vest on July 16, 2016, the second 25 percent will vest on July 16, 2017, with the final 50 percent vesting on July 16, 2018. These awards were adjusted on February 2, 2015 as part of the WPZ and ACMP merger by a ratio of 1.06152 WPZ shares for every one ACMP share. The final values on the table above reflect the awards after the adjustment was applied.
|
|
(2)
|
Values are based on a closing WPZ stock price of $27.85 on December 31, 2015.
|
Option Exercises and Stock Vested
The following table sets forth certain information with respect to options exercised by the NEO and stock that vested during fiscal year 2015.
|
|
Option Awards (1)
|
Stock Awards
|
||||||||||||
|
Name
|
Number of Shares Acquired on Exercise
|
Value Realized on Exercise
|
Number of Shares Acquired on Vesting
|
Value Realized on Vesting
|
||||||||||
|
Alan S. Armstrong
|
40,060
|
|
$
|
1,348,820
|
|
177,382
|
|
$
|
8,698,813
|
|
||||
|
Donald R. Chappel
|
—
|
|
—
|
|
99,072
|
|
4,858,491
|
|
||||||
|
Robert S. Purgason
|
—
|
|
—
|
|
—
|
|
—
|
|
||||||
|
John D. Seldenrust
|
—
|
|
—
|
|
—
|
|
—
|
|
||||||
|
Rory L. Miller
|
—
|
|
—
|
|
61,095
|
|
2,996,099
|
|
||||||
__________
|
(1)
|
Additionally, in conjunction with the equity conversion as mentioned in the “Outstanding Equity Awards” table, Mr. Armstrong exercised 13,353 WPX stock options.
|
Retirement Plan
The retirement plan for the Company’s executives consists of two plans: the pension plan and the retirement restoration plan as described below. Together these plans provide the same level of benefits to our executives as the pension plan provides to all other employees of the Company. The retirement restoration plan was implemented to address the annual compensation limit of the Internal Revenue Code.
Pension Plan
Our executives who have completed one-year of service participate in our pension plan on the same terms as our other employees. Our pension plan is a noncontributory, tax qualified defined benefit plan (with a cash balance design) subject to the Employee Retirement Income Security Act of 1974, as amended.
196
Each year, participants earn compensation credits that are posted to their cash balance account. The annual compensation credits are equal to the sum of a percentage of eligible pay (base pay and certain bonuses) and a percentage of eligible pay greater than the social security wage base. The percentage credited is based upon the participant’s age as shown in the following table:
|
Age
|
Percentage of Eligible Pay
|
Percent of Eligible Pay Greater than the Social Security Wage Base
|
||||
|
Less than 30
|
4.5%
|
+
|
From 1% to 1.2%
|
|||
|
30-39
|
6%
|
+
|
2%
|
|||
|
40-49
|
8%
|
+
|
3%
|
|||
|
50 or over
|
10%
|
+
|
5%
|
|||
For participants who were active employees and participants under the plan on March 31, 1998, and April 1, 1998, the percentage of eligible pay is increased by 0.3 percent multiplied by the participant’s total years of benefit service earned as of March 31, 1998.
In addition, interest is credited to account balances quarterly at a rate determined annually in accordance with the terms of the plan.
The monthly annuity available to those who take normal retirement is based on the participant’s account balance as of the date of retirement. Normal retirement age is 65. Early retirement eligibility begins at age 55. At retirement, participants may choose to receive a single-life annuity (for single participants) or a qualified joint and survivor annuity (for married participants) or they may choose one of several other forms of payment having an actuarial value equal to that of the relevant annuity.
Retirement Restoration Plan
The Internal Revenue Code limits pension benefits based on the annual compensation limit that can be accrued in tax-qualified defined benefit plans, such as our pension plan. The annual compensation limit in 2015 was $265,000. Any reduction in an executive’s pension benefit accrual due to these limits will be compensated, subject to a cap, under an unfunded top hat plan - our retirement restoration plan.
The elements of compensation that are included in applying the payment and benefit formula for the retirement restoration plan are the same elements that are used, except for application of a cap, in the base pension plan for all employees. The elements of pay included in that definition are total base pay, including any overtime, base pay-reduction amounts, and cash bonus awards, if paid (unless specifically excluded under a written bonus or incentive-pay arrangement). Specifically excluded from the definition are severance pay, cost-of-living pay, housing pay, relocation pay (including mortgage interest differential), taxable and non-taxable fringe benefits, and all other extraordinary pay, including any amounts received from equity compensation awards.
With respect to bonuses, annual cash incentives are considered in determining eligible pay under the pension plan. Long-term equity compensation incentives are not considered.
Pension Benefits
The following table sets forth certain information with respect to the actuarial present value of the accrued benefit as of December 31, 2015 under the qualified pension plan and retirement restoration plan. All NEOs are fully vested in the benefits.
197
|
Name
|
Plan Name
|
Number of Years Credited Services
|
Present Value of Accrued Benefit (1)
|
Payments During Last Fiscal Year
|
||||||
|
Alan S. Armstrong
|
Pension Plan
|
30
|
$
|
709,220
|
|
—
|
||||
|
Retirement Restoration Plan
|
30
|
2,866,058
|
|
—
|
||||||
|
Donald R. Chappel (2)
|
Pension Plan
|
13
|
458,018
|
|
—
|
|||||
|
Retirement Restoration Plan
|
13
|
2,331,874
|
|
—
|
||||||
|
Robert S. Purgason (2) (3)
|
Pension Plan
|
1
|
39,935
|
|
—
|
|||||
|
Retirement Restoration Plan
|
1
|
48,741
|
|
—
|
||||||
|
John Seldenrust (3)
|
Pension Plan
|
1
|
30,673
|
|
—
|
|||||
|
Retirement Restoration Plan
|
1
|
25,106
|
|
—
|
||||||
|
Rory Miller (2)
|
Pension Plan
|
26
|
675,073
|
|
—
|
|||||
|
Retirement Restoration Plan
|
26
|
655,201
|
|
—
|
||||||
___________
|
(1)
|
The primary actuarial assumptions used to determine the present values include an annual interest credit to normal retirement age equal to 4.25 percent and a discount rate equal to 4.45 percent for the pension plan and discount rate equal to 3.99 percent for the retirement restoration plan.
|
|
(2)
|
Mr. Chappel, Mr. Miller, and Mr. Purgason are the NEOs eligible to retire as of December 31, 2015.
|
|
(3)
|
Mr. Purgason and Mr. Seldenrust are vested in plan benefits due to recognition of previous service with Williams or an acquired entity.
|
Nonqualified Deferred Compensation
We do not provide other nonqualified deferred compensation for any of our NEOs or other employees.
Change in Control Agreements
We have entered into change in control agreements with each of our NEOs to facilitate continuity of management if there is a change in control of the Company.
If during the term of a change in control agreement, a “change in control” occurs and (i) the employment of any NEO is terminated other than for “cause,” “disability,” death, or a “disqualification disaggregation”, or (ii) an NEO resigns for “good reason,” such NEO is entitled to the following:
|
•
|
Within ten business days after the termination date:
|
|
•
|
Accrued but unpaid base salary, accrued earned but unpaid cash incentive, accrued but unpaid paid time off, and any other amounts or benefits due but not paid (lump sum payment).
|
|
•
|
On the first business day following six months after the termination date:
|
|
•
|
Prorated annual cash incentive for the year of separation through the termination date (lump sum payment);
|
|
•
|
A severance amount equal to three times the sum of his/her base salary and annual cash incentive amount for executive officers, as of the termination date (lump sum payment). The annual cash incentive amount is equal to his/her target percentage multiplied by his/her base salary in effect at the termination date as if performance goals were achieved at 100 percent;
|
|
•
|
An amount equal to three times for executive officers, the total allocations made by Williams for the NEO in the preceding calendar year under our retirement restoration plan (lump sum payment);
|
|
•
|
An amount equal to the sum of the value of the unvested portion of the NEO’s accounts or accrued benefits under the Company’s 401(k) plan that would have otherwise been forfeited (lump sum payment).
|
198
|
•
|
Continued participation in the Company’s medical benefit plans for so long as the NEO elects coverage or 18 months from the termination, whichever is less, in the same manner and at the same cost as similarly situated active employees;
|
|
•
|
All restrictions on stock options held by the NEO will lapse, and the options will vest and become immediately exercisable;
|
|
•
|
All restricted stock units will vest and will be paid out only in accordance with the terms of the respective award agreements;
|
|
•
|
Continued participation in the Company’s directors’ and officers’ liability insurance for six years or any longer known applicable statute of limitations period;
|
|
•
|
Indemnification as set forth under the Company’s By-laws;
|
|
•
|
Outplacement benefits for six months at a cost not exceeding $25,000 for NEOs.
|
We provide a ‘best net’ provision providing our NEOs with the better of their after-tax benefit capped at the safe harbor amount or their benefit paid in full, subjecting them to possible excise tax payments. If an NEO’s employment is terminated for “cause” during the period beginning upon a change of control and continuing for two years or until the termination of the agreement, whichever happens first, the NEO is entitled to accrued but unpaid base salary, accrued earned but unpaid cash incentive, accrued but unpaid paid time off, and any other amounts or benefits due but not paid (lump sum payment).
The agreements with our NEOs use the following definitions:
“Cause” means an NEO’s:
|
•
|
Conviction of or a plea of nolo contendere to a felony or a crime involving fraud, dishonesty or moral turpitude;
|
|
•
|
Willful or reckless material misconduct in the performance of his/her duties that has an adverse effect on Williams or any of its subsidiaries or affiliates;
|
|
•
|
Willful or reckless violation or disregard of the code of business conduct of Williams or the policies of Williams or its subsidiaries; or
|
|
•
|
Habitual or gross neglect of his/her duties.
|
Cause generally does not include bad judgment or negligence (other than habitual neglect or gross negligence); acts or omissions made in good faith after reasonable investigation by the NEO or acts or omissions with respect to which the Board could determine that the NEO had satisfied the standards of conduct for indemnification or reimbursement under the Company’s By-laws, indemnification agreement, or applicable law; or failure (despite good faith efforts) to meet performance goals, objectives, or measures for a period beginning upon a change of control and continuing for two years or until the termination of the agreement, whichever happens first. An NEO’s act or failure to act (except as relates to a conviction or plea of nolo contendere described above), when done in good faith and with a reasonable belief after reasonable investigation that such action or non-action was in the best interest of Williams or its affiliate or required by law shall not be Cause if the NEO cures the action or non-action within ten days of notice. Furthermore, no act or failure to act will be Cause if the NEO acted under the advice of Williams’ counsel or required by the legal process.
“Change in control” means:
|
•
|
Any person or group (other than an affiliate of Williams or an employee benefit plan sponsored by Williams or its affiliates) becomes a beneficial owner, as such term is defined under the Exchange Act, of 20 percent or more of the Company’s common stock or 20 percent or more of the combined voting power of all securities
|
199
entitled to vote generally in the election of directors (Voting Securities), unless such person owned both more than 75 percent of common stock and Voting Securities, directly or indirectly, in substantially the same proportion immediately before such acquisition;
|
•
|
The Williams directors as of a date of the agreement (Existing Directors) and directors approved after that date by at least two-thirds of the Existing Directors cease to constitute a majority of the directors of Williams;
|
|
•
|
Consummation of any merger, reorganization, recapitalization consolidation, or similar transaction (Reorganization Transaction), other than a Reorganization Transaction that results in the person who was the direct or indirect owner of outstanding common stock and Voting Securities of the Company prior to the transaction becoming, immediately after the transaction, the owner of at least 65 percent of the then outstanding common stock and Voting Securities representing 65 percent of the combined voting power of the then outstanding Voting Securities of the surviving corporation in substantially the same respective proportion as that person’s ownership immediately before such Reorganization Transaction; or
|
|
•
|
Approval by the stockholders of Williams of the sale or other disposition of all or substantially all of the consolidated assets of Williams or the complete liquidation of Williams other than a transaction that would result in (i) a related party owning more than 50 percent of the assets that were owned by Williams immediately prior to the transaction or (ii) the persons who were the direct or indirect owners of outstanding Williams common stock and Voting Securities prior to the transaction continuing to own, directly or indirectly, 50 percent or more of the assets that were owned by Williams immediately prior to the transaction.
|
A change in control will not occur if:
|
•
|
The NEO agrees in writing prior to an event that such an event will not be a change in control; or
|
|
•
|
The Board determines that a liquidation, sale or other disposition approved by the stockholders, as described in the fourth bullet above, will not occur, except to the extent termination occurred prior to such determination.
|
“Disability” means a physical or mental infirmity that impairs the NEO’s ability to substantially perform his/her duties for twelve months or more and for which he is receiving income replacement benefits from a Company plan for not less than three months.
“Disqualification disaggregation” means:
|
•
|
The termination of an NEO from Williams or an affiliate’s employment before a change in control for any reason; or
|
|
•
|
The termination of an NEO’s employment by a successor (during the period beginning upon a change of control and continuing for two-years or until the termination of the agreement, whichever happens first), if the NEO is employed in substantially the same position and the successor has assumed the Williams change in control agreement.
|
“Good reason” means, generally, a material adverse change in the NEO’s title, position, or responsibilities, a reduction in the NEO’s base salary, a reduction in the NEO’s annual bonus, required relocation, a material reduction in the level of aggregate compensation or benefits not applicable to Company peers, a successor company’s failure to honor the agreement, or the failure of the Board to provide written notice of the act or omission constituting “cause.”
Termination Scenarios
The following table sets forth circumstances that provide for payments to the NEOs following or in connection with a change in control of the Company or an NEO’s termination of employment for cause, upon retirement, upon death and disability, or not for cause. NEOs are generally eligible to retire at the earlier of age 55 and completion of three years of service or age 65.
200
All values are based on a hypothetical termination date of December 31, 2015 and a WMB closing stock price of $25.70 on such date. Additionally, Mr. Purgason and Mr. Seldenrust also have outstanding WPZ shares. The closing stock price of WPZ on December 31, 2015 was $27.85. The values shown are intended to provide reasonable estimates of the potential benefits the NEOs would receive upon termination. The values are based on various assumptions and may not represent the actual amount an NEO would receive. In addition to the amounts disclosed in the following table, a departing NEO would retain the amounts he/she has earned over the course of his/her employment prior to the termination event, including accrued retirement benefits and previously vested stock options and restricted stock units.
|
Name
|
Payment
|
For
Cause (1)
|
Retirement
(2)
|
Death &
Disability (3)
|
Not for
Cause (4)
|
CIC (5)
|
||||||||||
|
Armstrong
|
Stock options
|
$
|
—
|
|
$
|
—
|
|
$
|
—
|
|
$
|
—
|
|
$
|
—
|
|
|
Stock awards
|
—
|
|
—
|
|
7,428,562
|
|
7,428,562
|
|
10,725,086
|
|
||||||
|
AIP
|
—
|
|
—
|
|
1,400,000
|
|
1,400,000
|
|
1,400,000
|
|
||||||
|
Cash Severance
|
—
|
|
—
|
|
—
|
|
—
|
|
7,560,000
|
|
||||||
|
Outplacement
|
—
|
|
—
|
|
—
|
|
—
|
|
25,000
|
|
||||||
|
Health & Welfare
|
—
|
|
—
|
|
—
|
|
—
|
|
25,772
|
|
||||||
|
Retirement Restoration Plan Enhancement
|
—
|
|
—
|
|
—
|
|
—
|
|
834,159
|
|
||||||
|
‘Best Net’ Provision
|
—
|
|
—
|
|
—
|
|
—
|
|
(944,470
|
)
|
||||||
|
Total
|
$
|
—
|
|
$
|
—
|
|
$
|
8,828,562
|
|
$
|
8,828,562
|
|
$
|
19,625,547
|
|
|
|
Chappel
|
Stock options
|
$
|
—
|
|
$
|
—
|
|
$
|
—
|
|
$
|
—
|
|
$
|
—
|
|
|
Stock awards
|
—
|
|
3,169,597
|
|
3,738,464
|
|
3,738,464
|
|
5,176,805
|
|
||||||
|
AIP
|
—
|
|
506,250
|
|
506,250
|
|
506,250
|
|
506,250
|
|
||||||
|
Cash Severance
|
—
|
|
—
|
|
—
|
|
—
|
|
3,543,750
|
|
||||||
|
Outplacement
|
—
|
|
—
|
|
—
|
|
—
|
|
25,000
|
|
||||||
|
Health & Welfare
|
—
|
|
—
|
|
—
|
|
—
|
|
17,863
|
|
||||||
|
Retirement Restoration Plan Enhancement
|
—
|
|
—
|
|
—
|
|
—
|
|
301,223
|
|
||||||
|
‘Best Net’ Provision
|
—
|
|
—
|
|
—
|
|
—
|
|
—
|
|
||||||
|
Total
|
$
|
—
|
|
$
|
3,675,847
|
|
$
|
4,244,714
|
|
$
|
4,244,714
|
|
$
|
9,570,891
|
|
|
|
Purgason
|
Stock options
|
$
|
—
|
|
$
|
—
|
|
$
|
—
|
|
$
|
—
|
|
$
|
—
|
|
|
Stock awards
|
—
|
|
1,743,889
|
|
3,453,575
|
|
3,453,575
|
|
4,122,452
|
|
||||||
|
AIP
|
—
|
|
385,000
|
|
385,000
|
|
385,000
|
|
385,000
|
|
||||||
|
Cash Severance
|
—
|
|
—
|
|
—
|
|
—
|
|
2,805,000
|
|
||||||
|
Outplacement
|
—
|
|
—
|
|
—
|
|
—
|
|
25,000
|
|
||||||
|
Health & Welfare
|
—
|
|
—
|
|
—
|
|
—
|
|
16,715
|
|
||||||
|
Retirement Restoration Plan Enhancement
|
—
|
|
—
|
|
—
|
|
—
|
|
149,397
|
|
||||||
|
‘Best Net’ Provision
|
—
|
|
—
|
|
—
|
|
—
|
|
—
|
|
||||||
|
Total
|
$
|
—
|
|
$
|
2,128,889
|
|
$
|
3,838,575
|
|
$
|
3,838,575
|
|
$
|
7,503,564
|
|
|
|
Seldenrust
|
Stock options
|
$
|
—
|
|
$
|
—
|
|
$
|
—
|
|
$
|
—
|
|
$
|
—
|
|
|
Stock awards
|
—
|
|
—
|
|
2,870,328
|
|
2,870,328
|
|
3,159,916
|
|
||||||
|
AIP
|
—
|
|
—
|
|
332,500
|
|
332,500
|
|
332,500
|
|
||||||
|
Cash Severance
|
—
|
|
—
|
|
—
|
|
—
|
|
2,422,500
|
|
||||||
|
Outplacement
|
—
|
|
—
|
|
—
|
|
—
|
|
25,000
|
|
||||||
|
Health & Welfare
|
—
|
|
—
|
|
—
|
|
—
|
|
24,139
|
|
||||||
|
Retirement Restoration Plan Enhancement
|
—
|
|
—
|
|
—
|
|
—
|
|
74,876
|
|
||||||
|
E&C Special Incentive
|
—
|
|
—
|
|
—
|
|
—
|
|
500,000
|
|
||||||
|
‘Best Net’ Provision
|
—
|
|
—
|
|
—
|
|
—
|
|
—
|
|
||||||
|
Total
|
$
|
—
|
|
$
|
—
|
|
$
|
3,202,828
|
|
$
|
3,202,828
|
|
$
|
6,538,931
|
|
|
|
Miller
|
Stock options
|
$
|
—
|
|
$
|
—
|
|
$
|
—
|
|
$
|
—
|
|
$
|
—
|
|
|
Stock awards
|
—
|
|
1,809,670
|
|
2,197,765
|
|
2,197,765
|
|
3,034,767
|
|
||||||
|
AIP
|
—
|
|
343,000
|
|
343,000
|
|
343,000
|
|
343,000
|
|
||||||
|
Cash Severance
|
—
|
|
—
|
|
—
|
|
—
|
|
2,499,000
|
|
||||||
|
Outplacement
|
—
|
|
—
|
|
—
|
|
—
|
|
25,000
|
|
||||||
|
Health & Welfare
|
—
|
|
—
|
|
—
|
|
—
|
|
25,772
|
|
||||||
|
Retirement Restoration Plan Enhancement
|
—
|
|
—
|
|
—
|
|
—
|
|
204,905
|
|
||||||
|
‘Best Net’ Provision
|
—
|
|
—
|
|
—
|
|
—
|
|
—
|
|
||||||
|
Total
|
$
|
—
|
|
$
|
2,152,670
|
|
$
|
2,540,765
|
|
$
|
2,540,765
|
|
$
|
6,132,444
|
|
|
___________
|
(1)
|
If an NEO is terminated for cause or leaves the company voluntarily, no additional benefits will be received.
|
201
|
(2)
|
Mr. Chappel, Mr. Purgason, and Mr. Miller are the only NEOs eligible to retire as of December 31, 2015. If an NEO retires, then the annual cash incentive for the year of separation is pro-rated to the retirement date and is paid when all active employees’ annual cash incentives are paid after the company performance is certified. All unvested stock options will fully accelerate. A pro-rated portion of the unvested time based restricted stock units will accelerate and a pro-rated portion of any performance-based and leveraged restricted stock units will vest on the original vesting date if the Compensation Committee certifies that the performance measures were met. The annual cash incentive award estimates, as of December 31, 2015, are shown at target.
|
|
(3)
|
If an NEO dies or becomes disabled, then the annual cash incentive for the year of separation is pro-rated through the separation or leave date and is paid when all active employees’ annual cash incentives are paid after the company performance is certified. All unvested stock options will fully accelerate. All unvested time-based restricted stock units will fully accelerate, and a pro-rated portion of any performance-based and leveraged restricted stock units will vest if the Compensation Committee certifies that the performance measures were met. The annual cash incentive award estimates, as of December 31, 2015, are shown at target.
|
|
(4)
|
For an NEO who is involuntarily terminated and who receives severance or for an NEO whose termination is due to the sale of a business or outsourcing any portion of a business and for whom no comparable internal offer of employment is made, all unvested time-based restricted stock units will fully accelerate and a pro-rated portion of any performance-based and leveraged restricted stock units will vest if the Compensation Committee certifies that the performance measures were met. However all unvested stock options cancel. If this separation occurs during the last quarter of the fiscal year, the annual cash incentive for the year of separation is pro-rated through the separation or leave date and is paid when all active employees’ annual cash incentives are paid after the company performance is certified. The annual cash incentive award estimates, as of December 31, 2015, are shown at target.
|
|
(5)
|
See “Change in Control Agreements” above.
|
Please note that we make no assumptions as to the achievement of performance goals as it relates to the performance-based RSUs. If an award is covered by Section 409A of the Internal Revenue Code, lump sum payments and distributions occurring from these events will occur six months after the triggering event as required by the Internal Revenue Code and our award agreements.
Compensation of Directors
Only non-employee directors receive director fees. In 2015, the Company paid non-employee directors:
|
•
|
$110,000 annual retainer paid in quarterly cash payments;
|
|
•
|
$140,000 annual equity retainer in the form of RSUs which will vest after one-year and are subject to 60 percent retention until the director meets the five-times annual retainer stock ownership guidelines;
|
|
•
|
$20,000 annual retainer paid in quarterly cash payments for Committee Chairs (Audit, Compensation, Finance, Nominating and Governance Committees, and Safety);
|
|
•
|
$200,000 annual retainer paid in quarterly cash payments for the Strategic Review Administrative Committee Chair and $100,000 annual retainer paid in quarterly cash payments for members of the Strategic Review Administrative Committee;
|
|
•
|
$190,000 annual retainer paid in quarterly cash payments and $160,000 annual equity retainer in the form of RSUs which will vest after one-year and are subject to 60 percent retention as noted above for the non-employee Chairman of the Board.
|
A special Strategic Review Administrative Committee was established on June 20, 2015 to assist with the strategic alternatives process.
The annual cash retainers paid to the non-employee directors are made through quarterly cash payments. Through The Williams Companies, Inc. Amended and Restated 2007 Incentive Plan, the annual equity retainer vests after one
202
year and is subject to 60 percent retention if the non-employee director has not satisfied the stock ownership guidelines as approved by the Compensation Committee. Paying dividend equivalents on annual non-employee director equity grants was also approved in 2012. Dividend equivalents will be paid in the form of cash after the one-year vesting term. Beginning in 2013, non-employee directors have the option to defer their annual equity grants until retirement. If the director elects not to defer, shares will be distributed at the scheduled vesting date and dividends will be paid in the form of cash. If the director elects to defer vested shares until retirement, the dividends will be reinvested until such date.
Non-employee directors generally receive their compensation on the date of the annual stockholders meeting. The following table shows how compensation is paid to individuals who become non-employee directors after the annual meeting.
|
An individual who became a non-employee director…
|
…but before…
|
…will receive…
|
…as of…
|
|||
|
After the annual meeting
|
August 1
|
Full compensation
|
December 15
|
|||
|
On or after August 1
|
or on December 15
|
Pro-rated compensation
|
December 15
|
|||
|
On or after December 16
|
the next annual meeting
|
Pro-rated compensation
|
The next annual meeting date
|
|||
Non-employee directors are reimbursed for expenses (including costs of travel, food, and lodging) incurred in attending Board, committee, and stockholder meetings. Directors are also reimbursed for reasonable expenses associated with other business activities, including participation in director education programs. In addition, Williams pays premiums on directors’ and officers’ liability insurance policies.
Like all Williams employees, directors are eligible to participate in the Williams Matching Grant Program for eligible charitable organizations and the United Way Program. The maximum matching contribution in any calendar year is $10,000 for a participant in the Matching Grant Program and $25,000 for a participant in the United Way Program. No match is made to the United Way under the Matching Grant Program unless the giving relates to a natural disaster or is applied to the funding of a capital campaign at a United Way funded agency.
As referenced previously, we entered into an agreement with the Investor Group pursuant to which Mr. Mandelblatt was appointed to our Board in February 2014 and Mr. Meister joined the Board in November 2014. Under the terms of the agreement, Mr. Mandelblatt and Mr. Meister will not receive any form of cash or equity compensation, for their service on our Board.
203
Director Compensation for Fiscal Year 2015
The compensation earned by each director for 2015 service is outlined in the following table:
|
Name
|
Fees
Earned
or Paid
in Cash (1)
|
Fees
Earned
or Paid
in Stock (2)
|
Option
Awards
|
Non-Equity
Incentive Plan
Compensation
|
Change in
Pension
Value and
Nonqualified
Deferred
Compensation
Earnings
|
All Other
Compensation
(3)
|
Total
|
||||||||||||||
|
Joseph R. Cleveland
|
$
|
110,000
|
|
$
|
140,051
|
|
$
|
—
|
|
$
|
—
|
|
$
|
—
|
|
$
|
—
|
|
$
|
250,051
|
|
|
Kathleen B. Cooper
|
130,000
|
|
140,051
|
|
—
|
|
—
|
|
—
|
|
10,500
|
|
280,551
|
|
|||||||
|
John A. Hagg
|
110,000
|
|
140,051
|
|
—
|
|
—
|
|
—
|
|
—
|
|
250,051
|
|
|||||||
|
Juanita H. Hinshaw
|
130,000
|
|
140,051
|
|
—
|
|
—
|
|
—
|
|
—
|
|
270,051
|
|
|||||||
|
Ralph Izzo
|
110,000
|
|
140,051
|
|
—
|
|
—
|
|
—
|
|
1,000
|
|
251,051
|
|
|||||||
|
Frank T. MacInnis
|
320,000
|
|
300,018
|
|
—
|
|
—
|
|
—
|
|
10,000
|
|
630,018
|
|
|||||||
|
Eric W. Mandelblatt (4)
|
—
|
|
—
|
|
—
|
|
—
|
|
—
|
|
—
|
|
—
|
|
|||||||
|
Keith A. Meister (4)
|
—
|
|
—
|
|
—
|
|
—
|
|
—
|
|
—
|
|
—
|
|
|||||||
|
Steven W. Nance (5)
|
180,000
|
|
140,051
|
|
—
|
|
—
|
|
—
|
|
6,435
|
|
326,486
|
|
|||||||
|
Murray D. Smith
|
110,000
|
|
140,051
|
|
—
|
|
—
|
|
—
|
|
—
|
|
250,051
|
|
|||||||
|
Janice D. Stoney (5)
|
180,000
|
|
140,051
|
|
—
|
|
—
|
|
—
|
|
10,000
|
|
330,051
|
|
|||||||
|
Laura A. Sugg (5)
|
210,000
|
|
140,051
|
|
—
|
|
—
|
|
—
|
|
1,000
|
|
351,051
|
|
|||||||
___________
|
(1)
|
The fees paid in cash are itemized in the following chart:
|
|
Cash Retainers
|
|||||||||||||||||||||||||||
|
Name
|
Annual Cash Retainer Including Service on Two Committees
|
Audit Committee Chair Retainer
|
Compensation Committee Chair Retainer
|
Nominating & Governance Committee Chair Retainer
|
Finance Committee Chair Retainer
|
Safety Committee Chair Retainer
|
Special Strategic Alternatives Review Committee
Retainer
|
Non-employee Chairman of the Board Retainer
|
Total
|
||||||||||||||||||
|
Cleveland
|
$
|
110,000
|
|
$
|
—
|
|
$
|
—
|
|
$
|
—
|
|
$
|
—
|
|
$
|
—
|
|
$
|
—
|
|
$
|
—
|
|
$
|
110,000
|
|
|
Cooper
|
110,000
|
|
20,000
|
|
—
|
|
—
|
|
—
|
|
—
|
|
—
|
|
—
|
|
130,000
|
|
|||||||||
|
Hagg
|
110,000
|
|
—
|
|
—
|
|
—
|
|
—
|
|
—
|
|
—
|
|
—
|
|
110,000
|
|
|||||||||
|
Hinshaw
|
110,000
|
|
—
|
|
—
|
|
—
|
|
20,000
|
|
—
|
|
—
|
|
—
|
|
130,000
|
|
|||||||||
|
Izzo
|
110,000
|
|
—
|
|
—
|
|
—
|
|
—
|
|
—
|
|
—
|
|
—
|
|
110,000
|
|
|||||||||
|
MacInnis
|
110,000
|
|
—
|
|
—
|
|
20,000
|
|
—
|
|
—
|
|
—
|
|
190,000
|
|
320,000
|
|
|||||||||
|
Mandelblatt (4)
|
—
|
|
—
|
|
—
|
|
—
|
|
—
|
|
—
|
|
—
|
|
—
|
|
—
|
|
|||||||||
|
Meister (4)
|
—
|
|
—
|
|
—
|
|
—
|
|
—
|
|
—
|
|
—
|
|
—
|
|
—
|
|
|||||||||
|
Nance (5)
|
110,000
|
|
—
|
|
—
|
|
—
|
|
—
|
|
20,000
|
|
50,000
|
|
—
|
|
180,000
|
|
|||||||||
|
Smith
|
110,000
|
|
—
|
|
—
|
|
—
|
|
—
|
|
—
|
|
—
|
|
—
|
|
110,000
|
|
|||||||||
|
Stoney (5)
|
110,000
|
|
—
|
|
20,000
|
|
—
|
|
—
|
|
—
|
|
50,000
|
|
—
|
|
180,000
|
|
|||||||||
|
Sugg (5)
|
110,000
|
|
—
|
|
—
|
|
—
|
|
—
|
|
—
|
|
100,000
|
|
—
|
|
210,000
|
|
|||||||||
___________
|
(2)
|
Awards were granted under the terms of the 2007 Incentive Plan and represent time-based RSUs. Amounts shown are the grant date fair value of awards computed in accordance with FASB ASC Topic 718. The assumptions used to value the stock awards can be found in this Form 10-K for the year-ended December 31, 2015.
|
|
(3)
|
All other compensation includes matching contributions paid in 2015 made on behalf of the Board to charitable organizations through the Matching Grants Program or the United Way Program. It is possible for Directors to make contributions at the end of the year that are not matched by the Company until the following year. Dr. Cooper, Mr. Izzo, Mr. MacInnis, Mr. Nance, and Ms. Sugg made 2015 contributions through the Matching Grants Program or the United Way Program at the end of the year that will be matched by the Company in early 2016.
|
204
|
(4)
|
Under the terms of their agreements, Mr. Mandelblatt and Mr. Meister will not receive any form of cash or equity compensation for their service on our Board. They are eligible to participate in the Matching Grants Program or the United Way Program as previously described.
|
|
(5)
|
Mr. Nance, Ms. Stoney, and Ms. Sugg were appointed to a new Strategic Alternatives Review Committee in 2015. Ms. Sugg served as Chair of the Committee. Mr. Nance, Ms. Stoney, and Ms. Sugg were compensated $25,000, $25,000 and $50,000 for each quarter served on the Committee.
|
Outstanding Awards as of Fiscal Year End 2015
The aggregate number of stock options and stock awards held by directors outstanding at December 31, 2015 is as follows:
|
Name
|
Number of Shares or Units of Stock Outstanding
|
Number of Securities Underlying Unexercised Options Exercisable
|
||||
|
Joseph R. Cleveland
|
10,252
|
|
—
|
|
||
|
Kathleen B. Cooper
|
2,637
|
|
5,527
|
|
||
|
John A. Hagg
|
10,252
|
|
—
|
|
||
|
Juanita H. Hinshaw
|
2,637
|
|
7,370
|
|
||
|
Ralph Izzo
|
11,334
|
|
—
|
|
||
|
Frank T. MacInnis
|
14,911
|
|
7,370
|
|
||
|
Eric W. Mandelblatt
|
—
|
|
—
|
|
||
|
Keith A. Meister
|
—
|
|
—
|
|
||
|
Steven W. Nance
|
10,252
|
|
—
|
|
||
|
Murray D. Smith
|
10,252
|
|
—
|
|
||
|
Janice D. Stoney
|
31,845
|
|
—
|
|
||
|
Laura A. Sugg
|
6,960
|
|
—
|
|
||
Item 12.
Security Ownership of Certain Beneficial Owners and Management and Related Stockholder Matters
The following table sets forth information concerning beneficial ownership by holders of five percent or more of our common stock. Unless otherwise indicated, the persons named have sole voting and investment power with respect to the shares listed.
|
Name
|
Number of Shares of Common Stock
|
Percent of Class (5)
|
|||
|
BlackRock, Inc. (1)
|
39,077,588
|
|
5.20%
|
||
|
Corvex Management LP/Soroban Master Fund LP (2)
|
62,682,960
|
|
8.38%
|
||
|
Lone Pine Capital LLC (3)
|
41,966,355
|
|
5.60%
|
||
|
The Vanguard Group (4)
|
43,934,329
|
|
5.85%
|
||
___________
|
(1)
|
According to a Schedule 13G filed with the SEC on February 9, 2016, BlackRock, Inc., a Delaware corporation may beneficially own the shares of common stock listed in the table above. The 13G indicates that BlackRock, Inc. may have sole voting power over 32,801,001 shares of our common stock and sole dispositive power over 39,077,588 shares of our common stock. The address of BlackRock, Inc. is 55 East 52
nd
Street, New York, New York, 10055.
|
|
(2)
|
According to a Schedule 13D filed with the SEC on December 16, 2013, as amended on January 13, 2014, February 4, 2014, February 5, 2014, February 14, 2014, February 25, 2014, and November 19, 2014 (as amended, the “13D”), the shares of common stock listed in the table represent the aggregate number of shares that may be beneficially owned by the following (collectively, the “Reporting Persons”): (a) Corvex Management LP, a Delaware limited partnership (“Corvex”), (b) Keith A. Meister, (collectively with Corvex, the “Corvex Persons”), (c) Soroban Master Fund LP, a Cayman Islands exempted limited partnership (“SMF Fund”), (d) Soroban Capital
|
205
GP LLC, a Delaware limited liability company (“SCGP LLC”), (e) Soroban Capital Partners LP, a Delaware limited partnership (“SCP LP”), and (f) Eric W. Mandelblatt (collectively with SMF Fund, SCGP LLC and SCP LP, the “Soroban Persons”). The foregoing entities and persons jointly filed the 13D, indicating that they may constitute a “group” within the meaning of Section 13 of the Exchange Act. The 13D further reports an agreement between Corvex and SCP LP relating to taking certain actions with respect to us. The 13D indicates that Corvex may be the beneficial owner of and have sole voting and dispositive power over 41,682,960 shares of our common stock held for the account of certain private investment funds for which Corvex acts as investment advisor. The 13D also notes that Mr. Meister, by virtue of his position as control person of the general partner of Corvex, may be considered to beneficially own such shares. The 13D indicates that the Soroban Persons may be the beneficial owner of and have shared voting and dispositive power over 21,000,000 shares of our common stock held for the account of SMF Fund, a private investment fund for which SCP LP acts as investment manager. SCGP LLC is the general partner of SMF Fund and is controlled by Mr. Mandelblatt through his role as Managing Partner of SCGP LLC. SCP LP is controlled by Mr. Mandelblatt through his role as Managing Partner of SCP LP. The principal business address of the Corvex Persons is 712 Fifth Avenue, 23
rd
Floor, New York, New York 10019. The principal business address of SMF Fund is Gardenia Court, Suite 3307, 45 Market Street, Camana Bay, Grand Cayman KY1-1103, Cayman Islands and the principal business address of SCP LP, SCGP LLC and Mr. Mandelblatt is 444 Madison Avenue, 21
st
Floor, New York, New York, 10022.
|
(3)
|
According to a Schedule 13G filed with the SEC on November 30, 2015, Lone Pine Capital LLC, a Delaware limited liability company (“Lone Pine Capital”), which serves as an investment manager to Lone Spruce, L.P., a Delaware limited partnership (“Lone Spruce”), Lone Cascade, L.P., a Delaware limited partnership (“Lone Cascade”), Lone Sierra, L.P., a Delaware limited partnership (“Lone Sierra”), Lone Tamarack, L.P., a Delaware limited partnership (“Lone Tamarack”), Lone Cypress, Ltd., a Cayman Islands exempted company (“Lone Cypress”), Lone Kauri, Ltd., a Cayman Islands exempted company (“Lone Kauri”), Lone Monterey Master Fund, Ltd., a Cayman Islands exempted company (“Lone Monterey Master Fund”), and Lone Savin Master Fund Ltd., a Cayman Islands exempted company (“Lone Savin Master Fund”)( and together with Lone Spruce, Lone Cascade, Lone Sierra, Lone Tamarack, Lone Cypress, Lone Kauri, Lone Monterey Master Fund and Lone Savin Master Fund, the “Lone Pine Funds”), with respect to the Common Stock directly held by each of the Lone Pine Funds; and Stephen F. Mandel, Jr. (“Mr. Mandel”), the managing member of Lone Pine Managing Member LLC, which is the Managing Member of Lone Pine Capital , with respect to the Common Stock directly held by each of the Lone Pine Funds, may beneficially own the shares of common stock listed in the table above. The Lone Pine Capital 13-G indicates that Lone Tree Capital may have shared voting power over 41,966,355 shares of our common stock and shared dispositive power over 41,966,355 shares of our common stock. The foregoing persons are hereinafter sometimes collectively referred to as the “Reporting Persons”. Any disclosures herein with respect to persons other than the Reporting Persons are made on information belief after making inquiry to the appropriate party. The address of each of the Reporting Persons is Two Greenwich Plaza, Greenwich, Connecticut 06830.
|
|
(4)
|
According to a Schedule 13G filed with the SEC on February 12, 2014, as amended on February 10, 2015 and February 10, 2016 (as amended, the “Vanguard 13G”), The Vanguard Group, an investment advisor, may beneficially own the shares of common stock listed in the table above. The Vanguard 13G indicates that The Vanguard Group may have sole voting power over 1,353,754 shares of our common stock, sole dispositive power over 42,561,560 shares of our common stock, and shared dispositive power over 1,372,769 shares of our common stock. The address of The Vanguard Group is 100 Vanguard Boulevard, Malvern, Pennsylvania, 19355.
|
|
(5)
|
Ownership percentage is reported based on 750,064,908 shares of common stock outstanding on February 16, 2016.
|
206
The following table sets forth, as of February 16, 2016, the number of shares of our common stock beneficially owned by each of our directors and nominees for directors, by the NEOs, and by all directors and executive officers as a group.
|
Name of Individual or Group
|
Shares of Williams Common Stock Owned Directly or Indirectly
|
Williams Shares Underlying Stock Options (1)
|
Williams Shares Underlying RSUs (2)
|
Total
|
Percent of Class (3)
|
|||||||||
|
Alan S. Armstrong (4)
|
312,940
|
|
797,452
|
|
38,497
|
|
1,148,889
|
|
*
|
|||||
|
Donald R. Chappel
|
292,659
|
|
725,818
|
|
46,376
|
|
1,064,853
|
|
*
|
|||||
|
Joseph R. Cleveland (5)
|
30,543
|
|
—
|
|
10,252
|
|
40,795
|
|
*
|
|||||
|
Kathleen B. Cooper
|
33,308
|
|
5,527
|
|
2,637
|
|
41,472
|
|
*
|
|||||
|
John A. Hagg
|
13,848
|
|
—
|
|
10,252
|
|
24,100
|
|
*
|
|||||
|
Juanita H. Hinshaw
|
57,527
|
|
7,370
|
|
2,637
|
|
67,534
|
|
*
|
|||||
|
Ralph Izzo
|
—
|
|
—
|
|
11,334
|
|
11,334
|
|
*
|
|||||
|
Frank T. MacInnis
|
129,204
|
|
7,370
|
|
14,911
|
|
151,485
|
|
*
|
|||||
|
Eric W. Mandelblatt (6)
|
21,000,000
|
|
—
|
|
—
|
|
21,000,000
|
|
2.8%
|
|||||
|
Rory L. Miller
|
104,948
|
|
213,688
|
|
27,485
|
|
346,121
|
|
*
|
|||||
|
Keith A. Meister (6)
|
41,682,960
|
|
—
|
|
—
|
|
41,682,960
|
|
5.56%
|
|||||
|
Steven W. Nance
|
6,309
|
|
—
|
|
10,252
|
|
16,561
|
|
*
|
|||||
|
Robert S. Purgason
|
—
|
|
53,279
|
|
5,539
|
|
58,818
|
|
*
|
|||||
|
John D. Seldenrust
|
—
|
|
4,126
|
|
—
|
|
4,126
|
|
*
|
|||||
|
Murray D. Smith (7)
|
19,998
|
|
—
|
|
10,252
|
|
30,250
|
|
*
|
|||||
|
Janice D. Stoney (8)
|
69,073
|
|
—
|
|
31,845
|
|
100,918
|
|
*
|
|||||
|
Laura A. Sugg
|
16,410
|
|
—
|
|
6,960
|
|
23,370
|
|
*
|
|||||
|
All directors and executive officers as a group (26 persons)
|
63,975,094
|
|
2,659,204
|
|
370,620
|
|
67,004,918
|
|
8.93%
|
|||||
___________
* Less than 1 percent
|
(1)
|
The SEC deems a person to have beneficial ownership of all shares that the person has the right to acquire within 60 days. Amounts reflect shares that may be acquired upon the exercise of stock options granted under Williams’ current or previous equity plans that are currently exercisable, will become exercisable, or would become exercisable upon the voluntary retirement of such person, within 60 days of February 16, 2016.
|
|
(2)
|
The SEC deems a person to have beneficial ownership of all shares that the person has the right to acquire within 60 days. Amounts reflect shares that would be acquired upon the vesting of restricted stock units (“RSUs”) granted under Williams current or previous equity plans that will vest or that would vest upon the voluntary retirement of such person, within 60 days of February 16, 2016. RSUs have no voting or investment power.
|
|
(3)
|
Ownership percentage is reported based on 750,064,908 shares of common stock outstanding on February 16, 2016, plus, as to the holder thereof only and no other person, the number of shares (if any) that the person has the right to acquire as of February 16, 2016, or within 60 days from that date, through the exercise of all options and other rights.
|
|
(4)
|
Includes 34,264 shares held in the Alan and Shelly S. Armstrong Family Foundation dated December 16, 2015, Alan S. and Shelly S. Armstrong, Trustees.
|
|
(5)
|
Includes 3,047 shares held in the Joe R. Cleveland Family Trust dated November 21, 2008, Joe R. and Evelyn Cleveland, Trustees.
|
207
|
(6)
|
Please see the table above setting forth information concerning beneficial ownership by holders of five percent or more of our common stock for information about Messrs. Mandelblatt’s and Meister’s beneficial holdings of our shares.
|
|
(7)
|
Includes 10,150 shares held by Murray D. Smith and Associates Limited.
|
|
(8)
|
Includes 65,073 shares held in the Larry and Janice Stoney Family Trust dated March 25, 2008, Larry D. & Janice D. Stoney, Trustees.
|
The following table sets forth, as of February 16, 2016, the number of common units of Williams Partners L.P. beneficially owned by each of our directors and nominees for directors, by the NEOs, and by all directors and executive officers as a group. None of the persons in the table below own any Class B Convertible Units of Williams Partners L.P.
|
Name of Individual or Group
|
Williams Partners Common Units Owned Directly or Indirectly
|
Percent of Class (1)
|
|||
|
Alan S. Armstrong (2)
|
32,334
|
|
*
|
||
|
Donald R. Chappel
|
19,574
|
|
*
|
||
|
Joseph R. Cleveland (3)
|
1,733
|
|
*
|
||
|
Kathleen B. Cooper
|
—
|
|
*
|
||
|
John A. Hagg
|
—
|
|
*
|
||
|
Juanita H. Hinshaw
|
2,492
|
|
*
|
||
|
Ralph Izzo
|
—
|
|
*
|
||
|
Frank T. MacInnis
|
7,620
|
|
*
|
||
|
Eric W. Mandelblatt
|
—
|
|
*
|
||
|
Keith A. Meister
|
—
|
|
*
|
||
|
Rory L. Miller
|
1,752
|
|
*
|
||
|
Steven W. Nance
|
—
|
|
*
|
||
|
Robert S. Purgason
|
29,726
|
|
*
|
||
|
John D. Seldenrust
|
1,262
|
|
*
|
||
|
Murray D. Smith
|
—
|
|
*
|
||
|
Janice D. Stoney (4)
|
7,620
|
|
*
|
||
|
Laura A. Sugg
|
—
|
|
*
|
||
|
All directors and executive officers as a group (26 persons)
|
113,667
|
|
*
|
||
___________
* Less than 1 percent
|
(1)
|
Ownership percentage is reported based on 588,565,174 common units, which is the number of common units outstanding on February 16, 2016 less the number of common units owned by a subsidiary of the Company on such date.
|
|
(2)
|
23,667 units are held in the Alan Stuart Armstrong Trust dated June 16, 2010, with Alan Armstrong as trustee, and 8,667 units are held in the Shelly Stone Armstrong Trust dated June 16, 2010, with Shelly Armstrong as trustee.
|
|
(3)
|
Units are held in the Joe R. Cleveland Family Trust dated November 21, 2008, Joe R. and Evelyn Cleveland, Trustees.
|
|
(4)
|
Units are held in the Larry and Janice Stoney Family Trust dated March 25, 2008, Larry D. and Janice D. Stoney, Trustees.
|
208
Item 13.
Certain Relationships and Related Transactions, and Director Independence
Transactions with Related Persons
The Board has adopted policies and procedures with respect to related person transactions. Any proposed related person transaction involving a member of the Board must be reviewed and approved by the full Board. The Audit Committee reviews proposed transactions with any other related persons, promoters, and certain control persons that are required to be disclosed in our filings with the SEC. If it is impractical to convene an Audit Committee meeting before a related person transaction occurs, the Chair of the committee may review the transaction alone.
No director may participate in any review, consideration or approval of any related person transaction with respect to which such director or any of his or her immediate family members is the related person. The Audit Committee or its Chair, or the Board, as the case may be, in good faith, may approve only those related person transactions that are in, or not inconsistent with, Williams’ best interests and the best interests of our stockholders. In conducting a review of whether a transaction is in, or is not inconsistent with the best interest of Williams and its stockholders, the Audit Committee or its chair, or the Board, as the case may be, will consider the benefits of the transaction to the Company, the availability of other sources for comparable products or services, the terms of the transaction, the terms available to unrelated third parties and to employees generally, and the nature of the relationship between the Company and the related party, among other things. During 2015 there were no transactions that required review or approval by the Audit Committee or the full Board.
Director Independence
Our Corporate Governance Guidelines require that the Board make an annual determination regarding the independence of each of our directors. The Board made these determinations in February, 2016, based on an annual evaluation.
The Board has affirmatively determined that each of Mr. Cleveland, Dr. Cooper, Mr. Hagg, Ms. Hinshaw, Mr. Izzo, Mr. MacInnis, Mr. Mandelblatt, Mr. Meister, Mr. Nance, Mr. Smith, Ms. Stoney, and Ms. Sugg is an independent director. In so doing, the Board determined that each of these individuals met the “bright line” independence standards of the NYSE. In addition, the Board considered the following transactions and relationships between each director and any member of his or her immediate family on one hand, and Williams and its affiliates on the other, to confirm that those transactions and relationships do not vitiate the affected director’s independence. We discuss these relationships below.
|
•
|
Ms. Hinshaw is a director of Aegion Corporation (“Aegion”), which provided ordinary course pipeline construction and maintenance services to Williams. In determining that the relationship was not material, the Board considered these facts: the relationship arises only because Ms. Hinshaw is a director of Aegion; she has no material interest in any transactions between Aegion and Williams; and she had no role in any such transactions.
|
|
•
|
Mr. Izzo is Chief Executive Officer of Public Service Energy Group (“PSEG”), for whom Williams has provided ordinary course transportation services since at least 2010. In determining that the relationship was not material, the Board considered these facts: payments made by PSEG to Williams in any of the last three fiscal years are less than 2 percent of PSEG’s revenue for the respective year; Mr. Izzo has no material interest in any transactions between PSEG and Williams; and he had no role in any such transactions.
|
|
•
|
Mr. MacInnis is a director of ITT Corporation (“ITT”), for whom Williams’ subsidiaries provide ordinary course offshore/midstream project services. In determining that the relationship was not material, the Board considered these facts: the relationship arises only because Mr. MacInnis is a director of ITT; he has no material interest in any transactions between ITT and Williams; and he had no role in any such transactions.
|
209
|
•
|
Mr. Nance is a director of Newfield Exploration Company (“Newfield”), for whom Williams provided ordinary course midstream and transportation services. In determining that the relationship was not material, the Board considered these facts: the relationship arises only because Mr. Nance is a director of Newfield; he has no material interest in any transactions between Newfield and Williams; and he had no role in any such transactions.
|
|
•
|
Ms. Sugg is a director of Denbury Resources, Inc. (“Denbury”), from whom Williams purchased gas for fuel and shrink and for whom Williams provided midstream and transportation services in the ordinary course of business. In determining that the relationship was not material, the Board considered these facts: the relationship arises only because Ms. Sugg is a director of Denbury; she has no material interest in any transactions between Denbury and Williams; and she had no role in any such transactions. Ms. Sugg is also a director of Murphy Oil Corporation (“Murphy”), for whom Williams’ subsidiaries provide ordinary course midstream and transportation services. In determining that the relationship was not material, the Board considered these facts: the relationship arises only because Ms. Sugg is a director of Murphy; she has no material interest in any transactions between Murphy and Williams; and she had no role in any such transactions.
|
No member of our Board serves as an executive officer of any non-profit organization that has received contributions from Williams exceeding the greater of $1 million or 2 percent of such organization’s consolidated gross revenues in any single fiscal year of the preceding three years. Further, in accordance with our director independence standards, the Board determined that there were no discretionary contributions to a non-profit organization with which a director, or a director’s spouse, has a relationship that affects the director’s independence.
Mr. Armstrong, the current Chief Executive Officer and President and a director, is not independent, because of his role as an executive officer of the Company.
Item 14.
Principal Accountant Fees and Services
Fees for professional services provided by Ernst & Young LLP (“EY”), our independent auditors, for each of the last two fiscal years were as follows:
|
2015
|
2014
|
||||||
|
(Millions)
|
|||||||
|
Audit Fees
|
$
|
9.0
|
|
$
|
9.7
|
|
|
|
Audit-Related Fees
|
1.2
|
|
0.7
|
|
|||
|
Tax Fees
|
1.2
|
|
0.2
|
|
|||
|
All Other Fees
|
—
|
|
—
|
|
|||
|
$
|
11.4
|
|
$
|
10.6
|
|
||
Audit fees include fees associated with the annual audits of all of our registrants for SEC and Federal Energy Regulatory Commission reporting purposes, the reviews of our quarterly reports on Form 10-Q, the audit of internal controls as required by Section 404 of the Sarbanes-Oxley Act of 2002, and services performed in connection with other filings with the SEC. Audit-related fees include audits of employee benefit plans and services performed for other compliance purposes. Tax fees include tax planning, tax advice, and tax compliance. EY does not provide tax services to our executives. Fees in 2015 also include services performed related to the ACMP Merger and our evaluation of strategic alternatives.
Policy on Audit Committee Pre-Approval of Audit and Non-Audit Services of Independent Auditors
The Audit Committee is responsible for appointment, compensation, retention, and oversight of EY, our independent auditors. The Audit Committee is responsible for overseeing the determination of fees associated with EY’s audit of our financial statements. The Audit Committee has established a policy regarding pre-approval of all audit and non-audit services provided by EY.
210
On an ongoing basis, our management presents specific projects and categories of service to the Audit Committee to request advance approval. The Audit Committee reviews those requests and advises management if the Audit Committee approves the engagement of EY. On a periodic basis, our management reports to the Audit Committee regarding the actual spending for such projects and services compared to the approved amounts. The Audit Committee may also delegate the authority to pre-approve audit and permitted non-audit services, excluding services related to the Company’s internal control over financial reporting, to a subcommittee of one or more committee members, provided that any such pre-approvals are reported on at a subsequent Audit Committee meeting. In 2014 and 2015, 100 percent of EY’s services were pre-approved by the Audit Committee.
Change of Williams Partners’ Independent Registered Accounting Firm
Williams Partners (formerly known as Access Midstream Partners, L.P.) merged with Pre-merger Williams Partners in February 2015 and is a significant subsidiary of the Company. The Audit Committee of the Board of Directors of the general partner of Williams Partners dismissed PricewaterhouseCoopers LLP (“PwC”) as Williams Partners’ independent registered public accounting firm upon the filing of Williams Partners’ Quarterly Report on Form 10-Q for the quarter ended September 30, 2014. The Audit Committee approved the appointment of EY as Williams Partners’ independent registered public accounting firm for the fiscal year ended December 31, 2014.
PwC’s audit reports on Williams Partners’ consolidated financial statements for each of the two fiscal years ended December 31, 2013 and 2012 did not contain an adverse opinion or a disclaimer of opinion, and were not qualified or modified as to uncertainty, audit scope, or accounting principles. During the two fiscal years ended December 31, 2013 and 2012, and in the subsequent interim period through October 30, 2014, there were (i) no disagreements with PwC on any matter of accounting principles or practices, financial statement disclosure or auditing scope or procedure, which disagreement, if not resolved to the satisfaction of PwC, would have caused PwC to make reference to the subject matter of the disagreement in its reports on the consolidated financial statements for such years, and (ii) no “reportable events” within the meaning of Item 304(a)(1)(v) of the SEC’s Regulation S-K.
In connection with the audits of Williams Partners’ consolidated financial statements, during Williams Partners’ two fiscal years ended December 31, 2013 and 2012 and subsequent interim period through October 30, 2014, neither Williams Partners, its general partner, nor anyone on each of its behalf consulted with EY regarding (i) the application of accounting principles to a specified transaction, either completed or proposed, or the type of audit opinion that might be rendered on Williams Partners’ financial statements, and neither a written report nor oral advice was provided to Williams Partners or its general partner that EY concluded was an important factor considered by Williams Partners or its general partner in reaching a decision as to the accounting, auditing, or financial reporting issue; or (ii) any matter that was either the subject of a “disagreement” (as that term is defined in Item 304(a)(1)(iv) of Regulation S-K and the related instructions to Item 304 of Regulation S-K) or a “reportable event” (as that term is defined in Item 304(a)(1)(v) of Regulation S-K).
We previously reported this information in our Current Report on Form 8-K dated October 3, 2014, as amended on November 4, 2014.
211
Item 15.
Exhibits and Financial Statement Schedules
(a) 1 and 2.
|
Page
|
|
|
Covered by report of independent auditors:
|
|
|
Not covered by report of independent auditors:
|
|
All other schedules have been omitted since the required information is not present or is not present in amounts sufficient to require submission of the schedule, or because the information required is included in the financial statements and notes thereto.
(a) 3 and (b). The exhibits listed below are filed as part of this annual report.
INDEX TO EXHIBITS
|
Exhibit
No. |
Description
|
|
|
2.1+
|
—
|
Agreement and Plan of Merger dated as of May 12, 2015, by and among The Williams Companies, Inc., SCMS LLC, Williams Partners L.P., and WPZ GP LLC (filed on May 13, 2015 as Exhibit 2.1 to The Williams Companies, Inc.’s current report on Form 8-K (File No. 001-04174) and incorporated herein by reference).
|
|
2.2+
|
—
|
Agreement and Plan of Merger dated as of September 28, 2015, by and among The Williams Companies, Inc., Energy Transfer Corp LP, Energy Transfer Corp GP, LLC, Energy Transfer Equity, L.P., LE GP, LLC and Energy Transfer Equity GP, LLC (filed on October 1, 2015 as Exhibit 2.1 to The Williams Companies, Inc.’s current report on Form 8-K (File No. 001-04174) and incorporated herein by reference).
|
|
3.1
|
—
|
Amended and Restated Certificate of Incorporation, as supplemented (filed on May 26, 2010 as Exhibit 3.1 to The Williams Companies Inc.’s current report on Form 8-K (File No. 001-04174) and incorporated herein by reference).
|
|
3.2
|
—
|
By-Laws (filed on August 24, 2015 as Exhibit 3 to The Williams Companies Inc.’s current report on Form 8-K (File No. 001-04174) and incorporated herein by reference).
|
212
|
Exhibit
No. |
Description
|
|
|
4.1
|
—
|
Senior Indenture dated February 25, 1997, between MAPCO Inc. and Bank One Trust Company,
N.A. (formerly The First National Bank of Chicago), as Trustee (filed February 25, 1997 as Exhibit 4.5.1 to MAPCO Inc.’s Amendment No. l to registration statement on Form S-3 (File No. 333-20837) and incorporated herein by reference). |
|
4.2
|
—
|
Supplemental Indenture No. 1 dated March 5, 1997, between MAPCO Inc. and Bank One Trust Company, N.A. (formerly The First National Bank of Chicago), as Trustee (filed as Exhibit 4(o) to MAPCO Inc.’s annual report on Form 10-K for the fiscal year ended December 31, 1997 (File No. 001-05254) and incorporated herein by reference).
|
|
4.3
|
—
|
Supplemental Indenture No. 2 dated March 5, 1997, between MAPCO Inc. and Bank One Trust Company, N.A. (formerly The First National Bank of Chicago), as Trustee (filed as Exhibit 4(p) to MAPCO Inc.’s annual report on Form 10-K for the fiscal year ended December 31, 1997 (File No. 001-05254) and incorporated herein by reference).
|
|
4.4
|
—
|
Supplemental Indenture No. 3 dated March 31, 1998, among MAPCO Inc., Williams Holdings of Delaware, Inc. and Bank One Trust Company, N.A. (formerly The First National Bank of Chicago), as Trustee (filed as Exhibit 4(J) to Williams Holdings of Delaware, Inc.’s annual report on Form 10 K for the fiscal year ended December 31, 1998 (File No. 000-20555) and incorporated herein by reference).
|
|
4.5
|
—
|
Supplemental Indenture No. 4 dated as of July 31, 1999, among Williams Holdings of Delaware, Inc., Williams and Bank One Trust Company, N.A. (formerly The First National Bank of Chicago), as Trustee (filed on March 28, 2000 as Exhibit 4(q) to The Williams Companies, Inc.’s annual report on Form 10-K (File No. 001-04174) and incorporated herein by reference).
|
|
4.6
|
—
|
Fifth Supplemental Indenture between Williams and Bank One Trust Company, N.A., as Trustee, dated as of January 17, 2001 (filed on March 12, 2001 as Exhibit 4(k) to The Williams Companies, Inc.’s annual report on Form 10-K (File No. 001-04174) and incorporated herein by reference).
|
|
4.7
|
—
|
Seventh Supplemental Indenture dated March 19, 2002, between The Williams Companies, Inc. as Issuer and Bank One Trust Company, National Association, as Trustee (filed on May 9, 2002 as Exhibit 4.1 to The Williams Companies, Inc.’s quarterly report on Form 10-Q (File No. 001-04174) and incorporated herein by reference).
|
|
4.8
|
—
|
Indenture dated as of May 28, 2003, by and between The Williams Companies, Inc. and JPMorgan Chase Bank, as Trustee for the issuance of the 5.50% Junior Subordinated Convertible Debentures due 2033 (filed on August 12, 2003 as Exhibit 4.2 to The Williams Companies, Inc.’s quarterly report on Form 10-Q (File No. 001-04174) and incorporated herein by reference).
|
|
4.9
|
—
|
Indenture dated as of March 5, 2009, among The Williams Companies, Inc. and The Bank of New York Mellon Trust Company, N.A., as Trustee (filed on March 11, 2009 as Exhibit 4.1 to The Williams Companies, Inc.’s current report on Form 8-K (File No. 001-04174) and incorporated herein by reference).
|
|
4.10
|
—
|
Eleventh Supplemental Indenture dated as of February 1, 2010 between The Williams Companies, Inc. and The Bank of New York Mellon Trust Company, N.A. (filed on February 2, 2010 as Exhibit 4.1 to The Williams Companies, Inc.’s current report on Form 8-K (File No. 001-04174) and incorporated herein by reference).
|
|
4.11
|
—
|
First Supplemental Indenture dated as of February 1, 2010 between The Williams Companies, Inc. and The Bank of New York Mellon Trust Company, N.A. (filed on February 2, 2010 as Exhibit 4.2 to The Williams Companies, Inc.’s current report on Form 8-K (File No. 001-04174) and incorporated herein by reference).
|
213
|
Exhibit
No. |
Description
|
|
|
4.12
|
—
|
Fifth Supplemental Indenture dated as of February 1, 2010 between The Williams Companies, Inc. and The Bank of New York Mellon Trust Company, N.A. (filed on February 2, 2010 as Exhibit 4.3 to The Williams Companies, Inc.’s current report on Form 8-K (File No. 001-04174) and incorporated herein by reference).
|
|
4.13
|
—
|
Indenture, dated December 18, 2012 between The Williams Companies, Inc. and The Bank of New York Mellon Trust Company, N.A. as trustee (filed on December 20, 2012 as Exhibit 4.1 to The Williams Companies, Inc.’s current report on Form 8-K (File No. 001-04174) and incorporated herein by reference).
|
|
4.14
|
—
|
First Supplemental Indenture, dated December 18, 2012, between The Williams Companies, Inc. and The Bank of New York Mellon Trust Company, N.A. as trustee (filed on December 20, 2012 as Exhibit 4.2 to The Williams Companies, Inc.’s current report on Form 8-K (File No. 001-04174) and incorporated herein by reference).
|
|
4.15
|
—
|
Second Supplemental Indenture, dated as of June 24, 2014, between The Williams Companies, Inc. and The Bank of New York Mellon Trust Company, N.A., as trustee (filed on June 24, 2014 as Exhibit 4.1 to The Williams Companies, Inc.’s current report on Form 8-K (File No. 001-04174) and incorporated herein by reference).
|
|
4.16
|
—
|
Indenture, dated December 13, 2006, by and among Williams Partners L.P., Williams Partners Finance Corporation and The Bank of New York (filed on December 19, 2006 as Exhibit 4.1 to Pre-merger WPZ’s report on Form 8-K (File No. 001-32599) and incorporated herein by reference).
|
|
4.17
|
—
|
First Supplemental Indenture, dated as of February 2, 2015, among Williams Partners L.P., Williams Partners Finance Corporation and The Bank of New York Mellon Trust Company, N.A. (filed on February 3, 2015, as Exhibit 4.6 to Williams Partners L.P.’s current report on Form 8-K (File No. 001-34831) and incorporated herein by reference).
|
|
4.18
|
—
|
Indenture dated as of February 9, 2010, between Williams Partners L.P. and The Bank of New York Mellon Trust Company, N.A. (filed on February 10, 2010 as Exhibit 4.1 to The Williams Companies, Inc.’s current report on Form 8-K (File No. 001-04174) and incorporated herein by reference).
|
|
4.19
|
—
|
First Supplemental Indenture, dated as of February 2, 2015, between Williams Partners L.P. and The Bank of New York Mellon Trust Company, N.A. (filed on February 3, 2015, as Exhibit 4.5 to Williams Partners L.P.’s current report on Form 8-K (File No. 001-34831) and incorporated herein by reference).
|
|
4.20
|
—
|
Indenture, dated as of November 9, 2010, between Williams Partners L.P. and The Bank of New York Mellon Trust Company, N.A., as trustee (filed on November 12, 2010 as Exhibit 4.1 to Williams Partners L.P.’s current report on Form 8-K (File No. 001-32599) and incorporated herein by reference).
|
|
4.21
|
—
|
First Supplemental Indenture, dated as of November 9, 2010, between Williams Partners L.P. and The Bank of New York Mellon Trust Company, N.A., as trustee (filed on November 12, 2010 as Exhibit 4.2 to Williams Partners L.P.’s current report on Form 8-K (File No. 001-32599) and incorporated herein by reference).
|
|
4.22
|
—
|
Second Supplemental Indenture, dated as of November 17, 2011, between Williams Partners L.P. and The Bank of New York Mellon Trust Company, N.A., as trustee (filed November 18, 2011 as Exhibit 4.1 to Williams Partners L.P.’s current report on Form 8-K (File No. 001-32599) and incorporated herein by reference).
|
|
4.23
|
—
|
Third Supplemental Indenture (including Form of 3.35% Senior Notes due 2022), dated as of August 14, 2012, between Williams Partners L.P. and The Bank of New York Mellon Trust Company, N.A., as trustee (filed on August 14, 2012 as Exhibit 4.1 to Williams Partners L.P.’s current report on Form 8-K (File No. 001-32599) and incorporated herein by reference).
|
214
|
Exhibit
No. |
Description
|
|
|
4.24
|
—
|
Fourth Supplemental Indenture, dated as of November 15, 2013, between Williams Partners L.P. and The Bank of New York Mellon Trust Company, N .A., as trustee (filed on November 18, 2013 as Exhibit 4.1 to Williams Partners L.P.’s current report on Form 8-K (File No. 001-32599) and incorporated herein by reference).
|
|
4.25
|
—
|
Fifth Supplemental Indenture, dated as of March 4, 2014, between Williams Partners L.P. and The Bank of New York Mellon Trust Company, N.A., as trustee (filed on March 4, 2014 as Exhibit 4.1 to Williams Partners L.P.’s report on Form 8-K (File No. 001-32599) and incorporated herein by reference).
|
|
4.26
|
—
|
Sixth Supplemental Indenture, dated as of June 27, 2014, between Williams Partners L.P. and The Bank of New York Mellon Trust Company, N.A., as trustee (filed on June 27, 2014 as Exhibit 4.1 to Williams Partners L.P.’s report on Form 8-K (File No. 001-32599) and incorporated herein by reference).
|
|
4.27
|
—
|
Seventh Supplemental Indenture, dated as of February 2, 2015, between Williams Partners L.P. and The Bank of New York Mellon Trust Company, N.A. (filed on February 3, 2015, as Exhibit 4.4 to Williams Partners L.P.’s current report on Form 8-K (File No. 001-34831) and incorporated herein by reference).
|
|
4.28
|
—
|
Eighth Supplemental Indenture, dated as of March 3, 2015, between Williams Partners L.P. and The Bank of New York Mellon Trust Company, N.A., as trustee (filed on March 3, 2015 as Exhibit 4.1 to Williams Partners L.P.’s current report on Form 8-K (File No. 001-34831) and incorporated herein by reference).
|
|
4.29
|
—
|
Indenture, dated as of January 11, 2012, by and among the Chesapeake Midstream Partners, L.P., CHKM Finance Corp, the Guarantors named therein and The Bank of New York Mellon Trust Company, N.A., as trustee (filed on January 11, 2012 as Exhibit 4.1 to Williams Partners L.P.’s (then known as Access Midstream Partners L.P.) current report on 8-K (File No. 001-34831) and incorporated herein by reference).
|
|
4.30
|
—
|
First Supplemental Indenture, dated as of January 7, 2013, by and among Access Midstream Partners, L.P., ACMP Finance Corp., the guarantors named therein and The Bank of New York Mellon Trust Company, N.A., as trustee (filed on February 21, 2014 as Exhibit 4.5 to Williams Partners L.P.’s (then known as Access Midstream Partners L.P.) annual report on 10-K (File No. 001-34831) and incorporated herein by reference).
|
|
4.31
|
—
|
Second Supplemental Indenture and Amendment - Subsidiary Guarantee, dated as of April 18, 2014 among the Access Midstream Partners, L.P., ACMP Finance Corp, the Guarantors named therein and The Bank of New York Mellon Trust Company, N.A., as trustee filed on May 1, 2014 as Exhibit 4.4 to Williams Partners L.P.’s (then known as Access Midstream Partners L.P.) quarterly report on 10-Q (File No. 001-34831) and incorporated herein by reference).
|
|
4.32
|
—
|
Third Supplemental Indenture among Williams Partners L.P., ACMP Finance Corp. and The Bank of New York Mellon Trust Company, N.A. (filed on February 3, 2015, as Exhibit 4.2 to Williams Partners L.P.’s current report on Form 8-K (File No. 001-34831) and incorporated herein by reference).
|
|
4.33
|
—
|
Indenture, dated as of December 19, 2012, by and among Access Midstream Partners, L.P., ACMP Finance Corp., the guarantors listed therein and The Bank of New York Mellon Trust Company, N.A., as trustee (filed on December 19, 2012 as Exhibit 4.1 to Williams Partners L.P.’s (formerly known as Access Midstream Partners L.P.) current report on 8-K (File No. 001-34831) and incorporated herein by reference).
|
215
|
Exhibit
No. |
Description
|
|
|
4.34
|
—
|
First Supplemental Indenture, dated as of December 19, 2012, among Access Midstream Partners, L.P., ACMP Finance Corp., the guarantors listed therein and The Bank of New York Mellon Trust Company, N.A., as trustee (filed on December 19, 2012 as Exhibit 4.2 to Williams Partners L.P.’s (formerly known as Access Midstream Partners L.P.) current report on 8-K (File No. 001-34831) and incorporated herein by reference).
|
|
4.35
|
—
|
Second Supplemental Indenture and Amendment - Subsidiary Guarantee, dated as of January 7, 2013, by among Access Midstream Partners, L.P., ACMP Finance Corp., the guarantors named therein and The Bank of New York Mellon Trust Company, N.A., as trustee (filed on February 21, 2014 as Exhibit 4.9 to Williams Partners L.P.’s (formerly known as Access Midstream Partners L.P.) annual report on 10-K (File No. 001-34831) and incorporated herein by reference).
|
|
4.36
|
—
|
Third Supplemental Indenture, dated as of March 7, 2014, among the Access Midstream Partners, L.P., ACMP Finance Corp, the Guarantors named therein and The Bank of New York Mellon Trust Company, N.A., as trustee (filed on March 7, 2014 as Exhibit 4.2 to Williams Partners L.P.’s (formerly known as Access Midstream Partners L.P.) current report on 8-K (File No. 001-34831) and incorporated herein by reference).
|
|
4.37
|
—
|
Third Supplemental Indenture and Amendment - Subsidiary Guarantee, dated as of April 18, 2014, among the Access Midstream Partners, L.P., ACMP Finance Corp, the Guarantors named therein and The Bank of New York Mellon Trust Company, N.A., as trustee (filed on May 1, 2014 as Exhibit 4.3 to Williams Partners L.P.’s (formerly known as Access Midstream Partners L.P.) quarterly report on 10-Q (File No. 001-34831) and incorporated herein by reference).
|
|
4.38
|
—
|
Fifth Supplemental Indenture dated as of February 2, 2015 among Williams Partners L.P., ACMP Finance Corp. and The Bank of New York Mellon Trust Company, N.A. (filed on February 3, 2015, as Exhibit 4.3 to Williams Partners L.P.’s current report on Form 8-K (File No. 001-34831) and incorporated herein by reference).
|
|
4.39
|
—
|
Senior Indenture dated as of November 30, 1995, between Northwest Pipeline Corporation and Chemical Bank, Trustee (filed September 14, 1995 as Exhibit 4.1 to Northwest Pipeline’s registration statement on Form S-3 (File No. 033-62639) and incorporated herein by reference).
|
|
4.40
|
—
|
Indenture dated as of June 22, 2006, between Northwest Pipeline Corporation and JPMorgan Chase Bank, N.A., as Trustee (filed on June 23, 2006 as Exhibit 4.1 to Northwest Pipeline’s current report on Form 8-K (File No. 001-07414) and incorporated herein by reference).
|
|
4.41
|
—
|
Indenture dated as of April 5, 2007, between Northwest Pipeline Corporation and The Bank of New York (filed on April 5, 2007 as Exhibit 4.1 to Northwest Pipeline Corporation’s current report on Form 8-K (File No. 001-07414) and incorporated herein by reference).
|
|
4.42
|
—
|
Indenture dated May 22, 2008, between Northwest Pipeline GP and The Bank of New York Trust Company, N.A., as Trustee (filed on May 23, 2008 as Exhibit 4.1 to Northwest Pipeline GP’s current report on Form 8-K (File No. 001-07414) and incorporated herein by reference).
|
|
4.43
|
—
|
Senior Indenture dated as of July 15, 1996 between Transcontinental Gas Pipe Line Corporation and Citibank, N.A., as Trustee (filed on April 2, 1996 as Exhibit 4.1 to Transcontinental Gas Pipe Line Corporation’s registration statement on Form S-3 (File No. 333-02155) and incorporated herein by reference).
|
|
4.44
|
—
|
Indenture dated as of April 11, 2006 between Transcontinental Gas Pipe Line Corporation and JPMorgan Chase Bank, N.A., as Trustee (filed on April 11, 2006 as Exhibit 4.1 to Transcontinental Gas Pipe Line Corporation’s current report on Form 8-K (File No. 001-07584) and incorporated herein by reference).
|
216
|
Exhibit
No. |
Description
|
|
|
4.45
|
—
|
Indenture dated May 22, 2008, between Transcontinental Gas Pipe Line Corporation and The Bank of New York Trust Company, N.A., as Trustee (filed on May 23, 2008 as Exhibit 4.1 to Transcontinental Gas Pipe Line Corporation’s current report on Form 8-K (File No. 001-07584) and incorporated herein by reference).
|
|
4.46
|
—
|
Indenture dated as of August 12, 2011, between Transcontinental Gas Pipe Line Company, LLC and The Bank of New York Mellon Trust Company, N.A., as trustee (filed on August 12, 2011 as Exhibit 4.1 to Transcontinental Gas Pipe Line Company, LLC’s current report on Form 8K (File No. 001-07584) and incorporated herein by reference).
|
|
4.47
|
—
|
Indenture, dated as of July 13, 2012, between Transcontinental Gas Pipe Line Company, LLC and The Bank of New York Mellon Trust Company, N.A., as trustee (filed on July 16, 2012 as Exhibit 4.1 to Transcontinental Gas Pipe Line Company, LLC’s current report on Form 8-K (File No. 001-07584) and incorporated herein by reference).
|
|
4.48
|
—
|
Indenture, dated as of January 22, 2016, between Transcontinental Gas Pipe Line Company, LLC and The Bank of New York Mellon Trust Company, N.A., as trustee (filed on January 22, 2016 as Exhibit 4.1 to The Williams Company, Inc.’s current report on Form 8-K (File No. 001-04174) and incorporated herein by reference).
|
|
10.1§
|
—
|
The Williams Companies Amended and Restated Retirement Restoration Plan effective January l , 2008 (filed on February 25, 2009 as Exhibit 10.1 to The Williams Companies, Inc.’s annual report on Form 10-K (File No. 001-04174) and incorporated herein by reference).
|
|
10.2§
|
—
|
Form of Director and Officer Indemnification Agreement (filed on September 24, 2008 as Exhibit 10.1 to The Williams Companies, Inc.’s current report on Form 8-K (File No. 001-04174) and incorporated herein by reference).
|
|
10.3§
|
—
|
Form of 2011 Restricted Stock Unit Agreement among Williams and certain nonmanagement directors (filed on February 27, 2012 as Exhibit 10.7 to The Williams Companies, Inc.’s annual report on Form 10-K (File No. 001-04174) and incorporated herein by reference).
|
|
10.4§
|
—
|
Form of 2012 Restricted Stock Unit Agreement among Williams and certain nonmanagement directors (filed on August 2, 2012 as Exhibit 10.2 to The Williams Companies, Inc.’s quarterly report on Form 10-Q (File No. 001-04174) and incorporated herein by reference).
|
|
10.5§
|
—
|
Form of 2013 Performance-Based Restricted Stock Unit Agreement among Williams and certain employees and officers (filed on February 27, 2013 as Exhibit 10.4 to The Williams Companies, Inc.’s annual report on Form 10-K (File No. 001-04174) and incorporated herein by reference).
|
|
10.6§
|
—
|
Form of 2013 Restricted Stock Unit Agreement among Williams and certain employees and officers (filed on February 27, 2013 as Exhibit 10.5 to The Williams Companies Inc.’s annual report on Form 10-K (File No. 001-04174) and incorporated herein by reference).
|
|
10.7§
|
—
|
Form of 2013 Nonqualified Stock Option Agreement among Williams and certain employees and officers (filed on February 27, 2013 as Exhibit 10.6 to The Williams Companies, Inc.’s annual report on Form 10-K (File No. 001-04174) and incorporated herein by reference).
|
|
10.8§
|
—
|
Form of 2013 Restricted Stock Unit Agreement among Williams and certain nonmanagement directors (filed on February 26, 2014 as Exhibit 10.11 to The Williams Companies, Inc. annual report on Form 10-K (File No. 001-04174) and incorporated herein by reference).
|
|
10.9§
|
—
|
Form of 2014 Performance-Based Restricted Stock Unit Agreement among Williams and certain employees and officers (filed on February 26, 2014 as Exhibit 10.6 to The Williams Companies, Inc. annual report on Form 10-K (File No. 001-04174) and incorporated herein by reference).
|
217
|
Exhibit
No. |
Description
|
|
|
10.10§
|
—
|
Form of 2014 Restricted Stock Unit Agreement among Williams and certain employees and officers (filed on February 26, 2014 as Exhibit 10.7 to The Williams Companies, Inc. annual report on Form 10-K (File No. 001-04174) and incorporated herein by reference).
|
|
10.11§
|
—
|
Form of 2014 Nonqualified Stock Option Agreement among Williams and certain employees and officers (filed on February 26, 2014 as Exhibit 10.8 to The Williams Companies, Inc. annual report on Form 10-K (File No. 001-04174) and incorporated herein by reference).
|
|
10.12
|
—
|
Form of 2014 Restricted Stock Unit Agreement among Williams and certain nonmanagement directors (filed on February 25, 2015 as Exhibit 10.12 to The Williams Companies, Inc. annual report on Form 10-K (File No. 001-04174) and incorporated herein by reference).
|
|
10.13§
|
—
|
Form of October 2014 Leveraged Performance Unit Award Agreement among Williams and certain officers (filed on February 25, 2015 as Exhibit 10.13 to The Williams Companies, Inc. annual report on Form 10-K (File No. 001-04174) and incorporated herein by reference).
|
|
10.14§
|
—
|
Form of Leveraged Performance Unit Award Agreement dated January 1, 2015 between Williams and Walter Bennett (filed on February 25, 2015 as Exhibit 10.14 to The Williams Companies, Inc. annual report on Form 10-K (File No. 001-04174) and incorporated herein by reference).
|
|
10.15§
|
—
|
Form of 2015 Performance-Based Restricted Stock Unit Agreement among Williams and certain employees and officers (filed on February 25, 2015 as Exhibit 10.15 to The Williams Companies, Inc. annual report on Form 10-K (File No. 001-04174) and incorporated herein by reference).
|
|
10.16§
|
—
|
Form of 2015 Time-Based Restricted Stock Unit Agreement among Williams and certain employees and officers (filed on February 25, 2015 as Exhibit 10.16 to The Williams Companies, Inc. annual report on Form 10-K (File No. 001-04174) and incorporated herein by reference).
|
|
10.17§
|
—
|
Form of 2015 Nonqualified Stock Option Agreement among Williams and certain employees and officers (filed on February 25, 2015 as Exhibit 10.17 to The Williams Companies, Inc. annual report on Form 10-K (File No. 001-04174) and incorporated herein by reference).
|
|
10.18§
|
—
|
Form of 2015 Short-Term Non-Equity Incentive Award Agreement among The Williams Companies Inc. and certain employees and officers (filed on October 29, 2015 as Exhibit 10.2 to The Williams Companies, Inc. quarterly report on Form 10-Q (File No. 001-04174) and incorporated herein by reference).
|
|
10.19§
|
—
|
Form of 2015 Non-Equity Incentive Award Agreement among The Williams Companies Inc. and certain employees and officers (filed on October 29, 2015 as Exhibit 10.3 to The Williams Companies, Inc. quarterly report on Form 10-Q (File No. 001-04174) and incorporated herein by reference).
|
|
10.20§
|
—
|
The Williams Companies, Inc. I996 Stock Plan for Nonemployee Directors (filed on March 27, 1996 as Exhibit B to The Williams Companies, Inc.’s Proxy Statement (File No. 002-27038) and incorporated herein by reference).
|
|
10.21§
|
—
|
The Williams Companies, Inc. 2002 Incentive Plan as amended and restated effective as of January 23, 2004 (filed on August 5, 2004 as Exhibit 10.1 to The Williams Companies, Inc.’s quarterly report on Form 10-Q (File No. 001-04174) and incorporated herein by reference).
|
|
10.22§
|
—
|
Amendment No. 1 to The Williams Companies, Inc. 2002 Incentive Plan (filed on February 25, 2009 as Exhibit 10.11 to The Williams Companies, Inc.’s annual report on Form 10-K (File No. 001-04174) and incorporated herein by reference).
|
|
10.23§
|
—
|
Amendment No. 2 to The Williams Companies, Inc. 2002 Incentive Plan (filed on February 25, 2009 as Exhibit 10.12 to The Williams Companies, Inc.’s annual report on Form 10-K (File No. 001-04174) and incorporated herein by reference).
|
218
|
Exhibit
No. |
Description
|
|
|
10.24§
|
—
|
The Williams Companies, Inc. 2007 Incentive Plan as amended and restated effective January 19, 2012 (filed on May 1, 2012 as Exhibit 10.12 to The Williams Companies, Inc.’s annual report on Form 10-K (File No. 001-04174) and incorporated herein by reference).
|
|
10.25§
|
—
|
Amended and Restated Change-in-Control Severance Agreement between the Company and certain executive officers (Tier I Executives) (filed on February 27, 2013 as Exhibit 10.14 to The Williams Companies, Inc.’s annual report on Form 10-K (File No. 001-04174) and incorporated herein by reference).
|
|
10.26§
|
—
|
Amended and Restated Change-in-Control Severance Agreement between the Company and certain executive officers (Tier II Executives) (filed on February 27, 2012, as Exhibit 10.14 to The Williams Companies, Inc.’s annual report on Form 10-K (File No. 001-04174) and incorporated herein by reference).
|
|
10.27
|
—
|
Separation and Distribution Agreement dated as of December 30, 2011, between The Williams Companies, Inc. and WPX Energy, Inc. (Filed on February 27, 2012 as Exhibit 10.19 to The Williams Companies, Inc.’s annual report on Form 10-K (File No. 001-04174) and incorporated herein by reference).
|
|
10.28
|
—
|
Tax Sharing Agreement, dated as of December 30, 2011, between The Williams Companies, Inc. and WPX Energy, Inc. (filed on January 6, 2012 as Exhibit 10.3 to The Williams Companies, Inc.’s current report on Form 8-K (File No. 001-04174) and incorporated herein by reference).
|
|
10.29
|
—
|
Letter Agreement, dated January 27, 2014, with James E. Scheel, Senior Vice President - Northeast G&P, regarding Relocation from Pennsylvania Benefits (filed on May 1, 2014 as Exhibit 10.2 to The Williams Companies, Inc.’s quarterly report on Form 10-Q (File No. 001-04174) and incorporated herein by reference).
|
|
10.30
|
—
|
Settlement Agreement, dated as of February 25, 2014, by and among Corvex Management LP, Keith Meister, Soroban Master Fund LP, Soroban Capital Partners LLC, Eric W. Mandelblatt, and The Williams Companies, Inc. (filed on February 25, 2014, as Exhibit 99.1 to The Williams Companies Inc.’s current report on Form 8-K (File No. 001-04174) and incorporated herein by reference).
|
|
10.31
|
—
|
The Williams Companies, Inc. 2007 Incentive Plan as amended and restated effective May 22, 2014 (filed April 11, 2014 as Appendix A to The Williams Companies, Inc.’s Definitive Proxy Statement on Schedule 14A (File No. 001-04174) and incorporated herein by reference).
|
|
10.32
|
—
|
Purchase Agreement, dated as of June 14, 2014, by and among GIP II Eagle Holdings Partnership, L.P., GIP II Hawk Holdings Partnership, L.P., GIP II Eagle 2 Holding, L.P. and GIP Hawk 2 Holding, L.P., as Sellers and The Williams Companies, Inc., as Buyer (filed on June 16, 2014 as Exhibit 10.1 to The Williams Companies, Inc.’s current report on Form 8-K (File No. 001-04174) and incorporated herein by reference).
|
|
10.33
|
—
|
Second Amended and Restated Credit Agreement dated as of February 2, 2015, between The Williams Companies, Inc., the lenders named therein, and Citibank, N.A. as Administrative Agent (filed on February 3, 2015 as Exhibit 10.1 to The Williams Companies, Inc.’s current report on Form 8-K (File 001-04174) and incorporated herein by reference).
|
|
10.34
|
—
|
Credit Agreement dated as of August 26, 2015, by and among Williams Partners L.P., the lenders named therein, and Barclays Bank PLC as Administrative Agent (filed on August 28, 2015 as Exhibit 10.1 to Williams Partners L.P.’s Current Report on Form 8-K (File No. 001-34831) and incorporated herein by reference).
|
|
10.35
|
—
|
Termination Agreement and Release, dated as of September 28, 2015, by and among The Williams Companies, Inc., SCMS LLC, Williams Partners L.P. and WPZ GP LLC (filed on September 28, 2015 as Exhibit 10.1 to Williams Companies, Inc.’s Current Report on Form 8-K (File No. 001-04174) and incorporated herein by reference).
|
219
|
Exhibit
No. |
Description
|
|
|
10.36
|
—
|
Amendment No. 1 to Second Amended and Restated Credit Agreement dated as of December 18, 2015, between Williams Partners L.P., Northwest Pipeline LLC, Transcontinental Gas Pipe Line Company, LLC, as co-borrowers, the lenders named therein, and Citibank, N.A. as Administrative Agent (filed on December 23, 2015 as Exhibit 10.1 to Williams Companies, Inc.’s Current Report on Form 8-K (File No. 001-04174) and incorporated herein by reference).
|
|
10.37
|
—
|
Credit Agreement dated as of December 23, 2015, between Williams Partners L.P., the lenders named therein, and Barclays Bank PLC as Administrative Agent (filed on December 23, 2015 as Exhibit 10.2 to Williams Companies, Inc.’s Current Report on Form 8-K (File No. 001-04174) and incorporated herein by reference).
|
|
10.38
|
—
|
Second Amended and Restated Credit Agreement dated as of February 2, 2015, between Williams Partners L.P. (formerly known as Access Midstream Partners, L.P.), Northwest Pipeline LLC, Transcontinental Gas Pipeline Company, LLC, as co-borrowers, the lenders named therein, and Citibank, N.A. as Administrative Agent (filed on February 3, 2015 as Exhibit 10.1 to Williams Partners L.P.’s Current Report on Form 8-K (File No. 001-34831) and incorporated herein by reference).
|
|
10.39
|
—
|
Form of Amended and Restated Commercial Paper Dealer Agreement, dated as of February 2, 2015, between Williams Partners L.P., as Issuer, and the Dealer party thereto(filed on February 3, 2015 as Exhibit 10.3 to Williams Partners L.P.’s Current Report on Form 8-K (File No. 001-34831) and incorporated herein by reference).
|
|
10.40
|
—
|
Credit Agreement dated as of February 3, 2015, between Williams Partners L.P., the lenders named therein, and Barclays Bank PLC as Administrative Agent (filed on February 3, 2015 as Exhibit 10.2 to Williams Partners L.P.’s Current Report on Form 8-K (File No. 001-34831) and incorporated herein by reference).
|
|
10.41
|
—
|
Registration Rights Agreement, dated January 22, 2016, between Transcontinental Gas Pipe Line Company, LLC and each of the initial purchasers listed therein (filed on January 22, 2016 as Exhibit 10.1 to The Williams Companies, Inc.’s Form 8-K (File No. 001-04174) and incorporated herein by reference).
|
|
12*
|
—
|
Computation of Ratio of Earnings to Combined Fixed Charges.
|
|
14
|
—
|
Code of Ethics for Senior Officers (filed on March 15, 2004 as Exhibit 14 to The Williams
Companies, Inc.’s Form 10-K and incorporated herein by reference). |
|
21*
|
—
|
Subsidiaries of the registrant.
|
|
23.1*
|
—
|
Consent of Independent Registered Public Accounting Firm, Ernst & Young LLP.
|
|
23.2*
|
—
|
Consent of Independent Registered Public Accounting Firm, Deloitte & Touche LLP.
|
|
23.3*
|
—
|
Consent of Independent Registered Public Accounting Firm, PricewaterhouseCoopers LLP.
|
|
24*
|
—
|
Power of Attorney.
|
|
31.1*
|
—
|
Certification of the Chief Executive Officer pursuant to Rules 13a-l 4(a) and 15d-14(a) promulgated under the Securities Exchange Act of 1934, as amended, and Item 601(b)(3 l) of Regulation S-K, as adopted pursuant to Section 302 of the Sarbanes-Oxley Act of 2002.
|
|
31.2*
|
—
|
Certification of the Chief Financial Officer pursuant to Rules 13a-14(a) and l 5d-l 4(a) promulgated under the Securities Exchange Act of 1934, as amended, and Item 601(b)(31) of Regulation S-K, as adopted pursuant to Section 302 of the Sarbanes-Oxley Act of 2002.
|
220
|
Exhibit
No. |
Description
|
|
|
32**
|
—
|
Certification of the Chief Executive Officer and the Chief Financial Officer pursuant to 18 U.S.C. Section 1350, as adopted pursuant to Section 906 of the Sarbanes-Oxley Act of 2002.
|
|
101.INS*
|
—
|
XBRL Instance Document.
|
|
101.SCH*
|
—
|
XBRL Taxonomy Extension Schema.
|
|
101.CAL*
|
—
|
XBRL Taxonomy Extension Calculation Linkbase.
|
|
101.DEF*
|
—
|
XBRL Taxonomy Extension Definition Linkbase.
|
|
101.LAB*
|
—
|
XBRL Taxonomy Extension Label Linkbase.
|
|
101.PRE*
|
—
|
XBRL Taxonomy Extension Presentation Linkbase.
|
|
______________
|
|
|
*
|
Filed herewith
|
|
**
|
Furnished herewith
|
|
§
|
Management contract or compensatory plan or arrangement
|
|
+
|
Pursuant to item 601(6)(2) of Regulation S-K, the registrant agrees to furnish supplementally a copy of any omitted exhibit or schedule to the SEC upon request.
|
221
SIGNATURES
Pursuant to the requirements of Section 13 or 15(d) of the Securities Exchange Act of 1934, the registrant has duly caused this report to be signed on its behalf by the undersigned, thereunto duly authorized.
|
T
HE
W
ILLIAMS
C
OMPANIES
, I
NC
.
(Registrant)
|
||
|
By:
|
/s/ T
ED
T. T
IMMERMANS
|
|
|
Ted T. Timmermans
Vice President, Controller and
Chief Accounting Officer
|
||
Date:
February 26, 2016
Pursuant to the requirements of the Securities Exchange Act of 1934, this report has been signed below by the following persons on behalf of the registrant and in the capacities and on the dates indicated.
|
Signature
|
Title
|
Date
|
||
|
/s/ A
LAN
S. A
RMSTRONG
|
President, Chief Executive Officer and Director
|
February 26, 2016
|
||
|
Alan S. Armstrong
|
(Principal Executive Officer)
|
|||
|
/s/ D
ONALD
R. C
HAPPEL
|
Senior Vice President and Chief Financial Officer
|
February 26, 2016
|
||
|
Donald R. Chappel
|
(Principal Financial Officer)
|
|||
|
/s/ T
ED
T. T
IMMERMANS
|
Vice President, Controller and Chief Accounting Officer
|
February 26, 2016
|
||
|
Ted T. Timmermans
|
(Principal Accounting Officer)
|
|||
|
/s/ J
OSEPH
R. C
LEVELAND
*
|
Director
|
February 26, 2016
|
||
|
Joseph R. Cleveland*
|
||||
|
/s/ K
ATHLEEN
B. C
OOPER
*
|
Director
|
February 26, 2016
|
||
|
Kathleen B. Cooper*
|
||||
|
/s/ J
OHN
A. H
AGG
*
|
Director
|
February 26, 2016
|
||
|
John A. Hagg*
|
||||
|
/s/ J
UANITA
H. H
INSHAW
*
|
Director
|
February 26, 2016
|
||
|
Juanita H. Hinshaw*
|
||||
|
/s/ R
ALPH
I
ZZO
*
|
Director
|
February 26, 2016
|
||
|
Ralph Izzo*
|
||||
|
/s/ F
RANK
T. M
AC
I
NNIS
*
|
Chairman of the Board
|
February 26, 2016
|
||
|
Frank T. MacInnis*
|
||||
|
/s/ E
RIC
W. M
ANDELBLATT
*
|
Director
|
February 26, 2016
|
||
|
Eric W. Mandelblatt*
|
||||
|
/s/ K
EITH
A. M
EISTER
*
|
Director
|
February 26, 2016
|
||
|
Keith A. Meister*
|
||||
222
|
Signature
|
Title
|
Date
|
||
|
/s/ S
TEVEN
W. N
ANCE
*
|
Director
|
February 26, 2016
|
||
|
Steven W. Nance*
|
||||
|
/s/ M
URRAY
D. S
MITH
*
|
Director
|
February 26, 2016
|
||
|
Murray D. Smith*
|
||||
|
/
S
/ J
ANICE
D. S
TONEY
*
|
Director
|
February 26, 2016
|
||
|
Janice D. Stoney*
|
||||
|
/
S
/ L
AURA
A. S
UGG
*
|
Director
|
February 26, 2016
|
||
|
Laura A. Sugg*
|
||||
|
*By:
|
/s/ S
ARAH
C. M
ILLER
|
February 26, 2016
|
||||
|
Sarah C. Miller
Attorney-in-Fact
|
||||||
223
INDEX TO EXHIBITS
|
Exhibit
No. |
Description
|
|
|
2.1+
|
—
|
Agreement and Plan of Merger dated as of May 12, 2015, by and among The Williams Companies, Inc., SCMS LLC, Williams Partners L.P., and WPZ GP LLC (filed on May 13, 2015 as Exhibit 2.1 to The Williams Companies, Inc.’s current report on Form 8-K (File No. 001-04174) and incorporated herein by reference).
|
|
2.2+
|
—
|
Agreement and Plan of Merger dated as of September 28, 2015, by and among The Williams Companies, Inc., Energy Transfer Corp LP, Energy Transfer Corp GP, LLC, Energy Transfer Equity, L.P., LE GP, LLC and Energy Transfer Equity GP, LLC (filed on October 1, 2015 as Exhibit 2.1 to The Williams Companies, Inc.’s current report on Form 8-K (File No. 001-04174) and incorporated herein by reference).
|
|
3.1
|
—
|
Amended and Restated Certificate of Incorporation, as supplemented (filed on May 26, 2010 as Exhibit 3.1 to The Williams Companies Inc.’s current report on Form 8-K (File No. 001-04174) and incorporated herein by reference).
|
|
3.2
|
—
|
By-Laws (filed on August 24, 2015 as Exhibit 3 to The Williams Companies Inc.’s current report on Form 8-K (File No. 001-04174) and incorporated herein by reference).
|
|
4.1
|
—
|
Senior Indenture dated February 25, 1997, between MAPCO Inc. and Bank One Trust Company,
N.A. (formerly The First National Bank of Chicago), as Trustee (filed February 25, 1997 as Exhibit 4.5.1 to MAPCO Inc.’s Amendment No. l to registration statement on Form S-3 (File No. 333-20837) and incorporated herein by reference). |
|
4.2
|
—
|
Supplemental Indenture No. 1 dated March 5, 1997, between MAPCO Inc. and Bank One Trust Company, N.A. (formerly The First National Bank of Chicago), as Trustee (filed as Exhibit 4(o) to MAPCO Inc.’s annual report on Form 10-K for the fiscal year ended December 31, 1997 (File No. 001-05254) and incorporated herein by reference).
|
|
4.3
|
—
|
Supplemental Indenture No. 2 dated March 5, 1997, between MAPCO Inc. and Bank One Trust Company, N.A. (formerly The First National Bank of Chicago), as Trustee (filed as Exhibit 4(p) to MAPCO Inc.’s annual report on Form 10-K for the fiscal year ended December 31, 1997 (File No. 001-05254) and incorporated herein by reference).
|
|
4.4
|
—
|
Supplemental Indenture No. 3 dated March 31, 1998, among MAPCO Inc., Williams Holdings of Delaware, Inc. and Bank One Trust Company, N.A. (formerly The First National Bank of Chicago), as Trustee (filed as Exhibit 4(J) to Williams Holdings of Delaware, Inc.’s annual report on Form 10 K for the fiscal year ended December 31, 1998 (File No. 000-20555) and incorporated herein by reference).
|
|
4.5
|
—
|
Supplemental Indenture No. 4 dated as of July 31, 1999, among Williams Holdings of Delaware, Inc., Williams and Bank One Trust Company, N.A. (formerly The First National Bank of Chicago), as Trustee (filed on March 28, 2000 as Exhibit 4(q) to The Williams Companies, Inc.’s annual report on Form 10-K (File No. 001-04174) and incorporated herein by reference).
|
|
4.6
|
—
|
Fifth Supplemental Indenture between Williams and Bank One Trust Company, N.A., as Trustee, dated as of January 17, 2001 (filed on March 12, 2001 as Exhibit 4(k) to The Williams Companies, Inc.’s annual report on Form 10-K (File No. 001-04174) and incorporated herein by reference).
|
|
4.7
|
—
|
Seventh Supplemental Indenture dated March 19, 2002, between The Williams Companies, Inc. as Issuer and Bank One Trust Company, National Association, as Trustee (filed on May 9, 2002 as Exhibit 4.1 to The Williams Companies, Inc.’s quarterly report on Form 10-Q (File No. 001-04174) and incorporated herein by reference).
|
224
|
Exhibit
No. |
Description
|
|
|
4.8
|
—
|
Indenture dated as of May 28, 2003, by and between The Williams Companies, Inc. and JPMorgan Chase Bank, as Trustee for the issuance of the 5.50% Junior Subordinated Convertible Debentures due 2033 (filed on August 12, 2003 as Exhibit 4.2 to The Williams Companies, Inc.’s quarterly report on Form 10-Q (File No. 001-04174) and incorporated herein by reference).
|
|
4.9
|
—
|
Indenture dated as of March 5, 2009, among The Williams Companies, Inc. and The Bank of New York Mellon Trust Company, N.A., as Trustee (filed on March 11, 2009 as Exhibit 4.1 to The Williams Companies, Inc.’s current report on Form 8-K (File No. 001-04174) and incorporated herein by reference).
|
|
4.10
|
—
|
Eleventh Supplemental Indenture dated as of February 1, 2010 between The Williams Companies, Inc. and The Bank of New York Mellon Trust Company, N.A. (filed on February 2, 2010 as Exhibit 4.1 to The Williams Companies, Inc.’s current report on Form 8-K (File No. 001-04174) and incorporated herein by reference).
|
|
4.11
|
—
|
First Supplemental Indenture dated as of February 1, 2010 between The Williams Companies, Inc. and The Bank of New York Mellon Trust Company, N.A. (filed on February 2, 2010 as Exhibit 4.2 to The Williams Companies, Inc.’s current report on Form 8-K (File No. 001-04174) and incorporated herein by reference).
|
|
4.12
|
—
|
Fifth Supplemental Indenture dated as of February 1, 2010 between The Williams Companies, Inc. and The Bank of New York Mellon Trust Company, N.A. (filed on February 2, 2010 as Exhibit 4.3 to The Williams Companies, Inc.’s current report on Form 8-K (File No. 001-04174) and incorporated herein by reference).
|
|
4.13
|
—
|
Indenture, dated December 18, 2012 between The Williams Companies, Inc. and The Bank of New York Mellon Trust Company, N.A. as trustee (filed on December 20, 2012 as Exhibit 4.1 to The Williams Companies, Inc.’s current report on Form 8-K (File No. 001-04174) and incorporated herein by reference).
|
|
4.14
|
—
|
First Supplemental Indenture, dated December 18, 2012, between The Williams Companies, Inc. and The Bank of New York Mellon Trust Company, N.A. as trustee (filed on December 20, 2012 as Exhibit 4.2 to The Williams Companies, Inc.’s current report on Form 8-K (File No. 001-04174) and incorporated herein by reference).
|
|
4.15
|
—
|
Second Supplemental Indenture, dated as of June 24, 2014, between The Williams Companies, Inc. and The Bank of New York Mellon Trust Company, N.A., as trustee (filed on June 24, 2014 as Exhibit 4.1 to The Williams Companies, Inc.’s current report on Form 8-K (File No. 001-04174) and incorporated herein by reference).
|
|
4.16
|
—
|
Indenture, dated December 13, 2006, by and among Williams Partners L.P., Williams Partners Finance Corporation and The Bank of New York (filed on December 19, 2006 as Exhibit 4.1 to Pre-merger WPZ’s report on Form 8-K (File No. 001-32599) and incorporated herein by reference).
|
|
4.17
|
—
|
First Supplemental Indenture, dated as of February 2, 2015, among Williams Partners L.P., Williams Partners Finance Corporation and The Bank of New York Mellon Trust Company, N.A. (filed on February 3, 2015, as Exhibit 4.6 to Williams Partners L.P.’s current report on Form 8-K (File No. 001-34831) and incorporated herein by reference).
|
|
4.18
|
—
|
Indenture dated as of February 9, 2010, between Williams Partners L.P. and The Bank of New York Mellon Trust Company, N.A. (filed on February 10, 2010 as Exhibit 4.1 to The Williams Companies, Inc.’s current report on Form 8-K (File No. 001-04174) and incorporated herein by reference).
|
|
4.19
|
—
|
First Supplemental Indenture, dated as of February 2, 2015, between Williams Partners L.P. and The Bank of New York Mellon Trust Company, N.A. (filed on February 3, 2015, as Exhibit 4.5 to Williams Partners L.P.’s current report on Form 8-K (File No. 001-34831) and incorporated herein by reference).
|
225
|
Exhibit
No. |
Description
|
|
|
4.20
|
—
|
Indenture, dated as of November 9, 2010, between Williams Partners L.P. and The Bank of New York Mellon Trust Company, N.A., as trustee (filed on November 12, 2010 as Exhibit 4.1 to Williams Partners L.P.’s current report on Form 8-K (File No. 001-32599) and incorporated herein by reference).
|
|
4.21
|
—
|
First Supplemental Indenture, dated as of November 9, 2010, between Williams Partners L.P. and The Bank of New York Mellon Trust Company, N.A., as trustee (filed on November 12, 2010 as Exhibit 4.2 to Williams Partners L.P.’s current report on Form 8-K (File No. 001-32599) and incorporated herein by reference).
|
|
4.22
|
—
|
Second Supplemental Indenture, dated as of November 17, 2011, between Williams Partners L.P. and The Bank of New York Mellon Trust Company, N.A., as trustee (filed November 18, 2011 as Exhibit 4.1 to Williams Partners L.P.’s current report on Form 8-K (File No. 001-32599) and incorporated herein by reference).
|
|
4.23
|
—
|
Third Supplemental Indenture (including Form of 3.35% Senior Notes due 2022), dated as of August 14, 2012, between Williams Partners L.P. and The Bank of New York Mellon Trust Company, N.A., as trustee (filed on August 14, 2012 as Exhibit 4.1 to Williams Partners L.P.’s current report on Form 8-K (File No. 001-32599) and incorporated herein by reference).
|
|
4.24
|
—
|
Fourth Supplemental Indenture, dated as of November 15, 2013, between Williams Partners L.P. and The Bank of New York Mellon Trust Company, N .A., as trustee (filed on November 18, 2013 as Exhibit 4.1 to Williams Partners L.P.’s current report on Form 8-K (File No. 001-32599) and incorporated herein by reference).
|
|
4.25
|
—
|
Fifth Supplemental Indenture, dated as of March 4, 2014, between Williams Partners L.P. and The Bank of New York Mellon Trust Company, N.A., as trustee (filed on March 4, 2014 as Exhibit 4.1 to Williams Partners L.P.’s report on Form 8-K (File No. 001-32599) and incorporated herein by reference).
|
|
4.26
|
—
|
Sixth Supplemental Indenture, dated as of June 27, 2014, between Williams Partners L.P. and The Bank of New York Mellon Trust Company, N.A., as trustee (filed on June 27, 2014 as Exhibit 4.1 to Williams Partners L.P.’s report on Form 8-K (File No. 001-32599) and incorporated herein by reference).
|
|
4.27
|
—
|
Seventh Supplemental Indenture, dated as of February 2, 2015, between Williams Partners L.P. and The Bank of New York Mellon Trust Company, N.A. (filed on February 3, 2015, as Exhibit 4.4 to Williams Partners L.P.’s current report on Form 8-K (File No. 001-34831) and incorporated herein by reference).
|
|
4.28
|
—
|
Eighth Supplemental Indenture, dated as of March 3, 2015, between Williams Partners L.P. and The Bank of New York Mellon Trust Company, N.A., as trustee (filed on March 3, 2015 as Exhibit 4.1 to Williams Partners L.P.’s current report on Form 8-K (File No. 001-34831) and incorporated herein by reference).
|
|
4.29
|
—
|
Indenture, dated as of January 11, 2012, by and among the Chesapeake Midstream Partners, L.P., CHKM Finance Corp, the Guarantors named therein and The Bank of New York Mellon Trust Company, N.A., as trustee (filed on January 11, 2012 as Exhibit 4.1 to Williams Partners L.P.’s (then known as Access Midstream Partners L.P.) current report on 8-K (File No. 001-34831) and incorporated herein by reference).
|
|
4.30
|
—
|
First Supplemental Indenture, dated as of January 7, 2013, by and among Access Midstream Partners, L.P., ACMP Finance Corp., the guarantors named therein and The Bank of New York Mellon Trust Company, N.A., as trustee (filed on February 21, 2014 as Exhibit 4.5 to Williams Partners L.P.’s (then known as Access Midstream Partners L.P.) annual report on 10-K (File No. 001-34831) and incorporated herein by reference).
|
226
|
Exhibit
No. |
Description
|
|
|
4.31
|
—
|
Second Supplemental Indenture and Amendment - Subsidiary Guarantee, dated as of April 18, 2014 among the Access Midstream Partners, L.P., ACMP Finance Corp, the Guarantors named therein and The Bank of New York Mellon Trust Company, N.A., as trustee filed on May 1, 2014 as Exhibit 4.4 to Williams Partners L.P.’s (then known as Access Midstream Partners L.P.) quarterly report on 10-Q (File No. 001-34831) and incorporated herein by reference).
|
|
4.32
|
—
|
Third Supplemental Indenture among Williams Partners L.P., ACMP Finance Corp. and The Bank of New York Mellon Trust Company, N.A. (filed on February 3, 2015, as Exhibit 4.2 to Williams Partners L.P.’s current report on Form 8-K (File No. 001-34831) and incorporated herein by reference).
|
|
4.33
|
—
|
Indenture, dated as of December 19, 2012, by and among Access Midstream Partners, L.P., ACMP Finance Corp., the guarantors listed therein and The Bank of New York Mellon Trust Company, N.A., as trustee (filed on December 19, 2012 as Exhibit 4.1 to Williams Partners L.P.’s (formerly known as Access Midstream Partners L.P.) current report on 8-K (File No. 001-34831) and incorporated herein by reference).
|
|
4.34
|
—
|
First Supplemental Indenture, dated as of December 19, 2012, among Access Midstream Partners, L.P., ACMP Finance Corp., the guarantors listed therein and The Bank of New York Mellon Trust Company, N.A., as trustee (filed on December 19, 2012 as Exhibit 4.2 to Williams Partners L.P.’s (formerly known as Access Midstream Partners L.P.) current report on 8-K (File No. 001-34831) and incorporated herein by reference).
|
|
4.35
|
—
|
Second Supplemental Indenture and Amendment - Subsidiary Guarantee, dated as of January 7, 2013, by among Access Midstream Partners, L.P., ACMP Finance Corp., the guarantors named therein and The Bank of New York Mellon Trust Company, N.A., as trustee (filed on February 21, 2014 as Exhibit 4.9 to Williams Partners L.P.’s (formerly known as Access Midstream Partners L.P.) annual report on 10-K (File No. 001-34831) and incorporated herein by reference).
|
|
4.36
|
—
|
Third Supplemental Indenture, dated as of March 7, 2014, among the Access Midstream Partners, L.P., ACMP Finance Corp, the Guarantors named therein and The Bank of New York Mellon Trust Company, N.A., as trustee (filed on March 7, 2014 as Exhibit 4.2 to Williams Partners L.P.’s (formerly known as Access Midstream Partners L.P.) current report on 8-K (File No. 001-34831) and incorporated herein by reference).
|
|
4.37
|
—
|
Third Supplemental Indenture and Amendment - Subsidiary Guarantee, dated as of April 18, 2014, among the Access Midstream Partners, L.P., ACMP Finance Corp, the Guarantors named therein and The Bank of New York Mellon Trust Company, N.A., as trustee (filed on May 1, 2014 as Exhibit 4.3 to Williams Partners L.P.’s (formerly known as Access Midstream Partners L.P.) quarterly report on 10-Q (File No. 001-34831) and incorporated herein by reference).
|
|
4.38
|
—
|
Fifth Supplemental Indenture dated as of February 2, 2015 among Williams Partners L.P., ACMP Finance Corp. and The Bank of New York Mellon Trust Company, N.A. (filed on February 3, 2015, as Exhibit 4.3 to Williams Partners L.P.’s current report on Form 8-K (File No. 001-34831) and incorporated herein by reference).
|
|
4.39
|
—
|
Senior Indenture dated as of November 30, 1995, between Northwest Pipeline Corporation and Chemical Bank, Trustee (filed September 14, 1995 as Exhibit 4.1 to Northwest Pipeline’s registration statement on Form S-3 (File No. 033-62639) and incorporated herein by reference).
|
|
4.40
|
—
|
Indenture dated as of June 22, 2006, between Northwest Pipeline Corporation and JPMorgan Chase Bank, N.A., as Trustee (filed on June 23, 2006 as Exhibit 4.1 to Northwest Pipeline’s current report on Form 8-K (File No. 001-07414) and incorporated herein by reference).
|
|
4.41
|
—
|
Indenture dated as of April 5, 2007, between Northwest Pipeline Corporation and The Bank of New York (filed on April 5, 2007 as Exhibit 4.1 to Northwest Pipeline Corporation’s current report on Form 8-K (File No. 001-07414) and incorporated herein by reference).
|
227
|
Exhibit
No. |
Description
|
|
|
4.42
|
—
|
Indenture dated May 22, 2008, between Northwest Pipeline GP and The Bank of New York Trust Company, N.A., as Trustee (filed on May 23, 2008 as Exhibit 4.1 to Northwest Pipeline GP’s current report on Form 8-K (File No. 001-07414) and incorporated herein by reference).
|
|
4.43
|
—
|
Senior Indenture dated as of July 15, 1996 between Transcontinental Gas Pipe Line Corporation and Citibank, N.A., as Trustee (filed on April 2, 1996 as Exhibit 4.1 to Transcontinental Gas Pipe Line Corporation’s registration statement on Form S-3 (File No. 333-02155) and incorporated herein by reference).
|
|
4.44
|
—
|
Indenture dated as of April 11, 2006 between Transcontinental Gas Pipe Line Corporation and JPMorgan Chase Bank, N.A., as Trustee (filed on April 11, 2006 as Exhibit 4.1 to Transcontinental Gas Pipe Line Corporation’s current report on Form 8-K (File No. 001-07584) and incorporated herein by reference).
|
|
4.45
|
—
|
Indenture dated May 22, 2008, between Transcontinental Gas Pipe Line Corporation and The Bank of New York Trust Company, N.A., as Trustee (filed on May 23, 2008 as Exhibit 4.1 to Transcontinental Gas Pipe Line Corporation’s current report on Form 8-K (File No. 001-07584) and incorporated herein by reference).
|
|
4.46
|
—
|
Indenture dated as of August 12, 2011 , between Transcontinental Gas Pipe Line Company, LLC and The Bank of New York Mellon Trust Company, N.A., as trustee (filed on August 12, 2011 as Exhibit 4.1 to Transcontinental Gas Pipe Line Company, LLC’s current report on Form 8K (File No. 001-07584) and incorporated herein by reference).
|
|
4.47
|
—
|
Indenture, dated as of July 13, 2012, between Transcontinental Gas Pipe Line Company, LLC and The Bank of New York Mellon Trust Company, N.A., as trustee (filed on July 16, 2012 as Exhibit 4.1 to Transcontinental Gas Pipe Line Company, LLC’s current report on Form 8-K (File No. 001-07584) and incorporated herein by reference).
|
|
4.48
|
—
|
Indenture, dated as of January 22, 2016, between Transcontinental Gas Pipe Line Company, LLC and The Bank of New York Mellon Trust Company, N.A., as trustee (filed on January 22, 2016 as Exhibit 4.1 to The Williams Company, Inc.’s current report on Form 8-K (File No. 001-04174) and incorporated herein by reference).
|
|
10.1§
|
—
|
The Williams Companies Amended and Restated Retirement Restoration Plan effective January l , 2008 (filed on February 25, 2009 as Exhibit 10.1 to The Williams Companies, Inc.’s annual report on Form 10-K (File No. 001-04174) and incorporated herein by reference).
|
|
10.2§
|
—
|
Form of Director and Officer Indemnification Agreement (filed on September 24, 2008 as Exhibit 10.1 to The Williams Companies, Inc.’s current report on Form 8-K (File No. 001-04174) and incorporated herein by reference).
|
|
10.3§
|
—
|
Form of 2011 Restricted Stock Unit Agreement among Williams and certain nonmanagement directors (filed on February 27, 2012 as Exhibit 10.7 to The Williams Companies, Inc.’s annual report on Form 10-K (File No. 001-04174) and incorporated herein by reference).
|
|
10.4§
|
—
|
Form of 2012 Restricted Stock Unit Agreement among Williams and certain nonmanagement directors (filed on August 2, 2012 as Exhibit 10.2 to The Williams Companies, Inc.’s quarterly report on Form 10-Q (File No. 001-04174) and incorporated herein by reference).
|
|
10.5§
|
—
|
Form of 2013 Performance-Based Restricted Stock Unit Agreement among Williams and certain employees and officers (filed on February 27, 2013 as Exhibit 10.4 to The Williams Companies, Inc.’s annual report on Form 10-K (File No. 001-04174) and incorporated herein by reference).
|
|
10.6§
|
—
|
Form of 2013 Restricted Stock Unit Agreement among Williams and certain employees and officers (filed on February 27, 2013 as Exhibit 10.5 to The Williams Companies Inc.’s annual report on Form 10-K (File No. 001-04174) and incorporated herein by reference).
|
228
|
Exhibit
No. |
Description
|
|
|
10.7§
|
—
|
Form of 2013 Nonqualified Stock Option Agreement among Williams and certain employees and officers (filed on February 27, 2013 as Exhibit 10.6 to The Williams Companies, Inc.’s annual report on Form 10-K (File No. 001-04174) and incorporated herein by reference).
|
|
10.8§
|
—
|
Form of 2013 Restricted Stock Unit Agreement among Williams and certain nonmanagement directors (filed on February 26, 2014 as Exhibit 10.11 to The Williams Companies, Inc. annual report on Form 10-K (File No. 001-04174) and incorporated herein by reference).
|
|
10.9§
|
—
|
Form of 2014 Performance-Based Restricted Stock Unit Agreement among Williams and certain employees and officers (filed on February 26, 2014 as Exhibit 10.6 to The Williams Companies, Inc. annual report on Form 10-K (File No. 001-04174) and incorporated herein by reference).
|
|
10.10§
|
—
|
Form of 2014 Restricted Stock Unit Agreement among Williams and certain employees and officers (filed on February 26, 2014 as Exhibit 10.7 to The Williams Companies, Inc. annual report on Form 10-K (File No. 001-04174) and incorporated herein by reference).
|
|
10.11§
|
—
|
Form of 2014 Nonqualified Stock Option Agreement among Williams and certain employees and officers (filed on February 26, 2014 as Exhibit 10.8 to The Williams Companies, Inc. annual report on Form 10-K (File No. 001-04174) and incorporated herein by reference).
|
|
10.12
|
—
|
Form of 2014 Restricted Stock Unit Agreement among Williams and certain nonmanagement directors (filed on February 25, 2015 as Exhibit 10.12 to The Williams Companies, Inc. annual report on Form 10-K (File No. 001-04174) and incorporated herein by reference).
|
|
10.13§
|
—
|
Form of October 2014 Leveraged Performance Unit Award Agreement among Williams and certain officers (filed on February 25, 2015 as Exhibit 10.13 to The Williams Companies, Inc. annual report on Form 10-K (File No. 001-04174) and incorporated herein by reference).
|
|
10.14§
|
—
|
Form of Leveraged Performance Unit Award Agreement dated January 1, 2015 between Williams and Walter Bennett (filed on February 25, 2015 as Exhibit 10.14 to The Williams Companies, Inc. annual report on Form 10-K (File No. 001-04174) and incorporated herein by reference).
|
|
10.15§
|
—
|
Form of 2015 Performance-Based Restricted Stock Unit Agreement among Williams and certain employees and officers (filed on February 25, 2015 as Exhibit 10.15 to The Williams Companies, Inc. annual report on Form 10-K (File No. 001-04174) and incorporated herein by reference).
|
|
10.16§
|
—
|
Form of 2015 Time-Based Restricted Stock Unit Agreement among Williams and certain employees and officers (filed on February 25, 2015 as Exhibit 10.16 to The Williams Companies, Inc. annual report on Form 10-K (File No. 001-04174) and incorporated herein by reference).
|
|
10.17§
|
—
|
Form of 2015 Nonqualified Stock Option Agreement among Williams and certain employees and officers (filed on February 25, 2015 as Exhibit 10.17 to The Williams Companies, Inc. annual report on Form 10-K (File No. 001-04174) and incorporated herein by reference).
|
|
10.18§
|
—
|
Form of 2015 Short-Term Non-Equity Incentive Award Agreement among The Williams Companies Inc. and certain employees and officers (filed on October 29, 2015 as Exhibit 10.2 to The Williams Companies, Inc. quarterly report on Form 10-Q (File No. 001-04174) and incorporated herein by reference).
|
|
10.19§
|
—
|
Form of 2015 Non-Equity Incentive Award Agreement among The Williams Companies Inc. and certain employees and officers (filed on October 29, 2015 as Exhibit 10.3 to The Williams Companies, Inc. quarterly report on Form 10-Q (File No. 001-04174) and incorporated herein by reference).
|
229
|
Exhibit
No. |
Description
|
|
|
10.20§
|
—
|
The Williams Companies, Inc. I996 Stock Plan for Nonemployee Directors (filed on March 27, 1996 as Exhibit B to The Williams Companies, Inc.’s Proxy Statement (File No. 002-27038) and incorporated herein by reference).
|
|
10.21§
|
—
|
The Williams Companies, Inc. 2002 Incentive Plan as amended and restated effective as of January 23, 2004 (filed on August 5, 2004 as Exhibit 10.1 to The Williams Companies, Inc.’s quarterly report on Form 10-Q (File No. 001-04174) and incorporated herein by reference).
|
|
10.22§
|
—
|
Amendment No. 1 to The Williams Companies, Inc. 2002 Incentive Plan (filed on February 25, 2009 as Exhibit 10.11 to The Williams Companies, Inc.’s annual report on Form 10-K (File No. 001-04174) and incorporated herein by reference).
|
|
10.23§
|
—
|
Amendment No. 2 to The Williams Companies, Inc. 2002 Incentive Plan (filed on February 25, 2009 as Exhibit 10.12 to The Williams Companies, Inc.’s annual report on Form 10-K (File No. 001-04174) and incorporated herein by reference).
|
|
10.24§
|
—
|
The Williams Companies, Inc. 2007 Incentive Plan as amended and restated effective January 19, 2012 (filed on May 1, 2012 as Exhibit 10.12 to The Williams Companies, Inc.’s annual report on Form 10-K (File No. 001-04174) and incorporated herein by reference).
|
|
10.25§
|
—
|
Amended and Restated Change-in-Control Severance Agreement between the Company and certain executive officers (Tier I Executives) (filed on February 27, 2013 as Exhibit 10.14 to The Williams Companies, Inc.’s annual report on Form 10-K (File No. 001-04174) and incorporated herein by reference).
|
|
10.26§
|
—
|
Amended and Restated Change-in-Control Severance Agreement between the Company and certain executive officers (Tier II Executives) (filed on February 27, 2012, as Exhibit 10.14 to The Williams Companies, Inc.’s annual report on Form 10-K (File No. 001-04174) and incorporated herein by reference).
|
|
10.27
|
—
|
Separation and Distribution Agreement dated as of December 30, 2011, between The Williams Companies, Inc. and WPX Energy, Inc. (Filed on February 27, 2012 as Exhibit 10.19 to The Williams Companies, Inc.’s annual report on Form 10-K (File No. 001-04174) and incorporated herein by reference).
|
|
10.28
|
—
|
Tax Sharing Agreement, dated as of December 30, 2011, between The Williams Companies, Inc. and WPX Energy, Inc. (filed on January 6, 2012 as Exhibit 10.3 to The Williams Companies, Inc.’s current report on Form 8-K (File No. 001-04174) and incorporated herein by reference).
|
|
10.29
|
—
|
Letter Agreement, dated January 27, 2014, with James E. Scheel, Senior Vice President - Northeast G&P, regarding Relocation from Pennsylvania Benefits (filed on May 1, 2014 as Exhibit 10.2 to The Williams Companies, Inc.’s quarterly report on Form 10-Q (File No. 001-04174) and incorporated herein by reference).
|
|
10.30
|
—
|
Settlement Agreement, dated as of February 25, 2014, by and among Corvex Management LP, Keith Meister, Soroban Master Fund LP, Soroban Capital Partners LLC, Eric W. Mandelblatt, and The Williams Companies, Inc. (filed on February 25, 2014, as Exhibit 99.1 to The Williams Companies Inc.’s current report on Form 8-K (File No. 001-04174) and incorporated herein by reference).
|
|
10.31
|
—
|
The Williams Companies, Inc. 2007 Incentive Plan as amended and restated effective May 22, 2014 (filed April 11, 2014 as Appendix A to The Williams Companies, Inc.’s Definitive Proxy Statement on Schedule 14A (File No. 001-04174) and incorporated herein by reference).
|
230
|
Exhibit
No. |
Description
|
|
|
10.32
|
—
|
Purchase Agreement, dated as of June 14, 2014, by and among GIP II Eagle Holdings Partnership, L.P., GIP II Hawk Holdings Partnership, L.P., GIP II Eagle 2 Holding, L.P. and GIP Hawk 2 Holding, L.P., as Sellers and The Williams Companies, Inc., as Buyer (filed on June 16, 2014 as Exhibit 10.1 to The Williams Companies, Inc.’s current report on Form 8-K (File No. 001-04174) and incorporated herein by reference).
|
|
10.33
|
—
|
Second Amended and Restated Credit Agreement dated as of February 2, 2015, between The Williams Companies, Inc., the lenders named therein, and Citibank, N.A. as Administrative Agent (filed on February 3, 2015 as Exhibit 10.1 to The Williams Companies, Inc.’s current report on Form 8-K (File 001-04174) and incorporated herein by reference).
|
|
10.34
|
—
|
Credit Agreement dated as of August 26, 2015, by and among Williams Partners L.P., the lenders named therein, and Barclays Bank PLC as Administrative Agent (filed on August 28, 2015 as Exhibit 10.1 to Williams Partners L.P.’s Current Report on Form 8-K (File No. 001-34831) and incorporated herein by reference).
|
|
10.35
|
—
|
Termination Agreement and Release, dated as of September 28, 2015, by and among The Williams Companies, Inc., SCMS LLC, Williams Partners L.P. and WPZ GP LLC (filed on September 28, 2015 as Exhibit 10.1 to Williams Companies, Inc.’s Current Report on Form 8-K (File No. 001-04174) and incorporated herein by reference).
|
|
10.36
|
—
|
Amendment No. 1 to Second Amended and Restated Credit Agreement dated as of December 18, 2015, between Williams Partners L.P., Northwest Pipeline LLC, Transcontinental Gas Pipe Line Company, LLC, as co-borrowers, the lenders named therein, and Citibank, N.A. as Administrative Agent (filed on December 23, 2015 as Exhibit 10.1 to Williams Companies, Inc.’s Current Report on Form 8-K (File No. 001-04174) and incorporated herein by reference).
|
|
10.37
|
—
|
Credit Agreement dated as of December 23, 2015, between Williams Partners L.P., the lenders named therein, and Barclays Bank PLC as Administrative Agent (filed on December 23, 2015 as Exhibit 10.2 to Williams Companies, Inc.’s Current Report on Form 8-K (File No. 001-04174) and incorporated herein by reference).
|
|
10.38
|
—
|
Second Amended and Restated Credit Agreement dated as of February 2, 2015, between Williams Partners L.P. (formerly known as Access Midstream Partners, L.P.), Northwest Pipeline LLC, Transcontinental Gas Pipeline Company, LLC, as co-borrowers, the lenders named therein, and Citibank, N.A. as Administrative Agent (filed on February 3, 2015 as Exhibit 10.1 to Williams Partners L.P.’s Current Report on Form 8-K (File No. 001-34831) and incorporated herein by reference).
|
|
10.39
|
—
|
Form of Amended and Restated Commercial Paper Dealer Agreement, dated as of February 2, 2015, between Williams Partners L.P., as Issuer, and the Dealer party thereto(filed on February 3, 2015 as Exhibit 10.3 to Williams Partners L.P.’s Current Report on Form 8-K (File No. 001-34831) and incorporated herein by reference).
|
|
10.40
|
—
|
Credit Agreement dated as of February 3, 2015, between Williams Partners L.P., the lenders named therein, and Barclays Bank PLC as Administrative Agent (filed on February 3, 2015 as Exhibit 10.2 to Williams Partners L.P.’s Current Report on Form 8-K (File No. 001-34831) and incorporated herein by reference).
|
|
10.41
|
—
|
Registration Rights Agreement, dated January 22, 2016, between Transcontinental Gas Pipe Line Company, LLC and each of the initial purchasers listed therein (filed on January 22, 2016 as Exhibit 10.1 to The Williams Companies, Inc.’s Form 8-K (File No. 001-04174) and incorporated herein by reference).
|
|
12*
|
—
|
Computation of Ratio of Earnings to Combined Fixed Charges.
|
|
14
|
—
|
Code of Ethics for Senior Officers (filed on March 15, 2004 as Exhibit 14 to The Williams
Companies, Inc.’s Form 10-K and incorporated herein by reference). |
231
|
Exhibit
No. |
Description
|
|
|
21*
|
—
|
Subsidiaries of the registrant.
|
|
23.1*
|
—
|
Consent of Independent Registered Public Accounting Firm, Ernst & Young LLP.
|
|
23.2*
|
—
|
Consent of Independent Registered Public Accounting Firm, Deloitte & Touche LLP.
|
|
23.3*
|
—
|
Consent of Independent Registered Public Accounting Firm, PricewaterhouseCoopers LLP.
|
|
24*
|
—
|
Power of Attorney.
|
|
31.1*
|
—
|
Certification of the Chief Executive Officer pursuant to Rules 13a-l 4(a) and 15d-14(a) promulgated under the Securities Exchange Act of 1934, as amended, and Item 601(b)(3 l) of Regulation S-K, as adopted pursuant to Section 302 of the Sarbanes-Oxley Act of 2002.
|
|
31.2*
|
—
|
Certification of the Chief Financial Officer pursuant to Rules 13a-14(a) and l 5d-l 4(a) promulgated under the Securities Exchange Act of 1934, as amended, and Item 601(b)(31) of Regulation S-K, as adopted pursuant to Section 302 of the Sarbanes-Oxley Act of 2002.
|
|
32**
|
—
|
Certification of the Chief Executive Officer and the Chief Financial Officer pursuant to 18 U.S.C. Section 1350, as adopted pursuant to Section 906 of the Sarbanes-Oxley Act of 2002.
|
|
101.INS*
|
—
|
XBRL Instance Document.
|
|
101.SCH*
|
—
|
XBRL Taxonomy Extension Schema.
|
|
101.CAL*
|
—
|
XBRL Taxonomy Extension Calculation Linkbase.
|
|
101.DEF*
|
—
|
XBRL Taxonomy Extension Definition Linkbase.
|
|
101.LAB*
|
—
|
XBRL Taxonomy Extension Label Linkbase.
|
|
101.PRE*
|
—
|
XBRL Taxonomy Extension Presentation Linkbase.
|
|
______________
|
|
|
*
|
Filed herewith
|
|
**
|
Furnished herewith
|
|
§
|
Management contract or compensatory plan or arrangement
|
|
+
|
Pursuant to item 601(6)(2) of Regulation S-K, the registrant agrees to furnish supplementally a copy of any omitted exhibit or schedule to the SEC upon request.
|
232
TABLE OF CONTENTS
Part IItem 1. BusinessNote 1 General, Description Of Business, Basis Of Presentation, and Summary Of Significant Accounting PoliciesItem 8 Financial Statements and Supplementary Data Notes To Consolidated Financial StatementsNote 19 Segment DisclosuresNote 17 Fair Value Measurements, Guarantees, and Concentration Of Credit RiskNote 18 Contingent Liabilities and CommitmentsItem 1A. Risk FactorsNote 14 Debt, Banking Arrangements, and LeasesItem 1B. Unresolved Staff CommentsItem 2. PropertiesItem 3. Legal ProceedingsItem 4. Mine Safety DisclosuresPart IIItem 5. Market For Registrant S Common Equity, Related Stockholder Matters and Issuer Purchases Of Equity SecuritiesItem 6. Selected Financial DataNote 2 AcquisitionsNote 15 Stockholders' EquityItem 7. Management S Discussion and Analysis Of Financial Condition and Results Of OperationsNote 9 Employee Benefit PlansNote 6 Other Income and ExpensesNote 5 Investing ActivitiesNote 7 Provision (benefit) For Income TaxesNote 3 Variable Interest EntitiesNote 11 Property, Plant, and EquipmentItem 7A. Quantitative and Qualitative Disclosures About Market RiskItem 8. Financial Statements and Supplementary DataNote 16 Equity-based CompensationNote 4 Related Party TransactionsNote 8 Earnings (loss) Per Common Share From Continuing OperationsNote 10 InventoriesNote 12 Goodwill and Other Intangible AssetsNote 13 Accrued LiabilitiesNote 1. GuaranteesNote 2. Cash Dividends ReceivedItem 9. Changes in and Disagreements with Accountants on Accounting and Financial DisclosureItem 9A. Controls and ProceduresItem 9B. Other InformationPart IIIItem 10. Directors, Executive Officers and Corporate GovernanceItem 11. Executive CompensationItem 12. Security Ownership Of Certain Beneficial Owners and Management and Related Stockholder MattersItem 13. Certain Relationships and Related Transactions, and Director IndependenceItem 14. Principal Accountant Fees and ServicesPart IVItem 15. Exhibits and Financial Statement Schedules