WILLIAMS COMPANIES, INC.
10-Ks and 10-Qs
|
|
|
|
|
|
|
|
|
|
|
|
|
|
|
|
|
|
|
|
|
|
|
|
|
|
|
|
|
|
|
|
|
|
|
|
|
|
|
|
|
|
|
|
|
|
|
|
|
|
|
|
|
|
|
|
UNITED STATES SECURITIES AND EXCHANGE COMMISSION
Washington, D.C. 20549
FORM 10-Q
(Mark One)
|
þ
|
QUARTERLY REPORT PURSUANT TO SECTION 13 OR 15(d) OF THE SECURITIES EXCHANGE ACT OF 1934
|
For the quarterly period ended
June 30, 2014
or
|
¨
|
TRANSITION REPORT PURSUANT TO SECTION 13 OR 15(d) OF THE SECURITIES EXCHANGE ACT OF 1934
|
For the transition period from _____________ to ____________
_
Commission file number 1-4174
|
THE WILLIAMS COMPANIES, INC.
|
|
(Exact name of registrant as specified in its charter)
|
|
DELAWARE
|
73-0569878
|
|
|
(State or other jurisdiction of incorporation or organization)
|
(I.R.S. Employer Identification No.)
|
|
|
ONE WILLIAMS CENTER
|
||
|
TULSA, OKLAHOMA
|
74172-0172
|
|
|
(Address of principal executive offices)
|
(Zip Code)
|
|
Registrant’s telephone number, including area code: (918) 573-2000
NO CHANGE
(Former name, former address and former fiscal year, if changed since last report.)
Indicate by check mark whether the registrant (1) has filed all reports required to be filed by Section 13 or 15(d) of the Securities Exchange Act of 1934 during the preceding 12 months (or for such shorter period that the registrant was required to file such reports), and (2) has been subject to such filing requirements for the past 90 days. Yes
þ
No
¨
Indicate by check mark whether the registrant has submitted electronically and posted on its corporate Web site, if any, every Interactive Data File required to be submitted and posted pursuant to Rule 405 of Regulation S-T (§232.405 of this chapter) during the preceding 12 months (or for such shorter period that the registrant was required to submit and post such files).
þ
Yes
¨
No
Indicate by check mark whether the registrant is a large accelerated filer, an accelerated filer, a non-accelerated filer, or a smaller reporting company. See the definitions of “large accelerated filer,” “accelerated filer” and “smaller reporting company” in Rule 12b-2 of the Exchange Act.
(Check one):
|
Large accelerated filer
þ
|
Accelerated filer
¨
|
Non-accelerated filer
¨
|
Smaller reporting company
¨
|
|||
|
(Do not check if a smaller reporting company)
|
||||||
Indicate by check mark whether the registrant is a shell company (as defined in Rule 12b-2 of the Exchange Act.) Yes
¨
No
þ
Indicate the number of shares outstanding of each of the issuer’s classes of common stock, as of the latest practicable date.
|
Class
|
Shares Outstanding at July 28, 2014
|
|
|
Common Stock, $1 par value
|
747,311,764
|
|
The Williams Companies, Inc.
Index
|
Page
|
|
|
Item 1. Financial Statements
|
|
Certain matters contained in this document include “forward-looking statements” within the meaning of Section 27A of the Securities Act of 1933, as amended, and Section 21E of the Securities Exchange Act of 1934, as amended. These forward-looking statements relate to anticipated financial performance, management’s plans and objectives for future operations, business prospects, outcome of regulatory proceedings, market conditions, and other matters. We make these forward-looking statements in reliance on the safe harbor protections provided under the Private Securities Litigation Reform Act of 1995.
All statements, other than statements of historical facts, included in this document that address activities, events or developments that we expect, believe or anticipate will exist or may occur in the future, are forward-looking statements. Forward-looking statements can be identified by various forms of words such as “anticipates,” “believes,” “seeks,” “could,” “may,” “should,” “continues,” “estimates,” “expects,” “forecasts,” “intends,” “might,” “proposed,” “goals,” “objectives,” “targets,” “planned,” “potential,” “projects,” “scheduled,” “will,” “assumes,” “guidance,” “outlook,” “in service date” or other similar expressions. These forward-looking statements are based on management’s beliefs and assumptions and on information currently available to management and include, among others, statements regarding:
|
•
|
The levels of dividends to stockholders;
|
|
•
|
Expected levels of cash distributions by Access Midstream Partners, L.P. (ACMP) and Williams Partners L.P. (WPZ) with respect to general partner interests, incentive distribution rights, and limited partner interests;
|
|
•
|
Amounts and nature of future capital expenditures;
|
|
•
|
Expansion and growth of our business and operations;
|
|
•
|
Financial condition and liquidity;
|
1
|
•
|
Business strategy;
|
|
•
|
Cash flow from operations or results of operations;
|
|
•
|
Seasonality of certain business components;
|
|
•
|
Natural gas, natural gas liquids, and olefins prices, supply and demand;
|
|
•
|
Demand for our services;
|
|
•
|
The proposed merger (the Proposed Merger) of ACMP and WPZ.
|
Forward-looking statements are based on numerous assumptions, uncertainties and risks that could cause future events or results to be materially different from those stated or implied in this document. Many of the factors that will determine these results are beyond our ability to control or predict. Specific factors that could cause actual results to differ from results contemplated by the forward-looking statements include, among others, the following:
|
•
|
Whether WPZ, ACMP, or the merged partnership will produce sufficient cash flows to provide the level of cash distributions we expect;
|
|
•
|
The structure, terms, timing and approval of the Proposed Merger, as to be negotiated by the conflicts committees of ACMP and WPZ;
|
|
•
|
Whether we are able to pay current and expected levels of dividends;
|
|
•
|
Availability of supplies, market demand, and volatility of prices;
|
|
•
|
Inflation, interest rates, fluctuation in foreign exchange rates, and general economic conditions (including future disruptions and volatility in the global credit markets and the impact of these events on our customers and suppliers);
|
|
•
|
The strength and financial resources of our competitors and the effects of competition;
|
|
•
|
Whether we are able to successfully identify, evaluate and execute investment opportunities;
|
|
•
|
Our ability to acquire new businesses and assets and successfully integrate those operations and assets, including ACMP’s business, into our existing businesses, as well as successfully expand our facilities;
|
|
•
|
Development of alternative energy sources;
|
|
•
|
The impact of operational and development hazards and unforeseen interruptions;
|
|
•
|
Costs of, changes in, or the results of laws, government regulations (including safety and environmental regulations), environmental liabilities, litigation, and rate proceedings;
|
|
•
|
Our costs and funding obligations for defined benefit pension plans and other postretirement benefit plans;
|
|
•
|
Changes in maintenance and construction costs;
|
|
•
|
Changes in the current geopolitical situation;
|
|
•
|
Our exposure to the credit risk of our customers and counterparties;
|
2
|
•
|
Risks related to strategy and financing, including restrictions stemming from our debt agreements, future changes in our credit ratings and the availability and cost of capital;
|
|
•
|
The amount of cash distributions from and capital requirements of our investments and joint ventures in which we participate;
|
|
•
|
Risks associated with weather and natural phenomena, including climate conditions;
|
|
•
|
Acts of terrorism, including cybersecurity threats and related disruptions;
|
|
•
|
Additional risks described in our filings with the Securities and Exchange Commission.
|
Given the uncertainties and risk factors that could cause our actual results to differ materially from those contained in any forward-looking statement, we caution investors not to unduly rely on our forward-looking statements. We disclaim any obligations to and do not intend to update the above list or to announce publicly the result of any revisions to any of the forward-looking statements to reflect future events or developments.
In addition to causing our actual results to differ, the factors listed above and referred to below may cause our intentions to change from those statements of intention set forth in this document. Such changes in our intentions may also cause our results to differ. We may change our intentions, at any time and without notice, based upon changes in such factors, our assumptions, or otherwise.
Because forward-looking statements involve risks and uncertainties, we caution that there are important factors, in addition to those listed above, that may cause actual results to differ materially from those contained in the forward-looking statements. For a detailed discussion of those factors, see Part I, Item 1A. Risk Factors in our Annual Report on Form 10-K for the year ended December 31, 2013, and Part II, Item 1A. Risk Factors of this Form 10-Q.
3
DEFINITIONS
The following is a listing of certain abbreviations, acronyms and other industry terminology used throughout this Form 10-Q.
Measurements
:
Barrel
: One barrel of petroleum products that equals 42 U.S. gallons
Bcf
: One billion cubic feet of natural gas
Bcf/d
: One billion cubic feet of natural gas per day
British Thermal Unit (Btu)
: A unit of energy needed to raise the temperature of one pound of water by one degree
Fahrenheit
Dekatherms (Dth)
: A unit of energy equal to one million British thermal units
Mbbls/d
: One thousand barrels per day
Mdth/d
: One thousand dekatherms per day
MMcf/d
: One million cubic feet per day
Consolidated Entities
:
Constitution:
Constitution Pipeline Company, LLC
Gulfstar One:
Gulfstar One LLC
Northwest Pipeline:
Northwest Pipeline LLC
Transco:
Transcontinental Gas Pipe Line Company, LLC
WPZ:
Williams Partners L.P.
Partially Owned Entities
: Entities in which we do not own a 100 percent ownership interest and which, as of June 30, 2014, we account for as an equity investment, including principally the following:
Access GP:
Access Midstream Partners GP, L.L.C.
Access Midstream Partners:
Access GP and ACMP
ACMP:
Access Midstream Partners, L.P.
Aux Sable:
Aux Sable Liquid Products LP
Bluegrass Pipeline:
Bluegrass Pipeline Company LLC
Caiman II:
Caiman Energy II, LLC
Discovery:
Discovery Producer Services LLC
Gulfstream:
Gulfstream Natural Gas System, L.L.C.
Laurel Mountain:
Laurel Mountain Midstream, LLC
Moss Lake:
Moss Lake Fractionation LLC and Moss Lake LPG Terminal LLC
OPPL:
Overland Pass Pipeline Company LLC
Government and Regulatory:
EPA:
Environmental Protection Agency
FERC:
Federal Energy Regulatory Commission
4
Other
:
B/B Splitter:
Butylene/Butane splitter
RGP Splitter:
Refinery grade propylene splitter
IDR:
Incentive distribution right
NGLs:
Natural gas liquids; natural gas liquids result from natural gas processing and crude oil refining and are
used as petrochemical feedstocks, heating fuels, and gasoline additives, among other applications
NGL margins
:
NGL revenues less Btu replacement cost, plant fuel, transportation, and fractionation
5
The Williams Companies, Inc.
(Unaudited)
|
Three months ended
June 30, |
Six months ended
June 30, |
|||||||||||||||
|
2014
|
2013
|
2014
|
2013
|
|||||||||||||
|
(Millions, except per-share amounts)
|
||||||||||||||||
|
Revenues:
|
||||||||||||||||
|
Service revenues
|
$
|
825
|
|
$
|
721
|
|
$
|
1,644
|
|
|
$
|
1,427
|
|
|||
|
Product sales
|
853
|
|
1,046
|
|
1,783
|
|
|
2,150
|
|
|||||||
|
Total revenues
|
1,678
|
|
1,767
|
|
3,427
|
|
|
3,577
|
|
|||||||
|
Costs and expenses:
|
|
|
|
|
||||||||||||
|
Product costs
|
724
|
|
801
|
|
1,493
|
|
|
1,591
|
|
|||||||
|
Operating and maintenance expenses
|
308
|
|
291
|
|
606
|
|
|
551
|
|
|||||||
|
Depreciation and amortization expenses
|
214
|
|
198
|
|
428
|
|
|
399
|
|
|||||||
|
Selling, general, and administrative expenses
|
136
|
|
123
|
|
286
|
|
|
255
|
|
|||||||
|
Net insurance recoveries – Geismar Incident
|
(42
|
)
|
—
|
|
(161
|
)
|
—
|
|
||||||||
|
Other (income) expense – net
|
27
|
|
4
|
|
44
|
|
|
5
|
|
|||||||
|
Total costs and expenses
|
1,367
|
|
1,417
|
|
2,696
|
|
|
2,801
|
|
|||||||
|
Operating income (loss)
|
311
|
|
350
|
|
731
|
|
|
776
|
|
|||||||
|
Equity earnings (losses)
|
37
|
|
38
|
|
(11
|
)
|
|
56
|
|
|||||||
|
Interest incurred
|
(192
|
)
|
|
(151
|
)
|
|
(361
|
)
|
|
(303
|
)
|
|||||
|
Interest capitalized
|
29
|
|
|
24
|
|
|
58
|
|
|
48
|
|
|||||
|
Other investing income – net
|
18
|
|
39
|
|
32
|
|
|
52
|
|
|||||||
|
Other income (expense) – net
|
4
|
|
2
|
|
5
|
|
|
—
|
|
|||||||
|
Income (loss) from continuing operations before income taxes
|
207
|
|
302
|
|
454
|
|
|
629
|
|
|||||||
|
Provision (benefit) for income taxes
|
84
|
|
102
|
|
135
|
|
|
198
|
|
|||||||
|
Income (loss) from continuing operations
|
123
|
|
200
|
|
319
|
|
|
431
|
|
|||||||
|
Income (loss) from discontinued operations
|
4
|
|
(8
|
)
|
4
|
|
|
(9
|
)
|
|||||||
|
Net income (loss)
|
127
|
|
192
|
|
323
|
|
|
422
|
|
|||||||
|
Less: Net income attributable to noncontrolling interests
|
24
|
|
50
|
|
80
|
|
|
119
|
|
|||||||
|
Net income (loss) attributable to The Williams Companies, Inc.
|
$
|
103
|
|
$
|
142
|
|
$
|
243
|
|
|
$
|
303
|
|
|||
|
Amounts attributable to The Williams Companies, Inc.:
|
||||||||||||||||
|
Income (loss) from continuing operations
|
$
|
99
|
|
$
|
149
|
|
$
|
239
|
|
$
|
311
|
|
||||
|
Income (loss) from discontinued operations
|
4
|
|
(7
|
)
|
4
|
|
(8
|
)
|
||||||||
|
Net income (loss)
|
$
|
103
|
|
$
|
142
|
|
$
|
243
|
|
$
|
303
|
|
||||
|
Basic earnings (loss) per common share:
|
||||||||||||||||
|
Income (loss) from continuing operations
|
$
|
.14
|
|
$
|
.22
|
|
$
|
.34
|
|
$
|
.45
|
|
||||
|
Income (loss) from discontinued operations
|
.01
|
|
(.01
|
)
|
.01
|
|
(.01
|
)
|
||||||||
|
Net income (loss)
|
$
|
.15
|
|
$
|
.21
|
|
$
|
.35
|
|
$
|
.44
|
|
||||
|
Weighted-average shares (thousands)
|
696,553
|
|
682,893
|
|
690,695
|
|
682,475
|
|
||||||||
|
Diluted earnings (loss) per common share:
|
||||||||||||||||
|
Income (loss) from continuing operations
|
$
|
.14
|
|
$
|
.22
|
|
$
|
.34
|
|
$
|
.45
|
|
||||
|
Income (loss) from discontinued operations
|
.01
|
|
(.01
|
)
|
.01
|
|
(.01
|
)
|
||||||||
|
Net income (loss)
|
$
|
.15
|
|
$
|
.21
|
|
$
|
.35
|
|
$
|
.44
|
|
||||
|
Weighted-average shares (thousands)
|
700,696
|
|
686,924
|
|
694,832
|
|
686,855
|
|
||||||||
|
Cash dividends declared per common share
|
$
|
.4250
|
|
$
|
.3525
|
|
$
|
.8275
|
|
$
|
.69125
|
|
||||
See accompanying notes.
6
The Williams Companies, Inc.
Consolidated Statement of Comprehensive Income
(Unaudited)
|
Three months ended
June 30, |
Six months ended
June 30, |
|||||||||||||||
|
2014
|
2013
|
2014
|
2013
|
|||||||||||||
|
(Millions)
|
||||||||||||||||
|
Net income (loss)
|
$
|
127
|
|
$
|
192
|
|
$
|
323
|
|
$
|
422
|
|
||||
|
Other comprehensive income (loss):
|
||||||||||||||||
|
Foreign currency translation adjustments, net of taxes of ($9) and ($8) in 2014
|
37
|
|
(30
|
)
|
(7
|
)
|
(51
|
)
|
||||||||
|
Pension and other postretirement benefits:
|
||||||||||||||||
|
Amortization of prior service cost (credit) included in net periodic benefit cost, net of taxes of $1 and $2 in 2014
|
(1
|
)
|
—
|
|
(2
|
)
|
(1
|
)
|
||||||||
|
Amortization of actuarial (gain) loss included in net periodic benefit cost, net of taxes of ($4) and ($7) in 2014 and ($5) and ($11) in 2013, respectively
|
6
|
|
10
|
|
12
|
|
20
|
|
||||||||
|
Other comprehensive income (loss)
|
42
|
|
(20
|
)
|
3
|
|
(32
|
)
|
||||||||
|
Comprehensive income (loss)
|
169
|
|
172
|
|
326
|
|
390
|
|
||||||||
|
Less: Comprehensive income (loss) attributable to noncontrolling interests
|
37
|
|
50
|
|
93
|
|
119
|
|
||||||||
|
Comprehensive income (loss) attributable to The Williams Companies, Inc.
|
$
|
132
|
|
$
|
122
|
|
$
|
233
|
|
$
|
271
|
|
||||
See accompanying notes.
7
The Williams Companies, Inc.
(Unaudited)
|
June 30,
2014 |
December 31,
2013 |
|||||||
|
(Millions, except per-share amounts)
|
||||||||
|
ASSETS
|
||||||||
|
Current assets:
|
||||||||
|
Cash and cash equivalents
|
$
|
860
|
|
$
|
681
|
|
||
|
Accounts and notes receivable, net:
|
||||||||
|
Trade and other
|
576
|
|
600
|
|
||||
|
Income tax receivable
|
82
|
|
74
|
|
||||
|
Deferred income tax asset
|
132
|
|
27
|
|
||||
|
Inventories
|
276
|
|
194
|
|
||||
|
Other current assets and deferred charges
|
193
|
|
107
|
|
||||
|
Total current assets
|
2,119
|
|
1,683
|
|
||||
|
Investments
|
4,489
|
|
4,360
|
|
||||
|
Property, plant, and equipment, at cost
|
27,380
|
|
25,823
|
|
||||
|
Accumulated depreciation and amortization
|
(7,938
|
)
|
(7,613
|
)
|
||||
|
Property, plant and equipment – net
|
19,442
|
|
18,210
|
|
||||
|
Goodwill
|
646
|
|
646
|
|
||||
|
Other intangible assets, net of amortization
|
1,616
|
|
1,644
|
|
||||
|
Cash held for ACMP Acquisition (Note 13)
|
5,995
|
|
—
|
|
||||
|
Regulatory assets, deferred charges, and other
|
642
|
|
599
|
|
||||
|
Total assets
|
$
|
34,949
|
|
$
|
27,142
|
|
||
|
LIABILITIES AND EQUITY
|
||||||||
|
Current liabilities:
|
||||||||
|
Accounts payable
|
$
|
990
|
|
$
|
960
|
|
||
|
Accrued liabilities
|
655
|
|
797
|
|
||||
|
Commercial paper
|
—
|
|
225
|
|
||||
|
Long-term debt due within one year
|
751
|
|
1
|
|
||||
|
Total current liabilities
|
2,396
|
|
1,983
|
|
||||
|
Long-term debt
|
15,539
|
|
11,353
|
|
||||
|
Deferred income taxes
|
3,658
|
|
3,529
|
|
||||
|
Other noncurrent liabilities
|
1,434
|
|
1,356
|
|
||||
|
Contingent liabilities (Note 11)
|
|
|
||||||
|
Equity:
|
||||||||
|
Stockholders’ equity:
|
||||||||
|
Common stock (960 million shares authorized at $1 par value;
782 million shares issued at June 30, 2014 and 718 million shares
issued at December 31, 2013)
|
782
|
|
718
|
|
||||
|
Capital in excess of par value
|
14,890
|
|
11,599
|
|
||||
|
Retained deficit
|
(6,574
|
)
|
(6,248
|
)
|
||||
|
Accumulated other comprehensive income (loss)
|
(194
|
)
|
(164
|
)
|
||||
|
Treasury stock, at cost (35 million shares of common stock)
|
(1,041
|
)
|
(1,041
|
)
|
||||
|
Total stockholders’ equity
|
7,863
|
|
4,864
|
|
||||
|
Noncontrolling interests in consolidated subsidiaries
|
4,059
|
|
4,057
|
|
||||
|
Total equity
|
11,922
|
|
8,921
|
|
||||
|
Total liabilities and equity
|
$
|
34,949
|
|
$
|
27,142
|
|
||
See accompanying notes.
8
The Williams Companies, Inc.
Consolidated Statement of Changes in Equity
(Unaudited)
|
The Williams Companies, Inc., Stockholders
|
|||||||||||||||||||||||||||||||
|
Common
Stock
|
Capital in
Excess of
Par Value
|
Retained
Deficit
|
Accumulated
Other
Comprehensive
Income (Loss)
|
Treasury
Stock
|
Total
Stockholders’
Equity
|
Noncontrolling
Interest
|
Total Equity
|
||||||||||||||||||||||||
|
(Millions)
|
|||||||||||||||||||||||||||||||
|
Balance – December 31, 2013
|
$
|
718
|
|
$
|
11,599
|
|
$
|
(6,248
|
)
|
$
|
(164
|
)
|
$
|
(1,041
|
)
|
$
|
4,864
|
|
$
|
4,057
|
|
$
|
8,921
|
|
|||||||
|
Net income (loss)
|
—
|
|
—
|
|
243
|
|
—
|
|
—
|
|
243
|
|
80
|
|
323
|
|
|||||||||||||||
|
Other comprehensive income (loss)
|
—
|
|
—
|
|
—
|
|
(10
|
)
|
—
|
|
(10
|
)
|
13
|
|
3
|
|
|||||||||||||||
|
Issuance of common stock for acquisition of business (Note 9)
|
61
|
|
3,317
|
|
—
|
|
—
|
|
—
|
|
3,378
|
|
—
|
|
3,378
|
|
|||||||||||||||
|
Cash dividends – common stock
|
—
|
|
—
|
|
(567
|
)
|
—
|
|
—
|
|
(567
|
)
|
—
|
|
(567
|
)
|
|||||||||||||||
|
Dividends and distributions to noncontrolling interests
|
—
|
|
—
|
|
—
|
|
—
|
|
—
|
|
—
|
|
(296
|
)
|
(296
|
)
|
|||||||||||||||
|
Stock-based compensation and related common stock issuances, net of tax
|
2
|
|
54
|
|
—
|
|
—
|
|
—
|
|
56
|
|
—
|
|
56
|
|
|||||||||||||||
|
Changes in ownership of consolidated subsidiaries, net
|
—
|
|
(79
|
)
|
—
|
|
(20
|
)
|
—
|
|
(99
|
)
|
146
|
|
47
|
|
|||||||||||||||
|
Contributions from noncontrolling interests
|
—
|
|
—
|
|
—
|
|
—
|
|
—
|
|
—
|
|
122
|
|
122
|
|
|||||||||||||||
|
Deconsolidation of Bluegrass Pipeline (Note 2)
|
—
|
|
—
|
|
—
|
|
—
|
|
—
|
|
—
|
|
(63
|
)
|
(63
|
)
|
|||||||||||||||
|
Other
|
1
|
|
(1
|
)
|
(2
|
)
|
—
|
|
—
|
|
(2
|
)
|
—
|
|
(2
|
)
|
|||||||||||||||
|
Balance – June 30, 2014
|
$
|
782
|
|
$
|
14,890
|
|
$
|
(6,574
|
)
|
$
|
(194
|
)
|
$
|
(1,041
|
)
|
$
|
7,863
|
|
$
|
4,059
|
|
$
|
11,922
|
|
|||||||
See accompanying notes.
9
The Williams Companies, Inc.
(Unaudited)
|
|
Six months ended
June 30, |
|||||||
|
2014
|
2013
|
|||||||
|
(Millions)
|
||||||||
|
OPERATING ACTIVITIES:
|
||||||||
|
Net income (loss)
|
$
|
323
|
|
$
|
422
|
|
||
|
Adjustments to reconcile to net cash provided (used) by operating activities:
|
||||||||
|
Depreciation and amortization
|
428
|
|
399
|
|
||||
|
Provision (benefit) for deferred income taxes
|
31
|
|
261
|
|
||||
|
Amortization of stock-based awards
|
23
|
|
20
|
|
||||
|
Cash provided (used) by changes in current assets and liabilities:
|
||||||||
|
Accounts and notes receivable
|
17
|
|
(10
|
)
|
||||
|
Inventories
|
(81
|
)
|
2
|
|
||||
|
Other current assets and deferred charges
|
(37
|
)
|
(8
|
)
|
||||
|
Accounts payable
|
(34
|
)
|
(22
|
)
|
||||
|
Accrued liabilities
|
60
|
|
42
|
|
||||
|
Other, including changes in noncurrent assets and liabilities
|
29
|
|
57
|
|
||||
|
Net cash provided (used) by operating activities
|
759
|
|
1,163
|
|
||||
|
FINANCING ACTIVITIES:
|
||||||||
|
Proceeds from (payments of) commercial paper – net
|
(226
|
)
|
710
|
|
||||
|
Proceeds from long-term debt
|
4,935
|
|
1,705
|
|
||||
|
Payments of long-term debt
|
—
|
|
(2,081
|
)
|
||||
|
Proceeds from issuance of common stock
|
3,408
|
|
9
|
|
||||
|
Proceeds from sale of limited partner units of consolidated partnership
|
—
|
|
617
|
|
||||
|
Dividends paid
|
(567
|
)
|
(472
|
)
|
||||
|
Dividends and distributions paid to noncontrolling interests
|
(296
|
)
|
(224
|
)
|
||||
|
Contributions from noncontrolling interests
|
122
|
|
272
|
|
||||
|
Other – net
|
(20
|
)
|
12
|
|
||||
|
Net cash provided (used) by financing activities
|
7,356
|
|
548
|
|
||||
|
INVESTING ACTIVITIES:
|
||||||||
|
Capital expenditures (1)
|
(1,839
|
)
|
(1,530
|
)
|
||||
|
Purchases of and contributions to equity-method investments
|
(246
|
)
|
(188
|
)
|
||||
|
Cash held for ACMP Acquisition (Note 13)
|
(5,995
|
)
|
—
|
|
||||
|
Other – net
|
144
|
|
(8
|
)
|
||||
|
Net cash provided (used) by investing activities
|
(7,936
|
)
|
(1,726
|
)
|
||||
|
Increase (decrease) in cash and cash equivalents
|
179
|
|
(15
|
)
|
||||
|
Cash and cash equivalents at beginning of period
|
681
|
|
839
|
|
||||
|
Cash and cash equivalents at end of period
|
$
|
860
|
|
$
|
824
|
|
||
|
_________
|
||||||||
|
(1) Increases to property, plant, and equipment
|
$
|
(1,789
|
)
|
$
|
(1,605
|
)
|
||
|
Changes in related accounts payable and accrued liabilities
|
(50
|
)
|
75
|
|
||||
|
Capital expenditures
|
$
|
(1,839
|
)
|
$
|
(1,530
|
)
|
||
See accompanying notes.
10
The Williams Companies, Inc.
Notes to Consolidated Financial Statements
(Unaudited)
Note 1 – General, Description of Business, and Basis of Presentation
General
Our accompanying interim consolidated financial statements do not include all the notes in our annual financial statements and, therefore, should be read in conjunction with the consolidated financial statements and notes thereto in Exhibit 99.1 of our Form 8-K dated May 22, 2014. The accompanying unaudited financial statements include all normal recurring adjustments and others that, in the opinion of management, are necessary to present fairly our interim financial statements.
The preparation of financial statements in conformity with accounting principles generally accepted in the United States requires management to make estimates and assumptions that affect the amounts reported in the consolidated financial statements and accompanying notes. Actual results could differ from those estimates.
Unless the context clearly indicates otherwise, references in this report to “we,” “our,” “us,” or similar language refer to The Williams Companies, Inc. and its subsidiaries.
Description of Business
Our operations are located principally in the United States and are organized into the Williams Partners, Williams NGL & Petchem Services, and Access Midstream Partners reportable segments. All remaining business activities are included in Other.
Williams Partners consists of our consolidated master limited partnership, Williams Partners L.P. (WPZ), and includes gas pipeline and midstream businesses. The gas pipeline businesses primarily consist of two interstate natural gas pipelines, which are Transcontinental Gas Pipe Line Company, LLC (Transco) and Northwest Pipeline LLC (Northwest Pipeline), a
50 percent
equity investment in Gulfstream Natural Gas System, L.L.C., and a
41 percent
interest in Constitution Pipeline Company, LLC (Constitution) (a consolidated entity). WPZ’s midstream operations are composed of significant, large-scale operations in the Rocky Mountain and Gulf Coast regions, operations in the Marcellus Shale region, and various equity investments in domestic natural gas gathering and processing assets and natural gas liquid (NGL) fractionation and transportation assets. WPZ’s midstream assets also include an NGL fractionator and storage facilities near Conway, Kansas as well as an NGL light-feed olefins cracker in Geismar, Louisiana, along with associated ethane and propane pipelines, a refinery grade splitter in Louisiana, an oil sands offgas processing plant located near Fort McMurray, Alberta, and an NGL/olefin fractionation facility and butylene/butane splitter facility at Redwater, Alberta.
Williams NGL & Petchem Services includes certain other domestic olefins pipeline assets, certain Canadian growth projects under development, including a propane dehydrogenation facility and a liquids extraction plant, as well as a
50 percent
equity investment in Bluegrass Pipeline Company LLC (Bluegrass Pipeline). See
Note 2 – Variable Interest Entities
for more information regarding recent developments.
Access Midstream Partners consists of our equity investment in Access Midstream Partners, L.P. (ACMP). At
June 30, 2014
, this investment includes an indirect
50 percent
interest in Access Midstream Partners, GP, L.L.C. (Access GP), including incentive distribution rights, and a
23 percent
limited partner interest in ACMP. ACMP is a publicly traded master limited partnership that provides gathering, treating, and compression services to producers under long-term, fee-based contracts. Access GP is the general partner of ACMP. See
Note 13 – Subsequent Event
for discussion of our third-quarter 2014 ACMP Acquisition.
Other includes other business activities that are not operating segments, as well as corporate operations.
11
Notes (Continued)
Basis of Presentation
We contributed certain Canadian operations in February 2014 to WPZ (Canada Dropdown) for total consideration of
$56 million
of cash (including a
$31 million
post-closing adjustment received in the second quarter),
25,577,521
WPZ Class D limited-partner units, and an increase in the capital account of its general partner to allow us to maintain our
2 percent
general partner interest. In lieu of cash distributions, the Class D units receive quarterly distributions of additional paid-in-kind Class D units. All Class D units outstanding will be convertible to common units beginning in the first quarter of 2016. The contribution agreement governing the Canada Dropdown provides that WPZ can issue additional Class D units to us on a quarterly basis through 2015 for up to a total of
$200 million
in cash for the purpose of funding certain facility expansions. At June 30, 2014, no additional Class D units have been issued to us under this provision. These operations were previously reported within the Williams NGL & Petchem Services segment, but are now reported within Williams Partners. Prior period segment disclosures have been recast for this transaction.
Consolidated master limited partnership
At June 30, 2014, we own approximately
66 percent
of the interests in WPZ, including the interests of the general partner, which are wholly owned by us, and incentive distribution rights.
Changes in our ownership of WPZ related to the issuances of WPZ’s Class D units, while still retaining control, had the net impact of increasing our
Noncontrolling interests in consolidated subsidiaries
by
$146 million
and decreasing
Deferred income taxes
by
$47 million
,
Capital in excess of par value
by
$79 million
and
Accumulated other comprehensive income (loss)
by
$20 million
in the Consolidated Balance Sheet.
WPZ is self-funding and maintains separate lines of bank credit and cash management accounts and also has a commercial paper program. (See
Note 8 – Debt and Banking Arrangements
.) Cash distributions from WPZ to us, including any associated with our incentive distribution rights, occur through the normal partnership distributions from WPZ to all partners.
Discontinued operations
Unless indicated otherwise, the information in the Notes to Consolidated Financial Statements relates to our continuing operations.
Accounting standards issued but not yet adopted
In May 2014, the Financial Accounting Standards Board issued Accounting Standards Update 2014-09 establishing Accounting Standards Codification Topic 606, “Revenue from Contracts with Customers” (ASC 606). ASC 606 establishes a comprehensive new revenue recognition model designed to depict the transfer of goods or services to a customer in an amount that reflects the consideration the entity expects to be entitled to receive in exchange for those goods or services and requires significantly enhanced revenue disclosures. The standard is effective for annual reporting periods beginning after December 15, 2016, and interim periods within the reporting period. Accordingly, we will adopt this standard in the first quarter of 2017. ASC 606 allows either full retrospective or modified retrospective transition and early adoption is not permitted. We are currently evaluating the impact of this new standard on our consolidated financial statements.
Note 2 – Variable Interest Entities
Consolidated VIEs
As of
June 30, 2014
, we consolidate the following variable interest entities (VIEs):
Gulfstar One
WPZ owns a
51 percent
interest in Gulfstar One LLC (Gulfstar One), a subsidiary that, due to certain risk-sharing provisions in its customer contracts, is a VIE. WPZ is the primary beneficiary because it has the power to direct the activities that most significantly impact Gulfstar One’s economic performance. WPZ, as construction agent for Gulfstar
12
Notes (Continued)
One, designed, constructed, and is installing a proprietary floating-production system, Gulfstar FPS
™
, and associated pipelines which will initially provide production handling and gathering services for the Tubular Bells oil and gas discovery in the eastern deepwater Gulf of Mexico. The project is expected to be in service in the third quarter of 2014. WPZ has received certain advance payments from the producer customers and is committed to the producer customers to construct this system. The current estimate of the total remaining construction costs is less than
$50 million
,
which we expect will be funded with capital contributions from WPZ and the other equity partner on a proportional basis. During the second quarter of 2014, WPZ provided a temporary advance to Gulfstar One of
$128 million
to permit ongoing construction pending further expected contributions from its partner. The producer customers will be responsible for the firm price of building the facilities if they do not develop the offshore oil and gas fields to be connected to Gulfstar One.
In July 2014, the other equity partner elected to participate in the funding of an expansion of Gulfstar One that will provide production handling, gathering, and processing services for the Gunflint oil and gas discovery in the eastern deepwater Gulf of Mexico. The expansion project is expected to be in service in the first quarter of 2016. The current estimate of the total remaining construction costs of the Gunflint project is less than
$134 million
which we expect will be funded with capital contributions from WPZ and the other equity partner on a proportional basis.
Constitution
WPZ owns a
41 percent
interest in Constitution, a subsidiary that, due to shipper fixed-payment commitments under its firm transportation contracts, is a VIE. WPZ is the primary beneficiary because it has the power to direct the activities that most significantly impact Constitution’s economic performance. WPZ, as construction agent for Constitution, is building a pipeline connecting our gathering system in Susquehanna County, Pennsylvania, to the Iroquois Gas Transmission and the Tennessee Gas Pipeline systems. WPZ plans to place the project in service in late 2015 to 2016 and estimates the total remaining construction costs of the project to be approximately
$575 million
, which will be funded with capital contributions from WPZ and the other equity partners, proportional to ownership interest.
The following table presents amounts included in our
Consolidated Balance Sheet
that are for the use or obligation of these VIEs, which are joint projects in the development and construction phase.
|
|
June 30,
2014 |
|
December 31, 2013 (1)
|
|
Classification
|
||||
|
|
(Millions)
|
|
|
||||||
|
Assets (liabilities):
|
|
|
|
|
|
||||
|
Cash and cash equivalents
|
$
|
78
|
|
$
|
122
|
|
|
Cash and cash equivalents
|
|
|
Property, plant and equipment
|
1,387
|
|
1,111
|
|
|
Property, plant, and equipment, at cost
|
|||
|
Accounts payable
|
(120
|
)
|
(145
|
)
|
|
Accounts payable
|
|||
|
Construction retainage
|
(4
|
)
|
(3
|
)
|
|
Accrued liabilities
|
|||
|
Current deferred revenue
|
—
|
|
(10
|
)
|
Accrued liabilities
|
||||
|
Asset retirement obligation
|
(30
|
)
|
—
|
|
Other noncurrent liabilities
|
||||
|
Noncurrent deferred revenue associated with customer advance payments
|
(130
|
)
|
(115
|
)
|
|
Other noncurrent liabilities
|
|||
(1) Amounts presented for December 31, 2013, include balances related to Bluegrass Pipeline. See discussion of the subsequent deconsolidation of Bluegrass Pipeline below.
13
Notes (Continued)
Nonconsolidated VIEs
We have also identified certain interests in VIEs for which we are not the primary beneficiary. These include:
Laurel Mountain
WPZ’s
51 percent
-owned equity-method investment in Laurel Mountain Midstream, LLC (Laurel Mountain) is considered to be a VIE generally due to contractual provisions that transfer certain risks to customers. As decisions about the activities that most significantly impact the economic performance of this entity require a unanimous vote of all members, WPZ is not the primary beneficiary. Our maximum exposure to loss is limited to the carrying value of this investment, which was
$477 million
at
June 30, 2014
.
Caiman II
During April 2014, Caiman Energy II, LLC (Caiman II)
,
a previously reported VIE, became able to finance its current activities without additional subordinated financial support due in part to its primary investee securing a revolving credit agreement with a third party. The total equity investment at risk of Caiman II is sufficient to finance its activities. As a result, Caiman II is no longer a VIE and continues to be reported as a
58 percent
-owned equity-method investment.
Bluegrass Pipeline
We currently own a
50 percent
equity-method investment in Bluegrass Pipeline, a proposed NGL pipeline that would connect processing facilities in the Marcellus and Utica shale-gas areas in the northeastern United States to growing petrochemical and export markets in the Gulf Coast area of the United States. Bluegrass Pipeline is considered to be a VIE because it has insufficient equity to finance activities during its development stage. From its inception until February 16, 2014, we were the primary beneficiary of this entity because we had the power to direct whether the project moved forward and thus we previously consolidated the Bluegrass Pipeline.
On February 16, 2014, we and our partner executed an amendment to the governing documents that removed our power to direct whether the project moved forward. As a result, we were no longer the primary beneficiary as of that date, and we deconsolidated the Bluegrass Pipeline and began reporting our 50 percent interest as an equity-method investment. There was
no
gain or loss recognized upon deconsolidation.
Completion of this project is subject to execution of customer contracts sufficient to support the project. Although discussions with potential shippers continue, including both producers and consumers of NGLs that are desiring U.S. Gulf Coast markets, we have not received sufficient executed customer commitments to date to support the continued development of the project. Considering this and other factors, our management decided in April 2014 to discontinue further funding of the project at this time. Given these developments, the capitalized project development costs at the Bluegrass Pipeline entity were written off as of March 31, 2014, and as a result, we recognized
$67 million
in related equity losses in the first quarter of 2014.
Moss Lake
Our
50 percent
-owned equity-method investments in Moss Lake Fractionation LLC and Moss Lake LPG Terminal LLC (collectively referred to as Moss Lake) are considered to be VIEs because they have insufficient equity to finance activities during their development stage. Moss Lake may construct a proposed new large-scale fractionation plant, expand natural gas liquids storage facilities in Louisiana and construct a proposed pipeline connecting these facilities to the Bluegrass Pipeline. Additionally, Moss Lake may construct a proposed new liquefied petroleum gas (LPG) terminal. We are not the primary beneficiary of this entity because we do not have the power to direct the majority of the activities of Moss Lake that most significantly impact its economic performance at this stage. In the first quarter of 2014, we recognized
$4 million
in equity losses related to Moss Lake, primarily associated with the underlying write-off of capitalized project development costs at Moss Lake. The carrying value of our investment in Moss Lake is less than
$1 million
at June 30, 2014.
14
Notes (Continued)
Note 3 – Other Income and Expenses
The following table presents certain gains or losses reflected in
Other (income) expense – net
within
Costs and expenses
in our
Consolidated Statement of Income
:
|
Three months ended
June 30, |
Six months ended
June 30, |
||||||||||||||
|
2014
|
2013
|
2014
|
2013
|
||||||||||||
|
(Millions)
|
|||||||||||||||
|
Williams Partners
|
|||||||||||||||
|
Amortization of regulatory assets associated with asset retirement obligations
|
$
|
8
|
|
$
|
5
|
|
$
|
17
|
|
$
|
7
|
|
|||
|
Write-off of the Eminence abandonment regulatory asset not recoverable through rates
|
—
|
|
6
|
|
—
|
|
6
|
|
|||||||
|
Insurance recoveries associated with the Eminence abandonment
|
—
|
|
(12
|
)
|
—
|
|
(12
|
)
|
|||||||
|
Impairment of certain equipment held for sale (see Note 10)
|
17
|
|
—
|
|
17
|
|
—
|
|
|||||||
Geismar Incident
On June 13, 2013, an explosion and fire occurred at WPZ’s Geismar olefins plant. The fire was extinguished on the day of the incident. The incident (Geismar Incident) rendered the facility temporarily inoperable and resulted in significant human, financial, and operational effects.
We have substantial insurance coverage for repair and replacement costs, lost production, and additional expenses related to the incident as follows:
|
•
|
Property damage and business interruption coverage with a combined per-occurrence limit of
$500 million
and retentions (deductibles) of
$10 million
per occurrence for property damage and a waiting period of
60 days
per occurrence for business interruption;
|
|
•
|
General liability coverage with per-occurrence and aggregate annual limits of
$610 million
and retentions (deductibles) of
$2 million
per occurrence;
|
|
•
|
Workers’ compensation coverage with statutory limits and retentions (deductibles) of
$1 million
total per occurrence.
|
During the three and six month periods ended
June 30, 2014
, we received
$50 million
and
$175 million
, respectively, of insurance recoveries related to the Geismar Incident. The three and six month periods ended
June 30, 2014
, also include
$8 million
and
$14 million
, respectively, of related covered insurable expenses incurred in excess of our retentions (deductibles). These amounts are reported within Williams Partners and reflected as net gains in
Net insurance recoveries – Geismar Incident
in the
Consolidated Statement of Income
.
The three and six month periods ended
June 30, 2013
, include
$6 million
of costs under our insurance deductibles reported in
Operating and maintenance expenses
in the
Consolidated Statement of Income
.
Additional Items
The six month period ended
June 30, 2014
, includes
$19 million
of project development costs related to the Bluegrass Pipeline reported within Williams NGL & Petchem Services and reflected in
Selling, general, and administrative expenses
in the
Consolidated Statement of Income
.
The three and six month periods ended
June 30, 2014
, also include
$11 million
of acquisition-related transaction costs incurred related to our ACMP Acquisition with
$9 million
reported in
Interest incurred
and
$2 million
reported within our Access Midstream Partners segment and reflected in
Selling, general, and administrative expenses
in the
Consolidated Statement of Income
. (See further discussion in
Note 13 – Subsequent Event
.)
15
Notes (Continued)
The three month periods ended
June 30, 2014
and 2013, include
$14 million
and
$13 million
, respectively, and the six month periods ended
June 30, 2014
and 2013, include
$27 million
and
$26 million
, respectively, of interest income associated with a receivable related to the sale of certain former Venezuela assets reflected in
Other investing income – net
in the
Consolidated Statement of Income
.
The three and six month periods ended
June 30, 2014
both include
$4 million
and the three and six month periods ended June 30, 2013 both include
$26 million
, of gains resulting from Access Midstream Partners’ equity issuances reflected in
Other investing income – net
in the
Consolidated Statement of Income
. These equity issuances resulted in the dilution of our ownership interest and are accounted for as though we sold a portion of our investment.
Note 4 – Provision (Benefit) for Income Taxes
The
Provision (benefit) for income taxes
includes:
|
Three months ended
June 30, |
Six months ended
June 30, |
||||||||||||||
|
2014
|
2013
|
2014
|
2013
|
||||||||||||
|
(Millions)
|
|||||||||||||||
|
Current:
|
|||||||||||||||
|
Federal
|
$
|
(24
|
)
|
$
|
(61
|
)
|
$
|
113
|
|
$
|
(72
|
)
|
|||
|
State
|
(1
|
)
|
1
|
|
4
|
|
3
|
|
|||||||
|
Foreign
|
3
|
|
(1
|
)
|
5
|
|
1
|
|
|||||||
|
(22
|
)
|
(61
|
)
|
122
|
|
(68
|
)
|
||||||||
|
Deferred:
|
|||||||||||||||
|
Federal
|
95
|
|
130
|
|
(1
|
)
|
212
|
|
|||||||
|
State
|
6
|
|
19
|
|
5
|
|
32
|
|
|||||||
|
Foreign
|
5
|
|
14
|
|
9
|
|
22
|
|
|||||||
|
106
|
|
163
|
|
13
|
|
266
|
|
||||||||
|
Total provision (benefit)
|
$
|
84
|
|
$
|
102
|
|
$
|
135
|
|
$
|
198
|
|
|||
The effective income tax rate for the total provision for the three months ended
June 30, 2014
, is greater than the federal statutory rate primarily due to taxes on foreign operations and the effect of state income taxes, partially offset by the impact of nontaxable noncontrolling interests.
The effective income tax rate for the total provision for the
six
months ended
June 30, 2014
, is less than the federal statutory rate primarily due to a tax benefit related to the completion of the Canada Dropdown in the first quarter of 2014 and the impact of nontaxable noncontrolling interests, partially offset by the effect of state income taxes and taxes on foreign operations.
The effective income tax rates for the total provision for the three and
six
months ended
June 30, 2013
, are less than the federal statutory rate primarily due to the impact of nontaxable noncontrolling interests and taxes on foreign operations, partially offset by the effect of state income taxes. The 2013 state deferred provision includes
$10 million
, net of federal benefit, related to the impact of a second-quarter Texas franchise tax law change.
As a result of closing the Canada Dropdown, approximately
$80 million
of previously deferred tax liability has been reclassified as a current income tax liability through the second quarter of 2014.
During the next 12 months, we do not expect ultimate resolution of any unrecognized tax benefit associated with domestic or international matters to have a material impact on our unrecognized tax benefit position.
16
Notes (Continued)
|
Three months ended
June 30, |
Six months ended
June 30, |
||||||||||||||
|
2014
|
2013
|
2014
|
2013
|
||||||||||||
|
(Dollars in millions, except per-share
amounts; shares in thousands)
|
|||||||||||||||
|
Income (loss) from continuing operations attributable to The Williams Companies, Inc. available to common stockholders for basic and diluted earnings (loss) per common share
|
$
|
99
|
|
$
|
149
|
|
$
|
239
|
|
$
|
311
|
|
|||
|
Basic weighted-average shares
|
696,553
|
|
682,893
|
|
690,695
|
|
682,475
|
|
|||||||
|
Effect of dilutive securities:
|
|||||||||||||||
|
Nonvested restricted stock units
|
2,091
|
|
1,669
|
|
2,094
|
|
2,012
|
|
|||||||
|
Stock options
|
2,034
|
|
2,207
|
|
2,025
|
|
2,198
|
|
|||||||
|
Convertible debentures
|
18
|
|
155
|
|
18
|
|
170
|
|
|||||||
|
Diluted weighted-average shares
|
700,696
|
|
686,924
|
|
694,832
|
|
686,855
|
|
|||||||
|
Earnings (loss) per common share from continuing operations:
|
|||||||||||||||
|
Basic
|
$
|
.14
|
|
$
|
.22
|
|
$
|
.34
|
|
$
|
.45
|
|
|||
|
Diluted
|
$
|
.14
|
|
$
|
.22
|
|
$
|
.34
|
|
$
|
.45
|
|
|||
Note 6 – Employee Benefit Plans
Net periodic benefit cost (credit)
is as follows:
|
|
Pension Benefits
|
||||||||||||||
|
|
Three months ended
June 30, |
|
Six months ended
June 30, |
||||||||||||
|
|
2014
|
|
2013
|
|
2014
|
|
2013
|
||||||||
|
|
(Millions)
|
||||||||||||||
|
Components of net periodic benefit cost:
|
|
|
|
|
|
|
|
||||||||
|
Service cost
|
$
|
10
|
|
|
$
|
11
|
|
|
$
|
20
|
|
|
$
|
22
|
|
|
Interest cost
|
15
|
|
|
13
|
|
|
31
|
|
|
26
|
|
||||
|
Expected return on plan assets
|
(19
|
)
|
|
(15
|
)
|
|
(38
|
)
|
|
(30
|
)
|
||||
|
Amortization of net actuarial loss
|
10
|
|
|
15
|
|
|
19
|
|
|
30
|
|
||||
|
Net periodic benefit cost
|
$
|
16
|
|
|
$
|
24
|
|
|
$
|
32
|
|
|
$
|
48
|
|
|
Other Postretirement Benefits
|
|||||||||||||||
|
Three months ended
June 30, |
Six months ended
June 30, |
||||||||||||||
|
2014
|
2013
|
2014
|
2013
|
||||||||||||
|
(Millions)
|
|||||||||||||||
|
Components of net periodic benefit cost (credit):
|
|||||||||||||||
|
Service cost
|
$
|
—
|
|
$
|
—
|
|
$
|
1
|
|
$
|
1
|
|
|||
|
Interest cost
|
3
|
|
3
|
|
5
|
|
6
|
|
|||||||
|
Expected return on plan assets
|
(3
|
)
|
(2
|
)
|
(6
|
)
|
(4
|
)
|
|||||||
|
Amortization of prior service credit
|
(5
|
)
|
(2
|
)
|
(10
|
)
|
(4
|
)
|
|||||||
|
Amortization of net actuarial loss
|
—
|
|
1
|
|
—
|
|
3
|
|
|||||||
|
Reclassification to regulatory liability
|
1
|
|
—
|
|
2
|
|
—
|
|
|||||||
|
Net periodic benefit cost (credit)
|
$
|
(4
|
)
|
$
|
—
|
|
$
|
(8
|
)
|
$
|
2
|
|
|||
17
Notes (Continued)
Amortization of prior service credit
and
net actuarial loss
included in
net periodic benefit
cost (credit)
for our other postretirement benefit plans associated with Transco and Northwest Pipeline are recorded to
regulatory assets/liabilities
instead of
other comprehensive income (loss).
Amounts recognized in
regulatory assets/liabilities
include:
|
Three months ended
June 30, |
Six months ended
June 30, |
||||||||||||||
|
2014
|
2013
|
2014
|
2013
|
||||||||||||
|
|
(Millions)
|
||||||||||||||
|
Amortization of prior service credit
|
$
|
(3
|
)
|
$
|
(2
|
)
|
$
|
(6
|
)
|
$
|
(3
|
)
|
|||
|
Amortization of net actuarial loss
|
—
|
|
1
|
|
—
|
|
2
|
|
|||||||
During the
six
months ended
June 30, 2014
, we contributed
$31 million
to our pension plans and
$3 million
to our other postretirement benefit plans. We presently anticipate making additional contributions of approximately
$32 million
to our pension plans and approximately
$4 million
to our other postretirement benefit plans in the remainder of 2014.
|
June 30,
2014 |
December 31,
2013 |
||||||
|
(Millions)
|
|||||||
|
Natural gas liquids, olefins, and natural gas in underground storage
|
$
|
195
|
|
$
|
111
|
|
|
|
Materials, supplies, and other
|
81
|
|
83
|
|
|||
|
$
|
276
|
|
$
|
194
|
|
||
Note 8 – Debt and Banking Arrangements
Issuances
On June 27, 2014, WPZ completed a public offering of
$750 million
of
3.9 percent
senior unsecured notes due 2025 and
$500 million
of
4.9 percent
senior unsecured notes due 2045. WPZ used a portion of the net proceeds to repay amounts outstanding under its commercial paper program and expects to utilize the remainder to fund capital expenditures and for general partnership purposes.
On June 24, 2014, we completed a public offering of
$1.25 billion
of
4.55 percent
senior unsecured notes due 2024 and
$650 million
of
5.75 percent
senior unsecured notes due 2044. We used the net proceeds in July 2014 to finance a portion of the ACMP Acquisition (See
Note 13 – Subsequent Event
.)
On March 4, 2014, WPZ completed a public offering of
$1 billion
of
4.3 percent
senior unsecured notes due 2024 and
$500 million
of
5.4 percent
senior unsecured notes due 2044. WPZ used the net proceeds to repay amounts outstanding under its commercial paper program, to fund capital expenditures, and for general partnership purposes.
Credit Facilities
On June 27, 2014, we entered into Amendment No. 1 (the Amendment) to the First Amended & Restated Credit Agreement, dated as of July 31, 2013. The Amendment changed certain defined terms and provisions concerning the maintenance of ownership of the general partner of Williams Partners L.P. and the indebtedness of certain of our subsidiaries that act as general partner of WPZ and of ACMP and increased our permitted financial covenant thresholds. Our significant financial covenants after the Amendment require our ratio of debt to EBITDA (each as defined in the credit facility) to be no greater than
4.75
to 1. For the fiscal quarter and the two following fiscal quarters in which one or more acquisitions for a total aggregate purchase price equal to or greater than
$50 million
has been executed, we are required to maintain a ratio of debt to EBITDA of no greater than
5.5
to 1.
18
Notes (Continued)
Letter of credit capacity under our
$1.5 billion
and WPZ’s
$2.5 billion
credit facilities is
$700 million
and
$1.3 billion
, respectively. At June 30, 2014, no letters of credit have been issued and loans totaling $300 million are outstanding on our credit facility. At
June 30, 2014
, no letters of credit have been issued and no loans are outstanding on WPZ’s credit facility. We issued letters of credit totaling
$15 million
and WPZ issued letters of credit totaling
$1 million
as of
June 30, 2014
, under certain bilateral bank agreements.
Note 9 – Stockholders' Equity
On June 23, 2014, we issued
61 million
shares of common stock at a price of
$57.00
per share. That amount includes
8 million
shares purchased pursuant to the full exercise of the underwriter’s option to purchase additional shares. The net proceeds of
$3.378 billion
were used in July 2014 to finance a portion of the ACMP Acquisition. (See
Note 13 – Subsequent Event
.)
AOCI
The following table presents the changes in
Accumulated other comprehensive income (loss)
by component, net of income taxes:
|
Cash
Flow
Hedges
|
Foreign
Currency
Translation
|
Pension and
Other Post
Retirement
Benefits
|
Total
|
||||||||||||
|
(Millions)
|
|||||||||||||||
|
Balance at December 31, 2013
|
$
|
(1
|
)
|
$
|
128
|
|
$
|
(291
|
)
|
$
|
(164
|
)
|
|||
|
Other comprehensive income (loss)
before reclassifications
|
—
|
|
(20
|
)
|
—
|
|
(20
|
)
|
|||||||
|
Amounts reclassified from
accumulated
other comprehensive income (loss)
|
—
|
|
—
|
|
10
|
|
10
|
|
|||||||
|
Other comprehensive income (loss)
|
—
|
|
(20
|
)
|
10
|
|
(10
|
)
|
|||||||
|
Changes in ownership of consolidated subsidiaries, net
|
—
|
|
(20
|
)
|
—
|
|
(20
|
)
|
|||||||
|
Balance at June 30, 2014
|
$
|
(1
|
)
|
$
|
88
|
|
$
|
(281
|
)
|
$
|
(194
|
)
|
|||
Reclassifications out of
Accumulated other comprehensive income (loss)
are presented in the following table by component for the
six
months ended
June 30, 2014
:
|
Component
|
Reclassifications
|
Classification
|
||||
|
(Millions)
|
||||||
|
Pension and other postretirement benefits:
|
||||||
|
Amortization of prior service cost (credit) included in net periodic benefit cost
|
$
|
(4
|
)
|
Note 6 – Employee Benefit Plans
|
||
|
Amortization of actuarial (gain) loss included in net periodic benefit cost
|
19
|
|
|
|||
|
Total pension and other postretirement benefits, before income taxes
|
15
|
|
||||
|
Income tax benefit
|
(5
|
)
|
Provision (benefit) for income taxes
|
|||
|
Reclassifications during the period
|
$
|
10
|
|
|||
19
Notes (Continued)
Note 10 – Fair Value Measurements and Guarantees
The following table presents, by level within the fair value hierarchy, certain of our financial assets and liabilities. The carrying values of cash and cash equivalents, accounts receivable, commercial paper, and accounts payable approximate fair value because of the short-term nature of these instruments. Therefore, these assets and liabilities are not presented in the following table.
|
Fair Value Measurements Using
|
|||||||||||||||||||
|
Carrying
Amount
|
Fair
Value
|
Quoted
Prices In
Active
Markets for
Identical
Assets
(Level 1)
|
Significant
Other
Observable
Inputs
(Level 2)
|
Significant
Unobservable
Inputs
(Level 3)
|
|||||||||||||||
|
(Millions)
|
|||||||||||||||||||
|
Assets (liabilities) at June 30, 2014:
|
|||||||||||||||||||
|
Measured on a recurring basis:
|
|||||||||||||||||||
|
ARO Trust investments
|
$
|
42
|
|
$
|
42
|
|
$
|
42
|
|
$
|
—
|
|
$
|
—
|
|
||||
|
Energy derivatives assets not designated as hedging instruments
|
3
|
|
3
|
|
—
|
|
—
|
|
3
|
|
|||||||||
|
Energy derivatives liabilities not designated as hedging instruments
|
(2
|
)
|
(2
|
)
|
—
|
|
—
|
|
(2
|
)
|
|||||||||
|
Additional disclosures:
|
|||||||||||||||||||
|
Notes receivable and other
|
36
|
|
82
|
|
2
|
|
5
|
|
75
|
|
|||||||||
|
Long-term debt, including current portion (1)
|
(16,289
|
)
|
(17,684
|
)
|
—
|
|
(17,684
|
)
|
—
|
|
|||||||||
|
Guarantee
|
(31
|
)
|
(28
|
)
|
—
|
|
(28
|
)
|
—
|
|
|||||||||
|
Assets (liabilities) at December 31, 2013:
|
|||||||||||||||||||
|
Measured on a recurring basis:
|
|||||||||||||||||||
|
ARO Trust investments
|
$
|
33
|
|
$
|
33
|
|
$
|
33
|
|
$
|
—
|
|
$
|
—
|
|
||||
|
Energy derivatives assets not designated as hedging instruments
|
3
|
|
3
|
|
—
|
|
—
|
|
3
|
|
|||||||||
|
Energy derivatives liabilities not designated as hedging instruments
|
(3
|
)
|
(3
|
)
|
—
|
|
(1
|
)
|
(2
|
)
|
|||||||||
|
Additional disclosures:
|
|||||||||||||||||||
|
Notes receivable and other
|
77
|
|
140
|
|
1
|
|
6
|
|
133
|
|
|||||||||
|
Long-term debt (1)
|
(11,353
|
)
|
(11,971
|
)
|
—
|
|
(11,971
|
)
|
—
|
|
|||||||||
|
Guarantee
|
(32
|
)
|
(29
|
)
|
—
|
|
(29
|
)
|
—
|
|
|||||||||
(1) Excludes capital leases
Fair Value Methods
We use the following methods and assumptions in estimating the fair value of our financial instruments:
Assets and liabilities measured at fair value on a recurring basis
ARO Trust investments
:
Transco deposits a portion of its collected rates, pursuant to its rate case settlement, into an external trust (ARO Trust) that is specifically designated to fund future asset retirement obligations. The ARO Trust invests in a portfolio of actively traded mutual funds that are measured at fair value on a recurring basis based on quoted prices in an active market, is classified as available-for-sale, and is reported in
Regulatory assets, deferred charges, and other
in the Consolidated Balance Sheet. Both realized and unrealized gains and losses are ultimately recorded as regulatory assets or liabilities.
20
Notes (Continued)
Energy derivatives
:
Energy derivatives include commodity based exchange-traded contracts and over-the-counter (OTC) contracts, which consist of physical forwards, futures, and swaps that are measured at fair value on a recurring basis. The fair value amounts are presented on a gross basis and do not reflect the netting of asset and liability positions permitted under the terms of our master netting arrangements. Further, the amounts do not include cash held on deposit in margin accounts that we have received or remitted to collateralize certain derivative positions. Energy derivatives assets are reported in
Other current assets and deferred charges
and
Regulatory assets, deferred charges, and other
in the Consolidated Balance Sheet. Energy derivatives liabilities are reported in
Accrued liabilities
and
Other noncurrent liabilities
in the Consolidated Balance Sheet.
Reclassifications of fair value between Level 1, Level 2, and Level 3 of the fair value hierarchy, if applicable, are made at the end of each quarter. No transfers between Level 1 and Level 2 occurred during the
six
months ended
June 30, 2014
or
2013
.
Additional fair value disclosures
Notes receivable and other:
Notes receivable and other consists of various notes, including a receivable related to the sale of certain former Venezuela assets. The disclosed fair value of this receivable is determined by an income approach. We calculated the net present value of a probability-weighted set of cash flows utilizing assumptions based on contractual terms, historical payment patterns by the counterparty, future probabilities of default, our likelihood of using arbitration if the counterparty does not perform, and discount rates. We determined the fair value of the receivable to be
$75 million
at
June 30, 2014
. The carrying value of this receivable is
$29 million
at
June 30, 2014
. The current and noncurrent portions are reported in
Accounts and notes receivable, net
and
Regulatory assets, deferred charges, and other
, respectively, in the Consolidated Balance Sheet.
At December 31, 2013, notes receivable and other also included a receivable from our former affiliate, WPX Energy, Inc. (WPX) related to various proceedings involving prices charged for power in California and other western states (see
Note 11 – Contingent Liabilities
). In second quarter 2014, the proceedings related to this receivable were settled, and we received
$42 million
and recorded pretax
Income from discontinued operations
of
$7 million
.
Long-term debt
:
The disclosed fair value of our long-term debt is determined by a market approach using broker quoted indicative period-end bond prices. The quoted prices are based on observable transactions in less active markets for our debt or similar instruments.
Guarantee
:
The guarantee represented in the table consists of a guarantee we have provided in the event of nonpayment by our previously owned communications subsidiary, Williams Communications Group (WilTel), on a lease performance obligation that extends through 2042.
To estimate the disclosed fair value of the guarantee, an estimated default rate is applied to the sum of the future contractual lease payments using an income approach. The estimated default rate is determined by obtaining the average cumulative issuer-weighted corporate default rate based on the credit rating of WilTel’s current owner and the term of the underlying obligation. The default rate is published by Moody’s Investors Service. This guarantee is reported in
Accrued liabilities
in the Consolidated Balance Sheet.
Assets and liabilities measured at fair value on a nonrecurring basis
In second quarter 2014, we designated certain equipment within our Williams Partners segment as held for sale. The estimated fair value (less cost to sell) of the equipment at June 30, 2014, is
$46 million
and is reported in
Other current assets and deferred charges
in the Consolidated Balance Sheet. The estimated fair value was determined by a market approach based on our analysis of information related to sales of similar pre-owned equipment in the principal market. This analysis resulted in an impairment charge of
$17 million
, recorded in
Other (income) expense – net
within
Costs and expenses
. This nonrecurring fair value measurement fell within Level 3 of the fair value hierarchy.
Guarantees
We are required by our revolving credit agreements to indemnify lenders for certain taxes required to be withheld from payments due to the lenders and for certain tax payments made by the lenders. The maximum potential amount
21
Notes (Continued)
of future payments under these indemnifications is based on the related borrowings and such future payments cannot currently be determined. These indemnifications generally continue indefinitely unless limited by the underlying tax regulations and have no carrying value. We have never been called upon to perform under these indemnifications and have no current expectation of a future claim.
Regarding our previously described guarantee of Wiltel’s lease performance, the maximum potential exposure is approximately
$35 million
at
June 30, 2014
and
December 31, 2013
. Our exposure declines systematically throughout the remaining term of WilTel’s obligation.
We have provided guarantees in the event of nonpayment by our previously owned subsidiary, WPX, on certain contracts, primarily a natural gas purchase contract extending through 2023. We estimate the maximum undiscounted potential future payment obligation under these remaining guarantees is approximately
$59 million
at
June 30, 2014
. Our recorded liability for these guarantees, which considers our estimate of the fair value of the guarantees, is insignificant.
Note 11 – Contingent Liabilities
Indemnification of WPX Matters
We have agreed to indemnify our former affiliate, WPX and its subsidiaries, related to the following matters.
Issues resulting from California energy crisis
WPX’s former power business was engaged in power marketing in various geographic areas, including California. Prices charged for power by WPX and other traders and generators in California and other western states in 2000 and 2001 were challenged in various proceedings, including those before the Federal Energy Regulatory Commission (FERC). WPX has entered into settlements with the State of California (State Settlement), major California utilities (Utilities Settlement), and others that substantially resolved each of these issues with these parties.
Although the State Settlement and Utilities Settlement resolved a significant portion of the refund issues among the settling parties, WPX continued to have potential refund exposure to nonsettling parties, including various California end users that did not participate in the Utilities Settlement. On April 24, 2014, the FERC approved a settlement among the California utilities, WPX, and us which resolves the remaining legal issues (WPX’s collection of accrued interest from counterparties as well as WPX’s payment of accrued interest on refund amounts) arising from the 2000-2001 California Energy Crisis. In May 2014, WPX paid to us approximately
$42 million
in settlement proceeds that it received from the California utilities and the dissolution of escrow accounts.
Reporting of natural gas-related information to trade publications
Direct and indirect purchasers of natural gas in various states filed class actions against WPX and others alleging the manipulation of published gas price indices and seeking unspecified amounts of damages. Such actions were transferred to the Nevada federal district court for consolidation of discovery and pre-trial issues.
In 2011, the Nevada district court granted WPX’s joint motions for summary judgment to preclude the plaintiffs’ state law claims because the federal Natural Gas Act gives the FERC exclusive jurisdiction to resolve those issues. The court also denied the plaintiffs’ class certification motion as moot. The plaintiffs appealed the court’s ruling and on April 10, 2013, the Ninth Circuit Court of Appeals reversed the district court and remanded the cases to the district court to permit the plaintiffs to pursue their state antitrust claims for natural gas sales that were not subject to FERC jurisdiction under the Natural Gas Act. On July 1, 2014, the U.S. Supreme Court agreed to hear the cases. Because of the uncertainty around the remaining pending unresolved issues, including an insufficient description of the purported classes and other related matters, we cannot reasonably estimate a range of potential exposures at this time. However, it is reasonably possible that the ultimate resolution of these items and our related indemnification obligation could result in future charges that may be material to our results of operations. In connection with this indemnification, we have an accrued liability balance associated with this matter, and as a result, have an indirect exposure to future developments in this matter.
22
Notes (Continued)
Other Legal Matters
Geismar Incident
As a result of the previously discussed Geismar Incident, there were two fatalities, and numerous individuals (including employees and contractors) reported injuries, which varied from minor to serious. WPZ is cooperating with the Chemical Safety Board and the U.S. Environmental Protection Agency (EPA) regarding their investigations of the Geismar Incident. On October 21, 2013, the EPA issued an Inspection Report pursuant to the Clean Air Act’s Risk Management Program following its inspection of the facility on June 24 through 28, 2013. The report notes the EPA’s preliminary determinations about the facility’s documentation regarding process safety, process hazard analysis, as well as operating procedures, employee training, and other matters. On June 16, 2014, we received a request for information related to the Geismar Incident from the EPA under Section 114 of the Clean Air Act. We and the EPA continue to discuss preliminary determinations, and the EPA could issue penalties pertaining to final determinations. On December 11, 2013, the Occupational Safety and Health Administration (OSHA) issued citations in connection with its investigation of the June 13, 2013 incident, which included a Notice of Penalty for
$99,000
. We have settled the citations in principle with OSHA, but have not yet finalized a settlement agreement. On June 25, 2013, OSHA commenced a second inspection pursuant to its Refinery and Chemical National Emphasis Program (NEP). OSHA did not issue a citation to WPZ in connection with this NEP inspection and there is a six month statute of limitations for violation of the Occupational Safety and Health Act of 1970 or regulations promulgated under such act. On June 28, 2013, the Louisiana Department of Environmental Quality (LDEQ) issued a Consolidated Compliance Order & Notice of Potential Penalty to Williams Olefins, L.L.C. that consolidates claims of unpermitted emissions and other deviations under the Clean Air Act that the parties had been negotiating since 2010 and alleged unpermitted emissions arising from the Geismar Incident. Negotiations with the LDEQ are ongoing. Any potential fines and penalties from these agencies would not be covered by our insurance policy. Additionally, multiple lawsuits, including class actions for alleged offsite impacts, property damage, customer claims, and personal injury, have been filed against various of our subsidiaries.
Due to the ongoing investigation into the cause of the incident, and the limited information available associated with the filed lawsuits, which generally do not specify any amounts for claimed damages, we cannot reasonably estimate a range of potential loss related to these contingencies at this time.
Gulf Liquids litigation
Gulf Liquids, one of our subsidiaries, contracted with Gulsby Engineering Inc. (Gulsby) and Gulsby-Bay (a joint venture between Gulsby and Bay Ltd.) for the construction of certain gas processing plants in Louisiana. National American Insurance Company (NAICO) and American Home Assurance Company provided payment and performance bonds for the projects. In 2001, the contractors and sureties filed multiple cases in Louisiana and Texas against Gulf Liquids and us. In 2006, at the conclusion of the consolidated trial of the asserted contract and tort claims, the jury returned its actual and punitive damages verdict against us and Gulf Liquids. From May through October 2007, the court entered seven post-trial orders in the case which, among other things, overruled the verdict award of tort and punitive damages as well as any damages against us. The court also denied the plaintiffs’ claims for attorneys’ fees. On January 28, 2008, the court issued its judgment awarding certain damages against Gulf Liquids in favor of Gulsby and Gulsby-Bay. Gulf Liquids, Gulsby, Gulsby-Bay, Bay Ltd., and NAICO appealed the judgment. In February 2009, we settled with Bay Ltd. and Gulsby-Bay. On February 17, 2011, the Texas Court of Appeals upheld the dismissals of the tort and punitive damages claims and reversed and remanded the remaining claims for further proceedings. None of the parties filed a petition for review in the Texas Supreme Court. On May 8, 2012, the Texas Court of Appeals issued its mandate remanding the original breach of contract claims involving Gulsby and attorney fee claims to trial court. Trial is set for October 14, 2014. In 2006, we accrued a charge, and related interest, for our estimate of probable loss associated with the initial adverse verdict. From 2008 through 2011, the amount accrued was reduced based on subsequent judgments and settlement payments. As of June 30, 2014, we have a remaining accrued liability of
$13 million
associated with the litigation.
23
Notes (Continued)
Alaska refinery contamination litigation
In January 2010, James West filed a class action lawsuit in state court in Fairbanks, Alaska on behalf of individual property owners whose water contained sulfolane contamination allegedly emanating from the Flint Hills Oil Refinery in North Pole, Alaska. The suit named our subsidiary, Williams Alaska Petroleum Inc. (WAPI), and Flint Hills Resources Alaska, LLC (FHRA), a subsidiary of Koch Industries, Inc., as defendants. We owned and operated the refinery until 2004 when we sold it to FHRA. We and FHRA have made claims under the pollution liability insurance policy issued in connection with the sale of the North Pole refinery to FHRA. We and FHRA also filed claims against each other seeking, among other things, contractual indemnification alleging that the other party caused the sulfolane contamination.
In 2011, we and FHRA settled the James West claim. We and FHRA subsequently filed motions for summary judgment on the other’s claims. On November 5, 2013, the court ruled that the applicable statute of limitations bars all FHRA’s claims against us and dismissed those claims with prejudice. FHRA asked the court to reconsider and clarify its ruling. On July 8, 2014, the court reaffirmed its dismissal of all FHRA’s claims and entered judgment for us. We anticipate that FHRA will appeal the court’s decision.
We currently estimate that our reasonably possible loss exposure in this matter could range from an insignificant amount up to
$32 million
, although uncertainties inherent in the litigation process, expert evaluations, and jury dynamics might cause our exposure to exceed that amount.
Independent of the litigation matter described in the preceding paragraphs, the Alaska Department of Environmental Conservation (ADEC) indicated that it views FHRA and us as responsible parties. During the first quarter of 2013 and again on December 23, 2013, ADEC informed FHRA and us that ADEC intends to enter a compliance order to address the environmental remediation of sulfolane and other possible contaminants including cleanup work outside the refinery’s boundaries to be performed in 2014. In addition, ADEC will seek from each of FHRA and us an adequate financial performance guarantee for the benefit of ADEC. On March 6, 2014, the State of Alaska filed suit against FHRA and us in state court in Fairbanks seeking injunctive relief and damages in connection with the sulfolane contamination. On May 5, 2014, FHRA filed cross-claims against us in the State of Alaska suit, and FHRA also seeks injunctive relief and damages. Due to the ongoing assessment of the level and extent of sulfolane contamination and the ultimate cost of remediation and division of costs among the potentially responsible parties, we are unable to estimate a range of exposure at this time.
Transco 2012 rate case
On August 31, 2012, Transco submitted to the FERC a general rate filing principally designed to recover increased costs and to comply with the terms of the settlement in its prior rate proceedings. The new rates became effective March 1, 2013, subject to refund and the outcome of the hearing. On August 27, 2013, Transco filed a stipulation and agreement with the FERC proposing to resolve all issues in this proceeding without the need for a hearing (Agreement). On December 6, 2013, the FERC issued an order approving the Agreement without modifications. Pursuant to its terms, the Agreement became effective March 1, 2014. We paid
$118 million
of rate refunds on April 18, 2014.
Environmental Matters
We are a participant in certain environmental activities in various stages including assessment studies, cleanup operations and remedial processes at certain sites, some of which we currently do not own. We are monitoring these sites in a coordinated effort with other potentially responsible parties, the EPA, and other governmental authorities. We are jointly and severally liable along with unrelated third parties in some of these activities and solely responsible in others. Certain of our subsidiaries have been identified as potentially responsible parties at various Superfund and state waste disposal sites. In addition, these subsidiaries have incurred, or are alleged to have incurred, various other hazardous materials removal or remediation obligations under environmental laws. As of
June 30, 2014
, we have accrued liabilities totaling
$45 million
for these matters, as discussed below. Our accrual reflects the most likely costs of cleanup, which are generally based on completed assessment studies, preliminary results of studies or our experience with other similar cleanup operations. Certain assessment studies are still in process for which the ultimate outcome may yield significantly different estimates of most likely costs. Any incremental amount in excess of amounts currently accrued cannot be
24
Notes (Continued)
reasonably estimated at this time due to uncertainty about the actual number of contaminated sites ultimately identified, the actual amount and extent of contamination discovered and the final cleanup standards mandated by the EPA and other governmental authorities.
The EPA and various state regulatory agencies routinely promulgate and propose new rules, and issue updated guidance to existing rules. More recent rules and rulemakings include, but are not limited to, rules for reciprocating internal combustion engine maximum achievable control technology, new air quality standards for ground level ozone, one hour nitrogen dioxide emission limits, and new air quality standards impacting storage vessels, pressure valves, and compressors. We are unable to estimate the costs of asset additions or modifications necessary to comply with these new regulations due to uncertainty created by the various legal challenges to these regulations and the need for further specific regulatory guidance.
Continuing operations
Our interstate gas pipelines are involved in remediation activities related to certain facilities and locations for polychlorinated biphenyls, mercury, and other hazardous substances. These activities have involved the EPA and various state environmental authorities, resulting in our identification as a potentially responsible party at various Superfund waste sites. At
June 30, 2014
, we have accrued liabilities of
$11 million
for these costs. We expect that these costs will be recoverable through rates.
We also accrue environmental remediation costs for natural gas underground storage facilities, primarily related to soil and groundwater contamination. At
June 30, 2014
, we have accrued liabilities totaling
$8 million
for these costs.
Former operations, including operations classified as discontinued
We have potential obligations in connection with assets and businesses we no longer operate. These potential obligations include remediation activities at the direction of federal and state environmental authorities and the indemnification of the purchasers of certain of these assets and businesses for environmental and other liabilities existing at the time the sale was consummated. Our responsibilities relate to the operations of the assets and businesses described below.
|
•
|
Former agricultural fertilizer and chemical operations and former retail petroleum and refining operations;
|
|
•
|
Former petroleum products and natural gas pipelines;
|
|
•
|
Former petroleum refining facilities;
|
|
•
|
Former exploration and production and mining operations;
|
|
•
|
Former electricity and natural gas marketing and trading operations.
|
At
June 30, 2014
, we have accrued environmental liabilities of
$26 million
related to these matters.
Other Divestiture Indemnifications
Pursuant to various purchase and sale agreements relating to divested businesses and assets, we have indemnified certain purchasers against liabilities that they may incur with respect to the businesses and assets acquired from us. The indemnities provided to the purchasers are customary in sale transactions and are contingent upon the purchasers incurring liabilities that are not otherwise recoverable from third parties. The indemnities generally relate to breach of warranties, tax, historic litigation, personal injury, property damage, environmental matters, right of way and other representations that we have provided.
At
June 30, 2014
, other than as previously disclosed, we are not aware of any material claims against us involving the indemnities; thus, we do not expect any of the indemnities provided pursuant to the sales agreements to have a
25
Notes (Continued)
material impact on our future financial position. Any claim for indemnity brought against us in the future may have a material adverse effect on our results of operations in the period in which the claim is made.
In addition to the foregoing, various other proceedings are pending against us which are incidental to our operations.
Summary
We have disclosed our estimated range of reasonably possible losses for certain matters above, as well as all significant matters for which we are unable to reasonably estimate a range of possible loss. We estimate that for all other matters for which we are able to reasonably estimate a range of loss, our aggregate reasonably possible losses beyond amounts accrued are immaterial to our expected future annual results of operations, liquidity and financial position. These calculations have been made without consideration of any potential recovery from third parties.
Our reportable segments are Williams Partners, Williams NGL & Petchem Services, and Access Midstream Partners. All remaining business activities are included in Other. (See
Note 1 – General, Description of Business, and Basis of Presentation
.)
Performance Measurement
We currently evaluate segment operating performance based upon
Segment profit (loss)
from operations, which includes
Segment revenues
from external and internal customers, segment costs and expenses,
Equity earnings (losses)
and
Income (loss) from investments
.
General corporate expenses
represent
Selling, general, and administrative expenses
that are not allocated to our segments. Intersegment revenues are generally accounted for at current market prices as if the sales were to unaffiliated third parties.
26
Notes (Continued)
The following table reflects the reconciliation of
Segment revenues
and
Segment profit (loss)
to
Total revenues
and
Operating income (loss)
as reported in the
Consolidated Statement of Income
and
Total assets
by reportable segment.
|
Williams
Partners
|
Williams
NGL & Petchem
Services
|
Access
Midstream
Partners
|
Other
|
Eliminations
|
Total
|
||||||||||||||||||
|
(Millions)
|
|||||||||||||||||||||||
|
Three months ended June 30, 2014
|
|||||||||||||||||||||||
|
Segment revenues:
|
|||||||||||||||||||||||
|
Service revenues
|
|||||||||||||||||||||||
|
External
|
$
|
763
|
|
$
|
—
|
|
$
|
—
|
|
$
|
62
|
|
$
|
—
|
|
$
|
825
|
|
|||||
|
Internal
|
—
|
|
—
|
|
—
|
|
4
|
|
(4
|
)
|
—
|
|
|||||||||||
|
Total service revenues
|
763
|
|
—
|
|
—
|
|
66
|
|
(4
|
)
|
825
|
|
|||||||||||
|
Product sales
|
|||||||||||||||||||||||
|
External
|
853
|
|
—
|
|
—
|
|
—
|
|
—
|
|
853
|
|
|||||||||||
|
Internal
|
—
|
|
—
|
|
—
|
|
—
|
|
—
|
|
—
|
|
|||||||||||
|
Total product sales
|
853
|
|
—
|
|
—
|
|
—
|
|
—
|
|
853
|
|
|||||||||||
|
Total revenues
|
$
|
1,616
|
|
$
|
—
|
|
$
|
—
|
|
$
|
66
|
|
$
|
(4
|
)
|
$
|
1,678
|
|
|||||
|
Segment profit (loss)
|
$
|
393
|
|
$
|
(8
|
)
|
$
|
9
|
|
$
|
1
|
|
$
|
395
|
|
||||||||
|
Less:
|
|||||||||||||||||||||||
|
Equity earnings (losses)
|
32
|
|
(2
|
)
|
7
|
|
—
|
|
37
|
|
|||||||||||||
|
Income (loss) from investments
|
—
|
|
—
|
|
4
|
|
—
|
|
4
|
|
|||||||||||||
|
Segment operating income (loss)
|
$
|
361
|
|
$
|
(6
|
)
|
$
|
(2
|
)
|
$
|
1
|
|
354
|
|
|||||||||
|
General corporate expenses
|
(43
|
)
|
|||||||||||||||||||||
|
Operating income (loss)
|
$
|
311
|
|
||||||||||||||||||||
|
Three months ended June 30, 2013
|
|||||||||||||||||||||||
|
Segment revenues:
|
|||||||||||||||||||||||
|
Service revenues
|
|||||||||||||||||||||||
|
External
|
$
|
717
|
|
$
|
—
|
|
$
|
—
|
|
$
|
4
|
|
$
|
—
|
|
$
|
721
|
|
|||||
|
Internal
|
—
|
|
—
|
|
—
|
|
3
|
|
(3
|
)
|
—
|
|
|||||||||||
|
Total service revenues
|
717
|
|
—
|
|
—
|
|
7
|
|
(3
|
)
|
721
|
|
|||||||||||
|
Product sales
|
|||||||||||||||||||||||
|
External
|
1,046
|
|
—
|
|
—
|
|
—
|
|
—
|
|
1,046
|
|
|||||||||||
|
Internal
|
—
|
|
—
|
|
—
|
|
—
|
|
—
|
|
—
|
|
|||||||||||
|
Total product sales
|
1,046
|
|
—
|
|
—
|
|
—
|
|
—
|
|
1,046
|
|
|||||||||||
|
Total revenues
|
$
|
1,763
|
|
$
|
—
|
|
$
|
—
|
|
$
|
7
|
|
$
|
(3
|
)
|
$
|
1,767
|
|
|||||
|
Segment profit (loss)
|
$
|
427
|
|
$
|
(1
|
)
|
$
|
29
|
|
$
|
1
|
|
$
|
456
|
|
||||||||
|
Less:
|
|||||||||||||||||||||||
|
Equity earnings (losses)
|
35
|
|
—
|
|
3
|
|
—
|
|
38
|
|
|||||||||||||
|
Income (loss) from investments
|
(1
|
)
|
—
|
|
26
|
|
—
|
|
25
|
|
|||||||||||||
|
Segment operating income (loss)
|
$
|
393
|
|
$
|
(1
|
)
|
$
|
—
|
|
$
|
1
|
|
393
|
|
|||||||||
|
General corporate expenses
|
(43
|
)
|
|||||||||||||||||||||
|
Operating income (loss)
|
$
|
350
|
|
||||||||||||||||||||
27
Notes (Continued)
|
Williams
Partners
|
Williams
NGL & Petchem
Services
|
Access
Midstream
Partners
|
Other
|
Eliminations
|
Total
|
||||||||||||||||||
|
(Millions)
|
|||||||||||||||||||||||
|
Six months ended June 30, 2014
|
|||||||||||||||||||||||
|
Segment revenues:
|
|||||||||||||||||||||||
|
Service revenues
|
|||||||||||||||||||||||
|
External
|
$
|
1,526
|
|
$
|
—
|
|
$
|
—
|
|
$
|
118
|
|
$
|
—
|
|
$
|
1,644
|
|
|||||
|
Internal
|
—
|
|
—
|
|
—
|
|
7
|
|
(7
|
)
|
—
|
|
|||||||||||
|
Total service revenues
|
1,526
|
|
—
|
|
—
|
|
125
|
|
(7
|
)
|
1,644
|
|
|||||||||||
|
Product sales
|
|||||||||||||||||||||||
|
External
|
1,783
|
|
—
|
|
—
|
|
—
|
|
—
|
|
1,783
|
|
|||||||||||
|
Internal
|
—
|
|
—
|
|
—
|
|
—
|
|
—
|
|
—
|
|
|||||||||||
|
Total product sales
|
1,783
|
|
—
|
|
—
|
|
—
|
|
—
|
|
1,783
|
|
|||||||||||
|
Total revenues
|
$
|
3,309
|
|
$
|
—
|
|
$
|
—
|
|
$
|
125
|
|
$
|
(7
|
)
|
$
|
3,427
|
|
|||||
|
Segment profit (loss)
|
$
|
896
|
|
$
|
(108
|
)
|
$
|
15
|
|
$
|
4
|
|
$
|
807
|
|
||||||||
|
Less:
|
|||||||||||||||||||||||
|
Equity earnings (losses)
|
55
|
|
(79
|
)
|
13
|
|
—
|
|
(11
|
)
|
|||||||||||||
|
Income (loss) from investments
|
—
|
|
—
|
|
4
|
|
—
|
|
4
|
|
|||||||||||||
|
Segment operating income (loss)
|
$
|
841
|
|
$
|
(29
|
)
|
$
|
(2
|
)
|
$
|
4
|
|
814
|
|
|||||||||
|
General corporate expenses
|
(83
|
)
|
|||||||||||||||||||||
|
Operating income (loss)
|
$
|
731
|
|
||||||||||||||||||||
|
Six months ended June 30, 2013
|
|||||||||||||||||||||||
|
Segment revenues:
|
|||||||||||||||||||||||
|
Service revenues
|
|||||||||||||||||||||||
|
External
|
$
|
1,419
|
|
$
|
—
|
|
$
|
—
|
|
$
|
8
|
|
$
|
—
|
|
$
|
1,427
|
|
|||||
|
Internal
|
—
|
|
—
|
|
—
|
|
6
|
|
(6
|
)
|
—
|
|
|||||||||||
|
Total service revenues
|
1,419
|
|
—
|
|
—
|
|
14
|
|
(6
|
)
|
1,427
|
|
|||||||||||
|
Product sales
|
|||||||||||||||||||||||
|
External
|
2,150
|
|
—
|
|
—
|
|
—
|
|
—
|
|
2,150
|
|
|||||||||||
|
Internal
|
—
|
|
—
|
|
—
|
|
—
|
|
—
|
|
—
|
|
|||||||||||
|
Total product sales
|
2,150
|
|
—
|
|
—
|
|
—
|
|
—
|
|
2,150
|
|
|||||||||||
|
Total revenues
|
$
|
3,569
|
|
$
|
—
|
|
$
|
—
|
|
$
|
14
|
|
$
|
(6
|
)
|
$
|
3,577
|
|
|||||
|
Segment profit (loss)
|
$
|
921
|
|
$
|
(3
|
)
|
$
|
29
|
|
$
|
(4
|
)
|
$
|
943
|
|
||||||||
|
Less:
|
|||||||||||||||||||||||
|
Equity earnings (losses)
|
53
|
|
—
|
|
3
|
|
—
|
|
56
|
|
|||||||||||||
|
Income (loss) from investments
|
(2
|
)
|
—
|
|
26
|
|
—
|
|
24
|
|
|||||||||||||
|
Segment operating income (loss)
|
$
|
870
|
|
$
|
(3
|
)
|
$
|
—
|
|
$
|
(4
|
)
|
863
|
|
|||||||||
|
General corporate expenses
|
(87
|
)
|
|||||||||||||||||||||
|
Operating income (loss)
|
$
|
776
|
|
||||||||||||||||||||
|
June 30, 2014
|
|||||||||||||||||||||||
|
Total assets
|
$
|
25,738
|
|
$
|
439
|
|
$
|
2,113
|
|
$
|
7,202
|
|
$
|
(543
|
)
|
$
|
34,949
|
|
|||||
|
December 31, 2013
|
|||||||||||||||||||||||
|
Total assets
|
$
|
23,571
|
|
$
|
486
|
|
$
|
2,161
|
|
$
|
1,359
|
|
$
|
(435
|
)
|
$
|
27,142
|
|
|||||
28
Notes (Continued)
Note 13 – Subsequent Event
On July 1, 2014, we acquired all of the interests in ACMP held by Global Infrastructure Partners II, which included
50
percent of the general partner interest and
55.1 million
limited partner units for
$5.995 billion
in cash (ACMP Acquisition). We now own
100
percent of the general partner interest, including incentive distribution rights, and approximately
50
percent of the limited partner units in ACMP. The acquisition was funded through the issuance of equity (See
Note 9 – Stockholders' Equity
) and debt (See
Note 8 – Debt and Banking Arrangements
), credit facility borrowings, and cash on hand. The cash used for the ACMP Acquisition is presented as a long-term asset on our Consolidated Balance Sheet at June 30, 2014 because it was designated for use in the ACMP Acquisition at that date. The amount appears as an investing outflow on our Consolidated Statement of Cash Flows as it relates to our anticipated acquisition of ACMP.
ACMP is a publicly traded master limited partnership listed on the New York Stock Exchange that owns, operates, develops, and acquires natural gas gathering systems and other midstream energy assets. The purpose of the acquisition is to enhance our position in the Marcellus and Utica shale plays, provide additional diversity via the Eagle Ford, Haynesville, Barnett, Mid-Continent, and Niobrara areas, and to fortify our stable, fee-based business model and support our dividend growth strategy.
Through our
100
percent ownership of the general partner we have obtained control of ACMP, therefore, this acquisition will be accounted for as a business combination which, among other things, requires identifiable assets acquired and liabilities assumed to be measured at their acquisition-date fair values. The excess of the consideration, including the fair value of the noncontrolling interest and our previously held equity interest, over those fair values will be recorded as goodwill. Substantially all of the goodwill is expected to be deductible for tax purposes.
Following the ACMP Acquisition, we will no longer account for our investment in ACMP by applying the equity method, but rather we expect to consolidate ACMP. We expect to recognize a significant non-cash gain, currently estimated to be in the range of
$2.5 billion
to
$3.0 billion
, in the third quarter of 2014 associated with obtaining control and now consolidating our investment in ACMP. This estimated gain is still subject to ongoing evaluation of significant assumptions, including those related to estimating the value of our initial
50
percent interest in the privately-held general partner.
Due to the recent closing of the ACMP Acquisition, we have not disclosed proforma revenues and earnings of the combined entity and the amounts expected to be recognized for each major class of assets acquired and liabilities assumed as the information necessary to prepare these disclosures is still under development. We plan to provide these disclosures in future filings.
29
Item 2
Management’s Discussion and Analysis of
Financial Condition and Results of Operations
General
We are an energy infrastructure company focused on connecting North America’s significant hydrocarbon resource plays to growing markets for natural gas, natural gas liquids, and olefins. Our operations are located principally in the United States, but span from the deepwater Gulf of Mexico to the Canadian oil sands, and are organized into the Williams Partners, Williams NGL & Petchem Services, and Access Midstream Partners reportable segments. All remaining business activities are included in Other.
Unless indicated otherwise, the following discussion and analysis of results of operations and financial condition and liquidity relates to our current continuing operations and should be read in conjunction with the consolidated financial statements and notes thereto of this Form 10-Q and our annual consolidated financial statements and notes thereto in Exhibit 99.1 of our Form 8-K dated May 22, 2014.
Williams Partners
Williams Partners includes WPZ, our consolidated master limited partnership, which includes two interstate natural gas pipelines, as well as investments in natural gas pipeline-related companies, which serve regions from the San Juan basin in northwestern New Mexico and southwestern Colorado to Oregon and Washington and from the Gulf of Mexico to the northeastern United States. WPZ also includes natural gas gathering, processing, and treating facilities and oil gathering and transportation facilities located primarily in the Rocky Mountain, Gulf Coast, and Marcellus Shale regions of the United States. WPZ also owns a 5/6 interest in an olefin production facility, along with a refinery grade propylene splitter and pipelines in the Gulf region, an oil sands offgas processing plant near Fort McMurray, Alberta, and an NGL/olefin fractionation facility and B/B splitter facility at Redwater, Alberta. As of June 30, 2014, we own approximately 66 percent of the interests in WPZ, including the interests of the general partner, which is wholly owned by us, and incentive distribution rights.
Williams Partners’ ongoing strategy is to safely and reliably operate large-scale, interstate natural gas transmission and midstream infrastructures where our assets can be fully utilized and drive low per-unit costs. We focus on consistently attracting new business by providing highly reliable service to our customers and utilizing our low cost-of-capital to invest in growing markets, including the deepwater Gulf of Mexico, the Marcellus Shale, the Gulf Coast Region, the Canadian oil sands, and areas of increasing natural gas demand.
Williams Partners’ interstate transmission and related storage activities are subject to regulation by the FERC and as such, our rates and charges for the transportation of natural gas in interstate commerce, and the extension, expansion or abandonment of jurisdictional facilities and accounting, among other things, are subject to regulation. The rates are established through the FERC’s ratemaking process. Changes in commodity prices and volumes transported have little near-term impact on revenues because the majority of cost of service is recovered through firm capacity reservation charges in transportation rates.
Williams NGL & Petchem Services
Williams NGL & Petchem Services includes certain other domestic olefins pipeline assets, certain Canadian growth projects under development, including a propane dehydrogenation facility and a liquids extraction plant, as well as the proposed Bluegrass Pipeline joint project (see
Note 2 – Variable Interest Entities
of Notes to Consolidated Financial Statements for more information regarding recent developments). As discussed in
Note 1 – General, Description of Business, and Basis of Presentation
of Notes to Consolidated Financial Statements, the currently operating Canadian assets were contributed to Williams Partners in the first quarter of 2014 and are now presented in the Williams Partners segment. As a result, the Williams NGL & Petchem Services segment is currently comprised primarily of projects under development and thus has no operating revenues to date. We anticipate contributing the assets and projects that comprise this segment by late 2014 or early 2015. Any transaction is subject to execution of an agreement, review and
30
Management’s Discussion and Analysis (Continued)
recommendation by the conflicts committee of the partnership’s general partner, and approval of both our and the partnership’s Board of Directors.
Access Midstream Partners
Access Midstream Partners includes our equity-method investment in ACMP. As of June 30, 2014, this investment includes a 23 percent limited partner interest in ACMP and a 50 percent indirect interest in Access GP, including incentive distribution rights. ACMP is a publicly traded master limited partnership that owns, operates, develops, and acquires natural gas gathering systems and other midstream energy assets, which bolsters our position in the Marcellus and Utica shale plays and adds diversity via the Eagle Ford, Haynesville, Barnett, Mid-Continent, and Niobrara areas.
On July 1, 2014, we acquired all of the interests in ACMP held by Global Infrastructure Partners II (GIP) which included 50 percent of the general partner interest and 55.1 million limited partner units for $5.995 billion in cash (ACMP Acquisition). We now own 100 percent of the general partner interest, including incentive distribution rights, and approximately 50 percent of the limited partner units in ACMP. We expect to recognize a significant non-cash gain, currently estimated to be in the range of $2.5 billion to $3.0 billion, upon the consolidation of ACMP in the third quarter. Additionally, as a result of the ACMP Acquisition, we expect ACMP will recognize approximately $80 million of expense in the third quarter of 2014 related to a management incentive compensation plan and an equity-based compensation plan at ACMP. We have proposed merging WPZ with and into ACMP in a unit-for-unit exchange at a ratio of 0.85 ACMP units per WPZ unit, subject to approval by each partnership’s board of directors and the WPZ unitholders. The proposal also includes an option for WPZ unitholders to take either a one-time special payment of $0.81 per unit, or an equivalent value of additional common units of ACMP, to compensate for lower expected per-unit limited partner cash distributions in 2015. All subsequent references to 2014 plan amounts within this Management’s Discussion and Analysis do not reflect the proposed merger.
Dividends
In June 2014, we paid a regular quarterly dividend of $0.425 per share, which was 21 percent higher than the same period last year and 6 percent higher than the prior quarter. Also, consistent with our expectation of receiving increasing cash distributions from our interests in WPZ and ACMP, we expect to increase our dividend on a quarterly basis. We expect a 32 percent dividend increase from the second quarter to the third quarter and an annual increase through 2017 of 15 percent over the third quarter 2014 annualized amount.
Overview of
Six Months Ended
June 30, 2014
Income (loss) from continuing operations attributable to The Williams Companies, Inc.
, for the
six
months ended
June 30, 2014
, changed unfavorably by $72 million compared to the
six
months ended
June 30, 2013
, primarily due to equity losses from the proposed Bluegrass Pipeline project, reflecting a write-off of development costs that were previously capitalized and other associated costs that were incurred during the first quarter. The six months ended June 30, 2014 also reflects increased service revenues partially offset by lower NGL margins. See additional discussion in Results of Operations.
Abundant and low-cost natural gas reserves in the United States continue to drive strong demand for midstream and pipeline infrastructure. We believe that we have successfully positioned our energy infrastructure businesses for significant future growth.
Williams Partners
Canada Dropdown
On February 28, 2014, we contributed certain of our Canadian operations to WPZ, including an oil sands offgas processing plant near Fort McMurray, Alberta, and an NGL/olefin fractionation facility and B/B splitter facility at Redwater, Alberta. These businesses were previously reported within our Williams NGL & Petchem Services segment, but are now reported within Williams Partners. Prior period segment disclosures have been recast for this transaction. WPZ funded the transaction with $56 million of cash including $31 million that was received in the second quarter, the issuance of 25,577,521 Class D limited-partner units, and an increase in the capital account of its general partner
31
Management’s Discussion and Analysis (Continued)
to allow us to maintain our 2 percent general partner interest. In lieu of cash distributions, the Class D units receive quarterly distributions of additional paid-in-kind Class D units. All Class D units outstanding will be convertible to common units beginning in the first quarter of 2016. The contribution agreement governing the Canada Dropdown provides that WPZ can issue additional Class D units to us on a quarterly basis through 2015 for up to a total of $200 million in cash for the purpose of funding certain facility expansions. At June 30, 2014, no additional Class D units have been issued to us under this provision.
Geismar Incident
On June 13, 2013, an explosion and fire occurred at WPZ’s Geismar olefins plant. The fire was extinguished on the day of the incident. The Geismar Incident rendered the facility temporarily inoperable and resulted in significant human, financial, and operational effects.
We have substantial insurance coverage for repair and replacement costs, lost production and additional expenses related to the incident as follows:
|
•
|
Property damage and business interruption coverage with a combined per-occurrence limit of $500 million and retentions (deductibles) of $10 million per occurrence for property damage and a 60-day waiting period per occurrence for business interruption;
|
|
•
|
General liability coverage with per-occurrence and aggregate annual limits of $610 million and retentions (deductibles) of $2 million per occurrence;
|
|
•
|
Workers’ compensation coverage with statutory limits and retentions (deductibles) of $1 million total per occurrence.
|
During the first six months of 2014, we received
$175 million
of insurance recoveries related to the Geismar Incident and incurred
$14 million
of related covered insurable expenses in excess of our retentions (deductibles). These amounts are reflected as a net gain in
Net insurance recoveries- Geismar Incident
within
Costs and expenses
in our
Consolidated Statement of Income
.
Following the repair and an expansion of the plant, we expect the Geismar plant to return to operation in the fourth quarter of 2014. The delay from the previous expectation resulted from the recent decision to install certain safety-related equipment and to provide additional contingency associated with the start-up process.
We expect our total loss to exceed our $500 million policy limit, which would result in a total claim of approximately $432 million related to business interruption and approximately $68 million related to the repair of the plant. Through June 2014, we have received a total of $225 million from insurers. We received $50 million of our most recent claim of $200 million as the insurers are evaluating our claim and have raised questions around key assumptions involving our business interruption claim. We continue to work with insurers in support of all claims, as submitted, and are vigorously pursuing collection of the remaining $275 million insurance limits. Further, we are impacted by certain uninsured losses, including amounts associated with the 60-day waiting period for business interruption, as well as other deductibles, policy limits, and uninsured expenses. Our assumptions and estimates, including the timing for the expanded plant return to operation, repair cost estimates and insurance proceeds associated with our property damage and business interruption coverage, are subject to various risks and uncertainties that could cause the actual results to be materially different.
New Transco rates effective
On August 31, 2012, Transco submitted to the FERC a general rate filing principally designed to recover increased costs and to comply with the terms of the settlement in its prior rate proceeding. The new rates became effective March 1, 2013, subject to refund and the outcome of a hearing. On August 27, 2013, Transco filed a stipulation and agreement with the FERC proposing to resolve all issues in this proceeding without the need for a hearing (Agreement). On December 6, 2013, the FERC issued an order approving the Agreement without modifications. Pursuant to its terms, the Agreement became effective March 1, 2014. We paid
$118 million
of rate refunds on April 18, 2014.
32
Management’s Discussion and Analysis (Continued)
Caiman II
As a result of $119 million of contributions made in the first quarter of 2014, our ownership in the Caiman II joint project increased to 58 percent at June 30, 2014. These contributions are used to fund Caiman II’s 50 percent investment in Blue Racer Midstream LLC, which is expanding gathering and processing and the associated liquids infrastructure serving oil and gas producers in the Utica Shale.
Volatile commodity prices
NGL margins were approximately 23 percent lower in the first six months of 2014 compared to the same period of 2013 driven by lower volumes, as well as higher natural gas prices, partially offset by favorable non-ethane prices. Volumes declined primarily due to a customer contract in the West that expired in September 2013, as well as higher inventory levels. Due to unfavorable ethane economics, we further reduced our recoveries of ethane in our domestic plants in the first six months of 2014, compared to the same period in 2013. These reductions are substantially offset by new volumes generated by our Canadian ethane recovery facility which was placed into service in December 2013.
NGL margins are defined as NGL revenues less any applicable Btu replacement cost, plant fuel, and third-party transportation and fractionation. Per-unit NGL margins are calculated based on sales of our own equity volumes at the processing plants. Our equity volumes include NGLs where we own the rights to the value from NGLs recovered at our plants under both “keep-whole” processing agreements, where we have the obligation to replace the lost heating value with natural gas, and “percent-of-liquids” agreements whereby we receive a portion of the extracted liquids with no obligation to replace the lost heating value.
The following graph illustrates the effects of this price volatility, notably the decline in equity ethane sales driven by reduced recoveries, as well as the margin differential between ethane and non-ethane products and the relative mix of those products.
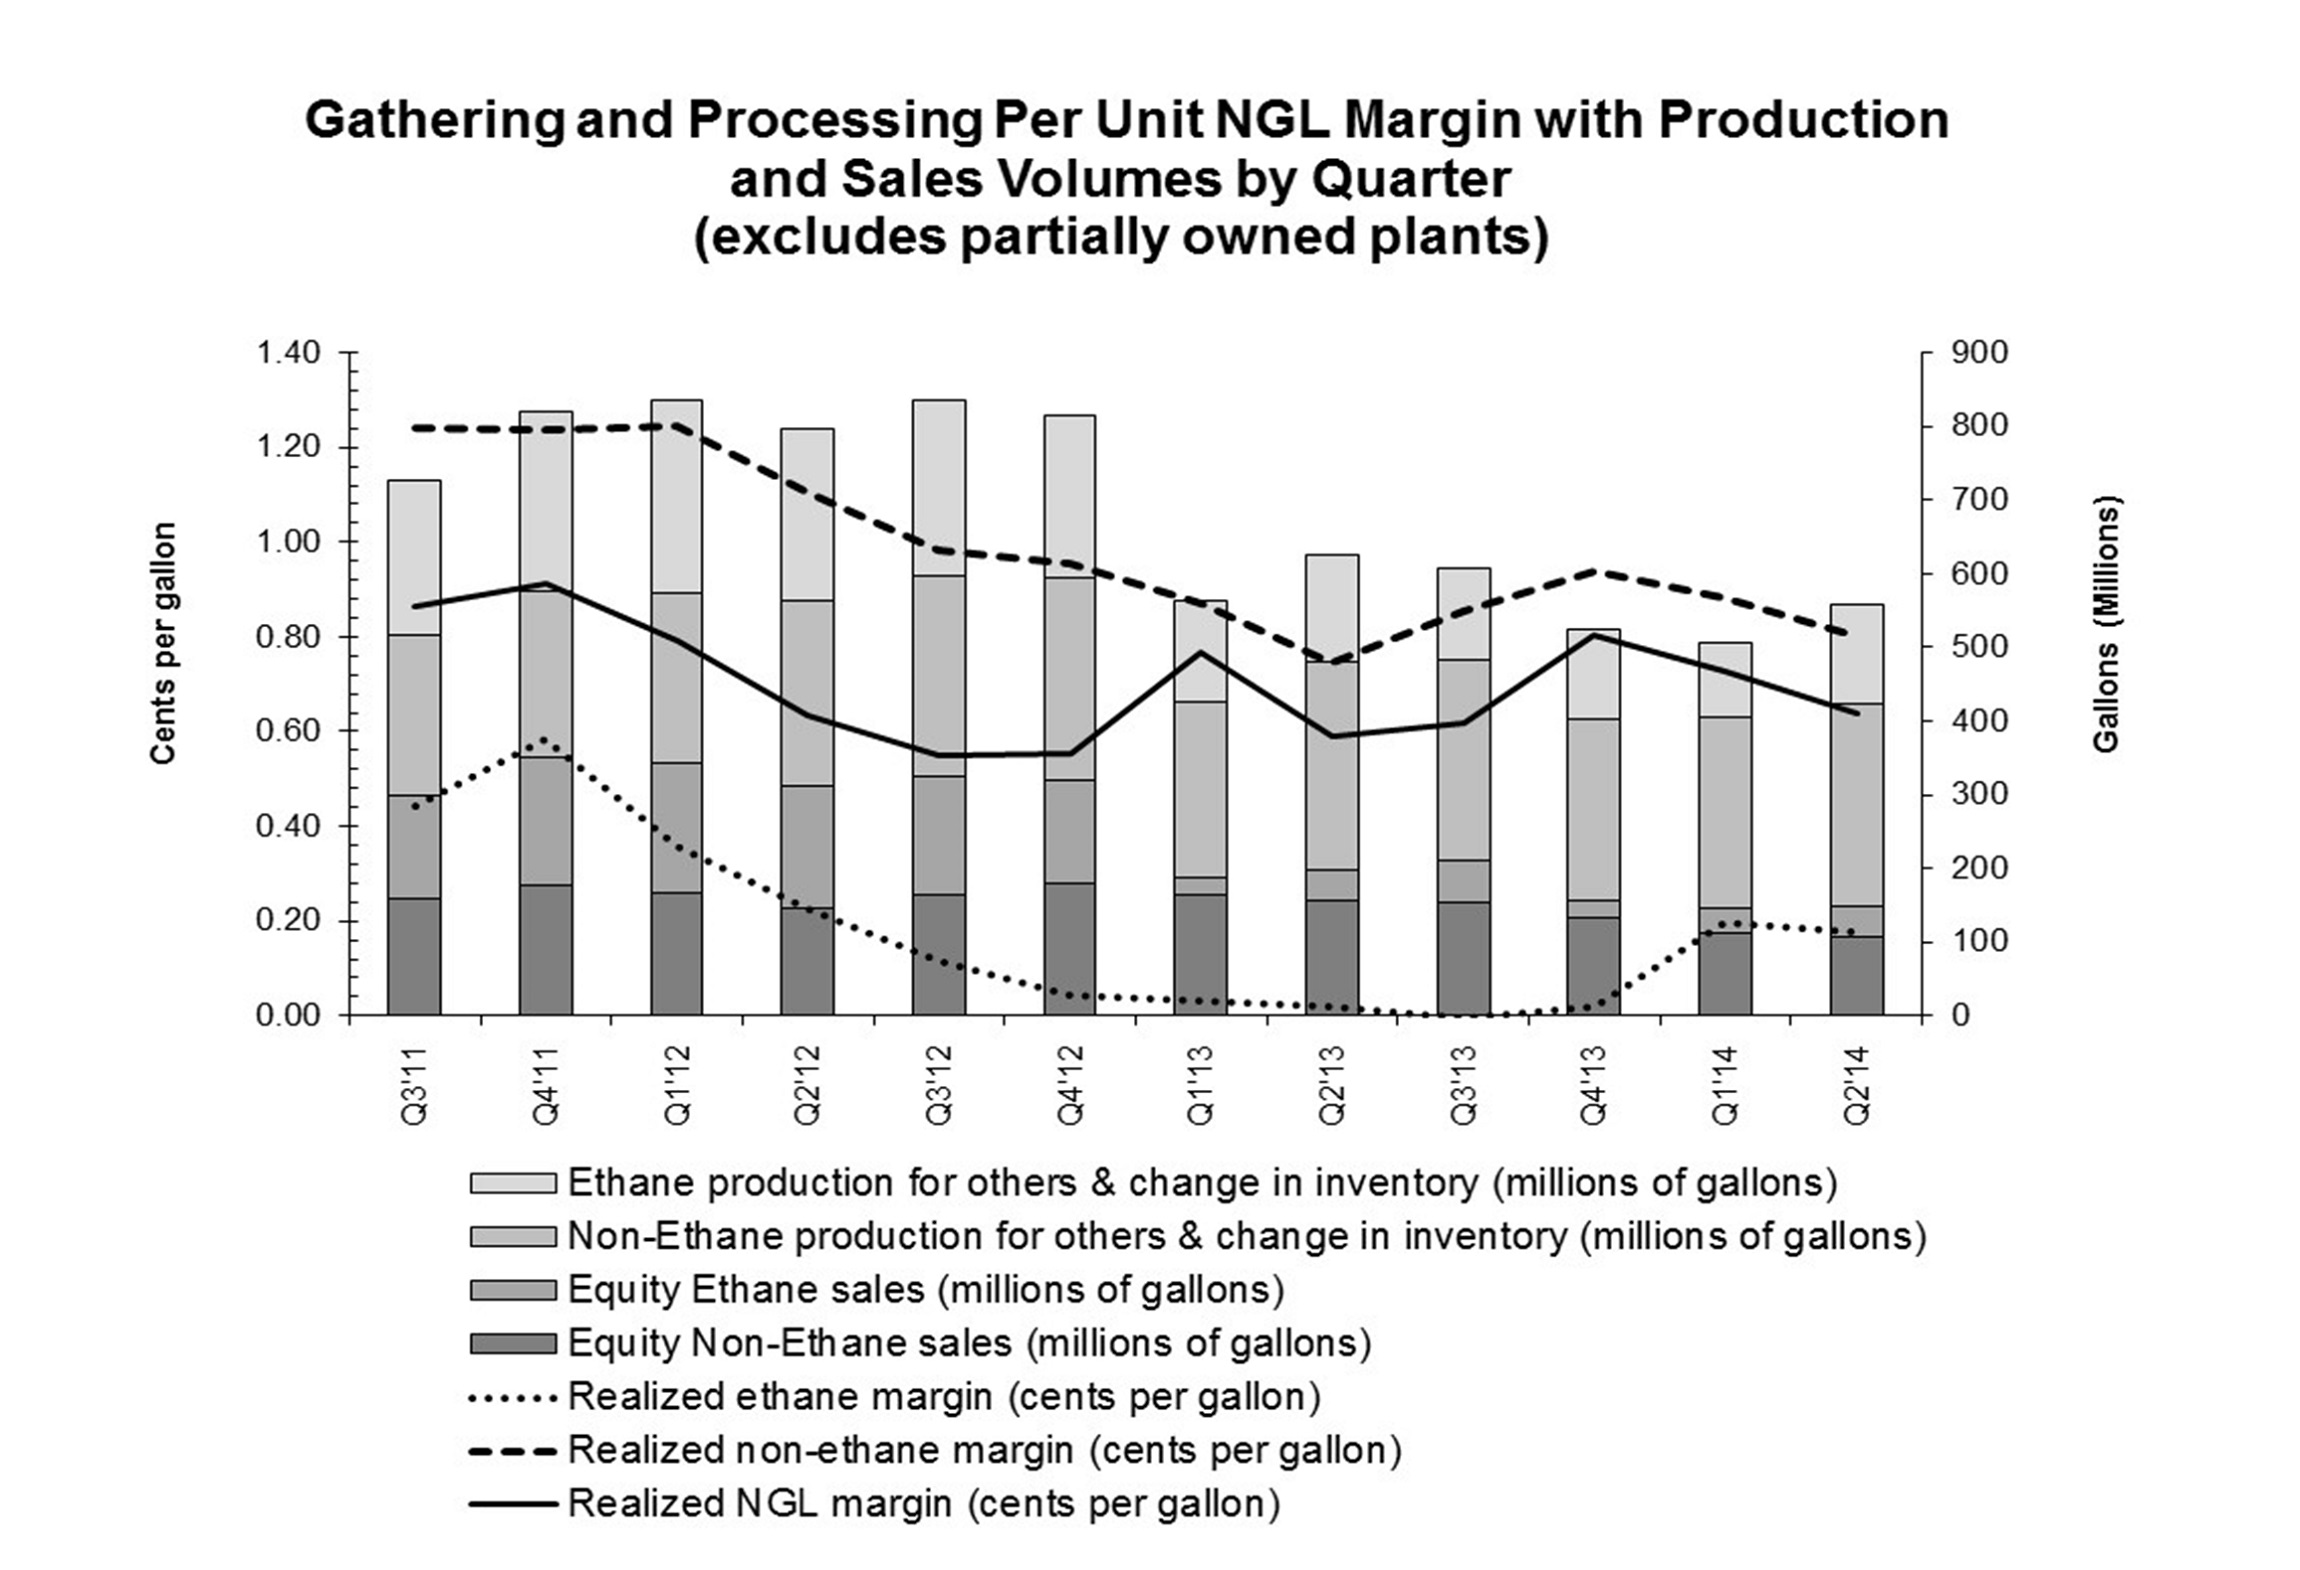
|
33
Management’s Discussion and Analysis (Continued)
Williams NGL & Petchem Services
Bluegrass Pipeline and Moss Lake
We own a 50 percent interest in the proposed Bluegrass Pipeline, which would connect processing facilities in the Marcellus and Utica shale-gas areas in the U.S. Northeast to growing petrochemical and export markets in the U.S. Gulf Coast. Completion of this project is subject to execution of customer contracts sufficient to support the project. Although discussions with potential customers continue, we have not received sufficient executed customer commitments to date to support the continued development of the project. Considering this and other factors, our management decided in April 2014 to discontinue further funding of the project at this time. Given these developments, the capitalized project development costs at the Bluegrass Pipeline entity were written off as of March 31, 2014.
We also own 50 percent interests in Moss Lake Fractionation LLC and Moss Lake LPG Terminal LLC (collectively referred to as Moss Lake). Moss Lake may construct a proposed new large-scale fractionation plant, expand natural gas liquids storage facilities in Louisiana and construct a proposed pipeline connecting these facilities to the Bluegrass Pipeline. Additionally, Moss Lake may construct a proposed new liquefied petroleum gas (LPG) terminal. The capitalized project development costs at the Moss Lake entities were written off as of March 31, 2014.
Company Outlook
Our strategy is to provide large-scale energy infrastructure designed to maximize the opportunities created by the vast supply of natural gas, natural gas products, and crude oil that exists in North America. We seek to accomplish this through further developing our scale positions in current key markets and basins and entering new growth markets and basins where we can become the large-scale service provider. We will maintain a strong commitment to safety, environmental stewardship, operational excellence and customer satisfaction. We believe that accomplishing these goals will position us to deliver an attractive return to our shareholders.
Consistent with our strategy, we recently completed the ACMP Acquisition which is expected to bolster our position in the Marcellus and Utica shale plays and add diversity via the Eagle Ford, Haynesville, Barnett, Mid-Continent, and Niobrara areas. We have proposed merging WPZ with and into ACMP subject to approval by each partnership’s conflicts committees and board of directors and the WPZ unitholders.
Fee-based businesses are a significant component of our portfolio and are expected to increase as a result of the ACMP Acquisition. As we continue to transition to an overall business mix that is increasingly fee-based, the influence of commodity price fluctuations on our operating results and cash flows is expected to become somewhat less significant.
Our business plan for 2014 reflects both significant capital investment and continued dividend growth. Our planned consolidated capital investments for 2014 total approximately $10.9 billion, including both the ACMP Acquisition and ACMP’s capital investments for the remainder of the year. We also expect approximately 36 percent growth in total 2014 dividends, including the previously mentioned third-quarter increase, which we expect to fund primarily with distributions received from WPZ and ACMP. We expect to maintain an attractive cost of capital and reliable access to capital markets, both of which will allow us to pursue development projects and acquisitions.
Potential risks and obstacles that could impact the execution of our plan include:
|
•
|
General economic, financial markets, or industry downturn;
|
|
•
|
Unexpected significant increases in capital expenditures or delays in capital project execution;
|
|
•
|
Lower than anticipated or delay in receiving insurance recoveries associated with the Geismar Incident;
|
|
•
|
Lower than expected distributions, including IDRs, from WPZ and ACMP. WPZ’s liquidity could also be impacted by a lack of adequate access to capital markets to fund its growth;
|
34
Management’s Discussion and Analysis (Continued)
|
•
|
Limited availability of capital due to a change in our financial condition, interest rates, market or industry conditions;
|
|
•
|
Counterparty credit and performance risk;
|
|
•
|
Decreased volumes from third parties served by our midstream business;
|
|
•
|
Lower than anticipated energy commodity prices and margins;
|
|
•
|
Changes in the political and regulatory environments;
|
|
•
|
Physical damages to facilities, including damage to offshore facilities by named windstorms;
|
|
•
|
Reduced availability of insurance coverage.
|
We continue to address these risks through disciplined investment strategies, sufficient liquidity from cash and cash equivalents and available capacity under our revolving credit facilities.
In 2014, we anticipate an overall improvement in operating results compared to 2013 primarily due to an increase in our fee based and Canadian midstream businesses, partially offset by lower olefins and NGL margins and higher operating expenses associated with the growth of our business. As a result of the ACMP acquisition, our results for the remainder of 2014 will also include a significant non-cash gain, currently estimated to be in the range of $2.5 to $3.0 billion, and higher fee-based business results, partially offset by higher depreciation and amortization expenses.
The following factors, among others, could impact our businesses in 2014.
Williams Partners
Commodity price changes
NGL and olefin price changes have historically correlated somewhat with changes in the price of crude oil, although NGL, olefin, crude, and natural gas prices are highly volatile, and difficult to predict. Commodity margins are highly dependent upon regional supply/demand balances of natural gas as they relate to NGL margins, while olefins are impacted by continued supply and demand within the global economy. NGL prices will benefit from exports to satisfy global demand. NGL products are currently the preferred feedstock for ethylene and propylene production, and are expected to remain advantaged over crude-based feedstocks into the foreseeable future. We continue to benefit from our strategic feedstock cost advantage in propylene production from Canadian oil sands offgas.
We anticipate the following trends in overall commodity prices in 2014 as compared to 2013:
|
•
|
Natural gas prices are expected to be higher in part due to the additional demand to replace the gas volumes withdrawn during the colder than normal weather over the past winter season.
|
|
•
|
Ethane prices are expected to be somewhat higher due to a modest increase in demand as well as slightly higher natural gas prices.
|
|
•
|
Propane prices are expected to be higher from an increase in exports and higher natural gas prices.
|
|
•
|
Propylene prices are expected to be comparable to 2013 prices.
|
|
•
|
Ethylene prices and the overall ethylene crack spread are expected to be comparable to 2013 levels.
|
35
Management’s Discussion and Analysis (Continued)
Gathering, transportation, processing, and NGL sales volumes
The growth of natural gas production supporting our gathering and processing volumes is impacted by producer drilling activities, which are influenced by commodity prices including natural gas, ethane and propane prices. In addition, the natural decline in production rates in producing areas impact the amount of gas available for gathering and processing. Due in part to the higher natural gas prices in the early part of 2014, we anticipate that overall drilling economics will improve slightly, which will benefit us in the long-term.
|
•
|
In Williams Partners’ northeast region, we anticipate significant growth compared to the prior year in our natural gas gathering and processing volumes as our infrastructure grows to support drilling activities in the region.
|
|
•
|
In Williams Partners’ Transco and Northwest Pipeline businesses, we anticipate higher natural gas transportation revenues compared to 2013, as a result of expansion projects placed into service in 2013 and anticipated to be placed in service in 2014.
|
|
•
|
In Williams Partners’ Gulf Coast region, we expect higher production handling volumes compared to 2013, following the scheduled completion of Gulfstar FPS™ in third quarter 2014.
|
|
•
|
In Williams Partners’ western region, we anticipate an unfavorable impact in equity NGL volumes in 2014 compared to 2013, primarily due to a customer contract that expired in September 2013.
|
|
•
|
In 2014, Williams Partners’ domestic businesses anticipate a continuation of periods when it will not be economical to recover ethane.
|
|
•
|
In Williams Partners’ Canadian midstream business, we anticipate new ethane volumes in 2014 associated with the December 2013 completion of the Canadian ethane recovery project, which is expected to benefit from a contractual minimum ethane sales price.
|
Olefin production volumes
|
•
|
Williams Partners’ Canadian olefins business expects higher propylene volumes in 2014 than 2013. Volumes in 2013 were negatively impacted by both a planned maintenance turnaround and downtime associated with the tie-in of the Canadian ethane recovery project.
|
|
•
|
Williams Partners’ Gulf olefins business anticipates lower ethylene volumes in 2014 compared to 2013 substantially due to the repair and expansion of the Geismar plant, which is expected to return to operation in the fourth quarter of 2014.
|
Other
|
•
|
Williams Partners’ expects higher operating expenses in 2014 compared to 2013, including depreciation expense related to its growing operations in its northeast region and expansion projects in its gas pipeline businesses.
|
|
•
|
Williams Partners’ expects higher equity earnings compared to 2013 following the scheduled completion of Discovery’s Keathley Canyon Connector™ lateral in the fourth quarter of 2014.
|
Access Midstream Partners
As a result of completing the previously mentioned ACMP Acquisition on July 1, 2014, we now own 100 percent of the general partner and approximately 50 percent of the limited partner units in ACMP. As such, we expect to receive higher cash distributions associated with our increase in ownership percentage, including 100 percent of the incentive distributions. Following the ACMP Acquisition, we will no longer account for our investment in ACMP as
36
Management’s Discussion and Analysis (Continued)
an equity investment, but rather we expect to consolidate ACMP, which will impact our operating results for the remainder of 2014.
We expect to recognize a significant non-cash gain, currently estimated to be in the range of $2.5 to $3.0 billion, in the third quarter of 2014 associated with accounting for the ACMP business combination. Our future reported results for ACMP as a consolidated entity will reflect our higher basis in ACMP following the ACMP Acquisition and will not necessarily be consistent with ACMP’s standalone reported results reflecting its historical basis. We expect our reported results to reflect higher depreciation and amortization expense associated with our increased basis in ACMP.
In the third-quarter of 2013, ACMP increased its cash distribution by five cents per unit. Following this increase, annual distributions to unitholders are expected to grow by approximately 15 percent in 2014. We forecast that we will receive cash distributions of approximately $227 million from ACMP for 2014, including the additional distributions associated with our increased ownership percentage resulting from the ACMP Acquisition.
Expansion Projects
We expect to invest total capital in 2014 among our business segments as follows:
|
Low
|
High
|
||||||
|
(Millions)
|
|||||||
|
Segment:
|
|||||||
|
Williams Partners
|
$
|
3,140
|
|
$
|
3,640
|
|
|
|
Williams NGL & Petchem Services
|
400
|
|
500
|
|
|||
|
Access Midstream Partners
|
525
|
|
625
|
|
|||
Our ongoing major expansion projects include the following:
Williams Partners
Atlantic Sunrise
The Atlantic Sunrise Expansion Project involves an expansion of Transco’s existing natural gas transmission system along with greenfield facilities to provide firm transportation from the northeastern Marcellus producing area to markets along Transco’s mainline as far south as Station 85 in Alabama. We plan to file an application with the FERC in the second quarter of 2015 for approval of the project. We plan to place the project into service during the second half of 2017, assuming timely receipt of all necessary regulatory approvals, and it is expected to increase capacity by 1,700 Mdth/d.
Leidy Southeast
In September 2013, we filed an application with the FERC for Transco’s Leidy Southeast Expansion project to expand our existing natural gas transmission system from the Marcellus Shale production region on Transco’s Leidy Line in Pennsylvania to delivery points along its mainline as far south as Station 85 in Alabama. We plan to place the project into service during the fourth quarter of 2015, assuming timely receipt of all necessary regulatory approvals, and expect it to increase capacity by 525 Mdth/d.
Mobile Bay South III
In April 2014, we received approval from the FERC to construct and operate an expansion of Transco’s Mobile Bay line south from Station 85 in west central Alabama to delivery points along the line. We plan to place the project into service during the second quarter of 2015 and it is expected to increase capacity on the line by 225 Mdth/d.
37
Management’s Discussion and Analysis (Continued)
Constitution Pipeline
In June 2013, we filed an application with the FERC for authorization to construct and operate the jointly owned Constitution pipeline. We currently own 41 percent of Constitution with three other parties holding 25 percent, 24 percent, and 10 percent, respectively. We will be the operator of Constitution. The 126-mile Constitution pipeline will connect our gathering system in Susquehanna County, Pennsylvania, to the Iroquois Gas Transmission and Tennessee Gas Pipeline systems in New York. We plan to place the project into service in late 2015 to 2016, assuming timely receipt of all necessary regulatory approvals, with an expected capacity of 650 Mdth/d. The pipeline is fully subscribed with two shippers.
Northeast Connector
In May 2014, we received FERC approval to expand Transco’s existing natural gas transmission system from southeastern Pennsylvania to the proposed Rockaway Delivery Lateral. We plan to place the project into service during the fourth quarter of 2014 and expect it to increase capacity by 100 Mdth/d.
Rockaway Delivery Lateral
In May 2014, we received FERC approval to construct a three-mile offshore lateral to a distribution system in New York. We plan to place the project into service during the fourth quarter of 2014, and the capacity of the lateral is expected to be 647 Mdth/d.
Virginia Southside
In November 2013, we received approval from the FERC to expand Transco’s existing natural gas transmission system from New Jersey to a proposed power station in Virginia and delivery points in North Carolina. We plan to place the project into service during the third quarter of 2015, and expect it to increase capacity by 270 Mdth/d.
Rock Springs Expansion
In June 2014, we filed an application with the FERC for Transco’s Rock Springs Expansion project to expand our existing natural gas transmission system from New Jersey to a proposed generation facility in Maryland. The project is planned to be placed into service in third quarter 2016, assuming timely receipt of all necessary regulatory approvals, and is expected to increase capacity by 192 Mdth/d.
Marcellus Shale Expansions
|
•
|
Expansion of our gathering infrastructure including compression and gathering pipelines in the Susquehanna Supply Hub in northeastern Pennsylvania as production in the Marcellus increases. The Susquehanna Supply Hub is expected to reach a natural gas take away capacity of 3 Bcf/d by 2015.
|
|
•
|
In the first half of 2014, we completed a 30 Mbbls/d expansion of the Moundsville fractionator facility, the construction of a 50-mile ethane pipeline, and the first phase of the condensate stabilization project in the Marcellus Shale. In third quarter 2014, we expect to complete the installation of 40 Mbbls/d of deethanization facilities, the first 200 MMcf/d of processing at Oak Grove, and the last phase of the condensate stabilization project.
|
|
•
|
Construction of the Blue Racer Midstream joint project, an expansion to gathering and processing and the associated liquids infrastructure serving oil and gas producers in the Utica Shale, primarily in Ohio and Northwest Pennsylvania through capital to be invested within our Caiman II equity investment. Expansion plans included the addition of Natrium II, a second 200 MMcf/d processing plant at Natrium, which was completed in April 2014. Construction of an additional 200 MMcf/d processing plant is underway at the Berne complex in Monroe County, Ohio. Berne I is expected to come online in the fourth quarter of 2014.
|
38
Management’s Discussion and Analysis (Continued)
Gulfstar One
We designed, constructed, and are installing our Gulfstar FPS™, a spar-based floating production system that utilizes a standard design approach with a capacity of 60 Mbbls/d of oil, up to 200 MMcf/d of natural gas, and the capability to provide seawater injection services. Installation is under way and the project is expected to be in service in the third quarter 2014. In December 2013, Gulfstar One agreed to host the Gunflint development, which will result in an expansion of the Gulfstar One system to provide production handling capacity of 20 Mbbls/d and 40 MMcf/d for Gunflint. The Gunflint project is expected to be completed in the first quarter of 2016, dependent on the producer’s development activities.
Parachute
Due to a reduction in drilling in the Piceance basin during 2012 and early 2013, we delayed the in-service date of our 350 MMcf/d cryogenic natural gas processing plant in Parachute that was planned for service in 2014. We are currently planning an in-service date in mid-2016. We will continue to monitor the situation to determine whether a different in-service date is warranted.
Geismar
As a result of the Geismar Incident, the expansion of our Geismar olefins production facility is expected to be completed when the Geismar plant returns to operation. We expect the plant to return to operation in the fourth quarter of 2014. The expansion is expected to increase the facility’s ethylene production capacity by 600 million pounds per year to a new annual capacity of 1.95 billion pounds. The additional capacity will be wholly owned by us and is expected to increase our ownership of the Geismar production facility from the current 83.3 percent.
Keathley Canyon Connector™
Discovery is constructing a 215-mile, 20-inch deepwater lateral pipeline in the central deepwater Gulf of Mexico that it will own and operate. Discovery has signed long-term agreements with anchor customers for natural gas gathering and processing services for production from the Keathley Canyon and Green Canyon areas. The Keathley Canyon Connector™ lateral will originate from a third-party floating production facility in the southeast portion of the Keathley Canyon area and will connect to Discovery’s existing 30-inch offshore natural gas transmission system. The gas will be processed at Discovery’s Larose Plant and the NGLs will be fractionated at Discovery’s Paradis Fractionator. The lateral pipeline is estimated to have the capacity to flow more than 400 MMcf/d and will accommodate the tie-in of other deepwater prospects. The pipeline is expected to be in service in the fourth quarter of 2014.
Redwater Expansion
As part of a long-term agreement to provide gas processing to a second bitumen upgrader in Canada’s oil sands near Fort McMurray, Alberta, we plan to increase the capacity of the Redwater facilities where NGL/olefins mixtures will be fractionated into an ethane/ethylene mix, propane, polymer grade propylene, normal butane, an alkylation feed and condensate. This project is expected to be placed into service during the fourth quarter of 2015.
Williams NGL & Petchem Services
Canadian PDH Facility
We are planning to build a PDH facility in Alberta that will significantly increase production of polymer-grade propylene. Start-up for the PDH facility is expected to occur in the second half of 2018. The new PDH facility is expected to produce approximately 1.1 billion pounds annually, significantly increasing Williams’ production of polymer-grade propylene currently at 180 million pounds annually.
39
Management’s Discussion and Analysis (Continued)
NGL Infrastructure Expansion
As part of a long-term agreement to provide gas processing to a second bitumen upgrader in Canada’s oil sands near Fort McMurray, Alberta, we plan to build a new liquids extraction plant and an extension of the Boreal Pipeline. The extension of the Boreal Pipeline will enable transportation of the NGL/olefins mixture from the new extraction plant. The NGL/olefins recovered are initially expected to be approximately 12 Mbbls/d by fourth quarter 2015. To mitigate the associated ethane price risk, we have a long-term supply agreement with a third-party customer.
Gulf Coast Expansion
In November 2012, we acquired 10 liquids pipelines in the Gulf Coast region. The acquired pipelines will be combined with an organic build-out of several projects to expand our petrochemical services in that region. The projects include the construction and commissioning of pipeline systems capable of transporting various products in the Gulf Coast region. A butanes/ gasoline pipeline is expected to be placed into service in 2014, with additional pipelines expected to be placed into service during 2015 through 2017.
40
Management’s Discussion and Analysis (Continued)
Results of Operations
Consolidated Overview
The following table and discussion is a summary of our consolidated results of operations for the three and six months ended June 30, 2014, compared to the three and six months ended June 30, 2013. The results of operations by segment are discussed in further detail following this consolidated overview discussion.
|
Three months ended
June 30, |
Six months ended
June 30, |
||||||||||||||||||||||
|
2014
|
2013
|
$ Change*
|
% Change*
|
2014
|
2013
|
$ Change*
|
% Change*
|
||||||||||||||||
|
(Millions)
|
(Millions)
|
||||||||||||||||||||||
|
Revenues:
|
|||||||||||||||||||||||
|
Service revenues
|
$
|
825
|
|
$
|
721
|
|
+104
|
+14%
|
$
|
1,644
|
|
$
|
1,427
|
|
+217
|
+15%
|
|||||||
|
Product sales
|
853
|
|
1,046
|
|
-193
|
-18%
|
1,783
|
|
2,150
|
|
-367
|
-17%
|
|||||||||||
|
Total revenues
|
1,678
|
|
1,767
|
|
3,427
|
|
3,577
|
|
|||||||||||||||
|
Costs and expenses:
|
|
||||||||||||||||||||||
|
Product costs
|
724
|
|
801
|
|
+77
|
+10%
|
1,493
|
|
1,591
|
|
+98
|
+6%
|
|||||||||||
|
Operating and maintenance expenses
|
308
|
|
291
|
|
-17
|
-6%
|
606
|
|
551
|
|
-55
|
-10%
|
|||||||||||
|
Depreciation and amortization expenses
|
214
|
|
198
|
|
-16
|
-8%
|
428
|
|
399
|
|
-29
|
-7%
|
|||||||||||
|
Selling, general, and administrative expenses
|
136
|
|
123
|
|
-13
|
-11%
|
286
|
|
255
|
|
-31
|
-12%
|
|||||||||||
|
Net insurance recoveries – Geismar Incident
|
(42
|
)
|
—
|
|
+42
|
NM
|
(161
|
)
|
—
|
|
+161
|
NM
|
|||||||||||
|
Other (income) expense – net
|
27
|
|
4
|
|
-23
|
NM
|
44
|
|
5
|
|
-39
|
NM
|
|||||||||||
|
Total costs and expenses
|
1,367
|
|
1,417
|
|
2,696
|
|
2,801
|
|
|||||||||||||||
|
Operating income (loss)
|
311
|
|
350
|
|
731
|
|
776
|
|
|||||||||||||||
|
Equity earnings (losses)
|
37
|
|
38
|
|
-1
|
-3%
|
(11
|
)
|
56
|
|
-67
|
NM
|
|||||||||||
|
Interest expense
|
(163
|
)
|
(127
|
)
|
-36
|
-28%
|
(303
|
)
|
(255
|
)
|
-48
|
-19%
|
|||||||||||
|
Other investing income – net
|
18
|
|
39
|
|
-21
|
-54%
|
32
|
|
52
|
|
-20
|
-38%
|
|||||||||||
|
Other income (expense) – net
|
4
|
|
2
|
|
+2
|
+100%
|
5
|
|
—
|
|
+5
|
NM
|
|||||||||||
|
Income (loss) from continuing operations before income taxes
|
207
|
|
302
|
|
454
|
|
629
|
|
|||||||||||||||
|
Provision (benefit) for income taxes
|
84
|
|
102
|
|
+18
|
+18%
|
135
|
|
198
|
|
+63
|
+32%
|
|||||||||||
|
Income (loss) from continuing operations
|
123
|
|
200
|
|
319
|
|
431
|
|
|||||||||||||||
|
Income (loss) from discontinued operations
|
4
|
|
(8
|
)
|
+12
|
NM
|
4
|
|
(9
|
)
|
+13
|
NM
|
|||||||||||
|
Net income (loss)
|
127
|
|
192
|
|
323
|
|
422
|
|
|||||||||||||||
|
Less: Net income attributable to noncontrolling interests
|
24
|
|
50
|
|
+26
|
+52%
|
80
|
|
119
|
|
+39
|
+33%
|
|||||||||||
|
Net income (loss) attributable to The Williams Companies, Inc.
|
$
|
103
|
|
$
|
142
|
|
$
|
243
|
|
$
|
303
|
|
|||||||||||
|
*
|
+ = Favorable change; - = Unfavorable change; NM = A percentage calculation is not meaningful due to a change in signs, a zero-value denominator, or a percentage change greater than 200.
|
Three months ended June 30, 2014 vs. three months ended June 30, 2013
Service revenues
increased due to new Canadian construction management services performed for third parties (substantially offset in
Costs and expenses
) and higher gathering volumes primarily in the Susquehanna Supply Hub, as well as an increase in natural gas transportation fee revenues related to new projects placed in service.
41
Management’s Discussion and Analysis (Continued)
Product sales
decreased primarily due to lower olefin sales volumes associated with the lack of production in 2014 as a result of the Geismar Incident. In addition, equity NGL sales decreased related to lower sales volumes, partially offset by higher per-unit sales prices and crude oil marketing sales decreased related to natural declines in production areas served by our Mountaineer crude oil pipeline.
Product costs
decreased primarily due to lower olefin feedstock purchases related to the lack of production as a result of the Geismar Incident and lower crude oil marketing purchases. The changes in marketing purchases are more than offset by similar changes in marketing revenues. In addition, natural gas purchases associated with the production of equity NGLs decreased reflecting lower volumes, partially offset by higher natural gas prices.
Operating and maintenance expenses
increased primarily due to new Canadian construction management services performed for third parties, partially offset by a net increase in system gains and lower maintenance and repair expenses.
Depreciation and amortization expenses
increased reflecting depreciation on new projects placed in service.
The favorable change in
Net insurance recoveries – Geismar Incident
is due to the receipt of $50 million of insurance recoveries, partially offset by $8 million of related covered insurable expenses in excess of our retentions (deductibles) incurred in the second quarter of 2014. (See
Note 3 – Other Income and Expenses
of Notes to Consolidated Financial Statements.)
The unfavorable change in
Other (income) expense – net
within
Operating income
includes the following:
|
•
|
$17 million of impairment charges recognized in 2014 related to certain equipment held for sale.
|
|
•
|
The absence of $12 million of income from insurance recoveries in 2013 related to the abandonment of certain Eminence storage assets.
|
|
•
|
The absence of $6 million of expense recognized in 2013 related to the portion of the Eminence abandonment regulatory asset that will not be recovered in rates.
|
Operating income
decreased primarily due to a $90 million decrease in olefin margins, including $83 million lower product margins at our Geismar plant, and a $23 million decrease in NGL margins driven primarily by lower volumes, as well as $17 million of impairment charges recognized in 2014. These decreases are partially offset by $50 million of income associated with 2014 insurance recoveries related to the Geismar Incident and $46 million higher service revenues at Williams Partners.
Interest expense
increased due to a $41 million increase in
Interest incurred
primarily due to new debt issuances in the fourth quarter of 2013 and the first quarter of 2014, as well as $9 million of ACMP Acquisition-related costs incurred in 2014. (See
Note 8 – Debt and Banking Arrangements
of Notes to Consolidated Financial Statements.)
The unfavorable change in
Other investing income – net
reflects $22 million lower gains resulting from Access Midstream Partners’ equity issuances.
Provision (benefit) for income taxes
changed favorably primarily due to lower pre-tax income in 2014. See
Note 4 – Provision (Benefit) for Income Taxes
of Notes to Consolidated Financial Statements for a discussion of the effective tax rate compared to the federal statutory rate for both periods.
Income (loss) from discontinued operations
changed favorably primarily due to the absence of a $12 million charge resulting from an unfavorable ruling associated with our former Alaska refinery related to the Trans-Alaska Pipeline System Quality Bank in 2013.
The favorable change in
Net income attributable to noncontrolling interests
primarily reflects lower operating results at WPZ and the impact of increased income allocated to the WPZ general partner associated with incentive distribution rights.
42
Management’s Discussion and Analysis (Continued)
Six months ended June 30, 2014 vs. six months ended June 30, 2013
Service revenues
increased due to new Canadian construction management services performed for third parties and higher gathering fees driven by higher volumes from new well connections and a net increase in gathering rates associated with customer contract modifications primarily in the Susquehanna Supply Hub. Additionally, natural gas transportation fee revenues increased primarily associated with expansion projects placed in service in 2013 and the implementation of new rates for Transco in March 2013. Partially offsetting these increases are lower production handling and crude oil transportation fee revenues in the eastern Gulf Coast primarily driven by lower Bass Lite production area volumes and producers’ operational issues.
Product sales
decreased primarily due to lower olefins sales volumes associated with the lack of production in 2014 as a result of the Geismar Incident and a decrease in volumes at our RGP splitter primarily due to an outage in a third-party storage facility. In addition, equity NGL sales decreased primarily reflecting lower volumes, partially offset by higher average NGL per-unit sales prices. Marketing revenues increased primarily due to higher NGL, natural gas, and crude oil prices and ethane volumes, partially offset by lower non-ethane, crude oil, and natural gas volumes.
Product costs
decreased primarily due to lower olefin feedstock purchases related to the lack of production as a result of the Geismar Incident and a decrease in volumes at our RGP splitter as previously discussed. In addition, natural gas purchases associated with the production of equity NGLs decreased reflecting lower volumes, which were substantially offset by higher natural gas prices. These decreases were partially offset by an increase in marketing purchases. The changes in marketing purchases are more than offset by similar changes in marketing revenues.
Operating and maintenance expenses
increased primarily
due to
costs incurred associated with new Canadian construction management services performed for third parties, partially offset by net favorable system gains and losses, and lower maintenance and repair expenses.
Depreciation and amortization expenses
increased reflecting depreciation on new projects placed in service.
Selling, general, and administrative expenses
(SG&A)
increased primarily due to $19 million of project development costs incurred in 2014 related to the Bluegrass Pipeline reflecting 100 percent of such costs. The 50 percent noncontrolling interest share of these costs are presented in
Net income attributable to noncontrolling interests
.
The favorable change in
Net insurance recoveries – Geismar Incident
is due to the receipt of $175 million of insurance recoveries partially offset by $14 million of related covered insurable expenses in excess of our retentions (deductibles) incurred in 2014. (See
Note 3 – Other Income and Expenses
of Notes to Consolidated Financial Statements.)
The unfavorable change in
Other (income) expense – net
within
Operating income
includes the following:
|
•
|
$17 million of impairment charges recognized in 2014 related to certain equipment held for sale.
|
|
•
|
The absence of $12 million of income from insurance recoveries in 2013 related to the abandonment of certain Eminence storage assets.
|
|
•
|
A $10 million increase in amortization expense related to our regulatory asset associated with asset retirement obligations.
|
|
•
|
The absence of $6 million of expense recognized in 2013 related to the portion of the Eminence abandonment regulatory asset that will not be recovered in rates.
|
Operating income
decreased due primarily to a $212 million decrease in olefin margins, including $194 million lower product margins at our Geismar plant, a $61 million decrease in NGL margins driven primarily by lower volumes, as well as higher project development costs and $17 million of impairment charges recognized in 2014. These decreases are partially offset by $175 million of income associated with 2014 insurance recoveries related to the Geismar Incident and $107 million higher service revenues at Williams Partners.
43
Management’s Discussion and Analysis (Continued)
The unfavorable change in
Equity earnings (losses)
is primarily due to $79 million of equity losses from Bluegrass Pipeline and Moss Lake in 2014 related primarily to the underlying write-off of previously capitalized project development costs. (See
Note 2 – Variable Interest Entities
of Notes to Consolidated Financial Statements.)
Interest expense
increased due to a $58 million increase in
Interest incurred
primarily due to new debt issuances in the fourth quarter of 2013 and the first quarter of 2014, as well as $9 million of ACMP Acquisition-related costs incurred in 2014. (See
Note 8 – Debt and Banking Arrangements
of Notes to Consolidated Financial Statements.)
The unfavorable change in
Other investing income – net
is primarily due to $22 million lower gains resulting from Access Midstream Partners’ equity issuances.
Provision (benefit) for income taxes
changed favorably primarily due to lower pre-tax income in 2014. See
Note 4 – Provision (Benefit) for Income Taxes
of Notes to Consolidated Financial Statements for a discussion of the effective tax rate compared to the federal statutory rate for both periods.
Income (loss) from discontinued operations
changed favorably primarily due to the absence of a $12 million charge resulting from an unfavorable ruling associated with our former Alaska refinery related to the Trans-Alaska Pipeline System Quality Bank in 2013.
The favorable change in
Net income attributable to noncontrolling interests
is primarily due to the impact of increased income allocated to the WPZ general partner associated with incentive distribution rights and lower operating results at WPZ, partially offset by our decreased percentage of limited partner ownership of WPZ, which was 64 percent at June 30, 2014, compared to 66 percent at June 30, 2013. The favorable change also includes our partner’s 50 percent share of project development costs expensed by Bluegrass Pipeline during the portion of the first quarter of 2014 that Bluegrass Pipeline was consolidated.
Period-Over-Period Operating Results - Segments
Williams Partners
|
Three months ended
June 30, |
Six months ended
June 30, |
||||||||||||||
|
2014
|
2013
|
2014
|
2013
|
||||||||||||
|
(Millions)
|
|||||||||||||||
|
Segment revenues
|
$
|
1,616
|
|
$
|
1,763
|
|
$
|
3,309
|
|
$
|
3,569
|
|
|||
|
Segment costs and expenses
|
(1,255
|
)
|
(1,371
|
)
|
(2,468
|
)
|
(2,701
|
)
|
|||||||
|
Equity earnings (losses)
|
32
|
|
35
|
|
55
|
|
53
|
|
|||||||
|
Segment profit
|
$
|
393
|
|
$
|
427
|
|
$
|
896
|
|
$
|
921
|
|
|||
Three months ended
June 30, 2014
vs. three months ended
June 30, 2013
The decrease in
Segment revenues
includes:
|
•
|
A $132 million decrease in olefin sales primarily associated with a $129 million decrease due to lower volumes related to the lack of production in 2014 as a result of the Geismar Incident.
|
|
•
|
A $33 million decrease in revenues from our equity NGLs primarily reflecting a $42 million decrease due to lower volumes, partially offset by a $9 million increase associated with 12 percent higher average non-ethane per-unit sales prices. Equity non-ethane volumes are 31 percent lower primarily due to a customer contract that expired in September 2013 and higher inventory levels, partially offset by higher Canadian volumes generated by the ethane recovery project.
|
44
Management’s Discussion and Analysis (Continued)
|
•
|
An $18 million decrease in marketing revenues primarily associated with lower non-ethane, crude oil, and natural gas volumes, partially offset by higher NGL, crude oil, and natural gas prices and higher ethane volumes. The changes in marketing revenues are substantially offset by similar changes in marketing purchases.
|
|
•
|
A $13 million decrease in other product sales primarily due to lower system management gas sales from our gas pipeline businesses (offset in
Segment costs and expenses
).
|
|
•
|
A $46 million increase in service revenues primarily due to $24 million higher fee revenues resulting from higher gathering volumes driven by new well connections and a net increase in gathering rates associated with customer contract modifications in the Northeast region primarily in the Susquehanna Supply Hub. In addition, natural gas transportation revenues increased $14 million at Transco primarily from expansion projects placed into service in 2013.
|
The decrease in
Segment costs and expenses
includes:
|
•
|
A $42 million favorable change in
Net insurance recoveries – Geismar Incident
attributable to the receipt of $50 million of insurance recoveries during the second quarter of 2014, partially offset by $8 million of related covered insurable expenses in excess of our retentions (deductibles).
|
|
•
|
A $42 million decrease in olefin feedstock purchases primarily associated with a $45 million decrease due to lower volumes related to the lack of production in 2014 as a result of the Geismar Incident.
|
|
•
|
A $19 million decrease in operating costs including a $38 million decrease in
Operating and maintenance expenses
primarily
due to a net increase in system gains, lower Canadian maintenance expenses, and the absence of both Geismar Incident insurance deductibles and Perdido pipeline relocation costs in 2013. This decrease is partially offset by a $16 million increase in
Depreciation and amortization expenses
primarily
associated with
the Ohio Valley Midstream and Susquehanna Supply Hub businesses due to growth in these operations.
|
|
•
|
A $16 million decrease in marketing purchases primarily due to lower non-ethane, crude oil, and natural gas volumes, partially offset by higher NGL, crude oil, and natural gas prices and higher ethane volumes (more than offset in marketing revenues).
|
|
•
|
A $12 million decrease in other product costs primarily due to lower system management gas costs from our gas pipeline businesses (offset in
Segment revenues
).
|
|
•
|
A $10 million decrease in costs associated with the production of our equity NGLs reflecting a decrease of $28 million associated with lower volumes, partially offset by an $18 million increase related to higher average natural gas prices.
|
|
•
|
A $23 million unfavorable change in
Other (income) expense – net
primarily due to impairment charges recognized in second-quarter 2014 associated with certain equipment held for sale related to our Ohio Valley Midstream business, as well as the absence of insurance recoveries recognized by Transco in 2013 related to the abandonment of certain of its Eminence storage assets. These unfavorable changes are partially offset by the absence of expense recognized by Transco in 2013 related to the portion of the Eminence abandonment regulatory asset not recoverable in rates.
|
The decrease in
Segment profit
includes:
|
•
|
A $90 million decrease in olefin margins, including $83 million lower olefin margins at our Geismar plant and $6 million lower olefin margins associated with our Canadian operations driven by lower volumes.
|
|
•
|
A $23 million decrease in NGL margins driven primarily by lower volumes and higher natural gas prices, partially offset by higher average NGL prices.
|
45
Management’s Discussion and Analysis (Continued)
|
•
|
A $23 million unfavorable change in
Other (income) expense – net
as previously discussed.
|
|
•
|
A $3 million decrease in
Equity earnings (losses)
primarily due to lower equity earnings from Laurel Mountain reflecting the absence of a minimum volume commitment fee received in second-quarter 2013. Equity earnings from Discovery also decreased reflecting the write-down of certain assets in second-quarter 2014. These decreases are partially offset by higher equity earnings from Caiman II resulting primarily from business interruption insurance proceeds received in 2014.
|
|
•
|
A $46 million increase in service revenues as previously discussed.
|
|
•
|
A $42 million favorable change in
Net insurance recoveries – Geismar Incident
as previously discussed.
|
|
•
|
A $19 million decrease in operating costs as previously discussed.
|
Six months ended
June 30, 2014
vs. six months ended
June 30, 2013
The decrease in
Segment revenues
includes:
|
•
|
A $322 million decrease in olefin sales primarily associated with a $290 million decrease due to lower volumes related to the lack of production in 2014 as a result of the Geismar Incident, a net $17 million decrease primarily related to lower volumes at our RGP splitter primarily due to an outage in a third-party storage facility which caused us to reduce production (substantially offset in
Product costs
), and a $14 million decrease related to lower Canada olefin volumes due to limited production available for sale during first-quarter 2014 as a result of downtime for the tie-in of the new ethane recovery system and operational issues at the off-gas provider in second-quarter 2014.
|
|
•
|
A $62 million decrease in revenues from our equity NGLs primarily reflecting a decrease of $87 million due to lower volumes, partially offset by a $25 million increase associated with 14 percent higher average non-ethane per-unit sales prices. Equity non-ethane sales volumes are 31 percent lower primarily due to a customer contract that expired in September 2013 and higher inventory levels, partially offset by 10 percent higher equity ethane sales volumes primarily driven by higher Canadian volumes generated by the ethane recovery project.
|
|
•
|
A $12 million decrease in other product sales primarily due to lower system management gas sales from our gas pipeline businesses (offset in
Segment costs and expenses
).
|
|
•
|
A $107 million increase in service revenues primarily due to $51 million higher fee revenues resulting from higher gathering volumes driven by new well connections and a net increase in gathering rates associated with customer contract modifications in the Northeast region primarily in the Susquehanna Supply Hub, and fewer maintenance issues in 2014. Fee revenues also increased $8 million due to contributions from our Ohio Valley Midstream business resulting from the addition of processing and fractionation facilities placed in service in 2013 and 2014. In addition, natural gas transportation revenues increased $45 million primarily from expansion projects placed into service in 2013, as well as new rates effective in March 2013 for Transco. These increases are partially offset by $10 million lower production handling and crude oil transportation fee revenues in the eastern Gulf Coast region due to a decrease in production area volumes and producers' operational issues.
|
|
•
|
A $27 million increase in marketing revenues primarily associated with higher NGL, natural gas and crude oil prices and higher ethane volumes, partially offset by lower non-ethane, crude oil, and natural gas volumes. The changes in marketing revenues are substantially offset by similar changes in marketing purchases.
|
46
Management’s Discussion and Analysis (Continued)
The decrease in
Segment costs and expenses
includes:
|
•
|
A $161 million favorable change in
Net insurance recoveries – Geismar Incident
attributable to the receipt of $175 million of insurance recoveries in 2014, partially offset by $14 million of related covered insurable expenses in excess of our retentions (deductibles).
|
|
•
|
A $110 million decrease in olefin feedstock purchases primarily associated with a $94 million decrease due to lower volumes related to the lack of production in 2014 as a result of the Geismar Incident and a net $16 million decrease primarily related to lower volumes at our RGP splitter primarily due to the third-party storage facility outage, as discussed above (more than offset in
Product sales
).
|
|
•
|
An $11 million decrease in other product costs primarily due to lower system management gas costs from our gas pipeline businesses (offset in
Segment revenues
).
|
|
•
|
An $11 million decrease in operating costs including a $47 million decrease in
Operating and maintenance expenses
primarily
due to net favorable system gains and losses, lower Canadian maintenance expenses, and the absence of both Geismar Incident insurance deductibles and Perdido pipeline relocation costs in 2013, partially offset by the higher expenses associated with maintenance and growth in the Northeast region. This decrease is partially offset by a $28 million increase in
Depreciation and amortization expenses
primarily
associated with
the Ohio Valley Midstream and Susquehanna Supply Hub businesses due to growth in these operations and an $8 million increase in SG&A.
|
|
•
|
Costs associated with the production of our equity NGLs decreased slightly reflecting a decrease of $51 million associated with lower volumes, partially offset by a $50 million increase related to higher average natural gas prices.
|
|
•
|
A $39 million unfavorable change in
Other (income) expense – net
primarily due to impairment charges recognized in second-quarter 2014 associated with certain equipment held for sale related to our Ohio Valley Midstream business and costs incurred in first-quarter 2014 associated with fire damage at a compressor station in the Susquehanna Supply Hub, as well as the absence of insurance recoveries recognized by Transco in 2013 related to the abandonment of certain of its Eminence storage assets and a $6 million favorable contingency settlement recognized in the first quarter of 2013. These unfavorable changes are partially offset by the absence of expense recognized in 2013 related to the portion of the Eminence abandonment regulatory asset not recoverable in rates.
|
|
•
|
A $22 million increase in marketing purchases primarily due to higher NGL, natural gas and crude oil prices and higher ethane volumes, partially offset by lower non-ethane, crude oil, and natural gas volumes (more than offset in marketing revenues).
|
The decrease in
Segment profit
includes:
|
•
|
A $212 million decrease in olefin margins, including $194 million lower olefin margins at our Geismar plant and $16 million lower olefin margins associated with our Canadian operations due to lower volumes driven by limited production in first-quarter, as previously discussed, along with operational issues at the off-gas provider and higher ending inventory at the end of second-quarter 2014.
|
|
•
|
A $61 million decrease in NGL margins driven primarily by lower volumes and higher natural gas prices, partially offset by higher average NGL prices.
|
|
•
|
A $39 million unfavorable change in
Other (income) expense – net
as previously discussed.
|
|
•
|
A $161 million favorable change in
Net insurance recoveries – Geismar Incident
as previously discussed.
|
|
•
|
A $107 million increase in service revenues as previously discussed.
|
47
Management’s Discussion and Analysis (Continued)
|
•
|
An $11 million decrease in operating costs as previously discussed.
|
|
•
|
A $5 million increase in marketing margins.
|
|
•
|
A $2 million increase in
Equity earnings (losses)
primarily due to improved equity earnings from Caiman II resulting primarily from business interruption insurance proceeds received in 2014, partially offset by $4 million lower equity earnings from Discovery reflecting the write-down of certain assets in second quarter 2014.
|
Williams NGL & Petchem Services
|
Three months ended
June 30, |
Six months ended
June 30, |
||||||||||||||
|
2014
|
2013
|
2014
|
2013
|
||||||||||||
|
(Millions)
|
|||||||||||||||
|
Segment costs and expenses
|
$
|
(6
|
)
|
$
|
(1
|
)
|
$
|
(29
|
)
|
$
|
(3
|
)
|
|||
|
Equity earnings (losses)
|
(2
|
)
|
—
|
|
(79
|
)
|
—
|
|
|||||||
|
Segment loss
|
$
|
(8
|
)
|
$
|
(1
|
)
|
$
|
(108
|
)
|
$
|
(3
|
)
|
|||
Three months ended June 30, 2014 vs. three months ended June 30, 2013
The unfavorable change in
Segment loss
is primarily due to higher expensed project development costs in 2014 reflected in
Segment costs and expenses
along with $2 million of equity losses from Bluegrass Pipeline and Moss Lake in 2014.
Six months ended June 30, 2014 vs. six months ended June 30, 2013
Segment costs and expenses
increased $26 million primarily due to $19 million of project development costs expensed during the first quarter of 2014 related to the Bluegrass Pipeline and higher expensed development costs related to other projects.
The unfavorable change in
Equity earnings (losses)
is due to equity losses from Bluegrass Pipeline and Moss Lake related primarily to the underlying write-off of previously capitalized project development costs.
The unfavorable change in
Segment loss
is due primarily to equity losses from Bluegrass Pipeline and Moss Lake as well as costs incurred during the first quarter of 2014 related to the development of the Bluegrass Pipeline.
Access Midstream Partners
|
Three months ended
June 30, |
Six months ended
June 30, |
||||||||||||||
|
2014
|
2013
|
2014
|
2013
|
||||||||||||
|
(Millions)
|
|||||||||||||||
|
Segment profit
|
$
|
9
|
|
$
|
29
|
|
$
|
15
|
|
$
|
29
|
|
|||
Three months ended June 30, 2014
vs. three months ended June 30, 2013
Segment profit
in the second quarter includes equity earnings recognized from ACMP of $22 million and $18 million in 2014 and 2013, respectively. Offsetting the equity earnings are charges of $15 million in each of 2014 and 2013 of noncash amortization of the difference between the cost of our investment and our underlying share of the net assets of ACMP.
In addition, the
segment profit
in the second quarter of 2014 and 2013 includes noncash gains of $4 million and $26 million, respectively, resulting from ACMP’s equity issuances.
Offsetting
segment profit
in the second quarter of 2014 were $2 million of expenses related to the acquisition of ACMP (see
Note 13 – Subsequent Event
).
48
Management’s Discussion and Analysis (Continued)
We received regular quarterly distributions from ACMP of $33 million and $22 million during the second quarter of 2014 and 2013, respectively.
Six months ended June 30, 2014
vs. six months ended June 30, 2013
Segment profit
includes equity earnings recognized from ACMP of $43 million and $35 million in 2014 and 2013, respectively. Offsetting the equity earnings are charges of $30 million and $32 million in 2014 and 2013, respectively, of noncash amortization of the difference between the cost of our investment and our underlying share of the net assets of ACMP.
In addition,
segment profit
in 2014 and 2013 includes noncash gains of $4 million and $26 million, respectively, resulting from ACMP’s equity issuances.
Offsetting
segment profit
in 2014 are $2 million of expenses related to the acquisition of ACMP (see
Note 13 – Subsequent Event
).
We received regular quarterly distributions from ACMP of $64 million and $42 million through the second quarter of 2014 and 2013, respectively.
Other
|
Three months ended
June 30, |
Six months ended
June 30, |
||||||||||||||
|
2014
|
2013
|
2014
|
2013
|
||||||||||||
|
(Millions)
|
|||||||||||||||
|
Segment revenues
|
$
|
66
|
|
$
|
7
|
|
$
|
125
|
|
$
|
14
|
|
|||
|
Segment profit (loss)
|
1
|
|
1
|
|
4
|
|
(4
|
)
|
|||||||
For the three and six months ended June 30, 2014,
Segment revenues
increased due to new Canadian construction management services performed for third parties (substantially offset in
segment costs and expenses
).
For the three and six months ended 2014
, Segment costs and expenses
increased by $59 million and $103 million, respectively, primarily due to new Canadian construction management services performed for third parties.
Segment profit (loss)
reflects a favorable change
for the six months ended 2014 due to the absence of $6 million of project development costs incurred during the first quarter of 2013.
49
Management’s Discussion and Analysis (Continued)
Management’s Discussion and Analysis of Financial Condition and Liquidity
Outlook
We seek to manage our businesses with a focus on applying conservative financial policy in order to maintain investment-grade credit metrics. Our plan for 2014 reflects our ongoing transition to an overall business mix that is increasingly fee-based, bolstered by our recent ACMP Acquisition. Although our cash flows are impacted by fluctuations in energy commodity prices, that impact is somewhat mitigated by certain of our cash flow streams that are not directly impacted by short-term commodity price movements, including:
|
•
|
Firm demand and capacity reservation transportation revenues under long-term contracts;
|
|
•
|
Fee-based revenues from certain gathering and processing services.
|
We believe we have, or have access to, the financial resources and liquidity necessary to meet our requirements for working capital, capital and investment expenditures, dividends and distributions, debt service payments, and tax payments, including an $80 million tax payment as a result of WPZ’s acquisition of certain of our Canadian operations, while maintaining a sufficient level of liquidity. In particular, we note the following, which considers our recent ACMP Acquisition:
|
•
|
We expect capital and investment expenditures to total between $10.485 billion and $11.265 billion in 2014, which includes both $5.995 billion related to the ACMP Acquisition and Access Midstream Partners’ expected capital expenditures from the acquisition date through the remainder of the year. Of this total, maintenance capital expenditures, which are generally considered nondiscretionary and include expenditures to meet legal and regulatory requirements, to maintain and/or extend the operating capacity and useful lives of our assets, and to complete certain well connections, are expected to total between $425 million and $505 million. Expansion capital expenditures, which are generally more discretionary as compared to maintenance capital expenditures, are used to fund projects in order to grow our business and are expected to total between $10.06 billion and $10.76 billion. See Company Outlook – Expansion Projects for discussions describing the general nature of these expenditures. In addition, we retain the flexibility to adjust our planned levels of capital and investment expenditures in response to changes in economic conditions or business opportunities.
|
|
•
|
We expect to pay total cash dividends of approximately $1.96 per common share in 2014, an increase of 36 percent over 2013 levels.
|
|
•
|
We expect to fund working capital requirements, capital and investment expenditures, debt service payments, dividends and distributions and tax payments primarily through cash flow from operations, cash and cash equivalents on hand, issuances of WMB debt and equity securities, issuances of WPZ debt and/or equity securities, issuances of ACMP debt and/or equity securities, and utilization of our credit facility, WPZ’s credit facility and/or commercial paper program, and ACMP’s revolving credit facility.
|
Liquidity
Based on our forecasted levels of cash flow from operations and other sources of liquidity, we expect to have sufficient liquidity to manage our businesses in 2014. Our internal and external sources of consolidated liquidity include:
|
•
|
Cash generated from our operations, including cash distributions from WPZ and ACMP, and our equity-method investments based on our level of ownership and incentive distribution rights;
|
|
•
|
Cash and cash equivalents on hand;
|
|
•
|
Cash proceeds from WPZ’s and/or ACMP’s issuances of debt and/or equity securities;
|
|
•
|
Use of WPZ’s commercial paper program and/or credit facility;
|
50
Management’s Discussion and Analysis (Continued)
|
•
|
Use of ACMP’s revolving credit facility.
|
Additional sources of liquidity available to us at the parent level include our credit facility, proceeds from the issuance of debt and/or equity securities, and proceeds from asset sales. WPZ and ACMP are expected to be self-funding through their cash flows from operations, use of WPZ’s commercial paper program and/or their credit facilities, and their access to capital markets.
Potential risks associated with our planned levels of liquidity and the planned capital and investment expenditures discussed above include those previously discussed in Company Outlook.
As of
June 30, 2014
, we had a working capital deficit (current liabilities in excess of current assets) of
$277 million
. However, we note the following about our available liquidity.
|
June 30, 2014
|
|||||||||||
|
Available Liquidity
|
WPZ
|
WMB
|
Total
|
||||||||
|
(Millions)
|
|||||||||||
|
Cash and cash equivalents (1)
|
$
|
716
|
|
$
|
144
|
|
$
|
860
|
|
||
|
Capacity available under our $1.5 billion credit facility (expires July 31, 2018) (2)
|
1,200
|
|
1,200
|
|
|||||||
|
Capacity available to WPZ under its $2.5 billion five-year credit facility (expires July 31, 2018) less amounts outstanding under its $2 billion commercial paper program (3)
|
2,500
|
|
2,500
|
|
|||||||
|
$
|
3,216
|
|
$
|
1,344
|
|
$
|
4,560
|
|
|||
|
(1)
|
At June 30, 2014, we also had $5.995 billion
Cash held for ACMP Acquisition
, which was paid on July 1, 2014.
|
|
(2)
|
At
June 30, 2014
, we are in compliance with the financial covenants associated with this credit facility. As of June 30, 2014, we had $300 million outstanding under this credit facility. The credit facility capacity, under certain circumstances, may be increased up to an additional $500 million.
|
|
(3)
|
WPZ has not borrowed on its credit facility during 2014 and has no
Commercial paper
outstanding at June 30, 2014. The highest amount outstanding under the commercial paper program during 2014 was $900 million. At
June 30, 2014
, WPZ is in compliance with the financial covenants associated with the credit facility and commercial paper program. The WPZ credit facility is only available to WPZ, Transco, and Northwest Pipeline as co-borrowers and, under certain circumstances, the capacity may be increased up to an additional $500 million. In managing our available liquidity, we do not expect a maximum outstanding amount in excess of the capacity of WPZ’s credit facility inclusive of any outstanding amounts under WPZ’s commercial paper program.
|
In addition to the credit facilities and WPZ’s commercial paper program listed above, we have issued letters of credit totaling $15 million and WPZ has issued letters of credit totaling $1 million as of
June 30, 2014
, under certain bilateral bank agreements.
ACMP has a revolving credit facility that matures in May 2018 and includes revolving commitments of $1.75 billion, including a sublimit of $100 million for same-day swing line advances and a sublimit of $200 million for letters of credit. At June 30, 2014, ACMP had $150 million outstanding under its revolving credit facility.
Debt Offerings
On June 24, 2014, we completed a public offering of $1.25 billion of 4.55 percent senior notes due 2024 and $650 million of 5.75 percent senior notes due 2044. We used the net proceeds to finance a portion of the ACMP Acquisition.
On June 27, 2014, WPZ completed a public offering of $750 million of 3.9 percent senior unsecured notes due 2025 and $500 million of 4.9 percent senior unsecured notes due 2045. WPZ used a portion of the net proceeds to repay amounts outstanding under its commercial paper program and expects to utilize the remainder to fund capital expenditures and for general partnership purposes.
51
Management’s Discussion and Analysis (Continued)
On March 4, 2014, WPZ completed a public offering of $1 billion of 4.3 percent senior unsecured notes due 2024 and $500 million of 5.4 percent senior unsecured notes due 2044. WPZ used a portion of the net proceeds to repay amounts outstanding under its commercial paper program and the remainder to fund capital expenditures and for general partnership purposes.
Equity Offering
On June 23, 2014, we issued 61 million shares of common stock at a price of $57.00 per share. That amount includes 8 million shares purchased pursuant to the full exercise of the underwriter’s option to purchase additional shares. The net proceeds of $3.378 billion were used to finance a portion of the ACMP Acquisition.
Distributions from Equity-Method Investees
Our equity-method investees’ organizational documents require distribution of their available cash to their members on a quarterly basis. In each case, available cash is reduced, in part, by reserves appropriate for operating their respective businesses.
Shelf Registration
In April 2013, WPZ filed a shelf registration statement for the offer and sale from time to time of common units representing limited partner interests in WPZ having an aggregate offering price of up to $600 million. These sales will be made over a period of time and from time to time in transactions at prices which are market prices prevailing at the time of sale, prices related to market price or at negotiated prices. Such sales will be made pursuant to an equity distribution agreement between WPZ and certain banks who may act as sales agents or purchase for its own accounts as principals. As of
June 30, 2014
, no common units have been issued under this registration.
WPZ Incentive Distribution Rights
Our ownership interest in WPZ includes the right to incentive distributions determined in accordance with WPZ’s partnership agreement. In connection with the contribution of certain Gulf olefins assets to WPZ in November 2012, we agreed to waive $16 million per quarter of incentive distributions until the later of December 31, 2013 or 30 days after the Geismar plant expansion is operational.
Insurance Renewal
Our onshore property damage and business interruption insurance coverage renewed on May 1st, with a combined per-occurrence limit of $750 million, subject to retentions (deductibles) of $40 million per occurrence for property damage and a waiting period of 120 days per occurrence for business interruption.
Credit Ratings
Our ability to borrow money is impacted by our credit ratings and the credit ratings of WPZ. The current ratings are as follows:
|
Rating Agency
|
Outlook
|
Senior
Unsecured
Debt
Rating
|
Corporate
Credit Rating
|
||||
|
Williams:
|
|||||||
|
Standard & Poor’s
|
Stable
|
BB+
|
BB+
|
||||
|
Moody’s Investors Service
|
Stable
|
Baa3
|
N/A
|
||||
|
Fitch Ratings
|
Stable
|
BBB-
|
N/A
|
||||
|
Williams Partners:
|
|||||||
|
Standard & Poor’s
|
Stable
|
BBB
|
BBB
|
||||
|
Moody’s Investors Service
|
Stable
|
Baa2
|
N/A
|
||||
|
Fitch Ratings
|
Stable
|
BBB
|
N/A
|
||||
52
Management’s Discussion and Analysis (Continued)
On June 16, 2014, Moody’s Investors Service and Fitch Ratings affirmed both Williams’ and Williams Partners’ investment grade ratings. Standard & Poor’s lowered Williams’ senior unsecured debt and corporate credit ratings to BB+, which is one notch below investment grade, with a stable outlook. Standard & Poor’s affirmed Williams Partners’ investment grade rating.
On June 16, 2014, Standard & Poor’s placed ACMP ratings on CreditWatch positive and affirmed ACMP’s corporate credit rating and its senior unsecured debt at BB+. Moody’s placed ACMP’s Ba1 corporate family rating and Ba2 senior unsecured debt rating on review for upgrade.
Credit rating agencies perform independent analyses when assigning credit ratings. No assurance can be given that the credit rating agencies will continue to assign us investment grade ratings even if we meet or exceed their current criteria for investment grade ratios. A downgrade of our credit rating might increase our future cost of borrowing and would require us to post additional collateral with third parties, negatively impacting our available liquidity. As of
June 30, 2014
, we estimate that a downgrade to a rating below investment grade for us or WPZ could require us to post up to $1 million or $316 million, respectively, in additional collateral with third parties.
Sources (Uses) of Cash
|
Six months ended
June 30, |
|||||||
|
2014
|
2013
|
||||||
|
(Millions)
|
|||||||
|
Net cash provided (used) by:
|
|||||||
|
Operating activities
|
$
|
759
|
|
$
|
1,163
|
|
|
|
Financing activities
|
7,356
|
|
548
|
|
|||
|
Investing activities
|
(7,936
|
)
|
(1,726
|
)
|
|||
|
Increase (decrease) in cash and cash equivalents
|
$
|
179
|
|
$
|
(15
|
)
|
|
Operating activities
The factors that determine operating activities are largely the same as those that affect
Net income (loss)
, with the exception of noncash expenses such as
Depreciation and amortization
and
Provision (benefit) for deferred income taxes
.
Our
Net cash provided by operating activities
was also impacted by net unfavorable changes in operating working capital.
Financing activities
Significant transactions include:
|
•
|
$3.378 billion received in 2014 from our equity offering;
|
|
•
|
$1.895 billion net received in 2014 from our debt offering;
|
|
•
|
$300 million received in June 2014 from our credit facility borrowings;
|
|
•
|
$226 million net payments in 2014 and $710 net borrowings in 2013 on WPZ’s commercial paper;
|
|
•
|
$2.74 billion net received in 2014 from WPZ’s previously mentioned debt offerings;
|
|
•
|
$1.705 billion received in 2013 from WPZ’s credit facility borrowings;
|
|
•
|
$2.08 billion paid in 2013 on WPZ’s credit facility borrowings;
|
|
•
|
$617 million received in 2013 from WPZ’s equity offerings;
|
53
Management’s Discussion and Analysis (Continued)
|
•
|
$567 million in 2014 and $472 million in 2013 paid for quarterly dividends on common stock;
|
|
•
|
$296 million in 2014 and $224 million in 2013 paid for dividends and distributions to noncontrolling interests;
|
|
•
|
$122 million in 2014 and $272 million in 2013 received in contributions from noncontrolling interests.
|
Investing activities
Significant transactions include:
|
•
|
Capital expenditures of $1.839 billion in 2014 and $1.53 billion in 2013;
|
|
•
|
Purchases of and contributions to our equity-method investments of $246 million in 2014 and $188 million in 2013;
|
|
•
|
Cash held for ACMP Acquisition of $5.995 billion in 2014.
|
Off-Balance Sheet Financing Arrangements and Guarantees of Debt or Other Commitments
We have various other guarantees and commitments which are disclosed in
Note 2 – Variable Interest Entities
,
Note 10 – Fair Value Measurements and Guarantees
,
Note 11 – Contingent Liabilities
, and
Note 13 – Subsequent Event
of Notes to Consolidated Financial Statements. We do not believe these guarantees or the possible fulfillment of them will prevent us from meeting our liquidity needs.
54
Item 3
Quantitative and Qualitative Disclosures About Market Risk
Interest Rate Risk
Our current interest rate risk exposure is related primarily to our debt portfolio and has not materially changed during the first
six
months of 2014.
Foreign Currency Risk
Our foreign operations, whose functional currency is the local currency, are located primarily in Canada. Net assets of our foreign operations were approximately $1.25 billion and $1.12 billion at
June 30, 2014
and December 31, 2013, respectively. These investments have the potential to impact our financial position due to fluctuations in these local currencies arising from the process of translating the local functional currency into the U.S. dollar. As an example, a 20 percent change in the respective functional currencies against the U.S. dollar would have changed
total stockholders’ equity
by approximately $132 million at
June 30, 2014
.
55
Item 4
Controls and Procedures
Our management, including our Chief Executive Officer and Chief Financial Officer, does not expect that our disclosure controls and procedures (as defined in Rules 13a - 15(e) and 15d - 15(e) of the Securities Exchange Act) (Disclosure Controls) or our internal controls over financial reporting (Internal Controls) will prevent all errors and all fraud. A control system, no matter how well conceived and operated, can provide only reasonable, not absolute, assurance that the objectives of the control system are met. Further, the design of a control system must reflect the fact that there are resource constraints, and the benefits of controls must be considered relative to their costs. Because of the inherent limitations in all control systems, no evaluation of controls can provide absolute assurance that all control issues and instances of fraud, if any, within the company have been detected. These inherent limitations include the realities that judgments in decision-making can be faulty, and that breakdowns can occur because of simple error or mistake. Additionally, controls can be circumvented by the individual acts of some persons, by collusion of two or more people, or by management override of the control. The design of any system of controls also is based in part upon certain assumptions about the likelihood of future events, and there can be no assurance that any design will succeed in achieving its stated goals under all potential future conditions. Because of the inherent limitations in a cost-effective control system, misstatements due to error or fraud may occur and not be detected. We monitor our Disclosure Controls and Internal Controls and make modifications as necessary; our intent in this regard is that the Disclosure Controls and Internal Controls will be modified as systems change and conditions warrant.
Evaluation of Disclosure Controls and Procedures
An evaluation of the effectiveness of the design and operation of our Disclosure Controls was performed as of the end of the period covered by this report. This evaluation was performed under the supervision and with the participation of our management, including our Chief Executive Officer and Chief Financial Officer. Based upon that evaluation, our Chief Executive Officer and Chief Financial Officer concluded that these Disclosure Controls are effective at a reasonable assurance level.
Changes in Internal Controls Over Financial Reporting
There have been no changes during the second quarter of 2014 that have materially affected, or are reasonably likely to materially affect, our Internal Controls over financial reporting.
Environmental
Certain reportable legal proceedings involving governmental authorities under federal, state and local laws regulating the discharge of materials into the environment are described below. While it is not possible for us to predict the final outcome of the proceedings which are still pending, we do not anticipate a material effect on our consolidated financial position if we receive an unfavorable outcome in any one or more of such proceedings.
In September 2007, the EPA requested, and Transco later provided, information regarding natural gas compressor stations in the states of Mississippi and Alabama as part of the EPA’s investigation of Transco’s compliance with the Clean Air Act. On March 28, 2008, the EPA issued notices of violation alleging violations of Clean Air Act requirements at these compressor stations. Transco met with the EPA in May 2008 and submitted a response denying the allegations in June 2008. In May 2011, Transco provided additional information to the EPA pertaining to these compressor stations in response to a request they had made in February 2011. In August 2010, the EPA requested, and Transco provided, similar information for a compressor station in Maryland. Since 2011, we have not received any additional requests for information related to these facilities.
56
In November 2013, we became aware of deficiencies with the air permit for the Ft. Beeler gas processing facility located in West Virginia. We notified the EPA and the West Virginia Department of Environmental Protection and are working to bring the Ft. Beeler facility into full compliance. At June 30, 2014, we have accrued liabilities of $100,000 for potential penalties arising out of the deficiencies.
Other
The additional information called for by this item is provided in
Note 11 – Contingent Liabilities
of the Notes to Consolidated Financial Statements included under Part I, Item 1. Financial Statements of this report, which information is incorporated by reference into this item.
Part I, Item 1A. Risk Factors in our Annual Report on Form 10-K for the year ended December 31, 2013, includes certain risk factors that could materially affect our business, financial condition or future results. Those Risk Factors have not materially changed, except as set forth below:
Our cash flow depends heavily on the earnings and distributions of WPZ.
Our partnership interest, including the general partner’s holding of incentive distribution rights, in WPZ is our largest cash-generating asset. Therefore, our cash flow is heavily dependent upon the ability of WPZ to make distributions to its partners. Following the consummation of the ACMP Acquisition, our partnership interest in ACMP increased, as did the portion of our cash flows generated by ACMP distributions. A significant decline in WPZ’s or ACMP’s earnings and/or distributions would have a corresponding negative impact on us.
The time required to return WPZ’s Geismar plant to operation following the explosion and fire at the facility on June 13, 2013, and the extent and timing of costs and insurance recoveries related to the incident could be materially different than we anticipate and could cause our financial results and levels of dividends to be materially different than we project.
Our projections of financial results and expected levels of dividends are based on numerous assumptions and estimates, including but not limited to the time required to return WPZ’s Geismar plant to operation and complete the expansion project at the facility following the explosion and fire at the plant on June 13, 2013, and the extent and timing of costs and insurance recoveries related to the incident. Additionally, insurers continue to evaluate WPZ’s claims and have recently raised questions around key assumptions involving our business-interruption claim; as a result, the insurers have elected to make a partial payment pending further assessment of these issues. Although we currently expect to make full recovery of $500 million in insurance proceeds related to the Geismar incident, there can be no assurance that we will recover the full amount of our claims. Our total receipts from our insurers to date are $225 million. Our financial results and levels of dividends could be materially different than we project if our assumptions and estimates related to the incident are materially different than actual outcomes.
Two of our subsidiaries act as the general partner of publicly traded limited partnerships. As such, these subsidiaries’ operations may involve a greater risk of liability than ordinary business operations.
One of our subsidiaries acts as the general partner of WPZ, and another of our subsidiaries acts as the general partner of ACMP. Because each of WPZ and ACMP is a publicly traded limited partnership, these subsidiaries have undertaken contractual obligations with respect to WPZ and ACMP as the general partner and to the limited partners of WPZ and ACMP, respectively. Activities determined to involve such obligations to other persons or entities typically involve a higher standard of conduct than ordinary business operations and therefore may involve a greater risk of liability, particularly when a conflict of interest is found to exist. Our control of each of the general partner of WPZ and the general partner of ACMP may increase the possibility of claims of breach of such duties, including claims brought due to conflicts of interest (including conflicts of interest that may arise between WPZ or ACMP, on the one hand, and its general partner and that general partner’s affiliates, including us, on the other hand). Any liability resulting from such claims could be material.
57
We may be unable to realize the expected benefits from the ACMP Acquisition, and the value of our investment in ACMP may decrease.
The value of our investment in ACMP equity interests and the cash distributions we will receive with respect to these equity interests may not match our expectations or justify our investment in ACMP. For example, ACMP may not have sufficient cash flow from operations each quarter to pay the cash distributions we expect to receive on a quarterly basis. The amount of cash ACMP can distribute principally depends upon the amount of cash it generates from its operations, which will fluctuate from quarter to quarter based on, among other things: the volume of natural gas it gathers, treats and compresses; the level of production of and demand for natural gas; its operating and general and administrative costs; regulatory actions; prevailing economic conditions; the level of capital expenditures it makes; fluctuations in working capital needs; and the amount of cash reserves established by its general partner. If the levels of cash distributions from ACMP do not meet our expectations, the resulting decrease in cash flow and reduction in liquidity could have an adverse effect on our business, financial condition, results of operations and cash flows.
In addition, we may never realize the expected benefits from the ACMP Acquisition, and we may lose all or a part of the value of our investment in ACMP. The accuracy of our assessments concerning the value of ACMP’s business is inherently uncertain. In connection with our assessments, we performed a review of ACMP’s business that we believe to be generally consistent with industry practices. Such review may not have revealed all existing or potential problems and may not have permitted us to become sufficiently familiar with ACMP’s business to fully assess any and all risks related to ACMP’s business. The value of our investment in ACMP may decrease due to the risks associated with ACMP’s business, including the fact that ACMP is dependent on Chesapeake Energy Corporation (“Chesapeake”) for a substantial majority of its revenues and is therefore indirectly subject to the business risks of Chesapeake and to the credit risks associated with Chesapeake. ACMP has no control over Chesapeake’s business decisions and operations, and Chesapeake is under no obligation to adopt a business strategy that favors ACMP. Furthermore, in addition to Chesapeake, ACMP is dependent on Total Gas & Power North America, Inc. and other third-party producers for a significant amount of the natural gas that it gathers, treats and compresses. A material reduction in one or more other third-party producers’ production gathered, treated or compressed by ACMP may result in a material decline in its revenues and ability to make cash distributions to its unitholders, including us.
As a result of the foregoing risks, ACMP may not pay the level of distributions we expect, we may need to contribute additional capital to support ACMP’s operations, the ACMP Acquisition may not produce the benefits that we expect and the value of our investment in ACMP may decrease.
The ACMP Acquisition could trigger a mandatory repurchase offer under certain of ACMP’s existing indentures and an event of default under ACMP’s existing revolving credit facility.
The ACMP Acquisition, if followed by a decrease in the rating of ACMP’s outstanding 5.875% Senior Notes due 2021 and 6.125% Senior Notes due 2022 (collectively, the “Applicable ACMP Notes”) by either Moody’s Investors Service, Inc. or Standard & Poor’s Ratings Services within ninety days of the consummation of the ACMP Acquisition, will result in a change of control as defined in the indentures governing the Applicable ACMP Notes (the “Applicable ACMP Notes Indentures”). The occurrence of a change of control under the Applicable ACMP Notes Indentures triggers an obligation for ACMP to offer to purchase all or any part of each series of Applicable ACMP Notes at a purchase price equal to 101% of the principal amount of each series of Applicable ACMP Notes, plus accrued and unpaid interest thereon to the date of repurchase. The occurrence of a change of control under the Applicable ACMP Notes Indentures would also result in an event of default under ACMP’s existing revolving credit facility. Under those circumstances, ACMP might not have sufficient financial resources available to satisfy its obligations to repurchase the Applicable ACMP Notes or to satisfy any obligations under the existing ACMP revolving credit facility. ACMP’s failure to purchase the Applicable ACMP Notes as required under the Applicable ACMP Notes Indentures would result in a default under the Applicable ACMP Notes Indentures, which could have material adverse consequences for ACMP, and consequently our business, financial condition, results of operations and cash flows.
The Proposed Merger may not be approved by the WPZ Conflicts Committee and the ACMP Conflicts Committee or the terms on which such approval might be granted may differ from the initially proposed terms.
58
In connection with the announcement of the ACMP Acquisition, we proposed that, subsequent to the ACMP Acquisition, ACMP acquire WPZ pursuant to the terms of the Proposed Merger. Prior to entering into a definitive agreement with respect to the Proposed Merger, each of the WPZ Conflicts Committee and the ACMP Conflicts Committee will be required to approve the Proposed Merger. In connection with obtaining such approval, the terms of the Proposed Merger, including the exchange ratio by which WPZ common units would be converted into ACMP common units in connection with the Proposed Merger, will be subject to negotiation with each of the WPZ Conflicts Committee and the ACMP Conflicts Committee. The WPZ Conflicts Committee and the ACMP Conflicts Committee may not approve the Proposed Merger, or if such approval is granted, the terms on which the Proposed Merger is approved may be significantly different than the initially proposed terms. Further, the market prices of WPZ’s and ACMP’s common units could significantly fluctuate prior to the consummation of the Proposed Merger and any potential changes in the market prices of WPZ’s or ACMP’s common units could affect whether the WPZ Conflicts Committee and the ACMP Conflicts Committee will approve the Proposed Merger, or if such approval is granted, the terms on which the Proposed Merger will be approved.
The successful execution of the integration strategy following the consummation of the Proposed Merger will involve considerable risks and may not be successful.
If the Proposed Merger is consummated, the success of the Proposed Merger will depend, in part, on the ability of the combined company to realize the anticipated benefits from combining ACMP’s and WPZ’s businesses. Realizing the benefits of the Proposed Merger will depend in part on the integration of assets, operations, functions and personnel while maintaining adequate focus on the core businesses of the combined company. Any expected cost savings, economies of scale, enhanced liquidity or other operational efficiencies, as well as revenue enhancement opportunities anticipated from the combination of WPZ and ACMP, or other synergies, may not occur. The full benefit of the Proposed Merger is also based on an expected upgrade of ACMP’s credit rating by independent credit rating agencies following the consummation of the Proposed Merger. Such upgrade may not occur.
The combined company’s management team will face challenges inherent in efficiently managing an increased number of employees over larger geographic distances, including the need to implement appropriate systems, policies, benefits and compliance programs. If management of the combined company is unable to minimize the potential disruption of the combined company’s ongoing business and the distraction of management during the integration process, the anticipated benefits of the Proposed Merger may not be realized or may only be realized to a lesser extent than expected. In addition, the inability to successfully manage the implementation of appropriate systems, policies, benefits and compliance programs for the combined company or the geographically more diverse and substantially larger combined organization could have an adverse effect on the combined company after the Proposed Merger. These integration-related activities also could have an adverse effect on each of ACMP and WPZ pending the completion of the Proposed Merger.
It is possible that the integration process could result in the loss of key employees, as well as the disruption of each of WPZ’s and ACMP’s ongoing businesses or the creation of inconsistencies between their standards, controls, procedures and policies. Any or all of those occurrences could adversely affect the combined company’s ability to maintain relationships with service providers, customers and employees after the Proposed Merger or to achieve the anticipated benefits of the Proposed Merger.
The combined company’s operating expenses may increase significantly over the near term due to the increased headcount, expanded operations and expenses or other changes related to the Proposed Merger. In addition, the actual integration may result in additional and unforeseen expenses, which could reduce the anticipated benefits of the Proposed Merger and materially and adversely affect the combined company’s business, operating results and financial condition.
59
|
Exhibit
No.
|
Description
|
|||
|
Exhibit 3.1
|
—
|
Amended and Restated Certificate of Incorporation (filed on May 26, 2010, as Exhibit 3.1 to The Williams Companies, Inc.’s current report on Form 8-K (File No. 001-04174) and incorporated herein by reference).
|
||
|
Exhibit 3.2
|
—
|
By-Laws (filed on May 26, 2010, as Exhibit 3.2 to The Williams Companies Inc.’s current report on Form 8-K (File No. 001-04174) and incorporated herein by reference).
|
||
|
Exhibit 10.1
|
—
|
Purchase Agreement, dated as of June 14, 2014, by and among GIP II Eagle Holdings Partnership, L.P., GIP II Hawk Holdings Partnership, L.P., GIP II Eagle 2 Holding, L.P. and GIP Hawk 2 Holding, L.P., as Sellers and The Williams Companies, Inc., as Buyer. (filed on June 16, 2014 as Exhibit 10.1 to The Williams Companies, Inc.’s current report on Form 8-K (File No. 001-04174) and incorporated herein by reference).
|
||
|
Exhibit 10.2
|
—
|
Second Supplemental Indenture, dated as of June 24, 2014, between The Williams Companies, Inc. and The Bank of New York Mellon Trust Company, N.A., as trustee. (filed on June 24, 2014 as Exhibit 4.1 to The Williams Companies, Inc.’s current report on Form 8-K (File No. 001-04174) and incorporated herein by reference).
|
||
|
Exhibit 10.3
|
—
|
Amendment No. 1, dated as of June 27, 2014 to the First Amended & Restated Credit Agreement, by and among The Williams Companies, Inc., the lenders named therein, and Citibank, N.A., as Administrative Agent. (filed on July 1, 2014 as Exhibit 10.1 to The Williams Companies, Inc.’s current report on Form 8-K (File No. 001-04174) and incorporated herein by reference).
|
||
|
*Exhibit 12
|
—
|
Computation of Ratio of Earnings to Fixed Charges.
|
||
|
*Exhibit 31.1
|
—
|
Certification of Chief Executive Officer pursuant to Rules 13a-14(a) and 15d-14(a) promulgated under the Securities Exchange Act of 1934, as amended, and Item 601(b)(31) of Regulation S-K, as adopted pursuant to Section 302 of the Sarbanes-Oxley Act of 2002.
|
||
|
*Exhibit 31.2
|
—
|
Certification of Chief Financial Officer pursuant to Rules 13a-14(a) and 15d-14(a) promulgated under the Securities Exchange Act of 1934, as amended, and Item 601(b)(31) of Regulation S-K, as adopted pursuant to Section 302 of the Sarbanes-Oxley Act of 2002.
|
||
|
**Exhibit 32
|
—
|
Certification of Chief Executive Officer and Chief Financial Officer pursuant to 18 U.S.C. Section 1350, as adopted pursuant to Section 906 of the Sarbanes-Oxley Act of 2002.
|
||
|
*Exhibit 101.INS
|
—
|
XBRL Instance Document.
|
||
|
*Exhibit 101.SCH
|
—
|
XBRL Taxonomy Extension Schema.
|
||
|
*Exhibit 101.CAL
|
—
|
XBRL Taxonomy Extension Calculation Linkbase.
|
||
|
*Exhibit 101.DEF
|
—
|
XBRL Taxonomy Extension Definition Linkbase.
|
||
|
*Exhibit 101.LAB
|
—
|
XBRL Taxonomy Extension Label Linkbase.
|
||
|
*Exhibit 101.PRE
|
—
|
XBRL Taxonomy Extension Presentation Linkbase.
|
||
* Filed herewith.
** Furnished herewith.
60
SIGNATURE
Pursuant to the requirements of the Securities Exchange Act of 1934, the registrant has duly caused this report to be signed on its behalf by the undersigned thereunto duly authorized.
|
T
HE
W
ILLIAMS
C
OMPANIES
, I
NC
.
|
|
|
(Registrant)
|
|
|
/s/ T
ED
T. T
IMMERMANS
|
|
|
Ted T. Timmermans
|
|
|
Vice President, Controller and Chief Accounting
Officer (Duly Authorized Officer and Principal
Accounting Officer)
|
|
July 31, 2014
EXHIBIT INDEX
|
Exhibit
No.
|
Description
|
|||
|
Exhibit 3.1
|
—
|
Amended and Restated Certificate of Incorporation (filed on May 26, 2010, as Exhibit 3.1 to The Williams Companies, Inc.’s current report on Form 8-K (File No. 001-04174) and incorporated herein by reference).
|
||
|
Exhibit 3.2
|
—
|
By-Laws (filed on May 26, 2010, as Exhibit 3.2 to The Williams Companies, Inc.’s current report on Form 8-K (File No. 001-04174) and incorporated herein by reference).
|
||
|
Exhibit 10.1
|
—
|
Purchase Agreement, dated as of June 14, 2014, by and among GIP II Eagle Holdings Partnership, L.P., GIP II Hawk Holdings Partnership, L.P., GIP II Eagle 2 Holding, L.P. and GIP Hawk 2 Holding, L.P., as Sellers and The Williams Companies, Inc., as Buyer. (filed on June 16, 2014 as Exhibit 10.1 to The Williams Companies, Inc.’s current report on Form 8-K (File No. 001-04174) and incorporated herein by reference).
|
||
|
Exhibit 10.2
|
—
|
Second Supplemental Indenture, dated as of June 24, 2014, between The Williams Companies, Inc. and The Bank of New York Mellon Trust Company, N.A., as trustee. (filed on June 24, 2014 as Exhibit 4.1 to The Williams Companies, Inc.’s current report on Form 8-K (File No. 001-04174) and incorporated herein by reference).
|
||
|
Exhibit 10.3
|
—
|
Amendment No. 1, dated as of June 27, 2014 to the First Amended & Restated Credit Agreement, by and among The Williams Companies, Inc., the lenders named therein, and Citibank, N.A., as Administrative Agent. (filed on July 1, 2014 as Exhibit 10.1 to The Williams Companies, Inc.’s current report on Form 8-K (File No. 001-04174) and incorporated herein by reference).
|
||
|
*Exhibit 12
|
—
|
Computation of Ratio of Earnings to Fixed Charges.
|
||
|
*Exhibit 31.1
|
—
|
Certification of Chief Executive Officer pursuant to Rules 13a-14(a) and 15d-14(a) promulgated under the Securities Exchange Act of 1934, as amended, and Item 601(b)(31) of Regulation S-K, as adopted pursuant to Section 302 of the Sarbanes-Oxley Act of 2002.
|
||
|
*Exhibit 31.2
|
—
|
Certification of Chief Financial Officer pursuant to Rules 13a-14(a) and 15d-14(a) promulgated under the Securities Exchange Act of 1934, as amended, and Item 601(b)(31) of Regulation S-K, as adopted pursuant to Section 302 of the Sarbanes-Oxley Act of 2002.
|
||
|
**Exhibit 32
|
—
|
Certification of Chief Executive Officer and Chief Financial Officer pursuant to 18 U.S.C. Section 1350, as adopted pursuant to Section 906 of the Sarbanes-Oxley Act of 2002.
|
||
|
*Exhibit 101.INS
|
—
|
XBRL Instance Document.
|
||
|
*Exhibit 101.SCH
|
—
|
XBRL Taxonomy Extension Schema.
|
||
|
*Exhibit 101.CAL
|
—
|
XBRL Taxonomy Extension Calculation Linkbase.
|
||
|
*Exhibit 101.DEF
|
—
|
XBRL Taxonomy Extension Definition Linkbase.
|
||
|
*Exhibit 101.LAB
|
—
|
XBRL Taxonomy Extension Label Linkbase.
|
||
|
*Exhibit 101.PRE
|
—
|
XBRL Taxonomy Extension Presentation Linkbase.
|
||
* Filed herewith.
** Furnished herewith.
TABLE OF CONTENTS
Part I Financial InformationNote 1 General, Description Of Business, and Basis Of PresentationNote 2 Variable Interest EntitiesNote 13 Subsequent EventNote 8 Debt and Banking ArrangementsNote 3 Other Income and ExpensesNote 4 Provision (benefit) For Income TaxesNote 5 Earnings (loss) Per Common Share From Continuing OperationsNote 6 Employee Benefit PlansNote 7 InventoriesNote 9 Stockholders' EquityNote 10 Fair Value Measurements and GuaranteesNote 11 Contingent LiabilitiesNote 12 Segment DisclosuresPart II. Other InformationItem 1. Legal ProceedingsItem 1A. Risk FactorsItem 6. Exhibits