WALMART INC.
10-Ks and 10-Qs
|
|
|
|
|
|
|
|
|
|
|
|
|
|
|
|
|
|
|
|
|
|
|
|
|
|
|
|
|
|
|
|
|
|
|
|
|
|
|
|
|
|
|
|
|
|
|
|
|
|
|
|
|
|
|
|
|
|
|
UNITED STATES
SECURITIES AND EXCHANGE COMMISSION
Washington, D.C. 20549
___________________________________________
FORM 10-K
___________________________________________
|
ý
|
Annual report pursuant to section 13 or 15(d) of the Securities Exchange Act of 1934
|
for the fiscal year ended
January 31, 2018
, or
|
¨
|
Transition report pursuant to section 13 or 15(d) of the Securities Exchange Act of 1934
|
Commission file number 001-6991.
___________________________________________

WALMART INC.
(Exact name of registrant as specified in its charter)
___________________________________________
|
Delaware
|
|
71-0415188
|
|
(State or other jurisdiction of
incorporation or organization)
|
|
(IRS Employer Identification No.)
|
|
702 S.W. 8th Street
Bentonville, Arkansas
|
|
72716
|
|
(Address of principal executive offices)
|
|
(Zip Code)
|
Registrant's telephone number, including area code: (479) 273-4000
Securities registered pursuant to Section 12(b) of the Act:
|
Title of each class
|
|
Name of each exchange on which registered
|
|
Common Stock, par value $0.10 per share
1.900% Notes Due 2022
2.550% Notes Due 2026
|
|
New York Stock Exchange
New York Stock Exchange
New York Stock Exchange
|
Securities registered pursuant to Section 12(g) of the Act: None
___________________________________________
Indicate by check mark if the registrant is a well-known seasoned issuer, as defined in Rule 405 of the Securities Act.
Yes
ý
No
¨
Indicate by check mark if the registrant is not required to file reports pursuant to Section 13 or Section 15(d) of the Exchange Act.
Yes
¨
No
ý
Indicate by check mark whether the registrant (1) has filed all reports required to be filed by Section 13 or 15(d) of the Securities Exchange Act of 1934 during the preceding 12 months (or for such shorter period that the registrant was required to file such reports), and (2) has been subject to such filing requirements for at least the past 90 days.
Yes
ý
No
¨
Indicate by check mark whether the registrant has submitted electronically and posted on its corporate Web site, if any, every Interactive Data File required to be submitted and posted pursuant to Rule 405 of Regulation S-T (§232.405 of this chapter) during the preceding 12 months (or for such shorter period that the registrant was required to submit and post such files).
Yes
ý
No
¨
Indicate by check mark if disclosure of delinquent filers pursuant to Item 405 of Regulation S-K is not contained herein, and will not be contained, to the best of registrant's knowledge, in definitive proxy or information statements incorporated by reference in Part III of this Form 10-K or any amendment to this Form 10-K.
¨
Indicate by check mark whether the registrant is a large accelerated filer, an accelerated filer, a non-accelerated filer, a smaller reporting company or an emerging growth company. See the definitions of "large accelerated filer," "accelerated filer," "smaller reporting company" and "emerging growth company" in Rule 12b-2 of the Exchange Act.
|
Large Accelerated Filer
|
|
ý
|
|
Accelerated Filer
|
|
o
|
|
Non-Accelerated Filer
|
|
o
|
|
Smaller Reporting Company
|
|
o
|
|
Emerging Growth Company
|
o
|
|||||
If an emerging growth company, indicate by check mark if the registrant has elected not to use the extended transition period for complying with any new or revised financial accounting standards provided pursuant to Section 13(a) of the Exchange Act.
¨
Indicate by check mark whether the registrant is a shell company (as defined in Rule 12b-2 of the Exchange Act).
Yes
¨
No
ý
As o
f
July 31, 2017, the aggregate market value of the voting common stock of the registrant held by non-affiliates of the registrant, based on the closing sale price of those shares on the New York Stock Exchange reported on July 31, 2017, was $114,770,199,895. For the purposes of this disclosure only, the registrant has assumed that its directors, executive officers (as defined in Rule 3b-7 under the Exchange Act) and the beneficial owners of 5% or more of the registrant's outstanding common stock are the affiliates of the registrant.
The registrant had 2,950,696,818 shares of common stock outstanding as of
March 28, 2018
.
DOCUMENTS INCORPORATED BY REFERENCE
|
Document
|
|
Parts Into Which Incorporated
|
|
Portions of the registrant's Proxy Statement for the Annual Meeting of Shareholders to be held May 30, 2018 (the "Proxy Statement")
|
|
Part III
|
Walmart Inc.
Form 10-K
For the Fiscal Year Ended
January 31, 2018
Table of Contents
|
Page
|
||
WALMART INC.
(formerly "WAL-MART STORES, INC.")
ANNUAL REPORT ON FORM 10-K
FOR THE FISCAL YEAR ENDED JANUARY 31,
2018
On February 1, 2018, the legal name of our corporation became "Walmart Inc.," changing from "Wal-Mart Stores, Inc." All references in this Annual Report on Form 10-K, the information incorporated into this Annual Report on Form 10-K by reference to information in the Proxy Statement of Walmart Inc. for its Annual Shareholders' Meeting to be held on May 30, 2018 and in the exhibits to this Annual Report on Form 10-K to "Walmart Inc.," "Wal-Mart Stores, Inc.," "Walmart," "the Company," "our Company," "we," "us" and "our" are to the Delaware corporation named "Wal-Mart Stores, Inc." prior to February 1, 2018 and named "Walmart Inc." commencing on February 1, 2018 and, except where expressly noted otherwise or the context otherwise requires, that corporation's consolidated subsidiaries.
Cautionary Statement Regarding Forward-Looking Statements
This Annual Report on Form 10-K and other reports, statements, and information that Walmart Inc. (which individually or together with its subsidiaries, as the context otherwise requires, is referred to as "we," "Walmart" or the "Company") has filed with or furnished to the Securities and Exchange Commission ("SEC") or may file with or furnish to the SEC in the future, and prior or future public announcements and presentations that we or our management have made or may make, include or may include, or incorporate or may incorporate by reference, statements that may be deemed to be "forward-looking statements" within the meaning of Section 21E of the Securities Exchange Act of 1934, as amended (the "Act"), that are intended to enjoy the protection of the safe harbor for forward-looking statements provided by the Act.
Nature of Forward-Looking Statements
Such forward-looking statements are not statements of historical facts, but instead express our estimates or expectations for our consolidated, or one of our segment's, economic performance or results of operations for future periods or as of future dates or events or developments that may occur in the future or discuss our plans, objectives or goals. These forward-looking statements relate to:
|
•
|
the growth of our business or change in our competitive position in the future or in or over particular periods;
|
|
•
|
the amount, number, growth or increase, in or over certain periods, of or in certain financial items or measures or operating measures, including our earnings per share, including as adjusted for certain items, net sales, comparable store and club sales, our Walmart U.S. operating segment's eCommerce sales, liabilities, expenses of certain categories, expense leverage, returns, capital and operating investments or expenditures of particular types, new store openings and investments in particular formats;
|
|
•
|
investments and capital expenditures we will make and how certain of those investments and capital expenditures are expected to be financed;
|
|
•
|
our plans to increase investments in eCommerce, technology, store remodels and other customer initiatives, such as online grocery locations;
|
|
•
|
volatility in currency exchange rates and fuel prices affecting our or one of our segments' results of operations;
|
|
•
|
the Company continuing to provide returns to shareholders through share repurchases and dividends, the use of share repurchase authorization over a certain period or the source of funding of a certain portion of our share repurchases;
|
|
•
|
our sources of liquidity, including our cash, continuing to be adequate or sufficient to fund and finance our operations, expansion activities, dividends and share repurchases, to meet our cash needs and to fund our domestic operations without repatriating earnings we hold outside of the United States;
|
|
•
|
our intention to reinvest the earnings we hold outside of the United States in our foreign operations and certain laws, other limitations and potential taxes on anticipated future repatriations of such earnings not materially affecting our liquidity, financial condition or results of operations;
|
|
•
|
the insignificance of ineffective hedges and reclassification of amounts related to our derivatives;
|
|
•
|
our effective tax rate for certain periods and the realization of certain net deferred tax assets and the effects of resolutions of tax-related matters;
|
|
•
|
the effect of adverse decisions in, or settlement of, litigation or other proceedings to which we are subject; or
|
|
•
|
the effect on the Company's results of operations or financial condition of the Company's adoption of certain new, or amendments to existing, accounting standards.
|
Our forward-looking statements may also include statements of our strategies, plans and objectives for our operations, including areas of future focus in our operations, and the assumptions underlying any of the forward-looking statements we make. The forward-looking statements we make can typically be identified by the use therein of words and phrases such as "aim," "anticipate," "believe," "could be," "could increase," "could occur," "could result," "continue," "estimate," "expansion," "expect," "expectation," "expected to be," "focus," "forecast," "goal," "grow," "guidance," "intend," "invest," "is expected,"
4
"may continue," "may fluctuate," "may grow," "may impact," "may result," "objective," "plan," "priority," "project," "strategy," "to be," "we'll," "we will," "will add," "will allow," "will be," "will benefit," "will change," "will come in at," "will continue," "will decrease," "will grow," "will have," "will impact," "will include," "will increase," "will open," "will remain," "will result," "will stay," "will strengthen," "would be," "would decrease" and "would increase," variations of such words or phrases, other phrases commencing with the word "will" or similar words and phrases denoting anticipated or expected occurrences or results. The forward-looking statements include statements made in
Part I, Item 3.
"Legal Proceedings" in this Annual Report on Form 10-K as to our belief that the possible loss or range of any possible loss that may be incurred in connection with certain legal proceedings will not be material to our financial condition, results of operations, or liquidity.
Risks Factors and Uncertainties Affecting Our Business
Our business operations are subject to numerous risks, factors and uncertainties, domestically and internationally, outside of our control. One, or a combination, of these risks, factors and uncertainties could materially affect any of those matters as to which we have made forward-looking statements and cause our actual results or an actual event or occurrence to differ materially from those results or an event or occurrence described in a forward-looking statement. These risks, factors and uncertainties, which may be global in their effect or affect only some of the markets in which we operate and which may affect us on a consolidated basis or affect only some of our reportable segments, include, but are not limited to:
Economic Factors
|
•
|
economic, geo-political, capital markets and business conditions, trends and events around the world and in the markets in which Walmart operates;
|
|
•
|
currency exchange rate fluctuations;
|
|
•
|
changes in market rates of interest;
|
|
•
|
changes in market levels of wages;
|
|
•
|
changes in the size of various markets, including eCommerce markets;
|
|
•
|
unemployment levels;
|
|
•
|
inflation or deflation, generally and in certain product categories;
|
|
•
|
transportation, energy and utility costs;
|
|
•
|
commodity prices, including the prices of oil and natural gas;
|
|
•
|
consumer confidence, disposable income, credit availability, spending levels, shopping patterns, debt levels, and demand for certain merchandise;
|
|
•
|
trends in consumer shopping habits around the world and in the markets in which Walmart operates;
|
|
•
|
consumer enrollment in health and drug insurance programs and such programs' reimbursement rates and drug formularies; and
|
|
•
|
initiatives of competitors, competitors' entry into and expansion in Walmart's markets, and competitive pressures;
|
Operating Factors
|
•
|
the amount of Walmart's net sales and operating expenses denominated in U.S. dollar and various foreign currencies;
|
|
•
|
the financial performance of Walmart and each of its segments, including the amounts of Walmart's cash flow during various periods;
|
|
•
|
Walmart's need to repatriate earnings held outside of the U.S. and changes in U.S. and international tax regulations;
|
|
•
|
customer traffic and average ticket in Walmart's stores and clubs and on its eCommerce platforms;
|
|
•
|
the mix of merchandise Walmart sells and its customers purchase;
|
|
•
|
the availability of goods from suppliers and the cost of goods acquired from suppliers;
|
|
•
|
the effectiveness of the implementation and operation of Walmart's strategies, plans, programs and initiatives;
|
|
•
|
Walmart's ability to successfully integrate acquired businesses, including within the eCommerce space;
|
|
•
|
the amount of shrinkage Walmart experiences;
|
|
•
|
consumer acceptance of and response to Walmart's stores and clubs, digital platforms, programs, merchandise offerings and delivery methods;
|
|
•
|
Walmart's gross profit margins, including pharmacy margins and margins of other product categories;
|
|
•
|
the selling prices of gasoline and diesel fuel;
|
|
•
|
disruption of seasonal buying patterns in Walmart's markets;
|
|
•
|
Walmart's expenditures for Foreign Corrupt Practices Act ("FCPA") and other compliance-related matters including the adequacy of our accrual for the FCPA matter;
|
|
•
|
disruptions in Walmart's supply chain;
|
|
•
|
cybersecurity events affecting Walmart and related costs and impact of any disruption in business;
|
|
•
|
Walmart's labor costs, including healthcare and other benefit costs;
|
|
•
|
Walmart's casualty and accident-related costs and insurance costs;
|
|
•
|
the size of and turnover in Walmart's workforce and the number of associates at various pay levels within that workforce;
|
|
•
|
the availability of necessary personnel to staff Walmart's stores, clubs and other facilities;
|
5
|
•
|
unexpected changes in Walmart's objectives and plans;
|
|
•
|
developments in, and the outcome of, legal and regulatory proceedings and investigations to which Walmart is a party or is subject, and the liabilities, obligations and expenses, if any, that Walmart may incur in connection therewith;
|
|
•
|
changes in the credit ratings assigned to the Company's commercial paper and debt securities by credit rating agencies;
|
|
•
|
Walmart's effective tax rate; and
|
|
•
|
unanticipated changes in accounting judgments and estimates;
|
Regulatory and Other Factors
|
•
|
changes in existing tax, labor and other laws and changes in tax rates, including the enactment of laws and the adoption and interpretation of administrative rules and regulations;
|
|
•
|
adoption or creation of new, and modification of existing, governmental policies, programs and initiatives in the markets in which Walmart operates and elsewhere and actions with respect to such policies, programs and initiatives;
|
|
•
|
the possibility of the imposition of new taxes on imports and new tariffs and trade restrictions and changes in tariff rates and trade restrictions;
|
|
•
|
changes in currency control laws;
|
|
•
|
changes in the level of public assistance payments;
|
|
•
|
the timing of federal income tax refunds;
|
|
•
|
natural disasters, public health emergencies, civil disturbances, and terrorist attacks; and
|
|
•
|
changes in generally accepted accounting principles in the United States.
|
We typically earn a disproportionate part of our annual operating income in the fourth quarter as a result of seasonal buying patterns, which patterns are difficult to forecast with certainty and can be affected by many factors.
Other Risk Factors; No Duty to Update
The above list of factors that may affect the estimates and expectations discussed in or implied or contemplated by forward-looking statements we make or made on our behalf is not exclusive. We are subject to other risks discussed under the caption "Item 1A. Risk Factors," and that we may discuss in Management's Discussions and Analysis of Financial Condition and Results of Operations and in risks that may be discussed under "Part II, Item 1A. Risk Factors" and "Part I, Item 2. Management's Discussions and Analysis of Financial Condition and Results of Operations" appearing in our Quarterly Reports on Form 10-Q or may otherwise be disclosed in our Quarterly Reports on Form 10-Q and other reports filed with the SEC. Investors and other readers are urged to consider all of these risks, uncertainties and other factors carefully in evaluating our forward-looking statements.
The forward-looking statements that we make or are made by others on our behalf are based on our knowledge of our business and our operating environment and assumptions that we believe to be or will believe to be reasonable when such forward-looking statements were or are made. As a consequence of the factors described above, the other risks, uncertainties and factors we disclose below and in the other reports as mentioned above, other risks not known to us at this time, changes in facts, assumptions not being realized or other circumstances, our actual results may differ materially from those discussed in or implied or contemplated by our forward-looking statements. Consequently, this cautionary statement qualifies all forward-looking statements we make or that are made on our behalf, including those made herein and incorporated by reference herein. We cannot assure you that the results or developments expected or anticipated by us will be realized or, even if substantially realized, that those results or developments will result in the expected consequences for us or affect us, our business, our operations or our operating results in the manner or to the extent we expect. We caution readers not to place undue reliance on such forward-looking statements, which speak only as of their dates. We undertake no obligation to revise or update any of the forward-looking statements to reflect subsequent events or circumstances except to the extent required by applicable law.
6
|
ITEM 1.
|
BUSINESS
|
General
Walmart Inc. ("Walmart," the "Company" or "we") helps people around the world save money and live better – anytime and anywhere – in retail stores and through eCommerce. Through innovation, we are striving to create a customer-centric experience that seamlessly integrates our eCommerce and retail stores in an omni-channel offering that saves time for our customers. Each week, we serve nearly
270 million
customers who visit our more than
11,700
stores and numerous eCommerce websites under
65
banners in
28
countries.
Our strategy is to lead on price, invest to differentiate on access, be competitive on assortment and deliver a great experience. Leading on price is designed to earn the trust of our customers every day by providing a broad assortment of quality merchandise and services at everyday low prices ("EDLP"). EDLP is our pricing philosophy under which we price items at a low price every day so our customers trust that our prices will not change under frequent promotional activity. Price leadership is core to who we are. Everyday low cost ("EDLC") is our commitment to control expenses so those cost savings can be passed along to our customers. Our omni-channel presence provides customers access to our broad assortment anytime and anywhere. We strive to give our customers and members a great digital and physical shopping experience.
Our operations comprise three reportable segments: Walmart U.S., Walmart International and Sam's Club. Our fiscal year ends on January 31 for our United States ("U.S.") and Canadian operations. We consolidate all other operations generally using a one-month lag and on a calendar year basis. Our discussion is as of and for the fiscal years ended
January 31, 2018
("fiscal
2018
"),
January 31, 2017
("fiscal
2017
") and
January 31, 2016
("fiscal
2016
"). During fiscal
2018
, we generated total revenues of
$500.3 billion
, which was primarily comprised of net sales of
$495.8 billion
.
We maintain our principal offices at 702 S.W. 8th Street, Bentonville, Arkansas 72716, USA. Our common stock trades on the New York Stock Exchange under the symbol "WMT."
The Development of Our Company
Although Walmart was incorporated in Delaware in October 1969, the businesses conducted by our founders began in 1945 when Sam M. Walton opened a franchise Ben Franklin variety store in Newport, Arkansas. In 1946, his brother, James L. Walton, opened a similar store in Versailles, Missouri. Until 1962, our founders' business was devoted entirely to the operation of variety stores. In that year, the first Wal-Mart Discount City, which was a discount store, opened in Rogers, Arkansas. In 1983, we opened our first Sam's Club, and in 1988, we opened our first supercenter. In 1998, we opened our first Neighborhood Market.
In 1991, we began our first international initiative when we entered into a joint venture in Mexico. Since then, our international presence has expanded and, as of
January 31, 2018
, our Walmart International segment conducted business in
27
countries.
In 2000, we began our first eCommerce initiative by creating walmart.com. That same year, we also created samsclub.com. Since then, our digital presence has continued to grow. In 2007, walmart.com launched its Site to Store service, enabling customers to make a purchase online and pick up merchandise in stores. In 2016, we acquired jet.com in the U.S. and formed a strategic alliance with JD.com in China. Subsequent to the jet.com purchase, we have acquired several other U.S. eCommerce entities. In 2017, walmart.com launched free two-day shipping on more than 2 million items and we created Store N
o
8, a tech incubator with a focus to drive commerce forward. These eCommerce efforts have led to omni-channel offerings in many markets, including over 1,100 "Online Grocery" pickup locations in the U.S.
Information About Our Segments
The Company is engaged in the operation of retail, wholesale and other units, as well as eCommerce websites, located throughout the U.S., Africa, Argentina, Brazil, Canada, Central America, Chile, China, India, Japan, Mexico and the United Kingdom. The Company's operations are conducted in three reportable segments: Walmart U.S., Walmart International and Sam's Club. The Company defines its segments as those operations whose results the chief operating decision maker ("CODM") regularly reviews to analyze performance and allocate resources. The Company sells similar individual products and services in each of its segments. It is impractical to segregate and identify revenues for each of these individual products and services.
Walmart U.S. is our largest segment and operates retail stores in all 50 states in the U.S., Washington D.C. and Puerto Rico, with three primary store formats, as well as eCommerce. Walmart U.S. generated approximately
64%
of our net sales in fiscal
2018
, and of our three segments, Walmart U.S. is the largest and has historically had the highest gross profit as a percentage of net sales ("gross profit rate"). In addition, Walmart U.S. has historically contributed the greatest amount to the Company's net sales and operating income.
Walmart International consists of operations in
27
countries outside of the U.S. and is divided into three major categories: retail, wholesale and other. These categories consist of many formats, including: supercenters, supermarkets, hypermarkets, warehouse clubs (including Sam's Clubs) and cash & carry, as well as eCommerce. Walmart International generated
7
approximately
24%
of our fiscal
2018
net sales. The overall gross profit rate for Walmart International is lower than that of Walmart U.S. primarily because of its merchandise mix. Walmart International is our second largest segment.
Sam's Club consists of membership-only warehouse clubs and operates in 44 states in the U.S. and in Puerto Rico, as well as eCommerce. Sam's Club accounted for approximately
12%
of our fiscal
2018
net sales. As a membership-only warehouse club, membership income is a significant component of the segment's operating income. Sam's Club operates with a lower gross profit rate and lower operating expenses as a percentage of net sales than our other segments.
The Company measures the results of its segments using, among other measures, each segment's net sales and operating income, which includes certain corporate overhead allocations. From time to time, we revise the measurement of each segment's operating income, including any corporate overhead allocations, as determined by the information regularly reviewed by our CODM. When the measurement of a segment changes, previous period amounts and balances are reclassified to be comparable to the current period's presentation.
Walmart U.S. Segment
The Walmart U.S. segment is a mass merchandiser of consumer products, operating under the "Walmart," "Wal-Mart" and "Walmart Neighborhood Market" brands, as well as walmart.com and other eCommerce brands. The Walmart U.S. segment had net sales of
$318.5 billion
,
$307.8 billion
and
$298.4 billion
for fiscal
2018
,
2017
and
2016
, respectively. During the most recent fiscal year, no single unit accounted for as much as 1% of total Company consolidated net sales.
Physical.
Walmart U.S. operates retail stores in the U.S., including in all
50
states, Washington D.C. and Puerto Rico, with supercenters in
49
states, Washington D.C. and Puerto Rico, discount stores in
41
states and Puerto Rico and Neighborhood Markets and other small store formats in
36
states, Washington D.C. and Puerto Rico. The following table provides square footage details on each of our formats as of
January 31, 2018
:
|
Minimum Square Feet
|
Maximum Square Feet
|
Average Square Feet
|
|||||||
|
Supercenters (general merchandise and grocery)
|
69,000
|
|
260,000
|
|
178,000
|
|
|||
|
Discount stores (general merchandise and limited grocery)
|
30,000
|
|
206,000
|
|
105,000
|
|
|||
|
Neighborhood Markets
(1)
(grocery)
|
28,000
|
|
65,000
|
|
42,000
|
|
|||
|
(1)
|
Excludes other small formats.
|
The following table provides the retail unit count and retail square feet by format for the fiscal years shown:
|
Supercenters
|
Discount Stores
|
|||||||||||||||||||||||||||||
|
Fiscal Year
|
Opened
|
Closed
|
Conversions
(1)
|
Total
(2)
|
Square
Feet
(2)
|
Opened
|
Closed
|
Conversions
(1)
|
Total
(2)
|
Square
Feet
(2)
|
||||||||||||||||||||
|
Balance forward
|
3,158
|
|
570,409
|
|
561
|
|
59,098
|
|
||||||||||||||||||||||
|
2014
|
72
|
|
—
|
|
58
|
|
3,288
|
|
589,858
|
|
4
|
|
—
|
|
(57
|
)
|
508
|
|
53,496
|
|
||||||||||
|
2015
|
79
|
|
—
|
|
40
|
|
3,407
|
|
607,415
|
|
2
|
|
—
|
|
(40
|
)
|
470
|
|
49,327
|
|
||||||||||
|
2016
|
55
|
|
(16
|
)
|
19
|
|
3,465
|
|
616,428
|
|
—
|
|
(9
|
)
|
(19
|
)
|
442
|
|
45,991
|
|
||||||||||
|
2017
|
38
|
|
(2
|
)
|
21
|
|
3,522
|
|
625,930
|
|
—
|
|
(6
|
)
|
(21
|
)
|
415
|
|
43,347
|
|
||||||||||
|
2018
|
30
|
|
—
|
|
9
|
|
3,561
|
|
632,479
|
|
—
|
|
(6
|
)
|
(9
|
)
|
400
|
|
41,926
|
|
||||||||||
|
|
Neighborhood Markets and Other Small Formats
|
|
Total Segment
|
|||||||||||||||||||||||||||
|
Fiscal Year
|
Opened
|
Closed
|
Conversions
(1)
|
Total
(2)
|
Square
Feet
(2)
|
|
Opened
(3)
|
Closed
|
Total
(2)
|
Square
Feet
(2)
|
||||||||||||||||||||
|
Balance forward
|
286
|
|
11,226
|
|
4,005
|
|
640,733
|
|
||||||||||||||||||||||
|
2014
|
122
|
|
—
|
|
(1
|
)
|
407
|
|
15,778
|
|
198
|
|
—
|
|
4,203
|
|
659,132
|
|
||||||||||||
|
2015
|
235
|
|
(3
|
)
|
—
|
|
639
|
|
23,370
|
|
316
|
|
(3
|
)
|
4,516
|
|
680,112
|
|
||||||||||||
|
2016
|
161
|
|
(133
|
)
|
—
|
|
667
|
|
27,228
|
|
216
|
|
(158
|
)
|
4,574
|
|
689,647
|
|
||||||||||||
|
2017
|
73
|
|
(5
|
)
|
—
|
|
735
|
|
30,012
|
|
111
|
|
(13
|
)
|
4,672
|
|
699,289
|
|
||||||||||||
|
2018
|
85
|
|
(20
|
)
|
—
|
|
800
|
|
30,111
|
|
115
|
|
(26
|
)
|
4,761
|
|
704,516
|
|
||||||||||||
|
(1)
|
Conversions of discount stores or Neighborhood Markets to supercenters.
|
|
(2)
|
"Total" and "Square Feet" columns are as of January 31 for the years shown. Retail square feet are reported in thousands.
|
|
(3)
|
Total opened, net of conversions of discount stores or Neighborhood Markets to supercenters.
|
Digital.
Walmart U.S. provides its customers access to a broad assortment of merchandise, including products not found in our physical stores, and services online through our eCommerce family of brands' websites and third party retail partnership channels, as well as through related mobile commerce and voice-activated commerce applications. Our eCommerce family of brands includes walmart.com, jet.com, hayneedle.com, shoes.com, moosejaw.com, modcloth.com and bonobos.com. Walmart.com offers access to nearly 75 million SKUs, including those carried on Marketplace, a feature of the website that permits third parties to sell merchandise on walmart.com. Walmart.com is also integrated with our physical stores through
8
services like "Walmart Pickup," "Pickup Today" and in over 1,100 "Online Grocery" pickup locations to provide an omni-channel offering to our customers. Walmart U.S. also offers access to digital content and services including Vudu.
Merchandise.
Walmart U.S. does business in three strategic merchandise units, listed below, across several store formats including supercenters, discount stores, Neighborhood Markets and other small store formats, as well as on our eCommerce websites.
|
•
|
Grocery consists of a full line of grocery items, including meat, produce, natural & organics, deli & bakery, dairy, frozen foods, alcoholic and nonalcoholic beverages, floral and dry grocery, as well as consumables such as health and beauty aids, baby products, household chemicals, paper goods and pet supplies;
|
|
•
|
Health and wellness includes pharmacy, optical services, clinical services, and over-the-counter drugs and other medical products;
|
|
•
|
General merchandise includes:
|
|
◦
|
Entertainment (e.g., electronics, cameras and supplies, photo processing services, wireless, movies, music, video games and books);
|
|
◦
|
Hardlines (e.g., stationery, automotive, hardware and paint, sporting goods, outdoor living and horticulture);
|
|
◦
|
Apparel (e.g., apparel for women, girls, men, boys and infants, as well as shoes, jewelry and accessories); and
|
|
◦
|
Home/Seasonal (e.g., home furnishings, housewares and small appliances, bedding, home decor, toys, fabrics and crafts and seasonal merchandise).
|
Walmart U.S. also offers fuel and financial services and related products, including money orders, prepaid cards, wire transfers, money transfers, check cashing and bill payment. These services total less than 1% of annual net sales.
Brand name merchandise represents a significant portion of the merchandise sold in Walmart U.S. We also market lines of merchandise under our private-label store brands, including: "Adventure Force," "AutoDrive," "BlackWeb," "Equate," "Everstart," "Faded Glory," "George," "Great Value," "Holiday Time," "Hyper Tough," "Kid Connection," "Mainstays," "Marketside," "My Life As," "No Boundaries," "Ol' Roy," "Onn," "Ozark Trail," "Parent's Choice," "Prima Della," "Pure Balance," "Sam's Choice," "Special Kitty," "Spring Valley," "Terra & Sky," "Time and Tru," "Way to Celebrate" and "Wonder Nation." The Company also markets lines of merchandise under licensed brands, some of which include: "Better Homes & Gardens," "Farberware," "Russell" and "SwissTech."
The percentage of strategic merchandise unit net sales for Walmart U.S., including online sales, was as follows for fiscal
2018
,
2017
and
2016
:
|
Fiscal Years Ended January 31,
|
||||||
|
STRATEGIC MERCHANDISE UNITS
|
2018
|
2017
|
2016
|
|||
|
Grocery
|
56%
|
56%
|
56%
|
|||
|
Health and wellness
|
11%
|
11%
|
11%
|
|||
|
General merchandise
|
33%
|
33%
|
33%
|
|||
|
Total
|
100%
|
100%
|
100%
|
|||
Periodically, revisions are made to the categorization of the components comprising our strategic merchandise units. When revisions are made, the previous periods' presentation is adjusted to maintain comparability.
Operations.
Many supercenters, discount stores and Neighborhood Markets are open 24 hours each day. A variety of payment methods are accepted at our stores and through our eCommerce websites and mobile commerce applications.
Seasonal Aspects of Operations.
Walmart U.S.'s business is seasonal to a certain extent due to calendar events and national and religious holidays, as well as different weather patterns. Historically, its highest sales volume and segment operating income have occurred in the fiscal quarter ending January 31.
Competition.
Walmart U.S.
competes with both physical retailers operating discount, department, retail and wholesale grocers, drug, dollar, variety and specialty stores, supermarkets, hypermarkets and supercenter-type stores, and digital retailers, as well as catalog businesses.
We also compete with others for desirable sites for new or relocated retail units.
Our ability to develop, open and operate units at the right locations and to deliver a customer-centric omni-channel experience largely determines our competitive position within the retail industry. We employ many programs designed to meet competitive pressures within our industry. These programs include the following:
|
•
|
EDLP: our pricing philosophy under which we price items at a low price every day so our customers trust that our prices will not change under frequent promotional activity;
|
|
•
|
EDLC: everyday low cost is our commitment to control expenses so our cost savings can be passed along to our customers;
|
9
|
•
|
Rollbacks: our commitment to pass cost savings on to the customer by lowering prices on selected goods;
|
|
•
|
Savings Catcher, Save Even More and Ad Match: strategies to meet or be below a competitor's advertised price;
|
|
•
|
Walmart Pickup: customer places order online and picks it up for free from a store. The merchandise is fulfilled through our distribution facilities;
|
|
•
|
Pickup Today: customer places order online and picks it up at a store within four hours for free. The order is fulfilled through existing store inventory;
|
|
•
|
Online Grocery: customer places grocery order online and has it delivered to home or picks it up at one of our participating stores or remote locations; and
|
|
•
|
Money Back Guarantee: our commitment to ensure the quality and freshness of the fruits and vegetables in our stores by offering our customers a 100 percent money-back guarantee if they are not satisfied.
|
We offer a broad assortment of merchandise that provides one-stop shopping, in-stock levels that give our customers confidence that we will have the products they need and operating hours that allow customers to shop at their convenience. In addition, our eCommerce capabilities, including omni-channel transactions that involve both an eCommerce platform and a physical format, are important factors in our competition with other retailers.
Distribution.
For fiscal
2018
, approximately
78%
of Walmart U.S.'s purchases of store merchandise were shipped through our
157
distribution facilities, which are located strategically throughout the U.S. The remaining merchandise we purchased was shipped directly from suppliers. General merchandise and dry grocery merchandise is transported primarily through the segment's private truck fleet; however, we contract with common carriers to transport the majority of our perishable grocery merchandise.
We ship merchandise purchased by customers on our eCommerce platforms by a number of methods from multiple locations including from our 30 dedicated eCommerce fulfillment centers.
The following table provides further details of our distribution facilities, including return facilities and dedicated eCommerce fulfillment centers, as of
January 31, 2018
:
|
Owned and Operated
|
Owned and Third Party Operated
|
Leased and Operated
|
Third Party Owned and Operated
|
Total
|
||||||
|
Walmart U.S. distribution facilities
|
103
|
2
|
23
|
29
|
157
|
|||||
Walmart International Segment
The Walmart International segment consists of operations in
27
countries outside of the U.S. and includes numerous formats divided into three major categories: retail, wholesale and other. These categories, including eCommerce, consist of many formats, including: supercenters, supermarkets, hypermarkets, warehouse clubs (including Sam's Clubs) and cash & carry. The segment's net sales for fiscal
2018
,
2017
and
2016
, were
$118.1 billion
,
$116.1 billion
and
$123.4 billion
, respectively, which have been impacted by currency exchange rate fluctuations. During the most recent fiscal year, no single unit accounted for as much as 1% of total Company net sales.
Physical.
Walmart International includes physical stores operated by: our wholly-owned subsidiaries operating in Argentina, Brazil, Canada, Chile, China, India, Japan and the United Kingdom; and our majority-owned subsidiaries operating in Africa (which includes Botswana, Ghana, Kenya, Lesotho, Malawi, Mozambique, Namibia, Nigeria, South Africa, Swaziland, Tanzania, Uganda and Zambia), Central America (which includes Costa Rica, El Salvador, Guatemala, Honduras and Nicaragua) and Mexico.
Generally, retail units range in size from
8,900
square feet to
186,000
square feet. Our wholesale stores generally range in size from
35,000
square feet to
185,000
square feet. Other, which includes drugstores and convenience stores operating under various banners in Brazil, Mexico and the United Kingdom, range in size up to
2,400
square feet. Also, on a limited basis, Walmart International operates financial institutions that provide consumer credit.
10
The following table provides the retail unit count
(1)
and retail square feet
(2)
for the fiscal years shown:
|
Africa
|
Argentina
|
Brazil
|
Canada
|
Central
America
|
Chile
|
|||||||||||||||||||||||||||||||
|
Fiscal Year
|
Unit Count
|
Square Feet
|
Unit
Count
|
Square
Feet
|
Unit
Count
|
Square
Feet
|
Unit
Count
|
Square
Feet
|
Unit
Count
|
Square
Feet
|
Unit
Count
|
Square
Feet
|
||||||||||||||||||||||||
|
Balance forward
|
377
|
|
19,775
|
|
94
|
|
7,531
|
|
558
|
|
32,494
|
|
379
|
|
48,354
|
|
642
|
|
9,873
|
|
329
|
|
12,671
|
|
||||||||||||
|
2014
|
379
|
|
20,513
|
|
104
|
|
8,062
|
|
556
|
|
32,501
|
|
389
|
|
49,914
|
|
661
|
|
10,427
|
|
380
|
|
13,697
|
|
||||||||||||
|
2015
|
396
|
|
21,223
|
|
105
|
|
8,119
|
|
557
|
|
33,028
|
|
394
|
|
50,927
|
|
690
|
|
11,094
|
|
404
|
|
14,762
|
|
||||||||||||
|
2016
|
408
|
|
21,869
|
|
108
|
|
8,280
|
|
499
|
|
30,675
|
|
400
|
|
51,784
|
|
709
|
|
11,410
|
|
395
|
|
15,407
|
|
||||||||||||
|
2017
|
412
|
|
22,542
|
|
107
|
|
8,264
|
|
498
|
|
30,642
|
|
410
|
|
53,088
|
|
731
|
|
11,770
|
|
363
|
|
15,260
|
|
||||||||||||
|
2018
|
424
|
|
23,134
|
|
106
|
|
8,305
|
|
465
|
|
29,824
|
|
410
|
|
53,082
|
|
778
|
|
12,448
|
|
378
|
|
15,990
|
|
||||||||||||
|
|
China
|
India
|
Japan
|
Mexico
(3)
|
United
Kingdom
|
Total Segment
|
||||||||||||||||||||||||||||||
|
Fiscal Year
|
Unit
Count
|
Square
Feet
|
Unit
Count
|
Square
Feet
|
Unit
Count
|
Square
Feet
|
Unit
Count
|
Square
Feet
|
Unit
Count
|
Square
Feet
|
Unit
Count
|
Square
Feet
|
||||||||||||||||||||||||
|
Balance forward
|
393
|
|
65,801
|
|
20
|
|
1,083
|
|
438
|
|
24,448
|
|
1,988
|
|
88,833
|
|
565
|
|
34,810
|
|
5,783
|
|
345,673
|
|
||||||||||||
|
2014
|
405
|
|
67,205
|
|
20
|
|
1,083
|
|
438
|
|
24,489
|
|
2,199
|
|
94,900
|
|
576
|
|
35,416
|
|
6,107
|
|
358,207
|
|
||||||||||||
|
2015
|
411
|
|
68,269
|
|
20
|
|
1,083
|
|
431
|
|
24,429
|
|
2,290
|
|
98,419
|
|
592
|
|
36,277
|
|
6,290
|
|
367,630
|
|
||||||||||||
|
2016
|
432
|
|
71,724
|
|
21
|
|
1,146
|
|
346
|
|
22,551
|
|
2,360
|
|
100,308
|
|
621
|
|
37,044
|
|
6,299
|
|
372,198
|
|
||||||||||||
|
2017
|
439
|
|
73,172
|
|
20
|
|
1,091
|
|
341
|
|
21,921
|
|
2,411
|
|
101,681
|
|
631
|
|
37,338
|
|
6,363
|
|
376,769
|
|
||||||||||||
|
2018
|
443
|
|
73,615
|
|
20
|
|
1,091
|
|
336
|
|
21,181
|
|
2,358
|
|
97,024
|
|
642
|
|
37,587
|
|
6,360
|
|
373,281
|
|
||||||||||||
|
(1)
|
"Unit Count" includes retail stores, wholesale clubs and other, which includes drugstores and convenience stores. Walmart International unit counts, with the exception of Canada, are stated as of December 31, to correspond with the fiscal year end of the related geographic market. Canada unit counts and square footage are stated as of January 31. For the balance forward, all country balances are stated as of the end of fiscal year 2013.
|
|
(2)
|
"Square Feet" columns are reported in thousands.
|
|
(3)
|
All periods presented exclude units and square feet for the Vips restaurant business. The Company completed the sale of the Vips restaurant business in fiscal 2015.
|
Unit counts
(1)
as of
January 31, 2018
for Walmart International are summarized by major category for each geographic market as follows:
|
Geographic Market
|
Retail
|
Wholesale
|
Other
(2)
|
Total
|
||||||||
|
Africa
(3)
|
335
|
|
89
|
|
—
|
|
424
|
|
||||
|
Argentina
|
106
|
|
—
|
|
—
|
|
106
|
|
||||
|
Brazil
|
380
|
|
70
|
|
15
|
|
465
|
|
||||
|
Canada
|
410
|
|
—
|
|
—
|
|
410
|
|
||||
|
Central America
(4)
|
778
|
|
—
|
|
—
|
|
778
|
|
||||
|
Chile
|
373
|
|
5
|
|
—
|
|
378
|
|
||||
|
China
|
424
|
|
19
|
|
—
|
|
443
|
|
||||
|
India
|
—
|
|
20
|
|
—
|
|
20
|
|
||||
|
Japan
|
336
|
|
—
|
|
—
|
|
336
|
|
||||
|
Mexico
|
2,186
|
|
162
|
|
10
|
|
2,358
|
|
||||
|
United Kingdom
|
617
|
|
—
|
|
25
|
|
642
|
|
||||
|
Total
|
5,945
|
|
365
|
|
50
|
|
6,360
|
|
||||
|
(1)
|
Walmart International unit counts, with the exception of Canada, are stated as of December 31,
2017
, to correspond with the balance sheet date of the related geographic market. Canada unit counts are stated as of
January 31, 2018
.
|
|
(2)
|
Other includes drug stores and convenience stores.
|
|
(3)
|
Africa unit counts by country are Botswana (
11
), Ghana (
2
), Kenya (
1
), Lesotho (
3
), Malawi (
2
), Mozambique (
5
), Namibia (
4
), Nigeria (
5
), South Africa (
382
), Swaziland (
1
), Tanzania (
1
), Uganda (
1
) and Zambia (
6
).
|
|
(4)
|
Central America unit counts by country are Costa Rica (
247
), El Salvador (
95
), Guatemala (
238
), Honduras (
103
) and Nicaragua (
95
).
|
Digital.
Walmart International operates eCommerce websites in numerous countries. Customers have access through our eCommerce websites and, in countries where available, mobile commerce applications to a broad assortment of merchandise and services, both of which vary by country. Our omni-channel offerings include capabilities like "Click & Collect" in the United Kingdom and our grocery pick-up and delivery business in several other markets.
Merchandise.
The merchandising strategy for Walmart International is similar to that of our operations in the U.S. in terms of the breadth and scope of merchandise offered for sale. While brand name merchandise accounts for a majority of our sales, we have both leveraged U.S. private brands and developed market specific private brands to serve our customers with high quality, lower priced items. Along with the private brands we market globally, such as "Equate," "George," "Great Value," "Holiday Time," "Mainstays," "Ol' Roy" and "Parent's Choice," our international markets have developed market specific brands including "Aurrera," "Cambridge," "Chosen by You" and "Extra Special." In addition, we have developed relationships with
11
regional and local suppliers in each market to ensure reliable sources of quality merchandise that is equal to national brands at low prices.
Operations.
The hours of operation for operating units in Walmart International vary by country and by individual markets within countries, depending upon local and national ordinances governing hours of operation. Operating units in each country accept a variety of payment methods.
Seasonal Aspects of Operations.
Walmart International's business is seasonal to a certain extent. Historically, the segment's highest sales volume and operating income have occurred in the fourth quarter of our fiscal year. The seasonality of the business varies by country due to different national and religious holidays, festivals and customs, as well as different weather patterns.
Competition.
Walmart International
competes with both physical retailers who operate department, drug, discount, variety and specialty stores, supermarkets, hypermarkets and supercenter-type stores, wholesale clubs, home-improvement stores, specialty electronics stores, cash & carry operations and convenience stores, and digital retailers, as well as catalog businesses.
We also operate, on a limited basis, consumer credit operations. We compete with others for desirable sites for new or relocated units. Our ability to develop, open and operate units at the right locations and to deliver a customer-centric experience that seamlessly integrates digital and physical shopping determines, to a large extent, our competitive position in the markets in which Walmart International operates. We believe price leadership is a critical part of our business model and we continue to focus on moving our markets towards an EDLP approach. Additionally, our ability to operate food departments effectively has a significant impact on our competitive position in the markets where we operate. In the markets in which we have eCommerce websites or mobile commerce applications, those websites and applications help differentiate us from our competitors and help us compete with other retailers for customers and their purchases, both in our digital and physical retail operations.
Distribution.
We utilize a total of
188
distribution facilities located in Argentina, Brazil, Canada, Central America, Chile, China, Japan, Mexico, South Africa and the United Kingdom. Through these facilities, we process and distribute both imported and domestic products to the operating units of the Walmart International segment. During fiscal
2018
, approximately
83%
of Walmart International's purchases passed through these distribution facilities. Suppliers ship the balance of Walmart International's purchases directly to our stores in the various markets in which we operate. The following table provides further details of our international distribution facilities, including 17 dedicated eCommerce fulfillment centers, as of December 31, 2017, with the exception of distribution facilities in Canada, which are stated as of
January 31, 2018
:
|
Owned and Operated
|
Owned and Third Party Operated
|
Leased and Operated
|
Third Party Owned and Operated
|
Total
|
||||||
|
International distribution facilities
|
43
|
12
|
87
|
46
|
188
|
|||||
We ship merchandise purchased by customers on our eCommerce websites and through our mobile commerce applications by a number of methods from multiple locations including from our dedicated eCommerce fulfillment centers.
Sam's Club Segment
The Sam's Club segment operates membership-only warehouse clubs, as well as samsclub.com, in the U.S. and had net sales of
$59.2 billion
,
$57.4 billion
and
$56.8 billion
for fiscal
2018
,
2017
and
2016
, respectively. During the most recent fiscal year, no single club location accounted for as much as 1% of total Company net sales.
Membership.
Beginning in the year ending January 31, 2019 ("fiscal 2019"), Sam's Club simplified the membership program. The following two options are available to members:
|
Membership Type
|
|||
|
Plus
|
Club
|
||
|
Annual Membership Fee
|
$100
|
$45
|
|
|
Number of Add-on Memberships ($40 each)
|
Up to 16
|
Up to 8
|
|
|
Eligible for Cash Rewards
|
Yes
|
No
|
|
|
Eligible for Free Shipping
|
Yes
|
No
|
|
All memberships include a spouse/household card at no additional cost. Plus Members are eligible for Cash Rewards, which is a benefit that provides $10 for every $500 in qualifying Sam's Club purchases up to a $500 cash reward annually. The amount earned can be used for purchases, membership fees or redeemed for cash. Plus Members are also eligible for Free Shipping on the vast majority of merchandise available online, with no minimum order size. Free Shipping is yet another example of creating a new Sam's Club for our members.
12
Physical.
As a membership-only warehouse club, Sam's Club facility sizes generally range between
94,000
and
168,000
square feet, with an average size of approximately
134,000
square feet.
The following table provides the retail unit count and retail square feet for the fiscal years shown
:
|
Fiscal Year
|
Opened
|
Closed
|
Total
(1)
|
Square
Feet
(1)
|
||||||||
|
Balance forward
|
620
|
|
82,653
|
|
||||||||
|
2014
|
12
|
|
—
|
|
632
|
|
84,382
|
|
||||
|
2015
|
16
|
|
(1
|
)
|
647
|
|
86,510
|
|
||||
|
2016
|
8
|
|
—
|
|
655
|
|
87,552
|
|
||||
|
2017
|
9
|
|
(4
|
)
|
660
|
|
88,376
|
|
||||
|
2018
|
4
|
|
(67
|
)
|
597
|
|
80,068
|
|
||||
|
(1)
|
"Total" and "Square Feet" columns are as of January 31 for the fiscal years shown. Retail square feet are reported in thousands.
|
Digital.
Sam's Club provides its members access to a broad assortment of merchandise, including products not found in our clubs, and services online at samsclub.com and through our mobile commerce applications. Samsclub.com experiences on average 20.4 million unique visitors a month and offers access to approximately 59,000 SKUs providing the member the option of delivery direct-to-home or to the club through services such as "Club Pickup." Digital retail supports our physical clubs with capabilities like "Scan and Go," a mobile checkout and payment solution, which allows members to bypass the checkout line.
Merchandise.
Sam's Club offers merchandise in the following five merchandise categories:
|
•
|
Grocery and consumables includes dairy, meat, bakery, deli, produce, dry, chilled or frozen packaged foods, alcoholic and nonalcoholic beverages, floral, snack foods, candy, other grocery items, health and beauty aids, paper goods, laundry and home care, baby care, pet supplies and other consumable items;
|
|
•
|
Fuel and other categories consists of gasoline stations, tobacco, tools and power equipment, and tire and battery centers;
|
|
•
|
Home and apparel includes home improvement, outdoor living, grills, gardening, furniture, apparel, jewelry, housewares, toys, seasonal items, mattresses and small appliances;
|
|
•
|
Technology, office and entertainment includes electronics, wireless, software, video games, movies, books, music, office supplies, office furniture, photo processing and third-party gift cards; and
|
|
•
|
Health and wellness includes pharmacy, optical and hearing services and over-the-counter drugs.
|
The Member's Mark brand continues to expand assortment and deliver member value. In fiscal
2018
, Member's Mark sales exceeded $10 billion, driven by growth in grocery, seasonal items and apparel. The percentage of net sales for Sam's Club, including eCommerce sales, by merchandise category, was as follows for fiscal
2018
,
2017
and
2016
:
|
|
Fiscal Years Ended January 31,
|
|||||
|
MERCHANDISE CATEGORY
|
2018
|
2017
|
2016
|
|||
|
Grocery and consumables
|
58%
|
59%
|
59%
|
|||
|
Fuel and other categories
|
21%
|
20%
|
20%
|
|||
|
Home and apparel
|
9%
|
9%
|
9%
|
|||
|
Technology, office and entertainment
|
6%
|
6%
|
7%
|
|||
|
Health and wellness
|
6%
|
6%
|
5%
|
|||
|
Total
|
100%
|
100%
|
100%
|
|||
Operations.
Operating hours for Sam's Clubs are generally Monday through Friday from 10:00 a.m. to 8:30 p.m., Saturday from 9:00 a.m. to 8:30 p.m. and Sunday from 10:00 a.m. to 6:00 p.m. Additionally, all club locations offer Plus Members the ability to shop before the regular operating hours Monday through Saturday, starting at 7:00 a.m. A variety of payment methods are accepted at our clubs and online, including the co-branded Sam's Club "Cash Back" MasterCard.
Seasonal Aspects of Operations.
Sam's Club's business is seasonal to a certain extent due to calendar events and national and religious holidays, as well as different weather patterns. Historically, its highest sales volume and segment operating income have occurred in the fiscal quarter ending January 31.
Competition.
Sam's Club competes with other membership-only warehouse clubs, the largest of which is Costco, as well as with discount retailers, retail and wholesale grocers, general merchandise wholesalers and distributors, gasoline stations as well as digital retailers and catalog businesses. At Sam's Club, we provide value at members-only prices, a quality merchandise assortment, and bulk sizing to serve both our Plus and Club members. Our eCommerce website and mobile commerce
13
applications have increasingly become important factors in our ability to compete with other membership-only warehouse clubs.
Distribution.
During fiscal
2018
, approximately
68%
of Sam's Club's non-fuel purchases were shipped from Sam's Club's
22
dedicated distribution facilities located strategically throughout the U.S., or from some of the Walmart U.S. segment's distribution facilities, which service the Sam's Club segment for certain items. Suppliers shipped the balance of the Sam's Club segment's purchases directly to Sam's Club locations. The following table provides further details of our dedicated distribution facilities, including two dedicated eCommerce fulfillment centers and two dedicated import facilities, as of
January 31, 2018
:
|
Owned and Operated
|
Owned and Third Party Operated
|
Leased and Operated
|
Third Party Owned and Operated
|
Total
|
||||||
|
Sam's Club distribution facilities
|
3
|
3
|
3
|
13
|
22
|
|||||
The principal focus of Sam's Club's distribution operations is on cross-docking merchandise, while stored inventory is minimized. Cross-docking is a distribution process under which shipments are directly transferred from inbound to outbound trailers. Shipments typically spend less than 24 hours in a cross-dock facility, and sometimes less than an hour.
Sam's Club uses a combination of our private truck fleet, as well as common carriers, to transport non-perishable merchandise from distribution facilities to clubs. The segment contracts with common carriers to transport perishable grocery merchandise from distribution facilities to clubs.
Sam's Club ships merchandise purchased by members on samsclub.com and through its mobile commerce applications by a number of methods from its dedicated eCommerce fulfillment centers and other distribution centers.
Other Segment Information
Certain financial information relating to our segments is included in
Part II, Item 7
under the caption "Management's Discussion and Analysis of Financial Condition and Results of Operations" and in
Note 15
to our Consolidated Financial Statements.
Note 15
also includes information regarding total revenues and long-lived assets aggregated by our U.S. and non-U.S. operations.
Intellectual Property
We regard our trademarks, service marks, copyrights, patents, domain names, trade dress, trade secrets, proprietary technologies, and similar intellectual property as important to our success, and with respect to our associates, customers and others, we rely on trademark, copyright, and patent law, trade-secret protection, and confidentiality and/or license agreements to protect our proprietary rights. We have registered, or applied for the registration of, a number of U.S. and international domain names, trademarks, service marks and copyrights. Additionally, we have filed U.S. and international patent applications covering certain of our proprietary technology. We have licensed in the past, and expect that we may license in the future, certain of our proprietary rights to third parties.
Suppliers and Supply Chain
As a retailer and warehouse club operator, we utilize a global supply chain that includes over 100,000 suppliers located around the world, including in the United States, from whom we purchase the merchandise that we sell in our stores, clubs and online. In many instances, we purchase merchandise from producers located near the stores and clubs in which such merchandise will be sold, particularly products in the "fresh" category. Our purchases may represent a significant percentage of a number of our suppliers' annual sales, and the volume of product we acquire from many suppliers allows us to obtain favorable pricing from such suppliers. Our suppliers are subject to standards of conduct, including requirements that they comply with local labor laws, local worker safety laws and other applicable laws. Our ability to acquire from our suppliers the assortment and volume of products we wish to offer to our customer, to receive those products within the required time through our supply chain and to distribute those products to our stores and clubs determines, in part, our in-stock levels in our stores and clubs and the attractiveness of our merchandise assortment we offer to our customers and members.
Employees
As of the end of fiscal
2018
, Walmart Inc. and our subsidiaries employed approximately
2.3 million
employees ("associates") worldwide, with
1.5 million
associates in the U.S. and
0.8 million
associates internationally. Similar to other retailers, the Company has a large number of part-time, hourly or non-exempt associates. We believe our relationships with our associates are good and are continuing to improve. A large number of associates turn over each year, although Walmart U.S. turnover has been improving in fiscal 2018 as a result of our focus on increasing wages and providing improved tools, technology and training to associates.
14
Certain information relating to retirement-related benefits we provide to our associates is included in
Note 12
to our Consolidated Financial Statements.
In addition to retirement-related benefits, in the U.S., we offer a broad range of Company-paid benefits to our associates. These include a store discount card or Sam's Club membership, bonuses based on Company performance, matching a portion of purchases of our stock by associates through our Associate Stock Purchase Plan and life insurance. In addition to the health-care benefits for eligible full-time and part-time associates in the U.S., as announced in January 2018, we expanded maternity leave and implemented a new paid parental leave program to all full-time associates. We also introduced a $5,000 benefit to assist eligible associates with adoption.
Similarly, in the operations outside the U.S., we provide a variety of associate benefits that vary based on customary local practices and statutory requirements.
15
Executive Officers of the Registrant
The following chart names the executive officers of the Company as of the date of the filing of this Annual Report on Form 10-K with the SEC, each of whom is elected by and serves at the pleasure of the Board of Directors. The business experience shown for each officer has been his or her principal occupation for at least the past five years, unless otherwise noted.
|
Name
|
Business Experience
|
Current
Position
Held Since
|
Age
|
|||
|
Daniel J. Bartlett
|
Executive Vice President, Corporate Affairs, effective June 2013. From November 2007 to June 2013, he served as the Chief Executive Officer and President of U.S. Operations at Hill & Knowlton, Inc., a public relations company.
|
2013
|
46
|
|||
|
M. Brett Biggs
|
Executive Vice President and Chief Financial Officer, effective January 1, 2016. From January 2014 to December 2015, he served as Executive Vice President and Chief Financial Officer of Walmart International. From January 2013 to January 2014, he was Executive Vice President and Chief Financial Officer of Walmart U.S.
|
2016
|
49
|
|||
|
Jacqueline P. Canney
|
Executive Vice President, Global People, effective August 3, 2015. From September 2003 to July 2015, she served as the Managing Director of Global Human Resources at Accenture plc., a global management consulting, technology services and outsourcing company.
|
2015
|
50
|
|||
|
David M. Chojnowski
|
Senior Vice President and Controller effective January 1, 2017. From October 2014 to January 2017, he served as Vice President and Controller, Walmart U.S. From January 2013 to October 2014, he served as Vice President, Finance Transformation, of Walmart International.
|
2017
|
48
|
|||
|
Gregory Foran
|
Executive Vice President, President and Chief Executive Officer, Walmart U.S. effective August 2014. From May 2014 to August 2014, he served as President and Chief Executive Officer for the Walmart Asia region. From March 2012 to May 2014, he served as President and Chief Executive Officer of Walmart China.
|
2014
|
56
|
|||
|
John Furner
|
Executive Vice President, President and Chief Executive Officer, Sam's Club, effective February 1, 2017. From October 2015 to January 2017, he served as Executive Vice President and Chief Merchandising Officer of Sam's Club. From January 2013 to October 2015, he served as Senior Vice President and Chief Merchandising Officer of Walmart China.
|
2017
|
43
|
|||
|
Marc Lore
|
Executive Vice President, President and Chief Executive Officer, U.S. eCommerce, effective September 2016. From April 2014 to September 2016, he served as President and Chief Executive Officer of Jet.com, Inc. From January 2005 to July 2013, he served as Chief Executive Officer of Quidsi, Inc., an eCommerce retailer that became a wholly-owned subsidiary of Amazon.com, Inc. in April 2011.
|
2016
|
46
|
|||
|
Judith McKenna
|
Executive Vice President, President and Chief Executive Officer, Walmart International, effective February 1, 2018. From February 2015 to January 2018, she served as Executive Vice President and Chief Operating Officer of Walmart U.S. Prior to that position, she served as Executive Vice President and Chief Development Officer for Walmart U.S. from April 2014 to February 2015; as Executive Vice President, Strategy and Development, for Walmart International, from April 2013 to April 2014; and as Chief Operating Officer of Asda Group Limited, the Company's subsidiary in the United Kingdom, from July 2011 to April 2013.
|
2018
|
51
|
|||
|
C. Douglas McMillon
|
President and Chief Executive Officer, effective February 1, 2014. From February 2009 to January 2014, he served as Executive Vice President, President and Chief Executive Officer, Walmart International.
|
2014
|
51
|
|||
New Executive Officer
Effective April 2, 2018, Rachel Brand, age 44, will join the Company as Executive Vice President, Global Governance and Corporate Secretary. From May 2017 to February 2018, she served as Associate Attorney General in the United States Department of Justice. From January 2017 to May 2017, she was an Associate Professor of Law at George Mason University Antonin Scalia Law School. Prior to that position, she served as a Board Member on the Privacy and Civil Liberties Oversight Board of the U.S. government from August 2012 to February 2017.
16
Our Website and Availability of SEC Reports and Other Information
Our corporate website is located at www.stock.walmart.com. We file with or furnish to the SEC Annual Reports on Form 10-K, Quarterly Reports on Form 10-Q, Current Reports on Form 8-K, amendments to those reports, proxy statements and annual reports to shareholders, and, from time to time, other documents. The reports and other documents filed with or furnished to the SEC are available to investors on or through our corporate website free of charge as soon as reasonably practicable after we electronically file them with or furnish them to the SEC. The SEC maintains a website that contains reports, proxy and information statements and other information regarding issuers, such as the Company, that file electronically with the SEC. The address of that website is www.sec.gov. In addition, the public may read and copy any of the materials we file with the SEC at the SEC's Public Reference Room at 100 F Street, NE, Washington DC 20549. The public may obtain information on the operation of the Public Reference Room by calling the SEC at 1-800-SEC-0330. Our SEC filings, our Code of Ethics for our CEO and Senior Financial Officers and our Statement of Ethics can be found on our website at www.stock.walmart.com. These documents are available in print to any shareholder who requests a copy by writing or calling our Investor Relations Department, which is located at our principal offices.
A description of any substantive amendment or waiver of Walmart's Code of Ethics for the CEO and Senior Financial Officers or our Statement of Ethics for our chief executive officer, our chief financial officer and our controller, who is our principal accounting officer, will be disclosed on our website at www.stock.walmart.com under the Corporate Governance section. Any such description will be located on our website for a period of 12 months following the amendment or waiver.
|
ITEM 1A.
|
RISK FACTORS
|
The risks described below could materially and adversely affect our business, results of operations, financial condition and liquidity. Our business operations could also be affected by additional factors that apply to all companies operating in the U.S. and globally.
Strategic Risks
General or macro-economic factors, both domestically and internationally, may materially adversely affect our financial performance.
General economic conditions and other economic factors, globally or in one or more of the markets we serve, may adversely affect our financial performance. Higher interest rates, lower or higher prices of petroleum products, including crude oil, natural gas, gasoline, and diesel fuel, higher costs for electricity and other energy, weakness in the housing market, inflation, deflation, increased costs of essential services, such as medical care and utilities, higher levels of unemployment, decreases in consumer disposable income, unavailability of consumer credit, higher consumer debt levels, changes in consumer spending and shopping patterns, fluctuations in currency exchange rates, higher tax rates, imposition of new taxes or other changes in tax laws, changes in healthcare laws, other regulatory changes, the imposition of measures that create barriers to or increase the costs associated with international trade, overall economic slowdown and other economic factors in the U.S. or in any of the other markets in which we operate could adversely affect consumer demand for the products we sell in the U.S. or such other markets, change the mix of products we sell to one with a lower average gross margin, cause a slowdown in discretionary purchases of goods, adversely affect our net sales and result in slower inventory turnover and greater markdowns of inventory, or otherwise materially adversely affect our operations and operating results.
In addition, the economic factors listed above, any other economic factors or circumstances resulting in higher transportation, labor, insurance or healthcare costs or commodity prices, and other economic factors in the U.S. and other countries in which we operate can increase our cost of sales and operating, selling, general and administrative expenses and otherwise materially adversely affect our operations and operating results.
The economic factors that affect our operations may also adversely affect the operations of our suppliers, which can result in an increase in the cost to us of the goods we sell to our customers or, in more extreme cases, in certain suppliers not producing goods in the volume typically available to us for sale.
We face strong competition from other retailers and wholesale club operators (whether through physical retail, digital retail or the integration of both), which could materially adversely affect our financial performance.
Each of our segments competes for customers, employees, store and club sites, digital prominence, products and services and in other important aspects of its business with many other local, regional, national and global physical and digital retailers, wholesale club operators and retail intermediaries.
Our Walmart U.S. segment
competes with both physical retailers operating discount, department, retail and wholesale grocers, drug, dollar, variety and specialty stores, supermarkets, hypermarkets and supercenter-type stores, and digital retailers, as well as catalog businesses.
Our Sam's Club segment competes with other wholesale club operators, as well as discount retailers, retail and wholesale grocers, general merchandise wholesalers and distributors, gasoline stations, as well as digital retailers and catalog businesses.
17
Our Walmart International segment
competes with both physical retailers who operate department, drug, discount, variety and specialty stores, supermarkets, hypermarkets and supercenter-type stores, wholesale clubs, home-improvement stores, specialty electronics stores, cash & carry operations and convenience stores, and digital retailers, as well as catalog businesses.
We compete in a variety of ways, including the prices at which we sell our merchandise, merchandise selection and availability, services offered to customers, location, store hours, in-store amenities, the shopping convenience and overall shopping experience we offer, the attractiveness and ease of use of our digital platforms, cost and speed of and options for delivery to customers of merchandise purchased through our digital platforms or through the
omni-channel integration of
our
physical and digital retail
operations.
A failure to respond effectively to competitive pressures and changes in the retail markets or delays or failure in execution of our strategy could materially adversely affect our financial performance. See "
Item 1. Business
" above for additional discussion of the competitive situation of each of our reportable segments.
Certain segments of the retail industry are undergoing consolidation, which could result in increased competition and significantly alter the dynamics of the retail marketplace. Such consolidation, or other business combinations or alliances, may result in competitors with greatly improved financial resources, improved access to merchandise, greater market penetration than they previously enjoyed and other improvements in their competitive positions. Such business combinations or alliances could result in the provision of a wider variety of products and services at competitive prices by such consolidated or aligned companies, which could adversely affect our financial performance.
We may not timely identify or effectively respond to consumer trends or preferences, which could negatively affect our relationship with our customers, demand for the products and services we sell, our market share and the growth of our business.
It is difficult to predict consistently and successfully the products and services our customers will demand and changes in their shopping patterns. The success of our business depends in part on how accurately we predict consumer demand, availability of merchandise, the related impact on the demand for existing products and the competitive environment, whether for customers purchasing products at our stores and clubs, through our digital platforms or through the combination of both. Price transparency, assortment of products, customer experience, convenience and the speed and cost of shipping are of primary importance to customers and continue to increase in importance, particularly as a result of digital tools and social media available to consumers and the choices available to consumers for purchasing products. Our failure to adequately or effectively respond to changing consumer tastes, preferences and shopping patterns, or any other failure on our part to timely identify or effectively respond to changing consumer tastes, preferences and shopping patterns could negatively affect our relationship with our customers, the demand for the products we sell, our market share and the growth of our business.
Failure to grow our eCommerce business through the
omni-channel integration of
physical and digital retail
or otherwise, and the cost of our increasing eCommerce investments, may materially adversely affect our market position, net sales and financial performance.
The retail business is rapidly evolving and consumers are increasingly embracing shopping online and through mobile commerce applications. As a result, the portion of total consumer expenditures with retailers and wholesale clubs occurring through digital platforms is increasing and the pace of this increase could accelerate.
Our strategy, which includes investments in eCommerce, technology, store remodels and other customer initiatives may not adequately or effectively allow us to grow our eCommerce business, increase comparable store sales, maintain or grow our overall market position or otherwise offset the impact on the growth of our business of a moderated pace of new store and club openings. The success of this strategy will depend in large measure on our ability to build and deliver a seamless omni-channel shopping experience and is further subject to the risks we face as outlined in this
Item 1A
. As a result, our market position, net sales and financial performance could be adversely affected. In addition, a greater concentration of eCommerce sales could result in a reduction in the amount of traffic in our stores and clubs, which would, in turn, reduce the opportunities for cross-store or cross-club sales of merchandise that such traffic creates and could reduce our sales within our stores and clubs and materially adversely affect the financial performance of the physical retail side of our operations.
Furthermore, the cost of certain eCommerce and technology investments, including any operating losses incurred by acquired eCommerce businesses will adversely impact our financial performance in the short-term and may adversely impact our financial performance over the longer term.
The performance of strategic alliances to support the expansion of our Walmart International segment could materially adversely affect our financial performance.
Our Walmart International segment may enter into strategic alliances in the countries in which we have existing operations or in other markets to expand our digital retail operations, physical retail operations or both. Any strategic alliance may not generate the level of eCommerce or other sales we anticipate when entering into that alliance or may otherwise adversely impact our
18
business and competitive position relative to the results we could have achieved in the absence of such alliance. In addition, any investment we make in connection with a strategic alliance could materially adversely affect our financial performance.
Operational Risks
Natural disasters, changes in climate, and geo-political events could materially adversely affect our financial performance.
The occurrence of one or more natural disasters, such as hurricanes, tropical storms, floods, fires, earthquakes, tsunamis, cyclones, typhoons, weather conditions such as major or extended winter storms, droughts and tornadoes, whether as a result of climate change or otherwise, severe changes in climate and geo-political events, such as war, civil unrest or terrorist attacks in a country in which we operate or in which our suppliers are located could adversely affect our operations and financial performance.
Such events could result in physical damage to, or the complete loss of, one or more of our properties, the closure of one or more stores, clubs and distribution facilities, the lack of an adequate work force in a market, the inability of customers and associates to reach or have transportation to our stores and clubs affected by such events, the evacuation of the populace from areas in which our stores, clubs and distribution facilities are located, the unavailability of our digital platforms to our customers, changes in the purchasing patterns of consumers and in consumers' disposable income, the temporary or long-term disruption in the supply of products from some local and overseas suppliers, the disruption in the transport of goods from overseas, the disruption or delay in the delivery of goods to our distribution facilities or stores within a country in which we are operating, the reduction in the availability of products in our stores, the disruption of utility services to our stores and our facilities, and disruption in our communications with our stores.
We bear the risk of losses incurred as a result of physical damage to, or destruction of, any stores, clubs and distribution facilities, loss or spoilage of inventory and business interruption caused by such events. These events and their impacts could otherwise disrupt and adversely affect our operations in the areas in which they occur and could materially adversely affect our financial performance.
Risks associated with the suppliers from whom our products are sourced could materially adversely affect our financial performance.
The products we sell are sourced from a wide variety of domestic and international suppliers. Global sourcing of many of the products we sell is an important factor in our financial performance. We expect all of our suppliers to comply with applicable laws, including labor, safety and environmental laws, and to otherwise meet our required supplier standards of conduct. Our ability to find qualified suppliers who uphold our standards, and to access products in a timely and efficient manner, is a significant challenge, especially with respect to suppliers located and goods sourced outside the U.S.
Political and economic instability in the countries in which our foreign suppliers and their manufacturers are located, the financial instability of suppliers, suppliers' failure to meet certain of our supplier standards (including our responsible sourcing standards), labor problems experienced by our suppliers and their manufacturers, the availability of raw materials to suppliers, merchandise safety and quality issues, disruption in the transportation of merchandise from the suppliers and manufacturers to our stores, clubs, and other facilities, including as a result of labor slowdowns at any port at which a material amount of merchandise we purchase enters into the U.S., currency exchange rates, transport availability and cost, transport security, inflation and other factors relating to the suppliers and the countries in which they are located are beyond our control.
In addition, the U.S.'s foreign trade policies, tariffs and other impositions on imported goods, trade sanctions imposed on certain countries, the limitation on the importation of certain types of goods or of goods containing certain materials from other countries and other factors relating to foreign trade are beyond our control. These and other factors affecting our suppliers and our access to products could adversely affect our financial performance.
If the products we sell are not safe or otherwise fail to meet our customers' expectations, we could lose customers, incur liability for any injuries suffered by customers using or consuming a product we sell or otherwise experience material adverse effects to our brand, reputation and financial performance.
Our customers count on us to provide them with safe products. Concerns regarding the safety of food and non-food products that we source from our suppliers or that we prepare and then sell could cause customers to avoid purchasing certain products from us, or to seek alternative sources of supply for all of their food and non-food needs, even if the basis for the concern is outside of our control. Any lost confidence on the part of our customers would be difficult and costly to reestablish. As such, any issue regarding the safety of any food or non-food items we sell, regardless of the cause, could adversely affect our brand, reputation and financial performance.
19
We rely extensively on information systems to process transactions, summarize results and manage our business. Disruptions in our systems could harm our ability to conduct our operations.
Given the number of individual transactions we have each year, it is crucial that we maintain uninterrupted operation of our business-critical information systems. Our information systems are subject to damage or interruption from power outages, computer and telecommunications failures, computer viruses, worms, other malicious computer programs, denial-of-service attacks, security breaches (through cyber-attacks from cyber-attackers and sophisticated organizations), catastrophic events such as fires, tornadoes, earthquakes and hurricanes, and usage errors by our associates or contractors. Our information systems are essential to our business operations, including the processing of transactions, management of our associates, facilities, logistics, inventories, physical stores and clubs and our online operations. Our information systems are not fully redundant and if our systems are damaged, breached or cease to function properly, we may have to make a significant investment to repair or replace them, and we may suffer interruptions in our business operations in the interim. Any interruption to our information systems may have a material adverse effect on our business or results of operations. In addition, we are constantly updating our information technology processes and systems. The risk of system disruption is increased when significant system changes are undertaken. If we fail to timely integrate and update our information systems and processes, we may fail to realize the cost savings anticipated to be derived from these initiatives.
If the technology-based systems that give our customers the ability to shop with us online do not function effectively, our operating results, as well as our ability to grow our eCommerce business globally, could be materially adversely affected.
Many of our customers shop with us using our digital platforms, which are a part of our omni-channel sales strategy. Increasingly, customers are using computers, tablets, and smart phones to shop online and through digital platforms with us and with our competitors and to do comparison shopping. We use social media and electronic mail to interact with our customers and as a means to enhance their shopping experience. As a part of our omni-channel sales strategy, in addition to home delivery, we offer "Walmart Pickup," "Pickup Today" and "Club Pickup" and, in a growing number of locations, "Online Grocery" programs under which many products available for purchase online can be picked up by the customer at a local Walmart store or Sam's Club, which provides additional customer traffic at such stores and clubs. Omni-channel retailing is a rapidly evolving part of the retail industry and of our operations in the U.S. (whether through organic growth or eCommerce acquisitions) and in a number of markets in which our Walmart International segment operates.
We must anticipate and meet our customers' changing expectations while adjusting for technology investments and developments in our competitors' operations through focusing on the building and delivery of a seamless shopping experience across all channels by each operating segment. Any failure on our part to provide attractive, user-friendly secure digital platforms that offer a wide assortment of merchandise at competitive prices and with low cost and rapid delivery options and that continually meet the changing expectations of online shoppers and developments in online and digital platform merchandising and related technology could place us at a competitive disadvantage, result in the loss of eCommerce and other sales, harm our reputation with customers, have a material adverse impact on the growth of our eCommerce business globally and have a material adverse impact on our business and results of operations.
Our digital platforms, which are increasingly important to our business and continue to grow in complexity and scope, and the computer and operating systems on which they run, including those applications and systems in our acquired eCommerce businesses, may be subject to cyber-attacks. Those attacks could involve attempts to gain access to one of our eCommerce websites or mobile commerce applications to obtain and make unauthorized use of customers' or members' payment information and related risks discussed below. Such attacks, if successful, can also create denials of service or otherwise disable, degrade or sabotage one or more of our digital platforms and otherwise significantly disrupt our customers' and members' shopping experience. If we are unable to maintain the security of our digital platforms and keep them operating within acceptable parameters, we could suffer loss of sales, reductions in traffic, reputational damage and deterioration of our competitive position and incur liability for any damage to customers whose personal information is unlawfully obtained and used, any of which events could have a material adverse impact on our business and results of operations and impede the execution of our strategy for the growth of our business.
Any failure to maintain the security of the information relating to our company, customers, members, associates and vendors, whether as a result of cybersecurity attacks on our information systems or otherwise, could damage our reputation, result in litigation or other legal actions against us, cause us to incur substantial additional costs, and materially adversely affect our business and operating results.
As do most retailers, we receive and store in our digital information systems certain personal information about our customers and members, and we receive and store personal information concerning our associates and vendors. Some of that information is stored digitally in connection with our digital platforms. We also utilize third-party service providers for a variety of reasons, including, without limitation, for encryption and authentication technology, content delivery to customers and members, back-office support, and other functions. Such providers may have access to information we hold about our customers, members, associates or vendors. In addition, our eCommerce operations depend upon the secure transmission of confidential information over public networks, including information permitting cashless payments.
20
Cyber threats are rapidly evolving and those threats and the means for obtaining access to information in digital and other storage media are becoming increasingly sophisticated. Cyber threats and cyber-attackers can be sponsored by countries or sophisticated criminal organizations or be the work of single "hackers" or small groups of "hackers." Each year, cyber-attackers make numerous attempts to access the information stored in our information systems. As cyber threats evolve, change and become more difficult to detect and successfully defend against, one or more cyber-attacks might defeat our or a third-party service provider's security measures in the future and obtain the personal information of customers, members, associates and vendors.
Associate error or malfeasance, faulty password management or other irregularities may also result in a defeat of our or our third-party service providers' security measures and a breach of our or their information systems. Moreover, hardware, software or applications we use may have inherent defects of design, manufacture or operations or could be inadvertently or intentionally implemented or used in a manner that could compromise information security. We or our third-party service providers may not discover any security breach and loss of information for a significant period of time after the security breach occurs.
Any breach of our security measures or any breach, error or malfeasance of those of our third-party service providers and loss of our confidential information, or any failure by us to comply with applicable privacy and information security laws and regulations, could cause us to incur significant costs to protect any customers, members, associates and vendors whose personal data was compromised and to restore their confidence in us and to make changes to our information systems and administrative processes to address security issues and compliance with applicable laws and regulations.
In addition, such events could be widely publicized and could materially adversely affect our reputation with our customers, members, associates, vendors and shareholders, could harm our competitive position particularly with respect to our eCommerce operations, and could result in a material reduction in our net sales in our eCommerce operations, as well as in our stores thereby materially adversely affecting our operations, net sales, results of operations, financial condition, cash flows and liquidity. Such events could also result in the release to the public of confidential information about our operations and financial condition and performance and could result in litigation or other legal actions against us or the imposition of penalties, fines, fees or liabilities, which may not be covered by our insurance policies. Moreover, a security breach could require us to devote significant management resources to address the problems created by the security breach and to expend significant additional resources to upgrade further the security measures we employ to guard personal information against cyber-attacks and other attempts to access such information and could result in a disruption of our operations, particularly our digital retail operations.
We accept payments using a variety of methods, including cash, checks, credit and debit cards, our private label credit cards and gift cards, and we may offer new payment options over time, which may have information security risk implications. As a retailer accepting debit and credit cards for payment, we are subject to various industry data protection standards and protocols, such as payment network security operating guidelines and the Payment Card Industry Data Security Standard. We cannot be certain that the security measures we maintain to protect all of our information technology systems are able to prevent, contain or detect any cyber-attacks, cyber terrorism, or security breaches from known cyber-attacks or malware that may be developed in the future. To the extent that any cyber-attack or incursion in our or one of our third-party service provider's information systems results in the loss, damage or misappropriation of information, we may be materially adversely affected by claims from customers, financial institutions, regulatory authorities, payment card networks and others. In certain circumstances, payment card association rules and obligations to which we are subject under our contracts with payment card processors make us liable to payment card issuers if information in connection with payment cards and payment card transactions that we hold is compromised, which liabilities could be substantial. In addition, the cost of complying with stricter and more complex data privacy, data collection and information security laws and standards could be significant to us.
Changes in the results of our retail pharmacy business could adversely affect our overall results of operations, cash flows and liquidity.
Walmart has retail pharmacy operations in our Walmart U.S. and Sam's Club segments and a large majority of the retail pharmacy net sales are generated by filling prescriptions for which we receive payment through established contractual relationships with third-party payers and payment administrators, such as private insurers, governmental agencies and pharmacy benefit managers ("PBMs").
Our retail pharmacy operations are subject to numerous risks, including: reductions in the third-party reimbursement rates for drugs; changes in our payer mix (i.e., shifts in the relative distribution of our pharmacy customers across drug insurance plans and programs toward plans and programs with less favorable reimbursement terms); changes in third party payer drug formularies (i.e., the schedule of prescription drugs approved for reimbursement or which otherwise receive preferential coverage treatment); growth in, and our participation in or exclusion from, exclusive and preferred pharmacy network arrangements operated by PBMs and/or any insurance plan or program; increases in the prices we pay for brand name and generic prescription drugs we sell; increases in the administrative burdens associated with seeking third-party reimbursement; changes in the frequency with which new brand name pharmaceuticals become available to consumers; introduction of lower cost generic drugs as substitutes for existing brand name drugs for which there was no prior generic drug competition; changes in drug mix (i.e., the relative distribution of drugs customers purchase at our pharmacies between brands and generics); changes
21
in the health insurance market generally; changes in the scope of or the elimination of Medicare Part D or Medicaid drug programs; increased competition from other retail pharmacy operations; further consolidation among third party payers, PBMs or purchasers of drugs; overall economic conditions and the ability of our pharmacy customers to pay for drugs prescribed for them to the extent the costs are not reimbursed by a third party; failure to meet any performance or incentive thresholds to which our level of third party reimbursement may be subject; and changes in the regulatory environment for the retail pharmacy industry and the pharmaceutical industry, including as a result of restrictions on the further implementation of or the repeal of the Patient Protection and Affordable Care Act or the enactment and implementation of a law replacing such act, and other changes in laws, rules and regulations that affect our retail pharmacy business.
If the supply of certain pharmaceuticals provided by one or more of our vendors were to be disrupted for any reason, our pharmacy operations could be severely affected until at least such time as we could obtain a new supplier for such pharmaceuticals. Any such disruption could cause reputational damage and result in a significant number of our pharmacy customers transferring their prescriptions to other pharmacies.
One or a combination of such factors may adversely affect the volumes of brand name and generic pharmaceuticals we sell, our cost of sales associated with our retail pharmacy operations, and the net sales and gross margin of those operations, result in the loss of cross-store or cross-club selling opportunities and, in turn, adversely affect our overall net sales, other results of operations, cash flows and liquidity.
Our failure to attract and retain qualified associates, increases in wage and benefit costs, changes in laws and other labor issues could materially adversely affect our financial performance.
Our ability to continue to conduct and expand our operations depends on our ability to attract and retain a large and growing number of qualified associates globally. Our ability to meet our labor needs, including our ability to find qualified personnel to fill positions that become vacant at our existing stores, clubs and distribution centers, while controlling our associate wage and related labor costs, is generally subject to numerous external factors, including the availability of a sufficient number of qualified persons in the work force of the markets in which we operate, unemployment levels within those markets, prevailing wage rates, changing demographics, health and other insurance costs and adoption of new or revised employment and labor laws and regulations. If we are unable to locate, to attract or to retain qualified personnel, the quality of service we provide to our customers may decrease and our financial performance may be adversely affected.
In addition, if our costs of labor or related costs increase for other reasons or if new or revised labor laws, rules or regulations or healthcare laws are adopted or implemented that further increase our labor costs, our financial performance could be materially adversely affected.
Financial Risks
Fluctuations in foreign exchange rates may materially adversely affect our financial performance and our reported results of operations.
Our operations in countries other than the U.S. are conducted primarily in the local currencies of those countries. Our consolidated financial statements are denominated in U.S. dollars, and to prepare those financial statements we must translate the amounts of the assets, liabilities, net sales, other revenues and expenses of our operations outside of the U.S. from local currencies into U.S. dollars using exchange rates for the current period. In recent years, fluctuations in currency exchange rates that were unfavorable to us coupled with such translations have had a material adverse effect on our reported results of operations.
As a result of such translations, fluctuations in currency exchange rates from period-to-period that are unfavorable to us may also result in our consolidated financial statements reflecting significant adverse period-over-period changes in our financial performance or reflecting a period-over-period improvement in our financial performance that is not as robust as it would be without such fluctuations in the currency exchange rates. Such unfavorable currency exchange rate fluctuations will adversely affect the reported performance of our Walmart International operating segment and have a corresponding adverse effect on our reported consolidated results of operations.
We may pay for products we purchase for sale in our stores and clubs around the world with a currency other than the local currency of the country in which the goods will be sold. When we must acquire the currency to pay for such products and the exchange rates for the payment currency fluctuate in a manner unfavorable to us, our cost of sales may increase and we may be unable or unwilling to change the prices at which we sell those goods to address that increase in our costs, with a corresponding adverse effect on our gross profit. Consequently, fluctuations in currency exchange rates may adversely affect our results of operations.
Failure to meet market expectations for our financial performance could adversely affect the market price and volatility of our stock.
We believe that the price of our stock generally reflects high market expectations for our future operating results. Any failure to meet or delay in meeting these expectations, including our comparable store and club sales growth rates, eCommerce growth
22
rates, gross margin, or earnings and earnings per share could cause the market price of our stock to decline, as could changes in our dividend or stock repurchase programs or policies. Additionally, failure of Walmart's performance to match that of other retailers may have a negative effect on the price of our stock.
Legal, Tax, Regulatory, Compliance, Reputational and Other Risks
Our operations subject us to legislative, judicial, accounting, legal, regulatory, tax, political and economic risks and conditions specific to the countries or regions in which we operate, which could materially adversely affect our business or financial performance.
In addition to our U.S. operations, we operate our retail business principally through wholly-owned subsidiaries in Argentina, Brazil, Canada, Chile, China, India, Japan and the United Kingdom and our majority-owned subsidiaries in Africa, Central America and Mexico.
In fiscal 2018, our Walmart U.S. and Sam's Club operating segments generated approximately
76%
of our consolidated net sales. The Federal Government has created the potential for significant changes in trade policies, including tariffs and government regulations affecting trade between the U.S. and other countries where we source many of the products we sell in our stores and clubs. Potential changes which have been discussed include the renegotiation or termination of trade agreements and the imposition of higher tariffs on imports into the U.S. A significant portion of the general merchandise we sell in our U.S. stores and clubs is manufactured in other countries. Any such actions could increase the cost to us of such merchandise (whether imported directly or indirectly) and cause increases in the prices at which we sell such merchandise to our customers, which could materially adversely affect the financial performance of our U.S. operations and our business.
During fiscal 2018, our Walmart International operations generated approximately
24%
of our consolidated net sales. Walmart International's operations in various countries also sources goods and services from other countries. Our future operating results in these countries could be negatively affected by a variety of factors, most of which are beyond our control. These factors include political conditions, including political instability, local and global economic conditions, legal and regulatory constraints, local product safety and environmental laws, tax regulations, local labor laws, anti-money laundering laws and regulations, trade policies, currency regulations, and other matters in any of the countries or regions in which we operate, now or in the future.
Our business and results of operations in the UK may be negatively affected by fluctuations in currency exchange rates, increases in food costs, changes in trade policies, or changes in labor, immigration, tax or other laws resulting from the UK's anticipated exit from the European Union.
Brazilian federal, state and local laws are complex and subject to varying interpretations. Although the Company believes it complies with those laws, the Company's subsidiaries in Brazil are party to a large number of labor claims and non-income tax assessments, which have arisen during the normal course of business in Brazil. These matters are subject to inherent uncertainties and if decided adversely to the Company, could materially adversely affect our financial performance.
The economies of some of the countries in which we have operations have in the past suffered from high rates of inflation and currency devaluations, which, if they occurred again, could adversely affect our financial performance. Other factors which may impact our international operations include foreign trade, monetary and fiscal policies of the U.S. and of other countries, laws, regulations and other activities of foreign governments, agencies and similar organizations, and risks associated with having numerous facilities located in countries which have historically been less stable than the U.S. Additional risks inherent in our international operations generally include, among others, the costs and difficulties of managing international operations, adverse tax consequences and greater difficulty in enforcing intellectual property rights in countries other than the U.S. The various risks inherent in doing business in the U.S. generally also exist when doing business outside of the U.S., and may be exaggerated by the difficulty of doing business in numerous sovereign jurisdictions due to differences in culture, laws and regulations.
In foreign countries in which we have operations, a risk exists that our associates, contractors or agents could, in contravention of our policies, engage in business practices prohibited by U.S. laws and regulations applicable to us, such as the Foreign Corrupt Practices Act ("FCPA"), or the laws and regulations of other countries, such as the UK Bribery Act. We maintain a global policy prohibiting such business practices and have in place a global anti-corruption compliance program designed to ensure compliance with these laws and regulations. Nevertheless, we remain subject to the risk that one or more of our associates, contractors or agents, including those based in or from countries where practices that violate such U.S. laws and regulations or the laws and regulations of other countries may be customary, will engage in business practices that are prohibited by our policies, circumvent our compliance programs and, by doing so, violate such laws and regulations. Any such violations, even if prohibited by our internal policies, could adversely affect our business or financial performance and our reputation.
We are subject to income taxes and other taxes in both the U.S. and the foreign jurisdictions in which we currently operate or have historically operated. The determination of our worldwide provision for income taxes and current and deferred tax assets and liabilities requires judgment and estimation. Our income taxes could be materially adversely affected by earnings being
23
lower than anticipated in jurisdictions that have lower statutory tax rates and higher than anticipated in jurisdictions that have higher statutory tax rates, by changes in the valuation of our deferred tax assets and liabilities, or by changes in worldwide tax laws, regulations, or accounting principles.
On December 22, 2017, the Tax Cuts and Jobs Act of 2017 (the "Tax Act") was enacted and contains significant changes to U.S. income tax law. Effective in 2018, the Tax Act reduces the U.S. statutory tax rate from 35 percent to 21 percent and creates new taxes focused on foreign-sourced earnings and related-party payments. In addition, the Company was subject to a one-time transition tax in fiscal 2018 on accumulated foreign subsidiary earnings not previously subject to U.S. income tax. The Securities and Exchange Commission (SEC) staff issued Staff Accounting Bulletin No. 118 ("SAB 118") on December 22, 2017, which allows companies to record provisional amounts during a measurement period not to extend beyond one year of the enactment date. Due to the timing of the enactment and the complexity involved in applying the provisions of the Tax Act, the Company made reasonable estimates of the effects and recorded provisional amounts in our financial statements as of January 31, 2018, in accordance with SAB 118. As the Company collects and prepares necessary data, and interprets the Tax Act and any additional guidance issued by the U.S. Treasury Department, the IRS, and other standard-setting bodies, the Company may make adjustments to the provisional amounts during fiscal 2019. Those adjustments may materially impact our provision for income taxes and effective tax rate in the period in which the adjustments are made and could impact our net income and our earnings per share, as well as our consolidated cash flows and liquidity.
We are subject to regular review and audit by both domestic and foreign tax authorities as well as subject to the prospective and retrospective effects of changing tax regulations and legislation. Although we believe our tax estimates are reasonable, the ultimate tax outcome may materially differ from the tax amounts recorded in our consolidated financial statements and may materially affect our income tax provision, net income, or cash flows in the period or periods for which such determination and settlement is made.
We operate in complex regulated environments in the United States and in the other countries in which we operate and could be adversely affected by changes to existing legal requirements including the related interpretations and enforcement practices, new legal requirements and/or any failure to comply with applicable regulations. Our pharmacy operations in the United States are subject to numerous federal, state and local regulations including licensing and other requirements for pharmacies and reimbursement arrangements. The regulations to which we are subject include, but are not limited to: federal and state registration and regulation of pharmacies; dispensing and sale of controlled substances and products containing pseudoephedrine; applicable governmental payer regulations including Medicare and Medicaid; data privacy and security laws and regulations including the Health Insurance Portability and Accountability Act, the Affordable Care Act or any successor thereto; laws and regulations relating to the protection of the environment and health and safety matters, including those governing exposure to, and the management and disposal of, hazardous substances; regulations regarding food and drug safety including those of the U.S. Food and Drug Administration (the "FDA") and the Drug Enforcement Administration (the "DEA"), trade regulations including those of the U.S. Federal Trade Commission, and consumer protection and safety regulations including those of the Consumer Product Safety Commission, as well as state regulatory authorities, governing the availability, sale, advertisement and promotion of products we sell and the financial services we offer; anti-kickback laws; false claims laws; and federal and state laws governing health care fraud and abuse and the practice of the professions of pharmacy, optical care and nurse practitioner services.
For example, in the United States the DEA and various other regulatory authorities regulate the distribution and dispensing of pharmaceuticals and controlled substances. We are required to hold valid DEA and state-level licenses, meet various security and operating standards and comply with the federal and various state controlled substance acts and related regulations governing the sale, dispensing, disposal, holding and distribution of controlled substances. The DEA, FDA and state regulatory authorities have broad enforcement powers, including the ability to seize or recall products and impose significant criminal, civil and administrative sanctions for violations of these laws and regulations. We are also governed by foreign, national and state laws of general applicability, including laws regulating matters of working conditions, health and safety and equal employment opportunity and other labor and employment matters, as well as employee benefit, competition, anti-money laundering, antitrust matters and health and wellness related regulations for our pharmacy operations outside of the United States. Changes in laws, regulations and policies and the related interpretations and enforcement practices may alter the landscape in which we do business and may significantly affect our cost of doing business.
The impact of new laws, regulations and policies and the related interpretations and enforcement practices generally cannot be predicted, and changes in applicable laws, regulations and policies and the related interpretations and enforcement practices may require extensive system and operational changes, be difficult to implement, increase our operating costs and require significant capital expenditures. Untimely compliance or noncompliance with applicable laws and regulations could result in the imposition of civil and criminal penalties that could adversely affect the continued operation of our businesses, including: suspension of payments from government programs; loss of required government certifications; loss of authorizations to participate in or exclusion from government programs, including the Medicare and Medicaid programs in the United States; loss of licenses; and significant fines or monetary damages and/or penalties. Any failure to comply with applicable regulatory requirements in the United States or in any of the countries in which we operate could result in significant legal and financial
24
exposure, damage our reputation, and have a material adverse effect on our business operations, financial condition and results of operations.
We are subject to certain legal proceedings that may materially adversely affect our results of operations, financial condition and liquidity.
We are involved in a number of legal proceedings, which include consumer, employment, tort and other litigation. In particular, we are currently a defendant in a number of cases containing class-action allegations in which the plaintiffs have brought claims under federal and state wage and hour laws, as well as a number of cases containing class-action allegations in which the plaintiffs have brought claims under federal and state consumer laws.
In addition, ASDA Stores, Ltd. ("ASDA"), a wholly-owned subsidiary of the Company, has been named as a defendant in over 10,000 "equal value" claims pending in the Manchester Employment Tribunal (the "Employment Tribunal") in the United Kingdom. The claimants, who are current and former ASDA store employees, allege that the work performed by female employees in ASDA's retail stores is of equal value in terms of, among other things, the demands of their jobs to that of male employees working in ASDA's warehouses and distribution facilities, and that the disparity in pay between these different job positions is not objectively justified. The claimants are seeking differential back pay based on higher wage rates in the warehouses and distribution facilities and higher wage rates on a prospective basis. At present, we cannot predict the number of such claims that may be filed, and cannot reasonably estimate any loss or range of loss that may arise from these proceedings.
In December 2017, the United States Judicial Panel on Multidistrict Litigation consolidated numerous lawsuits filed against a wide array of defendants by various plaintiffs, including counties, cities, healthcare providers, Native American tribes, individuals, and third-party payors, asserting claims generally concerning the impacts of widespread opioid abuse. The consolidated multidistrict litigation is entitled
In re National Prescription Opiate Litigation
(MDL No. 2804)
, and is pending in the U.S. District Court for the Northern District of Ohio. The Company is named as a defendant in some of the cases included in this multidistrict litigation, including cases filed by several counties in West Virginia; by healthcare providers in Mississippi, Alabama, Texas, and Florida; and by the St. Croix Chippewa Indians of Wisconsin. Similar cases that name the Company have been filed in state courts by various counties and municipalities; by health care providers; and by various Native American Tribes. At present, we cannot predict the number of such claims that may be filed, and cannot reasonably estimate any loss or range of loss that may arise from such claims.
We discuss these cases and other litigation to which we are party below under the caption "
Item 3. Legal Proceedings
" and in
Note 10
in the "
Notes to our Consolidated Financial Statements
," which are part of this Annual Report on Form 10-K.
We could be subject to liability, penalties and other sanctions and other adverse consequences arising out of our on-going FCPA matter.
The Audit Committee of our Board of Directors has been conducting an internal investigation into, among other things, alleged violations of the FCPA and other alleged crimes or misconduct in connection with certain of our foreign subsidiaries, including Wal-Mart de México, S.A.B. de C.V. ("Walmex"), and whether prior allegations of such violations and/or misconduct were appropriately handled by the Company. We have also been conducting a voluntary global review of our policies, practices and internal controls for anti-corruption compliance and are engaged in strengthening our global anti-corruption compliance programs. Since the implementation of the global review and enhanced anti-corruption compliance programs, the Audit Committee and we have identified or been made aware of additional allegations regarding potential violations of the FCPA.
Inquiries or investigations regarding allegations of potential FCPA violations have been commenced in a number of foreign markets in which we operate, including, but not limited to, Brazil, China and India. In November 2011, we voluntarily disclosed our investigative activity to the U.S. Department of Justice (the "DOJ") and the SEC. We have been cooperating with those agencies and discussions have been ongoing with them regarding the resolution of these matters. These discussions have progressed to a point that we can now reasonably estimate a probable loss and have recorded an aggregate accrual of $283 million with respect to these matters (the "Accrual").
A number of federal and local government agencies in Mexico have also initiated investigations of these matters. Furthermore, lawsuits relating to the matters under investigation have been filed by several of our shareholders against us, certain of our current and former directors and officers and certain of Walmex's current and former officers.
We could be exposed to a variety of negative consequences as a result of these matters. One or more enforcement actions could be instituted in respect of the matters that are the subject of some or all of the on-going government investigations, and such actions, if brought, may result in judgments, settlements, fines, penalties, injunctions, cease and desist orders, debarment or other relief, criminal convictions and/or penalties. The shareholder lawsuits may result in judgments against us and our current and former directors and officers named in those proceedings. We also expect that there will be ongoing media and governmental interest regarding these matters, including additional news articles on these matters that could impact the perception of our role as a corporate citizen among certain audiences. Moreover, we have incurred and expect to continue to incur costs in responding to requests for information or subpoenas seeking documents, testimony and other information in
25
connection with the government investigations, in defending the shareholder lawsuits and in conducting our review and investigations.
While we have made an Accrual for these matters, because the discussions are continuing, there can be no assurance as to the timing or the terms of the final resolution of these matters. Although we do not presently believe that these matters will have a material adverse effect on our business, given the inherent uncertainties in such situations, we can provide no assurance that these matters will not be material to our business in the future.
|
ITEM 1B.
|
UNRESOLVED STAFF COMMENTS
|
None.
26
|
ITEM 2.
|
PROPERTIES
|
United States
The Walmart U.S. and Sam's Club segments comprise the Company's operations in the U.S. As of
January 31, 2018
, unit counts for Walmart U.S. and Sam's Club are summarized by format for each state and territory as follows:
|
Walmart U.S.
|
Sam's Club
|
||||||||||||||
|
State or Territory
|
Supercenters
|
Discount Stores
|
Neighborhood Markets
and other small formats |
Clubs
|
Grand Total
|
||||||||||
|
Alabama
|
101
|
|
1
|
|
30
|
|
13
|
|
145
|
|
|||||
|
Alaska
|
7
|
|
2
|
|
—
|
|
—
|
|
9
|
|
|||||
|
Arizona
|
83
|
|
2
|
|
31
|
|
12
|
|
128
|
|
|||||
|
Arkansas
|
76
|
|
6
|
|
37
|
|
9
|
|
128
|
|
|||||
|
California
|
141
|
|
74
|
|
76
|
|
29
|
|
320
|
|
|||||
|
Colorado
|
70
|
|
4
|
|
18
|
|
17
|
|
109
|
|
|||||
|
Connecticut
|
12
|
|
21
|
|
1
|
|
1
|
|
35
|
|
|||||
|
Delaware
|
6
|
|
3
|
|
—
|
|
1
|
|
10
|
|
|||||
|
Florida
|
231
|
|
9
|
|
94
|
|
46
|
|
380
|
|
|||||
|
Georgia
|
154
|
|
2
|
|
35
|
|
24
|
|
215
|
|
|||||
|
Hawaii
|
—
|
|
10
|
|
—
|
|
2
|
|
12
|
|
|||||
|
Idaho
|
23
|
|
—
|
|
3
|
|
1
|
|
27
|
|
|||||
|
Illinois
|
139
|
|
17
|
|
11
|
|
25
|
|
192
|
|
|||||
|
Indiana
|
97
|
|
7
|
|
11
|
|
13
|
|
128
|
|
|||||
|
Iowa
|
58
|
|
2
|
|
—
|
|
9
|
|
69
|
|
|||||
|
Kansas
|
58
|
|
2
|
|
16
|
|
9
|
|
85
|
|
|||||
|
Kentucky
|
79
|
|
8
|
|
11
|
|
9
|
|
107
|
|
|||||
|
Louisiana
|
89
|
|
2
|
|
34
|
|
14
|
|
139
|
|
|||||
|
Maine
|
19
|
|
3
|
|
—
|
|
3
|
|
25
|
|
|||||
|
Maryland
|
30
|
|
18
|
|
2
|
|
11
|
|
61
|
|
|||||
|
Massachusetts
|
27
|
|
22
|
|
3
|
|
—
|
|
52
|
|
|||||
|
Michigan
|
91
|
|
3
|
|
9
|
|
23
|
|
126
|
|
|||||
|
Minnesota
|
65
|
|
4
|
|
1
|
|
12
|
|
82
|
|
|||||
|
Mississippi
|
65
|
|
3
|
|
10
|
|
7
|
|
85
|
|
|||||
|
Missouri
|
112
|
|
9
|
|
18
|
|
19
|
|
158
|
|
|||||
|
Montana
|
14
|
|
—
|
|
—
|
|
2
|
|
16
|
|
|||||
|
Nebraska
|
35
|
|
—
|
|
7
|
|
5
|
|
47
|
|
|||||
|
Nevada
|
30
|
|
2
|
|
11
|
|
7
|
|
50
|
|
|||||
|
New Hampshire
|
19
|
|
8
|
|
—
|
|
2
|
|
29
|
|
|||||
|
New Jersey
|
29
|
|
34
|
|
—
|
|
7
|
|
70
|
|
|||||
|
New Mexico
|
35
|
|
2
|
|
9
|
|
7
|
|
53
|
|
|||||
|
New York
|
80
|
|
18
|
|
7
|
|
12
|
|
117
|
|
|||||
|
North Carolina
|
144
|
|
6
|
|
45
|
|
22
|
|
217
|
|
|||||
|
North Dakota
|
14
|
|
—
|
|
—
|
|
3
|
|
17
|
|
|||||
|
Ohio
|
139
|
|
6
|
|
—
|
|
27
|
|
172
|
|
|||||
|
Oklahoma
|
81
|
|
8
|
|
34
|
|
13
|
|
136
|
|
|||||
|
Oregon
|
28
|
|
7
|
|
10
|
|
—
|
|
45
|
|
|||||
|
Pennsylvania
|
116
|
|
21
|
|
3
|
|
24
|
|
164
|
|
|||||
|
Puerto Rico
|
13
|
|
5
|
|
17
|
|
7
|
|
42
|
|
|||||
|
Rhode Island
|
5
|
|
4
|
|
—
|
|
—
|
|
9
|
|
|||||
|
South Carolina
|
84
|
|
—
|
|
27
|
|
13
|
|
124
|
|
|||||
|
South Dakota
|
15
|
|
—
|
|
—
|
|
2
|
|
17
|
|
|||||
|
Tennessee
|
117
|
|
2
|
|
21
|
|
14
|
|
154
|
|
|||||
|
Texas
|
389
|
|
20
|
|
111
|
|
81
|
|
601
|
|
|||||
|
Utah
|
41
|
|
—
|
|
12
|
|
8
|
|
61
|
|
|||||
|
Vermont
|
3
|
|
3
|
|
—
|
|
—
|
|
6
|
|
|||||
|
Virginia
|
109
|
|
6
|
|
24
|
|
15
|
|
154
|
|
|||||
|
Washington
|
52
|
|
10
|
|
6
|
|
—
|
|
68
|
|
|||||
|
Washington D.C.
|
3
|
|
—
|
|
2
|
|
—
|
|
5
|
|
|||||
|
West Virginia
|
38
|
|
—
|
|
1
|
|
5
|
|
44
|
|
|||||
|
Wisconsin
|
83
|
|
4
|
|
2
|
|
10
|
|
99
|
|
|||||
|
Wyoming
|
12
|
|
—
|
|
—
|
|
2
|
|
14
|
|
|||||
|
U.S. total
|
3,561
|
|
400
|
|
800
|
|
597
|
|
5,358
|
|
|||||
27
International
The Walmart International segment comprises the Company's operations outside of the U.S. Unit counts as of
January 31, 2018
(1)
for Walmart International are summarized by major category for each geographic market as follows:
|
Geographic Market
|
Retail
|
Wholesale
|
Other
(2)
|
Total
|
||||||||
|
Africa
(3)
|
335
|
|
89
|
|
—
|
|
424
|
|
||||
|
Argentina
|
106
|
|
—
|
|
—
|
|
106
|
|
||||
|
Brazil
|
380
|
|
70
|
|
15
|
|
465
|
|
||||
|
Canada
|
410
|
|
—
|
|
—
|
|
410
|
|
||||
|
Central America
(4)
|
778
|
|
—
|
|
—
|
|
778
|
|
||||
|
Chile
|
373
|
|
5
|
|
—
|
|
378
|
|
||||
|
China
|
424
|
|
19
|
|
—
|
|
443
|
|
||||
|
India
|
—
|
|
20
|
|
—
|
|
20
|
|
||||
|
Japan
|
336
|
|
—
|
|
—
|
|
336
|
|
||||
|
Mexico
|
2,186
|
|
162
|
|
10
|
|
2,358
|
|
||||
|
United Kingdom
|
617
|
|
—
|
|
25
|
|
642
|
|
||||
|
International total
|
5,945
|
|
365
|
|
50
|
|
6,360
|
|
||||
|
(1)
|
Walmart International unit counts, with the exception of Canada, are stated as of December 31, 2017, to correspond with the balance sheet date of the related geographic market. Canada unit counts are stated as of
January 31, 2018
.
|
|
(2)
|
Other includes drug stores and convenience stores.
|
|
(3)
|
Africa unit counts by country are Botswana (
11
), Ghana (
2
), Kenya (
1
), Lesotho (
3
), Malawi (
2
), Mozambique (
5
), Namibia (
4
), Nigeria (
5
), South Africa (
382
), Swaziland (
1
), Tanzania (
1
), Uganda (
1
) and Zambia (
6
).
|
|
(4)
|
Central America unit counts by country are Costa Rica (
247
), El Salvador (
95
), Guatemala (
238
), Honduras (
103
) and Nicaragua (
95
).
|
Owned and Leased Properties
The following table provides further details of our retail units and distribution facilities, including return facilities, as of
January 31, 2018
:
|
Owned and Operated
|
Owned and Third Party Operated
|
Leased and Operated
|
Third Party Owned and Operated
|
Total
|
|||||||||||
|
U.S. properties
|
|||||||||||||||
|
Walmart U.S. retail units
|
4,066
|
|
—
|
|
695
|
|
—
|
|
4,761
|
|
|||||
|
Sam's Club retail units
|
512
|
|
—
|
|
85
|
|
—
|
|
597
|
|
|||||
|
Total U.S. retail units
|
4,578
|
|
—
|
|
780
|
|
—
|
|
5,358
|
|
|||||
|
Walmart U.S. distribution facilities
|
103
|
|
2
|
|
23
|
|
29
|
|
157
|
|
|||||
|
Sam's Club distribution facilities
|
3
|
|
3
|
|
3
|
|
13
|
|
22
|
|
|||||
|
Total U.S. distribution facilities
|
106
|
|
5
|
|
26
|
|
42
|
|
179
|
|
|||||
|
Total U.S. properties
|
4,684
|
|
5
|
|
806
|
|
42
|
|
5,537
|
|
|||||
|
International properties
|
|||||||||||||||
|
Africa
|
39
|
|
—
|
|
385
|
|
—
|
|
424
|
|
|||||
|
Argentina
|
66
|
|
—
|
|
40
|
|
—
|
|
106
|
|
|||||
|
Brazil
|
209
|
|
—
|
|
256
|
|
—
|
|
465
|
|
|||||
|
Canada
|
124
|
|
—
|
|
286
|
|
—
|
|
410
|
|
|||||
|
Central America
|
304
|
|
—
|
|
474
|
|
—
|
|
778
|
|
|||||
|
Chile
|
228
|
|
—
|
|
150
|
|
—
|
|
378
|
|
|||||
|
China
|
3
|
|
—
|
|
440
|
|
—
|
|
443
|
|
|||||
|
India
|
2
|
|
—
|
|
18
|
|
—
|
|
20
|
|
|||||
|
Japan
|
56
|
|
—
|
|
280
|
|
—
|
|
336
|
|
|||||
|
Mexico
|
669
|
|
—
|
|
1,689
|
|
—
|
|
2,358
|
|
|||||
|
United Kingdom
|
442
|
|
—
|
|
200
|
|
—
|
|
642
|
|
|||||
|
Total International retail units
|
2,142
|
|
—
|
|
4,218
|
|
—
|
|
6,360
|
|
|||||
|
International distribution facilities
|
43
|
|
12
|
|
87
|
|
46
|
|
188
|
|
|||||
|
Total International properties
|
2,185
|
|
12
|
|
4,305
|
|
46
|
|
6,548
|
|
|||||
|
Total retail units
|
6,720
|
|
—
|
|
4,998
|
|
—
|
|
11,718
|
|
|||||
|
Total distribution facilities
|
149
|
|
17
|
|
113
|
|
88
|
|
367
|
|
|||||
|
Total properties
|
6,869
|
|
17
|
|
5,111
|
|
88
|
|
12,085
|
|
|||||
We own office facilities in Bentonville, Arkansas, that serve as our principal office and own and lease office facilities throughout the U.S. and internationally for operations as well as for field and market management. The land on which our
28
stores are located is either owned or leased by the Company. We use independent contractors to construct our buildings. All store leases provide for annual rentals, some of which escalate during the original lease or provide for additional rent based on sales volume. Substantially all of the Company's store and club leases have renewal options, some of which include rent escalation clauses.
For further information on our distribution centers, see the caption "Distribution" provided for each of our segments under "
Item 1. Business
."
|
ITEM 3.
|
LEGAL PROCEEDINGS
|
I. SUPPLEMENTAL INFORMATION:
We discuss certain legal proceedings in
Note 10
to our Consolidated Financial Statements, entitled "Contingencies," which is included in
Part II, Item 8.
Financial Statements and Supplementary Data of this Annual Report on Form 10-K. We refer you to that discussion for important information concerning those legal proceedings, including the basis for such actions and, where known, the relief sought. We provide the following additional information concerning those legal proceedings, including the name of the lawsuit, the court in which the lawsuit is pending, and the date on which the petition commencing the lawsuit was filed.
ASDA Equal Value Claims:
Ms S Brierley & Others v ASDA Stores Ltd (2406372/2008 & Others - Manchester Employment Tribunal); ASDA Stores Ltd v Brierley & Ors (A2/2016/0973 - United Kingdom Court of Appeal); ASDA Stores Ltd v Ms S Brierley & Others (UKEAT/0059/16/DM - United Kingdom Employment Appeal Tribunal); ASDA Stores Ltd v Ms S Brierley & Others (UKEAT/0009/16/JOJ - United Kingdom Employment Appeal Tribunal).
National Prescription Opiate Litigation:
In re National Prescription Opiate Litigation (MDL No. 2804); Lac Courte Oreilles Band of Lake Superior Chippewa Indians v. McKesson Corp., et al.,
WI Circuit Court, Sawyer County, 3/16/18;
ApolloMD Bus. Servs., LLC v. Attain Med, Inc., et al.,
GA State Ct., Fulton Cty., 3/8/2018;
Center Point, Inc. v. McKesson Corp., et al,
CA Superior Ct., San Francisco County, 3/6/2018;
Cty. of Greenville v. Rite Aid of S.C., Inc., et al.
, SC Ct. of Common Pleas, 13th Judicial Dist., 3/5/2018;
Big Sandy Rancheria of W. Mono Indians v. McKesson Corp., et al.
, CA Superior Ct., San Francisco County, 3/2/2018;
Consolidated Tribal Health Project, Inc. v. McKesson Corp.
, et al., CA Superior Ct., San Francisco County, 3/2/2018;
Robinson Rancheria v.McKesson Corp., et al.
, CA Superior Ct., San Francisco County, 3/2/2018;
Round Valley Indian Tribes; Round Valley Indian Health Center, Inc. v. McKesson Corp., et al.,
CA Superior Ct., San Francisco County, 3/2/2018;
Hopland Band of Pomo Indians v. McKesson Corp., et al.,
CA Superior Ct., San Francisco County, 2/21/2018;
Redwood Valley or Little River Band of Pomo Indians of Redwood Valley Rancheria v. McKesson Corp., et al.
, CA Superior Ct., San Francisco County, 2/21/2018;
Scotts Valley Band of Pomo Indians v. McKesson Corp., et al.
, CA Superior Ct., San Francisco County, 2/21/2018;
Big Valley Band of Pomo Indians of the Big Valley Rancheria v. McKesson Corp., et al.,
CA Superior Ct., San Francisco County, 2/13/2018;
Guidiville Rancheria of Cal. v. McKesson Corp., et al.,
CA Superior Ct., San Francisco County
,
2/13/2018;
Odyssey House La., Inc. v. Morris & Dickson Co., et al.
, LA Civil Dist. Ct., New Orleans Parish, 2/6/2018;
Coyote Valley Band of Pomo Indians v. McKesson Corp., et al.,
CA Superior Ct., San Francisco County,
1/29/2018;
Cty. Comm'n of Mingo Cty. v. Purdue Pharma, L.P., et al.,
WV Circuit Ct., Mingo County, 1/18/2018;
Brooke Cty. Comm'n v. Purdue Pharma L.P., et al.,
WV Circuit Ct., Marshall County, 12/13/2017;
Hancock Cty. Comm'n v. Purdue Pharma L.P., et al.,
WV Circuit Ct., Marshall County, 12/13/2017;
Harrison Cty. Comm'n v. Purdue Pharma L.P., et al.,
WV Circuit Ct., Marshall County, 12/13/2017;
Lewis Cty. Comm'n v. Purdue Pharma L.P., et al.,
WV Circuit Ct., Marshall County, 12/13/2017;
Marshall Cty. Comm'n v. Purdue Pharma L.P., et al.,
WV Circuit Ct., Marshall County, 12/13/2017;
Ohio Cty. Comm'n v. Purdue Pharma L.P., et al.,
WV Circuit Ct., Marshall County
,
12/13/2017;
Tyler Cty. Comm'n v. Purdue Pharma L.P., et al.,
WV Circuit Ct., Marshall County, 12/13/2017;
Wetzel Cty. Comm'n v. Purdue Pharma L.P., et al.,
WV Circuit Ct., Marshall County, 12/13/2017.
II. CERTAIN OTHER PROCEEDINGS:
The Company is a defendant in several lawsuits in which the complaints closely track the allegations set forth in a news story that appeared in
The New York Times (
the "
Times
"
)
on April 21, 2012. One of these is a securities lawsuit that was filed on May 7, 2012, in the United States District Court for the Middle District of Tennessee, and subsequently transferred to the Western District of Arkansas, in which the plaintiff alleges various violations of the U.S. Foreign Corrupt Practices Act (the "FCPA") beginning in 2005, and asserts violations of Sections 10(b) and 20(a) of the Securities Exchange Act of 1934, as amended, relating to certain prior disclosures of the Company. The plaintiff seeks to represent a class of shareholders who purchased or acquired stock of the Company between December 8, 2011, and April 20, 2012, and seeks damages and other relief based on allegations that the defendants' conduct affected the value of such stock. On September 20, 2016, the court granted plaintiff's motion for class certification. On October 6, 2016, the defendants filed a petition to appeal the class certification ruling to the U.S. Court of Appeals for the Eighth Circuit. On November 7, 2016, the U.S. Court of Appeals for the Eighth Circuit denied the Company's petition.
In addition, a number of derivative complaints have been filed in Delaware and Arkansas, also tracking the allegations of the
Times
story, and naming various current and former directors and certain former officers as additional defendants. The plaintiffs in the derivative suits (in which the Company is a nominal defendant) allege, among other things, that the defendants who are or were directors or officers of the Company breached their fiduciary duties in connection with their oversight of FCPA compliance. All of the derivative suits have been combined into two consolidated proceedings, one of which was consolidated
29
in the United States District Court for the Western District of Arkansas and the other in the Delaware Court of Chancery. On March 31, 2015, the Western District of Arkansas granted the defendants' motion to dismiss the consolidated derivative proceedings in that court. On April 15, 2015, plaintiffs filed their notice of appeal with the United States Court of Appeals for the Eighth Circuit. On July 22, 2016, the United States Court of Appeals for the Eighth Circuit affirmed the dismissal of the consolidated derivative proceedings in Arkansas. There was no appeal from that ruling. On May 13, 2016, the Delaware Court of Chancery granted the defendants' motion to dismiss the consolidated derivative proceedings in that court. On June 10, 2016, plaintiffs in the Delaware consolidated derivative proceedings filed their notice of appeal to the Delaware Supreme Court. On January 25, 2018, the Delaware Supreme Court affirmed the dismissal of the consolidated derivative proceedings in Delaware.
Management does not believe any possible loss or the range of any possible loss that may be incurred in connection with these proceedings will be material to the Company's financial condition or results of operations.
Securities Class Action:
City of Pontiac General Employees Retirement System v. Wal-Mart Stores, Inc.,
USDC, Western Dist. of AR; 5/7/12.
Derivative Lawsuits:
In re Wal-Mart Stores, Inc. Delaware Derivative Litigation,
Delaware Ct. of Chancery, 4/25/12; Delaware Supreme Court, Dover, DE; 6/10/16.
III. ENVIRONMENTAL MATTERS:
Item 103 of SEC Regulation S-K requires disclosure of certain environmental matters. The following matters are disclosed in accordance with that requirement. For the matters listed below, management does not believe any possible loss or the range of any possible loss that may be incurred in connection with each matter, individually or in the aggregate, will be material to the Company's financial condition or results of operations.
On January 25, 2018, the Environmental Prosecutor of the State of Chiapas (Procuraduría Ambiental del Estado de Chiapas) in Mexico imposed a fine of $163,000 for the absence of an Environmental Impact Authorization License related to the store Mi Bodega Las Rosas. The Company plans to challenge the fine before an administrative court.
In May 2017, WMS Supermercados do Brasil Ltda ("Walmart Brazil") self-reported to the relevant municipal environmental agency, and proposed a remediation plan for, an oil contamination in the soil and underground water at the Walmart and Sam's Club store location in Barueri, São Paulo (Tamboré), which contamination had been confirmed by an internal investigation in April 2017. Walmart Brazil is cooperating with the agency, including seeking authorization to start a remediation plan.
In April 2017, the California Air Resources Board ("ARB") notified the Company that it had taken the position that retailers are required to use unclaimed deposits collected on sales of small containers of automotive refrigerant to fund certain consumer education programs. The ARB alleged that the Company had improperly retained approximately $4.2 million in unclaimed deposits and has sought reimbursement. The Company has denied any wrongdoing.
In November and December 2016, the Environmental and Natural History Ministry of Chiapas, Mexico ("Ministry") notified a subsidiary of the Company, Arrendadora de Centros Comerciales, S. de R.L. de C.V. ("Arrendadora"), that it was proposing aggregated penalties approximating $430,000 in respect to four stores which the Ministry believed may have been constructed without first obtaining a required environmental impact license. Arrendadora has challenged the penalties before an administrative court and the trials are in process. The Ministry had previously proposed penalties of approximately $640,000 related to this matter in 2014, but Arrendadora was released by an administrative court from payment of such penalties on the basis that the Ministry had failed to comply with legal formalities in connection with their imposition.
On April 6, 2015, representatives for the Brazilian Institute of the Environment alleged that Walmart Brazil had failed to file required reports documenting the number of tires imported, sold and recycled. The agency proposed a penalty of approximately $857,000, which may be doubled and excludes additional amounts in respect of inflation and interest, and prohibited Walmart Brazil from selling or importing tires until the matter is resolved. In October 2015, Walmart Brazil filed its defense with the agency against the imposition of this penalty.
In April 2013, a subsidiary of the Company, Corporacion de Compañias Agroindustriales, operating in Costa Rica, became aware that the Municipality of Curridabat is seeking a penalty of approximately $380,000 in connection with the construction of a retaining wall seventeen years ago for a perishables distribution center that is situated along a protected river bank. The subsidiary obtained permits from the Municipality and the Secretaria Técnica Nacional Ambiental at the time of construction, but the Municipality now alleges that the wall is non-conforming.
In January 2011, the Environmental Department of Porto Alegre Municipality formally notified Walmart Brazil of soil inspection reports indicating soil contamination due to leakage of oil from power generating equipment at nine store locations in Brazil. Walmart Brazil is cooperating with the agency as well as the District Attorney's Office for the State of Rio Grande do Sul and has filed a mitigation plan to address the situation.
|
ITEM 4.
|
MINE SAFETY DISCLOSURES
|
Not applicable.
30
|
ITEM 5.
|
MARKET FOR REGISTRANT'S COMMON EQUITY, RELATED STOCKHOLDER MATTERS AND ISSUER PURCHASES OF EQUITY SECURITIES
|
Market for Common Stock
Walmart's common stock is listed for trading on the New York Stock Exchange, which is the primary market for Walmart's common stock. The common stock trades under the symbol "WMT."
Market Price of Common Stock
The high market price and low market price per share for the Company's common stock for each fiscal quarter in fiscal
2018
and
2017
were as follows:
|
|
2018
|
2017
|
||||||||||||||
|
|
High
|
Low
|
High
|
Low
|
||||||||||||
|
1st Quarter
|
$
|
75.77
|
|
$
|
66.04
|
|
$
|
70.08
|
|
$
|
62.35
|
|
||||
|
2nd Quarter
|
80.47
|
|
73.13
|
|
74.35
|
|
62.72
|
|
||||||||
|
3rd Quarter
|
89.11
|
|
77.50
|
|
75.19
|
|
67.07
|
|
||||||||
|
4th Quarter
|
109.98
|
|
87.00
|
|
72.48
|
|
65.28
|
|
||||||||
The high market price and low market price per share for the Company's common stock for the first fiscal quarter of fiscal
2019
, were as follows:
|
|
2019
|
||||||
|
|
High
|
Low
|
|||||
|
1st Quarter
(1)
|
$
|
106.56
|
|
$
|
85.28
|
|
|
|
(1)
|
Through March 28, 2018.
|
Holders of Record of Common Stock
As of
March 28, 2018
, there were
229,858
holders of record of Walmart's common stock.
Dividends Payable Per Share
For fiscal
2019
, dividends will be paid based on the following schedule:
|
April 2, 2018
|
$
|
0.52
|
|
|
June 4, 2018
|
0.52
|
|
|
|
September 4, 2018
|
0.52
|
|
|
|
January 2, 2019
|
0.52
|
|
|
Dividends Paid Per Share
For fiscal
2018
, dividends were paid based on the following schedule:
|
April 3, 2017
|
$
|
0.51
|
|
|
June 5, 2017
|
0.51
|
|
|
|
September 5, 2017
|
0.51
|
|
|
|
January 2, 2018
|
0.51
|
|
|
For fiscal
2017
, dividends were paid based on the following schedule:
|
April 4, 2016
|
$
|
0.50
|
|
|
June 6, 2016
|
0.50
|
|
|
|
September 6, 2016
|
0.50
|
|
|
|
January 3, 2017
|
0.50
|
|
|
Stock Performance Chart
This graph compares the cumulative total shareholder return on Walmart's common stock during the five fiscal years ending with fiscal 2018 to the cumulative total returns on the S&P 500 Retailing Index and the S&P 500 Index. The comparison assumes $100 was invested on February 1, 2013, in shares of our common stock and in each of the indices shown and assumes that all of the dividends were reinvested.
31
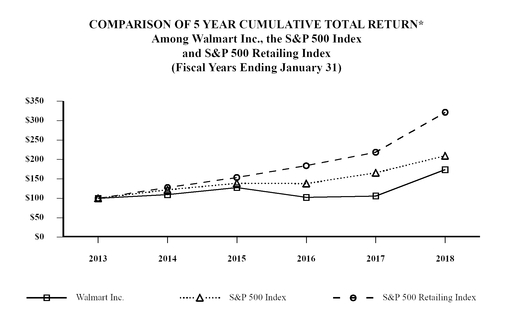
|
*Assumes $100 Invested on February 1, 2013
Assumes Dividends Reinvested
Fiscal Year Ending January 31, 2018 |
|
Fiscal Years Ended January 31,
|
|||||||||||||||||||||||
|
|
2013
|
|
2014
|
|
2015
|
|
2016
|
|
2017
|
|
2018
|
||||||||||||
|
Walmart Inc.
|
$
|
100.00
|
|
|
$
|
109.39
|
|
|
$
|
127.58
|
|
|
$
|
102.39
|
|
|
$
|
105.97
|
|
|
$
|
173.61
|
|
|
S&P 500 Index
|
100.00
|
|
|
121.52
|
|
|
138.80
|
|
|
137.88
|
|
|
165.51
|
|
|
209.22
|
|
||||||
|
S&P 500 Retailing Index
|
100.00
|
|
|
127.72
|
|
|
153.64
|
|
|
184.32
|
|
|
218.76
|
|
|
321.37
|
|
||||||
Issuer Purchases of Equity Securities
From time to time, we repurchase shares of our common stock under share repurchase programs authorized by the Company's Board of Directors. All repurchases made during the fiscal year prior to November 20, 2017 were made under the plan in effect at the beginning of fiscal 2018. On October 9, 2017, the Board of Directors approved a new $20.0 billion share repurchase program which, beginning on November 20, 2017, replaced the previous share repurchase program. As of
January 31, 2018
, authorization for
$18.8 billion
of share repurchases remained under the current share repurchase program. Any repurchased shares are constructively retired and returned to an unissued status.
Share repurchase activity under our share repurchase programs, on a trade date basis, for each month in the quarter ended
January 31, 2018
, was as follows:
|
Fiscal Period
|
Total Number of
Shares Repurchased
|
Average Price Paid
per Share
(in dollars)
|
Total Number of
Shares Purchased
as Part of Publicly
Announced Plans or
Programs
|
Approximate Dollar Value of
Shares that May Yet Be
Purchased Under the
Plans or Programs
(1)
(in billions)
|
||||||||||
|
November 1-30, 2017
|
6,816,775
|
|
$
|
93.00
|
|
6,816,775
|
|
$
|
19.8
|
|
||||
|
December 1-31, 2017
|
5,594,137
|
|
97.92
|
|
5,594,137
|
|
19.2
|
|
||||||
|
January 1-31, 2018
|
4,170,041
|
|
102.37
|
|
4,170,041
|
|
18.8
|
|
||||||
|
Total
|
16,580,953
|
|
16,580,953
|
|
||||||||||
(1) Represents the approximate dollar value of shares that could have been purchased under the current plan at the end of the month. The approximate dollar value of shares that could still have been purchased under the plan in effect at the beginning of fiscal 2018, as of November 17, 2017, when such plan was replaced, was $2.2 billion.
32
|
ITEM 6.
|
SELECTED FINANCIAL DATA
|
|
Five-Year Financial Summary
|
|
|
Walmart Inc.
|
|
|
As of and for the Fiscal Years Ended January 31,
|
||||||||||||||||||||
|
(Amounts in millions, except per share and unit count data)
|
2018
|
2017
|
2016
|
2015
|
2014
|
|||||||||||||||
|
Operating results
|
||||||||||||||||||||
|
Total revenues
|
$
|
500,343
|
|
$
|
485,873
|
|
$
|
482,130
|
|
$
|
485,651
|
|
$
|
476,294
|
|
|||||
|
Percentage change in total revenues from previous fiscal year
|
3.0
|
%
|
0.8
|
%
|
(0.7
|
)%
|
2.0
|
%
|
1.6
|
%
|
||||||||||
|
Net sales
|
$
|
495,761
|
|
$
|
481,317
|
|
$
|
478,614
|
|
$
|
482,229
|
|
$
|
473,076
|
|
|||||
|
Percentage change in net sales from previous fiscal year
|
3.0
|
%
|
0.6
|
%
|
(0.7
|
)%
|
1.9
|
%
|
1.6
|
%
|
||||||||||
|
Increase (decrease) in calendar comparable sales
(1)
in the U.S.
|
2.2
|
%
|
1.4
|
%
|
0.3
|
%
|
0.5
|
%
|
(0.5
|
)%
|
||||||||||
|
Walmart U.S.
|
2.1
|
%
|
1.6
|
%
|
1.0
|
%
|
0.6
|
%
|
(0.6
|
)%
|
||||||||||
|
Sam's Club
|
2.8
|
%
|
0.5
|
%
|
(3.2
|
)%
|
0.0
|
%
|
0.3
|
%
|
||||||||||
|
Gross profit margin
|
24.7
|
%
|
24.9
|
%
|
24.6
|
%
|
24.3
|
%
|
24.3
|
%
|
||||||||||
|
Operating, selling, general and administrative expenses, as a percentage of net sales
|
21.5
|
%
|
21.2
|
%
|
20.3
|
%
|
19.4
|
%
|
19.3
|
%
|
||||||||||
|
Operating income
|
$
|
20,437
|
|
$
|
22,764
|
|
$
|
24,105
|
|
$
|
27,147
|
|
$
|
26,872
|
|
|||||
|
Income from continuing operations attributable to Walmart
|
9,862
|
|
13,643
|
|
14,694
|
|
16,182
|
|
15,918
|
|
||||||||||
|
Diluted income per common share from continuing operations attributable to Walmart
|
$
|
3.28
|
|
$
|
4.38
|
|
$
|
4.57
|
|
$
|
4.99
|
|
$
|
4.85
|
|
|||||
|
Dividends declared per common share
|
2.04
|
|
2.00
|
|
1.96
|
|
1.92
|
|
1.88
|
|
||||||||||
|
Financial position
|
||||||||||||||||||||
|
Inventories
|
$
|
43,783
|
|
$
|
43,046
|
|
$
|
44,469
|
|
$
|
45,141
|
|
$
|
44,858
|
|
|||||
|
Property, equipment, capital lease and financing obligation assets, net
|
114,818
|
|
114,178
|
|
116,516
|
|
116,655
|
|
117,907
|
|
||||||||||
|
Total assets
|
204,522
|
|
198,825
|
|
199,581
|
|
203,490
|
|
204,541
|
|
||||||||||
|
Long-term debt and long-term capital lease and financing obligations (excluding amounts due within one year)
|
36,825
|
|
42,018
|
|
44,030
|
|
43,495
|
|
44,368
|
|
||||||||||
|
Total Walmart shareholders' equity
|
77,869
|
|
77,798
|
|
80,546
|
|
81,394
|
|
76,255
|
|
||||||||||
|
Unit counts
(2)
|
||||||||||||||||||||
|
Walmart U.S. segment
|
4,761
|
|
4,672
|
|
4,574
|
|
4,516
|
|
4,203
|
|
||||||||||
|
Walmart International segment
|
6,360
|
|
6,363
|
|
6,299
|
|
6,290
|
|
6,107
|
|
||||||||||
|
Sam's Club segment
|
597
|
|
660
|
|
655
|
|
647
|
|
632
|
|
||||||||||
|
Total units
|
11,718
|
|
11,695
|
|
11,528
|
|
11,453
|
|
10,942
|
|
||||||||||
|
(1)
|
Comparable sales include sales from stores and clubs open for the previous 12 months, including remodels, relocations and expansions, as well as eCommerce sales and sales from eCommerce acquisitions when such acquisitions have been owned for 12 months. Comparable sales include fuel.
|
|
(2)
|
Unit counts related to discontinued operations have been removed from all relevant periods.
|
33
|
ITEM 7.
|
MANAGEMENT'S DISCUSSION AND ANALYSIS OF FINANCIAL CONDITION AND RESULTS OF OPERATIONS
|
Overview
Walmart Inc. ("Walmart," the "Company" or "we") is engaged in retail and wholesale operations in various formats around the world. Through our operations, we help people around the world save money and live better – anytime and anywhere – in retail stores and through eCommerce. Through innovation, we are striving to create a customer-centric experience that seamlessly integrates digital and physical shopping into an omni-channel offering that saves time for our customers. Physical retail encompasses our brick and mortar presence in each of the markets in which we operate. Digital retail, or eCommerce, is comprised of our eCommerce websites, mobile commerce applications and transactions involving both an eCommerce platform and a physical format, which we refer to as omni-channel. Each week, we serve nearly
270 million
customers who visit our more than
11,700
stores and numerous eCommerce websites under
65
banners in
28
countries. Our strategy is to lead on price, invest to differentiate on access, be competitive on assortment and deliver a great experience. By leading on price we earn the trust of our customers every day by providing a broad assortment of quality merchandise and services at everyday low prices ("EDLP"). EDLP is our pricing philosophy under which we price items at a low price every day so our customers trust that our prices will not change under frequent promotional activity. Price leadership is core to who we are. Everyday low cost ("EDLC") is our commitment to control expenses so our cost savings can be passed along to our customers. Our physical and digital presence, in which we are investing to integrate into a seamless omni-channel, provides customers convenient access to our broad assortment anytime and anywhere. We strive to give our customers and members a great shopping experience through whichever shopping method they prefer.
Our operations consist of three reportable segments: Walmart U.S., Walmart International and Sam's Club.
|
•
|
Walmart U.S. is our largest segment with three primary store formats and eCommerce, as well as an omni-channel offering. Of our three reportable segments, Walmart U.S. has historically had the highest gross profit as a percentage of net sales ("gross profit rate"). In addition, it has historically contributed the greatest amount to the Company's net sales and operating income.
|
|
•
|
Walmart International consists of our operations outside of the U.S. and includes retail, wholesale and other businesses. These categories, including eCommerce, consist of many formats, including: supercenters, supermarkets, hypermarkets, warehouse clubs (including Sam's Clubs) and cash & carry. Overall gross profit rate for Walmart International is lower than that of Walmart U.S. primarily because of its merchandise mix. Walmart International is our second largest segment and has grown in recent years by adding retail, wholesale and other units, and expanding eCommerce.
|
|
•
|
Sam's Club consists of membership-only warehouse clubs as well as eCommerce through samsclub.com. As a membership-only warehouse club, membership income is a significant component of the segment's operating income. Sam's Club operates with a lower gross profit rate and lower operating expenses as a percentage of net sales than our other segments.
|
Each of our segments contributes to the Company's operating results differently. Each, however, has generally maintained a consistent contribution rate to the Company's net sales and operating income in recent years other than minor changes to the contribution rate for the Walmart International segment due to fluctuations in currency exchange rates.
Our fiscal year ends on
January 31
for our U.S. and Canadian operations. We consolidate all other operations generally using a one-month lag and on a calendar year basis. Our business is seasonal to a certain extent due to calendar events and national and religious holidays, as well as weather patterns. Generally, our highest sales volume and operating income have occurred in the fiscal quarter ending
January 31
.
This discussion, which presents our results for the fiscal years ended
January 31, 2018
("fiscal
2018
"),
January 31, 2017
("fiscal
2017
") and
January 31, 2016
("fiscal
2016
") should be read in conjunction with our Consolidated Financial Statements and the accompanying notes. We intend for this discussion to provide the reader with information that will assist in understanding our financial statements, the changes in certain key items in those financial statements from period to period and the primary factors that accounted for those changes. We also discuss certain performance metrics that management uses to assess the Company's performance. Additionally, the discussion provides information about the financial results of the three segments of our business to provide a better understanding of how each of those segments and its results of operations affect the financial condition and results of operations of the Company as a whole.
Throughout this Management's Discussion and Analysis of Financial Condition and Results of Operations, we discuss segment operating income, comparable store and club sales and other measures. Management measures the results of the Company's segments using each segment's operating income, including certain corporate overhead allocations, as well as other measures. From time to time, we revise the measurement of each segment's operating income, including certain corporate overhead allocations, and other measures as determined by the information regularly reviewed by our chief operating decision maker. When we do so, the previous period amounts and balances are reclassified to conform to the current period's presentation.
34
Comparable store and club sales, or comparable sales, is a metric that indicates the performance of our existing stores and clubs by measuring the change in sales for such stores and clubs, including eCommerce sales, for a particular period from the corresponding period in the previous year. Walmart's definition of comparable sales includes sales from stores and clubs open for the previous 12 months, including remodels, relocations, expansions and conversions, as well as eCommerce sales. We measure the eCommerce sales impact by including all sales initiated online or though mobile applications, including omni-channel transactions which are fulfilled through our stores and clubs. Sales of a store that has changed in format are excluded from comparable sales when the conversion of that store is accompanied by a relocation or expansion that results in a change in the store's retail square feet of more than five percent. Additionally, sales related to eCommerce acquisitions are excluded until such acquisitions have been owned for 12 months. Comparable sales are also referred to as "same-store" sales by others within the retail industry. The method of calculating comparable sales varies across the retail industry. As a result, our calculation of comparable sales is not necessarily comparable to similarly titled measures reported by other companies.
In discussing our operating results, we use the term "currency exchange rates" to refer to the currency exchange rates we use to convert the operating results for all countries where the functional currency is not the U.S. dollar into U.S. dollars for financial reporting purposes. We calculate the effect of changes in currency exchange rates from the prior period to the current period as the difference between current period activity translated using the current period's currency exchange rates, and current period activity translated using the comparable prior year period's currency exchange rates. Throughout our discussion, we refer to the results of this calculation as the impact of currency exchange rate fluctuations. Volatility in currency exchange rates may impact the results, including net sales and operating income, of the Company and the Walmart International segment in the future.
The Retail Industry
We operate in the highly competitive retail industry in all of the markets we serve. We face strong sales competition from other discount, department, drug, dollar, variety and specialty stores, warehouse clubs and supermarkets, as well as eCommerce businesses. Many of these competitors are national, regional or international chains or have a national or international online presence. We compete with a number of companies for prime retail site locations, as well as in attracting and retaining quality employees ("associates"). We, along with other retail companies, are influenced by a number of factors including, but not limited to: catastrophic events, weather, competitive pressures, consumer disposable income, consumer debt levels and buying patterns, consumer credit availability, cost of goods, currency exchange rate fluctuations, customer preferences, deflation, inflation, fuel and energy prices, general economic conditions, insurance costs, interest rates, labor costs, tax rates, cybersecurity attacks and unemployment. Further information on the factors that can affect our operating results and on certain risks to our Company and an investment in its securities can be found herein under "
Item 1A. Risk Factors
," and under "
Cautionary Statement Regarding Forward-Looking Statements
."
Company Performance Metrics
We are committed to helping customers save money and live better through everyday low prices, supported by everyday low costs. At times, we adjust our business strategies to maintain and strengthen our competitive positions in the countries in which we operate. Our financial framework is defined as:
|
•
|
strong, efficient growth;
|
|
•
|
operating discipline; and
|
|
•
|
strategic capital allocation.
|
As we execute on this financial framework, we believe our returns on capital will improve over time.
Strong, Efficient Growth
Our objective of prioritizing strong, efficient growth means we will focus on increasing comparable sales and eCommerce sales growth while slowing the rate of growth of new stores and clubs. At times, we make strategic investments which are focused on the long-term growth of the Company, which may not benefit comparable sales in the near term.
Comparable sales is a metric which indicates the performance of our existing stores and clubs by measuring the change in sales for such stores and clubs, including eCommerce sales, for a particular period over the corresponding period in the previous year. The retail industry generally reports comparable sales using the retail calendar (also known as the 4-5-4 calendar). To be consistent with the retail industry, we provide comparable sales using the retail calendar in our quarterly earnings releases. However, when we discuss our comparable sales below, we are referring to our calendar comparable sales calculated using our fiscal calendar. As our fiscal calendar differs from the retail calendar, our fiscal calendar comparable sales also differ from the retail calendar comparable sales provided in our quarterly earnings releases.
35
Calendar comparable sales, as well as the impact of fuel, for fiscal
2018
and
2017
, were as follows:
|
|
Fiscal Years Ended January 31,
|
|||||||
|
|
2018
|
2017
|
2018
|
2017
|
||||
|
|
With Fuel
|
Fuel Impact
|
||||||
|
Walmart U.S.
|
2.1%
|
1.6%
|
0.1%
|
0.0%
|
||||
|
Sam's Club
|
2.8%
|
0.5%
|
1.0%
|
(0.9)%
|
||||
|
Total U.S.
|
2.2%
|
1.4%
|
0.2%
|
(0.1)%
|
||||
Comparable sales in the U.S., including fuel,
increased
2.2%
and
1.4%
in fiscal
2018
and
2017
, respectively, when compared to the previous fiscal year. The fiscal
2018
total U.S. comparable sales were positively impacted by continued traffic improvement, higher eCommerce sales and the impact of higher fuel sales. eCommerce sales positively impacted comparable sales approximately
0.7%
for both Walmart U.S. and Sam's Club for fiscal
2018
. The fiscal
2017
total U.S. comparable sales were positively impacted by continued traffic improvement and higher eCommerce sales at the Walmart U.S. segment, partially offset by the negative impact of lower fuel sales primarily due to lower fuel prices at the Sam's Club segment. eCommerce sales positively impacted comparable sales approximately 0.4% and 0.7% for Walmart U.S. and Sam's Club, respectively, for fiscal
2017
.
In the past, when we were focused on adding new stores and clubs in the U.S., we did so with an understanding that additional stores and clubs may take sales away from existing units. We reduced the number of new store and club openings in fiscal 2018 and the negative impact on comparable sales as a result of these openings was not significant. We expect this trend to continue in the future as well. In fiscal
2017
, we estimate the negative impact on comparable sales as a result of opening new stores and clubs was approximately 0.7%. Our estimate was calculated primarily by comparing the sales trends of the impacted stores and clubs, which are identified based on their proximity to the new stores and clubs, to those of nearby non-impacted stores and clubs, in each case, as measured after the new stores and clubs are opened.
Operating Discipline
We operate with discipline by managing expenses and optimizing the efficiency of how we work. We measure operating discipline through expense leverage, which we define as net sales growing at a faster rate than operating expenses.
|
Fiscal Years Ended January 31,
|
||||||||
|
(Amounts in millions, except unit counts)
|
2018
|
2017
|
||||||
|
Net sales
|
$
|
495,761
|
|
$
|
481,317
|
|
||
|
Percentage change from comparable period
|
3.0
|
%
|
0.6
|
%
|
||||
|
Operating, selling, general and administrative expenses
|
$
|
106,510
|
|
$
|
101,853
|
|
||
|
Percentage change from comparable period
|
4.6
|
%
|
5.0
|
%
|
||||
|
Operating, selling, general and administrative expenses as a percentage of net sales
|
21.5
|
%
|
21.2
|
%
|
||||
For fiscal
2018
, operating, selling, general and administrative ("operating") expenses as a percentage of net sales increased
32
basis points, when compared to the same period in the previous fiscal year. While our increase in net sales and improving expense management had a positive impact on our operating expenses as a percentage of net sales, we did not leverage expenses as a result of approximately $0.6 billion of charges related to Sam's Club closures and discontinued real estate projects, approximately $400 million related to a lump sum bonus paid to associates, $300 million related to Home Office severance, a legal accrual of $283 million related to the FCPA matter, a charge of $244 million related to Walmart U.S. discontinued real estate projects, and the decisions to exit certain international properties and wind down the first party Brazil eCommerce operations.
Strategic Capital Allocation
We are allocating more capital to remodels, eCommerce, technology and supply chain and less to new store and club openings, when compared to prior years. This allocation aligns with our initiatives of improving our customer proposition in stores and clubs and integrating digital and physical shopping. The following table provides additional detail:
|
(Amounts in millions)
|
Fiscal Years Ended January 31,
|
|||||||
|
Allocation of Capital Expenditures
|
2018
|
2017
|
||||||
|
New stores and clubs, including expansions and relocations
|
$
|
914
|
|
$
|
2,171
|
|
||
|
Remodels
|
2,009
|
|
1,589
|
|
||||
|
eCommerce, technology, supply chain and other
|
4,521
|
|
4,162
|
|
||||
|
Total U.S.
|
7,444
|
|
7,922
|
|
||||
|
Walmart International
|
2,607
|
|
2,697
|
|
||||
|
Total capital expenditures
|
$
|
10,051
|
|
$
|
10,619
|
|
||
36
Total U.S. capital expenditures decreased
$478 million
for fiscal
2018
, when compared to the previous fiscal year. Capital expenditures related to new stores and clubs, including expansions and relocations, decreased
$1.3 billion
, partially offset by increases to capital expenditures for remodels and for eCommerce, technology, supply chain and other. These changes were a result of our shift in capital allocation strategy to support growth in comparable store and club sales and eCommerce, while slowing the rate at which we open new stores and clubs.
Returns
As we execute our financial framework, we believe our returns on capital will improve over time. We measure returns on capital with our return on investment and free cash flow metrics. In addition, we provide returns in the form of share repurchases and dividends, which are discussed in the
Liquidity and Capital Resources
section.
Return on Assets and Return on Investment
We include Return on Assets ("ROA"), the most directly comparable measure based on our financial statements presented in accordance with generally accepted accounting principles in the U.S. ("GAAP"), and Return on Investment ("ROI") as metrics to assess returns on assets. While ROI is considered a non-GAAP financial measure, management believes ROI is a meaningful metric to share with investors because it helps investors assess how effectively Walmart is deploying its assets. Trends in ROI can fluctuate over time as management balances long-term potential strategic initiatives with possible short-term impacts. ROA was
5.2%
and
7.2%
for the fiscal years ended
January 31, 2018
and
2017
, respectively. The decline in ROA was primarily due to the loss on extinguishment of debt and the decrease in operating income for the fiscal year ended
January 31, 2018
. ROI was
14.2%
and
15.2%
for the fiscal years ended
January 31, 2018
and
2017
, respectively. The decline in ROI was primarily due to the decrease in operating income for the fiscal year ended
January 31, 2018
.
We define ROI as adjusted operating income (operating income plus interest income, depreciation and amortization, and rent expense) for the fiscal year or trailing 12 months divided by average invested capital during that period. We consider average invested capital to be the average of our beginning and ending total assets, plus average accumulated depreciation and average accumulated amortization, less average accounts payable and average accrued liabilities for that period, plus a rent factor equal to the rent for the fiscal year or trailing 12 months multiplied by a factor of eight. When we have discontinued operations, we exclude the impact of the discontinued operations.
Our calculation of ROI is considered a non-GAAP financial measure because we calculate ROI using financial measures that exclude and include amounts that are included and excluded in the most directly comparable financial measure calculated and presented in accordance with GAAP. For example, we exclude the impact of depreciation and amortization from our reported operating income in calculating the numerator of our calculation of ROI. In addition, we include a factor of eight for rent expense that estimates the hypothetical capitalization of our operating leases. As mentioned above, we consider ROA to be the financial measure computed in accordance with GAAP that is the most directly comparable financial measure to our calculation of ROI. ROI differs from ROA (which is consolidated net income for the period divided by average total assets for the period) because ROI: adjusts operating income to exclude certain expense items and adds interest income; adjusts total assets for the impact of accumulated depreciation and amortization, accounts payable and accrued liabilities; and incorporates a factor of rent to arrive at total invested capital. Because of the adjustments mentioned above, we believe ROI more accurately measures how we are deploying our key assets and is more meaningful to investors than ROA.
Although ROI is a standard financial metric, numerous methods exist for calculating a company's ROI. As a result, the method used by management to calculate our ROI may differ from the methods used by other companies to calculate their ROI.
37
The calculation of ROA and ROI, along with a reconciliation of ROI to the calculation of ROA, the most comparable GAAP financial measure, is as follows:
|
|
Fiscal Years Ended January 31,
|
|||||||
|
(Amounts in millions)
|
2018
|
2017
|
||||||
|
CALCULATION OF RETURN ON ASSETS
|
||||||||
|
Numerator
|
||||||||
|
Consolidated net income
|
$
|
10,523
|
|
$
|
14,293
|
|
||
|
Denominator
|
||||||||
|
Average total assets
(1)
|
$
|
201,674
|
|
$
|
199,203
|
|
||
|
Return on assets (ROA)
|
5.2
|
%
|
7.2
|
%
|
||||
|
CALCULATION OF RETURN ON INVESTMENT
|
||||||||
|
Numerator
|
||||||||
|
Operating income
|
$
|
20,437
|
|
$
|
22,764
|
|
||
|
+ Interest income
|
152
|
|
100
|
|
||||
|
+ Depreciation and amortization
|
10,529
|
|
10,080
|
|
||||
|
+ Rent
|
2,932
|
|
2,612
|
|
||||
|
= Adjusted operating income
|
$
|
34,050
|
|
$
|
35,556
|
|
||
|
Denominator
|
||||||||
|
Average total assets
(1)
|
$
|
201,674
|
|
$
|
199,203
|
|
||
|
+ Average accumulated depreciation and amortization
(1)
|
79,995
|
|
74,245
|
|
||||
|
- Average accounts payable
(1)
|
43,763
|
|
39,960
|
|
||||
|
- Average accrued liabilities
(1)
|
21,388
|
|
20,131
|
|
||||
|
+ Rent x 8
|
23,456
|
|
20,896
|
|
||||
|
= Average invested capital
|
$
|
239,974
|
|
$
|
234,253
|
|
||
|
Return on investment (ROI)
|
14.2
|
%
|
15.2
|
%
|
||||
|
|
As of January 31,
|
|||||||||||
|
|
2018
|
2017
|
2016
|
|||||||||
|
Certain Balance Sheet Data
|
||||||||||||
|
Total assets
|
$
|
204,522
|
|
$
|
198,825
|
|
$
|
199,581
|
|
|||
|
Accumulated depreciation and amortization
|
83,039
|
|
76,951
|
|
71,538
|
|
||||||
|
Accounts payable
|
46,092
|
|
41,433
|
|
38,487
|
|
||||||
|
Accrued liabilities
|
22,122
|
|
20,654
|
|
19,607
|
|
||||||
(1) The average is based on the addition of the account balance at the end of the current period to the account balance at the end of the prior period and dividing by 2.
Free Cash Flow
Free cash flow is considered a non-GAAP financial measure.
Management believes, however, that free cash flow, which measures our ability to generate additional cash from our business operations, is an important financial measure for use in evaluating the Company's financial performance. Free cash flow should be considered in addition to, rather than as a substitute for, consolidated net income as a measure of our performance and net cash provided by operating activities as a measure of our liquidity. See
Liquidity and Capital Resources
for discussions of GAAP metrics including net cash provided by operating activities, net cash used in investing activities and net cash used in financing activities.
We define free cash flow as net cash provided by operating activities in a period minus payments for property and equipment made in that period. We had net cash provided by operating activities of
$28.3 billion
,
$31.7 billion
and
$27.6 billion
for fiscal
2018
,
2017
and
2016
, respectively. We generated free cash flow of
$18.3 billion
,
$21.1 billion
and
$16.1 billion
for fiscal
2018
,
2017
and
2016
, respectively. The decreases in net cash provided by operating activities and free cash flow in fiscal
2018
from fiscal
2017
were primarily due to the
timing of tax and other payments, as well as lapping the previous year's improvements in working capital management
and the benefit from the application of tax regulations adopted in fiscal 2017. The increase in net cash provided by operating activities and free cash flow in fiscal
2017
from fiscal
2016
was primarily due to
improved working capital management. Additionally, we benefited from the application of new tax regulations related to the accelerated deduction of remodels and related expenses.
Walmart's definition of free cash flow is limited in that it does not represent residual cash flows available for discretionary expenditures due to the fact that the measure does not deduct the payments required for debt service and other contractual obligations or payments made for business acquisitions. Therefore, we believe it is important to view free cash flow as a measure that provides supplemental information to our
Consolidated Statements of Cash Flows
.
38
Although other companies report their free cash flow, numerous methods may exist for calculating a company's free cash flow. As a result, the method used by Walmart's management to calculate our free cash flow may differ from the methods used by other companies to calculate their free cash flow.
The following table sets forth a reconciliation of free cash flow, a non-GAAP financial measure, to net cash provided by operating activities, which we believe to be the GAAP financial measure most directly comparable to free cash flow, as well as information regarding net cash used in investing activities and net cash used in financing activities:
|
|
Fiscal Years Ended January 31,
|
|||||||||||
|
(Amounts in millions)
|
2018
|
2017
|
2016
|
|||||||||
|
Net cash provided by operating activities
|
$
|
28,337
|
|
$
|
31,673
|
|
$
|
27,552
|
|
|||
|
Payments for property and equipment
|
(10,051
|
)
|
(10,619
|
)
|
(11,477
|
)
|
||||||
|
Free cash flow
|
$
|
18,286
|
|
$
|
21,054
|
|
$
|
16,075
|
|
|||
|
Net cash used in investing activities
(1)
|
$
|
(9,060
|
)
|
$
|
(13,987
|
)
|
$
|
(10,675
|
)
|
|||
|
Net cash used in financing activities
|
(19,875
|
)
|
(19,072
|
)
|
(16,285
|
)
|
||||||
(1) "Net cash used in investing activities" includes payments for property and equipment, which is also included in our computation of free cash flow.
Results of Operations
Consolidated Results of Operations
|
Fiscal Years Ended January 31,
|
||||||||||||
|
(Amounts in millions, except unit counts)
|
2018
|
2017
|
2016
|
|||||||||
|
Total revenues
|
$
|
500,343
|
|
$
|
485,873
|
|
$
|
482,130
|
|
|||
|
Percentage change from comparable period
|
3.0
|
%
|
0.8
|
%
|
(0.7
|
)%
|
||||||
|
Net sales
|
$
|
495,761
|
|
$
|
481,317
|
|
$
|
478,614
|
|
|||
|
Percentage change from comparable period
|
3.0
|
%
|
0.6
|
%
|
(0.7
|
)%
|
||||||
|
Total U.S. calendar comparable sales increase
|
2.2
|
%
|
1.4
|
%
|
0.3
|
%
|
||||||
|
Gross profit rate
|
24.7
|
%
|
24.9
|
%
|
24.6
|
%
|
||||||
|
Operating income
|
$
|
20,437
|
|
$
|
22,764
|
|
$
|
24,105
|
|
|||
|
Operating income as a percentage of net sales
|
4.1
|
%
|
4.7
|
%
|
5.0
|
%
|
||||||
|
Consolidated net income
|
$
|
10,523
|
|
$
|
14,293
|
|
$
|
15,080
|
|
|||
|
Unit counts at period end
|
11,718
|
|
11,695
|
|
11,528
|
|
||||||
|
Retail square feet at period end
|
1,158
|
|
1,164
|
|
1,149
|
|
||||||
Our total revenues, which are mostly comprised of net sales, but also include membership and other income, increased
$14.5 billion
or
3.0%
and $3.7 billion or
0.8%
for fiscal
2018
and
2017
, respectively, when compared to the previous fiscal year.
Net sales
increased
$14.4 billion
or
3.0%
and $2
.7 billion or
0.6%
for fiscal
2018
and
2017
, respectively, when compared to the previous fiscal year. For fiscal
2018
, net sales were positively impacted by overall positive comparable sales, the impact from new store openings and
sales generated from eCommerce acquisitions
. Additionally, for fiscal
2018
, the increase in net sales was partially offset by a reduction in net sales of $1.9 billion due to
divesting our Yihaodian and Suburbia businesses
and the
$0.5 billion
of negative impact from fluctuations in currency exchange rates. For fiscal
2017
, net sales were positively impacted by overall positive comparable sales and the 1.3% year-over-year growth in consolidated retail square feet. The positive effect of such factors on our consolidated net sales for fiscal
2017
was partially offset by a negative impact of $11.0 billion or 2.3% as a result of fluctuations in currency exchange rates and a $0.4 billion decrease in fuel sales from lower fuel prices at the Sam's Club segment.
Our gross profit rate decreased
26
basis points for fiscal
2018
and increased 36 basis points for fiscal
2017
, when compared to the previous fiscal year. For fiscal
2018
, the decrease was primarily due to strategic price investments and the mix impact from eCommerce. For fiscal
2017
, the increase in gross profit rate was primarily due to improved margin in food and consumables, including the impact of savings in procuring merchandise and lower transportation expense from lower fuel costs in the Walmart U.S. segment. Additionally, improvement in certain markets' inventory management and cost analytics programs in the Walmart International segment also positively impacted our gross profit rate for fiscal
2017
.
Operating expenses as a percentage of net sales increased
32
and 88 basis points for fiscal
2018
and
2017
, respectively, when compared to the previous fiscal year. For fiscal
2018
, the increase in operating expenses as a percentage of net sales was primarily due to approximately $0.6 billion in charges related to Sam's Club closures and discontinued real estate projects, approximately $400 million related to a lump sum bonus paid to associates, $300 million related to Home Office severance, a legal accrual of $283 million related to the FCPA matter in the third quarter, a charge of $244 million related to discontinued real estate projects in Walmart U.S., and the decisions to exit certain international properties and wind down the first party Brazil eCommerce operations. For fiscal
2017
, the increase in operating expenses as a percentage of net sales was primarily due to an increase in wage expense at the Walmart U.S. and Sam's Club segments resulting from the continued investment in associate wage structure, a $370 million charge related to discontinued domestic real estate projects and severance, and our
39
continued investments in eCommerce and technology. The increase in operating expenses as a percentage of net sales for fiscal
2017
was partially offset by the impact of store closures in the fourth quarter of fiscal 2016.
Membership and other income was relatively flat for fiscal
2018
and increased $1.0 billion for fiscal
2017
, when compared to the same period in the previous fiscal year. While fiscal
2018
included a $387 million gain from the sale of Suburbia, a $47 million gain from a land sale, higher recycling income from our sustainability efforts and higher membership income from increased Plus Member penetration at Sam's Club,
these gains were less than gains recognized in fiscal
2017
. Fiscal
2017
included a $535 million gain from the sale of our Yihaodian business and a $194 million gain from the sale of shopping malls in Chile.
For fiscal 2018, loss on extinguishment of debt was
$3.1 billion
, due to the early extinguishment of long-term debt which
allowed us to retire higher rate debt to reduce interest expense in future periods
.
Our effective income tax rate was
30.4%
for fiscal
2018
and
30.3%
for both fiscal
2017
and
2016
. Although relatively consistent year-over-year, our effective income tax rate may fluctuate from period to period as a result of factors including changes in our assessment of certain tax contingencies, valuation allowances, changes in tax laws, outcomes of administrative audits, the impact of discrete items and the mix of earnings among our U.S. operations and international operations. The reconciliation from the U.S. statutory rate to the effective income tax rates for fiscal
2018
,
2017
and
2016
is presented in
Note 9
in the "
Notes to Consolidated Financial Statements
" and describes the impact of the enactment of the Tax Cuts and Jobs Act of 2017 (the "Tax Act") to the fiscal 2018 effective income tax rate.
As a result of the factors discussed above, we reported
$10.5 billion
and
$14.3 billion
of consolidated net income for fiscal
2018
and
2017
, respectively, which represents a decrease of
$3.8 billion
and
$0.8 billion
for fiscal
2018
and
2017
, respectively, when compared to the previous fiscal year. Diluted net income per common share attributable to Walmart ("EPS") was
$3.28
and
$4.38
for fiscal
2018
and
2017
, respectively.
Walmart U.S. Segment
|
|
Fiscal Years Ended January 31,
|
|||||||||||
|
(Amounts in millions, except unit counts)
|
2018
|
2017
|
2016
|
|||||||||
|
Net sales
|
$
|
318,477
|
|
$
|
307,833
|
|
$
|
298,378
|
|
|||
|
Percentage change from comparable period
|
3.5
|
%
|
|
3.2
|
%
|
3.6
|
%
|
|||||
|
Calendar comparable sales increase
|
2.1
|
%
|
1.6
|
%
|
1.0
|
%
|
||||||
|
Operating income
|
$
|
17,869
|
|
$
|
17,745
|
|
$
|
19,087
|
|
|||
|
Operating income as a percentage of net sales
|
5.6
|
%
|
5.8
|
%
|
6.4
|
%
|
||||||
|
Unit counts at period end
|
4,761
|
|
|
4,672
|
|
4,574
|
|
|||||
|
Retail square feet at period end
|
705
|
|
|
699
|
|
690
|
|
|||||
Net sales for the Walmart U.S. segment increased
$10.6 billion
or
3.5%
and $9.5 billion or
3.2%
for fiscal
2018
and
2017
, respectively, when compared to the previous fiscal year. The increases in net sales were primarily due to increases in comparable store sales of
2.1%
and
1.6%
for fiscal
2018
and
2017
, respectively, and year-over-year growth in retail square feet of
0.7%
and 1.4% for fiscal
2018
and
2017
, respectively. Additionally, for fiscal
2018
,
sales generated from eCommerce acquisitions
further contributed to the year-over-year increase.
Gross profit rate decreased
24
basis points for fiscal
2018
and increased 24 basis points for fiscal
2017
, when compared to the previous fiscal year. For fiscal
2018
, the decrease was primarily due to strategic price investments and the mix impact from eCommerce. Partially offsetting the negative factors for fiscal
2018
was the positive impact of savings from procuring merchandise. For fiscal
2017
, the increase in gross profit rate was primarily due to improved margin in food and consumables, including the impact of savings in procuring merchandise and lower transportation expense from lower fuel costs.
Operating expenses as a percentage of segment net sales was relatively flat for fiscal
2018
and increased 101 basis points for fiscal
2017
, when compared to the previous fiscal year. Fiscal
2018
and fiscal
2017
included charges related to discontinued real estate projects of $244 million and $249 million, respectively. For fiscal
2017
, the increase was primarily driven by an increase in wage expense due to the investment in the associate wage structure; the charge related to discontinued real estate projects; and investments in digital retail and technology. The increase in operating expenses as a percentage of segment net sales for fiscal
2017
was partially offset by the impact of store closures in fiscal 2016.
As a result of the factors discussed above, segment operating income increased
$124 million
for fiscal
2018
and decreased $1.3 billion for fiscal
2017
, respectively.
40
Walmart International Segment
|
|
Fiscal Years Ended January 31,
|
|||||||||||
|
(Amounts in millions, except unit counts)
|
2018
|
2017
|
2016
|
|||||||||
|
Net sales
|
$
|
118,068
|
|
$
|
116,119
|
|
$
|
123,408
|
|
|||
|
Percentage change from comparable period
|
1.7
|
%
|
(5.9
|
)%
|
(9.4
|
)%
|
||||||
|
Operating income
|
$
|
5,352
|
|
$
|
5,758
|
|
$
|
5,346
|
|
|||
|
Operating income as a percentage of net sales
|
4.5
|
%
|
5.0
|
%
|
4.3
|
%
|
||||||
|
Unit counts at period end
|
6,360
|
|
|
6,363
|
|
6,299
|
|
|||||
|
Retail square feet at period end
|
373
|
|
|
377
|
|
372
|
|
|||||
Net sales for the Walmart International segment increased
$1.9 billion
or
1.7%
for fiscal
2018
and decreased $7.3 billion or
5.9%
for fiscal
2017
, when compared to the previous fiscal year. For fiscal
2018
, the increase in net sales was due to positive comparable sales in the majority of our markets and the impact of new stores, partially offset by a reduction in net sales of $1.9 billion due to
divesting our Yihaodian and Suburbia businesses
and a
$0.5 billion
negative impact from fluctuations in currency exchange rates. For fiscal
2017
, the decrease in net sales was due to a $11.0 billion negative impact from fluctuations in currency exchange rates. Additionally, net sales for fiscal
2017
were impacted by positive comparable sales in all of our markets, except in the United Kingdom, and year-over-year growth in retail square feet of 1.2%.
Gross profit rate decreased
28
basis points for fiscal
2018
and increased 46 basis points for fiscal
2017
, when compared to the previous fiscal year. For fiscal
2018
, the decrease in the gross profit rate was primarily due to strategic price investments in certain markets. For fiscal
2017
, the increase in gross profit rate was primarily due to improvement in certain markets' inventory management and cost analytics programs.
Membership and other income decreased
14.0%
for fiscal
2018
and increased 69.4% for fiscal
2017
, when compared to the previous fiscal year. While fiscal
2018
included a $387 million gain from the sale of Suburbia and a $47 million gain from a land sale,
these gains were less than gains recognized in fiscal
2017
. Fiscal
2017
included a $535 million gain from the sale of our Yihaodian business and a $194 million gain from the sale of shopping malls in Chile
.
Operating expenses as a percentage of segment net sales decreased
11
basis points for fiscal
2018
and increased 58 basis points for fiscal
2017
, when compared to the previous fiscal year. The decrease in operating expenses as a percentage of segment net sales for fiscal
2018
was primarily due to an increase in net sales partially offset by restructuring and impairment charges in certain markets of approximately $0.5 billion, including charges from decisions to exit certain properties and to wind down the first party Brazil eCommerce operations. The increase in operating expenses as a percentage of segment net sales for fiscal
2017
was primarily due to declining sales on relatively flat fixed costs in the United Kingdom, as well as adjustments to useful lives of certain assets and impairment charges in certain markets.
Segment operating income was negatively impacted by fluctuations in currency exchange rates of
$68 million
and $642 million for fiscal
2018
and
2017
, respectively. As a result of the factors discussed above, segment operating income decreased
$406 million
for fiscal
2018
and increased $412 million for fiscal
2017
, respectively.
Sam's Club Segment
We believe the information in the below table under the caption "Excluding Fuel" is useful to investors because it permits investors to understand the effect of the Sam's Club segment's fuel sales on its results of operations, which are impacted by the volatility of fuel prices. Volatility in fuel prices may continue to impact the operating results of the Sam's Club segment in the future.
|
|
Fiscal Years Ended January 31,
|
|||||||||||
|
(Amounts in millions, except unit counts)
|
2018
|
2017
|
2016
|
|||||||||
|
Including Fuel
|
||||||||||||
|
Net sales
|
$
|
59,216
|
|
$
|
57,365
|
|
$
|
56,828
|
|
|||
|
Percentage change from comparable period
|
3.2
|
%
|
0.9
|
%
|
(2.1
|
)%
|
||||||
|
Calendar comparable sales increase (decrease)
|
2.8
|
%
|
0.5
|
%
|
(3.2
|
)%
|
||||||
|
Operating income
|
$
|
982
|
|
$
|
1,671
|
|
$
|
1,820
|
|
|||
|
Operating income as a percentage of net sales
|
1.7
|
%
|
2.9
|
%
|
3.2
|
%
|
||||||
|
Unit counts at period end
|
597
|
|
|
660
|
|
655
|
|
|||||
|
Retail square feet at period end
|
80
|
|
|
88
|
|
88
|
|
|||||
|
Excluding Fuel
|
||||||||||||
|
Net sales
|
$
|
54,456
|
|
$
|
53,289
|
|
$
|
52,330
|
|
|||
|
Percentage change from comparable period
|
2.2
|
%
|
1.8
|
%
|
1.4
|
%
|
||||||
|
Operating income
|
$
|
864
|
|
$
|
1,619
|
|
$
|
1,746
|
|
|||
|
Operating income as a percentage of net sales
|
1.6
|
%
|
3.0
|
%
|
3.3
|
%
|
||||||
41
Net sales for the Sam's Club segment increased
$1.9 billion
or
3.2%
and $0.5 billion or
0.9%
for fiscal
2018
and
2017
, respectively, when compared to the previous fiscal year. For fiscal
2018
, the increase in net sales was primarily due to an increase in comparable sales which were benefited by an increase of
$0.7 billion
in fuel sales from higher fuel prices in fiscal
2018
. For fiscal
2017
, the increase in net sales was primarily due to an increase in comparable sales without fuel driven by higher eCommerce sales, and a year-over-year increase in retail square feet of 0.9%, partially offset by a decrease of $0.4 billion in fuel sales primarily from lower fuel prices in fiscal
2017
. In the future, net sales will be negatively impacted by our decision to remove tobacco in certain clubs.
Gross profit rate decreased
44
basis points for fiscal
2018
and increased 39 basis points for fiscal
2017
, when compared to the previous fiscal year. For fiscal
2018
, the decrease in gross profit rate was primarily due to the impact of markdowns to liquidate inventory related to the club closures, a reclassification of certain supply expenses from operating expenses to cost of goods sold, higher inventory shrink, increased shipping costs at samsclub.com and the investment in cash rewards. For fiscal
2017
, the increase in gross profit rate was primarily due to margin rate improvement in home and apparel, health and wellness, and grocery, partially offset by changes in merchandise mix and the growth of the Cash Rewards program.
Membership and other income increased
2.3%
for fiscal
2018
and decreased 6.5% for fiscal
2017
, when compared to the previous fiscal year. For fiscal
2018
, the increase in membership and other income was primarily due to higher recycling income from our sustainability efforts and an increase of 1.3% in membership income resulting from increased Plus Member penetration. For fiscal
2017
, the decrease was primarily due to a reduction in other income partially offset by an increase of 2.3% in membership income as a result of increased Plus Member renewals.
Operating expenses as a percentage of segment net sales increased
80
and 49 basis points for fiscal
2018
and
2017
, respectively, when compared to the previous fiscal year. For fiscal
2018
, the increase in operating expenses as a percentage of segment net sales was primarily due to a charge of approximately $0.6 billion related to club closures and discontinued real estate projects. For fiscal
2017
, the increase in operating expenses as a percentage of segment net sales was primarily due to an increase in wage, benefit and incentive expenses from the investment in the associate wage structure, as well as our investments in eCommerce and technology and an increase in advertising expense.
As a result of the factors discussed above, segment operating income decreased
$689 million
and $149 million f
or fiscal
2018
and
2017
, respectively.
Liquidity and Capital Resources
Liquidity
The strength and stability of our operations have historically supplied us with a significant source of liquidity. Our cash flows provided by operating activities, supplemented with our long-term debt and short-term borrowings, have been sufficient to fund our operations while allowing us to invest in activities that support the long-term growth of our operations. Generally, some or all of the remaining available cash flow has been used to fund the dividends on our common stock and share repurchases. We believe our sources of liquidity will continue to be adequate to fund operations, finance our global investment and expansion activities, pay dividends and fund our share repurchases for the foreseeable future.
Net Cash Provided by Operating Activities
|
Fiscal Years Ended January 31,
|
||||||||||||
|
(Amounts in millions)
|
2018
|
2017
|
2016
|
|||||||||
|
Net cash provided by operating activities
|
$
|
28,337
|
|
$
|
31,673
|
|
$
|
27,552
|
|
|||
Net cash provided by operating activities was
$28.3 billion
,
$31.7 billion
and
$27.6 billion
for fiscal
2018
,
2017
and
2016
, respectively. The decrease in net cash provided by operating activities for fiscal
2018
, when compared to the previous fiscal year, was due to the
timing of tax and other payments, as well as lapping the previous year's improvements in working capital management
and the benefit from the application of tax regulations adopted in fiscal 2017. The increase in net cash provided by operating activities for fiscal
2017
, when compared to the previous fiscal year, was primarily due to
improved working capital management. Additionally, we benefited from the application of new tax regulations related to the accelerated deduction of remodels and related expenses.
Cash Equivalents and Working Capital
Cash and cash equivalents were
$6.8 billion
and
$6.9 billion
at
January 31, 2018
and
2017
, respectively. Our working capital deficit was
$18.9 billion
and
$9.2 billion
at
January 31, 2018
and
2017
, respectively. The increase in our working capital deficit reflects an increase in short-term borrowings as part of our long-term debt extinguishment activity as well as improved procurement and inventory management. We generally operate with a working capital deficit due to our efficient use of cash in funding operations, consistent access to the capital markets and returns provided to our shareholders in the form of payments of cash dividends and share repurchases.
42
We use intercompany financing arrangements in an effort to ensure cash can be made available in the country in which it is needed with the minimum cost possible. We do not believe it will be necessary to repatriate earnings held outside of the U.S. and anticipate our domestic liquidity needs will be met through cash flows provided by domestic operating activities, supplemented with long-term debt and short-term borrowings. Accordingly, we intend, with only certain exceptions, to continue to indefinitely reinvest our earnings held outside of the U.S. in our foreign operations. As part of U.S. tax reform enacted on December 22, 2017, we are currently assessing the impact of the new legislation, which can in turn, impact our assertion regarding any potential future repatriation. If our intentions with respect to reinvestment were to change, most of the amounts held within our foreign operations could be repatriated to the U.S., although any repatriation under new U.S. tax laws could be subject to incremental withholding taxes. We do not expect current local laws, other existing limitations or potential taxes on anticipated future repatriations of cash amounts held outside of the U.S. to have a material effect on our overall liquidity, financial condition or results of operations.
As of
January 31, 2018
and
2017
, cash and cash equivalents of
$1.4 billion
and
$1.0 billion
, respectively, may not be freely transferable to the U.S. due to local laws or other restrictions.
Net Cash Used in Investing Activities
|
|
Fiscal Years Ended January 31,
|
|||||||||||
|
(Amounts in millions)
|
2018
|
2017
|
2016
|
|||||||||
|
Net cash used in investing activities
|
$
|
(9,060
|
)
|
$
|
(13,987
|
)
|
$
|
(10,675
|
)
|
|||
Net cash used in investing activities was
$9.1 billion
,
$14.0 billion
and
$10.7 billion
for fiscal
2018
,
2017
and
2016
, respectively, and generally consisted of payments to remodel existing stores and clubs, expand our eCommerce capabilities, invest in other technologies and add stores and clubs. Net cash used in investing activities decreased
$4.9 billion
for fiscal
2018
, when compared to the previous fiscal year. Fiscal
2018
included cash received of $1.0 billion from the sale of Suburbia in Mexico, while fiscal
2017
included our acquisition of Jet.com, Inc. ("jet.com") for approximately $2.4 billion and our purchase of $1.9 billion of available for sale securities in JD.com ("JD"). Net cash used in investing activities increased $3.3 billion for fiscal
2017
, when compared to the previous fiscal year, primarily due to our acquisition of jet.com and investment in JD, partially offset by $0.7 billion in cash received from the sales of shopping malls in Chile. Refer to
Note 13
to our Consolidated Financial Statements for further details on our acquisition of jet.com and investment in JD. Additionally, refer to the "
Strategic Capital Allocation
" section in our
Company Performance Metrics
for capital expenditure detail for fiscal 2018 and 2017.
We continued to focus on eCommerce, including a seamless omni-channel shopping experience, in each of our segments during fiscal
2018
. Our fiscal
2018
accomplishments in this area include growing "Online Grocery" to over 1,100 pickup locations in the U.S., new dedicated eCommerce fulfillment centers, two-day free shipping with no membership fee at Walmart U.S. and one-hour delivery from stores in China.
Growth Activities
For the fiscal year ending January 31,
2019
("fiscal
2019
"), we project capital expenditures will be approximately $11.0 billion and involve:
|
•
|
in Walmart U.S., continuing to prioritize store remodels and digital experiences, with approximately 1,000 additional online grocery locations;
|
|
•
|
in Walmart International, investing more in fulfillment capabilities in addition to new stores; and,
|
|
•
|
eCommerce investments that include enhanced supply chain capabilities.
|
Globally, in fiscal
2019
, we expect to add approximately 280 new, expanded or relocated stores and clubs, with approximately 255 of those in Walmart International, focusing on key markets such as Mexico and China.
Net Cash Used in Financing Activities
|
|
Fiscal Years Ended January 31,
|
|||||||||||
|
(Amounts in millions)
|
2018
|
2017
|
2016
|
|||||||||
|
Net cash used in financing activities
|
$
|
(19,875
|
)
|
$
|
(19,072
|
)
|
$
|
(16,285
|
)
|
|||
Net cash flows used in financing activities generally consist of transactions related to our short-term and long-term debt, financing obligations, dividends paid and the repurchase of Company stock. Transactions with noncontrolling interests are also classified as cash flows from financing activities. Net cash used in financing activities increased
$0.8 billion
and
$2.8 billion
for fiscal
2018
and
2017
, respectively, when compared to the same period in the previous fiscal year. Net cash used in financing activities for fiscal
2018
increased due to premiums paid for early extinguishment of debt. Net cash used in financing
43
activities for fiscal
2017
increased primarily due to repurchases of Company stock partially offset by lower repayments of long-term debt. Further discussion of financing activities is provided by major category below.
Short-term Borrowings
Net cash flows provided by short-term borrowings increased
$4.1 billion
in fiscal
2018
and decreased
$1.7 billion
in fiscal
2017
, when compared to the balance at the end of the previous fiscal year. We generally utilize the liquidity provided by short-term borrowings to provide funding for our operations, dividend payments, share repurchases, capital expenditures and other cash requirements. For fiscal
2018
, the additional cash provided by short-term borrowings was primarily due to the timing of our January 2018 debt extinguishment. For fiscal
2017
, the decrease in net cash flows provided by short-term borrowings was due to improved cash flows from operations driven by working capital improvements and changes to tax regulations.
The following table includes additional information related to the Company's short-term borrowings for fiscal
2018
,
2017
and
2016
:
|
|
Fiscal Years Ended January 31,
|
|||||||||||
|
(Amounts in millions)
|
2018
|
2017
|
2016
|
|||||||||
|
Maximum amount outstanding at any month-end
|
$
|
11,386
|
|
$
|
9,493
|
|
$
|
10,551
|
|
|||
|
Average daily short-term borrowings
|
8,131
|
|
5,691
|
|
4,536
|
|
||||||
|
Annual weighted-average interest rate
|
1.3
|
%
|
1.8
|
%
|
1.5
|
%
|
||||||
In addition to our short-term borrowings, we also have various undrawn committed lines of credit in the U.S. that provide
$12.5 billion
and various undrawn committed lines of credit outside of the U.S. that provide approximately $4.0 billion of additional liquidity, if needed.
Long-term Debt
The following table provides the changes in our long-term debt for fiscal
2018
:
|
(Amounts in millions)
|
Long-term debt due within one year
|
Long-term debt
|
Total
|
|||||||||
|
Balances as of February 1, 2017
|
$
|
2,256
|
|
$
|
36,015
|
|
$
|
38,271
|
|
|||
|
Proceeds from issuance of long-term debt
|
—
|
|
7,476
|
|
7,476
|
|
||||||
|
Payments of long-term debt
|
(1,789
|
)
|
(11,272
|
)
|
(13,061
|
)
|
||||||
|
Reclassifications of long-term debt
|
3,224
|
|
(3,224
|
)
|
—
|
|
||||||
|
Other
|
47
|
|
1,050
|
|
1,097
|
|
||||||
|
Balances as of January 31, 2018
|
$
|
3,738
|
|
$
|
30,045
|
|
$
|
33,783
|
|
|||
Our total long-term debt decreased
$4.5 billion
for fiscal
2018
, primarily due to the extinguishment and maturities of certain long-term debt, partially offset by the issuance of long-term debt. The extinguishment of certain long-term debt
allowed us to retire higher rate debt to reduce interest expense in future periods
.
Dividends
Our total dividend payments were
$6.1 billion
,
$6.2 billion
and
$6.3 billion
for fiscal
2018
,
2017
and
2016
, respectively. On
February 20, 2018
, the Board of Directors approved the fiscal
2019
annual dividend of
$2.08
per share, an increase over the fiscal
2018
annual dividend of
$2.04
per share. For fiscal
2019
, the annual dividend will be paid in
four
quarterly installments of
$0.52
per share, according to the following record and payable dates:
|
Record Date
|
|
Payable Date
|
|
March 9, 2018
|
|
April 2, 2018
|
|
May 11, 2018
|
|
June 4, 2018
|
|
August 10, 2018
|
|
September 4, 2018
|
|
December 7, 2018
|
|
January 2, 2019
|
Company Share Repurchase Program
From time to time, we repurchase shares of our common stock under share repurchase programs authorized by the Company's Board of Directors. All repurchases made during the fiscal year prior to November 20, 2017 were made under the plan in effect at the beginning of fiscal
2018
. On October 9, 2017, the Board of Directors approved a new
$20.0 billion
share repurchase program which, beginning on November 20, 2017, replaced the previous share repurchase program. As of
January 31, 2018
, authorization for
$18.8 billion
of share repurchases remained under the current share repurchase program. Any repurchased shares are constructively retired and returned to an unissued status.
We regularly review share repurchase activity and consider several factors in determining when to execute share repurchases, including, among other things, current cash needs, capacity for leverage, cost of borrowings, our results of operations and the market price of our common stock. We anticipate that a significant majority of the ongoing share repurchase program will be
44
funded through the Company's free cash flows. The following table provides, on a settlement date basis, the number of shares repurchased, average price paid per share and total amount paid for share repurchases for fiscal
2018
,
2017
and
2016
:
|
Fiscal Years Ended January 31,
|
||||||||||||
|
(Amounts in millions, except per share data)
|
2018
|
2017
|
2016
|
|||||||||
|
Total number of shares repurchased
|
104.9
|
|
119.9
|
|
62.4
|
|
||||||
|
Average price paid per share
|
$
|
79.11
|
|
$
|
69.18
|
|
$
|
65.90
|
|
|||
|
Total amount paid for share repurchases
|
$
|
8,296
|
|
$
|
8,298
|
|
$
|
4,112
|
|
|||
Share repurchases were flat for fiscal
2018
and increased
$4.2 billion
for fiscal
2017
, respectively, when compared to the previous fiscal year.
Significant Transactions with Noncontrolling Interests
In fiscal 2016, as described in
Note 13
to our Consolidated Financial Statements, we completed the purchase of all of the remaining noncontrolling interest in Yihaodian, our eCommerce operations in China, for approximately $760 million, using existing cash to complete the transaction. The Company subsequently sold Yihaodian to JD in fiscal 2017.
Capital Resources
We believe cash flows from operations, our current cash position and access to capital markets will continue to be sufficient to meet our anticipated operating cash needs, which include funding seasonal buildups in merchandise inventories and funding our capital expenditures, dividend payments and share repurchases.
We have strong commercial paper and long-term debt ratings that have enabled and should continue to enable us to refinance our debt as it becomes due at favorable rates in capital markets. At
January 31, 2018
, the ratings assigned to our commercial paper and rated series of our outstanding long-term debt were as follows:
|
Rating agency
|
|
Commercial paper
|
|
Long-term debt
|
|
Standard & Poor's
|
|
A-1+
|
|
AA
|
|
Moody's Investors Service
|
|
P-1
|
|
Aa2
|
|
Fitch Ratings
|
|
F1+
|
|
AA
|
Credit rating agencies review their ratings periodically and, therefore, the credit ratings assigned to us by each agency may be subject to revision at any time. Accordingly, we are not able to predict whether our current credit ratings will remain consistent over time. Factors that could affect our credit ratings include changes in our operating performance, the general economic environment, conditions in the retail industry, our financial position, including our total debt and capitalization, and changes in our business strategy. Any downgrade of our credit ratings by a credit rating agency could increase our future borrowing costs or impair our ability to access capital and credit markets on terms commercially acceptable to us. In addition, any downgrade of our current short-term credit ratings could impair our ability to access the commercial paper markets with the same flexibility that we have experienced historically, potentially requiring us to rely more heavily on more expensive types of debt financing. The credit rating agency ratings are not recommendations to buy, sell or hold our commercial paper or debt securities. Each rating may be subject to revision or withdrawal at any time by the assigning rating organization and should be evaluated independently of any other rating. Moreover, each credit rating is specific to the security to which it applies.
45
Contractual Obligations
The following table sets forth certain information concerning our obligations to make contractual future payments, such as debt and lease agreements, and certain contingent commitments as of
January 31, 2018
:
|
|
|
|
|
Payments Due During Fiscal Years Ending January 31,
|
||||||||||||||||
|
(Amounts in millions)
|
|
Total
|
|
2019
|
|
2020-2021
|
|
2022-2023
|
|
Thereafter
|
||||||||||
|
Recorded contractual obligations:
|
|
|
|
|
|
|
|
|
|
|
||||||||||
|
Long-term debt
(1)
|
|
$
|
33,783
|
|
|
$
|
3,733
|
|
|
$
|
5,250
|
|
|
$
|
3,541
|
|
|
$
|
21,259
|
|
|
Short-term borrowings
|
|
5,257
|
|
|
5,257
|
|
|
—
|
|
|
—
|
|
|
—
|
|
|||||
|
Capital lease and financing obligations
(2)
|
|
9,930
|
|
|
1,039
|
|
|
1,929
|
|
|
1,539
|
|
|
5,423
|
|
|||||
|
Unrecorded contractual obligations:
|
|
|
|
|
|
|
|
|
|
|
||||||||||
|
Non-cancelable operating leases
(3)
|
|
15,366
|
|
|
1,933
|
|
|
3,250
|
|
|
2,539
|
|
|
7,644
|
|
|||||
|
Estimated interest on long-term debt
|
|
17,601
|
|
|
1,291
|
|
|
2,319
|
|
|
2,121
|
|
|
11,870
|
|
|||||
|
Trade and stand-by letters of credit
|
|
2,626
|
|
|
2,626
|
|
|
—
|
|
|
—
|
|
|
—
|
|
|||||
|
Purchase obligations
|
|
13,278
|
|
|
6,121
|
|
|
5,094
|
|
|
1,138
|
|
|
925
|
|
|||||
|
Total contractual obligations
|
|
$
|
97,841
|
|
|
$
|
22,000
|
|
|
$
|
17,842
|
|
|
$
|
10,878
|
|
|
$
|
47,121
|
|
|
(1)
|
"Long-term debt" includes the fair value of our derivatives designated as fair value hedges.
|
|
(2)
|
"Capital lease and financing obligations" includes executory costs and imputed interest related to capital lease and financing obligations that are not yet recorded. Refer to
Note 11
to our Consolidated Financial Statements for more information.
|
|
(3)
|
Represents minimum contractual obligation for non-cancelable leases with initial or remaining terms greater than 12 months as of
January 31, 2018
.
|
Additionally, the Company has
$12.5 billion
in undrawn committed lines of credit in the U.S. and approximately $4.0 billion of undrawn committed lines of credit outside of the U.S. which, if drawn upon, would be included in the current liabilities section of the Company's Consolidated Balance Sheets.
Estimated interest payments are based on our principal amounts and expected maturities of all debt outstanding at
January 31, 2018
, and assumes interest rates remain at current levels for our variable rate debt.
Purchase obligations include legally binding contracts, such as firm commitments for inventory and utility purchases, as well as commitments to make capital expenditures, software acquisition and license commitments and legally binding service contracts. For the purposes of this table, contractual obligations for the purchase of goods or services are defined as agreements that are enforceable and legally binding and that specify all significant terms, including: fixed or minimum quantities to be purchased; fixed, minimum or variable price provisions; and the approximate timing of the transaction. Contracts that specify the Company will purchase all or a portion of its requirements of a specific product or service from a supplier, but do not include a fixed or minimum quantity, are excluded from the table above. Additionally, purchase orders for inventory are not included in the table above as purchase orders represent authorizations to purchase rather than binding agreements. Our purchase orders are based on our current inventory needs and are fulfilled by our suppliers within short time periods. We also enter into contracts for outsourced services; however, the obligations under these contracts are not significant and the contracts generally contain clauses allowing for cancellation without significant penalty.
The expected timing for payment discussed above is estimated based on current information. Timing of payments and actual amounts paid may be different depending on the timing of receipt of goods or services or changes to agreed-upon amounts for some obligations.
In addition to the amounts shown in the table above,
$1.0 billion
of unrecognized tax benefits are considered uncertain tax positions and have been recorded as liabilities. The timing of the payment, if any, associated with these liabilities is uncertain. Refer to
Note 9
to our Consolidated Financial Statements for additional discussion of unrecognized tax benefits.
Off Balance Sheet Arrangements
As of
January 31, 2018
, we had no off-balance sheet arrangements that have, or are reasonably likely to have, a current or future material effect on our consolidated financial condition, results of operations, liquidity, capital expenditures or capital resources.
46
Other Matters
We discuss our existing FCPA investigation and related matters, including certain risks arising therefrom, in
Part I, Item 1A
of this Form 10-K under the caption "Risk Factors" and under the sub-caption "Legal Proceedings" in
Note 10
to our Consolidated Financial Statements, which is captioned "Contingencies," and appears elsewhere herein. We also discuss various legal proceedings related to the FCPA investigation in
Item 3
herein under the caption "Part I, Item 3. Legal Proceedings," under the sub-caption "II. Certain Other Proceedings." We discuss the "equal value" claims against our United Kingdom subsidiary, ASDA Stores, Ltd., including certain risks arising therefrom, in
Part I, Item 1A
of this Form 10-K under the caption "Risk Factors" and under the sub-caption "Legal Proceedings" in
Note 10
to our Consolidated Financial Statements, which is captioned "Contingencies," and appears elsewhere herein. We discuss the national prescription opiate litigation including certain risks arising therefrom, in
Part I, Item 1A
of this Form 10-K under the caption "Risk Factors" and under the sub-caption "Legal Proceedings" in
Note 10
to our Consolidated Financial Statements, which is captioned "Contingencies," and appears elsewhere herein.
Summary of Critical Accounting Estimates
Management strives to report our financial results in a clear and understandable manner, although in some cases accounting and disclosure rules are complex and require us to use technical terminology. In preparing the Company's Consolidated Financial Statements, we follow accounting principles generally accepted in the U.S. These principles require us to make certain estimates and apply judgments that affect our financial position and results of operations as reflected in our financial statements. These judgments and estimates are based on past events and expectations of future outcomes. Actual results may differ from our estimates.
Management continually reviews our accounting policies, how they are applied and how they are reported and disclosed in our financial statements. Following is a summary of our critical accounting estimates and how they are applied in preparation of the financial statements.
Inventories
We value
inventories at the lower of cost or market as determined primarily by the retail inventory method of accounting, using the last-in, first-out ("LIFO") method for Walmart U.S. segment's inventories. The inventory at the Walmart International segment is valued primarily by the retail inventory method of accounting, using the first-in, first-out ("FIFO") method. The retail inventory method of accounting results in inventory being valued at the lower of cost or market, since permanent markdowns are immediately recorded as a reduction of the retail value of inventory. The inventory at the Sam's Club segment is valued using the weighted-average cost LIFO method.
Under the retail method of accounting, inventory is valued at the lower of cost or market, which is determined by applying a cost-to-retail ratio to each merchandise grouping's retail value. The FIFO cost-to-retail ratio is generally based on the fiscal year purchase activity. The cost-to-retail ratio for measuring any LIFO provision is based on the initial margin of the fiscal year purchase activity less the impact of any permanent markdowns. The retail method of accounting requires management to make certain judgments and estimates that may significantly impact the ending inventory valuation at cost, as well as the amount of gross profit recognized. Judgments made include recording markdowns used to sell inventory and shrinkage. When management determines the ability to sell inventory has diminished, markdowns for clearance activity and the related cost impact are recorded. Factors considered in the determination of markdowns include current and anticipated demand, customer preferences and age of merchandise, as well as seasonal and fashion trends. Changes in weather and customer preferences could also cause changes in the amount and timing of markdowns from year to year.
When necessary, we record a LIFO provision for the estimated annual effect of inflation, and these estimates are adjusted to actual results determined at year-end. Our LIFO provision is calculated based on inventory levels, markup rates and internally generated retail price indices. As a measure of sensitivity, a 1% increase to our retail price indices would not have resulted in a decrease to the carrying value of inventory. At
January 31, 2018
and
2017
, our inventories valued at LIFO approximated those inventories as if they were valued at FIFO.
We provide for estimated inventory losses, or shrinkage, between physical inventory counts on the basis of a historical percentage of sales. Following annual inventory counts, the provision is adjusted to reflect updated historical results. Historically, our estimated inventory losses have been materially accurate when compared to annual inventory counts and we expect that trend to continue.
Impairment of Assets
We evaluate long-lived assets, other than goodwill and assets with indefinite lives, for indicators of impairment whenever events or changes in circumstances indicate their carrying amounts may not be recoverable. Management's judgments regarding the existence of impairment indicators are based on market conditions and financial performance. The evaluation of long-lived assets is performed at the lowest level of identifiable cash flows, which is generally at the individual store level. The variability of these factors depends on a number of conditions, including uncertainty about future events and changes in
47
demographics. Thus, our accounting estimates may change from period to period. These factors could cause management to conclude that indicators of impairment exist and require impairment tests be performed, which could result in management determining the value of long-lived assets is impaired, resulting in a write-down of the related long-lived assets. Although impairment charges for fiscal
2018
were
$1.4 billion
, these charges
primarily related to restructuring activities described in
Note 14
,
as well as discontinued real estate projects in the U.S. and decisions to exit certain international properties
. Impairment charges not related to restructuring activities or decisions to exit properties for fiscal 2018 were not material and would not change materially with a 10% decrease in the undiscounted cash flows for the stores with indicators of impairment.
Additionally, total impairment charges for fiscal
2017
were not material.
Goodwill and other indefinite-lived acquired intangible assets are not amortized, but are evaluated for impairment annually or whenever events or changes in circumstances indicate that the value of a certain asset may be impaired. Generally, this evaluation begins with a qualitative assessment to determine whether a quantitative impairment test is necessary. If we determine, after performing an assessment based on the qualitative factors, that the fair value of the reporting unit is more likely than not less than the carrying amount, or that a fair value of the reporting unit substantially in excess of the carrying amount cannot be assured, then a quantitative impairment test would be performed. The quantitative test for impairment requires management to make judgments relating to future cash flows, growth rates and economic and market conditions. These evaluations are based on determining the fair value of a reporting unit or asset using a valuation method such as discounted cash flow or a relative, market-based approach. Historically, our reporting units and other indefinite-lived acquired intangible assets have generated sufficient returns to recover the cost of goodwill and other indefinite-lived acquired intangible assets. Because of the nature of the factors used in these tests, if different conditions occur in future periods, future operating results could be materially impacted. For approximately $300 million of certain acquired indefinite-lived intangible assets, the fair value approximated the carrying value; any deterioration in the fair value may result in an impairment charge.
Income Taxes
Income taxes have a significant effect on our net earnings. We are subject to income taxes in the U.S. and numerous foreign jurisdictions. Accordingly, the determination of our provision for income taxes requires significant judgment, the use of estimates and the interpretation and application of complex tax laws. Our effective income tax rate is affected by many factors, including changes in our assessment of certain tax contingencies, increases and decreases in valuation allowances, changes in tax law, outcomes of administrative audits, the impact of discrete items and the mix of earnings among our U.S. and international operations where the statutory rates are generally lower than the U.S. statutory rate, and may fluctuate as a result.
Our tax returns are routinely audited and settlements of issues raised in these audits sometimes affect our tax provisions. The benefits of uncertain tax positions are recorded in our financial statements only after determining a more likely than not probability that the uncertain tax positions will withstand challenge, if any, from taxing authorities. When facts and circumstances change, we reassess these probabilities and record any changes in the financial statements as appropriate. We account for uncertain tax positions by determining the minimum recognition threshold that a tax position is required to meet before being recognized in the financial statements. This determination requires the use of significant judgment in evaluating our tax positions and assessing the timing and amounts of deductible and taxable items.
Deferred tax assets represent amounts available to reduce income taxes payable on taxable income in future years. Such assets arise because of temporary differences between the financial reporting and tax bases of assets and liabilities, as well as from net operating loss and tax credit carryforwards. Deferred tax assets are evaluated for future realization and reduced by a valuation allowance to the extent that a portion is not more likely than not to be realized. Many factors are considered when assessing whether it is more likely than not that the deferred tax assets will be realized, including recent cumulative earnings, expectations of future taxable income, carryforward periods and other relevant quantitative and qualitative factors. The recoverability of the deferred tax assets is evaluated by assessing the adequacy of future expected taxable income from all sources, including reversal of taxable temporary differences, forecasted operating earnings and available tax planning strategies. This evaluation relies heavily on estimates.
On December 22, 2017, the Tax Cuts and Jobs Act of 2017 (the "Tax Act") was enacted and contains significant changes to U.S. income tax law. Effective in 2018, the Tax Act reduces the U.S. statutory tax rate from 35 percent to 21 percent and creates new taxes on foreign-sourced earnings and related-party payments. In addition, the Company was subject to a one-time transition tax in fiscal 2018 on accumulated foreign subsidiary earnings not previously subject to U.S. income tax.
During the fourth quarter of fiscal 2018, the Company recorded a net tax benefit of
$0.2 billion
related to the enactment of the Tax Act. The benefit primarily related to the remeasurement of the Company's deferred tax assets and liabilities considering the Tax Act's newly enacted tax rates and is net of the Tax Act's one-time transition tax on previously unremitted earnings of non-U.S. subsidiaries. As discussed in
Note 9
to our Consolidated Financial Statements, as the Company collects and prepares necessary data, and interprets the Tax Act and any additional guidance issued by the U.S. Treasury Department, the IRS, and other standard-setting bodies, the Company may make adjustments to the provisional amounts. Those adjustments may materially impact our provision for income taxes and effective tax rate in the period in which the adjustments are made. The accounting for the tax effects of the Tax Act is provisional and will be completed by the measurement period provided in Staff Accounting Bulletin No. 118.
48
|
ITEM 7A.
|
QUANTITATIVE AND QUALITATIVE DISCLOSURES ABOUT MARKET RISK
|
Market Risk
In addition to the risks inherent in our operations, we are exposed to certain market risks, including changes in interest rates and fluctuations in currency exchange rates.
The analysis presented below for each of our market risk sensitive instruments is based on a hypothetical scenario used to calibrate potential risk and does not represent our view of future market changes. The effect of a change in a particular assumption is calculated without adjusting any other assumption. In reality, however, a change in one factor could cause a change in another, which may magnify or negate other sensitivities.
Interest Rate Risk
We are exposed to changes in interest rates as a result of our short-term borrowings and long-term debt issuances. We hedge a portion of our interest rate risk by managing the mix of fixed and variable rate debt and by entering into interest rate swaps. For fiscal
2018
, the net fair value of our interest rate swaps decreased approximately
$87 million
primarily due to fluctuations in market interest rates.
The table below provides information about our financial instruments that are sensitive to changes in interest rates. For debt obligations, the table represents the principal cash flows and related weighted-average interest rates by expected maturity dates. For interest rate swaps, the table represents the contractual cash flows and weighted-average interest rates by the contractual maturity date, unless otherwise noted. The notional amounts are used to calculate contractual cash flows to be exchanged under the contracts. The weighted-average variable rates are based upon prevailing market rates at
January 31, 2018
.
|
Expected Maturity Date
|
||||||||||||||||||||||||||||
|
(Amounts in millions)
|
Fiscal 2019
|
Fiscal 2020
|
Fiscal 2021
|
Fiscal 2022
|
Fiscal 2023
|
Thereafter
|
Total
|
|||||||||||||||||||||
|
Liabilities
|
||||||||||||||||||||||||||||
|
Short-term borrowings:
|
||||||||||||||||||||||||||||
|
Variable rate
|
$
|
5,257
|
|
$
|
—
|
|
$
|
—
|
|
$
|
—
|
|
$
|
—
|
|
$
|
—
|
|
$
|
5,257
|
|
|||||||
|
Weighted-average interest rate
|
1.5
|
%
|
—
|
%
|
—
|
%
|
—
|
%
|
—
|
%
|
—
|
%
|
1.5
|
%
|
||||||||||||||
|
Long-term debt
(1)
:
|
||||||||||||||||||||||||||||
|
Fixed rate
|
$
|
3,233
|
|
$
|
1,614
|
|
$
|
3,336
|
|
$
|
607
|
|
$
|
2,934
|
|
$
|
21,259
|
|
$
|
32,983
|
|
|||||||
|
Weighted-average interest rate
|
3.2
|
%
|
2.6
|
%
|
2.8
|
%
|
5.5
|
%
|
1.7
|
%
|
4.6
|
%
|
3.9
|
%
|
||||||||||||||
|
Variable rate
|
$
|
500
|
|
$
|
300
|
|
$
|
—
|
|
$
|
—
|
|
$
|
—
|
|
$
|
—
|
|
$
|
800
|
|
|||||||
|
Weighted-average interest rate
|
5.5
|
%
|
1.7
|
%
|
—
|
%
|
—
|
%
|
—
|
%
|
—
|
%
|
4.1
|
%
|
||||||||||||||
|
Interest rate derivatives
|
||||||||||||||||||||||||||||
|
Interest rate swaps:
|
||||||||||||||||||||||||||||
|
Fixed to variable
|
$
|
—
|
|
$
|
—
|
|
$
|
750
|
|
$
|
—
|
|
$
|
—
|
|
$
|
3,250
|
|
$
|
4,000
|
|
|||||||
|
Weighted-average pay rate
|
—
|
%
|
—
|
%
|
3.2
|
%
|
—
|
%
|
—
|
%
|
2.5
|
%
|
2.6
|
%
|
||||||||||||||
|
Weighted-average receive rate
|
—
|
%
|
—
|
%
|
3.3
|
%
|
—
|
%
|
—
|
%
|
2.9
|
%
|
3.0
|
%
|
||||||||||||||
|
(1)
|
The long-term debt amounts in the table exclude the Company's derivatives classified as fair value hedges.
|
As of
January 31, 2018
, our variable rate borrowings, including the effect of our commercial paper and interest rate swaps, represented
26%
of our total short-term and long-term debt. Based on
January 31, 2018
debt levels, a
100
basis point change in prevailing market rates would cause our annual interest costs to change by approximately
$96 million
.
Foreign Currency Risk
We are exposed to fluctuations in foreign currency exchange rates as a result of our net investments and operations in countries other than the U.S. For fiscal
2018
, movements in currency exchange rates and the related impact on the translation of the balance sheets of the Company's subsidiaries in the United Kingdom and Canada were the primary cause of the
$2.3 billion
gain in the currency translation and other category of accumulated other comprehensive loss. We hedge a portion of our foreign currency risk by entering into currency swaps and designating certain foreign-currency-denominated long-term debt as net investment hedges.
We hold currency swaps to hedge the currency exchange component of our net investments and also to hedge the currency exchange rate fluctuation exposure associated with the forecasted payments of principal and interest of non-U.S. denominated debt. The aggregate fair value of these swaps was in an asset position of
$413 million
at
January 31, 2018
and a liability position of
$147 million
at
January 31, 2017
. The change in the fair value of these swaps was due to fluctuations in currency exchange rates, primarily the strengthening of other currencies relative to the U.S. dollar in fiscal
2018
. A hypothetical 10% increase or decrease in the currency exchange rates underlying these swaps from the market rate at
January 31, 2018
would have resulted in a loss or gain in the value of the swaps of
$560 million
. A hypothetical 10% change in interest rates underlying
49
these swaps from the market rates in effect at
January 31, 2018
would have resulted in a loss or gain in the value of the swaps of
$22 million
.
In addition to currency swaps, we have designated foreign-currency-denominated long-term debt as nonderivative hedges of net investments of certain of our foreign operations. We had outstanding long-term debt of
£1.7 billion
at
January 31, 2018
and
£2.5 billion
at
January 31, 2017
that was designated as a hedge of our net investment in the United Kingdom. At
January 31, 2018
, a hypothetical 10% increase or decrease in the value of the U.S. dollar relative to the British pound would have resulted in a change in the value of the debt of
$217 million
. In addition, we had outstanding long-term debt of
¥180 billion
at
January 31, 2018
and
¥10 billion
at
January 31, 2017
that was designated as a hedge of our net investment in Japan. At
January 31, 2018
, a hypothetical 10% increase or decrease in value of the U.S. dollar relative to the Japanese yen would have resulted in a change in the value of the debt of
$150 million
.
In certain countries, we also enter into immaterial foreign currency forward contracts to hedge the purchase and payment of purchase commitments denominated in non-functional currencies.
Investment Risk
During fiscal
2018
, the fair value of our available-for-sale investment in JD increased approximately
$1.5 billion
, due to an increase in the market value of JD.
50
|
ITEM 8.
|
FINANCIAL STATEMENTS AND SUPPLEMENTARY DATA
|
Consolidated Financial Statements of Walmart Inc.
(formerly "Wal-Mart Stores, Inc.")
For the Fiscal Year Ended
January 31, 2018
Table of Contents
|
Page
|
|
51
Management's Report to Our Shareholders
Walmart Inc.
Management of Walmart Inc. ("Walmart," the "company" or "we") is responsible for the preparation, integrity and objectivity of Walmart's Consolidated Financial Statements and other financial information contained in this Annual Report on Form 10-K. Those Consolidated Financial Statements were prepared in conformity with accounting principles generally accepted in the United States. In preparing those Consolidated Financial Statements, management is required to make certain estimates and judgments, which are based upon currently available information and management's view of current conditions and circumstances.
The Audit Committee of the Board of Directors oversees our process of reporting financial information and the audit of our Consolidated Financial Statements. The Audit Committee stays informed of the financial condition of Walmart and regularly reviews management's financial policies and procedures, the independence of our independent auditors, our internal control over financial reporting and the objectivity of our financial reporting. Both the independent auditors and the internal auditors have free access to the Audit Committee and meet with the Audit Committee regularly, both with and without management present.
Acting through our Audit Committee, we have retained Ernst & Young LLP, an independent registered public accounting firm, to audit our Consolidated Financial Statements appearing below. We have made available to Ernst & Young LLP all of our financial records and related data in connection with their audit of our Consolidated Financial Statements. We have filed with the Securities and Exchange Commission ("SEC") the required certifications related to our Consolidated Financial Statements as of and for the year ended
January 31, 2018
. These certifications are attached as exhibits to this Annual Report on Form 10-K. Additionally, we have also provided to the New York Stock Exchange the required annual certification of our Chief Executive Officer regarding our compliance with the New York Stock Exchange's corporate governance listing standards.
52
Report of Independent Registered Public Accounting Firm
To the Shareholders and the Board of Directors of Walmart Inc.
Opinion on the Financial Statements
We have audited the accompanying consolidated balance sheets of Walmart Inc. (the Company) as of
January 31, 2018
and
2017
, the related consolidated statements of income, comprehensive income, shareholders' equity and cash flows for each of the three years in the period ended
January 31, 2018
, and the related notes (collectively referred to as the "consolidated financial statements"). In our opinion, the consolidated financial statements present fairly, in all material respects, the financial position of the Company at
January 31, 2018
and
2017
, and the results of its operations and its cash flows for each of the three years in the period ended
January 31, 2018
, in conformity with U.S. generally accepted accounting principles.
We also have audited, in accordance with the standards of the Public Company Accounting Oversight Board (United States) (PCAOB), the Company's internal control over financial reporting as of
January 31, 2018
, based on criteria established in Internal Control-Integrated Framework issued by the Committee of Sponsoring Organizations of the Treadway Commission (2013 framework) and our report dated
March 30, 2018
expressed an unqualified opinion thereon.
Basis for Opinion
These financial statements are the responsibility of the Company's management. Our responsibility is to express an opinion on the Company's financial statements based on our audits. We are a public accounting firm registered with the PCAOB and are required to be independent with respect to the Company in accordance with the U.S. federal securities laws and the applicable rules and regulations of the Securities and Exchange Commission and the PCAOB.
We conducted our audits in accordance with the standards of the PCAOB. Those standards require that we plan and perform the audit to obtain reasonable assurance about whether the financial statements are free of material misstatement, whether due to error or fraud. Our audits included performing procedures to assess the risks of material misstatement of the financial statements, whether due to error or fraud, and performing procedures that respond to those risks. Such procedures included examining, on a test basis, evidence regarding the amounts and disclosures in the financial statements. Our audits also included evaluating the accounting principles used and significant estimates made by management, as well as evaluating the overall presentation of the financial statements. We believe that our audits provide a reasonable basis for our opinion.
/s/ Ernst & Young LLP
We have served as the Company's auditor since 1969.
Rogers, Arkansas
March 30, 2018
53
Report of Independent Registered Public Accounting Firm
To the Shareholders and the Board of Directors of Walmart Inc.
Opinion on Internal Control over Financial Reporting
We have audited Walmart Inc.'s internal control over financial reporting as of
January 31, 2018
, based on criteria established in Internal Control-Integrated Framework issued by the Committee of Sponsoring Organizations of the Treadway Commission (2013 framework) (the COSO criteria). In our opinion, Walmart Inc. (the Company) maintained, in all material respects, effective internal control over financial reporting as of
January 31, 2018
, based on the COSO criteria.
We also have audited, in accordance with the standards of the Public Company Accounting Oversight Board (United States) (PCAOB), the accompanying consolidated balance sheets of Walmart Inc. as of
January 31, 2018
and
2017
, the related consolidated statements of income, comprehensive income, shareholders' equity and cash flows for each of the three years in the period ended
January 31, 2018
, and the related notes and our report dated
March 30, 2018
expressed an unqualified opinion thereon.
Basis for Opinion
The Company's management is responsible for maintaining effective internal control over financial reporting and for its assessment of the effectiveness of internal control over financial reporting included in the accompanying Report on Internal Control over Financial Reporting. Our responsibility is to express an opinion on the Company's internal control over financial reporting based on our audit. We are a public accounting firm registered with the PCAOB and are required to be independent with respect to the Company in accordance with the U.S. federal securities laws and the applicable rules and regulations of the Securities and Exchange Commission and the PCAOB.
We conducted our audit in accordance with the standards of the PCAOB. Those standards require that we plan and perform the audit to obtain reasonable assurance about whether effective internal control over financial reporting was maintained in all material respects.
Our audit included obtaining an understanding of internal control over financial reporting, assessing the risk that a material weakness exists, testing and evaluating the design and operating effectiveness of internal control based on the assessed risk, and performing such other procedures as we considered necessary in the circumstances. We believe that our audit provides a reasonable basis for our opinion.
Definition and Limitations of Internal Control over Financial Reporting
A company's internal control over financial reporting is a process designed to provide reasonable assurance regarding the reliability of financial reporting and the preparation of financial statements for external purposes in accordance with generally accepted accounting principles. A company's internal control over financial reporting includes those policies and procedures that (1) pertain to the maintenance of records that, in reasonable detail, accurately and fairly reflect the transactions and dispositions of the assets of the company; (2) provide reasonable assurance that transactions are recorded as necessary to permit preparation of financial statements in accordance with generally accepted accounting principles, and that receipts and expenditures of the company are being made only in accordance with authorizations of management and directors of the company; and (3) provide reasonable assurance regarding prevention or timely detection of unauthorized acquisition, use, or disposition of the company's assets that could have a material effect on the financial statements.
Because of its inherent limitations, internal control over financial reporting may not prevent or detect misstatements. Also, projections of any evaluation of effectiveness to future periods are subject to the risk that controls may become inadequate because of changes in conditions, or that the degree of compliance with the policies or procedures may deteriorate.
/s/ Ernst & Young LLP
Rogers, Arkansas
March 30, 2018
54
Walmart Inc.
|
Fiscal Years Ended January 31,
|
||||||||||||
|
(Amounts in millions, except per share data)
|
2018
|
2017
|
2016
|
|||||||||
|
Revenues:
|
||||||||||||
|
Net sales
|
$
|
495,761
|
|
$
|
481,317
|
|
$
|
478,614
|
|
|||
|
Membership and other income
|
4,582
|
|
4,556
|
|
3,516
|
|
||||||
|
Total revenues
|
500,343
|
|
485,873
|
|
482,130
|
|
||||||
|
Costs and expenses:
|
||||||||||||
|
Cost of sales
|
373,396
|
|
361,256
|
|
360,984
|
|
||||||
|
Operating, selling, general and administrative expenses
|
106,510
|
|
101,853
|
|
97,041
|
|
||||||
|
Operating income
|
20,437
|
|
22,764
|
|
24,105
|
|
||||||
|
Interest:
|
||||||||||||
|
Debt
|
1,978
|
|
2,044
|
|
2,027
|
|
||||||
|
Capital lease and financing obligations
|
352
|
|
323
|
|
521
|
|
||||||
|
Interest income
|
(152
|
)
|
(100
|
)
|
(81
|
)
|
||||||
|
Interest, net
|
2,178
|
|
2,267
|
|
2,467
|
|
||||||
|
Loss on extinguishment of debt
|
3,136
|
|
—
|
|
—
|
|
||||||
|
Income before income taxes
|
15,123
|
|
20,497
|
|
21,638
|
|
||||||
|
Provision for income taxes
|
4,600
|
|
6,204
|
|
6,558
|
|
||||||
|
Consolidated net income
|
10,523
|
|
14,293
|
|
15,080
|
|
||||||
|
Consolidated net income attributable to noncontrolling interest
|
(661
|
)
|
(650
|
)
|
(386
|
)
|
||||||
|
Consolidated net income attributable to Walmart
|
$
|
9,862
|
|
$
|
13,643
|
|
$
|
14,694
|
|
|||
|
Net income per common share:
|
||||||||||||
|
Basic net income per common share attributable to Walmart
|
$
|
3.29
|
|
$
|
4.40
|
|
$
|
4.58
|
|
|||
|
Diluted net income per common share attributable to Walmart
|
3.28
|
|
4.38
|
|
4.57
|
|
||||||
|
Weighted-average common shares outstanding:
|
||||||||||||
|
Basic
|
2,995
|
|
3,101
|
|
3,207
|
|
||||||
|
Diluted
|
3,010
|
|
3,112
|
|
3,217
|
|
||||||
|
Dividends declared per common share
|
$
|
2.04
|
|
$
|
2.00
|
|
$
|
1.96
|
|
|||
See accompanying notes.
55
Walmart Inc.
Consolidated Statements of Comprehensive Income
|
|
Fiscal Years Ended January 31,
|
|||||||||||
|
(Amounts in millions)
|
2018
|
2017
|
2016
|
|||||||||
|
Consolidated net income
|
$
|
10,523
|
|
$
|
14,293
|
|
$
|
15,080
|
|
|||
|
Consolidated net income attributable to noncontrolling interest
|
(661
|
)
|
(650
|
)
|
(386
|
)
|
||||||
|
Consolidated net income attributable to Walmart
|
9,862
|
|
13,643
|
|
14,694
|
|
||||||
|
Other comprehensive income (loss), net of income taxes
|
||||||||||||
|
Currency translation and other
|
2,540
|
|
(3,027
|
)
|
(5,220
|
)
|
||||||
|
Net investment hedges
|
(405
|
)
|
413
|
|
366
|
|
||||||
|
Unrealized gain on available-for-sale securities
|
1,501
|
|
145
|
|
—
|
|
||||||
|
Cash flow hedges
|
437
|
|
21
|
|
(202
|
)
|
||||||
|
Minimum pension liability
|
147
|
|
(397
|
)
|
86
|
|
||||||
|
Other comprehensive income (loss), net of income taxes
|
4,220
|
|
(2,845
|
)
|
(4,970
|
)
|
||||||
|
Other comprehensive (income) loss attributable to noncontrolling interest
|
(169
|
)
|
210
|
|
541
|
|
||||||
|
Other comprehensive income (loss) attributable to Walmart
|
4,051
|
|
(2,635
|
)
|
(4,429
|
)
|
||||||
|
Comprehensive income, net of income taxes
|
14,743
|
|
11,448
|
|
10,110
|
|
||||||
|
Comprehensive (income) loss attributable to noncontrolling interest
|
(830
|
)
|
(440
|
)
|
155
|
|
||||||
|
Comprehensive income attributable to Walmart
|
$
|
13,913
|
|
$
|
11,008
|
|
$
|
10,265
|
|
|||
See accompanying notes.
56
Walmart Inc.
|
As of January 31,
|
||||||||
|
(Amounts in millions)
|
2018
|
2017
|
||||||
|
ASSETS
|
||||||||
|
Current assets:
|
||||||||
|
Cash and cash equivalents
|
$
|
6,756
|
|
$
|
6,867
|
|
||
|
Receivables, net
|
5,614
|
|
5,835
|
|
||||
|
Inventories
|
43,783
|
|
43,046
|
|
||||
|
Prepaid expenses and other
|
3,511
|
|
1,941
|
|
||||
|
Total current assets
|
59,664
|
|
57,689
|
|
||||
|
Property and equipment:
|
||||||||
|
Property and equipment
|
185,154
|
|
179,492
|
|
||||
|
Less accumulated depreciation
|
(77,479
|
)
|
(71,782
|
)
|
||||
|
Property and equipment, net
|
107,675
|
|
107,710
|
|
||||
|
Property under capital lease and financing obligations:
|
||||||||
|
Property under capital lease and financing obligations
|
12,703
|
|
11,637
|
|
||||
|
Less accumulated amortization
|
(5,560
|
)
|
(5,169
|
)
|
||||
|
Property under capital lease and financing obligations, net
|
7,143
|
|
6,468
|
|
||||
|
Goodwill
|
18,242
|
|
17,037
|
|
||||
|
Other assets and deferred charges
|
11,798
|
|
9,921
|
|
||||
|
Total assets
|
$
|
204,522
|
|
$
|
198,825
|
|
||
|
LIABILITIES AND EQUITY
|
||||||||
|
Current liabilities:
|
||||||||
|
Short-term borrowings
|
$
|
5,257
|
|
$
|
1,099
|
|
||
|
Accounts payable
|
46,092
|
|
41,433
|
|
||||
|
Accrued liabilities
|
22,122
|
|
20,654
|
|
||||
|
Accrued income taxes
|
645
|
|
921
|
|
||||
|
Long-term debt due within one year
|
3,738
|
|
2,256
|
|
||||
|
Capital lease and financing obligations due within one year
|
667
|
|
565
|
|
||||
|
Total current liabilities
|
78,521
|
|
66,928
|
|
||||
|
Long-term debt
|
30,045
|
|
36,015
|
|
||||
|
Long-term capital lease and financing obligations
|
6,780
|
|
6,003
|
|
||||
|
Deferred income taxes and other
|
8,354
|
|
9,344
|
|
||||
|
Commitments and contingencies
|
|
|
||||||
|
Equity:
|
||||||||
|
Common stock
|
295
|
|
305
|
|
||||
|
Capital in excess of par value
|
2,648
|
|
2,371
|
|
||||
|
Retained earnings
|
85,107
|
|
89,354
|
|
||||
|
Accumulated other comprehensive loss
|
(10,181
|
)
|
(14,232
|
)
|
||||
|
Total Walmart shareholders' equity
|
77,869
|
|
77,798
|
|
||||
|
Noncontrolling interest
|
2,953
|
|
2,737
|
|
||||
|
Total equity
|
80,822
|
|
80,535
|
|
||||
|
Total liabilities and equity
|
$
|
204,522
|
|
$
|
198,825
|
|
||
See accompanying notes.
57
Walmart Inc.
Consolidated Statements of Shareholders' Equity
|
Accumulated
|
Total
|
|||||||||||||||||||||||||||||
|
Capital in
|
Other
|
Walmart
|
||||||||||||||||||||||||||||
|
(Amounts in millions)
|
Common Stock
|
Excess of
|
Retained
|
Comprehensive
|
Shareholders'
|
Noncontrolling
|
Total
|
|||||||||||||||||||||||
|
Shares
|
Amount
|
Par Value
|
Earnings
|
Income (Loss)
|
Equity
|
Interest
|
Equity
|
|||||||||||||||||||||||
|
Balances as of February 1, 2015
|
3,228
|
|
$
|
323
|
|
$
|
2,462
|
|
$
|
85,777
|
|
$
|
(7,168
|
)
|
$
|
81,394
|
|
$
|
4,543
|
|
$
|
85,937
|
|
|||||||
|
Consolidated net income
|
—
|
|
—
|
|
—
|
|
14,694
|
|
—
|
|
14,694
|
|
386
|
|
15,080
|
|
||||||||||||||
|
Other comprehensive income (loss), net of income taxes
|
—
|
|
—
|
|
—
|
|
—
|
|
(4,429
|
)
|
(4,429
|
)
|
(541
|
)
|
(4,970
|
)
|
||||||||||||||
|
Cash dividends declared ($1.96 per share)
|
—
|
|
—
|
|
—
|
|
(6,294
|
)
|
—
|
|
(6,294
|
)
|
—
|
|
(6,294
|
)
|
||||||||||||||
|
Purchase of Company stock
|
(65
|
)
|
(6
|
)
|
(102
|
)
|
(4,148
|
)
|
—
|
|
(4,256
|
)
|
—
|
|
(4,256
|
)
|
||||||||||||||
|
Cash dividend declared to noncontrolling interest
|
—
|
|
—
|
|
—
|
|
—
|
|
—
|
|
—
|
|
(691
|
)
|
(691
|
)
|
||||||||||||||
|
Other
|
(1
|
)
|
—
|
|
(555
|
)
|
(8
|
)
|
—
|
|
(563
|
)
|
(632
|
)
|
(1,195
|
)
|
||||||||||||||
|
Balances as of January 31, 2016
|
3,162
|
|
317
|
|
1,805
|
|
90,021
|
|
(11,597
|
)
|
80,546
|
|
3,065
|
|
83,611
|
|
||||||||||||||
|
Consolidated net income
|
—
|
|
—
|
|
—
|
|
13,643
|
|
—
|
|
13,643
|
|
650
|
|
14,293
|
|
||||||||||||||
|
Other comprehensive income (loss), net of income taxes
|
—
|
|
—
|
|
—
|
|
—
|
|
(2,635
|
)
|
(2,635
|
)
|
(210
|
)
|
(2,845
|
)
|
||||||||||||||
|
Cash dividends declared ($2.00 per share)
|
—
|
|
—
|
|
—
|
|
(6,216
|
)
|
—
|
|
(6,216
|
)
|
—
|
|
(6,216
|
)
|
||||||||||||||
|
Purchase of Company stock
|
(120
|
)
|
(12
|
)
|
(174
|
)
|
(8,090
|
)
|
—
|
|
(8,276
|
)
|
—
|
|
(8,276
|
)
|
||||||||||||||
|
Cash dividend declared to noncontrolling interest
|
—
|
|
—
|
|
—
|
|
—
|
|
—
|
|
—
|
|
(519
|
)
|
(519
|
)
|
||||||||||||||
|
Other
|
6
|
|
—
|
|
740
|
|
(4
|
)
|
—
|
|
736
|
|
(249
|
)
|
487
|
|
||||||||||||||
|
Balances as of January 31, 2017
|
3,048
|
|
305
|
|
2,371
|
|
89,354
|
|
(14,232
|
)
|
77,798
|
|
2,737
|
|
80,535
|
|
||||||||||||||
|
Consolidated net income
|
—
|
|
—
|
|
—
|
|
9,862
|
|
—
|
|
9,862
|
|
661
|
|
10,523
|
|
||||||||||||||
|
Other comprehensive income (loss), net of income taxes
|
—
|
|
—
|
|
—
|
|
—
|
|
4,051
|
|
4,051
|
|
169
|
|
4,220
|
|
||||||||||||||
|
Cash dividends declared ($2.04 per share)
|
—
|
|
—
|
|
—
|
|
(6,124
|
)
|
—
|
|
(6,124
|
)
|
—
|
|
(6,124
|
)
|
||||||||||||||
|
Purchase of Company stock
|
(103
|
)
|
(10
|
)
|
(219
|
)
|
(7,975
|
)
|
—
|
|
(8,204
|
)
|
—
|
|
(8,204
|
)
|
||||||||||||||
|
Cash dividend declared to noncontrolling interest
|
—
|
|
—
|
|
—
|
|
—
|
|
—
|
|
—
|
|
(687
|
)
|
(687
|
)
|
||||||||||||||
|
Other
|
7
|
|
—
|
|
496
|
|
(10
|
)
|
—
|
|
486
|
|
73
|
|
559
|
|
||||||||||||||
|
Balances as of January 31, 2018
|
2,952
|
|
$
|
295
|
|
$
|
2,648
|
|
$
|
85,107
|
|
$
|
(10,181
|
)
|
$
|
77,869
|
|
$
|
2,953
|
|
$
|
80,822
|
|
|||||||
See accompanying notes.
58
Walmart Inc.
|
Fiscal Years Ended January 31,
|
||||||||||||
|
(Amounts in millions)
|
2018
|
2017
|
2016
|
|||||||||
|
Cash flows from operating activities:
|
||||||||||||
|
Consolidated net income
|
$
|
10,523
|
|
$
|
14,293
|
|
$
|
15,080
|
|
|||
|
Adjustments to reconcile consolidated net income to net cash provided by operating activities:
|
||||||||||||
|
Depreciation and amortization
|
10,529
|
|
10,080
|
|
9,454
|
|
||||||
|
Deferred income taxes
|
(304
|
)
|
761
|
|
(672
|
)
|
||||||
|
Loss on extinguishment of debt
|
3,136
|
|
—
|
|
—
|
|
||||||
|
Other operating activities
|
1,210
|
|
206
|
|
1,410
|
|
||||||
|
Changes in certain assets and liabilities, net of effects of acquisitions:
|
||||||||||||
|
Receivables, net
|
(1,074
|
)
|
(402
|
)
|
(19
|
)
|
||||||
|
Inventories
|
(140
|
)
|
1,021
|
|
(703
|
)
|
||||||
|
Accounts payable
|
4,086
|
|
3,942
|
|
2,008
|
|
||||||
|
Accrued liabilities
|
928
|
|
1,280
|
|
1,466
|
|
||||||
|
Accrued income taxes
|
(557
|
)
|
492
|
|
(472
|
)
|
||||||
|
Net cash provided by operating activities
|
28,337
|
|
31,673
|
|
27,552
|
|
||||||
|
Cash flows from investing activities:
|
||||||||||||
|
Payments for property and equipment
|
(10,051
|
)
|
(10,619
|
)
|
(11,477
|
)
|
||||||
|
Proceeds from the disposal of property and equipment
|
378
|
|
456
|
|
635
|
|
||||||
|
Proceeds from the disposal of certain operations
|
1,046
|
|
662
|
|
246
|
|
||||||
|
Purchase of available for sale securities
|
—
|
|
(1,901
|
)
|
—
|
|
||||||
|
Business acquisitions, net of cash acquired
|
(375
|
)
|
(2,463
|
)
|
—
|
|
||||||
|
Other investing activities
|
(58
|
)
|
(122
|
)
|
(79
|
)
|
||||||
|
Net cash used in investing activities
|
(9,060
|
)
|
(13,987
|
)
|
(10,675
|
)
|
||||||
|
Cash flows from financing activities:
|
||||||||||||
|
Net change in short-term borrowings
|
4,148
|
|
(1,673
|
)
|
1,235
|
|
||||||
|
Proceeds from issuance of long-term debt
|
7,476
|
|
137
|
|
39
|
|
||||||
|
Repayments of long-term debt
|
(13,061
|
)
|
(2,055
|
)
|
(4,432
|
)
|
||||||
|
Premiums paid to extinguish debt
|
(3,059
|
)
|
—
|
|
—
|
|
||||||
|
Dividends paid
|
(6,124
|
)
|
(6,216
|
)
|
(6,294
|
)
|
||||||
|
Purchase of Company stock
|
(8,296
|
)
|
(8,298
|
)
|
(4,112
|
)
|
||||||
|
Dividends paid to noncontrolling interest
|
(690
|
)
|
(479
|
)
|
(719
|
)
|
||||||
|
Purchase of noncontrolling interest
|
(8
|
)
|
(90
|
)
|
(1,326
|
)
|
||||||
|
Other financing activities
|
(261
|
)
|
(398
|
)
|
(676
|
)
|
||||||
|
Net cash used in financing activities
|
(19,875
|
)
|
(19,072
|
)
|
(16,285
|
)
|
||||||
|
Effect of exchange rates on cash and cash equivalents
|
487
|
|
(452
|
)
|
(1,022
|
)
|
||||||
|
Net increase (decrease) in cash and cash equivalents
|
(111
|
)
|
(1,838
|
)
|
(430
|
)
|
||||||
|
Cash and cash equivalents at beginning of year
|
6,867
|
|
8,705
|
|
9,135
|
|
||||||
|
Cash and cash equivalents at end of year
|
$
|
6,756
|
|
$
|
6,867
|
|
$
|
8,705
|
|
|||
|
Supplemental disclosure of cash flow information:
|
||||||||||||
|
Income taxes paid
|
6,179
|
|
4,507
|
|
8,111
|
|
||||||
|
Interest paid
|
2,450
|
|
2,351
|
|
2,540
|
|
||||||
See accompanying notes.
59
Walmart Inc.
Notes to Consolidated Financial Statements
General
Walmart Inc. (formerly "Wal-Mart Stores, Inc.") ("Walmart" or the "Company") helps people around the world save money and live better – anytime and anywhere – in retail stores and through eCommerce. Through innovation, the Company is striving to create a customer-centric experience that seamlessly integrates digital and physical shopping into an omni-channel offering that saves time for its customers. Each week, the Company serves nearly
270 million
customers who visit its more than
11,700
stores and numerous eCommerce websites under
65
banners in
28
countries. The Company's strategy is to lead on price, invest to differentiate on access, be competitive on assortment and deliver a great experience.
The Company's operations comprise three reportable segments: Walmart U.S., Walmart International and Sam's Club.
Principles of Consolidation
The Consolidated Financial Statements include the accounts of Walmart and its subsidiaries as of and for the fiscal years ended
January 31, 2018
("fiscal
2018
"),
January 31, 2017
("fiscal
2017
") and
January 31, 2016
("fiscal
2016
"). All material intercompany accounts and transactions have been eliminated in consolidation. The Company consolidates variable interest entities where it has been determined that the Company is the primary beneficiary of those entities' operations. Investments in unconsolidated affiliates, which are 50% or less owned and do not otherwise meet consolidation requirements, are accounted for primarily using the equity method. These equity method investments are immaterial to the Company's Consolidated Financial Statements.
The Company's Consolidated Financial Statements are based on a fiscal year ending on January 31 for the United States ("U.S.") and Canadian operations. The Company consolidates all other operations generally using a one-month lag and based on a calendar year. There were no significant intervening events during the month of January
2018
related to the operations consolidated using a lag that materially affected the Consolidated Financial Statements.
Use of Estimates
The Consolidated Financial Statements have been prepared in conformity with U.S. generally accepted accounting principles. Those principles require management to make estimates and assumptions that affect the reported amounts of assets and liabilities. Management's estimates and assumptions also affect the disclosure of contingent assets and liabilities at the date of the financial statements and the reported amounts of revenues and expenses during the reporting period. Actual results may differ from those estimates.
Cash and Cash Equivalents
The Company considers investments with a maturity when purchased of three months or less to be cash equivalents. All credit card, debit card and electronic transfer transactions that process in less than seven days are classified as cash and cash equivalents. The amounts due from banks for these transactions classified as cash and cash equivalents totaled
$1.6 billion
and
$1.5 billion
at
January 31, 2018
and
2017
, respectively. In addition, cash and cash equivalents included restricted cash of
$300 million
and
$265 million
at
January 31, 2018
and
2017
, respectively, which was primarily related to cash collateral holdings from various counterparties, as required by certain derivative and trust agreements.
The Company's cash balances are held in various locations around the world. Substantially all of the Company's
$6.8 billion
of cash and cash equivalents at
January 31, 2018
, was held outside of the U.S. Of the Company's
$6.9 billion
of cash and cash equivalents at January 31,
2017
,
$5.9 billion
was held outside of the U.S. Cash and cash equivalents held outside of the U.S. are generally utilized to support liquidity needs in the Company's non-U.S. operations.
The Company uses intercompany financing arrangements in an effort to ensure cash can be made available in the country in which it is needed with the minimum cost possible. Management does not believe it will be necessary to repatriate earnings held outside of the U.S. and anticipates the Company's domestic liquidity needs will be met through cash flows provided by domestic operating activities, supplemented with long-term debt and short-term borrowings. Accordingly, the Company intends, with only certain exceptions, to continue to indefinitely reinvest the Company's earnings held outside of the U.S. in its foreign operations. As part of the U.S. tax reform enacted on December 22, 2017, the Company is currently assessing the impact of the new legislation, which can in turn, impact its assertion regarding any potential future repatriation. If the Company's intentions with respect to reinvestment were to change, most of the amounts held within the Company's foreign operations could be repatriated to the U.S., although any repatriation under new U.S. tax laws could be subject to incremental withholding taxes. The Company does not expect current local laws, other existing limitations or potential taxes on anticipated future repatriations of earnings held outside of the U.S. to have a material effect on the Company's overall liquidity, financial condition or results of operations.
60
As of
January 31, 2018
and
2017
, cash and cash equivalents of approximately
$1.4 billion
and
$1.0 billion
, respectively, may not be freely transferable to the U.S. due to local laws or other restrictions.
Receivables
Receivables are stated at their carrying values, net of a reserve for doubtful accounts. Receivables consist primarily of amounts due from:
|
•
|
insurance companies resulting from pharmacy sales;
|
|
•
|
banks for customer credit and debit cards and electronic bank transfers that take in excess of seven days to process;
|
|
•
|
suppliers for marketing or incentive programs; and
|
|
•
|
real estate transactions.
|
Inventories
The Company values
inventories at the lower of cost or market as determined primarily by the retail inventory method of accounting, using the last-in, first-out ("LIFO") method for Walmart U.S. segment's inventories. The inventory at the Walmart International segment is valued primarily by the retail inventory method of accounting, using the first-in, first-out ("FIFO") method. The retail inventory method of accounting results in inventory being valued at the lower of cost or market, since permanent markdowns are immediately recorded as a reduction of the retail value of inventory. The inventory at the Sam's Club segment is valued using the weighted-average cost LIFO method.
At
January 31, 2018
and
January 31, 2017
, the Company's inventories valued at LIFO approximated those inventories as if they were valued at FIFO.
Assets Held for Sale
Assets held for sale represent components and businesses that meet accounting requirements to be classified as held for sale and are presented as single asset and liability amounts in the Company's financial statements with a valuation allowance, if necessary, to recognize the net carrying amount at the lower of cost or fair value, less cost to sell. The Company reviews all businesses and assets held for sale each reporting period to determine whether the existing carrying amounts are fully recoverable in comparison to estimated fair values. As of January 31, 2018 and 2017, immaterial amounts for assets and liabilities held for sale were classified within prepaid expenses and other and accrued liabilities, respectively, in the Consolidated Balance Sheets.
Property and Equipment
Property and equipment are initially recorded at cost. Gains or losses on disposition are recognized as earned or incurred. Costs of major improvements are capitalized, while costs of normal repairs and maintenance are charged to expense as incurred. The following table summarizes the Company's property and equipment balances and includes the estimated useful lives that are generally used to depreciate the assets on a straight-line basis:
|
As of January 31,
|
||||||||||
|
(Amounts in millions)
|
Estimated Useful Lives
|
2018
|
2017
|
|||||||
|
Land
|
N/A
|
$
|
25,298
|
|
$
|
24,801
|
|
|||
|
Buildings and improvements
|
3-40 years
|
101,155
|
|
98,547
|
|
|||||
|
Fixtures and equipment
|
1-30 years
|
52,695
|
|
48,998
|
|
|||||
|
Transportation equipment
|
3-15 years
|
2,387
|
|
2,845
|
|
|||||
|
Construction in progress
|
N/A
|
3,619
|
|
4,301
|
|
|||||
|
Property and equipment
|
$
|
185,154
|
|
$
|
179,492
|
|
||||
|
Accumulated depreciation
|
(77,479
|
)
|
(71,782
|
)
|
||||||
|
Property and equipment, net
|
$
|
107,675
|
|
$
|
107,710
|
|
||||
Leasehold improvements are depreciated or amortized over the shorter of the estimated useful life of the asset or the remaining expected lease term. Total depreciation and amortization expense for property and equipment, property under financing obligations and property under capital leases for fiscal
2018
,
2017
and
2016
was
$10.5 billion
,
$10.1 billion
and
$9.5 billion
, respectively.
Leases
The Company estimates the expected term of a lease by assuming the exercise of renewal options where an economic penalty exists that would preclude the abandonment of the lease at the end of the initial non-cancelable term and the exercise of such renewal is at the sole discretion of the Company. The expected term is used in the determination of whether a store or club lease is a capital or operating lease and in the calculation of straight-line rent expense. Additionally, the useful life of leasehold improvements is limited by the expected lease term or the economic life of the asset, whichever is shorter. If significant expenditures are made for leasehold improvements late in the expected term of a lease and renewal is reasonably assured, the
61
useful life of the leasehold improvement is limited to the end of the renewal period or economic life of the asset, whichever is shorter. Rent abatements and escalations are considered in the calculation of minimum lease payments in the Company's capital lease tests and in determining straight-line rent expense for operating leases.
The Company is often involved in the construction of its leased stores. In certain cases, payments made for certain structural components included in the lessor's construction of the leased assets result in the Company being deemed the owner of the leased assets for accounting purposes. As a result, the payments, regardless of the significance, are automatic indicators of ownership and require the Company to capitalize the lessor's total project cost with a corresponding financing obligation. Upon completion of the lessor's project, the Company performs a sale-leaseback analysis to determine if these assets and the related financing obligation can be derecognized from the Company's Consolidated Balance Sheets. If the Company is deemed to have "continuing involvement," the leased assets and the related financing obligation remain on the Company's Consolidated Balance Sheets and are generally amortized over the lease term. At the end of the lease term, including exercise of any renewal options, the net remaining financing obligation over the net carrying value of the fixed asset will be recognized as a non-cash gain on sale of the property.
Long-Lived Assets
Long-lived assets are initially recorded at cost. Management reviews long-lived assets for indicators of impairment whenever events or changes in circumstances indicate that the carrying amount may not be recoverable. The evaluation is performed at the lowest level of identifiable cash flows, which is at the individual store or club level. Undiscounted cash flows expected to be generated by the related assets are estimated over the assets' useful lives based on updated projections. If the evaluation indicates that the carrying amount of the assets may not be recoverable, any potential impairment is measured based upon the fair value of the related asset or asset group as determined by an appropriate market appraisal or other valuation technique.
Goodwill and Other Acquired Intangible Assets
Goodwill represents the excess of the purchase price over the fair value of net assets acquired in business combinations and is allocated to the appropriate reporting unit when acquired. Other acquired intangible assets are stated at the fair value acquired as determined by a valuation technique commensurate with the intended use of the related asset. Goodwill and indefinite-lived intangible assets are not amortized; rather, they are evaluated for impairment annually and whenever events or changes in circumstances indicate that the value of the asset may be impaired. Definite-lived intangible assets are considered long-lived assets and are amortized on a straight-line basis over the periods that expected economic benefits will be provided.
Goodwill is evaluated for impairment using either a qualitative or quantitative approach for each of the Company's reporting units. Generally, a qualitative assessment is first performed to determine whether a quantitative goodwill impairment test is necessary. If management determines, after performing an assessment based on the qualitative factors, that the fair value of the reporting unit is more likely than not less than the carrying amount, or that a fair value of the reporting unit substantially in excess of the carrying amount cannot be assured, then a quantitative goodwill impairment test would be required. The quantitative test for goodwill impairment is performed by determining the fair value of the related reporting units. Fair value is measured based on the discounted cash flow method and relative market-based approaches. After evaluation, management determined the fair value of each reporting unit is greater than the carrying amount and, accordingly, the Company has not recorded any impairment charges related to goodwill.
The following table reflects goodwill activity, by reportable segment, for fiscal
2018
and
2017
:
|
(Amounts in millions)
|
Walmart U.S.
|
Walmart
International
|
Sam's Club
|
Total
|
||||||||||||
|
Balances as of February 1, 2016
|
$
|
461
|
|
$
|
15,921
|
|
$
|
313
|
|
$
|
16,695
|
|
||||
|
Changes in currency translation and other
|
—
|
|
(1,433
|
)
|
—
|
|
(1,433
|
)
|
||||||||
|
Acquisitions
(1)
|
1,775
|
|
—
|
|
—
|
|
1,775
|
|
||||||||
|
Balances as of January 31, 2017
|
2,236
|
|
14,488
|
|
313
|
|
17,037
|
|
||||||||
|
Changes in currency translation and other
|
—
|
|
996
|
|
—
|
|
996
|
|
||||||||
|
Acquisitions
|
209
|
|
—
|
|
—
|
|
209
|
|
||||||||
|
Balances as of January 31, 2018
|
$
|
2,445
|
|
$
|
15,484
|
|
$
|
313
|
|
$
|
18,242
|
|
||||
|
(1)
|
Goodwill recorded for fiscal 2017 Walmart U.S. acquisitions primarily relates to Jet.com, Inc. ("jet.com").
|
Indefinite-lived intangible assets are included in other assets and deferred charges in the Company's Consolidated Balance Sheets. These assets are evaluated for impairment based on their fair values using valuation techniques which are updated annually based on the most recent variables and assumptions. There were no significant impairment charges related to indefinite-lived intangible assets recorded for fiscal
2018
,
2017
and
2016
.
62
Self Insurance Reserves
The Company self-insures a number of risks, including, but not limited to,
workers' compensation, general liability, auto liability, product liability and certain employee-related healthcare benefits
. Standard actuarial procedures and data analysis are used to estimate the liabilities associated with these risks as of the balance sheet date on an undiscounted basis. The recorded liabilities reflect the ultimate cost for claims incurred but not paid and any estimable administrative run-out expenses related to the processing of these outstanding claim payments. On a regular basis, the liabilities are evaluated for appropriateness with claims reserve valuations provided by independent third-party actuaries. To limit exposure to some risks, the Company maintains insurance coverage with varying limits and retentions, including stop-loss insurance coverage for workers' compensation, general liability and auto liability.
Income Taxes
Income taxes are accounted for under the balance sheet method. Deferred tax assets and liabilities are recognized for the estimated future tax consequences attributable to differences between the financial statement carrying amounts of existing assets and liabilities and their respective tax bases ("temporary differences"). Deferred tax assets and liabilities are measured using enacted tax rates in effect for the year in which those temporary differences are expected to be recovered or settled. The effect on deferred tax assets and liabilities of a change in tax rate is recognized in income in the period that includes the enactment date.
Deferred tax assets are evaluated for future realization and reduced by a valuation allowance to the extent that a portion is not more likely than not to be realized. Many factors are considered when assessing whether it is more likely than not that the deferred tax assets will be realized, including recent cumulative earnings, expectations of future taxable income, carryforward periods, and other relevant quantitative and qualitative factors. The recoverability of the deferred tax assets is evaluated by assessing the adequacy of future expected taxable income from all sources, including reversal of taxable temporary differences, forecasted operating earnings and available tax planning strategies. These sources of income rely heavily on estimates.
In determining the provision for income taxes, an annual effective income tax rate is used based on annual income, permanent differences between book and tax income, and statutory income tax rates. Discrete events such as audit settlements or changes in tax laws are recognized in the period in which they occur.
The Company records a liability for unrecognized tax benefits resulting from uncertain tax positions taken or expected to be taken in a tax return. The Company records interest and penalties related to unrecognized tax benefits in interest expense and operating, selling, general and administrative expenses, respectively, in the Company's Consolidated Statements of Income. Refer to
Note 9
for additional income tax disclosures.
Revenue Recognition
Sales
The Company recognizes sales revenue, net of sales taxes and estimated sales returns, at the time it sells merchandise to the customer. eCommerce sales include shipping revenue and are recorded upon delivery to the customer. Additionally, estimated sales returns are calculated using historical experience of actual returns as a percent of sales.
Membership Fee Revenue
The Company recognizes membership fee revenue both in the U.S. and internationally over the term of the membership, which is typically 12 months. The following table summarizes membership fee activity for fiscal
2018
,
2017
and
2016
:
|
|
Fiscal Years Ended January 31,
|
|||||||||||
|
(Amounts in millions)
|
2018
|
2017
|
2016
|
|||||||||
|
Deferred membership fee revenue, beginning of year
|
$
|
743
|
|
$
|
744
|
|
$
|
759
|
|
|||
|
Cash received from members
|
1,398
|
|
1,371
|
|
1,333
|
|
||||||
|
Membership fee revenue recognized
|
(1,411
|
)
|
(1,372
|
)
|
(1,348
|
)
|
||||||
|
Deferred membership fee revenue, end of year
|
$
|
730
|
|
$
|
743
|
|
$
|
744
|
|
|||
Membership fee revenue is included in membership and other income in the Company's Consolidated Statements of Income. The deferred membership fee is included in accrued liabilities in the Company's Consolidated Balance Sheets.
Gift Cards
Customer purchases of gift cards, to be utilized in our stores or on our eCommerce websites, are not recognized as revenue until the card is redeemed and the customer purchases merchandise using the gift card. Gift cards in the U.S. and some countries do not carry an expiration date; therefore, customers and members can redeem their gift cards for merchandise indefinitely. Gift cards in some foreign countries where the Company does business have expiration dates. A certain number of gift cards, both with and without expiration dates, will not be fully redeemed. Management estimates unredeemed gift cards and recognizes
63
revenue for these amounts when it is determined the likelihood of redemption is remote. Management periodically reviews and updates its estimates.
Financial and Other Services
The Company recognizes revenue from service transactions at the time the service is performed. Generally, revenue from services is classified as a component of net sales in the Company's Consolidated Statements of Income.
Cost of Sales
Cost of sales includes actual product cost, the cost of transportation to the Company's distribution facilities, stores and clubs from suppliers, the cost of transportation from the Company's distribution facilities to the stores, clubs and customers and the cost of warehousing for the Sam's Club segment and import distribution centers. Cost of sales is reduced by supplier payments that are not a reimbursement of specific, incremental and identifiable costs.
Payments from Suppliers
The Company receives consideration from suppliers for various programs, primarily volume incentives, warehouse allowances and reimbursements for specific programs such as markdowns, margin protection, advertising and supplier-specific fixtures. Payments from suppliers are accounted for as a reduction of cost of sales, except in certain limited situations when the payment is a reimbursement of specific, incremental and identifiable costs, and are recognized in the Company's Consolidated Statements of Income when the related inventory is sold.
Operating, Selling, General and Administrative Expenses
Operating, selling, general and administrative expenses include all operating costs of the Company, except cost of sales, as described above. As a result, the majority of the cost of warehousing and occupancy for the Walmart U.S. and Walmart International segments' distribution facilities is included in operating, selling, general and administrative expenses. Because the Company only includes a portion of the cost of its Walmart U.S. and Walmart International segments' distribution facilities in cost of sales, its gross profit and gross profit as a percentage of net sales may not be comparable to those of other retailers that may include all costs related to their distribution facilities in cost of sales and in the calculation of gross profit.
Advertising Costs
Advertising costs are expensed as incurred, consist primarily of print, television and digital advertisements and are recorded in operating, selling, general and administrative expenses in the Company's Consolidated Statements of Income. In certain limited situations, reimbursements from suppliers that are for specific, incremental and identifiable advertising costs are recognized as a reduction of advertising costs in operating, selling, general and administrative expenses. Advertising costs were
$3.1 billion
,
$2.9 billion
and
$2.5 billion
for fiscal
2018
,
2017
and
2016
, respectively.
Pre-Opening Costs
The cost of start-up activities, including organization costs, related to new store openings, store remodels, relocations, expansions and conversions are expensed as incurred and included in operating, selling, general and administrative expenses in the Company's Consolidated Statements of Income. Pre-opening costs totaled
$106 million
,
$131 million
and
$271 million
for fiscal
2018
,
2017
and
2016
, respectively.
Currency Translation
The assets and liabilities of all international subsidiaries are translated from the respective local currency to the U.S. dollar using exchange rates at the balance sheet date. Related translation adjustments are recorded as a component of accumulated other comprehensive loss. The Company's Consolidated Statements of Income of all international subsidiaries are translated from the respective local currencies to the U.S. dollar using average exchange rates for the period covered by the income statements.
Recent Accounting Pronouncements
Pronouncements Adopted in Fiscal 2018
In March 2016, the Financial Accounting Standards Board ("FASB") issued Accounting Standards Update ("ASU") 2016-09,
Compensation–Stock Compensation (Topic 718)
, which is intended to simplify accounting for share-based payment transactions. The ASU changed several aspects of the accounting for share-based payment award transactions, including accounting for income taxes, forfeitures and minimum statutory tax withholding requirements. Management adopted this ASU beginning February 1, 2017, and as a result, reclassified an immaterial amount from operating activities to financing activities in the Company's prior year consolidated cash flows.
On December 22, 2017, the Securities and Exchange Commission (SEC) staff issued Staff Accounting Bulletin No. 118,
Income Tax Accounting Implications of the Tax Cuts and Jobs Act
("SAB 118"), in response to the Tax Cuts and Jobs Act of
64
2017 ("Tax Act"). The Company has elected to record provisional amounts, as allowed by SAB 118, during a measurement period not to extend beyond one year of the enactment date. Management expects to complete the analysis within the measurement period in accordance with SAB 118.
Pronouncements to Be Adopted in the Year Ending January 31, 2019 ("fiscal 2019")
In May 2014, the FASB issued ASU 2014-09,
Revenue from Contracts with Customers (Topic 606).
This ASU represents a single comprehensive model to recognize revenue to depict the transfer of promised goods or services to a customer at an amount that reflects the consideration it expects to be entitled to in exchange for those goods or services. The Company adopted this ASU on February 1, 2018, under the modified retrospective approach, which resulted in an immaterial cumulative adjustment to retained earnings. Also, this ASU will require additional disclosures.
In January 2016, the FASB issued ASU 2016-01,
Financial Instruments–Overall (Topic 825)
, which updates certain aspects of recognition, measurement, presentation and disclosure of financial instruments. This ASU primarily impacts the Company's accounting for its investment in JD.com ("JD"). The Company adopted this ASU on February 1, 2018, which resulted in a cumulative positive adjustment to retained earnings of approximately
$2.9 billion
based on the market value of our investment in JD at January 31, 2018. The retained earnings adjustment relates to both the available for sale portion and the cost portion of the investment. Beginning February 1, 2018, the adoption requires the remeasurement of our investment in JD due to observable price changes and impairments, if any, to be recorded through the Consolidated Statement of Income, introducing volatility to reported net income.
In November 2016, the FASB issued ASU 2016-18,
Statement of Cash Flows–Restricted Cash (Topic 230)
, which requires restricted cash to be included with cash and cash equivalents when reconciling the beginning and ending amounts on the statement of cash flows. The Company adopted this ASU on February 1, 2018, which, while immaterial, will modify the Company's presentation of Consolidated Statements of Cash Flows. At January 31, 2018, the Company had restricted cash recorded in line items other than cash and cash equivalents of
$258 million
.
In February 2018, the FASB issued Accounting Standards Update ASU 2018-02,
Income Statement–Reporting Comprehensive Income (Topic 220): Reclassification of Certain Tax Effects from Accumulated Other Comprehensive Income
. The ASU provides that the stranded tax effects from the Tax Act in accumulated other comprehensive loss may be reclassified to retained earnings. The ASU is effective February 1, 2019, with early adoption permitted. Management anticipates early adopting this optional standard and is evaluating the effect on the Company's consolidated financial statements.
Other Pronouncements Being Evaluated
In February 2016, the FASB issued ASU 2016-02,
Leases (Topic 842)
, which requires lease assets and liabilities to be recorded on the balance sheet. Certain qualitative and quantitative disclosures are also required, as well as retrospective recognition and measurement of impacted leases. The Company will adopt this ASU on February 1, 2019 and is implementing new lease systems in connection with the adoption. Management is progressing with implementation and continuing to evaluate the effect to the Company's consolidated financial statements and disclosures. Management expects a material impact to the Company's Consolidated Balance Sheet.
In June 2016, the FASB issued ASU 2016-13,
Financial Instruments–Credit Losses (Topic 326)
, which modifies the measurement of expected credit losses of certain financial instruments. The Company will adopt this ASU on February 1, 2020. Management is currently evaluating this ASU to determine its impact to the Company's consolidated financial statements.
65
Basic net income per common share attributable to Walmart is based on the weighted-average common shares outstanding during the relevant period. Diluted net income per common share attributable to Walmart is based on the weighted-average common shares outstanding during the relevant period adjusted for the dilutive effect of share-based awards. The Company did not have significant share-based awards outstanding that were antidilutive and not included in the calculation of diluted net income per common share attributable to Walmart for fiscal
2018
,
2017
and
2016
.
The following table provides a reconciliation of the numerators and denominators used to determine basic and diluted net income per common share attributable to Walmart:
|
Fiscal Years Ended January 31,
|
||||||||||||
|
(Amounts in millions, except per share data)
|
2018
|
2017
|
2016
|
|||||||||
|
Numerator
|
||||||||||||
|
Consolidated net income
|
$
|
10,523
|
|
$
|
14,293
|
|
$
|
15,080
|
|
|||
|
Consolidated net income attributable to noncontrolling interest
|
(661
|
)
|
(650
|
)
|
(386
|
)
|
||||||
|
Consolidated net income attributable to Walmart
|
$
|
9,862
|
|
$
|
13,643
|
|
$
|
14,694
|
|
|||
|
Denominator
|
||||||||||||
|
Weighted-average common shares outstanding, basic
|
2,995
|
|
3,101
|
|
3,207
|
|
||||||
|
Dilutive impact of stock options and other share-based awards
|
15
|
|
11
|
|
10
|
|
||||||
|
Weighted-average common shares outstanding, diluted
|
3,010
|
|
3,112
|
|
3,217
|
|
||||||
|
|
||||||||||||
|
Net income per common share attributable to Walmart
|
||||||||||||
|
Basic
|
$
|
3.29
|
|
$
|
4.40
|
|
$
|
4.58
|
|
|||
|
Diluted
|
3.28
|
|
4.38
|
|
4.57
|
|
||||||
Share-Based Compensation
The Company has awarded share-based compensation to associates and nonemployee directors of the Company. The compensation expense recognized for all plans was
$626 million
,
$596 million
and
$448 million
for fiscal
2018
,
2017
and
2016
, respectively. Share-based compensation expense is generally included in operating, selling, general and administrative expenses in the Company's Consolidated Statements of Income. The total income tax benefit recognized for share-based compensation was
$150 million
,
$212 million
and
$151 million
for fiscal
2018
,
2017
and
2016
, respectively. The following table summarizes the Company's share-based compensation expense by award type:
|
|
Fiscal Years Ended January 31,
|
||||||||||
|
(Amounts in millions)
|
2018
|
2017
|
2016
|
||||||||
|
Restricted stock and performance share units
|
$
|
234
|
|
$
|
237
|
|
$
|
134
|
|
||
|
Restricted stock units
|
368
|
|
332
|
|
292
|
|
|||||
|
Other
|
24
|
|
27
|
|
22
|
|
|||||
|
Share-based compensation expense
|
$
|
626
|
|
$
|
596
|
|
$
|
448
|
|
||
The Walmart Inc. Stock Incentive Plan of 2015 (the "Plan"), as amended and restated effective February 23, 2016, and as amended further as of February 1, 2017, and as renamed on February 1, 2018, was established to grant stock options, restricted (non-vested) stock, performance share units and other equity compensation awards for which
210 million
shares of Walmart common stock issued or to be issued under the Plan have been registered under the Securities Act of 1933, as amended. The Company believes that such awards serve to align the interests of its associates with those of its shareholders.
The Plan's award types are summarized as follows:
|
•
|
Restricted Stock and Performance Share Units.
Restricted stock awards are for shares that vest based on the passage of time and include restrictions related to employment. Performance share units vest based on the passage of time and achievement of performance criteria and may range from
0%
to
150%
of the original award amount. Vesting periods for these awards are generally between
one
and
three
years. Restricted stock and performance share units may be settled or deferred in stock and are accounted for as equity in the Company's Consolidated Balance Sheets. The fair value of restricted stock awards is determined on the date of grant and is expensed ratably over the vesting period. The fair value of performance share units is determined on the date of grant using the Company's stock price discounted for the expected dividend yield through the vesting period and is recognized over the vesting period. The weighted-average discount for the dividend yield used to determine the fair value of performance share units in fiscal
2018
,
2017
and
2016
was
7.2%
,
8.3%
and
7.4%
, respectively.
|
66
|
•
|
Restricted Stock Units.
Restricted stock units provide rights to Company stock after a specified service period; generally
50%
vest
three
years from the grant date and the remaining
50%
vest
five
years from the grant date. The fair value of each restricted stock unit is determined on the date of grant using the stock price discounted for the expected dividend yield through the vesting period and is recognized ratably over the vesting period. The expected dividend yield is based on the anticipated dividends over the vesting period. The weighted-average discount for the dividend yield used to determine the fair value of restricted stock units granted in fiscal
2018
,
2017
and
2016
was
9.0%
,
9.0%
and
8.7%
, respectively.
|
In addition to the Plan, the Company's subsidiary in the United Kingdom has stock option plans for certain colleagues which generally vest over
three
years. The stock option share-based compensation expense is included in the Other line in the table above.
The following table shows the activity for restricted stock and performance share units and restricted stock units during fiscal
2018
:
|
Restricted Stock and Performance Share Units
(1)
|
Restricted Stock Units
|
|||||||||||||
|
(Shares in thousands)
|
Shares
|
Weighted-Average Grant-Date Fair Value Per Share
|
Shares
|
Weighted-Average Grant-Date Fair Value Per Share
|
||||||||||
|
Outstanding at February 1, 2017
|
9,077
|
|
$
|
68.61
|
|
24,276
|
|
$
|
65.52
|
|
||||
|
Granted
|
3,598
|
|
74.73
|
|
8,570
|
|
67.54
|
|
||||||
|
Vested/exercised
|
(2,525
|
)
|
71.55
|
|
(5,440
|
)
|
63.02
|
|
||||||
|
Forfeited or expired
|
(1,592
|
)
|
68.59
|
|
(3,253
|
)
|
66.28
|
|
||||||
|
Outstanding at January 31, 2018
|
8,558
|
|
$
|
70.47
|
|
24,153
|
|
$
|
66.69
|
|
||||
|
(1)
|
Assumes payout rate at 100% for Performance Share Units.
|
The following table includes additional information related to restricted stock and performance share units and restricted stock units:
|
|
Fiscal Years Ended January 31,
|
||||||||||
|
(Amounts in millions, except years)
|
2018
|
2017
|
2016
|
||||||||
|
Fair value of restricted stock and performance share units vested
|
$
|
181
|
|
$
|
149
|
|
$
|
142
|
|
||
|
Fair value of restricted stock units vested
|
344
|
|
261
|
|
237
|
|
|||||
|
Unrecognized compensation cost for restricted stock and performance share units
|
291
|
|
211
|
|
133
|
|
|||||
|
Unrecognized compensation cost for restricted stock units
|
972
|
|
986
|
|
628
|
|
|||||
|
Weighted average remaining period to expense for restricted stock and performance share units (years)
|
1.2
|
|
1.3
|
|
1.3
|
|
|||||
|
Weighted average remaining period to expense for restricted stock units (years)
|
1.8
|
|
1.9
|
|
1.7
|
|
|||||
Share Repurchase Program
From time to time, the Company repurchases shares of its common stock under share repurchase programs authorized by the Company's Board of Directors. All repurchases made during the fiscal year prior to November 20, 2017 were made under the plan in effect at the beginning of fiscal 2018. On October 9, 2017, the Board of Directors approved a new
$20.0 billion
share repurchase program which, beginning on November 20, 2017, replaced the previous share repurchase program. As of
January 31, 2018
, authorization for
$18.8 billion
of share repurchases remained under the current share repurchase program. Any repurchased shares are constructively retired and returned to an unissued status.
The Company considers several factors in determining when to execute share repurchases, including, among other things, current cash needs, capacity for leverage, cost of borrowings, its results of operations and the market price of its common stock. The following table provides, on a settlement date basis, the number of shares repurchased, average price paid per share and total amount paid for share repurchases for fiscal
2018
,
2017
and
2016
:
|
Fiscal Years Ended January 31,
|
||||||||||||
|
(Amounts in millions, except per share data)
|
2018
|
2017
|
2016
|
|||||||||
|
Total number of shares repurchased
|
104.9
|
|
119.9
|
|
62.4
|
|
||||||
|
Average price paid per share
|
$
|
79.11
|
|
$
|
69.18
|
|
$
|
65.90
|
|
|||
|
Total cash paid for share repurchases
|
$
|
8,296
|
|
$
|
8,298
|
|
$
|
4,112
|
|
|||
67
The following table provides the changes in the composition of total accumulated other comprehensive loss for fiscal
2018
,
2017
and
2016
:
|
(Amounts in millions and net of income taxes)
|
Currency
Translation and Other |
Net Investment Hedges
|
Unrealized Gain on Available-for-Sale Securities
|
Cash Flow Hedges
|
Minimum
Pension Liability |
Total
|
|||||||||||||||||
|
Balances as of February 1, 2015
|
$
|
(7,011
|
)
|
$
|
656
|
|
$
|
—
|
|
$
|
(134
|
)
|
$
|
(679
|
)
|
$
|
(7,168
|
)
|
|||||
|
Other comprehensive income (loss) before reclassifications, net
|
(4,679
|
)
|
366
|
|
—
|
|
(217
|
)
|
96
|
|
(4,434
|
)
|
|||||||||||
|
Amounts reclassified from accumulated other comprehensive loss, net
|
—
|
|
—
|
|
—
|
|
15
|
|
(10
|
)
|
5
|
|
|||||||||||
|
Balances as of January 31, 2016
|
(11,690
|
)
|
1,022
|
|
—
|
|
(336
|
)
|
(593
|
)
|
(11,597
|
)
|
|||||||||||
|
Other comprehensive income (loss) before reclassifications, net
|
(2,817
|
)
|
413
|
|
145
|
|
(22
|
)
|
(389
|
)
|
(2,670
|
)
|
|||||||||||
|
Amounts reclassified from accumulated other comprehensive loss, net
|
—
|
|
—
|
|
—
|
|
43
|
|
(8
|
)
|
35
|
|
|||||||||||
|
Balances as of January 31, 2017
|
(14,507
|
)
|
1,435
|
|
145
|
|
(315
|
)
|
(990
|
)
|
(14,232
|
)
|
|||||||||||
|
Other comprehensive income (loss) before reclassifications, net
|
2,345
|
|
(405
|
)
|
1,501
|
|
436
|
|
83
|
|
3,960
|
|
|||||||||||
|
Amounts reclassified from accumulated other comprehensive loss, net
|
26
|
|
—
|
|
—
|
|
1
|
|
64
|
|
91
|
|
|||||||||||
|
Balances as of January 31, 2018
|
$
|
(12,136
|
)
|
$
|
1,030
|
|
$
|
1,646
|
|
$
|
122
|
|
$
|
(843
|
)
|
$
|
(10,181
|
)
|
|||||
Amounts reclassified from accumulated other comprehensive loss for derivative instruments are recorded in interest, net, in the Company's Consolidated Statements of Income, and the amounts for the minimum pension liability are recorded in operating, selling, general and administrative expenses in the Company's Consolidated Statements of Income. The income tax impact for each of the amounts shown in the table above is immaterial.
The Company's accrued liabilities consist of the following:
|
|
As of January 31,
|
|||||||
|
(Amounts in millions)
|
2018
|
2017
|
||||||
|
Accrued wages and benefits
(1)
|
$
|
6,998
|
|
$
|
6,105
|
|
||
|
Self-insurance
(2)
|
3,737
|
|
3,922
|
|
||||
|
Accrued non-income taxes
(3)
|
3,073
|
|
2,816
|
|
||||
|
Deferred gift card revenue
|
2,017
|
|
1,856
|
|
||||
|
Other
(4)
|
6,297
|
|
5,955
|
|
||||
|
Total accrued liabilities
|
$
|
22,122
|
|
$
|
20,654
|
|
||
|
(1)
|
Accrued wages and benefits include accrued wages, salaries, vacation, bonuses and other incentive plans.
|
|
(2)
|
Self-insurance consists of insurance-related liabilities, such as
workers' compensation, general liability, auto liability, product liability and certain employee-related healthcare benefits
.
|
|
(3)
|
Accrued non-income taxes include accrued payroll, value added, sales and miscellaneous other taxes.
|
|
(4)
|
Other accrued liabilities consist of various items such as maintenance, utilities, advertising, interest and legal contingencies.
|
68
Short-term borrowings consist of commercial paper and lines of credit. Short-term borrowings at
January 31, 2018
and
2017
were
$5.3 billion
and
$1.1 billion
, respectively, with weighted-average interest rates of
1.5%
and
6.2%
, respectively.
The Company has various committed lines of credit in the U.S., committed with
23
financial institutions, totaling
$12.5 billion
as of
January 31, 2018
and
2017
, respectively. These committed lines of credit are summarized in the following table:
|
|
As of January 31,
|
|||||||||||||||||||||||
|
2018
|
2017
|
|||||||||||||||||||||||
|
(Amounts in millions)
|
Available
|
Drawn
|
Undrawn
|
Available
|
Drawn
|
Undrawn
|
||||||||||||||||||
|
Five-year credit facility
(1)
|
$
|
5,000
|
|
$
|
—
|
|
$
|
5,000
|
|
$
|
5,000
|
|
$
|
—
|
|
$
|
5,000
|
|
||||||
|
364-day revolving credit facility
(1)
|
7,500
|
|
—
|
|
7,500
|
|
7,500
|
|
—
|
|
7,500
|
|
||||||||||||
|
Total
|
$
|
12,500
|
|
$
|
—
|
|
$
|
12,500
|
|
$
|
12,500
|
|
$
|
—
|
|
$
|
12,500
|
|
||||||
|
(1)
|
In May 2017, the Company renewed and extended its existing five-year credit facility and its existing 364-day revolving credit facility, both of which are used to support its commercial paper program.
|
The committed lines of credit in the table above mature at various times between
May 2018
and
May 2022
, carry interest rates generally ranging between LIBOR plus
10
basis points and LIBOR plus
75
basis points, and incur commitment fees ranging between
1.5
and
4.0
basis points. In conjunction with the committed lines of credit listed in the table above, the Company has agreed to observe certain covenants, the most restrictive of which relates to the maximum amount of secured debt. Additionally, the Company also maintains other committed lines of credit outside of the U.S. with an available and undrawn amount of approximately
$4.0 billion
as of
January 31, 2018
.
Apart from the committed lines of credit, the Company has trade and stand-by letters of credit totaling
$2.6 billion
and
$3.6 billion
at
January 31, 2018
and
2017
, respectively. These letters of credit are utilized in normal business activities.
The Company's long-term debt, which includes the fair value instruments further discussed in
Note 8
, consists of the following:
|
|
|
January 31, 2018
|
January 31, 2017
|
|||||||||||
|
(Amounts in millions)
|
Maturity Dates
By Fiscal Year |
Amount
|
Average Rate
(1)
|
Amount
|
Average Rate
(1)
|
|||||||||
|
Unsecured debt
|
||||||||||||||
|
Fixed
|
2019 - 2048
|
$
|
24,540
|
|
3.9%
|
$
|
30,500
|
|
4.7%
|
|||||
|
Variable
|
2019 - 2020
|
800
|
|
4.1%
|
500
|
|
5.5%
|
|||||||
|
Total U.S. dollar denominated
|
25,340
|
|
31,000
|
|
||||||||||
|
Fixed
|
2023 - 2030
|
3,101
|
|
3.3%
|
2,674
|
|
3.3%
|
|||||||
|
Variable
|
—
|
|
—
|
|
||||||||||
|
Total Euro denominated
|
3,101
|
|
2,674
|
|
||||||||||
|
Fixed
|
2031 - 2039
|
3,801
|
|
5.4%
|
4,370
|
|
5.3%
|
|||||||
|
Variable
|
—
|
|
—
|
|
||||||||||
|
Total Sterling denominated
|
3,801
|
|
4,370
|
|
||||||||||
|
Fixed
|
2021 - 2028
|
1,655
|
|
0.4%
|
88
|
|
1.6%
|
|||||||
|
Variable
|
—
|
|
—
|
|
||||||||||
|
Total Yen denominated
|
1,655
|
|
88
|
|
||||||||||
|
Total unsecured debt
|
33,897
|
|
38,132
|
|
||||||||||
|
Total other
(2)
|
(114
|
)
|
139
|
|
||||||||||
|
Total debt
|
33,783
|
|
38,271
|
|
||||||||||
|
Less amounts due within one year
|
(3,738
|
)
|
(2,256
|
)
|
||||||||||
|
Long-term debt
|
$
|
30,045
|
|
$
|
36,015
|
|
||||||||
|
(1)
|
The average rate represents the weighted-average stated rate for each corresponding debt category, based on year-end balances and year-end interest rates. Interest costs are also impacted by certain derivative financial instruments described in
Note 8
.
|
|
(2)
|
Includes deferred loan costs, discounts, fair value hedges, foreign-held debt and secured debt. At
January 31, 2018
and
2017
the Company had secured debt in the amount of
$10 million
and
$14 million
, respectively, which was collateralized by property that had an aggregate carrying amount of approximately
$101 million
and
$82 million
, respectively.
|
At
January 31, 2018
and
2017
, the Company had
$500 million
in debt with embedded put options. The issuance of money market puttable reset securities in the amount of
$500 million
is structured to be remarketed in connection with the annual reset of the interest rate. If, for any reason, the remarketing of the notes does not occur at the time of any interest rate reset, the holders of the notes must sell and the Company must repurchase the notes at par. Accordingly, this issuance has been classified as long-term debt due within one year in the Company's Consolidated Balance Sheets.
69
Annual maturities of long-term debt during the next five years and thereafter are as follows:
|
(Amounts in millions)
|
Annual
|
||
|
Fiscal Year
|
Maturities
|
||
|
2019
|
$
|
3,733
|
|
|
2020
|
1,914
|
|
|
|
2021
|
3,336
|
|
|
|
2022
|
607
|
|
|
|
2023
|
2,934
|
|
|
|
Thereafter
|
21,259
|
|
|
|
Total
|
$
|
33,783
|
|
Debt Issuances
Information on significant long-term debt issued during fiscal
2018
is as follows:
|
(Amounts in millions)
|
||||||||||||
|
Issue Date
|
Principal Amount
|
Maturity Date
|
Fixed vs. Floating
|
Interest Rate
|
Proceeds
|
|||||||
|
July 18, 2017
|
70,000 JPY
|
July 15, 2022
|
Fixed
|
0.183%
|
$
|
619
|
|
|||||
|
July 18, 2017
|
40,000 JPY
|
July 18, 2024
|
Fixed
|
0.298%
|
354
|
|
||||||
|
July 18, 2017
|
60,000 JPY
|
July 16, 2027
|
Fixed
|
0.520%
|
530
|
|
||||||
|
October 20, 2017
|
300 USD
|
October 9, 2019
|
Floating
|
Floating
|
299
|
|
||||||
|
October 20, 2017
|
1,200 USD
|
October 9, 2019
|
Fixed
|
1.750%
|
1,198
|
|
||||||
|
October 20, 2017
|
1,250 USD
|
December 15, 2020
|
Fixed
|
1.900%
|
1,245
|
|
||||||
|
October 20, 2017
|
1,250 USD
|
December 15, 2022
|
Fixed
|
2.350%
|
1,245
|
|
||||||
|
October 20, 2017
|
1,000 USD
|
December 15, 2024
|
Fixed
|
2.650%
|
996
|
|
||||||
|
October 20, 2017
|
1,000 USD
|
December 15, 2047
|
Fixed
|
3.625%
|
990
|
|
||||||
|
Total
|
$
|
7,476
|
|
|||||||||
As described in
Note 8
, the current year issuances of foreign-currency-denominated long-term debt are designated as a hedge of the Company's net investment in Japan.
The Company did not have any significant long-term debt issuances during fiscal 2017, but received some proceeds from a number of small long-term debt issuances by several of its non-U.S. operations.
70
Maturities and Extinguishments
The following table provides details of debt repayments during fiscal
2018
:
|
(Amounts in millions)
|
||||||||||
|
Maturity Date
|
Principal Amount
|
Fixed vs. Floating
|
Interest Rate
|
Repayment
(1)
|
||||||
|
April 5, 2017
|
1,000 USD
|
Fixed
|
5.375%
|
$
|
1,000
|
|
||||
|
April 21, 2017
|
500 USD
|
Fixed
|
1.000%
|
500
|
|
|||||
|
Total repayment of matured debt
|
1,500
|
|
||||||||
|
December 15, 2018
|
1,000 USD
|
Fixed
|
1.950%
|
276
|
|
|||||
|
February 1, 2019
|
500 USD
|
Fixed
|
4.125%
|
136
|
|
|||||
|
July 8, 2020
|
1,500 USD
|
Fixed
|
3.625%
|
661
|
|
|||||
|
October 25, 2020
|
1,750 USD
|
Fixed
|
3.250%
|
553
|
|
|||||
|
April 15, 2021
|
1,000 USD
|
Fixed
|
4.250%
|
491
|
|
|||||
|
October 16, 2023
|
250 USD
|
Fixed
|
6.750%
|
98
|
|
|||||
|
April 5, 2027
|
750 USD
|
Fixed
|
5.875%
|
267
|
|
|||||
|
February 15, 2030
|
500 USD
|
Fixed
|
7.550%
|
412
|
|
|||||
|
September 4, 2035
|
2,500 USD
|
Fixed
|
5.250%
|
532
|
|
|||||
|
September 28, 2035
|
1,000 GBP
|
Fixed
|
5.250%
|
260
|
|
|||||
|
August 17, 2037
|
3,000 USD
|
Fixed
|
6.500%
|
1,700
|
|
|||||
|
April 15, 2038
|
2,000 USD
|
Fixed
|
6.200%
|
1,081
|
|
|||||
|
January 19, 2039
|
1,000 GBP
|
Fixed
|
4.875%
|
851
|
|
|||||
|
April 2, 2040
|
1,250 USD
|
Fixed
|
5.625%
|
499
|
|
|||||
|
July 9, 2040
|
750 USD
|
Fixed
|
4.875%
|
372
|
|
|||||
|
October 25, 2040
|
1,250 USD
|
Fixed
|
5.000%
|
731
|
|
|||||
|
April 15, 2041
|
2,000 USD
|
Fixed
|
5.625%
|
1,082
|
|
|||||
|
April 11, 2043
|
1,000 USD
|
Fixed
|
4.000%
|
291
|
|
|||||
|
October 2, 2043
|
750 USD
|
Fixed
|
4.750%
|
481
|
|
|||||
|
April 22, 2044
|
1,000 USD
|
Fixed
|
4.300%
|
498
|
|
|||||
|
Total repayment of extinguished debt
|
11,272
|
|
||||||||
|
Total
|
$
|
12,772
|
|
|||||||
(1) Represents portion of the principal amount repaid during fiscal
2018
.
In connection with extinguishing debt, the Company paid premiums of approximately
$3.1 billion
during fiscal
2018
, resulting in a loss on extinguishment of debt of approximately
$3.1 billion
.
During fiscal
2017
, the following long-term debt matured and was repaid:
|
(Amounts in millions)
|
||||||||||
|
Maturity Date
|
Principal Amount
|
Fixed vs. Floating
|
Interest Rate
|
Repayment
|
||||||
|
April 11, 2016
|
1,000 USD
|
Fixed
|
0.600%
|
$
|
1,000
|
|
||||
|
April 15, 2016
|
1,000 USD
|
Fixed
|
2.800%
|
1,000
|
|
|||||
|
$
|
2,000
|
|
||||||||
During fiscal
2018
and
2017
, the Company also repaid other, smaller long-term debt as it matured in several of its non-U.S. operations.
71
The Company records and discloses certain financial and non-financial assets and liabilities at fair value. The fair value of an asset is the price at which the asset could be sold in an orderly transaction between unrelated, knowledgeable and willing parties able to engage in the transaction. The fair value of a liability is the amount that would be paid to transfer the liability to a new obligor in a transaction between such parties, not the amount that would be paid to settle the liability with the creditor. Assets and liabilities recorded at fair value are measured using the fair value hierarchy, which prioritizes the inputs used in measuring fair value. The levels of the fair value hierarchy are:
|
•
|
Level 1: observable inputs such as quoted prices in active markets;
|
|
•
|
Level 2: inputs other than quoted prices in active markets that are either directly or indirectly observable; and
|
|
•
|
Level 3: unobservable inputs for which little or no market data exists, therefore requiring the Company to develop its own assumptions.
|
Recurring Fair Value Measurements
The Company holds derivative instruments that are required to be measured at fair value on a recurring basis. The fair values are the estimated amounts the Company would receive or pay upon termination of the related derivative agreements as of the reporting dates. The fair values have been measured using the income approach and Level 2 inputs, which include the relevant interest rate and foreign currency forward curves. As of
January 31, 2018
and
2017
, the notional amounts and fair values of these derivatives were as follows:
|
|
January 31, 2018
|
January 31, 2017
|
|||||||||||||
|
(Amounts in millions)
|
Notional Amount
|
Fair Value
|
Notional Amount
|
Fair Value
|
|||||||||||
|
Receive fixed-rate, pay variable-rate interest rate swaps designated as fair value hedges
|
$
|
4,000
|
|
$
|
(91
|
)
|
$
|
5,000
|
|
$
|
(4
|
)
|
|||
|
Receive fixed-rate, pay fixed-rate cross-currency swaps designated as net investment hedges
|
2,250
|
|
208
|
|
2,250
|
|
471
|
|
|||||||
|
Receive fixed-rate, pay fixed-rate cross-currency swaps designated as cash flow hedges
|
4,523
|
|
205
|
|
3,957
|
|
(618
|
)
|
|||||||
|
Total
|
$
|
10,773
|
|
$
|
322
|
|
$
|
11,207
|
|
$
|
(151
|
)
|
|||
Additionally, the Company's available-for-sale securities are measured at fair value on a recurring basis using Level 1 inputs. Changes in fair value are recorded in accumulated other comprehensive loss. The cost basis and fair value of the Company's available-for-sale securities as of
January 31, 2018
and
2017
, are as follows:
|
|
January 31, 2018
|
January 31, 2017
|
||||||||||||||
|
(Amounts in millions)
|
Cost Basis
|
Fair Value
|
Cost Basis
|
Fair Value
|
||||||||||||
|
Available-for-sale securities
|
$
|
1,901
|
|
$
|
3,547
|
|
$
|
1,901
|
|
$
|
2,046
|
|
||||
Nonrecurring Fair Value Measurements
In addition to assets and liabilities that are recorded at fair value on a recurring basis, the Company's assets and liabilities are also subject to nonrecurring fair value measurements. Generally, assets are recorded at fair value on a nonrecurring basis as a result of impairment charges. Fiscal 2018 impairment charges to assets measured at fair value on a nonrecurring basis were
$1.4 billion
and
primarily related to restructuring activities described in
Note 14
,
as well as discontinued real estate projects in the U.S. and decisions to exit certain international properties
. These impairment charges were classified in operating, selling, general and administrative expenses in the Company's Consolidated Statement of Income. The fair value was determined based on comparable market values of similar properties or on a rental income approach, using Level 2 inputs. Impairment charges not related to restructuring or decisions to exit properties for fiscal 2018 were not material.
Additionally, total impairment charges for fiscal
2017
were not material.
Other Fair Value Disclosures
The Company records cash and cash equivalents and short-term borrowings at cost. The carrying values of these instruments approximate their fair value due to their short-term maturities.
The Company's long-term debt is also recorded at cost. The fair value is estimated using Level 2 inputs based on the Company's current incremental borrowing rate for similar types of borrowing arrangements. The carrying value and fair value of the Company's long-term debt as of
January 31, 2018
and
2017
, are as follows:
|
|
January 31, 2018
|
January 31, 2017
|
||||||||||||||
|
(Amounts in millions)
|
Carrying Value
|
Fair Value
|
Carrying Value
|
Fair Value
|
||||||||||||
|
Long-term debt, including amounts due within one year
|
$
|
33,783
|
|
$
|
38,766
|
|
$
|
38,271
|
|
$
|
44,602
|
|
||||
72
The Company uses derivative financial instruments for hedging and non-trading purposes to manage its exposure to changes in interest and currency exchange rates, as well as to maintain an appropriate mix of fixed- and variable-rate debt. Use of derivative financial instruments in hedging programs subjects the Company to certain risks, such as market and credit risks. Market risk represents the possibility that the value of the derivative financial instrument will change. In a hedging relationship, the change in the value of the derivative financial instrument is offset to a great extent by the change in the value of the underlying hedged item. Credit risk related to a derivative financial instrument represents the possibility that the counterparty will not fulfill the terms of the contract. The notional, or contractual, amount of the Company's derivative financial instruments is used to measure interest to be paid or received and does not represent the Company's exposure due to credit risk. Credit risk is monitored through established approval procedures, including setting concentration limits by counterparty, reviewing credit ratings and requiring collateral from the counterparty when appropriate.
The Company only enters into derivative transactions with counterparties rated "A-" or better by nationally recognized credit rating agencies. Subsequent to entering into derivative transactions, the Company regularly monitors the credit ratings of its counterparties. In connection with various derivative agreements, including master netting arrangements, the Company held cash collateral from counterparties of
$279 million
and
$242 million
at
January 31, 2018
and
January 31, 2017
, respectively. The Company records cash collateral received as amounts due to the counterparties exclusive of any derivative asset. Furthermore, as part of the master netting arrangements with each of these counterparties, the Company is also required to post collateral with a counterparty if the Company's net derivative liability position exceeds
$150 million
with such counterparties. The Company did not have any cash collateral posted with counterparties at
January 31, 2018
and
January 31, 2017
, respectively. The Company records cash collateral it posts with counterparties as amounts receivable from those counterparties exclusive of any derivative liability.
The Company uses derivative financial instruments for the purpose of hedging its exposure to interest and currency exchange rate risks and, accordingly, the contractual terms of a hedged instrument closely mirror those of the hedged item, providing a high degree of risk reduction and correlation. Contracts that are effective at meeting the risk reduction and correlation criteria are recorded using hedge accounting. If a derivative financial instrument is recorded using hedge accounting, depending on the nature of the hedge, changes in the fair value of the instrument will either be offset against the change in fair value of the hedged assets, liabilities or firm commitments through earnings or be recognized in accumulated other comprehensive loss until the hedged item is recognized in earnings. Any hedge ineffectiveness is immediately recognized in earnings. The Company's net investment and cash flow instruments are highly effective hedges and the ineffective portion has not been, and is not expected to be, significant. Instruments that do not meet the criteria for hedge accounting, or contracts for which the Company has not elected hedge accounting, are recorded at fair value with unrealized gains or losses reported in earnings during the period of the change.
Fair Value Instruments
The Company is a party to receive fixed-rate, pay variable-rate interest rate swaps that the Company uses to hedge the fair value of fixed-rate debt. The notional amounts are used to measure interest to be paid or received and do not represent the Company's exposure due to credit loss. The Company's interest rate swaps that receive fixed-interest rate payments and pay variable-interest rate payments are designated as fair value hedges. As the specific terms and notional amounts of the derivative instruments match those of the fixed-rate debt being hedged, the derivative instruments are assumed to be perfectly effective hedges. Changes in the fair values of these derivative instruments are recorded in earnings, but are offset by corresponding changes in the fair values of the hedged items, also recorded in earnings, and, accordingly, do not impact the Company's Consolidated Statements of Income. These fair value instruments will mature on dates ranging from
October 2020
to
April 2024
.
Net Investment Instruments
The Company is a party to cross-currency interest rate swaps that the Company uses to hedge its net investments. The agreements are contracts to exchange fixed-rate payments in one currency for fixed-rate payments in another currency. All changes in the fair value of these instruments are recorded in accumulated other comprehensive loss, offsetting the currency translation adjustment of the related investment that is also recorded in accumulated other comprehensive loss. These instruments will mature on dates ranging from
July 2020
to
February 2030
.
The Company has issued foreign-currency-denominated long-term debt as hedges of net investments of certain of its foreign operations. These foreign-currency-denominated long-term debt issuances are designated and qualify as nonderivative hedging instruments. Accordingly, the foreign currency translation of these debt instruments is recorded in accumulated other comprehensive loss, offsetting the foreign currency translation adjustment of the related net investment that is also recorded in accumulated other comprehensive loss. At
January 31, 2018
and
January 31, 2017
, the Company had
¥180 billion
and
¥10 billion
, respectively, of outstanding long-term debt designated as a hedge of its net investment in Japan, as well as outstanding long-term debt of
£1.7 billion
and
£2.5 billion
at
January 31, 2018
and
January 31, 2017
, respectively, that was designated as a
73
hedge of its net investment in the United Kingdom. These nonderivative net investment hedges will mature on dates ranging from
July 2020
to
January 2039
.
Cash Flow Instruments
The Company is a party to receive fixed-rate, pay fixed-rate cross-currency interest rate swaps to hedge the currency exposure associated with the forecasted payments of principal and interest of certain non-U.S. denominated debt. The swaps are designated as cash flow hedges of the currency risk related to payments on the non-U.S. denominated debt. The effective portion of changes in the fair value of derivatives designated as cash flow hedges of foreign exchange risk is recorded in accumulated other comprehensive loss and is subsequently reclassified into earnings in the period that the hedged forecasted transaction affects earnings. The hedged items are recognized foreign currency-denominated liabilities that are re-measured at spot exchange rates each period, and the assessment of effectiveness (and measurement of any ineffectiveness) is based on total changes in the related derivative's cash flows. As a result, the amount reclassified into earnings each period includes an amount that offsets the related transaction gain or loss arising from that re-measurement and the adjustment to earnings for the period's allocable portion of the initial spot-forward difference associated with the hedging instrument. These cash flow instruments will mature on dates ranging from
April 2022
to
March 2034
.
Financial Statement Presentation
Although subject to master netting arrangements, the Company does not offset derivative assets and derivative liabilities in its Consolidated Balance Sheets. Derivative instruments with an unrealized gain are recorded in the Company's Consolidated Balance Sheets as either current or non-current assets, based on maturity date, and those hedging instruments with an unrealized loss are recorded as either current or non-current liabilities, based on maturity date. Refer to
Note 7
for the net presentation of the Company's derivative instruments.
The Company's derivative instruments, as well as its nonderivative debt instruments designated and qualifying as net investment hedges, were classified as follows as of
January 31, 2018
and
2017
in the Company's Consolidated Balance Sheets:
|
|
January 31, 2018
|
January 31, 2017
|
|||||||||||||||||||||
|
(Amounts in millions)
|
Fair Value
Instruments |
Net Investment
Instruments |
Cash Flow
Instruments |
Fair Value
Instruments |
Net Investment
Instruments
|
Cash Flow
Instruments |
|||||||||||||||||
|
Derivative instruments
|
|||||||||||||||||||||||
|
Derivative assets:
|
|||||||||||||||||||||||
|
Other assets and deferred charges
|
$
|
—
|
|
$
|
208
|
|
$
|
300
|
|
$
|
8
|
|
$
|
471
|
|
$
|
—
|
|
|||||
|
Derivative liabilities:
|
|||||||||||||||||||||||
|
Deferred income taxes and other
|
91
|
|
—
|
|
95
|
|
12
|
|
—
|
|
618
|
|
|||||||||||
|
Nonderivative hedging instruments
|
|||||||||||||||||||||||
|
Long-term debt
|
—
|
|
4,041
|
|
—
|
|
—
|
|
3,209
|
|
—
|
|
|||||||||||
Realized gains and losses related to the Company's derivatives are recorded in interest, net, in the Company's Consolidated Statements of Income. Amounts related to the Company's derivatives expected to be reclassified from accumulated other comprehensive loss to net income during the next 12 months are not significant.
74
Income Before Income Taxes
The components of income before income taxes are as follows:
|
|
Fiscal Years Ended January 31,
|
||||||||||
|
(Amounts in millions)
|
2018
|
2017
|
2016
|
||||||||
|
U.S.
|
$
|
10,722
|
|
$
|
15,680
|
|
$
|
16,685
|
|
||
|
Non-U.S.
|
4,401
|
|
4,817
|
|
4,953
|
|
|||||
|
Total income before income taxes
|
$
|
15,123
|
|
$
|
20,497
|
|
$
|
21,638
|
|
||
A summary of the provision for income taxes is as follows:
|
|
Fiscal Years Ended January 31,
|
||||||||||
|
(Amounts in millions)
|
2018
|
2017
|
2016
|
||||||||
|
Current:
|
|||||||||||
|
U.S. federal
|
$
|
2,998
|
|
$
|
3,454
|
|
$
|
5,562
|
|
||
|
U.S. state and local
|
405
|
|
495
|
|
622
|
|
|||||
|
International
|
1,377
|
|
1,510
|
|
1,400
|
|
|||||
|
Total current tax provision
|
4,780
|
|
5,459
|
|
7,584
|
|
|||||
|
Deferred:
|
|||||||||||
|
U.S. federal
|
(22
|
)
|
1,054
|
|
(704
|
)
|
|||||
|
U.S. state and local
|
(12
|
)
|
51
|
|
(106
|
)
|
|||||
|
International
|
(146
|
)
|
(360
|
)
|
(216
|
)
|
|||||
|
Total deferred tax expense (benefit)
|
(180
|
)
|
745
|
|
(1,026
|
)
|
|||||
|
Total provision for income taxes
|
$
|
4,600
|
|
$
|
6,204
|
|
$
|
6,558
|
|
||
On December 22, 2017, the Tax Act was enacted and contains significant changes to U.S. income tax law. Effective in 2018, the Tax Act reduces the U.S. statutory tax rate from
35%
to
21%
and creates new taxes focused on foreign-sourced earnings and related-party payments, including the creation of the base erosion anti-abuse tax and a new tax on global intangible low-taxed income ("GILTI"). By operation of law, the Company will apply a blended U.S. statutory federal income tax rate of
33.8%
for fiscal 2018. In addition, the Company was subject to a one-time transition tax in fiscal 2018 on accumulated foreign subsidiary earnings not previously subject to U.S. income tax.
The Securities and Exchange Commission (SEC) staff issued SAB 118 on December 22, 2017, which allows companies to record provisional amounts during a measurement period not to extend beyond one year of the enactment date. Due to the timing of the enactment and the complexity involved in applying the provisions of the Tax Act, the Company made reasonable estimates of the effects and recorded provisional amounts in its financial statements as of January 31, 2018, in accordance with SAB 118. As the Company collects and prepares necessary data, and interprets the Tax Act and any additional guidance issued by the U.S. Treasury Department, the IRS, and other standard-setting bodies, the Company may make adjustments to the provisional amounts during fiscal 2019. Those adjustments may materially impact the Company's provision for income taxes and effective tax rate in the period in which the adjustments are made. The accounting for the tax effects of the Tax Act will be completed by the measurement period provided in SAB 118.
Provisional amounts for the following income tax effects of the Tax Act have been recorded as of January 31, 2018, and are subject to change during fiscal 2019. The net tax benefit recognized in fiscal 2018 related to the Tax Act was
$0.2 billion
. As the Company completes its analysis of the Tax Act and incorporates additional guidance that may be issued by the U.S. Treasury Department, the IRS or other standard-setting bodies, the Company may identify additional effects not reflected as of January 31, 2018.
One-time Transition Tax
The Tax Act requires the Company to pay U.S. income taxes on accumulated foreign subsidiary earnings not previously subject to U.S. income tax at a rate of
15.5%
to the extent of foreign cash and certain other net current assets, as defined by the Tax Act, and
8.0%
on the remaining earnings. The Company recorded a provisional amount of
$1.9 billion
of additional income tax expense for its one-time transitional tax liability. The Company recorded a provisional amount based on estimates as it completes its analysis of the application of the effects of the Tax Act as well as finalize its calculations surrounding the components of its foreign subsidiaries subject to the transition tax including the potential of any correlative adjustments.
Deferred Tax Effects
The Tax Act reduces the U.S. statutory tax rate from
35%
to
21%
for years after 2017. Accordingly, the Company re-measured its deferred taxes as of January 31, 2018, to reflect the reduced rate that will apply in future periods when these deferred taxes
75
are settled or realized. The Company recognized a deferred tax benefit of
$2.1 billion
to reflect the reduced U.S. tax rate and other effects of the Tax Act. The benefit associated with the remeasurement of the deferred taxes is provisional as of January 31, 2018, as the Company continues gathering the necessary information to complete the calculations. The Company has no provisional adjustment with respect to the GILTI provision of the Tax Act as the Company is not able to make reasonable estimates of its related effects at this time. The Company has not yet elected an accounting policy to determine whether it will recognize GILTI as a period cost when incurred or to recognize deferred taxes for basis differences expected to reverse.
Effective Income Tax Rate Reconciliation
The Company's effective income tax rate is typically lower than the U.S. statutory tax rate primarily because of benefits from lower-taxed global operations, including the use of global funding structures and certain U.S. tax credits as further discussed in the "Cash and Cash Equivalents" section of the Company's significant accounting policies in
Note 1
. The Company's non-U.S. income is generally subject to local country tax rates that are below the U.S. statutory tax rate. Certain non-U.S. earnings have been indefinitely reinvested outside the U.S. A reconciliation of the significant differences between the U.S. statutory tax rate and the effective income tax rate on pretax income from continuing operations is as follows:
|
|
Fiscal Years Ended January 31,
|
|||||||
|
|
2018
|
2017
|
2016
|
|||||
|
U.S. statutory tax rate
|
33.8
|
%
|
35.0
|
%
|
35.0
|
%
|
||
|
U.S. state income taxes, net of federal income tax benefit
|
1.8
|
%
|
1.7
|
%
|
1.8
|
%
|
||
|
Impact of the Tax Act:
|
||||||||
|
One-time transition tax
|
12.3
|
%
|
—
|
%
|
—
|
%
|
||
|
Deferred tax effects
|
(14.1
|
)%
|
—
|
%
|
—
|
%
|
||
|
Income taxed outside the U.S.
|
(4.1
|
)%
|
(4.5
|
)%
|
(4.0
|
)%
|
||
|
Net impact of repatriated international earnings
|
(0.1
|
)%
|
(1.0
|
)%
|
0.1
|
%
|
||
|
Other, net
|
0.8
|
%
|
(0.9
|
)%
|
(2.6
|
)%
|
||
|
Effective income tax rate
|
30.4
|
%
|
30.3
|
%
|
30.3
|
%
|
||
Deferred Taxes
The Company recorded a provisional adjustment to its U.S. deferred income taxes as of January 31, 2018 to reflect the reduction in the U.S. statutory tax rate from
35%
to
21%
resulting from the Tax Act. The significant components of the Company's deferred tax account balances are as follows:
|
|
January 31,
|
|||||||
|
(Amounts in millions)
|
2018
|
2017
|
||||||
|
Deferred tax assets:
|
||||||||
|
Loss and tax credit carryforwards
|
$
|
1,989
|
|
$
|
3,633
|
|
||
|
Accrued liabilities
|
2,482
|
|
3,437
|
|
||||
|
Share-based compensation
|
217
|
|
309
|
|
||||
|
Other
|
1,251
|
|
1,474
|
|
||||
|
Total deferred tax assets
|
5,939
|
|
8,853
|
|
||||
|
Valuation allowances
|
(1,843
|
)
|
(1,494
|
)
|
||||
|
Deferred tax assets, net of valuation allowance
|
4,096
|
|
7,359
|
|
||||
|
Deferred tax liabilities:
|
||||||||
|
Property and equipment
|
3,954
|
|
6,435
|
|
||||
|
Inventories
|
1,153
|
|
1,808
|
|
||||
|
Other
|
941
|
|
1,884
|
|
||||
|
Total deferred tax liabilities
|
6,048
|
|
10,127
|
|
||||
|
Net deferred tax liabilities
|
$
|
1,952
|
|
$
|
2,768
|
|
||
76
The deferred taxes noted above are classified as follows in the Company's Consolidated Balance Sheets:
|
|
January 31,
|
|||||||
|
(Amounts in millions)
|
2018
|
2017
|
||||||
|
Balance Sheet classification
|
||||||||
|
Assets:
|
||||||||
|
Other assets and deferred charges
|
$
|
1,879
|
|
$
|
1,565
|
|
||
|
Liabilities:
|
||||||||
|
Deferred income taxes and other
|
3,831
|
|
4,333
|
|
||||
|
Net deferred tax liabilities
|
$
|
1,952
|
|
$
|
2,768
|
|
||
Unremitted Earnings
The Company has previously asserted all of its unremitted earnings offshore were permanently reinvested. Accordingly, the Company did not record any deferred taxes related to any outside basis differences associated with its foreign subsidiaries. As part of the tax reform enacted on December 22, 2017, the Company is currently assessing the impact of the new legislation, which can in turn, impact its assertion regarding any potential future repatriation. After consideration of the provisional transition tax calculation and deemed repatriation of the previously unremitted earnings, the Company is estimating, on a provisional basis, its outside tax basis exceeds the outside book basis of its foreign subsidiaries by approximately
$10.0 billion
. Once the calculations are completed regarding the transition tax, taking into account the timeline provided in SAB 118, the Company will provide updated disclosures regarding any potential changes for its previous assertions.
Net Operating Losses, Tax Credit Carryforwards and Valuation Allowances
At
January 31, 2018
, the Company had net operating loss and capital loss carryforwards totaling approximately
$6.7 billion
. Of these carryforwards, approximately
$3.6 billion
will expire, if not utilized, in various years through
2038
. The remaining carryforwards have no expiration. At
January 31, 2018
, the Company's provisional transition tax calculation fully utilized all foreign tax credit carryforwards.
The recoverability of these future tax deductions and credits is evaluated by assessing the adequacy of future expected taxable income from all sources, including taxable income in prior carryback years, reversal of taxable temporary differences, forecasted operating earnings and available tax planning strategies. To the extent the Company does not consider it more likely than not that a deferred tax asset will be recovered, a valuation allowance is established. To the extent that a valuation allowance has been established and it is subsequently determined that it is more likely than not that the deferred tax assets will be recovered, the valuation allowance will be released.
The Company had valuation allowances of approximately
$1.8 billion
and
$1.5 billion
as of
January 31, 2018
and
2017
, respectively, on deferred tax assets associated primarily with net operating loss carryforwards for which management has determined it is more likely than not that the deferred tax asset will not be realized. Net activity in the valuation allowance during fiscal 2018 related to releases arising from the use of deferred tax assets, changes in judgment regarding the future realization of deferred tax assets, increases from certain net operating losses and deductible temporary differences arising in fiscal
2018
, decreases due to operating loss expirations and fluctuations in currency exchange rates. Management believes that it is more likely than not that the remaining deferred tax assets will be fully realized.
Uncertain Tax Positions
The benefits of uncertain tax positions are recorded in the Company's Consolidated Financial Statements only after determining a more-likely-than-not probability that the uncertain tax positions will withstand challenge, if any, from taxing authorities.
As of
January 31, 2018
and
2017
, the amount of unrecognized tax benefits related to continuing operations was
$1.0 billion
and
$1.1 billion
, respectively. The amount of unrecognized tax benefits that would affect the Company's effective income tax rate was
$690 million
and
$703 million
as of
January 31, 2018
and
2017
, respectively.
77
A reconciliation of unrecognized tax benefits from continuing operations is as follows:
|
|
Fiscal Years Ended January 31,
|
||||||||||
|
(Amounts in millions)
|
2018
|
2017
|
2016
|
||||||||
|
Unrecognized tax benefits, beginning of year
|
$
|
1,050
|
|
$
|
607
|
|
$
|
838
|
|
||
|
Increases related to prior year tax positions
|
130
|
|
388
|
|
164
|
|
|||||
|
Decreases related to prior year tax positions
|
(254
|
)
|
(32
|
)
|
(446
|
)
|
|||||
|
Increases related to current year tax positions
|
122
|
|
145
|
|
119
|
|
|||||
|
Settlements during the period
|
(23
|
)
|
(46
|
)
|
(25
|
)
|
|||||
|
Lapse in statutes of limitations
|
(15
|
)
|
(12
|
)
|
(43
|
)
|
|||||
|
Unrecognized tax benefits, end of year
|
$
|
1,010
|
|
$
|
1,050
|
|
$
|
607
|
|
||
The Company classifies interest and penalties related to uncertain tax benefits as interest expense and as operating, selling, general and administrative expenses, respectively. During fiscal
2018
,
2017
and
2016
, the Company recognized interest expense related to uncertain tax positions of
$32 million
,
$35 million
and
$5 million
, respectively. As of
January 31, 2018
and
2017
, accrued interest related to uncertain tax positions of
$96 million
and
$72 million
, respectively, was recorded in the Company's Consolidated Balance Sheets. As of January 31, 2018, accrued penalties related to uncertain tax positions of
$12 million
were recorded in the Company's Consolidated Balance Sheets. As of January 31, 2017, there were no accrued penalties related to uncertain tax positions recorded in the Company's Consolidated Balance Sheets.
During the next twelve months, it is reasonably possible that tax audit resolutions could reduce unrecognized tax benefits by between
$50 million
and
$400 million
, either because the tax positions are sustained on audit or because the Company agrees to their disallowance. The Company is focused on resolving tax audits as expeditiously as possible. As a result of these efforts, unrecognized tax benefits could potentially be reduced beyond the provided range during the next twelve months. The Company does not expect any change to have a material impact to its Consolidated Financial Statements.
The Company remains subject to income tax examinations for its U.S. federal income taxes generally for fiscal
2013
through
2018
. The Company also remains subject to income tax examinations for international income taxes for fiscal
2011
through
2018
, and for U.S. state and local income taxes generally for the fiscal years ended
2013
through
2018
.
Other Taxes
The Company is subject to tax examinations for value added, sales-based, payroll and other non-income taxes. A number of these examinations are ongoing in various jurisdictions. In certain cases, the Company has received assessments from the respective taxing authorities in connection with these examinations. Unless otherwise indicated, the possible losses or range of possible losses associated with these matters are individually immaterial, but a group of related matters, if decided adversely to the Company, could result in a liability material to the Company's Consolidated Financial Statements.
In particular, Brazil federal, state and local laws are complex and subject to varying interpretations, and the Company's subsidiaries in Brazil are party to a large number of non-income tax assessments. One of these interpretations common to the retail industry in Brazil relates to whether credits received from suppliers should be treated as a reduction of cost for purposes of calculating certain indirect taxes. The Company believes credits received from suppliers are reductions in cost and that it has substantial legal defenses in this matter and intends to defend this matter vigorously. As such, the Company has not accrued for this matter, although the Company may be required to deposit funds in escrow or secure financial guarantees to continue the judicial process in defending this matter in Brazil.
78
Legal Proceedings
The Company is involved in a number of legal proceedings. The Company has made accruals with respect to these matters, where appropriate, which are reflected in the Company's Consolidated Financial Statements. For some matters, a liability is not probable or the amount cannot be reasonably estimated and therefore an accrual has not been made. However, where a liability is reasonably possible and may be material, such matters have been disclosed. The Company may enter into discussions regarding settlement of these matters, and may enter into settlement agreements, if it believes settlement is in the best interest of the Company and its shareholders.
Unless stated otherwise, the matters discussed below, if decided adversely to or settled by the Company, individually or in the aggregate, may result in a liability material to the Company's financial condition or results of operations.
ASDA Equal Value Claims
ASDA Stores, Ltd. ("ASDA"), a wholly-owned subsidiary of the Company, is a defendant in over
10,000
"equal value" claims that are proceeding before an Employment Tribunal in Manchester (the "Employment Tribunal") in the United Kingdom ("UK") on behalf of current and former ASDA store employees, and further claims may be asserted in the future. The claimants allege that the work performed by female employees in ASDA's retail stores is of equal value in terms of, among other things, the demands of their jobs compared to that of male employees working in ASDA's warehouse and distribution facilities, and that the disparity in pay between these different job positions is not objectively justified. As a result, claimants are requesting differential back pay based on higher wage rates in the warehouse and distribution facilities and higher wage rates on a prospective basis.
On March 23, 2015, ASDA asked the Employment Tribunal to stay all proceedings and to "strike out" substantially all of the claims because the claimants had not adhered to the Tribunal's procedural rule for including multiple claimants on the same claim form. On July 23, 2015, the Employment Tribunal denied ASDA's requests. Following additional proceedings, on June 20, 2017, the Employment Appeal Tribunal ruled in favor of ASDA on the "strike out" issue and remitted the matter to the Employment Tribunal to determine whether the improperly filed claims should be struck out. On July 12, 2017, claimants sought permission from the Court of Appeals to appeal this ruling, which was granted on October 3, 2017. A hearing before the Court of Appeals is scheduled for October 23, 2018.
As to the initial phase of the Equal Value claims, on October 14, 2016, following a preliminary hearing, the Employment Tribunal ruled that claimants could compare their positions in ASDA's retail stores with those of employees in ASDA's warehouse and distribution facilities. On August 31, 2017, the Employment Appeal Tribunal affirmed the Employment Tribunal's ruling. The Employment Appeal Tribunal also granted permission for ASDA to appeal substantially all of its findings on August 31, 2017. ASDA sought permission to appeal the remainder of the Employment Appeal Tribunal's findings to the Court of Appeals on September 21, 2017. A hearing before the Court of Appeals is scheduled for October 10, 2018.
Claimants are now proceeding in the next phase of their claims. That phase will determine whether the work performed by the claimants is of equal value to the work performed by employees in ASDA's warehouse and distribution facilities.
At present, the Company cannot predict the number of such claims that may be filed, and cannot reasonably estimate any loss or range of loss that may arise from these proceedings. The Company believes it has substantial factual and legal defenses to these claims, and intends to defend the claims vigorously.
National Prescription Opiate Litigation
In December 2017, the United States Judicial Panel on Multidistrict Litigation ordered consolidated numerous lawsuits filed against a wide array of defendants by various plaintiffs, including counties, cities, healthcare providers, Native American tribes, individuals, and third-party payors, asserting claims generally concerning the impacts of widespread opioid abuse. The consolidated multidistrict litigation is entitled
In re National Prescription Opiate Litigation (MDL No. 2804)
, and is pending in the U.S. District Court for the Northern District of Ohio. The Company is named as a defendant in some of the cases included in this multidistrict litigation, including cases filed by several counties in West Virginia; by healthcare providers in Mississippi, Alabama, Texas, and Florida; and by the St. Croix Chippewa Indians of Wisconsin. Similar cases that name the Company have been filed in state courts by various counties and municipalities; by health care providers; and by various Native American Tribes. The Company cannot predict the number of such claims that may be filed, and cannot reasonably estimate any loss or range of loss that may arise from such claims. The Company believes it has substantial factual and legal defenses to these claims, and intends to defend the claims vigorously.
FCPA Investigation and Related Matters
The Audit Committee (the "Audit Committee") of the Board of Directors of the Company has been conducting an internal investigation into, among other things, alleged violations of the U.S. Foreign Corrupt Practices Act ("FCPA") and other alleged crimes or misconduct in connection with foreign subsidiaries, including Wal-Mart de México, S.A.B. de C.V. ("Walmex"), and
79
whether prior allegations of such violations and/or misconduct were appropriately handled by the Company. The Audit Committee and the Company have engaged outside counsel from a number of law firms and other advisors who are assisting in the on-going investigation of these matters.
The Company has also been conducting a voluntary global review of its policies, practices and internal controls for anti-corruption compliance. The Company is engaged in strengthening its global anti-corruption compliance program through appropriate remedial anti-corruption measures. In November 2011, the Company voluntarily disclosed that investigative activity to the U.S. Department of Justice (the "DOJ") and the Securities and Exchange Commission (the "SEC"). Since the implementation of the global review and the enhanced anti-corruption compliance program, the Audit Committee and the Company have identified or been made aware of additional allegations regarding potential violations of the FCPA. When such allegations have been reported or identified, the Audit Committee and the Company, together with their third party advisors, have conducted inquiries and when warranted based on those inquiries, opened investigations. Inquiries or investigations regarding allegations of potential FCPA violations were commenced in a number of foreign markets where the Company operates, including, but not limited to, Brazil, China and India.
As previously disclosed, the Company is under investigation by the DOJ and the SEC regarding possible violations of the FCPA. The Company has been cooperating with the agencies and discussions have been ongoing regarding the resolution of these matters. These discussions have progressed to a point that the Company can now reasonably estimate a probable loss and has recorded an aggregate accrual of
$283 million
with respect to these matters (the "Accrual"). As the discussions are continuing, there can be no assurance as to the timing or the terms of the final resolution of these matters.
A number of federal and local government agencies in Mexico have also initiated investigations of these matters. Walmex is cooperating with the Mexican governmental agencies conducting these investigations. Furthermore, lawsuits relating to the matters under investigation have been filed by several of the Company's shareholders against it, certain of its current directors, and certain of its former directors, certain of its former officers and certain of Walmex's former officers.
The Company could be exposed to a variety of negative consequences as a result of the matters noted above. There could be one or more enforcement actions in respect of the matters that are the subject of some or all of the on-going government investigations, and such actions, if brought, may result in judgments, settlements, fines, penalties, injunctions, cease and desist orders, debarment or other relief, criminal convictions and/or penalties and the shareholder lawsuits referenced above may result in judgments against the Company and its current and former directors and officers named in those proceedings. The Company expects that there will be on-going media and governmental interest, including additional news articles from media publications on these matters, which could impact the perception among certain audiences of the Company's role as a corporate citizen.
In addition, the Company has incurred and expects to continue to incur costs in responding to requests for information or subpoenas seeking documents, testimony and other information in connection with the government investigations, in defending the shareholder lawsuits, and in conducting the review and investigations. These costs will be expensed as incurred. For the fiscal years ended
January 31, 2018
,
2017
and
2016
, the Company incurred the following third-party expenses in connection with the FCPA investigation and related matters:
|
Fiscal Years Ended January 31,
|
||||||||||||
|
(Amounts in millions)
|
2018
|
2017
|
2016
|
|||||||||
|
Ongoing inquiries and investigations
|
$
|
26
|
|
$
|
80
|
|
$
|
95
|
|
|||
|
Global compliance program and organizational enhancements
|
14
|
|
19
|
|
31
|
|
||||||
|
Total
|
$
|
40
|
|
$
|
99
|
|
$
|
126
|
|
|||
The Company does not presently believe that these matters, including the Accrual (and the payment of the Accrual at some point-in-time in the future), will have a material adverse effect on its business, although given the inherent uncertainties in such situations, the Company can provide no assurance that these matters will not be material to its business in the future.
80
The Company has long-term leases for stores and equipment. Rentals (including amounts applicable to taxes, insurance, maintenance, other operating expenses and contingent rentals) under operating leases and other short-term rental arrangements were
$2.9 billion
,
$2.6 billion
and
$2.5 billion
in fiscal
2018
,
2017
and
2016
, respectively.
Aggregate minimum annual rentals at
January 31, 2018
, under non-cancelable leases are as follows:
|
(Amounts in millions)
|
|
|
||||||
|
Fiscal Year
|
Operating Leases
(1)
|
Capital Lease and Financing Obligations
|
||||||
|
2019
|
$
|
1,933
|
|
$
|
1,039
|
|
||
|
2020
|
1,718
|
|
987
|
|
||||
|
2021
|
1,532
|
|
942
|
|
||||
|
2022
|
1,381
|
|
843
|
|
||||
|
2023
|
1,158
|
|
696
|
|
||||
|
Thereafter
|
7,644
|
|
5,423
|
|
||||
|
Total minimum rentals
|
$
|
15,366
|
|
$
|
9,930
|
|
||
|
Less estimated executory costs
|
27
|
|
||||||
|
Net minimum lease payments
|
9,903
|
|
||||||
|
Noncash gain on future termination of financing obligation
|
1,111
|
|
||||||
|
Less imputed interest
|
(3,567
|
)
|
||||||
|
Present value of minimum lease payments
|
$
|
7,447
|
|
|||||
|
(1)
|
Represents minimum contractual obligation for non-cancelable leases with initial or remaining terms greater than 12 months as of
January 31, 2018
.
|
Certain of the Company's leases provide for the payment of contingent rentals based on a percentage of sales. Such contingent rentals were not material for fiscal
2018
,
2017
and
2016
. Substantially all of the Company's store leases have renewal options, some of which may trigger an escalation in rentals.
The Company offers a 401(k) plan for associates in the U.S. under which eligible associates can begin contributing to the plan immediately upon hire. The Company also offers a 401(k) type plan for associates in Puerto Rico under which associates can begin to contribute generally after one year of employment. Under these plans, after one year of employment, the Company matches
100%
of participant contributions up to
6%
of annual eligible earnings. The matching contributions immediately vest at
100%
for each associate. Participants can contribute up to
50%
of their pretax earnings, but not more than the statutory limits.
Associates in international countries who are not U.S. citizens are covered by various defined contribution post-employment benefit arrangements. These plans are administered based upon the legislative and tax requirements in the countries in which they are established.
The following table summarizes the contribution expense related to the Company's defined contribution plans for fiscal
2018
,
2017
and
2016
:
|
Fiscal Years Ended January 31,
|
|||||||||||
|
(Amounts in millions)
|
2018
|
2017
|
2016
|
||||||||
|
Defined contribution plans:
|
|||||||||||
|
U.S.
|
$
|
1,124
|
|
$
|
1,064
|
|
$
|
967
|
|
||
|
International
|
126
|
|
173
|
|
179
|
|
|||||
|
Total contribution expense for defined contribution plans
|
$
|
1,250
|
|
$
|
1,237
|
|
$
|
1,146
|
|
||
Additionally, the Company's subsidiaries in the United Kingdom and Japan have sponsored defined benefit pension plans. The plan in the United Kingdom was overfunded by
$97 million
at
January 31, 2018
and underfunded by
$129 million
at January 31,
2017
. The plan in Japan was underfunded by
$184 million
and
$203 million
at
January 31, 2018
and
2017
, respectively. Overfunded amounts are recorded as assets in the Company's Consolidated Balance Sheets in other assets and deferred charges. Underfunded amounts are recorded as liabilities in the Company's Consolidated Balance Sheets in deferred income taxes and other. Certain other international operations also have defined benefit arrangements that are not significant.
81
Other than the jet.com transaction discussed below, the Company completed certain eCommerce acquisitions during fiscal
2018
and
2017
, which were immaterial, individually and in the aggregate, to the Company's Consolidated Financial Statements.
The following significant transaction primarily impacts the operations of the Company's Walmart U.S. segment:
Jet.com, Inc.
In September 2016, the Company completed the acquisition of jet.com, a U.S.-based eCommerce company. The integration of jet.com into the Walmart U.S. segment is building upon the current eCommerce foundation, allowing for synergies from talent, logistical operations and access to a broader customer base. The total purchase price for the acquisition was
$2.4 billion
, net of cash acquired. The allocation of the purchase price includes
$1.7 billion
in goodwill and
$0.6 billion
in intangible assets. As part of the transaction, the Company agreed to pay additional compensation of approximately
$0.8 billion
over a five year period.
The following significant transactions impact the operations of the Company's Walmart International segment:
Suburbia
In April 2017, one of the Company's subsidiaries sold Suburbia, the apparel retail division in Mexico, for
$1.0 billion
. As part of the sales agreement, the Company is also leasing certain real estate to the purchaser. The sale resulted in a pre-tax gain of
$0.7 billion
, of which
$0.4 billion
was recognized in the second quarter of fiscal 2018 in membership and other income, and the remainder was deferred and is being recognized over the lease terms of approximately
20 years
.
Yihaodian and JD.com, Inc. ("JD")
In June 2016, the Company sold certain assets relating to Yihaodian, its eCommerce operations in China, including the Yihaodian brand, website and application, to JD in exchange for
Class A ordinary shares
of JD representing approximately
five percent
of JD's outstanding ordinary shares on a fully diluted basis. The
$1.5 billion
investment in JD is carried at cost and is included in other assets and deferred charges in the accompanying Consolidated Balance Sheets. The sale resulted in the recognition of a
$535 million
noncash gain, which was included in membership and other income in the accompanying Consolidated Statements of Income. Subsequently, during fiscal 2017, the Company purchased
$1.9 billion
of additional JD shares classified as available for sale securities, representing an incremental ownership percentage of approximately
five percent
, for a total ownership of approximately
ten percent
of JD's outstanding ordinary shares.
In fiscal 2016, the Company completed the purchase of all of the remaining noncontrolling interest in Yihaodian for approximately
$760 million
, using existing cash to complete this transaction.
In the fourth quarter of fiscal 2018, the Company announced several organizational changes to position the business for more efficient growth going forward. As a result, the Company recorded
$1.2 billion
in pre-tax restructuring charges in fiscal 2018 as follows:
|
|
Fiscal Year Ended January 31, 2018
|
|||||||||||
|
(Amounts in millions)
|
Asset Impairment
|
Severance Costs
|
Total
|
|||||||||
|
Walmart International
|
$
|
193
|
|
$
|
43
|
|
$
|
236
|
|
|||
|
Sam's Club
|
596
|
|
69
|
|
665
|
|
||||||
|
Corporate and support
|
—
|
|
300
|
|
300
|
|
||||||
|
Total
|
$
|
789
|
|
$
|
412
|
|
$
|
1,201
|
|
|||
The asset impairment charges primarily relate to the real estate of the Sam's Club closures and the wind-down of the Brazil first-party eCommerce business, which were written down to their estimated fair value. Refer to
Note 7
for information on fair value measurement.
The pre-tax restructuring charges of
$1.2 billion
are classified in operating, selling, general and administrative expenses in the Company's Consolidated Statement of Income for fiscal 2018. At January 31, 2018, substantially all of the severances costs were recorded in accrued liabilities in the Company's Consolidated Balance Sheet. Almost all of these severance costs are expected to be paid during the first quarter of fiscal 2019.
82
The Company is engaged in the operation of retail, wholesale and other units, as well as eCommerce websites, located throughout the U.S., Africa, Argentina, Brazil, Canada, Central America, Chile, China, India, Japan, Mexico and the United Kingdom. The Company's operations are conducted in three reportable segments: Walmart U.S., Walmart International and Sam's Club. The Company defines its segments as those operations whose results the chief operating decision maker ("CODM") regularly reviews to analyze performance and allocate resources. The Company sells similar individual products and services in each of its segments. It is impractical to segregate and identify revenues for each of these individual products and services.
The Walmart U.S. segment includes the Company's mass merchant concept in the U.S. operating under the "Walmart" or "Wal-Mart" brands, as well as eCommerce. The Walmart International segment consists of the Company's operations outside of the U.S., including eCommerce. The Sam's Club segment includes the warehouse membership clubs in the U.S., as well as samsclub.com. Corporate and support consists of corporate overhead and other items not allocated to any of the Company's segments.
The Company measures the results of its segments using, among other measures, each segment's net sales and operating income, which includes certain corporate overhead allocations. From time to time, the Company revises the measurement of each segment's operating income, including any corporate overhead allocations, as determined by the information regularly reviewed by its CODM. When the measurement of a segment changes, previous period amounts and balances are reclassified to be comparable to the current period's presentation.
Information for the Company's segments, as well as for Corporate and support, including the reconciliation to income before income taxes, is provided in the following table:
|
(Amounts in millions)
|
Walmart U.S.
|
Walmart International
|
Sam's Club
|
Corporate and support
|
Consolidated
|
|||||||||||||||
|
Fiscal Year Ended January 31, 2018
|
||||||||||||||||||||
|
Net sales
|
$
|
318,477
|
|
$
|
118,068
|
|
$
|
59,216
|
|
$
|
—
|
|
$
|
495,761
|
|
|||||
|
Operating income (loss)
|
17,869
|
|
5,352
|
|
982
|
|
(3,766
|
)
|
20,437
|
|
||||||||||
|
Interest, net
|
(2,178
|
)
|
||||||||||||||||||
|
Loss on extinguishment of debt
|
(3,136
|
)
|
||||||||||||||||||
|
Income before income taxes
|
$
|
15,123
|
|
|||||||||||||||||
|
Total assets
|
$
|
104,347
|
|
$
|
81,549
|
|
$
|
13,418
|
|
$
|
5,208
|
|
$
|
204,522
|
|
|||||
|
Depreciation and amortization
|
3,655
|
|
2,601
|
|
466
|
|
3,807
|
|
10,529
|
|
||||||||||
|
Capital expenditures
|
5,680
|
|
2,607
|
|
626
|
|
1,138
|
|
10,051
|
|
||||||||||
|
Fiscal Year Ended January 31, 2017
|
||||||||||||||||||||
|
Net sales
|
$
|
307,833
|
|
$
|
116,119
|
|
$
|
57,365
|
|
$
|
—
|
|
$
|
481,317
|
|
|||||
|
Operating income (loss)
|
17,745
|
|
5,758
|
|
1,671
|
|
(2,410
|
)
|
22,764
|
|
||||||||||
|
Interest, net
|
(2,267
|
)
|
||||||||||||||||||
|
Income before income taxes
|
$
|
20,497
|
|
|||||||||||||||||
|
Total assets
|
$
|
104,262
|
|
$
|
74,508
|
|
$
|
14,125
|
|
$
|
5,930
|
|
$
|
198,825
|
|
|||||
|
Depreciation and amortization
|
3,298
|
|
2,629
|
|
487
|
|
3,666
|
|
10,080
|
|
||||||||||
|
Capital expenditures
|
6,090
|
|
2,697
|
|
639
|
|
1,193
|
|
10,619
|
|
||||||||||
|
Fiscal Year Ended January 31, 2016
|
||||||||||||||||||||
|
Net sales
|
$
|
298,378
|
|
$
|
123,408
|
|
$
|
56,828
|
|
$
|
—
|
|
$
|
478,614
|
|
|||||
|
Operating income (loss)
|
19,087
|
|
5,346
|
|
1,820
|
|
(2,148
|
)
|
24,105
|
|
||||||||||
|
Interest, net
|
(2,467
|
)
|
||||||||||||||||||
|
Income before income taxes
|
$
|
21,638
|
|
|||||||||||||||||
|
Total assets
|
$
|
103,109
|
|
$
|
73,720
|
|
$
|
13,998
|
|
$
|
8,754
|
|
$
|
199,581
|
|
|||||
|
Depreciation and amortization
|
2,800
|
|
2,549
|
|
472
|
|
3,633
|
|
9,454
|
|
||||||||||
|
Capital expenditures
|
6,728
|
|
2,930
|
|
695
|
|
1,124
|
|
11,477
|
|
||||||||||
83
Total revenues, consisting of net sales and membership and other income, and long-lived assets, consisting primarily of property and equipment, net, aggregated by the Company's U.S. and non-U.S. operations for fiscal
2018
,
2017
and
2016
, are as follows:
|
Fiscal Years Ended January 31,
|
|||||||||||
|
(Amounts in millions)
|
2018
|
2017
|
2016
|
||||||||
|
Revenues
|
|||||||||||
|
U.S. operations
|
$
|
380,580
|
|
$
|
367,784
|
|
$
|
357,559
|
|
||
|
Non-U.S. operations
|
119,763
|
|
118,089
|
|
124,571
|
|
|||||
|
Total revenues
|
$
|
500,343
|
|
$
|
485,873
|
|
$
|
482,130
|
|
||
|
Long-lived assets
|
|||||||||||
|
U.S. operations
|
$
|
81,478
|
|
$
|
82,746
|
|
$
|
82,475
|
|
||
|
Non-U.S. operations
|
33,340
|
|
31,432
|
|
34,041
|
|
|||||
|
Total long-lived assets
|
$
|
114,818
|
|
$
|
114,178
|
|
$
|
116,516
|
|
||
No individual country outside of the U.S. had total revenues or long-lived assets that were material to the consolidated totals. Additionally, the Company did not generate material total revenues from any single customer.
Dividends Declared
On
February 20, 2018
, the Board of Directors approved the fiscal
2019
annual dividend at
$2.08
per share, an increase over the fiscal
2018
dividend of
$2.04
per share. For fiscal
2019
, the annual dividend will be paid in four quarterly installments of
$0.52
per share, according to the following record and payable dates:
|
Record Date
|
|
Payable Date
|
|
March 9, 2018
|
|
April 2, 2018
|
|
May 11, 2018
|
|
June 4, 2018
|
|
August 10, 2018
|
|
September 4, 2018
|
|
December 7, 2018
|
|
January 2, 2019
|
|
Fiscal Year Ended January 31, 2018
|
||||||||||||||||||||
|
(Amounts in millions, except per share data)
|
Q1
|
Q2
|
Q3
|
Q4
|
Total
|
|||||||||||||||
|
Total revenues
|
$
|
117,542
|
|
$
|
123,355
|
|
$
|
123,179
|
|
$
|
136,267
|
|
$
|
500,343
|
|
|||||
|
Net sales
|
116,526
|
|
121,949
|
|
122,136
|
|
135,150
|
|
495,761
|
|
||||||||||
|
Cost of sales
|
87,688
|
|
91,521
|
|
91,547
|
|
102,640
|
|
373,396
|
|
||||||||||
|
Consolidated net income
|
3,152
|
|
3,104
|
|
1,904
|
|
2,363
|
|
10,523
|
|
||||||||||
|
Consolidated net income attributable to Walmart
|
3,039
|
|
2,899
|
|
1,749
|
|
2,175
|
|
9,862
|
|
||||||||||
|
Basic net income per common share attributable to Walmart
|
1.00
|
|
0.96
|
|
0.59
|
|
0.74
|
|
3.29
|
|
||||||||||
|
Diluted net income per common share attributable to Walmart
(1)
|
1.00
|
|
0.96
|
|
0.58
|
|
0.73
|
|
3.28
|
|
||||||||||
|
|
Fiscal Year Ended January 31, 2017
|
|||||||||||||||||||
|
|
Q1
|
Q2
|
Q3
|
Q4
|
Total
|
|||||||||||||||
|
Total revenues
|
$
|
115,904
|
|
$
|
120,854
|
|
$
|
118,179
|
|
$
|
130,936
|
|
$
|
485,873
|
|
|||||
|
Net sales
|
114,986
|
|
119,405
|
|
117,176
|
|
129,750
|
|
481,317
|
|
||||||||||
|
Cost of sales
|
86,544
|
|
89,485
|
|
87,484
|
|
97,743
|
|
361,256
|
|
||||||||||
|
Consolidated net income
|
3,216
|
|
3,889
|
|
3,202
|
|
3,986
|
|
14,293
|
|
||||||||||
|
Consolidated net income attributable to Walmart
|
3,079
|
|
3,773
|
|
3,034
|
|
3,757
|
|
13,643
|
|
||||||||||
|
Basic net income per common share attributable to Walmart
|
0.98
|
|
1.21
|
|
0.98
|
|
1.23
|
|
4.40
|
|
||||||||||
|
Diluted net income per common share attributable to Walmart
(1)
|
0.98
|
|
1.21
|
|
0.98
|
|
1.22
|
|
4.38
|
|
||||||||||
|
(1)
|
The sum of quarterly amounts may not agree to annual amount due to rounding and the impact of a decreasing amount of shares outstanding during the year.
|
84
|
ITEM 9.
|
CHANGES IN AND DISAGREEMENTS WITH ACCOUNTANTS ON ACCOUNTING AND FINANCIAL DISCLOSURE
|
None.
|
ITEM 9A.
|
CONTROLS AND PROCEDURES
|
Evaluation of Disclosure Controls and Procedures
We maintain disclosure controls and procedures that are designed to provide reasonable assurance that information, which is required to be timely disclosed, is accumulated and communicated to management in a timely fashion. In designing and evaluating such controls and procedures, we recognize that any controls and procedures, no matter how well designed and operated, can provide only reasonable assurance of achieving the desired control objectives. Our management is necessarily required to use judgment in evaluating controls and procedures. Also, we have investments in unconsolidated entities. Since we do not control or manage those entities, our controls and procedures with respect to those entities are substantially more limited than those we maintain with respect to our consolidated subsidiaries.
In the ordinary course of business, we review our internal control over financial reporting and make changes to our systems and processes to improve such controls and increase efficiency, while ensuring that we maintain an effective internal control environment. Changes may include such activities as implementing new, more efficient systems, updating existing systems, automating manual processes, migrating certain processes to our shared services organizations and increasing monitoring controls. These changes have not materially affected, and are not reasonably likely to materially affect, the Company's internal control over financial reporting. However, they allow us to continue to enhance our internal control over financial reporting and ensure that our internal control environment remains effective.
An evaluation of the effectiveness of the design and operation of our disclosure controls and procedures as of the end of the period covered by this report was performed under the supervision and with the participation of management, including our Chief Executive Officer and Chief Financial Officer. Based upon that evaluation, our Chief Executive Officer and Chief Financial Officer concluded that our disclosure controls and procedures are effective to provide reasonable assurance that information required to be disclosed by the Company in the reports that it files or submits under the Securities Exchange Act of 1934, as amended, is accumulated and communicated to management, including our Chief Executive Officer and Chief Financial Officer, as appropriate, to allow timely decisions regarding required disclosure and are effective to provide reasonable assurance that such information is recorded, processed, summarized and reported within the time periods specified by the SEC's rules and forms.
Report on Internal Control Over Financial Reporting
Management has responsibility for establishing and maintaining adequate internal control over financial reporting. Internal control over financial reporting is a process designed to provide reasonable assurance regarding the reliability of financial reporting and the preparation of financial statements for external reporting purposes in accordance with accounting principles generally accepted in the United States. Because of its inherent limitations, internal control over financial reporting may not prevent or detect misstatements. Management has assessed the effectiveness of the Company's internal control over financial reporting as of
January 31, 2018
. In making its assessment, management has utilized the criteria set forth by the Committee of Sponsoring Organizations ("COSO") of the Treadway Commission in Internal Control-Integrated Framework (2013). Management concluded that based on its assessment, Walmart's internal control over financial reporting was effective as of
January 31, 2018
. The Company's internal control over financial reporting as of
January 31, 2018
, has been audited by Ernst & Young LLP as stated in their report which appears herein.
Changes in Internal Control Over Financial Reporting
There has been no change in the Company's internal control over financial reporting as of
January 31, 2018
, that has materially affected, or is reasonably likely to materially affect, the Company's internal control over financial reporting.
85
Report on Ethical Standards
Our Company was founded on the belief that open communication and the highest ethical standards are necessary to be successful. Our long-standing "Open Door" communication policy helps management be aware of and address issues in a timely and effective manner. Through the open door policy all associates are encouraged to inform management at the appropriate level when they are concerned about any matter pertaining to Walmart.
Walmart has adopted a Statement of Ethics to guide our associates in the continued observance of high ethical standards such as honesty, integrity and compliance with the law in the conduct of Walmart's business. Familiarity and compliance with the Statement of Ethics is required of all associates. The Company also maintains a separate Code of Ethics for our senior financial officers. Walmart also has in place a Related-Party Transaction Policy. This policy applies to Walmart's senior officers and directors and requires material related-party transactions to be reviewed by the Audit Committee. The senior officers and directors are required to report material related-party transactions to Walmart. We maintain a global ethics and compliance office which oversees and administers several reporting mechanisms, including an ethics helpline. The ethics helpline provides a channel for associates to ask questions and make confidential complaints regarding potential violations of our statements of ethics, including violations related to financial or accounting matters. These contacts may be made anonymously.
|
/s/ C. Douglas McMillon
|
|
C. Douglas McMillon
President and Chief Executive Officer
|
|
/s/ M. Brett Biggs
|
|
M. Brett Biggs
Executive Vice President and Chief Financial Officer
|
|
ITEM 9B.
|
OTHER INFORMATION
|
None.
86
|
ITEM 10.
|
DIRECTORS, EXECUTIVE OFFICERS AND CORPORATE GOVERNANCE
|
Information required by this item with respect to the Company's directors, certain family relationships, and compliance by the Company's directors, executive officers and certain beneficial owners of the Company's common stock with Section 16(a) of the Securities Exchange Act of 1934, as amended, is incorporated by reference to such information under the captions entitled "Proposal No. 1 – Election of Directors" and "Stock Ownership – Section 16(a) Beneficial Ownership Reporting Compliance" in our Proxy Statement relating to the Annual Meeting of Shareholders to be held on
May 30, 2018
(our "Proxy Statement").
Please see the information concerning our executive officers contained in
Part I, Item 1
herein under the caption "
Executive Officers of the Registrant
," which is included there in accordance with Instruction 3 to Item 401(b) of the SEC's Regulation S-K.
No material changes have been made to the procedures by which shareholders of the Company may recommend nominees to our board of directors since those procedures were disclosed in our proxy statement relating to our
2017
Annual Shareholders' Meeting as previously filed with the SEC.
The information regarding our Audit Committee, including our audit committee financial experts and our Codes of Ethics for the CEO and Senior Financial Officers and our Statement of Ethics applicable to all of our associates, including our Chief Executive Officer, Chief Financial Officer and our Controller, who is our principal accounting officer, required by this item is incorporated herein by reference to the information under the captions "Corporate Governance – Board Committees" and "Proposal No. 3: Ratification of Independent Accountants – Audit Committee Independence and Financial Expert Determination" included in our Proxy Statement. "
Item 1. Business
" above contains information relating to the availability of a copy of our Code of Ethics for our CEO and Senior Financial Officers and our Statement of Ethics and the posting of amendments to and any waivers of the Code of Ethics for our CEO and Senior Financial Officers and our Statement of Ethics on our website.
|
ITEM 11.
|
EXECUTIVE COMPENSATION
|
The information required by this item is incorporated herein by reference to all information under the captions "Corporate Governance – Director Compensation," "Executive Compensation" and under the sub-captions "Compensation Committee Interlocks and Insider Participation" and "Compensation Committee Report" that appear under the caption "Executive Compensation" included in our Proxy Statement.
|
ITEM 12.
|
SECURITY OWNERSHIP OF CERTAIN BENEFICIAL OWNERS AND MANAGEMENT AND RELATED STOCKHOLDER MATTERS
|
The information required by this item is incorporated herein by reference to all information under the sub-captions "Holdings of Major Shareholders" and "Holdings of Officers and Directors" that appear under the caption "Stock Ownership" and all information that appears under the caption "Executive Compensation Tables – Equity Compensation Plan Information" included in our Proxy Statement.
|
ITEM 13.
|
CERTAIN RELATIONSHIPS AND RELATED TRANSACTIONS, AND DIRECTOR INDEPENDENCE
|
The information required by this item is incorporated herein by reference to all information under the caption "Corporate Governance – Fiscal 2018 Review of Related Person Transactions" and under the caption "Corporate Governance – How We Determine Director Independence" included in our Proxy Statement.
|
ITEM 14.
|
PRINCIPAL ACCOUNTING FEES AND SERVICES
|
The information required by this item is incorporated herein by reference to all information under the caption "Proposal No. 3 – Ratification of Independent Accountants" and the sub-caption thereunder "Audit Committee Pre-Approval Policy" included in our Proxy Statement.
87
|
ITEM 15.
|
EXHIBITS, FINANCIAL STATEMENT SCHEDULES
|
(a) Documents filed as part of this report are as follows:
1. Financial Statements: See the Financial Statements in
Part II, Item 8
.
2. Financial Statement Schedules:
Certain schedules have been omitted because the required information is not present or is not present in amounts sufficient to require submission of the schedule, or because the information required is included in the Consolidated Financial Statements, including the notes thereto.
3. Exhibits:
The required exhibits are included at the end of the Form 10-K or are incorporated herein by reference and are described in the Exhibit Index immediately preceding the first exhibit to this Annual Report on Form 10-K.
|
(b)
|
The exhibits furnished with this Annual Report on Form 10-K in accordance with the requirement of Form 10-K of the SEC are listed in the Exhibit Index, which appears immediately following the signature pages to this Annual Report on Form 10-K and which is incorporated in this Item 15(b) by reference to such Exhibit Index.
|
(c) Financial Statement Schedules: None.
|
ITEM 16.
|
FORM 10-K SUMMARY
|
None.
88
SIGNATURES
Pursuant to the requirements of Section 13 or 15(d) of the Securities Exchange Act of 1934, the registrant has duly caused this report to be signed on its behalf by the undersigned, thereunto duly authorized.
|
|
Walmart Inc.
|
|||
|
Date: March 30, 2018
|
|
By
|
|
/s/ C. Douglas McMillon
|
|
|
|
C. Douglas McMillon
|
||
|
|
|
President and Chief Executive Officer
|
||
Pursuant to the requirements of the Securities Exchange Act of 1934, this report has been signed below by the following persons on behalf of the registrant and in the capacities and on the dates indicated:
|
Date: March 30, 2018
|
|
By
|
|
/s/ C. Douglas McMillon
|
|
|
|
C. Douglas McMillon
|
||
|
|
|
President and Chief Executive Officer and Director
|
||
|
|
|
(Principal Executive Officer)
|
||
|
Date: March 30, 2018
|
|
By
|
|
/s/ Gregory B. Penner
|
|
|
|
Gregory B. Penner
|
||
|
|
|
Chairman of the Board and Director
|
||
|
Date: March 30, 2018
|
|
By
|
|
/s/ M. Brett Biggs
|
|
|
|
M. Brett Biggs
|
||
|
|
|
Executive Vice President and Chief Financial Officer
|
||
|
(Principal Financial Officer)
|
||||
|
Date: March 30, 2018
|
|
By
|
|
/s/ David M. Chojnowski
|
|
|
|
David M. Chojnowski
|
||
|
|
|
Senior Vice President and Controller
|
||
|
(Principal Accounting Officer)
|
||||
Signature Page to Walmart Inc.
Form 10-K for the Fiscal Year Ended
January 31, 2018
89
|
Date: March 30, 2018
|
|
By
|
|
/s/ James I. Cash, Jr.
|
|
|
|
James I. Cash, Jr., Ph.D.
|
||
|
|
|
Director
|
||
|
Date: March 30, 2018
|
By
|
/s/ Timothy P. Flynn
|
||
|
Timothy P. Flynn
|
||||
|
Director
|
||||
|
Date: March 30, 2018
|
By
|
/s/ Sarah Friar
|
||
|
Sarah Friar
|
||||
|
Director
|
||||
|
Date: March 30, 2018
|
By
|
/s/ Carla A. Harris
|
||
|
Carla A. Harris
|
||||
|
Director
|
||||
|
Date: March 30, 2018
|
By
|
/s/ Thomas W. Horton
|
||
|
Thomas W. Horton
|
||||
|
Director
|
||||
|
Date: March 30, 2018
|
By
|
/s/ Marissa A. Mayer
|
||
|
Marissa A. Mayer
|
||||
|
Director
|
||||
|
Date: March 30, 2018
|
By
|
/s/ Steven S Reinemund
|
||
|
Steven S Reinemund
|
||||
|
Director
|
||||
|
Date: March 30, 2018
|
|
By
|
|
/s/ Kevin Y. Systrom
|
|
|
|
Kevin Y. Systrom
|
||
|
|
|
Director
|
||
|
Date: March 30, 2018
|
|
By
|
|
/s/ S. Robson Walton
|
|
|
|
S. Robson Walton
|
||
|
|
|
Director
|
||
|
Date: March 30, 2018
|
|
By
|
|
/s/ Steuart L. Walton
|
|
|
|
Steuart L. Walton
|
||
|
|
|
Director
|
||
Signature Page to Walmart Inc.
Form 10-K for the Fiscal Year Ended
January 31, 2018
90
Exhibit Index
(1),(2)
The following exhibits are filed or furnished as part of this Form 10-K or are incorporated herein by reference.
|
3(a)
|
||
|
3(b)
|
||
|
4(a)
|
Form of Indenture dated as of July 15, 1990, between the Company and Harris Trust and Savings Bank, Trustee, is incorporated herein by reference to Exhibit 4(b) to Registration Statement on Form S-3 (File Number 33-35710)
(P)
|
|
|
4(b)
|
Indenture dated as of April 1, 1991, between the Company and J.P. Morgan Trust Company, National Association, as successor trustee to Bank One Trust Company, NA, as successor trustee to The First National Bank of Chicago, Trustee, is incorporated herein by reference to Exhibit 4(a) to Registration Statement on Form S-3 (File Number 33-51344)
(P)
|
|
|
4(c)
|
First Supplemental Indenture dated as of September 9, 1992, to the Indenture dated as of April 1, 1991, between the Company and J.P. Morgan Trust Company, National Association, as successor trustee to Bank One Trust Company, NA, as successor trustee to The First National Bank of Chicago, Trustee, is incorporated herein by reference to Exhibit 4(b) to Registration Statement on Form S-3 (File Number 33-51344)
(P)
|
|
|
4(d)
|
||
|
4(e)
|
||
|
4(f)
|
||
|
4(g)
|
||
|
4(h)
|
||
|
10(a)*
|
||
|
10(b)*
|
||
|
10(c)*
|
||
|
10(d)*
|
||
|
10(e)*
|
||
|
10(f)*
|
||
|
10(g)
|
||
|
10(g).1*
|
||
|
10(h)*
|
||
91
|
10(i)
|
||
|
10(j)
|
||
|
10(k)
|
||
|
10(l)*
|
||
|
10(m)*
|
||
|
10(n)
|
||
|
10(o)
|
||
|
10(p)
|
||
|
10(q)
|
||
|
10(r)
|
||
|
10(s)
|
||
|
10(t)
|
||
|
10(u)
|
||
|
10(v)
|
||
|
10(w)
|
||
|
10(x)
|
||
|
12.1*
|
||
92
|
21*
|
||
|
23*
|
||
|
31.1*
|
||
|
31.2*
|
||
|
32.1**
|
||
|
32.2**
|
||
|
101.INS*
|
XBRL Instance Document
|
|
|
101.SCH*
|
XBRL Taxonomy Extension Schema Document
|
|
|
101.CAL*
|
XBRL Taxonomy Extension Calculation Linkbase Document
|
|
|
101.DEF*
|
XBRL Taxonomy Extension Definition Linkbase Document
|
|
|
101.LAB*
|
XBRL Taxonomy Extension Label Linkbase Document
|
|
|
101.PRE*
|
XBRL Taxonomy Extension Presentation Linkbase Document
|
|
|
*
|
Filed herewith as an Exhibit.
|
|
|
**
|
Furnished herewith as an Exhibit.
|
|
|
(P)
|
This Exhibit was originally filed in paper format. Accordingly, a hyperlink has not been provided.
|
|
Notes to Exhibit Index:
|
1.
|
The exhibits listed in this Exhibit Index and incorporated as exhibits to the Annual Report on Form 10-K of Walmart Inc. (the "Company") for the fiscal year ended January 31, 2018 by reference to an Annual Report on Form 10-K, Quarterly Report on Form 10-Q or Current Report on Form 8-K of the Company previously filed with the SEC by the Company are available for review online on the EDGAR system of the SEC at www.sec.gov as exhibits to the Annual Report on Form 10-K, Quarterly Report on Form 10-Q or Current Report on Form 8-K referred to above in the description of the exhibit incorporated by reference. The historical filings of the Company may be reviewed and copied at the Public Reference Room of the SEC at 100 F Street, NE Washington, DC 20549-2521 under Commission File No. 001-6991.
|
|
2.
|
The Company and its subsidiaries have in the past issued, and may in the future issue from time to time, long-term debt instruments, but the aggregate principal amount of the debt instruments of any one series of such debt instruments has not exceeded or will not exceed 10% of the assets of the Company at any pertinent time. The Company has previously filed with the SEC its agreement to, and hereby agrees to, file copies of the agreements relating to long-term debt instruments and the instruments representing or evidencing such long-term debt instruments with the SEC upon request. As a result, in accordance with the provisions of paragraph (b)(4)(iii)(A) of Item 601 of Regulation S-K of the SEC, copies of such long-term debt instruments have not been filed as exhibits to the Annual Report on Form 10-K of the Company for the fiscal year ended January 31, 2018. The Company has previously filed the documents and instruments establishing the specific terms of long-term debt instruments offered and sold by the Company pursuant to its effective registration statements filed with the SEC pursuant to the Securities Act of 1933, as amended, as exhibits to the applicable registration statement or as exhibits to a Current Report on Form 8-K filed in connection with the applicable registration statement and the sale and issuance of those long-term debt instruments.
|
93
TABLE OF CONTENTS
Part IItem 1. BusinessItem 1A. Risk FactorsItem 1B. Unresolved Staff CommentsItem 2. PropertiesItem 3. Legal ProceedingsItem 4. Mine Safety DisclosuresPart IIItem 5. Market For Registrant's Common Equity, Related Stockholder Matters and Issuer Purchases Of Equity SecuritiesItem 6. Selected Financial DataItem 7. Management's Discussion and Analysis Of Financial Condition and Results Of OperationsItem 7A. Quantitative and Qualitative Disclosures About Market RiskItem 8. Financial Statements and Supplementary DataNote 1. Summary Of Significant Accounting PoliciesNote 2. Net Income Per Common ShareNote 3. Shareholders' EquityNote 4. Accumulated Other Comprehensive LossNote 5. Accrued LiabilitiesNote 6. Short-term Borrowings and Long-term DebtNote 7. Fair Value MeasurementsNote 8. Derivative Financial InstrumentsNote 9. TaxesNote 10. ContingenciesNote 11. CommitmentsNote 12. Retirement-related BenefitsNote 13. Acquisitions, Disposals and Related ItemsNote 14. Restructuring ChargesNote 15. SegmentsNote 16. Subsequent EventNote 17. Quarterly Financial Data (unaudited)Item 9. Changes in and Disagreements with Accountants on Accounting and Financial DisclosureItem 9A. Controls and ProceduresItem 9B. Other InformationPart IIIItem 10. Directors, Executive Officers and Corporate GovernanceItem 11. Executive CompensationItem 12. Security Ownership Of Certain Beneficial Owners and Management and Related Stockholder MattersItem 13. Certain Relationships and Related Transactions, and Director IndependenceItem 14. Principal Accounting Fees and ServicesPart IVItem 15. Exhibits, Financial Statement SchedulesItem 16. Form 10-k Summary