WOLFSPEED, INC.
10-Ks and 10-Qs
|
|
|
|
|
|
|
|
|
|
|
|
|
|
|
|
|
|
|
|
|
|
|
|
|
|
|
|
|
|
|
|
|
|
|
|
|
|
|
|
|
|
|
|
|
|
|
|
|
|
|
|
|
|
|
|
UNITED STATES
SECURITIES AND EXCHANGE COMMISSION
Washington, D.C. 20549
__________________________________________
FORM 10-K
(Mark One)
|
ý
|
ANNUAL REPORT PURSUANT TO SECTION 13 OR 15(d) OF THE SECURITIES EXCHANGE ACT OF 1934
|
|
For the fiscal year ended June 24, 2012
|
|
or
|
¨
|
TRANSITION REPORT PURSUANT TO SECTION 13 OR 15(d) OF THE SECURITIES EXCHANGE ACT OF 1934
|
|
For the transition period from to
|
|
Commission file number 0-21154
__________________________________________
CREE, INC.
(Exact name of registrant as specified in its charter)
|
North Carolina
|
|
56-1572719
|
|
(State or other jurisdiction of
incorporation or organization)
|
|
(I.R.S. Employer
Identification No.)
|
|
4600 Silicon Drive
Durham, North Carolina
|
|
27703
|
|
(Address of principal executive offices)
|
|
(Zip Code)
|
(919) 407-5300
(Registrant’s telephone number, including area code)
Securities registered pursuant to Section 12(b) of the Act:
|
Title of each class
|
|
Name of each exchange on which registered
|
|
Common Stock, $0.00125 par value
|
|
The NASDAQ Stock Market LLC
|
Securities registered pursuant to Section 12(g) of the Act:
None
__________________________________________
Indicate by check mark if the registrant is a well-known seasoned issuer, as defined in Rule 405 of the Securities Act. Yes
ý
No
¨
Indicate by check mark if the registrant is not required to file reports pursuant to Section 13 or 15(d) of the Act. Yes
¨
No
ý
Indicate by check mark whether the registrant (1) has filed all reports required to be filed by Section 13 or 15(d) of the Securities Exchange Act of 1934 during the preceding 12 months (or for such shorter period that the registrant was required to file such reports), and (2) has been subject to such filing requirements for the past 90 days. Yes
ý
No
¨
Indicate by check mark whether the registrant has submitted electronically and posted on its corporate Web site, if any, every Interactive Data File required to be submitted and posted pursuant to Rule 405 of Regulation S-T during the preceding 12 months (or for such shorter period that the registrant was required to submit and post such files). Yes
ý
No
¨
Indicate by check mark if disclosure of delinquent filers pursuant to Item 405 of Regulation S-K is not contained herein, and will not be contained, to the best of registrant’s knowledge, in definitive proxy or information statements incorporated by reference in Part III of this Form 10-K or any amendment to this Form 10-K.
¨
Indicate by check mark whether the registrant is a large accelerated filer, an accelerated filer, a non-accelerated filer, or a smaller reporting company. See definitions of “large accelerated filer,” “accelerated filer” and “smaller reporting company” in Rule 12b-2 of the Exchange Act. (Check one):
|
Large accelerated filer
|
ý
|
Accelerated filer
|
¨
|
|
Non-accelerated filer
|
¨
(Do not check if a smaller reporting company)
|
Smaller reporting company
|
¨
|
Indicate by check mark whether the registrant is a shell company (as defined in Rule 12b-2 of the Act). Yes
¨
No
ý
The aggregate market value of common stock held by non-affiliates of the registrant as of
December 23, 2011
, the last business day of the registrant’s most recently completed second fiscal quarter, was
$2,472,345,957
(based on the closing sale price of
$21.66
per share).
The number of shares of the registrant’s Common Stock,
$0.00125
par value per share, outstanding as of
August 14, 2012
was
115,953,015
.
__________________________________________
DOCUMENTS INCORPORATED BY REFERENCE
Portions of the definitive Proxy Statement to be delivered to shareholders in connection with the Annual Meeting of Shareholders to be held
October 23, 2012
are incorporated by reference into Part III.
CREE, INC.
FORM 10-K
For the Fiscal Year Ended
June 24, 2012
INDEX
|
|
|
Page
|
|
Part I
|
||
|
Item 1.
|
||
|
Item 1A.
|
||
|
Item 1B.
|
||
|
Item 2.
|
||
|
Item 3.
|
||
|
Item 4.
|
||
|
Part II
|
||
|
Item 5.
|
||
|
Item 6.
|
||
|
Item 7.
|
||
|
Item 7A.
|
||
|
Item 8.
|
||
|
Item 9.
|
||
|
Item 9A.
|
||
|
Item 9B.
|
||
|
Part III
|
||
|
Item 10.
|
||
|
Item 11.
|
||
|
Item 12.
|
||
|
Item 13.
|
||
|
Item 14.
|
||
|
PART IV
|
||
|
Item 15.
|
||
2
Forward-Looking Information
Information set forth in this Annual Report on Form 10-K contains various “forward-looking statements” within the meaning of Section 27A of the Securities Act of 1933, as amended (Securities Act), and Section 21E of the Securities Exchange Act of 1934, as amended (Exchange Act). All information contained in this report relative to future markets for our products and trends in and anticipated levels of revenue, gross margins and expenses, as well as other statements containing words such as “believe,” “project,” “may,” “will,” “anticipate,” “target,” “plan,” “estimate,” “expect” and “intend” and other similar expressions constitute forward-looking statements. These forward-looking statements are subject to business, economic and other risks and uncertainties, both known and unknown, and actual results may differ materially from those contained in the forward-looking statements. Any forward-looking statements we make are as of the date made, and except as required under the U.S. federal securities laws and the rules and regulations of the Securities and Exchange Commission (SEC), we disclaim any obligation to update them if our views later change. These forward- looking statements should not be relied upon as representing our views as of any date subsequent to the date of this Annual Report. Examples of risks and uncertainties that could cause actual results to differ materially from historical performance and any forward-looking statements include, but are not limited to, those described in “Risk Factors” in Item 1A of this Annual Report.
3
Item 1.
Business
Overview
Cree, Inc. (Cree, we, our, or us) is a leading innovator of lighting-class light emitting diode (LED) products, lighting products and semiconductor products for power and radio-frequency (RF) applications. Our products are targeted for applications such as indoor and outdoor lighting, video displays, transportation, electronic signs and signals, power supplies, solar inverters and wireless systems.
We develop and manufacture semiconductor materials and devices primarily based on silicon carbide (SiC), gallium nitride (GaN) and related compounds. The physical and electronic properties of SiC and GaN offer technical advantages over traditional silicon, gallium arsenide (GaAs) and other materials used for electronic and opto-electronic applications.
Our LED products consist of LED components, LED chips, and SiC wafers. As LED technology improves, we believe the potential market for LED lighting will continue to expand. Our success in selling LED products depends upon our ability to offer innovative products and solutions that enable our customers to develop and market LED based products that successfully compete and drive LED adoption against traditional lighting products.
Our lighting products consist of both LED and traditional lighting systems. We design, manufacture and sell lighting systems for indoor and outdoor applications, with our primary focus on LED lighting systems for the commercial and industrial markets. We also use our LED systems expertise to accelerate LED lighting adoption and expand the market for our LED components.
In addition, we develop, manufacture and sell power and RF devices. Our power products are made from SiC and provide faster switching speeds than comparable silicon-based power devices for a given power level. Our RF devices are made from GaN and produce higher power densities as compared to silicon or gallium arsenide.
The majority of our products are manufactured at our production facilities located in North Carolina, Wisconsin, and China. We also use contract manufacturers for certain aspects of product fabrication, assembly and packaging. We operate research and development facilities in North Carolina, California, Wisconsin, and China.
Cree, Inc. is a North Carolina corporation established in 1987. For further information about our consolidated revenues and earnings, please see our consolidated financial statements included in Item 8 of this Annual Report.
Reportable Segments
As of
June 24, 2012
, we have
three
reportable segments:
|
•
|
LED Products
|
|
•
|
Lighting Products
|
|
•
|
Power and RF Products
|
Reportable segments are components of an entity that have separate financial data that the entity's Chief Operating Decision Maker (CODM) regularly reviews when allocating resources and assessing performance. Our CODM is the Chief Executive Officer.
For financial results by reportable segment, please refer to Note 13, "Reportable Segments" in our consolidated financial statements included in Item 8 of this Annual Report.
Products by Reportable Segment
LED Products Segment
LED Products revenue represented
65%
,
82%
and
86%
of revenue for the fiscal years ended
June 24, 2012
,
June 26, 2011
and
June 27, 2010
, respectively. LED Products gross profit was
$290.6 million
,
$375.4 million
and
$379.8 million
and gross margin was
38%
,
46%
, and
51%
for fiscal years
2012
,
2011
, and
2010
, respectively.
4
Our LED Products segment includes LED chips, LED components, and SiC wafers.
LED Chips
Our LED chip products include blue and green LED chips based on GaN and related materials. LED chips or die are solid state electronic components used in a number of applications and are currently available in a variety of brightness levels, wavelengths (color) and sizes. We use our LED chips in the manufacturing of our LED components. Some of our customers use our blue and green LED chips in a variety of applications including video screens, gaming displays such as pachinko, function indicator lights and automotive backlights. Other customers combine our blue LED chips with phosphors to create white LEDs, which are used in various applications for indoor and outdoor illumination and backlighting, full-color display screens, liquid crystal display (LCD) backlighting, white keypads and the camera flash function.
LED Components
Our LED components include a range of packaged LED products from our XLamp
®
LED components and LED modules for lighting applications to our high brightness LED components.
Our XLamp LED components and LED modules are lighting class packaged LED products designed to meet a broad range of market needs for lighting applications including general illumination (both indoor and outdoor applications), portable, architectural, signal and transportation lighting. We also use our XLamp LED components in our lighting products.
Our high brightness LED components consist of surface mount (SMD) and through-hole packaged LED products. Our SMD LED component products are available in a full range of colors designed to meet a broad range of market needs, including video, signage, general illumination, transportation, gaming and specialty lighting. Our through-hole packaged LED component products are available in a full range of colors primarily designed for the signage market and provide users with color and brightness consistency across a wide viewing area.
SiC Wafers
Our SiC wafers are targeted for customers who use the wafers to manufacture products for optoelectronics, RF, power switching and other applications. Corporate, government and university customers also buy SiC materials for research and development directed at optoelectronics, RF, and high power devices. We sell our wafers as a bare wafer or with epitaxial films of SiC or GaN materials.
Lighting Products Segment
Lighting Products revenue represented
29%
,
8%
, and
5%
of our revenues for the fiscal years ended
June 24, 2012
,
June 26, 2011
and
June 27, 2010
, respectively. Lighting Products gross profit was
$103.4 million
,
$23.7 million
and
$12.0 million
and gross margin was
31%
,
29%
, and
28%
for fiscal years
2012
,
2011
, and
2010
, respectively.
Our Lighting Products segment consists of both LED and traditional lighting systems. Our portfolio of lighting products is designed for use in such settings as office and retail space, restaurants and hospitality, schools and universities, manufacturing, healthcare, airports, municipal, residential, street lighting and parking structures, among other applications.
During fiscal 2012, we expanded into outdoor lighting through our acquisition of Ruud Lighting, Inc. ("Ruud Lighting"), a leader in outdoor LED lighting. Ruud Lighting added an extensive array of outdoor LED-lighting products to our existing portfolio, including the BetaLED
®
and LEDway
®
brands. As part of this acquisition, we also obtained traditional lighting brands, including Ruud Lighting
®
Direct, E-conolight
®
, Kramer Lighting
®
, Beta/Kramer
®
and Beta Lighting
™
.
Power and RF Products Segment
Power and RF Products revenue represented
6%
,
10%
, and
9%
of our revenues for the fiscal years ended
June 24, 2012
,
June 26, 2011
and
June 27, 2010
, respectively. Power and RF Products gross profit was
$32.1 million
,
$49.8 million
and
$34.4 million
and gross margin was
44%
,
51%
, and
44%
for fiscal years
2012
,
2011
, and
2010
, respectively.
Our Power and RF Products segment includes power devices and RF devices.
Power Devices
Our SiC-based power products include 600, 1,200 and 1,700-volt Schottky diodes as well as 1200-volt SiC metal semiconductor field-effect transistors (MOSFETs). Our customers purchase our power products for use in power factor correction circuits for power supplies used in computer servers, solar inverters and other applications. We are developing additional SiC-based power devices that could have a number of potential uses in applications for power conditioning, solar inverters, power supplies and motor controls.
5
RF Devices
Our RF products include a variety of GaN high electron mobility transistors (HEMTs) and monolithic microwave integrated circuits (MMICs), which are optimized for either military or commercial applications. We also provide foundry services for wide bandgap MMICs. The MMIC foundry service allows a customer to design its own custom RF circuit to be fabricated in our MMIC foundry, or have us provide custom MMIC design for the customer and fabricate the chips.
Financial Information about Geographic Areas of Customers and Assets
We derive our revenue primarily from product sales to international customers. For information concerning geographical areas of our customers and geographic information concerning our long-lived assets, please see Note 17, “Geographic Information,” in our consolidated financial statements included in Item 8 of this Annual Report. International operations expose us to risks that are different from operating in the United States, including foreign currency translation and transaction risk, risk of changes in tax laws, application of import/export laws and regulations and other risks described further in Item 1A “Risk Factors” of this Annual Report.
Research and Development
We invest significant resources in research and development. Our research and development activity includes efforts to:
|
•
|
increase the quality, performance and diameter of our substrate and epitaxial materials;
|
|
•
|
continually improve our manufacturing processes;
|
|
•
|
develop brighter, more efficient, and lower cost LED chip and component products;
|
|
•
|
create new, and improve existing, LED components and LED lighting products; and
|
|
•
|
develop higher power diodes/switches and higher power/higher linearity RF devices.
|
When our customers participate in funding our research and development programs, we record the amount funded as a reduction of research and development expenses to the extent that our customers’ funding does not exceed our respective research and development costs. For further information about these programs, see Note 2, “Basis of Presentation and Summary of Significant Accounting Policies,” in our consolidated financial statements included in Item 8 of this Annual Report. For further information about our research and development, see “Research and Development” in Item 7, “Management’s Discussion and Analysis of Financial Condition and Results of Operations.”
Sales and Marketing
We continue to make significant investments to expand our global sales, marketing, technical applications support, and distribution capabilities to sell our lighting products and further enable new and existing customers to implement LED and power technology into their products. We also continue to make investments to promote and build market awareness of the Cree brand. Our growing sales, marketing and technical applications teams include personnel throughout North America, Asia, and Europe.
Cree Thermal, Electrical, Mechanical, Photometric, and Optical (TEMPO) Services provide a comprehensive suite of performance tests to assist our customers in developing high quality LED lighting products. We currently provide TEMPO Services out of our Cree Technology Centers located in North Carolina, California, and Shenzhen and Shanghai, China.
Customers
We have historically had a few key customers who represented more than 10% of our consolidated revenues. In fiscal
2012
,
2011
, and
2010
, revenues from two distribution customers, Arrow Electronics, Inc. (Arrow) and World Peace Industrial Co., Ltd. (World Peace), exceeded 10% of our total consolidated revenues. Sales to Arrow and World Peace represented
18%
and
10%
of our total consolidated revenues in fiscal
2012
, respectively. In fiscal
2011
, sales to Arrow and World Peace represented
20%
and
10%
of our total consolidated revenues, respectively. In fiscal
2010
, sales to Arrow and World Peace represented
19%
and
11%
of our total consolidated revenues, respectively. Arrow and World Peace are customers of our LED Products segment and our Power and RF Products segment. For further discussion regarding customer concentration, please see Note 14, “Concentrations of Risk,” in our consolidated financial statements included in Item 8 of this Annual Report. The loss of any large customer could have a material adverse effect on our business and results of operations.
6
Distribution
A substantial portion of our products are sold to distributors. Distributors stock inventory and sell our products to their own customer base, which may include: value added resellers, manufacturers who incorporate our products into their own manufactured goods, or ultimate end users of our products. We also utilize third-party sales representatives who generally do not maintain a product inventory; instead, their customers place orders directly with us or through distributors.
Seasonality
Our LED Products segment may experience seasonally lower sales during our third quarter due to the Chinese New Year holiday. During this period, our LED Products segment may experience disruption in normal customer purchasing volume. Our Lighting Products segment may experience seasonally lower sales due to winter weather, impacting our second and third quarters. Due to these seasonal factors, the Lighting Products segment may experience lower sales during these periods. Our Power and RF Products segment is not generally subject to seasonality.
Our sales also vary based on other factors such as customer demand and government regulation.
If anticipated sales or shipments do not occur when expected, our results of operations for that quarter, and potentially for future quarters, may be adversely affected.
Backlog
Our backlog at
June 24, 2012
, the last day of our
2012
fiscal year, was approximately
$149.1 million
, compared with a backlog of approximately
$172.1 million
at
June 26, 2011
, the last day of our
2011
fiscal year. Because of the generally short cycle time between order and shipment and occasional customer changes in delivery schedules or cancellation of orders (which at times may be made without significant penalty), we do not believe that our backlog, as of any particular date, is necessarily indicative of actual net sales for any future period. Additionally, our
June 24, 2012
backlog figure contains
$37.4 million
of research contracts signed with the U.S. Government, for which approximately
$27.6 million
had not been appropriated as of the last day of fiscal
2012
. Our
June 26, 2011
backlog figure contains
$55.4 million
of research contracts signed with the U.S. Government, for which approximately
$37.3 million
were not appropriated as of the last day of fiscal
2011
. Our backlog could be adversely affected if the U.S. Government exercises its rights to terminate our government contracts or does not appropriate and allocate all of the funding contemplated by the contracts.
Sources of Raw Materials
We depend on a number of suppliers for certain raw materials, components and equipment used in our products, including certain key materials and equipment used in our crystal growth, wafering, polishing, epitaxial deposition, device fabrication, component and lighting assembly processes. We generally purchase these limited source items pursuant to purchase orders and have limited guaranteed supply arrangements with our suppliers. Our suppliers, located around the world, can be subject to many constraints limiting supply that are beyond our control. We believe our current supply of essential materials is sufficient to meet our needs. However, shortages have occurred from time to time and could occur again.
Competition by Reportable Segment
Our success depends on our ability to keep pace with the evolving technology standards of the industries we serve. These industries are characterized by rapid technological change, frequent introduction of new products, short product life cycles, changes in end user and customer requirements, and a competitive pricing environment. The evolving nature of these industries may render our existing or future products obsolete, noncompetitive or unmarketable. Any of these developments could have an adverse effect on our business, results of operations and financial condition.
LED Products Segment
Our LED Products segment's primary competitors are Nichia Corporation (Nichia), OSRAM Semiconductor GmbH (OSRAM), Koninklijke Philips Electronics N.V. (Philips), and Samsung LED Company (Samsung).
LED Chips
The primary competition for our LED chip products comes from companies that manufacture and/or sell nitride-based LED chips. We consider Nichia to be a competitor because it sells LED chips to a select number of LED packaging companies and it sells packaged LEDs that most often compete directly with our chip customers. We believe, based on industry information, that Nichia currently has the largest market share for nitride-based LEDs.
7
There are many other LED chip producers who sell blue, green and white LED chip products, including OSRAM, Toyoda Gosei Co., Ltd., and Epistar Corporation. These competitors make products for a variety of applications in a range of performance levels that compete directly with our LED chip products.
Overall, we believe that performance, price and strength of intellectual property are the most significant factors to compete successfully in the nitride LED market. We believe our products are well positioned to meet the market performance requirements; however, there is significant pricing pressure from a number of competitors. We continually strive to improve our competitive position by developing brighter and higher performing LED chips while focusing on lowering costs.
LED Components
The market for lighting class LED components is concentrated primarily in indoor and outdoor commercial lighting; specialty lighting, including torch lamps (flashlights); color changing architectural lighting; signs and signals; and transportation. Nichia, OSRAM, Philips, and Samsung are the main competitors in these markets. These companies sell LED components that compete indirectly with our target customers for LED chips and compete directly with our XLamp LED components and LED modules. There are a large number of other companies, primarily based in Asia, that offer products designed to compete both directly and indirectly with our LED components in lighting and other applications. We are positioning our XLamp LED components and LED modules to compete in this market based on performance, price and usability.
Our high brightness LED components compete with a larger number of competitors around the world in a variety of applications including signage, video, transportation, gaming and specialty lighting. We are positioning our high brightness LED components to compete in this market based on performance, price, availability and usability.
SiC Wafers
We have continued to maintain our well-established leadership position in the sale of SiC wafer and SiC and GaN epitaxy products. We are seeing increased competition in this market.
Lighting Products Segment
Our Lighting Products segment currently faces competition from traditional lighting fixture companies, lamp manufacturers and from non-traditional companies focused on LED lighting systems including fixtures and lamps. Lighting companies such as Acuity Brands, Inc., Cooper Industries plc, General Electric Company, Hubbell Incorporated, Philips, and OSRAM are the main competitors in this market. However, increasingly, other companies (i.e., start-ups) are beginning to emerge in the LED lighting market in which we compete.
Our LED lighting products compete against traditional lighting products using incandescent, fluorescent, halogen, ceramic metal halide or other lighting technology. Our LED lighting products compete against traditional lighting products based upon superior energy savings, extended life, improved lighting quality and lower total cost of ownership. Also, our LED lighting products have a reduced impact on the environment as compared to fluorescent and compact fluorescent technologies that contain mercury.
We also compete with LED-based products from traditional and non-traditional lamp and fixture companies, some of which are customers for our LED chips and LED components. Our products compete on the basis of color quality and consistency, superior light output, reduced energy consumption, brand and lower total cost of ownership.
Power and RF Products Segment
Power Devices
Our SiC-based power devices compete with similar devices offered by Infineon Technologies AG, STMicroelectronics, Inc. and Rohm Co., Ltd. There are also a number of other companies developing SiC-based power devices. In addition, our products compete with existing silicon-based power devices offered by a variety of manufacturers.
RF Devices
Currently, Sumitomo Electric Device Innovations, Inc. is the main company offering products that compete directly with our GaN HEMT products, although several other companies such as RF Micro Devices Inc., Nitronex Corporation and Triquint Corporation have products that compete with us as well. Our products also face competition from existing silicon and GaAs-based products.
8
Patents and Other Intellectual Property Rights
We believe it is important to protect our investment in technology by obtaining and enforcing intellectual property rights, including rights under patent, trademark, trade secret and copyright laws. We seek to protect inventions we consider significant by applying for patents in the United States and other countries when appropriate. We have also acquired, through license grants and assignments, rights to patents on inventions originally developed by others. As of
June 24, 2012
, we owned or held exclusive rights under
940
issued U.S. patents and approximately
1,850
foreign patents with various expiration dates extending up to
2037
. We do not consider our business to be materially dependent upon any one patent, and we believe our business will not be materially adversely affected by the expiration of any one patent. For proprietary technology that is not patented, we generally seek to protect the technology and related know-how and information as trade secrets by keeping confidential the information that we believe provides us with a competitive advantage. We attempt to create strong brands for our products and promote our products through trademarks that distinguish them in the market. We may license our customers to use our trademarks in connection with the sale of our products, and we monitor for the proper and authorized use of our marks.
Licensing activities and lawsuits to enforce intellectual property rights, particularly patent rights, are a common feature of the semiconductor, LED and lighting industries, and we attempt to ensure respect for our intellectual property rights through appropriate actions. The breadth of our intellectual property rights and the extent to which they can be successfully enforced vary across jurisdictions. We both make and receive inquiries regarding possible patent infringements and possible violations of other intellectual property rights in the normal course of business. Depending on the circumstances, we may seek to negotiate a license or other acceptable resolution. If we are unable to achieve a resolution by agreement, we may seek to enforce our rights or defend our position through litigation. Patent litigation in particular is expensive and the outcome is often uncertain. We believe that the strength of our portfolio of patent rights is important in helping us resolve or avoid such disputes with other companies in our industry.
Environmental Regulation
We are subject to a variety of federal, state and local provisions regulating the discharge of materials into the environment or otherwise relating to the protection of the environment. These include statutory and regulatory provisions under which we are responsible for the management of hazardous materials we use and the disposition of hazardous wastes resulting from our manufacturing processes. Failure to comply with such provisions could result in fines and other liabilities to the government or third parties, injunctions requiring us to suspend or curtail operations or other remedies, and could have a material adverse effect on our business.
Working Capital
For a discussion of our working capital practices, see “Liquidity and Capital Resources” in Item 7 of this Annual Report.
Employees
As of
June 24, 2012
, we employed
5,555
regular full and part-time employees. We also employ individuals on a temporary full-time basis and use the services of contractors as necessary. Certain of our employees in various countries outside of the United States are subject to laws providing representation rights. We consider relations with our employees to be good.
Available Information
Our website address is www.cree.com. We make available free of charge through our website our Annual Reports on Form 10-K, Quarterly Reports on Form 10-Q, including Interactive Data Files, and Current Reports on Form 8-K, and amendments to these reports, as soon as reasonably practicable after we electronically file such material with, or furnish such material to, the SEC. These reports may be accessed from our website by following the links under “Investors,” then “SEC Filings.” The information found on our website is not part of this or any other report we file with or furnish to the SEC. We assume no obligation to update or revise any forward-looking statements in this Annual Report or in other reports filed with the SEC, whether as a result of new information, future events or otherwise, unless we are required to do so by law. A copy of this Annual Report and our other reports is available without charge upon written request to Investor Relations, Cree, Inc., 4600 Silicon Drive, Durham, North Carolina 27703.
9
Described below are various risks and uncertainties that may affect our business. If any of the risks described below actually occurs, our business, financial condition or results of operations could be materially and adversely affected.
Our operating results are substantially dependent on the development and acceptance of new products.
Our future success may depend on our ability to develop new and lower cost solutions for existing and new markets and for customers to accept those solutions. We must introduce new products in a timely and cost-effective manner, and we must secure production orders for those products from our customers. The development of new products is a highly complex process, and we historically have experienced delays in completing the development and introduction of new products. Our research and development efforts are aimed at solving increasingly complex problems, and we do not expect that all of our projects will be successful. The successful development and introduction of these new products depends on a number of factors, including the following:
|
•
|
achievement of technology breakthroughs required to make commercially viable devices;
|
|
•
|
the accuracy of our predictions for market requirements beyond near term visibility;
|
|
•
|
our ability to predict, influence, and/or react to evolving standards;
|
|
•
|
acceptance of our new product designs;
|
|
•
|
acceptance of new technology in certain markets;
|
|
•
|
the availability of qualified research and development personnel;
|
|
•
|
our timely completion of product designs and development;
|
|
•
|
our ability to expand direct customer sales and influence key distribution customers to adopt our products;
|
|
•
|
our ability to develop repeatable processes to manufacture new products in sufficient quantities, with the desired specifications and at competitive costs for commercial sales;
|
|
•
|
our ability to effectively transfer products and technology developed in one country to our manufacturing facilities in other countries;
|
|
•
|
our customers' ability to develop competitive products incorporating our products; and
|
|
•
|
acceptance of our customers' products by the market.
|
If any of these or other factors becomes problematic, we may not be able to develop and introduce these new products in a timely or cost-effective manner.
If we are unable to effectively develop, manage and expand our sales and distribution channels for our products, our operating results may suffer.
We have expanded into business channels that are different from those in which we have historically operated as we grow our business and sell more LED and lighting products. For example, in the third quarter of fiscal 2012, we consolidated the Cree and BetaLED lighting product lines sales agents for each major market in North America which resulted in a disruption in the project pipeline and lower than targeted sales for our indoor lighting products. Lighting sales agents may also choose to drop our product lines from their portfolio to avoid losing access to our competitors' lighting products. If we are unable to effectively penetrate these channels or develop alternate channels to ensure our products are reaching the appropriate customer base, our financial results may be adversely impacted. In addition, if we successfully penetrate or develop these channels, we cannot guarantee that customers will accept our products or that we will be able to manufacture and deliver them in the timeline established by our customers.
We sell a substantial portion of our products to distributors. We rely on distributors to develop and expand their customer base as well as anticipate demand from their customers. If they are not successful, our growth and profitability may be adversely impacted. Distributors must balance the need to have enough products in stock in order to meet their customers' needs against their internal target inventory levels and the risk of potential inventory obsolescence. The risks of inventory obsolescence are especially true with technological products. The distributors' internal target inventory levels vary depending on market cycles and a number of factors within each distributor over which we have very little, if any, control.
10
We typically recognize revenue on product sold to distributors when the item is shipped and title passes to the distributor (sell-in method). Certain distributors have limited rights to return inventory under stock rotation programs and have limited price protection rights for which we make estimates. We evaluate inventory levels in the distribution channel, current economic trends and other related factors in order to account for these factors in our judgments and estimates. As inventory levels and product return trends change, we revise our estimates and our operating results could be impacted.
We face significant challenges managing our growth as the market adopts LEDs for general lighting.
Our potential for growth depends significantly on the adoption of LEDs within the general lighting market and our ability to affect this rate of adoption. Although LED lighting has grown rapidly in recent years, adoption of LEDs for general lighting is relatively new, still limited and faces significant challenges before widespread adoption. In order to manage our growth and business strategy effectively in light of uncertainty related to the pace of adoption, we must continue to:
|
•
|
maintain, expand and purchase adequate manufacturing facilities and equipment to meet customer demand;
|
|
•
|
maintain a sufficient supply of raw materials to support our growth;
|
|
•
|
expand research and development, sales and marketing, technical support, distribution capabilities and administrative functions;
|
|
•
|
expand the skills and capabilities of our current management team;
|
|
•
|
add experienced senior level managers; and
|
|
•
|
attract and retain qualified employees.
|
While we intend to focus on managing our costs and expenses, over the long term we expect to invest substantially to support our growth and may have additional unexpected costs. For example, in November 2011, we broke ground on a 208,000 square foot expansion to our Wisconsin manufacturing and warehouse facilities to support our LED lighting products production in fiscal 2013 and we are targeting to continue expanding our LED products manufacturing facilities in China. However, such investments take time to become fully operational, and we may not be able to expand quickly enough to exploit targeted market opportunities. There are also inherent execution risks in starting up a new factory or expanding production capacity that could increase costs and reduce our operating results, including design and construction cost overruns, poor production process yields and reduced quality control during the start-up phase.
We are also increasingly dependent on information technology to enable us to improve the effectiveness of our operations and to maintain financial accuracy and efficiency. If we do not allocate and effectively manage the resources necessary to build, implement and sustain the proper technology infrastructure, we could be subject to transaction errors, processing inefficiencies, loss of customers, business disruptions or loss of or damage to intellectual property through security breach.
In connection with our efforts to cost-effectively manage our growth, we have increasingly relied on contractors for production capacity, logistics support and certain administrative functions including hosting of certain information technology software applications. If these service providers do not perform effectively, we may not be able to achieve the expected cost savings and may incur additional costs to correct errors or fulfill customer demand. Depending on the function involved, such errors may also lead to business disruption, processing inefficiencies or the loss of or damage to intellectual property through security breach, or impact employee morale. Our operations may also be negatively impacted if any of these service providers do not have the financial capability to meet our growing needs.
The markets in which we operate are highly competitive and have evolving technical requirements.
The markets for our products are highly competitive. In the LED market, we compete with companies that manufacture or sell LED chips and LED components. In the lighting market we compete with companies that manufacture and sell traditional and LED lighting products, many of which have larger and more established sales channels. Competitors continue to offer new products with aggressive pricing and improved performance. Competitive pricing pressures may change and could accelerate the rate of decline of our average sales prices.
With the growth potential for LEDs, we may face increased competition in the future. If the investment in new capacity exceeds the growth in demand, the LED market is likely to become more competitive with additional pricing pressures. Additionally, new technologies could emerge or improvements could be made in existing technologies that may also reduce the demand for LEDs in certain markets. There are also new technologies, such as organic LEDs (OLEDs), which could potentially have the same impact on LED demand for backlighting, which could impact the overall LED market.
11
As competition increases, in order to continue to grow our business, we need to continue to develop new products that meet or exceed the needs of our customers. Therefore, our ability to continually produce more efficient, higher brightness and lower cost LEDs and lighting products that meet the evolving needs of our customers will be critical to our success. Competitors may also try to align with some of our strategic customers. This could mean lower prices for our products, reduced demand for our products and a corresponding reduction in our ability to recover development, engineering and manufacturing costs. Any of these developments could have an adverse effect on our business, results of operations or financial condition.
Global economic conditions could materially adversely impact demand for our products and services.
Our operations and performance depend significantly on worldwide economic conditions. Uncertainty about global economic conditions could result in customers postponing purchases of our products and services in response to tighter credit, unemployment, negative financial news and/or declines in income or asset values and other macroeconomic factors, which could have a material negative effect on demand for our products and services and accordingly, on our business, results of operations and financial condition.
We rely on a number of key sole source and limited source suppliers, and are subject to high price volatility on certain commodity inputs, variations in parts quality, and raw material consistency and availability.
We depend on a number of sole source and limited source suppliers for certain raw materials, including rare earth elements, components, services and equipment used in manufacturing our products, including key materials and equipment used in critical stages of our manufacturing processes. Although alternative sources generally exist for these items, qualification of many of these alternative sources could take up to six months or longer. Where possible, we attempt to identify and qualify alternative sources for our sole and limited source suppliers.
We generally purchase these sole or limited source items with purchase orders, and we have limited guaranteed supply arrangements with such suppliers. Some of our sources can have variations in attributes and availability which can affect our ability to produce products in sufficient volume or quality. We do not control the time and resources that these suppliers devote to our business, and we cannot be sure that these suppliers will perform their obligations to us. Additionally, general shortages in the marketplace of certain raw materials or key components may adversely impact our business. In the past, we have experienced decreases in our production yields when suppliers have varied from previously agreed upon specifications that have impacted our cost of sales.
Additionally, the inability of our suppliers to access capital efficiently could cause disruptions in their businesses, thereby negatively impacting ours. This risk may increase if an economic downturn negatively affects key suppliers or a significant number of our other suppliers. Any delay in product delivery or other interruption or variation in supply from these suppliers could prevent us from meeting commercial demand for our products. If we were to lose key suppliers, our key suppliers were unable to support our demand for any reason, or we were unable to identify and qualify alternative suppliers, our manufacturing operations could be interrupted or hampered significantly.
We rely on arrangements with independent shipping companies for the delivery of our products from vendors and to customers in both the United States and abroad. The failure or inability of these shipping companies to deliver products, or the unavailability of their shipping services, even temporarily, could have a material adverse effect on our business. We may also be adversely affected by an increase in freight surcharges due to rising fuel costs and added security.
In our fabrication process we consume a number of precious metals and other commodities, which are subject to high price volatility. Our operating margins could be significantly affected if we are not able to pass along price increases to our customers. In addition, production could be disrupted by the unavailability of the resources used in production such as water, silicon, electricity and gases. Future environmental regulations could restrict supply or increase the cost of certain of those materials.
12
We operate in an industry that is subject to significant fluctuation in supply and demand that affects our revenue and profitability.
The LED lighting industry is in the early stages of adoption and is characterized by constant and rapid technological change, rapid product obsolescence and price erosion, evolving standards, short product life-cycles and fluctuations in product supply and demand. The industry has experienced significant fluctuations, often in connection with, or in anticipation of, product cycles and changes in general economic conditions. These fluctuations have been characterized by lower product demand, production overcapacity, higher inventory levels and increased pricing pressure. We have experienced these conditions in our business in the past and may experience such conditions in the future, which could have a material negative impact on our business and results of operations.
In addition, as we diversify our product offerings and as pricing differences in the average selling prices among our product lines widen, a change in the mix of sales among our product lines may increase volatility in our revenue and gross margin from period to period.
We depend on a limited number of customers, including distributors, for a substantial portion of our revenues, and the loss of, or a significant reduction in purchases by, one or more of these customers could adversely affect our operating results.
We receive a significant amount of our revenues from a limited number of customers, including distributors who represented our two largest customers in fiscal 2012. Most of our customer orders are made on a purchase order basis, which does not generally require any long-term customer commitments. Therefore, these customers may alter their past purchasing behavior with little or no notice to us for various reasons, including: developing, or, in the case of our distributors, their customers developing, their own product solutions; choosing to purchase product from our competitors; incorrectly forecasting end market demand for their products; or experiencing a reduction in their market share in the markets for which they purchase our products. If our customers alter their past (or expected) purchasing behavior, or if we encounter any problems collecting amounts due from them, our financial condition and results of operations could be negatively impacted.
As a result of our continued expansion into new markets existing customers may reduce orders.
Through acquisitions and organic growth, including our recent acquisition of Ruud Lighting, we continue to expand into new markets. Many of our existing customers who purchase our LED products develop and manufacture products using those chips and components that are offered into the same lighting markets. As a result, some of our current customers perceive us as a competitor in these new markets. In response, our customers may reduce or discontinue their orders for our LED products. This reduction in or discontinuation of orders could occur faster than our sales growth in these new markets, which could adversely affect our business, results of operations or financial condition.
Our results of operations, financial condition and business could be harmed if we are unable to balance customer demand and capacity.
As customer demand for our products changes, we must be able to ramp up or adjust our production capacity to meet demand. We are continually taking steps to address our manufacturing capacity needs for our products. For example, in November of 2011, we broke ground on a 208,000 square foot expansion to our Wisconsin manufacturing and warehouse facilities to support our LED lighting products and we are targeting to continue expanding our LED product manufacturing facilities in China. If we are not able to increase our production capacity at our targeted rate, or if there are unforeseen costs associated with adjusting our capacity levels, we may not be able to achieve our financial targets.
Conversely, due to the proportionately high fixed cost nature of our business (such as facility expansion costs), if demand does not increase at the rate forecasted, we may not be able to manage manufacturing expenses or overhead costs at the same rate as demand. This could result in lower margins and adversely impact our business and results of operations. Additionally, if product demand decreases or we fail to forecast demand accurately, we may be required to record impairments on our long-lived assets or record excess inventory write off charges. We have in the past and may in the future be required to record excess capacity charges, which would have a negative impact on our results of operations.
In addition, our efforts to improve quoted delivery lead-time performance may result in corresponding reductions in order backlog. A decline in backlog levels could result in more variability and less predictability in our quarter-to-quarter net sales and operating results.
13
If we fail to evaluate and execute strategic opportunities successfully, our business may suffer.
From time to time, we evaluate strategic opportunities available to us for product, technology or business transactions, such as business acquisitions or divestitures. For example, we acquired Ruud Lighting in
August 2011
. If we choose to enter into such transactions, we face certain risks, such as the failure of an acquired business to meet our performance expectations, diversion of management attention, identification of additional liabilities relating to the acquired business, retention of existing customers of our current and acquired businesses due to concerns that new product lines may be in competition with the customers of existing product lines or otherwise, and difficulty integrating an acquired business's operations, personnel and financial and operating systems into our current business.
We may not be able to adequately address these risks or any other problems that arise from our recent or future acquisitions or divestitures. Any failure to successfully evaluate strategic opportunities and address risks or other problems that arise related to any such business transaction could adversely affect our business, results of operations or financial condition.
Our LED and Power and RF revenues are highly dependent on our customers' ability to produce, market and sell more integrated products.
Our LED and Power and RF revenues depend on getting our products designed into a larger number of our customers' products and in turn, our customers' ability to produce, market and sell their products. For example, we have current and prospective customers that create, or plan to create, lighting systems using our LED components. However, the traditional lighting industry is still developing technical expertise with LED-related designs, which may limit the success of our customers' products. Even if our customers are able to develop and produce LED lighting products and products that incorporate our Power and RF products, there can be no assurance that our customers will be successful in marketing and selling these products in the marketplace.
We also have current and prospective customers that create white LED components using our blue LEDs, in combination with phosphors. Sales of blue LED chips are highly dependent upon our customers' ability to procure efficient phosphors, develop high quality and highly efficient white LED components and gain access to the necessary intellectual property rights. Even if our customers are able to develop competitive white LED components using our blue LED chips, there can be no assurance that our customers will be successful in the marketplace.
The adoption of or changes in government and/or industry policies, standards or regulations relating to the efficiency, performance or other aspects of LED lighting or changes in government and/or industry policies, standards or regulations that discourage the use of certain traditional lighting technologies, could impact the demand for our LED products.
The adoption of or changes in government and/or industry policies, standards or regulations relating to the efficiency, performance or other aspects of LED lighting may impact the demand for our LED products. For example, in 2010 the Chinese government delayed purchases of LED street and tunnel lighting while developing new standards for the required performance for such lighting products in China. The process resulted in reduced demand for those lighting applications and has continued to limit our ability to forecast demand for those applications.
Demand for our LED products may also be impacted by changes in government and/or industry policies, standards or regulations that discourage the use of certain traditional lighting technologies. These constraints may be eliminated or delayed by legislative action, which could have a negative impact on demand for our products.
If governments, their agencies or regulated utilities reduce their demand for our products or discontinue or curtail their funding, our business may suffer.
Changes in governmental budget priorities could adversely affect our business and results of operations. U.S. and foreign government agencies have purchased products directly from us and products from our customers, and U.S. government agencies have historically funded a portion of our research and development activities. When the government changes budget priorities, such as in times of war or financial crisis, our research and development funding and our product sales to government entities are at risk. For example, demand and payment for our products and our customers' products may be affected by public sector budgetary cycles, funding authorizations, or utility rebates. Funding reductions or delays could negatively impact demand for our products. If government funding is discontinued or significantly reduced, our business and results of operations could be adversely affected.
14
Variations in our production yields could impact our ability to reduce costs and could cause our margins to decline and our operating results to suffer.
All of our products are manufactured using technologies that are highly complex. The number of usable items, or yield, from our production processes may fluctuate as a result of many factors, including but not limited to the following:
|
•
|
variability in our process repeatability and control;
|
|
•
|
contamination of the manufacturing environment;
|
|
•
|
equipment failure, power outages, system failures or variations in the manufacturing process;
|
|
•
|
lack of consistency and adequate quality and quantity of piece parts and other raw materials, and other bill of materials items;
|
|
•
|
inventory shrinkage or human errors;
|
|
•
|
defects in production processes (including system assembly) either within our facilities or at our contractors; and
|
|
•
|
any transitions or changes in our production process, planned or unplanned.
|
In the past, we have experienced difficulties in achieving acceptable yields on certain products, which has adversely affected our operating results. We may experience similar problems in the future, and we cannot predict when they may occur or their severity.
In addition, our ability to convert volume manufacturing to larger diameter substrates can be an important factor in allowing for a more cost effective manufacturing process. If we are unable to make this transition in a timely or cost effective manner, our results could be negatively impacted.
In some instances, we may offer products for future delivery at prices based on planned yield improvements or increased cost efficiencies from other production advances. Failure to achieve these planned improvements or advances could significantly affect our margins and operating results.
Catastrophic events may disrupt our business.
A disruption or failure of our systems or operations in the event of a natural disaster, health pandemic, such as an influenza outbreak within our workforce, or man-made catastrophic event could cause delays in completing sales, continuing production or performing other critical functions of our business, particularly if a catastrophic event occurred at our primary manufacturing locations in the U.S. and China. This could severely affect our ability to conduct normal business operations and, as a result, our operating results could be adversely affected. There may also be secondary impacts that are unforeseeable as well, such as impacts to our customers, which could cause delays in new orders, delays in completing sales or even order cancellations.
If our products fail to perform or fail to meet customer requirements or expectations, we could incur significant additional costs, including costs associated with the recall of those items.
The manufacture of our products involves highly complex processes. Our customers specify quality, performance and reliability standards that we must meet. If our products do not meet these standards, we may be required to replace or rework the products. In some cases, our products may contain undetected defects or flaws that only become evident after shipment. Even if our products meet standard specifications, our customers may attempt to use our products in applications they were not designed for or in products that were not designed or manufactured properly, resulting in product failures and creating customer satisfaction issues.
We have experienced product quality, performance or reliability problems from time to time and defects or failures may occur in the future. If failures or defects occur, we may need to recall our products. These recalls could result in significant losses due to:
|
•
|
costs associated with the removal, collection and destruction of the product recalled;
|
|
•
|
payments made to replace recalled product;
|
|
•
|
a rise in warranty expense and costs associated with customer support;
|
|
•
|
the write down or destruction of existing inventory subject to the recall;
|
15
|
•
|
lost sales due to the unavailability of product for a period of time;
|
|
•
|
delays, cancellations or rescheduling of orders for our products; or
|
|
•
|
increased product returns.
|
We also may be the target of product liability lawsuits, and could suffer losses from a significant product liability judgment against us if the use of our products at issue is determined to have caused injury. A significant product recall or product liability case could also result in adverse publicity, damage to our reputation, and a loss of customer confidence in our products.
Our operations in foreign countries expose us to certain risks inherent in doing business internationally, which may adversely affect our business, results of operations or financial condition.
As a result of acquisitions and organic growth, we have operations, manufacturing facilities and contract manufacturing arrangements in foreign countries that expose us to certain risks. For example, fluctuations in exchange rates may affect our revenues, expenses and results of operations as well as the value of our assets and liabilities as reflected in our financial statements. We are also subject to other types of risks, including the following:
|
•
|
protection of intellectual property and trade secrets;
|
|
•
|
tariffs, customs and other barriers to importing/exporting materials and products in a cost effective and timely manner;
|
|
•
|
timing and availability of export licenses;
|
|
•
|
rising labor costs;
|
|
•
|
disruptions in or inadequate infrastructure of the countries where we operate;
|
|
•
|
difficulties in accounts receivable collections;
|
|
•
|
difficulties in staffing and managing international operations;
|
|
•
|
the burden of complying with foreign and international laws and treaties; and
|
|
•
|
the burden of complying with and changes in international taxation policies.
|
In some instances, we have been provided and may continue to receive competing incentives from foreign governments to encourage our investment in certain countries, regions, or areas outside of the United States. In particular, we have received and may continue to receive such incentives in connection with our operations in Asia, as Asian national and local governments seek to encourage the development of the technology industry. Government incentives may include tax rebates, reduced tax rates, favorable lending policies and other measures, some or all of which may be available to us due to our foreign operations. Any of these incentives could be reduced or eliminated by governmental authorities at any time. Any reduction or elimination of incentives currently provided to our operations could adversely affect our business and results of operations. These same governments also may provide increased incentives to or require production processes that favor local companies, which could further negatively impact our business and results of operations.
Abrupt political change, terrorist activity and armed conflict pose a risk of general economic disruption in affected countries, which could also result in an adverse effect on our business and results of operations.
Litigation could adversely affect our operating results and financial condition.
We are often involved in litigation, primarily patent litigation, as described in more detail in Note 12, "Commitments and Contingencies" to our consolidated financial statements included in Item 8 of this Annual Report. Defending against existing and potential litigation will likely require significant attention and resources and, regardless of the outcome, result in significant legal expenses, which could adversely affect our results unless covered by insurance or recovered from third parties. If our defenses are ultimately unsuccessful, or if we are unable to achieve a favorable resolution, we could be liable for damage awards that could materially affect our results of operations and financial condition.
Where necessary, we may initiate litigation to enforce our patent or other intellectual property rights. Any such litigation may require us to spend a substantial amount of time and money and could distract management from our day-to-day operations. Moreover, there is no assurance that we will be successful in any such litigation.
16
Our business may be impaired by claims that we, or our customers, infringe the intellectual property rights of others.
Vigorous protection and pursuit of intellectual property rights characterize our industry. These traits have resulted in significant and often protracted and expensive litigation. Litigation to determine the validity of patents or claims by third parties of infringement of patents or other intellectual property rights could result in significant legal expense and divert the efforts of our technical personnel and management, even if the litigation results in a determination favorable to us. In the event of an adverse result in such litigation, we could be required to:
|
•
|
pay substantial damages;
|
|
•
|
indemnify our customers;
|
|
•
|
stop the manufacture, use and sale of products found to be infringing;
|
|
•
|
incur asset impairment charges;
|
|
•
|
discontinue the use of processes found to be infringing;
|
|
•
|
expend significant resources to develop non-infringing products or processes; or
|
|
•
|
obtain a license to use third party technology.
|
There can be no assurance that third parties will not attempt to assert infringement claims against us, or our customers, with respect to our products. In addition, our customers may face infringement claims directed to the customer's products that incorporate our products, and an adverse result could impair the customer's demand for our products. We have also promised certain of our customers that we will indemnify them in the event they are sued by our competitors for infringement claims directed to the products we supply. Under these indemnification obligations, we may be responsible for future payments to resolve infringement claims against them.
From time to time, we receive correspondence asserting that our products or processes are or may be infringing patents or other intellectual property rights of others. If we believe the assertions may have merit or in other appropriate circumstances, we take steps to seek to obtain a license or to avoid the infringement. However, we cannot predict whether a license will be available; that we would find the terms of any license offered acceptable; or that we would be able to develop an alternative solution. Failure to obtain a necessary license or develop an alternative solution could cause us to incur substantial liabilities and costs and to suspend the manufacture of affected products.
There are limitations on our ability to protect our intellectual property.
Our intellectual property position is based in part on patents owned by us and patents licensed to us. We intend to continue to file patent applications in the future, where appropriate, and to pursue such applications with U.S. and foreign patent authorities.
However, our existing patents are subject to expiration and re-examination and we cannot be sure that additional patents will be issued on any new applications around the covered technology or that our existing or future patents will not be successfully contested by third parties. Also, since issuance of a valid patent does not prevent other companies from using alternative, non-infringing technology, we cannot be sure that any of our patents, or patents issued to others and licensed to us, will provide significant commercial protection, especially as new competitors enter the market.
We periodically discover products that are counterfeit reproductions of our products or that otherwise infringe on our intellectual property rights. The actions we take to establish and protect trademarks, patents, and other intellectual property rights may not be adequate to prevent imitation of our products by others, and therefore, may adversely affect our sales and our brand and result in the shift of customer preference away from our products. Further, the actions we take to establish and protect trademarks, patents and other intellectual property rights could result in significant legal expense and divert the efforts of our technical personnel and management, even if the litigation or other action results in a determination favorable to us.
We also rely on trade secrets and other non-patented proprietary information relating to our product development and manufacturing activities. We try to protect this information through appropriate efforts to maintain its secrecy, including requiring employees and third parties to sign confidentiality agreements. We cannot be sure that these efforts will be successful or that the confidentiality agreements will not be breached. We also cannot be sure that we would have adequate remedies for any breach of such agreements or other misappropriation of our trade secrets, or that our trade secrets and proprietary know-how will not otherwise become known or be independently discovered by others.
17
We may be required to record a significant charge to earnings if our goodwill or other intangible assets become impaired.
Goodwill and purchased intangible assets with indefinite lives are not amortized, but are reviewed for impairment annually and more frequently when events or changes in circumstances indicate that the carrying value of an asset may not be recoverable. We assess the recoverability of the unamortized balance of our definite-lived intangible assets when indicators of potential impairment are present. Factors that may indicate that the carrying value of our goodwill or other intangible assets may not be recoverable include a decline in stock price and market capitalization and slower growth rates in our industry. We may be required to record a significant charge to earnings in our consolidated financial statements during the period in which any impairment of our goodwill or other intangible assets is determined to exist, which could adversely impact our results of operations.
We may be subject to intellectual property theft or misuse, which could harm our business and results of operations.
We face attempts by others to gain unauthorized access to our information technology systems on which we maintain proprietary and other confidential information. Our security measures may be breached as the result of industrial or other espionage actions of outside parties, employee error, malfeasance, or otherwise, and, as a result, an unauthorized party may obtain access to our systems. Additionally, outside parties may attempt to fraudulently induce employees to disclose sensitive information in order to gain access to our systems. We actively seek to prevent, detect and investigate any unauthorized access, which sometimes occurs. We might be unaware of any such access or unable to determine its magnitude and effects. The theft and/or unauthorized use or publication of our trade secrets and other confidential business information as a result of such an incident could adversely affect our competitive position and the value of our investment in research and development could be reduced. Our business could be subject to significant disruption, and we could suffer monetary or other losses.
We are subject to risks related to international sales and purchases.
We expect that revenue from international sales will continue to represent the majority of our total revenue. As such, a significant slowdown or instability in these foreign economies, including the recent economic instability in Europe, or lower investments in new infrastructure could have a negative impact on our sales. We also purchase a portion of the materials included in our products from overseas sources.
Our international sales and purchases are subject to numerous U.S. and foreign laws and regulations, including, without limitation, tariffs, trade barriers, regulations relating to import-export control, technology transfer restrictions, the International Traffic in Arms Regulation promulgated under the Arms Export Control Act, the Foreign Corrupt Practices Act and the anti-boycott provisions of the U.S. Export Administration Act. If we fail to comply with these laws and regulations, we could be liable for administrative, civil or criminal liabilities, and in the extreme case, we could be suspended or debarred from government contracts or have our export privileges suspended, which could have a material adverse effect on our business.
International sales and purchases are also subject to a variety of other risks, including risks arising from currency fluctuations, collection issues and taxes. Our international sales are subject to variability as our selling prices become less competitive in countries with currencies that are declining in value against the U.S. Dollar and more competitive in countries with currencies that are increasing in value against the U.S. Dollar. In addition, our international purchases can become more expensive if the U.S. Dollar weakens against the foreign currencies in which we are billed.
We have not entered into any foreign currency derivative financial instruments; however, we may choose to do so in the future in an effort to manage or hedge our foreign exchange rate risk.
Our business may be adversely affected by uncertainties in the global financial markets and our or our customers' or suppliers' ability to access the capital markets.
Global financial markets continue to reflect uncertainty about a sustained global economic recovery. Given these uncertainties, there could be future disruptions in the global economy, financial markets and consumer confidence. If economic conditions deteriorate unexpectedly, our business and results of operations could be materially and adversely affected. For example, our customers, including our distributors and their customers, may experience difficulty obtaining the financing necessary to support historical or projected purchasing patterns, which could negatively affect our results of operations.
Although we believe we have adequate liquidity and capital resources to fund our operations internally, our inability to access the capital markets on favorable terms in the future, or at all, may adversely affect our financial performance. The inability to obtain adequate financing from debt or capital sources in the future could force us to self-fund strategic initiatives or even forego certain opportunities, which in turn could potentially harm our performance.
18
New regulations related to conflict-free minerals may force us to incur additional expenses.
The Dodd-Frank Wall Street Reform and Consumer Protection Act contains provisions to improve transparency and accountability concerning the supply of minerals originating from the conflict zones of the Democratic Republic of Congo (DRC) and adjoining countries. As a result, the SEC is required to establish new annual disclosure and reporting requirements for those companies who use “conflict” minerals mined from the DRC and adjoining countries in their products. When these new requirements are implemented, they could affect the sourcing and availability of minerals used in the manufacture of our products. As a result, we cannot ensure that we will be able to obtain minerals at competitive prices and there may be additional costs associated with complying with the new due diligence procedures as required by the SEC. In addition, as our supply chain is complex, we may face reputational challenges with our customers and other stakeholders if we are unable to sufficiently verify the origins of all minerals used in our products through the due diligence procedures that we implement.
Changes in our effective tax rate may affect our results.
Our future effective tax rates may be affected by a number of factors including:
|
•
|
the jurisdiction in which profits are determined to be earned and taxed;
|
|
•
|
changes in government administrations, such as the Presidency and Congress of the U.S. as well as in the states and countries in which we operate;
|
|
•
|
changes in tax laws or interpretation of such tax laws and changes in generally accepted accounting principles;
|
|
•
|
the resolution of issues arising from tax audits with various authorities;
|
|
•
|
changes in the valuation of our deferred tax assets and liabilities;
|
|
•
|
adjustments to estimated taxes upon finalization of various tax returns;
|
|
•
|
increases in expenses not deductible for tax purposes, including write-offs of acquired in-process research and development and impairment of goodwill in connection with acquisitions;
|
|
•
|
changes in available tax credits;
|
|
•
|
the recognition and measurement of uncertain tax positions;
|
|
•
|
the lack of sufficient excess tax benefits (credits) in our additional paid in capital (APIC) pool in situations where our realized tax deductions for certain stock-based compensation awards (such as non-qualified stock options and restricted stock) are less than those originally anticipated; and
|
|
•
|
the repatriation of non-U.S. earnings for which we have not previously provided for U.S. taxes, or any changes in legislation that may result in these earnings being taxed within the U.S., regardless of our decision regarding repatriation of funds.
|
For example, proposals have been made by various U.S. governmental bodies to change the U.S. tax laws that include, among other things, limiting U.S. tax deductions for expenses related to un-repatriated foreign-source income and modifying the U.S. foreign tax credit rules. Although the scope of the proposed changes is unclear, it is possible that these or other changes in U.S. tax laws could increase our U.S. income tax liability and adversely affect our profitability. At this time, we cannot determine the timing that the proposed changes, if enacted, would become effective.
Any significant increase or decrease in our future effective tax rates could impact net income for future periods. In addition, the determination of our income tax provision requires complex estimations, significant judgments and significant knowledge and experience concerning the applicable tax laws. To the extent our income tax liability materially differs from our income tax provisions and accruals due to factors, including the above, which were not anticipated at the time we estimated our tax provision, our net income or cash flows could be affected.
In order to compete, we must attract, motivate and retain key employees, and our failure to do so could harm our results of operations.
Hiring and retaining qualified executives, scientists, engineers, technical staff and sales personnel is critical to our business, and competition for experienced employees in our industry can be intense. As a global company, this issue is not limited to the United States, but includes our other locations such as Europe and China. For example, there is substantial competition in China for qualified and capable personnel, particularly experienced engineers and technical personnel, which
19
may make it difficult for us to recruit and retain qualified employees. Also, within Huizhou, China, there are other large companies building manufacturing plants that will likely attract qualified employees. If we are unable to staff sufficient and adequate personnel at our China facilities, we may experience lower revenues or increased manufacturing costs, which would adversely affect our results of operations.
To help attract, motivate and retain key employees, we use benefits such as stock-based compensation awards, which include non-qualified stock options and restricted stock. If the value of such stock awards does not appreciate, as measured by the performance of the price of our common stock, or if our share-based compensation otherwise ceases to be viewed as a valuable benefit, our ability to attract, retain and motivate employees could be weakened, which could harm our business and results of operations.
Failure to comply with applicable environmental laws and regulations worldwide could harm our business and results of operations.
The manufacturing, assembling and testing of our products require the use of hazardous materials that are subject to a broad array of environmental, health and safety laws and regulations. Our failure to comply with any of these applicable laws or regulations could result in:
|
•
|
regulatory penalties, fines, legal liabilities, and the forfeiture of certain tax benefits;
|
|
•
|
suspension of production;
|
|
•
|
alteration of our fabrication, assembly and test processes; and
|
|
•
|
curtailment of our operations or sales.
|
In addition, our failure to manage the use, transportation, emission, discharge, storage, recycling or disposal of hazardous materials could subject us to increased costs or future liabilities. Existing and future environmental laws and regulations could also require us to acquire pollution abatement or remediation equipment, modify our product designs or incur other expenses, such as permit costs, associated with such laws and regulations. Many new materials that we are evaluating for use in our operations may be subject to regulation under existing or future environmental laws and regulations that may restrict our use of one or more of such materials in our manufacturing, assembly and test processes or products. Any of these restrictions could harm our business and results of operations by increasing our expenses or requiring us to alter our manufacturing processes.
Our results could vary as a result of the methods, estimates and judgments that we use in applying our accounting policies, including changes in the accounting regulations to be applied.
The methods, estimates and judgments that we use in applying our accounting policies have a significant impact on our results (see “Critical Accounting Policies and Estimates” in our Management's Discussion and Analysis of Financial Condition and Results of Operations included in Item 7 of this Annual Report on Form 10-K.) Such methods, estimates and judgments are, by their nature, subject to substantial risks, uncertainties and assumptions, and factors may arise over time that lead us to change our methods, estimates and judgments. Changes in those methods, estimates and judgments could significantly affect our results.
Likewise, our results may be impacted due to changes in the accounting rules to be applied, such as the increased use of fair value measurement rules, proposed changes in revenue recognition requirements, and the potential requirement that U.S. registrants prepare financial statements in accordance with International Financial Reporting Standards.
We are exposed to fluctuations in the market value of our investment portfolio and in interest rates, and therefore, impairment of our investments or lower investment income could harm our earnings.
We are exposed to market value and inherent interest rate risk related to our investment portfolio. We have historically invested portions of our available cash in fixed interest rate securities such as high-grade corporate debt, commercial paper, government securities and other fixed interest rate investments. The primary objective of our investment policy is preservation of principal. However, our investments are generally not FDIC insured and may lose value and/or become illiquid regardless of their credit rating.
20
Our stock price may be volatile.
Historically, our common stock has experienced substantial price volatility, particularly as a result of significant fluctuations in our revenue, earnings and margins over the past few years, and variations between our actual financial results and the published expectations of analysts. For example, the closing price per share of our common stock on the NASDAQ Global Select Market ranged from a low of
$20.32
in fiscal
2012
to a high of
$37.11
in the same fiscal year. If our future operating results or margins are below the expectations of stock market analysts or our investors, our stock price will likely decline.
Speculation in the press or investment community about our strategic position, financial condition, results of operations, or significant transactions can also cause changes in our stock price. In particular, speculation around our market opportunities for energy efficient lighting may have a dramatic effect on our stock price, especially as various government agencies announce their planned investments in energy efficient technology, including lighting.
Item 1B.
Unresolved Staff Comments
Not applicable.
Item 2.
Properties
The table below sets forth information with respect to our significant owned and leased facilities as of
June 24, 2012
. The sizes of the locations represent the approximate gross square footage of each site’s buildings.
|
|
Size (approximate square footage)
|
|||||||||||||||
|
Location
|
Segment Utilization
1
|
Total
|
Production
|
Facility
Services and
Warehousing
|
Administrative
Function
|
Housing /
Other
|
||||||||||
|
Owned Facilities
|
||||||||||||||||
|
Durham, NC
|
All
|
808,600
|
|
500,720
|
|
106,000
|
|
201,880
|
|
—
|
|
|||||
|
Research Triangle Park, NC
|
1,3
|
147,500
|
|
57,000
|
|
56,000
|
|
34,500
|
|
—
|
|
|||||
|
Racine, WI
|
2
|
440,000
|
|
160,000
|
|
210,000
|
|
70,000
|
|
—
|
|
|||||
|
Huizhou, China
|
1
|
760,739
|
|
356,600
|
|
40,000
|
|
40,200
|
|
323,939
|
|
|||||
|
Total owned
|
2,156,839
|
|
1,074,320
|
|
412,000
|
|
346,580
|
|
323,939
|
|
||||||
|
Leased Facilities
|
||||||||||||||||
|
Morrisville, NC
|
2
|
27,050
|
|
—
|
|
—
|
|
27,050
|
|
—
|
|
|||||
|
Goleta, CA
|
All
|
25,623
|
|
—
|
|
1,882
|
|
23,741
|
|
—
|
|
|||||
|
Yorkville, WI
|
2
|
79,016
|
|
—
|
|
77,316
|
|
1,700
|
|
—
|
|
|||||
|
Florence, Italy
|
1,2
|
32,776
|
|
4,628
|
|
19,095
|
|
9,053
|
|
—
|
|
|||||
|
Hong Kong
|
All
|
37,890
|
|
—
|
|
—
|
|
29,955
|
|
7,935
|
|
|||||
|
Huizhou, China
|
1
|
371,840
|
|
260,014
|
|
—
|
|
—
|
|
111,826
|
|
|||||
|
Shanghai, China
|
1,3
|
28,976
|
|
—
|
|
—
|
|
28,976
|
|
—
|
|
|||||
|
Miscellaneous sales and support offices
|
All
|
38,392
|
|
—
|
|
7,735
|
|
28,060
|
|
2,597
|
|
|||||
|
Leased Land
|
||||||||||||||||
|
Huizhou, China
|
1
|
414,952
|
|
194,512
|
|
21,818
|
|
21,927
|
|
176,695
|
|
|||||
|
Total leased
|
1,056,515
|
|
459,154
|
|
127,846
|
|
170,462
|
|
299,053
|
|
||||||
|
Total
|
3,213,354
|
|
1,533,474
|
|
539,846
|
|
517,042
|
|
622,992
|
|
||||||
1
Segments listed in the "Segment Utilization" column above are identified as follows: 1) LED Products; 2) Lighting Products; 3) Power and RF Products.
21
In the United States, our corporate headquarters as well as our primary research and development and manufacturing operations are located at the Durham, North Carolina facilities that we own. Our Durham facilities sit on approximately
141
acres of land that we own. Our power and RF products are primarily produced at our owned manufacturing facility located in Research Triangle Park, North Carolina. This facility sits on approximately
55
acres of land that we own.
Through our acquisition of Ruud Lighting in
August 2011
, we added an additional
440,000
square feet of administrative and manufacturing space in Racine, Wisconsin. The Racine facilities sit on approximately
30
acres of land that we own. In addition, we announced in
November 2011
the start of a
208,000
square foot expansion to our manufacturing facility in Wisconsin.
We also own a
760,739
-square-foot facility in Huizhou, Guangdong Province, China. This building sits on land which is leased from the Chinese government through two leases. One lease for
327,440
square feet expires in
June 2057
. The other lease for
87,512
square feet expires in
November 2060
. At the end of the lease terms, new terms for our land leases will need to be renegotiated.
We maintain sales and support offices, through our subsidiaries, in leased office premises in North America, Asia, and Europe. In addition, we lease a facility in Goleta, California that is used for research and development and administrative functions.
Item 3.
Legal Proceedings
The information required by this item is set forth under Note 12, “Commitments and Contingencies,” of the Notes to Consolidated Financial Statements included in Item 8 of this Annual Report, and is incorporated herein by reference.
Not applicable.
Item 5.
Market for Registrant’s Common Equity, Related Stockholder Matters and Issuer Purchases of Equity Securities
Common Stock Market Information
Our common stock is traded on the NASDAQ Global Select Market and is quoted under the symbol CREE. There were
500
holders of record of our common stock as of
August 14, 2012
. The following table sets forth, for the quarters indicated, the high and low closing sales prices as reported by NASDAQ.
|
|
Fiscal 2012
|
Fiscal 2011
|
|||||||||||||
|
|
High
|
Low
|
High
|
Low
|
|||||||||||
|
First Quarter
|
|
$37.11
|
|
|
$26.65
|
|
|
$75.63
|
|
|
$48.72
|
|
|||
|
Second Quarter
|
31.00
|
|
20.32
|
|
72.05
|
|
48.74
|
|
|||||||
|
Third Quarter
|
32.21
|
|
21.41
|
|
69.20
|
|
42.90
|
|
|||||||
|
Fourth Quarter
|
32.88
|
|
22.91
|
|
46.72
|
|
33.15
|
|
|||||||
We have never paid cash dividends on our common stock and do not anticipate that we will do so in the foreseeable future. There are no contractual restrictions in place that currently materially limit, or are likely in the future to materially limit us from paying dividends on our common stock, but applicable state law may limit the payment of dividends. Our present policy is to retain earnings, if any, to provide funds for the operation and expansion of our business.
Stock Performance Graph
The following information in this Item 5 of this Annual Report on Form 10-K is not deemed to be “soliciting material” or to be “filed” with the SEC or subject to Regulation 14A or 14C under the Exchange Act or to the liabilities of Section 18
22
of the Exchange Act, and will not be deemed to be incorporated by reference into any filing under the Securities Act or the Exchange Act, except to the extent we specifically incorporate it by reference into such filing.
The following graph compares the cumulative total return on our common stock with the cumulative total returns of The NASDAQ Composite Index and The NASDAQ Electronic Components Index for the five-year period commencing
June 24, 2007
. The stock price performance shown on the graph below is not necessarily indicative of future price performance.
23
Comparison of Five-Year Cumulative Total Return*
Among Cree, Inc., The NASDAQ Composite Index
And The NASDAQ Electronic Components Index
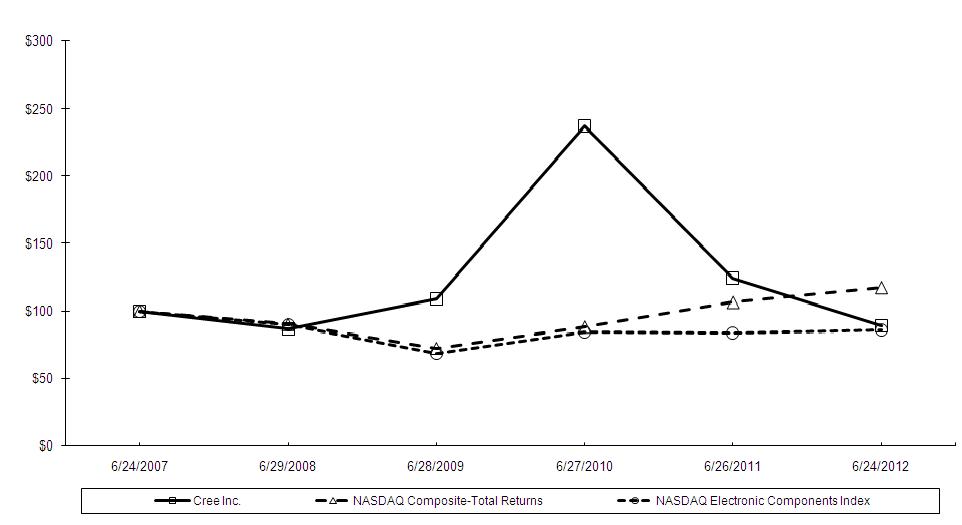
|
*
|
Assumes (1) $100 invested on
June 24, 2007
in Cree, Inc. Common Stock, The NASDAQ Composite Index and The NASDAQ Electronic Components Index and (2) the immediate reinvestment of all dividends.
|
|
6/24/2007
|
6/29/2008
|
6/28/2009
|
6/27/2010
|
6/26/2011
|
6/24/2012
|
||||||||||||||||||
|
Cree, Inc.
|
|
$100.00
|
|
|
$86.39
|
|
|
$109.16
|
|
|
$237.36
|
|
|
$123.90
|
|
|
$89.20
|
|
|||||
|
NASDAQ Composite Index
|
100.00
|
|
90.20
|
|
72.35
|
|
88.34
|
|
106.49
|
|
117.44
|
|
|||||||||||
|
NASDAQ Electronic Components Index
|
100.00
|
|
89.95
|
|
68.21
|
|
84.07
|
|
83.63
|
|
86.19
|
|
|||||||||||
24
Sale of Unregistered Securities
Other than in connection with our previously disclosed acquisition of Ruud Lighting, there were
no
unregistered securities sold during fiscal
2012
.
The following table summarizes stock repurchase activity for the
fourth
quarter of fiscal
2012
(in thousands except price per share data):
|
Period
|
Total Number of Shares Purchased
|
Average Price Paid per Share
|
Total Number of Shares Purchased as Part of Publicly Announced Plans or Programs
|
Approximate Dollar Value of Shares that May Yet be Purchased Under the Plans or Programs
3
|
||||||||||
|
Shares repurchased outside our Stock Repurchase Program
1
|
||||||||||||||
|
March 26, 2012 to April 22, 2012
|
—
|
|
$
|
—
|
|
—
|
|
|
$200,000
|
|
||||
|
April 23, 2012 to May 20, 2012
|
—
|
|
—
|
|
—
|
|
200,000
|
|
||||||
|
May 21, 2012 to June 24, 2012
|
5
|
|
40.85
|
|
—
|
|
200,000
|
|
||||||
|
Total
|
5
|
|
|
$40.85
|
|
—
|
|
|
$200,000
|
|
||||
|
Shares repurchased under our Stock Repurchase Program
2
|
||||||||||||||
|
March 26, 2012 to April 22, 2012
|
—
|
|
|
$—
|
|
—
|
|
|
$200,000
|
|
||||
|
April 23, 2012 to May 20, 2012
|
—
|
|
—
|
|
—
|
|
200,000
|
|
||||||
|
May 21, 2012 to June 24, 2012
|
500
|
|
23.98
|
|
500
|
|
188,009
|
|
||||||
|
Total
|
500
|
|
|
$23.98
|
|
500
|
|
|
$188,009
|
|
||||
(1)
Represents shares of our common stock returned to us in connection with the exercise of our indemnification rights under the stock purchase agreement pursuant to which we acquired Ruud Lighting. The shares were returned from escrow during the
fourth
quarter of fiscal
2012
. The average price per share represents the deemed value of the shares as specified in such stock purchase agreement.
(2)
During the three months ended
June 24, 2012
, we repurchased
500,000
shares under the repurchase program.
(3)
We were authorized to repurchase shares of our common stock having an aggregate purchase price not exceeding
$200 million
as authorized by our Board of Directors from
June 16, 2011
through the expiration of the program on
June 24, 2012
. After the repurchase of
500,000
shares during the
fourth
quarter of fiscal
2012
, there was
$188.0
million remaining in the June 16, 2011 Board authorization.
There were
no
other repurchases of our common stock during fiscal
2012
. Since the inception of our stock repurchase program in January 2001, we have repurchased
10.3 million
shares of our common stock at an average price of
$19.95
per share with an aggregate value of
$205.4 million
.
As of
June 24, 2012
, pursuant to an extension of our stock repurchase program authorized by our Board of Directors, we are authorized to repurchase shares of our common stock having an aggregate purchase price not exceeding
$200 million
for all purchases from
June 14, 2012
through the expiration of the program in
June 30, 2013
. The repurchase program can be implemented through open market or privately negotiated transactions at the discretion of our management.
Item 6.
Selected Financial Data
The consolidated statement of income data set forth below with respect to the fiscal years ended
June 24, 2012
,
June 26, 2011
, and
June 27, 2010
and the consolidated balance sheet data at
June 24, 2012
and
June 26, 2011
are derived from, and are qualified by reference to, the audited consolidated financial statements included in Item 8 of this Annual Report and should be read in conjunction with those financial statements and notes thereto. The consolidated statement of income data for the fiscal years ended
June 28, 2009
and
June 29, 2008
and the consolidated balance sheet data at
June 27, 2010
,
June 28, 2009
, and
June 29, 2008
are derived from audited consolidated financial statements not included herein. Certain fiscal
2011
, fiscal
2010
, fiscal
2009
, and fiscal
2008
amounts have been reclassified to conform to fiscal
2012
classifications. These reclassifications had no effect on previously reported income from operations or shareholders’ equity.
25
Selected Consolidated Financial Data
(Thousands, except per share data)
|
|
Years Ended
|
||||||||||||||||||
|
|
June 24,
2012 |
June 26,
2011 |
June 27,
2010 |
June 28,
2009 |
June 29,
2008 |
||||||||||||||
|
Statement of Income Data
1, 2
|
|||||||||||||||||||
|
Revenue, net
|
|
$1,164,658
|
|
|
$987,615
|
|
|
$867,287
|
|
|
$567,255
|
|
|
$493,296
|
|
||||
|
Operating income
|
|
$39,258
|
|
|
$168,706
|
|
|
$197,778
|
|
|
$30,590
|
|
|
$12,041
|
|
||||
|
Net income from continuing operations
|
|
$44,412
|
|
|
$146,500
|
|
|
$152,290
|
|
|
$30,650
|
|
|
$31,812
|
|
||||
|
Net income from continuing operations per share, basic
|
|
$0.39
|
|
|
$1.35
|
|
|
$1.49
|
|
|
$0.35
|
|
|
$0.37
|
|
||||
|
Net income from continuing operations per share, diluted
|
|
$0.39
|
|
|
$1.33
|
|
|
$1.45
|
|
|
$0.34
|
|
|
$0.36
|
|
||||
|
Weighted Average Shares Outstanding
|
|||||||||||||||||||
|
Basic
|
114,693
|
|
108,522
|
|
102,371
|
|
88,263
|
|
86,366
|
|
|||||||||
|
Diluted
|
115,225
|
|
110,035
|
|
104,698
|
|
89,081
|
|
88,077
|
|
|||||||||
|
|
Years Ended
|
||||||||||||||||||
|
|
June 24,
2012 |
June 26,
2011 |
June 27,
2010 |
June 28,
2009 |
June 29,
2008 |
||||||||||||||
|
Balance Sheet Data
1,2
|
|||||||||||||||||||
|
Cash, cash equivalents and short-term investments
|
|
$744,513
|
|
|
$1,085,797
|
|
|
$1,066,405
|
|
|
$447,210
|
|
|
$371,032
|
|
||||
|
Working capital
|
1,015,104
|
|
1,316,579
|
|
1,235,072
|
|
500,755
|
|
408,293
|
|
|||||||||
|
Total assets
|
2,747,498
|
|
2,446,722
|
|
2,199,176
|
|
1,404,567
|
|
1,313,407
|
|
|||||||||
|
Long term obligations
|
38,430
|
|
44,842
|
|
51,037
|
|
51,138
|
|
42,992
|
|
|||||||||
|
Shareholders’ equity
|
2,559,891
|
|
2,261,564
|
|
2,028,048
|
|
1,224,748
|
|
1,145,740
|
|
|||||||||
1
Consolidated statement of income data and balance sheet data for fiscal years 2009 and 2008 exclude Cree Microwave as it was accounted for as a discontinued operation during fiscal year 2006.
2
Consolidated statement of income data and balance sheet data for fiscal year 2012 include Ruud Lighting from the date of its acquisition in the first quarter of fiscal 2012. See Note 3, "Acquisitions," in our consolidated financial statements included in Item 8 of this annual report for more information about the impact of the acquisition on our consolidated financial statements.
Item 7.
Management’s Discussion and Analysis of Financial Condition and Results of Operations
Executive Summary
The following discussion is designed to provide a better understanding of our audited consolidated financial statements and notes thereto, including a brief discussion of our business and products, key factors that impacted our performance, and a summary of our operating results. The following discussion should be read in conjunction with our consolidated financial statements included in Item 8 of this Annual Report. Historical results and percentage relationships among any amounts in the financial statements are not necessarily indicative of trends in operating results for any future periods.
26
Overview
We are a leading innovator of lighting-class light emitting diode (LED) products, lighting products and semiconductor products for power and radio-frequency (RF) applications. Our products are targeted for applications such as indoor and outdoor lighting, video displays, transportation, electronic signs and signals, power supplies, solar inverters and wireless systems.
We develop and manufacture semiconductor materials and devices primarily based on silicon carbide (SiC), gallium nitride (GaN) and related compounds. The physical and electronic properties of SiC and GaN offer technical advantages over traditional silicon, gallium arsenide (GaAs) and other materials used for electronic and opto-electronic applications.
Our LED products consist of LED components, LED chips, and SiC wafers. As LED technology improves, we believe the potential market for LED lighting will continue to expand. Our success in selling LED products depends upon our ability to offer innovative products and solutions that enable our customers to develop and market LED based products that successfully compete and drive LED adoption against traditional lighting products.
Our lighting products consist of both LED and traditional lighting systems. We design, manufacture and sell lighting systems for indoor and outdoor applications, with our primary focus on LED lighting systems for the commercial and industrial markets. We also use our LED systems expertise to accelerate LED lighting adoption and expand the market for our LED components.
In addition, we develop, manufacture and sell power and RF devices. Our power products are made from SiC and provide faster switching speeds than comparable silicon-based power devices for a given power level. Our RF devices are made from GaN and produce higher power densities as compared to silicon or gallium arsenide.
The majority of our products are manufactured at our production facilities located in North Carolina, Wisconsin, and China. We also use contract manufacturers for certain aspects of product fabrication, assembly and packaging. We operate research and development facilities in North Carolina, California, Wisconsin, and China.
Cree, Inc. is a North Carolina corporation established in 1987. For further information about our consolidated revenues and earnings, please see our consolidated financial statements included in Item 8 of this Annual Report.
Reportable Segments
As of
June 24, 2012
, we have
three
reportable segments:
|
•
|
LED Products
|
|
•
|
Lighting Products
|
|
•
|
Power and RF Products
|
Reportable segments are components of an entity that have separate financial data that the entity's Chief Operating Decision Maker (CODM) regularly reviews when allocating resources and assessing performance. Our CODM is the Chief Executive Officer.
For financial results by reportable segment, please refer to Note 13, "Reportable Segments" in our consolidated financial statements included in Item 8 of this Annual Report.
Industry Dynamics and Trends
There are a number of industry factors that affect our business which include, among others:
|
•
|
Overall Demand for Products and Applications using LEDs
. Our potential for growth depends significantly on the adoption of LEDs within the general lighting market and our ability to affect this rate of adoption. Although LED lighting has grown in recent years, adoption of LEDs for general lighting is relatively new, still limited, and faces significant challenges before widespread adoption. Demand also fluctuates based on various market cycles, a continuously evolving LED industry supply chain, and demand dynamics in the market. These uncertainties make demand difficult to forecast for us and our customers.
|
|
•
|
Intense and Constantly Evolving Competitive Environment.
Competition in the LED and lighting industry is intense. Many companies have made significant investments in LED development and production equipment. Traditional lighting companies and new entrants are investing in LED based lighting products as LED adoption has gained momentum. Product pricing pressures exist as market participants often undertake pricing strategies to
|
27
gain or protect market share, increase the utilization of their production capacity and open new applications to LED based solutions. To remain competitive, market participants must continuously increase product performance and reduce costs. To address these competitive pressures, we have invested in R&D activities to support new product development to deliver higher levels of performance and lower costs to differentiate our products in the market.
|
•
|
Technological Innovation and Advancement.
Innovations and advancements in LED technology continue to expand the potential commercial application of LEDs particularly in the general illumination market. However, new technologies or standards could emerge, or improvements could be made in existing technologies, that could reduce or limit the demand for LEDs in certain markets.
|
|
•
|
Regulatory Actions Concerning Energy Efficiency.
Many countries have already instituted or have announced plans to institute government regulations and programs designed to encourage or mandate increased energy efficiency, even in some cases banning forms of incandescent lighting, which are advancing the adoption of more energy efficient lighting solutions such as LEDs. While this trend is generally positive, these regulations are affected by changing political priorities which can modify or limit the effectiveness of these new regulations.
|
|
•
|
Intellectual Property Issues.
Market participants rely on patented and non-patented proprietary information relating to product development, manufacturing capabilities and other core competencies of their business. Protection of intellectual property is critical. Therefore, steps such as additional patent applications, confidentiality and non-disclosure agreements, as well as other security measures are generally taken. To enforce or protect intellectual property rights, litigation or threatened litigation commonly occurs.
|
Fiscal
2012
Overview
The following is a summary of our financial results for the year ended
June 24, 2012
:
|
•
|
Our year over year revenues increased
18%
to
$1.2 billion
.
|
|
•
|
Gross margin percentage declined from
44%
in fiscal
2011
to
35%
in fiscal
2012
. Gross profit decreased by
$26.3 million
.
|
|
•
|
Operating income was
$39.3 million
in fiscal
2012
compared to
$168.7 million
in fiscal
2011
. Net income per diluted share was
$0.39
compared to
$1.33
for fiscal
2011
.
|
|
•
|
Combined cash, cash equivalents and short-term investments decreased to
$744.5 million
at
June 24, 2012
compared to
$1.1 billion
at
June 26, 2011
primarily due to the cash outlay to acquire Ruud Lighting. Cash provided by operating activities was
$242.3 million
for the year.
|
|
•
|
Inventory increased to
$188.8 million
at
June 24, 2012
compared to
$176.5 million
at
June 26, 2011
.
|
|
•
|
We spent
$95.0 million
on purchases of property and equipment in fiscal
2012
compared to
$237.1 million
in fiscal
2011
.
|
Business Outlook
We project that the markets for our products will remain highly competitive during fiscal
2013
. We anticipate focusing on the following key areas, among others, in response to this competitive environment:
|
•
|
Accelerate adoption of
LED lighting.
We continue to work on developing new LED lighting systems to increase the lumens per dollar, which brings LED lighting closer to price parity with conventional technology and reduces the payback time for the customer. We are focused on delivering best-in-class products for key lighting categories and expanding our sales channels to build the Cree brand and access more customers.
|
|
•
|
Grow LED component sales through product innovation.
We are working to leverage our SC
3
Technology™ next generation LED platform into a range of new LED component products that are targeted to deliver more lumens per dollar to the customer. We are also developing component and module products targeted to simplify our customers' product designs and reduce their time to market.
|
28
|
•
|
Leverage technology leadership in Power and RF to open new applications for these products.
In the power product line, we are working with our customers to combine our SiC MOSFET and Schottky diodes technology to enable power modules for solar, uninterruptable power supplies (UPS) and motor control applications. In the RF product line, we are developing GaN based products to access new military applications and some commercial platforms.
|
|
•
|
Translate product innovation into revenue and profit growth.
We target incremental improvement from factory cost reductions, process improvements and lower cost new product designs.
|
Results of Operations
The following table sets forth certain consolidated statement of income data for the periods indicated:
|
|
2012
|
2011
|
2010
|
|||||||||||||||||
|
(in thousands, except per share amounts and percentages)
|
Dollars
|
% of
Revenue |
Dollars
|
% of
Revenue |
Dollars
|
% of
Revenue |
||||||||||||||
|
Revenue, net
|
|
$1,164,658
|
|
100
|
%
|
|
$987,615
|
|
100
|
%
|
|
$867,287
|
|
100
|
%
|
|||||
|
Cost of revenue, net
|
755,196
|
|
65
|
%
|
551,842
|
|
56
|
%
|
456,180
|
|
53
|
%
|
||||||||
|
Gross profit
|
409,462
|
|
35
|
%
|
435,773
|
|
44
|
%
|
411,107
|
|
47
|
%
|
||||||||
|
Research and development
|
143,357
|
|
12
|
%
|
115,035
|
|
12
|
%
|
81,407
|
|
9
|
%
|
||||||||
|
Sales, general and administrative
|
197,092
|
|
17
|
%
|
139,304
|
|
14
|
%
|
115,601
|
|
13
|
%
|
||||||||
|
Amortization of acquisition related intangibles
|
26,274
|
|
2
|
%
|
10,776
|
|
1
|
%
|
12,180
|
|
1
|
%
|
||||||||
|
Loss on disposal or impairment of long-lived assets
|
3,481
|
|
0
|
%
|
1,952
|
|
—
|
%
|
4,141
|
|
1
|
%
|
||||||||
|
Operating income
|
39,258
|
|
3
|
%
|
168,706
|
|
17
|
%
|
197,778
|
|
23
|
%
|
||||||||
|
Other non-operating income
|
932
|
|
—
|
%
|
993
|
|
—
|
%
|
294
|
|
—
|
%
|
||||||||
|
Interest income, net
|
7,457
|
|
1
|
%
|
8,528
|
|
1
|
%
|
7,400
|
|
1
|
%
|
||||||||
|
Income before income taxes
|
47,647
|
|
4
|
%
|
178,227
|
|
18
|
%
|
205,472
|
|
24
|
%
|
||||||||
|
Income tax expense
|
3,235
|
|
—
|
%
|
31,727
|
|
3
|
%
|
53,182
|
|
6
|
%
|
||||||||
|
Net income
|
|
$44,412
|
|
4
|
%
|
|
$146,500
|
|
15
|
%
|
|
$152,290
|
|
18
|
%
|
|||||
|
Diluted earnings per share
|
|
$0.39
|
|
|
$1.33
|
|
|
$1.45
|
|
|||||||||||
Revenues
Revenues for fiscal
2012
,
2011
and
2010
were comprised of the following (in thousands, except percentages):
|
|
Fiscal Years Ended
|
Year-Over-Year Change
|
|||||||||||||||||||||||
|
|
June 24,
2012 |
June 26,
2011 |
June 27,
2010 |
2011 to 2012
|
2010 to 2011
|
||||||||||||||||||||
|
LED Products
|
|
$756,924
|
|
|
$808,207
|
|
|
$747,431
|
|
|
($51,283
|
)
|
(6
|
)%
|
|
$60,776
|
|
8
|
%
|
||||||
|
% of Revenue
|
65
|
%
|
82
|
%
|
86
|
%
|
|||||||||||||||||||
|
Lighting Products
|
334,704
|
|
81,784
|
|
42,516
|
|
252,920
|
|
309
|
%
|
39,268
|
|
92
|
%
|
|||||||||||
|
% of Revenue
|
29
|
%
|
8
|
%
|
5
|
%
|
|||||||||||||||||||
|
Power and RF Products
|
73,030
|
|
97,624
|
|
77,340
|
|
(24,594
|
)
|
(25
|
)%
|
20,284
|
|
26
|
%
|
|||||||||||
|
% of Revenue
|
6
|
%
|
10
|
%
|
9
|
%
|
|||||||||||||||||||
|
Total revenue
|
|
$1,164,658
|
|
|
$987,615
|
|
|
$867,287
|
|
|
$177,043
|
|
18
|
%
|
|
$120,328
|
|
14
|
%
|
||||||
29
Our consolidated revenue increased
18%
to
$1.2 billion
in fiscal
2012
from
$987.6 million
in fiscal
2011
. This year over year increase is due to the
309%
increase in Lighting Products revenue from sales of products acquired from Ruud Lighting and an increase in the sales of our existing products. The increase in Lighting Products revenue offset the
6%
decrease in LED Products revenues year over year and the
25%
decrease in Power and RF Products revenue over the same period.
Our consolidated revenue increased
14%
to
$987.6 million
in fiscal
2011
from
$867.3 million
in fiscal
2010
. This year over year increase was due to an increase of
8%
in LED Products Revenue driven by increased sales of LED components,
92%
in Lighting Products revenue driven by growth in the general illumination market and new product introductions, and
26%
in Power and RF Products revenue due to increased orders for SiC Schottky diodes and GaN MMICs.
LED Products Segment Revenue
LED Products revenue represents the largest portion of our revenue with approximately
65%
,
82%
, and
86%
of our total revenues for fiscal
2012
,
2011
, and
2010
, respectively. LED Products revenue was
$756.9 million
,
$808.2 million
, and
$747.4 million
for fiscal
2012
,
2011
, and
2010
, respectively.
LED Products revenue decreased approximately
6%
to
$756.9 million
in fiscal
2012
from
$808.2 million
in fiscal
2011
. This decrease was primarily due to generally weaker demand and downward pricing pressure for our LED chips and components. LED products overall blended average selling price, or ASP increased by
8%
in fiscal
2012
compared to fiscal
2011
due primarily to changes in product mix.
LED Products revenue increased
8%
to
$808.2 million
in fiscal
2011
as compared to
$747.4 million
in fiscal
2010
. This increase was driven by increased sales of LED components partially offset by lower demand for LED chips and a more competitive pricing environment. LED Products overall blended ASP increased approximately
51%
in fiscal
2011
as compared to fiscal
2010
. This increase was due to a shift in product mix to a higher proportion of revenues generated from sales of our LED components versus our LED chips.
Lighting Products Segment Revenue
Lighting Products revenues represented approximately
29%
,
8%
, and
5%
of our total revenues for fiscal
2012
,
2011
and
2010
respectively. Lighting Products revenue was
$334.7 million
,
$81.8 million
, and
$42.5 million
for fiscal
2012
,
2011
, and
2010
respectively.
Lighting Products revenue increased approximately
309%
to
$334.7 million
in fiscal
2012
from
$81.8 million
in fiscal
2011
. The increase in our Lighting Products revenue was primarily due to sales of products acquired from Ruud Lighting and an increase in the sales of our existing products. Including the Ruud Lighting products acquired, which have a higher overall ASP than our existing products, the Lighting Products overall blended ASP increased by approximately
34%
in fiscal
2012
compared to fiscal
2011
.
Lighting Products revenue increased
92%
to
$81.8 million
in fiscal
2011
as compared to
$42.5 million
in fiscal
2010
. This increase was due to higher sales resulting from growth in the LED general illumination market and new product introductions. Lighting Products overall blended ASP decreased approximately
29%
in fiscal
2011
compared to fiscal
2010
due to the expansion of lower price product offerings.
Power and RF Products Segment Revenue
Power and RF Products revenue represented approximately
6%
,
10%
, and
9%
of our total revenues for fiscal
2012
,
2011
, and
2010
, respectively. Power and RF Products revenue was
$73.0 million
,
$97.6 million
, and
$77.3 million
for fiscal
2012
,
2011
, and
2010
, respectively.
Power and RF Products revenue decreased approximately
25%
to
$73.0 million
in fiscal
2012
from
$97.6 million
in fiscal
2011
. The decrease in revenue was primarily due to a lower demand in the solar inverter market and the delay of RF orders related to military programs. Power and RF Products overall blended ASP decreased by
11%
in fiscal
2012
compared to fiscal
2011
due to change in product mix.
Power and RF Products revenue increased
$20.3 million
or
26%
in fiscal
2011
as compared to fiscal
2010
. This increase was primarily due to increased orders for SiC Schottky diodes and GaN MMICs. The Power and RF Products overall blended ASP decreased by
4%
in fiscal
2011
compared to fiscal
2010
due to change in product mix.
Unallocated Revenue
All of our revenue is allocated to our reportable segments. The Company's Chief Executive Officer does not review inter-segment revenue when evaluating performance and allocating resources to each segment, and inter-segment revenue is not included in the segment revenues presented above. As such, total segment revenue in the table above is equal to the Company's consolidated revenue.
30
Gross Profit and Gross Margin
Gross profit and gross margin for fiscal
2012
,
2011
and
2010
were as follows (in thousands, except percentages):
|
|
Fiscal Years Ended
|
Year-Over-Year Change
|
|||||||||||||||||||||||
|
|
June 24, 2012
|
June 26, 2011
|
June 27, 2010
|
2011 to 2012
|
2010 to 2011
|
||||||||||||||||||||
|
LED Products gross profit
|
|
$290,642
|
|
|
$375,424
|
|
|
$379,806
|
|
|
($84,782
|
)
|
(23
|
)%
|
|
($4,382
|
)
|
(1
|
)%
|
||||||
|
LED Products gross margin
|
38
|
%
|
46
|
%
|
51
|
%
|
|||||||||||||||||||
|
Lighting Products gross profit
|
103,396
|
|
23,686
|
|
12,041
|
|
79,710
|
|
337
|
%
|
11,645
|
|
97
|
%
|
|||||||||||
|
Lighting Products gross margin
|
31
|
%
|
29
|
%
|
28
|
%
|
|||||||||||||||||||
|
Power and RF Products gross profit
|
32,051
|
|
49,828
|
|
34,358
|
|
(17,777
|
)
|
(36
|
)%
|
15,470
|
|
45
|
%
|
|||||||||||
|
Power and RF Products gross margin
|
44
|
%
|
51
|
%
|
44
|
%
|
|||||||||||||||||||
|
Unallocated costs
|
(16,627
|
)
|
(13,165
|
)
|
(15,098
|
)
|
|
(3,462
|
)
|
26
|
%
|
1,933
|
|
(13
|
)%
|
||||||||||
|
Consolidated gross profit
|
409,462
|
|
435,773
|
|
411,107
|
|
(26,311
|
)
|
(6
|
)%
|
24,666
|
|
6
|
%
|
|||||||||||
|
Consolidated gross margin
|
35
|
%
|
44
|
%
|
47
|
%
|
|||||||||||||||||||
Our consolidated gross profit decreased
6%
to
$409.5 million
in fiscal
2012
from
$435.8 million
in fiscal
2011
. Our consolidated gross margin decreased to
35%
in fiscal
2012
from
44%
in fiscal
2011
. These year over year consolidated gross profit and gross margin decreases are due to the decrease in LED Products and Power and RF Products gross profit, offset by an increase in Lighting Products gross profit. The
23%
decrease in LED Products gross profit was due to a competitive pricing environment and lower factory utilization. The
36%
decrease in Power and RF Products gross profit was due to reduced solar demand that resulted in lower factory utilization. The
337%
increase in Lighting Products gross profit was due to increased sales volume due to the Ruud Lighting acquisition,
manufacturing cost reductions and lower cost new product designs.
Our consolidated gross profit increased
6%
to
$435.8 million
in fiscal
2011
from
$411.1 million
in fiscal
2010
. However, consolidated gross margin decreased to
44%
in fiscal
2011
from
47%
in fiscal
2010
. Factors contributing to the increase in gross profit included a
97%
increase in Lighting Products gross profit due to increased sales and a
45%
increase in Power and RF Products gross profit due to increased sales and lower costs. These gross profit increases were partially offset by a
1%
decrease in LED Products gross profit due to significant pricing pressure. The consolidated gross margin decrease is due to a more competitive pricing environment and lower factory utilization for LED Products and Power and RF Products, as well as an increase in sales of Lighting Products and a decline in gross profit on our LED Products.
LED Products Segment Gross Profit and Gross Margin
Our LED Products gross profit was
$290.6 million
,
$375.4 million
, and
$379.8 million
for fiscal
2012
,
2011
, and
2010
, respectively. LED Products gross margin was
38%
,
46%
, and
51%
for fiscal
2012
,
2011
, and
2010
respectively.
LED Products gross profit decreased approximately
23%
to
$290.6 million
in fiscal
2012
from
$375.4 million
in fiscal
2011
and LED Products gross margin decreased to
38%
in fiscal
2012
from
46%
in fiscal
2011
. LED Products gross profit and gross margin fell during fiscal
2012
due to a competitive pricing environment for LED chips and components and lower factory utilization.
LED products gross profit decreased approximately
1%
to
$375.4 million
in fiscal
2011
from
$379.8 million
in fiscal
2010
. LED Products gross margin decreased to
46%
in fiscal
2011
from
51%
in fiscal
2010
. LED products gross profit and gross margin fell in fiscal 2011 due to a more competitive pricing environment.
Lighting Products Segment Gross Profit and Gross Margin
Lighting Products gross profit was
$103.4 million
,
$23.7 million
, and
$12.0 million
for fiscal
2012
,
2011
, and
2010
, respectively. Lighting Products gross margin was
31%
,
29%
, and
28%
for fiscal
2012
,
2011
, and
2010
respectively.
Lighting Products gross profit increased approximately
337%
to
$103.4 million
in fiscal
2012
from
$23.7 million
in fiscal
2011
. During fiscal
2012
, Lighting Products gross margin increased to
31%
from
29%
in fiscal
2011
. Lighting Products gross profit and gross margin increased during fiscal
2012
due to
a combination of increased sales volumes due to the Ruud Lighting acquisition, manufacturing cost reductions and lower cost new product designs.
Lighting Products gross profit increased approximately
97%
to
$23.7 million
in fiscal
2011
from
$12.0 million
in fiscal
2010
. Lighting Products gross margin increased to
29%
in fiscal
2011
from
28%
in fiscal
2010
. Lighting Products gross profit and gross margin increased in fiscal
2011
due to increased sales.
31
Power and RF Products Segment Gross Profit and Gross Margin
Power and RF Products gross profit was
$32.1 million
,
$49.8 million
, and
$34.4 million
for fiscal
2012
,
2011
, and
2010
, respectively. Power and RF Products gross margin was
44%
,
51%
, and
44%
for fiscal
2012
,
2011
, and
2010
respectively.
Power and RF Products gross profit decreased approximately
36%
to
$32.1 million
in fiscal
2012
from
$49.8 million
in fiscal
2011
. For fiscal
2012
, Power and RF Products gross margin decreased to
44%
from
51%
in
2011
. Power and RF Products gross profit and gross margin decreased during fiscal
2012
due to lower revenue, primarily from reduced solar demand which resulted in lower factory utilization.
Power and RF Products gross profit increased approximately
45%
to
$49.8 million
in fiscal
2011
from
$34.4 million
in fiscal
2010
. Power and RF Products gross margin increased to
51%
in fiscal
2011
from
44%
in fiscal
2010
. Power and RF Products gross profit and gross margin increased during fiscal
2011
due to increased product sales and lower manufacturing costs.
Unallocated Costs
Total gross profit and gross margin by segment reconcile to consolidated gross profit and gross margin through a subtraction of
$16.6 million
,
$13.2 million
, and
$15.1 million
of unallocated variable compensation costs for manufacturing employees, consisting primarily of stock-based compensation, expenses for profit sharing and quarterly or annual incentive plans, matching contributions under our 401(k) plan and acquisition related costs. These costs are not allocated to the reportable segments' gross profit because our Chief Executive Officer does not review them regularly when evaluating segment performance and allocating resources. For further information on the allocation of costs to segment gross profit, refer to Note 13, "Reportable Segments," in our consolidated financial statements included in Item 8 of this Annual Report.
Research and Development
Research and development expenses include costs associated with the development of new products, enhancements of existing products and general technology research. These costs consist primarily of employee salaries and related compensation costs, occupancy costs, consulting costs and the cost of development equipment and supplies.
The following sets forth our research and development expenses in dollars and as a percentage of revenues (in thousands, except percentages):
|
|
Fiscal Years Ended
|
Year-Over-Year Change
|
|||||||||||||||||||||||
|
|
June 24, 2012
|
June 26, 2011
|
June 27, 2010
|
2011 to 2012
|
2010 to 2011
|
||||||||||||||||||||
|
Research and development
|
|
$143,357
|
|
|
$115,035
|
|
|
$81,407
|
|
|
$28,322
|
|
25
|
%
|
|
$33,628
|
|
41
|
%
|
||||||
|
Percent of revenue
|
12
|
%
|
12
|
%
|
9
|
%
|
|||||||||||||||||||
Research and development expenses in fiscal
2012
increased
25%
to
$143.4 million
from
$115.0 million
in fiscal
2011
. The increase was primarily due to increased spending on new LED chips, LED components, LED lighting products, power products, including associated manufacturing process improvement initiatives, and incremental research and development expense incurred from the acquisition of Ruud Lighting.
Research and development expenses increased
41%
in fiscal
2011
to
$115.0 million
compared to
$81.4 million
in fiscal
2010
. The increase was primarily due to increased spending to support the transition to 150mm wafer capabilities as well as continued research and development activities focused on new LED chips, LED components, LED lighting products, and power products.
Our research and development expenses vary significantly from year to year based on a number of factors, including: the timing of new product introductions, timing of expenditures and the number and nature of our ongoing research and development activities. However, we anticipate that in general our research and development expenses will continue to increase over time to support future growth.
32
Sales, General and Administrative
Sales, general and administrative expenses are composed primarily of costs associated with our sales and marketing personnel and our executive and administrative personnel (for example, finance, human resources, information technology and legal) and consist of 1) salaries and related compensation costs, 2) consulting and other professional services (such as litigation and other outside legal counsel fees, audit and other compliance costs), 3) facilities and insurance costs, and 4) travel and other costs. The following table sets forth our sales, general and administrative expenses in dollars and as a percentage of revenues (in thousands, except percentages):
|
|
Fiscal Years Ended
|
Year-Over-Year Change
|
|||||||||||||||||||||||
|
|
June 24, 2012
|
June 26, 2011
|
June 27, 2010
|
2011 to 2012
|
2010 to 2011
|
||||||||||||||||||||
|
Sales, general and administrative
|
|
$197,092
|
|
|
$139,304
|
|
|
$115,601
|
|
|
$57,788
|
|
41
|
%
|
|
$23,703
|
|
21
|
%
|
||||||
|
Percent of revenue
|
17
|
%
|
14
|
%
|
13
|
%
|
|||||||||||||||||||
Sales, general and administrative expenses in fiscal
2012
increased
41%
to
$197.1 million
from
$139.3 million
in fiscal
2011
. This increase is primarily due to an increase in spending on sales and marketing for lighting products as we continue to expand our direct sales resources and channels and invest in building and promoting the Cree brands. The increase is also due to incremental sales, general and administrative expenses from Ruud Lighting, the legal transaction costs associated with the Ruud Lighting acquisition and patent litigation expenses.
Sales, general and administrative expenses increased
21%
in fiscal
2011
to
$139.3 million
compared to
$115.6 million
in fiscal
2010
. The increase in costs in fiscal
2011
is primarily due to an increase in spending on sales and marketing as we expanded our direct sales resources and channels and invested in building the Cree brand. Additionally, costs increased due to higher patent litigation expenses.
Amortization of Acquisition Related Intangibles
As a result of our acquisitions, we have recorded various intangible assets, including customer relationships and developed technologies. During fiscal 2012, we acquired Ruud Lighting, resulting in
$206.0 million
of amortizable intangible assets, principally composed of developed technology, customer relationships and trade names. In fiscal 2008, we acquired LED Lighting Fixtures, Inc. (LLF), resulting in an additional
$41.2 million
of amortizable intangible assets. These intangible assets are principally composed of developed technology that specifically relates to technologies underlying the development of LED lighting products for the general illumination market. During fiscal 2007, we acquired INTRINSIC Semiconductor Corporation and COTCO Luminant Device Limited (COTCO), resulting in
$63.7 million
of amortizable intangible assets principally composed of customer relationships and developed technology.
Amortization of intangible assets related to our acquisitions is as follows (in thousands, except percentages):
|
|
Fiscal Years Ended
|
Year-Over-Year Change
|
|||||||||||||||||||||||
|
|
June 24,
2012 |
June 26,
2011 |
June 27,
2010 |
2011 to 2012
|
2010 to 2011
|
||||||||||||||||||||
|
Ruud Lighting
|
|
$17,473
|
|
|
$—
|
|
|
$—
|
|
|
$17,473
|
|
100
|
%
|
|
$—
|
|
0
|
%
|
||||||
|
COTCO
|
5,058
|
|
6,932
|
|
8,290
|
|
(1,874
|
)
|
(27
|
)%
|
(1,358
|
)
|
(16
|
)%
|
|||||||||||
|
LLF
|
2,998
|
|
3,099
|
|
3,145
|
|
(101
|
)
|
(3
|
)%
|
(46
|
)
|
(1
|
)%
|
|||||||||||
|
INTRINSIC
|
745
|
|
745
|
|
745
|
|
—
|
|
0
|
%
|
—
|
|
0
|
%
|
|||||||||||
|
Total
|
|
$26,274
|
|
|
$10,776
|
|
|
$12,180
|
|
|
$15,498
|
|
144
|
%
|
|
($1,404
|
)
|
(12
|
)%
|
||||||
Amortization of acquisition related intangibles is not allocated to our reportable segments because our Chief Executive Officer reviews this expense on a consolidated basis.
33
Loss on Disposal or Impairment of Long-Lived Assets
We operate a capital intensive business. As such, we dispose of a certain level of our equipment in the normal course of business as our production processes change due to production improvement initiatives or product mix changes. Due to the risk of technological obsolescence or changes in our production process, we regularly review our equipment and capitalized patent costs for possible impairments in value. The following table sets forth our loss on disposal or impairment of long-lived assets (in thousands, except percentages):
|
|
Fiscal Years Ended
|
Year-Over-Year Change
|
|||||||||||||||||||||||
|
|
June 24, 2012
|
June 26, 2011
|
June 27, 2010
|
2011 to 2012
|
2010 to 2011
|
||||||||||||||||||||
|
Loss on disposal or impairment of long-lived assets, net
|
|
$3,481
|
|
|
$1,952
|
|
|
$4,141
|
|
|
$1,529
|
|
78
|
%
|
|
($2,189
|
)
|
(53
|
)%
|
||||||
We recorded a net loss of
$3.5 million
,
$2.0 million
, and
$4.1 million
on the disposal of long-lived assets in fiscal years
2012
,
2011
, and
2010
respectively. These net losses were primarily the result of disposals of equipment due to changes in various manufacturing processes and the impairment of certain capitalized patent costs as a result of technological obsolescence.
Non-Operating Income
The following table sets forth our non-operating income (in thousands, except percentages):
|
|
Fiscal Years Ended
|
Year-Over-Year Change
|
|||||||||||||||||||||||
|
|
June 24, 2012
|
June 26, 2011
|
June 27, 2010
|
2011 to 2012
|
2010 to 2011
|
||||||||||||||||||||
|
Other non-operating income, net
|
|
$932
|
|
|
$993
|
|
|
$294
|
|
|
($61
|
)
|
(6
|
)%
|
|
$699
|
|
238
|
%
|
||||||
|
Interest income, net
|
7,457
|
|
8,528
|
|
7,400
|
|
(1,071
|
)
|
(13
|
)%
|
1,128
|
|
15
|
%
|
|||||||||||
|
Total
|
|
$8,389
|
|
|
$9,521
|
|
|
$7,694
|
|
|
($1,132
|
)
|
(12
|
)%
|
|
$1,827
|
|
24
|
%
|
||||||
We have no debt or active lines of credit and we are in a net interest income position. Our investments consist of fixed interest rate securities such as high-grade corporate debt, commercial paper, government securities, municipal bonds, and other fixed interest rate investments. The primary objective of our investment policy is preservation of principal.
Other non-operating income, net is comprised primarily of gains on sales of investments and foreign exchange gains and losses. Other non-operating income, net for fiscal
2012
of
$0.9 million
is primarily due to gains on sales of investments liquidated in order to fund our acquisition of Ruud Lighting. The increase in other non-operating income, net for fiscal
2011
to
$1.0 million
from
$0.3 million
in fiscal
2010
is primarily due to foreign exchange gains recorded during fiscal
2011
.
Net interest income declined to
$7.5 million
in fiscal
2012
from
$8.5 million
in fiscal 2011. This decline was primarily due to the cash outlay associated with the Ruud Lighting acquisition in the first quarter of fiscal
2012
, which reduced our average cash and investment balances in fiscal year
2012
as compared to fiscal
2011
.
Net interest income was
$8.5 million
and
$7.4 million
in fiscal
2011
and fiscal
2010
, respectively. This
$1.1 million
year over year increase was due to a combination of fluctuations in interest rates on our cash, cash equivalents and investments and differences between the periods in our average cash and investment balances.
Income Tax Expense
The following table sets forth our income tax expense in dollars and our effective tax rate (in thousands, except percentages):
|
|
Fiscal Years Ended
|
Year-Over-Year Change
|
|||||||||||||||||||||||
|
|
June 24,
2012 |
June 26,
2011 |
June 27,
2010 |
2011 to 2012
|
2010 to 2011
|
||||||||||||||||||||
|
Income tax expense
|
|
$3,235
|
|
|
$31,727
|
|
|
$53,182
|
|
|
($28,492
|
)
|
(90
|
)%
|
|
($21,455
|
)
|
(40
|
%)
|
||||||
|
Effective tax rate
|
7
|
%
|
18
|
%
|
26
|
%
|
|
|
|
|
|||||||||||||||
34
We recorded income tax expense of
$3.2 million
in fiscal
2012
as compared to income tax expense of
$31.7 million
in fiscal
2011
. The decrease in the effective tax rate from
18%
in fiscal
2011
to
7%
in fiscal
2012
is due to the increased impact of net tax benefits related to prior year audit settlements, statute expirations, and tax credits relative to lower year over year pre-tax income. The decrease in the effective tax rate from
26%
in fiscal
2010
to
18%
in fiscal
2011
was primarily due to a change in the mix of pre-tax income from various tax jurisdictions, primarily mainland China and Hong Kong, and the new tax holiday in Malaysia effective in fiscal 2011 with respect to our subcontract manufacturing and distribution operations. For further discussion of changes in our effective tax rate, please refer to Note 11, “Income Taxes,” in our consolidated financial statements included in Item 8 of this Annual Report.
The variation between our effective tax rate and the U.S. statutory rate of
35%
is primarily due to the consolidation of our foreign operations, which are generally subject to income taxes at lower statutory rates as well as the net tax benefit related to prior year audit settlements and statute expirations recorded during fiscal 2012. A change in the mix of pretax income from these various tax jurisdictions can have a significant impact on our periodic effective tax rate. In addition, our effective tax rate may be negatively impacted by the lack of sufficient excess tax benefits (credits) that accumulate in our equity as additional paid-in-capital (APIC) and referred to as the “APIC pool” of credits. In situations where our realized tax deductions for certain stock based compensation awards, such as non-qualified stock options and restricted stock, are less than those originally anticipated, which accumulate in the APIC pool, U.S. GAAP requires that we record the difference as an increase to income tax expense.
Liquidity and Capital Resources
Overview
We require cash to fund our operating expenses and working capital requirements, including outlays for research and development, capital expenditures, strategic acquisitions and investments. Our principal sources of liquidity are cash on hand, marketable investments and cash generated from operations. Our ability to generate cash from operations has been one of our fundamental strengths and has provided us with substantial flexibility in meeting our operating, financing and investing needs. We have no debt or active lines of credit and have minimal lease commitments.
On
August 17, 2011, we acquired all of the outstanding share capital of Ruud Lighting in exchange for consideration consisting of
6.1 million
shares of our common stock and
$372.2 million
in cash, subject to certain post-closing adjustments. These post-closing adjustments are described in detail in Note 3, "Acquisitions," in Item 8 of this Annual Report. Prior to the completion of our acquisition of Ruud Lighting, Ruud Lighting completed the re-acquisition of its e-conolight business by purchasing all of the membership interests of E-conolight LLC. Ruud Lighting previously sold its e-conolight business in March 2010 and had been providing operational services to E-conolight since that date. In connection with the stock purchase transaction, we funded Ruud Lighting's re-acquisition of E-conolight and paid off Ruud Lighting's outstanding debt in the aggregate amount of approximately
$85.0 million
. The cash consideration and debt payoff were funded from cash on hand, which reduced our available cash to fund our operating expenses and working capital by approximately
$457.2 million
.
Based on past performance and current expectations, we believe our cash and cash equivalents, investments, cash generated from operations and our ability to access capital markets will satisfy our working capital needs, capital expenditures, investment requirements, stock repurchases, contractual obligations, commitments and other liquidity requirements associated with our operations through at least the next 12 months.
From time to time, we evaluate strategic opportunities, including potential acquisitions, divestitures or investments in complementary businesses and we anticipate continuing to make such evaluations. We may also access capital markets through the issuance of debt or additional shares of common stock in connection with the acquisition of complementary businesses or other significant assets or for other strategic opportunities.
35
Contractual Obligations
At
June 24, 2012
, payments to be made pursuant to significant contractual obligations are as follows (in thousands):
|
|
|
Payments due by period
|
|||||||||||||||||
|
Total
|
Less than
One Year |
One to
Three Years |
Three to
Five Years |
More Than
Five Years |
|||||||||||||||
|
Long-term debt obligations
|
|
$—
|
|
|
$—
|
|
|
$—
|
|
|
$—
|
|
|
$—
|
|
||||
|
Capital lease obligations
|
—
|
|
—
|
|
—
|
|
—
|
|
—
|
|
|||||||||
|
Operating lease obligations
|
12,736
|
|
3,239
|
|
5,752
|
|
3,588
|
|
157
|
|
|||||||||
|
Purchase obligations
|
192,723
|
|
178,037
|
|
8,048
|
|
3,622
|
|
3,016
|
|
|||||||||
|
Other long-term liabilities
1
|
—
|
|
—
|
|
—
|
|
—
|
|
—
|
|
|||||||||
|
Total
|
|
$205,459
|
|
|
$181,276
|
|
|
$13,800
|
|
|
$7,210
|
|
|
$3,173
|
|
||||
1
Other long-term liabilities as of
June 24, 2012
include long-term tax contingencies, other tax liabilities and deferrals of
$18.9 million
and other long-term contingent liabilities (i.e., warranties) of
$3.8 million
. These liabilities are not included in the table above as they will either not be settled in cash and/or the timing of any payments is uncertain.
Operating leases include rental amounts due on leases of certain office and manufacturing space under the terms of non-cancellable operating leases. These leases expire at various times through
November 2017
. All of the lease agreements provide for rental adjustments for increases in base rent, property taxes and general property maintenance that would be recorded as rent expense, if applicable.
Purchase obligations represent purchase commitments, including open purchase orders and contracts, and are generally related to the purchase of goods and services in the ordinary course of business such as raw materials, supplies and capital equipment.
Financial Condition
The following table sets forth our cash, cash equivalents and investments (in thousands):
|
June 24,
2012 |
June 26,
2011 |
Change
|
|||||||||
|
Cash and cash equivalents
|
|
$178,885
|
|
|
$390,598
|
|
|
($211,713
|
)
|
||
|
Short-term investments
|
565,628
|
|
695,199
|
|
(129,571
|
)
|
|||||
|
Total cash, cash equivalents, and short-term investments
|
|
$744,513
|
|
|
$1,085,797
|
|
|
($341,284
|
)
|
||
Our liquidity and capital resources depend on our cash flows from operations and our working capital. Our working capital decreased to
$1,015.1 million
as of
June 24, 2012
from
$1,316.6 million
at
June 26, 2011
, primarily due to the use of cash to fund our acquisition of Ruud Lighting in the first quarter of fiscal 2012. The following table presents the components of our cash conversion cycle:
|
June 24,
2012 |
June 26,
2011 |
Change
|
||||||
|
Days of sales outstanding (a)
|
45
|
|
44
|
|
1
|
|
||
|
Days of supply in inventory (b)
|
85
|
|
106
|
|
(21
|
)
|
||
|
Days in accounts payable (c )
|
(36
|
)
|
(46
|
)
|
10
|
|
||
|
Cash conversion cycle
|
94
|
|
104
|
|
(10
|
)
|
||
|
a)
|
Days of sales outstanding (DSO) calculates the average collection period of our receivables. DSO is based on the ending net trade receivables and the revenue for the quarter then ended. DSO is calculated by adding ending accounts receivable, net of applicable allowances and reserves, and dividing that sum by the average net revenue per day for the respective quarter.
|
|
b)
|
Days of supply in inventory (DSI) measures the average number of days from procurement to sale of our product. DSI is based on ending inventory and cost of goods sold for the quarter then ended. DSI is calculated by dividing inventory by average cost of goods sold per day for the respective quarter.
|
36
|
c)
|
Days in accounts payable (DPO) calculates the average number of days our payables remain outstanding before payment. DPO is based on ending accounts payable and cost of goods sold for the quarter then ended. DPO is calculated by dividing accounts payable by the average cost of goods sold per day for the respective quarter.
|
Overall our cash conversion cycle, or days to cash, decreased primarily due to a decrease in inventory on hand in relation to current sales volumes.
As of
June 24, 2012
, we had unrealized losses on our investments of
$0.2 million
. All of our investments had investment grade ratings, and any such investments that were in an unrealized loss position at
June 24, 2012
were in such position due to interest rate changes, sector credit rating changes or company-specific rating changes. As we intend and believe that we have the ability to hold such investments for a period of time that will be sufficient for anticipated recovery in market value, we currently expect to receive the full principal or recover our cost basis in these securities. The declines in value of the securities in our portfolio are considered to be temporary in nature and, accordingly, we do not believe these securities are impaired as of
June 24, 2012
.
We believe our current working capital and anticipated cash flows from operations will be adequate to meet our cash needs for our daily operations and capital expenditures for at least the next 12 months. We have and may continue to use a portion of our available cash and cash equivalents, or funds underlying our marketable securities, to repurchase shares of our common stock. With our strong working capital position, we believe that we have the ability to continue to invest in further development of our products and, when necessary or appropriate, make selective acquisitions or other strategic investments to strengthen our product portfolio, secure key intellectual properties, or expand our production capacity.
Cash Flows
In summary, our cash flows were as follows (in thousands):
|
|
Fiscal Years Ended
|
Year-Over-Year Change
|
|||||||||||||||||
|
|
June 24, 2012
|
June 26, 2011
|
June 27, 2010
|
2011 to 2012
|
2010 to 2011
|
||||||||||||||
|
Cash provided by operating activities
|
|
$242,280
|
|
|
$251,380
|
|
|
$250,569
|
|
|
($9,100
|
)
|
|
$811
|
|
||||
|
Cash used in investing activities
|
(448,141
|
)
|
(303,234
|
)
|
(763,387
|
)
|
(144,907
|
)
|
460,153
|
|
|||||||||
|
Cash (used) provided by financing activities
|
(6,692
|
)
|
44,546
|
|
619,799
|
|
(51,238
|
)
|
(575,253
|
)
|
|||||||||
|
Effect of foreign exchange changes
|
840
|
|
475
|
|
296
|
|
365
|
|
179
|
|
|||||||||
|
Net (decrease) increase in cash and cash equivalents
|
|
($211,713
|
)
|
|
($6,833
|
)
|
|
$107,277
|
|
|
($204,880
|
)
|
|
($114,110
|
)
|
||||
The following is a discussion of our primary sources and uses of cash in our operating, investing and financing activities.
Cash Flows from Operating Activities
Cash provided by operating activities decreased slightly to
$242.3 million
in fiscal
2012
from
$251.4 million
in fiscal
2011
. The change was due primarily to lower net income partially offset by an increase in various non-cash charges and decreases in inventory, excluding inventory acquired. Cash provided by operating activities was relatively unchanged from
$250.6 million
in fiscal
2010
to
$251.4 million
in fiscal
2011
.
Cash Flows from Investing Activities
Our investing activities primarily relate to transactions within our investments, strategic acquisitions, purchase of property, plant and equipment and purchase of patent and license rights. Net cash used in investing activities was
$448.1 million
for fiscal
2012
compared to
$303.2 million
for fiscal
2011
. This year over year increase was primarily the result of the $457.2 million in cash used to acquire Ruud Lighting in the first quarter of fiscal 2012, partially offset by a decrease in purchases of property and equipment and an increase in our proceeds from the sale and maturity of investments, some of which were liquidated to pay for the acquisition.
Net cash used in investing activities was
$303.2 million
for fiscal
2011
compared to
$763.4 million
for fiscal
2010
. This year over year decrease was primarily due to an overall net decrease in short term investment purchase activity and payment of contingent consideration related to our COTCO acquisition. This decrease was partially offset by an increase in purchases of property and equipment to expand our global production capacity and proceeds from maturities of investments.
37
We are continuing to actively manage our capital spending. For fiscal
2013
, we target similar levels of investment as fiscal
2012
to support our strategic priorities to lead the market, drive adoption of LED lighting, accelerate cost reductions and support incremental capacity as needed.
Cash Flows from Financing Activities
In fiscal
2012
, net cash used by financing activities was
$6.7 million
compared to net cash provided by financing activities of
$44.5 million
in fiscal
2011
. This year over year change was primarily related to the repurchase of
0.5 million
shares of common stock worth approximately
$12.0 million
during the
fourth
quarter of fiscal
2012
and a reduction in option exercises during fiscal 2012 as compared to fiscal 2011. There were
no
common stock repurchases during fiscal
2011
.
Net cash provided by financing activities was
$44.5 million
for fiscal
2011
compared to
$619.8 million
for fiscal
2010
. This year over year decrease was primarily due to our sale of
12.65 million
shares of our common stock in a follow-on public offering during fiscal 2010, which provided net proceeds of approximately
$434 million
.
As of
June 24, 2012
, up to
$200 million
of our common stock is approved for repurchase under the repurchase program authorized by our Board of Directors beginning
June 14, 2012
through
June 30, 2013
. Since the inception of our stock repurchase program in 2001, we have repurchased approximately
10.3 million
shares of our common stock at an average price of
$19.95
per share with an aggregate value of
$205.4 million
.
At the discretion of our management, the repurchase program can be implemented through open market or privately negotiated transactions. We will determine the time and extent of repurchases based on our evaluation of market conditions and other factors.
Fair Value
Under accounting principles generally accepted in the United States (U.S. GAAP), fair value is defined as the price that would be received to sell an asset or paid to transfer a liability (i.e., “the exit price”) in an orderly transaction between market participants at the measurement date. U.S. GAAP also establishes a hierarchy for inputs used in measuring fair value that maximizes the use of observable inputs and minimizes the use of unobservable inputs by requiring that the most observable inputs be used when available. Observable inputs are obtained from independent sources and can be validated by a third party, whereas, unobservable inputs reflect assumptions regarding what a third party would use in pricing an asset or liability. The fair value hierarchy is broken down into three levels based on the reliability of inputs as follows:
|
•
|
Level 1 - Valuations based on quoted prices in active markets for identical instruments that we are able to access. Since valuations are based on quoted prices that are readily and regularly available in an active market, valuation of these products does not entail a significant degree of judgment.
|
|
•
|
Level 2 - Valuations based on quoted prices in active markets for instruments that are similar, or quoted prices in markets that are not active for identical or similar instruments, and model-derived valuations in which all significant inputs and significant value drivers are observable in active markets.
|
|
•
|
Level 3 - Valuations based on inputs that are unobservable and significant to the overall fair value measurement.
|
The financial assets for which we perform recurring fair value remeasurements are cash equivalents and short-term investments. The financial assets for which we may be required to perform non-recurring fair value remeasurements (e.g., an impairment of assets) are any investments in privately-held companies. As of
June 24, 2012
, financial assets utilizing Level 1 inputs included money market funds. Financial assets utilizing Level 2 inputs included corporate bonds, municipal bonds, certificates of deposit, variable rate demand notes, non-U.S. government securities, commercial paper, and U.S. agency securities. Level 2 assets are valued using a third-party pricing services consensus price which is a weighted average price based on multiple sources. These sources determine prices utilizing market income models which factor in, where applicable, transactions of similar assets in active markets, transactions of identical assets in infrequent markets, interest rates, bond or credit default swap spreads and volatility. We do not have any significant financial assets requiring the use of Level 3 inputs. Please refer to Note 6, “Fair Value of Financial Instruments” to the consolidated financial statements included in Item 8 of this Annual Report for further information.
38
Financial and Market Risks
We are exposed to financial and market risks, including changes in interest rates, currency exchange rates and commodities risk. We currently do not use derivative financial instruments to mitigate any of these risks; however, we may choose to do so in the future. All of the potential changes noted below are based on sensitivity analyses performed on our financial positions at
June 24, 2012
and
June 26, 2011
. Actual results may differ materially.
Interest Rates
We maintain an investment portfolio principally composed of high-grade corporate debt, commercial paper, government securities, and other investments at fixed interest rates that vary by security. In order to minimize risk, our cash management policy permits us to acquire investments rated “AA” grade or better. The potential loss in fair value resulting from a hypothetical 10% decrease in quoted market price of our investments was approximately
$56.6 million
at
June 24, 2012
and
$69.5 million
at
June 26, 2011
.
Currency Exchange Rates
As we operate internationally and have transactions denominated in foreign currencies, including the Euro, among others, we are exposed to currency exchange rate risks. As a result, fluctuations in exchange rates may adversely affect our expenses and results of operations as well as the value of our assets and liabilities. Our primary exposures relate to the exchange rates between the U.S. Dollar and the Chinese Renminbi (CNY). The potential loss in fair value resulting from a hypothetical 10% increase in the value of the U.S. Dollar compared to the Chinese Renminbi was approximately
$3.8 million
at
June 24, 2012
and
$2.6 million
at
June 26, 2011
.
Commodities
We utilize significant amounts of precious metals, gases and other commodities in our manufacturing processes. General economic conditions, market specific changes or other factors outside of our control may affect the pricing of these commodities. We do not use financial instruments to hedge commodity prices.
Off-Balance Sheet Arrangements
We do not use off-balance sheet arrangements with unconsolidated entities or related parties, nor do we use any other forms of off-balance sheet arrangements. Accordingly, our liquidity and capital resources are not subject to off-balance sheet risks from unconsolidated entities. As of
June 24, 2012
, we did not have any off-balance sheet arrangements, as defined in Item 303(a)(4)(ii) of SEC Regulation S-K.
We have entered into operating leases primarily for certain of our U.S. and international facilities in the normal course of business. These arrangements are often referred to as a form of off-balance-sheet financing. Future minimum lease payments under our operating leases as of
June 24, 2012
are detailed above in “Liquidity and Capital Resources” in the section entitled “Contractual Obligations.”
Critical Accounting Policies and Estimates
Our consolidated financial statements are prepared in accordance with U.S. GAAP. In the application of U.S. GAAP, we are required to make estimates that affect the reported amounts of assets, liabilities, revenues and expenses, and related disclosure of contingent assets and liabilities in our consolidated financial statements. Changes in the accounting estimates from period to period are reasonably likely to occur. Accordingly, actual results could differ significantly from the estimates made by management. To the extent that there are material differences between these estimates and actual results, our future financial statement presentation of our financial condition or results of operations may be affected.
On an ongoing basis, we evaluate our estimates, including those related to revenue recognition, valuation of stock based compensation, valuation of long-lived assets, tax related contingencies, valuation of inventories, warranties, other contingencies and litigation, among others. We base our estimates on historical experience and on various other assumptions, including expected trends, that are believed to be reasonable under the circumstances, the results of which form the basis for making judgments about the carrying values of assets and liabilities that are not readily apparent from other sources.
39
In addition to making critical accounting estimates, we must ensure that our financial statements are properly stated in accordance with U.S. GAAP. In many cases, the accounting treatment of a particular transaction is specifically dictated by U.S. GAAP and does not require a high degree of management judgment in its application, while in other cases, management’s judgment is required in selecting among available alternative accounting standards that allow different accounting treatment for similar transactions.
Our significant accounting policies are discussed in Note 2, “Basis of Presentation and Summary of Significant Accounting Policies,” to the consolidated financial statements included in Item 8 of this Annual Report. We believe that the following are our most critical accounting policies and estimates, each of which is critical to the portrayal of our financial condition and results of operations and requires our most difficult, subjective and complex judgments. Our management has reviewed our critical accounting policies and the related disclosures with the Audit Committee of our Board of Directors.
Revenue Recognition
We recognize product revenue when the earnings process is complete, as evidenced by persuasive evidence of an arrangement, typically in the form of a purchase order, when the sales price is fixed or determinable, collection of revenue is reasonably assured, and title and risk of loss have passed to the customer.
For the year ended
June 24, 2012
,
40%
of our product sales were made to distributors. Distributors stock inventory and sell our products to their own customer base, which may include: value added resellers; manufacturers who incorporate our products into their own manufactured goods; or ultimate end users of our products. We recognize revenue upon shipment of our products to our distributors. This arrangement is often referred to as a “sell-in” or “point-of-purchase” model as opposed to a “sell-through” or “point-of-sale” model, where revenue is deferred and not recognized until the distributor sells the product through to their customer.
Our distributors may be provided limited rights that allow them to return a portion of inventory (Product Exchange Rights or Stock Rotation Rights) and receive credits for changes in selling prices (Price Protection Rights) or other targeted sales incentives. When determining our net revenue, we make significant judgments and estimates corresponding with product shipments. We record a reserve for estimated future returns, changes in selling prices, and other targeted sales incentives when product ships. We also record an asset for the estimated value of product returns that we believe will be returned to inventory in the future and resold, and these estimates are based upon historical data, current economic trends, distributor inventory levels and other related factors. Our financial condition and operating results are dependent upon our ability to make reliable estimates. Actual results may vary and could have a significant impact on our operating results.
Warranties
Product warranties are estimated and recorded at the time we recognize revenue. The warranty periods range from
ninety
days to
ten
years. We estimate these warranty liabilities as a percentage of revenue, based on historical knowledge of warranty costs and expected future warranty costs. We evaluate our warranty reserve on a quarterly basis. If actual product failure rates materially differ from our estimates, revisions to the estimated warranty liability are recorded in the period in which they are determined.
Inventories
We write-down our inventory for estimated obsolescence equal to the difference between the cost of inventory and its estimated market value based upon an aging analysis of the inventory on hand, specifically known inventory-related risks (such as technological obsolescence), and assumptions about future demand. We also analyze sales levels by product type, including historical and estimated future customer demand for those products to determine if any additional reserves are appropriate. For example, we adjust for items that are considered obsolete based upon changes in customer demand, manufacturing process changes or new product introductions that may eliminate demand for the product. Any adjustment to our inventory as a result of an estimated obsolescence or net realizable condition is reflected as a component of our cost of sales. At the point of the loss recognition, a new, lower-cost basis for that inventory is established, and any subsequent improvements in facts and circumstances do not result in the restoration or increase in that newly established cost basis. We recorded charges for write-downs in inventory of
$14.7 million
,
$14.6 million
and
$16.2 million
, for fiscal
2012
,
2011
and
2010
, respectively.
40
In order to determine what costs can be included in the valuation of inventory, we determine normal capacity for our manufacturing facilities based on historical patterns. If our estimates regarding customer demand are inaccurate, or market conditions or technology change in ways that are less favorable than those projected by management, we may be required to take excess capacity charges in accordance with U.S. GAAP, which could have an adverse effect on our consolidated financial results.
Deferred Tax Asset Valuation Allowances
In assessing the adequacy of a recorded valuation allowance, we consider all positive and negative evidence and a variety of factors including historical and projected future taxable income and prudent and feasible tax planning strategies. When we establish or increase a valuation allowance, our income tax expense increases in the period such determination is made. If we decrease a valuation allowance, our income tax expense decreases in the period such a determination is made.
Tax Contingencies
We are subject to periodic audits of our income tax returns by federal, state and local agencies. The audits include questions regarding our tax filing positions, including the timing and amount of deductions and the allocation of income among various tax jurisdictions. In accordance with Financial Accounting Standards Board (FASB) Accounting Standards Codification Topic 740, “Income Taxes” (ASC 740), we regularly evaluate the exposures associated with our various tax filing positions. ASC 740 states that a tax benefit should not be recognized for financial statement purposes for an uncertain tax filing position where it is not more likely than not (likelihood of greater than 50%) for being sustained by the taxing authorities based on the technical merits of the position.
In accordance with the provisions of ASC 740, we have recorded unrecognized tax benefits (as a reduction to the deferred tax asset or as an increase to other liabilities) to remove some or all of the tax benefit of any of our tax positions at the time we determine that the positions become uncertain based upon one of the following: (1) the tax position is not “more likely than not” to be sustained, (2) the tax position is “more likely than not” to be sustained, but for a lesser amount, (3) the tax position is “more likely than not” to be sustained, but not in the financial period in which the tax position was originally taken. For purposes of evaluating whether or not a tax position is uncertain, (1) we presume the tax position will be examined by the relevant taxing authority that has full knowledge of all relevant information, (2) the technical merits of a tax position are derived from authorities such as legislation and statutes, legislative intent, regulations, rulings and case law and their applicability to the facts and circumstances of the tax position, and (3) each tax position is evaluated without considerations of the possibility of offset or aggregation with other tax positions taken. We adjust these unrecognized tax benefits, including any impact on the related interest and penalties, in light of changing facts and circumstances, such as the progress of a tax audit.
A number of years may elapse before a particular matter for which we have established an unrecognized tax benefit is audited and fully resolved. To the extent we prevail in matters for which we have recorded an unrecognized benefit or are required to pay amounts in excess of what we have recorded our effective tax rate in a given financial statement period could be materially affected. An unfavorable tax settlement might require use of our cash and/or result in an increase in our effective tax rate in the year of resolution. A favorable tax settlement would be recognized as a reduction in our effective tax rate in the year of resolution.
Accounting for Stock-Based Compensation
We account for awards of stock-based compensation under our employee stock-based compensation plans using the fair value method. Accordingly, we estimate the grant date fair value of our stock-based awards and amortize this fair value to compensation expense over the requisite service period or vesting term. We currently use the Black-Scholes option-pricing model to estimate the fair value of our stock option and ESPP awards. The determination of the fair value of stock-based awards on the date of grant using an option-pricing model is affected by our then current stock price as well as assumptions regarding a number of complex and subjective variables. These variables include the expected stock price volatility over the term of the awards, actual and projected employee stock option exercise behaviors, the risk-free interest rate and expected dividends.
Due to the inherent limitations of option-valuation models available today, including future events that are unpredictable and the estimation process utilized in determining the valuation of the stock-based awards, the ultimate value realized by award holders may vary significantly from the amounts expensed in our financial statements. For restricted stock and stock unit awards, grant date fair value is based upon the market price of our common stock on the date of the grant. This fair value is then amortized to compensation expense over the requisite service period or vesting term.
41
We estimate expected forfeitures at the time of grant and revise this estimate, if necessary, in subsequent periods if actual forfeitures differ from initial estimates. Our determination of an estimated forfeiture rate is primarily based upon a review of historical experience but may also include consideration of other facts and circumstances we believe are indicative of future activity. The assessment of an estimated forfeiture rate will not alter the total compensation expense to be recognized, only the timing of this recognition as compensation expense is adjusted to reflect instruments that actually vest.
If actual results are not consistent with our assumptions and judgments used in estimating key assumptions, we may be required to adjust compensation expense, which could be material to our results of operations.
Recoverability of Long-Lived Assets
Our assessment of the recoverability of long-lived assets involves significant judgment and estimation. These assessments reflect our assumptions, which, we believe, are consistent with the assumptions hypothetical marketplace participants use. Factors that we must estimate when performing recoverability and impairment tests include, among others, the economic life of the asset, sales volumes, prices, cost of capital, tax rates, and capital spending. These factors are often interdependent and therefore do not change in isolation.
We evaluate long-lived assets such as property, equipment and definite lived intangible assets, such as patents, for impairment whenever events or circumstances indicate that the carrying value of the assets recorded in our financial statements may not be recoverable. Factors that we consider include whether there has been a significant decrease in the market value of an asset, a significant change in the way an asset is being used, or a significant change, delay or departure in our strategy for that asset. If impairment is indicated, we first determine if the total estimated future cash flows on an undiscounted basis are less than the carrying amounts of the asset or assets. If so, an impairment loss is measured and recorded.
After an impairment loss is recognized, a new, lower cost basis for that long-lived asset is established. Subsequent changes in facts and circumstances do not result in the reversal of a previously recognized impairment loss.
Our impairment loss calculations require that we apply judgment in estimating future cash flows and asset fair values, including estimating useful lives of the assets. To make these judgments, we may use internal discounted cash flow estimates, quoted market prices when available and independent appraisals as appropriate to determine fair value.
If actual results are not consistent with our assumptions and judgments used in estimating future cash flows and asset fair values, we may be required to record additional impairment losses which could be material to our results of operations.
Goodwill
We test goodwill for impairment at least annually in the fiscal fourth quarter, or when indications of potential impairment exist. We monitor for the existence of potential impairment indicators throughout the fiscal year.
We conduct impairment testing for goodwill at the reporting unit level. Reporting units as defined by ASC 350 may be operating segments as a whole or an operation one level below an operating segment, referred to as a component. We have determined that our reporting units for fiscal
2012
are our
three
operating and reportable segments.
We may initiate goodwill impairment testing by considering qualitative factors to determine whether it is more likely than not that a reporting unit's carrying value is greater than its fair value. Such factors may include the following, among others: a significant decline in the reporting unit's expected future cash flows; a sustained, significant decline in our stock price and market capitalization; a significant adverse change in legal factors or in the business climate, unanticipated competition; and slower growth rates; as well as changes in management, key personnel, strategy, and/or customers. If our qualitative assessment reveals that goodwill impairment is more likely than not, we perform the two-step impairment test. Alternatively, we may bypass the qualitative test and initiate goodwill impairment testing with the first step of the two-step goodwill impairment test.
During the first step of the goodwill impairment test, we compare the fair value of the reporting unit to its carrying value, including goodwill. We derive a reporting unit's fair value through a combination of the market approach (a guideline transaction method) and the income approach (a discounted cash flow analysis). The income method cash flow analysis utilizes a discount rate from the capital asset pricing model. If all reporting units are analyzed during step 1 of the goodwill impairment test, their respective fair values are reconciled back to the Company's consolidated market capitalization.
42
If the fair value of a reporting unit exceeds its carrying value, then we conclude that no goodwill impairment has occurred. If the carrying value of the reporting unit exceeds its fair value, we perform the second step of the goodwill impairment test to measure possible goodwill impairment loss. During the second step, we hypothetically value the reporting unit's tangible and intangible assets and liabilities as if the reporting unit had been acquired in a business combination. Then, the implied fair value of the reporting unit's goodwill is compared to the carrying value of its goodwill. If the carrying value of the reporting unit's goodwill exceeds the implied fair value of the goodwill, we recognize an impairment loss in an amount equal to the excess, not to exceed the carrying value of the reporting unit's goodwill. Once an impairment loss is recognized, the adjusted carrying value of the goodwill becomes the new accounting basis of the goodwill for the reporting unit.
Indefinite Lived Intangible Assets
We test indefinite lived intangible assets for impairment at least annually in the fiscal fourth quarter, or when indications of potential impairment exist. We monitor for the existence of potential impairment indicators throughout the fiscal year.
Our impairment test may begin with a qualitative test to determine whether it is more likely than not that an
indefinite lived intangible
asset's carrying value is greater than its fair value.
If our qualitative assessment reveals that asset impairment is more likely than not, we perform a quantitative impairment test by
comparing the fair value of the
indefinite lived intangible asset
to its carrying value.
Alternatively, we may bypass the qualitative test and initiate impairment testing with the quantitative impairment test.
Determining the fair value of indefinite-lived intangible assets entails significant estimates and assumptions including, but not limited to, determining the timing and expected costs to complete development projects, estimating future cash flows from product sales, developing appropriate discount rates, estimating probability rates for the successful completion of development projects, continuation of customer relationships and renewal of customer contracts, and approximating the useful lives of the intangible assets acquired.
If the fair value of the indefinite lived intangible asset exceeds its carrying value, we conclude that no indefinite lived intangible asset impairment has occurred. If the carrying value of the indefinite lived intangible asset exceeds its fair value, we recognize an impairment loss in an amount equal to the excess, not to exceed the carrying value. Once an impairment loss is recognized, the adjusted carrying value becomes the new accounting basis of the indefinite lived intangible asset.
Contingent Liabilities
We provide for contingent liabilities in accordance with U.S. GAAP. In accordance with U.S. GAAP, a loss contingency is charged to income when (1) it is probable that an asset has been impaired or a liability has been incurred at the date of the financial statements, and (2) the amount of the loss can be reasonably estimated.
Periodically, we review the status of each significant matter to assess the potential financial exposure. If a potential loss is considered probable and the amount can be reasonably estimated, we reflect the estimated loss in our results of operations. Significant judgment is required to determine the probability that a liability has been incurred or an asset impaired and whether such loss is reasonably estimable. Because of uncertainties related to these matters, accruals are based on the best information available at the time. Further, estimates of this nature are highly subjective, and the final outcome of these matters could vary significantly from the amounts that may have been included in the accompanying consolidated financial statements. In determining the probability of an unfavorable outcome of a particular contingent liability and whether such liability is reasonably estimable, we consider the individual facts and circumstances related to the liability, opinions of legal counsel and recent legal rulings by the appropriate regulatory bodies, among other factors. As additional information becomes available, we reassesses the potential liability related to our pending claims and litigation and may revise our estimates accordingly. Such revisions in the estimates of the potential liabilities could have a material impact on our results of operations and financial position. See also a discussion of specific contingencies in Note 12, “Commitments and Contingencies,” to our consolidated financial statements in Item 8 of this Annual Report.
Recent Accounting Pronouncements
See Note 2, “Basis of Presentation and Summary of Significant Accounting Policies,” to our consolidated financial statements in Item 8 of this Annual Report for a description of recent accounting pronouncements, including the expected dates of adoption and estimated effects, if any, on our consolidated financial statements.
Item 7A.
Quantitative and Qualitative Disclosures About Market Risk
43
See the section entitled “Financial and Market Risks” included in “Management’s Discussion and Analysis of Financial Condition and Results of Operations” in Item 7 of this Annual Report.
44
Item 8.
Financial Statements and Supplementary Data
Index to Consolidated Financial Statements
|
|
Page
|
45
REPORT OF INDEPENDENT REGISTERED PUBLIC ACCOUNTING FIRM
The Board of Directors and Shareholders of Cree, Inc.
We have audited the accompanying consolidated balance sheets of Cree, Inc. as of
June 24, 2012
and
June 26, 2011
, and the related consolidated statements of income, shareholders’ equity, and cash flows for each of the three years in the period ended
June 24, 2012
. These financial statements are the responsibility of the Company’s management. Our responsibility is to express an opinion on these financial statements based on our audits.
We conducted our audits in accordance with the standards of the Public Company Accounting Oversight Board (United States). Those standards require that we plan and perform the audit to obtain reasonable assurance about whether the financial statements are free of material misstatement. An audit includes examining, on a test basis, evidence supporting the amounts and disclosures in the financial statements. An audit also includes assessing the accounting principles used and significant estimates made by management, as well as evaluating the overall financial statement presentation. We believe that our audits provide a reasonable basis for our opinion.
In our opinion, the financial statements referred to above present fairly, in all material respects, the consolidated financial position of Cree, Inc. at
June 24, 2012
and
June 26, 2011
, and the consolidated results of its operations and its cash flows for each of the three years in the period ended
June 24, 2012
, in conformity with U.S. generally accepted accounting principles.
We also have audited, in accordance with the standards of the Public Company Accounting Oversight Board (United States), Cree, Inc.’s internal control over financial reporting as of June 24, 2012, based on criteria established in Internal Control-Integrated Framework issued by the Committee of Sponsoring Organizations of the Treadway Commission and our report dated
August 21, 2012
expressed an unqualified opinion thereon.
|
/s/ Ernst & Young LLP
|
|
|
Raleigh, North Carolina
|
|
|
August 21, 2012
|
|
46
CREE, INC.
|
June 24,
2012 |
June 26,
2011 |
||||||
|
|
(Thousands, except par value)
|
||||||
|
ASSETS
|
|||||||
|
Current assets:
|
|||||||
|
Cash and cash equivalents
|
|
$178,885
|
|
|
$390,598
|
|
|
|
Short-term investments
|
565,628
|
|
695,199
|
|
|||
|
Total cash, cash equivalents, and short-term investments
|
744,513
|
|
1,085,797
|
|
|||
|
Accounts receivable, net
|
152,258
|
|
118,469
|
|
|||
|
Income tax receivable
|
—
|
|
6,796
|
|
|||
|
Inventories
|
188,849
|
|
176,482
|
|
|||
|
Deferred income taxes
|
21,744
|
|
17,857
|
|
|||
|
Prepaid expenses and other current assets
|
56,917
|
|
51,494
|
|
|||
|
Total current assets
|
1,164,281
|
|
1,456,895
|
|
|||
|
Property and equipment, net
|
582,461
|
|
555,929
|
|
|||
|
Intangible assets, net
|
376,075
|
|
102,860
|
|
|||
|
Goodwill
|
616,345
|
|
326,178
|
|
|||
|
Other assets
|
8,336
|
|
4,860
|
|
|||
|
Total assets
|
|
$2,747,498
|
|
|
$2,446,722
|
|
|
|
LIABILITIES AND SHAREHOLDERS’ EQUITY
|
|||||||
|
Current liabilities:
|
|||||||
|
Accounts payable, trade
|
|
$78,873
|
|
|
$76,593
|
|
|
|
Accrued salaries and wages
|
29,837
|
|
18,491
|
|
|||
|
Income taxes payable
|
3,834
|
|
15,493
|
|
|||
|
Other current liabilities
|
36,633
|
|
29,739
|
|
|||
|
Total current liabilities
|
149,177
|
|
140,316
|
|
|||
|
Long-term liabilities:
|
|||||||
|
Deferred income taxes
|
15,735
|
|
21,902
|
|
|||
|
Other long-term liabilities
|
22,695
|
|
22,940
|
|
|||
|
Total long-term liabilities
|
38,430
|
|
44,842
|
|
|||
|
Commitments and contingencies (Note 12)
|
|
|
|||||
|
Shareholders’ equity:
|
|||||||
|
Preferred stock, par value $0.01; 3,000 shares authorized at June 24, 2012 and June 26, 2011; none issued and outstanding
|
—
|
|
—
|
|
|||
|
Common stock, par value $0.00125; 200,000 shares authorized at June 24, 2012 and June 26, 2011; 115,906 and 109,607 shares issued and outstanding at June 24, 2012 and June 26, 2011, respectively
|
144
|
|
136
|
|
|||
|
Additional paid-in-capital
|
1,861,502
|
|
1,593,530
|
|
|||
|
Accumulated other comprehensive income, net of taxes
|
11,007
|
|
13,091
|
|
|||
|
Retained earnings
|
687,238
|
|
654,807
|
|
|||
|
Total shareholders’ equity
|
2,559,891
|
|
2,261,564
|
|
|||
|
Total liabilities and shareholders’ equity
|
|
$2,747,498
|
|
|
$2,446,722
|
|
|
The accompanying notes are an integral part of the consolidated financial statements.
47
CREE, INC.
|
|
Fiscal Years Ended
|
||||||||||
|
|
June 24,
2012 |
June 26,
2011 |
June 27,
2010 |
||||||||
|
|
(Thousands, except per share data)
|
||||||||||
|
Revenue, net
|
|
$1,164,658
|
|
|
$987,615
|
|
|
$867,287
|
|
||
|
Cost of revenue, net
|
755,196
|
|
551,842
|
|
456,180
|
|
|||||
|
Gross profit
|
409,462
|
|
435,773
|
|
411,107
|
|
|||||
|
Operating expenses:
|
|||||||||||
|
Research and development
|
143,357
|
|
115,035
|
|
81,407
|
|
|||||
|
Sales, general and administrative
|
197,092
|
|
139,304
|
|
115,601
|
|
|||||
|
Amortization of acquisition related intangibles
|
26,274
|
|
10,776
|
|
12,180
|
|
|||||
|
Loss on disposal or impairment of long-lived assets
|
3,481
|
|
1,952
|
|
4,141
|
|
|||||
|
Total operating expenses
|
370,204
|
|
267,067
|
|
213,329
|
|
|||||
|
Operating income
|
39,258
|
|
168,706
|
|
197,778
|
|
|||||
|
Non-operating income:
|
|||||||||||
|
Other non-operating income, net
|
932
|
|
993
|
|
294
|
|
|||||
|
Interest income, net
|
7,457
|
|
8,528
|
|
7,400
|
|
|||||
|
Income before income taxes
|
47,647
|
|
178,227
|
|
205,472
|
|
|||||
|
Income tax expense
|
3,235
|
|
31,727
|
|
53,182
|
|
|||||
|
Net income
|
|
$44,412
|
|
|
$146,500
|
|
|
$152,290
|
|
||
|
Earnings per share:
|
|||||||||||
|
Basic
|
|
$0.39
|
|
|
$1.35
|
|
|
$1.49
|
|
||
|
Diluted
|
|
$0.39
|
|
|
$1.33
|
|
|
$1.45
|
|
||
|
Shares used in per share calculation:
|
|||||||||||
|
Basic
|
114,693
|
|
108,522
|
|
102,371
|
|
|||||
|
Diluted
|
115,225
|
|
110,035
|
|
104,698
|
|
|||||
The accompanying notes are an integral part of the consolidated financial statements.
48
CREE, INC.
|
|
Fiscal Years Ended
|
||||||||||
|
|
June 24,
2012 |
June 26,
2011 |
June 27,
2010 |
||||||||
|
(In thousands)
|
|||||||||||
|
Cash flows from operating activities:
|
|
|
|
||||||||
|
Net income
|
|
$44,412
|
|
|
$146,500
|
|
|
$152,290
|
|
||
|
Adjustments to reconcile net income to net cash provided by operating activities
|
|
|
|
|
|
|
|||||
|
Depreciation and amortization
|
142,709
|
|
108,605
|
|
90,424
|
|
|||||
|
Stock-based compensation
|
46,393
|
|
38,240
|
|
24,067
|
|
|||||
|
Excess tax benefit from share-based payment arrangements
|
(277
|
)
|
(10,141
|
)
|
(21,722
|
)
|
|||||
|
Loss on disposal or impairment of long-lived assets
|
3,481
|
|
1,952
|
|
4,141
|
|
|||||
|
Amortization of premium/discount on investments, net
|
8,330
|
|
15,696
|
|
9,502
|
|
|||||
|
Deferred income taxes
|
(6,425
|
)
|
(16,308
|
)
|
(11,046
|
)
|
|||||
|
Changes in operating assets and liabilities:
|
|
|
|
|
|
|
|||||
|
Accounts receivable
|
(9,365
|
)
|
(963
|
)
|
(14,555
|
)
|
|||||
|
Inventories
|
26,904
|
|
(63,450
|
)
|
(33,129
|
)
|
|||||
|
Prepaid expenses and other assets
|
(931
|
)
|
(17,090
|
)
|
(18,084
|
)
|
|||||
|
Accounts payable, trade
|
(10,105
|
)
|
18,442
|
|
15,717
|
|
|||||
|
Accrued salaries and wages and other liabilities
|
(2,846
|
)
|
29,897
|
|
52,964
|
|
|||||
|
Net cash provided by operating activities
|
242,280
|
|
251,380
|
|
250,569
|
|
|||||
|
Cash flows from investing activities:
|
|
|
|
|
|
|
|||||
|
Purchases of property and equipment
|
(95,015
|
)
|
(237,085
|
)
|
(168,624
|
)
|
|||||
|
Payment of COTCO contingent consideration
|
—
|
|
—
|
|
(57,050
|
)
|
|||||
|
Payment of LLF contingent consideration
|
—
|
|
(13,159
|
)
|
(8,773
|
)
|
|||||
|
Purchases of investments
|
(345,457
|
)
|
(382,520
|
)
|
(660,823
|
)
|
|||||
|
Proceeds from maturities of investments
|
186,425
|
|
252,603
|
|
121,808
|
|
|||||
|
Proceeds from sale of property and equipment
|
252
|
|
205
|
|
228
|
|
|||||
|
Proceeds from sale of available-for-sale investments
|
277,463
|
|
89,474
|
|
19,120
|
|
|||||
|
Purchase of Ruud Lighting, net of cash acquired
|
(454,605
|
)
|
—
|
|
—
|
|
|||||
|
Purchases of patent and licensing rights
|
(17,204
|
)
|
(12,752
|
)
|
(9,273
|
)
|
|||||
|
Net cash used in investing activities
|
(448,141
|
)
|
(303,234
|
)
|
(763,387
|
)
|
|||||
|
Cash flows from financing activities:
|
|
|
|
|
|
|
|||||
|
Net proceeds from issuance of common stock
|
5,012
|
|
34,405
|
|
598,077
|
|
|||||
|
Excess tax benefit from share-based payment arrangements
|
277
|
|
10,141
|
|
21,722
|
|
|||||
|
Repurchases of common stock
|
(11,981
|
)
|
—
|
|
—
|
|
|||||
|
Net cash (used in)/provided by financing activities
|
(6,692
|
)
|
44,546
|
|
619,799
|
|
|||||
|
Effect of foreign exchange changes on cash and cash equivalents
|
840
|
|
475
|
|
296
|
|
|||||
|
Net (decrease)/increase in cash and cash equivalents
|
(211,713
|
)
|
(6,833
|
)
|
107,277
|
|
|||||
|
Cash and cash equivalents:
|
|
|
|
||||||||
|
Beginning of period
|
390,598
|
|
397,431
|
|
290,154
|
|
|||||
|
End of period
|
|
$178,885
|
|
|
$390,598
|
|
|
$397,431
|
|
||
|
Supplemental disclosure of cash flow information:
|
|
|
|
||||||||
|
Cash paid for income taxes
|
|
$17,984
|
|
|
$31,201
|
|
|
$33,441
|
|
||
The accompanying notes are an integral part of the consolidated financial statements.
49
CREE, INC.
CONSOLIDATED STATEMENTS OF SHAREHOLDERS’ EQUITY
|
|
Common Stock
|
Additional
Paid-in
Capital
|
Retained
Earnings
|
Accumulated
Other
Comprehensive
Income
|
Total
Shareholders’
Equity
|
|||||||||||||||||
|
|
Number
of Shares
|
Par Value
|
||||||||||||||||||||
|
|
(In thousands)
|
|||||||||||||||||||||
|
Balance at June 28, 2009
|
89,659
|
|
|
$112
|
|
|
$857,383
|
|
|
$356,017
|
|
|
$11,236
|
|
|
$1,224,748
|
|
|||||
|
Net income
|
—
|
|
—
|
|
—
|
|
152,290
|
|
—
|
|
152,290
|
|
||||||||||
|
Currency translation gain/(loss)
|
—
|
|
—
|
|
—
|
|
—
|
|
—
|
|
—
|
|
||||||||||
|
Unrealized gain on available-for-sale securities, net of tax of $591
|
—
|
|
—
|
|
—
|
|
—
|
|
935
|
|
935
|
|
||||||||||
|
Comprehensive income
|
153,225
|
|
||||||||||||||||||||
|
Income tax benefits from stock option exercises
|
—
|
|
—
|
|
28,810
|
|
—
|
|
—
|
|
28,810
|
|
||||||||||
|
Repurchased shares
|
—
|
|
—
|
|
—
|
|
—
|
|
—
|
|
—
|
|
||||||||||
|
Stock-based compensation
|
—
|
|
—
|
|
24,271
|
|
—
|
|
—
|
|
24,271
|
|
||||||||||
|
Exercise of stock options and issuance of shares
|
18,343
|
|
23
|
|
596,971
|
|
—
|
|
—
|
|
596,994
|
|
||||||||||
|
Balance at June 27, 2010
|
108,002
|
|
|
$135
|
|
|
$1,507,435
|
|
|
$508,307
|
|
|
$12,171
|
|
|
$2,028,048
|
|
|||||
|
Net income
|
—
|
|
—
|
|
—
|
|
146,500
|
|
—
|
|
146,500
|
|
||||||||||
|
Currency translation gain/(loss)
|
—
|
|
—
|
|
—
|
|
—
|
|
—
|
|
—
|
|
||||||||||
|
Unrealized gain on available-for-sale securities, net of tax of $558
|
—
|
|
—
|
|
—
|
|
—
|
|
920
|
|
920
|
|
||||||||||
|
Comprehensive income
|
147,420
|
|
||||||||||||||||||||
|
Income tax benefits from stock option exercises
|
—
|
|
—
|
|
7,865
|
|
—
|
|
—
|
|
7,865
|
|
||||||||||
|
Repurchased shares
|
—
|
|
—
|
|
—
|
|
—
|
|
—
|
|
—
|
|
||||||||||
|
Stock-based compensation
|
—
|
|
—
|
|
39,061
|
|
—
|
|
—
|
|
39,061
|
|
||||||||||
|
Exercise of stock options and issuance of shares
|
1,605
|
|
1
|
|
39,169
|
|
—
|
|
—
|
|
39,170
|
|
||||||||||
|
Balance at June 26, 2011
|
109,607
|
|
|
$136
|
|
|
$1,593,530
|
|
|
$654,807
|
|
|
$13,091
|
|
|
$2,261,564
|
|
|||||
|
Net income
|
—
|
|
—
|
|
—
|
|
44,412
|
|
—
|
|
44,412
|
|
||||||||||
|
Currency translation gain/(loss)
|
—
|
|
—
|
|
—
|
|
—
|
|
(335
|
)
|
(335
|
)
|
||||||||||
|
Unrealized loss on available-for-sale securities, net of tax of $1,059
|
—
|
|
—
|
|
—
|
|
—
|
|
(1,749
|
)
|
(1,749
|
)
|
||||||||||
|
Comprehensive income
|
42,328
|
|
||||||||||||||||||||
|
Income tax benefits from stock option exercises
|
—
|
|
—
|
|
(354
|
)
|
—
|
|
—
|
|
(354
|
)
|
||||||||||
|
Repurchased shares
|
(521
|
)
|
—
|
|
(856
|
)
|
(11,981
|
)
|
—
|
|
(12,837
|
)
|
||||||||||
|
Stock-based compensation
|
—
|
|
—
|
|
45,784
|
|
—
|
|
—
|
|
45,784
|
|
||||||||||
|
Exercise of stock options and issuance of shares
|
6,820
|
|
8
|
|
223,398
|
|
—
|
|
—
|
|
223,406
|
|
||||||||||
|
Balance at June 24, 2012
|
115,906
|
|
|
$144
|
|
|
$1,861,502
|
|
|
$687,238
|
|
|
$11,007
|
|
|
$2,559,891
|
|
|||||
The accompanying notes are an integral part of the consolidated financial statements.
50
CREE, INC.
NOTES TO CONSOLIDATED FINANCIAL STATEMENTS
Cree, Inc. (the “Company”) is a leading innovator of lighting-class light emitting diode (LED) products, lighting products and semiconductor products for power and radio-frequency (RF) applications. The Company's products are targeted for applications such as indoor and outdoor lighting, video displays, transportation, electronic signs and signals, power supplies, solar inverters and wireless systems.
The Company develops and manufactures semiconductor materials and devices primarily based on silicon carbide (SiC), gallium nitride (GaN) and related compounds. The physical and electronic properties of SiC and GaN offer technical advantages over traditional silicon, gallium arsenide (GaAs) and other materials used for electronic and opto-electronic applications.
The Company's LED products consist of LED components, LED chips, and SiC wafers. As LED technology improves, the Company believes the potential market for LED lighting will continue to expand. The Company's success in selling LED products depends upon the ability to offer innovative products and solutions that enable its customers to develop and market LED based products that successfully compete and drive LED adoption against traditional lighting products.
The Company's lighting products consist of both LED and traditional lighting systems. The Company designs, manufactures and sells lighting systems for indoor and outdoor applications, with a primary focus on LED lighting systems for the commercial and industrial markets. The Company also uses its LED systems expertise to accelerate LED lighting adoption and expand the market for its LED components.
In addition, the Company develops, manufactures and sells power and RF devices. The Company's power products are made from SiC and provide faster switching speeds than comparable silicon-based power devices for a given power level. The Company's RF devices are made from GaN and produce higher power densities as compared to silicon or gallium arsenide.
The majority of the Company's products are manufactured at its production facilities located in North Carolina, Wisconsin, and China. The Company also uses contract manufacturers for certain aspects of product fabrication, assembly and packaging. The Company operates research and development facilities in North Carolina, California, Wisconsin, and China.
Cree, Inc. is a North Carolina corporation established in 1987.
As of
June 24, 2012
, the Company has
three
reportable segments:
|
•
|
LED Products
|
|
•
|
Lighting Products
|
|
•
|
Power and RF Products
|
Reportable segments are components of an entity that have separate financial data that the entity's Chief Operating Decision Maker (CODM) regularly reviews when allocating resources and assessing performance. The Company's CODM is the Chief Executive Officer.
For financial results by reportable segment, please refer to Note 13, "Reportable Segments."
Principles of Consolidation
The consolidated financial statements include the accounts of the Company, and its wholly owned subsidiaries. All material intercompany accounts and transactions have been eliminated in consolidation.
51
Fiscal Year
The Company’s fiscal year is a
52
or
53
-week period ending on the last Sunday in the month of June. The Company’s
2012
fiscal year extended from
June 27, 2011
to
June 24, 2012
and was a
52
-week fiscal year. The Company’s
2011
fiscal year extended from
June 28, 2010
to
June 26, 2011
and was a
52
-week fiscal year. The Company’s
2010
fiscal year extended from
June 29, 2009
to
June 27, 2010
and was a
52
-week fiscal year. The Company’s
2013
fiscal year will extend from
June 25, 2012
to
June 30, 2013
and will be a
53
-week fiscal year.
Reclassifications
Certain prior period amounts in the accompanying consolidated financial statements have been reclassified to conform to the current year presentation. These reclassifications had no effect on previously reported net income or shareholders’ equity.
Use of Estimates
The preparation of consolidated financial statements in conformity with accounting principles generally accepted in the United States of America (“U.S. GAAP”) requires management to make estimates and assumptions that affect the reported amounts of assets, liabilities, revenues and expenses, and the disclosure of contingent assets and liabilities. On an ongoing basis, the Company evaluates its estimates, including those related to revenue recognition, provision for doubtful accounts, sales returns, sales price discounts and incentives, provision for inventory obsolescence, fair value of investments, fair value of acquired intangible assets and goodwill, useful lives of intangible assets and property and equipment, income taxes, product warranty obligations, employee stock options, and contingencies and litigation, among others. The Company generally bases its estimates on historical experience and on various other assumptions that are believed to be reasonable under the circumstances, the results of which form the basis for making judgments about the carrying values of assets and liabilities that are not readily apparent from other sources. Actual amounts recorded could differ materially from those estimates.
Segment Information
The Company follows U.S. GAAP with respect to disclosures regarding reportable segments. U.S. GAAP requires segmentation based on an entity’s internal organization and reporting of revenue and operating income based upon internal accounting methods commonly referred to as the “management approach.” Operating segments are defined as components of an enterprise about which separate financial information is available that is evaluated regularly by the chief operating decision maker, or decision making group, in deciding how to allocate resources and in assessing performance. The Company’s chief operating decision maker is its Chief Executive Officer. The Company has determined that it currently has
three
reportable segments.
Cash and Cash Equivalents
Cash and cash equivalents consist of unrestricted cash accounts and highly liquid investments with an original maturity of three months or less when purchased. Cash and cash equivalents are carried at cost, which approximates fair value. The Company holds cash and cash equivalents at several major financial institutions, which often exceed insurance limits set by the Federal Deposit Insurance Corporation (“FDIC”). The Company has not historically experienced any losses due to such concentration of credit risk.
Investments
Investments in certain securities may be classified into three categories:
|
•
|
Held-to-Maturity – Debt securities that the entity has the positive intent and ability to hold to maturity, which are reported at amortized cost.
|
|
•
|
Trading Securities – Debt and equity securities that are bought and held principally for the purpose of selling in the near term, which are reported at fair value, with unrealized gains and losses included in earnings.
|
|
•
|
Available-for-Sale – Debt and equity securities not classified as either securities held-to-maturity or trading securities, which are reported at fair value with unrealized gains or losses excluded from earnings and reported as a separate component of shareholders’ equity.
|
52
The Company reassesses the appropriateness of the classification (i.e. held-to-maturity, trading securities, or available-for-sale) of its investments at the end of each reporting period.
When the fair value of an investment declines below its original cost, the Company considers all available evidence to evaluate whether the decline is other-than-temporary. Among other things, the Company considers the duration and extent of the decline and economic factors influencing the capital markets. For the fiscal years ended
June 24, 2012
,
June 26, 2011
, and
June 27, 2010
, the Company has had no other-than-temporary declines below the cost basis of its investments. The Company utilizes specific identification in computing realized gains and losses on the sale of investments. Realized gains and losses on investments are reported in other income and expense.
Investments in marketable securities with maturities beyond one year may be classified as short term based on their highly liquid nature and because such marketable securities represent the investment of cash that is available for current operations.
Inventories
Inventories are valued at the lower of cost or market value, with cost being determined on the first-in, first-out (“FIFO”) method or the average cost method. The Company writes down its inventory balances for estimates of excess and obsolete amounts. These write-downs are recorded as a component of cost of sales. At the point of the write-down, a new lower-cost basis for that inventory is established, and any subsequent improvements in facts and circumstances do not result in the restoration or increase in that newly established lower cost basis. The Company recorded charges for write-downs in inventory of
$14.7 million
,
$14.6 million
and
$16.2 million
, for fiscal
2012
,
2011
and
2010
, respectively.
Property and Equipment
Property and equipment are recorded at cost and depreciated on a straight-line basis over the assets’ estimated useful lives. Leasehold improvements are amortized over the lesser of the asset life or the life of the related lease. In general, the Company's policy for useful lives is as follows:
|
Manufacturing equipment
|
|
3 to 5 years
|
|
|
Buildings and building improvements
|
|
5 to 40 years
|
|
|
Furniture and office equipment
|
|
3 to 5 years
|
|
|
Aircraft and vehicles
|
5 to 20 years
|
||
|
Leasehold improvements
|
|
Shorter of estimated useful life or lease term
|
|
Expenditures for repairs and maintenance are charged to expense as incurred. The costs for major renewals and improvements are capitalized and depreciated over their estimated useful lives. The cost and related accumulated depreciation of the assets are removed from the accounts upon disposition and any resulting gain or loss is reflected in operating income.
Shipping and Handling Costs
Shipping and handling costs are included in cost of revenues and are recognized as a period expense during the period in which they are incurred.
Goodwill and Intangible Assets
The Company records the assets acquired and liabilities assumed in business combinations at their respective fair values at the date of acquisition, with any excess purchase price recorded as goodwill. Valuation of intangible assets and in-process research and development entails significant estimates and assumptions including, but not limited to, determining the timing and expected costs to complete development projects, estimating future cash flows from product sales, developing appropriate discount rates, estimating probability rates for the successful completion of development projects, conti
nuation of customer relationships and renewal of customer contracts, and approximating the useful lives of the intangible assets acquired.
53
Goodwill
The Company recognizes goodwill as an asset representing the future economic benefits arising from other assets acquired in a business combination that are not individually identified and separately recognized. The Company tests goodwill for impairment annually in the fiscal fourth quarter, or when indications of potential impairment exist. The Company monitors the existence of potential impairment indicators throughout the fiscal year.
The Company conducts impairment testing for goodwill at the reporting unit level. Reporting units as defined by ASC 350 may be operating segments as a whole or an operation one level below an operating segment, referred to as a component. We have determined that our reporting units for fiscal
2012
are our
three
operating and reportable segments.
The Company may initiate goodwill impairment testing by considering qualitative factors to determine
whether it is more likely than not that a reporting unit's carrying value is greater than its fair value.
Such factors may include the following, among others: a significant decline in the reporting unit's expected future cash flows; a sustained, significant decline in the Company's stock price and market capitalization; a significant adverse change in legal factors or in the business climate; unanticipated competition; and slower growth rates as well as
changes in management, key personnel, strategy, and/or customers
.
If the Company's qualitative assessment reveals that goodwill impairment is more likely than not, the Company performs the two-step goodwill impairment test. Alternatively, the Company may bypass the qualitative test and initiate goodwill impairment testing with the first step of the two-step goodwill impairment test.
During the first step of the goodwill impairment test, the Company compares the fair value of the reporting unit to its carrying value, including goodwill. The Company derives a reporting unit's fair value through a combination of the market approach (a guideline transaction method) and the income approach (a discounted cash flow analysis). The income method cash flow analysis utilizes a discount rate from the capital asset pricing model. If all reporting units are analyzed during step 1 of the goodwill impairment test, their respective fair values are reconciled back to the Company's consolidated market capitalization.
If the fair value of a reporting unit exceeds its carrying value, then the Company concludes that no goodwill impairment has occurred. If the carrying value of the reporting unit exceeds its fair value, the Company performs the second step of the goodwill impairment test to measure possible goodwill impairment loss. During the second step, the Company hypothetically values the reporting unit's tangible and intangible assets and liabilities as if the reporting unit had been acquired in a business combination. Then, the implied fair value of the reporting unit's goodwill is compared to the carrying value of its goodwill. If the carrying value of the reporting units goodwill exceeds the implied fair value of the goodwill, the Company recognizes an impairment loss in an amount equal to the excess, not to exceed the carrying value of the reporting unit's goodwill. Once an impairment loss is recognized, the adjusted carrying value of the goodwill becomes the new accounting basis of the goodwill for the reporting unit.
Indefinite-Lived Intangible Assets
The Company's indefinite-lived intangible assets are comprised of trade names as a result of the Ruud Lighting acquisition. These are tested for impairment annually in the fiscal fourth quarter, or when events or changes in circumstances indicate potential impairment may exist. The Company monitors the existence of potential impairment indicators throughout the fiscal year.
The Company initiates the impairment analysis with a qualitative test to determine whether it is more likely than not that an
indefinite lived intangible
asset's carrying value is greater than its fair value.
If the Company's qualitative assessment reveals that asset impairment is more likely than not, the Company performs a quantitative impairment test by
comparing the fair value of the
indefinite lived intangible asset
to its carrying value. Fair value reflects the price a market participant would be willing to pay in a potential sale of the asset.
Valuation of indefinite-lived intangible assets entails significant estimates and assumptions including, but not limited to, determining the timing and expected costs to complete development projects, estimating future cash flows from product sales, developing appropriate discount rates, estimating probability rates for the successful completion of development projects, continuation of customer relationships and renewal of customer contracts, and approximating the useful lives of the intangible assets acquired.
If the fair value of the indefinite lived intangible asset exceeds its carrying value, then the Company concludes that no indefinite lived intangible asset impairment has occurred. If the carrying value of the indefinite lived intangible asset exceeds its fair value, the Company records an impairment loss in an amount equal to the excess, not to exceed the carrying value. Once an impairment loss is recognized, the adjusted carrying value becomes the new accounting basis of the indefinite lived intangible asset.
54
In-Process Research and Development
The Company acquired in-process research and development ("IPR&D") as a result of the Ruud Lighting acquisition. The Company determines the fair value of IPR&D acquired in a business combination based on the present value of each project's projected cash flows using an income approach. IPR&D is initially capitalized and considered to be indefinite-lived assets subject to annual impairment reviews or more often upon the occurrence of certain events. If the fair value of the intangible assets is less than its carrying value, an impairment loss is recognized for the difference.
When the IPR&D project is complete, it is reclassified as an amortizable purchased intangible asset and is amortized over its estimated useful life. If an IPR&D project is abandoned, the Company records an impairment loss for the value of the related intangible asset in the period it is abandoned.
Other Intangible Assets
U.S. GAAP requires that intangible assets, other than goodwill and indefinite-lived intangibles, must be amortized over their useful lives. The Company is currently amortizing its acquired intangible assets with finite lives over periods ranging from
one
to
twenty years
.
Patent rights reflect costs incurred by the Company in applying for and maintaining patents owned by the Company and costs incurred in purchasing patents and related rights from third parties. License rights reflect costs incurred by the Company in acquiring licenses under patents owned by others. The Company amortizes both on a straight-line basis over the expected useful life of the associated patent rights, which is generally the lesser of
20
years from the date of the patent application or the license period. Royalties payable under licenses for patents owned by others are expensed as incurred. The Company reviews its capitalized patent portfolio and records impairment charges when circumstances warrant, such as when patents have been abandoned or are no longer being pursued.
Impairment of Long-Lived Assets
The Company reviews long-lived assets such as property and equipment for impairment based on changes in circumstances that indicate their carrying amounts may not be recoverable. In making these determinations, the Company uses certain assumptions, including but not limited to: (1) estimations of the fair market value of the assets, and (2) estimations of future cash flows expected to be generated by these assets, which are based on additional assumptions such as asset utilization, length of service the asset will be used in the Company’s operations and estimated salvage values.
Contingent Liabilities
The Company provides for contingent liabilities when (1) it is probable that an asset has been impaired or a liability has been incurred at the date of the financial statements; and, (2) the amount of the loss can be reasonably estimated. Disclosure in the notes to the financial statements is required for loss contingencies that do not meet both these conditions if there is a reasonable possibility that a loss may have been incurred. See Note 12, “Commitments and Contingencies,” for a discussion of loss contingencies in connection with pending and threatened litigation. The Company expenses as incurred the costs of defending legal claims against the Company.
Revenue Recognition
The Company recognizes product revenue when the earnings process is complete, as evidenced by persuasive evidence of an arrangement, typically in the form of a purchase order, when the sales price is fixed or determinable, collection of revenue is reasonably assured, and title and risk of loss have passed to the customer.
The Company provides its customers with limited rights of return for non-conforming shipments and product warranty claims. The Company estimates an allowance for anticipated sales returns based upon an analysis of historical sales returns and other relevant data. The Company records an allowance at the time of sale, which is recorded as a reduction of product revenue and as a reduction to the related accounts receivable balance.
A substantial portion of the Company’s products are sold through distributors. Distributors stock inventory and sell the Company’s products to their own customer base, which may include: value added resellers; manufacturers who incorporate the Company’s products into their own manufactured goods; or ultimate end users of the Company’s products. The Company recognizes revenue under the same terms as described. Certain of the Company’s distributors are provided limited rights that
55
allow them to return a portion of inventory (Product Exchange Rights or Stock Rotation Rights) and receive credits for changes in selling prices (Price Protection Rights) and targeted customer pricing arrangements under the Company's “ship and debit” program. These estimates are calculated based upon historical experience, product shipment analysis, current economic conditions, on-hand inventory at the distributor, and customer contractual arrangements. The Company believes that it can reasonably and reliably estimate the allowance for distributor credits at the time of sale. Accordingly, estimates for these rights are recorded at the time of sale as a reduction of product revenue and as a reduction to the related accounts receivable balance.
On occasion, the Company will issue a new price book for its product, at which time the Company will provide a credit to certain distributors for inventory quantities on hand if required by the Company’s agreement with the distributor. This practice is known as price protection. These credits are applied against the reserve that the Company establishes upon initial shipment of product to the distributor.
Under the ship and debit program, products are sold to distributors at negotiated prices and the distributors are required to pay for product within the Company’s standard commercial terms. Subsequent to the initial product purchase, a distributor may request a price allowance for a particular part number(s) for certain target customers, prior to the distributor reselling the particular part. Once the Company has approved an allowance and the distributor resells the product to the target customer, the Company credits the distributor according to the allowance approved. These credits are applied against a reserve the Company establishes upon initial shipment of product to the distributor.
In addition, the Company periodically runs sales incentive programs with certain of its distributors and resellers, such as product rebates and cooperative advertising campaigns. The Company recognizes these incentives at the time they are offered for consideration given to customers, and records a credit to the customer’s account and offsetting expense as either a reduction to revenue, increase to cost of sales, or marketing expense depending on the type of sales incentive.
From time to time, the Company may enter into licensing arrangements related to its intellectual property. Revenue from licensing arrangements is recognized when earned and estimable. The timing of revenue recognition is dependent on the terms of each license agreement. Generally, the Company will recognize non-refundable upfront license fees related to patent licenses immediately upon receipt of the funds if the Company has no significant future obligations to perform under the arrangement. However, the Company will defer recognition for licensing fees where the Company has significant future performance requirements, the fee is not fixed (such as royalties earned as a percentage of future sales), or the fees are otherwise contingent.
Accounts Receivable
For product sales, the Company typically invoices its customers at the time of shipment for the sales order value of products shipped. For contract revenue, invoicing occurs based upon the terms of the specific research contract, typically one month in arrears for services rendered and any other allowable direct costs. Accounts receivable are recorded at the invoiced amount and are not subject to any interest or finance charges. The Company does not have any off-balance sheet credit exposure related to any of its customers.
Allowance for Doubtful Accounts
The Company evaluates the collectability of accounts receivable based on a combination of factors. In cases where the Company becomes aware of circumstances that may impair a specific customer’s ability to meet its financial obligations subsequent to the original sale, the Company will record an allowance against amounts due, and thereby reduce the net recognized receivable to the amount the Company reasonably believes will be collected. For all other customers, the Company recognizes an allowance for doubtful accounts based on the length of time the receivables are past due and consideration of other factors such as industry conditions, the current business environment and the Company's historical experience.
Advertising
The Company expenses the costs of producing advertisements at the time production occurs and expenses the cost of communicating the advertising in the period in which the advertising is used. Advertising costs are included in selling, general and administrative expenses and amounted to approximately
$9.7 million
,
$5.7 million
, and
$4.2 million
for the years ended
June 24, 2012
,
June 26, 2011
and
June 27, 2010
, respectively.
56
Research and Development
Research and development activities are expensed when incurred. For contracts under which the Company anticipates that direct costs will exceed amounts to be funded over the life of the contract, costs are reported as research and development expenses when incurred, and related funding as an offset of those expenses when funds are received.
Earnings Per Share
Basic earnings per share is computed by dividing net income by the weighted average number of shares of common stock outstanding for the applicable period. Diluted earnings per share is determined in the same manner as basic earnings per share except that the number of shares is increased to assume exercise of potentially dilutive stock options, non-vested restricted stock and contingently issuable shares using the treasury stock method, unless the effect of such increases would be anti-dilutive. Under the treasury stock method, the amount the employee must pay for exercising stock options, the amount of compensation cost for future service that the Company has not yet recognized, and the amount of tax benefits that would be recorded in additional paid-in capital when the award becomes deductible are assumed to be used to repurchase shares.
Accounting for Stock-Based Compensation
The Company recognizes compensation expense for all share-based payments granted based on the fair value of the shares on the date of grant. Compensation expense is then recognized over the award’s vesting period.
Fair Value of Financial Instruments
The carrying amounts of cash and cash equivalents, available-for-sale securities, accounts and interest receivable, accounts payable and other liabilities approximate their fair values at
June 24, 2012
and
June 26, 2011
due to the short-term nature of these instruments.
Taxes
The Company uses the asset and liability method of accounting for income taxes. Under this method, deferred tax assets and liabilities are recognized for the estimated future tax consequences attributable to differences between the carrying amounts of existing assets and liabilities and their respective tax bases. Deferred tax assets are recognized for deductible temporary differences, along with net operating loss carryforwards and credit carryforwards, if it is more likely than not that the tax benefits will be realized. To the extent a deferred tax asset cannot be recognized under the preceding criteria, allowances are established. Deferred tax assets and liabilities are measured using enacted tax rates in effect for the year in which those temporary differences are expected to be recovered or settled.
Taxes payable which are not based on income are accrued ratably over the period to which they apply. For example, payroll taxes are accrued each period end based upon the amount of payroll taxes that are owed as of that date; whereas taxes such as property taxes and franchise taxes are accrued over the fiscal year to which they apply if paid at the end of a period, or they are amortized ratably over the fiscal year if they are paid in advance.
Foreign Currency Translation
In the first quarter of fiscal 2012, the Company acquired
two
foreign subsidiaries as part of the Ruud Lighting acquisition that have a non-U.S. dollar functional currency. Accordingly, foreign currency translation adjustments have been recorded through accumulated other comprehensive income (loss) in fiscal 2012 for changes between the foreign subsidiaries' functional currency and the U.S. dollar. There were no translation adjustments recorded through accumulated other comprehensive income (loss) for fiscal years 2011 and 2010. In addition, historical foreign currency translation gains and losses incurred prior to fiscal 2010 will continue to exist in the Company’s equity account balance of Accumulated Other Comprehensive Income, along with the amounts recorded in fiscal 2012, until such time that the subsidiaries are either sold or substantially liquidated.
Because the Company and its subsidiaries transact business in currencies other than the U.S. Dollar, the Company will continue to experience varying amounts of foreign currency exchange gains and losses for subsidiaries with U.S. dollar functional currency.
57
Recently Adopted Accounting Pronouncements
Fair Value Disclosures
In January 2010, the FASB issued amended standards requiring additional fair value disclosures. The amended standards require disclosures of transfers in and out of Levels 1 and 2 of the fair value hierarchy, as well as requiring gross basis disclosures for purchases, sales, issuances and settlements within the Level 3 reconciliation. Additionally, the update clarifies the requirement to determine the level of disaggregation for fair value measurement disclosures and to disclose valuation techniques and inputs used for both recurring and nonrecurring fair value measurements in either Level 2 or Level 3. The Company adopted the new guidance regarding transfers in and out of Levels 1 and 2 of the hierarchy in the third quarter of fiscal 2010, and the disclosures related to purchases, sales, issuance and settlements in the first quarter of fiscal 2012. Because these new standards are related primarily to disclosures, their adoption has not had a significant impact on the Company’s consolidated financial statements.
Goodwill Impairment Testing
In September 2011, the FASB issued updated guidance concerning the testing of goodwill for impairment. This guidance modifies goodwill impairment testing by allowing the inclusion of qualitative factors in the assessment of whether a two-step goodwill impairment test is necessary. Thus, entities are no longer required to calculate the fair value of a reporting unit unless they conclude through an assessment of qualitative factors that it is more likely than not that the unit's carrying value is greater than its fair value. When an entity's qualitative assessment reveals that goodwill impairment is more likely than not, the entity must perform the two-step goodwill impairment test.
The amendments did not change the existing accounting guidance on how Step 1 and Step 2 of the goodwill impairment test are performed. In addition, an entity is no longer permitted to carry forward its detailed calculation of a reporting unit's fair value from a prior year as previously permitted under the previous guidance.
This guidance became effective for the Company in the second quarter of fiscal 2012. The Company's adoption of this guidance has not had a significant impact on its consolidated financial statements.
Indefinite-Lived Intangible Assets Impairment Testing
In July 2012, the FASB issued final guidance concerning the testing of indefinite-lived intangible assets for impairment. This guidance modifies both annual and interim impairment testing. Annual and interim indefinite-lived intangible asset impairment testing was modified to allow the inclusion of qualitative factors in the assessment of whether a quantitative impairment test is necessary. Thus, entities are no longer required to calculate the fair value of an indefinite-lived intangible asset unless they conclude through an assessment of qualitative factors that it is more likely than not that the carrying value of the indefinite-lived intangible asset exceeds its fair value.
When an entity's qualitative assessment reveals that indefinite-lived intangible asset impairment is more likely than not, the entity must perform the quantitative impairment test.
The amendments did not change the existing accounting guidance on how this impairment test is performed.
This guidance is effective for annual and interim impairment tests performed for fiscal years beginning after September 15, 2012. Early adoption is permitted, even by entities whose impairment testing dates have passed but have not issued their most recent financial statements. The Company is early adopting this guidance beginning with annual impairment testing in the fourth quarter of fiscal 2012. The Company's adoption of this guidance has not had a significant impact on its consolidated financial statements.
58
Recently Issued Accounting Pronouncements
Presentation of Comprehensive Income
In June 2011, the FASB issued new guidance concerning the presentation of total comprehensive income and its components. Under this guidance an entity has the option to present the total of comprehensive income, the components of net income, and the components of other comprehensive income, either in a single continuous statement of comprehensive income, or in two separate but consecutive statements. This guidance also requires an entity to present on the face of the financial statements reclassification adjustments from other comprehensive income to net income. In December 2011, the FASB issued an accounting standards update that defers this presentation requirement for other comprehensive income reclassifications on the face of the financial statements. This guidance, as amended, will become effective for the Company beginning in the first quarter of the fiscal year ending June 30, 2013. The Company's adoption of the new accounting guidance is not expected to have a significant impact on its consolidated financial statements.
Acquisition of Ruud Lighting, Inc.
On
August 17, 2011
, the Company entered into a Stock Purchase Agreement with all of the shareholders of Ruud Lighting. Pursuant to the terms of the Stock Purchase Agreement and concurrently with the execution of the Stock Purchase Agreement, the Company acquired all of the outstanding share capital of Ruud Lighting in exchange for consideration consisting of
6.1 million
shares of the Company's common stock and
$372.2 million
in cash, subject to certain post-closing adjustments. Following the acquisition, the Company recorded certain post-closing purchase price adjustments. These adjustments to the purchase price have been reflected as a reduction of goodwill. The acquisition allows the Company to expand its product portfolio into outdoor LED lighting.
Prior to the Company completing its acquisition of Ruud Lighting, Ruud Lighting completed the re-acquisition of its e-conolight business by purchasing all of the membership interests of E-conolight LLC ("E-conolight"). Ruud Lighting previously sold its e-conolight business in March 2010 and had been providing operational services to E-conolight since that date. In connection with the stock purchase transaction with Ruud Lighting, the Company funded Ruud Lighting's re-acquisition of E-conolight and paid off Ruud Lighting's outstanding debt in the aggregate amount of approximately
$85.0 million
.
The acquisitions of Ruud Lighting and E-conolight have been accounted for as business combinations in accordance with
ASC 805 Business Combinations
and, as such, the Ruud Lighting and E-conolight assets acquired and liabilities assumed have been recorded at their respective fair values. The determination of fair value for the identifiable tangible and intangible assets acquired and liabilities assumed requires extensive use of estimates and judgments. Significant estimates and assumptions include, but are not limited to: estimating future cash flows and determining the appropriate discount rate. The total purchase price for the acquisitions is as follows (in thousands):
59
|
Cash consideration paid to stockholders
|
|
$372,235
|
|
|
Fair value of common stock issued by the Company
(1)
|
211,040
|
|
|
|
Fair value of debt paid on behalf of stockholders
|
84,991
|
|
|
|
Post-closing adjustments
(2) (3) (4) (5)
|
(2,260
|
)
|
|
|
Total purchase price
|
|
$666,006
|
|
(1)
Represents
6,074,833
shares of the Company's common stock at
$34.74
per share, the closing share price on
August 17, 2011
. The shares are subject to certain transfer restrictions under the Stock Purchase Agreement that will generally lapse with respect to
25%
of the shares held (i) at the completion of the consecutive six-month period following the date of the closing of the transaction; and, (ii) at the completion of each of the following three successive six-month periods, such that all restrictions will lapse by the second anniversary of the closing.
(2)
In accordance with the Stock Purchase Agreement, the post-closing working capital adjustment was composed of approximately
$1.0 million
in cash and the return of
15,895
shares of the Company's common stock from escrow during the fourth quarter of fiscal 2012.
(3)
In accordance with the Stock Purchase Agreement, the sellers have certain post-closing indemnification obligations to the Company. During the fourth quarter of fiscal 2012, the Company received approximately
$0.3 million
in cash and the return of
5,069
shares of the Company's common stock from escrow in connection with these indemnification obligations.
(4)
The Company recovered approximately
$0.4 million
in insurance proceeds related to liabilities assumed in the acquisition during the fourth quarter of fiscal 2012.
(5)
The Company paid approximately
$0.2 million
related to pre-closing taxes during the fourth quarter of fiscal 2012.
The Company incurred total transaction costs related to the acquisition of approximately
$3.6 million
, of which,
$3.1 million
were expensed in the first quarter of fiscal
2012
in accordance with U.S. GAAP.
60
The following table presents the allocation of the purchase price for this acquisition to the assets acquired and liabilities assumed based on their estimated fair values and resulting residual goodwill (in thousands):
|
August 17, 2011
(as initially reported)
|
Measurement Period Adjustments
|
August 17, 2011
(as adjusted)
|
|||||||
|
Tangible assets:
|
|||||||||
|
Cash and cash equivalents
|
|
$3,081
|
|
|
$—
|
|
|
$3,081
|
|
|
Accounts receivable
|
25,698
|
|
(375
|
)
|
25,323
|
|
|||
|
Inventories
|
39,330
|
|
(461
|
)
|
38,869
|
|
|||
|
Property and equipment
|
45,946
|
|
(233
|
)
|
45,713
|
|
|||
|
Other assets
|
4,727
|
|
—
|
|
4,727
|
|
|||
|
Total tangible assets
|
|
$118,782
|
|
|
($1,069
|
)
|
|
$117,713
|
|
|
Intangible assets:
|
|||||||||
|
Developed technology
|
$
|
96,300
|
|
$
|
—
|
|
$
|
96,300
|
|
|
Customer relationships
|
84,820
|
|
—
|
|
84,820
|
|
|||
|
Trade names
|
82,950
|
|
—
|
|
82,950
|
|
|||
|
In-process research & development
|
15,050
|
|
—
|
|
15,050
|
|
|||
|
Non-compete agreements
|
9,800
|
|
—
|
|
9,800
|
|
|||
|
Goodwill
|
287,431
|
|
2,734
|
|
290,165
|
|
|||
|
Total intangible assets
|
|
$576,351
|
|
|
$2,734
|
|
|
$579,085
|
|
|
Liabilities assumed:
|
|||||||||
|
Accounts payable
|
$
|
12,943
|
|
$
|
—
|
|
$
|
12,943
|
|
|
Accrued expenses and liabilities
|
10,116
|
|
902
|
|
11,018
|
|
|||
|
Warranty liabilities
|
2,600
|
|
3,023
|
|
5,623
|
|
|||
|
Other long-term liabilities
|
1,208
|
|
—
|
|
1,208
|
|
|||
|
Total liabilities assumed
|
|
$26,867
|
|
|
$3,925
|
|
|
$30,792
|
|
|
Net assets acquired
|
|
$668,266
|
|
|
($2,260
|
)
|
|
$666,006
|
|
The above estimated fair values of assets acquired and liabilities assumed are based on the information that was available as of the Ruud Lighting acquisition date through the end of the measurement period. As of the filing date of this report, the measurement period adjustments are complete.
Acquired finished goods and work-in-process inventory was valued at its estimated selling price less the sum of costs of disposal and a reasonable profit allowance for the Company's selling effort and, with respect to work-in-process inventory, estimated costs to complete. This valuation process resulted in a fair value adjustment that increased finished goods inventory approximately
$1.5 million
. Raw material inventory has been valued at current replacement cost, resulting in a write down of approximately
$0.7 million
. As of the end of fiscal year
2012
, the Company has recognized the net step up of
$0.8 million
in its cost of revenue.
61
The identifiable intangible assets acquired as a result of the acquisition will be amortized over their respective estimated useful lives as follows (in thousands, except for years):
|
Asset Amount
|
Estimated Life in Years
|
||||
|
Developed technology
|
|
$96,300
|
|
7 to 10
|
|
|
Customer relationships
|
84,820
|
|
7 to 20
|
||
|
Trade names (indefinite lived)
|
82,880
|
|
-
|
||
|
Trade names (definite lived)
|
70
|
|
3
|
||
|
In-process research and development
(1)
|
15,050
|
|
6 to 7
|
||
|
Non-compete agreements
|
9,800
|
|
5
|
||
|
Total identifiable intangible assets
|
|
$288,920
|
|
||
(1)
Initially, IPR&D is classified as indefinite-lived assets until completion or abandonment. Therefore, amortization of IPR&D does not begin until the technological and market risk(s) no longer exist. During the interim, IPR&D intangibles are subject to annual testing for impairment or when there are indicators of impairment.
The fair value of the developed technology, IPR&D and customer relationship assets were estimated using an income approach. Under this method, an intangible asset's fair value is equal to the present value of the incremental after-tax cash flows (excess earnings) attributable solely to the intangible asset over its remaining useful life. To calculate fair value, the Company used cash flows discounted at rates considered appropriate given the inherent risks associated with each type of asset. The Company believes that the level and timing of cash flows appropriately reflect market participant assumptions. The fair value of the Ruud Lighting and e-conolight trade names were estimated using an income approach, specifically known as the relief from royalty method. The relief from royalty method is based on a hypothetical royalty stream that would be paid if the Company did not own the Ruud Lighting “BetaLED” brand and had to license the Ruud Lighting and e-conolight trade names. The Company derived the hypothetical royalty income from the projected revenues of Ruud Lighting and e-conolight products. Cash flows were assumed to extend through the remaining economic useful life of each class of intangible asset.
Goodwill largely consists of geographic expansion of product sales, manufacturing and other synergies of the combined companies, and the value of the assembled workforce.
As a result of the Company's U.S. tax election under Internal Revenue Code section 338(h)(10), the acquisition did not result in the recording of an opening net deferred tax position as the deferred tax asset resulting from excess tax deductible goodwill equally offsets the deferred tax liability resulting from excess book over tax basis in the underlying assets acquired.
Ruud Lighting is included in the Lighting Products segment.
The assets, liabilities, and operating results of Ruud Lighting have been included in the Company's consolidated financial statements from the date of acquisition. The results of Ruud Lighting reflected in the Company's Consolidated Statements of Income for the year ended
June 24, 2012
from the date of acquisition (
August 17, 2011
) is as follows (in thousands, except per share data):
|
Since acquisition date to
|
|||
|
June 24,
2012 |
|||
|
Revenue
|
|
$204,353
|
|
|
Operating Loss
|
(1,985
|
)
|
|
|
Net Loss
|
(2,334
|
)
|
|
|
Basic net loss per share
|
|
($0.02
|
)
|
|
Diluted net loss per share
|
|
($0.02
|
)
|
Amortization expense related to identifiable intangible assets associated with the Ruud Lighting acquisition, included in the table above, was
$17.4 million
, for the year ended
June 24, 2012
.
62
The following supplemental pro forma information (in thousands, except per share data) presents the consolidated financial results as if the Ruud Lighting transactions had occurred at the beginning of the 2011 fiscal year.
|
For the Years Ended
|
|||||||
|
June 24,
2012 |
June 26,
2011 |
||||||
|
Revenue
|
|
$1,194,990
|
|
|
$1,184,765
|
|
|
|
Operating Income
|
37,551
|
|
154,765
|
|
|||
|
Net income
|
42,399
|
|
134,768
|
|
|||
|
Earnings per share, basic
|
|
$0.37
|
|
|
$1.18
|
|
|
|
Earnings per share, diluted
|
|
$0.37
|
|
|
$1.16
|
|
|
The total revenue for Ruud Lighting included in the pro forma table above was
$235.8 million
and
$211.2 million
for the years ended
June 24, 2012
and
June 26, 2011
, respectively. These amounts have been calculated after applying the Company’s accounting policies and adjusting the results of Ruud Lighting to give effect to events that are directly attributable to the Ruud Lighting transactions, including the elimination of sales to Ruud Lighting prior to acquisition, additional depreciation and amortization that would have been charged assuming the fair value adjustments primarily to property and equipment and intangible assets, had been applied at the beginning of the 2011 fiscal year, together with the consequential tax effects. Excluded from the pro forma net income and the earnings per share amounts for the years ended
June 24, 2012
and
June 26, 2011
are one-time acquisition costs attributable to the Ruud Lighting transactions of
$3.1 million
and
$0.5 million
, respectively. This supplemental pro forma information has been prepared for comparative purposes and does not purport to be indicative of what would have occurred had the acquisition been made at the beginning of the 2011 fiscal year, nor is it indicative of any future results.
Acquisition of LED Lighting Fixtures, Inc.
On February 29, 2008 the Company acquired LED Lighting Fixtures, Inc. (“LLF”) through a wholly owned subsidiary that merged into Cree, Inc. on June 27, 2010. The Company acquired all of the outstanding share capital of LLF in exchange for total upfront consideration of
$80.8 million
, consisting of (1)
$16.5 million
in cash, (2) approximately
1.9 million
shares of the Company’s common stock valued at
$58.8 million
, and (3) the assumption of fully vested LLF employee stock options valued at
$4.5 million
. The Company incurred transaction costs of approximately
$1.0 million
consisting primarily of professional fees incurred relating to attorneys, accountants and valuation advisors. Under the acquisition terms, additional consideration of up to
$26.4 million
would become payable to the former shareholders of LLF if defined product development targets and key employee retention measures were achieved over the
three
calendar years following the acquisition.
LLF met the conditions necessary for the earn-out payment for the calendar years ended December 31, 2008, 2009 and 2010. As a result, the Company made a cash payment in the amount of
$4.4 million
to the former shareholders of LLF in the third quarter of fiscal 2009, a cash payment in the amount of
$8.8 million
to the former shareholders of LLF in the third quarter of fiscal 2010, and a final cash payment in the amount of
$13.2 million
to the former shareholders of LLF in the third quarter of fiscal 2011. These incremental payments were treated as additional purchase price and resulted in an increase to goodwill in those fiscal years in which they were made.
LLF is included in the Lighting Products segment.
63
Accounts Receivable, net
The following is a summary of the components of accounts receivable, net (in thousands):
|
June 24,
2012 |
June 26,
2011 |
||||||
|
Billed trade receivables
|
|
$173,145
|
|
|
$137,799
|
|
|
|
Unbilled contract receivables
|
1,576
|
|
1,038
|
|
|||
|
174,721
|
|
138,837
|
|
||||
|
Allowance for sales returns, discounts and other incentives
|
(20,681
|
)
|
(19,615
|
)
|
|||
|
Allowance for bad debts
|
(1,782
|
)
|
(753
|
)
|
|||
|
Total accounts receivable, net
|
|
$152,258
|
|
|
$118,469
|
|
|
The following table summarizes the changes in the Company’s allowance for sales returns and other incentives (in thousands):
|
|
Fiscal Years Ended
|
||||||||||
|
|
June 24,
2012 |
June 26,
2011 |
June 27,
2010 |
||||||||
|
Balance at beginning of period
|
|
$19,615
|
|
|
$20,551
|
|
|
$9,644
|
|
||
|
Current period claims
|
(64,826
|
)
|
(47,448
|
)
|
(23,036
|
)
|
|||||
|
Provision for sales returns
|
65,892
|
|
46,512
|
|
33,943
|
|
|||||
|
Balance at end of period
|
|
$20,681
|
|
|
$19,615
|
|
|
$20,551
|
|
||
The following table is a roll forward of the Company’s allowance for bad debts (in thousands):
|
|
Fiscal Years Ended
|
||||||||||
|
|
June 24,
2012 |
June 26,
2011 |
June 27,
2010 |
||||||||
|
Balance at beginning of period
|
|
$753
|
|
|
$1,947
|
|
|
$2,531
|
|
||
|
Current year provision
|
1,029
|
|
(956
|
)
|
738
|
|
|||||
|
Write-offs net of recoveries
|
—
|
|
(238
|
)
|
(1,322
|
)
|
|||||
|
Balance at end of period
|
|
$1,782
|
|
|
$753
|
|
|
$1,947
|
|
||
Inventories
The following is a summary of the components of inventories (in thousands):
|
June 24,
2012 |
June 26,
2011 |
||||||
|
Raw material
|
|
$57,618
|
|
|
$38,781
|
|
|
|
Work-in-progress
|
74,241
|
|
74,816
|
|
|||
|
Finished goods
|
56,990
|
|
62,885
|
|
|||
|
Total inventories
|
|
$188,849
|
|
|
$176,482
|
|
|
64
Property and Equipment, net
The following table reflects the components of property and equipment (in thousands):
|
June 24,
2012 |
June 26,
2011 |
||||||
|
Furniture and fixtures
|
|
$11,499
|
|
|
$10,439
|
|
|
|
Land and buildings
|
289,163
|
|
254,190
|
|
|||
|
Machinery and equipment
|
856,733
|
|
799,259
|
|
|||
|
Aircraft and vehicles
|
15,912
|
|
748
|
|
|||
|
Computer hardware/software
|
29,510
|
|
26,954
|
|
|||
|
Leasehold improvements and other
|
19,082
|
|
18,305
|
|
|||
|
Construction in progress
|
108,986
|
|
95,974
|
|
|||
|
1,330,885
|
|
1,205,869
|
|
||||
|
Accumulated depreciation
|
(748,424
|
)
|
(649,940
|
)
|
|||
|
Property and Equipment, net
|
|
$582,461
|
|
|
$555,929
|
|
|
Depreciation of property and equipment totaled
$110.6 million
,
$93.1 million
and
$74.1 million
for the years ended
June 24, 2012
,
June 26, 2011
and
June 27, 2010
, respectively.
During the years ended
June 24, 2012
,
June 26, 2011
and
June 27, 2010
, the Company recorded approximately
$2.6 million
,
$1.5 million
and
$3.9 million
, respectively, as losses on disposals or impairments of property and equipment. These charges are reflected in Loss on Disposal or Impairment of Long Lived Assets in the accompanying Consolidated Statements of Income.
Short-term and long-term investments consist of high-grade corporate bonds and other debt securities. All marketable investments are classified as available-for-sale as of
June 24, 2012
.
The following table provides a summary of marketable investments as of
June 24, 2012
(in thousands):
|
|
June 24, 2012
|
||||||||||||||
|
|
Amortized
Cost
|
Gross
Unrealized
Gains
|
Gross
Unrealized
Losses
|
Estimated
Fair Value
|
|||||||||||
|
Municipal bonds
|
$
|
209,626
|
|
$
|
2,036
|
|
$
|
(58
|
)
|
$
|
211,604
|
|
|||
|
Corporate bonds
|
144,942
|
|
1,848
|
|
(123
|
)
|
146,667
|
|
|||||||
|
Municipal variable rate demand notes
|
—
|
|
—
|
|
—
|
|
—
|
|
|||||||
|
U.S. agency securities
|
68,156
|
|
450
|
|
(7
|
)
|
68,599
|
|
|||||||
|
Certificates of deposit
|
130,000
|
|
—
|
|
—
|
|
130,000
|
|
|||||||
|
Commercial paper
|
—
|
|
—
|
|
—
|
|
—
|
|
|||||||
|
Non-U.S. government securities
|
8,746
|
|
15
|
|
(3
|
)
|
8,758
|
|
|||||||
|
Total
|
$
|
561,470
|
|
$
|
4,349
|
|
$
|
(191
|
)
|
$
|
565,628
|
|
|||
65
The following table presents the gross unrealized losses and estimated fair value of the Company’s investment securities, aggregated by investment type and the length of time that individual investment securities have been in a continuous unrealized loss position, as of
June 24, 2012
(in thousands):
|
|
June 24, 2012
|
||||||||||||||||||||||
|
|
Less than 12 Months
|
Greater than 12 Months
|
Total
|
||||||||||||||||||||
|
|
Fair Value
|
Unrealized
Loss
|
Fair Value
|
Unrealized
Loss
|
Fair Value
|
Unrealized
Loss
|
|||||||||||||||||
|
Municipal bonds
|
$
|
30,102
|
|
$
|
(58
|
)
|
$
|
—
|
|
$
|
—
|
|
$
|
30,102
|
|
$
|
(58
|
)
|
|||||
|
Corporate bonds
|
30,550
|
|
(123
|
)
|
—
|
|
—
|
|
30,550
|
|
(123
|
)
|
|||||||||||
|
Municipal variable rate demand notes
|
—
|
|
—
|
|
—
|
|
—
|
|
—
|
|
—
|
|
|||||||||||
|
U.S. agency securities
|
3,014
|
|
(7
|
)
|
—
|
|
—
|
|
3,014
|
|
(7
|
)
|
|||||||||||
|
Certificates of deposit
|
—
|
|
—
|
|
—
|
|
—
|
|
—
|
|
—
|
|
|||||||||||
|
Commercial paper
|
—
|
|
—
|
|
—
|
|
—
|
|
—
|
|
—
|
|
|||||||||||
|
Non-U.S. government securities
|
1,543
|
|
(3
|
)
|
—
|
|
—
|
|
1,543
|
|
(3
|
)
|
|||||||||||
|
Total
|
$
|
65,209
|
|
$
|
(191
|
)
|
$
|
—
|
|
$
|
—
|
|
$
|
65,209
|
|
$
|
(191
|
)
|
|||||
|
Number of securities with an unrealized loss
|
33
|
|
—
|
|
33
|
|
|||||||||||||||||
The following table provides a summary of marketable investments as of
June 26, 2011
(in thousands):
|
|
June 26, 2011
|
||||||||||||||
|
|
Amortized
Cost
|
Gross
Unrealized
Gains
|
Gross
Unrealized
Losses
|
Estimated
Fair Value
|
|||||||||||
|
Municipal bonds
|
$
|
391,465
|
|
$
|
3,943
|
|
$
|
(10
|
)
|
$
|
395,398
|
|
|||
|
Corporate bonds
|
207,241
|
|
2,312
|
|
(115
|
)
|
209,438
|
|
|||||||
|
Municipal variable rate demand notes
|
295
|
|
—
|
|
—
|
|
295
|
|
|||||||
|
U.S. agency securities
|
67,244
|
|
807
|
|
(2
|
)
|
68,049
|
|
|||||||
|
Certificates of deposit
|
10,003
|
|
12
|
|
—
|
|
10,015
|
|
|||||||
|
Commercial paper
|
4,999
|
|
—
|
|
—
|
|
4,999
|
|
|||||||
|
Non-U.S. government securities
|
6,986
|
|
19
|
|
—
|
|
7,005
|
|
|||||||
|
Total
|
$
|
688,233
|
|
$
|
7,093
|
|
$
|
(127
|
)
|
$
|
695,199
|
|
|||
The following table presents the gross unrealized losses and estimated fair value of the Company’s investment securities, aggregated by investment type and the length of time that individual investment securities have been in a continuous unrealized loss position, as of
June 26, 2011
(in thousands):
|
|
June 26, 2011
|
||||||||||||||||||||||
|
|
Less than 12 Months
|
Greater than 12 Months
|
Total
|
||||||||||||||||||||
|
|
Fair Value
|
Unrealized
Loss
|
Fair Value
|
Unrealized
Loss
|
Fair Value
|
Unrealized
Loss
|
|||||||||||||||||
|
Municipal bonds
|
$
|
14,348
|
|
$
|
(10
|
)
|
$
|
—
|
|
$
|
—
|
|
$
|
14,348
|
|
$
|
(10
|
)
|
|||||
|
Corporate bonds
|
20,484
|
|
(115
|
)
|
—
|
|
—
|
|
20,484
|
|
(115
|
)
|
|||||||||||
|
Municipal variable rate demand notes
|
—
|
|
—
|
|
—
|
|
—
|
|
—
|
|
—
|
|
|||||||||||
|
U.S. agency securities
|
6,518
|
|
(2
|
)
|
—
|
|
—
|
|
6,518
|
|
(2
|
)
|
|||||||||||
|
Certificates of deposit
|
—
|
|
—
|
|
—
|
|
—
|
|
—
|
|
—
|
|
|||||||||||
|
Commercial paper
|
—
|
|
—
|
|
—
|
|
—
|
|
—
|
|
—
|
|
|||||||||||
|
Non-U.S. government securities
|
—
|
|
—
|
|
—
|
|
—
|
|
—
|
|
—
|
|
|||||||||||
|
Total
|
$
|
41,350
|
|
$
|
(127
|
)
|
$
|
—
|
|
$
|
—
|
|
$
|
41,350
|
|
$
|
(127
|
)
|
|||||
|
Number of securities with an unrealized loss
|
20
|
|
—
|
|
20
|
|
|||||||||||||||||
66
Each of the securities in the above tables generally has an investment grade rating and is an unrealized loss position solely due to interest rate changes, sector credit rating changes or company-specific rating changes. The Company evaluates its investments for possible impairment or a decline in fair value below cost basis that is deemed to be “other than temporary” on a periodic basis. It considers such factors as the length of time and extent to which the fair value has been below the cost basis, the financial condition of the investee, and its ability and intent to hold the investment for a period of time that may be sufficient for an anticipated full recovery in market value. Accordingly, the Company considers declines in its securities to be temporary in nature, and does not consider its securities to be impaired as of
June 24, 2012
and
June 26, 2011
.
The contractual maturities of marketable investments at
June 24, 2012
were as follows (in thousands):
|
Within One
Year
|
After One,
Within Five
Years
|
After Five,
Within Ten
Years
|
After Ten
Years
|
Total
|
|||||||||||||||
|
Municipal bonds
|
$
|
85,261
|
|
$
|
126,343
|
|
$
|
—
|
|
$
|
—
|
|
$
|
211,604
|
|
||||
|
Corporate bonds
|
50,462
|
|
92,221
|
|
3,984
|
|
—
|
|
146,667
|
|
|||||||||
|
Municipal variable rate demand notes
|
—
|
|
—
|
|
—
|
|
—
|
|
—
|
|
|||||||||
|
U.S. agency securities
|
31,856
|
|
36,743
|
|
—
|
|
—
|
|
68,599
|
|
|||||||||
|
Certificates of deposit
|
130,000
|
|
—
|
|
—
|
|
—
|
|
130,000
|
|
|||||||||
|
Commercial paper
|
—
|
|
—
|
|
—
|
|
—
|
|
—
|
|
|||||||||
|
Non-U.S. government securities
|
4,559
|
|
4,199
|
|
—
|
|
—
|
|
8,758
|
|
|||||||||
|
Total
|
$
|
302,138
|
|
$
|
259,506
|
|
$
|
3,984
|
|
$
|
—
|
|
$
|
565,628
|
|
||||
Under U.S. GAAP, fair value is defined as the price that would be received to sell an asset or paid to transfer a liability (i.e., “the exit price”) in an orderly transaction between market participants at the measurement date. In determining fair value, the Company uses various valuation approaches, including quoted market prices and market income models. U.S. GAAP also establishes a hierarchy for inputs used in measuring fair value that maximizes the use of observable inputs and minimizes the use of unobservable inputs by requiring that the most observable inputs be used when available. Observable inputs are obtained from independent sources and can be validated by a third party, whereas, unobservable inputs reflect assumptions regarding what a third party would use in pricing an asset or liability. The fair value hierarchy is broken down into
3
levels based on the reliability of inputs as follows:
|
•
|
Level 1 - Valuations based on quoted prices in active markets for identical instruments that the Company is able to access. Since valuations are based on quoted prices that are readily and regularly available in an active market, valuation of these products does not entail a significant degree of judgment.
|
|
•
|
Level 2 - Valuations based on quoted prices in active markets for instruments that are similar, or quoted prices in markets that are not active for identical or similar instruments, and model-derived valuations in which all significant inputs and significant value drivers are observable in active markets.
|
|
•
|
Level 3 - Valuations based on inputs that are unobservable and significant to the overall fair value measurement.
|
The financial assets for which the Company performs recurring fair value remeasurements are cash equivalents and short-term investments. As of
June 24, 2012
, financial assets utilizing Level 1 inputs included money market funds and investments traded on active securities exchanges. Financial assets utilizing Level 2 inputs included corporate bonds, municipal bonds, U.S. agency securities, certificates of deposit and non-U.S. government securities. Level 2 assets are valued using a third-party pricing services consensus price which is a weighted average price based on multiple sources. These sources determine prices utilizing market income models which factor in, where applicable, transactions of similar assets in active markets, transactions of identical assets in infrequent markets, interest rates, bond or credit default swap spreads and volatility. The Company does not have any significant financial assets requiring the use of Level 3 inputs. There were no transfers between Level 1 and Level 2 during the year ended
June 24, 2012
.
67
The following table sets forth financial instruments carried at fair value within the U.S. GAAP hierarchy and using the lowest level of input (in thousands):
|
|
June 24, 2012
|
June 26, 2011
|
|||||||||||||||||||||||||||||
|
|
Level 1
|
Level 2
|
Level 3
|
Total
|
Level 1
|
Level 2
|
Level 3
|
Total
|
|||||||||||||||||||||||
|
Assets:
|
|||||||||||||||||||||||||||||||
|
Cash equivalents
|
|||||||||||||||||||||||||||||||
|
Municipal bonds
|
$
|
—
|
|
$
|
3,000
|
|
$
|
—
|
|
$
|
3,000
|
|
$
|
—
|
|
$
|
—
|
|
$
|
—
|
|
$
|
—
|
|
|||||||
|
Money market funds
|
31,318
|
|
—
|
|
—
|
|
31,318
|
|
7,386
|
|
—
|
|
—
|
|
7,386
|
|
|||||||||||||||
|
Total cash equivalents
|
$
|
31,318
|
|
$
|
3,000
|
|
$
|
—
|
|
$
|
34,318
|
|
$
|
7,386
|
|
$
|
—
|
|
$
|
—
|
|
$
|
7,386
|
|
|||||||
|
Short-term investments
|
|||||||||||||||||||||||||||||||
|
Municipal bonds
|
—
|
|
211,604
|
|
—
|
|
211,604
|
|
—
|
|
395,398
|
|
—
|
|
$
|
395,398
|
|
||||||||||||||
|
Corporate bonds
|
—
|
|
146,667
|
|
—
|
|
146,667
|
|
—
|
|
209,438
|
|
—
|
|
209,438
|
|
|||||||||||||||
|
Municipal variable rate demand notes
|
—
|
|
—
|
|
—
|
|
—
|
|
—
|
|
295
|
|
—
|
|
295
|
|
|||||||||||||||
|
U.S. agency securities
|
—
|
|
68,599
|
|
—
|
|
68,599
|
|
—
|
|
68,049
|
|
—
|
|
68,049
|
|
|||||||||||||||
|
Certificates of deposit
|
—
|
|
130,000
|
|
—
|
|
130,000
|
|
—
|
|
10,015
|
|
—
|
|
10,015
|
|
|||||||||||||||
|
Commercial paper
|
—
|
|
—
|
|
—
|
|
—
|
|
—
|
|
4,999
|
|
—
|
|
4,999
|
|
|||||||||||||||
|
Non-U.S. government securities
|
—
|
|
8,758
|
|
—
|
|
8,758
|
|
—
|
|
7,005
|
|
—
|
|
7,005
|
|
|||||||||||||||
|
Total short-term investments
|
$
|
—
|
|
$
|
565,628
|
|
$
|
—
|
|
$
|
565,628
|
|
$
|
—
|
|
$
|
695,199
|
|
$
|
—
|
|
$
|
695,199
|
|
|||||||
|
Total assets
|
$
|
31,318
|
|
$
|
568,628
|
|
$
|
—
|
|
$
|
599,946
|
|
$
|
7,386
|
|
$
|
695,199
|
|
$
|
—
|
|
$
|
702,585
|
|
|||||||
The Company utilizes specific identification in computing realized gains and losses on the sale of investments. Realized gains from the sale of investments for the fiscal year ended
June 24, 2012
of approximately
$1.0 million
are included in “Other non-operating income, net” and unrealized gains and losses are included as a separate component of equity, net of tax, unless the loss is determined to be other-than-temporary.
The Company evaluates its investments for possible impairment or a decline in fair value below cost basis that is deemed to be other-than-temporary on a periodic basis. It considers such factors as the length of time and extent to which fair value has been below cost basis, the financial condition of the investee, and its ability and intent to hold the investment for a period of time that may be sufficient for an anticipated full recovery in market value.
Intangible Assets
The following table reflects the components of intangible assets (in thousands):
|
June 24,
2012 |
June 26,
2011 |
||||||
|
Customer relationships
|
$
|
137,440
|
|
$
|
52,620
|
|
|
|
Developed technology
|
147,710
|
|
51,410
|
|
|||
|
Patent and license rights
|
97,812
|
|
83,440
|
|
|||
|
Trade names
|
83,400
|
|
450
|
|
|||
|
In-process research and development
|
15,050
|
|
—
|
|
|||
|
Non-compete agreements
|
10,244
|
|
444
|
|
|||
|
Intangible assets, gross
|
$
|
491,656
|
|
$
|
188,364
|
|
|
|
Accumulated amortization
|
(115,581
|
)
|
(85,504
|
)
|
|||
|
Intangible assets, net
|
$
|
376,075
|
|
$
|
102,860
|
|
|
68
Indefinite-lived trade names included in the table above were approximately
$82.9 million
. Total amortization of intangible assets was
$32.1 million
,
$15.5 million
and
$16.3 million
for the years ended
June 24, 2012
,
June 26, 2011
and
June 27, 2010
, respectively. During the fourth quarter of fiscal 2012, the Company started amortizing certain IPR&D assets (acquired in the Ruud Lighting acquisition) that were completed during the quarter.
The Company invested
$17.2 million
,
$12.8 million
and
$9.3 million
for the years ended
June 24, 2012
,
June 26, 2011
and
June 27, 2010
, respectively for patent and license rights. For the fiscal years ended
June 24, 2012
,
June 26, 2011
and
June 27, 2010
, the Company recorded
$0.8 million
,
$0.5 million
and
$0.2 million
, respectively, in impairment charges related to its patent portfolio.
Future amortization expense of the Company's definite-lived intangible assets is estimated to be as follows (in thousands):
|
Fiscal Year Ending
|
|
||
|
June 30, 2013
|
$
|
37,032
|
|
|
June 29, 2014
|
34,908
|
|
|
|
June 28, 2015
|
31,937
|
|
|
|
June 26, 2016
|
31,638
|
|
|
|
June 25, 2017
|
29,658
|
|
|
|
Thereafter
|
128,022
|
|
|
|
$
|
293,195
|
|
|
Goodwill
In fiscal
2012
, the Company performed a qualitative test on the Company's consolidated goodwill. This qualitative assessment did not conclude that it was more likely than not that consolidated goodwill was impaired. Thus, a two step goodwill impairment test was not indicated for fiscal 2012. There were no impairments of consolidated goodwill for the fiscal years ended
June 26, 2011
and
June 27, 2010
.
During the fourth quarter of fiscal 2012, the Company completed modification of its internal management and reporting structure along
three
operating segments. In reviewing these operating segments under ASC 350 for goodwill reporting purposes, the Company determined that the Company's operating segments are consistent with its reporting units. Thus, the Company's reporting units for goodwill impairment testing include:
|
•
|
LED Products
|
|
•
|
Lighting Products
|
|
•
|
Power and RF Products
|
As a result of the reorganization of the Company into
three
reporting units, the Company was required to assess goodwill impairment at the reporting unit level. The Company performed the quantitative goodwill impairment test on each reporting unit. For step one of the impairment test, t
he Company derived each reporting unit's fair value through a combination of the market approach (a guideline transaction method) and the income approach (a discounted cash flow analysis). The Company utilized a discount rate from the capital asset pricing model for the discounted cash flow analysis. Once the reporting unit fair values were calculated, the Company reconciled the reporting units' relative fair values back to the Company's market capitalization as of the testing date.
T
he Company then compared the carrying value of each reporting unit, inclusive of its assigned goodwill, to its fair value. The Company determined that the fair value of each reporting unit exceeded its carrying value, and therefore, there was
no
goodwill impairment as of
June 24, 2012
. As a result, step two of the goodwill impairment test was not necessary.
Goodwill activity by reporting unit for the years ended
June 24, 2012
and
June 26, 2011
is as follows (in thousands):
|
LED Products
|
Lighting Products
|
Power and RF Products
|
Consolidated Total
|
||||||||||||
|
June 26, 2011
|
$
|
245,857
|
|
$
|
47,614
|
|
$
|
32,707
|
|
$
|
326,178
|
|
|||
|
Addition due to Ruud Lighting acquisition
|
—
|
|
290,167
|
|
—
|
|
290,167
|
|
|||||||
|
June 24, 2012
|
$
|
245,857
|
|
$
|
337,781
|
|
$
|
32,707
|
|
$
|
616,345
|
|
|||
69
Consolidated goodwill increased from approximately
$326.2 million
at
June 26, 2011
to approximately
$616.3 million
at
June 24, 2012
due to the acquisition of Ruud Lighting.
In September 2009, the Company issued and sold
12.65 million
shares of its common stock, with net proceeds of approximately
$434 million
.
In August 2011, in connection with the acquisition of Ruud Lighting, the Company issued
6.1 million
shares of common stock valued at approximately
$211.0 million
. The shares issued in connection with the acquisition are subject to certain transfer restrictions under the Stock Purchase Agreement that will generally lapse with respect to
25%
of the shares held (i) at the completion of the consecutive six-month period following the date of the closing of the transaction; and, (ii) at the completion of each of the following three successive six-month periods, such that all restrictions will lapse by the second anniversary of the closing.
As discussed in Note 3, “Acquisitions,” the post-closing working capital adjustment and indemnification obligations under the Stock Purchase Agreement resulted in the return of an aggregate of
20,964
shares of the Company's common stock from escrow during fiscal 2012.
As of
June 24, 2012
, the Company is authorized to repurchase shares of its common stock having an aggregate purchase price not exceeding
$200 million
for all purchases from
June 14, 2012
through the expiration of the program, as authorized by the Board of Directors and extended through
June 30, 2013
. During the fiscal year ended
June 24, 2012
, the Company repurchased
0.5 million
shares of its common stock under the share repurchase program, for a total of
$12.0 million
. The average price paid per share for the repurchase was
$23.98
per share.
Since the inception of the predecessor stock repurchase program in January 2001, the Company has repurchased
10.3 million
shares of its common stock at an average price of
$19.95
per share with an aggregate value of
$205.4 million
. The repurchase program can be implemented through open market or privately negotiated transactions at the discretion of the Company’s management. The Company will continue to determine the time and extent of any repurchases based on its evaluation of market conditions and other factors.
On May 29, 2002, the Company’s Board of Directors adopted a shareholder rights plan, pursuant to which stock purchase rights were distributed to shareholders at a rate of
one
right with respect to each share of common stock held of record as of June 10, 2002. Subsequently issued shares of common stock also carry stock purchase rights under the plan. The rights plan is designed to enhance the Board’s ability to prevent an acquirer from depriving shareholders of the long-term value of their investment and to protect shareholders against attempts to acquire the Company by means of unfair or abusive takeover tactics. Unless terminated by the Board, the rights become exercisable based upon certain limited conditions related to acquisitions of stock, tender offers and certain business combinations involving the Company. The shareholder rights plan includes a review mechanism requiring the independent members of the Company’s Board of Directors to review and evaluate the plan at least every three years to consider whether the maintenance of the plan continues to be in the best interests of the Company and its shareholders and to communicate their conclusion to the Board. The Board of Directors has delegated this responsibility to the Governance and Nominations Committee, which is composed of all independent directors of the Board. On April 24, 2012, the shareholder rights plan was amended and restated to, among other things, extend the expiration date from
June 10, 2012
to
September 30, 2018
, and to remove provisions in the rights plan stipulating that certain actions can be taken only with the concurrence of a majority of the members of the Board of Directors who are not affiliated with an acquiring person (more specifically, those who are “Continuing Directors,” as defined in the original rights plan adopted in 2002).
At
June 24, 2012
, the Company had reserved a total of approximately
17.1 million
shares of its common stock and
0.1 million
shares of its Series A preferred stock for future issuance as follows (in thousands):
|
|
Number of
Shares
|
|
|
For exercise of outstanding common stock options
|
8,800
|
|
|
For vesting of outstanding stock units
|
36
|
|
|
For future equity awards under 2004 Long-Term Incentive Compensation Plan
|
7,089
|
|
|
For future issuance under the Non-Employee Director Stock Compensation and Deferral Program
|
100
|
|
|
For future issuance to employees under the 2005 Employee Stock Purchase Plan
|
1,105
|
|
|
Total common shares reserved
|
17,130
|
|
|
Series A preferred stock reserved for exercise of rights issued under shareholders’ rights plan
|
100
|
|
70
The following presents the computation of basic earnings per share (in thousands, except per share amounts):
|
|
Fiscal Years Ended
|
||||||||||
|
|
June 24,
2012 |
June 26,
2011 |
June 27,
2010 |
||||||||
|
Basic:
|
|
|
|
||||||||
|
Net income
|
$
|
44,412
|
|
$
|
146,500
|
|
$
|
152,290
|
|
||
|
Weighted average common shares
|
114,693
|
|
108,522
|
|
102,371
|
|
|||||
|
Basic earnings per share
|
$
|
0.39
|
|
$
|
1.35
|
|
$
|
1.49
|
|
||
The following computation reconciles the differences between the basic and diluted earnings per share presentations (in thousands, except per share data):
|
|
Fiscal Years Ended
|
||||||||||
|
|
June 24,
2012 |
June 26,
2011 |
June 27,
2010 |
||||||||
|
Diluted:
|
|||||||||||
|
Net income
|
$
|
44,412
|
|
$
|
146,500
|
|
$
|
152,290
|
|
||
|
Weighted average common shares - basic
|
114,693
|
|
108,522
|
|
102,371
|
|
|||||
|
Dilutive effect of stock options, nonvested shares and ESPP purchase rights
|
532
|
|
1,513
|
|
2,327
|
|
|||||
|
Weighted average common shares - diluted
|
115,225
|
|
110,035
|
|
104,698
|
|
|||||
|
Diluted earnings per share
|
$
|
0.39
|
|
$
|
1.33
|
|
$
|
1.45
|
|
||
Potential common shares that have the effect of increasing diluted earnings per share are considered to be antidilutive and as such, these shares are not included in calculating diluted earnings per share. As of
June 24, 2012
,
June 26, 2011
and
June 27, 2010
, there were
7.0 million
,
2.0 million
and
0.4 million
, respectively, of potential common shares not included in the calculation of diluted earnings per share because their effect was antidilutive.
Overview of Employee Stock-Based Compensation Plans
The Company currently has
one
equity-based compensation plan from which stock-based compensation awards can be granted to employees and directors. The Company also assumed options that were initially granted pursuant to plans adopted by companies acquired by the Company. The Company’s plans are as follows:
71
2004 Long-Term Incentive Compensation Plan - This plan provides for awards in the form of incentive stock options, non-qualified stock options, stock appreciation rights, restricted stock, stock units and performance units. Currently, this is the only plan under which awards can be granted. In fiscal years
2012
,
2011
and
2010
, the shareholders approved increases to the number of shares authorized under the plan by
4.0 million
,
3.0 million
and
3.0 million
, respectively. As of
June 24, 2012
, there are
18.2 million
shares authorized for issuance under the plan, and
7.1 million
shares remaining for future grants.
Awards issued under the plan to date include non-qualified stock options, restricted stock, stock units and performance units.
The Company also has an Employee Stock Purchase Plan (the “2005 ESPP”) that provides employees with the opportunity to purchase common stock through payroll deductions. The Company established its original ESPP in 1999 and terminated it on October 31, 2005. As approved by the Company’s shareholders on November 3, 2005, the 2005 ESPP authorized issuance of up to
0.6 million
shares of common stock. On October 30, 2008, the Company’s shareholders approved an amendment to the 2005 ESPP, increasing the shares authorized for issuance under the plan by an additional
0.9 million
shares. On
October 25, 2011
, the Company's shareholders approved another amendment to the 2005 ESPP, increasing the shares authorized for issuance under the plan by an additional
1.0 million
shares. As of June 24, 2012, there are
2.5 million
shares authorized for issuance under the 2005 ESPP, with
1.1 million
shares remaining for future issuance.
The 2005 ESPP limits employee contributions to
15%
of each employee’s compensation (as defined in the plan) and originally allowed employees to purchase shares at a
15%
less than the fair market value of common stock on the purchase date
two
times per year. The 2005 ESPP was amended in the second quarter of fiscal 2012 to increase the six-month participation period to a twelve-month participation period, divided into two equal six month purchase periods, and to provide for a look-back feature. At the end of each six-month period in April and October, employees participating in the plan may purchase the Company's common stock through the ESPP at
15%
less than the fair market value of the common stock on the first day of the twelve-month participation period or the purchase date, whichever is lower. The plan amendment also provides for an automatic reset feature to start participants on a new twelve-month participation period if the share value declines during the first six-month purchase period.
Stock Option Awards
The following table summarizes option activity as of
June 24, 2012
and changes during the fiscal year then ended (total and shares in thousands):
|
|
Number of
Shares
|
|
Weighted-Average
Exercise price
|
|
Weighted Average
Remaining
Contractual Term
|
|
Total
Intrinsic Value
|
|||||
|
Outstanding at June 26, 2011
|
6,467
|
|
$
|
39.56
|
|
|
|
|||||
|
Granted
|
3,139
|
|
30.56
|
|
|
|
||||||
|
Exercised
|
(217
|
)
|
23.12
|
|
|
|
||||||
|
Forfeited or expired
|
(589
|
)
|
40.28
|
|
|
|
||||||
|
Outstanding at June 24, 2012
|
8,800
|
|
$
|
36.71
|
|
4.71
|
$
|
3,704
|
|
|||
|
Vested and expected to vest at June 24, 2012
|
8,646
|
|
$
|
36.75
|
|
4.69
|
$
|
3,697
|
|
|||
|
Exercisable at June 24, 2012
|
3,760
|
|
$
|
34.69
|
|
3.46
|
$
|
3,599
|
|
|||
The total intrinsic value in the table above represents the total pretax intrinsic value, which is the total difference between the closing price of the Company’s common stock on
June 22, 2012
(the last trading day of fiscal
2012
) of
$24.45
and the exercise price for in-the-money options that would have been received by the holders if all instruments had been exercised on
June 24, 2012
. As of
June 24, 2012
, there was
$46.3 million
of unrecognized compensation cost related to nonvested stock options, which is expected to be recognized over a weighted average period of
1.68
years.
72
The following table summarizes information about stock options outstanding and exercisable at
June 24, 2012
(shares in thousands):
|
|
Options Outstanding
|
|
Options Exercisable
|
||||||||||||
|
Range of Exercise Price
|
Number
|
|
Weighted Average
Remaining Contractual
Life (Years)
|
|
Weighted Average Exercise Price
|
|
Number
|
|
Weighted Average Exercise Price
|
||||||
|
$0.01 to $30.33
|
1,886
|
|
2.91
|
$
|
23.46
|
|
1,659
|
|
$
|
23.24
|
|
||||
|
30.34 to 30.92
|
2,581
|
|
6.19
|
30.92
|
|
1
|
|
30.92
|
|
||||||
|
30.93 to 35.89
|
2,055
|
|
4.05
|
34.90
|
|
1,242
|
|
35.04
|
|
||||||
|
35.90 to 53.49
|
237
|
|
5.32
|
48.24
|
|
95
|
|
48.00
|
|
||||||
|
53.50 to 75.55
|
2,041
|
|
5.11
|
56.74
|
|
763
|
|
57.36
|
|
||||||
|
Total
|
8,800
|
|
4.71
|
$
|
36.71
|
|
3,760
|
|
$
|
34.69
|
|
||||
Other information pertaining to the Company's stock option awards is as follows (in thousands, except per share data):
|
|
Fiscal Years Ended
|
||||||||||
|
|
June 24,
2012 |
June 26,
2011 |
June 27,
2010 |
||||||||
|
Weighted average grant date fair value per share of options
|
$
|
11.67
|
|
$
|
22.83
|
|
$
|
14.58
|
|
||
|
Total intrinsic value of options exercised
|
$
|
1,605
|
|
$
|
40,042
|
|
$
|
118,162
|
|
||
Restricted Stock Awards
A summary of non-vested shares of restricted stock and stock unit awards (“RSAs” and “RSUs”) outstanding under the Company’s 2004 Long-Term Incentive Compensation Plan as of
June 24, 2012
and changes during the year then ended is as follows (in thousands, except per share data):
|
Number of
Shares/Units
|
Weighted-Average
Grant-Date Fair Value
|
|||||
|
Nonvested at June 26, 2011
|
509
|
|
$
|
40.87
|
|
|
|
Granted
|
238
|
|
30.69
|
|
||
|
Vested
|
(184
|
)
|
38.63
|
|
||
|
Forfeited
|
(46
|
)
|
36.05
|
|
||
|
Nonvested at June 24, 2012
|
517
|
|
$
|
37.41
|
|
|
As of
June 24, 2012
, there was
$13.7 million
of unrecognized compensation cost related to nonvested awards, which is expected to be recognized over a weighted average period of
2.55
years.
Stock-Based Compensation Valuation and Expense
The Company accounts for its employee stock-based compensation plan using the fair value method. The fair value method requires the Company to estimate the grant date fair value of its stock-based awards and amortize this fair value to compensation expense over the requisite service period or vesting term.
The Company currently uses the Black-Scholes option-pricing model to estimate the fair value of the Company's stock option and ESPP awards. The determination of the fair value of stock-based payment awards on the date of grant using an option-pricing model is affected by the Company’s stock price as well as assumptions regarding a number of complex and subjective variables. These variables include the expected stock price volatility over the term of the awards, actual and projected employee stock option exercise behaviors, the risk-free interest rate and expected dividends. Due to the inherent limitations of option-valuation models, future events that are unpredictable and the estimation process utilized in determining the valuation of the stock-based awards, the ultimate value realized by award holders may vary significantly from the amounts expensed in the Company’s financial statements.
73
For restricted stock and stock unit awards, the grant date fair value is based upon the market price of the Company’s common stock on the date of the grant. This fair value is then amortized to compensation expense over the requisite service period or vesting term.
Stock-based compensation expense is recorded net of estimated forfeitures such that expense is recorded only for those stock-based awards that are expected to vest. A forfeiture rate is estimated at the time of grant and revised, if necessary, in subsequent periods if actual forfeitures differ from initial estimates.
Total stock-based compensation expense was as follows (in thousands):
|
|
Fiscal Years Ended
|
||||||||||
|
Income Statement Classification:
|
June 24,
2012 |
June 26,
2011 |
June 27,
2010 |
||||||||
|
Cost of goods sold
|
$
|
7,713
|
|
$
|
5,454
|
|
$
|
3,091
|
|
||
|
Research and development
|
10,378
|
|
8,388
|
|
5,040
|
|
|||||
|
Sales, general and administrative
|
28,302
|
|
24,398
|
|
15,936
|
|
|||||
|
Total operating expenses
|
38,680
|
|
32,786
|
|
20,976
|
|
|||||
|
Total
|
$
|
46,393
|
|
$
|
38,240
|
|
$
|
24,067
|
|
||
The weighted average assumptions used to value stock option grants were as follows:
|
|
Fiscal Years Ended
|
|||||||
|
Stock Option Grants:
|
June 24,
2012 |
June 26,
2011 |
June 27,
2010 |
|||||
|
Risk-free interest rate
|
0.47
|
%
|
0.95
|
%
|
1.76
|
%
|
||
|
Expected life, in years
|
3.63
|
|
3.5
|
|
3.7
|
|
||
|
Expected volatility
|
51.7
|
%
|
56.7
|
%
|
48.4
|
%
|
||
|
Dividend Yield
|
—
|
|
—
|
|
—
|
|
||
The following describes each of these assumptions and the Company’s methodology for determining each assumption:
Risk-Free Interest Rate
The Company estimates the risk-free interest rate using the U.S. Treasury bill rate with a remaining term equal to the expected life of the award.
Expected Life
The expected life represents the period that the stock option awards are expected to be outstanding. In determining the appropriate expected life of its stock options, the Company segregates its grantees into categories based upon employee levels that are expected to be indicative of similar option-related behavior. The expected useful lives for each of these categories are then estimated giving consideration to (1) the weighted average vesting periods, (2) the contractual lives of the stock options, (3) the relationship between the exercise price and the fair market value of the Company’s common stock, (4) expected employee turnover, (5) the expected future volatility of the Company’s common stock, and (6) past and expected exercise behavior, among other factors.
Expected Volatility
The Company estimates expected volatility giving consideration to the expected life of the respective award, the Company’s current expected growth rate, implied volatility in traded options for its common stock, and the historical volatility of its common stock.
Expected Dividend Yield
The Company estimates the expected dividend yield by giving consideration to its current dividend policies as well as those anticipated in the future considering the Company’s current plans and projections. The Company does not currently calculate a discount for any post-vesting restrictions to which its awards may be subject.
74
The following are the components of income/(loss) before income taxes (in thousands):
|
|
Fiscal Years Ended
|
||||||||||
|
|
June 24,
2012 |
June 26,
2011 |
June 27,
2010 |
||||||||
|
Domestic
|
$
|
(10,682
|
)
|
$
|
110,959
|
|
$
|
153,848
|
|
||
|
Foreign
|
58,329
|
|
67,268
|
|
51,624
|
|
|||||
|
Total
|
$
|
47,647
|
|
$
|
178,227
|
|
$
|
205,472
|
|
||
The following are the components of income tax (benefit)/expense (in thousands):
|
|
Fiscal Years Ended
|
||||||||||
|
|
June 24,
2012 |
June 26,
2011 |
June 27,
2010 |
||||||||
|
Current:
|
|
|
|
||||||||
|
Federal
|
$
|
(4,031
|
)
|
$
|
31,503
|
|
$
|
45,005
|
|
||
|
Foreign
|
13,125
|
|
13,796
|
|
12,963
|
|
|||||
|
State
|
566
|
|
2,736
|
|
6,260
|
|
|||||
|
Total Current
|
$
|
9,660
|
|
$
|
48,035
|
|
$
|
64,228
|
|
||
|
Deferred:
|
|
|
|
||||||||
|
Federal
|
(6,665
|
)
|
(5,008
|
)
|
(8,180
|
)
|
|||||
|
Foreign
|
1,429
|
|
(10,825
|
)
|
(2,837
|
)
|
|||||
|
State
|
(1,189
|
)
|
(475
|
)
|
(29
|
)
|
|||||
|
Total Deferred
|
(6,425
|
)
|
(16,308
|
)
|
(11,046
|
)
|
|||||
|
Income tax expense
|
$
|
3,235
|
|
$
|
31,727
|
|
$
|
53,182
|
|
||
Actual income tax expense differed from the amount computed by applying the U.S. federal tax rate of
35%
to pre-tax earnings as a result of the following (in thousands, except percentages):
|
|
Fiscal Years Ended
|
||||||||||||||||
|
|
June 24,
2012 |
% of Income
|
June 26,
2011 |
% of Income
|
June 27,
2010 |
% of Income
|
|||||||||||
|
Federal income tax provision at statutory rate
|
$
|
16,676
|
|
35%
|
$
|
62,378
|
|
35%
|
$
|
71,916
|
|
35%
|
|||||
|
Increase (decrease) in income tax expense resulting from:
|
|
|
|
|
|
|
|||||||||||
|
State tax provision, net of federal benefit
|
68
|
|
0%
|
2,169
|
|
1%
|
4,135
|
|
2%
|
||||||||
|
Tax exempt interest
|
(1,064
|
)
|
-2%
|
(1,646
|
)
|
-1%
|
(1,089
|
)
|
-1%
|
||||||||
|
Exam settlements
|
—
|
|
0%
|
—
|
|
0%
|
1,645
|
|
1%
|
||||||||
|
48C investment tax credit
|
(4,105
|
)
|
-9%
|
(4,023
|
)
|
-2%
|
(1,401
|
)
|
-1%
|
||||||||
|
Increase (decrease) in tax reserve
|
(2,677
|
)
|
-6%
|
(2,175
|
)
|
-1%
|
(3,462
|
)
|
-2%
|
||||||||
|
Research and development credits
|
(694
|
)
|
-1%
|
(3,619
|
)
|
-2%
|
(1,092
|
)
|
-1%
|
||||||||
|
Qualified production activities deduction
|
(177
|
)
|
0%
|
(2,714
|
)
|
-2%
|
(3,945
|
)
|
-2%
|
||||||||
|
Statutory rate differences
|
(5,830
|
)
|
-12%
|
(16,117
|
)
|
-9%
|
(14,939
|
)
|
-7%
|
||||||||
|
Effect of tax rate change
|
—
|
|
0%
|
(2,998
|
)
|
-2%
|
(707
|
)
|
0%
|
||||||||
|
Other
|
1,038
|
|
2%
|
472
|
|
0%
|
2,121
|
|
1%
|
||||||||
|
Income tax expense
|
$
|
3,235
|
|
7%
|
$
|
31,727
|
|
17%
|
$
|
53,182
|
|
25%
|
|||||
75
The tax effects of temporary differences that give rise to significant portions of the deferred tax assets and deferred tax liabilities are as follows (in thousands):
|
June 24,
2012 |
June 26,
2011 |
||||||
|
Deferred tax assets:
|
|||||||
|
Compensation
|
$
|
2,594
|
|
$
|
1,494
|
|
|
|
Inventory
|
13,051
|
|
10,132
|
|
|||
|
Sales return reserve and allowance for bad debts
|
2,710
|
|
4,160
|
|
|||
|
Warranty reserve
|
2,668
|
|
—
|
|
|||
|
Federal and state net operating loss carryforwards
|
2,353
|
|
1,010
|
|
|||
|
Federal credits
|
290
|
|
—
|
|
|||
|
State credits
|
3,982
|
|
3,688
|
|
|||
|
48C investment tax credits
|
15,905
|
|
11,176
|
|
|||
|
Investments
|
980
|
|
970
|
|
|||
|
Stock-based compensation
|
27,586
|
|
16,731
|
|
|||
|
Other
|
1,056
|
|
2,071
|
|
|||
|
Total gross deferred assets
|
73,175
|
|
51,432
|
|
|||
|
Less valuation allowance
|
(1,611
|
)
|
(1,620
|
)
|
|||
|
Deferred tax assets, net
|
71,564
|
|
49,812
|
|
|||
|
Deferred tax liabilities:
|
|||||||
|
Property and equipment
|
(29,307
|
)
|
(19,590
|
)
|
|||
|
Intangible assets
|
(31,701
|
)
|
(29,952
|
)
|
|||
|
Available-for-sale securities
|
(1,570
|
)
|
(2,629
|
)
|
|||
|
Prepaid taxes and other
|
(1,045
|
)
|
(890
|
)
|
|||
|
Total gross deferred liability
|
(63,623
|
)
|
(53,061
|
)
|
|||
|
Deferred tax asset/(liability), net
|
$
|
7,941
|
|
$
|
(3,249
|
)
|
|
The components giving rise to the net deferred tax assets (liabilities) have been included in the accompanying Consolidated Balance Sheet as follows (in thousands):
|
|
Balance at June 24, 2012
|
||||||||||||||
|
|
Asset
|
Liabilities
|
|||||||||||||
|
|
Current
|
Noncurrent
|
Current
|
Noncurrent
|
|||||||||||
|
U.S. federal income taxes
|
$
|
13,461
|
|
$
|
—
|
|
$
|
—
|
|
$
|
(15,735
|
)
|
|||
|
Hong Kong and other income taxes
|
8,283
|
|
1,931
|
*
|
—
|
|
—
|
|
|||||||
|
|
$
|
21,744
|
|
$
|
1,931
|
|
$
|
—
|
|
$
|
(15,735
|
)
|
|||
|
*
|
This amount is included in Other Assets on the Consolidated Balance Sheets.
|
|
|
Balance at June 26, 2011
|
||||||||||||||
|
|
Asset
|
Liabilities
|
|||||||||||||
|
|
Current
|
Noncurrent
|
Current
|
Noncurrent
|
|||||||||||
|
U.S. federal income taxes
|
$
|
10,072
|
|
$
|
—
|
|
$
|
—
|
|
$
|
(21,902
|
)
|
|||
|
Hong Kong and other income taxes
|
7,785
|
|
796
|
*
|
—
|
|
—
|
|
|||||||
|
|
$
|
17,857
|
|
$
|
796
|
|
$
|
—
|
|
$
|
(21,902
|
)
|
|||
|
*
|
This amount is included in Other Assets on the Consolidated Balance Sheets.
|
76
During fiscal 2010, the Company was notified by the Internal Revenue Service that it had been allocated
$39 million
of federal tax credits as part of the American Recovery and Reinvestment Act of 2009 (Internal Revenue Section 48C). This
$39 million
allocation was based upon the Company projecting that it would put into service approximately
$130 million
of qualified equipment into its United States manufacturing locations over the next
three
years. During fiscal 2010, 2011 and 2012, the Company has generated
$10.8 million
,
$23.7 million
and
$4.5 million
of 48C credit, respectively. The tax benefit (net of related basis adjustments) will be amortized into income over the useful life (
5
years) of the underlying equipment that was placed in service to generate these credits. Since fiscal 2010, the Company has recognized an income tax benefit of
$9.5 million
related to the credits generated to date, with
$4.1 million
of this amount recognized as a tax benefit for the year ended June 24, 2012.
As of
June 24, 2012
the Company has approximately
$10.7 million
of state net operating loss carryovers against which a full valuation allowance has been recorded. Furthermore, the Company has approximately
$0.8 million
of alternative minimum tax credits carryforwards and
$3.5 million
of 48C credit carryforwards that relate to excess stock option benefits which, if and when realized, will credit additional paid in capital. Additionally, the Company has
$6.1 million
of state income tax credit carryforwards. The state net operating loss carryovers will begin to expire in fiscal 2015 and the state income tax credit carryforwards will begin to expire in fiscal 2016.
U.S. GAAP requires a two-step approach to recognizing and measuring uncertain tax positions. The first step is to evaluate the tax position for recognition by determining if the weight of available evidence indicates that it is more likely than not that the position will be sustained on audit, including resolution of related appeals or litigation processes, if any. The second step is to measure the tax benefit as the largest amount that is cumulatively more than 50% likely to be realized upon ultimate settlement.
During fiscal
2012
, the Company recognized a net decrease in total unrecognized tax benefits of
$2.6 million
as a result of the settlement of prior year tax audits and statute expirations in the United States and Hong Kong. As a result, the total amount of unrecognized tax benefits as of
June 24, 2012
is
$4.4 million
. Of the
$4.4 million
total unrecognized tax benefits,
$4.4 million
represents tax positions that, if recognized, would impact the effective tax rate. Although timing of the resolution and/or closure on audits is highly uncertain, the Company believes it is reasonably possible that approximately
$2.2 million
of gross unrecognized tax benefits will change in the next
12
months as a result of pending audit settlements or statute expirations.
The following is a tabular reconciliation of the Company’s change in uncertain tax positions (in thousands):
|
|
June 24,
2012 |
June 26,
2011 |
|||||
|
Beginning Balance
|
$
|
6,987
|
|
$
|
7,602
|
|
|
|
Increases related to prior year tax positions
|
—
|
|
741
|
|
|||
|
Decreases related to prior year tax positions
|
(1,966
|
)
|
—
|
|
|||
|
Expiration of statute of limitations for assessment of taxes
|
(600
|
)
|
(1,356
|
)
|
|||
|
Ending Balance
|
$
|
4,421
|
|
$
|
6,987
|
|
|
The Company’s policy is to include interest and penalties related to unrecognized tax benefits within the income tax expense line item in the Consolidated Statements of Income. As of
June 24, 2012
, the Company accrued
$42 thousand
for the payment of interest related to unrecognized tax benefits.
The Company files U.S. federal, U.S. state and foreign tax returns. For U.S. federal purposes, the Company is generally no longer subject to examinations for fiscal years ended June 29, 2009 and prior. During the third quarter of fiscal 2012, the Company settled its federal examination with the Internal Revenue Service for fiscal 2009. For foreign purposes, the Company is no longer subject to examination for tax periods 2002 and prior. Certain carryforward tax attributes generated in prior years remain subject to examination and adjustment. For U.S. state tax returns the Company is generally no longer subject to tax examinations for fiscal years prior to 2009. The Company is also currently under inquiry by the Hong Kong Inland Revenue Department for fiscal 2008 through fiscal 2010.
The Company provides for U.S. income taxes on the earnings of foreign subsidiaries unless the subsidiaries’ earnings are considered indefinitely reinvested outside the United States. As of
June 24, 2012
, U.S. income taxes were not provided for on a cumulative total of approximately
$229.0 million
of undistributed earnings for certain non-U.S. subsidiaries, as the Company currently intends to reinvest these earnings in these foreign operations indefinitely. Determination of the amount of any deferred tax liability on these undistributed earnings is not practicable.
77
During fiscal 2011, the Company was awarded a tax holiday in Malaysia with respect to its manufacturing and distribution operations. As a result of this arrangement, which allows for
0%
tax for
10
years starting in fiscal 2011, the Company's net income increased by
$2.1 million
and
$1.8 million
in fiscal
2012
and fiscal
2011
, respectively (
$0.02
per basic share and
$0.02
per diluted share in each year).
Warranties
The following table summarizes the changes in the Company’s product warranty liabilities (in thousands):
|
|
Fiscal Years Ended
|
||||||||||
|
|
June 24,
2012 |
June 26,
2011 |
June 27,
2010 |
||||||||
|
Balance at beginning of period
|
$
|
2,235
|
|
$
|
1,308
|
|
$
|
662
|
|
||
|
Acquisition related warranties (See Note 3)
|
5,623
|
|
—
|
|
—
|
|
|||||
|
Warranties accrued in current period
|
1,055
|
|
1,573
|
|
990
|
|
|||||
|
Changes in estimates for pre-existing warranties
|
(878
|
)
|
(125
|
)
|
(97
|
)
|
|||||
|
Expenditures
|
(2,522
|
)
|
(521
|
)
|
(247
|
)
|
|||||
|
Balance at end of period
|
$
|
5,513
|
|
$
|
2,235
|
|
$
|
1,308
|
|
||
Product warranties are estimated and recorded at the time the Company recognizes revenue. The warranty periods range from
ninety
days to
ten
years. The Company estimates these warranty liabilities as a percentage of revenue, based on historical knowledge of warranty costs and expected future warranty costs. The Company evaluates its warranty reserve on a quarterly basis. If actual product failure rates materially differ from the Company's estimates, revisions to the estimated warranty liability are recorded in the period in which they are determined.
Lease Commitments
The Company primarily leases manufacturing, office, housing and warehousing space under the terms of non-cancelable operating leases. These leases expire at various times through
November 2017
. The Company records net rent expense on a straight-line basis over the life of the lease. Rent expense associated with these operating leases totaled approximately
$4.6 million
,
$3.0 million
and
$2.7 million
for each of the fiscal years ended
June 24, 2012
,
June 26, 2011
and
June 27, 2010
, respectively. Certain agreements require that the Company pay property taxes and general property maintenance in addition to the minimum rental payments. Future minimum rental payments as of
June 24, 2012
(under leases currently in effect) are as follows, (in thousands):
|
Fiscal Years Ending
|
Minimum Rental
Amount
|
||
|
June 30, 2013
|
$
|
3,239
|
|
|
June 29, 2014
|
3,094
|
|
|
|
June 28, 2015
|
2,658
|
|
|
|
June 26, 2016
|
2,033
|
|
|
|
June 25, 2017
|
1,555
|
|
|
|
Thereafter
|
157
|
|
|
|
Total
|
$
|
12,736
|
|
Litigation
The Company is currently a party to various legal proceedings, including certain of the proceedings noted in this section. While management presently believes that the ultimate outcome of these proceedings, individually and in the aggregate, will not materially harm the Company’s financial position, cash flows, or overall trends in results of operations, legal proceedings are subject to inherent uncertainties, and unfavorable rulings could occur. An unfavorable ruling could include money damages
78
or, in matters for which injunctive relief or other conduct remedies are sought, an injunction prohibiting the Company from selling one or more products at all or in particular ways. Were unfavorable final outcomes to occur, there exists the possibility of a material adverse impact on the Company’s business, results of operation, financial position, and overall trends. Except as may be otherwise indicated, the outcomes in these matters are not reasonably estimable.
SemiLEDs Litigation
The Company is the plaintiff in an action against SemiLEDs Corporation and its subsidiaries, Helios Crew Corp. and SemiLEDs Optoelectronics Co., Ltd. (collectively "SemiLEDs"), commenced October 8, 2010 in the U.S. District Court for the District of Delaware. The complaint as amended seeks injunctive relief and damages and alleges that the defendants are infringing
six
U.S. patents owned by the Company relating to light-emitting diodes: No. 7,737,459, entitled "High Output Group III Nitride Light Emitting Diodes"; No. 7,211,833, entitled "Light Emitting Diodes Including Barrier Layers/Sublayers"; No. 7,611,915, entitled "Methods for Manufacturing Light Emitting Diodes Including Barrier Layers/Sublayers"; No. 6,657,236, entitled "Enhanced Light Extraction in LEDs Through the Use of Internal and External Optical Elements"; No. 7,795,623, entitled "Light Emitting Devices Having Current Reducing Structures and Methods of Forming Light Emitting Devices Having Current Reducing Structures"; and No. 7,557,380, entitled "Light Emitting Devices Having a Reflective Bond Pad and Methods of Fabricating Light Emitting Devices Having Reflective Bond Pads." The defendants have filed an answer and counterclaims in which they deny any infringement and seek a declaratory judgment that all of the patents are invalid and that
one
of the patents is unenforceable.
SemiLEDs Corporation and SemiLEDs Optoelectronics Co., Ltd. filed a complaint against the Company in the U.S. District Court for the District of Delaware on August 15, 2011. The complaint seeks injunctive relief and damages for alleged infringement of
three
U.S. patents relating to light-emitting diodes: No. 7,615,789, entitled "Vertical Light Emitting Diode Device Structure"; No. 7,646,033, entitled "Systems and Methods for Producing White-Light Emitting Diodes"; and No. D580,888 entitled "Light Emitting Diode Device with Electrode." In October 2011, the Company filed an answer and counterclaims in which the Company denies any infringement and seeks a declaratory judgment that the asserted claims of the SemiLEDs patents are invalid. In addition, the Company asserted counterclaims against SemiLEDs Corporation and SemiLEDs Optoelectronics Co. seeking injunctive relief and damages for infringement of the following additional U.S. patents owned by the Company relating to light-emitting diodes: No. 6,958,497, entitled "Group III Nitride Based Light Emitting Diode Structures with a Quantum Well and Superlattice, Group III Nitride Based Quantum Well Structures and Group III Nitride Based Superlattice Structures"; and No. 6,515,313, entitled "Efficiency Light Emitters with Reduced Polarization-Induced Charges."
In June 2012, the parties entered into a settlement agreement pursuant to which SemiLEDs agreed to the entry of an injunction effective October 1, 2012 that prohibits the importation and sale of the SemiLEDs accused products in the United States and made a one-time payment to the Company for past damages. The remaining claims of all parties were dismissed without prejudice.
Cooper Lighting Litigation
Ruud Lighting, Inc. filed a complaint for patent infringement against Cooper Lighting, LLC in the U.S. District Court for the Eastern District of Wisconsin on April 2, 2010. The complaint as amended seeks injunctive relief and damages for infringement of
two
U.S. patents owned by Ruud Lighting: No. 7,686,469, entitled "LED Lighting Fixture"; and No. 7,891,835, entitled “Light-Directed Apparatus with Protected Reflector-Shield and Lighting Fixture Utilizing Same.” Cooper Lighting has filed an answer and counterclaims in which it denies any infringement and seeks a declaratory judgment that the asserted claims of the patents are invalid. On May 23, 2012, Ruud Lighting filed a second complaint for patent infringement against Cooper Lighting, LLC in the U.S. District Court for the Eastern District of Wisconsin. The complaint seeks injunctive relief and damages for infringement of a third U.S. patent owned by Ruud Lighting, No. 7,952,262, entitled “Modular LED Unit Incorporating Interconnected Heat Sinks Configured To Mount and Hold Adjacent LED Modules."
Illumination Management Solutions, Inc., a subsidiary of Cooper Lighting, LLC, filed a complaint for patent infringement against Ruud Lighting in the U.S. District Court for the Eastern District of Texas on June 7, 2010. The action was later transferred to the U.S. District Court for the Eastern District of Wisconsin. As amended in January 2012, the complaint alleges that Ruud Lighting is infringing
two
U.S. patents owned by Illumination Management Solutions, No. 7,674,018 and No. 7,993,036, each entitled "LED Device for Wide Beam Generation." It also alleges that Ruud Lighting and its then president, Alan Ruud, who served on the plaintiff's board of directors in 2006 and 2007 when Ruud Lighting was a shareholder of the plaintiff, conspired to misuse confidential information obtained from the plaintiff to file patent applications and to obtain patents assigned to Ruud Lighting. The complaint seeks injunctive relief, damages and ownership of any interest in the patent applications and patents alleged to have been wrongfully filed and obtained.
79
Ruud Lighting is a defendant in an action commenced by Illumination Management Solutions in the U.S. District Court for the Central District of California on June 8, 2010 and later transferred to the U.S. District Court for the Eastern District of Wisconsin. As amended in December 2011, the complaint names as defendants Ruud Lighting and
two
of its employees, Alan Ruud and Christopher Ruud, and asserts that the defendants engaged in wrongful acts arising out of the relationship between the plaintiff and Ruud Lighting in 2006 and 2007 when Ruud Lighting was a shareholder of the plaintiff and Alan Ruud served on the plaintiff's board of directors. The complaint alleges that the defendants breached fiduciary duties and otherwise acted improperly by pursuing a plan to compete with the plaintiff and that the defendants misused trade secrets and other information obtained from the plaintiff as fiduciaries and subject to a non-disclosure agreement. These allegedly wrongful acts included filing patent applications and obtaining patents assigned to Ruud Lighting on inventions claimed by the plaintiff. The complaint also alleges that Ruud Lighting: (a) marketed its LED products without reference to certain optical technology claimed by the plaintiff, thereby breaching a marketing agreement with the plaintiff and engaging in unfair competition and false advertising; (b) breached the marketing agreement by failing to give the plaintiff a right of first refusal to integrate the plaintiff's optical technology into Ruud Lighting LED products; and (c) committed fraud by entering into the marketing agreement without any intention to perform it. The complaint further alleges that the plaintiff is entitled to a correction of the inventors named in
one
or more patents to add a founder of the plaintiff as an inventor. The complaint seeks to recover damages, all profits and other gains realized by defendants as a result of the acts complained of, attorneys' fees, ownership of any interest in the patent applications and patents alleged to have been wrongfully filed and obtained, and correction of the named inventors on
one
or more patents.
Dynacraft Industries Litigation
On April 29, 2009, Dynacraft Industries Sdn Bhd commenced an action against the Company and Cree Malaysia Sdn Bhd, a subsidiary of the Company, in Malaysia in a filing with the High Court of Malaysia at Pulau Pinang (Penang).
The statement of claim filed in the action alleges that the Cree defendants breached an agreement to purchase from Dynacraft certain real property in Malaysia for a contract price of
38,000,000
Malaysia ringgit (approximately
$10.8 million
) and seeks an award of damages in an unspecified amount. The Cree defendants have filed defenses denying liability for damages.
The Fox Group Litigation
The Fox Group, Inc. filed a complaint for patent infringement against the Company in the U.S. District Court for the Eastern District of Virginia on June 29, 2010. The complaint, which sought injunctive relief and damages, asserted that the Company was infringing
two
U.S. patents relating to high quality silicon carbide material: No. 6,534,026, entitled "Low Defect Density Silicon Carbide" (the "'026 patent"); and No. 6,562,130, entitled "Low Defect Axially Grown Single Crystal Silicon Carbide" (the "'130 patent"). The district court granted summary judgment in favor of the Company in August 2011. The court determined that the Company did not infringe the '026 patent and that the claims of the '130 patent asserted against the Company are invalid. The Fox Group has filed a notice of appeal to the U.S. Court of Appeals for the Federal Circuit.
Dow Corning Litigation
Dow Corning Compound Semiconductor Solutions, LLC filed a complaint against the Company in the U.S. District Court for the Eastern District of Michigan on September 27, 2011. The complaint, as subsequently amended, seeks a declaratory judgment that the plaintiff does not infringe
three
U.S. patents owned by the Company relating to high quality silicon carbide materials and that the patents are invalid. The patents in suit are: No. 7,294,324, entitled “Low Basal Plane Dislocation Bulk Grown SiC Wafers”; No. 7,314,520, entitled “Low 1C Screw Dislocation 3 Inch Silicon Carbide Wafer”; and No. 7,314,521, entitled “Low Micropipe 100 MM Silicon Carbide Wafer.” The Company has moved the court to dismiss the action for lack of subject matter jurisdiction on the grounds that at the time the complaint was filed there was no substantial or immediate controversy between the parties regarding the patents-in-suit.
Schubert Litigation
E. Fred Schubert filed a complaint for patent infringement against the Company in the U.S. District Court for the District of Delaware on July 18, 2012. The complaint seeks injunctive relief and damages for alleged infringement of U.S. patent No. 6,294,475, entitled “Crystallographic Wet Chemical Etching of III-Nitride Material."
80
The Company discloses information concerning its reportable segments in accordance with Accounting Standards Codification (ASC) 280, “Segment Reporting." Reportable segments are components of an entity that have separate financial data that the entity's chief operating decision maker regularly reviews when allocating resources and assessing the performance. The Company's chief operating decision maker is the Chief Executive Officer.
During the fourth quarter of fiscal 2012, the Company completed modification of its internal management and reporting structure along
three
operating segments. In reviewing these operating segments under ASC 280 for segment reporting purposes, the Company determined that the Company's operating segments are consistent with its reportable segments. This determination was based primarily on information the Chief Executive Officer now utilizes to evaluate operations and allocate resources. Other factors used to identify the Company's reportable segments included manufacturing processes, customer base, sales and marketing strategies, and distribution channels. Thus, the Company's operating and reportable segments include:
|
•
|
LED Products
|
|
•
|
Lighting Products
|
|
•
|
Power and RF Products
|
The Company's Chief Executive Officer reviews segment performance and allocates resources based upon segment revenues and segment gross profit.
Reportable Segments Description
LED Products Segment
The Company's LED Products segment includes LED chips, LED components, and SiC wafers.
LED Chips
LED Chip products include blue and green devices made from GaN and other materials. LED Chips or “die” are solid-state electronic components used in a number of applications and are currently available in a variety of brightness levels, wavelengths (color) and sizes. The Company uses LED chips internally in the manufacturing of LED components. LED Chips are also sold externally to customers for use in a variety of applications including video screens, gaming displays, function indicator lights, and automotive backlighting.
LED Components
LED component products include a range of packaged LED products from the Company's XLamp
®
LED components and LED modules for lighting applications to the Company's high-brightness LED components.
The Company's XLamp LED components are lighting class packaged LED products designed to meet a broad range of market needs for lighting applications including general illumination (both indoor and outdoor applications), portable, architectural, signal and transportation lighting. The LED Components segment produces XLamp LED components for use by the Company's LED lighting segment (described below). The LED Components segment also sells XLamp LED components externally to manufacturing customers and manufacturing distributors for use in a variety of lighting applications.
The Company's high brightness LED components consist of surface mount (SMD) and through-hole packaged LED products. The SMD LED component products are available in a full range of colors designed to meet a broad range of market needs. These products are sold to manufacturing customers and distributors in the video, signage, general illumination, automotive, gaming and specialty lighting markets.
SiC Wafers
The Company's SiC wafers are targeted for customers who use the wafers to manufacture products for optoelectronics, RF, power switching and other applications. Corporate, government and university customers also buy SiC materials for research and development directed at optoelectronics, RF, and high power devices. The Company sells its wafers as a bare wafer or with epitaxial films of SiC or GaN materials.
81
Lighting Products Segment
The Company's Lighting Products segment consists of both LED and traditional lighting systems. The Company designs, manufactures and sells lighting systems for indoor and outdoor applications, with its primary focus on LED lighting systems for the commercial and industrial markets. Lighting products are primarily sold to distributors who serve the indoor and outdoor lighting consumer and business-to-business markets.
Power and RF Products Segment
The Company's Power and RF Products segment includes power devices and RF devices.
Power Devices
The Company's power products are made from SiC and provide faster switching speeds than comparable silicon-based power devices for a given power level. Power products are sold primarily to government contractors and distributors.
RF Devices
The Company's RF devices are made from SiC or GaN and produce higher power densities as compared to silicon or gallium arsenide. RF devices are sold primarily to government contractors and distributors.
Financial Results by Reportable Segment
The following table reflects the results of the Company's reportable segments as reviewed by the Company's Chief Executive Officer for fiscal
2012
,
2011
and
2010
. The Company uses substantially the same accounting policies to derive the segment results reported below as those used in the Company's consolidated financial statements.
The Company's Chief Executive Officer does not review inter-segment revenue when evaluating segment performance and allocating resources to each segment. Thus, inter-segment revenue is not included in the segment revenues presented in the following table. As such, total segment revenue in the table below is equal to the Company's consolidated revenue.
In order to assign gross profit to each reportable segment, the Company allocates direct costs and indirect costs to each segment's cost of sales. The Company allocates indirect costs, such as employee benefits for manufacturing employees, shared facilities services, information technology, purchasing, and customer service, when the costs are identifiable and beneficial to the reportable segment. The Company allocates these indirect costs based on a reasonable measure of utilization that considers the specific facts and circumstances of the costs being allocated.
Unallocated costs in the table below are not allocated to the reportable segments' gross profit because the Company's Chief Executive Officer does not review these costs when evaluating segment performance and allocating resources to each segment. These unallocated costs include variable compensation costs for manufacturing employees consisting primarily of stock-based compensation, expenses for profit sharing and quarterly or annual incentive plans, matching contributions under the Company's 401(k) plan, and acquisition related costs.
82
The Company's Chief Executive Officer reviews gross profit as the lowest and only level of segment profit. Income statement items below gross profit, including corporate operating expenses (e.g., research and development, executive management cost, broad based sales and marketing, human resources, legal, accounting, finance, treasury), non-operating income/expense, net interest income, and income tax expense are not allocated to the reportable segments because the Company's Chief Executive Officer only reviews them on a consolidated basis. As such, all items below gross profit on the Consolidated Statements of Income can be added to consolidated gross profit presented in the following table to arrive at the Company's consolidated income before income taxes.
|
Revenues
|
Gross Profit
|
||||||||||||||||||||||
|
(in thousands)
|
Year Ended
|
Year Ended
|
|||||||||||||||||||||
|
June 24,
2012 |
June 26, 2011
|
June 27, 2010
|
June 24, 2012
|
June 26, 2011
|
June 27, 2010
|
||||||||||||||||||
|
LED Products
|
|
$756,924
|
|
|
$808,207
|
|
|
$747,431
|
|
|
$290,642
|
|
|
$375,424
|
|
|
$379,806
|
|
|||||
|
Lighting Products
|
334,704
|
|
81,784
|
|
42,516
|
|
103,396
|
|
23,686
|
|
12,041
|
|
|||||||||||
|
Power and RF Products
|
73,030
|
|
97,624
|
|
77,340
|
|
32,051
|
|
49,828
|
|
34,358
|
|
|||||||||||
|
Total segment reporting
|
|
$1,164,658
|
|
|
$987,615
|
|
|
$867,287
|
|
426,089
|
|
448,938
|
|
426,205
|
|
||||||||
|
Unallocated costs
|
(16,627
|
)
|
(13,165
|
)
|
(15,098
|
)
|
|||||||||||||||||
|
Consolidated gross profit
|
|
$409,462
|
|
|
$435,773
|
|
|
$411,107
|
|
||||||||||||||
Assets by Reportable Segment
Inventory is the only asset reviewed by the Company's Chief Executive Officer when evaluating segment performance and allocating resources to the segments. The following table sets forth the Company's inventory by reportable segment for the fiscal years ended
June 24, 2012
and
June 26, 2011
.
Unallocated inventory in the table below is not allocated to the reportable segments because the Company's Chief Executive Officer does not review it when evaluating performance and allocating resources to each segment. Unallocated inventory primarily includes variable compensation costs for manufacturing employees consisting primarily of stock-based compensation, bonuses and matching contributions under the Company's 401(k) plan.
The Company does not allocate assets other than inventory to the reportable segments because the Company's Chief Executive Officer does not review them when assessing segment performance and allocating resources. The Chief Executive Officer reviews all of the Company's assets other than inventory on a consolidated basis.
|
Inventory, Net
|
|||||||
|
(in thousands)
|
Year Ended
|
||||||
|
June 24, 2012
|
June 26, 2011
|
||||||
|
LED Products
|
$
|
109,262
|
|
$
|
139,990
|
|
|
|
Lighting Products
|
69,330
|
|
24,470
|
|
|||
|
Power and RF Products
|
6,100
|
|
8,618
|
|
|||
|
Total segment reporting
|
184,692
|
|
173,078
|
|
|||
|
Unallocated inventory
|
4,157
|
|
3,404
|
|
|||
|
Consolidated inventory, net
|
$
|
188,849
|
|
$
|
176,482
|
|
|
83
Geographic Information
The Company conducts business in several geographic areas. The following table sets forth the percentage of revenues from external customers by geographic area for fiscal
2012
,
2011
and
2010
:
|
|
Revenues from External Customers
|
|||||||
|
|
For the Years Ended
|
|||||||
|
|
June 24, 2012
|
June 26, 2011
|
June 27, 2010
|
|||||
|
China
|
32
|
%
|
36
|
%
|
40
|
%
|
||
|
United States
|
38
|
%
|
24
|
%
|
19
|
%
|
||
|
Europe
|
14
|
%
|
14
|
%
|
13
|
%
|
||
|
South Korea
|
2
|
%
|
4
|
%
|
10
|
%
|
||
|
Japan
|
8
|
%
|
7
|
%
|
9
|
%
|
||
|
Malaysia
|
2
|
%
|
2
|
%
|
2
|
%
|
||
|
Taiwan
|
1
|
%
|
5
|
%
|
4
|
%
|
||
|
Other
|
3
|
%
|
8
|
%
|
3
|
%
|
||
|
Total
|
100
|
%
|
100
|
%
|
100
|
%
|
||
The following table sets forth the Company’s net property and equipment by country for the fiscal years ended
June 24, 2012
and
June 26, 2011
(in thousands) :
|
|
Long-Lived Assets
|
||||||
|
|
As of
|
||||||
|
|
June 24,
2012 |
June 26,
2011 |
|||||
|
United States
|
$
|
452,249
|
|
$
|
402,783
|
|
|
|
China
|
125,868
|
|
143,846
|
|
|||
|
Malaysia
|
3,163
|
|
9,300
|
|
|||
|
Other
|
1,181
|
|
$
|
—
|
|
||
|
Total
|
$
|
582,461
|
|
$
|
555,929
|
|
|
Financial instruments, which may subject the Company to a concentration of risk, consist principally of short-term investments, cash equivalents, and accounts receivable. Short-term investments consist primarily of high-grade corporate debt, commercial paper, government securities and other investments at interest rates that vary by security. The Company’s cash equivalents consist primarily of money market funds. Certain bank deposits may at times be in excess of the FDIC insurance limits.
The Company sells its products on account to manufacturers, distributors and others worldwide and generally requires no collateral. When title has transferred and the earnings process is complete, the Company records revenue and related accounts receivable.
The following customers individually accounted for more than
10%
of the consolidated accounts receivable balance as of the following fiscal year-ends:
|
June 24,
2012 |
June 26,
2011 |
||||
|
Arrow Electronics, Inc.
|
14
|
%
|
17
|
%
|
|
|
World Peace Industrial Co., Ltd.
|
14
|
%
|
12
|
%
|
|
84
The Company derived its product revenue from sales to customers who individually represented more than
10%
of consolidated revenue as follows:
|
|
Fiscal Years Ended
|
|||||||
|
|
June 24,
2012 |
June 26,
2011 |
June 27,
2010 |
|||||
|
Arrow Electronics, Inc.
|
18
|
%
|
20
|
%
|
19
|
%
|
||
|
World Peace Industrial Co., Ltd.
|
10
|
%
|
10
|
%
|
11
|
%
|
||
Arrow Electronics, Inc. and World Peace Industrial Co., Ltd. are customers of the LED Products segment and the Power and RF Products segment.
The Company sponsors
one
employee benefit plan (the “Plan”) pursuant to Section 401(k) of the Internal Revenue Code of 1986, as amended. All U.S. employees are eligible to participate under the Plan on the first day of a new fiscal month after the date of hire. Under the Plan, there is
no
fixed dollar amount of retirement benefits; rather, the Company matches a defined percentage of employee deferrals, and employees vest in these matching funds over time. Employees choose their investment elections from a list of available investment options. During the fiscal years ended
June 24, 2012
,
June 26, 2011
and
June 27, 2010
, the Company contributed approximately
$4.7 million
,
$3.9 million
and
$3.1 million
to the Plan, respectively. The Pension Benefit Guaranty Corporation does not insure the Plan.
On
August 17, 2011
, in connection with the Company's acquisition of Ruud Lighting,
two
of the prior shareholders of Ruud Lighting, Alan Ruud and Christopher Ruud, executed offer letters for continued employment with Ruud Lighting. Also on
August 17, 2011
, subsequent to the Company's acquisition of Ruud Lighting and pursuant to an Aircraft Purchase and Sale Agreement and a Joint Ownership Agreement with Ruud Lighting, each of Alan Ruud (through LSA, LLC, a limited liability company of which Mr. Ruud is the sole member (“LSA”)) and Christopher Ruud (through Light Speed Aviation, LLC, a limited liability company of which Christopher Ruud is the sole member (“Light Speed”)) acquired a
10%
interest in an aircraft previously purchased by Ruud Lighting, resulting in Ruud Lighting owning an
80%
interest in the aircraft. Each of LSA and Light Speed acquired its ownership in the aircraft for a purchase price of approximately
$0.9 million
for a combined interest of
20%
or
$1.9 million
which is included in the Consolidated Statements of Cash Flow as cash provided by investing activities, under the caption "Purchase of Ruud, net of cash acquired."
Pursuant to the Joint Ownership Agreement, each of LSA and Light Speed is responsible for its share of flight crew, direct, fixed and other expenses attributable to its use of the aircraft. During fiscal
2012
, the Company billed LSA and Light Speed
$230 thousand
and
$181 thousand
, respectively, for use of the aircraft. Of these billed amounts, the Company has been reimbursed by LSA and Light Speed for
$230 thousand
and
$181 thousand
, respectively, as of
June 24, 2012
.
In July 2010, Mark Swoboda was appointed Chief Executive Officer of Intematix Corporation ("Intematix"). Mark Swoboda is the brother of the Company’s Chairman, Chief Executive Officer and President, Charles M. Swoboda. For a number of years the Company has purchased raw materials from Intematix pursuant to standard purchase orders in the ordinary course of business.
During fiscal
2012
, the Company purchased
$1.9 million
of raw materials from Intematix, and the Company had
$0.4 million
outstanding payable to Intematix as of
June 24, 2012
. During fiscal
2011
, the Company purchased
$0.8 million
of raw materials from Intematix, and the Company had
$0.1 million
outstanding payable to Intematix as of
June 26, 2011
.
85
The following is a summary of the Company’s consolidated quarterly results of operations for each of the fiscal years ended
June 24, 2012
and
June 26, 2011
(in thousands, except per share data):
|
September 25,
2011 |
December 25,
2011 |
March 25,
2012 |
June 24,
2012 |
Fiscal Year 2012
|
|||||||||||||||
|
Revenue, net
|
$
|
268,980
|
|
$
|
304,118
|
|
$
|
284,801
|
|
$
|
306,759
|
|
$
|
1,164,658
|
|
||||
|
Cost of revenue, net
|
170,952
|
|
199,000
|
|
185,388
|
|
199,856
|
|
755,196
|
|
|||||||||
|
Gross profit
|
98,028
|
|
105,118
|
|
99,413
|
|
106,903
|
|
409,462
|
|
|||||||||
|
Net income
|
12,819
|
|
12,078
|
|
9,489
|
|
10,026
|
|
44,412
|
|
|||||||||
|
Earnings (loss) per share:
|
|||||||||||||||||||
|
Basic
|
$
|
0.11
|
|
$
|
0.10
|
|
$
|
0.08
|
|
$
|
0.09
|
|
$
|
0.39
|
|
||||
|
Diluted
|
$
|
0.11
|
|
$
|
0.10
|
|
$
|
0.08
|
|
$
|
0.09
|
|
$
|
0.39
|
|
||||
|
|
September 26,
2010 |
December 26,
2010 |
March 27,
2011 |
June 26,
2011 |
Fiscal Year 2011
|
||||||||||||||
|
Revenue, net
|
$
|
268,437
|
|
$
|
256,983
|
|
$
|
219,168
|
|
$
|
243,027
|
|
$
|
987,615
|
|
||||
|
Cost of revenue, net
|
137,908
|
|
135,837
|
|
127,773
|
|
150,324
|
|
551,842
|
|
|||||||||
|
Gross profit
|
130,529
|
|
121,146
|
|
91,395
|
|
92,703
|
|
435,773
|
|
|||||||||
|
Net income
|
58,036
|
|
49,775
|
|
18,881
|
|
19,808
|
|
146,500
|
|
|||||||||
|
Earnings (loss) per share:
|
|||||||||||||||||||
|
Basic
|
$
|
0.54
|
|
$
|
0.46
|
|
$
|
0.17
|
|
$
|
0.18
|
|
$
|
1.35
|
|
||||
|
Diluted
|
$
|
0.53
|
|
$
|
0.45
|
|
$
|
0.17
|
|
$
|
0.18
|
|
$
|
1.33
|
|
||||
None.
Disclosure Controls and Procedures
Our management, with the participation of our Chief Executive Officer and Interim Chief Financial Officer, has evaluated the effectiveness of our disclosure controls and procedures (as such term is defined in Rules 13a-15(e) and 15d-15(e) under the Exchange Act) as of the end of the period covered by this Form 10-K. Based on such evaluation, our Chief Executive Officer and Interim Chief Financial Officer concluded that, as of the end of the period covered by this Form 10-K, our disclosure controls and procedures are effective in that they provide reasonable assurances that the information we are required to disclose in the reports we file or submit under the Exchange Act is recorded, processed, summarized and reported within the time periods required by the SEC’s rules and forms and that such information is accumulated and communicated to management, including our Chief Executive Officer and Interim Chief Financial Officer, as appropriate, to allow timely decisions regarding required disclosure.
Changes to Internal Control Over Financial Reporting
There have been no changes to our internal control over financial reporting, as such term is defined in Rules 13a-15(f) and 15d-15(f) under the Exchange Act, during the fourth quarter of fiscal
2012
that materially affected, or are reasonably likely to materially affect, our internal control over financial reporting.
In the course of our ongoing preparations for making management’s report on internal control over financial reporting as required by Section 404 of the Sarbanes-Oxley Act of 2002, from time to time we have identified areas in need of improvement and have taken remedial actions to strengthen the affected controls as appropriate. We make these and other changes to enhance the effectiveness of our internal controls over financial reporting, which do not have a material effect on our overall internal control. Additionally, as a result of our acquisition of Ruud Lighting on
August 17, 2011
, as discussed in Note 3 of the Notes to
86
Consolidated Financial Statements included elsewhere in this Annual Report, our internal control over financial reporting, subsequent to the date of acquisition, includes certain additional internal controls relating to Ruud Lighting.
We will continue to evaluate the effectiveness of our disclosure controls and procedures and internal control over financial reporting on an ongoing basis and will take action as appropriate.
Management’s Report on Internal Control Over Financial Reporting
Our management is responsible for establishing and maintaining adequate internal control over financial reporting, as such term is defined in Exchange Act Rules 13a-15(f) and 15d-15(f). Our internal control system was designed to provide reasonable assurance to our management and Board of Directors regarding the preparation and fair presentation of published financial statements.
Our internal control over financial reporting includes those policies and procedures that:
|
(i)
|
pertain to the maintenance of records that, in reasonable detail, accurately and fairly reflect the transactions and dispositions of our assets;
|
|
(j)
|
provide reasonable assurance that transactions are recorded as necessary to permit preparation of financial statements in accordance with generally accepted accounting principles, and that our receipts and expenditures are being made only in accordance with authorizations of our management and directors; and
|
|
(k)
|
provide reasonable assurance regarding prevention or timely detection of unauthorized acquisition, use or disposition of our assets that could have a material effect on the financial statements.
|
All internal control systems, no matter how well designed, have inherent limitations. Therefore, even those systems determined to be effective can provide only reasonable assurance with respect to financial statement preparation and presentation.
In making the assessment of internal control over financial reporting, our management used the criteria issued by the Committee of Sponsoring Organizations of the Treadway Commission (COSO) in
Internal Control-Integrated Framework
. Based on that assessment and those criteria, management has concluded that our internal control over financial reporting was effective as of
June 24, 2012
. We have excluded from our evaluation certain internal controls over financial reporting of Ruud Lighting, which we acquired on
August 17, 2011
. Total revenues subject to Ruud Lighting's internal controls over financial reporting which have been excluded from this evaluation represented 21% of our consolidated total revenues for the fiscal year ended
June 24, 2012
. Net assets subject to Ruud Lighting's internal control over financial reporting which have been excluded from this evaluation represented 26% of our consolidated total assets as of
June 24, 2012
.
The effectiveness of our internal control over financial reporting as of
June 24, 2012
has been audited by Ernst & Young LLP, an independent registered public accounting firm, as stated in their attestation report, which is included in this Annual Report.
REPORT OF INDEPENDENT REGISTERED PUBLIC ACCOUNTING FIRM
The Board of Directors and Shareholders of Cree, Inc.
We have audited Cree, Inc.'s internal control over financial reporting as of
June 24, 2012
, based on criteria established in Internal Control-Integrated Framework issued by the Committee of Sponsoring Organizations of the Treadway Commission (the COSO criteria). Cree, Inc.'s management is responsible for maintaining effective internal control over financial reporting, and for its assessment of the effectiveness of internal control over financial reporting included in the accompanying Management's Report on Internal Control Over Financial Reporting. Our responsibility is to express an opinion on the company's internal control over financial reporting based on our audit.
We conducted our audit in accordance with the standards of the Public Company Accounting Oversight Board (United States). Those standards require that we plan and perform the audit to obtain reasonable assurance about whether effective internal control over financial reporting was maintained in all material respects. Our audit included obtaining an understanding of internal control over financial reporting, assessing the risk that a material weakness exists, testing and evaluating the design and operating effectiveness of internal control based on the assessed risk, and performing such other procedures as we considered necessary in the circumstances. We believe that our audit provides a reasonable basis for our opinion.
A company's internal control over financial reporting is a process designed to provide reasonable assurance regarding the reliability of financial reporting and the preparation of financial statements for external purposes in accordance with generally accepted
87
accounting principles. A company's internal control over financial reporting includes those policies and procedures that (1) pertain to the maintenance of records that, in reasonable detail, accurately and fairly reflect the transactions and dispositions of the assets of the company; (2) provide reasonable assurance that transactions are recorded as necessary to permit preparation of financial statements in accordance with generally accepted accounting principles, and that receipts and expenditures of the company are being made only in accordance with authorizations of management and directors of the company; and (3) provide reasonable assurance regarding prevention or timely detection of unauthorized acquisition, use, or disposition of the company's assets that could have a material effect on the financial statements.
Because of its inherent limitations, internal control over financial reporting may not prevent or detect misstatements. Also, projections of any evaluation of effectiveness to future periods are subject to the risk that controls may become inadequate because of changes in conditions, or that the degree of compliance with the policies or procedures may deteriorate.
As indicated in the accompanying Management's Report on Internal Control Over Financial Reporting, management's assessment of and conclusion on the effectiveness of internal control over financial reporting did not include the internal controls of Ruud Lighting, Inc., which is included in the 2012 consolidated financial statements of Cree, Inc. and constituted 26% of consolidated total assets as of
June 24, 2012
and 21% of consolidated revenues for the year then ended. Our audit of internal control over financial reporting of Cree, Inc. also did not include an evaluation of the internal control over financial reporting of Ruud Lighting, Inc.
In our opinion, Cree, Inc. maintained, in all material respects, effective internal control over financial reporting as of
June 24, 2012
, based on the COSO criteria.
We also have audited, in accordance with the standards of the Public Company Accounting Oversight Board (United States), the consolidated balance sheets of Cree, Inc. as of
June 24, 2012
and
June 26, 2011
, and the related consolidated statements of income, shareholders' equity, and cash flows for each of the three years in the period ended
June 24, 2012
of Cree, Inc. and our report dated
August 21, 2012
expressed an unqualified opinion thereon.
|
/s/ Ernst & Young LLP
|
|
|
Raleigh, North Carolina
|
|
|
August 21, 2012
|
|
Item 9B.
Other Information
Not applicable.
88
Certain information called for in Items 10, 11,12, 13 and 14 is incorporated by reference from our definitive proxy statement relating to our annual meeting of shareholders, which will be filed with the SEC within 120 days after the end of fiscal
2012
.
Item 10.
Directors, Executive Officers and Corporate Governance
Item 11.
Executive Compensation
Item 12.
Security Ownership of Certain Beneficial Owners and Management and Related Stockholder Matters
Item 13.
Certain Relationships and Related Transactions, and Director Independence
Item 14.
Principal Accountant Fees and Services
89
Item 15.
Exhibits and Financial Statement Schedules
(a)(1) and (2) The financial statements and reports of independent registered public accounting firm are filed as part of this Annual Report (see “Index to Consolidated Financial Statements” at Item 8). The financial statement schedules are not included in this item as they are either not applicable or are included as part of the consolidated financial statements.
(a)(3) The following exhibits have been or are being filed herewith and are numbered in accordance with Item 601 of Regulation S-K:
|
EXHIBIT NO.
|
DESCRIPTION
|
|
|
2.1
|
Stock Purchase Agreement, dated as of August 17, 2011 (incorporated herein by reference to Exhibit 2.1 to the Company's Current Report on Form 8-K, dated August 17, 2011, as filed with the Securities and Exchange Commission on August 17, 2011)
|
|
|
3.1
|
Articles of Incorporation, as amended (incorporated herein by reference to Exhibit 3.1 to the Company’s Annual Report on Form 10-K for the fiscal year ended June 30, 2002, as filed with the Securities and Exchange Commission on August 19, 2002)
|
|
|
3.2
|
Bylaws, as amended and restated (incorporated herein by reference to Exhibit 3.1 to the Company’s Current Report on Form 8-K, dated October 25, 2010, as filed with the Securities and Exchange Commission on October 29, 2010)
|
|
|
4.1
|
Specimen Common Stock Certificate (incorporated herein by reference to Exhibit 4.1 to the Company’s Annual Report on Form 10-K for the fiscal year ended June 30, 2002, as filed with the Securities and Exchange Commission on August 19, 2002)
|
|
|
4.2
|
Amended and Restated Rights Agreement, dated April 24, 2012, between Cree, Inc. and American Stock Transfer & Trust Company, LLC (incorporated herein by reference to Exhibit 4.1 to the Company's Current Report on Form 8-K, dated April 24, 2012, as filed with the Securities and Exchange Commission on April 26, 2012)
|
|
|
10.1*
|
2004 Long-Term Incentive Compensation Plan, as amended (incorporated herein by reference to Exhibit 10.1 to the Company's Current Report on Form 8-K, dated October 25, 2011, as filed with the Securities and Exchange Commission on October 27, 2011)
|
|
|
10.3*
|
Form of Master Stock Option Award Agreement for Grants of Nonqualified Stock Options to Non-Employee Directors (incorporated herein by reference to Exhibit 10.1 to the Company’s Current Report on Form 8-K, dated October 1, 2004, as filed with the Securities and Exchange Commission on October 7, 2004)
|
|
|
10.4*
|
Addendum to Form of Master Stock Option Award Agreement Terms and Conditions for Grants of Nonqualified Stock Options to Non-Employee Directors (incorporated herein by reference to Exhibit 10.5 to the Company’s Quarterly Report on Form 10-Q for the quarterly period ended September 27, 2009, as filed with the Securities and Exchange Commission on October 21, 2009)
|
|
|
10.5*
|
Form of Master Stock Option Award Agreement for Grants of Nonqualified Stock Options to Employees (incorporated herein by reference to Exhibit 10.2 to the Company’s Current Report on Form 8-K, dated October 1, 2004, as filed with the Securities and Exchange Commission on October 7, 2004)
|
|
|
10.6*
|
Form of Master Stock Option Award Agreement for Grants of Nonqualified Stock Options (incorporated herein by reference to Exhibit 10.4 to the Company’s Quarterly Report on Form 10-Q for the quarterly period ended September 24, 2006, as filed with the Securities and Exchange Commission on November 2, 2006)
|
|
|
10.7*
|
Form of Master Stock Option Award Agreement for Grants of Nonqualified Stock Options (incorporated herein by reference to Exhibit 10.4 to the Company’s Quarterly Report on Form 10-Q for the quarterly period ended December 26, 2010, as filed with the Securities and Exchange Commission on January 19, 2011)
|
|
|
10.8*
|
Form of Master Restricted Stock Award Agreement (incorporated herein by reference to Exhibit 10.5 to the Company’s Quarterly Report on Form 10-Q for the quarterly period ended September 24, 2006, as filed with the Securities and Exchange Commission on November 2, 2006)
|
|
|
10.9*
|
Management Incentive Compensation Plan (effective for fiscal years beginning on or after June 27, 2011), (incorporated herein by reference to Exhibit 10.1 to the Company's Current Report on Form 8-K, dated August 15, 2011, as filed with the Securities and Exchange Commission on August 19, 2011)
|
|
90
|
10.10*
|
Schedule of Compensation for Non-Employee Directors (incorporated herein by reference to Exhibit 10.6 to the Company's Quarterly Report on Form 10-Q for the quarterly period ended September 25, 2011, as filed with the Securities and Exchange Commission on October 20, 2011)
|
|
|
10.11*
|
Non-Employee Director Stock Compensation and Deferral Program (incorporated herein by reference to Exhibit 10.3 to the Company’s Quarterly Report on Form 10-Q for the quarterly period ended September 27, 2009, as filed with the Securities and Exchange Commission on October 21, 2009)
|
|
|
10.12*
|
Amendment One to Non-Employee Director Stock Compensation and Deferral Program (incorporated by reference to Exhibit 10.3 to the Company’s Quarterly Report on Form 10-Q for the quarterly period ended December 26, 2010, as filed with the Securities and Exchange Commission on January 19, 2011)
|
|
|
10.13*
|
Charles Swoboda Employment Agreement, as amended and restated effective August 21, 2007 (incorporated herein by reference to Exhibit 10.4 to the Company’s Current Report on Form 8-K, dated August 20, 2007, as filed with the Securities and Exchange Commission on August 24, 2007)
|
|
|
10.14*
|
Notice of Grant to Charles M. Swoboda, dated August 15, 2011 (incorporated herein by reference to Exhibit 10.2 to the Company's Current Report on Form 8-K, dated August 15, 2011, as filed with the Securities and Exchange Commission on August 19, 2011)
|
|
|
10.15*
|
Master Performance Unit Award Agreement, dated August 18, 2008, between Cree, Inc. and Charles M. Swoboda (incorporated herein by reference to Exhibit 10.3 to the Company’s Current Report on Form 8-K, dated August 18, 2008, as filed with the Securities and Exchange Commission on August 22, 2008)
|
|
|
10.16*
|
Notice of Grant to John T. Kurtzweil, dated August 15, 2011 (incorporated herein by reference to Exhibit 10.3 to the Company's Current Report on Form 8-K, dated August 15, 2011, as filed with the Securities and Exchange Commission on August 19, 2011)
|
|
|
10.17*
|
Master Performance Unit Award Agreement, dated August 16, 2010, between Cree, Inc. and John T. Kurtzweil (incorporated herein by reference to Exhibit 10.5 to the Company’s Current Report on Form 8-K, dated August 16, 2010, as filed with the Securities and Exchange Commission on August 19, 2010)
|
|
|
10.18*
|
Notice of Grant to Stephen D. Kelley, dated August 15, 2011 (incorporated herein by reference to Exhibit 10.4 to the Company's Current Report on Form 8-K, dated August 15, 2011, as filed with the Securities and Exchange Commission on August 19, 2011)
|
|
|
10.19*
|
Master Performance Unit Award Agreement, dated August 16, 2010, between Cree, Inc. and Stephen D. Kelley (incorporated herein by reference to Exhibit 10.6 to the Company’s Current Report on Form 8-K, dated August 16, 2010, as filed with the Securities and Exchange Commission on August 19, 2010)
|
|
|
10.20*
|
Cree, Inc. Severance Plan for Section 16 Officers (incorporated herein by reference to Exhibit 10.7 to the Company’s Current Report on Form 8-K, dated August 18, 2008, as filed with the Securities and Exchange Commission on August 22, 2008)
|
|
|
10.21*
|
Executive Change in Control Agreement, effective August 18, 2008, between Cree, Inc. and Charles M. Swoboda (incorporated herein by reference to Exhibit 10.4 to the Company’s Current Report on Form 8-K, dated August 18, 2008, as filed with the Securities and Exchange Commission on August 22, 2008)
|
|
|
10.22*
|
Executive Change in Control Agreement, effective August 18, 2008, between Cree, Inc. and John T. Kurtzweil (incorporated herein by reference to Exhibit 10.5 to the Company’s Current Report on Form 8-K, dated August 18, 2008, as filed with the Securities and Exchange Commission on August 22, 2008)
|
|
|
10.23*
|
Executive Change in Control Agreement, effective August 19, 2008, between Cree, Inc. and Stephen D. Kelley (incorporated herein by reference to Exhibit 10.6 to the Company’s Current Report on Form 8-K, dated August 18, 2008, as filed with the Securities and Exchange Commission on August 22, 2008)
|
|
|
10.24*
|
Form of Cree, Inc. Indemnification Agreement for Directors and Officers (incorporated herein by reference to Exhibit 10.1 to the Company’s Current Report on Form 8-K, dated October 25, 2010, as filed with the Securities and Exchange Commission on October 29, 2010)
|
|
|
10.25*
|
Offer Letter Agreement executed August 16, 2011 between Cree, Inc. and Alan J. Ruud (incorporated herein by reference to Exhibit 10.5 to the Company's Quarterly Report on Form 10-Q for the quarterly period ended September 25, 2011, as filed with the Securities and Exchange Commission on October 20, 2011)
|
|
|
21.1
|
Subsidiaries of the Company
|
|
|
23.1
|
Consent of Independent Registered Public Accounting Firm
|
|
|
31.1
|
Certification by Chief Executive Officer pursuant to Rule 13a-14(a) under the Securities Exchange Act of 1934, as adopted pursuant to Section 302 of the Sarbanes-Oxley Act of 2002
|
|
91
|
31.2
|
Certification by Interim Chief Financial Officer pursuant to Rule 13a-14(a) under the Securities Exchange Act of 1934, as adopted pursuant to Section 302 of the Sarbanes-Oxley Act of 2002
|
|
|
32.1
|
Certification by Chief Executive Officer pursuant to 18 U.S.C. Section 1350, as adopted pursuant to Section 906 of the Sarbanes-Oxley Act of 2002
|
|
|
32.2
|
Certification by Interim Chief Financial Officer pursuant to 18 U.S.C. Section 1350, as adopted pursuant to Section 906 of the Sarbanes-Oxley Act of 2002
|
|
|
101
|
The following materials from Cree, Inc.’s Annual Report on Form 10-K for the fiscal year ended June 24, 2012 formatted in XBRL (eXtensible Business Reporting Language) and furnished electronically herewith: (i) Consolidated Balance Sheets; (ii) Consolidated Statements of Income; (iii) Consolidated Statements of Cash Flows; and (iv) Notes to Consolidated Financial Statements
(a)
|
|
|
*
|
Management contract or compensatory plan
|
|
a.
|
Pursuant to Rule 406T of Regulation S-T, the Interactive Data Files in Exhibit 101 hereto are deemed not filed or part of a registration statement or prospectus for purposes of Sections 11 or 12 of the Securities Act of 1933, as amended, are deemed not filed for purposes of Section 18 of the Securities and Exchange Act of 1934, as amended, and otherwise are not subject to liability under those sections.
|
92
SIGNATURES
Pursuant to the requirements of Section 13 or 15(d) of the Securities Exchange Act of 1934, the registrant has duly caused this report to be signed on its behalf by the undersigned, thereunto duly authorized.
|
CREE, INC.
|
|
|
Date:
|
August 21, 2012
|
|
By:
|
/s/ C
HARLES
M. S
WOBODA
|
|
Charles M. Swoboda
|
|
|
Chairman, Chief Executive Officer and President
|
|
Pursuant to the requirements of the Securities Exchange Act of 1934, this report has been signed below by the following persons on behalf of the registrant and in the capacities and on the dates indicated.
|
Signature
|
Title
|
Date
|
||
|
/s/ C
HARLES
M. S
WOBODA
|
Chairman, Chief Executive Officer and President
|
August 21, 2012
|
||
|
Charles M. Swoboda
|
||||
|
/s/ M
ICHAEL
E. M
C
D
EVITT
|
Vice President and Interim Chief Financial Officer
|
August 21, 2012
|
||
|
Michael E. McDevitt
|
||||
|
/s/ C
LYDE
R. H
OSEIN
|
Director
|
August 21, 2012
|
||
|
Clyde R. Hosein
|
||||
|
/s/ R
OBERT
A. I
NGRAM
|
Director
|
August 21, 2012
|
||
|
Robert A. Ingram
|
||||
|
/s/ F
RANCO
P
LASTINA
|
Director
|
August 21, 2012
|
||
|
Franco Plastina
|
||||
|
/s/ A
LAN
J. R
UUD
|
Director
|
August 21, 2012
|
||
|
Alan J. Ruud
|
||||
|
/s/ R
OBERT
L. T
ILLMAN
|
Director
|
August 21, 2012
|
||
|
Robert L. Tillman
|
||||
|
/s/ H
ARVEY
A. W
AGNER
|
Director
|
August 21, 2012
|
||
|
Harvey A. Wagner
|
||||
|
/s/ T
HOMAS
H. W
ERNER
|
Director
|
August 21, 2012
|
||
|
Thomas H. Werner
|
||||
93
EXHIBIT INDEX
|
EXHIBIT NO.
|
DESCRIPTION
|
|
|
2.1
|
Stock Purchase Agreement, dated as of August 17, 2011 (incorporated herein by reference to Exhibit 2.1 to the Company's Current Report on Form 8-K, dated August 17, 2011, as filed with the Securities and Exchange Commission on August 17, 2011)
|
|
|
3.1
|
Articles of Incorporation, as amended (incorporated herein by reference to Exhibit 3.1 to the Company’s Annual Report on Form 10-K for the fiscal year ended June 30, 2002, as filed with the Securities and Exchange Commission on August 19, 2002)
|
|
|
3.2
|
Bylaws, as amended and restated (incorporated herein by reference to Exhibit 3.1 to the Company’s Current Report on Form 8-K, dated October 25, 2010, as filed with the Securities and Exchange Commission on October 29, 2010)
|
|
|
4.1
|
Specimen Common Stock Certificate (incorporated herein by reference to Exhibit 4.1 to the Company’s Annual Report on Form 10-K for the fiscal year ended June 30, 2002, as filed with the Securities and Exchange Commission on August 19, 2002)
|
|
|
4.2
|
Amended and Restated Rights Agreement, dated April 24, 2012, between Cree, Inc. and American Stock Transfer & Trust Company, LLC (incorporated herein by reference to Exhibit 4.1 to the Company's Current Report on Form 8-K, dated April 24, 2012, as filed with the Securities and Exchange Commission on April 26, 2012)
|
|
|
10.1*
|
2004 Long-Term Incentive Compensation Plan, as amended (incorporated herein by reference to Exhibit 10.1 to the Company's Current Report on Form 8-K, dated October 25, 2011, as filed with the Securities and Exchange Commission on October 27, 2011)
|
|
|
10.3*
|
Form of Master Stock Option Award Agreement for Grants of Nonqualified Stock Options to Non-Employee Directors (incorporated herein by reference to Exhibit 10.1 to the Company’s Current Report on Form 8-K, dated October 1, 2004, as filed with the Securities and Exchange Commission on October 7, 2004)
|
|
|
10.4*
|
Addendum to Form of Master Stock Option Award Agreement Terms and Conditions for Grants of Nonqualified Stock Options to Non-Employee Directors (incorporated herein by reference to Exhibit 10.5 to the Company’s Quarterly Report on Form 10-Q for the quarterly period ended September 27, 2009, as filed with the Securities and Exchange Commission on October 21, 2009)
|
|
|
10.5*
|
Form of Master Stock Option Award Agreement for Grants of Nonqualified Stock Options to Employees (incorporated herein by reference to Exhibit 10.2 to the Company’s Current Report on Form 8-K, dated October 1, 2004, as filed with the Securities and Exchange Commission on October 7, 2004)
|
|
|
10.6*
|
Form of Master Stock Option Award Agreement for Grants of Nonqualified Stock Options (incorporated herein by reference to Exhibit 10.4 to the Company’s Quarterly Report on Form 10-Q for the quarterly period ended September 24, 2006, as filed with the Securities and Exchange Commission on November 2, 2006)
|
|
|
10.7*
|
Form of Master Stock Option Award Agreement for Grants of Nonqualified Stock Options (incorporated herein by reference to Exhibit 10.4 to the Company’s Quarterly Report on Form 10-Q for the quarterly period ended December 26, 2010, as filed with the Securities and Exchange Commission on January 19, 2011)
|
|
|
10.8*
|
Form of Master Restricted Stock Award Agreement (incorporated herein by reference to Exhibit 10.5 to the Company’s Quarterly Report on Form 10-Q for the quarterly period ended September 24, 2006, as filed with the Securities and Exchange Commission on November 2, 2006)
|
|
|
10.9*
|
Management Incentive Compensation Plan (effective for fiscal years beginning on or after June 27, 2011), (incorporated herein by reference to Exhibit 10.1 to the Company's Current Report on Form 8-K, dated August 15, 2011, as filed with the Securities and Exchange Commission on August 19, 2011)
|
|
|
10.10*
|
Schedule of Compensation for Non-Employee Directors (incorporated herein by reference to Exhibit 10.6 to the Company's Quarterly Report on Form 10-Q for the quarterly period ended September 25, 2011, as filed with the Securities and Exchange Commission on October 20, 2011)
|
|
|
10.11*
|
Non-Employee Director Stock Compensation and Deferral Program (incorporated herein by reference to Exhibit 10.3 to the Company’s Quarterly Report on Form 10-Q for the quarterly period ended September 27, 2009, as filed with the Securities and Exchange Commission on October 21, 2009)
|
|
94
|
10.12*
|
Amendment One to Non-Employee Director Stock Compensation and Deferral Program (incorporated by reference to Exhibit 10.3 to the Company’s Quarterly Report on Form 10-Q for the quarterly period ended December 26, 2010, as filed with the Securities and Exchange Commission on January 19, 2011)
|
|
|
10.13*
|
Charles Swoboda Employment Agreement, as amended and restated effective August 21, 2007 (incorporated herein by reference to Exhibit 10.4 to the Company’s Current Report on Form 8-K, dated August 20, 2007, as filed with the Securities and Exchange Commission on August 24, 2007)
|
|
|
10.14*
|
Notice of Grant to Charles M. Swoboda, dated August 15, 2011 (incorporated herein by reference to Exhibit 10.2 to the Company's Current Report on Form 8-K, dated August 15, 2011, as filed with the Securities and Exchange Commission on August 19, 2011)
|
|
|
10.15*
|
Master Performance Unit Award Agreement, dated August 18, 2008, between Cree, Inc. and Charles M. Swoboda (incorporated herein by reference to Exhibit 10.3 to the Company’s Current Report on Form 8-K, dated August 18, 2008, as filed with the Securities and Exchange Commission on August 22, 2008)
|
|
|
10.16*
|
Notice of Grant to John T. Kurtzweil, dated August 15, 2011 (incorporated herein by reference to Exhibit 10.3 to the Company's Current Report on Form 8-K, dated August 15, 2011, as filed with the Securities and Exchange Commission on August 19, 2011)
|
|
|
10.17*
|
Master Performance Unit Award Agreement, dated August 16, 2010, between Cree, Inc. and John T. Kurtzweil (incorporated herein by reference to Exhibit 10.5 to the Company’s Current Report on Form 8-K, dated August 16, 2010, as filed with the Securities and Exchange Commission on August 19, 2010)
|
|
|
10.18*
|
Notice of Grant to Stephen D. Kelley, dated August 15, 2011 (incorporated herein by reference to Exhibit 10.4 to the Company's Current Report on Form 8-K, dated August 15, 2011, as filed with the Securities and Exchange Commission on August 19, 2011)
|
|
|
10.19*
|
Master Performance Unit Award Agreement, dated August 16, 2010, between Cree, Inc. and Stephen D. Kelley (incorporated herein by reference to Exhibit 10.6 to the Company’s Current Report on Form 8-K, dated August 16, 2010, as filed with the Securities and Exchange Commission on August 19, 2010)
|
|
|
10.20*
|
Cree, Inc. Severance Plan for Section 16 Officers (incorporated herein by reference to Exhibit 10.7 to the Company’s Current Report on Form 8-K, dated August 18, 2008, as filed with the Securities and Exchange Commission on August 22, 2008)
|
|
|
10.21*
|
Executive Change in Control Agreement, effective August 18, 2008, between Cree, Inc. and Charles M. Swoboda (incorporated herein by reference to Exhibit 10.4 to the Company’s Current Report on Form 8-K, dated August 18, 2008, as filed with the Securities and Exchange Commission on August 22, 2008)
|
|
|
10.22*
|
Executive Change in Control Agreement, effective August 18, 2008, between Cree, Inc. and John T. Kurtzweil (incorporated herein by reference to Exhibit 10.5 to the Company’s Current Report on Form 8-K, dated August 18, 2008, as filed with the Securities and Exchange Commission on August 22, 2008)
|
|
|
10.23*
|
Executive Change in Control Agreement, effective August 19, 2008, between Cree, Inc. and Stephen D. Kelley (incorporated herein by reference to Exhibit 10.6 to the Company’s Current Report on Form 8-K, dated August 18, 2008, as filed with the Securities and Exchange Commission on August 22, 2008)
|
|
|
10.24*
|
Form of Cree, Inc. Indemnification Agreement for Directors and Officers (incorporated herein by reference to Exhibit 10.1 to the Company’s Current Report on Form 8-K, dated October 25, 2010, as filed with the Securities and Exchange Commission on October 29, 2010)
|
|
|
10.25*
|
Offer Letter Agreement executed August 16, 2011 between Cree, Inc. and Alan J. Ruud (incorporated herein by reference to Exhibit 10.5 to the Company's Quarterly Report on Form 10-Q for the quarterly period ended September 25, 2011, as filed with the Securities and Exchange Commission on October 20, 2011)
|
|
|
21.1
|
Subsidiaries of the Company
|
|
|
23.1
|
Consent of Independent Registered Public Accounting Firm
|
|
|
31.1
|
Certification by Chief Executive Officer pursuant to Rule 13a-14(a) under the Securities Exchange Act of 1934, as adopted pursuant to Section 302 of the Sarbanes-Oxley Act of 2002
|
|
|
31.2
|
Certification by Interim Chief Financial Officer pursuant to Rule 13a-14(a) under the Securities Exchange Act of 1934, as adopted pursuant to Section 302 of the Sarbanes-Oxley Act of 2002
|
|
|
32.1
|
Certification by Chief Executive Officer pursuant to 18 U.S.C. Section 1350, as adopted pursuant to Section 906 of the Sarbanes-Oxley Act of 2002
|
|
|
32.2
|
Certification by Interim Chief Financial Officer pursuant to 18 U.S.C. Section 1350, as adopted pursuant to Section 906 of the Sarbanes-Oxley Act of 2002
|
|
95
|
101
|
The following materials from Cree, Inc.’s Annual Report on Form 10-K for the fiscal year ended June 24, 2012 formatted in XBRL (eXtensible Business Reporting Language) and furnished electronically herewith: (i) Consolidated Balance Sheets; (ii) Consolidated Statements of Income; (iii) Consolidated Statements of Cash Flows; and (iv) Notes to Consolidated Financial Statements
(a)
|
|
|
*
|
Management contract or compensatory plan
|
|
a.
|
Pursuant to Rule 406T of Regulation S-T, the Interactive Data Files in Exhibit 101 hereto are deemed not filed or part of a registration statement or prospectus for purposes of Sections 11 or 12 of the Securities Act of 1933, as amended, are deemed not filed for purposes of Section 18 of the Securities and Exchange Act of 1934, as amended, and otherwise are not subject to liability under those sections.
|
96
TABLE OF CONTENTS
Part IItem 1. BusinessItem 1A. Risk FactorsItem 1B. Unresolved Staff CommentsItem 2. PropertiesItem 3. Legal ProceedingsItem 4. Mine Safety DisclosuresPart IIItem 5. Market For Registrant S Common Equity, Related Stockholder Matters and Issuer Purchases Of Equity SecuritiesItem 6. Selected Financial DataItem 7. Management S Discussion and Analysis Of Financial Condition and Results Of OperationsItem 7A. Quantitative and Qualitative Disclosures About Market RiskItem 8. Financial Statements and Supplementary DataNote 1 BusinessNote 2 Basis Of Presentation and Summary Of Significant Accounting PoliciesNote 3 - AcquisitionsNote 4 Financial Statement DetailsNote 5 InvestmentsNote 6 Fair Value Of Financial InstrumentsNote 7 Intangible Assets and GoodwillNote 8 Shareholders EquityNote 9 Earnings Per ShareNote 10 Stock-based CompensationNote 11 Income TaxesNote 12 Commitments and ContingenciesNote 13 - Reportable SegmentsNote 14 Concentrations Of RiskNote 15 Retirement Savings PlanNote 16 Related Party TransactionsNote 17 Quarterly Results Of Operations - UnauditedItem 9. Changes in and Disagreements with Accountants on Accounting and Financial DisclosureItem 9A. Controls and ProceduresItem 9B. Other InformationPart IIIItem 10. Directors, Executive Officers and Corporate GovernanceItem 11. Executive CompensationItem 12. Security Ownership Of Certain Beneficial Owners and Management and Related Stockholder MattersItem 13. Certain Relationships and Related Transactions, and Director IndependenceItem 14. Principal Accountant Fees and ServicesPart IVItem 15. Exhibits and Financial Statement Schedules