W. P. CAREY INC.
10-Ks and 10-Qs
|
|
|
|
|
|
|
|
|
|
|
|
|
|
|
|
|
|
|
|
|
|
|
|
|
|
|
|
|
|
|
|
|
|
|
|
|
|
|
|
|
|
|
|
|
|
|
|
|
|
|
|
|
|
|
|
UNITED STATES SECURITIES AND EXCHANGE COMMISSION
Washington, D.C. 20549
FORM
10-Q
For the quarterly period ended
September 30, 2022
or
For the transition period from__________ to __________
Commission File Number:
001-13779

(Exact name of registrant as specified in its charter)
|
|
|
|||||||
| (State of incorporation) | (I.R.S. Employer Identification No.) | |||||||
|
|
||||||||
|
|
|
|
||||||
| (Address of principal executive offices) | (Zip Code) | |||||||
Investor Relations (212) 492-8920
(
212
)
492-1100
(Registrant’s telephone numbers, including area code)
Securities registered pursuant to Section 12(b) of the Act:
| Title of each class | Trading Symbol(s) | Name of each exchange on which registered | ||||||||||||
|
|
|
|
||||||||||||
Indicate by check mark whether the registrant (1) has filed all reports required to be filed by Section 13 or 15(d) of the Securities Exchange Act of 1934 during the preceding 12 months (or for such shorter period that the registrant was required to file such reports), and (2) has been subject to such filing requirements for the past 90 days.
Yes
☑
No
☐
Indicate by check mark whether the registrant has submitted electronically every Interactive Data File required to be submitted pursuant to Rule 405 of Regulation S-T (§232.405 of this chapter) during the preceding 12 months (or for such shorter period that the registrant was required to submit such files).
Yes
☑
No
☐
Indicate by check mark whether the registrant is a large accelerated filer, an accelerated filer, a non-accelerated filer, a smaller reporting company, or an emerging growth company. See the definitions of “large accelerated filer,” “accelerated filer,” “smaller reporting company,” and “emerging growth company” in Rule 12b-2 of the Exchange Act.
|
|
☑
|
Accelerated filer
|
☐
|
Non-accelerated filer
|
☐
|
||||||||||||
|
Smaller reporting company
|
|
Emerging growth company
|
|
||||||||||||||
If an emerging growth company, indicate by check mark if the registrant has elected not to use the extended transition period for complying with any new or revised financial accounting standards provided pursuant to Section 13(a) of the Exchange Act.
☐
Indicate by check mark whether the registrant is a shell company (as defined in Rule 12b-2 of the Exchange Act). Yes
☐
No
☑
Registrant has
208,032,718
shares of common stock, $0.001 par value, outstanding at October 28, 2022.
INDEX
| Page No. | ||||||||
| PART I — FINANCIAL INFORMATION | ||||||||
| Item 1. Financial Statements (Unaudited) | ||||||||
|
Item 4.
Controls and Procedures
|
||||||||
| PART II — OTHER INFORMATION | ||||||||
|
Item 6.
Exhibits
|
||||||||
W. P. Carey 9/30/2022 10-Q
–
1
Forward-Looking Statements
This Quarterly Report on Form 10-Q (this “Report”), including Management’s Discussion and Analysis of Financial Condition and Results of Operations in Item 2 of Part I of this Report, contains forward-looking statements within the meaning of the federal securities laws. These forward-looking statements generally are identified by the words “believe,” “project,” “expect,” “anticipate,” “estimate,” “intend,” “strategy,” “plan,” “may,” “should,” “will,” “would,” “will be,” “will continue,” “will likely result,” and similar expressions. These forward-looking statements include, but are not limited to, statements regarding: the impact of the CPA:18 Merger (as defined herein); our corporate strategy and estimated or future economic performance and results, including our expectations surrounding the impact of the novel coronavirus (“COVID-19”) pandemic on our business, financial condition, liquidity, results of operations, and prospects; our future capital expenditure and leverage levels, debt service obligations, and plans to fund our liquidity needs; prospective statements regarding our access to the capital markets, including our “at-the-market” program (“ATM Program”) and settlement of our Equity Forwards (as defined herein); the outlook for the investment programs that we manage, including possible liquidity events for those programs; statements that we make regarding our ability to remain qualified for taxation as a real estate investment trust (“REIT”); and the impact of recently issued accounting pronouncements and regulatory activity.
These statements are based on the current expectations of our management. It is important to note that our actual results could be materially different from those projected in such forward-looking statements. There are a number of risks and uncertainties that could cause actual results to differ materially from these forward-looking statements. Other unknown or unpredictable risks or uncertainties, like the risks related to the effects of pandemics and global outbreaks of contagious diseases (such as the current COVID-19 pandemic) and domestic or geopolitical crises, such as terrorism, military conflict (including the ongoing conflict between Russia and Ukraine and the global response to it), war or the perception that hostilities may be imminent, political instability or civil unrest, or other conflict, could also have material adverse effects on our business, financial condition, liquidity, results of operations, and prospects. You should exercise caution in relying on forward-looking statements as they involve known and unknown risks, uncertainties, and other factors that may materially affect our future results, performance, achievements, or transactions. Information on factors that could impact actual results and cause them to differ from what is anticipated in the forward-looking statements contained herein is included in this Report, as well as in our other filings with the Securities and Exchange Commission (“SEC”), including but not limited to those described in Part I, Item 1A. Risk Factors in our Annual Report on Form 10-K for the year ended December 31, 2021, as filed with the SEC on February 11, 2022 (the “2021 Annual Report”). Moreover, because we operate in a very competitive and rapidly changing environment, new risks are likely to emerge from time to time. Given these risks and uncertainties, potential investors are cautioned not to place undue reliance on these forward-looking statements as a prediction of future results, which speak only as of the date of this Report, unless noted otherwise. Except as required by federal securities laws and the rules and regulations of the SEC, we do not undertake to revise or update any forward-looking statements.
All references to “Notes” throughout the document refer to the footnotes to the consolidated financial statements of the registrant in Part I, Item 1. Financial Statements (Unaudited).
W. P. Carey 9/30/2022 10-Q
–
2
PART I — FINANCIAL INFORMATION
Item 1. Financial Statements.
W. P. CAREY INC.
CONSOLIDATED BALANCE SHEETS (UNAUDITED)
(in thousands, except share and per share amounts)
| September 30, 2022 | December 31, 2021 | ||||||||||
| Assets | |||||||||||
| Investments in real estate: | |||||||||||
| Land, buildings and improvements — net lease and other | $ |
|
$ |
|
|||||||
| Land, buildings and improvements — operating properties |
|
|
|||||||||
| Net investments in direct financing leases and loans receivable |
|
|
|||||||||
| In-place lease intangible assets and other |
|
|
|||||||||
| Above-market rent intangible assets |
|
|
|||||||||
| Investments in real estate |
|
|
|||||||||
| Accumulated depreciation and amortization |
(
|
(
|
|||||||||
| Assets held for sale, net |
|
|
|||||||||
| Net investments in real estate |
|
|
|||||||||
| Equity method investments |
|
|
|||||||||
| Cash and cash equivalents |
|
|
|||||||||
| Due from affiliates |
|
|
|||||||||
| Other assets, net |
|
|
|||||||||
| Goodwill |
|
|
|||||||||
|
Total assets
(a)
|
$ |
|
$ |
|
|||||||
| Liabilities and Equity | |||||||||||
| Debt: | |||||||||||
| Senior unsecured notes, net | $ |
|
$ |
|
|||||||
| Unsecured term loans, net |
|
|
|||||||||
| Unsecured revolving credit facility |
|
|
|||||||||
| Non-recourse mortgages, net |
|
|
|||||||||
| Debt, net |
|
|
|||||||||
| Accounts payable, accrued expenses and other liabilities |
|
|
|||||||||
| Below-market rent and other intangible liabilities, net |
|
|
|||||||||
| Deferred income taxes |
|
|
|||||||||
| Dividends payable |
|
|
|||||||||
|
Total liabilities
(a)
|
|
|
|||||||||
|
|
|
||||||||||
|
Preferred stock, $
|
|
|
|||||||||
|
Common stock, $
|
|
|
|||||||||
| Additional paid-in capital |
|
|
|||||||||
| Distributions in excess of accumulated earnings |
(
|
(
|
|||||||||
| Deferred compensation obligation |
|
|
|||||||||
| Accumulated other comprehensive loss |
(
|
(
|
|||||||||
| Total stockholders’ equity |
|
|
|||||||||
| Noncontrolling interests |
|
|
|||||||||
| Total equity |
|
|
|||||||||
| Total liabilities and equity | $ |
|
$ |
|
|||||||
__________
(a)
See
Note 2
for details related to variable interest entities (“VIEs”).
See Notes to Consolidated Financial Statements.
W. P. Carey 9/30/2022 10-Q
–
3
W. P. CAREY INC.
CONSOLIDATED STATEMENTS OF INCOME (UNAUDITED)
(in thousands, except share and per share amounts)
| Three Months Ended September 30, | Nine Months Ended September 30, | ||||||||||||||||||||||
| 2022 | 2021 | 2022 | 2021 | ||||||||||||||||||||
| Revenues | |||||||||||||||||||||||
| Real Estate: | |||||||||||||||||||||||
| Lease revenues | $ |
|
$ |
|
$ |
|
$ |
|
|||||||||||||||
| Income from direct financing leases and loans receivable |
|
|
|
|
|||||||||||||||||||
| Operating property revenues |
|
|
|
|
|||||||||||||||||||
| Lease termination income and other |
|
|
|
|
|||||||||||||||||||
|
|
|
|
|
||||||||||||||||||||
| Investment Management: | |||||||||||||||||||||||
| Asset management and other revenue |
|
|
|
|
|||||||||||||||||||
| Reimbursable costs from affiliates |
|
|
|
|
|||||||||||||||||||
|
|
|
|
|
||||||||||||||||||||
|
|
|
|
|
||||||||||||||||||||
| Operating Expenses | |||||||||||||||||||||||
| Depreciation and amortization |
|
|
|
|
|||||||||||||||||||
| Impairment charges — Investment Management goodwill |
|
|
|
|
|||||||||||||||||||
| General and administrative |
|
|
|
|
|||||||||||||||||||
| Reimbursable tenant costs |
|
|
|
|
|||||||||||||||||||
| Merger and other expenses |
|
(
|
|
(
|
|||||||||||||||||||
| Property expenses, excluding reimbursable tenant costs |
|
|
|
|
|||||||||||||||||||
| Operating property expenses |
|
|
|
|
|||||||||||||||||||
| Stock-based compensation expense |
|
|
|
|
|||||||||||||||||||
| Reimbursable costs from affiliates |
|
|
|
|
|||||||||||||||||||
| Impairment charges — real estate |
|
|
|
|
|||||||||||||||||||
|
|
|
|
|
||||||||||||||||||||
| Other Income and Expenses | |||||||||||||||||||||||
| Interest expense |
(
|
(
|
(
|
(
|
|||||||||||||||||||
| Gain on change in control of interests |
|
|
|
|
|||||||||||||||||||
| Other gains and (losses) |
(
|
|
(
|
|
|||||||||||||||||||
| Earnings (losses) from equity method investments |
|
|
|
(
|
|||||||||||||||||||
| Non-operating income |
|
|
|
|
|||||||||||||||||||
| (Loss) gain on sale of real estate, net |
(
|
|
|
|
|||||||||||||||||||
|
(
|
|
(
|
(
|
||||||||||||||||||||
| Income before income taxes |
|
|
|
|
|||||||||||||||||||
| Provision for income taxes |
(
|
(
|
(
|
(
|
|||||||||||||||||||
| Net Income |
|
|
|
|
|||||||||||||||||||
| Net loss (income) attributable to noncontrolling interests |
|
(
|
|
(
|
|||||||||||||||||||
| Net Income Attributable to W. P. Carey | $ |
|
$ |
|
$ |
|
$ |
|
|||||||||||||||
| Basic Earnings Per Share | $ |
|
$ |
|
$ |
|
$ |
|
|||||||||||||||
| Diluted Earnings Per Share | $ |
|
$ |
|
$ |
|
$ |
|
|||||||||||||||
| Weighted-Average Shares Outstanding | |||||||||||||||||||||||
| Basic |
|
|
|
|
|||||||||||||||||||
| Diluted |
|
|
|
|
|||||||||||||||||||
See Notes to Consolidated Financial Statements.
W. P. Carey 9/30/2022 10-Q
–
4
W. P. CAREY INC.
CONSOLIDATED STATEMENTS OF COMPREHENSIVE INCOME (UNAUDITED)
(in thousands)
| Three Months Ended September 30, | Nine Months Ended September 30, | ||||||||||||||||||||||
| 2022 | 2021 | 2022 | 2021 | ||||||||||||||||||||
| Net Income | $ |
|
$ |
|
$ |
|
$ |
|
|||||||||||||||
| Other Comprehensive (Loss) Income | |||||||||||||||||||||||
| Foreign currency translation adjustments |
(
|
(
|
(
|
(
|
|||||||||||||||||||
| Unrealized gain on derivative instruments |
|
|
|
|
|||||||||||||||||||
| Reclassification of unrealized gain on investments to net income |
|
|
(
|
|
|||||||||||||||||||
|
(
|
(
|
(
|
|
||||||||||||||||||||
| Comprehensive Income |
|
|
|
|
|||||||||||||||||||
| Amounts Attributable to Noncontrolling Interests | |||||||||||||||||||||||
| Net loss (income) |
|
(
|
|
(
|
|||||||||||||||||||
| Foreign currency translation adjustments |
|
|
|
|
|||||||||||||||||||
| Unrealized gain on derivative instruments |
|
|
|
(
|
|||||||||||||||||||
| Comprehensive loss (income) attributable to noncontrolling interests |
|
(
|
|
(
|
|||||||||||||||||||
| Comprehensive Income Attributable to W. P. Carey | $ |
|
$ |
|
$ |
|
$ |
|
|||||||||||||||
See Notes to Consolidated Financial Statements.
W. P. Carey 9/30/2022 10-Q
–
5
W. P. CAREY INC.
CONSOLIDATED STATEMENTS OF EQUITY (UNAUDITED)
(in thousands, except share and per share amounts)
| W. P. Carey Stockholders | |||||||||||||||||||||||||||||||||||||||||||||||||||||
| Distributions | Accumulated | ||||||||||||||||||||||||||||||||||||||||||||||||||||
| Common Stock | Additional | in Excess of | Deferred | Other | Total | ||||||||||||||||||||||||||||||||||||||||||||||||
| $0.001 Par Value | Paid-in | Accumulated | Compensation | Comprehensive | W. P. Carey | Noncontrolling | |||||||||||||||||||||||||||||||||||||||||||||||
| Shares | Amount | Capital | Earnings | Obligation | Loss | Stockholders | Interests | Total | |||||||||||||||||||||||||||||||||||||||||||||
|
Balance at July 1, 2022
|
|
$ |
|
$ |
|
$ |
(
|
$ |
|
$ |
(
|
$ |
|
$ |
|
$ |
|
||||||||||||||||||||||||||||||||||||
| Shares issued to stockholders of CPA:18 – Global in connection with CPA:18 Merger |
|
|
|
|
|
||||||||||||||||||||||||||||||||||||||||||||||||
| Shares issued under Equity Forwards, net |
|
|
|
|
|
||||||||||||||||||||||||||||||||||||||||||||||||
| Shares issued upon delivery of vested restricted share awards |
|
— |
(
|
(
|
(
|
||||||||||||||||||||||||||||||||||||||||||||||||
| Amortization of stock-based compensation expense |
|
|
|
||||||||||||||||||||||||||||||||||||||||||||||||||
| Acquisition of noncontrolling interests in connection with the CPA:18 Merger | — |
|
|
||||||||||||||||||||||||||||||||||||||||||||||||||
| Distributions to noncontrolling interests | — |
(
|
(
|
||||||||||||||||||||||||||||||||||||||||||||||||||
|
Dividends declared ($
|
(
|
(
|
(
|
||||||||||||||||||||||||||||||||||||||||||||||||||
| Net income |
|
|
(
|
|
|||||||||||||||||||||||||||||||||||||||||||||||||
| Other comprehensive loss: | |||||||||||||||||||||||||||||||||||||||||||||||||||||
| Foreign currency translation adjustments |
(
|
(
|
(
|
(
|
|||||||||||||||||||||||||||||||||||||||||||||||||
| Unrealized gain on derivative instruments |
|
|
|
||||||||||||||||||||||||||||||||||||||||||||||||||
| Balance at September 30, 2022 |
|
$ |
|
$ |
|
$ |
(
|
$ |
|
$ |
(
|
$ |
|
$ |
|
$ |
|
||||||||||||||||||||||||||||||||||||
| W. P. Carey Stockholders | |||||||||||||||||||||||||||||||||||||||||||||||||||||
| Distributions | Accumulated | ||||||||||||||||||||||||||||||||||||||||||||||||||||
| Common Stock | Additional | in Excess of | Deferred | Other | Total | ||||||||||||||||||||||||||||||||||||||||||||||||
| $0.001 Par Value | Paid-in | Accumulated | Compensation | Comprehensive | W. P. Carey | Noncontrolling | |||||||||||||||||||||||||||||||||||||||||||||||
| Shares | Amount | Capital | Earnings | Obligation | Loss | Stockholders | Interests | Total | |||||||||||||||||||||||||||||||||||||||||||||
|
Balance at July 1, 2021
|
|
$ |
|
$ |
|
$ |
(
|
$ |
|
$ |
(
|
$ |
|
$ |
|
$ |
|
||||||||||||||||||||||||||||||||||||
| Shares issued under Equity Forwards, net |
|
|
|
|
|
||||||||||||||||||||||||||||||||||||||||||||||||
| Shares issued upon delivery of vested restricted share awards |
|
— |
(
|
(
|
(
|
||||||||||||||||||||||||||||||||||||||||||||||||
| Amortization of stock-based compensation expense |
|
|
|
||||||||||||||||||||||||||||||||||||||||||||||||||
| Delivery of vested shares, net |
|
(
|
— | — | |||||||||||||||||||||||||||||||||||||||||||||||||
| Distributions to noncontrolling interests | — |
(
|
(
|
||||||||||||||||||||||||||||||||||||||||||||||||||
|
Dividends declared ($
|
(
|
(
|
(
|
||||||||||||||||||||||||||||||||||||||||||||||||||
| Net income |
|
|
|
|
|||||||||||||||||||||||||||||||||||||||||||||||||
| Other comprehensive loss: | |||||||||||||||||||||||||||||||||||||||||||||||||||||
| Foreign currency translation adjustments |
(
|
(
|
(
|
||||||||||||||||||||||||||||||||||||||||||||||||||
| Unrealized gain on derivative instruments |
|
|
|
||||||||||||||||||||||||||||||||||||||||||||||||||
| Balance at September 30, 2021 |
|
$ |
|
$ |
|
$ |
(
|
$ |
|
$ |
(
|
$ |
|
$ |
|
$ |
|
||||||||||||||||||||||||||||||||||||
(Continued)
W. P. Carey 9/30/2022 10-Q
–
6
W. P. CAREY INC.
CONSOLIDATED STATEMENTS OF EQUITY (UNAUDITED)
(Continued)
(in thousands, except share and per share amounts)
| W. P. Carey Stockholders | |||||||||||||||||||||||||||||||||||||||||||||||||||||
| Distributions | Accumulated | ||||||||||||||||||||||||||||||||||||||||||||||||||||
| Common Stock | Additional | in Excess of | Deferred | Other | Total | ||||||||||||||||||||||||||||||||||||||||||||||||
| $0.001 Par Value | Paid-in | Accumulated | Compensation | Comprehensive | W. P. Carey | Noncontrolling | |||||||||||||||||||||||||||||||||||||||||||||||
| Shares | Amount | Capital | Earnings | Obligation | Loss | Stockholders | Interests | Total | |||||||||||||||||||||||||||||||||||||||||||||
|
Balance at January 1, 2022
|
|
$ |
|
$ |
|
$ |
(
|
$ |
|
$ |
(
|
$ |
|
$ |
|
$ |
|
||||||||||||||||||||||||||||||||||||
| Shares issued to stockholders of CPA:18 – Global in connection with CPA:18 Merger |
|
|
|
|
|
||||||||||||||||||||||||||||||||||||||||||||||||
| Shares issued under ATM Program, net |
|
|
|
|
|
||||||||||||||||||||||||||||||||||||||||||||||||
| Shares issued under Equity Forwards, net |
|
|
|
|
|
||||||||||||||||||||||||||||||||||||||||||||||||
| Shares issued upon delivery of vested restricted share awards |
|
— |
(
|
(
|
(
|
||||||||||||||||||||||||||||||||||||||||||||||||
| Shares issued upon purchases under employee share purchase plan |
|
— |
|
|
|
||||||||||||||||||||||||||||||||||||||||||||||||
| Amortization of stock-based compensation expense |
|
|
|
||||||||||||||||||||||||||||||||||||||||||||||||||
| Deferral of vested shares, net |
(
|
|
— | — | |||||||||||||||||||||||||||||||||||||||||||||||||
| Acquisition of noncontrolling interests in connection with the CPA:18 Merger | — |
|
|
||||||||||||||||||||||||||||||||||||||||||||||||||
| Distributions to noncontrolling interests | — |
(
|
(
|
||||||||||||||||||||||||||||||||||||||||||||||||||
|
Dividends declared ($
|
|
(
|
|
(
|
(
|
||||||||||||||||||||||||||||||||||||||||||||||||
| Net income |
|
|
(
|
|
|||||||||||||||||||||||||||||||||||||||||||||||||
| Other comprehensive loss: | |||||||||||||||||||||||||||||||||||||||||||||||||||||
| Foreign currency translation adjustments |
(
|
(
|
(
|
(
|
|||||||||||||||||||||||||||||||||||||||||||||||||
| Unrealized gain on derivative instruments |
|
|
|
||||||||||||||||||||||||||||||||||||||||||||||||||
| Reclassification of unrealized gain on investments to net income |
(
|
(
|
(
|
||||||||||||||||||||||||||||||||||||||||||||||||||
| Balance at September 30, 2022 |
|
$ |
|
$ |
|
$ |
(
|
$ |
|
$ |
(
|
$ |
|
$ |
|
$ |
|
||||||||||||||||||||||||||||||||||||
| W. P. Carey Stockholders | |||||||||||||||||||||||||||||||||||||||||||||||||||||
| Distributions | Accumulated | ||||||||||||||||||||||||||||||||||||||||||||||||||||
| Common Stock | Additional | in Excess of | Deferred | Other | Total | ||||||||||||||||||||||||||||||||||||||||||||||||
| $0.001 Par Value | Paid-in | Accumulated | Compensation | Comprehensive | W. P. Carey | Noncontrolling | |||||||||||||||||||||||||||||||||||||||||||||||
| Shares | Amount | Capital | Earnings | Obligation | Loss | Stockholders | Interests | Total | |||||||||||||||||||||||||||||||||||||||||||||
|
Balance at January 1, 2021
|
|
$ |
|
$ |
|
$ |
(
|
$ |
|
$ |
(
|
$ |
|
$ |
|
$ |
|
||||||||||||||||||||||||||||||||||||
| Shares issued under Equity Forwards, net |
|
|
|
|
|
||||||||||||||||||||||||||||||||||||||||||||||||
| Shares issued under ATM Program, net |
|
|
|
|
|
||||||||||||||||||||||||||||||||||||||||||||||||
| Shares issued upon delivery of vested restricted share awards |
|
— |
(
|
(
|
(
|
||||||||||||||||||||||||||||||||||||||||||||||||
| Shares issued upon purchases under employee share purchase plan |
|
— |
|
|
|
||||||||||||||||||||||||||||||||||||||||||||||||
| Amortization of stock-based compensation expense |
|
|
|
||||||||||||||||||||||||||||||||||||||||||||||||||
| Deferral of vested shares, net |
(
|
|
— | — | |||||||||||||||||||||||||||||||||||||||||||||||||
| Distributions to noncontrolling interests | — |
(
|
(
|
||||||||||||||||||||||||||||||||||||||||||||||||||
|
Dividends declared ($
|
|
(
|
|
(
|
(
|
||||||||||||||||||||||||||||||||||||||||||||||||
| Net income |
|
|
|
|
|||||||||||||||||||||||||||||||||||||||||||||||||
| Other comprehensive income: | |||||||||||||||||||||||||||||||||||||||||||||||||||||
| Unrealized gain on derivative instruments |
|
|
|
|
|||||||||||||||||||||||||||||||||||||||||||||||||
| Foreign currency translation adjustments |
(
|
(
|
(
|
||||||||||||||||||||||||||||||||||||||||||||||||||
| Balance at September 30, 2021 |
|
$ |
|
$ |
|
$ |
(
|
$ |
|
$ |
(
|
$ |
|
$ |
|
$ |
|
||||||||||||||||||||||||||||||||||||
See Notes to Consolidated Financial Statements.
W. P. Carey 9/30/2022 10-Q
–
7
W. P. CAREY INC.
CONSOLIDATED STATEMENTS OF CASH FLOWS (UNAUDITED)
(in thousands)
| Nine Months Ended September 30, | |||||||||||
| 2022 | 2021 | ||||||||||
| Cash Flows — Operating Activities | |||||||||||
| Net income | $ |
|
$ |
|
|||||||
| Adjustments to net income: | |||||||||||
| Depreciation and amortization, including intangible assets and deferred financing costs |
|
|
|||||||||
|
Straight-line rent adjustments
|
(
|
(
|
|||||||||
| Gain on sale of real estate, net |
(
|
(
|
|||||||||
| Gain on change in control of interests |
(
|
|
|||||||||
| Amortization of rent-related intangibles and deferred rental revenue |
|
|
|||||||||
| Impairment charges — Investment Management goodwill |
|
|
|||||||||
| Decrease in allowance for credit losses |
(
|
(
|
|||||||||
| Impairment charges — real estate |
|
|
|||||||||
| Distributions of earnings from equity method investments |
|
|
|||||||||
| (Earnings) losses from equity method investments |
(
|
|
|||||||||
| Stock-based compensation expense |
|
|
|||||||||
| Net realized and unrealized losses (gains) on equity securities, extinguishment of debt, foreign currency exchange rate movements, and other |
|
(
|
|||||||||
| Deferred income tax benefit |
(
|
(
|
|||||||||
| Asset management revenue received in shares of CPA:18 – Global |
(
|
(
|
|||||||||
| Net changes in other operating assets and liabilities |
(
|
(
|
|||||||||
| Net Cash Provided by Operating Activities |
|
|
|||||||||
| Cash Flows — Investing Activities | |||||||||||
| Purchases of real estate |
(
|
(
|
|||||||||
| Cash paid to stockholders of CPA:18 – Global in the CPA:18 Merger |
(
|
|
|||||||||
| Cash and restricted cash acquired in connection with the CPA:18 Merger |
|
|
|||||||||
| Proceeds from sales of real estate |
|
|
|||||||||
| Funding for real estate construction, redevelopments, and other capital expenditures on real estate |
(
|
(
|
|||||||||
| Capital contributions to equity method investments |
(
|
(
|
|||||||||
|
|
|
||||||||||
| Proceeds from repayment of loans receivable |
|
|
|||||||||
| Proceeds from repayment of short-term loans to affiliates |
|
|
|||||||||
| Funding of short-term loans to affiliates |
(
|
(
|
|||||||||
| Investment in loan receivable |
(
|
|
|||||||||
| Other investing activities, net |
(
|
(
|
|||||||||
| Return of capital from equity method investments |
|
|
|||||||||
| Net Cash Used in Investing Activities |
(
|
(
|
|||||||||
| Cash Flows — Financing Activities | |||||||||||
| Proceeds from Unsecured Revolving Credit Facility |
|
|
|||||||||
| Repayments of Unsecured Revolving Credit Facility |
(
|
(
|
|||||||||
| Dividends paid |
(
|
(
|
|||||||||
| Proceeds from issuance of Senior Unsecured Notes |
|
|
|||||||||
| Proceeds from Unsecured Term Loans |
|
|
|||||||||
| Proceeds from shares issued under ATM Program, net of selling costs |
|
|
|||||||||
| Proceeds from shares issued under Equity Forwards, net of selling costs |
|
|
|||||||||
| Scheduled payments of mortgage principal |
(
|
(
|
|||||||||
| Other financing activities, net |
|
|
|||||||||
| Prepayments of mortgage principal |
(
|
(
|
|||||||||
| Payments for withholding taxes upon delivery of equity-based awards |
(
|
(
|
|||||||||
| Payment of financing costs |
(
|
(
|
|||||||||
| Distributions paid to noncontrolling interests |
(
|
(
|
|||||||||
| Redemption of Senior Unsecured Notes |
|
(
|
|||||||||
| Net Cash Provided by Financing Activities |
|
|
|||||||||
| Change in Cash and Cash Equivalents and Restricted Cash During the Period | |||||||||||
| Effect of exchange rate changes on cash and cash equivalents and restricted cash |
(
|
(
|
|||||||||
| Net increase (decrease) in cash and cash equivalents and restricted cash |
|
(
|
|||||||||
| Cash and cash equivalents and restricted cash, beginning of period |
|
|
|||||||||
| Cash and cash equivalents and restricted cash, end of period | $ |
|
$ |
|
|||||||
See Notes to Consolidated Financial Statements.
W. P. Carey 9/30/2022 10-Q
–
8
W. P. CAREY INC.
CONSOLIDATED STATEMENTS OF CASH FLOWS
(Continued)
Supplemental Non-Cash Investing and Financing Activities:
2022
—
On August 1, 2022, CPA:18 – Global (as defined herein) merged with and into one of our indirect subsidiaries in the CPA:18 Merger (as defined herein) (
Note 3
). The following table summarizes estimated fair values of the assets acquired and liabilities assumed in the CPA:18 Merger (in thousands):
| Total Consideration | |||||
| Fair value of W. P. Carey shares of common stock issued | $ |
|
|||
| Cash consideration paid |
|
||||
| Cash paid for fractional shares |
|
||||
| Fair value of our equity interest in CPA:18 – Global prior to the CPA:18 Merger |
|
||||
| Fair value of our equity interest in jointly owned investments with CPA:18 – Global prior to the CPA:18 Merger |
|
||||
|
|
|||||
| Assets Acquired at Fair Value | |||||
| Land, buildings and improvements — net lease and other |
|
||||
| Land, buildings and improvements — operating properties |
|
||||
| Net investments in direct financing leases and loans receivable |
|
||||
| In-place lease and other intangible assets |
|
||||
| Above-market rent intangible assets |
|
||||
| Assets held for sale |
|
||||
| Goodwill |
|
||||
| Other assets, net (excluding restricted cash) |
|
||||
| Liabilities Assumed at Fair Value | |||||
| Non-recourse mortgages, net |
|
||||
| Accounts payable, accrued expenses and other liabilities |
|
||||
| Below-market rent and other intangible liabilities |
|
||||
| Deferred income taxes |
|
||||
| Amounts attributable to noncontrolling interests |
|
||||
| Net assets acquired excluding cash and restricted cash |
|
||||
| Cash and cash equivalents and restricted cash acquired | $ |
|
|||
See Notes to Consolidated Financial Statements.
W. P. Carey 9/30/2022 10-Q
–
9
W. P. CAREY INC.
NOTES TO CONSOLIDATED FINANCIAL STATEMENTS (UNAUDITED)
Note 1.
Business and Organization
W. P. Carey Inc. (“W. P. Carey”) is a REIT that, together with our consolidated subsidiaries, invests primarily in operationally-critical, single-tenant commercial real estate properties located in the United States and Northern and Western Europe on a long-term basis. We earn revenue principally by leasing the properties we own to companies on a triple-net lease basis, which generally requires each tenant to pay the costs associated with operating and maintaining the property.
Founded in 1973, our shares of common stock are listed on the New York Stock Exchange under the symbol “WPC.”
We elected to be taxed as a REIT under Section 856 through 860 of the Internal Revenue Code effective as of February 15, 2012. As a REIT, we are not subject to federal income taxes on income and gains that we distribute to our stockholders as long as we satisfy certain requirements, principally relating to the nature of our income and the level of our distributions, as well as other factors. We also own real property in jurisdictions outside the United States through foreign subsidiaries and are subject to income taxes on our pre-tax income earned from properties in such countries. Through our taxable REIT subsidiaries (“TRSs”), we also earn revenue as the advisor to certain non-traded investment programs. We hold all of our real estate assets attributable to our Real Estate segment under the REIT structure, while the activities conducted by our Investment Management segment subsidiaries have been organized under TRSs.
On August 1, 2022, a non-traded REIT that we advised, Corporate Property Associates 18 – Global Incorporated (“CPA:18 – Global”) merged with and into one of our indirect subsidiaries (the “CPA:18 Merger”) (
Note 3
). At September 30, 2022, we were the advisor to Carey European Student Housing Fund I, L.P. (“CESH”), a limited partnership formed for the purpose of developing, owning, and operating student housing properties in Europe (
Note 4
).
We refer to CPA:18 – Global (prior to the CPA:18 Merger) and CESH collectively as the “Managed Programs.” We no longer raise capital for new or existing funds, but currently expect to continue managing CESH through the end of its life cycle (
Note 4
).
Reportable Segments
Real Estate
— Lease revenues from our real estate investments generate the vast majority of our earnings. We invest primarily in commercial properties located in the United States and Northern and Western Europe, which are leased to companies on a triple-net lease basis. At September 30, 2022, our owned portfolio was comprised of our full or partial ownership interests in
1,428
properties, totaling approximately
175
million square feet, substantially all of which were net leased to
391
tenants, with a weighted-average lease term of
10.9
years and an occupancy rate of
98.9
%. In addition, at September 30, 2022, our portfolio was comprised of full or partial ownership interests in
87
operating properties, including
84
self-storage properties,
two
student housing properties, and
one
hotel, totaling approximately
6.6
million square feet.
Investment Management
— Through our TRSs, we manage the real estate investment portfolio for CESH, for which we earn asset management revenue. We may also be entitled to receive certain distributions pursuant to our advisory arrangements with CESH. At September 30, 2022, CESH owned all or a portion of
three
net-leased properties, totaling approximately
0.4
million square feet, all of which were leased to
one
tenant, with an occupancy rate of
100.0
%. CESH also owned
one
active build-to-suit project at the same date.
W. P. Carey 9/30/2022 10-Q
–
10
Notes to Consolidated Financial Statements (Unaudited)
Note 2.
Basis of Presentation
The preparation of financial statements in conformity with GAAP requires management to make estimates and assumptions that affect the reported amounts and the disclosure of contingent amounts in our consolidated financial statements and the accompanying notes. Actual results could differ from those estimates.
When we obtain an economic interest in an entity, we evaluate the entity to determine if it should be deemed a VIE and, if so, whether we are the primary beneficiary and are therefore required to consolidate the entity. There have been no significant changes in our VIE policies from what was disclosed in the 2021 Annual Report.
Upon the closing of the CPA:18 Merger, we acquired
five
consolidated VIEs and declassified
three
entities as VIEs.
At September 30, 2022 and December 31, 2021, we considered
16
and
14
entities to be VIEs, respectively, of which we consolidated
11
and
six
, respectively, as we are considered the primary beneficiary.
The following table presents a summary of selected financial data of the consolidated VIEs included in our consolidated balance sheets (in thousands):
| September 30, 2022 | December 31, 2021 | ||||||||||
| Land, buildings and improvements — net lease and other | $ |
|
$ |
|
|||||||
| Land, buildings and improvements — operating properties |
|
|
|||||||||
| Net investments in direct financing leases and loans receivable |
|
|
|||||||||
| In-place lease intangible assets and other |
|
|
|||||||||
| Above-market rent intangible assets |
|
|
|||||||||
| Accumulated depreciation and amortization |
(
|
(
|
|||||||||
| Total assets |
|
|
|||||||||
| Non-recourse mortgages, net | $ |
|
$ |
|
|||||||
| Below-market rent and other intangible liabilities, net |
|
|
|||||||||
| Total liabilities |
|
|
|||||||||
W. P. Carey 9/30/2022 10-Q
–
11
Notes to Consolidated Financial Statements (Unaudited)
Reclassifications
Certain prior period amounts have been reclassified to conform to the current period presentation.
We currently present Income from direct financing leases and loans receivable on its own line item in the consolidated statements of income. Previously, income from direct financing leases was included within Lease revenues and income from loans receivable was included within Lease termination income and other in the consolidated statements of income.
We currently present Land, buildings and improvements — net lease and other and Land, buildings and improvements — operating properties on separate line items in the consolidated balance sheets. Previously, land, buildings and improvements attributable to net lease properties and operating properties were aggregated within Land, buildings and improvements in the consolidated balance sheets (
Note 5
).
Revenue Recognition
There have been no significant changes in our policies for revenue from contracts under Accounting Standards Codification (“ASC”) 606 from what was disclosed in the 2021 Annual Report. ASC 606 does not apply to our lease revenues, which constitute a majority of our revenues, but primarily applies to revenues generated from our hotel operating properties and our Investment Management segment. Revenue from contracts for our Real Estate segment primarily represented hotel operating property revenues of $
3.7
million and $
2.4
million for the three months ended September 30, 2022 and 2021, respectively, and $
9.1
million and $
4.9
million for the nine months ended September 30, 2022 and 2021, respectively (
Note 16
). Revenue from contracts under ASC 606 from our Investment Management segment is discussed in
Note 4
.
Restricted Cash
The following table provides a reconciliation of cash and cash equivalents and restricted cash reported within the consolidated balance sheets to the consolidated statements of cash flows (in thousands):
| September 30, 2022 | December 31, 2021 | ||||||||||
|
Cash and cash equivalents
|
$ |
|
$ |
|
|||||||
|
Restricted cash
(a)
|
|
|
|||||||||
|
Total cash and cash equivalents and restricted cash
|
$ |
|
$ |
|
|||||||
__________
(a)
Restricted cash is included within Other assets, net on our consolidated balance sheets.
W. P. Carey 9/30/2022 10-Q
–
12
Notes to Consolidated Financial Statements (Unaudited)
Note 3.
Merger with CPA:18 – Global
CPA:18 Merger
On February 27, 2022, we and certain of our subsidiaries entered into a merger agreement with CPA:18 – Global, pursuant to which CPA:18 – Global would merge with and into one of our indirect subsidiaries in exchange for shares of our common stock and cash, subject to approval by the stockholders of CPA:18 – Global. The CPA:18 Merger and related transactions were approved by the stockholders of CPA:18 – Global on July 26, 2022 and completed on August 1, 2022.
At the effective time of the CPA:18 Merger, each share of CPA:18 – Global common stock issued and outstanding immediately prior to the effective time of the CPA:18 Merger was canceled and, in exchange for cancellation of such share, the rights attaching to such share were converted automatically into the right to receive (i)
0.0978
shares of our common stock and (ii) $
3.00
in cash, which we refer to herein as the Merger Consideration. Each share of CPA:18 – Global common stock owned by us or any of our subsidiaries immediately prior to the effective time of the CPA:18 Merger was automatically canceled and retired, and ceased to exist, for no Merger Consideration. In exchange for the
141,099,002
shares of CPA:18 – Global common stock that we and our subsidiaries did not previously own, we paid total merger consideration of approximately $
1.6
billion, consisting of (i) the issuance of
13,786,302
shares of our common stock with a fair value of $
1.2
billion, based on the closing price of our common stock on August 1, 2022 of $
87.46
per share, (ii) cash consideration of $
423.3
million, and (iii) cash of $
0.1
million paid in lieu of issuing any fractional shares of our common stock. Pursuant to the terms of the definitive merger agreement, in connection with the closing of the CPA:18 Merger, we waived certain back-end fees that we would have otherwise been entitled to receive from CPA:18 – Global upon its liquidation pursuant to the terms of our pre-closing advisory agreement with CPA:18 – Global.
Immediately prior to the closing of the CPA:18 Merger, CPA:18 – Global’s portfolio was comprised of full or partial ownership interests in
42
leased properties (including
seven
properties in which we already owned a partial ownership interest), substantially all of which were net leased with a weighted-average lease term of
7.0
years, an occupancy rate of
99.3
%, and an estimated contractual minimum annualized base rent (“ABR”) totaling $
81.0
million, as well as
65
self-storage operating properties and
two
student housing operating properties totaling
5.1
million square feet. The related property-level debt was comprised of non-recourse mortgage loans with an aggregate consolidated fair value of approximately $
900.2
million with a weighted-average annual interest rate of
5.1
% as of August 1, 2022. From the closing of the CPA:18 Merger through September 30, 2022, lease revenues, operating property revenues, and net loss from properties acquired were $
16.5
million, $
15.4
million, and $
0.5
million, respectively.
Purchase Price Allocation
We accounted for the CPA:18 Merger as a business combination under the acquisition method of accounting. After consideration of all applicable factors pursuant to the business combination accounting rules, we were considered the “accounting acquirer” due to various factors, including the fact that our stockholders held the largest portion of the voting rights in the combined company upon completion of the CPA:18 Merger. Costs related to the CPA:18 Merger have been expensed as incurred and classified within Merger and other expenses in the consolidated statements of income, totaling $
17.1
million for the nine months ended September 30, 2022.
W. P. Carey 9/30/2022 10-Q
–
13
Notes to Consolidated Financial Statements (Unaudited)
| Preliminary Purchase Price Allocation (in thousands) | |||||
| Total Consideration | |||||
| Fair value of W. P. Carey shares of common stock issued | $ |
|
|||
| Cash consideration paid |
|
||||
| Cash paid for fractional shares |
|
||||
| Merger Consideration |
|
||||
| Fair value of our equity interest in CPA:18 – Global prior to the CPA:18 Merger |
|
||||
| Fair value of our equity interest in jointly owned investments with CPA:18 – Global prior to the CPA:18 Merger |
|
||||
| $ |
|
||||
| Preliminary Purchase Price Allocation (in thousands) | |||||
| Assets | |||||
| Land, buildings and improvements — net lease and other | $ |
|
|||
| Land, buildings and improvements — operating properties |
|
||||
| Net investments in direct financing leases and loans receivable |
|
||||
| In-place lease and other intangible assets |
|
||||
| Above-market rent intangible assets |
|
||||
| Assets held for sale |
|
||||
| Cash and cash equivalents and restricted cash |
|
||||
| Other assets, net (excluding restricted cash) |
|
||||
| Total assets |
|
||||
| Liabilities | |||||
| Non-recourse mortgages, net |
|
||||
| Accounts payable, accrued expenses and other liabilities |
|
||||
| Below-market rent and other intangible liabilities |
|
||||
| Deferred income taxes |
|
||||
| Total liabilities |
|
||||
| Total identifiable net assets |
|
||||
| Noncontrolling interests |
(
|
||||
| Goodwill |
|
||||
| $ |
|
||||
Goodwill
The $
172.3
million of goodwill recorded in the CPA:18 Merger was primarily due to the premium we paid over CPA:18 – Global’s estimated fair value. Management believes the premium is supported by several factors, including that the CPA:18 Merger (i) concludes our exit from the non-traded REIT business, (ii) adds a high-quality diversified portfolio of net lease assets that is well-aligned with our existing portfolio, (iii) enhances certain portfolio metrics, and (iv) adds an attractive portfolio of self-storage operating properties.
The fair value of the
13,786,302
shares of our common stock issued in the CPA:18 Merger as part of the consideration paid for CPA:18 – Global of $
1.6
billion was derived from the closing market price of our common stock on the acquisition date. As required by GAAP, the fair value related to the assets acquired and liabilities assumed, as well as the shares exchanged, has been computed as of the date we gained control, which was the closing date of the CPA:18 Merger, in a manner consistent with the methodology described above.
Goodwill is not deductible for income tax purposes.
W. P. Carey 9/30/2022 10-Q
–
14
Notes to Consolidated Financial Statements (Unaudited)
Equity Investments
During the third quarter of 2022, we recognized a gain on change in control of interests of approximately $
22.5
million, which was the difference between the carrying value of approximately $
65.8
million and the fair value of approximately $
88.3
million of our previously held equity interest in
8,556,732
shares of CPA:18 – Global’s common stock.
The CPA:18 Merger also resulted in our acquisition of the remaining interests in four investments in which we already had a joint interest and accounted for under the equity method. Upon acquiring the remaining interests in these investments, we owned 100% of these investments and thus accounted for the acquisitions of these interests utilizing the purchase method of accounting. Due to the change in control of the
four
jointly owned investments that occurred, we recorded a gain on change in control of interests of approximately $
11.4
million during the third quarter of 2022, which was the difference between our carrying values and the fair values of our previously held equity interests on August 1, 2022 of approximately $
17.2
million and approximately $
28.6
million, respectively. Subsequent to the CPA:18 Merger, we consolidate these wholly owned investments.
The fair values of our previously held equity interests are based on the estimated fair market values of the underlying real estate and related mortgage debt, both of which were determined by management relying in part on a third party. Real estate valuation requires significant judgment. We determined the significant assumptions to be Level 3 with ranges for our previously held equity interests as follows:
•
Market rents ranged from $
8.65
per square foot to $
21.00
per square foot;
•
Discount rates applied to the estimated net operating income of each property ranged from approximately
5.75
% to
9.75
%;
•
Discount rates applied to the estimated residual value of each property ranged from approximately
6.50
% to
8.50
%;
•
Residual capitalization rates applied to the properties ranged from approximately
5.75
% to
8.00
%;
•
The fair market value of the property level debt was determined based upon available market data for comparable liabilities and by applying selected discount rates to the stream of future debt payments; and
•
Discount rates applied to the property level debt cash flows ranged from approximately
2.28
% to
5.50
%.
Pro Forma Financial Information
The following consolidated pro forma financial information has been presented as if the CPA:18 Merger had occurred on January 1, 2021 for the three and nine months ended September 30, 2022 and 2021. The pro forma financial information is not necessarily indicative of what the actual results would have been had the CPA:18 Merger on that date, nor does it purport to represent the results of operations for future periods.
(in thousands)
| Three Months Ended September 30, | Nine Months Ended September 30, | ||||||||||||||||||||||
| 2022 | 2021 | 2022 | 2021 | ||||||||||||||||||||
| Pro forma total revenues | $ |
|
$ |
|
$ |
|
$ |
|
|||||||||||||||
Note 4.
Agreements and Transactions with Related Parties
Advisory Agreements and Partnership Agreements with the Managed Programs
We currently have advisory arrangements with CESH, pursuant to which we earn fees and are entitled to receive reimbursement for certain fund management expenses. Upon completion of the CPA:18 Merger on August 1, 2022 (
Note 3
), our advisory agreements with CPA:18 – Global were terminated, and we ceased earning revenue from CPA:18 – Global. We no longer raise capital for new or existing funds, but we currently expect to continue to manage CESH and earn various fees (as described below) through the end of its life cycle.
W. P. Carey 9/30/2022 10-Q
–
15
Notes to Consolidated Financial Statements (Unaudited)
The merger between Carey Watermark Investors Incorporated (“CWI 1”) and Carey Watermark Investors 2 Incorporated (“CWI 2”), two former affiliates (the “CWI 1 and CWI 2 Merger”), closed on April 13, 2020 and is discussed in detail in the 2021 Annual Report. Subsequently, CWI 2 was renamed Watermark Lodging Trust, Inc. (“WLT”). In connection with the CWI 1 and CWI 2 Merger, we entered into a transition services agreement, under which we provided certain transition services at cost to WLT generally for a period of 12 months from closing. On October 13, 2021, all services provided under the transition services agreement were terminated.
The following tables present a summary of revenue earned, reimbursable costs, and distributions of Available Cash received/accrued from the Managed Programs and WLT for the periods indicated, included in the consolidated financial statements (in thousands):
| Three Months Ended September 30, | Nine Months Ended September 30, | ||||||||||||||||||||||
| 2022 | 2021 | 2022 | 2021 | ||||||||||||||||||||
|
Distributions of Available Cash
(a)
|
$ |
|
$ |
|
$ |
|
$ |
|
|||||||||||||||
|
Asset management revenue
(b) (c)
|
|
|
|
|
|||||||||||||||||||
|
Reimbursable costs from affiliates
(b)
|
|
|
|
|
|||||||||||||||||||
|
Interest income on deferred acquisition fees and loans to affiliates
(d)
|
|
|
|
|
|||||||||||||||||||
| $ |
|
$ |
|
$ |
|
$ |
|
||||||||||||||||
| Three Months Ended September 30, | Nine Months Ended September 30, | ||||||||||||||||||||||
| 2022 | 2021 | 2022 | 2021 | ||||||||||||||||||||
|
CPA:18 – Global
|
$ |
|
$ |
|
$ |
|
$ |
|
|||||||||||||||
| CESH |
|
|
|
|
|||||||||||||||||||
| WLT (reimbursed transition services) |
|
|
|
|
|||||||||||||||||||
| $ |
|
$ |
|
$ |
|
$ |
|
||||||||||||||||
__________
(a)
Included within Earnings (losses) from equity method investments in the consolidated statements of income. Amounts for the three and nine months ended September 30, 2022 reflect an additional month of activity as compared to the prior year periods, since the CPA:18 Merger closed on August 1, 2022 and distributions of Available Cash are paid on a quarter lag.
(b)
Amounts represent revenues from contracts under ASC 606.
(c)
Included within Asset management and other revenue in the consolidated statements of income.
(d)
Included within Non-operating income in the consolidated statements of income.
The following table presents a summary of amounts included in Due from affiliates in the consolidated financial statements (in thousands):
| September 30, 2022 | December 31, 2021 | ||||||||||
| Asset management fees receivable | $ |
|
$ |
|
|||||||
| Accounts receivable |
|
|
|||||||||
| Reimbursable costs |
|
|
|||||||||
| Current acquisition fees receivable |
|
|
|||||||||
| Deferred acquisition fees receivable, including accrued interest |
|
|
|||||||||
| $ |
|
$ |
|
||||||||
W. P. Carey 9/30/2022 10-Q
–
16
Notes to Consolidated Financial Statements (Unaudited)
Asset Management Revenue
Under the advisory agreements with the Managed Programs, we earn asset management revenue for managing their investment portfolios.
The following table presents a summary of our asset management fee arrangements with the Managed Programs:
| Managed Program | Rate | Payable | Description | |||||||||||||||||
| CPA:18 – Global |
|
In shares of its Class A common stock and/or cash, at the option of CPA:18 – Global; payable in shares of its Class A common stock for 2021 through February 28, 2022; payable in cash from March 1, 2022 to August 1, 2022 (the date of the completion of the CPA:18 Merger) | Rate depended on the type of investment and was based on the average market or average equity value, as applicable | |||||||||||||||||
| CESH |
|
In cash | Based on gross assets at fair value | |||||||||||||||||
Reimbursable Costs from Affiliates
CESH reimburses us in cash for certain personnel and overhead costs that we incur on its behalf, based on actual expenses incurred.
Distributions of Available Cash
We were entitled to receive distributions of up to
10
% of the Available Cash (as defined in CPA:18 – Global’s partnership agreement) from the operating partnership of CPA:18 – Global, payable quarterly in arrears. After completion of the CPA:18 Merger on August 1, 2022 (
Note 3
), we no longer receive distributions of Available Cash from CPA:18 – Global.
Back-End Fees and Interests in the Managed Programs
Under our advisory arrangements with CESH, we may also receive compensation in connection with providing a liquidity event for its investors. Such back-end fees or interests include or may include interests in disposition proceeds. There can be no assurance as to whether or when any back-end fees or interests will be realized. Pursuant to the terms of the definitive merger agreement, in connection with the closing of the CPA:18 Merger, we waived certain back-end fees that we would have been entitled to receive from CPA:18 – Global upon its liquidation pursuant to the terms of our advisory agreement and partnership agreement with CPA:18 – Global (
Note 3
).
Other Transactions with Affiliates
Loans to Affiliates
From time to time, our board of directors has approved the making of secured and unsecured loans or lines of credit from us to certain of the Managed Programs, at our sole discretion, generally for the purpose of facilitating acquisitions or for working capital purposes. The principal outstanding balance on our line of credit to CPA:18 – Global was $
16.0
million as of June 30, 2022.
No
amounts were outstanding as of December 31, 2021. In July 2022, CPA:18 – Global repaid the principal outstanding balance in full. The loan agreement with CPA:18 – Global was terminated upon completion of the CPA:18 Merger on August 1, 2022. No such line of credit with CESH existed during the reporting period.
Other
At September 30, 2022, we owned interests in
ten
jointly owned investments in real estate, with the remaining interests held by third parties. We consolidate
six
such investments and account for the remaining
four
investments under the equity method of accounting (
Note 8
). In addition, we owned limited partnership units of CESH at that date. We elected to account for our investment in CESH under the fair value option (
Note 8
).
W. P. Carey 9/30/2022 10-Q
–
17
Notes to Consolidated Financial Statements (Unaudited)
Note 5.
Land, Buildings and Improvements and Assets Held for Sale
Land, Buildings and Improvements — Net Lease and Other
Land and buildings leased to others, which are subject to operating leases, and real estate under construction, are summarized as follows (in thousands):
| September 30, 2022 | December 31, 2021 | ||||||||||
| Land | $ |
|
$ |
|
|||||||
| Buildings and improvements |
|
|
|||||||||
| Real estate under construction |
|
|
|||||||||
| Less: Accumulated depreciation |
(
|
(
|
|||||||||
| $ |
|
$ |
|
||||||||
As discussed in
Note 3
, we acquired
39
consolidated properties subject to existing operating leases in the CPA:18 Merger, which increased the carrying value of our Land, buildings and improvements — net lease and other by $
881.6
million during the nine months ended September 30, 2022.
During the nine months ended September 30, 2022, the U.S. dollar strengthened against the euro, as the end-of-period rate for the U.S. dollar in relation to the euro decreased by
13.9
% to $
0.9748
from $
1.1326
. As a result of this fluctuation in foreign currency exchange rates, the carrying value of our Land, buildings and improvements — net lease and other decreased by $
601.1
million from December 31, 2021 to September 30, 2022.
In connection with changes in lease classifications due to termination of the underlying leases, we reclassified
two
properties with an aggregate carrying value of $
30.5
million from Net investments in direct financing leases and loans receivable to Land, buildings and improvements — net lease and other during the nine months ended September 30, 2022 (
Note 6
).
Depreciation expense, including the effect of foreign currency translation, on our buildings and improvements subject to operating leases was $
76.0
million and $
70.8
million for the three months ended September 30, 2022 and 2021, respectively, and $
221.0
million and $
207.2
million for the nine months ended September 30, 2022 and 2021, respectively.
W. P. Carey 9/30/2022 10-Q
–
18
Notes to Consolidated Financial Statements (Unaudited)
Acquisitions of Real Estate
During the nine months ended September 30, 2022, we entered into the following investments, which were deemed to be real estate asset acquisitions, and which excludes properties acquired in the CPA:18 Merger (dollars in thousands):
| Property Location(s) | Number of Properties | Date of Acquisition | Property Type | Total Capitalized Costs | ||||||||||||||||||||||
| Pleasant Prairie, Wisconsin |
|
1/10/2022 | Industrial | $ |
|
|||||||||||||||||||||
|
Various, Spain
(a)
|
|
2/3/2022 | Funeral Home |
|
||||||||||||||||||||||
|
Various, Denmark
(a) (b)
|
|
2/11/2022 | Retail |
|
||||||||||||||||||||||
|
Laval, Canada
(a)
|
|
2/18/2022 | Industrial |
|
||||||||||||||||||||||
|
Chattanooga, Tennessee
(c)
|
|
3/4/2022 | Warehouse |
|
||||||||||||||||||||||
|
Various, United States (
|
|
4/27/2022; 5/9/2022 | Industrial |
|
||||||||||||||||||||||
| Various, United States |
|
5/16/2022 | Industrial; Warehouse |
|
||||||||||||||||||||||
|
Various, Denmark
(a) (b)
|
|
6/1/2022; 6/30/2022 | Retail |
|
||||||||||||||||||||||
| Medina, Ohio |
|
6/17/2022 | Industrial |
|
||||||||||||||||||||||
|
Bree, Belgium
(a)
|
|
6/30/2022 | Warehouse |
|
||||||||||||||||||||||
|
Various, Spain
(a)
|
|
7/21/2022 | Retail |
|
||||||||||||||||||||||
| Various, United States |
|
7/26/2022 | Industrial; Warehouse |
|
||||||||||||||||||||||
|
Various, Denmark
(a) (b)
|
|
8/1/2022; 9/28/2022 | Retail |
|
||||||||||||||||||||||
| Westlake, Ohio |
|
8/3/2022 | Warehouse |
|
||||||||||||||||||||||
| Hebron and Strongsville, Ohio; and Scarborough, Canada |
|
8/10/2022 | Industrial; Warehouse |
|
||||||||||||||||||||||
| Clifton Park, New York and West Des Moines, Iowa |
|
8/12/2022 | Specialty |
|
||||||||||||||||||||||
|
Orzinuovi, Italy
(a)
|
|
8/26/2022 | Industrial |
|
||||||||||||||||||||||
|
|
$ |
|
||||||||||||||||||||||||
__________
(a)
Amount reflects the applicable exchange rate on the date of transaction.
(b)
We also entered into purchase agreements to acquire
five
additional retail facilities leased to this tenant totaling $
17.7
million (based on the exchange rate of the Danish krone at September 30, 2022), which is expected to be completed in 2022.
(c)
We also committed to fund an additional $
21.9
million for an expansion at the facility, which is expected to be completed in the third quarter of 2023.
W. P. Carey 9/30/2022 10-Q
–
19
Notes to Consolidated Financial Statements (Unaudited)
The aggregate purchase price allocation for investments disclosed above is as follows (dollars in thousands):
| Total Capitalized Costs | |||||
| Land | $ |
|
|||
| Buildings and improvements |
|
||||
| Intangible assets and liabilities: | |||||
|
In-place lease (weighted-average expected life of
|
|
||||
|
Below-market rent (expected life of
|
(
|
||||
| Right-of-use assets: | |||||
|
Prepaid rent
(a)
|
|
||||
| $ |
|
||||
__________
(a)
Represents prepaid rent for a land lease. Therefore, there is no future obligation on the land lease asset and no corresponding operating lease liability. This asset is included in In-place lease intangible assets and other in the consolidated balance sheets.
Real Estate Under Construction
During the nine months ended September 30, 2022, we capitalized real estate under construction totaling $
127.3
million (including $
78.3
million related to a student housing development project acquired in the CPA:18 Merger, as discussed below under
Land, Buildings and Improvements — Operating Properties
). The number of construction projects in progress with balances included in real estate under construction was
four
and
six
as of September 30, 2022 and December 31, 2021, respectively. Aggregate unfunded commitments totaled approximately $
38.2
million and $
55.3
million as of September 30, 2022 and December 31, 2021, respectively.
During the nine months ended September 30, 2022, we completed the following construction projects (dollars in thousands):
| Property Location(s) | Primary Transaction Type | Number of Properties | Date of Completion | Property Type |
Total Capitalized Costs
(a)
|
|||||||||||||||||||||||||||
|
Hurricane, Utah
|
Expansion |
|
3/8/2022 | Warehouse | $ |
|
||||||||||||||||||||||||||
|
Breda, Netherlands
(a)
|
Expansion |
|
3/18/2022 | Warehouse |
|
|||||||||||||||||||||||||||
| Bowling Green, Kentucky | Renovation |
|
4/26/2022 | Warehouse |
|
|||||||||||||||||||||||||||
|
Wageningen, Netherlands
(a)
|
Build-to-Suit |
|
7/7/2022 | Research and Development |
|
|||||||||||||||||||||||||||
|
Radomsko, Poland
(a)
|
Expansion |
|
8/1/2022 | Industrial |
|
|||||||||||||||||||||||||||
|
|
$ |
|
||||||||||||||||||||||||||||||
__________
(a)
Amount reflects the applicable exchange rate on the date of transaction.
During the nine months ended September 30, 2022, we committed to fund
two
build-to-suit projects for outdoor advertising structures in New Jersey, for an aggregate amount of $
3.6
million. We currently expect to complete the projects in the first quarter of 2023.
Capitalized interest incurred during construction was $
0.3
million and $
0.6
million for the three months ended September 30, 2022 and 2021, respectively, and $
1.3
million and $
1.9
million for the nine months ended September 30, 2022 and 2021, respectively, which reduces Interest expense in the consolidated statements of income.
Dispositions of Properties
During the nine months ended September 30, 2022, we sold
14
properties, which were classified as Land, buildings and improvements — net lease and other. As a result, the carrying value of our Land, buildings and improvements — net lease and other decreased by $
74.7
million from December 31, 2021 to September 30, 2022 (
Note 15
).
W. P. Carey 9/30/2022 10-Q
–
20
Notes to Consolidated Financial Statements (Unaudited)
Lease Termination Income and Other
2022
— For the three and nine months ended September 30, 2022, lease termination income and other on our consolidated statements of income included: (i) lease termination income of $
4.2
million received from a tenant during the third quarter of 2022, (ii) other
lease-related settlements
totaling $
3.8
million and $
10.0
million, respectively
; (iii) income from a parking garage attached to one of our net-leased properties totaling
$
0.2
million and $
1.5
million, respectively, and (iv) lease termination income of $
8.2
million received from a tenant during the nine months ended September 30, 2022.
2021
— For the three and nine months ended September 30, 2021, lease termination income and other on our consolidated statements of income included: (i) lease-related settlements totaling $
0.8
million and $
6.1
million, respectively; and (ii) income from a parking garage attached to one of our net-leased properties totaling $
0.5
million and $
1.4
million, respectively.
Leases
Operating Lease Income
Lease income related to operating leases recognized and included in the consolidated statements of income is as follows (in thousands):
| Three Months Ended September 30, | Nine Months Ended September 30, | ||||||||||||||||||||||
| 2022 | 2021 | 2022 | 2021 | ||||||||||||||||||||
|
Lease income — fixed
|
$ |
|
$ |
|
$ |
|
$ |
|
|||||||||||||||
|
Lease income — variable
(a)
|
|
|
|
|
|||||||||||||||||||
| Total operating lease income | $ |
|
$ |
|
$ |
|
$ |
|
|||||||||||||||
__________
(a)
Includes (i) rent increases based on changes in the U.S. Consumer Price Index and other comparable indices and (ii) reimbursements for property taxes, insurance, and common area maintenance services.
We assumed
seven
land lease arrangements in the CPA:18 Merger. As a result, we capitalized (i) right-of-use assets totaling $
24.5
million (comprised of below-market ground lease intangibles totaling $
17.9
million and land lease right-of-use assets totaling $
6.6
million), which are included within In-place lease intangible assets and other on our consolidated balance sheets, and (ii) operating lease liabilities totaling $
6.6
million, which are included within Accounts payable, accrued expenses and other liabilities on our consolidated balance sheets.
Land, Buildings and Improvements — Operating Properties
At September 30, 2022, Land, buildings and improvements — operating properties consisted of our investments in
75
consolidated self-storage properties,
two
consolidated student housing properties, and
one
consolidated hotel. We acquired
65
self-storage properties,
one
student housing property, and
one
student housing development project with an aggregate fair value of $
1.0
billion in the CPA:18 Merger (including $
78.3
million within real estate under construction) (
Note 3
). In September 2022, we partially placed into service the student housing development project for total capitalized costs of $
32.9
million. At December 31, 2021, Land, buildings and improvements — operating properties consisted of our investments in
ten
consolidated self-storage properties and
one
consolidated hotel.
Below is a summary of our Land, buildings and improvements — operating properties (in thousands):
| September 30, 2022 | December 31, 2021 | ||||||||||
| Land | $ |
|
$ |
|
|||||||
| Buildings and improvements |
|
|
|||||||||
| Real estate under construction |
|
|
|||||||||
| Less: Accumulated depreciation |
(
|
(
|
|||||||||
| $ |
|
$ |
|
||||||||
Depreciation expense on our buildings and improvements attributable to Operating real estate was $
4.1
million and $
0.7
million for the three months ended September 30, 2022 and 2021, respectively, and $
5.4
million and $
2.1
million for the nine months ended September 30, 2022 and 2021, respectively.
W. P. Carey 9/30/2022 10-Q
–
21
Notes to Consolidated Financial Statements (Unaudited)
Assets Held for Sale, Net
Below is a summary of our properties held for sale (in thousands):
| September 30, 2022 | December 31, 2021 | ||||||||||
|
Land, buildings and improvements — net lease and other
|
$ |
|
$ |
|
|||||||
| In-place lease intangible assets and other |
|
|
|||||||||
| Above-market rent intangible assets |
|
|
|||||||||
| Accumulated depreciation and amortization |
|
(
|
|||||||||
| Assets held for sale, net | $ |
|
$ |
|
|||||||
At September 30, 2022, we had
one
property classified as Assets held for sale, net, with a carrying value of $
38.6
million. We acquired
two
properties classified as Assets held for sale, net, with a fair value of $
85.0
million in the CPA:18 Merger (
Note 3
),
one
of which was sold in August 2022 (
Note 15
). At December 31, 2021 we had
two
properties classified as Assets held for sale, net, with an aggregate carrying value of $
8.3
million. These properties were sold in the first quarter of 2022.
Note 6.
Finance Receivables
Assets representing rights to receive money on demand or at fixed or determinable dates are referred to as finance receivables. Our finance receivables portfolio consists of our Net investments in direct financing leases and loans receivable (net of allowance for credit losses), and deferred acquisition fees. Operating leases are not included in finance receivables.
Finance Receivables
Net investments in direct financing leases and loans receivable are summarized as follows (in thousands):
| Maturity Date | September 30, 2022 | December 31, 2021 | |||||||||||||||
|
Net investments in direct financing leases
(a)
|
2022 – 2036 | $ |
|
$ |
|
||||||||||||
|
Sale-leaseback transactions accounted for as loans receivable
(b)
|
2038 – 2052 |
|
|
||||||||||||||
|
Secured loans receivable
(c)
|
2022 – 2024 |
|
|
||||||||||||||
| $ |
|
$ |
|
||||||||||||||
__________
(a)
Amounts are net of allowance for credit losses, as disclosed below under
Net Investments in Direct Financing Leases
.
(b)
These investments are accounted for as loans receivable in accordance with ASC 310,
Receivables
and ASC 842,
Leases
. Maturity dates reflect the current lease maturity dates.
(c)
Amounts are net of allowance for credit losses of $
2.1
million and $
12.6
million as of September 30, 2022 and December 31, 2021, respectively.
Net Investments in Direct Financing Leases
Net investments in direct financing leases is summarized as follows (in thousands):
| September 30, 2022 | December 31, 2021 | ||||||||||
| Lease payments receivable | $ |
|
$ |
|
|||||||
| Unguaranteed residual value |
|
|
|||||||||
|
|
|
||||||||||
| Less: unearned income |
(
|
(
|
|||||||||
|
Less: allowance for credit losses
(a)
|
(
|
(
|
|||||||||
| $ |
|
$ |
|
||||||||
__________
W. P. Carey 9/30/2022 10-Q
–
22
Notes to Consolidated Financial Statements (Unaudited)
Income from direct financing leases, which is included in Income from direct financing leases and loans receivable in the consolidated financial statements, was $
13.0
million and $
15.6
million for the three months ended September 30, 2022 and 2021, respectively, and $
40.2
million and $
48.9
million for the nine months ended September 30, 2022 and 2021, respectively.
As discussed in
Note 3
, we acquired one consolidated property subject to a direct financing lease in the CPA:18 Merger, which increased the carrying value of our Net investments in direct financing leases and loans receivable by $
10.5
million during the nine months ended September 30, 2022. During the nine months ended September 30, 2022, we reclassified
two
properties with an aggregate carrying value of $
30.5
million from Net investments in direct financing leases and loans receivable to Real estate in connection with changes in lease classifications due to termination of the underlying leases. During the nine months ended September 30, 2022, the U.S. dollar strengthened against the euro, resulting in a $
53.7
million decrease in the carrying value of Net investments in direct financing leases and loans receivable from December 31, 2021 to September 30, 2022.
Loans Receivable
During the nine months ended September 30, 2022, we entered into the following sale-leaseback, which was deemed to be a loan receivable in accordance with ASC 310,
Receivables
and ASC 842,
Leases
(dollars in thousands):
| Property Location(s) | Number of Properties | Date of Acquisition | Property Type | Total Investment | ||||||||||||||||||||||
|
Various, Belgium
(a)
|
|
6/22/2022 | Retail | $ |
|
|||||||||||||||||||||
|
|
$ |
|
||||||||||||||||||||||||
__________
(a)
Amount reflects the applicable exchange rate on the date of transaction.
As discussed in
Note 3
, we acquired one secured loan receivable in the CPA:18 Merger for $
28.0
million, which pays interest at
10
% per annum with a maturity date of July 2024.
In September 2022, one of our secured loans receivable was repaid to us for $
34.0
million. In connection with this repayment, we recorded a release of allowance for credit losses of $
10.5
million since the loan principal was fully repaid. In addition, in the first quarter of 2021, we entered into an agreement with the borrowers for certain of our secured loans receivable, who agreed to pay us at maturity a total of $
3.7
million of unpaid interest due over the previous year. In connection with the repayment of the secured loan receivable in September 2022, we collected $
2.3
million of this interest, which was included in Income from direct financing leases and loans receivable on the consolidated statements of income for the three and nine months ended September 30, 2022. The remaining $
1.4
million of unpaid interest is related to a secured loan receivable that we still own, and has not been recognized in the consolidated financial statements due to uncertainty of collectibility.
Earnings from our loans receivable are included in Income from direct financing leases and loans receivable in the consolidated financial statements, and totaled $
7.6
million and $
1.2
million for the three months ended September 30, 2022 and 2021, respectively, and $
16.6
million and $
3.0
million for the nine months ended September 30, 2022 and 2021, respectively.
Credit Quality of Finance Receivables
We generally invest in facilities that we believe are critical to a tenant’s business and therefore have a lower risk of tenant default. At both September 30, 2022 and December 31, 2021, other than uncollected income from our secured loans receivable (as noted above), no material balances of our finance receivables were past due. Other than the lease terminations noted under
Net Investments in Direct Financing Leases
above, there were no material modifications of finance receivables during the nine months ended September 30, 2022.
W. P. Carey 9/30/2022 10-Q
–
23
Notes to Consolidated Financial Statements (Unaudited)
We evaluate the credit quality of our finance receivables utilizing an internal five-point credit rating scale, with one representing the highest credit quality and five representing the lowest. A credit quality of one through three indicates a range of investment grade to stable. A credit quality of four through five indicates a range of inclusion on the watch list to risk of default. The credit quality evaluation of our finance receivables is updated quarterly.
A summary of our finance receivables by internal credit quality rating, excluding our allowance for credit losses, is as follows (dollars in thousands):
| Number of Tenants / Obligors at | Carrying Value at | |||||||||||||||||||||||||
| Internal Credit Quality Indicator | September 30, 2022 | December 31, 2021 | September 30, 2022 | December 31, 2021 | ||||||||||||||||||||||
| 1 – 3 |
|
|
$ |
|
$ |
|
||||||||||||||||||||
| 4 |
|
|
|
|
||||||||||||||||||||||
| 5 |
|
|
|
|
||||||||||||||||||||||
| $ |
|
$ |
|
|||||||||||||||||||||||
Note 7.
Goodwill and Other Intangibles
Net lease intangibles recorded in connection with property acquisitions during the nine months ended September 30, 2022 are described in
Note 5
. In connection with the CPA:18 Merger (
Note 3
), we recorded net lease intangibles comprised as follows (life in years, dollars in thousands):
| Weighted-Average Life | Amount | ||||||||||
| Finite-Lived Intangible Assets | |||||||||||
| In-place lease |
|
$ |
|
||||||||
| Above-market rent |
|
|
|||||||||
| $ |
|
||||||||||
| Finite-Lived Intangible Liabilities | |||||||||||
| Below-market rent |
|
$ |
(
|
||||||||
In connection with certain business combinations, including the CPA:18 Merger (
Note 3
), we recorded goodwill as a result of consideration exceeding the fair values of the assets acquired and liabilities assumed.
The goodwill was attributed to our Real Estate reporting unit as it relates to the real estate assets we acquired in such business combinations. The following table presents a reconciliation of our goodwill (in thousands):
| Real Estate | Investment Management | Total | |||||||||||||||
| Balance at January 1, 2022 | $ |
|
$ |
|
$ |
|
|||||||||||
|
|
|
|
|||||||||||||||
| Foreign currency translation adjustments |
(
|
|
(
|
||||||||||||||
|
|
(
|
(
|
|||||||||||||||
|
Balance at September 30, 2022
|
$ |
|
$ |
|
$ |
|
|||||||||||
W. P. Carey 9/30/2022 10-Q
–
24
Notes to Consolidated Financial Statements (Unaudited)
Current accounting guidance requires that we test for the recoverability of goodwill at the reporting unit level. The test for recoverability must be conducted at least annually, or more frequently if events or changes in circumstances indicate that the carrying value of goodwill may not be recoverable. In connection with the completion of the CPA:18 Merger in August 2022 (
Note 3
), we performed a test for impairment during the third quarter of 2022 for goodwill recorded in both segments and recognized an impairment charge of $
29.3
million on goodwill within our Investment Management segment (
Note
9
).
Intangible assets, intangible liabilities, and goodwill are summarized as follows (in thousands):
| September 30, 2022 | December 31, 2021 | ||||||||||||||||||||||||||||||||||
| Gross Carrying Amount | Accumulated Amortization | Net Carrying Amount | Gross Carrying Amount | Accumulated Amortization | Net Carrying Amount | ||||||||||||||||||||||||||||||
| Finite-Lived Intangible Assets | |||||||||||||||||||||||||||||||||||
|
Internal-use software development costs
|
$ |
|
$ |
(
|
$ |
|
$ |
|
$ |
(
|
$ |
|
|||||||||||||||||||||||
| Trade name |
|
|
|
|
(
|
|
|||||||||||||||||||||||||||||
|
|
(
|
|
|
(
|
|
||||||||||||||||||||||||||||||
| Lease Intangibles: | |||||||||||||||||||||||||||||||||||
| In-place lease |
|
(
|
|
|
(
|
|
|||||||||||||||||||||||||||||
| Above-market rent |
|
(
|
|
|
(
|
|
|||||||||||||||||||||||||||||
|
|
(
|
|
|
(
|
|
||||||||||||||||||||||||||||||
| Goodwill | |||||||||||||||||||||||||||||||||||
| Goodwill |
|
— |
|
|
— |
|
|||||||||||||||||||||||||||||
| Total intangible assets | $ |
|
$ |
(
|
$ |
|
$ |
|
$ |
(
|
$ |
|
|||||||||||||||||||||||
| Finite-Lived Intangible Liabilities | |||||||||||||||||||||||||||||||||||
| Below-market rent | $ |
(
|
$ |
|
$ |
(
|
$ |
(
|
$ |
|
$ |
(
|
|||||||||||||||||||||||
|
Indefinite-Lived Intangible Liabilities
|
|||||||||||||||||||||||||||||||||||
| Below-market purchase option |
(
|
— |
(
|
(
|
— |
(
|
|||||||||||||||||||||||||||||
| Total intangible liabilities | $ |
(
|
$ |
|
$ |
(
|
$ |
(
|
$ |
|
$ |
(
|
|||||||||||||||||||||||
During the nine months ended September 30, 2022, the U.S. dollar strengthened against the euro, resulting in a decrease of $
96.7
million in the carrying value of our net intangible assets from December 31, 2021 to September 30, 2022. Net amortization of intangibles, including the effect of foreign currency translation, was $
62.1
million and $
55.2
million for the three months ended September 30, 2022 and 2021, respectively, and $
165.6
million and $
166.9
million for the nine months ended September 30, 2022 and 2021, respectively.
Amortization of below-market rent and above-market rent intangibles is recorded as an adjustment to Lease revenues and amortization of internal-use software development, trade name, and in-place lease intangibles is included in Depreciation and amortization.
Note 8.
Equity Method Investments
We own interests in the Managed Programs and certain unconsolidated real estate investments with third parties. We account for our interests in these investments under the equity method of accounting (i.e., at cost, increased or decreased by our share of earnings or losses, less distributions, plus contributions and other adjustments required by equity method accounting, such as basis differences) or at fair value by electing the equity method fair value option available under GAAP.
We classify distributions received from equity method investments using the cumulative earnings approach. In general, distributions received are considered returns on the investment and classified as cash inflows from operating activities. If, however, the investor’s cumulative distributions received, less distributions received in prior periods determined to be returns of investment, exceeds cumulative equity in earnings recognized, the excess is considered a return of investment and is classified as cash inflows from investing activities.
W. P. Carey 9/30/2022 10-Q
–
25
Notes to Consolidated Financial Statements (Unaudited)
Managed Programs
We own interests in the Managed Programs and account for these interests under the equity method because, as their advisor, we do not exert control over, but we do have the ability to exercise significant influence over, the Managed Programs. Operating results of the Managed Programs are included in the Investment Management segment.
The following table sets forth certain information about our investments in the Managed Programs (dollars in thousands):
| % of Outstanding Interests Owned at | Carrying Amount of Investment at | |||||||||||||||||||||||||
| Fund | September 30, 2022 | December 31, 2021 | September 30, 2022 | December 31, 2021 | ||||||||||||||||||||||
|
CPA:18 – Global
(a)
|
|
% |
|
% | $ |
|
$ |
|
||||||||||||||||||
|
CPA:18 – Global operating partnership
(a)
|
|
% |
|
% |
|
|
||||||||||||||||||||
|
CESH
(b)
|
|
% |
|
% |
|
|
||||||||||||||||||||
| $ |
|
$ |
|
|||||||||||||||||||||||
__________
(a)
On August 1, 2022, we acquired all of the remaining interests in CPA:18 – Global and the CPA:18 – Global operating partnership in the CPA:18 Merger (
Note 3
).
(b)
Investment is accounted for at fair value.
CPA:18 – Global
—
We received distributions from this investment during the nine months ended September 30, 2022 and 2021 of $
1.6
million and $
1.4
million, respectively. We received distributions from our investment in the CPA:18 – Global operating partnership during the nine months ended September 30, 2022 and 2021 of $
8.7
million and $
4.9
million, respectively (
Note 4
).
CESH
—
We have elected to account for our investment in CESH at fair value by selecting the equity method fair value option available under GAAP. We record our investment in CESH on a one quarter lag; therefore, the balance of our equity method investment in CESH recorded as of September 30, 2022 is based on the estimated fair value of our investment as of June 30, 2022. We received distributions from this investment during the nine months ended September 30, 2022 and 2021 of $
1.2
million and $
1.3
million, respectively.
At December 31, 2021, the aggregate unamortized basis differences on our equity method investments in the Managed Programs were $
23.3
million. Following the close of the CPA:18 Merger, there are no such unamortized basis differences on our equity method investments in the Managed Programs.
Interests in Other Unconsolidated Real Estate Investments and WLT
We own equity interests in properties that are generally leased to companies through noncontrolling interests in partnerships and limited liability companies that we do not control but over which we exercise significant influence. The underlying investments are jointly owned with affiliates or third parties. We account for these investments under the equity method of accounting. In addition, we own shares of WLT common stock, which we accounted for under the equity method of accounting as of December 31, 2021, but was reclassified to equity securities at fair value within Other assets, net on our consolidated balance sheets in January 2022, as described in
Note 9
. Operating results of our unconsolidated real estate investments are included in the Real Estate segment.
W. P. Carey 9/30/2022 10-Q
–
26
Notes to Consolidated Financial Statements (Unaudited)
The following table sets forth our ownership interests in our equity method investments in real estate, excluding the Managed Programs, and their respective carrying values (dollars in thousands):
| Carrying Value at | ||||||||||||||||||||||||||
| Lessee/Fund/Description | Co-owner | Ownership Interest | September 30, 2022 | December 31, 2021 | ||||||||||||||||||||||
| Existing Equity Method Investments | ||||||||||||||||||||||||||
|
Las Vegas Retail Complex
(a)
|
Third Party | N/A | $ |
|
$ |
|
||||||||||||||||||||
| Johnson Self Storage | Third Party |
|
|
|
||||||||||||||||||||||
|
Kesko Senukai
(b)
|
Third Party |
|
|
|
||||||||||||||||||||||
|
Harmon Retail Corner
(c)
|
Third Party |
|
|
|
||||||||||||||||||||||
|
WLT
(d)
|
WLT | N/A |
|
|
||||||||||||||||||||||
|
|
|
|||||||||||||||||||||||||
|
Equity Method Investments Consolidated After the CPA:18 Merger
(e)
|
||||||||||||||||||||||||||
| State Farm Mutual Automobile Insurance Co. | CPA:18 – Global |
|
|
|
||||||||||||||||||||||
|
Apply Sørco AS
(f)
|
CPA:18 – Global |
|
|
|
||||||||||||||||||||||
|
Bank Pekao
(b) (g)
|
CPA:18 – Global |
|
|
|
||||||||||||||||||||||
|
Fortenova Grupa d.d.
(b)
|
CPA:18 – Global |
|
|
|
||||||||||||||||||||||
|
|
|
|||||||||||||||||||||||||
| $ |
|
$ |
|
|||||||||||||||||||||||
__________
(a)
On June 10, 2021, we entered into an agreement to fund a construction loan of approximately $
261.9
million (as of September 30, 2022) for a retail complex in Las Vegas, Nevada. Through September 30, 2022, we funded $
168.9
million, including $
65.2
million during the nine months ended September 30, 2022. Equity income from this investment was $
6.1
million and $
1.6
million for the nine months ended September 30, 2022 and 2021, respectively, which was recognized within Earnings (losses) from equity method investments in our consolidated statements of income.
(b)
The carrying value of this investment is affected by fluctuations in the exchange rate of the euro.
(c)
This investment is reported using the hypothetical liquidation at book value model, which may be different than pro rata ownership percentages, primarily due to the capital structure of the partnership agreement.
(d)
At September 30, 2022, we owned
12,208,243
shares of common stock of WLT, which we accounted for as an equity method investment in real estate as of December 31, 2021, but was reclassified to equity securities at fair value within Other assets, net on our consolidated balance sheets in January 2022 (
Note 9
). WLT completed its previously announced sale to private real estate funds in October 2022 (
Note 17
).
(e)
We acquired the remaining interests in these investments from CPA:18 – Global in the CPA:18 Merger, subsequent to which we now consolidate these wholly owned investments (
Note 3
).
(f)
The carrying value of this investment is affected by fluctuations in the exchange rate of the Norwegian krone.
(g)
We recognized our $
4.6
million proportionate share of an impairment charge recorded on this investment during the nine months ended September 30, 2022, which was reflected within Earnings (losses) from equity method investments in our consolidated statements of income. The estimated fair value of the investment is based on the estimated selling price of the international office facility owned by the investment, and the fair value of the non-recourse mortgage encumbering the property also approximates the fair value of the property.
We received aggregate distributions of $
24.2
million and $
14.1
million from our other unconsolidated real estate investments for the nine months ended September 30, 2022 and 2021, respectively. At September 30, 2022 and December 31, 2021, the aggregate unamortized basis differences on our unconsolidated real estate investments were $
19.3
million and $
7.9
million, respectively.
W. P. Carey 9/30/2022 10-Q
–
27
Notes to Consolidated Financial Statements (Unaudited)
Note 9.
Fair Value Measurements
Items Measured at Fair Value on a Recurring Basis
The methods and assumptions described below were used to estimate the fair value of each class of financial instrument. For significant Level 3 items, we have also provided the unobservable inputs.
Derivative Assets and Liabilities
— Our derivative assets and liabilities, which are included in Other assets, net and Accounts payable, accrued expenses and other liabilities, respectively, in the consolidated financial statements, are comprised of foreign currency collars, interest rate swaps, interest rate caps, and stock warrants (
Note 10
).
The valuation of our derivative instruments (excluding stock warrants) is determined using a discounted cash flow analysis on the expected cash flows of each derivative. This analysis reflects the contractual terms of the derivatives, including the period to maturity, as well as observable market-based inputs, including interest rate curves, spot and forward rates, and implied volatilities. We incorporate credit valuation adjustments to appropriately reflect both our own nonperformance risk and the respective counterparty’s nonperformance risk in the fair value measurements. In adjusting the fair value of our derivative instruments for the effect of nonperformance risk, we have considered the impact of netting and any applicable credit enhancements, such as collateral postings, thresholds, mutual puts, and guarantees. These derivative instruments were classified as Level 2 as these instruments are custom, over-the-counter contracts with various bank counterparties that are not traded in an active market.
The stock warrants were measured at fair value using valuation models that incorporate market inputs and our own assumptions about future cash flows. We classified these assets as Level 3 because these assets are not traded in an active market.
Equity Method Investment in CESH
—
We have elected to account for our investment in CESH, which is included in Equity method investments in the consolidated financial statements, at fair value by selecting the equity method fair value option available under GAAP (
Note 8
). We classified this investment as Level 3 because we primarily used valuation models that incorporate unobservable inputs to determine its fair value.
Investment in Shares of Lineage Logistics
— We have elected to apply the measurement alternative under Accounting Standards Update 2016-01, Financial Instruments — Overall (Subtopic 825-10) to account for our investment in shares of Lineage Logistics (a cold storage REIT), which is included in Other assets, net in the consolidated financial statements. Under this alternative, the carrying value is adjusted for any impairments or changes in fair value resulting from observable transactions for similar or identical investments in the issuer. We classified this investment as Level 3 because it is not traded in an active market. We recognized non-cash unrealized gains on our investment in shares of Lineage Logistics of $
76.3
million during the nine months ended September 30, 2021, due to a secondary market transaction at a higher price per share, which was recorded within Other gains and (losses) in the consolidated financial statements. In addition, during the nine months ended September 30, 2022 and 2021, we received cash dividends of $
4.3
million and $
6.4
million, respectively, from our investment in shares of Lineage Logistics, which was recorded within Non-operating income in the consolidated financial statements. The fair value of this investment was $
366.3
million at both September 30, 2022 and December 31, 2021.
W. P. Carey 9/30/2022 10-Q
–
28
Notes to Consolidated Financial Statements (Unaudited)
Investment in Shares of GCIF
—
We account for our investment in shares of Guggenheim Credit Income Fund (“GCIF”), which is included in Other assets, net in the consolidated financial statements, at fair value. We classified this investment as Level 2 because we used a quoted price from an inactive market to determine its fair value. During the nine months ended September 30, 2022, we received liquidating distributions from our investment in shares of GCIF totaling $
1.7
million, which reduced the cost basis of our investment (in March 2021, GCIF announced its intention to liquidate and to distribute substantially all of its assets). The fair value of our investment in shares of GCIF was $
2.7
million and $
4.3
million at September 30, 2022 and December 31, 2021, respectively.
Investment in Preferred Shares of WLT
— In January 2022, WLT redeemed in full our
1,300,000
shares of its preferred stock for gross proceeds of $
65.0
million (based on the liquidation preference of $
50.00
per share). In connection with this redemption, we reclassified an unrealized gain on this investment of $
18.7
million from Accumulated other comprehensive loss to Other gains and (losses) in the consolidated financial statements (
Note 13
). Prior to this redemption, we accounted for this investment, which was included in Other assets, net in the consolidated financial statements, as available-for-sale debt securities at fair value (Level 3). During the nine months ended September 30, 2022 and 2021, we received cash dividends of $
0.9
million and $
4.1
million, respectively, from our investment in preferred shares of WLT, which was recorded within Non-operating income in the consolidated financial statements. The fair value of our investment in preferred shares of WLT was $
65.0
million as of December 31, 2021.
Investment in Common Shares of WLT
— In January 2022, we reclassified our investment in
12,208,243
shares of common stock of WLT from equity method investments to equity securities, since we no longer have significant influence over WLT, following the redemption of our investment in preferred shares of WLT, as described above. As a result, we account for this investment, which is included in Other assets, net in the consolidated financial statements, at fair value. We classified this investment as Level 3 because it is not traded in an active market. The carrying value of this investment was $
33.4
million as of December 31, 2021, which was included within Equity method investments in the consolidated financial statements. We recognized non-cash unrealized gains of $
43.4
million on our investment in common shares of WLT during the nine months ended September 30, 2022, reflecting the most recently published net asset value of WLT, which was recorded within Other gains and (losses) in the consolidated financial statements. The fair value of our investment in common shares of WLT was $
76.8
million as of September 30, 2022. WLT completed its previously announced sale to private real estate funds in October 2022 (
Note 17
).
We did not have any transfers into or out of Level 1, Level 2, and Level 3 category of measurements during either the nine months ended September 30, 2022 or 2021. Gains and losses (realized and unrealized) recognized on items measured at fair value on a recurring basis included in earnings are reported within Other gains and (losses) on our consolidated financial statements.
Our other material financial instruments had the following carrying values and fair values as of the dates shown (dollars in thousands):
| September 30, 2022 | December 31, 2021 | ||||||||||||||||||||||||||||
| Level | Carrying Value | Fair Value | Carrying Value | Fair Value | |||||||||||||||||||||||||
|
Senior Unsecured Notes, net
(a) (b) (c)
|
2 and 3
|
$ |
|
$ |
|
$ |
|
$ |
|
||||||||||||||||||||
|
Non-recourse mortgages, net
(a) (b) (d)
|
3 |
|
|
|
|
||||||||||||||||||||||||
__________
(a)
The carrying value of Senior Unsecured Notes, net (
Note 11
) includes unamortized deferred financing costs of $
26.3
million and $
28.7
million at September 30, 2022 and December 31, 2021, respectively. The carrying value of Non-recourse mortgages, net includes unamortized deferred financing costs of less than $
0.1
million at both September 30, 2022 and December 31, 2021.
(b)
The carrying value of Senior Unsecured Notes, net includes unamortized discount of $
24.4
million and $
29.2
million at September 30, 2022 and December 31, 2021, respectively. The carrying value of Non-recourse mortgages, net includes unamortized discount of $
11.6
million and $
0.8
million at September 30, 2022 and December 31, 2021, respectively.
(c)
For those Senior Unsecured Notes for which there are no observable market prices (specifically, our private placement Senior Unsecured Notes (
Note 11
)), we used a discounted cash flow model that estimates the present value of future loan payments by discounting such payments at current estimated market interest rates. We consider these notes to be within the Level 3 category. For all other Senior Unsecured Notes, we determined the estimated fair value using observed market prices in an open market, which may experience limited trading volume. We consider these notes to be within the Level 2 category.
W. P. Carey 9/30/2022 10-Q
–
29
Notes to Consolidated Financial Statements (Unaudited)
We estimated that our other financial assets and liabilities, including amounts outstanding under our Senior Unsecured Credit Facility (
Note 11
), but excluding finance receivables (
Note 6
), had fair values that approximated their carrying values at both September 30, 2022 and December 31, 2021.
Items Measured at Fair Value on a Non-Recurring Basis (Including Impairment Charges)
We periodically assess whether there are any indicators that the value of our real estate investments may be impaired or that their carrying value may not be recoverable. There have been no significant changes in our impairment policies from what was disclosed in the 2021 Annual Report.
The following tables present information about assets for which we recorded an impairment charge and that were measured at fair value on a non-recurring basis (in thousands):
| Three Months Ended September 30, | |||||||||||||||||||||||
| 2022 | 2021 | ||||||||||||||||||||||
| Fair Value Measurements | Impairment Charges | Fair Value Measurements | Impairment Charges | ||||||||||||||||||||
|
Impairment Charges
|
|||||||||||||||||||||||
| Investment Management goodwill | $ |
|
$ |
|
$ |
|
$ |
|
|||||||||||||||
| Real estate and intangibles |
|
|
|
|
|||||||||||||||||||
| Equity method investments |
|
|
|
|
|||||||||||||||||||
| $ |
|
$ |
|
||||||||||||||||||||
| Nine Months Ended September 30, | |||||||||||||||||||||||
| 2022 | 2021 | ||||||||||||||||||||||
|
Fair Value
Measurements |
Impairment
Charges |
Fair Value
Measurements |
Impairment
Charges |
||||||||||||||||||||
|
Impairment Charges
|
|||||||||||||||||||||||
| Investment Management goodwill | $ |
|
$ |
|
$ |
|
$ |
|
|||||||||||||||
| Real estate and intangibles |
|
|
|
|
|||||||||||||||||||
| Equity method investments |
|
|
|
|
|||||||||||||||||||
| $ |
|
$ |
|
||||||||||||||||||||
Impairment charges, and their related triggering events and fair value measurements, recognized during the three and nine months ended September 30, 2022 and 2021 were as follows:
Investment Management Goodwill
The impairment charges described below are reflected within Impairment charges — Investment Management goodwill in our consolidated statements of income.
During the three and nine months ended September 30, 2022, we recognized an impairment charge of $
29.3
million on goodwill within our Investment Management segment in order to reduce its carrying value to its estimated fair value of $
0
, since future Investment Management cash flows are expected to be minimal following the CPA:18 Merger (
Note 3
).
W. P. Carey 9/30/2022 10-Q
–
30
Notes to Consolidated Financial Statements (Unaudited)
Real Estate and Intangibles
The impairment charges described below are reflected within Impairment charges — real estate in our consolidated statements of income.
During the nine months ended September 30, 2022, we recognized impairment charges totaling $
6.2
million on
two
properties in order to reduce their carrying values to their estimated fair values, which approximated their estimated selling prices.
During the nine months ended September 30, 2022, we recognized an impairment charge of $
10.9
million on a property in order to reduce its carrying value to its estimated fair value, which declined due to changes in expected cash flows related to the existing tenant’s lease expiration in 2023. The fair value measurement was determined by estimating discounted cash flows using two significant unobservable inputs, which were the cash flow discount rate (
14.0
%) and terminal capitalization rate (
11.0
%)
In March 2022, we entered into a transaction to restructure certain leases with Pendragon PLC (a tenant at certain automotive dealerships in the United Kingdom). Under this restructuring, we extended the leases on
30
properties by
11
years (no change to rent) and entered into an agreement to dispose of
12
properties, with the tenant continuing to pay rent until the earlier of sale date or certain specified dates over the following 12 months. As a result, during the nine months ended September 30, 2022, we recognized impairment charges totaling $
9.3
million on
six
of these properties in order to reduce the carrying values of the properties to their estimated fair values. The fair value measurements for the properties were determined using a direct capitalization rate analysis; the capitalization rate for the various scenarios ranged from
4.75
% to
10.00
%.
During the three and nine months ended September 30, 2021, we recognized an impairment charge of $
16.3
million on a property in order to reduce the carrying value of the property to its estimated fair value, due to the existing tenant’s non-renewal of its lease expiring in 2022. The fair value measurement was determined by estimating discounted cash flows using four significant unobservable inputs, which were the cash flow discount rate (range of
7.00
% to
9.00
%), terminal capitalization rate (range of
6.00
% to
7.00
%), estimated market rents (range of $
10
to $
11
per square foot), and estimated capital expenditures ($
100
per square foot). We sold this property in September 2022.
Equity Method Investments
The other-than-temporary impairment charges described below are reflected within Earnings (losses) from equity method investments in our consolidated statements of income.
During the nine months ended September 30, 2021, we recognized an other-than-temporary impairment charge of $
6.8
million on a jointly owned real estate investment to reduce the carrying value of our investment to its estimated fair value, which declined due to changes in expected cash flows related to the existing tenant’s lease expiration in 2028. The fair value measurement was determined by estimating discounted cash flows using three significant unobservable inputs, which were the cash flow discount rate (
5.75
%), residual discount rate (
7.50
%), and residual capitalization rate (
6.75
%).
Note 10.
Risk Management and Use of Derivative Financial Instruments
Risk Management
In the normal course of our ongoing business operations, we encounter economic risk. There are four main components of economic risk that impact us: interest rate risk, credit risk, market risk, and foreign currency risk. We are primarily subject to interest rate risk on our interest-bearing liabilities, including our Senior Unsecured Credit Facility (
Note 11
) and unhedged variable-rate non-recourse mortgage loans. Credit risk is the risk of default on our operations and our tenants’ inability or unwillingness to make contractually required payments. Market risk includes changes in the value of our properties and related loans, Senior Unsecured Notes, other securities, and the shares or limited partnership units we hold in the Managed Programs, due to changes in interest rates or other market factors. We own investments in North America, Europe, and Japan and are subject to risks associated with fluctuating foreign currency exchange rates.
W. P. Carey 9/30/2022 10-Q
–
31
Notes to Consolidated Financial Statements (Unaudited)
Derivative Financial Instruments
There have been no significant changes in our derivative financial instrument policies from what was disclosed in the 2021 Annual Report. At both September 30, 2022 and December 31, 2021,
no
cash collateral had been posted nor received for any of our derivative positions.
The following table sets forth certain information regarding our derivative instruments (in thousands):
|
Derivatives Designated as Hedging Instruments
|
Balance Sheet Location | Derivative Assets Fair Value at | Derivative Liabilities Fair Value at | |||||||||||||||||||||||||||||
| September 30, 2022 | December 31, 2021 | September 30, 2022 | December 31, 2021 | |||||||||||||||||||||||||||||
|
Foreign currency collars
|
Other assets, net
|
$ |
|
$ |
|
$ | — | $ | — | |||||||||||||||||||||||
|
Interest rate swaps
(a)
|
Other assets, net
|
|
— | — | — | |||||||||||||||||||||||||||
| Interest rate cap |
Other assets, net
|
|
|
— | — | |||||||||||||||||||||||||||
|
Foreign currency collars
|
Accounts payable, accrued expenses and other liabilities
|
— | — | — |
(
|
|||||||||||||||||||||||||||
|
Interest rate swaps
|
Accounts payable, accrued expenses and other liabilities
|
— | — | — |
(
|
|||||||||||||||||||||||||||
|
|
|
— |
(
|
|||||||||||||||||||||||||||||
|
Derivatives Not Designated as Hedging Instruments
|
||||||||||||||||||||||||||||||||
| Stock warrants | Other assets, net |
|
|
— | — | |||||||||||||||||||||||||||
| Foreign currency collars | Other assets, net |
|
— | — | — | |||||||||||||||||||||||||||
|
|
|
— | — | |||||||||||||||||||||||||||||
| Total derivatives | $ |
|
$ |
|
$ | — | $ |
(
|
||||||||||||||||||||||||
__________
(a)
In connection with the CPA:18 Merger on August 1, 2022, we acquired
five
interest rate swaps, which had an aggregate fair value of $
0.4
million on the date of acquisition.
The following tables present the impact of our derivative instruments in the consolidated financial statements (in thousands):
|
Amount of Gain (Loss) Recognized on Derivatives in
Other Comprehensive Income (Loss)
(a)
|
||||||||||||||||||||||||||
| Three Months Ended September 30, | Nine Months Ended September 30, | |||||||||||||||||||||||||
| Derivatives in Cash Flow Hedging Relationships | 2022 | 2021 | 2022 | 2021 | ||||||||||||||||||||||
| Foreign currency collars | $ |
|
$ |
|
$ |
|
$ |
|
||||||||||||||||||
| Interest rate swaps |
|
|
|
|
||||||||||||||||||||||
| Interest rate caps |
|
|
|
|
||||||||||||||||||||||
| Total | $ |
|
$ |
|
$ |
|
$ |
|
||||||||||||||||||
|
Amount of Gain (Loss) on Derivatives Reclassified from
Other Comprehensive Income (Loss) |
||||||||||||||||||||||||||||||||
|
Derivatives in Cash Flow Hedging Relationships
|
Location of Gain (Loss) Recognized in Income
|
Three Months Ended September 30, | Nine Months Ended September 30, | |||||||||||||||||||||||||||||
| 2022 | 2021 | 2022 | 2021 | |||||||||||||||||||||||||||||
| Foreign currency collars | Non-operating income | $ |
|
$ |
|
$ |
|
$ |
(
|
|||||||||||||||||||||||
|
Interest rate swaps and caps
(b)
|
Interest expense |
(
|
(
|
(
|
(
|
|||||||||||||||||||||||||||
| Total | $ |
|
$ |
(
|
$ |
|
$ |
(
|
||||||||||||||||||||||||
__________
(a)
Excludes net gains of $
1.2
million and $
0.2
million recognized on unconsolidated jointly owned investments for the three months ended September 30, 2022 and 2021, respectively, and net gains of $
3.5
million and $
0.9
million for the nine months ended September 30, 2022 and 2021, respectively.
(b)
Amount for the nine months ended September 30, 2021 excludes other comprehensive income totaling $
3.1
million that was released from the consolidated financial statements (along with the related liability balances) upon the termination of interest rate swaps in connection with certain prepayments of non-recourse mortgage loans during the period.
W. P. Carey 9/30/2022 10-Q
–
32
Notes to Consolidated Financial Statements (Unaudited)
Amounts reported in Other comprehensive (loss) income related to interest rate derivative contracts will be reclassified to Interest expense as interest is incurred on our variable-rate debt. Amounts reported in Other comprehensive (loss) income related to foreign currency derivative contracts will be reclassified to Non-operating income when the hedged foreign currency contracts are settled. As of September 30, 2022, we estimate that an additional $
1.5
million and $
26.4
million will be reclassified as Interest expense and Non-operating income, respectively, during the next 12 months.
The following table presents the impact of our derivative instruments in the consolidated financial statements (in thousands):
| Amount of Gain (Loss) on Derivatives Recognized in Income | ||||||||||||||||||||||||||||||||
| Derivatives in Cash Flow Hedging Relationships |
Location of Gain (Loss) Recognized in Income
|
Three Months Ended September 30, | Nine Months Ended September 30, | |||||||||||||||||||||||||||||
| 2022 | 2021 | 2022 | 2021 | |||||||||||||||||||||||||||||
| Foreign currency collars | Non-operating income | $ |
|
$ |
|
$ |
|
$ |
|
|||||||||||||||||||||||
| Interest rate swaps |
Interest expense
|
|
|
|
|
|||||||||||||||||||||||||||
| Derivatives Not in Cash Flow Hedging Relationships | ||||||||||||||||||||||||||||||||
| Foreign currency collars | Other gains and (losses) |
|
|
|
|
|||||||||||||||||||||||||||
| Stock warrants | Other gains and (losses) |
|
|
|
(
|
|||||||||||||||||||||||||||
| Total | $ |
|
$ |
|
$ |
|
$ |
|
||||||||||||||||||||||||
See below for information on our purposes for entering into derivative instruments.
Interest Rate Swaps and Caps
We are exposed to the impact of interest rate changes primarily through our borrowing activities. To limit this exposure, we generally seek long-term debt financing on a fixed-rate basis. However, from time to time, we or our investment partners have obtained, and may in the future obtain, variable-rate, non-recourse mortgage loans and, as a result, we have entered into, and may continue to enter into, interest rate swap agreements or interest rate cap agreements with counterparties. Interest rate swaps, which effectively convert the variable-rate debt service obligations of a loan to a fixed rate, are agreements in which one party exchanges a stream of interest payments for a counterparty’s stream of cash flow over a specific period. The notional, or face, amount on which the swaps are based is not exchanged. Interest rate caps limit the effective borrowing rate of variable-rate debt obligations while allowing participants to share in downward shifts in interest rates. Our objective in using these derivatives is to limit our exposure to interest rate movements.
The interest rate swaps and caps that our consolidated subsidiaries had outstanding at September 30, 2022 are summarized as follows (currency in thousands):
| Interest Rate Derivatives | Number of Instruments |
Notional
Amount |
Fair Value at
September 30, 2022 (a) |
||||||||||||||||||||
| Designated as Cash Flow Hedging Instruments | |||||||||||||||||||||||
| Interest rate swaps |
|
|
USD | $ |
|
||||||||||||||||||
| Interest rate swaps |
|
|
EUR |
|
|||||||||||||||||||
| Interest rate cap |
|
|
EUR |
|
|||||||||||||||||||
| $ |
|
||||||||||||||||||||||
__________
(a)
Fair value amounts are based on the exchange rate of the euro at September 30, 2022, as applicable.
Foreign Currency Collars
We are exposed to foreign currency exchange rate movements, primarily in the euro and, to a lesser extent, the British pound sterling and certain other currencies. In order to hedge certain of our foreign currency cash flow exposures, we enter into foreign currency collars. A foreign currency collar consists of a written call option and a purchased put option to sell the foreign currency at a range of predetermined exchange rates. A foreign currency collar guarantees that the exchange rate of the currency will not fluctuate beyond the range of the options’ strike prices. Our foreign currency collars have maturities of
62
months or less.
W. P. Carey 9/30/2022 10-Q
–
33
Notes to Consolidated Financial Statements (Unaudited)
The following table presents the foreign currency collars that we had outstanding at September 30, 2022 (currency in thousands):
| Foreign Currency Derivatives | Number of Instruments |
Notional
Amount |
Fair Value at
September 30, 2022
|
||||||||||||||||||||
| Designated as Cash Flow Hedging Instruments | |||||||||||||||||||||||
| Foreign currency collars |
|
|
EUR | $ |
|
||||||||||||||||||
| Foreign currency collars |
|
|
GBP |
|
|||||||||||||||||||
| Not Designated as Cash Flow Hedging Instruments | |||||||||||||||||||||||
| Foreign currency collar |
|
|
EUR |
|
|||||||||||||||||||
| $ |
|
||||||||||||||||||||||
Credit Risk-Related Contingent Features
We measure our credit exposure on a counterparty basis as the net positive aggregate estimated fair value of our derivatives, net of any collateral received.
No
collateral was received as of September 30, 2022. At September 30, 2022, our total credit exposure and the maximum exposure to any single counterparty was $
67.3
million and $
11.2
million, respectively.
Some of the agreements we have with our derivative counterparties contain cross-default provisions that could trigger a declaration of default on our derivative obligations if we default, or are capable of being declared in default, on certain of our indebtedness. At September 30, 2022, we had not been declared in default on any of our derivative obligations. The estimated fair value of our derivatives in a net liability position was $
2.2
million at December 31, 2021, which included accrued interest and any nonperformance risk adjustments (there was
no
such liability balance at September 30, 2022). If we had breached any of these provisions at December 31, 2021, we could have been required to settle our obligations under these agreements at their aggregate termination value of $
2.3
million.
Net Investment Hedges
Borrowings under our Senior Unsecured Notes, Unsecured Revolving Credit Facility, and Unsecured Term Loans (all as defined in
Note 11
) denominated in euro, British pounds sterling, or Japanese yen are designated as, and are effective as, economic hedges of our net investments in foreign entities.
Exchange rate variations impact our financial results because the financial results of our foreign subsidiaries are translated to U.S. dollars each period, with the effect of exchange rate variations being recorded in Other comprehensive (loss) income as part of the cumulative foreign currency translation adjustment. As a result, changes in the value of our borrowings under our euro-denominated senior notes and changes in the value of our euro, Japanese yen, and British pound sterling borrowings under our Senior Unsecured Credit Facility, related to changes in the spot rates, will be reported in the same manner as foreign currency translation adjustments, which are recorded in Other comprehensive (loss) income as part of the cumulative foreign currency translation adjustment. Such gains (losses) related to non-derivative net investment hedges were $
215.0
million and $
92.6
million for the three months ended September 30, 2022 and 2021, respectively, and $
528.4
million and $
190.5
million for the nine months ended September 30, 2022 and 2021, respectively.
W. P. Carey 9/30/2022 10-Q
–
34
Notes to Consolidated Financial Statements (Unaudited)
Note 11.
Debt
Senior Unsecured Credit Facility
On February 20, 2020, we entered into the Fourth Amended and Restated Credit Facility, which had capacity of approximately $
2.1
billion, comprised of (i) a $
1.8
billion unsecured revolving credit facility for our working capital needs, acquisitions, and other general corporate purposes (our “Unsecured Revolving Credit Facility”), (ii) a £
150.0
million term loan (our “Term Loan”), and (iii) a €
96.5
million delayed draw term loan (our “Delayed Draw Term Loan”). We refer to our Term Loan and Delayed Draw Term Loan collectively as the “Unsecured Term Loans” and the entire facility collectively as our “Senior Unsecured Credit Facility.”
The Senior Unsecured Credit Facility includes the ability to borrow in certain currencies other than U.S. dollars and has a maturity date of February 20, 2025. The aggregate principal amount (of revolving and term loans) available under the Senior Unsecured Credit Facility may be increased up to an amount not to exceed the U.S. dollar equivalent of $
2.75
billion, subject to the conditions to increase set forth in our Credit Agreement, as described above.
In April 2022, we entered into a Second Amendment to the Credit Agreement to increase the Term Loan to £
270.0
million and the Delayed Draw Term Loan to €
215.0
million, thereby increasing the total capacity of our Senior Unsecured Credit Facility to approximately $
2.4
billion. There were no other changes to the terms of our Credit Agreement. We used the approximately $
300
million of proceeds from this increase in the capacity of our Unsecured Term Loans to partially repay amounts outstanding under our Unsecured Revolving Credit Facility.
At September 30, 2022, our Unsecured Revolving Credit Facility had available capacity of approximately $
1.3
billion (net of amounts reserved for standby letters of credit totaling $
0.6
million). We incur an annual facility fee of
0.20
% of the total commitment on our Unsecured Revolving Credit Facility, which is included within Interest expense in our consolidated statements of income.
The following table presents a summary of our Senior Unsecured Credit Facility (dollars in thousands):
|
Interest Rate at
September 30, 2022
(a)
|
Maturity Date at September 30, 2022
|
Principal Outstanding Balance at | ||||||||||||||||||||||||
| Senior Unsecured Credit Facility | September 30, 2022 | December 31, 2021 | ||||||||||||||||||||||||
|
Unsecured Term Loans:
|
||||||||||||||||||||||||||
|
Term Loan — borrowing in British pounds sterling
(b) (c) (d)
|
SONIA +
|
2/20/2025 | $ |
|
$ |
|
||||||||||||||||||||
|
Delayed Draw Term Loan — borrowing in euros
(e)
|
EURIBOR +
|
2/20/2025 |
|
|
||||||||||||||||||||||
|
|
|
|||||||||||||||||||||||||
|
Unsecured Revolving Credit Facility:
|
||||||||||||||||||||||||||
|
Borrowing in U.S. dollars
(f)
|
LIBOR +
|
2/20/2025 |
|
|
||||||||||||||||||||||
|
Borrowing in Japanese yen
(g)
|
TIBOR +
|
2/20/2025 |
|
|
||||||||||||||||||||||
| Borrowing in euros | N/A | 2/20/2025 |
|
|
||||||||||||||||||||||
| Borrowing in British pounds sterling | N/A | 2/20/2025 |
|
|
||||||||||||||||||||||
|
|
|
|||||||||||||||||||||||||
|
|
|
$ |
|
$ |
|
|||||||||||||||||||||
__________
(a)
The applicable interest rate at September 30, 2022 was based on the credit rating for our Senior Unsecured Notes of BBB/Baa1.
(b)
SONIA means Sterling Overnight Index Average.
(c)
Interest rate includes both a spread adjustment to the base rate and a credit spread.
(d)
Balance excludes unamortized discount of $
1.6
million and $
0.9
million at September 30, 2022 and December 31, 2021, respectively.
(e)
EURIBOR means Euro Interbank Offered Rate.
(f)
LIBOR means London Interbank Offered Rate.
(g)
TIBOR means Tokyo Interbank Offered Rate.
W. P. Carey 9/30/2022 10-Q
–
35
Notes to Consolidated Financial Statements (Unaudited)
Senior Unsecured Notes
As set forth in the table below, we have euro and U.S. dollar-denominated senior unsecured notes outstanding with an aggregate principal balance outstanding of $
5.7
billion at September 30, 2022 (the “Senior Unsecured Notes”).
On September 28, 2022, we completed a private placement of (i) €
150.0
million of
3.41
% Senior Notes due 2029, which have a
7-year
term and are scheduled to mature on September 28, 2029, and (ii) €
200
million of
3.70
% Senior Notes due 2032, which have a
10-year
term and are scheduled to mature on September 28, 2032.
We redeemed the €
500.0
million of
2.0
% Senior Notes due 2023 in March 2021. In connection with this redemption, we paid a “make-whole” amount of $
26.2
million (based on the exchange rate of the euro as of the date of redemption) and recognized a loss on extinguishment of $
28.2
million, which is included within Other gains and (losses) on our consolidated statements of income for the nine months ended September 30, 2021.
Interest on the Senior Unsecured Notes is payable annually in arrears for our euro-denominated senior notes and semi-annually for U.S. dollar-denominated senior notes. The Senior Unsecured Notes can be redeemed at par within three months of their respective maturities, or we can call the notes at any time for the principal, accrued interest, and a make-whole amount based upon the applicable government bond yield plus
20
to
35
basis points.
The following table presents a summary of our Senior Unsecured Notes outstanding at September 30, 2022 (currency in thousands):
| Principal Amount | Coupon Rate | Maturity Date | Principal Outstanding Balance at | |||||||||||||||||||||||||||||||||||
|
Senior Unsecured Notes, net
(a)
|
Issue Date | September 30, 2022 | December 31, 2021 | |||||||||||||||||||||||||||||||||||
|
|
3/14/2014 | $ |
|
|
% | 4/1/2024 | $ |
|
$ |
|
||||||||||||||||||||||||||||
|
|
1/19/2017 | € |
|
|
% | 7/19/2024 |
|
|
||||||||||||||||||||||||||||||
|
|
1/26/2015 | $ |
|
|
% | 2/1/2025 |
|
|
||||||||||||||||||||||||||||||
|
|
10/9/2018 | € |
|
|
% | 4/9/2026 |
|
|
||||||||||||||||||||||||||||||
|
|
9/12/2016 | $ |
|
|
% | 10/1/2026 |
|
|
||||||||||||||||||||||||||||||
|
|
3/6/2018 | € |
|
|
% | 4/15/2027 |
|
|
||||||||||||||||||||||||||||||
|
|
9/19/2019 | € |
|
|
% | 4/15/2028 |
|
|
||||||||||||||||||||||||||||||
|
|
6/14/2019 | $ |
|
|
% | 7/15/2029 |
|
|
||||||||||||||||||||||||||||||
|
|
9/28/2022 | € |
|
|
% | 9/28/2029 |
|
|
||||||||||||||||||||||||||||||
|
|
3/8/2021 | € |
|
|
% | 6/1/2030 |
|
|
||||||||||||||||||||||||||||||
|
|
10/14/2020 | $ |
|
|
% | 2/1/2031 |
|
|
||||||||||||||||||||||||||||||
|
|
10/15/2021 | $ |
|
|
% | 2/1/2032 |
|
|
||||||||||||||||||||||||||||||
|
|
9/28/2022 | € |
|
|
% | 9/28/2032 |
|
|
||||||||||||||||||||||||||||||
|
|
2/25/2021 | $ |
|
|
% | 4/1/2033 |
|
|
||||||||||||||||||||||||||||||
| $ |
|
$ |
|
|||||||||||||||||||||||||||||||||||
__________
(a)
Aggregate balance excludes unamortized deferred financing costs totaling $
26.3
million and $
28.7
million, and unamortized discount totaling $
24.4
million and $
29.2
million, at September 30, 2022 and December 31, 2021, respectively.
In connection with the private placement of the
3.41
% Senior Notes due 2029 and the €
200
million of
3.70
% Senior Notes due 2032 in September 2022, we incurred financing costs totaling $
2.3
million during the nine months ended September 30, 2022, which are included in the Senior Unsecured Notes, net in the consolidated financial statements and are being amortized to Interest expense over the term of their respective Senior Notes.
Covenants
The Credit Agreement, each of the Senior Unsecured Notes, and certain of our non-recourse mortgage loan agreements include customary financial maintenance covenants that require us to maintain certain ratios and benchmarks at the end of each quarter. There have been no significant changes in our debt covenants from what was disclosed in the 2021 Annual Report. We were in compliance with all of these covenants at September 30, 2022.
W. P. Carey 9/30/2022 10-Q
–
36
Notes to Consolidated Financial Statements (Unaudited)
Non-Recourse Mortgages
At September 30, 2022, the weighted-average interest rate for our total non-recourse mortgage notes payable was
4.3
% (fixed-rate and variable-rate non-recourse mortgage notes payable were
4.4
% and
3.9
%, respectively), with maturity dates ranging from October 2022 to April 2039.
CPA:18 Merger
In connection with the CPA:18 Merger on August 1, 2022 (
Note 3
), we assumed property-level debt comprised of non-recourse mortgage loans with fair values totaling $
900.2
million and recorded an aggregate fair market value net discount of $
13.1
million. The fair market value net discount will be amortized to interest expense over the remaining lives of the related loans. These non-recourse mortgage loans had a weighted-average annual interest rate of
5.1
% on the merger date.
Repayments
During the nine months ended September 30, 2022, we (i) prepaid a non-recourse mortgage loan of $
10.4
million and (ii) repaid non-recourse mortgage loans at maturity with an aggregate principal balance of approximately $
35.6
million. We recognized a net gain on extinguishment of debt of $
1.3
million on these repayments, which is included within Other gains and (losses) on our consolidated statements of income. The weighted-average interest rate for these non-recourse mortgage loans on their respective dates of repayment was
4.6
%.
During the nine months ended September 30, 2021, we (i) prepaid non-recourse mortgage loans totaling $
427.5
million and (ii) repaid non-recourse mortgage loans at maturity with an aggregate principal balance of approximately $
27.5
million. We recognized an aggregate net loss on extinguishment of debt of $
32.0
million on these repayments, primarily comprised of prepayment penalties totaling $
32.1
million, which is included within Other gains and (losses) on our consolidated statements of income. The weighted-average interest rate for these non-recourse mortgage loans on their respective dates of repayment was
5.1
%.
Foreign Currency Exchange Rate Impact
During the nine months ended September 30, 2022, the U.S. dollar strengthened against the euro, resulting in an aggregate decrease of $
579.1
million in the aggregate carrying values of our Non-recourse mortgages, net, Senior Unsecured Credit Facility, and Senior Unsecured Notes, net from December 31, 2021 to September 30, 2022.
Scheduled Debt Principal Payments
Scheduled debt principal payments as of September 30, 2022 are as follows (in thousands):
| Years Ending December 31, | Total | |||||||
| 2022 (remainder) | $ |
|
||||||
| 2023 |
|
|||||||
| 2024 |
|
|||||||
| 2025 |
|
|||||||
| 2026 |
|
|||||||
| Thereafter through 2039 |
|
|||||||
| Total principal payments |
|
|||||||
| Unamortized discount, net |
(
|
|||||||
| Unamortized deferred financing costs |
(
|
|||||||
| Total | $ |
|
||||||
Certain amounts in the table above are based on the applicable foreign currency exchange rate at September 30, 2022.
W. P. Carey 9/30/2022 10-Q
–
37
Notes to Consolidated Financial Statements (Unaudited)
Note 12.
Commitments and Contingencies
Note 13.
Stock-Based Compensation and Equity
Stock-Based Compensation
We maintain several stock-based compensation plans, which are more fully described in the 2021 Annual Report. There have been no significant changes to the terms and conditions of any of our stock-based compensation plans or arrangements during the nine months ended September 30, 2022. We recorded stock-based compensation expense of $
5.5
million and $
4.4
million during the three months ended September 30, 2022 and 2021, respectively, and $
23.1
million and $
18.8
million during the nine months ended September 30, 2022 and 2021, respectively, which was included in Stock-based compensation expense in the consolidated financial statements.
Restricted and Conditional Awards
Nonvested restricted share awards (“RSAs”), restricted share units (“RSUs”), and performance share units (“PSUs”) at September 30, 2022 and changes during the nine months ended September 30, 2022
were as follows:
| RSA and RSU Awards | PSU Awards | ||||||||||||||||||||||
| Shares |
Weighted-Average
Grant Date Fair Value |
Shares |
Weighted-Average
Grant Date Fair Value |
||||||||||||||||||||
|
Nonvested at January 1, 2022
|
|
$ |
|
|
$ |
|
|||||||||||||||||
|
Granted
(a)
|
|
|
|
|
|||||||||||||||||||
|
Vested
(b)
|
(
|
|
(
|
|
|||||||||||||||||||
| Forfeited |
(
|
|
|
|
|||||||||||||||||||
|
Adjustment
(c)
|
|
|
|
|
|||||||||||||||||||
|
Nonvested at September 30, 2022
(d)
|
|
$ |
|
|
$ |
|
|||||||||||||||||
__________
(a)
The grant date fair value of RSAs and RSUs reflect our stock price on the date of grant on a
one
-for-one basis. The grant date fair value of PSUs was determined utilizing (i) a Monte Carlo simulation model to generate an estimate of our future stock price over the
three-year
performance period and (ii) future financial performance projections. To estimate the fair value of PSUs granted during the nine months ended September 30, 2022, we used a risk-free interest rate of
1.2
%, an expected volatility rate of
36.7
%, and assumed a dividend yield of
zero
.
(b)
The grant date fair value of shares vested during the nine months ended September 30, 2022 was $
26.5
million. Employees have the option to take immediate delivery of the shares upon vesting or defer receipt to a future date pursuant to previously made deferral elections. At September 30, 2022 and December 31, 2021, we had an obligation to issue
1,181,947
and
1,104,020
shares, respectively, of our common stock underlying such deferred awards, which is recorded within Total stockholders’ equity as a Deferred compensation obligation of $
57.0
million and $
49.8
million, respectively.
(c)
Vesting and payment of the PSUs is conditioned upon certain company and/or market performance goals being met during the relevant
three-year
performance period. The ultimate number of PSUs to be vested will depend on the extent to which the performance goals are met and can range from
zero
to
three
times the original awards. As a result, we recorded adjustments at September 30, 2022 to reflect the number of shares expected to be issued when the PSUs vest.
(d)
At September 30, 2022, total unrecognized compensation expense related to these awards was approximately $
39.2
million, with an aggregate weighted-average remaining term of
2.0
years.
W. P. Carey 9/30/2022 10-Q
–
38
Notes to Consolidated Financial Statements (Unaudited)
Earnings Per Share
The following table summarizes basic and diluted earnings (dollars in thousands):
| Three Months Ended September 30, | Nine Months Ended September 30, | ||||||||||||||||||||||
| 2022 | 2021 | 2022 | 2021 | ||||||||||||||||||||
| Net income — basic and diluted | $ |
|
$ |
|
$ |
|
$ |
|
|||||||||||||||
| Weighted-average shares outstanding — basic |
|
|
|
|
|||||||||||||||||||
| Effect of dilutive securities |
|
|
|
|
|||||||||||||||||||
| Weighted-average shares outstanding — diluted |
|
|
|
|
|||||||||||||||||||
For the three and nine months ended September 30, 2022 and 2021, potentially dilutive securities excluded from the computation of diluted earnings per share were insignificant.
ATM Program
On May 2, 2022, we established a continuous “at-the-market” offering program (“ATM Program”) with a syndicate of banks, pursuant to which shares of our common stock having an aggregate gross sales price of up to $
1.0
billion may be sold (i) directly through or to the banks acting as sales agents or as principal for their own accounts or (ii) participating banks or their affiliates acting as forward sellers on behalf of any forward purchasers pursuant to a forward sale agreement (our “ATM Forwards”). Effective as of that date, we terminated a prior ATM Program that was established on August 9, 2019.
Our prior ATM Program is discussed in the 2021 Annual Report.
The following table sets forth certain information regarding the issuance of shares of our common stock under our prior ATM Program during the periods presented (net proceeds in thousands):
| Three Months Ended September 30, | Nine Months Ended September 30, | ||||||||||||||||||||||
| 2022 | 2021 | 2022 | 2021 | ||||||||||||||||||||
| Shares of common stock issued |
|
|
|
|
|||||||||||||||||||
| Weighted-average price per share | $ |
|
$ |
|
$ |
|
$ |
|
|||||||||||||||
| Net proceeds | $ |
|
$ |
|
$ |
|
$ |
|
|||||||||||||||
Forward Equity
We expect to settle the ATM Forwards in full on or prior to the maturity date of each ATM Forward via physical delivery of the outstanding shares of common stock in exchange for cash proceeds. However, subject to certain exceptions, we may also elect to cash settle or net share settle all or any portion of our obligations under any ATM Forwards. The forward sale price that we will receive upon physical settlement of the ATM Forwards will be (i) subject to adjustment on a daily basis based on a floating interest rate factor equal to a specified daily rate less a spread (i.e., if the specified daily rate is less than the spread on any day, the interest rate factor will result in a daily reduction of the applicable forward sale price) and (ii) decreased based on amounts related to expected dividends on shares of our common stock during the term of the ATM Forwards.
We determined that our ATM Forwards meet the criteria for equity classification and are therefore exempt from derivative accounting. We recorded the ATM Forwards at fair value at inception, which we determined to be zero. Subsequent changes to fair value are not required under equity classification.
W. P. Carey 9/30/2022 10-Q
–
39
Notes to Consolidated Financial Statements (Unaudited)
In addition, we refer to our three forward equity offerings presented below as the June 2020 Equity Forwards, June 2021 Equity Forwards, and August 2021 Equity Forwards (collectively, the “Equity Forwards”), which are discussed in the 2021 Annual Report. Our ATM Forwards are also presented below (gross offering proceeds at closing in thousands):
|
Agreement Date
(a)
|
Shares Offered
(b)
|
Average Gross Offering Price | Average Gross Offering Proceeds at Closing |
Outstanding Shares as of September 30, 2022
|
|||||||||||||||||||||||||
|
June 2020 Equity Forwards
(c)
|
6/17/2020 |
|
$ |
|
$ |
|
|
||||||||||||||||||||||
|
June 2021 Equity Forwards
(d)
|
6/7/2021 |
|
|
|
|
||||||||||||||||||||||||
| August 2021 Equity Forwards | 8/9/2021 |
|
|
|
|
||||||||||||||||||||||||
|
ATM Forwards
(e)
|
5/2/2022 |
|
|
|
|
||||||||||||||||||||||||
|
|
|||||||||||||||||||||||||||||
__________
(a)
We expect to settle the Equity Forwards in full within 18 months of the respective agreement dates via physical delivery of the outstanding shares of common stock in exchange for cash proceeds, although we may elect cash settlement or net share settlement for all or a portion of our obligations under the Equity Forwards, subject to certain conditions.
(b)
Includes
712,500
,
787,500
, and
675,000
shares of common stock purchased by certain underwriters in connection with the June 2020 Equity Forwards, June 2021 Equity Forwards, and August 2021 Equity Forwards, respectively, upon the exercise of 30-day options to purchase additional shares.
(c)
All remaining outstanding shares were settled during the three months ended June 30, 2021.
(d)
All remaining outstanding shares were settled during the three months ended December 31, 2021.
(e)
We sold shares under our ATM Forwards during the second and third quarters of 2022. We did not settle any of the shares sold and therefore did not receive any proceeds from such sales.
The following table sets forth certain information regarding the settlement of our Equity Forwards during the periods presented (dollars in thousands):
| Three Months Ended September 30, | Nine Months Ended September 30, | ||||||||||||||||||||||
| 2022 | 2021 | 2022 | 2021 | ||||||||||||||||||||
| Shares of common stock delivered |
|
|
|
|
|||||||||||||||||||
| Net proceeds | $ |
|
$ |
|
$ |
|
$ |
|
|||||||||||||||
W. P. Carey 9/30/2022 10-Q
–
40
Notes to Consolidated Financial Statements (Unaudited)
Reclassifications Out of Accumulated Other Comprehensive Loss
The following tables present a reconciliation of changes in Accumulated other comprehensive loss by component for the periods presented (in thousands):
| Three Months Ended September 30, 2022 | |||||||||||||||||||||||
| Gains and (Losses) on Derivative Instruments | Foreign Currency Translation Adjustments | Gains and (Losses) on Investments | Total | ||||||||||||||||||||
| Beginning balance | $ |
|
$ |
(
|
$ |
|
$ |
(
|
|||||||||||||||
| Other comprehensive loss before reclassifications |
|
(
|
|
(
|
|||||||||||||||||||
|
Amounts reclassified from accumulated other comprehensive loss to:
|
|||||||||||||||||||||||
| Non-operating income |
(
|
|
|
(
|
|||||||||||||||||||
| Interest expense |
|
|
|
|
|||||||||||||||||||
| Total |
(
|
|
|
(
|
|||||||||||||||||||
| Net current period other comprehensive loss |
|
(
|
|
(
|
|||||||||||||||||||
| Net current period other comprehensive loss attributable to noncontrolling interests |
|
|
|
|
|||||||||||||||||||
| Ending balance | $ |
|
$ |
(
|
$ |
|
$ |
(
|
|||||||||||||||
| Three Months Ended September 30, 2021 | |||||||||||||||||||||||
| Gains and (Losses) on Derivative Instruments | Foreign Currency Translation Adjustments | Gains and (Losses) on Investments | Total | ||||||||||||||||||||
| Beginning balance | $ |
(
|
$ |
(
|
$ |
|
$ |
(
|
|||||||||||||||
| Other comprehensive loss before reclassifications |
|
(
|
|
(
|
|||||||||||||||||||
|
Amounts reclassified from accumulated other comprehensive loss to:
|
|||||||||||||||||||||||
| Interest expense |
|
|
|
|
|||||||||||||||||||
| Non-operating income |
(
|
|
|
(
|
|||||||||||||||||||
| Total |
|
|
|
|
|||||||||||||||||||
| Net current period other comprehensive loss |
|
(
|
|
(
|
|||||||||||||||||||
| Ending balance | $ |
|
$ |
(
|
$ |
|
$ |
(
|
|||||||||||||||
| Nine Months Ended September 30, 2022 | |||||||||||||||||||||||
| Gains and (Losses) on Derivative Instruments | Foreign Currency Translation Adjustments | Gains and (Losses) on Investments | Total | ||||||||||||||||||||
| Beginning balance | $ |
|
$ |
(
|
$ |
|
$ |
(
|
|||||||||||||||
| Other comprehensive loss before reclassifications |
|
(
|
|
(
|
|||||||||||||||||||
|
Amounts reclassified from accumulated other comprehensive loss to:
|
|||||||||||||||||||||||
| Non-operating income |
(
|
|
|
(
|
|||||||||||||||||||
| Interest expense |
|
|
|
|
|||||||||||||||||||
|
|
|
(
|
(
|
||||||||||||||||||||
| Total |
(
|
|
(
|
(
|
|||||||||||||||||||
| Net current period other comprehensive loss |
|
(
|
(
|
(
|
|||||||||||||||||||
| Net current period other comprehensive loss attributable to noncontrolling interests |
|
|
|
|
|||||||||||||||||||
| Ending balance | $ |
|
$ |
(
|
$ |
|
$ |
(
|
|||||||||||||||
W. P. Carey 9/30/2022 10-Q
–
41
Notes to Consolidated Financial Statements (Unaudited)
| Nine Months Ended September 30, 2021 | |||||||||||||||||||||||
| Gains and (Losses) on Derivative Instruments | Foreign Currency Translation Adjustments | Gains and (Losses) on Investments | Total | ||||||||||||||||||||
| Beginning balance | $ |
(
|
$ |
(
|
$ |
|
$ |
(
|
|||||||||||||||
| Other comprehensive income before reclassifications |
|
(
|
|
|
|||||||||||||||||||
|
Amounts reclassified from accumulated other comprehensive loss to:
|
|||||||||||||||||||||||
| Interest expense |
|
|
|
|
|||||||||||||||||||
| Non-operating income |
|
|
|
|
|||||||||||||||||||
| Total |
|
|
|
|
|||||||||||||||||||
| Net current period other comprehensive income |
|
(
|
|
|
|||||||||||||||||||
| Net current period other comprehensive income attributable to noncontrolling interests |
(
|
|
|
(
|
|||||||||||||||||||
| Ending balance | $ |
|
$ |
(
|
$ |
|
$ |
(
|
|||||||||||||||
See
Note 10
for additional information on our derivatives activity recognized within Other comprehensive (loss) income for the periods presented.
Dividends Declared
During the third quarter of 2022, our Board declared a quarterly dividend of $
1.061
per share, which was paid on October 14, 2022 to stockholders of record as of September 30, 2022.
During the nine months ended September 30, 2022, we declared dividends totaling $
3.177
per share.
Note 14.
Income Taxes
We elected to be treated as a REIT and believe that we have been organized and have operated in such a manner to maintain our qualification as a REIT for federal and state income tax purposes. As a REIT, we are generally not subject to corporate level federal income taxes on earnings distributed to our stockholders. Since inception, we have distributed at least 100% of our taxable income annually. Accordingly, we have not included any provisions for federal income taxes related to the REIT in the accompanying consolidated financial statements for the three and nine months ended September 30, 2022 and 2021.
Certain of our subsidiaries have elected TRS status. A TRS may provide certain services considered impermissible for REITs and may hold assets that REITs may not hold directly. We also own real property in jurisdictions outside the United States through foreign subsidiaries and are subject to income taxes on our pre-tax income earned from properties in such countries. The accompanying consolidated financial statements include an interim tax provision for our TRSs and foreign subsidiaries, as necessary, for the three and nine months ended September 30, 2022 and 2021.
W. P. Carey 9/30/2022 10-Q
–
42
Notes to Consolidated Financial Statements (Unaudited)
Note 15.
Property Dispositions
We have an active capital recycling program, with a goal of extending the average lease term through reinvestment, improving portfolio credit quality through dispositions and acquisitions of assets, increasing the asset criticality factor in our portfolio, and/or executing strategic dispositions of assets. We may decide to dispose of a property when it is vacant as a result of tenants vacating space, tenants electing not to renew their leases, tenant insolvency, or lease rejection in the bankruptcy process. In such cases, we assess whether we can obtain the highest value from the property by selling it, as opposed to re-leasing it. We may also sell a property when we receive an unsolicited offer or negotiate a price for an investment that is consistent with our strategy for that investment. When it is appropriate to do so, we classify the property as an asset held for sale on our consolidated balance sheet. All property dispositions are recorded within our Real Estate segment and are also discussed in
Note 5
.
2022
—
During the three and nine months ended September 30, 2022, we sold
three
and
17
properties, respectively, for total proceeds, net of selling costs, of $
55.2
million and $
170.3
million, respectively, and recognized a net (loss) gain on these sales totaling $(
4.7
) million and $
37.6
million, respectively (inclusive of income taxes totaling $
2.8
million and $
2.9
million for the three and nine months ended September 30, 2022, respectively, recognized upon sale). This disposition activity included one property acquired in the CPA:18 Merger classified as assets held for sale (
Note 3
,
Note 5
), which was sold in August 2022.
2021
—
During the three and nine months ended September 30, 2021, we sold
five
and
17
properties, respectively, for total proceeds, net of selling costs, of $
28.3
million and $
126.7
million, respectively, and recognized a net gain on these sales totaling $
1.7
million and $
30.9
million, respectively (inclusive of income taxes totaling $
3.8
million recognized upon sale during the nine months ended September 30, 2021).
W. P. Carey 9/30/2022 10-Q
–
43
Notes to Consolidated Financial Statements (Unaudited)
Note 16.
Segment Reporting
We evaluate our results from operations through our
two
major business segments: Real Estate and Investment Management.
The following tables present a summary of comparative results and assets for these business segments (in thousands):
Real Estate
| Three Months Ended September 30, | Nine Months Ended September 30, | ||||||||||||||||||||||
| 2022 | 2021 | 2022 | 2021 | ||||||||||||||||||||
| Revenues | |||||||||||||||||||||||
| Lease revenues | $ |
|
$ |
|
$ |
|
$ |
|
|||||||||||||||
| Income from direct financing leases and loans receivable |
|
|
|
|
|||||||||||||||||||
|
Operating property revenues
(a)
|
|
|
|
|
|||||||||||||||||||
| Lease termination income and other |
|
|
|
|
|||||||||||||||||||
|
|
|
|
|
||||||||||||||||||||
| Operating Expenses | |||||||||||||||||||||||
| Depreciation and amortization |
|
|
|
|
|||||||||||||||||||
| General and administrative |
|
|
|
|
|||||||||||||||||||
| Reimbursable tenant costs |
|
|
|
|
|||||||||||||||||||
| Merger and other expenses |
|
(
|
|
(
|
|||||||||||||||||||
| Property expenses, excluding reimbursable tenant costs |
|
|
|
|
|||||||||||||||||||
| Operating property expenses |
|
|
|
|
|||||||||||||||||||
| Stock-based compensation expense |
|
|
|
|
|||||||||||||||||||
| Impairment charges — real estate |
|
|
|
|
|||||||||||||||||||
|
|
|
|
|
||||||||||||||||||||
| Other Income and Expenses | |||||||||||||||||||||||
| Interest expense |
(
|
(
|
(
|
(
|
|||||||||||||||||||
| Other gains and (losses) |
(
|
|
|
|
|||||||||||||||||||
| Gain on change in control of interests |
|
|
|
|
|||||||||||||||||||
| Non-operating income |
|
|
|
|
|||||||||||||||||||
| Earnings (losses) from equity method investments in real estate |
|
|
|
(
|
|||||||||||||||||||
| (Loss) gain on sale of real estate, net |
(
|
|
|
|
|||||||||||||||||||
|
(
|
|
(
|
(
|
||||||||||||||||||||
| Income before income taxes |
|
|
|
|
|||||||||||||||||||
| Provision for income taxes |
(
|
(
|
(
|
(
|
|||||||||||||||||||
| Net Income from Real Estate |
|
|
|
|
|||||||||||||||||||
| Net loss (income) attributable to noncontrolling interests |
|
(
|
|
(
|
|||||||||||||||||||
| Net Income from Real Estate Attributable to W. P. Carey | $ |
|
$ |
|
$ |
|
$ |
|
|||||||||||||||
W. P. Carey 9/30/2022 10-Q
–
44
Notes to Consolidated Financial Statements (Unaudited)
Investment Management
| Three Months Ended September 30, | Nine Months Ended September 30, | ||||||||||||||||||||||
| 2022 | 2021 | 2022 | 2021 | ||||||||||||||||||||
| Revenues | |||||||||||||||||||||||
| Asset management and other revenue | $ |
|
$ |
|
$ |
|
$ |
|
|||||||||||||||
| Reimbursable costs from affiliates |
|
|
|
|
|||||||||||||||||||
|
|
|
|
|
||||||||||||||||||||
| Operating Expenses | |||||||||||||||||||||||
| Impairment charges — Investment Management goodwill |
|
|
|
|
|||||||||||||||||||
| Reimbursable costs from affiliates |
|
|
|
|
|||||||||||||||||||
| Merger and other expenses |
|
|
|
|
|||||||||||||||||||
|
|
|
|
|
||||||||||||||||||||
| Other Income and Expenses | |||||||||||||||||||||||
| Gain on change in control of interests |
|
|
|
|
|||||||||||||||||||
| Earnings from equity method investments in the Managed Programs |
|
|
|
|
|||||||||||||||||||
| Other gains and (losses) |
(
|
|
(
|
|
|||||||||||||||||||
| Non-operating (loss) income |
(
|
|
|
|
|||||||||||||||||||
|
|
|
|
|
||||||||||||||||||||
| (Loss) income before income taxes |
(
|
|
|
|
|||||||||||||||||||
| Provision for income taxes |
(
|
(
|
(
|
(
|
|||||||||||||||||||
| Net (Loss) Income from Investment Management Attributable to W. P. Carey | $ |
(
|
$ |
|
$ |
|
$ |
|
|||||||||||||||
Total Company
| Three Months Ended September 30, | Nine Months Ended September 30, | ||||||||||||||||||||||
| 2022 | 2021 | 2022 | 2021 | ||||||||||||||||||||
| Revenues | $ |
|
$ |
|
$ |
|
$ |
|
|||||||||||||||
|
Operating expenses
|
|
|
|
|
|||||||||||||||||||
| Other income and (expenses) |
(
|
|
(
|
(
|
|||||||||||||||||||
| Provision for income taxes |
(
|
(
|
(
|
(
|
|||||||||||||||||||
| Net loss (income) attributable to noncontrolling interests |
|
(
|
|
(
|
|||||||||||||||||||
| Net income attributable to W. P. Carey | $ |
|
$ |
|
$ |
|
$ |
|
|||||||||||||||
| Total Assets at | |||||||||||
| September 30, 2022 | December 31, 2021 | ||||||||||
| Real Estate | $ |
|
$ |
|
|||||||
|
Investment Management
(b)
|
|
|
|||||||||
| Total Company | $ |
|
$ |
|
|||||||
__________
(a)
Operating property revenues from our hotels include $
3.7
million and $
2.4
million for the three months ended September 30, 2022 and 2021, respectively, and $
9.1
million and $
4.9
million for the nine months ended September 30, 2022 and 2021, respectively, generated from a hotel in Bloomington, Minnesota (revenues reflect higher occupancy as the hotel’s business recovered from the COVID-19 pandemic).
(b)
Following the CPA:18 Merger on August 1, 2022, we no longer own an equity investment in CPA:18 – Global, which was previously included within our Investment Management segment (
N
ote 3
,
Note
8
). In addition, during the nine months ended September 30, 2022, we recorded an impairment charge of $
29.3
million on goodwill within our Investment Management segment (
Note 7
,
Note 9
).
W. P. Carey 9/30/2022 10-Q
–
45
Notes to Consolidated Financial Statements (Unaudited)
Note 17.
Subsequent Events
Cash Received for Shares of WLT
In October 2022, we received $
82.6
million in cash proceeds as a result of certain private real estate funds’ acquisition of all outstanding shares of WLT common stock. As of the date of acquisition, we owned
12,208,243
shares of WLT common stock (
Note 9
). Upon completion of this transaction, we have no remaining interest in WLT.
W. P. Carey 9/30/2022 10-Q
–
46
Item 2. Management’s Discussion and Analysis of Financial Condition and Results
of Operations.
Management’s Discussion and Analysis of Financial Condition and Results of Operations is intended to assist in understanding our financial statements and the reasons for changes in certain key components of our financial statements from period to period. This item also provides our perspective on our financial position and liquidity, as well as certain other factors that may affect our future results. The discussion also breaks down the financial results of our business by segment to provide a better understanding of how these segments and their results affect our financial condition and results of operations. Our Management’s Discussion and Analysis of Financial Condition and Results of Operations should be read in conjunction with the 2021 Annual Report and subsequent reports filed under the Securities Exchange Act of 1934, as amended (the “Exchange Act”). Refer to Item 1 of the 2021 Annual Report for a description of our business.
Significant Developments
CPA:18 Merger
On February 27, 2022, we, CPA:18 – Global, CPA:18 Limited Partnership (a subsidiary of CPA:18 – Global), and certain of our subsidiaries entered into a merger agreement, pursuant to which CPA:18 – Global would merge with and into one of our indirect subsidiaries in exchange for shares of our common stock and cash (
Note 3
). The CPA:18 Merger and related transactions were approved by the stockholders of CPA:18 – Global on July 26, 2022 and completed on August 1, 2022.
Financial Highlights
During the nine months ended September 30, 2022, we completed the following (as further described in the consolidated financial statements):
Real Estate
CPA:18 Merger
•
We acquired full or partial ownership interests in 42 properties in the CPA:18 Merger (including seven properties in which we already owned a partial ownership interest), substantially all of which were triple-net leased with a weighted-average lease term of 7.0 years, an occupancy rate of 99.3%, and an estimated ABR totaling $81.0 million. We also acquired 65 self-storage operating properties and two student housing operating properties totaling 5.1 million square feet. The related property-level debt was comprised of non-recourse mortgage loans with an aggregate consolidated fair value of approximately $900.2 million with a weighted-average annual interest rate of 5.1% as of August 1, 2022.
•
We issued the following to CPA:18 – Global stockholders as part of the merger consideration: (i) 13,786,302 shares of our common stock of approximately $1.2 billion, (ii) $3.00 per share of cash consideration totaling approximately $423.3 million, and (iii) cash of $0.1 million paid in lieu of issuing any fractional shares of our common stock.
•
Lease revenues and operating property revenues from properties acquired in the CPA:18 Merger were $16.5 million and $15.4 million, respectively, for both the three and nine months ended September 30, 2022.
•
We recognized a Gain on change in control of interests of $33.9 million in connection with the CPA:18 Merger during the three and nine months ended September 30, 2022, of which $11.4 million was attributable to our Real Estate segment and $22.5 million was attributable to our Investment Management segment.
Investments
•
We funded approximately $65.2 million for a construction loan to build a retail complex in Las Vegas, Nevada, during the nine months ended September 30, 2022. Through September 30, 2022, we have funded $168.9 million (
Note 8
).
•
We committed to fund three build-to-suit or expansion projects totaling $25.5 million. We currently expect to complete the projects in 2023 (
Note 5
).
W. P. Carey 9/30/2022 10-Q
–
47
Dispositions
•
As part of our active capital recycling program, we disposed of 17 properties for total proceeds, net of selling costs, of $170.3 million (
Note 15
).
•
In January 2022, WLT redeemed in full our 1,300,000 shares of its preferred stock for gross proceeds of $65.0 million (
Note 9
).
•
In October 2022, we received $82.6 million in cash proceeds as a result of certain private real estate funds’ acquisition of all outstanding shares of WLT common stock. As of the date of acquisition, we owned 12,208,243 shares of WLT common stock (
Note 9
). Upon completion of this transaction, we have no remaining interest in WLT (
Note 17
).
Financing and Capital Markets Transactions
•
In April 2022, we increased the Term Loan to £270.0 million and the Delayed Draw Term Loan to €215.0 million, thereby increasing the total capacity of our Senior Unsecured Credit Facility to approximately $2.4 billion. We used the approximately $300 million of proceeds from this increase in the capacity of our Unsecured Term Loans to partially repay amounts outstanding under our Unsecured Revolving Credit Facility (
Note 11
).
•
On May 2, 2022, we established a $1.0 billion ATM Program, under which we may issue shares directly or defer delivery to a later date through our ATM Forwards. As of September 30, 2022, we had approximately $455.7 million of available proceeds under our ATM Forwards (
Note 13
).
•
We issued 2,740,295 shares of our common stock under our prior ATM Program at a weighted-average price of $80.79 per share, for net proceeds of $218.1 million (
Note 13
).
•
We settled portions of our Equity Forwards by delivering 1,337,500 shares of common stock for net proceeds of $97.5 million. As of September 30, 2022, 2,587,500 shares remained outstanding under our Equity Forwards for available proceeds of approximately $185.8 million (
Note 13
).
•
On September 28, 2022, we completed a private placement of (i) €150 million of 3.41% Senior Notes due 2029, which have a seven-year term and are scheduled to mature on September 28, 2029, and (ii) €200 million of 3.70% Senior Notes due 2032, which have a ten-year term and are scheduled to mature on September 28, 2032 (
Note 11
).
Investment Management
Assets Under Management
•
As of September 30, 2022, we managed total assets of approximately $161.5 million on behalf of CESH. The vast majority of our Investment Management earnings are generated from asset management fees. Upon completion of the CPA:18 Merger (
Note 3
), we ceased earning advisory fees and other income previously earned when we served as advisor to CPA:18 – Global. During the nine months ended September 30, 2022, through the date of the CPA:18 Merger, such fees and other income from CPA:18 – Global totaled $17.9 million.
Dividends to Stockholders
We declared cash dividends totaling $3.177 per share during the nine months ended September 30, 2022, comprised of three quarterly dividends per share of $1.057, $1.059, and $1.061 (
Note 13
).
W. P. Carey 9/30/2022 10-Q
–
48
Consolidated Results
(in thousands, except shares)
| Three Months Ended September 30, | Nine Months Ended September 30, | ||||||||||||||||||||||
| 2022 | 2021 | 2022 | 2021 | ||||||||||||||||||||
| Revenues from Real Estate | $ | 382,081 | $ | 320,841 | $ | 1,065,959 | $ | 941,802 | |||||||||||||||
|
Revenues from Investment Management
|
1,541 | 4,913 | 10,498 | 14,842 | |||||||||||||||||||
| Total revenues | 383,622 | 325,754 | 1,076,457 | 956,644 | |||||||||||||||||||
| Net income from Real Estate attributable to W. P. Carey | 111,375 | 130,858 | 381,461 | 290,132 | |||||||||||||||||||
| Net (loss) income from Investment Management attributable to W. P. Carey | (6,447) | 7,689 | 8,140 | 20,294 | |||||||||||||||||||
| Net income attributable to W. P. Carey | 104,928 | 138,547 | 389,601 | 310,426 | |||||||||||||||||||
| Dividends declared | 222,350 | 197,374 | 633,745 | 579,769 | |||||||||||||||||||
| Net cash provided by operating activities | 702,528 | 625,396 | |||||||||||||||||||||
| Net cash used in investing activities | (1,019,425) | (1,053,266) | |||||||||||||||||||||
| Net cash provided by financing activities | 364,057 | 305,865 | |||||||||||||||||||||
|
Supplemental financial measures
(a)
:
|
|||||||||||||||||||||||
| Adjusted funds from operations attributable to W. P. Carey (AFFO) — Real Estate | 273,567 | 224,445 | 772,827 | 657,150 | |||||||||||||||||||
|
Adjusted funds from operations attributable to W. P. Carey (AFFO) — Investment Management
|
4,155 | 6,279 | 18,095 | 18,736 | |||||||||||||||||||
|
Adjusted funds from operations attributable to W. P. Carey (AFFO)
|
277,722 | 230,724 | 790,922 | 675,886 | |||||||||||||||||||
| Diluted weighted-average shares outstanding | 204,098,116 | 186,012,478 | 197,264,509 | 181,323,128 | |||||||||||||||||||
__________
(a)
We consider Adjusted funds from operations (“AFFO”), a supplemental measure that is not defined by GAAP (a “non-GAAP measure”), to be an important measure in the evaluation of our operating performance. See
Supplemental Financial Measures
below for our definition of this non-GAAP measure and a reconciliation to its most directly comparable GAAP measure.
Revenues
Total revenues increased for the three and nine months ended September 30, 2022 as compared to the same periods in 2021. Real Estate revenue increased primarily due to higher lease revenues (substantially as a result of property acquisition activity and rent escalations, as well as the net-leased properties we acquired in the CPA:18 Merger on August 1, 2022 (
Note 3
), partially offset by the impact of the weakening euro and British pound sterling), higher operating property revenues (primarily from the operating properties we acquired in the CPA:18 Merger on August 1, 2022 (
Note 3
)), and higher lease termination and other income (
Note 5
).
Net Income Attributable to W. P. Carey
Net income attributable to W. P. Carey decreased for the three months ended September 30, 2022 as compared to the same period in 2021. Net income from Real Estate attributable to W. P. Carey decreased primarily due to a non-cash unrealized gain recognized on our investment in shares of Lineage Logistics during the prior year period (
Note 9
) and the weakening euro and British pound sterling, partially offset by the impact of real estate acquisitions. Net income from Investment Management attributable to W. P. Carey was in a loss position during the current year period, primarily due to an impairment charge recognized on goodwill within our Investment Management segment (
Note 9
). In addition, we recognized a gain on change in control of interests during the current year period in connection with the CPA:18 Merger (
Note 3
).
W. P. Carey 9/30/2022 10-Q
–
49
Net income attributable to W. P. Carey increased for the nine months ended September 30, 2022 as compared to the same period in 2021. Net income from Real Estate attributable to W. P. Carey increased primarily due to a lower loss on extinguishment of debt (
Note 11
), non-cash unrealized gains recognized on our investment in common shares of WLT (
Note 9
), and the impact of real estate acquisitions, partially offset by non-cash unrealized gains recognized on our investment in shares of Lineage Logistics during the prior year period (
Note 9
) and the impact of the weakening euro and British pound sterling. Net income from Investment Management attributable to W. P. Carey decreased primarily due to an impairment charge recognized on goodwill within our Investment Management segment (
Note 9
). In addition, we recognized a gain on change in control of interests during the current year period in connection with the CPA:18 Merger (
Note 3
).
AFFO
AFFO increased for the three and nine months ended September 30, 2022 as compared to the same periods in 2021, primarily due to higher lease revenues and operating property revenues from net investment activity (including properties acquired in the CPA:18 Merger (
Note 3
)) and rent escalations, as well as higher lease termination income and other, partially offset by the impact of the weakening euro and British pound sterling and higher interest expense.
Portfolio Overview
Our portfolio is comprised of operationally-critical, commercial real estate assets net leased to tenants located primarily in the United States and Northern and Western Europe. We invest in high-quality single tenant industrial, warehouse, office, retail, and self-storage properties subject to long-term net leases with built-in rent escalators. Portfolio information is provided on a pro rata basis, unless otherwise noted below, to better illustrate the economic impact of our various net-leased jointly owned investments. See Terms and Definitions below for a description of pro rata amounts.
Portfolio Summary
| September 30, 2022 | December 31, 2021 | ||||||||||
| ABR (in thousands) | $ | 1,333,741 | $ | 1,247,764 | |||||||
|
Number of net-leased properties
(a)
|
1,428 | 1,304 | |||||||||
|
Number of operating properties
(b)
|
87 | 20 | |||||||||
| Number of tenants (net-leased properties) | 391 | 352 | |||||||||
| Total square footage (net-leased properties, in thousands) | 174,950 | 155,674 | |||||||||
| Occupancy (net-leased properties) | 98.9 | % | 98.5 | % | |||||||
| Weighted-average lease term (net-leased properties, in years) | 10.9 | 10.8 | |||||||||
|
Number of countries
(c)
|
26 | 24 | |||||||||
| Total assets (in thousands) | $ | 17,774,842 | $ | 15,480,630 | |||||||
| Net investments in real estate (in thousands) | 15,120,888 | 13,037,369 | |||||||||
| Nine Months Ended September 30, | |||||||||||
| 2022 | 2021 | ||||||||||
|
Acquisition volume (in millions)
(d)
|
$ | 1,107.8 | $ | 1,096.2 | |||||||
|
Construction projects completed (in millions)
|
147.3 | 88.2 | |||||||||
| Average U.S. dollar/euro exchange rate | 1.0652 | 1.1961 | |||||||||
| Average U.S. dollar/British pound sterling exchange rate | 1.2589 | 1.3845 | |||||||||
__________
(a)
We acquired 35 net-leased properties (in which we did not already have an ownership interest) in the CPA:18 Merger in August 2022 (
Note 3
).
(b)
At September 30, 2022, operating properties consisted of 84 self-storage properties (of which we consolidated 75) with an average occupancy of 91.9% as of September 30, 2022, two student housing properties, and one hotel property with an average occupancy of 65.3% for the nine months ended September 30, 2022. We acquired 65 self-storage properties, one student housing property, and one student housing development project in the CPA:18 Merger in August 2022 (
Note 3
,
Note 5
). At December 31, 2021, operating properties consisted of 19 self-storage properties (of which we consolidated ten) and one hotel property.
W. P. Carey 9/30/2022 10-Q
–
50
(c)
We acquired investments in Belgium during the nine months ended September 30, 2022. We acquired an investment in Mauritius in connection with the CPA:18 Merger in August 2022 (
Note 3
).
(d)
Amount for the nine months ended September 30, 2022 excludes properties acquired in the CPA:18 Merger (
Note 3
). Amounts for the nine months ended September 30, 2022 and 2021 include $65.2 million and $93.5 million, respectively, of funding for a construction loan (
Note 8
).
Net-Leased Portfolio
The tables below represent information about our net-leased portfolio at September 30, 2022 on a pro rata basis and, accordingly, exclude all operating properties. See Terms and Definitions below for a description of pro rata amounts and ABR.
Top Ten Tenants by ABR
(dollars in thousands)
| Tenant/Lease Guarantor | Description | Number of Properties | ABR | ABR Percent | Weighted-Average Lease Term (Years) | |||||||||||||||||||||||||||
| U-Haul Moving Partners Inc. and Mercury Partners, LP | Net lease self-storage properties in the U.S. | 78 | $ | 38,751 | 2.9 | % | 1.6 | |||||||||||||||||||||||||
|
State of Andalucía
(a)
|
Government office properties in Spain | 70 | 26,752 | 2.0 | % | 12.2 | ||||||||||||||||||||||||||
|
Metro Cash & Carry Italia S.p.A.
(a)
|
Business-to-business wholesale stores in Italy and Germany | 20 | 25,047 | 1.9 | % | 6.1 | ||||||||||||||||||||||||||
|
Hellweg Die Profi-Baumärkte GmbH & Co. KG
(a)
|
Do-it-yourself retail properties in Germany | 35 | 24,904 | 1.9 | % | 14.4 | ||||||||||||||||||||||||||
| Extra Space Storage, Inc. | Net lease self-storage properties in the U.S. | 27 | 22,957 | 1.7 | % | 21.6 | ||||||||||||||||||||||||||
| Marriott Corporation | Net lease hotel properties in the U.S. | 18 | 21,350 | 1.6 | % | 1.3 | ||||||||||||||||||||||||||
| Nord Anglia Education, Inc. | K-12 private schools in the U.S. | 3 | 20,981 | 1.6 | % | 21.0 | ||||||||||||||||||||||||||
|
OBI Group
(a)
|
Do-it-yourself retail properties in Poland | 26 | 20,192 | 1.5 | % | 7.9 | ||||||||||||||||||||||||||
| Advance Auto Parts, Inc. | Distribution facilities in the U.S. | 29 | 19,851 | 1.5 | % | 10.3 | ||||||||||||||||||||||||||
|
Forterra, Inc.
(a) (b)
|
Industrial properties in the U.S. and Canada | 27 | 19,465 | 1.4 | % | 20.7 | ||||||||||||||||||||||||||
| Total | 333 | $ | 240,250 | 18.0 | % | 10.9 | ||||||||||||||||||||||||||
__________
(a)
ABR amounts are subject to fluctuations in foreign currency exchange rates.
(b)
Of the 27 properties leased to Forterra, Inc., 25 are located in the United States and two are located in Canada.
W. P. Carey 9/30/2022 10-Q
–
51
Portfolio Diversification by Geography
(in thousands, except percentages)
| Region | ABR | ABR Percent |
Square Footage
(a)
|
Square Footage Percent | ||||||||||||||||||||||
| United States | ||||||||||||||||||||||||||
| South | ||||||||||||||||||||||||||
| Texas | $ | 114,960 | 8.6 | % | 12,656 | 7.2 | % | |||||||||||||||||||
| Florida | 54,001 | 4.0 | % | 4,544 | 2.6 | % | ||||||||||||||||||||
| Georgia | 28,342 | 2.1 | % | 4,721 | 2.7 | % | ||||||||||||||||||||
| Tennessee | 25,243 | 1.9 | % | 4,136 | 2.4 | % | ||||||||||||||||||||
| Alabama | 19,882 | 1.5 | % | 3,334 | 1.9 | % | ||||||||||||||||||||
|
Other
(b)
|
14,377 | 1.1 | % | 2,237 | 1.3 | % | ||||||||||||||||||||
| Total South | 256,805 | 19.2 | % | 31,628 | 18.1 | % | ||||||||||||||||||||
| Midwest | ||||||||||||||||||||||||||
| Illinois | 73,872 | 5.5 | % | 10,738 | 6.1 | % | ||||||||||||||||||||
| Minnesota | 34,766 | 2.6 | % | 3,686 | 2.1 | % | ||||||||||||||||||||
| Indiana | 29,197 | 2.2 | % | 5,222 | 3.0 | % | ||||||||||||||||||||
| Ohio | 28,596 | 2.1 | % | 6,181 | 3.5 | % | ||||||||||||||||||||
| Michigan | 22,287 | 1.7 | % | 3,652 | 2.1 | % | ||||||||||||||||||||
| Wisconsin | 18,056 | 1.4 | % | 3,276 | 1.9 | % | ||||||||||||||||||||
| Iowa | 13,450 | 1.0 | % | 1,817 | 1.0 | % | ||||||||||||||||||||
|
Other
(b)
|
29,446 | 2.2 | % | 4,543 | 2.6 | % | ||||||||||||||||||||
| Total Midwest | 249,670 | 18.7 | % | 39,115 | 22.3 | % | ||||||||||||||||||||
| East | ||||||||||||||||||||||||||
| North Carolina | 36,634 | 2.7 | % | 8,098 | 4.6 | % | ||||||||||||||||||||
| Pennsylvania | 31,978 | 2.4 | % | 3,527 | 2.0 | % | ||||||||||||||||||||
| New York | 19,306 | 1.4 | % | 2,257 | 1.3 | % | ||||||||||||||||||||
| Kentucky | 18,578 | 1.4 | % | 3,063 | 1.8 | % | ||||||||||||||||||||
| South Carolina | 18,462 | 1.4 | % | 4,949 | 2.8 | % | ||||||||||||||||||||
| Massachusetts | 18,129 | 1.4 | % | 1,387 | 0.8 | % | ||||||||||||||||||||
| New Jersey | 15,735 | 1.2 | % | 943 | 0.5 | % | ||||||||||||||||||||
| Virginia | 14,580 | 1.1 | % | 1,854 | 1.1 | % | ||||||||||||||||||||
|
Other
(b)
|
24,841 | 1.9 | % | 3,884 | 2.2 | % | ||||||||||||||||||||
| Total East | 198,243 | 14.9 | % | 29,962 | 17.1 | % | ||||||||||||||||||||
| West | ||||||||||||||||||||||||||
| California | 67,528 | 5.1 | % | 6,417 | 3.7 | % | ||||||||||||||||||||
| Arizona | 30,471 | 2.3 | % | 3,437 | 2.0 | % | ||||||||||||||||||||
|
Other
(b)
|
64,759 | 4.9 | % | 6,994 | 4.0 | % | ||||||||||||||||||||
| Total West | 162,758 | 12.3 | % | 16,848 | 9.7 | % | ||||||||||||||||||||
| United States Total | 867,476 | 65.1 | % | 117,553 | 67.2 | % | ||||||||||||||||||||
| International | ||||||||||||||||||||||||||
| Germany | 64,247 | 4.8 | % | 7,020 | 4.0 | % | ||||||||||||||||||||
| Spain | 58,290 | 4.4 | % | 5,187 | 3.0 | % | ||||||||||||||||||||
| Poland | 57,874 | 4.3 | % | 8,631 | 4.9 | % | ||||||||||||||||||||
| The Netherlands | 51,318 | 3.8 | % | 7,054 | 4.0 | % | ||||||||||||||||||||
| United Kingdom | 46,967 | 3.5 | % | 4,804 | 2.8 | % | ||||||||||||||||||||
| Italy | 24,570 | 1.8 | % | 2,541 | 1.5 | % | ||||||||||||||||||||
| Denmark | 20,748 | 1.6 | % | 2,994 | 1.7 | % | ||||||||||||||||||||
| France | 18,205 | 1.4 | % | 1,685 | 1.0 | % | ||||||||||||||||||||
| Norway | 18,033 | 1.4 | % | 953 | 0.5 | % | ||||||||||||||||||||
| Croatia | 17,787 | 1.3 | % | 2,063 | 1.2 | % | ||||||||||||||||||||
| Canada | 15,950 | 1.2 | % | 2,492 | 1.4 | % | ||||||||||||||||||||
|
Other
(c)
|
72,276 | 5.4 | % | 11,973 | 6.8 | % | ||||||||||||||||||||
| International Total | 466,265 | 34.9 | % | 57,397 | 32.8 | % | ||||||||||||||||||||
| Total | $ | 1,333,741 | 100.0 | % | 174,950 | 100.0 | % | |||||||||||||||||||
W. P. Carey 9/30/2022 10-Q
–
52
Portfolio Diversification by Property Type
(in thousands, except percentages)
| Property Type | ABR | ABR Percent |
Square Footage
(a)
|
Square Footage Percent | ||||||||||||||||||||||
| Industrial | $ | 353,348 | 26.5 | % | 61,514 | 35.2 | % | |||||||||||||||||||
| Warehouse | 320,697 | 24.1 | % | 62,692 | 35.8 | % | ||||||||||||||||||||
| Office | 240,110 | 18.0 | % | 17,150 | 9.8 | % | ||||||||||||||||||||
|
Retail
(d)
|
213,357 | 16.0 | % | 20,284 | 11.6 | % | ||||||||||||||||||||
| Self Storage (net lease) | 61,708 | 4.6 | % | 5,810 | 3.3 | % | ||||||||||||||||||||
|
Other
(e)
|
144,521 | 10.8 | % | 7,500 | 4.3 | % | ||||||||||||||||||||
| Total | $ | 1,333,741 | 100.0 | % | 174,950 | 100.0 | % | |||||||||||||||||||
__________
(a)
Includes square footage for any vacant properties.
(b)
Other properties within South include assets in Louisiana, Arkansas, Oklahoma, and Mississippi. Other properties within Midwest include assets in Missouri, Kansas, Nebraska, South Dakota, and North Dakota. Other properties within East include assets in Maryland, Connecticut, West Virginia, New Hampshire, and Maine. Other properties within West include assets in Utah, Oregon, Colorado, Washington, Nevada, Hawaii, Idaho, New Mexico, Wyoming, and Montana.
(c)
Includes assets in Mexico, Lithuania, Finland, Belgium, Hungary, Mauritius, Slovakia, Portugal, the Czech Republic, Austria, Sweden, Japan, Latvia, and Estonia.
(d)
Includes automotive dealerships.
(e)
Includes ABR from tenants within the following property types: education facility, hotel (net lease), laboratory, specialty, fitness facility, research and development, student housing (net lease), theater, funeral home, restaurant, land, and parking.
W. P. Carey 9/30/2022 10-Q
–
53
Portfolio Diversification by Tenant Industry
(in thousands, except percentages)
| Industry Type | ABR | ABR Percent | Square Footage | Square Footage Percent | ||||||||||||||||||||||
|
Retail Stores
(a)
|
$ | 262,384 | 19.7 | % | 35,734 | 20.4 | % | |||||||||||||||||||
| Consumer Services | 109,943 | 8.3 | % | 8,067 | 4.6 | % | ||||||||||||||||||||
| Beverage and Food | 104,493 | 7.8 | % | 15,759 | 9.0 | % | ||||||||||||||||||||
| Automotive | 79,628 | 6.0 | % | 13,038 | 7.4 | % | ||||||||||||||||||||
| Grocery | 72,984 | 5.5 | % | 8,363 | 4.8 | % | ||||||||||||||||||||
| Cargo Transportation | 60,119 | 4.5 | % | 9,550 | 5.5 | % | ||||||||||||||||||||
| Hotel and Leisure | 55,498 | 4.2 | % | 3,060 | 1.7 | % | ||||||||||||||||||||
| Healthcare and Pharmaceuticals | 55,036 | 4.1 | % | 5,557 | 3.2 | % | ||||||||||||||||||||
| Capital Equipment | 52,520 | 3.9 | % | 8,255 | 4.7 | % | ||||||||||||||||||||
| Business Services | 48,089 | 3.6 | % | 4,113 | 2.3 | % | ||||||||||||||||||||
| Containers, Packaging, and Glass | 46,286 | 3.5 | % | 8,266 | 4.7 | % | ||||||||||||||||||||
| Construction and Building | 46,021 | 3.5 | % | 9,235 | 5.3 | % | ||||||||||||||||||||
| Durable Consumer Goods | 45,725 | 3.4 | % | 10,299 | 5.9 | % | ||||||||||||||||||||
| Sovereign and Public Finance | 39,257 | 2.9 | % | 3,560 | 2.0 | % | ||||||||||||||||||||
| High Tech Industries | 35,043 | 2.6 | % | 3,574 | 2.0 | % | ||||||||||||||||||||
| Insurance | 30,726 | 2.3 | % | 2,024 | 1.2 | % | ||||||||||||||||||||
| Chemicals, Plastics, and Rubber | 29,898 | 2.2 | % | 5,254 | 3.0 | % | ||||||||||||||||||||
| Non-Durable Consumer Goods | 26,085 | 2.0 | % | 6,244 | 3.6 | % | ||||||||||||||||||||
| Banking | 22,821 | 1.7 | % | 1,426 | 0.8 | % | ||||||||||||||||||||
| Metals | 18,281 | 1.4 | % | 3,259 | 1.9 | % | ||||||||||||||||||||
| Aerospace and Defense | 16,304 | 1.2 | % | 1,358 | 0.8 | % | ||||||||||||||||||||
| Telecommunications | 16,214 | 1.2 | % | 1,686 | 1.0 | % | ||||||||||||||||||||
|
Other
(b)
|
60,386 | 4.5 | % | 7,269 | 4.2 | % | ||||||||||||||||||||
| Total | $ | 1,333,741 | 100.0 | % | 174,950 | 100.0 | % | |||||||||||||||||||
__________
(a)
Includes automotive dealerships.
(b)
Includes ABR from tenants in the following industries: media: broadcasting and subscription, media: advertising, printing, and publishing, wholesale, oil and gas, utilities: electric, environmental industries, consumer transportation, forest products and paper, electricity, and real estate. Also includes square footage for vacant properties.
W. P. Carey 9/30/2022 10-Q
–
54
Lease Expirations
(in thousands, except percentages, number of leases, and number of tenants)
|
Year of Lease Expiration
(a)
|
Number of Leases Expiring | Number of Tenants with Leases Expiring | ABR | ABR Percent |
Square
Footage |
Square Footage Percent | ||||||||||||||||||||||||||||||||
| Remaining 2022 | 13 | 12 | $ | 7,642 | 0.6 | % | 717 | 0.4 | % | |||||||||||||||||||||||||||||
|
2023
(b)
|
33 | 28 | 57,787 | 4.3 | % | 6,939 | 4.0 | % | ||||||||||||||||||||||||||||||
|
2024
(c)
|
42 | 36 | 91,852 | 6.9 | % | 12,413 | 7.1 | % | ||||||||||||||||||||||||||||||
| 2025 | 56 | 34 | 61,672 | 4.6 | % | 7,325 | 4.2 | % | ||||||||||||||||||||||||||||||
| 2026 | 44 | 34 | 57,810 | 4.3 | % | 8,185 | 4.7 | % | ||||||||||||||||||||||||||||||
| 2027 | 58 | 34 | 82,040 | 6.2 | % | 8,986 | 5.1 | % | ||||||||||||||||||||||||||||||
| 2028 | 44 | 26 | 65,870 | 4.9 | % | 5,423 | 3.1 | % | ||||||||||||||||||||||||||||||
| 2029 | 57 | 29 | 65,545 | 4.9 | % | 8,341 | 4.8 | % | ||||||||||||||||||||||||||||||
| 2030 | 31 | 27 | 69,011 | 5.2 | % | 5,844 | 3.3 | % | ||||||||||||||||||||||||||||||
| 2031 | 37 | 21 | 68,117 | 5.1 | % | 8,749 | 5.0 | % | ||||||||||||||||||||||||||||||
| 2032 | 40 | 21 | 41,216 | 3.1 | % | 5,715 | 3.3 | % | ||||||||||||||||||||||||||||||
| 2033 | 30 | 24 | 76,780 | 5.8 | % | 10,907 | 6.2 | % | ||||||||||||||||||||||||||||||
| 2034 | 49 | 18 | 77,608 | 5.8 | % | 8,639 | 4.9 | % | ||||||||||||||||||||||||||||||
| 2035 | 14 | 14 | 28,332 | 2.1 | % | 4,957 | 2.8 | % | ||||||||||||||||||||||||||||||
| Thereafter (>2035) | 303 | 122 | 482,459 | 36.2 | % | 69,930 | 40.0 | % | ||||||||||||||||||||||||||||||
| Vacant | — | — | — | — | % | 1,880 | 1.1 | % | ||||||||||||||||||||||||||||||
| Total | 851 | $ | 1,333,741 | 100.0 | % | 174,950 | 100.0 | % | ||||||||||||||||||||||||||||||
__________
(a)
Assumes tenants do not exercise any renewal options or purchase options.
(b)
Includes ABR of $16.1 million from a tenant (Marriott Corporation) with a lease expiration in January 2023.
(c)
Includes ABR of $38.8 million from a tenant (U-Haul Moving Partners, Inc. and Mercury Partners, LP) that holds an option to repurchase the 78 properties it is leasing in April 2024. There can be no assurance that such repurchase will be completed.
Rent Collections
Through the date of this Report, we received from tenants over 99.3% of contractual base rent that was due during the third quarter of 2022 (based on contractual minimum ABR as of June 30, 2022).
Terms and Definitions
Pro Rata Metrics
— The portfolio information above contains certain metrics prepared on a pro rata basis.
We refer to these metrics as pro rata metrics. We have a number of investments, usually with our affiliates, in which our economic ownership is less than 100%. On a full consolidation basis, we report 100% of the assets, liabilities, revenues, and expenses of those investments that are deemed to be under our control or for which we are deemed to be the primary beneficiary, even if our ownership is less than 100%. Also, for all other jointly owned investments, which we do not control, we report our net investment and our net income or loss from that investment. On a pro rata basis, we generally present our proportionate share, based on our economic ownership of these jointly owned investments, of the portfolio metrics of those investments. Multiplying each of our jointly owned investments’ financial statement line items by our percentage ownership and adding or subtracting those amounts from our totals, as applicable, may not accurately depict the legal and economic implications of holding an ownership interest of less than 100% in our jointly owned investments.
ABR
—
ABR represents contractual minimum annualized base rent for our net-leased properties and reflects exchange rates as of September 30, 2022. If there is a rent abatement, we annualize the first monthly contractual base rent following the free rent period. ABR is not applicable to operating properties.
W. P. Carey 9/30/2022 10-Q
–
55
Results of Operations
We operate in two reportable segments: Real Estate and Investment Management. We evaluate our results of operations with a primary focus on increasing and enhancing the value, quality, and number of properties in our Real Estate segment. We focus our efforts on accretive investing and improving portfolio quality through re-leasing efforts, including negotiation of lease renewals, or selectively selling assets in order to increase value in our real estate portfolio. Through our Investment Management segment, we expect to continue to earn fees and other income from the management of the portfolio of CESH until it reaches the end of its life cycle. Refer to
Note 16
for tables presenting the comparative results of our Real Estate and Investment Management segments.
Real Estate
Revenues
The following table presents revenues within our Real Estate segment (in thousands):
| Three Months Ended September 30, | Nine Months Ended September 30, | ||||||||||||||||||||||||||||||||||
| 2022 | 2021 | Change | 2022 | 2021 | Change | ||||||||||||||||||||||||||||||
| Real Estate Revenues | |||||||||||||||||||||||||||||||||||
| Lease revenues from: | |||||||||||||||||||||||||||||||||||
| Existing net-leased properties | $ | 274,434 | $ | 276,236 | $ | (1,802) | $ | 834,410 | $ | 825,285 | $ | 9,125 | |||||||||||||||||||||||
| Recently acquired net-leased properties | 39,780 | 18,273 | 21,507 | 97,338 | 33,068 | 64,270 | |||||||||||||||||||||||||||||
| Net-leased properties acquired in the CPA:18 Merger | 14,068 | — | 14,068 | 14,068 | — | 14,068 | |||||||||||||||||||||||||||||
| Net-leased properties sold or held for sale | 3,620 | 4,107 | (487) | 8,165 | 13,992 | (5,827) | |||||||||||||||||||||||||||||
| Total lease revenues (includes reimbursable tenant costs) | 331,902 | 298,616 | 33,286 | 953,981 | 872,345 | 81,636 | |||||||||||||||||||||||||||||
| Income from direct financing leases and loans receivable | 20,637 | 16,754 | 3,883 | 56,794 | 51,917 | 4,877 | |||||||||||||||||||||||||||||
| Operating property revenues from: | |||||||||||||||||||||||||||||||||||
| Operating properties acquired in the CPA:18 Merger | 15,415 | — | 15,415 | 15,415 | — | 15,415 | |||||||||||||||||||||||||||||
| Existing operating properties | 5,935 | 4,050 | 1,885 | 14,864 | 9,474 | 5,390 | |||||||||||||||||||||||||||||
| Total operating property revenues | 21,350 | 4,050 | 17,300 | 30,279 | 9,474 | 20,805 | |||||||||||||||||||||||||||||
| Lease termination income and other | 8,192 | 1,421 | 6,771 | 24,905 | 8,066 | 16,839 | |||||||||||||||||||||||||||||
| $ | 382,081 | $ | 320,841 | $ | 61,240 | $ | 1,065,959 | $ | 941,802 | $ | 124,157 | ||||||||||||||||||||||||
W. P. Carey 9/30/2022 10-Q
–
56
Lease Revenues
“Existing net-leased properties” are those that we acquired or placed into service prior to January 1, 2021 and that were not sold or held for sale during the periods presented. For the periods presented, there were 1,108 existing net-leased properties.
For the three and nine months ended September 30, 2022 as compared to the same periods in 2021, lease revenues from existing net-leased properties increased due to the following items (in millions):
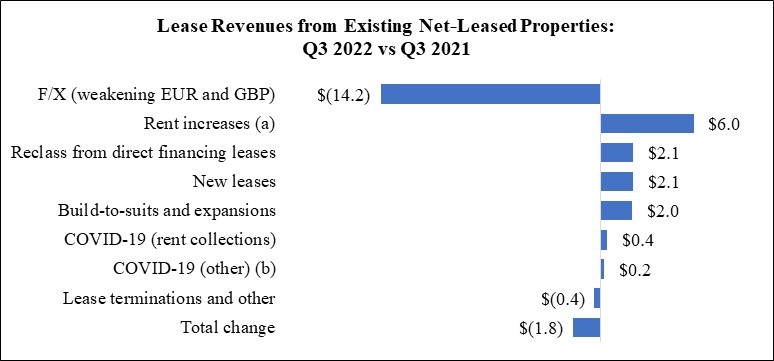
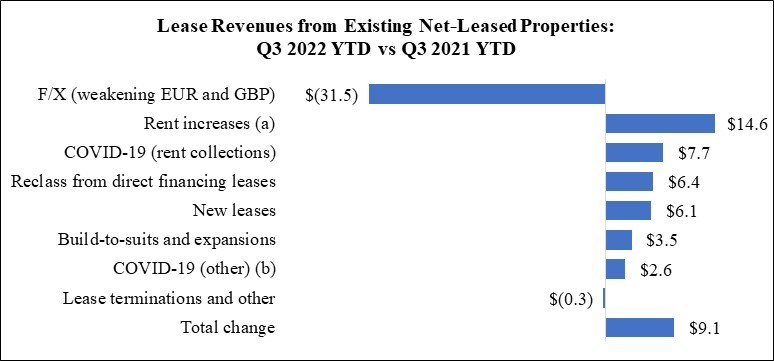
__________
(a)
Excludes fixed minimum rent increases, which are reflected as straight-line rent adjustments within lease revenues.
(b)
Primarily related to (i) straight-line rent adjustments as a result of contractual rental revenue from certain leases being deemed probable of collection and (ii) write-offs of above/below-market rent intangibles.
“Recently acquired net-leased properties” are those that we acquired or placed into service subsequent to December 31, 2020 and that were not sold or held for sale during the periods presented. Since January 1, 2021, we acquired 43 investments (comprised of 168 properties and six land parcels under buildings that we already own) and placed two properties into service.
W. P. Carey 9/30/2022 10-Q
–
57
“Net-leased properties acquired in the CPA:18 Merger” on August 1, 2022 (
Note 3
) consisted of 40 net-leased properties, which contributed two months of lease revenue, depreciation and amortization, and property expenses during the three and nine months ended September 30, 2022.
“Net-leased properties sold or held for sale” include (i) 17 net-leased properties disposed of during the nine months ended September 30, 2022, (ii) one net-leased property classified as held for sale at September 30, 2022, and (iii) 24 net-leased properties disposed of during the year ended December 31, 2021. Our dispositions are more fully described in
Note 15
.
W. P. Carey 9/30/2022 10-Q
–
58
Income from Direct Financing Leases and Loans Receivable
We currently present Income from direct financing leases and loans receivable on its own line item in the consolidated statements of income. Previously, income from direct financing leases was included within Lease revenues and income from loans receivable was included within Lease termination income and other in the consolidated statements of income. Prior period amounts have been reclassified to conform to the current period presentation.
For the three and nine months ended September 30, 2022 as compared to the same periods in 2021, income from direct financing leases and loans receivable increased due to the following items (in millions):
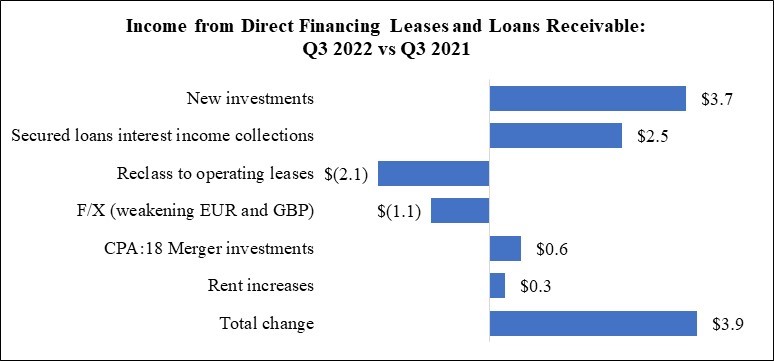

W. P. Carey 9/30/2022 10-Q
–
59
Operating Property Revenues and Expenses
“Operating properties acquired in the CPA:18 Merger” on August 1, 2022 (
Note 3
) consisted of 65 self-storage properties and two student housing properties, which contributed two months of lease revenue, depreciation and amortization, and property expenses during the three and nine months ended September 30, 2022.
“Existing operating properties” are those that we acquired or placed into service prior to January 1, 2021 and that were not sold or held for sale during the periods presented. For the periods presented, we recorded operating property revenues from 11 existing operating properties, comprised of ten self-storage operating properties (which excludes nine self-storage properties accounted for under the equity method) and one hotel operating property. For our hotel operating property, revenues and expenses increased by (i) $1.3 million and $0.5 million, respectively, for the three months ended September 30, 2022 as compared to the same period in 2021, and (ii) $4.2 million and $2.5 million, respectively, for the nine months ended September 30, 2022 as compared to the same period in 2021, reflecting higher occupancy as the hotel’s business recovers from the ongoing COVID-19 pandemic.
Lease Termination Income and Other
Operating Expenses
Depreciation and Amortization
For the three and nine months ended September 30, 2022 as compared to the same periods in 2021, depreciation and amortization expense for net-leased properties increased primarily due to the impact of net acquisition activity (including properties acquired in the CPA:18 Merger (
Note 3
)), partially offset by the weakening of foreign currencies (primarily the euro and British pound sterling) in relation to the U.S. dollar between the periods.
General and Administrative
All general and administrative expenses are attributed to our Real Estate segment.
For the three and nine months ended September 30, 2022 as compared to the same periods in 2021, general and administrative expenses increased by $2.5 million and $3.9 million, respectively, primarily due to higher compensation expense.
Merger and Other Expenses
For the three and nine months ended September 30, 2022 and 2021, merger and other expenses are primarily comprised of costs incurred in connection with the CPA:18 Merger (
Note 3
) and/or reversals of estimated liabilities for German real estate transfer taxes that were previously recorded in connection with mergers in prior years.
Property Expenses, Excluding Reimbursable Tenant Costs
For the three months ended September 30, 2022 as compared to the same period in 2021, property expenses, excluding reimbursable tenant costs, decreased by $2.5 million, primarily due to higher property tax assessments at certain properties during the prior year period.
Stock-based Compensation Expense
Stock-based compensation expense is fully recognized within our Real Estate segment.
For the three and nine months ended September 30, 2022 as compared to the same periods in 2021, stock-based compensation expense increased by $1.2 million and $4.3 million, respectively, primarily due to changes in the projected payout for PSUs.
Impairment Charges — Real Estate
W. P. Carey 9/30/2022 10-Q
–
60
Other Income and (Expenses), and Provision for Income Taxes
Interest Expense
For the three and nine months ended September 30, 2022 as compared to the same periods in 2021, interest expense increased by $10.3 million and $1.9 million, respectively, primarily due to (i) $8.0 million of interest expense incurred during August and September 2022 related to non-recourse mortgage loans assumed in the CPA:18 Merger (
Note 3
) and (ii) higher outstanding balances and interest rates on our Senior Unsecured Credit Facility, partially offset by (i) the weakening of foreign currencies (primarily the euro and British pound sterling) in relation to the U.S. dollar between the periods and (ii) the reduction of our mortgage debt outstanding by prepaying or repaying at or close to maturity a total of $823.8 million of non-recourse mortgage loans with a weighted-average interest rate of 4.8% since January 1, 2021 (
Note 11
).
The following table presents certain information about our outstanding debt (dollars in thousands):
| Three Months Ended September 30, | Nine Months Ended September 30, | ||||||||||||||||||||||
| 2022 | 2021 | 2022 | 2021 | ||||||||||||||||||||
| Average outstanding debt balance | $ | 7,827,346 | $ | 6,936,086 | $ | 7,193,779 | $ | 6,917,578 | |||||||||||||||
| Weighted-average interest rate | 2.6 | % | 2.5 | % | 2.5 | % | 2.6 | % | |||||||||||||||
Other Gains and (Losses)
Other gains and (losses) primarily consists of gains and losses on (i) the mark-to-market fair value of equity securities, (ii) extinguishment of debt, and (iii) foreign currency exchange rate movements. The timing and amount of such gains or losses cannot always be estimated and are subject to fluctuation.
All of our foreign currency-denominated unsecured debt instruments were designated as net investment hedges during the three and
nine months ended September 30, 2022
and
2021
. Therefore, no gains and losses on foreign currency exchange rate movements were recognized on the remeasurement of such instruments during those periods
(
Note 10
).
The following table presents other gains and (losses) within our Real Estate segment (in thousands):
| Three Months Ended September 30, | Nine Months Ended September 30, | ||||||||||||||||||||||||||||||||||
| 2022 | 2021 | Change | 2022 | 2021 | Change | ||||||||||||||||||||||||||||||
| Other Gains and (Losses) | |||||||||||||||||||||||||||||||||||
|
Net realized and unrealized losses on foreign currency exchange rate movements
(a)
|
$ | (36,288) | $ | (7,005) | $ | (29,283) | $ | (84,392) | $ | (11,186) | $ | (73,206) | |||||||||||||||||||||||
| 16,184 | 488 | 15,696 | 17,164 | 6,737 | 10,427 | ||||||||||||||||||||||||||||||
|
Gain on repayment of secured loan receivable
(b)
|
10,613 | — | 10,613 | 10,613 | — | 10,613 | |||||||||||||||||||||||||||||
|
Write-off of an insurance receivable acquired as part of a prior merger
(c)
|
(9,358) | — | (9,358) | (9,358) | — | (9,358) | |||||||||||||||||||||||||||||
|
Gain (loss) on extinguishment of debt
(d)
|
2,342 | (99) | 2,441 | 1,301 | (60,167) | 61,468 | |||||||||||||||||||||||||||||
|
Non-cash unrealized gains related to an increase in the fair value of our investment in shares of Lineage Logistics (
Note 9
)
|
— | 52,931 | (52,931) | — | 76,312 | (76,312) | |||||||||||||||||||||||||||||
|
Non-cash unrealized gains related to an increase in the fair value of our investment in common shares of WLT (
Note 9
)
|
— | — | — | 43,397 | — | 43,397 | |||||||||||||||||||||||||||||
|
Realized gains in connection with the redemption of our investment in preferred shares of WLT (
Note 9
)
|
— | — | — | 18,688 | — | 18,688 | |||||||||||||||||||||||||||||
| Other | 2,547 | 1,857 | 690 | 2,890 | 1,759 | 1,131 | |||||||||||||||||||||||||||||
| $ | (13,960) | $ | 48,172 | $ | (62,132) | $ | 303 | $ | 13,455 | $ | (13,152) | ||||||||||||||||||||||||
__________
W. P. Carey 9/30/2022 10-Q
–
61
(a)
We make certain foreign currency-denominated intercompany loans to a number of our foreign subsidiaries, most of which do not have the U.S. dollar as their functional currency. Remeasurement of foreign currency intercompany transactions that are scheduled for settlement, consisting primarily of accrued interest and amortizing loans, are included in other gains and (losses).
(b)
We acquired a secured loan receivable with a fair value of $23.4 million in our merger with a former affiliate, Corporate Property Associates 17 – Global Incorporated, in October 2018 (“CPA:17 Merger”), for which the outstanding principal of $34.0 million was fully repaid to us in September 2022 (
Note 6
). Therefore, we recorded a $10.6 million gain on repayment of this secured loan receivable.
(c)
This insurance receivable was acquired in the CPA:17 Merger.
(d)
Amount for the nine months ended September 30, 2021 is related to the prepayment of mortgage loans (primarily comprised of prepayment penalties totaling $32.1 million) and redemption of the €500.0 million of 2.0% Senior Notes due 2023 in March 2021 (primarily comprised of a “make-whole” amount of $26.2 million related to the redemption) (
Note 11
).
Gain on Change in Control of Interests
In connection with the CPA:18 Merger, during the three and nine months ended September 30, 2022, we acquired the remaining interests in four investments in which we already had a joint interest and accounted for under the equity method. Due to the change in control of these four jointly owned investments, we recorded a gain on change in control of interests of $11.4 million reflecting the difference between our carrying values and the preliminary estimated fair values of our previously held equity interests on August 1, 2022. Subsequent to the CPA:18 Merger, we consolidated these wholly owned investments (
Note 3
).
Non-Operating Income
Non-operating income primarily consists of realized gains and losses on derivative instruments, dividends from securities, and interest income on our loans to affiliates and cash deposits.
The following table presents non-operating income within our Real Estate segment (in thousands):
| Three Months Ended September 30, | Nine Months Ended September 30, | ||||||||||||||||||||||||||||||||||
| 2022 | 2021 | Change | 2022 | 2021 | Change | ||||||||||||||||||||||||||||||
| Non-Operating Income | |||||||||||||||||||||||||||||||||||
| $ | 8,724 | $ | 370 | $ | 8,354 | $ | 17,970 | $ | (38) | $ | 18,008 | ||||||||||||||||||||||||
| Interest income related to our loans to affiliates and cash deposits | 540 | 100 | 440 | 591 | 139 | 452 | |||||||||||||||||||||||||||||
| — | 813 | (813) | 912 | 4,081 | (3,169) | ||||||||||||||||||||||||||||||
| — | — | — | 4,308 | 6,438 | (2,130) | ||||||||||||||||||||||||||||||
| $ | 9,264 | $ | 1,283 | $ | 7,981 | $ | 23,781 | $ | 10,620 | $ | 13,161 | ||||||||||||||||||||||||
W. P. Carey 9/30/2022 10-Q
–
62
Earnings (Losses) from Equity Method Investments in Real Estate
Our equity method investments in real estate are more fully described in
Note 8
. The following table presents earnings (losses) from equity method investments in real estate (in thousands):
| Three Months Ended September 30, | Nine Months Ended September 30, | ||||||||||||||||||||||||||||||||||
| 2022 | 2021 | Change | 2022 | 2021 | Change | ||||||||||||||||||||||||||||||
| Earnings (Losses) from Equity Method Investments in Real Estate | |||||||||||||||||||||||||||||||||||
| Existing Equity Method Investments: | |||||||||||||||||||||||||||||||||||
| Earnings from Las Vegas Retail Complex | $ | 2,860 | $ | 1,352 | $ | 1,508 | $ | 6,228 | $ | 1,645 | $ | 4,583 | |||||||||||||||||||||||
|
Earnings from Kesko Senukai
(a)
|
1,902 | 944 | 958 | 3,132 | 434 | 2,698 | |||||||||||||||||||||||||||||
|
Earnings from Johnson Self Storage
(b)
|
1,163 | 663 | 500 | 3,190 | 1,556 | 1,634 | |||||||||||||||||||||||||||||
| Earnings from Harmon Retail Center | 258 | 276 | (18) | 789 | 828 | (39) | |||||||||||||||||||||||||||||
|
Losses from WLT
(c)
|
— | (1,376) | 1,376 | — | (9,864) | 9,864 | |||||||||||||||||||||||||||||
| 6,183 | 1,859 | 4,324 | 13,339 | (5,401) | 18,740 | ||||||||||||||||||||||||||||||
| — | — | — | (4,610) | — | (4,610) | ||||||||||||||||||||||||||||||
| — | — | — | — | (6,830) | 6,830 | ||||||||||||||||||||||||||||||
| Other | 264 | 586 | (322) | 1,460 | 1,703 | (243) | |||||||||||||||||||||||||||||
| 264 | 586 | (322) | (3,150) | (5,127) | 1,977 | ||||||||||||||||||||||||||||||
| $ | 6,447 | $ | 2,445 | $ | 4,002 | $ | 10,189 | $ | (10,528) | $ | 20,717 | ||||||||||||||||||||||||
__________
(a)
Increases for the three and nine months ended September 30, 2022 as compared to the same periods in 2021 are primarily due to higher rent collections at these retail properties, where certain rents were previously disputed and subsequently collected.
(b)
Increases for the three and nine months ended September 30, 2022 as compared to the same periods in 2021 are primarily due to higher occupancy and unit rates at these self-storage facilities.
(c)
Losses for the prior year periods were primarily due to the adverse impact of the COVID-19 pandemic on WLT’s operations. We recorded losses from this investment on a one quarter lag. This investment was reclassified to equity securities at fair value within Other assets, net on our consolidated balance sheets in January 2022 (
Note 9
).
(Loss) Gain on Sale of Real Estate, Net
(Loss) gain on sale of real estate, net, consists of losses and gains on the sale of properties that were disposed of during the reporting period. Our dispositions are more fully described in
Note 15
.
Provision for Income Taxes
For the three and nine months ended September 30, 2022 as compared to the same periods in 2021, provision for income taxes within our Real Estate segment decreased by $4.2 million and $6.9 million, respectively, primarily due to (i) deferred tax benefits totaling $2.4 million recognized during the current year periods related to the release of valuation allowances on certain foreign properties and (ii) trade taxes of $1.8 million recognized during the prior year periods as a result of the completion of a tax review on a portfolio of properties in Germany. In addition, we recognized tax benefits of $0.7 million on certain foreign properties during the nine months ended September 30, 2022 as a result of a tax court ruling.
W. P. Carey 9/30/2022 10-Q
–
63
Investment Management
We earn revenue as the advisor to the Managed Programs. For the periods presented, we acted as advisor to the following Managed Programs: CPA:18 – Global (through August 1, 2022) and CESH. Upon completion of the CPA:18 Merger on August 1, 2022 (
Note 3
), the advisory agreement with CPA:18 – Global was terminated, and we ceased earning revenue from CPA:18 – Global. The CWI 1 and CWI 2 Merger closed on April 13, 2020, and as a result, CWI 2 was renamed Watermark Lodging Trust, Inc., for which we provided certain services pursuant to a transition services agreement, which was terminated on October 13, 2021 (
Note 4
).
We no longer raise capital for new or existing funds, but we currently expect to continue managing CESH and earn the various fees described below through the end of its life cycle. As of September 30, 2022, we managed total assets of approximately $161.5 million on behalf of CESH.
Revenues
The following table presents revenues within our Investment Management segment (in thousands):
| Three Months Ended September 30, | Nine Months Ended September 30, | ||||||||||||||||||||||||||||||||||
| 2022 | 2021 | Change | 2022 | 2021 | Change | ||||||||||||||||||||||||||||||
| Investment Management Revenues | |||||||||||||||||||||||||||||||||||
| Asset management and other revenue | |||||||||||||||||||||||||||||||||||
| CPA:18 – Global | $ | 851 | $ | 3,160 | $ | (2,309) | $ | 6,956 | $ | 9,452 | $ | (2,496) | |||||||||||||||||||||||
| CESH | 346 | 712 | (366) | 1,128 | 2,340 | (1,212) | |||||||||||||||||||||||||||||
| 1,197 | 3,872 | (2,675) | 8,084 | 11,792 | (3,708) | ||||||||||||||||||||||||||||||
| Reimbursable costs from affiliates | |||||||||||||||||||||||||||||||||||
| CPA:18 – Global | 266 | 769 | (503) | 2,040 | 2,058 | (18) | |||||||||||||||||||||||||||||
| CESH | 78 | 197 | (119) | 374 | 713 | (339) | |||||||||||||||||||||||||||||
| WLT | — | 75 | (75) | — | 279 | (279) | |||||||||||||||||||||||||||||
| 344 | 1,041 | (697) | 2,414 | 3,050 | (636) | ||||||||||||||||||||||||||||||
| $ | 1,541 | $ | 4,913 | $ | (3,372) | $ | 10,498 | $ | 14,842 | $ | (4,344) | ||||||||||||||||||||||||
Asset Management and Other Revenue
Asset management and other revenue includes asset management revenue, structuring revenue, and other advisory revenue. During the periods presented, we earned asset management revenue from (i) CPA:18 – Global (prior to the CPA:18 Merger) based on the value of its real estate-related assets under management and (ii) CESH based on its gross assets under management at fair value. Asset management revenue may increase or decrease depending upon changes in the Managed Programs’ asset bases as a result of purchases, sales, or changes in the appraised value of the assets in their investment portfolios. For 2022, we received asset management fees from (i) CPA:18 – Global in shares of its common stock through February 28, 2022; effective as of March 1, 2022, we receive asset management fees from CPA:18 – Global in cash in light of the CPA:18 Merger, which closed on August 1, 2022 (
Note 3
), and (ii) CESH in cash.
Operating Expenses
Impairment Charges — Investment Management Goodwill
Other Income and Expenses, and Provision for Income Taxes
Gain on Change in Control of Interests
In connection with the CPA:18 Merger, during the three and nine months ended September 30, 2022, we recognized a gain on change in control of interests of $22.5 million within our Investment Management segment related to the difference between the carrying value and the preliminary estimated fair value of our previously held equity interest in shares of CPA:18 – Global’s common stock (
Note 3
).
W. P. Carey 9/30/2022 10-Q
–
64
Earnings from Equity Method Investments in the Managed Programs
Earnings from our equity method investments in the Managed Programs fluctuates based on the timing of transactions, such as new leases and property sales, as well as the level of impairment charges. The following table presents the details of our earnings from equity method investments in the Managed Programs (
Note 8
) (in thousands):
| Three Months Ended September 30, | Nine Months Ended September 30, | ||||||||||||||||||||||
| 2022 | 2021 | 2022 | 2021 | ||||||||||||||||||||
| Earnings from equity method investments in the Managed Programs: | |||||||||||||||||||||||
|
Distributions of Available Cash from CPA:18 – Global
(a)
|
$ | 3,345 | $ | 1,623 | $ | 8,746 | $ | 4,949 | |||||||||||||||
|
Earnings from equity method investments in the Managed Programs
(a) (b)
|
1,512 | 1,667 | 4,542 | 1,425 | |||||||||||||||||||
| Earnings from equity method investments in the Managed Programs | $ | 4,857 | $ | 3,290 | $ | 13,288 | $ | 6,374 | |||||||||||||||
__________
(a)
As a result of the completion of the CPA:18 Merger on August 1, 2022 (
Note 3
), we no longer recognize equity income from our investment in shares of common stock of CPA:18 – Global or receive distributions of Available Cash from CPA:18 – Global.
(b)
Increase for the nine months ended September 30, 2022 as compared to the same period in 2021 was due to an increase of $3.1 million from our investment in shares of CPA:18 – Global.
Provision for Income Taxes
For the three and nine months ended September 30, 2022 as compared to the same periods in 2021, provision for income taxes within our Investment Management segment increased by $4.1 million and $5.0 million, respectively, primarily due to one-time current taxes incurred upon the recognition of taxable income associated with the accelerated vesting of shares previously issued by CPA:18 – Global to us for asset management services performed, in connection with the CPA:18 Merger.
Liquidity and Capital Resources
Sources and Uses of Cash During the Period
We use the cash flow generated from our investments primarily to meet our operating expenses, service debt, and fund dividends to stockholders. Our cash flows fluctuate periodically due to a number of factors, which may include, among other things: the timing of our equity and debt offerings; the timing of purchases and sales of real estate; the timing of the repayment of mortgage loans and receipt of lease revenues; the timing and amount of other lease-related payments; the timing of settlement of foreign currency transactions; changes in foreign currency exchange rates; and the timing of distributions from equity method investments. We no longer receive certain fees and distributions from CPA:18 – Global following the completion of the CPA:18 Merger on August 1, 2022 (
Note 3
). Despite these fluctuations, we believe that we will generate sufficient cash from operations to meet our normal recurring short-term and long-term liquidity needs. We may also use existing cash resources, available capacity under our Senior Unsecured Credit Facility, proceeds from dispositions of properties, and the issuance of additional debt or equity securities, such as issuances of common stock through our Equity Forwards and ATM Program (
Note 13
), in order to meet these needs. We assess our ability to access capital on an ongoing basis. Our sources and uses of cash during the period are described below.
Operating Activities
— Net cash provided by operating activities increased by $77.1 million during the nine months ended September 30, 2022 as compared to the same period in 2021, primarily due to an increase in cash flow generated from net investment activity (including properties acquired in the CPA:18 Merger (
Note 3
)) and scheduled rent increases at existing properties, as well as higher lease termination and other income. These increases were partially offset by merger expenses recognized during the current year period related to the CPA:18 Merger (
Note 3
).
W. P. Carey 9/30/2022 10-Q
–
65
Investing Activities
— Our investing activities are generally comprised of real estate-related transactions (purchases and sales) and funding for build-to-suit activities and other capital expenditures on real estate. In connection with the CPA:18 Merger, we paid $423.4 million in cash consideration and for the fractional shares of CPA:18 – Global, and acquired $331.1 million of cash and restricted cash. In addition, during the nine months ended September 30, 2022, we used $26.0 million to fund short-term loans to the Managed Programs, all of which was repaid during that period (
Note 4
). We also received $7.4 million in distributions from equity method investments.
Financing Activities
— Our financing activities are generally comprised of borrowings and repayments under our Unsecured Revolving Credit Facility, issuances of the Senior Unsecured Notes, payments and prepayments of non-recourse mortgage loans, and payments of dividends to stockholders. In addition to these types of transactions, during the nine months ended September 30, 2022, we received (i) $218.1 million in net proceeds from the issuance of shares under our prior ATM Program (
Note 13
) and (ii) $97.5 million in net proceeds from the issuance of common stock under our Equity Forwards (
Note 13
).
Summary of Financing
The table below summarizes our Senior Unsecured Notes, our non-recourse mortgages, and our Senior Unsecured Credit Facility (dollars in thousands):
| September 30, 2022 | December 31, 2021 | ||||||||||
| Carrying Value | |||||||||||
| Fixed rate: | |||||||||||
|
Senior Unsecured Notes
(a)
|
$ | 5,651,865 | $ | 5,701,913 | |||||||
|
Non-recourse mortgages
(a)
|
876,092 | 235,898 | |||||||||
| 6,527,957 | 5,937,811 | ||||||||||
| Variable rate: | |||||||||||
|
Unsecured Term Loans
(a)
|
506,004 | 310,583 | |||||||||
| Unsecured Revolving Credit Facility | 462,660 | 410,596 | |||||||||
|
Non-recourse mortgages
(a)
:
|
|||||||||||
| Floating interest rate mortgage loans | 197,178 | 53,571 | |||||||||
| Amount subject to interest rate swaps and caps | 89,544 | 79,055 | |||||||||
| 1,255,386 | 853,805 | ||||||||||
| $ | 7,783,343 | $ | 6,791,616 | ||||||||
| Percent of Total Debt | |||||||||||
| Fixed rate | 84 | % | 87 | % | |||||||
| Variable rate | 16 | % | 13 | % | |||||||
| 100 | % | 100 | % | ||||||||
| Weighted-Average Interest Rate at End of Period | |||||||||||
| Fixed rate | 2.9 | % | 2.7 | % | |||||||
|
Variable rate
(b)
|
3.1 | % | 1.1 | % | |||||||
| Total debt | 3.0 | % | 2.5 | % | |||||||
__________
(a)
Aggregate debt balance includes unamortized discount, net, totaling $37.6 million and $30.9 million as of September 30, 2022 and December 31, 2021, respectively, and unamortized deferred financing costs totaling $26.4 million and $28.8 million as of September 30, 2022 and December 31, 2021, respectively.
(b)
The impact of our interest rate swaps and caps is reflected in the weighted-average interest rates.
W. P. Carey 9/30/2022 10-Q
–
66
Cash Resources
At September 30, 2022, our cash resources consisted of the following:
•
cash and cash equivalents totaling $186.4 million. Of this amount, $89.3 million, at then-current exchange rates, was held in foreign subsidiaries, and we could be subject to restrictions or significant costs should we decide to repatriate these amounts;
•
our Unsecured Revolving Credit Facility, with available capacity of approximately $1.3 billion (net of amounts reserved for standby letters of credit totaling $0.6 million);
•
available proceeds under our Equity Forwards of approximately $185.8 million (based on 2,587,500 remaining shares outstanding and a net offering price of $71.81 per share as of September 30, 2022);
•
available proceeds under our ATM Forwards of approximately $455.7 million (based on 5,538,037 shares outstanding and a weighted-average net offering price of $82.29 per share as of September 30, 2022); and
•
unleveraged properties that had an aggregate asset carrying value of approximately $12.7 billion at September 30, 2022, although there can be no assurance that we would be able to obtain financing for these properties.
Historically, we have also accessed the capital markets through additional debt (denominated in both U.S. dollars and euros) and equity offerings.
Our cash resources can be used for working capital needs and other commitments and may be used for future investments.
Cash Requirements and Liquidity
As of September 30, 2022, we had (i) $186.4 million of cash and cash equivalents, (ii) approximately $1.3 billion of available capacity under our Unsecured Revolving Credit Facility (net of amounts reserved for standby letters of credit totaling $0.6 million), (iii) available proceeds under our ATM Forwards of approximately $455.7 million (based on 5,538,037 remaining shares outstanding and a weighted-average net offering price of $82.29 per share as of that date), and (iv) available proceeds under our Equity Forwards of approximately $185.8 million (based on 2,587,500 remaining shares outstanding and a net offering price of $71.81 per share as of that date). Our Senior Unsecured Credit Facility includes a $1.8 billion Unsecured Revolving Credit Facility and Unsecured Term Loans outstanding totaling $506.0 million as of September 30, 2022 (
Note 11
), and is scheduled to mature on February 20, 2025. As of September 30, 2022, scheduled debt principal payments total $96.7 million through December 31, 2022 and $525.0 million through December 31, 2023, and our Senior Unsecured Notes do not start to mature until April 2024 (
Note 11
).
During the next 12 months following September 30, 2022 and thereafter, we expect that our significant cash requirements will include:
•
paying dividends to our stockholders (which we expect to be higher, following the issuance of 13,786,302 shares of our common stock in the CPA:18 Merger (
Note 3
));
•
making scheduled interest payments on our debt obligations (future interest payments total $957.6 million, with $228.5 million due during the next 12 months; interest on unhedged variable-rate debt obligations was calculated using the applicable annual variable interest rates and balances outstanding at September 30, 2022); and
•
other normal recurring operating expenses.
We expect to fund these cash requirements through cash generated from operations, cash received from dispositions of properties, the use of our cash reserves or unused amounts on our Unsecured Revolving Credit Facility (as described above), issuances of common stock through our Equity Forwards and/or ATM Program (
Note 13
), and potential issuances of additional debt or equity securities. We may also choose to pursue prepayments of certain of our non-recourse mortgage loan obligations, depending on our capital needs and market conditions at that time.
W. P. Carey 9/30/2022 10-Q
–
67
Our liquidity could be adversely affected by unanticipated costs, greater-than-anticipated operating expenses, and the adverse impact of the continuing COVID-19 pandemic. To the extent that our working capital reserve is insufficient to satisfy our cash requirements, additional funds may be provided from cash from operations to meet our normal recurring short-term and long-term liquidity needs. We may also use existing cash resources, available capacity under our Unsecured Revolving Credit Facility, mortgage loan proceeds, and the issuance of additional debt or equity securities to meet these needs. The extent to which the COVID-19 pandemic impacts our liquidity and debt covenants will depend on future developments, which are highly uncertain and cannot be predicted with confidence. The potential impact of the COVID-19 pandemic on our tenants and properties could also have a material adverse effect on our liquidity and debt covenants.
Certain amounts disclosed above are based on the applicable foreign currency exchange rate at September 30, 2022.
Supplemental Financial Measures
In the real estate industry, analysts and investors employ certain non-GAAP supplemental financial measures in order to facilitate meaningful comparisons between periods and among peer companies. Additionally, in the formulation of our goals and in the evaluation of the effectiveness of our strategies, we use Funds from Operations (“FFO”) and AFFO, which are non-GAAP measures defined by our management. We believe that these measures are useful to investors to consider because they may assist them to better understand and measure the performance of our business over time and against similar companies. A description of FFO and AFFO and reconciliations of these non-GAAP measures to the most directly comparable GAAP measures are provided below.
Funds from Operations and Adjusted Funds from Operations
Due to certain unique operating characteristics of real estate companies, as discussed below, the National Association of Real Estate Investment Trusts, Inc. (“NAREIT”), an industry trade group, has promulgated a non-GAAP measure known as FFO, which we believe to be an appropriate supplemental measure, when used in addition to and in conjunction with results presented in accordance with GAAP, to reflect the operating performance of a REIT. The use of FFO is recommended by the REIT industry as a supplemental non-GAAP measure. FFO is not equivalent to, nor a substitute for, net income or loss as determined under GAAP.
We define FFO, a non-GAAP measure, consistent with the standards established by the White Paper on FFO approved by the Board of Governors of NAREIT, as restated in December 2018. The White Paper defines FFO as net income or loss computed in accordance with GAAP, excluding gains or losses from sales of property, impairment charges on real estate or other assets incidental to the company’s main business, gains or losses on changes in control of interests in real estate, and depreciation and amortization from real estate assets; and after adjustments for unconsolidated partnerships and jointly owned investments. Adjustments for unconsolidated partnerships and jointly owned investments are calculated to reflect FFO.
We also modify the NAREIT computation of FFO to adjust GAAP net income for certain non-cash charges, such as amortization of real estate-related intangibles, deferred income tax benefits and expenses, straight-line rent and related reserves, other non-cash rent adjustments, non-cash allowance for credit losses on loans receivable and direct financing leases, stock-based compensation, non-cash environmental accretion expense, amortization of discounts and premiums on debt, and amortization of deferred financing costs. Our assessment of our operations is focused on long-term sustainability and not on such non-cash items, which may cause short-term fluctuations in net income but have no impact on cash flows. Additionally, we exclude non-core income and expenses, such as gains or losses from extinguishment of debt and merger and acquisition expenses. We also exclude realized and unrealized gains/losses on foreign currency exchange rate movements (other than those realized on the settlement of foreign currency derivatives), which are not considered fundamental attributes of our business plan and do not affect our overall long-term operating performance. We refer to our modified definition of FFO as AFFO. We exclude these items from GAAP net income to arrive at AFFO as they are not the primary drivers in our decision-making process and excluding these items provides investors a view of our portfolio performance over time and makes it more comparable to other REITs that are currently not engaged in acquisitions, mergers, and restructuring, which are not part of our normal business operations. AFFO also reflects adjustments for unconsolidated partnerships and jointly owned investments. We use AFFO as one measure of our operating performance when we formulate corporate goals, evaluate the effectiveness of our strategies, and determine executive compensation.
W. P. Carey 9/30/2022 10-Q
–
68
We believe that AFFO is a useful supplemental measure for investors to consider as we believe it will help them to better assess the sustainability of our operating performance without the potentially distorting impact of these short-term fluctuations. However, there are limits on the usefulness of AFFO to investors. For example, impairment charges and unrealized foreign currency losses that we exclude may become actual realized losses upon the ultimate disposition of the properties in the form of lower cash proceeds or other considerations. We use our FFO and AFFO measures as supplemental financial measures of operating performance. We do not use our FFO and AFFO measures as, nor should they be considered to be, alternatives to net income computed under GAAP, or as alternatives to net cash provided by operating activities computed under GAAP, or as indicators of our ability to fund our cash needs.
Consolidated FFO and AFFO were as follows (in thousands):
| Three Months Ended September 30, | Nine Months Ended September 30, | ||||||||||||||||||||||
| 2022 | 2021 | 2022 | 2021 | ||||||||||||||||||||
| Net income attributable to W. P. Carey | $ | 104,928 | $ | 138,547 | $ | 389,601 | $ | 310,426 | |||||||||||||||
| Adjustments: | |||||||||||||||||||||||
| Depreciation and amortization of real property | 131,628 | 114,204 | 360,607 | 336,405 | |||||||||||||||||||
|
Gain on change in control of interests
(a) (b)
|
(33,931) | — | (33,931) | — | |||||||||||||||||||
|
Impairment charges — Investment Management goodwill
(c)
|
29,334 | — | 29,334 | — | |||||||||||||||||||
| Loss (gain) on sale of real estate, net | 4,736 | (1,702) | (37,631) | (30,914) | |||||||||||||||||||
| Impairment charges — real estate | — | 16,301 | 26,385 | 16,301 | |||||||||||||||||||
|
Proportionate share of adjustments to earnings from equity method investments
(d) (e)
|
2,242 | 3,290 | 12,859 | 17,030 | |||||||||||||||||||
|
Proportionate share of adjustments for noncontrolling interests
(f)
|
(189) | (4) | (197) | (12) | |||||||||||||||||||
|
Total adjustments
|
133,820 | 132,089 | 357,426 | 338,810 | |||||||||||||||||||
| FFO (as defined by NAREIT) attributable to W. P. Carey | 238,748 | 270,636 | 747,027 | 649,236 | |||||||||||||||||||
| Adjustments: | |||||||||||||||||||||||
|
Merger and other expenses
(g)
|
17,667 | (908) | 17,329 | (3,983) | |||||||||||||||||||
|
Other (gains) and losses
(h)
|
15,020 | (49,219) | 1,021 | (15,576) | |||||||||||||||||||
| Straight-line and other leasing and financing adjustments | (14,326) | (10,823) | (39,665) | (29,887) | |||||||||||||||||||
|
Above- and below-market rent intangible lease amortization, net
|
11,186 | 12,004 | 32,738 | 38,503 | |||||||||||||||||||
| Stock-based compensation | 5,511 | 4,361 | 23,102 | 18,790 | |||||||||||||||||||
| Amortization of deferred financing costs | 5,223 | 3,424 | 11,498 | 10,284 | |||||||||||||||||||
| Tax expense (benefit) — deferred and other | 1,163 | (290) | (434) | (3,460) | |||||||||||||||||||
| Other amortization and non-cash items | 359 | 557 | 1,441 | 1,149 | |||||||||||||||||||
|
Proportionate share of adjustments to earnings from equity method investments
(e)
|
(2,156) | 988 | (2,451) | 10,849 | |||||||||||||||||||
|
Proportionate share of adjustments for noncontrolling interests
(f)
|
(673) | (6) | (684) | (19) | |||||||||||||||||||
|
Total adjustments
|
38,974 | (39,912) | 43,895 | 26,650 | |||||||||||||||||||
| AFFO attributable to W. P. Carey | $ | 277,722 | $ | 230,724 | $ | 790,922 | $ | 675,886 | |||||||||||||||
| Summary | |||||||||||||||||||||||
| FFO (as defined by NAREIT) attributable to W. P. Carey | $ | 238,748 | $ | 270,636 | $ | 747,027 | $ | 649,236 | |||||||||||||||
| AFFO attributable to W. P. Carey | $ | 277,722 | $ | 230,724 | $ | 790,922 | $ | 675,886 | |||||||||||||||
W. P. Carey 9/30/2022 10-Q
–
69
FFO and AFFO from Real Estate were as follows (in thousands):
| Three Months Ended September 30, | Nine Months Ended September 30, | ||||||||||||||||||||||
| 2022 | 2021 | 2022 | 2021 | ||||||||||||||||||||
| Net income from Real Estate attributable to W. P. Carey | $ | 111,375 | $ | 130,858 | $ | 381,461 | $ | 290,132 | |||||||||||||||
| Adjustments: | |||||||||||||||||||||||
| Depreciation and amortization of real property | 131,628 | 114,204 | 360,607 | 336,405 | |||||||||||||||||||
|
Gain on change in control of interests
(a)
|
(11,405) | — | (11,405) | — | |||||||||||||||||||
| Loss (gain) on sale of real estate, net | 4,736 | (1,702) | (37,631) | (30,914) | |||||||||||||||||||
| Impairment charges — real estate | — | 16,301 | 26,385 | 16,301 | |||||||||||||||||||
|
Proportionate share of adjustments to earnings from equity method investments
(d) (e)
|
2,242 | 3,290 | 12,859 | 17,030 | |||||||||||||||||||
|
Proportionate share of adjustments for noncontrolling interests
(f)
|
(189) | (4) | (197) | (12) | |||||||||||||||||||
|
Total adjustments
|
127,012 | 132,089 | 350,618 | 338,810 | |||||||||||||||||||
|
FFO (as defined by NAREIT) attributable to W. P. Carey — Real Estate
|
238,387 | 262,947 | 732,079 | 628,942 | |||||||||||||||||||
| Adjustments: | |||||||||||||||||||||||
|
Merger and other expenses
(g)
|
17,667 | (908) | 17,326 | (3,998) | |||||||||||||||||||
| Straight-line and other leasing and financing adjustments | (14,326) | (10,823) | (39,665) | (29,887) | |||||||||||||||||||
|
Other (gains) and losses
(h)
|
13,960 | (48,172) | (303) | (13,455) | |||||||||||||||||||
|
Above- and below-market rent intangible lease amortization, net
|
11,186 | 12,004 | 32,738 | 38,503 | |||||||||||||||||||
| Stock-based compensation | 5,511 | 4,361 | 23,102 | 18,790 | |||||||||||||||||||
| Amortization of deferred financing costs | 5,223 | 3,424 | 11,498 | 10,284 | |||||||||||||||||||
| Tax (benefit) — deferred and other | (2,789) | (700) | (4,302) | (3,087) | |||||||||||||||||||
| Other amortization and non-cash items | 359 | 557 | 1,441 | 1,149 | |||||||||||||||||||
|
Proportionate share of adjustments to earnings from equity method investments
(e)
|
(938) | 1,761 | (403) | 9,928 | |||||||||||||||||||
|
Proportionate share of adjustments for noncontrolling interests
(f)
|
(673) | (6) | (684) | (19) | |||||||||||||||||||
|
Total adjustments
|
35,180 | (38,502) | 40,748 | 28,208 | |||||||||||||||||||
| AFFO attributable to W. P. Carey — Real Estate | $ | 273,567 | $ | 224,445 | $ | 772,827 | $ | 657,150 | |||||||||||||||
| Summary | |||||||||||||||||||||||
|
FFO (as defined by NAREIT) attributable to W. P. Carey — Real Estate
|
$ | 238,387 | $ | 262,947 | $ | 732,079 | $ | 628,942 | |||||||||||||||
| AFFO attributable to W. P. Carey — Real Estate | $ | 273,567 | $ | 224,445 | $ | 772,827 | $ | 657,150 | |||||||||||||||
W. P. Carey 9/30/2022 10-Q
–
70
FFO and AFFO from Investment Management were as follows (in thousands):
| Three Months Ended September 30, | Nine Months Ended September 30, | ||||||||||||||||||||||
| 2022 | 2021 | 2022 | 2021 | ||||||||||||||||||||
| Net (loss) income from Investment Management attributable to W. P. Carey | $ | (6,447) | $ | 7,689 | $ | 8,140 | $ | 20,294 | |||||||||||||||
| Adjustments: | |||||||||||||||||||||||
|
Impairment charges — Investment Management goodwill
(c)
|
29,334 | — | 29,334 | — | |||||||||||||||||||
|
Gain on change in control of interests
(b)
|
(22,526) | — | (22,526) | — | |||||||||||||||||||
| Total adjustments | 6,808 | — | 6,808 | — | |||||||||||||||||||
|
FFO (as defined by NAREIT) attributable to W. P. Carey — Investment Management
|
361 | 7,689 | 14,948 | 20,294 | |||||||||||||||||||
| Adjustments: | |||||||||||||||||||||||
| Tax expense (benefit) — deferred and other | 3,952 | 410 | 3,868 | (373) | |||||||||||||||||||
| Other (gains) and losses | 1,060 | (1,047) | 1,324 | (2,121) | |||||||||||||||||||
| Merger and other expenses | — | — | 3 | 15 | |||||||||||||||||||
|
Proportionate share of adjustments to earnings from equity method investments
(e)
|
(1,218) | (773) | (2,048) | 921 | |||||||||||||||||||
|
Total adjustments
|
3,794 | (1,410) | 3,147 | (1,558) | |||||||||||||||||||
|
AFFO attributable to W. P. Carey — Investment Management
|
$ | 4,155 | $ | 6,279 | $ | 18,095 | $ | 18,736 | |||||||||||||||
| Summary | |||||||||||||||||||||||
|
FFO (as defined by NAREIT) attributable to W. P. Carey — Investment Management
|
$ | 361 | $ | 7,689 | $ | 14,948 | $ | 20,294 | |||||||||||||||
|
AFFO attributable to W. P. Carey — Investment Management
|
$ | 4,155 | $ | 6,279 | $ | 18,095 | $ | 18,736 | |||||||||||||||
__________
(a)
Amounts for the three and nine months ended September 30, 2022 represent a gain recognized on the remaining interests in four investments acquired in the CPA:18 Merger, which we had previously accounted for under the equity method (
Note 3
).
(b)
Amounts for the three and nine months ended September 30, 2022 represent a gain recognized on our previously held interest in shares of CPA:18 – Global common stock in connection with the CPA:18 Merger (
Note 3
).
(c)
Amounts for the three and nine months ended September 30, 2022 represent an impairment charge recognized on goodwill within our Investment Management segment, since future Investment Management cash flows are expected to be minimal (
N
ote 7
,
Note 9
).
(d)
Amount for the nine months ended September 30, 2022 includes our $4.6 million proportionate share of an impairment charge recognized on an equity method investment in real estate (
Note 8
). Amount for the nine months ended September 30, 2021 includes a non-cash other-than-temporary impairment charge of $6.8 million recognized on an equity method investment in real estate (
Note 9
).
(e)
Equity income, including amounts that are not typically recognized for FFO and AFFO, is recognized within Earnings (losses) from equity method investments on the consolidated statements of income. This represents adjustments to equity income to reflect FFO and AFFO on a pro rata basis.
(f)
Adjustments disclosed elsewhere in this reconciliation are on a consolidated basis. This adjustment reflects our FFO or AFFO on a pro rata basis.
(g)
Amounts for the three and nine months ended September 30, 2022 and 2021 are primarily comprised of costs incurred in connection with the CPA:18 Merger (
Note 3
) and/or reversals of estimated liabilities for German real estate transfer taxes that were previously recorded in connection with mergers in prior years.
(h)
Primarily comprised of gains and losses on extinguishment of debt, the mark-to-market fair value of equity securities, and foreign currency exchange rate movements, as well as non-cash allowance for credit losses on loans receivable and direct financing leases.
W. P. Carey 9/30/2022 10-Q
–
71
While we believe that FFO and AFFO are important supplemental measures, they should not be considered as alternatives to net income as an indication of a company’s operating performance. These non-GAAP measures should be used in conjunction with net income as defined by GAAP. FFO and AFFO, or similarly titled measures disclosed by other REITs, may not be comparable to our FFO and AFFO measures.
Item 3. Quantitative and Qualitative Disclosures About Market Risk.
Market Risk
Market risk is the exposure to loss resulting from changes in interest rates, foreign currency exchange rates, and equity prices. The primary market risks that we are exposed to are interest rate risk and foreign currency exchange risk; however, we do not use derivative instruments to hedge credit/market risks or for speculative purposes. From time to time, we may enter into foreign currency collars to hedge our foreign currency cash flow exposures.
We are also exposed to further market risk as a result of tenant concentrations in certain industries and/or geographic regions, since adverse market factors (such as the COVID-19 pandemic) can affect the ability of tenants in a particular industry/region to meet their respective lease obligations. In order to manage this risk, we view our collective tenant roster as a portfolio and we attempt to diversify such portfolio so that we are not overexposed to a particular industry or geographic region.
Interest Rate Risk
The values of our real estate and related fixed-rate debt obligations, as well as the values of our unsecured debt obligations, are subject to fluctuations based on changes in interest rates. The value of our real estate is also subject to fluctuations based on local and regional economic conditions (including the ongoing impact of the COVID-19 pandemic) and changes in the creditworthiness of lessees, which may affect our ability to refinance property-level mortgage debt when balloon payments are scheduled, if we do not choose to repay the debt when due. Interest rates are highly sensitive to many factors, including governmental monetary and tax policies, domestic and international economic and political conditions, and other factors beyond our control. An increase in interest rates would likely cause the fair value of our assets to decrease. Increases in interest rates may also have an impact on the credit profile of certain tenants.
We are exposed to the impact of interest rate changes primarily through our borrowing activities. To limit this exposure, we generally seek long-term debt financing on a fixed-rate basis. However, from time to time, we or our joint investment partners obtained, and may in the future obtain, variable-rate non-recourse mortgage loans and, as a result, we have entered into, and may continue to enter into, interest rate swap agreements or interest rate cap agreements with counterparties. See
Note 10
for additional information on our interest rate swaps and caps.
At September 30, 2022, a significant portion (approximately 85.0%) of our long-term debt either bore interest at fixed rates or was swapped or capped to a fixed rate. Our debt obligations are more fully described in
Note 11
and
Liquidity and Capital Resources — Summary of Financing
in Item 2 above. The following table presents principal cash flows based upon expected maturity dates of our debt obligations outstanding at September 30, 2022 (in thousands):
|
2022 (Remainder)
|
2023 | 2024 | 2025 | 2026 | Thereafter | Total | Fair Value | ||||||||||||||||||||||||||||||||||||||||
|
Fixed-rate debt
(a) (b)
|
$ | 93,750 | $ | 228,840 | $ | 1,126,491 | $ | 762,259 | $ | 947,997 | $ | 3,431,674 | $ | 6,591,011 | $ | 5,800,996 | |||||||||||||||||||||||||||||||
|
Variable-rate debt
(a)
|
$ | 2,994 | $ | 199,402 | $ | 34,936 | $ | 1,007,697 | $ | 11,290 | $ | — | $ | 1,256,319 | $ | 1,253,300 | |||||||||||||||||||||||||||||||
__________
(a)
Amounts are based on the exchange rate at September 30, 2022, as applicable.
(b)
Amounts after 2023 are primarily comprised of principal payments for our Senior Unsecured Notes (
Note 11
).
The estimated fair value of our fixed-rate debt and our variable-rate debt that currently bears interest at fixed rates or has effectively been converted to a fixed rate through the use of interest rate swaps, or that has been subject to interest rate caps, is affected by changes in interest rates. Annual interest expense on our unhedged variable-rate debt that does not bear interest at fixed rates at September 30, 2022 would increase or decrease by $4.7 million for our U.S. dollar-denominated debt, by $3.4 million for our British pound sterling-denominated debt, by $3.0 million for our euro-denominated debt, and by $0.2 million for our Japanese yen-denominated debt, for each respective 1% change in annual interest rates.
W. P. Carey 9/30/2022 10-Q
–
72
Foreign Currency Exchange Rate Risk
We own international investments, primarily in Europe, Canada, and Japan, and as a result are subject to risk from the effects of exchange rate movements in various foreign currencies, primarily the euro, the British pound sterling, the Canadian dollar, the Japanese yen, and certain other currencies which may affect future costs and cash flows. We have obtained, and may in the future obtain, non-recourse mortgage financing in the local currency. We have also completed several offerings of euro-denominated senior notes, and have borrowed under our Senior Unsecured Credit Facility in foreign currencies, including the euro, British pound sterling, and Japanese yen (
Note 11
). Volatile market conditions arising from the ongoing effects of the COVID-19 global pandemic, as well as other macroeconomic factors, may result in significant fluctuations in foreign currency exchange rates. To the extent that currency fluctuations increase or decrease rental revenues, as translated to U.S. dollars, the change in debt service (comprised of principal and interest, excluding balloon payments), as translated to U.S. dollars, will partially offset the effect of fluctuations in revenue and, to some extent, mitigate the risk from changes in foreign currency exchange rates. We estimate that, for a 1% increase or decrease in the exchange rate between the euro, British pound sterling, or Japanese yen and the U.S. dollar, there would be a corresponding change in the projected estimated cash flow (scheduled future rental revenues, net of scheduled future debt service payments for the next 12 months) for our consolidated foreign operations at September 30, 2022 of $2.5 million, $0.3 million, and less than $0.1 million, respectively, excluding the impact of our derivative instruments.
In addition, we may use currency hedging to further reduce the exposure to our equity cash flow. We are generally a net receiver of these currencies (we receive more cash than we pay out), and therefore our foreign operations benefit from a weaker U.S. dollar and are adversely affected by a stronger U.S. dollar, relative to the foreign currency.
We enter into foreign currency collars to hedge certain of our foreign currency cash flow exposures. See
Note 10
for additional information on our foreign currency collars.
Concentration of Credit Risk
Concentrations of credit risk arise when a number of tenants are engaged in similar business activities or have similar economic risks or conditions that could cause them to default on their lease obligations to us. We regularly monitor our portfolio to assess potential concentrations of credit risk. While we believe our portfolio is well-diversified, it does contain concentrations in certain areas. There have been no material changes in our concentration of credit risk from what was disclosed in the 2021 Annual Report.
W. P. Carey 9/30/2022 10-Q
–
73
Item 4. Controls and Procedures.
Disclosure Controls and Procedures
Our disclosure controls and procedures include internal controls and other procedures designed to provide reasonable assurance that information required to be disclosed in this and other reports filed under the Exchange Act is recorded, processed, summarized, and reported within the required time periods specified in the SEC’s rules and forms; and that such information is accumulated and communicated to management, including our chief executive officer and chief financial officer, to allow timely decisions regarding required disclosures. It should be noted that no system of controls can provide complete assurance of achieving a company’s objectives and that future events may impact the effectiveness of a system of controls.
Our chief executive officer and chief financial officer, after conducting an evaluation, together with members of our management, of the effectiveness of the design and operation of our disclosure controls and procedures as of September 30, 2022, have concluded that our disclosure controls and procedures (as defined in Rule 13a-15(e) under the Exchange Act) were effective as of September 30, 2022 at a reasonable level of assurance.
Changes in Internal Control Over Financial Reporting
There have been no changes in our internal control over financial reporting during our most recently completed fiscal quarter that have materially affected, or are reasonably likely to materially affect, our internal controls over financial reporting.
W. P. Carey 9/30/2022 10-Q
–
74
PART II — OTHER INFORMATION
Item 6. Exhibits.
The following exhibits are filed with this Report. Documents other than those designated as being filed herewith are incorporated herein by reference.
| Exhibit No. | Description | Method of Filing | ||||||||||||
| 4.1 | Form of Note Representing €150,000,000 Aggregate Principal Amount of 3.41% Senior Notes due 2029 |
Filed herewith
|
||||||||||||
| 4.2 | Form of Note Representing €200,000,000 Aggregate Principal Amount of 3.70% Senior Notes due 2032 |
Filed herewith
|
||||||||||||
| 10.1 | Note Purchase Agreement, dated August 31, 2022, by and among W. P. Carey Inc. and the purchasers listed in the purchaser schedule thereto |
Incorporated by reference to Exhibit 10.1 to the Current Report on Form 8-K filed September 1, 2022
|
||||||||||||
| 31.1 | Certification pursuant to Section 302 of the Sarbanes-Oxley Act of 2002 |
Filed herewith
|
||||||||||||
| 31.2 | Certification pursuant to Section 302 of the Sarbanes-Oxley Act of 2002 |
Filed herewith
|
||||||||||||
| 32 | Certifications pursuant to Section 906 of the Sarbanes-Oxley Act of 2002 |
Filed herewith
|
||||||||||||
| 101.INS | XBRL Instance Document — the instance document does not appear in the Interactive Data File because its XBRL tags are embedded within the Inline XBRL Document | Filed herewith | ||||||||||||
| 101.SCH | XBRL Taxonomy Extension Schema Document | Filed herewith | ||||||||||||
| 101.CAL | XBRL Taxonomy Extension Calculation Linkbase Document | Filed herewith | ||||||||||||
| 101.DEF | XBRL Taxonomy Extension Definition Linkbase Document | Filed herewith | ||||||||||||
| 101.LAB | XBRL Taxonomy Extension Label Linkbase Document | Filed herewith | ||||||||||||
| 101.PRE | XBRL Taxonomy Extension Presentation Linkbase Document | Filed herewith | ||||||||||||
W. P. Carey 9/30/2022 10-Q
–
75
SIGNATURES
Pursuant to the requirements of Section 13 or 15(d) of the Securities Exchange Act of 1934, the registrant has duly caused this Report to be signed on its behalf by the undersigned, thereunto duly authorized.
| W. P. Carey Inc. | |||||||||||
| Date: | November 4, 2022 | ||||||||||
| By: | /s/ ToniAnn Sanzone | ||||||||||
| ToniAnn Sanzone | |||||||||||
| Chief Financial Officer | |||||||||||
| (Principal Financial Officer) | |||||||||||
| Date: | November 4, 2022 | ||||||||||
| By: | /s/ Arjun Mahalingam | ||||||||||
| Arjun Mahalingam | |||||||||||
| Chief Accounting Officer | |||||||||||
| (Principal Accounting Officer) | |||||||||||
W. P. Carey 9/30/2022 10-Q
–
76
EXHIBIT INDEX
The following exhibits are filed with this Report. Documents other than those designated as being filed herewith are incorporated herein by reference.
| Exhibit No. | Description | Method of Filing | ||||||||||||
| 4.1 | Form of Note Representing €150,000,000 Aggregate Principal Amount of 3.41% Senior Notes due 2029 | |||||||||||||
| 4.2 | Form of Note Representing €200,000,000 Aggregate Principal Amount of 3.70% Senior Notes due 2032 | |||||||||||||
| 10.1 | Note Purchase Agreement, dated August 31, 2022, by and among W. P. Carey Inc. and the purchasers listed in the purchaser schedule thereto | |||||||||||||
| 31.1 | Certification pursuant to Section 302 of the Sarbanes-Oxley Act of 2002 | |||||||||||||
| 31.2 | Certification pursuant to Section 302 of the Sarbanes-Oxley Act of 2002 | |||||||||||||
| 32 | Certifications pursuant to Section 906 of the Sarbanes-Oxley Act of 2002 | |||||||||||||
| 101.INS | XBRL Instance Document — the instance document does not appear in the Interactive Data File because its XBRL tags are embedded within the Inline XBRL Document | Filed herewith | ||||||||||||
| 101.SCH | XBRL Taxonomy Extension Schema Document | Filed herewith | ||||||||||||
| 101.CAL | XBRL Taxonomy Extension Calculation Linkbase Document | Filed herewith | ||||||||||||
| 101.DEF | XBRL Taxonomy Extension Definition Linkbase Document | Filed herewith | ||||||||||||
| 101.LAB | XBRL Taxonomy Extension Label Linkbase Document | Filed herewith | ||||||||||||
| 101.PRE | XBRL Taxonomy Extension Presentation Linkbase Document | Filed herewith | ||||||||||||
TABLE OF CONTENTS
Part I Financial InformationItem 1. Financial StatementsNote 1. Business and OrganizationNote 2. Basis Of PresentationNote 3. Merger with Cpa:18 GlobalNote 4. Agreements and Transactions with Related PartiesNote 5. Land, Buildings and Improvements and Assets Held For SaleNote 6. Finance ReceivablesNote 7. Goodwill and Other IntangiblesNote 8. Equity Method InvestmentsNote 9. Fair Value MeasurementsNote 10. Risk Management and Use Of Derivative Financial InstrumentsNote 11. DebtNote 12. Commitments and ContingenciesNote 13. Stock-based Compensation and EquityNote 14. Income TaxesNote 15. Property DispositionsNote 16. Segment ReportingNote 17. Subsequent EventsItem 2. Management S Discussion and Analysis Of Financial Condition and Results Of OperationsItem 2. Management S Discussion and Analysis Of Financial Condition and ResultsItem 3. Quantitative and Qualitative Disclosures About Market RiskItem 4. Controls and ProceduresPart II Other InformationItem 6. Exhibits