WORLD ACCEPTANCE CORP
10-Ks and 10-Qs
|
|
|
|
|
|
|
|
|
|
|
|
|
|
|
|
|
|
|
|
|
|
|
|
|
|
|
|
|
|
|
|
|
|
|
|
|
|
|
|
|
|
|
|
|
|
|
|
|
|
|
|
|
|
|
|
|
|
|
|
|
|
UNITED STATES
SECURITIES AND EXCHANGE COMMISSION
WASHINGTON, D.C. 20549
__________________________________
Form 10-K
__________________________________
(Mark One)
|
x
|
ANNUAL REPORT PURSUANT TO SECTION 13 OR 15(d) OF THE SECURITIES EXCHANGE ACT OF 1934
|
For the fiscal year ended:
March 31, 2018
OR
|
o
|
TRANSITION REPORT PURSUANT TO SECTION 13 OR 15(d) OF THE SECURITIES EXCHANGE ACT OF 1934
|
For the transition period from _______________ to _____________
Commission file number:
000-19599
|
WORLD ACCEPTANCE CORPORATION
|
|
(Exact name of registrant as specified in its charter)
|
|
South Carolina
|
|
570425114
|
||
|
(State or other jurisdiction of incorporation or organization)
|
|
(I.R.S. Employer Identification No.)
|
||
|
|
|
|
||
|
108 Frederick Street
|
|
|
||
|
Greenville, South Carolina
|
|
29607
|
||
|
(Address of principal executive offices)
|
|
(Zip Code)
|
||
|
(864) 298-9800
|
||
|
(Registrant's telephone number, including area code)
|
||
SECURITIES REGISTERED PURSUANT TO SECTION 12(b) OF THE ACT:
|
Title of Each Class
|
|
Name of Each Exchange on Which Registered
|
||
|
Common Stock, no par value
|
|
The NASDAQ Stock Market LLC
|
||
|
|
|
(NASDAQ Global Select Market)
|
||
SECURITIES REGISTERED PURSUANT TO SECTION 12(g) OF THE ACT: NONE
Indicate by check mark if the registrant is a well-known seasoned issuer, as defined in Rule 405 of the Securities Act. Yes
o
No
x
Indicate by check mark if the registrant is not required to file reports pursuant to Section 13 or Section 15(d) of the Exchange Act. Yes
o
No
x
Indicate by check mark whether the registrant (1) has filed all reports required to be filed by Section 13 or Section 15(d) of the Securities Exchange Act of 1934 during the preceding 12 months (or for such shorter period that the Registrant was required to file such reports), and (2) has been subject to such filing requirements for the past 90 days. Yes
x
No
o
Indicate by check mark whether the registrant has submitted electronically and posted on its corporate Web site, if any, every Interactive Data File required to be submitted and posted pursuant to Rule 405 of Regulation S-T during the preceding 12 months (or for such shorter period that the registrant was required to submit and post such files). Yes
x
No
o
Indicate by check mark if disclosure of delinquent filers pursuant to Item 405 of Regulation S-K is not contained herein, and will not be contained, to the best of registrant’s knowledge, in definitive proxy or information statements incorporated by reference in Part III of this Form 10-K or any amendment to this Form 10-K.
o
Indicate by check mark whether the registrant is a large accelerated filer, an accelerated filer, a non-accelerated filer, a smaller reporting company, or an emerging growth company. See the definitions of “large accelerated filer,” “accelerated filer,” “smaller reporting company,” and "emerging growth company" in Rule 12b-2 of the Exchange Act. (Check One):
|
|
Large Accelerated filer
o
|
Accelerated filer
x
|
|
|
|
|
|
|
|
|
Non-accelerated filer
o
|
Smaller reporting company
o
|
|
|
(Do not check if smaller reporting company)
|
|||
|
Emerging growth company
o
|
|||
If an emerging growth company, indicate by check mark if registrant has elected not to use the extended transition period for complying with any new or revised financial accounting standards provided pursuant to Section 13(a) of the Exchange Act.
o
Indicate by check mark whether the registrant is a shell company (as defined in Rule 12b-2 of the Exchange Act).
Yes
o
No
x
The aggregate market value of voting stock held by non-affiliates of the registrant as of
September 30, 2017
, computed by reference to the closing sale price on such date, was
$491,713,593
. (For purposes of calculating this amount only, all directors and executive officers are treated as affiliates. This determination of affiliate status is not necessarily a conclusive determination for other purposes.) As of
May 25, 2018
,
9,128,869
shares of the registrant’s Common Stock, no par value, were outstanding.
DOCUMENTS INCORPORATED BY REFERENCE
Portions of the Registrant's definitive Proxy Statement pertaining to the
2018
Annual Meeting of Shareholders ("the Proxy Statement") and filed pursuant to Regulation 14A are incorporated herein by reference into Part III hereof.
|
|
WORLD ACCEPTANCE CORPORATION
Form 10-K
Table of Contents
|
Item No.
|
Page
|
|
|
|
|
|
|
PART I
|
|
|
|
|
|
|
|
1.
|
||
|
|
|
|
|
1A.
|
||
|
|
|
|
|
1B.
|
||
|
|
|
|
|
2.
|
||
|
|
|
|
|
3.
|
||
|
|
|
|
|
4.
|
||
|
|
|
|
|
PART II
|
|
|
|
|
|
|
|
5.
|
||
|
|
|
|
|
6.
|
||
|
|
|
|
|
7.
|
||
|
|
|
|
|
7A.
|
||
|
|
|
|
|
8.
|
||
|
|
|
|
|
9.
|
||
|
|
|
|
|
9A.
|
||
|
|
|
|
|
9B.
|
||
|
|
|
|
|
PART III
|
|
|
|
|
|
|
|
10.
|
||
|
|
|
|
|
11.
|
||
|
|
|
|
|
12.
|
||
|
|
|
|
|
13.
|
||
|
|
|
|
|
14.
|
||
|
|
|
|
|
PART IV
|
|
|
|
|
|
|
|
15.
|
||
|
16.
|
||
|
EXHIBIT INDEX
|
||
|
SIGNATURES
|
||
Introduction
World Acceptance Corporation, a South Carolina corporation, operates a small-loan consumer finance (installment loan) business in
fifteen
states and Mexico as of
March 31, 2018
. As used herein, the "Company,” “we,” “our,” “us,” or similar formulations include World Acceptance Corporation and each of its subsidiaries, except as the context otherwise requires. All references in this report to “fiscal
2019
” are to the Company’s fiscal year that will end on March 31,
2019
; all references in this report to "fiscal
2018
" are to the Company's fiscal year ended
March 31, 2018
; all references to “fiscal
2017
” are to the Company’s fiscal year ended March 31,
2017
; and all references to “fiscal
2016
” are to the Company’s fiscal year ended March 31,
2016
.
The Company maintains an Internet website, “www.LoansByWorld.com,” where interested persons will be able to access free of charge, among other information, the Company’s annual reports on Form 10-K, its quarterly reports on Form 10-Q, and its current reports on Form 8-K as well as amendments to these filings via a link to a third party website. These documents are available for access as soon as reasonably practicable after we electronically file these documents with the Securities and Exchange Commission (“SEC”). The Company files these reports with the SEC via the SEC’s EDGAR filing system, and such reports also may be accessed via the SEC’s EDGAR database at
www.sec.gov
. The Company will also provide either electronic or paper copies free of charge upon written request to P.O. Box 6429, Greenville, SC 29606-6429. Information included on or linked to our website is not incorporated by reference into this annual report.
|
Item 1.
|
Description of Business
|
General.
The Company was incorporated under the laws of South Carolina on February 22, 1973 and is now one of the nation's largest small-loan consumer finance companies, offering short-term small installment loans, medium-term larger installment loans, related credit insurance and ancillary products and services to individuals. The Company offers standardized installment loans generally between
$300
and
$4,000
through
1,308
branches in Alabama, Georgia, Idaho, Illinois, Indiana, Kentucky, Louisiana, Mississippi, Missouri, New Mexico, Oklahoma, South Carolina, Texas, Tennessee, Wisconsin and Mexico as of
March 31, 2018
. The Company generally serves individuals with limited access to other sources of consumer credit such as banks, credit unions, other consumer finance businesses and credit card lenders. In our U.S. branches the Company also offers income tax return preparation services to its loan customers and other individuals.
The small-loan consumer finance industry is a highly fragmented segment of the consumer lending industry. Small-loan consumer finance companies generally make loans to individuals of less than $2,000 with maturities of less than 18 months. These companies approve loans on the basis of the personal creditworthiness of their customers and maintain close contact with borrowers to encourage the repayment or, when appropriate to meet the borrower’s needs, the refinancing of loans. By contrast, commercial banks, credit unions and other consumer finance businesses typically make loans of more than $5,000 with maturities of greater than one year. Those financial institutions generally approve consumer loans on the security of qualifying personal property pledged as collateral or impose more stringent credit requirements than those of small-loan consumer finance companies. As a result of their higher credit standards and specific collateral requirements, commercial banks, savings and loans and other consumer finance businesses typically charge lower interest rates and fees and experience lower delinquency and charge-off rates than do small-loan consumer finance companies. Small-loan consumer finance companies generally charge higher interest rates and fees to compensate for the greater credit risk of delinquencies and charge-offs and increased loan administration and collection costs.
The majority of the participants in the industry are independent operators with generally less than 100 branches. We believe that competition between small-loan consumer finance companies occurs primarily on the basis of the strength of customer relationships, customer service and reputation in the local community rather than pricing, as participants in this industry generally charge interest rates and fees at, or close to, the maximum permitted by applicable state laws. We believe that our relatively large size affords us a competitive advantage over smaller companies by increasing our access to, and reducing our cost of capital.
2
Small-loan consumer finance companies are subject to extensive regulation, supervision and licensing under various federal and state statutes, ordinances and regulations. Consumer loan offices are licensed under state laws which, in many states, establish maximum loan amounts and interest rates and the types and maximum amounts of fees and other charges. In addition, state laws govern other aspects of the operation of small-loan consumer finance companies. Periodically, constituencies within states seek to enact stricter regulations that would affect our business. Furthermore, the industry is subject to numerous federal laws and regulations that affect lending operations. These federal laws require companies to provide complete disclosure of the principal terms of each loan to the borrower in accordance with specified standards prior to the consummation of the loan transaction. Federal laws also prohibit misleading advertising, protect against discriminatory lending practices and proscribe unfair, deceptive or abusive credit practices.
Expansion.
During fiscal
2018
, the Company opened
30
new branches, purchased
5
branches, and merged or consolidated
21
branches into existing branches due to their inability to grow to profitable levels. The Company also closed
33
branches belonging to its payroll deduct business in Mexico. In fiscal
2019
, the Company currently plans to open or acquire approximately
25
new branches in the United States by increasing the number of branches in its existing market areas or commencing operations in new states where it believes demographic profiles and state regulations are attractive. The Company may merge other branches on a case-by-case basis based on profitability or other factors. The Company's ability to continue existing operations and expand its operations in existing or new states is dependent upon, among other things, laws and regulations that permit the Company to operate its business profitably and its ability to obtain necessary regulatory approvals and licenses; however, there can be no assurance that such laws and regulations will not change in ways that adversely affect the Company or that the Company will be able to obtain any such approvals or consents. The Company currently does not plan to expand its operations in Mexico significantly. See Part 1, Item 1A, “Risk Factors” for a further discussion of risks to our business and plans for expansion.
The Company's expansion is also dependent upon its ability to identify attractive locations for new branches and to hire suitable personnel to staff, manage and supervise new branches. In evaluating a particular community, the Company examines several factors, including the demographic profile of the community, the existence of an established small-loan consumer finance market and the availability of suitable personnel. The Company generally locates new branches in communities already served by at least one other small-loan consumer finance company.
The following table sets forth the number of branches of the Company at the dates indicated:
|
|
At March 31,
|
|||||||||||||||||||
|
State
|
2018
|
2017
|
2016
|
2015
|
2014
|
2013
|
2012
|
2011
|
2010
|
2009
|
||||||||||
|
South Carolina
|
97
|
92
|
96
|
99
|
101
|
98
|
97
|
97
|
95
|
93
|
||||||||||
|
Georgia
|
123
|
125
|
114
|
113
|
110
|
108
|
105
|
103
|
101
|
100
|
||||||||||
|
Texas
|
291
|
291
|
300
|
300
|
297
|
279
|
262
|
247
|
229
|
223
|
||||||||||
|
Oklahoma
|
71
|
74
|
82
|
83
|
83
|
82
|
82
|
82
|
82
|
80
|
||||||||||
|
Louisiana
|
47
|
47
|
48
|
49
|
48
|
47
|
44
|
40
|
38
|
38
|
||||||||||
|
Tennessee
|
105
|
104
|
106
|
107
|
105
|
105
|
105
|
103
|
95
|
92
|
||||||||||
|
Illinois
|
82
|
80
|
82
|
82
|
82
|
81
|
75
|
68
|
64
|
61
|
||||||||||
|
Missouri
|
76
|
75
|
77
|
78
|
76
|
76
|
72
|
66
|
62
|
57
|
||||||||||
|
New Mexico
|
38
|
39
|
42
|
44
|
44
|
44
|
44
|
44
|
39
|
37
|
||||||||||
|
Kentucky
|
78
|
77
|
79
|
79
|
76
|
71
|
70
|
66
|
61
|
58
|
||||||||||
|
Alabama
|
65
|
65
|
69
|
68
|
68
|
64
|
62
|
51
|
44
|
42
|
||||||||||
|
Wisconsin
(1)
|
27
|
30
|
29
|
28
|
26
|
21
|
14
|
5
|
—
|
—
|
||||||||||
|
Indiana
(2)
|
32
|
29
|
25
|
22
|
17
|
8
|
—
|
—
|
—
|
—
|
||||||||||
|
Mississippi
(3)
|
25
|
20
|
20
|
12
|
5
|
—
|
—
|
—
|
—
|
—
|
||||||||||
|
Idaho
(4)
|
20
|
21
|
17
|
8
|
—
|
—
|
—
|
—
|
—
|
—
|
||||||||||
|
Mexico
(5)
|
131
|
158
|
153
|
148
|
133
|
119
|
105
|
95
|
80
|
63
|
||||||||||
|
Total
|
1,308
|
1,327
|
1,339
|
1,320
|
1,271
|
1,203
|
1,137
|
1,067
|
990
|
944
|
||||||||||
_______________________________________________________
(1)
The Company commenced operations in Wisconsin in December 2010.
(2)
The Company commenced operations in Indiana in September 2012.
(3)
The Company commenced operations in Mississippi in September 2013.
(4)
The Company commenced operations in Idaho in October 2014.
(5)
The Company stopped originations of payroll deduct "Viva" loans in fiscal 2018.
3
Loan and Other Products.
In each state in which we operate, as well as in Mexico, we primarily offer pre-computed consumer installment loans that are standardized by amount and maturity. Consumer installment loans are our principal product and interest and fee income from such loans accounted for
87.8%
,
88.2%
and
88.8%
of our total revenues in fiscal years
2018
,
2017
and
2016
, respectively. Our loans are payable in fully-amortizing monthly installments with terms generally from
6
to
36
months and are prepayable at any time without penalty.
The following table sets forth information about our loan products for fiscal
2018
:
|
Minimum Origination
(USD)
|
Maximum Origination
(USD)
|
Minimum Term
(Months)
|
Maximum Term
(Months)
|
||||||||||
|
Small loans (U.S.)
|
$
|
200.00
|
|
$
|
2,499.00
|
|
3
|
|
25
|
|
|||
|
Large loans (U.S.)
|
2,500.00
|
|
21,600.00
|
|
12
|
|
48
|
|
|||||
|
Payroll deduct "Viva" loans (Mexico)
(1)
|
165.23
|
|
11,015.16
|
|
12
|
|
120
|
|
|||||
|
Traditional installment loans (Mexico)
|
220.30
|
|
1,101.52
|
|
12
|
|
18
|
|
|||||
_______________________________________________________
(1)
The Company stopped originations of this loan product in fiscal 2018.
Specific allowable interest, fees and other charges vary by state and, consistent with industry practice, we generally charge at, or close to, the maximum rates allowable under applicable state law in those states that limit loan rates. The finance charge is a combination of origination or acquisition fees, account maintenance fees, monthly account handling fees, interest and other charges permitted by the relevant state laws. As of
March 31, 2018
, the annual percentage rates on loans we offer in the U.S., including interest, fees and other charges as calculated in accordance with the Federal Truth in Lending Act, ranged from 25% to 199%, depending on the loan size, maturity and the state in which the loan was made.
As of March 31,
2018
, annual percentage rates applicable to our gross loans receivable as defined by the Truth in Lending Act were as follows:
|
Low
|
High
|
US
|
Mexico
|
Total
|
Percentage of total
gross loans
receivable
|
||||||||||||||
|
25
|
%
|
36
|
%
|
$
|
269,855,271
|
|
$
|
—
|
|
$
|
269,855,271
|
|
24.3
|
%
|
|||||
|
37
|
%
|
50
|
%
|
$
|
235,761,364
|
|
$
|
4,941,904
|
|
240,703,268
|
|
21.8
|
%
|
||||||
|
51
|
%
|
60
|
%
|
$
|
133,802,272
|
|
$
|
23,105,858
|
|
156,908,130
|
|
14.2
|
%
|
||||||
|
61
|
%
|
70
|
%
|
$
|
53,847,775
|
|
$
|
12,217,949
|
|
66,065,724
|
|
6.0
|
%
|
||||||
|
71
|
%
|
80
|
%
|
$
|
48,130,233
|
|
$
|
8,868,115
|
|
56,998,348
|
|
5.2
|
%
|
||||||
|
81
|
%
|
90
|
%
|
$
|
35,888,283
|
|
$
|
2,762,325
|
|
38,650,608
|
|
3.5
|
%
|
||||||
|
91
|
%
|
100
|
%
|
$
|
143,054,907
|
|
$
|
4,241,645
|
|
147,296,552
|
|
13.3
|
%
|
||||||
|
101
|
%
|
120
|
%
|
$
|
65,060,715
|
|
$
|
27,432,755
|
|
92,493,470
|
|
8.4
|
%
|
||||||
|
121
|
%
|
150
|
%
|
$
|
18,175,906
|
|
$
|
17,311,083
|
|
35,486,989
|
|
3.2
|
%
|
||||||
|
151
|
%
|
199
|
%
|
$
|
656,432
|
|
$
|
—
|
|
656,432
|
|
0.1
|
%
|
||||||
|
|
|
|
|
$
|
1,004,233,158
|
|
$
|
100,881,634
|
|
$
|
1,105,114,792
|
|
100
|
%
|
|||||
The Company, as an agent for an unaffiliated insurance company, markets and sells credit life, credit accident and health, credit property, and unemployment insurance in connection with its loans in selected states where the sale of such insurance is permitted by law. Credit life insurance provides for the payment in full of the borrower's credit obligation to the lender in the event of death. Credit accident and health insurance provides for repayment of loan installments to the lender that come due during the insured's period of income interruption resulting from disability from illness or injury. Credit property insurance insures payment of the borrower's credit obligation to the lender in the event that the personal property pledged as security by the borrower is damaged or destroyed by a covered event. Unemployment insurance provides for repayment of loan installments to the lender that come due during the insured’s period of involuntary unemployment. The Company offers credit insurance for all loans originated in South Carolina, Georgia, Louisiana, Missouri, Kentucky, Indiana, and Mississippi and on a more limited basis in Texas, Oklahoma, Tennessee, and Alabama. Customers in those states typically obtain such credit insurance through the Company. Charges for such credit insurance are made at filed, authorized rates and are stated separately in the Company's disclosure to customers, as required by the Truth in Lending Act and by various applicable state laws. In the sale of insurance policies, the
4
Company, as an agent, writes policies only within limitations established by its agency contracts with the insurer. The Company does not sell credit insurance to non-borrowers.
The Company also offers automobile club memberships to its borrowers in Georgia, Texas, Louisiana, Tennessee, Missouri, Kentucky, Alabama, Wisconsin, Indiana, and Mississippi as an agent for an unaffiliated automobile club. Club memberships entitle members to automobile breakdown coverage, towing reimbursement and related services. The Company is paid a commission on each membership sold, but has no responsibility for administering the club, paying benefits or providing services to club members. The Company does not currently market automobile club memberships to non-borrowers but occasionally sells memberships to non-borrowers.
The table below shows the types of insurance and ancillary products the Company offers by state as of
March 31, 2018
:
|
|
Credit Life
|
Credit Accident
and Health
|
Credit Property and Auto
|
Unemployment
|
Automobile Club
Membership
|
|
South Carolina
|
X
|
X
|
X
|
X
|
|
|
Georgia
|
X
|
X
|
X
|
|
X
|
|
Texas
(1)
|
X
|
X
|
X
|
X
|
X
|
|
Oklahoma
(1)
|
X
|
X
|
X
|
X
|
|
|
Louisiana
|
X
|
X
|
X
|
|
X
|
|
Tennessee
(1)
|
X
|
X
|
X
|
X
|
X
|
|
Illinois
|
|
|
|
|
|
|
Missouri
|
X
|
X
|
|
X
|
X
|
|
New Mexico
|
|
|
|||
|
Kentucky
|
X
|
X
|
X
|
X
|
X
|
|
Alabama
(1)
|
X
|
X
|
X
|
|
X
|
|
Wisconsin
|
|
|
|
|
X
|
|
Indiana
|
X
|
X
|
X
|
X
|
X
|
|
Mississippi
|
X
|
X
|
X
|
X
|
|
|
Idaho
|
|||||
_______________________________________________________
(1)
Credit insurance is offered for certain loans.
Another service offered by the Company is income tax return preparation and electronic filing. This program is provided in all but a few of the Company’s U.S. branches. The Company prepared approximately
77,000
,
72,000
and
63,000
returns in fiscal years
2018
,
2017
and
2016
, respectively. Net revenue generated by the Company from this program during fiscal
2018
,
2017
and
2016
amounted to approximately
$16.8 million
,
$14.7 million
and
$11.9 million
, respectively. The Company believes that this is a beneficial service for its existing customer base as well as non-loan customers, and it plans to continue to promote this program.
Prior to the third quarter of fiscal 2015, the Company's World Class Buying Club program offered certain electronic products and appliances to its borrowers in Texas, Georgia, Tennessee, New Mexico, and Missouri. Borrowers participating in this program could purchase a product from a limited selection of items maintained in the branches or offered through a catalog available at a branch and could finance the purchase with a retail installment sales contract provided by the Company. Other than the limited product samples maintained in the branches, products sold through this program were shipped directly by the suppliers to the Company's customers, and accordingly, the Company was not required to maintain a large inventory to support the program. The Company decided to wind down the World Class Buying Club program during our fiscal 2015 third quarter. As of March 31, 2015, the Company no longer finances the purchase of products through the program. We will continue to service the approximately
$2.2 thousand
in outstanding retail installment sales contracts.
5
Loan Receivables.
The following table sets forth the composition of the Company's gross loans receivable by state at March 31 of each year from
2009
through
2018
:
|
|
At March 31,
|
|||||||||||||||||||||||||||||
|
State
|
2018
|
2017
|
2016
|
2015
|
2014
|
2013
|
2012
|
2011
|
2010
|
2009
|
||||||||||||||||||||
|
South Carolina
|
9
|
%
|
9
|
%
|
9
|
%
|
10
|
%
|
11
|
%
|
11
|
%
|
11
|
%
|
12
|
%
|
12
|
%
|
11
|
%
|
||||||||||
|
Georgia
|
13
|
|
13
|
|
12
|
|
12
|
|
12
|
|
13
|
|
13
|
|
13
|
|
14
|
|
14
|
|
||||||||||
|
Texas
|
17
|
|
16
|
|
17
|
|
18
|
|
19
|
|
19
|
|
19
|
|
19
|
|
20
|
|
21
|
|
||||||||||
|
Oklahoma
|
6
|
|
6
|
|
7
|
|
7
|
|
6
|
|
6
|
|
6
|
|
7
|
|
6
|
|
6
|
|
||||||||||
|
Louisiana
|
2
|
|
2
|
|
2
|
|
2
|
|
2
|
|
2
|
|
2
|
|
2
|
|
2
|
|
3
|
|
||||||||||
|
Tennessee
|
12
|
|
12
|
|
12
|
|
12
|
|
12
|
|
13
|
|
14
|
|
14
|
|
14
|
|
14
|
|
||||||||||
|
Illinois
|
6
|
|
6
|
|
6
|
|
6
|
|
7
|
|
6
|
|
7
|
|
6
|
|
6
|
|
6
|
|
||||||||||
|
Missouri
|
6
|
|
6
|
|
7
|
|
7
|
|
6
|
|
6
|
|
6
|
|
6
|
|
6
|
|
6
|
|
||||||||||
|
New Mexico
|
2
|
|
2
|
|
2
|
|
2
|
|
2
|
|
2
|
|
2
|
|
2
|
|
3
|
|
3
|
|
||||||||||
|
Kentucky
|
8
|
|
9
|
|
9
|
|
9
|
|
8
|
|
9
|
|
9
|
|
9
|
|
9
|
|
9
|
|
||||||||||
|
Alabama
|
5
|
|
4
|
|
5
|
|
5
|
|
4
|
|
4
|
|
4
|
|
4
|
|
4
|
|
4
|
|
||||||||||
|
Wisconsin
(1)
|
2
|
|
1
|
|
1
|
|
1
|
|
1
|
|
1
|
|
1
|
|
—
|
|
—
|
|
—
|
|
||||||||||
|
Indiana
(2)
|
2
|
|
2
|
|
1
|
|
1
|
|
1
|
|
—
|
|
—
|
|
—
|
|
—
|
|
—
|
|
||||||||||
|
Mississippi
(3)
|
1
|
|
1
|
|
—
|
|
—
|
|
—
|
|
—
|
|
—
|
|
—
|
|
—
|
|
—
|
|
||||||||||
|
Idaho
(4)
|
—
|
|
—
|
|
—
|
|
—
|
|
—
|
|
—
|
|
—
|
|
—
|
|
—
|
|
—
|
|
||||||||||
|
Mexico
|
9
|
|
11
|
|
10
|
|
8
|
|
9
|
|
8
|
|
6
|
|
6
|
|
4
|
|
3
|
|
||||||||||
|
Total
|
100
|
%
|
100
|
%
|
100
|
%
|
100
|
%
|
100
|
%
|
100
|
%
|
100
|
%
|
100
|
%
|
100
|
%
|
100
|
%
|
||||||||||
_______________________________________________________
(1)
The Company commenced operations in Wisconsin in December 2010.
(2)
The Company commenced operations in Indiana in September 2012.
(3)
The Company commenced operations in Mississippi in September 2013.
(4)
The Company commenced operations in Idaho in October 2014.
6
The following table sets forth the total number of loans, the average loan balance and the gross loan balance by state at
March 31, 2018
:
|
|
Total Number
of Loans
|
Average Gross Loan Balance (thousands)
|
Gross Loan Balance (thousands)
|
|||||||
|
South Carolina
|
74,838
|
|
$
|
1,280
|
|
$
|
95,778
|
|
||
|
Georgia
|
92,325
|
|
1,531
|
|
141,316
|
|
||||
|
Texas
|
204,692
|
|
945
|
|
193,419
|
|
||||
|
Oklahoma
|
50,458
|
|
1,340
|
|
67,592
|
|
||||
|
Louisiana
|
25,997
|
|
888
|
|
23,090
|
|
||||
|
Tennessee
|
88,245
|
|
1,471
|
|
129,806
|
|
||||
|
Illinois
|
43,197
|
|
1,594
|
|
68,873
|
|
||||
|
Missouri
|
39,957
|
|
1,775
|
|
70,920
|
|
||||
|
New Mexico
|
19,830
|
|
1,013
|
|
20,085
|
|
||||
|
Kentucky
|
58,425
|
|
1,552
|
|
90,684
|
|
||||
|
Alabama
|
49,950
|
|
1,041
|
|
51,988
|
|
||||
|
Wisconsin
|
13,200
|
|
1,307
|
|
17,248
|
|
||||
|
Indiana
|
15,837
|
|
1,232
|
|
19,507
|
|
||||
|
Mississippi
|
13,170
|
|
672
|
|
8,849
|
|
||||
|
Idaho
|
6,857
|
|
741
|
|
5,078
|
|
||||
|
Mexico
|
156,075
|
|
646
|
|
100,882
|
|
||||
|
Total
|
953,053
|
|
$
|
1,160
|
|
$
|
1,105,115
|
|
||
The following table sets forth the amounts and percentages of our total revenues from customers in the United States and from customers in Mexico.
|
Year ended March 31,
|
||||||||||||||||
|
2018
|
2017
|
2016
|
||||||||||||||
|
United States
|
91.6
|
%
|
$
|
502,668,332
|
|
92.3
|
%
|
490,821,420
|
|
92.4
|
%
|
515,300,873
|
|
|||
|
Mexico
|
8.4
|
%
|
$
|
46,037,802
|
|
7.7
|
%
|
40,913,304
|
|
7.6
|
%
|
42,174,834
|
|
|||
For information regarding potential risks associated with the Company’s operations in Mexico, see Part I, Item 1A, “Risk Factors—We may be exposed to liabilities under the FCPA, and any determination that the Company or any of its subsidiaries has violated the FCPA could have a material adverse effect on our business and liquidity,” “—Our internal investigation of our operations in Mexico may expose the Company to other potential liabilities in addition to any potential liabilities under the FCPA and cause the Company to incur substantial expenses," "—Our operations in Mexico are subject to the risks inherent in conducting operations internationally and in Mexico and could contribute materially to increased costs and negatively affect our business, prospects, results of operations and financial condition,” and “—Our use of derivatives exposes us to credit and market risk,” as well as Part II, Item 7A, “Quantitative and Qualitative Disclosures about Market Risk—Foreign Currency Exchange Rate Risk.” For additional financial information regarding our two reportable segments, refer to Note 17—Segments in Item 8, “Financial Statements and Supplementary Data” of this Annual Report on Form 10-K.
Seasonality
. The Company's highest loan demand occurs generally from October through December, its third fiscal quarter. Loan demand is generally lowest and loan repayment highest from January to March, its fourth fiscal quarter. Consequently, the Company experiences significant seasonal fluctuations in its operating results and cash needs. Operating results for the Company's third fiscal quarter are generally lower than in other quarters, and operating results for its fourth fiscal quarter are generally higher than in other quarters.
Lending and Collection Operations.
The Company seeks to provide short-term consumer installment loans to the segment of the population that has limited access to other sources of credit. In evaluating the creditworthiness of potential customers, the Company primarily examines the individual's discretionary income, length of current employment and/or sources of income, duration of
7
residence, and prior credit experience. Loans are made to individuals on the basis of their discretionary income and other factors and are limited to amounts we believe that customers can reasonably be expected to repay from that income given our assessment of their stability, ability and willingness to pay. All loan applicants are required to complete standardized credit applications in person or by telephone at local Company branches. Each of the Company's local branches are equipped to perform rapid background, employment and credit checks and approve loan applications promptly, often while the customer waits. The Company's employees verify the applicant's sources of income and credit histories through telephone checks with employers, other employment references and verification with various credit bureaus. Substantially all new customers are required to submit a listing of personal property that will serve as collateral to secure the loan, but the Company does not rely on the value of such collateral in the loan approval process and generally does not perfect its security interest in that collateral. Accordingly, if the customer were to default in the repayment of the loan, the Company may not be able to recover the outstanding loan balance by resorting to the sale of collateral.
The Company believes that development and continual reinforcement of personal relationships with customers improve the Company's ability to monitor their creditworthiness, reduce credit risk and generate customer loyalty. It is not unusual for the Company to have made a number of loans to the same customer over the course of several years, many of which were refinanced with a new loan after the borrower had reduced the existing loan's outstanding balance by making multiple payments. In determining whether to refinance existing loans, the Company typically requires loans to be current on a recency basis, and repeat customers are generally required to complete a new credit application if they have not completed one within the prior two years.
In fiscal
2018
, approximately
79.0%
of the Company's loans were generated through refinancings of outstanding loans and the origination of new loans to previous customers. A refinancing represents a new loan transaction with a present customer in which a portion of the new loan proceeds is used to repay the balance of an existing loan and the remaining portion is advanced to the customer. The Company markets the opportunity for qualifying customers to refinance existing loans prior to maturity. In many cases the existing customer’s past performance and established creditworthiness with the Company qualifies that customer for a larger loan. This, in turn, may increase the fees and other income realized for a particular customer. For fiscal
2018
,
2017
and
2016
, the percentages of the Company's loan originations that were refinancings of existing loans were
65.9%
,
66.8%
and
69.4%
, respectively.
The Company allows refinancing of delinquent loans on a case-by-case basis for those customers who otherwise satisfy the Company's credit standards. Each such refinancing is carefully examined before approval in an effort to avoid increasing credit risk. A delinquent loan generally may be refinanced only if the customer has made payments that, together with any credits of insurance premiums or other charges to which the customer is entitled in connection with the refinancing, reduce the balance due on the loan to an amount equal to or less than the original cash advance made in connection with the loan. The Company does not allow the amount of the new loan to exceed the original amount of the existing loan. The Company believes that refinancing delinquent loans for certain customers who have made periodic payments allows the Company to increase its average loans outstanding and its interest, fees and other income without experiencing a significant increase in loan losses. These refinancings also provide a resolution to temporary financial setbacks for these borrowers and sustain their credit rating. Because they are allowed on a selective basis only, refinancings of delinquent loans represented
1.1%
of the Company’s loan volume in fiscal
2018
.
To reduce late payment risk, local branch staff encourage customers to inform the Company in advance of expected payment problems. Local branch staff also promptly contact delinquent customers following any payment due date and thereafter remain in close contact with such customers through phone calls or letters until payment is received or some other resolution is reached. The Company expanded our centralized collections in fiscal 2018, focusing on customers who have become more than 90 days past due on a recency basis. In Georgia, Oklahoma, Illinois, Missouri, Tennessee, Alabama, Louisiana, New Mexico, Wisconsin, Kentucky, Indiana and Idaho the Company is permitted under state laws to garnish customers' wages for repayment of loans, but the Company does not otherwise generally resort to litigation for collection purposes and rarely attempts to foreclose on collateral.
Insurance-related Operations.
In certain states, the Company sells credit insurance to customers in connection with its loans as an agent for an unaffiliated insurance company. These insurance policies provide for the payment of the outstanding balance of the Company's loan upon the occurrence of an insured event. The Company earns a commission on the sale of such credit insurance, which, for most products, is directly impacted by the claims experience of the insurance company on policies sold on its behalf by the Company. In states where commissions on certain products are capped, the commission earned is not directly impacted by the claims experience.
The Company has a wholly-owned, captive insurance subsidiary that reinsures a portion of the credit insurance sold in connection with loans made by the Company. Certain coverages currently sold by the Company on behalf of the unaffiliated insurance carrier are ceded by the carrier to the captive insurance subsidiary, providing the Company with an additional source of income derived from the earned reinsurance premiums. In fiscal
2018
, the captive insurance subsidiary reinsured approximately
12.0%
of the credit insurance sold by the Company and contributed approximately
$2.1 million
to the Company's total revenue.
8
Non-Filing Insurance.
The Company typically does not perfect its security interest in collateral securing its smaller loans by filing Uniform Commercial Code (“UCC”) financing statements. Statutes in Georgia, Louisiana, South Carolina, Kentucky and Alabama permit the Company to charge a non-filing or non-recording insurance premium in connection with certain loans originated in these states. These premiums are equal in aggregate amount to the premiums paid by the Company to purchase non-filing insurance coverage from an unaffiliated insurance company. Under its non-filing insurance coverage, the Company is reimbursed for losses on loans resulting from its policy not to perfect its security interest in collateral securing the loans.
Information Technology.
ParaData Financial Systems, a wholly-owned subsidiary of the Company, is a financial services software company headquartered near St. Louis, Missouri. Using the proprietary data processing software package developed by ParaData, the Company is able to fully automate all of its loan account processing and collection reporting. The system provides thorough management information and control capabilities.
Monitoring and Supervision.
The Company's loan operations are organized into Southeastern, Central, and Western Divisions and Mexico. The Southeastern Division consists of Alabama, Georgia, Kentucky, South Carolina and Tennessee; the Central Division consists of Illinois, Indiana, Missouri, Oklahoma and Wisconsin; and the Western Division consists of Idaho, Louisiana, Mississippi, New Mexico and Texas. Several levels of management monitor and supervise the operations of each of the Company's branches. Branch managers are directly responsible for the performance of their respective branches. District supervisors are responsible for the performance of 8 to 11 branches in their districts, typically communicate with the branch managers of each of their branches at least weekly and visit the branches at least monthly. The Vice Presidents of Operations monitor the performance of all branches within their states (or partial state in the case of Texas), primarily through communication with district supervisors. These Vice Presidents of Operations typically communicate with the district supervisors of each of their districts weekly and regularly visit branches.
Senior management has access to daily delinquency, loan volume, charge-off, and other statistical data on a consolidated, state and branch level. At least eight times per fiscal year district supervisors examine the operations of each branch in their geographic area and submit standardized reports detailing their findings to the Company's senior management. At least once per year each branch undergoes an audit by the Company's internal auditors. These audits include an examination of cash balances and compliance with Company loan approval, review and collection procedures and compliance with federal and state laws and regulations.
Staff and Training.
Local branches are generally staffed with two to four employees. The branch manager supervises operations of the branch and is responsible for approving all new and former borrower loan applications and requests for increases in the amount of credit extended. Each branch generally has one or two branch service representatives who take loan applications, process loan applications, apply payments, assist in the preparation of operational reports, collection efforts and marketing activities. Larger branches may employ additional branch service representatives.
New employees are required to review detailed training materials that outline the Company's operating policies and procedures. The Company tests each employee on the training materials during the first year of employment. In addition, each branch associate completes an online training session once every week and periodic training sessions outside the branch. The Company has also implemented an enhanced training tool known as World University, which provides continuous, real-time, effective, on-line training to all locations. This allows for more training opportunities to be available to all employees throughout the course of their career with the Company.
Advertising.
The Company actively advertises through direct mail, targeting both its present and former customers and potential customers who have used other sources of consumer credit. The Company obtains or acquires mailing lists from third party sources. In addition to the general promotion of its loans for last-minute needs, back-to-school needs and other uses, the Company advertises extensively during the October through December holiday season and in connection with new branch openings. The Company also advertises across digital platforms, by email and to existing customers via SMS/text. The Company believes its advertising contributes significantly to its ability to compete effectively with other providers of small-loan consumer credit. Advertising expenses as a percent of revenue were approximately
4.1%
,
3.4%
, and
3.0%
in fiscal
2018
,
2017
, and
2016
, respectively.
Competition
. The small-loan consumer finance industry is highly fragmented, with numerous competitors. The majority of the Company's competitors are independent operators with generally less than 100 branches. Competition from community banks and credit unions is limited because they typically do not make loans of less than $5,000. While it is hard to surmise exactly what impact our competitors have on our business, we believe that factors such as online lending could be affecting the consumer lending market within which we operate. Additionally, although online lenders appear to be marketing to a different customer segment than that of our primary customers, some of our customers may overlap.
9
The Company believes that competition between small-loan consumer finance companies occurs primarily on the basis of the strength of customer relationships, customer service and reputation in the local community rather than pricing, as participants in this industry generally all charge interest rates and fees at or close to the maximum permitted by applicable laws. The Company believes that its relatively larger size affords it a competitive advantage over smaller companies by increasing its access to, and reducing its cost of, capital.
Several of the states in which the Company currently operates limit the size of loans made by small-loan consumer finance companies and prohibit the extension of more than one loan to a customer by any one company. As a result, many customers borrow from more than one finance company, which enables the Company, subject to the limitations of various consumer protection and privacy statutes, including, but not limited to, the Fair Credit Reporting Act and the Gramm-Leach-Bliley Act, to obtain information on the credit history of specific customers from other consumer finance companies.
Employees
. As of
March 31, 2018
, the Company had
3,419
U.S. employees, none of whom were represented by labor unions and
1,114
employees in Mexico, all of whom were represented by a Mexico-based labor union. The Company considers its relations with its employees to be good. The Company seeks to hire people who will become long-term employees, and, as a result, the vast majority of our field leadership has been promoted from within.
Executive Officers of the Company
. The names and ages, positions, terms of office and periods of service of each of the Company's executive officers (and other business experience for executive officers who have served as such for less than five years) are set forth below. The term of office for each executive officer expires upon the earlier of the appointment and qualification of a successor or such officer's death, resignation, retirement or removal.
10
|
Name and Age
|
Position
|
Period of Service as Executive Officer and
Pre-Executive Officer Experience (if an
Executive Officer for Less Than Five Years)
|
|
|
|
|
|
James H. Wanserski (66)
|
President and Chief Executive Officer
|
President and Chief Executive Officer since January 2018; consultant with JS&R Business Services, L.L.C. d/b/a Wanserski & Associates (“W&A”) since 2010; partner of Hardesty, LLC from 2015 to 2016.
|
|
|
|
|
|
John L. Calmes Jr. (38)
|
Senior Vice President, Chief Financial Officer and Treasurer
|
Senior Vice President, Chief Financial Officer and Treasurer since November 2015; Vice President, Chief Financial Officer and Treasurer since December 2013; Director of Finance – Corporate and Investment Banking Division of Bank of Tokyo-Mitsubishi UFJ in 2013; Senior Manager of PricewaterhouseCoopers from 2011 to 2013; Manager of PricewaterhouseCoopers from 2008 to 2011.
|
|
Ravin C. Prashad (37)
|
Senior Vice President and Chief Strategy & Analytics Officer
|
Senior Vice President, Chief Strategy & Analytics Officer since February 2018; Vice President of Analytics from 2014-2018; Senior Director of Strategy Development for Resurgent Capital Services from 2013-2014, Director of Legal Strategy for Resurgent Capital Services from 2009-2013.
|
|
|
|
|
|
D. Clinton Dyer (45)
|
Executive Vice President and Chief Branch Operations Officer
|
Executive Vice President and Chief Branch Operations Officer since February 2018; Executive Vice President of Branch Operations from September 2016 to February 2018; Senior Vice President, Southeastern Division from November 2015 to September 2016; Senior Vice President, Central Division from June 2005 to November 2015; Vice President, Operations –Tennessee and Kentucky from April 2002 to June 2005.
|
|
Jeff L. Tinney (56)
|
Senior Vice President, Western Division
|
Senior Vice President, Western Division, since June 2007; Vice President, Operations – Texas and New Mexico from June 2001 to June 2007; Vice President, Operations – Texas and Louisiana from April 1998 to June 2001.
|
|
|
|
|
|
Erik T. Brown (45)
|
Senior Vice President, Central Division
|
Senior Vice President, Central Division since November 2015; Vice President of Operations, Missouri from July 2005 to November 2015; District Supervisor from November 2003 to July 2005.
|
|
Jackie C. Willyard (55)
|
Senior Vice President, South Eastern Division
|
Senior Vice President, South Eastern Division since September 2016; Vice President of Operations, Kentucky from August 2003 to September 2016.
|
Government Regulation
.
U. S. Operations
. Small-loan consumer finance companies are subject to extensive regulation, supervision and licensing under various federal and state statutes, ordinances and regulations. In many cases these statutes establish maximum loan amounts and interest rates and the types and maximum amounts of fees and other charges. In addition, state laws regulate collection procedures, the keeping of books and records and other aspects of the operation of small-loan consumer finance companies. Generally, state regulations also establish minimum capital requirements for each local branch. Accordingly, the ability of the Company to expand by acquiring existing branches and opening new branches will depend in part on obtaining the necessary regulatory approvals.
For example, Texas regulation requires the approval of the Texas Consumer Credit Commissioner for the acquisition, directly or indirectly, of more than 10% of the voting or common stock of a consumer finance company. A Louisiana statute prohibits any person from acquiring control of 50% or more of the shares of stock of a licensed consumer lender, such as the Company, without first obtaining a license as a consumer lender. The overall effect of these laws, and similar laws in other states, is to make it more difficult to acquire a consumer finance company than it might be to acquire control of an unregulated corporation.
All of the Company's branches are licensed under the laws of the state in which the branch is located. Licenses granted by the regulatory agencies in these states are subject to renewal every year and may be revoked for failure to comply with applicable
11
state and federal laws and regulations. In the states in which the Company currently operates, licenses may be revoked only after an administrative hearing.
The Company and its operations are regulated by several state agencies, including the following:
|
•
|
The Industrial Loan Division of the Office of the Georgia Insurance Commissioner
|
|
•
|
The Consumer Finance Division of the South Carolina Board of Financial Institutions and the South Carolina Department of Consumer Affairs
|
|
•
|
The Texas Office of the Consumer Credit Commissioner
|
|
•
|
The Oklahoma Department of Consumer Credit
|
|
•
|
The Louisiana Office of Financial Institutions
|
|
•
|
The Tennessee Department of Financial Institutions
|
|
•
|
The Missouri Division of Finance
|
|
•
|
The Consumer Credit Division of the Illinois Department of Financial Institutions
|
|
•
|
The Financial Institutions Division of the New Mexico Regulation and Licensing Department
|
|
•
|
The Kentucky Department of Financial Institutions
|
|
•
|
The Alabama State Banking Department
|
|
•
|
The Wisconsin Department of Financial Institutions
|
|
•
|
The Indiana Department of Financial Institutions
|
|
•
|
The Mississippi Department of Banking and Consumer Finance
|
|
•
|
The Idaho Department of Finance.
|
These state regulatory agencies audit the Company's local branches from time to time, and each state agency performs an annual compliance audit of the Company's operations in that state.
Insurance
. The Company is also subject to state regulations governing insurance agents in the states in which it sells credit insurance. State insurance regulations require that insurance agents be licensed, govern the commissions that may be paid to agents in connection with the sale of credit insurance and limit the premium amount charged for such insurance. The Company's captive insurance subsidiary is regulated by the insurance authorities of the Turks and Caicos Islands of the British West Indies, where the subsidiary is organized and domiciled.
Consumer finance companies are affected by changes in state and federal statutes and regulations.
The Company actively participates in trade associations and in lobbying efforts in the states in which it operates and at the federal level. There have been, and the Company expects that there will continue to be, media attention, initiatives, discussions, proposals and legislation regarding the entire consumer credit industry, as well as our particular installment loan business, and possible significant changes to the laws and regulations, or the authority exercised pursuant to those laws and regulations that govern our business. In some cases, proposed or pending legislative or regulatory changes have been introduced that would, if enacted, have a material adverse effect on, or possibly even eliminate, our ability to continue our current business. We can give no assurance that the laws and regulations that govern our business, or the interpretation or administration of those laws and regulations, will remain unchanged or that any such future changes will not materially and adversely affect, or in the worst case, eliminate, the Company’s lending practices, operations, profitability or prospects. See "State legislation" and “Federal legislation” below and Part I, Item 1A, “Risk Factors,” for a further discussion of the potential impact of regulatory changes on our business.
State legislation.
The Company is subject to numerous state laws and regulations that affect our lending activities. Many of these regulations impose detailed and complex constraints on the terms of our loans, lending forms and operations. Failure to comply with applicable laws and regulations could subject us to regulatory enforcement action that could result in the assessment against us of civil, monetary or other penalties.
In the past, several state legislative and regulatory proposals have been introduced which, had they become law, would have had a materially adverse impact on our operations and ability to continue to conduct business in the relevant state. Although to date none of these state initiatives have been successful, state legislatures continue to receive pressure to adopt similar legislation that would affect our lending operations. For example, in Missouri, following a 2013 failed ballot initiative, the same proponents again commenced ballot initiatives to legislatively cap annual interest rates at 36% and to constitutionally impose other interest rate limitations. The proponents of the rate cap did not obtain sufficient signatures on this initiative to have it placed on the November 2014 election ballot. A similar attempt to introduce rate cap legislation was initiated in New Mexico, but was tabled in early February 2015 by a legislative committee. There can be no assurance that proponents of these or similar initiatives will not pursue them and be successful in the future.
12
In addition, any adverse change in existing laws or regulations, or any adverse interpretation or litigation relating to existing laws and regulations in any state in which we operate, could subject us to liability for prior operating activities or could lower or eliminate the profitability of our operations going forward by, among other things, reducing the amount of interest and fees we can charge in connection with our loans. If these or other factors lead us to close our branches in a state, then in addition to the loss of net revenues attributable to that closing, we would also incur closing costs such as lease cancellation payments, and we would have to write off assets that we could no longer use. If we were to suspend rather than permanently cease our operations in a state, we may also have continuing costs associated with maintaining our branches and our employees in that state, with little or no revenues to offset those costs.
Federal legislation
. In addition to state and local laws and regulations, we are subject to numerous federal laws and regulations that affect our lending operations. These laws include the Truth in Lending Act, the Equal Credit Opportunity Act and the Fair Credit Reporting Act and the regulations thereunder and the Federal Trade Commission's Credit Practices Rule. These laws require the Company to provide complete disclosure of the principal terms of each loan to the borrower prior to the consummation of the loan transaction, prohibit misleading advertising, protect against discriminatory lending practices and prohibit unfair, deceptive or abusive credit practices. Among the principal disclosure items under the Truth in Lending Act are the terms of repayment, the final maturity, the total finance charge and the annual percentage rate charged on each loan. The Equal Credit Opportunity Act prohibits creditors from discriminating against loan applicants on, among other things, the basis of race, color, sex, age or marital status. Pursuant to Regulation B promulgated under the Equal Credit Opportunity Act, creditors are required to make certain disclosures regarding consumer rights and advise consumers whose credit applications are not approved of the reasons for the rejection. The Fair Credit Reporting Act also requires the Company to provide certain information to consumers whose credit applications are not approved on the basis of a report obtained from a consumer reporting agency and to provide additional information to those borrowers whose loans are approved and consummated if the credit decision was based in whole or in part on the contents of a credit report. The Credit Practices Rule limits the types of property a creditor may accept as collateral to secure a consumer loan. Violations of the statutes and regulations described above may result in actions for damages, claims for refund of payments made, certain fines and penalties, injunctions against certain practices and the potential forfeiture of rights to repayment of loans.
Although these laws and regulations remained substantially unchanged for many years, over the last several years the laws and regulations directly affecting our lending activities have been under review and are subject to change as a result of various developments and changes in economic conditions, the make-up of the executive and legislative branches of government, and the political and media focus on issues of consumer and borrower protection. See Part I, Item 1A, “Risk Factors—Media and public characterization of consumer installment loans as being predatory or abusive could materially adversely affect our business, prospects, results of operations and financial condition” below. Any changes in such laws and regulations could force us to modify, suspend or cease part or, in the worst case, all of our existing operations. It is also possible that the scope of federal regulations could change or expand in such a way as to preempt what has traditionally been state law regulation of our business activities. The enactment of one or more of such regulatory changes could materially and adversely affect our business, results of operations and prospects.
Various legislative proposals addressing consumer credit transactions have been passed in recent years or are currently pending in the U.S. Congress. Congressional members continue to receive pressure from consumer activists and other industry opposition groups to adopt legislation to address various aspects of consumer credit transactions. As part of a sweeping package of financial industry reform regulations, in July 2010 Congress passed and the President signed into law the “Dodd-Frank Wall Street Reform and Consumer Protection Act” (the “Dodd-Frank Act”). This created, among other things, a new federal regulatory entity, the Consumer Financial Protection Bureau (commonly referred to as the CFPB), with sweeping regulatory and enforcement authority over consumer financial transactions. The CFPB continues to actively engage in the announcement and implementation of various plans and initiatives in the area of consumer financial transactions generally. Some of these CFPB announced plans and initiatives, if implemented, would directly affect certain loan products we currently offer and subject us to the CFPB’s supervisory authority. See Part II, Item 7, “Management’s Discussion and Analysis of Financial Condition and Results of Operations - Regulatory Matters,” for more information regarding the CFPB's regulatory initiatives.
13
Although the Dodd-Frank Act prohibits the CFPB from setting interest rates on consumer loans, efforts to create a federal usury cap, applicable to all consumer credit transactions and substantially below rates at which the Company could continue to operate profitably, are still ongoing. Any federal legislative or regulatory action that severely restricts or prohibits the provision of small-loan consumer credit and similar services on terms substantially similar to those we currently provide would, if enacted, have a material, adverse impact on our business, prospects, results of operations and financial condition. Any federal law that would impose a national 36% or similar annualized credit rate cap on our services would, if enacted, almost certainly eliminate our ability to continue our current operations. See Part I, Item 1A, “Risk Factors - Federal legislative or regulatory proposals, initiatives, actions or changes that are adverse to our operations or result in adverse regulatory proceedings, or our failure to comply with existing or future federal laws and regulations, could force us to modify, suspend or cease part or all of our nationwide operations,” for further information regarding the potential impact of adverse legislative and regulatory changes.
In July 2015, the Department of Defense (the “DoD”) amended its regulations implementing the Military Lending Act (the “MLA”) by issuing final regulations (the “Final Rule”). Prior MLA regulations prohibited creditors from making payday loans, non-purchase money motor vehicle title loans with a term of less than 181 days, and refund anticipation loans to “covered borrowers,” which includes members of the armed forces (i) on active duty; (ii) on active Guard and Reserve Duty; and (iii) their dependents if the APR exceeded 36%. The Company did not make any of the loans covered under the prior MLA regulations. However, the Final Rule expands the MLA and its 36% APR cap to cover a broader range of credit products. The Final Rule covers credit offered or extended to a “covered borrower” primarily for personal, family, or household purposes that is either subject to a finance charge or payable by a written agreement in more than four installments. The Final Rule mandates, among other things, that a creditor must provide both oral and written disclosures, including an all-inclusive APR referred to as the Military Annual Percentage Rate (“MAPR”), and must not require arbitration in agreements with “covered borrowers." Additionally, the Final Rule prohibits creditors from entering into any credit transactions with covered borrowers that use the title of a vehicle as security for the credit obligation. Creditors may elect to check a borrower’s status as a “covered borrower” either in a database maintained by the DoD or through a nationwide consumer reporting agency before entering into a consumer credit transaction. Doing so provides a creditor with a legally conclusive determination as to the borrower’s status and affords the creditor a safe harbor from liability as to the “covered borrower” determination. While the Final Rule became effective on October 1, 2015, the limitations in the Final Rule apply only to consumer credit transactions or accounts for consumer credit consummated or established on or after October 3, 2016. As such, effective September 1, 2016, the Company elected to no longer make loans to covered borrowers (active duty military personnel and their dependents) due to these new restrictions in the law. The Company believes the implementation of the Final Rule will not adversely affect its operations or financial condition.
Mexico Operations.
Effective May 1, 2008, World Acceptance Corporation de Mexico, S. de R.L. de C.V. was converted to WAC de Mexico, S.A. de C.V., SOFOM, E.N.R. (“WAC de Mexico SOFOM”), and due to such conversion, this entity became organized as a Sociedad Financiera de Objeto Múltiple, Entidad No Regulada (Multiple Purpose Financial Company, Non-Regulated Entity or “SOFOM, ENR”). Mexican law provides for administrative regulation of companies that are organized as SOFOM, ENRs. As such, WAC de Mexico SOFOM is mainly governed by different federal statutes, including the General Law of Auxiliary Credit Activities and Organizations, the Law for the Transparency and Order of Financial Services, the General Law of Credit Instruments and Operations, and the Law of Protection and Defense to the User of Financial Services. SOFOM, ENRs are also subject to regulation by and surveillance of the National Commission for the Protection and Defense of Users of Financial Services (“CONDUSEF”). CONDUSEF, among other things, acts as mediator and arbitrator in disputes between financial lenders and customers, and resolves claims filed by loan customers. CONDUSEF also prevents unfair and discriminatory lending practices, and regulates, among other things, the form of loan contracts, consumer disclosures, advertisement, and certain operating procedures of SOFOM, ENRs, with such regulations pertaining primarily to consumer protection and adequate disclosure and transparency in the terms of borrowing. Neither CONDUSEF nor federal statutes impose interest rate caps on loans granted by SOFOM, ENRs. Due to anti-money laundering laws, the consumer loan industry is now being reviewed by the National Banking and Securities Commission ("CNBV") for compliance with anti-money laundering regulations. The consumer loan industry, as with most businesses in Mexico, is also subject to other various regulations in the areas of tax compliance and employment matters, among others, by various federal, state and local governmental agencies. Generally, federal regulations take precedence over the state statutes with respect to the consumer loan operations of SOFOM, ENRs.
Our Mexican operations are also subject to compliance with the U.S. Foreign Corrupt Practices Act of 1977, as amended (“FCPA”), which prohibits corporations and individuals from paying, offering to pay, or authorizing the payment of anything of value to any foreign government official, government staff member, political party, or political candidate in an attempt to obtain or retain business or to otherwise influence a person working in an official capacity. We also may be implicated under the FCPA by the activities of our partners or other agents. The FCPA also requires us, as a public company, to make and keep books and records that accurately and fairly reflect all of our transactions and to devise and maintain an adequate system of internal accounting controls. The anti-corruption provisions of the FCPA are enforced by the U.S. Department of Justice (“DOJ”). In addition, the SEC requires strict compliance with the accounting and internal control standards set forth under the FCPA. Failure to comply with the FCPA can expose the Company and/or individual employees to potentially severe criminal and civil penalties. Such
14
penalties, if assessed, may have a material adverse effect on our business, financial condition, and results of operations. As discussed under Item 1A, “Risk Factors—We may be exposed to liabilities under the FCPA, and any determination that the Company or any of its subsidiaries has violated the FCPA could have a material adverse effect on our business and liquidity,” and Part I, Item 3, “Legal Proceedings—Mexico Investigation” in this Annual Report on Form 10-K, the Company has retained outside counsel and forensic accountants to conduct an investigation of certain transactions and payments in Mexico that potentially implicate the FCPA, including the books and records provisions thereof, and the SEC has issued a formal order of investigation in connection with the same.
Available Information
. The information regarding our website and availability of our filings with the SEC as described in the second paragraph under “Introduction” above is incorporated by reference into this Item 1 of Part I.
|
Item 1A.
|
Risk Factors
|
Forward-Looking Statements
This annual report contains various “forward-looking statements” within the meaning of the Private Securities Litigation Reform Act of 1995 that are based on management’s beliefs and assumptions, as well as information currently available to management. Statements other than those of historical fact, as well as those identified by the use of words such as “anticipate,” “estimate,” "intend," “plan,” “expect,” “believe,” “may,” “will,” “should,” “would,” “could,” and any variations of the foregoing and similar expressions, are forward-looking statements. Although we believe that the expectations reflected in any such forward-looking statements are reasonable, we can give no assurance that such expectations will prove to be correct. Any such statements are subject to certain risks, uncertainties and assumptions. Should one or more of these risks or uncertainties materialize, or should underlying assumptions prove incorrect, our actual financial results, performance or financial condition may vary materially from those anticipated, estimated, expected or implied by any forward-looking statements.
Investors should consider the following risk factors, in addition to the other information presented in this annual report and the other reports and registration statements the Company files with or furnishes to the SEC from time to time, in evaluating us, our business and an investment in our securities. Any of the following risks, as well as other risks, uncertainties, and possibly inaccurate assumptions underlying our plans and expectations, could result in harm to our business, results of operations and financial condition and cause the value of our securities to decline, which in turn could cause investors to lose all or part of their investment in our Company. These factors, among others, could also cause actual results to differ materially from those we have experienced in the past or those we may express or imply from time to time in any forward-looking statements we make. Investors are advised that it is impossible to identify or predict all risks, and that risks not currently known to us or that we currently deem immaterial also could affect us in the future. The Company does not undertake any obligation to update any forward-looking statements it may make.
Federal legislative or regulatory proposals, initiatives, actions or changes that are adverse to our operations or result in adverse regulatory proceedings, or our failure to comply with existing or future federal laws and regulations, could force us to modify, suspend or cease part or all of our nationwide operations.
We are subject to numerous federal laws and regulations that affect our lending operations. Although these laws and regulations have remained substantially unchanged for many years, the laws and regulations directly affecting our lending activities have been under review and subject to change in recent years as a result of various developments and changes in economic conditions, the make-up of the executive and legislative branches of government, and the political and media focus on issues of consumer and borrower protection. Any changes in such laws and regulations could force us to modify, suspend or cease part or, in the worst case, all of our existing operations. It is also possible that the scope of federal regulations could change or expand in such a way as to preempt what has traditionally been state law regulation of our business activities.
In July 2010 the Dodd-Frank Act was enacted. The Dodd-Frank Act restructured and enhanced the regulation and supervision of the financial services industry and created the CFPB, an agency with sweeping regulatory and enforcement authority over consumer financial transactions. Although the Dodd-Frank Act prohibits the CFPB from setting interest rates on consumer loans, efforts to create a federal usury cap, applicable to all consumer credit transactions and substantially below rates at which the Company could continue to operate profitably, are still ongoing. Any federal legislative or regulatory action that severely restricts or prohibits the provision of small-loan consumer credit and similar services on terms substantially similar to those we currently provide would, if enacted, have a material adverse impact on our business, prospects, results of operations and financial condition. Any federal law that would impose a 36% or similar annualized credit rate cap on our services would, if enacted, almost certainly eliminate our ability to continue our current operations. Given the uncertainty associated with the manner in which various expected provisions of the Dodd-Frank Act have been and are expected to continue to be implemented by the various regulatory agencies and through
15
regulations, the full extent of the impact such requirements will have on our operations remains unclear; however, these regulations have increased and are expected to further increase our cost of doing business and time spent by management on regulatory matters, which may have a material adverse effect on the Company’s operations and results.
The CFPB’s rulemaking and enforcement authority extends to certain non-depository institutions, including us. The CFPB is specifically authorized, among other things, to take actions to prevent companies providing consumer financial products or services and their service providers from engaging in unfair, deceptive or abusive acts or practices in connection with consumer financial products and services, and to issue rules requiring enhanced disclosures for consumer financial products or services. The CFPB also has authority to interpret, enforce, and issue regulations implementing enumerated consumer laws, including certain laws that apply to our business. Further, the CFPB has authority to designate non-depository “larger participants” in certain markets for consumer financial services and products for purposes of the CFPB’s supervisory authority under the Dodd-Frank Act. Such designated “larger participants” are subject to reporting and on-site compliance examinations by the CFPB, which may result in increased compliance costs and potentially greater enforcement risks based on these supervisory activities. Although the CFPB has not yet developed a “larger participant” rule that directly covers the Company’s installment lending business, in June 2016 the CFPB stated that it expects to conduct separate rulemaking to identify larger participants in the installment lending market for purposes of its supervision program. Though the timing of any such rulemaking is uncertain, the Company believes that the implementation of such rules would likely bring the Company’s business under the CFPB’s direct supervisory authority.
On June 2, 2016, the CFPB announced proposed rules under its unfair, deceptive and abusive acts and practices rulemaking authority relating to payday, vehicle title, and similar loans. The proposal would cover short-term loans with a contractual term of 45 days or less, as well as “longer-term loans” with a term of longer than 45 days with an all-in annualized percentage rate of interest (“APR”) in excess of 36% in which the lender has either a non-purchase money security interest in the consumer’s vehicle or the right to collect repayment from the consumer’s bank account or paycheck. The CFPB’s “longer-term” credit proposals seek to address a concern that consumers suffer harm if lenders fail to reasonably underwrite loans but take a security interest in the consumer’s vehicle or access to repayment from a consumer’s account or wages. Although the Company does not make loans with terms of 45 days or less or obtain access to a customer’s bank account or paycheck for repayment of any of its loans, it does make some vehicle-secured loans with an APR within the scope of the proposal. The proposals would require a lender, as a condition of making a covered longer-term loan, to first make a good-faith reasonable determination that the consumer has the ability to repay the covered longer-term loan without reborrowing or defaulting. The proposals would require a lender to consider and verify the amount and timing of the consumer's income, the consumer's major financial obligations, and the consumer's borrowing history prior to making a covered loan. Lenders would also be required to determine that a consumer is able to make all projected payments under the covered longer-term loan as those payments are due, while still fulfilling other major financial obligations and meeting living expenses. This ability to repay assessment would apply to both the initial longer-term loan and to any subsequent refinancing. In addition, the proposals would include a rebuttable presumption that customers seeking to refinance a covered longer-term loan lack an “ability to repay” if at the time of refinancing: (i) the borrower was delinquent by more than seven days or had recently been delinquent on an outstanding loan within the past 30 days; (ii) the borrower stated or indicated an inability to make a scheduled payment within the past 30 days; (iii) the refinancing would result in the first scheduled payment to be due in a longer period of time than between the time of refinancing the loan and the next regularly scheduled payment on the outstanding loan; or (iv) the refinancing would not provide the consumer a disbursement of funds or an amount that would not substantially exceed the amount of payment due on the outstanding loan within 30 days of refinancing. To overcome this presumption of inability to repay, the lender would have to verify an improvement in the borrower’s financial capacity to indicate an ability to repay the additional extension of credit. These proposals are subject to possible change before any final rules would be issued and implemented, and we cannot predict what the ultimate rulemaking will provide. The Company does not believe that these proposals as currently described by the CFPB would have a material impact on the Company’s existing lending procedures, because the Company currently underwrites all its loans (including those secured by a vehicle title that would fall within the scope of these proposals) by reviewing the customer’s ability to repay based on the Company’s standards. However, there can be no assurance that these proposals for longer-term loans, if and when implemented in final rulemaking, would not require changes to the Company’s practices and procedures for such loans that could materially and adversely affect the Company’s ability to make such loans, the cost of making such loans, the Company’s ability to, or frequency with which it could, refinance any such loans, and the profitability of such loans. Any final rulemaking also could have effects beyond those contemplated in the initial proposal that could further materially and adversely impact our business and operations.
In addition to the specific matters described above, other aspects of our business may be the subject of future CFPB rulemaking. The enactment of one or more of such regulatory changes, or the exercise of broad regulatory authority by regulators, including but not limited to, the CFPB, having jurisdiction over the Company’s business or discretionary consumer financial transactions generically, could materially and adversely affect our business, results of operations and prospects. See Part I, Item 1, “Business—Government Regulation” for more information regarding legislation we are subject to and related risks.
16
We have experienced significant turnover in our senior management, and our business may be adversely affected by the transitions in our senior management team or by our inability to effectively handle our leadership transition and any future succession planning.
In December 2017, we entered into a separation agreement with our then-serving Senior Vice President, Secretary and General Counsel, and in January 2018, we entered into a separation agreement with our then-serving President and Chief Executive Officer. The employment of these officers with the Company has terminated. On January 22, 2018, our Board of Directors appointed James H. Wanserski to serve as our interim President and Chief Executive Officer while the Board searches for a permanent replacement. There can be no assurances concerning the timing or outcome of the Company’s search for permanent replacements.
Executive leadership transitions can be inherently difficult to manage and may cause disruption to our business. As a result of recent executive turnover, our existing management team has taken on substantially more responsibility, which has resulted in greater workload demands and could divert their attention away from certain key areas of our business. In addition, management transition inherently causes some loss of institutional knowledge, which can negatively affect strategy and execution, and our results of operations and financial condition could be negative impacted as a result. The loss of services of one or more other members of senior management, or the inability to attract qualified permanent replacements, could have a material adverse effect on our business. If we fail to successfully attract and appoint permanent replacements with the appropriate expertise, we could experience increased employee turnover and harm to our business, results of operations, cash flow and financial condition. The search for permanent replacements could also result in significant recruiting and relocation costs.
We may be exposed to liabilities under the FCPA, and any determination that the Company or any of its subsidiaries has violated the FCPA could have a material adverse effect on our business and liquidity.
We are subject to the FCPA and various other anti-corruption and anti-bribery laws. We face significant risks and liability if we fail to comply with these laws, which generally prohibit companies and their employees and third-party intermediaries from authorizing, offering or providing, directly or indirectly, improper payments or benefits to foreign government officials, political parties or candidates, employees of public international organizations, or private-sector recipients for the corrupt purpose of obtaining or retaining business, directing business to any person, or securing any advantage. As discussed in Part I, Item 3, “Legal Proceedings—Mexico Investigation,” in this Annual Report on Form 10-K, we have retained outside counsel and forensic accountants to conduct an investigation of certain transactions and payments in Mexico that potentially implicate the Company in violations of the FCPA, including the books and records provisions of the FCPA. In addition, we have informed the DOJ and the SEC of these matters and intend to fully cooperate with these agencies in their review and investigation. The SEC has issued a formal order of investigation in connection with these matters.
If violations of the FCPA occurred, the Company could be subject to fines, civil and criminal penalties, equitable remedies, including profit disgorgement and related interest, and injunctive relief. In addition, any disposition of these matters could adversely impact the Company's access to debt financing and capital funding, as well as our ability to collect on outstanding loans and result in further modifications to our business practices and compliance programs, including significant restructuring or curtailment of our operations in Mexico. Any disposition could also potentially require that a monitor be appointed to review future business practices with the goal of ensuring compliance with the FCPA and other applicable laws. The Company could also face fines, sanctions, and other penalties from authorities in Mexico, as well as third-party claims by shareholders and/or other stakeholders of the Company.
Detecting, investigating, and resolving these matters is expensive and consumes significant time and attention of the Company’s senior management. While we are currently unable to predict what actions the DOJ, SEC, or other governmental agencies (including governmental agencies in Mexico) might take, or what the likely outcome of any such actions might be, we may incur substantial additional expenses responding to such actions. In addition, such actions, fines, and/or penalties could adversely affect the Company’s reputation and its ability to obtain new business or retain existing business from its current customers and potential customers, to attract and retain employees, and to access the capital markets. If it is determined that a violation of the FCPA has occurred, such violation, or a settlement thereof, may give rise to an event of default under the agreement governing our revolving credit facility, which could have a material adverse effect on our liquidity. See Part I, Item 1A, “Risk Factors—We depend to a substantial extent on borrowings under our revolving credit agreement to fund our liquidity needs” and “—The terms of our debt limit how we conduct business.”
Our investigation of our operations in Mexico may expose the Company to other potential liabilities in addition to any potential liabilities under the FCPA and cause the Company to incur substantial expenses.
In addition to the FCPA implications of our internal investigation into our Mexico operations, as described in the preceding risk factor, our internal investigation may also uncover other material violations of federal and local laws, including but not limited to
17
violations of tax laws and regulations. Any such violations could expose us to lawsuits and other liabilities under applicable law and have a material adverse effect on our business, including our operations in Mexico and our decisions with respect thereto, and our liquidity. Investigating, uncovering, and resolving these matters is expensive and continues to consume significant time and attention of the Company’s senior management. In addition, we may incur substantial additional expenses responding to potential lawsuits and the results thereof could adversely affect our reputation and our ability to obtain new business or retain existing business from our current clients and potential clients, to attract and retain employees, and to access the capital markets.
Our operations in Mexico are subject to the risks inherent in conducting operations internationally and could contribute materially to increased costs and negatively affect our business, prospects, results of operations and financial condition.
Our operations in Mexico accounted for
8.4%
of our revenues during fiscal
2018
and
9.1%
of our gross loans receivable at
March 31, 2018
and expose our business to risks inherent in conducting international operations, including potential FCPA compliance risks, currency fluctuations and devaluations, unsettled political and social conditions, communication and translation errors due to language barriers, compliance with differing legal and regulatory regimes and differing cultural attitudes toward regulation and compliance. In particular, political and social unrest in Mexico, coupled with a unionized labor structure that effectively gives third parties control over repayment of funds remitted from our customers who borrow under our payroll deduction loan product in Mexico, create risks of non-payment or delinquent payment of these funds collected through the third parties. If we are unable to resolve any such possible issues and persuade the third parties to remit these types of payments, our revenues, delinquencies and charge-off rates from our Mexican operations could be materially and adversely affected. Further, any suspension, cessation or curtailment of our operations in Mexico would decrease our revenues and gross loans receivable and negatively affect our business, prospects, results of operations and financial condition.
Litigation and regulatory actions, including challenges to the arbitration clauses in our customer agreements, could subject us to significant class actions, fines, penalties, judgments and requirements resulting in increased expenses and potential material adverse effects on our business, results of operations and financial condition.
In the normal course of business, from time to time, we have been named as a defendant in various legal actions, including arbitrations, class actions and other litigation, arising in connection with our business activities. Certain legal actions include claims for substantial compensatory and punitive damages, or claims for indeterminate amounts of damages. While the arbitration provisions in our customer agreements historically have limited our exposure to consumer class action litigation, there can be no assurance that we will be successful in enforcing our arbitration clause in the future. There may also be legislative, administrative or regulatory efforts to directly or indirectly prohibit the use of pre-dispute arbitration clauses, or we may be compelled as a result of competitive pressure or reputational concerns to voluntarily eliminate pre-dispute arbitration clauses.
Unfavorable state legislative or regulatory actions or changes, adverse outcomes in litigation or regulatory proceedings or failure to comply with existing laws and regulations could force us to cease, suspend or modify our operations in a state, potentially resulting in a material adverse effect on our business, results of operations and financial condition.
In addition to federal laws and regulations, we are subject to numerous state laws and regulations that affect our lending activities. Many of these regulations impose detailed and complex constraints on the terms of our loans, lending forms and operations. Failure to comply with applicable laws and regulations could subject us to regulatory enforcement action that could result in the assessment against us of civil, monetary or other penalties, including the suspension or revocation of our licenses to lend in one or more jurisdictions.
As discussed elsewhere in this report, the Company’s operations are subject to extensive state and federal laws and regulations, and changes in those laws or regulations or their application could have a material adverse effect on the Company’s business, results of operations, prospects or ability to continue operations in the jurisdictions affected by these changes. See Part I, Item 1, “Business—Government Regulation—State Legislation” and “—Federal Legislation,” and Part I, Item 1A,“Risk Factors,” for more information regarding this legislation and related risks.
Passage of adverse legislation, such as rate caps on financial lending products or similar initiatives, in any of the states in which we operate could have a material adverse effect on the Company’s business, results of operations, prospects or ability to continue operations in the jurisdictions affected by such changes. We can give no assurance that the laws and regulations that govern our business, or the interpretation or administration of those laws and regulations, will remain unchanged or that any such future changes will not materially and adversely affect or in the worst case, eliminate the Company’s lending practices, operations, profitability or prospects.
In addition, any adverse change in existing laws or regulations, or any adverse interpretation or litigation relating to existing laws and regulations in any state in which we operate, could subject us to liability for prior operating activities or could lower or
18
eliminate the profitability of our operations going forward by, among other things, reducing the amount of interest and fees we can charge in connection with our loans. If these or other factors lead us to close our branches in a state, then in addition to the loss of net revenues attributable to that closing, we would also incur closing costs such as lease cancellation payments and we would have to write off assets that we could no longer use. If we were to suspend rather than permanently cease our operations in a state, we may also have continuing costs associated with maintaining our branches and our employees in that state, with little or no revenues to offset those costs.
Media and public characterization of consumer installment loans as being predatory or abusive could have a materially adverse effect on our business, prospects, results of operations and financial condition.
Consumer activist groups and various other media sources continue to advocate for governmental and regulatory action to prohibit or severely restrict our products and services. These critics frequently characterize our products and services as predatory or abusive toward consumers. If this negative characterization of the consumer installment loans we make and/or ancillary services we provide becomes widely accepted by government policy makers or is embodied in legislative, regulatory, policy or litigation developments that adversely affect our ability to continue offering our products and services or the profitability of these products and services, our business, results of operations and financial condition would be materially and adversely affected.
Employee misconduct or misconduct by third parties acting on our behalf could harm us by subjecting us to monetary loss, significant legal liability, regulatory scrutiny and reputational harm.
Our reputation is critical to maintaining and developing relationships with our existing and potential customers and third parties with whom we do business. There is a risk that our employees or third party contractors could engage in misconduct that adversely affects our business. For example, if an employee or a third party contractor were to engage in, or be accused of engaging in, illegal or suspicious activities including fraud or theft, we could suffer direct losses from the activity and, in addition, we could be subject to regulatory sanctions and suffer serious harm to our reputation, financial condition, customer relationships and ability to attract future customers. Employee or third-party misconduct could prompt regulators to allege or to determine based upon such misconduct that we have not established adequate supervisory systems and procedures to inform employees of applicable rules or to detect violations of such rules. Our branches have experienced employee fraud from time to time, and it is not always possible to deter employee or third-party misconduct. The precautions that we take to detect and prevent misconduct may not be effective in all cases. Misconduct by our employees or third party contractors, or even unsubstantiated allegations of misconduct, could result in a material adverse effect on our reputation and our business.
Interest rate fluctuations may adversely affect our borrowing costs, profitability and liquidity.
Our profitability may be directly affected by the level of and fluctuations in interest rates, whether caused by changes in economic conditions or other factors, that affect our borrowing costs. Interest rates are highly sensitive to many factors that are beyond our control, including general economic conditions and policies of various governmental and regulatory agencies and, in particular, the Federal Reserve Board. Changes in monetary policy, including changes in interest rates, could influence the amount of interest we pay on our revolving credit facility or any other floating interest rate obligations we may incur. Our profitability and liquidity could be materially adversely affected during any period of higher interest rates. See Part II, Item 7A, “Quantitative and Qualitative Disclosure About Market Risk” for additional information regarding our interest rate risk.
We depend to a substantial extent on borrowings under our revolving credit agreement to fund our liquidity needs.
Our revolving credit agreement allows us to borrow up to
$480.0 million
through
June 15, 2019
. Pursuant to the terms of our revolving credit agreement, we are required to comply with a number of covenants and conditions, including a minimum borrowing base calculation. If our existing sources of liquidity become insufficient to satisfy our financial needs or our access to these sources becomes unexpectedly restricted, we may need to try to raise additional capital in the future. If such an event were to occur, we can give no assurance that such alternate sources of liquidity would be available to us at all or on favorable terms. Additional information regarding our liquidity risk is included in the risk factor below, "–We depend to a substantial extent on borrowings under our revolving credit agreement to fund our liquidity needs" and Part II, Item 7, “Management’s Discussion and Analysis of Financial Condition and Results of Operations–Liquidity and Capital Resources.”
19
Our substantial debt could negatively impact our business, prevent us from satisfying our debt obligations and adversely affect our financial condition.
We have a substantial amount of debt. As of
March 31, 2018
, we had approximately
$244.9 million
of total debt outstanding and a total debt to shareholders equity ratio of approximately
0.5
to 1. The substantial amount of our debt could have important consequences, including the following:
|
•
|
our ability to obtain additional financing for working capital, debt refinancing, share repurchases or other purposes could be impaired;
|
|
•
|
a substantial portion of our cash flows from operations will be dedicated to paying principal and interest on our debt, reducing funds available for other purposes;
|
|
•
|
we may be vulnerable to interest rate increases, as borrowings under our revolving credit agreement bear interest at variable rates, as may any future debt that we incur;
|
|
•
|
we could be more vulnerable to adverse developments in our industry or in general economic conditions;
|
|
•
|
we may be restricted from taking advantage of business opportunities or making strategic acquisitions;
|
|
•
|
we may be limited in our flexibility in planning for, or reacting to, changes in our business and the industry in which we operate; and
|
|
•
|
we may have difficulty satisfying our obligations under the debt if accelerated upon the occurrence of an event of default.
|
We may incur substantially more debt and other liabilities. This could exacerbate further the risks associated with our current debt levels.
We may be able to incur substantial additional debt in the future. Although the terms of our revolving credit agreement contain restrictions on our ability to incur additional debt, as may any future debt that we incur, these restrictions are subject, or likely to be subject, in the case of any future debt, to exceptions that could permit us to incur a substantial amount of additional debt. In addition, our existing and future debt agreements will not prevent us from incurring certain liabilities that do not constitute indebtedness as defined for purposes of those debt agreements. If new debt or other liabilities are added to our current debt levels, the risks associated with our having substantial debt could intensify. As of
March 31, 2018
, we had
$234.8 million
available for borrowing under our revolving credit agreement, subject to borrowing base limitations and other specified terms and conditions.
We may not be able to generate sufficient cash flows to service our outstanding debt and fund operations and may be forced to take other actions to satisfy our obligations under such debt.
Our ability to make scheduled payments on the principal of, to pay interest on, or to refinance our indebtedness will depend in part on our cash flows from operations, which are subject to regulatory, economic, financial, competitive and other factors beyond our control. We may not generate a level of cash flows from operations sufficient to permit us to meet our debt service obligations. If we are unable to generate sufficient cash flows from operations to service our debt, we may be required to sell assets, refinance all or a portion of our existing debt, obtain additional financing or obtain additional equity capital on terms that may be onerous or highly dilutive. There can be no assurance that any refinancing will be possible or that any asset sales or additional financing can be completed on acceptable terms or at all.
The terms of our debt limit how we conduct our business.
Our revolving credit agreement contains covenants that restrict our ability to, among other things:
|
•
|
incur and guarantee debt;
|
|
•
|
pay dividends or make other distributions on or redeem or repurchase our stock;
|
|
•
|
make investments or acquisitions;
|
|
•
|
create liens on our assets;
|
|
•
|
sell assets;
|
|
•
|
merge with or into other companies;
|
|
•
|
enter into transactions with shareholders and other affiliates; and
|
|
•
|
make capital expenditures.
|
Our revolving credit agreement also imposes requirements that we maintain specified financial measures not in excess of, or not below, specified levels. In particular, our revolving credit agreement requires, among other things, that we maintain (i) at all times a specified minimum consolidated net worth, (ii) as of the end of each fiscal quarter, a minimum ratio of consolidated net income available for fixed charges for the period of four consecutive fiscal quarters most recently ended to consolidated fixed charges for that period of not less than a specified minimum, (iii) at all times a specified maximum ratio of total debt to consolidated adjusted
20
net worth and (iv) at all times a specified ratio of subordinated debt to consolidated adjusted net worth. These covenants limit the manner in which we can conduct our business and could prevent us from engaging in favorable business activities or financing future operations and capital needs and impair our ability to successfully execute our strategy and operate our business.
A breach of any of the covenants in our revolving credit agreement would result in an event of default thereunder. Any event of default would permit the creditors to accelerate the related debt, which could also result in the acceleration of any other or future debt containing a cross-acceleration or cross-default provision. In addition, an event of default under our revolving credit agreement would permit the lenders thereunder to terminate all commitments to extend further credit under the revolving credit agreement. Furthermore, if we were unable to repay the amounts due and payable under the revolving credit agreement or any other secured debt we may incur, the lenders thereunder could cause the collateral agent to proceed against the collateral securing that debt. In the event our creditors accelerate the repayment of our debt, there can be no assurance that we would have sufficient assets to repay that debt, and our financial condition, liquidity and results of operations would suffer. Additional information regarding our revolving credit facility is included in Part II, Item 7 “Management’s Discussion and Analysis of Financial Condition and Results of Operations-Liquidity and Capital Resources.”
Changes in U.S. federal, state and local or foreign tax law, interpretations of existing tax law, or adverse determinations by tax authorities, could increase our tax burden or otherwise adversely affect our financial condition or results of operations.
We are subject to taxation at the federal, state and local levels in the United States and Mexico. On December 22, 2017, the U.S. government enacted comprehensive tax legislation commonly referred to as the Tax Cuts and Jobs Act (the “TCJA”). The changes included in the TCJA are broad and complex and significantly reform the Internal Revenue Code of 1986, as amended. The TCJA contains significant changes to corporate taxation, including a reduction of the corporate tax rate from 35% to 21%, a limitation on the tax deduction for interest expense to 30% of earnings (except for certain small businesses), a limitation on the deduction for net operating losses to 80% of current year taxable income and elimination of net operating loss carrybacks, immediate deductions for certain new investments instead of deductions for depreciation expense over time, and modifying or repealing many business deductions and credits. Notwithstanding the reduction in the corporate income tax rate and our expectations regarding our overall tax rate in fiscal 2018 and beyond, the overall impact of the TCJA is uncertain and the ultimate impact may prove to be inconsistent with our current expectations. As a result, the Company’s financial position, results of operations, and cash flows could be adversely affected by the TCJA, the interpretation and administration of the TCJA, and/or any future tax reform legislation.
Furthermore, we are subject to regular review and audit by both foreign and domestic tax authorities. While we believe our tax positions will be sustained, the final outcome of tax audits and related litigation may differ materially from the tax amounts recorded in our Consolidated Financial Statements, which could adversely impact our cash flows and financial results.
The conditions of the U.S. and international capital markets may adversely affect lenders with which we have relationships, causing us to incur additional costs and reducing our sources of liquidity, which may adversely affect our financial position, liquidity and results of operations.
Turbulence in the global capital markets can result in disruptions in the financial sector and affect lenders with which we have relationships, including members of the syndicate of banks that are lenders under our revolving credit agreement. Disruptions in the financial sector may increase our exposure to credit risk and adversely affect the ability of lenders to perform under the terms of their lending arrangements with us. Failure by our lenders to perform under the terms of our lending arrangements could cause us to incur additional costs that may adversely affect our liquidity, financial condition and results of operations. While overall market conditions have improved, there can be no assurance that future disruptions in the financial sector will not occur that could have similar adverse effects on our business. Additional information regarding our liquidity and related risks is included in Part II, Item 7, “Management’s Discussion and Analysis of Financial Condition and Results of Operations-Liquidity and Capital Resources.”
We are exposed to credit risk in our lending activities.
Our ability to collect on loans to individuals, our single largest asset group, depends on the ability and willingness of our borrowers to repay such loans. Any material adverse change in the ability or willingness of a significant portion of our borrowers to meet their obligations to us, whether due to changes in economic conditions, unemployment rates, the cost of consumer goods (particularly, but not limited to, food and energy costs), disposable income, interest rates, natural disasters, acts of war or terrorism, or other causes over which we have no control, would have a material adverse impact on our earnings and financial condition. Although new customers are required to submit a listing of personal property that will serve as collateral to secure their loans, the Company does not rely on the value of such collateral in the loan approval process and generally does not perfect its security interest in that collateral. Additional information regarding our credit risk is included in Part II, Item 7, “Management’s Discussion and Analysis of Financial Condition and Results of Operation–Credit Quality.”
21
If our estimates of loan losses are not adequate to absorb actual losses, our provision for loan losses would increase, which would adversely affect our results of operations.
To estimate the appropriate level of allowance for loan losses, we consider known and relevant internal and external factors that affect loan collectibility, including the total amount of loan receivables outstanding, historical loan receivable charge-offs, our current collection patterns, and economic trends. Our methodology for establishing our allowance for loan losses is based on the guidance in Accounting Standards Codification (“ASC”) 450, Contingencies, and, in part, on our historic loss experience. If customer behavior changes as a result of economic conditions or if we are unable to predict how economic conditions may affect our allowance for loan losses, our allowance for loan losses may be inadequate. Our allowance for loan losses is an estimate, and if actual loan losses are materially greater than our allowance for loan losses, our provision for loan losses would increase, which would result in a decline in our future earnings, and thus our results of operations could be adversely affected. Neither state regulators nor federal regulators regulate our allowance for loan losses. Additional information regarding our allowance for loan losses is included in Part II, Item 7, “Management’s Discussion and Analysis of Financial Condition and Results of Operations-Credit Quality.”
In June of 2016, the Financial Accounting Standards Board (“FASB”) issued Accounting Standards Update (“ASU”) 2016-13,
Financial Instruments-Credit Losses (Topic 326): Measurement of Credit Losses on Financial Instruments.
This ASU significantly changes the way that entities will be required to measure credit losses. The new standard requires that the estimated credit loss be based upon an “expected credit loss” approach rather than the “incurred loss” approach currently required. The new approach will require entities to measure all expected credit losses for financial assets based on historical experience, current conditions, and reasonable forecasts of collectibility. It is anticipated that the expected credit loss model may require earlier recognition of credit losses than the incurred loss approach. This ASU will become effective for fiscal years beginning after December 15, 2019, including interim periods within those fiscal years. Early adoption is permitted for fiscal years beginning after December 15, 2018, including interim periods within those fiscal years. The adoption of this ASU may have a material effect on our consolidated financial statements. See Note 1 of the Notes to Consolidated Financial Statements included in this report for more information on this new accounting standard.
The concentration of our revenues in certain states could adversely affect us.
We currently operate consumer installment loan branches in
fifteen
states in the United States. Any adverse legislative or regulatory change in any one of our states, but particularly in any of our larger states could have a material adverse effect on our business, prospects, and results of operation or financial condition. See Part I, Item 1, "Description of Business" for information regarding the size of our business in the various states in which we operate.
We have goodwill, which is subject to periodic review and testing for impairment.
At
March 31, 2018
our total assets contained
$7.0 million
of goodwill. Under generally accepted accounting principles, goodwill is subject to periodic review and testing to determine if it is impaired. Unfavorable trends in our industry and unfavorable events or disruptions to our operations resulting from adverse legislative or regulatory actions or from other unpredictable causes could result in goodwill impairment charges.
If we fail to maintain appropriate controls and procedures, we may not be able to accurately report our financial results, which could have a material adverse effect on our operations, financial condition, and the trading price of our common stock.
We are required to maintain disclosure controls and procedures and internal control over financial reporting. Section 404(a) of the Sarbanes Oxley Act of 2002 (the “Sarbanes Oxley Act”) requires us to include in our annual reports on Form 10-K an assessment by management of the effectiveness of our internal control over financial reporting. Section 404(b) of the Sarbanes Oxley Act requires us to engage our independent registered public accounting firm to attest to the effectiveness of our internal control over financial reporting. If we identify a material weakness in our controls and procedures, our ability to record, process, summarize, and report financial information accurately and within the time periods specified in the rules and forms of the SEC could be adversely affected. In addition, remediation of a material weakness would require our management to devote significant time and incur significant expense. A material weakness is a deficiency, or a combination of deficiencies, such that there is a reasonable possibility that a material misstatement of our annual or interim financial statements will not be prevented or detected on a timely basis. If we are unable to maintain effective controls and procedures we could lose investor confidence in the accuracy and completeness of our financial reports, and we may be subject to investigation or sanctions by the SEC. Any such consequence or other negative effect could adversely affect our operations, financial condition, and the trading price of our common stock.
22
Regular turnover among our managers and other employees at our branches makes it more difficult for us to operate our branches and increases our costs of operations, which could have an adverse effect on our business, results of operations and financial condition.
The annual turnover as of
March 31, 2018
among our branch employees was approximately
35.4%
. This turnover increases our cost of operations and makes it more difficult to operate our branches. If we are unable to keep our employee turnover rates consistent with historical levels or if unanticipated problems arise from our high employee turnover, our business, results of operations and financial condition could be adversely affected.
Our ability to execute our growth strategy may be adversely affected.
Our growth strategy includes opening and acquiring branches in existing and new markets and is subject to significant risks, some of which are beyond our control, including:
|
•
|
the prevailing laws and regulatory environment of each state in which we operate or seek to operate, and, to the extent applicable, federal laws and regulations, which are subject to change at any time;
|
|
•
|
our ability to obtain and maintain any regulatory approvals, government permits or licenses that may be required;
|
|
•
|
the degree of competition in new markets and its effect on our ability to attract new customers;
|
|
•
|
our ability to obtain adequate financing for our expansion plans; and
|
|
•
|
our ability to attract, train and retain qualified personnel to staff our new operations.
|
We currently lack product and business diversification; as a result, our revenues and earnings may be disproportionately negatively impacted by external factors and may be more susceptible to fluctuations than more diversified companies.
Our primary business activity is offering small consumer installment loans together with, in some states in which we operate, related ancillary products. Thus, any developments, whether regulatory, economic or otherwise, that would hinder, reduce the profitability of or limit our ability to operate our small consumer installment loan business on the terms currently conducted would have a direct and adverse impact on our business, profitability and perhaps even our viability. Our current lack of product and business diversification could inhibit our opportunities for growth, reduce our revenues and profits and make us more susceptible to earnings fluctuations than many other financial institutions whose operations are more diversified.
We depend on secure information technology, and a breach of those systems or those of third-party vendors could result in significant losses, unauthorized disclosure of confidential customer information and reputational damage, which could materially adversely affect our business, financial condition and/or results of operations and could lead to significant financial and legal exposure.
Our operations rely heavily on the secure processing, storage and transmission of personal, confidential and other information about us, our customers and third parties with which we do business. We process a significant number of customer transactions on a continuous basis through our computer systems and networks and are subject to increasingly more risk related to security systems as we enhance our mobile payment technologies and otherwise attempt to keep pace with rapid technological changes in the financial services industry. While we commit resources to the design, implementation, maintenance, and monitoring of our networks and systems, there is no guarantee that our security controls can provide absolute security. Despite the measures we implement to protect our systems and data, we may not be able to anticipate, identify, prevent or detect cyber-attacks, particularly because the techniques used by attackers change frequently or are not recognized until launched, and because cyber-attacks can originate from a wide variety of sources, including third parties who are or may be involved in organized crime or linked to terrorist organizations or hostile foreign governments. Such third parties may seek to gain unauthorized access to our systems directly, by fraudulently inducing employees, customers, or other users of our systems, or by using equipment or security passwords belonging to employees, customers, third-party service providers or other users of our systems. Or, they may seek to disrupt or disable our services through attacks such as denial-of-service attacks and ransomware attacks. In addition, we may be unable to identify, or may be significantly delayed in identifying, cyber-attacks and incidents due to the increasing use of techniques and tools that are designed to circumvent controls, to avoid detection, and to remove or obfuscate forensic artifacts. As a result, our computer systems, software and networks, as well as those of third-party vendors we utilize, may be vulnerable to unauthorized access, computer viruses, malicious attacks and other events that could have a security impact beyond our control. Our staff, technologies, systems, networks and those of third-parties we utilize also may become the target of cyber-attacks, unauthorized access, malicious code, computer viruses, denial of service attacks, ransomware, and physical attacks that could result in information security breaches, the unauthorized release, gathering, monitoring, misuse, loss or destruction of our or our customers’ confidential, proprietary and other information, or otherwise disrupt our or our customers’ operations. We also routinely transmit and receive personal, confidential and proprietary information through third parties, which may be vulnerable to interception, misuse or mishandling.
23
If one or more of such events occur, personal, confidential and other information processed and stored in, and transmitted through our computer systems and networks, or those of third-party vendors, could be compromised or could cause interruptions or malfunctions in our operations that could result in significant losses, loss of confidence by and business from customers, customer dissatisfaction, significant litigation, regulatory exposures and harm to our reputation and brand.
In the event personal, confidential or other information is threatened, intercepted, misused, mishandled or compromised, we may be required to expend significant additional resources to modify our protective measures, to investigate the circumstances surrounding the event and implement mitigation and remediation measures. We also may be subject to fines, penalties, litigation (including securities fraud class action lawsuits) and regulatory investigation costs and settlements and financial losses that are either not insured against or not fully covered through any insurance maintained by us. If one or more of such events occur, our business, financial condition and/or results of operations could be significantly and adversely affected.
Any interruption of our information systems could adversely affect us.
We rely heavily on communications and information systems to conduct our business. Each branch is part of an information network that is designed to permit us to maintain adequate cash inventory, reconcile cash balances on a daily basis and report revenues and expenses to our headquarters. Any failure or interruption of these systems, including any failure of our back-up systems, network outages, slow performance, or similar problems could result in failures or disruptions in our customer relationship management, general ledger, loan and other systems, loss of confidential Company, customer or vendor information and could result in a loss of customer confidence and business, subject us to additional regulatory scrutiny or negative publicity, or expose us to civil litigation, financial liability, and increased costs to remediate such problems, any of which could have a material adverse effect on our financial condition and results of operations.
We are subject to data privacy laws, which may significantly increase our compliance and technology costs resulting in a material adverse effect on our results of operations and financial condition.
We are subject to various privacy, data protection and information security laws, including requirements concerning security breach notification. Compliance with current or future privacy, data protection and information security laws affecting customer or employee data to which we are subject could result in higher compliance and technology costs and could materially and adversely affect our profitability. Our failure to comply with privacy, data protection and information security laws could result in potentially significant regulatory and/or governmental investigations and/or actions, litigation, fines, sanctions and damage to our reputation.
Our centralized headquarters functions are susceptible to disruption by catastrophic events, which could have a material adverse effect on our business, results of operations and financial condition.
Our headquarters building is located in Greenville, South Carolina. Our information systems and administrative and management processes are primarily provided to our branches from this centralized location, and they could be disrupted if a catastrophic event, such as severe weather, natural disaster, power outage, act of terror or similar event, destroyed or severely damaged our headquarters. Any such catastrophic event or other unexpected disruption of our headquarters functions could have a material adverse effect on our business, results of operations and financial condition.
Absence of dividends could reduce our attractiveness to investors.
Since 1989, we have not declared or paid cash dividends on our common stock and may not pay cash dividends in the foreseeable future. As a result, our common stock may be less attractive to certain investors than the stock of dividend-paying companies.
Various provisions of our charter documents and applicable laws could delay or prevent a change of control that shareholders may favor.
Provisions of our articles of incorporation, South Carolina law, and the laws in several of the states in which our operating subsidiaries are incorporated could delay or prevent a change of control that the holders of our common stock may favor or may impede the ability of our shareholders to change our management. In particular, our articles of incorporation and South Carolina law, among other things, authorize our board of directors to issue preferred stock in one or more series, without shareholder approval, and will require the affirmative vote of holders of two-thirds of our outstanding shares of voting stock, to approve our merger or consolidation with another corporation. Additional information regarding the similar effect of laws in certain states in which we operate is described in Part 1, Item 1, “Description of Business – Government Regulation.”
24
Overall stock market volatility may materially and adversely affect the market price of our common stock.
The Company’s common stock price has been and is likely to continue to be subject to significant volatility. A variety of factors could cause the price of the common stock to fluctuate, perhaps substantially, including: general market fluctuations resulting from factors not directly related to the Company’s operations or the inherent value of its common stock; state or federal legislative or regulatory proposals, initiatives, actions or changes that are, or are perceived to be, adverse to our operations or the broader consumer finance industry in general; announcements of developments related to our business; fluctuations in our operating results and the provision for loan losses; low trading volume in our common stock; decreased availability of our common stock resulting from stock repurchases and concentrations of ownership by large or institutional investors; general conditions in the financial service industry, the domestic or global economy or the domestic or global credit or capital markets; changes in financial estimates by securities analysts; our failure to meet the expectations of securities analysts or investors; negative commentary regarding our Company and corresponding short-selling market behavior; adverse developments in our relationships with our customers; investigations or legal proceedings brought against the Company or its officers; or significant changes in our senior management team.
Changes to accounting rules, regulations or interpretations could significantly affect our financial results.
New accounting rules or regulations, changes to existing accounting rules or regulations and changing interpretations of existing rules and regulations have been issued or occurred and may continue to be issued or occur in the future. Our methodology for valuing our receivables and otherwise accounting for our business is subject to change depending upon the changes in, and interpretation of, accounting rules, regulations, or interpretations. Any such changes to accounting rules, regulations or interpretations could negatively affect our reported results of operations and could negatively affect our financial condition through increased cost of compliance.
A small number of our shareholders have the ability to significantly influence matters requiring shareholder approval and such shareholders have interests which may conflict with the interests of our other security holders.
As of
May 4, 2018
, based on filings made with the SEC and other information made available to us, Prescott General Partners, LLC and its affiliates beneficially owned approximately
29.9%
of our common stock. As a result, these few shareholders are able to significantly influence matters presented to shareholders, including the election and removal of directors, the approval of significant corporate transactions, such as any reclassification, reorganization, merger, consolidation or sale of all or substantially all of our assets, and the control of our management and affairs, including executive compensation arrangements. Their interests may conflict with the interests of our other security holders.
|
Item 1B.
|
Unresolved Staff Comments
|
None.
|
Item 2.
|
Properties
|
The Company owns its headquarters facilities of approximately 42,000 square feet in Greenville, South Carolina, and all of the furniture, fixtures and computer terminals located in each branch. As of
March 31, 2018
, the Company had
1,308
branches, most of which are leased pursuant to short-term operating leases. During the fiscal year ended
March 31, 2018
, total lease expense was approximately
$28.1 million
, or an average of approximately
$21,127
per branch. The Company's leases generally provide for an initial three- to five-year term with renewal options. The Company's branches are typically located in shopping centers, malls and the first floors of downtown buildings. Branches in the U.S. and Mexico generally have an average size of
1,600
square feet.
|
Item 3.
|
Legal Proceedings
|
Mexico Investigation
As previously disclosed, in March 2017 the Company began an investigation of its operations in Mexico, focusing on the legality under the FCPA and certain local laws of certain payments related to loans, the maintenance of the Company’s books and records associated with such payments, and the treatment of compensation matters for certain employees. The Company has retained outside legal counsel and forensic accountants to lead the investigation.
25
The investigation continues to address whether and to what extent improper payments, which may violate the FCPA and other local laws, were made approximately between 2010 and 2017 by or on behalf of WAC de México SOFOM, a subsidiary of the Company, to government officials in Mexico relating to loans made to unionized employees. The Company has voluntarily contacted the SEC and the DOJ to advise both agencies that an investigation is underway and that the Company intends to cooperate with both agencies. The SEC has issued a formal order of investigation. A conclusion cannot be drawn at this time as to what potential remedies these agencies may seek. In addition, the Company cannot determine at this time the ultimate effect that the investigation or any remedial measures will have on its operations in Mexico or its decisions with respect thereto. See Part II, Item 7, "Management's Discussion and Analysis of Financial Condition and Results of Operations—Comparison of Fiscal 2018 Versus Fiscal 2017" for a discussion of our results of operations in Mexico for each of the last two fiscal years.
If violations of the FCPA or other local laws occurred, the Company could be subject to fines, civil and criminal penalties, equitable remedies, including profit disgorgement and related interest, and injunctive relief. In addition, any disposition of these matters could adversely impact our ability to collect on outstanding loans and result in further modifications to our business practices and compliance programs, including significant restructuring or curtailment of, or other effects on, our operations in Mexico. Any disposition could also potentially require that a monitor be appointed to review future business practices with the goal of ensuring compliance with the FCPA and other applicable laws. The Company could also face fines, sanctions, and other penalties from authorities in Mexico, as well as third-party claims by shareholders and/or other stakeholders of the Company. In addition, disclosure of the investigation could adversely affect the Company’s reputation and its ability to obtain new business or retain existing business from its current customers and potential customers, to attract and retain employees, and to access the capital markets. If it is determined that a violation of the FCPA has occurred, such violation may give rise to an event of default under the Company’s credit agreement if such violation were to have a material adverse effect on the Company’s business, operations, properties, assets, or condition (financial or otherwise) or if the amount of any settlement, penalties, fines or other payments resulted in the Company failing to satisfy any financial covenants. Additional potential FCPA violations or violations of other laws or regulations may be uncovered through the investigation. See Part I, Item 1A, “Risk Factors—We may be exposed to liability under the FCPA, and any determination that the Company or any of its subsidiaries has violated the FCPA could have a material adverse effect on our business and liquidity” and “—Our internal investigation of our operations in Mexico may expose the Company to other potential liabilities in addition to any potential liabilities under the FCPA and cause the Company to incur substantial expenses.”
In addition to the ultimate liability for disgorgement and related interest, the Company believes that it could be further liable for fines and penalties. We are continuing our discussions with the DOJ and SEC regarding the matters under investigation, but the Company cannot reasonably estimate the amount of any fine or penalty that it may have to pay as a part of any possible settlement or assess the potential liability that might be incurred if a settlement is not reached and the government were to litigate the matter. As such, based on the information available at this time, any additional liability related to this matter is not reasonably estimable. The Company will continue to evaluate the amount of its liability pending final resolution of the investigation and any related discussions with the government.
CFPB Investigation
As previously disclosed, on March 12, 2014, the Company received a Civil Investigative Demand (“CID”) from the Consumer Financial Protection Bureau (the “CFPB”). The stated purpose of the CID is to determine whether the Company has been or is “engaging in unlawful acts or practices in connection with the marketing, offering, or extension of credit in violation of Sections 1031 and 1036 of the Consumer Financial Protection Act, 12 U.S.C. §§ 5531, 5536, the Truth in Lending Act, 15 U.S.C. §§ 1601, et seq., Regulation Z, 12 C.F.R. pt. 1026, or any other Federal consumer financial law” and “also to determine whether Bureau action to obtain legal or equitable relief would be in the public interest.” The Company responded, within the deadlines specified in the CID, to broad requests for production of documents, answers to interrogatories and written reports related to loans made by the Company and numerous other aspects of the Company’s business.
By letter dated January 18, 2018, the CFPB informed the Company that it had concluded its investigation and would not be proceeding with an enforcement action against the Company. See Part I, Item 1, “Business - Government Regulation - Federal legislation” and Part I, Item 1A, “Risk Factors” in this Annual Report on Form 10-K for a discussion of federal regulations to which the Company’s operations are subject.
Shareholder Complaints
As previously disclosed, on April 22, 2014, a shareholder filed a putative class action complaint,
Edna Selan Epstein v. World Acceptance Corporation et al.
, in the United States District Court for the District of South Carolina (case number 6:14-cv-01606) (the "Edna Epstein Putative Class Action"), against the Company and certain of its current and former officers on behalf of all persons who purchased or otherwise acquired the Company’s common stock between April 25, 2013 and March 12, 2014. Two amended complaints were filed by the plaintiffs, and several other motions were filed in the proceedings. The complaint, as most
26
recently amended, alleged that (i) the Company made false and misleading statements in various SEC reports and other public statements in violation of federal securities laws preceding the Company’s disclosure in a Form 8-K filed March 13, 2014 that it had received the above-referenced CID from the CFPB (ii) the Company’s loan growth and volume figures were inflated because of a weakness in the Company’s internal controls relating to its accounting treatment of certain small-dollar loan re-financings and (iii) additional allegations regarding, among other things, the Company's receipt of a Notice and Opportunity to Respond and Advise letter from the CFPB on August 7, 2015. The complaint sought class certification for a class consisting of all persons who purchased or otherwise acquired the Company's common stock between January 30, 2013 and August 10, 2015, unspecified monetary damages, costs and attorneys' fees. The Company denied that the claims had any merit and opposed certification of the proposed class.
On June 7, 2017, during a court-ordered mediation, the parties reached an agreement in principle to settle the Edna Epstein Putative Class Action. The parties’ stipulation setting forth the terms of the settlement was filed with the court on August 25, 2017. The settlement stipulation provided for a settlement payment to the class of $16 million, all of which was funded by the Company’s directors and officers (D&O) liability insurance carriers. The court entered an order preliminarily approving the settlement on August 31, 2017. On December 18, 2017, the court entered a final order and judgment approving the settlement. The court’s order approving the settlement resolved the claims asserted against all defendants in the action. Neither the Company nor any of its present or former officers admitted any wrongdoing or liability in connection with the settlement.
As previously disclosed, on July 15, 2015, a shareholder filed a putative derivative complaint,
Irwin J. Lipton, et al. v. McLean, et al.
, in the United States District Court for the District of South Carolina (case number 6:15-cv-02796-MGL) (the “Lipton Derivative Action”), on behalf of the Company against certain of our current and former officers and directors. On September 21, 2015, another shareholder filed a putative derivative complaint,
Paul Parshall, et al. v. McLean, et al.
, in the United States District Court for the District of South Carolina (case number 6:15-cv-03779-MGL) (the “Parshall Derivative Action”), asserting substantially similar claims on behalf of the Company against certain of our current and former officers and directors. On October 14, 2015, the Court entered an order consolidating the Lipton Derivative Action and the Parshall Derivative Action as
In re World Acceptance Corp. Derivative Litigation
(Lead Case No. 6:15-cv-02796-MGL). The plaintiffs subsequently filed an amended complaint, and the amended consolidated complaint alleged, among other things:
|
(i)
|
that the defendants breached their fiduciary duties by disseminating false and misleading information to the Company’s shareholders regarding the Company’s loan growth, loan renewals, allowances for loan losses, revenue sources, revenue growth, compliance with U.S. generally accepted accounting principles ("GAAP"), and the sufficiency of the Company’s internal controls and accounting procedures;
|
|
(ii)
|
that the defendants breached their fiduciary duties by failing to ensure that the Company maintained adequate internal controls;
|
|
(iii)
|
that the defendants breached their fiduciary duties by failing to exercise prudent oversight and supervision of the Company’s officers and other employees to ensure conformity with all applicable laws and regulations;
|
|
(iv)
|
that the defendants were unjustly enriched as a result of the compensation they received while allegedly breaching their fiduciary duties owed to the Company;
|
|
(v)
|
that the defendants wasted corporate assets by paying excessive compensation to certain of the Company’s executive officers, awarding self-interested stock options to certain of the Company’s officers and directors, incurring legal liability and legal costs to defend the defendants’ unlawful actions, and authorizing the repurchase of Company stock at artificially inflated prices;
|
|
(vi)
|
that certain of the defendants breached their fiduciary duty to the Company by selling shares of the Company’s stock at artificially inflated prices while in the possession of material, nonpublic information regarding the Company’s financial condition;
|
|
(vii)
|
that the defendants violated Section 10(b) of the Securities Exchange Act of 1934 by making false and misleading statements regarding the Company’s practices regarding loan renewals, loan modifications, and accounting for loans;
|
|
(viii)
|
that the defendants violated Section 14(a) of the Securities Exchange Act of 1934 by failing to disclose alleged material facts in the Company’s 2014 and 2015 proxy statements; and
|
|
(ix)
|
allegations similar to those made in connection with the Edna Epstein Putative Class Action described above.
|
The consolidated complaint sought, among other things, unspecified monetary damages and an order directing the Company to take steps to reform and improve its corporate governance and internal procedures to comply with applicable laws and to protect the Company and its shareholders from future wrongdoing such as that described in the consolidated complaint. On February 28, 2017, the Court entered an order dismissing the derivative litigation. The plaintiffs filed a notice of appeal to the U.S. Court of Appeals for the Fourth Circuit on March 27, 2017.
27
On June 14, 2017, following mediation, the parties reached an agreement in principle to settle the derivative litigation. The parties’ stipulation setting forth the terms of the settlement was filed with the court on August 4, 2017. The settlement stipulation provided that the Company will adopt certain corporate governance practices and pay plaintiffs’ attorney’s fees and expenses in an amount approved by the court not to exceed $475,000, which fees and expenses have been funded by the Company’s D&O liability insurance carriers. The court entered an order preliminarily approving the settlement on August 24, 2017. On November 7, 2017, the court entered a final order and judgment approving the settlement and awarding plaintiffs’ attorney’s fees and expenses in the amount of $475,000. The court’s order approving the settlement resolved the claims asserted against all defendants in the action. Neither the Company nor any of its present or former directors and officers admitted any wrongdoing or liability in connection with the settlement.
General
In addition, from time to time the Company is involved in routine litigation matters relating to claims arising out of its operations in the normal course of business, including matters in which damages in various amounts are claimed.
Estimating an amount or range of possible losses resulting from litigation, government actions and other legal proceedings is inherently difficult and requires an extensive degree of judgment, particularly where the matters involve indeterminate claims for monetary damages, may involve fines, penalties or damages that are discretionary in amount, involve a large number of claimants or significant discretion by regulatory authorities, represent a change in regulatory policy or interpretation, present novel legal theories, are in the early stages of the proceedings, are subject to appeal or could result in a change in business practices. In addition, because most legal proceedings are resolved over extended periods of time, potential losses are subject to change due to, among other things, new developments, changes in legal strategy, the outcome of intermediate procedural and substantive rulings and other parties’ settlement posture and their evaluation of the strength or weakness of their case against us. For these reasons, we are currently unable to predict the ultimate timing or outcome of, or reasonably estimate the possible losses or a range of possible losses resulting from, the matters described above. Based on information currently available, the Company does not believe that any reasonably possible losses arising from currently pending legal matters will be material to the Company’s results of operations or financial conditions. However, in light of the inherent uncertainties involved in such matters, an adverse outcome in one or more of these matters could materially and adversely affect the Company’s financial condition, results of operations or cash flows in any particular reporting period.
|
Item 4.
|
Mine Safety Disclosures
|
None.
|
Item 5.
|
Market for Registrant's Common Equity, Related Stockholder Matters and Issuer Purchases of Equity Securities
|
Since November 26, 1991, the Company's common stock has traded on NASDAQ and is currently listed on the NASDAQ Global Select Market ("NASDAQ") under the symbol WRLD. As of
May 25, 2018
, there were
48
holders of record of our common stock and a significant number of persons or entities who hold their stock in nominee or “street” names through various brokerage firms.
Since April 1989, the Company has not declared or paid any cash dividends on its common stock. Its policy has been to retain earnings for use in its business and selectively use cash to repurchase its common stock on the open market. In the future, the Company's Board of Directors may determine whether to pay cash dividends based on conditions then existing, including the Company's earnings, financial condition, capital requirements and other relevant factors. In addition, the Company's credit agreements contain certain restrictions on the payment of cash dividends on its capital stock. See “Management’s Discussion and Analysis of Financial Condition and Results of Operations–Liquidity and Capital Resources.”
On March 10, 2015, the Board of Directors authorized the Company to repurchase up to $25.0 million of the Company’s common stock. As of
March 31, 2018
, the Company had
$1.9 million
in aggregate remaining repurchase capacity under the March 10, 2015 repurchase authorization. The timing and actual number of shares repurchased will depend on a variety of factors, including the stock price, corporate and regulatory requirements and other market and economic conditions. Although the repurchase authorization above has no stated expiration date, the Company’s stock repurchase program may be suspended or discontinued at any time. The Company has not repurchased any shares of our common stock since the first quarter of fiscal 2018. At the time of this filing, it is uncertain if or when the Company will recommence share repurchases.
28
The Company did not repurchase any shares of the Company’s common stock during the three month period ended
March 31, 2018
.
The table below reflects the stock prices published by NASDAQ by quarter for the last two fiscal years. The last reported sale price on
May 25, 2018
was
$107.87
.
|
Market Price of Common Stock
|
||||||||
|
Fiscal 2018
|
||||||||
|
Quarter
|
High
|
Low
|
||||||
|
First
|
$
|
88.26
|
|
$
|
49.26
|
|
||
|
Second
|
84.58
|
|
71.51
|
|
||||
|
Third
|
87.87
|
|
71.02
|
|
||||
|
Fourth
|
121.17
|
|
80.35
|
|
||||
|
Market Price of Common Stock
|
||||||||
|
Fiscal 2017
|
||||||||
|
Quarter
|
High
|
Low
|
||||||
|
First
|
$
|
46.24
|
|
$
|
32.40
|
|
||
|
Second
|
55.43
|
|
42.33
|
|
||||
|
Third
|
68.69
|
|
43.50
|
|
||||
|
Fourth
|
68.83
|
|
42.01
|
|
||||
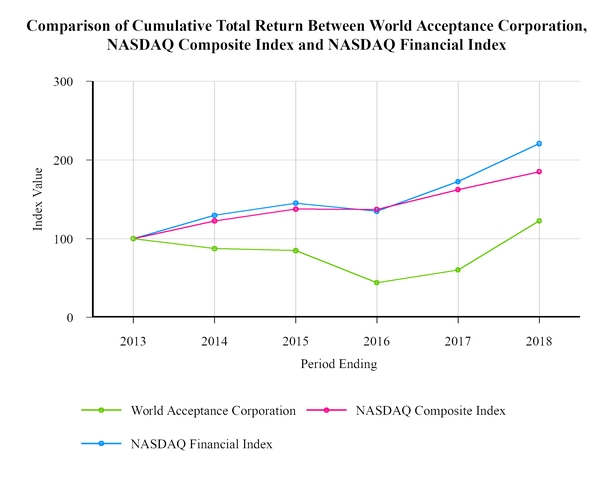
29
|
Item 6.
|
Selected Financial Data
|
Selected Consolidated Financial and Other Data
|
(Amounts in thousands, except number of branches and per share information)
|
Years Ended March 31,
|
||||||||||||||||||
|
2018
|
2017
|
2016
|
2015
|
2014
|
|||||||||||||||
|
Statement of Operations Data:
|
|
|
|||||||||||||||||
|
Interest and fee income
|
$
|
481,734
|
|
$
|
468,759
|
|
$
|
495,133
|
|
$
|
524,277
|
|
$
|
523,770
|
|
||||
|
Insurance income, net and other income
|
66,972
|
|
62,975
|
|
62,342
|
|
85,936
|
|
75,493
|
|
|||||||||
|
Total revenues
|
548,706
|
|
531,734
|
|
557,475
|
|
610,213
|
|
599,263
|
|
|||||||||
|
Provision for loan losses
|
130,979
|
|
128,572
|
|
123,598
|
|
118,830
|
|
126,575
|
|
|||||||||
|
General and administrative expenses
|
297,433
|
|
267,661
|
|
269,140
|
|
292,052
|
|
281,248
|
|
|||||||||
|
Interest expense
|
19,090
|
|
21,504
|
|
26,849
|
|
23,301
|
|
21,195
|
|
|||||||||
|
Total expenses
|
447,502
|
|
417,737
|
|
419,587
|
|
434,183
|
|
429,018
|
|
|||||||||
|
Income before income taxes
|
101,204
|
|
113,997
|
|
137,888
|
|
176,030
|
|
170,245
|
|
|||||||||
|
Income taxes
|
47,514
|
|
40,397
|
|
50,493
|
|
65,197
|
|
63,636
|
|
|||||||||
|
Net income
|
$
|
53,690
|
|
$
|
73,600
|
|
$
|
87,395
|
|
$
|
110,833
|
|
$
|
106,609
|
|
||||
|
Net income per common share (basic)
|
$
|
6.11
|
|
$
|
8.45
|
|
$
|
10.12
|
|
$
|
12.12
|
|
$
|
9.80
|
|
||||
|
Basic weighted average shares
|
8,791
|
|
8,706
|
|
8,636
|
|
9,146
|
|
10,877
|
|
|||||||||
|
Net income per common share (diluted)
|
$
|
5.99
|
|
$
|
8.38
|
|
$
|
10.05
|
|
$
|
11.90
|
|
$
|
9.60
|
|
||||
|
Diluted weighted average shares
|
8,959
|
|
8,778
|
|
8,692
|
|
9,317
|
|
11,106
|
|
|||||||||
|
Balance Sheet Data (end of period):
|
|
|
|
|
|||||||||||||||
|
Loans receivable, net of unearned interest, insurance and fees
|
$
|
806,006
|
|
$
|
767,896
|
|
$
|
776,305
|
|
$
|
812,743
|
|
$
|
813,920
|
|
||||
|
Allowance for loan losses
|
(80,826
|
)
|
(72,195
|
)
|
(69,566
|
)
|
(70,438
|
)
|
(63,255
|
)
|
|||||||||
|
Loans receivable, net
|
725,180
|
|
695,701
|
|
706,739
|
|
742,305
|
|
750,665
|
|
|||||||||
|
Total assets
|
840,987
|
|
800,589
|
|
806,219
|
|
866,131
|
|
850,028
|
|
|||||||||
|
Total debt
|
244,900
|
|
295,136
|
|
374,685
|
|
501,150
|
|
505,500
|
|
|||||||||
|
Shareholders' equity
|
541,108
|
|
461,064
|
|
391,902
|
|
315,568
|
|
307,355
|
|
|||||||||
|
Other Operating Data:
|
|
|
|
|
|||||||||||||||
|
As a percentage of average loans receivable, net:
|
|
|
|
|
|||||||||||||||
|
Provision for loan losses
|
15.9
|
%
|
16.1
|
%
|
14.8
|
%
|
13.9
|
%
|
15.1
|
%
|
|||||||||
|
Net charge-offs
|
14.9
|
%
|
15.7
|
%
|
14.8
|
%
|
12.9
|
%
|
14.7
|
%
|
|||||||||
|
Number of branches open at year-end
|
1,308
|
|
1,327
|
|
1,339
|
|
1,320
|
|
1,271
|
|
|||||||||
|
Item 7.
|
Management’s Discussion and Analysis of Financial Condition and Results of Operations
|
General
The Company's financial performance continues to be dependent in large part upon the growth in its outstanding loans receivable, the maintenance of loan quality and acceptable levels of operating expenses. Since
March 31, 2015
, gross loans receivable have
decreased
at a
0.15%
annual compounded rate from
$1.110 billion
to
$1.105 billion
at
March 31, 2018
. While our gross loans receivable have decreased from March 31, 2015, we experienced loan growth of 4.3% in fiscal 2018 after a decrease of 0.7% in fiscal 2017 and a decrease of 3.9% in fiscal 2016. We believe we were able to improve our gross loans receivable growth rates through improved marketing processes and analytics. During the three-year period beginning March 31, 2015, the Company has decreased in size from 1,320 branches to
1,308
branches as of
March 31, 2018
. Our U.S. operations have expanded in size from 1,172 branches to 1,177 branches over the same period. During fiscal
2019
, the Company currently plans to open or acquire approximately
25
new branches in the United States and evaluate acquisitions as opportunities arise.
30
The Company offers an income tax return preparation and electronic filing program in all but a few of its U.S. branches. The Company prepared approximately
77,000
,
72,000
and
63,000
returns in each of the fiscal years
2018
,
2017
and
2016
, respectively. Revenues from the Company’s tax preparation business amounted to approximately
$16.8 million
, a
14.3%
increase
over the
$14.7 million
earned during fiscal
2017
.
The following table sets forth certain information derived from the Company's consolidated statements of operations and balance sheets, as well as operating data and ratios, for the periods indicated:
|
|
Years Ended March 31,
|
||||||||||
|
|
2018
|
2017
|
2016
|
||||||||
|
|
(Dollars in thousands)
|
||||||||||
|
Gross loans receivable
|
$
|
1,105,115
|
|
$
|
1,059,804
|
|
$
|
1,066,964
|
|
||
|
Average gross loans receivable
(1)
|
$
|
1,138,401
|
|
$
|
1,100,700
|
|
$
|
1,147,956
|
|
||
|
Net loans receivable
|
$
|
806,007
|
|
$
|
767,896
|
|
$
|
776,305
|
|
||
|
Average net loans receivable
(2)
|
$
|
823,691
|
|
$
|
796,642
|
|
$
|
834,964
|
|
||
|
Expenses as a percentage of total revenue:
|
|
|
|
|
|
|
|||||
|
Provision for loan losses
|
23.9
|
%
|
24.2
|
%
|
22.2
|
%
|
|||||
|
General and administrative
|
54.2
|
%
|
50.3
|
%
|
48.3
|
%
|
|||||
|
Total interest expense
|
3.5
|
%
|
4.0
|
%
|
4.8
|
%
|
|||||
|
Operating income as a percentage of total revenue
(3)
|
21.9
|
%
|
25.5
|
%
|
29.6
|
%
|
|||||
|
Return on average assets (trailing 12 months)
|
6.3
|
%
|
8.8
|
%
|
10.1
|
%
|
|||||
|
Branches opened or acquired (merged or closed), net
|
(19
|
)
|
(12
|
)
|
19
|
|
|||||
|
Total branches (at period end)
|
1,308
|
|
1,327
|
|
1,339
|
|
|||||
_______________________________________________________
(1)
Average gross loans receivable have been determined by averaging month-end gross loans receivable over the indicated period.
(2)
Average net loans receivable have been determined by averaging month-end gross loans receivable less unearned interest and deferred fees over the indicated period.
(3)
Operating income is computed as total revenue less provision for loan losses and general and administrative expenses.
Comparison of Fiscal
2018
Versus Fiscal
2017
Net income for fiscal
2018
was
$53.7 million
, a
27.1%
decrease
from the
$73.6 million
earned during fiscal
2017
. Operating income (revenues less provision for loan losses and general and administrative expenses)
decreased
$15.2 million
. The decreases in net income and operating income were primarily driven by increases in personnel expense ($11.0 million), advertising expense ($4.4 million), and other expense ($12.5 million), partially offset by an increase in total revenues of $17.0 million. Net income was also impacted by a $15.4 million increase in income tax expense related to the Tax Cuts and Jobs Act (TCJA) and a $2.4 million decrease in interest expense.
Total revenues
increased
to
$548.7 million
in fiscal
2018
, a
$17.0 million
, or
3.2%
,
increase
from the
$531.7 million
in fiscal
2017
. Revenues from the 1,127 U.S. branches open throughout both fiscal years increased by 2.1%. At
March 31, 2018
, the Company had
1,308
branches in operation, a decrease of
19
branches from
March 31, 2017
. The decrease was the result of merging
21
branches into existing branches as well as closing
33
branches associated with the payroll deduct business in Mexico, partially offset by opening
30
new branches and acquiring
5
branches.
Interest and fee income during fiscal
2018
increased
by
$13.0 million
, or
2.8%
, from fiscal
2017
. The increase was primarily due to a corresponding increase in average earning loans. Net loans outstanding at
March 31, 2018
increased 5.0% compared to
March 31, 2017
, and average net loans outstanding
increased
3.4%
during fiscal
2018
compared to fiscal
2017
. Interest and fee income for the year also benefited from an increase in loan volumes of approximately 3.2%.
31
Insurance commissions and other income
increased
by
$4.0 million
, or
6.3%
, over the two fiscal years. Insurance commissions
increased
by
$1.1 million
, or
2.7%
, when comparing the two fiscal years due to an increase in loan volume in states where we offer our insurance product. Other income
increased
by
$2.9 million
, or
13.0%
, when comparing the two fiscal years due mainly to an increase in tax return preparation income of
$2.1 million
.
The provision for loan losses during fiscal
2018
increased by
$2.4 million
, or
1.9%
, from the previous year. This increase resulted from an increase in the amount of loans that were fully reserved during the year. Net charge-offs for fiscal
2018
amounted to $122.8 million, a 2.1% decrease from the $125.4 million charged off during fiscal
2017
. Accounts that were 60 days or more past due represented 6.3% and 5.5% of our loan portfolio on a recency basis and 8.8% and 7.8% of our portfolio on a contractual basis at
March 31, 2018
and
March 31, 2017
, respectively. When excluding the impact of payroll deduct loans in Mexico, accounts 60 days or more past due on a contractual basis represented 7.3% and 6.9% of our loan portfolio at
March 31, 2018
and
March 31, 2017
, respectively. The Company's year-over-year charge-off ratio (net charge-offs as a percentage of average net loans receivable) decreased from
15.7%
for the year ended
March 31, 2017
to
14.9%
for the year ended
March 31, 2018
. The Company's fiscal
2018
charge-off ratio of
14.9%
is consistent with the its historical charge-off ratios. Charge-off ratios for the past ten fiscal years averaged
14.5%
, with a high of
16.7%
(fiscal
2009
) and a low of
12.9%
(fiscal
2015
). The following table presents the Company's charge-off ratios since 2002.
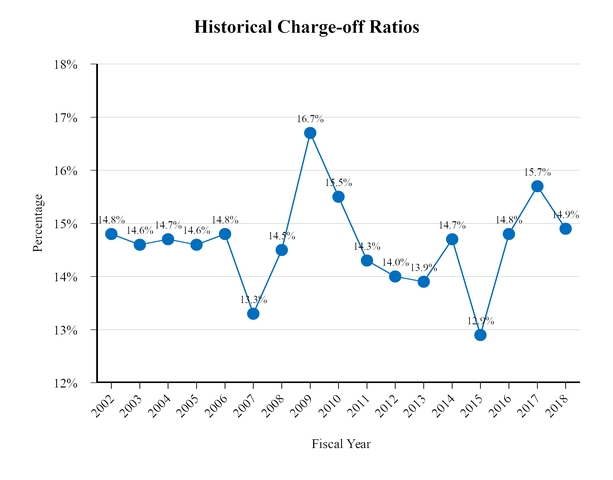
_______________________________________________________
2009
In fiscal 2009 the Company's net charge-off rate increased to 16.7%, the highest in the Company’s history due to the difficult economic environment, which put substantial pressure on our customers' ability to repay their loans.
2015
In fiscal 2015 the Company's net charge-off rate decreased to 12.9%. The net charge-off rate benefited from a change in branch level incentives during the year, which allows managers to continue collection efforts on accounts that are 90 days or more past due without having their monthly bonus negatively impacted. As expected, the change resulted in an increase in accounts 90 days or more past due and fewer charge-offs during fiscal 2015. We estimate the net charge-off rate would have been approximately 14.1% for fiscal 2015 excluding the impact of the change.
General and administrative expenses during fiscal
2018
increased
by
$29.8 million
, or
11.1%
, over the previous fiscal year. General and administrative expenses, when divided by average open branches, increased 10.8% when comparing the two fiscal years, and,
32
overall, general and administrative expenses as a percent of total revenues increased to
54.2%
in fiscal
2018
from
50.3%
in fiscal
2017
. The change in general and administrative expense is explained in greater detail below.
Personnel
expense totaled
$182.9 million
for fiscal
2018
, an
$11.0 million
, or
6.4%
,
increase
over fiscal
2017
. The increase was primarily driven by an increase in regular payroll related to annual pay increases and changes in headcount as well as increased incentive payments in the U.S. due to improved performance, $2.5 million of severance-related expense stemming from the separation agreement with the Company’s former CEO, and a $1.8 million expense related to a change in the Company’s paid time off policy that accelerated the accrual of time-off within the calendar year. The policy change became effective January 1, 2018.
Occupancy and equipment
expense totaled
$43.8 million
for for fiscal
2018
, a
$1.3 million
, or
3.1%
,
increase
over fiscal
2017
. Occupancy and equipment expense is generally a function of the number of branches the Company has open throughout the year. In fiscal 2018 the average expense per branch increased slightly to $32.9 thousand, up from $32.0 thousand in fiscal 2017.
Advertising
expense totaled
$22.3 million
for fiscal
2018
, a
$4.4 million
, or
24.8%
,
increase
over fiscal
2017
. The Company identified opportunities for customer acquisition during key time frames and, in an effort to capitalize on such opportunities, increased advertising, which resulted in more advertising campaigns being funded in the current year when compared to the prior year. In fiscal 2018 the average expense per branch increased to $16.8 thousand compared to $13.5 thousand in fiscal 2017.
Amortization of intangible assets
totaled
$1.0 million
for fiscal
2018
, a
$0.5 million
, or
102.2%
,
increase
over fiscal
2017
, which primarily relates to a corresponding
increase
in total intangible assets during the comparative periods due to acquisitions during the current and prior year.
Other
expense totaled
$47.4 million
for fiscal
2018
, a
$12.5 million
, or
35.9%
,
increase
over fiscal
2017
. The increase was primarily due to approximately $7.2 million of expense related to the Company's Mexico investigation, which began in March 2017, and a $2.3 million increase debit card fees over the prior year. Debit card fees have continued to increase as customers take advantage of the Company's pay-by-phone and on-line payment options. We have also increased our investment in information technology.
Interest expense decreased by
$2.4 million
, or
11.2%
, during fiscal
2018
when compared to the previous fiscal year as a result of a
decrease
in average debt outstanding of
13.7%
partially offset by an increase in the effective interest rate from 5.8% to 6.0%.
Income tax expense increased
$7.1 million
, or
17.6%
for fiscal 2018 compared to the prior fiscal year. The effective tax rate increased to
46.9%
for fiscal
2018
compared to
35.4%
for fiscal
2017
. The increase was primarily due to a $10.5 million charge to tax expense related to the net impact of revaluing the U.S. deferred tax assets and liabilities and a $4.8 million charge to tax expense related to the foreign transition tax in the current fiscal year. The increase was partially offset by a $3.4 million reduction in tax expense due to the reduction of the Company's U.S. federal statutory income tax rate from 35% to 31.55% for fiscal 2018.
Comparison of Fiscal
2017
Versus Fiscal
2016
Net income was $73.6 million during fiscal 2017, a 15.8% decrease from the $87.4 million earned during fiscal 2016. Operating income (revenues less provision for loan losses and general and administrative expenses) decreased $29.2 million due to a $26.4 million decrease in interest and fee income and a $5.0 million increase in provision expense offset by a $1.5 million decrease in general and administrative expenses. Net income was also impacted by a $10.1 million decrease in income tax expense and a $5.3 million decrease in interest expense.
Total revenues decreased to $531.7 million in fiscal 2017, a $25.7 million, or 4.6%, decrease from the $557.5 million in fiscal 2016. Revenues from the 1,258 branches open throughout both fiscal years decreased by 3.38%. At March 31, 2017 the Company had 1,327 branches in operation, a decrease of 12 branches from March 31, 2016. The decrease was the result of merging 44 branches into existing branches, partially offset by opening 18 new branches and acquiring 14 branches.
Interest and fee income during fiscal 2017 decreased by $26.4 million, or 5.3%, from fiscal 2016. We experienced a 4.6% decrease in our average net loans receivable. Interest and fee income for the year was also negatively impacted by a decrease in loan volumes. However, origination volume improved throughout the year and increased when comparing the fourth quarter of 2017 to the fourth quarter of 2016. Revenues from our operations in Mexico were negatively impacted by a fluctuation in the exchange rate year over year. The fluctuation in the exchange rate had a negative impact of approximately $6.4 million on fiscal 2017’s revenue compared to the prior year.
33
Insurance commissions and other income increased by $0.6 million, or 1.0%, over the two fiscal years. Insurance commissions decreased by $2.5 million, or 5.8%, when comparing the two fiscal years due to the decrease in loan volume in states where our insurance product is available to our customers. Other income increased by $3.1 million, or 16.5%, when comparing the two fiscal years due mainly from an increase in tax return income of $2.8 million.
The provision for loan losses during fiscal 2017 increased by $5.0 million, or 4.0%, from the previous year. This increase resulted from an increase in the amount of loans charged off as well as an increase in the amount of loans that were fully reserved during the year. Net charge-offs for fiscal 2017 amounted to $125.4 million, a 1.5% increase over the $123.6 million charged off during fiscal 2016. We believe that the increase in charge-offs is the result of ceasing all in-person visits to delinquent borrowers in December 2015. Accounts that were 60 days or more past due were 5.5% and 4.7% on a recency basis, and were 7.8% and 7.1% on a contractual basis at March 31, 2017 and March 31, 2016, respectively. When excluding the impact of payroll deduct loans in Mexico, the accounts contractually delinquent 60 days or more past due were 6.9% at March 31, 2017 compared to 6.4% at March 31, 2016. During fiscal 2017 the Company also had an increase in year-over-year loan loss ratios. Net charge-offs as a percentage of average net loans increased from 14.8% during fiscal 2016 to 15.7% during fiscal 2017. During fiscal 2017 the Company had a charge-off ratio of 15.7%, which is elevated compared to historical levels. From fiscal 2002 to fiscal 2006, the charge-offs as a percent of average loans ranged from 14.6% to 14.8%. In fiscal 2007 the Company experienced a temporary decline to 13.3%, which was attributed to a change in the bankruptcy law, but returned to 14.5% in fiscal 2008. In fiscal 2009 the ratio increased to 16.7%, the highest in the Company’s history as a result of the difficult economic environment and higher energy costs that our customers faced. The ratio steadily declined from 15.5% in fiscal 2010 to 13.9% in fiscal 2013 and increased to 14.7% in fiscal 2014.
General and administrative expenses during fiscal 2017 decreased by $1.5 million, or 0.5%, over the previous fiscal year. Personnel expense only increased $2.4 million despite the prior year benefiting from the release of $11.4 million of expense previously accrued for long-term equity incentive awards. Other expense decreased due to $1.2 million of expense related to a planned bond offering that was not completed being recorded in fiscal 2016 as well as a $1.5 million decrease in mileage expense. Occupancy and equipment expense decreased due to a $1.3 million loss taken as a result of the sale of the corporate jet in fiscal 2016. General and administrative expenses, when divided by average open branches, increased 0.4% when comparing the two fiscal years, and overall, general and administrative expenses as a percent of total revenues increased to 50.3% in fiscal 2017 from 48.3% in fiscal 2016.
Interest expense decreased by $5.3 million, or 19.9%, during fiscal 2017, as compared to the previous fiscal year as a result of a 3.6% decrease in the effective rate and a decrease in average debt outstanding of 24.1%.
Income tax expense decreased $10.1 million, or 20.0%, primarily from a decrease in pre-tax income. The effective tax rate decreased to 35.4% for fiscal 2017 compared to 36.6% for fiscal 2016. The decrease was primarily due to a reduction in state tax expense related to the Company's settlement with a state taxing authority during the current year.
Regulatory Matters
Mexico Investigation
As disclosed in Part I, Item 3, “Legal Proceedings—Mexico Investigation” above, the Company has retained outside counsel and forensic accountants to conduct an investigation of its operations in Mexico, focusing on the legality under the FCPA and certain local laws of certain payments related to loans, the maintenance of the Company’s books and records associated with such payments, and the treatment of compensation matters for certain employees.
The investigation continues to address whether and to what extent improper payments, which may violate the FCPA and other local laws, were made approximately between 2010 and 2017 by or on behalf of WAC de México SOFOM, a subsidiary of the Company, to government officials in Mexico relating to loans made to unionized employees. The Company has voluntarily contacted the SEC and the DOJ to advise both agencies that an investigation is underway and that the Company intends to cooperate with both agencies. The SEC has issued a formal order of investigation. A conclusion cannot be drawn at this time as to what potential remedies these agencies may seek. In addition, the Company cannot determine at this time the ultimate effect that the investigation or any remedial measures will have on its operations in Mexico or its decisions with respect thereto.
If violations of the FCPA or other local laws occurred, the Company could be subject to fines, civil and criminal penalties, equitable remedies, including profit disgorgement and related interest, and injunctive relief. In addition, any disposition of these matters could adversely impact our ability to collect on outstanding loans and result in further modifications to our business practices and compliance programs, including significant restructuring or curtailment of, or other effects on, our operations in Mexico. Any disposition could also potentially require that a monitor be appointed to review future business practices with the goal of ensuring
34
compliance with the FCPA and other applicable laws. The Company could also face fines, sanctions, and other penalties from authorities in Mexico, as well as third-party claims by shareholders and/or other stakeholders of the Company. In addition, disclosure of the investigation could adversely affect the Company’s reputation and its ability to obtain new business or retain existing business from its current customers and potential customers, to attract and retain employees, and to access the capital markets. If it is determined that a violation of the FCPA has occurred, such violation may give rise to an event of default under the Company’s credit agreement if such violation were to have a material adverse effect on the Company’s business, operations, properties, assets, or condition (financial or otherwise) or if the amount of any settlement, penalties, fines or other payments resulted in the Company failing to satisfy any financial covenants. Additional potential FCPA violations or violations of other laws or regulations may be uncovered through the investigation. See Part I, Item 1A, “Risk Factors-We may be exposed to liabilities under the FCPA, and any determination that the Company or any of its subsidiaries has violated the FCPA could have a material adverse effect on our business and liquidity,” “—Our internal investigation of our operations in Mexico may expose the Company to other potential liabilities in addition to any potential liabilities under the FCPA and cause the Company to incur substantial expenses,” “—We depend to a substantial extent on borrowings under our revolving credit agreement to fund our liquidity needs,” and “—The terms of our debt limit how we conduct our business” in this Annual Report on Form 10-K for additional information.
CFPB Investigation
As previously disclosed, on March 12, 2014, the Company received a Civil Investigative Demand (“CID”) from the Consumer Financial Protection Bureau (the “CFPB”). The stated purpose of the CID is to determine whether the Company has been or is “engaging in unlawful acts or practices in connection with the marketing, offering, or extension of credit in violation of Sections 1031 and 1036 of the Consumer Financial Protection Act, 12 U.S.C. §§ 5531, 5536, the Truth in Lending Act, 15 U.S.C. §§ 1601, et seq., Regulation Z, 12 C.F.R. pt. 1026, or any other Federal consumer financial law” and “also to determine whether Bureau action to obtain legal or equitable relief would be in the public interest.” The Company responded, within the deadlines specified in the CID, to broad requests for production of documents, answers to interrogatories and written reports related to loans made by the Company and numerous other aspects of the Company’s business.
By letter dated January 18, 2018, the CFPB informed the Company that it had concluded its investigation and would not be proceeding with an enforcement action against the Company. See Part I, Item 1, “Business - Government Regulation - Federal legislation” and Part I, Item 1A, “Risk Factors” in this Annual Report on Form 10-K for a further discussion of these matters and federal regulations to which the Company’s operations are subject.
CFPB Rulemaking Initiative
On October 5, 2017, the CFPB issued a final rule (the “Rule”) imposing limitations on (i) short-term consumer loans, (ii) longer-term consumer installment loans with balloon payments, and (iii) higher-rate consumer installment loans repayable by a payment authorization. The Rule requires lenders originating short-term loans and longer-term balloon payment loans to evaluate whether each consumer has the ability to repay the loan along with current obligations and expenses (“ability to repay requirements”). The Rule also curtails repeated unsuccessful attempts to debit consumers’ accounts for short-term loans, balloon payment loans, and installment loans that involve a payment authorization and an Annual Percentage Rate over 36% (“payment requirements”). The final Rule has significant differences from the CFPB’s proposed rules announced on June 2, 2016, relating to payday, vehicle title, and similar loans. The Company does not believe that the CFPB’s final Rule will have a material impact on the Company’s existing lending procedures because the Company currently does not make short-term consumer loans or longer-term consumer installment loans with balloon payments that would subject the Company to the Rule’s ability to repay requirements. To the extent that the Rule’s payment requirements would apply to the Company’s loans, the Company does not believe that these requirements would have a material impact on the Company’s lending procedures.
The CFPB has stated that it expects to conduct separate rulemaking to identify larger participants in the installment lending market for purposes of its supervision program. Though the timing of any such rulemaking is uncertain, the Company believes that the implementation of such rules would likely bring the Company’s business under the CFPB’s supervisory authority which, among other things, would subject the Company to reporting obligations to, and on-site compliance examinations by, the CFPB. See Part I, Item 1, “Business - Government Regulation - Federal legislation,” for a further discussion of these matters and the federal regulations to which the Company’s operations are subject and Part I, Item 1A, “Risk Factors,” for more information regarding these regulatory and related risks.
Critical Accounting Policies
The Company’s accounting and reporting policies are in accordance with GAAP and conform to general practices within the finance company industry. The significant accounting policies used in the preparation of the Consolidated Financial Statements are discussed in Note 1 to the Consolidated Financial Statements. Certain critical accounting policies involve significant judgment
35
by the Company’s management, including the use of estimates and assumptions which affect the reported amounts of assets, liabilities, revenues, and expenses. As a result, changes in these estimates and assumptions could significantly affect the Company’s financial position and results of operations. The Company considers its policies regarding the allowance for loan losses, share-based compensation, and income taxes to be its most critical accounting policies due to the significant degree of management judgment involved.
Allowance for Loan Losses
The Company has developed policies and procedures for assessing the adequacy of the allowance for loan losses that take into consideration various assumptions and estimates with respect to its loan portfolio. The Company’s assumptions and estimates may be affected in the future by changes in economic conditions, among other factors. For additional discussion concerning the allowance for loan losses, see “Credit Quality” below.
Share-Based Compensation
The Company measures compensation cost for share-based awards at fair value and recognizes compensation over the service period for awards expected to vest. The fair value of restricted stock is based on the number of shares granted and the quoted price of our common stock at the time of grant, and the fair value of stock options is determined using the Black-Scholes valuation model. The Black-Scholes model requires the input of highly subjective assumptions, including expected volatility, risk-free interest rate and expected life, changes to which can materially affect the fair value estimate. In addition, the estimation of share-based awards that will ultimately vest requires judgment, and to the extent actual results or updated estimates differ from our current estimates, such amounts will be recorded as a cumulative adjustment in the period that the estimates are revised. The Company considers many factors when estimating expected forfeitures, including types of awards, employee class, and historical experience. Actual results, and future changes in estimates, may differ substantially from our current estimates.
Income Taxes
Management uses certain assumptions and estimates in determining income taxes payable or refundable, deferred income tax liabilities and assets for events recognized differently in its financial statements and income tax returns, and income tax expense. Determining these amounts requires analysis of certain transactions and interpretation of tax laws and regulations. Management exercises considerable judgment in evaluating the amount and timing of recognition of the resulting income tax liabilities and assets. These judgments and estimates are re-evaluated on a periodic basis as regulatory and business factors change.
No assurance can be given that either the tax returns submitted by management or the income tax reported on the Consolidated Financial Statements will not be adjusted by either adverse rulings, changes in the tax code, or assessments made by the Internal Revenue Service or by state or foreign taxing authorities. The Company is subject to potential adverse adjustments including, but not limited to: an increase in the statutory federal or state income tax rates, the permanent non-deductibility of amounts currently considered deductible either now or in future periods, and the dependency on the generation of future taxable income in order to ultimately realize deferred income tax assets.
Under FASB ASC 740, the Company includes the current and deferred tax impact of its tax positions in the financial statements when it is more likely than not (likelihood of greater than 50%) that such positions will be sustained by taxing authorities, with full knowledge of relevant information, based on the technical merits of the tax position. While the Company supports its tax positions by unambiguous tax law, prior experience with the taxing authority, and analysis that considers all relevant facts, circumstances and regulations, management must still rely on assumptions and estimates to determine the overall likelihood of success and proper quantification of a given tax position.
Credit Quality
The Company’s delinquency and net charge-off ratios reflect, among other factors, changes in the mix of loans in the portfolio, the quality of receivables, the success of collection efforts, bankruptcy trends and general economic conditions.
Delinquency is computed on the basis of the date of the last full contractual payment on a loan (known as the recency method) and on the basis of the amount past due in accordance with original payment terms of a loan (known as the contractual method). Upon refinancings, the contractual delinquency of a loan is measured based upon the terms of the new agreement, and is not impacted by the refinanced loan's classification as a new loan or modification of the existing loan. Management closely monitors portfolio delinquency using both methods to measure the quality of the Company's loan portfolio and the probability of credit losses.
36
The following table classifies the gross loans receivable of the Company that were delinquent on a contractual basis for at least 61 days at March 31,
2018
,
2017
, and
2016
:
|
|
At March 31,
|
||||||||||
|
|
2018
|
2017
|
2016
|
||||||||
|
|
(Dollars in thousands)
|
||||||||||
|
Contractual basis:
|
|
|
|
|
|
|
|||||
|
61-90 days past due
|
$
|
27,908
|
|
$
|
25,824
|
|
$
|
27,082
|
|
||
|
91 days or more past due
|
69,835
|
|
56,809
|
|
48,495
|
|
|||||
|
Total
|
$
|
97,743
|
|
$
|
82,633
|
|
$
|
75,577
|
|
||
|
Percentage of period-end gross loans receivable
|
8.8
|
%
|
7.8
|
%
|
7.1
|
%
|
|||||
In fiscal
2018
approximately
79.0%
of the Company’s loans, based on accounts, were generated through refinancings of outstanding loans and the origination of new loans to previous customers. A refinancing represents a new loan transaction with a present customer in which a portion of the new loan proceeds is used to repay the balance of an existing loan and the remaining portion is advanced to the customer. For fiscal
2018
,
2017
, and
2016
, the percentages of the Company’s loan originations that were refinancings of existing loans were
65.9%
,
66.8%
, and
69.4%
, respectively. The Company’s refinancing policies, while limited by state regulations, in all cases consider the customer’s payment history and require that the customer has made multiple payments on the loan being considered for refinancing. A refinancing is considered a current refinancing if the customer is no more than 45 days delinquent on a contractual basis. Delinquent refinancings may be extended to customers who are more than 45 days past due on a contractual basis if the customer completes a new application and the manager believes that the customer’s ability and intent to repay has improved. It is the Company’s policy not to refinance delinquent loans in amounts greater than the original amounts financed. In all cases, a customer must complete a new application every two years. During fiscal
2018
and
2017
, delinquent refinancings represented
1.1%
and
1.2%
, respectively, of the Company’s total loan volume.
Charge-offs, as a percentage of loans made by category, are greatest on loans made to new borrowers and least on loans made to former borrowers and refinancings. As a percentage of total loans charged off, refinancings represent the greatest percentage due to the volume of loans made in this category. The following table depicts the charge-offs as a percent of loans made by category and as a percent of total charge-offs during fiscal
2018
:
|
Loan Volume by Category
(by No. of Accounts)
|
Percent of
Total Charge-offs
(by No. of Accounts)
|
Charge-off as a Percent of Total
Loans Made by Category
(by No. of Accounts)
|
||||||
|
Refinancings
|
65.9
|
%
|
62.1
|
%
|
5.9
|
%
|
||
|
Former borrowers
|
13.1
|
%
|
8.4
|
%
|
5.8
|
%
|
||
|
New borrowers
|
21.0
|
%
|
29.5
|
%
|
15.4
|
%
|
||
|
|
100.0
|
%
|
100.0
|
%
|
|
|
||
The Company maintains an allowance for loan losses in an amount that, in management's opinion, is adequate to provide for losses inherent in the existing loan portfolio. The Company charges against current earnings, as a provision for loan losses, amounts added to the allowance to maintain it at levels expected to cover probable losses of principal. When establishing the allowance for loan losses, the Company takes into consideration the growth of the loan portfolio, current levels of charge-offs, current levels of delinquencies, and current economic factors.
The Company uses a mathematical calculation to determine the initial allowance at the end of each reporting period. The calculation originated as management's estimate of future charge-offs and is used to allocate expenses to the branch level. There are two components when calculating the allowance for loan losses, which the Company refers to as the general reserve and the specific reserve. This calculation is a starting point, and over time, and as needed, additional provisions have been added as determined by management to ensure the allowance is adequate.
The general reserve is 4.25% of the gross loan portfolio. The specific reserve generally represents 100% of all loans 91 days or more past due on a recency basis, including bankrupt accounts in that category. This methodology is based on historical data showing that the collection of loans 91 days or more past due and bankrupt loans is remote.
37
A process is then performed to determine the adequacy of the allowance for loan losses, as well as considering trends in current levels of delinquencies, charge-off levels, and economic trends (such as energy and food prices). The primary tool used is the movement model (on a contractual and recency basis), which considers the rolling twelve months of delinquency to determine expected charge-offs. The sum of expected charge-offs, determined from the movement model (on a contractual and recency basis), plus an amount related to delinquent refinancings is compared to the allowance resulting from the mathematical calculation to determine if any adjustments are required to make the allowance adequate. Management also determines if any adjustments are needed in the event the consolidated annual provision for loan losses is less than total charge-offs. Management uses a precision level of 5% of the allowance for loan losses compared to the aforementioned movement model when determining if any adjustments are needed.
The Company's policy is to charge off at the earlier of when such loans are deemed to be uncollectible or when six months have elapsed since the date of the last full contractual payment. The Company's charge-off policy has been consistently applied and no changes have been made during the periods reported. We believe charge-offs during fiscal 2016 and 2017 were negatively impacted by ceasing all in-person visits to delinquent borrowers in December 2015. The Company's historical annual charge-off rate for the past 10 years has ranged from
12.9%
to
16.7%
of net loans. Management considers the charge-off policy when evaluating the appropriateness of the allowance for loan losses.
To estimate the losses, the Company uses historical information for net charge-offs and average loan life. This method is based on the fact that many customers refinance their loans prior to the contractual maturity. Average contractual loan terms are approximately
13
months, and the average loan life is approximately
8
months. The Company had an allowance for loan losses that approximated
9
months of average net charge-offs at March 31,
2018
. Management believes that the allowance is sufficient to cover estimated losses for its existing loans based on historical charge-offs and average loan life.
A large percentage of loans that are charged off during any fiscal year are not on the Company's books at the beginning of the fiscal year. The Company believes that it is not appropriate to provide for losses on loans that have not been originated, that twelve months of net charge-offs are not needed in the allowance due to the average life of the loan portfolio being less than twelve months and that the method employed is in accordance with GAAP.
The following is a summary of the changes in the allowance for loan losses for the years ended March 31,
2018
,
2017
, and
2016
:
|
|
2018
|
2017
|
2016
|
||||||||
|
Balance at beginning of period
|
$
|
72,194,892
|
|
$
|
69,565,804
|
|
$
|
70,437,988
|
|
||
|
Provision for loan losses
|
130,979,129
|
|
128,572,162
|
|
123,598,318
|
|
|||||
|
Loan losses
|
(138,808,839
|
)
|
(141,878,119
|
)
|
(141,758,366
|
)
|
|||||
|
Recoveries
|
16,047,215
|
|
16,519,929
|
|
18,196,110
|
|
|||||
|
Translation adjustment
|
413,331
|
|
(584,884
|
)
|
(908,246
|
)
|
|||||
|
Balance at end of period
|
$
|
80,825,728
|
|
$
|
72,194,892
|
|
$
|
69,565,804
|
|
||
|
Allowance as a percentage of loans receivable, net of unearned and deferred fees
|
10.0
|
%
|
9.4
|
%
|
9.0
|
%
|
|||||
|
Net charge-offs as a percentage of average net loans receivable
(1)
|
14.9
|
%
|
15.7
|
%
|
14.8
|
%
|
|||||
_______________________________________________________
(1)
Average net loans receivable have been determined by averaging month-end gross loans receivable less unearned interest and deferred fees over the indicated period.
Quarterly Information and Seasonality
The Company's loan volume and corresponding loans receivable follow seasonal trends. The Company's highest loan demand typically occurs from October through December, its third fiscal quarter. Loan demand has generally been the lowest and loan repayment highest from January to March, its fourth fiscal quarter. Loan volume and average balances typically remain relatively level during the remainder of the year. This seasonal trend affects quarterly operating performance through corresponding fluctuations in interest and fee income and insurance commissions earned and the provision for loan losses recorded, as well as fluctuations in the Company's cash needs. Consequently, operating results for the Company's third fiscal quarter generally are significantly lower than in other quarters and operating results for its fourth fiscal quarter are significantly higher than in other quarters.
38
The following table sets forth, on a quarterly basis, certain items included in the Company's unaudited Consolidated Financial Statements and shows the number of branches open during fiscal years
2018
and
2017
.
|
|
At or for the Three Months Ended
|
||||||||||||||||||||||||||||||
|
|
2018
|
2017
|
|||||||||||||||||||||||||||||
|
June
30,
|
September
30,
|
December
31,
|
March
31,
|
June
30,
|
September
30,
|
December
31,
|
March
31,
|
||||||||||||||||||||||||
|
(Dollars in thousands)
|
|||||||||||||||||||||||||||||||
|
|
|||||||||||||||||||||||||||||||
|
Total revenues
|
$
|
128,910
|
|
$
|
131,006
|
|
$
|
136,934
|
|
$
|
151,858
|
|
$
|
127,080
|
|
$
|
129,269
|
|
$
|
130,815
|
|
$
|
144,571
|
|
|||||||
|
Provision for loan losses
|
$
|
30,840
|
|
$
|
38,976
|
|
$
|
43,755
|
|
$
|
17,408
|
|
$
|
32,014
|
|
$
|
35,871
|
|
$
|
39,985
|
|
$
|
20,702
|
|
|||||||
|
General and administrative expenses
|
$
|
72,917
|
|
$
|
70,909
|
|
$
|
72,886
|
|
$
|
80,721
|
|
$
|
62,949
|
|
$
|
63,456
|
|
$
|
71,237
|
|
$
|
70,020
|
|
|||||||
|
Net income
|
$
|
13,068
|
|
$
|
9,799
|
|
$
|
1,680
|
|
$
|
29,143
|
|
$
|
16,618
|
|
$
|
15,491
|
|
$
|
9,640
|
|
$
|
31,851
|
|
|||||||
|
Gross loans receivable
|
$
|
1,110,372
|
|
$
|
1,147,641
|
|
$
|
1,229,304
|
|
$
|
1,105,114
|
|
$
|
1,087,502
|
|
$
|
1,095,577
|
|
$
|
1,165,009
|
|
$
|
1,059,804
|
|
|||||||
|
Number of branches open
|
1,331
|
|
1,331
|
|
1,334
|
|
1,308
|
|
1,324
|
|
1,322
|
|
1,323
|
|
1,327
|
|
|||||||||||||||
Recently Issued Accounting Pronouncements
See Part II, Item 8, Financial Statements and Supplementary Data and Note 1—Summary of Significant Accounting Policies in the Consolidated Financial Statements for the impact of new accounting pronouncements.
Liquidity and Capital Resources
The Company has financed and continues to finance its operations, acquisitions and branch expansion through a combination of cash flows from operations and borrowings from its institutional lenders. The Company has generally applied its cash flows from operations to fund its loan volume, fund acquisitions, repay long-term indebtedness and repurchase its common stock. As the Company's gross loans receivable
decreased
slightly from
$1,110.1 million
at
March 31, 2015
to
$1,105.1 million
at
March 31, 2018
, net cash provided by operating activities for fiscal years
2018
,
2017
and
2016
was
$218.0 million
,
$219.4 million
and
$206.1 million
, respectively.
The Company continues to believe stock repurchases are a viable component of the Company’s long-term financial strategy and an excellent use of excess cash when the opportunity arises. However, our amended credit facility limits share repurchases to 50% of consolidated adjusted net income in any fiscal year commencing with the fiscal year ending March 31, 2017.
The Company plans to open or acquire approximately
25
branches in the United States during fiscal
2019
. Expenditures by the Company to open and furnish new branches averaged approximately
$41,000
per branch during fiscal
2018
. New branches have generally required
$100,000
to
$400,000
to fund outstanding loans receivable originated during their first 12 months of operation. During fiscal
2018
the Company opened
30
new branches and merged or closed
54
branches into existing ones.
The Company acquired
5
branches during fiscal
2018
. The Company believes that attractive opportunities to acquire new branches or receivables from its competitors or to acquire branches in communities not currently served by the Company will continue to become available as conditions in local economies and the financial circumstances of owners change.
The Company has a revolving credit facility with a syndicate of banks. The revolving credit facility provides for revolving borrowings of up to the lesser of (a) the aggregate commitments under the facility and (b) a borrowing base, and includes a
$300,000
letter of credit subfacility. At
March 31, 2018
the aggregate commitments under the credit facility were
$480.0 million
. The borrowing base limitation is equal to the product of (a) the Company’s eligible finance receivables, less unearned finance charges, insurance premiums and insurance commissions, and (b) an advance rate percentage that ranges from 79% to 85% based on a collateral performance indicator, as more completely described below. Further, the administrative agent under the revolving credit
39
facility has the right at any time, and from time to time in its permitted discretion (but without any obligation), to set aside reasonable reserves against the borrowing base in such amounts as it may deem appropriate, including, without limitation, reserves with respect to regulatory events or any increased operational, legal or regulatory risk. In May 2017, the credit facility was amended to, among other things, extend the term through June 15, 2019.
Funds borrowed under the revolving credit facility bear interest at the LIBOR rate plus
4.0%
per annum, with a minimum rate of
5.0%
. For the year ended
March 31, 2018
, the effective interest rate, including the commitment fee, on borrowings under the revolving credit facility was
6.0%
. The Company pays a commitment fee equal to
0.50%
per annum of the daily unused portion of the commitments. On
March 31, 2018
,
$244.9 million
was outstanding under this facility, and there was
$234.8 million
of unused borrowing availability under the borrowing base limitations.
The Company’s obligations under the revolving credit facility, together with treasury management and hedging obligations owing to any lender under the revolving credit facility or any affiliate of any such lender, are required to be guaranteed by each of the Company’s wholly-owned domestic subsidiaries. The obligations of the Company and the subsidiary guarantors under the revolving credit facility, together with such treasury management and hedging obligations, are secured by a first-priority security interest in substantially all assets of the Company and the subsidiary guarantors.
The agreement governing the Company’s revolving credit facility contains affirmative and negative covenants, including covenants that restrict the ability of the Company and its subsidiaries to, among other things, incur or guarantee indebtedness, incur liens, pay dividends and repurchase or redeem capital stock, dispose of assets, engage in mergers and consolidations, make acquisitions or other investments, redeem or prepay subordinated debt, amend subordinated debt documents, make changes in the nature of its business, and engage in transactions with affiliates. The agreement also contains financial covenants, including a minimum consolidated net worth of
$330.0 million
plus 50% of the borrowers' consolidated net income for each fiscal year beginning with 2017, a minimum fixed charge coverage ratio of
2.5
to 1.0, a maximum ratio of total debt to consolidated adjusted net worth of
2.0
to 1.0, and a maximum ratio of subordinated debt to consolidated adjusted net worth of
1.0
to 1.0. The agreement allows the Company to incur subordinated debt that matures after the termination date for the revolving credit facility and that contains specified subordination terms, subject to limitations on amount imposed by the financial covenants under the agreement.
In addition, the agreement establishes a maximum specified level for the collateral performance indicator.
The collateral performance indicator is equal to the sum of (a) a three-month rolling average rate of receivables at least sixty days past due and (b) an eight-month rolling average net charge-off rate. The Company was in compliance with these covenants at
March 31, 2018
and does not believe that these covenants will materially limit its business and expansion strategy.
The agreement contains events of default including, without limitation, nonpayment of principal, interest or other obligations, violation of covenants, misrepresentation, cross-default to other debt, bankruptcy and other insolvency events, judgments, certain ERISA events, actual or asserted invalidity of loan documentation, invalidity of subordination provisions of subordinated debt, certain changes of control of the Company, and the occurrence of certain regulatory events (including the entry of any stay, order, judgment, ruling or similar event related to the Company’s or any of its subsidiaries’ originating, holding, pledging, collecting or enforcing its eligible finance receivables that is material to the Company or any subsidiary) which remains unvacated, undischarged, unbonded or unstayed by appeal or otherwise for a period of 60 days from the date of its entry and is reasonably likely to cause a material adverse change. If it is determined that a violation of the FCPA has occurred, as described above in Part I, Item 3, “Legal Proceedings—Mexico Investigation,” such violation may give rise to an event of default under our credit agreement if such violation were to have a material adverse effect on our business, operations, properties, assets, or condition (financial or otherwise) or if the amount of any settlement, penalties, fines or other payments resulted in the Company failing to satisfy any financial covenants.
The Company believes that cash flow from operations and borrowings under its revolving credit facility or other sources will be adequate to fund the expected cost of opening or acquiring new branches, including funding initial operating losses of new branches and funding loans receivable originated by those branches and the Company's other branches (for the next 12 months and for the foreseeable future beyond that). Except as otherwise discussed in this report including, but not limited to, any discussions in Part 1, Item 1A, "Risk Factors" (as supplemented by any subsequent disclosures in information the Company files with or furnishes to the SEC from time to time), management is not currently aware of any trends, demands, commitments, events or uncertainties that it believes will or could result in, or are or could be reasonably likely to result in, any material adverse effect on the Company’s liquidity.
40
The following table summarizes the Company’s contractual obligations by period (in thousands):
|
Contractual Obligations
|
Payments Due by Period
|
||||||||||||||||||
|
Total
|
Less than 1 Year
|
1-3 Years
|
3-5 Years
|
More than 5 Years
|
|||||||||||||||
|
Long-term debt obligations
|
$
|
261,678,711
|
|
$
|
13,885,830
|
|
$
|
247,792,881
|
|
$
|
—
|
|
$
|
—
|
|
||||
|
Capital lease obligations
|
—
|
|
—
|
|
—
|
|
—
|
|
—
|
|
|||||||||
|
Operating lease obligations
|
54,746,138
|
|
25,915,335
|
|
25,160,406
|
|
3,633,976
|
|
36,421
|
|
|||||||||
|
Purchase obligations
|
—
|
|
—
|
|
—
|
|
—
|
|
—
|
|
|||||||||
|
Other long-term liabilities reflected on the balance sheet under GAAP
|
—
|
|
—
|
|
—
|
|
—
|
|
—
|
|
|||||||||
|
Total
|
$
|
316,424,849
|
|
$
|
39,801,165
|
|
$
|
272,953,287
|
|
$
|
3,633,976
|
|
$
|
36,421
|
|
||||
Share Repurchase Program
On March 10, 2015, the Board of Directors authorized the Company to repurchase up to $25.0 million of the Company’s common stock. As of
March 31, 2018
, the Company had
$1.9 million
in aggregate remaining repurchase capacity under the March 10, 2015 repurchase authorization. The timing and actual number of shares repurchased will depend on a variety of factors, including the stock price, corporate and regulatory requirements and other market and economic conditions. Although the repurchase authorization above has no stated expiration date, the Company’s stock repurchase program may be suspended or discontinued at any time. The Company has not repurchased any shares of our common stock since the first quarter of fiscal 2018. At the time of this filing, it is uncertain if or when the Company will recommence share repurchases.
The Company continues to believe stock repurchases are a viable component of the Company’s long-term financial strategy and an excellent use of excess cash when the opportunity arises. However, our amended credit facility limits share repurchases to 50% of consolidated adjusted net income in any fiscal year commencing with the fiscal year ending March 31, 2017. Our first priority is to ensure we have enough capital to fund loan growth. To the extent we have excess capital, we may resume repurchasing stock, if appropriate and as authorized by our Board of Directors. As of
March 31, 2018
our debt outstanding was
$244.9 million
and our shareholders' equity was
$541.1 million
resulting in a debt-to-equity ratio of
0.5
:1.0. We will continue to monitor our debt-to-equity ratio and are committed to maintaining a debt level that will allow us to continue to execute our business objectives, while not putting undue stress on our consolidated balance sheet.
Inflation
The Company does not believe that inflation, within reasonably anticipated rates, will have a materially adverse effect on its financial condition. Although inflation would increase the Company’s operating costs in absolute terms, the Company expects that the same decrease in the value of money would result in an increase in the size of loans demanded by its customer base. It is reasonable to anticipate that such a change in customer preference would result in an increase in total loan receivables and an increase in absolute revenues to be generated from that larger amount of loans receivable. The Company believes that this increase in absolute revenues should offset any increase in operating costs. In addition, because the Company’s loans have a relatively short contractual term and average life, it is unlikely that loans made at any given point in time will be repaid with significantly inflated dollars.
Legal Matters
From time to time the Company is involved in routine litigation relating to claims arising out of its operations in the normal course of business. See Part I, Item 3, “Legal Proceedings” and Note 16 to our audited Consolidated Financial Statements for further discussion of legal matters.
41
|
Item 7A.
|
Quantitative and Qualitative Disclosures About Market Risk
|
Interest Rate Risk
As of
March 31, 2018
, the Company’s financial instruments consisted of the following: cash and cash equivalents, loans receivable, and senior notes payable. Fair value approximates carrying value for all of these instruments. Loans receivable are originated at prevailing market rates and have an average life of approximately
8
months. Given the short-term nature of these loans, they are continually repriced at current market rates. The Company’s outstanding debt under its revolving credit facility was
$244.9 million
at
March 31, 2018
. Interest on borrowings under this facility is based on the rate of LIBOR plus
4.0%
, with a minimum rate of
5.0%
Based on the outstanding balance under the Company's revolving credit facility at
March 31, 2018
, a change of 1% in the LIBOR interest rate would cause a change in interest expense of approximately
$2.4 million
on an annual basis.
Foreign Currency Exchange Rate Risk
The Company has operated branches in Mexico since September 2005, where its local businesses utilize the Mexican peso as their functional currency. The consolidated financial statements of the Company are denominated in U.S. dollars and are, therefore, subject to fluctuation as the U.S. dollar and Mexican peso foreign exchange rate changes. Revenues from our non-U.S. operations accounted for approximately
8.4%
and
7.7%
of total revenues during the twelve-month periods ended March 31,
2018
and
2017
, respectively. There have been, and there may continue to be, period-to-period fluctuations in the relative portions of our international revenues to total consolidated revenues.
Our international operations are subject to risks, including but not limited to differing economic conditions, changes in political climate, differing tax structures, other regulations and restrictions, and foreign exchange rate volatility when compared to the United States. Accordingly, our future consolidated financial position as well as our consolidated results of operations could be adversely affected by changes in these or other factors. Foreign exchange rate fluctuations may adversely impact our financial position as the assets and liabilities of our foreign operations are translated into U.S. dollars in preparing our consolidated balance sheet. Our exposure to foreign exchange rate fluctuations arises in part from balances in our intercompany accounts included on our subsidiary balance sheets. These intercompany accounts are denominated in the functional currency of the foreign subsidiaries and are translated to U.S. dollars at each reporting period end. Additionally, foreign exchange rate fluctuations may impact our consolidated results from operations as exchange rate fluctuations will impact the amounts reported in our consolidated statement of income. The effect of foreign exchange rate fluctuations on our consolidated financial position is recognized within shareholders’ equity through accumulated other comprehensive income (loss). The net translation adjustment for the twelve months ended March 31,
2018
was
income
of approximately
$1.7 million
. The Company’s foreign currency exchange rate exposure may change over time as business practices evolve and could have a material effect on the Company’s financial results. The Company will continue to monitor and assess the effect of foreign currency fluctuations and may institute hedging strategies.
The Company performs a foreign exchange sensitivity analysis on a quarterly basis, which assumes a hypothetical 10% increase and decrease in the value of the U.S. dollar relative to the Mexican peso. The foreign exchange risk sensitivity of both net loans receivable and consolidated net income is assessed using hypothetical scenarios and assumes that earnings in Mexican pesos are recognized evenly throughout a period. The actual results may differ from the results noted in the tables below, particularly due to assumptions utilized or if events occur that were not included in the method used.
42
The foreign exchange risk sensitivity of net loans denominated in Mexican pesos and translated into U.S. dollars, which were approximately
$60.8 million
and
$66.2 million
at March 31,
2018
and
2017
, respectively, on the reported net loans receivable amount is summarized in the following table:
|
Foreign Exchange Sensitivity Analysis of Loans Receivable, Net of Unearned Amounts
|
||||||||||||
|
|
As of March 31, 2018
|
|||||||||||
|
Foreign exchange spot rate, U.S. Dollars to Mexican Pesos
|
(10
|
)%
|
0
|
%
|
10
|
%
|
||||||
|
Loans receivable, net of unearned
|
$
|
800,482,329
|
|
$
|
806,006,456
|
|
$
|
812,758,181
|
|
|||
|
% change from base amount
|
(0.69
|
)%
|
—
|
|
0.84
|
%
|
||||||
|
$ change from base amount
|
$
|
(5,524,127
|
)
|
$
|
—
|
|
$
|
6,751,725
|
|
|||
|
|
As of March 31, 2017
|
|||||||||||
|
Foreign exchange spot rate, U.S. Dollars to Mexican Pesos
|
(10
|
)%
|
0
|
%
|
10
|
%
|
||||||
|
Loans receivable, net of unearned
|
$
|
761,880,589
|
|
$
|
767,895,481
|
|
$
|
775,247,049
|
|
|||
|
% change from base amount
|
(0.78
|
)%
|
—
|
|
0.96
|
%
|
||||||
|
$ change from base amount
|
$
|
(6,014,892
|
)
|
$
|
—
|
|
$
|
7,351,568
|
|
|||
The following table summarizes the results of the foreign exchange risk sensitivity analysis on reported net income as of the dates indicated below:
|
Foreign Exchange Sensitivity Analysis of Net Income
|
||||||||||||
|
|
As of March 31, 2018
|
|||||||||||
|
Foreign exchange spot rate, U.S. Dollars to Mexican Pesos
|
(10
|
)%
|
0
|
%
|
10
|
%
|
||||||
|
Net Income
|
$
|
53,272,105
|
|
$
|
53,690,018
|
|
$
|
54,200,774
|
|
|||
|
% change from base amount
|
(0.78
|
)%
|
—
|
|
0.95
|
%
|
||||||
|
$ change from base amount
|
$
|
(417,913
|
)
|
$
|
—
|
|
$
|
510,756
|
|
|||
|
|
As of March 31, 2017
|
|||||||||||
|
Foreign exchange spot rate, U.S. Dollars to Mexican Pesos
|
(10
|
)%
|
0
|
%
|
10
|
%
|
||||||
|
Net Income
|
$
|
73,072,121
|
|
$
|
73,600,294
|
|
$
|
74,245,840
|
|
|||
|
% change from base amount
|
(0.72
|
)%
|
—
|
|
0.88
|
%
|
||||||
|
$ change from base amount
|
$
|
(528,173
|
)
|
$
|
—
|
|
$
|
645,546
|
|
|||
43
|
Item 8.
|
Financial Statements and Supplementary Data
|
|
March 31,
|
||||||
|
|
2018
|
2017
|
||||
|
ASSETS
|
|
|
||||
|
Cash and cash equivalents
|
$
|
32,086,304
|
|
15,200,410
|
|
|
|
Gross loans receivable
|
1,105,114,792
|
|
1,059,804,132
|
|
||
|
Less:
|
|
|
|
|
||
|
Unearned interest, insurance and fees
|
(299,108,336
|
)
|
(291,908,651
|
)
|
||
|
Allowance for loan losses
|
(80,825,728
|
)
|
(72,194,892
|
)
|
||
|
Loans receivable, net
|
725,180,728
|
|
695,700,589
|
|
||
|
Property and equipment, net
|
25,591,418
|
|
24,184,207
|
|
||
|
Deferred income taxes, net
|
30,239,637
|
|
39,025,069
|
|
||
|
Other assets, net
|
14,210,186
|
|
13,797,098
|
|
||
|
Goodwill
|
7,034,463
|
|
6,067,220
|
|
||
|
Intangible assets, net
|
6,644,301
|
|
6,614,182
|
|
||
|
Total assets
|
$
|
840,987,037
|
|
800,588,775
|
|
|
|
LIABILITIES & SHAREHOLDERS' EQUITY
|
|
|
|
|
||
|
Liabilities:
|
|
|
|
|
||
|
Senior notes payable
|
244,900,000
|
|
295,136,200
|
|
||
|
Income taxes payable
|
14,534,970
|
|
12,519,417
|
|
||
|
Accounts payable and accrued expenses
|
40,444,215
|
|
31,869,581
|
|
||
|
Total liabilities
|
299,879,185
|
|
339,525,198
|
|
||
|
Shareholders' equity:
|
|
|
|
|
||
|
Preferred stock, no par value Authorized 5,000,000, no shares issued or outstanding
|
—
|
|
—
|
|
||
|
Common stock, no par value Authorized 95,000,000 shares; issued and outstanding 9,119,443 and 8,782,949 shares at March 31, 2018 and March 31, 2017, respectively
|
—
|
|
—
|
|
||
|
Additional paid-in capital
|
175,887,227
|
|
144,241,105
|
|
||
|
Retained earnings
|
391,275,705
|
|
344,605,347
|
|
||
|
Accumulated other comprehensive loss
|
(26,055,080
|
)
|
(27,782,875
|
)
|
||
|
Total shareholders' equity
|
541,107,852
|
|
461,063,577
|
|
||
|
Commitments and contingencies
|
|
|
|
|
||
|
Total liabilities and shareholders' equity
|
$
|
840,987,037
|
|
800,588,775
|
|
|
See accompanying notes to Consolidated Financial Statements.
44
|
|
Years Ended March 31,
|
||||||||||
|
|
2018
|
2017
|
2016
|
||||||||
|
Revenues:
|
|
|
|
||||||||
|
Interest and fee income
|
$
|
481,734,277
|
|
$
|
468,759,262
|
|
$
|
495,133,436
|
|
||
|
Insurance income, net and other income
|
66,971,857
|
|
62,975,462
|
|
62,342,271
|
|
|||||
|
Total revenues
|
548,706,134
|
|
531,734,724
|
|
557,475,707
|
|
|||||
|
Expenses:
|
|
|
|
|
|
|
|||||
|
Provision for loan losses
|
130,979,129
|
|
128,572,162
|
|
123,598,318
|
|
|||||
|
General and administrative expenses:
|
|
|
|
|
|
|
|||||
|
Personnel
|
182,947,342
|
|
171,958,682
|
|
169,573,039
|
|
|||||
|
Occupancy and equipment
|
43,772,794
|
|
42,437,711
|
|
44,460,905
|
|
|||||
|
Advertising
|
22,293,705
|
|
17,866,422
|
|
16,863,076
|
|
|||||
|
Amortization of intangible assets
|
990,399
|
|
489,836
|
|
528,747
|
|
|||||
|
Other
|
47,428,625
|
|
34,908,572
|
|
37,713,908
|
|
|||||
|
Total general and administrative expenses
|
297,432,865
|
|
267,661,223
|
|
269,139,675
|
|
|||||
|
Interest expense
|
19,089,635
|
|
21,504,208
|
|
26,849,250
|
|
|||||
|
Total expenses
|
447,501,629
|
|
417,737,593
|
|
419,587,243
|
|
|||||
|
Income before income taxes
|
101,204,505
|
|
113,997,131
|
|
137,888,464
|
|
|||||
|
Income taxes
|
47,514,487
|
|
40,396,837
|
|
50,492,907
|
|
|||||
|
Net income
|
$
|
53,690,018
|
|
$
|
73,600,294
|
|
$
|
87,395,557
|
|
||
|
Net income per common share:
|
|
|
|
|
|
|
|||||
|
Basic
|
$
|
6.11
|
|
$
|
8.45
|
|
$
|
10.12
|
|
||
|
Diluted
|
$
|
5.99
|
|
$
|
8.38
|
|
$
|
10.05
|
|
||
|
Weighted average common shares outstanding:
|
|
|
|
|
|
|
|||||
|
Basic
|
8,791,168
|
|
8,705,658
|
|
8,636,269
|
|
|||||
|
Diluted
|
8,958,676
|
|
8,778,044
|
|
8,692,191
|
|
|||||
See accompanying notes to Consolidated Financial Statements.
45
CONSOLIDATED STATEMENTS OF COMPREHENSIVE INCOME
|
Years Ended March 31,
|
|||||||||
|
2018
|
2017
|
2016
|
|||||||
|
Net income
|
$
|
53,690,018
|
|
73,600,294
|
|
87,395,557
|
|
||
|
Foreign currency translation adjustments
|
1,727,795
|
|
(4,848,530
|
)
|
(8,031,995
|
)
|
|||
|
Comprehensive income
|
$
|
55,417,813
|
|
68,751,764
|
|
79,363,562
|
|
||
See accompanying notes to Consolidated Financial Statements.
46
CONSOLIDATED STATEMENTS OF SHAREHOLDERS' EQUITY
|
|
Additional
Paid-in Capital
|
Retained
Earnings
|
Accumulated Other Comprehensive Loss, net
|
Total
Shareholders'
Equity
|
||||||||
|
Balances at March 31, 2015
|
$
|
141,864,764
|
|
188,605,305
|
|
(14,902,350
|
)
|
315,567,719
|
|
|||
|
Proceeds from exercise of stock options (89,403 shares), including tax benefits of $78,382
|
3,327,067
|
|
—
|
|
—
|
|
3,327,067
|
|
||||
|
Restricted common stock expense under stock option plan, net of cancellations ($2,289,017)
|
(10,322,230
|
)
|
—
|
|
—
|
|
(10,322,230
|
)
|
||||
|
Stock option expense
|
3,965,463
|
|
—
|
|
|
|
3,965,463
|
|
||||
|
Other comprehensive loss
|
—
|
|
—
|
|
(8,031,995
|
)
|
(8,031,995
|
)
|
||||
|
Net income
|
—
|
|
87,395,557
|
|
—
|
|
87,395,557
|
|
||||
|
Balances at March 31, 2016
|
$
|
138,835,064
|
|
276,000,862
|
|
(22,934,345
|
)
|
391,901,581
|
|
|||
|
Proceeds from exercise of stock options (32,702 shares), including tax expense of -$565,162
|
595,343
|
|
—
|
|
—
|
|
595,343
|
|
||||
|
Common stock repurchases (95,703 shares)
|
—
|
|
(4,995,809
|
)
|
—
|
|
(4,995,809
|
)
|
||||
|
Restricted common stock expense under stock option plan, net of cancellations ($284,221)
|
1,320,036
|
|
—
|
|
—
|
|
1,320,036
|
|
||||
|
Stock option expense
|
3,490,662
|
|
—
|
|
—
|
|
3,490,662
|
|
||||
|
Other comprehensive loss
|
—
|
|
—
|
|
(4,848,530
|
)
|
(4,848,530
|
)
|
||||
|
Net income
|
—
|
|
73,600,294
|
|
—
|
|
73,600,294
|
|
||||
|
Balances at March 31, 2017
|
$
|
144,241,105
|
|
344,605,347
|
|
(27,782,875
|
)
|
461,063,577
|
|
|||
|
Proceeds from exercise of stock options (389,888 shares)
|
25,323,531
|
|
—
|
|
—
|
|
25,323,531
|
|
||||
|
Common stock repurchases (58,728 shares)
|
—
|
|
(4,614,331
|
)
|
—
|
|
(4,614,331
|
)
|
||||
|
Restricted common stock expense under stock option plan, net of cancellations ($1,517,357)
|
1,564,048
|
|
—
|
|
—
|
|
1,564,048
|
|
||||
|
Stock option expense
|
2,353,214
|
|
—
|
|
—
|
|
2,353,214
|
|
||||
|
ASU 2016-09 adoption
|
2,405,329
|
|
(2,405,329
|
)
|
—
|
|
—
|
|
||||
|
Other comprehensive income
|
—
|
|
—
|
|
1,727,795
|
|
1,727,795
|
|
||||
|
Net income
|
—
|
|
53,690,018
|
|
—
|
|
53,690,018
|
|
||||
|
Balances at March 31, 2018
|
$
|
175,887,227
|
|
391,275,705
|
|
(26,055,080
|
)
|
541,107,852
|
|
|||
See accompanying notes to Consolidated Financial Statements.
47
|
|
Years Ended March 31,
|
||||||||
|
|
2018
|
2017
|
2016
|
||||||
|
Cash flow from operating activities:
|
|
|
|
||||||
|
Net income
|
$
|
53,690,018
|
|
73,600,294
|
|
87,395,557
|
|
||
|
Adjustments to reconcile net income to net cash provided by operating activities:
|
|
|
|
|
|
|
|||
|
Amortization of intangible assets
|
990,399
|
|
489,836
|
|
528,747
|
|
|||
|
Amortization of debt issuance costs
|
865,727
|
|
2,029,719
|
|
2,769,596
|
|
|||
|
Provision for loan losses
|
130,979,129
|
|
128,572,162
|
|
123,598,318
|
|
|||
|
Depreciation
|
7,339,657
|
|
6,918,525
|
|
6,503,561
|
|
|||
|
Loss (gain) on sale of property and equipment
|
210,117
|
|
(29,583
|
)
|
1,401,391
|
|
|||
|
Deferred income tax expense (benefit)
|
8,785,432
|
|
(894,086
|
)
|
(785,377
|
)
|
|||
|
Compensation related to stock option and restricted stock plans, net of taxes and adjustments
|
5,434,619
|
|
4,810,698
|
|
(6,356,767
|
)
|
|||
|
Gain on sale of finance receivables, net of buybacks
|
—
|
|
—
|
|
(1,474,182
|
)
|
|||
|
Change in accounts:
|
|||||||||
|
Other assets, net
|
(858,817
|
)
|
492,233
|
|
1,923,196
|
|
|||
|
Income taxes payable
|
2,015,553
|
|
4,277,275
|
|
(9,945,544
|
)
|
|||
|
Accounts payable and accrued expenses
|
8,574,634
|
|
(904,326
|
)
|
511,863
|
|
|||
|
Net cash provided by operating activities
|
218,026,468
|
|
219,362,747
|
|
206,070,359
|
|
|||
|
Cash flows from investing activities:
|
|
|
|
|
|
|
|||
|
Increase in loans receivable, net
|
(143,373,549
|
)
|
(104,765,019
|
)
|
(93,980,511
|
)
|
|||
|
Net assets acquired from branch acquisitions, primarily loans
|
(15,586,411
|
)
|
(16,703,456
|
)
|
(92,097
|
)
|
|||
|
Increase in intangible assets from acquisitions
|
(1,987,762
|
)
|
(4,133,242
|
)
|
(81,531
|
)
|
|||
|
Purchases of property and equipment
|
(9,171,468
|
)
|
(6,813,582
|
)
|
(8,654,804
|
)
|
|||
|
Proceeds from sale of property and equipment
|
310,542
|
|
801,797
|
|
889,946
|
|
|||
|
Proceeds from sale of loan receivable, net of buybacks
|
—
|
|
—
|
|
26,218
|
|
|||
|
Net cash used in investing activities
|
(169,808,648
|
)
|
(131,613,502
|
)
|
(101,892,779
|
)
|
|||
|
Cash flow from financing activities:
|
|
|
|
|
|
|
|||
|
Borrowings from senior notes payable
|
294,963,800
|
|
274,901,200
|
|
295,095,000
|
|
|||
|
Payments on senior notes payable
|
(345,200,000
|
)
|
(354,450,000
|
)
|
(421,560,000
|
)
|
|||
|
Debt issuance costs associated with senior notes payable
|
(420,000
|
)
|
(201,200
|
)
|
(5,500,000
|
)
|
|||
|
Proceeds from exercise of stock options
|
25,323,531
|
|
1,160,505
|
|
3,248,685
|
|
|||
|
Payments for taxes related to net share settlement of equity awards
|
(1,517,357
|
)
|
—
|
|
—
|
|
|||
|
Repurchase of common stock
|
(4,614,331
|
)
|
(4,995,809
|
)
|
—
|
|
|||
|
Excess tax benefit (expense) from exercise of stock options
|
—
|
|
(565,162
|
)
|
78,382
|
|
|||
|
Net cash used in financing activities
|
(31,464,357
|
)
|
(84,150,466
|
)
|
(128,637,933
|
)
|
|||
|
Effects of foreign currency fluctuations on cash and cash equivalents
|
132,431
|
|
(775,393
|
)
|
(1,501,558
|
)
|
|||
|
Net change in cash and cash equivalents
|
16,885,894
|
|
2,823,386
|
|
(25,961,911
|
)
|
|||
|
Cash and cash equivalents at beginning of year
|
15,200,410
|
|
12,377,024
|
|
38,338,935
|
|
|||
|
Cash and cash equivalents at end of year
|
$
|
32,086,304
|
|
15,200,410
|
|
12,377,024
|
|
||
|
Supplemental Disclosures:
|
|||||||||
|
Interest paid during the year
|
$
|
17,696,711
|
|
19,251,788
|
|
23,811,210
|
|
||
|
Income taxes paid during the year
|
$
|
38,741,119
|
|
38,042,020
|
|
62,530,594
|
|
||
See accompanying notes to Consolidated Financial Statements.
48
NOTES TO CONSOLIDATED FINANCIAL STATEMENTS
|
(1)
|
Summary of Significant Accounting Policies
|
The Company's accounting and reporting policies are in accordance with U.S. generally accepted accounting principles ("GAAP") and conform to general practices within the finance company industry. The following is a description of the more significant of these policies used in preparing the Consolidated Financial Statements.
Nature of Operations
The Company is a small-dollar consumer finance (installment loan) company headquartered in Greenville, South Carolina that offers short-term small loans, medium-term larger loans, related credit insurance products and ancillary products and services to individuals who have limited access to other sources of consumer credit. It also offers income tax return preparation services to its customer base and to others.
As of
March 31, 2018
, the Company operated
1,177
branches in Alabama, Georgia, Idaho, Illinois, Indiana, Kentucky, Louisiana, Mississippi, Missouri, New Mexico, Oklahoma, South Carolina, Tennessee, Texas, and Wisconsin. Branches in the aforementioned states operate under one of the following names: Amicable Finance, Capitol Loans, Colonial Finance, Freeman Finance, General Credit, Local Loans, Midwestern Financial, Midwestern Loans, Personal Credit, People's Finance, World Acceptance, or World Finance. The Company also operated
131
branches in Mexico. Branches in Mexico operate under the name Pr
é
stamos Avance or Pr
é
stamos Viva. The Company is subject to numerous lending regulations that vary by jurisdiction.
Principles of Consolidation
The Consolidated Financial Statements include the accounts of World Acceptance Corporation and its wholly-owned subsidiaries (the “Company”). Subsidiaries consist of operating entities in various states and Mexico, ParaData Financial Systems (a software company acquired during fiscal 1994), WAC Insurance Company, Ltd. (a captive reinsurance company established in fiscal 1994) and Servicios World Acceptance Corporation de Mexico (a service company established in fiscal 2006). All significant inter-company balances and transactions have been eliminated in consolidation.
The financial statements of the Company’s foreign subsidiaries in Mexico are prepared using the local currency as the functional currency. Assets and liabilities of these subsidiaries are translated into U.S. dollars at the current exchange rate while income and expense are translated at an average exchange rate for the period. The resulting translation gains and losses are recognized as a component of equity in “
Accumulated Other Comprehensive Loss, net
.”
Use of Estimates in the Preparation of Consolidated Financial Statements
The preparation of financial statements in conformity with GAAP requires management to make estimates and assumptions that affect the reported amount of assets and liabilities and disclosure of contingent liabilities at the date of the financial statements and the reported amounts of revenue and expenses during the reporting period. Actual results could differ from those estimates. The most significant item subject to such estimates and assumptions that could materially change in the near term is the allowance for loan losses.
Reclassification
Certain prior period amounts have been reclassified to conform to the current presentation. Such reclassifications had no impact on previously reported net income or shareholders' equity.
Business Segments
The Company reports operating segments in accordance with Financial Accounting Standards Board ("FASB") Accounting Standards Codification ("ASC") Topic 280. Operating segments are components of an enterprise about which separate financial information is available that is evaluated regularly by the chief operating decision maker in deciding how to allocate resources and assess performance. FASB ASC Topic 280 requires that a public enterprise report a measure of segment profit or loss, certain specific revenue and expense items, segment assets, information about the way that the operating segments were determined and other items.
49
The Company has
two
reportable segments, which are the U.S. and Mexico operating segments. The other revenue generating activities of the Company, including the sale of insurance products, income tax preparation, and the automobile club, are done within the existing branch network in conjunction with or as a complement to the lending operations. There is no discrete financial information available for these activities, and they do not meet the criteria under FASB ASC Topic 280 to be considered operating segments.
At
March 31, 2018
and
2017
, the Company's Mexico operations accounted for approximately
9.5%
and
8.7%
of total consolidated assets, respectively. Total revenues for the years ended
March 31, 2018
,
2017
and
2016
were
$46.0 million
,
$40.9 million
,
$42.2 million
, respectively, which represented
8.4%
,
7.7%
, and
7.6%
of consolidated revenues, respectively.
For additional financial information regarding the results of our two reportable segments for each of the last three fiscal years, refer to Note 17—Segments in Item 8, “Financial Statements and Supplementary Data” of this Annual Report on Form 10-K.
Cash and Cash Equivalents
For purposes of the statement of cash flows, the Company considers all highly liquid investments with a maturity of
three
months or less from the date of original issuance to be cash equivalents. As of
March 31, 2018
and
2017
the Company had
$5.5 million
and
$3.9 million
, respectively, in restricted cash associated with its captive insurance subsidiary that reinsures a portion of the credit insurance sold in connection with loans made by the Company.
Loans and Interest and Fee Income
The Company is licensed to originate consumer loans in the states of South Carolina, Georgia, Texas, Oklahoma, Louisiana, Tennessee, Illinois, Missouri, New Mexico, Kentucky, Alabama, Wisconsin, Indiana, Mississippi and Idaho. In addition, the Company also originates consumer loans in Mexico. During fiscal
2018
,
2017
and
2016
the Company originated loans generally ranging up to
$4,000
, with terms of
42 months
or fewer. Experience indicates that a majority of the consumer loans are refinanced, and the Company accounts for the majority of the refinancings as new loans. Generally a customer must make multiple payments in order to qualify for refinancing. Furthermore, the Company's lending policy has predetermined lending amounts so that in most cases a refinancing will result in advancing additional funds. The Company believes that the advancement of additional funds constitutes more than a minor modification to the terms of the existing loan if the present value of the cash flows under the terms of the new loan will be
10%
or more of the present value of the remaining cash flows under the terms of the original loan.
Gross loans receivable at
March 31, 2018
and
2017
consisted of the following:
|
2018
|
2017
|
|||||
|
Small loans (U.S.)
|
$
|
670,189,211
|
|
630,802,614
|
|
|
|
Large loans (U.S.)
|
334,041,731
|
|
312,458,275
|
|
||
|
Sales finance loans (U.S.)
(1)
|
2,217
|
|
54,247
|
|
||
|
Payroll deduct "Viva" loans (Mexico)
(2)
|
49,952,025
|
|
69,087,314
|
|
||
|
Traditional installment loans (Mexico)
|
50,929,608
|
|
47,401,682
|
|
||
|
Total gross loans
|
$
|
1,105,114,792
|
|
1,059,804,132
|
|
|
_______________________________________________________
(1)
The Company decided to wind down the World Class Buying Club program during the third quarter of fiscal 2015. As of March 31, 2015, the Company is no longer financing the purchase of products through the program; however, the Company will continue to service the outstanding retail installment sales contracts.
(2)
The Company stopped originations of this loan product in fiscal 2018.
Fees received and direct costs incurred for the origination of loans are deferred and amortized to interest income over the contractual lives of the loans using the interest method. Unamortized amounts are recognized in income at the time that loans are refinanced or paid in full except for those refinancings that do not constitute a more than minor modification.
50
Loans are carried at the gross amount outstanding, reduced by unearned interest and insurance income, net of deferred origination fees and direct costs and an allowance for loan losses. The Company recognizes interest and fee income using the interest method. Charges for late payments are credited to income when collected.
The Company generally offers its loans at the prevailing statutory rates for terms generally not to exceed
42 months
. Management believes that the carrying value approximates the fair value of its loan portfolio.
Nonaccrual Policy
The accrual of interest is discontinued when a loan is 61 days or more past the contractual due date. When the interest accrual is discontinued, all unpaid accrued interest is reversed against interest income. While a loan is on nonaccrual status, interest revenue is recognized only when a payment is received. Once a loan moves to nonaccrual status, it remains in nonaccrual status until it is paid out, charged off or refinanced.
Allowance for Loan Losses
The Company maintains an allowance for loan losses in an amount that, in management's opinion, is adequate to provide for incurred losses inherent in the existing loan portfolio. The Company charges against current earnings, as a provision for loan losses, amounts added to the allowance to maintain it at levels expected to cover probable incurred losses of principal. When establishing the allowance for loan losses, the Company takes into consideration the growth of the loan portfolio, current levels of charge-offs, current levels of delinquencies, and current economic factors.
The Company uses a mathematical calculation to determine the initial allowance at the end of each reporting period. The calculation originated as management's estimate of future charge-offs and is used to allocate expenses to the branch level. There are two components when calculating the allowance for loan losses, which the Company refers to as the general reserve and the specific reserve. This calculation is a starting point and over time, and as needed, additional provisions have been added as determined by management to make the allowance adequate.
The general reserve is
4.25%
of the gross loan portfolio. The specific reserve represents
100%
of the gross loan balance of all loans 91 days or more days past due (151 days or more past due for payroll deduct loans) on a recency basis, including bankrupt accounts in that category. This methodology is based on historical data showing that the collection of loans 91 days or more past due and bankrupt accounts is remote.
A process is then performed to determine the adequacy of the allowance for loan losses, which considers trends in current levels of delinquencies, charge-off levels, and economic trends (such as energy and food prices). The primary tool used is the movement model (on a contractual and recency basis) which considers the rolling twelve months of delinquency to determine expected charge-offs. The sum of expected charge-offs, determined from the movement model (on a contractual and recency basis) plus the amount of delinquent refinancings is compared to the allowance resulting from the mathematical calculation to determine if any adjustments are needed to make the allowance adequate. Management would also determine if any adjustments are needed if the consolidated annual provision for loan losses is less than total charge-offs. Management uses a precision level of 5% of the allowance for loan losses compared to the aforementioned movement model when determining if any adjustments are needed.
The Company's policy is to charge off loans at the earlier of when such loans are deemed to be uncollectible or when six months have elapsed since the date of the last full contractual payment. The Company's charge-off policy has been consistently applied and no changes have been made during the periods reported. The Company's historical annual charge-off rate (net charge-offs as a percentage of average net loans receivable) for the past 10 years has ranged from
12.9%
to
16.7%
of net loans. Management considers the charge-off policy when evaluating the appropriateness of the allowance for loan losses.
FASB ASC Topic 310-30 prohibits carryover or creation of valuation allowances in the initial accounting of all loans acquired in a transfer that are within the scope of this authoritative literature. The Company believes that loans acquired since the adoption of FASB ASC Topic 310-30 have not shown evidence of deterioration of credit quality since origination, and therefore, are not within the scope of FASB ASC Topic 310-30.
51
Impaired Loans
The Company defines impaired loans as bankrupt accounts and accounts
91 days or more
past due (151 days or more past due for payroll deduct loans). In accordance with the Company’s charge-off policy, once a loan is deemed uncollectible,
100%
of the net investment is charged off, except in the case of a borrower who has filed for bankruptcy. As of
March 31, 2018
, bankrupt accounts that had not been charged off were approximately
$5.9 million
. Bankrupt accounts 91 days or more past due are reserved at
100%
of the gross loan balance. The Company also considers accounts 91 days or more past due (151 days or more past due for payroll deduct loans) as impaired, and the accounts are reserved at
100%
of the gross loan balance.
Delinquency is the primary credit quality indicator used to determine the credit quality of the Company's receivables (additional requirements from ASC 310-10 are disclosed in Note 2).
Property and Equipment
Property and equipment are stated at cost less accumulated depreciation and amortization. Depreciation is recorded using the straight-line method over the estimated useful life of the related asset as follows: buildings,
25
to
40 years
; furniture and fixtures,
5
to
10
years; equipment,
3
to
7
years; and vehicles,
3
years. Amortization of leasehold improvements is recorded using the straight-line method over the lesser of the estimated useful life of the asset or the term of the lease. Additions to premises and equipment and major replacements or improvements are added at cost. Maintenance, repairs, and minor replacements are charged to operating expense as incurred. When assets are retired or otherwise disposed of, the cost and accumulated depreciation are removed from the accounts and any gain or loss is reflected in the consolidated statement of operations.
Operating Leases
The Company’s branch leases typically have a lease term of
three
to
five
years and contain lessee renewal options and cancellation clauses in the event of regulatory changes. The Company typically renews its leases for one or more option periods. Accordingly, the Company amortizes its leasehold improvements over the shorter of their economic lives, which are generally
five years
, or the lease term that considers renewal periods that are reasonably assured.
Other Assets
Other assets include cash surrender value of life insurance policies, prepaid expenses, debt issuance costs and other deposits.
Intangible Assets and Goodwill
Intangible assets include the cost of acquiring existing customers ("customer lists"), and the fair value assigned to non-compete agreements. Customer lists are amortized on a straight line or accelerated basis over their estimated period of benefit, ranging from
8
to
23.0 years
with a weighted average of approximately
12.9 years
. Non-compete agreements are amortized on a straight line basis over the term of the agreement, ranging from
3
to
5.3 years
with a weighted average of approximately
4.6 years
.
Customer lists are allocated at a branch level and are evaluated for impairment at a branch level when a triggering event occurs, in accordance with FASB ASC Topic 360-10-05. If a triggering event occurs, the impairment loss to the customer list is generally the remaining unamortized customer list balance. In most acquisitions, the original fair value of the customer list allocated to a branch is less than $100,000, and management believes that in the event a triggering event were to occur, the impairment loss to an unamortized customer list would be immaterial.
Non-compete agreements are valued at the stated amount paid to the other party for these agreements, which the Company believes approximates the fair value. The fair value of the customer lists is based on a valuation model that utilizes the Company’s historical data to estimate the value of any acquired customer lists. In a business combination, the remaining excess of the purchase price over the fair value of the tangible assets, customer list, and non-compete agreements is allocated to goodwill. The branches the Company acquires are small, privately-owned branches, which do not have sufficient historical data to determine customer attrition. The Company believes that the customers acquired have the same characteristics and perform similarly to its customers. Therefore, the Company utilized the attrition patterns of its customers when developing the estimate of attrition for acquired customers. This estimation method is re-evaluated periodically.
52
The Company evaluates goodwill annually for impairment in the fourth quarter of the fiscal year using the market value-based approach. The Company has
two
reporting units (U.S. and Mexico), and the Company has multiple components, the lowest level of which is individual branches. The Company’s components are aggregated for impairment testing because they have similar economic characteristics.
Impairment of Long-Lived Assets
The Company assesses impairment of long-lived assets, including property and equipment and intangible assets, whenever changes or events indicate that the carrying amount may not be recoverable. The Company assesses impairment of these assets generally at the branch level based on the operating cash flows of the branch and the Company’s plans for branch closings. The Company will write down such assets to fair value if, based on an analysis, the sum of the expected future undiscounted cash flows is less than the carrying amount of the assets. The Company did not record any impairment charges for the fiscal year ended
2018
,
2017
, or
2016
.
Fair Value of Financial Instruments
FASB ASC Topic 825 requires disclosures about the fair value of all financial instruments, regardless of whether the financial instrument is recognized on the balance sheet, for which it is practicable to estimate that value. In cases where quoted market prices are not available, fair values are based on estimates using present value or other valuation techniques. The Company’s financial instruments for the periods reported consist of the following: cash and cash equivalents, loans receivable and senior notes payable. Fair value approximates carrying value for all of these instruments.
Loans receivable are originated at prevailing market rates and have an average life of approximately
8 months
. Given the short-term nature of these loans, they are continually repriced at current market rates. The Company’s revolving credit facility has a variable rate based on a margin over LIBOR and reprices with any changes in LIBOR.
Insurance Premiums and Commissions
Insurance premiums for credit life, accident and health, property and unemployment insurance written in connection with certain loans, net of refunds and applicable advance insurance commissions retained by the Company, are remitted monthly to an insurance company. All commissions are credited to unearned insurance commissions and recognized as income over the life of the related insurance contracts. The Company recognizes insurance income using the Rule of 78s method for credit life (decreasing term), credit accident and health, unemployment insurance and the Pro Rata method for credit life (level term) and credit property.
Non-filing Insurance
Non-filing insurance premiums are charged on certain loans in lieu of recording and perfecting the Company's security interest in the assets pledged. The premiums and recoveries are remitted to a third party insurance company and are not reflected in the accompanying Consolidated Financial Statements (See Note 8).
Claims paid by the third party insurance company result in a reduction to loan losses. Certain losses related to such loans, which are not recoverable through life, accident and health, property, or unemployment insurance claims are reimbursed through non-filing insurance claims subject to policy limitations. Any remaining losses are charged to the allowance for loan losses.
Income Taxes
Income taxes are accounted for under the asset and liability method. Deferred tax assets and liabilities are recognized for the future tax consequences attributable to differences between the financial statement carrying amounts of existing assets and liabilities and their respective tax bases and operating loss and tax credit carryforwards. Deferred tax assets and liabilities are measured using enacted tax rates expected to apply to taxable income in the years in which those temporary differences are expected to be recovered or settled. The effect on deferred tax assets and liabilities of a change in tax rates is recognized in income in the period that includes the enactment date.
The Company recognizes the effect of income tax positions only if those positions are more likely than not of being sustained. Recognized income tax positions are measured at the largest amount that is greater than
50%
likely of being
53
realized. Changes in recognition or measurement are reflected in the period in which the change in judgment related to additional facts and circumstances occurs.
Earnings Per Share
Earnings per share (“EPS”) is computed in accordance with FASB ASC Topic 260. Basic EPS includes no dilution and is computed by dividing net income by the weighted-average number of common shares outstanding for the period. Diluted EPS reflects the potential dilution of securities that could share in the earnings of the Company. Potential common stock included in the diluted EPS computation consists of stock options and restricted stock, which are computed using the treasury stock method. See Note 11 for the reconciliation of the numerators and denominators for basic and dilutive EPS calculations.
Stock-Based Compensation
FASB ASC Topic 718-10 requires companies to recognize in the income statement the grant-date fair value of stock options and other equity-based compensation issued to employees. FASB ASC Topic 718-10 does not change the accounting guidance for share-based payment transactions with parties other than employees provided in FASB ASC Topic 718-10. Under FASB ASC Topic 718-10, the way an award is classified will affect the measurement of compensation cost. Liability-classified awards are remeasured to fair value at each balance-sheet date until the award is settled. Equity-classified awards are measured at grant-date fair value, amortized over the subsequent vesting period, and are not subsequently remeasured. The fair value of non-vested stock awards for the purposes of recognizing stock-based compensation expense is the market price of the stock on the grant date. The fair value of options is estimated on the grant date using the Black-Scholes option pricing model (see Note 12). At
March 31, 2018
, the Company had several share-based employee compensation plans, which are described more fully in Note 12.
Share Repurchases
On March 10, 2015, the Board of Directors authorized the Company to repurchase up to
$25.0 million
of the Company’s common stock. As of
March 31, 2018
, the Company had
$1.9 million
in aggregate remaining repurchase capacity under the March 10, 2015 repurchase authorization. The timing and actual number of shares repurchased will depend on a variety of factors, including the stock price, corporate and regulatory requirements and other market and economic conditions. Although the repurchase authorization above has no stated expiration date, the Company’s stock repurchase program may be suspended or discontinued at any time. The Company has not repurchased any shares of its common stock since the first quarter of fiscal 2018. At the time of this filing, it is uncertain if or when the Company will recommence share repurchases.
The Company continues to believe stock repurchases are a viable component of the Company’s long-term financial strategy and an excellent use of excess cash when the opportunity arises. However, our amended credit facility limits share repurchases to 50% of consolidated adjusted net income in any fiscal year commencing with the fiscal year ending March 31, 2017. Our first priority is to ensure we have enough capital to fund loan growth. To the extent we have excess capital, we may resume repurchasing stock, if appropriate and as authorized by our Board of Directors. As of
March 31, 2018
our debt outstanding was
$244.9 million
and our shareholders' equity was
$541.1 million
resulting in a debt-to-equity ratio of
0.5
:1.0. We will continue to monitor our debt-to-equity ratio and are committed to maintaining a debt level that will allow us to continue to execute our business objectives, while not putting undue stress on our consolidated balance sheet.
Comprehensive Income
Total comprehensive income consists of net income and other comprehensive income (loss). The Company’s other comprehensive income (loss) and accumulated other comprehensive income (loss) are composed of foreign currency translation adjustments.
Concentration of Risk
The Company generally serves individuals with limited access to other sources of consumer credit such as banks, credit unions, other consumer finance businesses and credit card lenders. During the year ended
March 31, 2018
, the Company operated in
fifteen
states in the United States as well as in Mexico. For the years ended
March 31, 2018
,
2017
and
2016
, total revenue within the Company's
four
largest states (
Texas
,
Georgia
,
Tennessee
, and
South Carolina
) accounted for approximately
53%
,
53%
and
53%
, respectively, of the Company's total revenues.
54
The Company maintains amounts in bank accounts which, at times, may exceed federally insured limits. The Company has not experienced losses in such accounts, which are maintained with large domestic banks. Management believes the Company’s exposure to credit risk is minimal for these accounts.
Advertising Costs
Advertising costs are expensed when incurred. Advertising costs were approximately
$22.3 million
,
$17.9 million
and
$16.9 million
for fiscal years
2018
,
2017
and
2016
, respectively.
Recently Adopted Accounting Standards
Improvements to Employee Share-Based Payment Accounting
In March 2016, the FASB issued Accounting Standards Update ("ASU") 2016-09, Improvements to Employee Share-Based Payment Accounting, which simplifies the accounting for share-based payment transactions, income tax consequences, classification of awards as either equity or liabilities, and classification on the statement of cash flows. For public companies the amendments in this ASU became effective for annual periods, and interim periods within those annual periods, beginning after December 15, 2016. The Company adopted ASU No. 2016-09 as of April 1, 2017. Adoption of the guidance impacted the Company's accounting practices in the following ways:
•
The Company elected to account for forfeitures as they occur, and, in accordance with the modified retrospective approach specified in ASU 2016-09, the Company recorded a cumulative effect reclassification between retained earnings and additional paid-in capital as of the beginning of the adoption year of approximately $2.4 million. The reclassification was needed to reflect deferred tax expense incurred prior to adoption, which had historically been charged to additional paid-in capital, in retained earnings.
•
The Company will recognize all excess tax benefits and deficiencies as income tax benefit or expense, respectively, in the income statement. The Company will recognize excess tax benefits or shortfalls regardless of whether the transaction reduces taxes payable in the current period. The Company did not record a cumulative adjustment related to this guidance, which is consistent with the prospective approach specified in ASU 2016-09.
•
The Company will combine excess tax benefits from equity awards with other income tax cash flows and will classify such cash flows as an operating activity. The Company will classify cash paid when directly withholding shares for tax-withholding purposes as a financing activity. The Company will apply this guidance prospectively, as specified in ASU 2016-09.
The adoption of this guidance did not have a significant impact on the Company's consolidated financial statements.
Recently Issued Accounting Standards to be Adopted
Scope of Modification Accounting
In May 2017, the FASB issued ASU No. 2017-09, Scope of Modification Accounting. The amendments in this Update provide guidance about which changes to the terms or conditions of a share-based payment award require an entity to apply modification accounting in Topic 718. According to ASU No. 2017-09 an entity should account for the effects of a modification unless all the following are met:
1.
The fair value of the modified award is the same as the fair value of the original award immediately before the original award is modified.
2.
The vesting conditions of the modified award are the same as the vesting conditions of the original award immediately before the original award is modified.
3.
The classification of the modified award as an equity instrument or a liability instrument is the same as the classification of the original award immediately before the original award is modified.
The amendments in this Update are effective for all entities for annual periods, and interim periods within those annual periods, beginning after December 15, 2017. Early adoption is permitted. We have completed our evaluation and determined that the adoption of ASU 2017-09 will not have a material impact on our consolidated financial statements.
Simplifying the Test for Goodwill Impairment
55
In January 2017, the FASB issued ASU No. 2017-04, Simplifying the Test for Goodwill Impairment. ASU No. 2017-04 eliminates Step 2 from the goodwill impairment test. Instead, under the amendments in this Update, an entity should perform its annual, or interim, goodwill impairment test by comparing the fair value of a reporting unit with its carrying amount. Additionally, an entity should consider income tax effects from any tax deductible goodwill on the carrying amount of the reporting unit when measuring the goodwill impairment loss, if applicable. ASU No. 2017-04 also eliminates the requirements for any reporting unit with a zero or negative carrying amount to perform a qualitative assessment and, if it fails that qualitative test, to perform Step 2 of the goodwill impairment test. Therefore, the same impairment assessment applies to all reporting units. The amendments in this Update are effective for public entities who are SEC filers for fiscal years beginning after December 15, 2018. Early adoption is permitted. We are currently evaluating the impact the adoption of this guidance will have on our consolidated financial statements.
Measurement of Credit Losses on Financial Instruments
In June 2016, the FASB issued ASU No. 2016-13, Financial Instruments - Credit Losses. The amendment seeks to provide financial statement users with more decision-useful information about the expected credit losses on financial instruments and other commitments to extend credit held by a reporting entity at each reporting date. To achieve this objective, the amendments in this ASU replace the incurred loss impairment methodology in current GAAP with a methodology that reflects expected credit losses and requires consideration of a broader range of reasonable and supportable information to inform credit loss estimates. For public business entities the amendments are effective for fiscal years beginning after December 15, 2019, including interim periods within those fiscal years. Early adoption is permitted for fiscal years beginning after December 15, 2018, including interim periods within those fiscal years. We are currently evaluating the impact the adoption of this guidance will have on our consolidated financial statements. The adoption of this ASU could have a material impact on the provision for loan losses in the consolidated statements of operations and allowance for loan losses in the consolidated balance sheets.
Revenue from Contracts with Customers: Identifying Performance Obligations and Licensing
In April 2016, the FASB issued ASU No. 2016-10, Identifying Performance Obligations and Licensing. The amendments clarify the following two aspects of Topic 606: (a) identifying performance obligations; and (b) the licensing implementation guidance. The amendments do not change the core principle of the guidance in Topic 606. The effective date and transition requirements for the amendments are the same as the effective date and transition requirements in Topic 606. Public entities should apply the amendments for annual reporting periods beginning after December 15, 2017, including interim reporting periods therein. Early application for public entities is permitted only as of annual reporting periods beginning after December 15, 2016, including interim reporting periods within that reporting period. We have completed our evaluation and concluded that the adoption of ASU 2016-10 will not have a material impact on our consolidated financial statements.
Leases
In February 2016, the FASB issued ASU No. 2016-02, Leases (Topic 842). The ASU will require lessees to recognize assets and liabilities on leases with terms greater than 12 months and to disclose information related to the amount, timing and uncertainty of cash flows arising from leases, including various qualitative and quantitative requirements. The amendments of this ASU become effective for annual periods, and interim periods within those annual periods, beginning after December 15, 2018. We are currently evaluating the impact the adoption of this guidance will have on our consolidated financial statements. We expect the standard to have an impact on our assets and liabilities for the addition of right-of-use assets and lease liabilities, but we do not expect it to have a material impact to our results of operations or liquidity.
Recognition and Measurement of Financial Assets and Financial Liabilities
In January 2016, the FASB issued ASU 2016-01, which updates certain aspects of recognition, measurement, presentation and disclosure of financial instruments. ASU 2016-01 will be effective for the Company beginning in its first quarter of 2019 and early adoption is not permitted. We have completed our evaluation and determined that the adoption of ASU 2016-01 will not have a material impact on our consolidated financial statements.
Revenue from Contracts with Customers
In May 2014 the FASB issued ASU No. 2014-09, which supersedes the revenue recognition requirements Topic 605 (Revenue Recognition), and most industry-specific guidance. ASU No. 2014-09 is based on the principle that revenue
56
is recognized to depict the transfer of goods or services to customers in an amount that reflects the consideration to which the entity expects to be entitled in exchange for those goods or services. ASU No. 2014-09 also requires additional disclosure about the nature, amount, timing and uncertainty of revenue and cash flows arising from customer contracts, including significant judgments and changes in judgments and assets recognized from costs incurred to obtain or fulfill a contract. ASU No. 2014-09, as amended by ASU 2015-14 and ASU 2016-20, is effective for fiscal years, and interim periods, beginning after December 15, 2017, with early adoption permitted for annual reporting periods beginning after December 15, 2016. We have evaluated revenue from contracts with customers and have concluded that the new standard will not have a material impact on the Company's consolidated financial statements. We adopted this new guidance on its effective date, April 1 2018, using the modified retrospective method whereas prior periods are not restated.
We reviewed all other newly issued accounting pronouncements and concluded that they are either not applicable to our business or are not expected to have a material effect on the consolidated financial statements as a result of future adoption.
|
(2)
|
Allowance for Loan Losses and Credit Quality Indicators
|
The following is a summary of the changes in the allowance for loan losses for the years ended March 31,
2018
,
2017
, and
2016
:
|
|
2018
|
2017
|
2016
|
||||||
|
Balance at beginning of period
|
$
|
72,194,892
|
|
69,565,804
|
|
70,437,988
|
|
||
|
Provision for loan losses
|
130,979,129
|
|
128,572,162
|
|
123,598,318
|
|
|||
|
Loan losses
|
(138,808,839
|
)
|
(141,878,119
|
)
|
(141,758,366
|
)
|
|||
|
Recoveries
|
16,047,215
|
|
16,519,929
|
|
18,196,110
|
|
|||
|
Translation adjustment
|
413,331
|
|
(584,884
|
)
|
(908,246
|
)
|
|||
|
Balance at end of period
|
$
|
80,825,728
|
|
72,194,892
|
|
69,565,804
|
|
||
The following is a summary of loans individually and collectively evaluated for impairment for the periods indicated:
|
March 31, 2018
|
Loans individually
evaluated for impairment (impaired loans) |
Loans collectively
evaluated for impairment |
Total
|
||||||
|
Gross loans in bankruptcy, excluding contractually delinquent
|
$
|
4,627,599
|
|
—
|
|
4,627,599
|
|
||
|
Gross loans contractually delinquent
|
66,124,368
|
|
—
|
|
66,124,368
|
|
|||
|
Loans not contractually delinquent and not in bankruptcy
|
—
|
|
1,034,362,825
|
|
1,034,362,825
|
|
|||
|
Gross loan balance
|
70,751,967
|
|
1,034,362,825
|
|
1,105,114,792
|
|
|||
|
Unearned interest and fees
|
(19,420,354
|
)
|
(279,687,982
|
)
|
(299,108,336
|
)
|
|||
|
Net loans
|
51,331,613
|
|
754,674,843
|
|
806,006,456
|
|
|||
|
Allowance for loan losses
|
(46,900,686
|
)
|
(33,925,042
|
)
|
(80,825,728
|
)
|
|||
|
Loans, net of allowance for loan losses
|
$
|
4,430,927
|
|
720,749,801
|
|
725,180,728
|
|
||
57
|
March 31, 2017
|
Loans individually
evaluated for impairment (impaired loans) |
Loans collectively
evaluated for impairment |
Total
|
||||||
|
Gross loans in bankruptcy, excluding contractually delinquent
|
$
|
4,903,728
|
|
—
|
|
4,903,728
|
|
||
|
Gross loans contractually delinquent
|
54,310,791
|
|
—
|
|
54,310,791
|
|
|||
|
Loans not contractually delinquent and not in bankruptcy
|
—
|
|
1,000,589,613
|
|
1,000,589,613
|
|
|||
|
Gross loan balance
|
59,214,519
|
|
1,000,589,613
|
|
1,059,804,132
|
|
|||
|
Unearned interest and fees
|
(15,336,248
|
)
|
(276,572,403
|
)
|
(291,908,651
|
)
|
|||
|
Net loans
|
43,878,271
|
|
724,017,210
|
|
767,895,481
|
|
|||
|
Allowance for loan losses
|
(39,182,951
|
)
|
(33,011,941
|
)
|
(72,194,892
|
)
|
|||
|
Loans, net of allowance for loan losses
|
$
|
4,695,320
|
|
691,005,269
|
|
695,700,589
|
|
||
The average net balance of impaired loans was
$49.1 million
,
$42.2 million
and
$41.2 million
, respectively, for the years ended March 31,
2018
,
2017
and
2016
. It is not practicable to compute the amount of interest earned on impaired loans, nor is it practicable to compute the interest income recognized using the cash-basis method during the period such loans are impaired.
The following is an assessment of the credit quality for the fiscal years indicated:
|
|
March 31,
2018 |
March 31,
2017 |
||||
|
Credit risk
|
|
|||||
|
Consumer loans- non-bankrupt accounts
|
$
|
1,099,180,684
|
|
1,053,769,654
|
|
|
|
Consumer loans- bankrupt accounts
|
5,934,108
|
|
6,034,478
|
|
||
|
Total gross loans
|
$
|
1,105,114,792
|
|
1,059,804,132
|
|
|
|
Consumer credit exposure
|
|
|
|
|
||
|
Credit risk profile based on payment activity, performing
|
$
|
1,007,372,253
|
|
977,171,570
|
|
|
|
Contractual non-performing, 61 days or more delinquent
(1)
|
97,742,539
|
|
82,632,562
|
|
||
|
Total gross loans
|
$
|
1,105,114,792
|
|
1,059,804,132
|
|
|
|
Credit risk profile based on customer type
|
|
|
|
|
||
|
New borrower
|
$
|
160,791,141
|
|
168,656,845
|
|
|
|
Former borrower
|
115,141,944
|
|
108,100,688
|
|
||
|
Refinance
|
811,726,005
|
|
765,373,325
|
|
||
|
Delinquent refinance
|
17,455,702
|
|
17,673,274
|
|
||
|
Total gross loans
|
$
|
1,105,114,792
|
|
1,059,804,132
|
|
|
(1) Loans in non-accrual status
58
The following is a summary of the past due receivables as of:
|
|
March 31,
2018 |
March 31,
2017 |
March 31,
2016 |
||||||
|
Contractual basis:
|
|
|
|
|
|
|
|||
|
30-60 days past due
|
$
|
36,372,504
|
|
35,527,103
|
|
40,094,824
|
|
||
|
61-90 days past due
|
27,907,869
|
|
25,823,757
|
|
27,082,385
|
|
|||
|
91 days or more past due
|
69,834,670
|
|
56,808,805
|
|
48,495,405
|
|
|||
|
Total
|
$
|
134,115,043
|
|
118,159,665
|
|
115,672,614
|
|
||
|
Percentage of period-end gross loans receivable
|
12.1
|
%
|
11.1
|
%
|
10.8
|
%
|
|||
|
(3)
|
Property and Equipment
|
Property and equipment consist of:
|
|
March 31, 2018
|
March 31, 2017
|
||||
|
Land
|
$
|
576,977
|
|
576,977
|
|
|
|
Building and leasehold improvements
|
23,281,882
|
|
21,410,067
|
|
||
|
Furniture and equipment
|
48,733,632
|
|
44,377,741
|
|
||
|
|
72,592,491
|
|
66,364,785
|
|
||
|
Less accumulated depreciation and amortization
|
(47,001,073
|
)
|
(42,180,578
|
)
|
||
|
Total
|
$
|
25,591,418
|
|
24,184,207
|
|
|
Depreciation expense was approximately
$7.3 million
,
$6.9 million
and
$6.5 million
for the years ended
March 31, 2018
,
2017
and
2016
, respectively.
|
(4)
|
Intangible Assets
|
The following table provides the gross carrying amount and related accumulated amortization of definite-lived intangible assets:
|
|
March 31, 2018
|
March 31, 2017
|
|||||||||||||||||
|
|
Gross Carrying
Amount
|
Accumulated
Amortization
|
Net Intangible Asset
|
Gross Carrying
Amount
|
Accumulated
Amortization
|
Net Intangible Asset
|
|||||||||||||
|
Cost of customer lists
|
$
|
27,494,510
|
|
(21,098,875
|
)
|
6,395,635
|
|
$
|
26,678,992
|
|
(20,161,116
|
)
|
6,517,876
|
|
|||||
|
Value assigned to non-compete agreements
|
8,629,643
|
|
(8,380,977
|
)
|
248,666
|
|
8,424,644
|
|
(8,328,338
|
)
|
96,306
|
|
|||||||
|
Total
|
$
|
36,124,153
|
|
(29,479,852
|
)
|
6,644,301
|
|
$
|
35,103,636
|
|
(28,489,454
|
)
|
6,614,182
|
|
|||||
The estimated amortization expense for intangible assets for future years ended March 31 is as follows:
$1.0 million
for
2019
;
$1.0 million
for
2020
;
$1.0 million
for
2021
;
$0.9 million
for
2022
;
$0.9 million
for
2023
; and an aggregate of
$1.8 million
for the years thereafter.
|
(5)
|
Goodwill
|
The following summarizes the changes in the carrying amount of goodwill for the years ended
March 31, 2018
and
2017
:
59
|
|
2018
|
2017
|
||||
|
Balance at beginning of year:
|
|
|
||||
|
Goodwill
|
$
|
6,146,851
|
|
6,146,851
|
|
|
|
Accumulated goodwill impairment losses
|
(79,631
|
)
|
(25,393
|
)
|
||
|
Goodwill, net
|
$
|
6,067,220
|
|
6,121,458
|
|
|
|
Goodwill acquired during the year
(1)
|
$
|
967,243
|
|
—
|
|
|
|
Impairment losses
|
—
|
|
(54,238
|
)
|
||
|
Balance at end of year:
|
|
|
|
|
||
|
Goodwill
|
$
|
7,114,094
|
|
6,146,851
|
|
|
|
Accumulated goodwill impairment losses
|
(79,631
|
)
|
(79,631
|
)
|
||
|
Goodwill, net
|
$
|
7,034,463
|
|
6,067,220
|
|
|
(1)
On February 28, 2017, the Company completed an acquisition of fourteen branches from Mathes Management Enterprises, Inc. As of March 31, 2017 the accounting related to this acquisition was preliminary as allowed by FASB ASC Topic 805-10-25. During the twelve months ended March 31, 2018 the Company made an adjustment to the fair value of the customer lists and goodwill related to the purchase, which resulted in the Company's recording approximately $1.0 million of goodwill and a corresponding reduction of the amount previously allocated to customer lists.
The Company performed an annual impairment test during the fourth quarters of fiscal
2018
and
2017
and determined that none of the recorded goodwill was impaired. However, the Company did merge one branch during fiscal 2017 that had goodwill associated with it. The goodwill associated with that branch, which was immaterial on a consolidated level, was written off.
|
(6)
|
Notes Payable
|
Senior Notes Payable; Revolving Credit Facility
At
March 31, 2018
the Company's notes payable consist of a
$480.0 million
senior revolving credit facility with borrowings of
$244.9 million
outstanding and
$0.3 million
standby letters of credit related to workers compensation outstanding. To the extent that the letter of credit is drawn upon, the disbursement will be funded by the credit facility. There are no amounts due related to the letters of credit as of
March 31, 2018
, and they expire on December 31, 2018. The letters of credit are automatically extended for one year on the expiration date. Subject to a borrowing base formula, the Company may borrow at the rate of
LIBOR
plus
4.0%
with a minimum of
5.0%
. For the years ended
March 31, 2018
,
2017
and
2016
the Company’s effective interest rate, including the commitment fee, was
6.0%
,
5.8%
, and
5.6%
respectively, and the unused amount available under the revolver at
March 31, 2018
was
$234.8 million
. The revolving credit facility has a commitment fee of
0.50%
per annum on the unused portion of the commitment. Borrowings under the revolving credit facility mature on
June 15, 2019
.
Substantially all of the Company's assets, excluding the assets of the Company's Mexican subsidiaries, are pledged as collateral for borrowings under the revolving credit agreement.
The agreement governing the Company’s revolving credit facility contains affirmative and negative covenants, including covenants that restrict the ability of the Company and its subsidiaries to, among other things, incur or guarantee indebtedness, incur liens, pay dividends and repurchase or redeem capital stock, dispose of assets, engage in mergers and consolidations, make acquisitions or other investments, redeem or prepay subordinated debt, amend subordinated debt documents, make changes in the nature of its business, and engage in transactions with affiliates. The agreement also contains financial covenants, including a minimum consolidated net worth of
$330.0 million
plus 50% of the borrower's consolidated net income for each fiscal year beginning with 2017, a minimum fixed charge coverage ratio of
2.5
to 1.0, a maximum ratio of total debt to consolidated adjusted net worth of
2.0
to 1.0, and a maximum ratio of subordinated debt to consolidated adjusted net worth of
1.0
to 1.0. The agreement allows the Company to incur subordinated debt that matures after the termination date for the revolving credit facility and that contains specified subordination terms, subject to limitations on amount imposed by the financial covenants under the agreement.
In addition, the agreement establishes a maximum specified level for the collateral performance indicator.
60
The collateral performance indicator is equal to the sum of (a) a three-month rolling average rate of receivables at least sixty days past due and (b) an eight-month rolling average net charge-off rate. The Company was in compliance with these covenants at
March 31, 2018
and does not believe that these covenants will materially limit its business and expansion strategy.
The agreement contains events of default including, without limitation, nonpayment of principal, interest or other obligations, violation of covenants, misrepresentation, cross-default to other debt, bankruptcy and other insolvency events, judgments, certain ERISA events, actual or asserted invalidity of loan documentation, invalidity of subordination provisions of subordinated debt, certain changes of control of the Company, and the occurrence of certain regulatory events (including the entry of any stay, order, judgment, ruling or similar event related to the Company’s or any of its subsidiaries’ originating, holding, pledging, collecting or enforcing its eligible finance receivables that is material to the Company or any subsidiary) which remains unvacated, undischarged, unbonded or unstayed by appeal or otherwise for a period of 60 days from the date of its entry and is reasonably likely to cause a material adverse change. If it is determined that a violation of the FCPA has occurred, as described in Note 16, such violation may give rise to an event of default under the agreement if such violation were to have a material adverse effect on the Company’s business, operations, properties, assets, or condition (financial or otherwise) or if the amount of any settlement, penalties, fines or other payments resulted in the Company failing to satisfy any financial covenants.
Debt Maturities
As of
March 31, 2018
, the aggregate annual maturities of the notes payable for each of the five fiscal years subsequent to
March 31, 2018
were as follows:
|
2019
|
$
|
—
|
|
|
2020
|
244,900,000
|
|
|
|
2021
|
—
|
|
|
|
2022
|
—
|
|
|
|
2023
|
—
|
|
|
|
Total future debt payments
|
$
|
244,900,000
|
|
|
(7)
|
Insurance and Other Income
|
Insurance and other income for the years ending
March 31, 2018
,
2017
and
2016
consist of:
|
|
2018
|
2017
|
2016
|
||||||
|
Insurance revenue
|
$
|
41,959,092
|
|
40,848,245
|
|
43,346,884
|
|
||
|
Tax return preparation revenue
|
16,801,909
|
|
14,695,633
|
|
11,920,669
|
|
|||
|
Auto club membership revenue
|
3,373,023
|
|
2,515,282
|
|
2,516,634
|
|
|||
|
World Class Buying Club revenue
|
—
|
|
136
|
|
1,410
|
|
|||
|
Net loss on sale of loans receivable
|
—
|
|
—
|
|
(1,572,536
|
)
|
|||
|
Other
|
4,837,833
|
|
4,916,166
|
|
6,129,210
|
|
|||
|
Insurance and other income
|
$
|
66,971,857
|
|
62,975,462
|
|
62,342,271
|
|
||
The Company has a wholly-owned, captive insurance subsidiary that reinsures a portion of the credit insurance sold in connection with loans made by the Company. Certain coverages currently sold by the Company on behalf of the unaffiliated insurance carrier are ceded by the carrier to the captive insurance subsidiary, providing the Company with an additional source of income derived from the earned reinsurance premiums. Insurance premiums are ceded to the reinsurance subsidiary as written and revenue is recognized over the life of the related insurance contracts. As of
March 31, 2018
,
2017
and
2016
, the amount of net written premiums were
$6.2 million
,
$4.5 million
and
$3.6 million
, respectively, and the amount of earned premiums were
$5.3 million
,
$4.0 million
, and
$1.7 million
, respectively.
The Company maintains a cash reserve for claims in an amount determined by the ceding company, and as of
March 31, 2018
and
2017
, the cash reserves were
$4.9 million
and
$3.6 million
, respectively.
61
|
(8)
|
Non-filing Insurance
|
The Company maintains non-filing insurance coverage with an unaffiliated insurance company. The following is a summary of the non-filing insurance activity for the years ended
March 31, 2018
,
2017
and
2016
:
|
|
2018
|
2017
|
2016
|
||||||
|
Insurance premiums written
|
$
|
5,987,538
|
|
5,673,653
|
|
6,197,928
|
|
||
|
Recoveries on claims paid
|
$
|
1,093,396
|
|
1,165,092
|
|
1,125,524
|
|
||
|
Claims paid
|
$
|
6,540,136
|
|
6,312,511
|
|
6,884,185
|
|
||
|
(9)
|
Leases
|
The Company conducts most of its operations from leased facilities, except for its owned corporate office building. The Company's leases typically have a lease term of
three
to
five
years and contain lessee renewal options. A majority of the leases provide that the lessee pays property taxes, insurance and common area maintenance costs. It is expected that in the normal course of business, expiring leases will be renewed at the Company's option or replaced by other leases or acquisitions of other properties. All of the Company’s leases are operating leases.
The future minimum lease payments under noncancelable operating leases as of
March 31, 2018
, are as follows:
|
2019
|
$
|
25,915,335
|
|
|
2020
|
16,842,025
|
|
|
|
2021
|
8,318,381
|
|
|
|
2022
|
2,564,790
|
|
|
|
2023
|
1,069,186
|
|
|
|
Thereafter
|
36,421
|
|
|
|
Total future minimum lease payments
|
$
|
54,746,138
|
|
Rental expense for cancelable and noncancelable operating leases for the years ended
March 31, 2018
,
2017
and
2016
, was approximately
$28.1 million
,
$26.9 million
and
$27.1 million
, respectively.
62
|
(10)
|
Income Taxes
|
On December 22, 2017, the U.S. government enacted comprehensive tax legislation commonly referred to as the Tax Cuts and Jobs Act (the “TCJA”). The TCJA included significant changes to existing tax law, including a permanent reduction to the U.S. federal corporate income tax rate from 35% to 21%, a one-time repatriation tax on deferred foreign income (“Transition Tax”), deductions, credits and business-related exclusions.
The permanent reduction to the U.S. federal corporate income tax rate from 35 % to 21% was effective January 1, 2018. When a federal tax rate changes during a fiscal year, the Internal Revenue Code requires taxpayers to compute a weighted daily average rate for the fiscal year of enactment. As a result, the Company has calculated a U.S. federal statutory corporate income tax rate of 31.55% for the fiscal year ended March 31, 2018. The U.S. corporate federal statutory rate of 31.55% is the weighted daily average rate between the pre-enactment federal statutory rate of 35% and the post-enactment federal statutory rate of 21%.
The impact of changes in federal tax rates on deferred tax amounts and the effect of the Transition Tax are significant unusual or infrequent items which are recognized as discrete items in the Company’s income tax expense in the period in which the event occurs. The Company recorded
$10.5 million
as a provisional amount related to the net impact of revaluing the U.S. deferred tax assets and liabilities in the third quarter of fiscal 2018. The final calculation related to the net impact of revaluing the U.S. deferred tax assets and liabilities resulted in an immaterial reduction in the provisional amount. The Company has recorded an increase in tax expense of
$4.9 million
related to the foreign “Transition Tax” during the final quarter of fiscal 2018.
Income tax expense (benefit) consists of:
|
|
Current
|
Deferred
|
Total
|
||||||
|
Year ended March 31, 2018
|
|
|
|
||||||
|
U.S. Federal
|
$
|
32,398,898
|
|
12,073,220
|
|
44,472,118
|
|
||
|
State and local
|
3,191,525
|
|
94,165
|
|
3,285,690
|
|
|||
|
Foreign
|
3,138,632
|
|
(3,381,953
|
)
|
(243,321
|
)
|
|||
|
|
$
|
38,729,055
|
|
8,785,432
|
|
47,514,487
|
|
||
|
Year ended March 31, 2017
|
|
|
|
|
|
|
|||
|
U.S. Federal
|
$
|
34,930,677
|
|
(14,658
|
)
|
34,916,019
|
|
||
|
State and local
|
3,215,621
|
|
25,852
|
|
3,241,473
|
|
|||
|
Foreign
|
3,144,625
|
|
(905,280
|
)
|
2,239,345
|
|
|||
|
|
$
|
41,290,923
|
|
(894,086
|
)
|
40,396,837
|
|
||
|
Year ended March 31, 2016
|
|
|
|
|
|
|
|||
|
U.S. Federal
|
$
|
44,781,123
|
|
(839,117
|
)
|
43,942,006
|
|
||
|
State and local
|
4,866,596
|
|
169,985
|
|
5,036,581
|
|
|||
|
Foreign
|
1,630,565
|
|
(116,245
|
)
|
1,514,320
|
|
|||
|
|
$
|
51,278,284
|
|
(785,377
|
)
|
50,492,907
|
|
||
63
Income tax expense was
$47.5 million
,
$40.4 million
and
$50.5 million
, for the years ended
March 31, 2018
,
2017
and
2016
, respectively, and differed from the amounts computed by applying the U.S. federal income tax rate of
31.55%
for fiscal 2018 and 35% for fiscal years 2017 and 2016 to pretax income from continuing operations as a result of the following:
|
|
2018
|
2017
|
2016
|
||||||
|
Expected income tax
|
$
|
31,930,021
|
|
39,898,996
|
|
48,260,962
|
|
||
|
Increase (reduction) in income taxes resulting from:
|
|
|
|
|
|
|
|||
|
State tax, net of federal benefit
|
2,249,055
|
|
2,106,957
|
|
3,273,778
|
|
|||
|
Revalue deferred tax assets and liabilities
|
10,516,827
|
|
—
|
|
—
|
|
|||
|
Foreign transition tax
|
4,854,640
|
|
—
|
|
—
|
|
|||
|
Uncertain tax positions
|
(340,993
|
)
|
(1,015,222
|
)
|
1,624,865
|
|
|||
|
State tax adjustment for amended returns
|
—
|
|
238,301
|
|
(370,659
|
)
|
|||
|
Foreign income adjustments
|
5,483
|
|
(332,023
|
)
|
(257,873
|
)
|
|||
|
Other, net
|
(1,700,546
|
)
|
(500,172
|
)
|
(2,038,166
|
)
|
|||
|
|
$
|
47,514,487
|
|
40,396,837
|
|
50,492,907
|
|
||
The tax effects of temporary differences that give rise to significant portions of the deferred tax assets and deferred tax liabilities at
March 31, 2018
and
2017
are presented below:
|
|
2018
|
2017
|
||||
|
Deferred tax assets:
|
|
|
||||
|
Allowance for loan losses
|
$
|
24,177,241
|
|
28,125,727
|
|
|
|
Unearned insurance commissions
|
8,711,298
|
|
12,419,811
|
|
||
|
Accrued expenses primarily related to employee benefits
|
8,470,247
|
|
15,849,041
|
|
||
|
Reserve for uncollectible interest
|
795,259
|
|
1,125,188
|
|
||
|
Foreign tax credit carryforward
|
3,254,926
|
|
—
|
|
||
|
Other
|
1,007,786
|
|
—
|
|
||
|
Gross deferred tax assets
|
46,416,757
|
|
57,519,767
|
|
||
|
Less valuation allowance
|
(3,256,200
|
)
|
(1,274
|
)
|
||
|
Net deferred tax assets
|
43,160,557
|
|
57,518,493
|
|
||
|
Deferred tax liabilities:
|
|
|
|
|
||
|
Fair value adjustment for loans receivable
|
(6,556,078
|
)
|
(9,450,239
|
)
|
||
|
Property and equipment
|
(2,483,487
|
)
|
(3,560,296
|
)
|
||
|
Intangible assets
|
(1,592,173
|
)
|
(2,341,393
|
)
|
||
|
Deferred net loan origination costs
|
(1,402,733
|
)
|
(1,985,387
|
)
|
||
|
Prepaid expenses
|
(886,449
|
)
|
(977,906
|
)
|
||
|
Other
|
—
|
|
(178,203
|
)
|
||
|
Gross deferred tax liabilities
|
(12,920,920
|
)
|
(18,493,424
|
)
|
||
|
Deferred income taxes, net
|
$
|
30,239,637
|
|
39,025,069
|
|
|
The valuation allowance for deferred tax assets as of
March 31, 2018
, and
2017
was
$3.3 million
and
$1,274
, respectively. The valuation allowance against the total deferred tax assets as of
March 31, 2018
consisted of
$1,274
related to state of Colorado net operating losses in the amount of
$54,318
, which expire in 2025, and a foreign tax credit carryforward of
$3.3 million
, arising in relation to the Section 965 calculation ("Transition Tax") during the current fiscal year. The Company does not expect to generate enough foreign source income in future tax years to realize this tax attribute.
64
In assessing the realizability of deferred tax assets, management considers whether it is more likely than not that some portion or all of the deferred tax assets will not be realized. The ultimate realization of deferred tax assets is dependent upon the generation of future taxable income during the periods in which those temporary differences become deductible. Management considers the scheduled reversals of deferred tax liabilities, projected future taxable income, and tax planning strategies in making this assessment. In order to fully realize the deferred tax asset, the Company will need to generate future taxable income prior to the expiration of the deferred tax assets governed by the tax code. Based upon the level of historical taxable income and projections for future taxable income over the periods in which the related temporary differences are deductible, management believes it is more likely than not the Company will realize the benefits of these deductible differences, net of the existing valuation allowances at
March 31, 2018
. The amount of the deferred tax asset considered realizable, however, could be reduced in the near term if estimates of future taxable income during the carryforward period are reduced.
The Company is expecting the Mexican subsidiaries to pay the U.S. company a dividend during fiscal 2019. As a result, the Company will no longer claim permanent reinvestment in the respective foreign jurisdiction. At March 31, 2018, because of the Transition Tax, the Company's tax basis in the Mexican subsidiaries is greater than its book basis; therefore, there is no taxable temporary difference.
As of
March 31, 2018
,
2017
and
2016
, the Company had
$8.8 million
,
$8.9 million
and
$10.7 million
of total gross unrecognized tax benefits including interest, respectively. Of these totals, approximately
$6.9 million
,
$7.2 million
and
$8.2 million
, respectively, represents the amount of net unrecognized tax benefits that are permanent in nature and, if recognized, would affect the annual effective tax rate.
A reconciliation of the beginning and ending amount of unrecognized tax benefits at
March 31, 2018
,
2017
and
2016
are presented below:
|
2018
|
2017
|
2016
|
|||||||
|
Unrecognized tax benefit balance beginning of year
|
$
|
7,264,966
|
|
9,395,413
|
|
7,621,327
|
|
||
|
Gross increases (decreases) for tax positions of current year
|
166,375
|
|
(237,746
|
)
|
783,265
|
|
|||
|
Gross increases for tax positions of prior years
|
8,228
|
|
637,166
|
|
1,798,505
|
|
|||
|
Settlements with tax authorities
|
—
|
|
(2,403,982
|
)
|
—
|
|
|||
|
Lapse of statute of limitations
|
(493,340
|
)
|
(125,885
|
)
|
(807,684
|
)
|
|||
|
Unrecognized tax benefit balance end of year
|
$
|
6,946,229
|
|
7,264,966
|
|
9,395,413
|
|
||
At
March 31, 2018
, approximately
$4.2 million
of gross unrecognized tax benefits are expected to be resolved during the next 12 months through settlements with taxing authorities or the expiration of the statute of limitations. The Company’s continuing practice is to recognize interest and penalties related to income tax matters in income tax expense. As of
March 31, 2018
,
2017
and 2016, the Company had
$1.9 million
,
$1.6 million
and
$1.3 million
accrued for gross interest, respectively, of which
$0.4 million
,
$0.7 million
, and
$0.6 million
represented the current period expense for the periods ended
March 31, 2018
,
2017
, and
2016
.
The Company is subject to U.S. and Mexican income taxes, as well as various other state and local jurisdictions. With the exception of a few states, the Company is no longer subject to U.S. federal, state and local, or non-U.S. income tax examinations by tax authorities for years before 2013, although carryforward attributes that were generated prior to 2013 may still be adjusted upon examination by the taxing authorities if they either have been or will be used in a future period.
65
|
(11)
|
Earnings Per Share
|
The following is a reconciliation of the numerators and denominators of the basic and diluted EPS calculations:
|
|
For the year ended March 31, 2018
|
|||||||||
|
Income
(Numerator)
|
Shares
(Denominator)
|
Per Share
Amount
|
||||||||
|
Basic EPS
|
|
|
|
|||||||
|
Income available to common shareholders
|
$
|
53,690,018
|
|
8,791,168
|
|
$
|
6.11
|
|
||
|
Effect of dilutive securities options and restricted stock
|
—
|
|
167,508
|
|
|
|
||||
|
Diluted EPS
|
|
|
|
|
|
|
||||
|
Income available to common shareholders including dilutive securities
|
$
|
53,690,018
|
|
8,958,676
|
|
$
|
5.99
|
|
||
|
|
For the year ended March 31, 2017
|
|||||||||
|
|
Income
(Numerator)
|
Shares
(Denominator)
|
Per Share Amount
|
|||||||
|
Basic EPS
|
|
|
|
|
|
|
||||
|
Income available to common shareholders
|
$
|
73,600,294
|
|
8,705,658
|
|
$
|
8.45
|
|
||
|
Effect of dilutive securities options and restricted stock
|
—
|
|
72,386
|
|
||||||
|
Diluted EPS
|
|
|
|
|
|
|
||||
|
Income available to common shareholders including dilutive securities
|
$
|
73,600,294
|
|
8,778,044
|
|
$
|
8.38
|
|
||
|
|
For the year ended March 31, 2016
|
|||||||||
|
|
Income
(Numerator)
|
Shares
(Denominator)
|
Per Share Amount
|
|||||||
|
Basic EPS
|
|
|
|
|
|
|
||||
|
Income available to common shareholders
|
$
|
87,395,557
|
|
8,636,269
|
|
$
|
10.12
|
|
||
|
Effect of dilutive securities options and restricted stock
|
—
|
|
55,922
|
|
||||||
|
Diluted EPS
|
|
|
|
|
|
|
||||
|
Income available to common shareholders including dilutive securities
|
$
|
87,395,557
|
|
8,692,191
|
|
$
|
10.05
|
|
||
Options to purchase
299,455
,
733,053
and
825,505
shares of common stock at various prices were outstanding during the years ended
March 31, 2018
,
2017
and
2016
, respectively, but were not included in the computation of diluted EPS because the option exercise price was antidilutive.
66
|
(12)
|
Benefit Plans
|
Retirement Plan
The Company provides a defined contribution employee benefit plan (401(k) plan) covering full-time employees, whereby employees can invest up to the maximum designated for that year. The Company matches
50%
of each employee's contributions up to the first
6%
of the employee's eligible compensation, providing a maximum employer contribution of 3% of compensation. The Company's expense under this plan was
$1,358,148
,
$1,377,371
and
$1,453,468
, for the years ended
March 31, 2018
,
2017
and
2016
, respectively.
Supplemental Executive Retirement Plan
The Company has instituted a Supplemental Executive Retirement Plan (“SERP”), which is a non-qualified executive benefit plan in which the Company agrees to pay the executive additional benefits in the future, usually at retirement, in return for continued employment by the executive. The SERP is an unfunded plan, and as such, there are no specific assets set aside by the Company in connection with the establishment of the plan. The executive has no rights under the agreement beyond those of a general creditor of the Company. In May 2009 the Company instituted a second Supplemental Executive Retirement Plan to provide to one executive the same type of benefits as are in the original SERP but for which he would not have qualified due to age. This second SERP is also an unfunded plan with no specific assets set aside by the Company in connection with the plan. For the years ended
March 31, 2018
,
2017
and
2016
, contributions of
$750,669
,
$618,013
and
$1,796,998
, respectively, were charged to expense related to the SERP. The unfunded liability was
$8,258,550
,
$8,447,283
and
$8,886,195
, as of
March 31, 2018
,
2017
and
2016
, respectively.
For the three years presented, the unfunded liability was estimated using the following assumptions: an annual salary increase of
3.5%
for all 3 years; a discount rate of
6.0%
for all 3 years; and a retirement age of
65
.
Executive Deferred Compensation Plan
The Company has an Executive Deferral Plan. Eligible executives and directors may elect to defer all or a portion of their incentive compensation to be paid under the Executive Deferral Plan. As of
March 31, 2018
and
2017
no executive or director had deferred compensation under this plan.
Stock Option Plans
The Company has a 2002 Stock Option Plan, a 2005 Stock Option Plan, a 2008 Stock Option Plan, a 2011 Stock Option Plan and a 2017 Stock Incentive Plan for the benefit of certain directors, officers, and key employees. Under these plans, a total of
4,950,000
shares of authorized common stock have been reserved for issuance pursuant to grants approved by the Compensation and Stock Option Committee of the Board of Directors. Stock options granted under these plans have a maximum duration of
ten years
, may be subject to certain vesting requirements, which are generally three to
five years
for officers, directors, and key employees, and are priced at the market value of the Company's common stock on the grant date of the option. At
March 31, 2018
there were a total of
1,258,427
shares available for grant under the plans.
Stock-based compensation is recognized as provided under FASB ASC Topic 718-10 and FASB ASC Topic 505-50. FASB ASC Topic 718-10 requires all share-based payments to employees, including grants of employee stock options, to be recognized as compensation expense over the requisite service period (generally the vesting period) in the consolidated financial statements based on their grant date fair values. The Company has applied the Black-Scholes valuation model in determining the grant date fair value of the stock option awards. Compensation expense is recognized only for those options expected to vest.
67
The weighted-average fair value at the grant date for options issued during the years ended
March 31, 2018
,
2017
and
2016
was
$39.49
,
$22.25
and
$10.82
per share, respectively. This fair value was estimated at grant date using the weighted-average assumptions listed below.
|
|
2018
|
2017
|
2016
|
|||||
|
Dividend yield
|
0
|
%
|
0
|
%
|
0
|
%
|
||
|
Expected volatility
|
52.97
|
%
|
48.90
|
%
|
41.41
|
%
|
||
|
Average risk-free interest rate
|
1.98
|
%
|
1.20
|
%
|
1.38
|
%
|
||
|
Expected life
|
5.0 years
|
|
5.0 years
|
|
5.0 years
|
|
||
The expected stock price volatility is based on the historical volatility of the Company’s stock for a period approximating the expected life. The expected life represents the period of time that options are expected to be outstanding after the grant date. The risk-free rate reflects the interest rate at grant date on zero coupon U.S. governmental bonds having a remaining life similar to the expected option term.
Option activity for the year ended
March 31, 2018
was as follows:
|
|
Shares
|
Weighted
Average
Exercise
Price
|
Weighted
Average
Remaining
Contractual Term
|
Aggregate
Intrinsic
Value
|
||||||||
|
Options outstanding, beginning of year
|
860,741
|
|
$
|
67.28
|
|
|
|
|||||
|
Granted
|
58,070
|
|
83.33
|
|
|
|
||||||
|
Exercised
|
(389,888
|
)
|
64.95
|
|
|
|
||||||
|
Forfeited
|
(16,675
|
)
|
63.73
|
|
|
|
||||||
|
Expired
|
(14,520
|
)
|
81.08
|
|
|
|
||||||
|
Options outstanding, end of period
|
497,728
|
|
$
|
70.69
|
|
5.95
|
$
|
17,227,283
|
|
|||
|
Options exercisable, end of period
|
297,395
|
|
$
|
72.22
|
|
4.71
|
$
|
9,837,009
|
|
|||
The aggregate intrinsic value reflected in the table above represents the total pre-tax intrinsic value (the difference between the closing stock price on
March 31, 2018
and the exercise price, multiplied by the number of in-the-money options) that would have been received by option holders had all option holders exercised their options as of
March 31, 2018
. This amount will change as the stock's market price changes. The total intrinsic value of options exercised during the periods ended
March 31, 2018
,
2017
and
2016
was as follows:
|
2018
|
2017
|
2016
|
||
|
$12,336,156
|
$661,164
|
$2,445,011
|
||
As of
March 31, 2018
, total unrecognized stock-based compensation expense related to non-vested stock options amounted to approximately
$2.5 million
, which is expected to be recognized over a weighted-average period of approximately
2.1
years.
Restricted Stock
During fiscal
2018
, the Company granted
24,456
shares of restricted stock (which are equity classified), to certain executive officers, with a grant date weighted average fair value of
$107.52
. One-third of these awards will vest each October 1 over the next three years.
68
During fiscal 2014 and 2013 the Company granted
8,590
and
70,800
Group A performance based restricted stock awards to certain officers. Group A awards vested on April 30, 2015 based on the Company's achievement of the following performance goals as of March 31, 2015:
|
EPS Target
|
Restricted Shares Eligible for Vesting
(Percentage of Award)
|
|
|
$10.29
|
100%
|
|
|
$9.76
|
67%
|
|
|
$9.26
|
33%
|
|
|
Below $9.26
|
0%
|
|
During fiscal 2014 and 2013 the Company granted
56,660
and
443,700
Group B performance based restricted stock awards to certain officers. As of
March 31, 2018
no Group B awards remain unforfeited and outstanding. Group B awards would have vested as follows, if the Company achieved the following performance goals during any successive trailing four quarters during the measurement period ending on March 31, 2017:
|
Trailing 4 quarter EPS Target
|
Restricted Shares Eligible for Vesting
(Percentage of Award)
|
|
|
$13.00
|
25%
|
|
|
$14.50
|
25%
|
|
|
$16.00
|
25%
|
|
|
$18.00
|
25%
|
|
During fiscal 2016 the Company determined that the earnings per share targets associated with the Group B stock awards were not achievable during the measurement period which ended on March 31, 2017. Subsequently, the Compensation and Stock Option Committee of the Board of Directors amended the awards allowing
25%
of the Group B awards to vest for certain officers. The officers were required to forfeit their remaining Group B shares as a part of the amendment. FASB Topic ASC 718 defines a grant modification as a change in any of the terms or conditions of a stock-based compensation award to include accelerated vesting. The Company determined that since the Group B awards would not have otherwise vested pre-modification, the accelerated vesting qualified as a Type III modification. During the year ended March 31, 2016, the Company released approximately
$9.7 million
of compensation expense associated with the Group B awards, including
$2.9 million
related to the Type III modification.
Compensation expense related to restricted stock is based on the number of shares expected to vest and the fair market value of the common stock on the grant date. The Company recognized compensation expense of
$3.1 million
,
$1.6 million
and a net reduction in compensation expense of
$8.0 million
for the years ended
March 31, 2018
,
2017
and
2016
, respectively, which is included as a component of general and administrative expenses in the Company's Consolidated Statements of Operations.
As of
March 31, 2018
, there was approximately
$3.2 million
of unrecognized compensation cost related to unvested restricted stock awards, which is expected to be recognized over the next
2.3
years based on current estimates.
69
A summary of the status of the Company’s restricted stock as of
March 31, 2018
and changes during the year ended
March 31, 2018
, are presented below:
|
|
Shares
|
Weighted Average Fair
Value at Grant Date
|
||||
|
Outstanding at March 31, 2017
|
111,361
|
|
$
|
43.11
|
|
|
|
Granted during the period
|
24,456
|
|
107.52
|
|
||
|
Vested during the period
|
(60,787
|
)
|
41.38
|
|
||
|
Forfeited during the period
|
(1,220
|
)
|
51.41
|
|
||
|
Outstanding at March 31, 2018
|
73,810
|
|
$
|
65.74
|
|
|
Total share-based compensation included as a component of net income during the years ended
March 31, 2018
,
2017
and
2016
was as follows:
|
|
2018
|
2017
|
2016
|
||||||
|
Share-based compensation related to equity classified units:
|
|
||||||||
|
Share-based compensation related to stock options
|
$
|
2,353,214
|
|
3,490,662
|
|
3,965,463
|
|
||
|
Share-based compensation related to restricted stock
|
3,081,405
|
|
1,604,257
|
|
(8,033,213
|
)
|
|||
|
Total share-based compensation related to equity classified awards
|
$
|
5,434,619
|
|
5,094,919
|
|
(4,067,750
|
)
|
||
|
(13)
|
Acquisitions
|
The Company evaluates each set of assets and activities it acquires to determine if the set meets the definition of a business according to FASB ASC Topic 805-10-55. Acquisitions meeting the definition of a business are accounted for as business combinations while all other acquisitions are accounted for as asset purchases.
70
The following table sets forth the acquisition activity of the Company for the years ended
March 31, 2018
,
2017
and
2016
:
|
|
2018
|
2017
|
2016
|
||||||
|
Number of branches acquired through business combinations
|
5
|
|
14
|
|
—
|
|
|||
|
Number of asset purchases
|
34
|
|
—
|
|
1
|
|
|||
|
Total acquisitions
|
39
|
|
14
|
|
1
|
|
|||
|
Purchase price
|
$
|
17,574,172
|
|
20,836,699
|
|
173,628
|
|
||
|
Tangible assets:
|
|
|
|
|
|||||
|
Loans receivable, net
|
15,583,411
|
|
16,617,242
|
|
92,097
|
|
|||
|
Property and equipment
|
3,000
|
|
86,214
|
|
—
|
|
|||
|
|
15,586,411
|
|
16,703,456
|
|
92,097
|
|
|||
|
Excess of purchase prices over carrying value of net tangible assets
|
$
|
1,987,761
|
|
4,133,243
|
|
81,531
|
|
||
|
Customer lists
(1)
|
$
|
815,518
|
|
4,063,243
|
|
76,531
|
|
||
|
Non-compete agreements
|
205,000
|
|
70,000
|
|
5,000
|
|
|||
|
Goodwill
(1)
|
967,243
|
|
—
|
|
—
|
|
|||
(1)
On February 28, 2017, the Company completed an acquisition of fourteen branches from Mathes Management Enterprises, Inc. As of March 31, 2017 the accounting related to this acquisition was preliminary as allowed by FASB ASC Topic 805-10-25. During the
twelve months ended March 31, 2018
the Company made an adjustment to the fair value of the customer lists and goodwill related to the purchase, which resulted in the Company's recording approximately
$1.0 million
of goodwill and a corresponding reduction of the amount previously allocated to customer lists.
Acquisitions that are accounted for as business combinations typically result in one or more new branches. In such cases, the Company typically retains the existing employees and the branch location from the acquisition. The purchase price is allocated to the tangible assets and intangible assets acquired based upon their estimated fair market values at the acquisition date. The remainder is allocated to goodwill. During the year ended
March 31, 2018
the Company acquired
five
branches through three business combinations, as described below.
Acquisitions that are accounted for as asset purchases are typically limited to acquisitions of loan portfolios. The purchase price is allocated to the tangible assets and intangible assets acquired based upon their estimated fair market values at the acquisition date. In an asset purchase, no goodwill is recorded. During the year ended
March 31, 2018
, the Company recorded
34
acquisitions as asset purchases, as described below.
The Company’s acquisitions include tangible assets (generally loans and furniture and equipment) and intangible assets (generally non-compete agreements, customer lists, and goodwill), both of which are recorded at their fair values, which are estimated pursuant to the processes described below.
Acquired loans are valued at the net loan balance. Given the short-term nature of these loans, generally
8 months
, and that these loans are priced at current rates, management believes the net loan balances approximate their fair value.
Furniture and equipment are valued at the specific purchase price as agreed to by both parties at the time of acquisition, which management believes approximates their fair values.
Non-compete agreements are valued at the stated amount paid to the other party for these agreements, which the Company believes approximates the fair value.
Customer lists are valued with a valuation model that utilizes the Company’s historical data to estimate the value of any acquired customer lists. Customer lists are allocated at a branch level and are evaluated for impairment at a branch level when a triggering event occurs in accordance with FASB ASC Topic 360-10-05. If a triggering event occurs, the impairment loss to the customer list is generally the remaining unamortized customer list balance. In most acquisitions, the original fair
71
value of the customer list allocated to an office is less than $100,000, and management believes that in the event a triggering event were to occur, the impairment loss to an unamortized customer list would be immaterial.
In a business combination, the remaining excess of the purchase price over the fair value of the tangible assets, customer lists, and non-compete agreements is allocated to goodwill.
On February 15, 2018, the Company completed an acquisition of three branches and nine loan portfolios from Community Finance and Loans, LLC. The acquisition is consistent with the Company's strategy of expansion in areas where demographic profiles and state regulations are attractive. The acquired branches are located in Georgia, and all acquired loan portfolios are located in Georgia and Alabama. Based on its evaluation of the agreement consistent with the framework described above, the Company accounted for the acquisition of the three branches as a business combination and the acquisition of the nine loan portfolios as an asset purchase. In conjunction with the acquisition, the Company allocated the purchase price and intangible assets among the acquired branches (and destination branches in the case of loan portfolios) based on the fair values of their respective acquired assets. The Company recorded no goodwill in its accounting for this acquisition.
On October 23, 2017, the Company completed an acquisition of one loan portfolio from 1st Fidelity Loans. The acquisition is consistent with the Company's strategy of expansion in areas where demographic profiles and state regulations are attractive. The acquired loan portfolio is located in the state of Alabama. Based on its evaluation of the agreement consistent with the framework described above, the Company accounted for the acquisition of the loan portfolio as an asset purchase. In conjunction with the acquisition, the Company assigned the entire purchase price and intangible assets to the destination branch. The Company recorded no goodwill in its accounting for this acquisition.
On September 8, 2017, the Company completed an acquisition of one branch and fifteen loan portfolios from Sun Loan Company Tennessee, Inc., Sun Loan Company New Mexico #3, Inc., and Sun Loan Company Oklahoma Number 3, Inc. The acquisition is consistent with the Company's strategy of expansion in areas where demographic profiles and state regulations are attractive. The acquired branch is located in Tennessee, and all acquired loan portfolios are located in the states of Tennessee, New Mexico, and Oklahoma. Based on its evaluation of the agreement consistent with the framework described above, the Company accounted for the acquisition of the branch as a business combination and the acquisition of the fifteen loan portfolios as an asset purchase. In conjunction with the acquisition, the Company allocated the purchase price and intangible assets among the acquired branch (and destination branches in the case of loan portfolios) based on the fair values of their respective acquired assets. The Company recorded no goodwill in its accounting for this acquisition.
On August 23, 2017, the Company completed an acquisition of one loan portfolio from Alpha Credit of Rockmart LLC. The acquisition is consistent with the Company's strategy of expansion in areas where demographic profiles and state regulations are attractive. The acquired loan portfolio is located in the state of Georgia. Based on its evaluation of the agreement consistent with the framework described above, the Company accounted for the acquisition of the loan portfolio as an asset purchase. In conjunction with the acquisition, the Company assigned the entire purchase price and intangible assets to the destination branch. The Company recorded no goodwill in its accounting for this acquisition.
On July 7, 2017, the Company completed an acquisition of one loan portfolio from Sun Loan Company Missouri, Inc. The acquisition is consistent with the Company's strategy of expansion in areas where demographic profiles and state regulations are attractive. The acquired loan portfolio is located in the state of Missouri. Based on its evaluation of the agreement consistent with the framework described above, the Company accounted for the acquisition of the loan portfolio as an asset purchase. In conjunction with the acquisition, the Company assigned the entire purchase price and intangible assets to the destination branch. The Company recorded no goodwill in its accounting for this acquisition.
On May 8, 2017, the Company completed an acquisition of two branches and eight loan portfolios from Texan Credit Corporation. The acquisition is consistent with the Company's strategy of expansion in areas where demographic profiles and state regulations are attractive. All acquired branches and loan portfolios are located in the state of Texas. Based on its evaluation of the agreement consistent with the framework described above, the Company accounted for the acquisition of the two branches as a business combination and the acquisition of the eight loan portfolios as an asset purchase. In conjunction with the acquisition, the Company allocated the purchase price and intangible assets among the acquired branches (and destination branches in the case of loan portfolios) based on the fair values of their respective acquired assets. The Company recorded no goodwill in its accounting for this acquisition.
The results of all acquisitions have been included in the Company’s Consolidated Financial Statements since the respective acquisition date. The pro forma impact of these branches as though they had been acquired at the beginning of the periods presented would not have a material effect on the results of operations as reported.
72
|
(14)
|
Fair Value
|
Fair Value Disclosures
The Company may carry certain financial instruments and derivative assets and liabilities at fair value on a recurring basis. Fair value is defined as the price that would be received to sell an asset or paid to transfer a liability in an orderly transaction between market participants on the measurement date. The Company determines the fair values of its financial instruments based on the fair value hierarchy, which requires an entity to maximize the use of observable inputs and minimize the use of unobservable inputs when measuring fair value.
Financial assets and liabilities measured at fair value are grouped in three levels. The levels prioritize the inputs used to measure the fair value of the assets or liabilities. These levels are:
•
Level 1 – Quoted prices (unadjusted) in active markets for identical assets or liabilities.
•
Level 2 – Inputs other than quoted prices that are observable for assets and liabilities, either directly or indirectly. These inputs include quoted prices for similar assets or liabilities in active markets and quoted prices for identical or similar assets or liabilities in market that are less active.
•
Level 3 – Unobservable inputs for assets or liabilities reflecting the reporting entity’s own assumptions.
The Company’s financial instruments for the periods reported consist of the following: cash and cash equivalents, loans receivable, and senior notes payable. Fair value approximates carrying value for all of these instruments. Loans receivable are originated at prevailing market rates and have an average life of approximately
8 months
. Given the short-term nature of these loans, they are continually repriced at current market rates. The Company’s revolving credit facility has a variable rate based on a margin over LIBOR and reprices with any changes in LIBOR. The Company also considered its creditworthiness in its determination of fair value.
The carrying amount and estimated fair values of the Company’s financial instruments summarized by level are as follows:
|
March 31, 2018
|
March 31, 2017
|
||||||||||||||
|
Carrying Value
|
Estimated Fair Value
|
Carrying Value
|
Estimated Fair Value
|
||||||||||||
|
ASSETS
|
|||||||||||||||
|
Level 1 inputs
|
|||||||||||||||
|
Cash and cash equivalents
|
$
|
32,086,304
|
|
$
|
32,086,304
|
|
$
|
15,200,410
|
|
$
|
15,200,410
|
|
|||
|
Level 3 inputs
|
|||||||||||||||
|
Loans receivable, net
|
725,180,728
|
|
725,180,728
|
|
695,700,589
|
|
695,700,589
|
|
|||||||
|
LIABILITIES
|
|||||||||||||||
|
Level 3 inputs
|
|||||||||||||||
|
Senior notes payable
|
244,900,000
|
|
244,900,000
|
|
295,136,200
|
|
295,136,200
|
|
|||||||
There were no significant assets or liabilities measured at fair value on a non-recurring basis as of
March 31, 2018
and
2017
.
73
|
(15)
|
Quarterly Information (Unaudited)
|
The following sets forth selected quarterly operating data:
|
|
Fiscal 2018
|
Fiscal 2017
|
||||||||||||||||||||||
|
|
First
|
Second
|
Third
|
Fourth
|
First
|
Second
|
Third
|
Fourth
|
||||||||||||||||
|
|
(Dollars in thousands, except for earnings per share data)
|
|||||||||||||||||||||||
|
Total revenues
|
$
|
128,910
|
|
131,006
|
|
136,934
|
|
151,858
|
|
127,080
|
|
129,269
|
|
130,815
|
|
144,571
|
|
|||||||
|
Provision for loan losses
|
30,840
|
|
38,976
|
|
43,755
|
|
17,408
|
|
32,014
|
|
35,871
|
|
39,985
|
|
20,702
|
|
||||||||
|
General and administrative expenses
|
72,917
|
|
70,909
|
|
72,886
|
|
80,721
|
|
62,949
|
|
63,456
|
|
71,237
|
|
70,020
|
|
||||||||
|
Interest expense
|
4,247
|
|
4,791
|
|
5,001
|
|
5,052
|
|
5,586
|
|
5,519
|
|
5,274
|
|
5,125
|
|
||||||||
|
Income tax expense
|
7,838
|
|
6,531
|
|
13,612
|
|
19,534
|
|
9,913
|
|
8,932
|
|
4,679
|
|
16,873
|
|
||||||||
|
Net income
|
$
|
13,068
|
|
9,799
|
|
1,680
|
|
29,143
|
|
16,618
|
|
15,491
|
|
9,640
|
|
31,851
|
|
|||||||
|
Earnings per share:
|
|
|
|
|
|
|
|
|
|
|
|
|
|
|
|
|
||||||||
|
Basic
|
$
|
1.50
|
|
1.12
|
|
0.19
|
|
3.25
|
|
1.91
|
|
1.78
|
|
1.11
|
|
3.67
|
|
|||||||
|
Diluted
|
$
|
1.48
|
|
1.10
|
|
0.19
|
|
3.18
|
|
1.89
|
|
1.76
|
|
1.10
|
|
3.64
|
|
|||||||
The Company's highest loan demand occurs generally from October through December, its third fiscal quarter. Loan demand is generally lowest and loan repayment highest from January to March, its fourth fiscal quarter. Consequently, the Company experiences significant seasonal fluctuations in its operating results and cash needs. Operating results from the Company's third fiscal quarter are generally lower than in other quarters and operating results for its fourth fiscal quarter are generally higher than in other quarters.
|
(16)
|
Litigation
|
Mexico Investigation
As previously disclosed, the Company has retained outside legal counsel and forensic accountants to conduct an investigation of its operations in Mexico, focusing on the legality under the FCPA and certain local laws of certain payments related to loans, the maintenance of the Company’s books and records associated with such payments, and the treatment of compensation matters for certain employees.
The investigation continues to address whether and to what extent improper payments, which may violate the FCPA and other local laws, were made approximately between 2010 and 2017 by or on behalf of WAC de México SOFOM, a subsidiary of the Company, to government officials in Mexico relating to loans made to unionized employees. The Company has voluntarily contacted the SEC and the DOJ to advise both agencies that an investigation is underway and that the Company intends to cooperate with both agencies. The SEC has issued a formal order of investigation. A conclusion cannot be drawn at this time as to what potential remedies these agencies may seek. In addition, the Company cannot determine at this time the ultimate effect that the investigation or any remedial measures will have on its operations in Mexico or its decisions with respect thereto.
If violations of the FCPA or other local laws occurred, the Company could be subject to fines, civil and criminal penalties, equitable remedies, including profit disgorgement and related interest, and injunctive relief. In addition, any disposition of these matters could adversely impact our ability to collect on outstanding loans and result in further modifications to our business practices and compliance programs, including significant restructuring or curtailment of, or other effects on, our operations in Mexico. Any disposition could also potentially require that a monitor be appointed to review future business practices with the goal of ensuring compliance with the FCPA and other applicable laws. The Company could also face fines, sanctions, and other penalties from authorities in Mexico, as well as third-party claims by shareholders and/or other stakeholders of the Company. In addition, disclosure of the investigation could adversely affect the Company’s reputation and its ability to obtain new business or retain existing business from its current customers and potential customers, to attract and retain employees, and to access the capital markets. If it is determined that a violation of the FCPA has occurred, such violation may give rise to an event of default under the Company’s credit agreement if such violation were to have a material
74
adverse effect on the Company’s business, operations, properties, assets, or condition (financial or otherwise) or if the amount of any settlement, penalties, fines or other payments resulted in the Company failing to satisfy any financial covenants. Additional potential FCPA violations or violations of other laws or regulations may be uncovered through the investigation.
In addition to the ultimate liability for disgorgement and related interest, the Company believes that it could be further liable for fines and penalties. The Company is continuing its discussions with the DOJ and SEC regarding the matters under investigation, but the Company cannot reasonably estimate the amount of any fine or penalty that it may have to pay as a part of any possible settlement or assess the potential liability that might be incurred if a settlement is not reached and the government were to litigate the matter. As such, based on the information available at this time, any additional liability related to this matter is not reasonably estimable. The Company will continue to evaluate the amount of its liability pending final resolution of the investigation and any related discussions with the government.
CFPB Investigation
As previously disclosed, on March 12, 2014, the Company received a CID from the Consumer Financial Protection Bureau CFPB. The stated purpose of the CID is to determine whether the Company has been or is “engaging in unlawful acts or practices in connection with the marketing, offering, or extension of credit in violation of Sections 1031 and 1036 of the Consumer Financial Protection Act, 12 U.S.C. §§ 5531, 5536, the Truth in Lending Act, 15 U.S.C. §§ 1601, et seq., Regulation Z, 12 C.F.R. pt. 1026, or any other Federal consumer financial law” and “also to determine whether Bureau action to obtain legal or equitable relief would be in the public interest.” The Company responded, within the deadlines specified in the CID, to broad requests for production of documents, answers to interrogatories and written reports related to loans made by the Company and numerous other aspects of the Company’s business.
By letter dated January 18, 2018, the CFPB informed the Company that it had concluded its investigation and would not be proceeding with an enforcement action against the Company. See Part I, Item 1, “Business-Government Regulation-Federal Legislation,” for a further discussion of these matters and the federal regulations to which the Company’s operations are subject and Part I, Item 1A,”Risk Factors,” for more information regarding these regulations and related risks.
Shareholder Complaints
As previously disclosed, on April 22, 2014, a shareholder filed a putative class action complaint, Edna Selan Epstein v. World Acceptance Corporation et al., in the United States District Court for the District of South Carolina (case number 6:14-cv-01606) (the “Edna Epstein Putative Class Action”), against the Company and certain of its current and former officers on behalf of all persons who purchased or otherwise acquired the Company’s common stock between April 25, 2013 and March 12, 2014. Two amended complaints have been filed by the plaintiffs, and several other motions have been filed in the proceedings. The complaint, as currently amended, alleges that (i) the Company made false and misleading statements in various SEC reports and other public statements in violation of federal securities laws preceding the Company’s disclosure in a Form 8-K filed March 13, 2014 that it had received the above-referenced CID from the CFPB, (ii) the Company’s loan growth and volume figures were inflated because of a weakness in the Company’s internal controls relating to its accounting treatment of certain small-dollar loan re-financings, and (iii) additional allegations regarding, among other things, the Company’s receipt of a Notice and Opportunity to Respond and Advise letter from the CFPB on August 7, 2015. The complaint seeks class certification for a class consisting of all persons who purchased or otherwise acquired the Company’s common stock between January 30, 2013 and August 10, 2015, unspecified monetary damages, costs and attorneys’ fees. The Company denied that the claims had any merit and opposed certification of the proposed class.
On June 7, 2017, during a court-ordered mediation, the parties reached an agreement in principle to settle the Edna Epstein Putative Class Action. The parties’ stipulation setting forth the terms of the settlement was filed with the court on August 25, 2017. The settlement stipulation provides for a settlement payment to the class of $16 million, all of which has been funded by the Company’s directors and officers (D&O) liability insurance carriers. The court entered an order preliminarily approving the settlement on August 31, 2017. On December 18, 2017, the court entered a final order and judgment approving the settlement. The court’s order approving the settlement resolves the claim asserted against all defendants in the action. Neither the Company nor any of its present or former officers have admitted any wrongdoing or liability in connection with the settlement.
As previously disclosed, on July 15, 2015, a shareholder filed a putative derivative complaint, Irwin J. Lipton, et al. v. McLean, et al., in the United States District Court for the District of South Carolina (case number 6:15-cv-02796-MGL) (the “Lipton Derivative Action”), on behalf of the Company against certain of our current and former officers and directors. On September 21, 2015, another shareholder filed a putative derivative complaint, Paul Parshall, et al. v. McLean, et al., in the United States District Court for the District of South Carolina (case number 6:15-cv-03779-MGL) (the “Parshall Derivative
75
Action”), asserting substantially similar claims on behalf of the Company against certain of our current and former officers and directors. On October 14, 2015, the Court entered an order consolidating the Lipton Derivative Action and the Parshall Derivative Action as In re World Acceptance Corp. Derivative Litigation (Lead Case No. 6:15-cv-02796-MGL). The plaintiffs subsequently filed an amended complaint, and the amended consolidated complaint alleges, among other things:
|
(i)
|
that the defendants breached their fiduciary duties by disseminating false and misleading information to the Company’s shareholders regarding the Company’s loan growth, loan renewals, allowances for loan losses, revenue sources, revenue growth, compliance with U.S. generally accepted accounting principles ("GAAP"), and the sufficiency of the Company’s internal controls and accounting procedures;
|
|
(ii)
|
that the defendants breached their fiduciary duties by failing to ensure that the Company maintained adequate internal controls;
|
|
(iii)
|
that the defendants breached their fiduciary duties by failing to exercise prudent oversight and supervision of the Company’s officers and other employees to ensure conformity with all applicable laws and regulations;
|
|
(iv)
|
that the defendants were unjustly enriched as a result of the compensation they received while allegedly breaching their fiduciary duties owed to the Company;
|
|
(v)
|
that the defendants wasted corporate assets by paying excessive compensation to certain of the Company’s executive officers, awarding self-interested stock options to certain of the Company’s officers and directors, incurring legal liability and legal costs to defend the defendants’ unlawful actions, and authorizing the repurchase of Company stock at artificially inflated prices;
|
|
(vi)
|
that certain of the defendants breached their fiduciary duty to the Company by selling shares of the Company’s stock at artificially inflated prices while in the possession of material, nonpublic information regarding the Company’s financial condition;
|
|
(vii)
|
that the defendants violated Section 10(b) of the Securities Exchange Act of 1934 by making false and misleading statements regarding the Company’s practices regarding loan renewals, loan modifications, and accounting for loans;
|
|
(viii)
|
that the defendants violated Section 14(a) of the Securities Exchange Act of 1934 by failing to disclose alleged material facts in the Company’s 2014 and 2015 proxy statements; and
|
|
(ix)
|
allegations similar to those made in connection with the Edna Epstein Putative Class Action described above.
|
The consolidated complaint seeks, among other things, unspecified monetary damages and an order directing the Company to take steps to reform and improve its corporate governance and internal procedures to comply with applicable laws and to protect the Company and its shareholders from future wrongdoing such as that described in the consolidated complaint. On February 28, 2017, the Court entered an order dismissing the derivative litigation. The plaintiffs filed a notice of appeal to the U.S. Court of Appeals for the Fourth Circuit on March 27, 2017.
On June 14, 2017, following mediation, the parties reached an agreement in principle to settle the derivative litigation. The parties’ stipulation setting forth the terms of the settlement was filed with the court on August 4, 2017. The settlement stipulation provides that the Company will adopt certain corporate governance practices and pay plaintiffs’ attorney’s fees and expenses in an amount approved by the court not to exceed $475,000, which fees and expenses will be funded by the Company’s directors and officers (D&O) liability insurance carriers. The court entered an order preliminarily approving the settlement on August 24, 2017. On November 7, 2017, the court entered a final order and judgment approving the settlement and awarding plaintiffs’ attorney’s fees and expenses in the amount of $475,000. The court’s order approving the settlement resolves the claims asserted against all defendants in the action. Neither the Company nor any of its present or former directors and officers have admitted any wrongdoing or liability in connection with the settlement.
General
In addition, from time to time the Company is involved in routine litigation matters relating to claims arising out of its operations in the normal course of business, including matters in which damages in various amounts are claimed.
76
Estimating an amount or range of possible losses resulting from litigation, government actions and other legal proceedings is inherently difficult and requires an extensive degree of judgment, particularly where the matters involve indeterminate claims for monetary damages, may involve fines, penalties or damages that are discretionary in amount, involve a large number of claimants or significant discretion by regulatory authorities, represent a change in regulatory policy or interpretation, present novel legal theories, are in the early stages of the proceedings, are subject to appeal or could result in a change in business practices. In addition, because most legal proceedings are resolved over extended periods of time, potential losses are subject to change due to, among other things, new developments, changes in legal strategy, the outcome of intermediate procedural and substantive rulings and other parties’ settlement posture and their evaluation of the strength or weakness of their case against us. For these reasons, we are currently unable to predict the ultimate timing or outcome of, or reasonably estimate the possible losses or a range of possible losses resulting from, the matters described above. Based on information currently available, the Company does not believe that any reasonably possible losses arising from currently pending legal matters will be material to the Company’s results of operations or financial conditions. However, in light of the inherent uncertainties involved in such matters, an adverse outcome in one or more of these matters could materially and adversely affect the Company’s financial condition, results of operations or cash flows in any particular reporting period.
|
(17)
|
Segments
|
The Company evaluates segment reporting in accordance with FASB ASC 280, Segment Reporting each reporting period, including evaluating the reporting package reviewed by the Chief Operation Decision Maker (“CODM”). The Company has concluded the Chief Executive Officer qualifies as the CODM.
Management believes there are four possible approaches to consider when determining the Company’s operating segments: by nationality, by division, by business line, and by function. In all, these approaches present a total of 13 unique entity components. Of the 13 unique entity components, Management has determined that only the U.S. and Mexico components meet the tests in ASC 280-10-50-1 to be classified as operating segments. The U.S. component is housed within the Nationality approach while the Mexico component is shared by the Nationality and Division approaches.
At
March 31, 2018
only the U.S. operating segment meets one or more of the quantitative thresholds that trigger separately disclosed reporting. However, Management believes separately disclosed information about the Mexico operating segment would be useful to readers of the financial statements. Therefore, the Company has two reportable segments, which are the U.S. and Mexico components.
77
The following table presents operating results for the Company’s two reportable segments:
|
For the Year Ended March 31,
|
||||||||||
|
2018
|
2017
|
2016
|
||||||||
|
Revenues:
|
||||||||||
|
U.S.
|
$
|
502,668,332
|
|
490,821,420
|
|
515,300,873
|
|
|||
|
Mexico
|
46,037,802
|
|
40,913,304
|
|
42,174,834
|
|
||||
|
Consolidated revenues
|
548,706,134
|
|
531,734,724
|
|
557,475,707
|
|
||||
|
Provision for loan losses:
|
||||||||||
|
U.S.
|
$
|
117,620,140
|
|
119,095,712
|
|
114,427,629
|
|
|||
|
Mexico
|
13,358,989
|
|
9,476,450
|
|
9,170,689
|
|
||||
|
Consolidated provision for loan losses
|
130,979,129
|
|
128,572,162
|
|
123,598,318
|
|
||||
|
General and administrative expenses:
(1)
|
||||||||||
|
U.S.
|
$
|
269,107,669
|
|
244,273,626
|
|
241,701,490
|
|
|||
|
Mexico
|
28,325,196
|
|
23,387,597
|
|
27,438,185
|
|
||||
|
Consolidated general and administrative expenses
|
297,432,865
|
|
267,661,223
|
|
269,139,675
|
|
||||
|
Interest expense:
(2)
|
||||||||||
|
U.S.
|
$
|
19,089,635
|
|
21,504,208
|
|
26,849,250
|
|
|||
|
Mexico
|
—
|
|
—
|
|
—
|
|
||||
|
Consolidated interest expense
|
19,089,635
|
|
21,504,208
|
|
26,849,250
|
|
||||
|
Income tax expense (benefit):
|
||||||||||
|
U.S.
|
$
|
47,757,808
|
|
38,157,492
|
|
48,978,587
|
|
|||
|
Mexico
|
(243,321
|
)
|
2,239,345
|
|
1,514,320
|
|
||||
|
Consolidated income tax expense (benefit)
|
47,514,487
|
|
40,396,837
|
|
50,492,907
|
|
||||
|
Net income:
|
||||||||||
|
U.S.
|
$
|
49,093,080
|
|
67,790,382
|
|
83,343,917
|
|
|||
|
Mexico
|
4,596,938
|
|
5,809,912
|
|
4,051,640
|
|
||||
|
Consolidated net income
|
53,690,018
|
|
73,600,294
|
|
87,395,557
|
|
||||
(1)
In accordance with transfer pricing agreements between the segments, the Mexico segment reimburses the U.S. segment for personnel-related and other administrative costs incurred by the U.S. for the benefit of Mexico. For fiscal years
2018
,
2017
, and
2016
these charges totaled
$1.0 million
($5.3 million in charges net of approximately $4.3 million of expense related to the investigation into the Company's Mexico operations),
$0.4 million
($1.5 million in charges net of approximately $1.1 million of expense reversal related to the retirement of the previous Senior Vice President of Mexico), and
$2.7 million
, respectively.
(2)
In accordance with the Company's revolving credit facility, substantially all of the Company’s assets, excluding the Company’s Mexico subsidiaries, are pledged as collateral. Any working capital contributions made by the U.S. to Mexico are treated as contributions of capital. Therefore, the Mexico segment incurs no interest expense.
The following table presents long-lived assets (other than financial instruments, long-term customer relationships of a financial institution, mortgage and other servicing rights, deferred policy acquisition costs, and deferred tax assets)
for the Company’s two reportable segments:
78
|
March 31,
|
|||||||
|
2018
|
2017
|
||||||
|
Total long-lived assets
|
|||||||
|
U.S.
|
$
|
22,785,951
|
|
20,724,777
|
|
||
|
Mexico
|
2,805,467
|
|
3,459,430
|
|
|||
|
Consolidated total assets
|
25,591,418
|
|
24,184,207
|
|
|||
The following table presents total assets for the Company’s two reportable segments:
|
March 31,
|
|||||||
|
2018
|
2017
|
||||||
|
Total assets
|
|||||||
|
U.S.
|
$
|
761,511,639
|
|
730,985,558
|
|
||
|
Mexico
|
79,475,398
|
|
69,603,217
|
|
|||
|
Consolidated total assets
|
840,987,037
|
|
800,588,775
|
|
|||
|
(18)
|
Subsequent Events
|
Twelfth Amendment to Amended and Restated Revolving Credit Facility
On June 1, 2018, the Company entered into a twelfth amendment (the “Twelfth Amendment”) to the Amended and Restated Revolving Credit Agreement, originally dated as of September 17, 2010 (as cumulatively amended, the “Revolving Credit Agreement”), among the Company, the lenders named therein, and Wells Fargo Bank, National Association, as successor Administrative Agent and successor Collateral Agent.
The Twelfth Amendment amends the Revolving Credit Agreement to, among other things: (i) extend the maturity date under the Revolving Credit Agreement from June 15, 2019 to June 15, 2020; (ii) require the use of deposit account control agreements in favor of the administrative agent in certain circumstances; and (iii) require quarterly reports updating the schedule showing the Company’s deposit accounts.
79
MANAGEMENT’S REPORT ON INTERNAL CONTROL OVER FINANCIAL REPORTING
We are responsible for establishing and maintaining adequate internal control over financial reporting, as defined in Rule 13a – 15(f) under the Securities Exchange Act of 1934. We have assessed the effectiveness of internal control over financial reporting as of
March 31, 2018
. Our assessment was based on criteria established in the
Internal Control – Integrated Framework (2013)
issued by the Committee of Sponsoring Organizations of the Treadway Commission (COSO).
Our internal control over financial reporting is a process designed to provide reasonable assurance regarding the reliability of financial reporting and the preparation of financial statements for external purposes in accordance with generally accepted accounting principles. Our internal control over financial reporting includes those policies and procedures that:
|
(1)
|
pertain to the maintenance of records that, in reasonable detail, accurately and fairly reflect our transactions and dispositions of our assets;
|
|
(2)
|
provide reasonable assurance that transactions are recorded as necessary to permit preparation of financial statements in accordance with generally accepted accounting principles, and that our receipts and expenditures are being made only in accordance with authorizations of our management and board of directors; and
|
|
(3)
|
provide reasonable assurance regarding prevention or timely detection of unauthorized acquisition, use, or disposition of our assets that could have a material effect on our financial statements.
|
Because of its inherent limitations, internal control over financial reporting may not prevent or detect misstatements. Also, any assumptions regarding internal control over financial reporting in future periods based on an evaluation of effectiveness in a prior period are subject to the risk that controls may become inadequate because of changes in conditions, or that the degree of compliance with the policies or procedures may deteriorate.
Based on using the COSO criteria, we believe our internal control over financial reporting as of
March 31, 2018
was effective.
Our independent registered public accounting firm has audited the Consolidated Financial Statements included in this Annual Report and has issued an attestation report on the effectiveness of our internal control over financial reporting, as stated in their report.
|
By: /s/ James H. Wanserski
|
|
By: /s/ John L. Calmes, Jr.
|
||
|
James H. Wanserski
|
|
John L. Calmes, Jr.
|
||
|
President and Chief Executive Officer
|
|
Senior Vice President and Chief Financial Officer
|
||
|
Date:
|
June 13, 2018
|
Date:
|
June 13, 2018
|
|
80
Report of Independent Registered Public Accounting Firm
To the Shareholders and the Board of Directors of World Acceptance Corporation and subsidiaries
Opinion on the Financial Statements
We have audited the accompanying consolidated balance sheets of World Acceptance Corporation and its subsidiaries (the Company) as of March 31, 2018 and 2017, the related consolidated statements of operations, comprehensive income, shareholders' equity and cash flows for each of the three years in the period ended March 31, 2018, and the related notes to the consolidated financial statements (collectively, the financial statements). In our opinion, the financial statements present fairly, in all material respects, the financial position of the Company as of March 31, 2018 and 2017, and the results of its operations and its cash flows for each of the three years in the period ended March 31, 2018, in conformity with accounting principles generally accepted in the United States of America.
We have also audited, in accordance with the standards of the Public Company Accounting Oversight Board (United States) (PCAOB), the Company's internal control over financial reporting as of March 31, 2018, based on criteria established in
Internal Control - Integrated Framework
issued by the Committee of Sponsoring Organizations of the Treadway Commission in 2013, and our report dated
June 13, 2018
expressed an unqualified opinion on the effectiveness of the Company's internal control over financial reporting.
Basis for Opinion
These financial statements are the responsibility of the Company’s management. Our responsibility is to express an opinion on the Company’s financial statements based on our audits. We are a public accounting firm registered with the PCAOB and are required to be independent with respect to the Company in accordance with U.S. federal securities laws and the applicable rules and regulations of the Securities and Exchange Commission and the PCAOB.
We conducted our audits in accordance with the standards of the PCAOB. Those standards require that we plan and perform the audits to obtain reasonable assurance about whether the financial statements are free of material misstatement, whether due to error or fraud. Our audits included performing procedures to assess the risks of material misstatement of the financial statements, whether due to error or fraud, and performing procedures that respond to those risks. Such procedures included examining, on a test basis, evidence regarding the amounts and disclosures in the financial statements. Our audits also included evaluating the accounting principles used and significant estimates made by management, as well as evaluating the overall presentation of the financial statements. We believe that our audits provide a reasonable basis for our opinion.
/s/ RSM US LLP
We have served as the Company's auditor since 2014.
Raleigh, North Carolina
June 13, 2018
81
Report of Independent Registered Public Accounting Firm
To the Shareholders and the Board of Directors of World Acceptance Corporation and subsidiaries
Opinion on the Internal Control Over Financial Reporting
We have audited World Acceptance Corporation and subsidiaries’ (the Company) internal control over financial reporting as of March 31, 2018, based on criteria established in
Internal Control - Integrated Framework
issued by the Committee of Sponsoring Organizations of the Treadway Commission in 2013. In our opinion, the Company maintained, in all material respects, effective internal control over financial reporting as of March 31, 2018, based on criteria established in
Internal Control - Integrated Framework
issued by the Committee of Sponsoring Organizations of the Treadway Commission in 2013.
We have also audited, in accordance with the standards of the Public Company Accounting Oversight Board (United States) (PCAOB), the consolidated balance sheets of the Company as of March 31, 2018 and 2017 and the related consolidated statements of operations, comprehensive income, shareholders’ equity, and cash flows for each of the three years in the period ended March 31, 2018, and our report dated
June 13, 2018
expressed an unqualified opinion.
Basis for Opinion
The Company’s management is responsible for maintaining effective internal control over financial reporting and for its assessment of the effectiveness of internal control over financial reporting in the accompanying Management’s Report on Internal Control Over Financial Reporting. Our responsibility is to express an opinion on the Company’s internal control over financial reporting based on our audit. We are a public accounting firm registered with the PCAOB and are required to be independent with respect to the Company in accordance with U.S. federal securities laws and the applicable rules and regulations of the Securities and Exchange Commission and the PCAOB.
We conducted our audit in accordance with the standards of the PCAOB. Those standards require that we plan and perform the audit to obtain reasonable assurance about whether effective internal control over financial reporting was maintained in all material respects. Our audit included obtaining an understanding of internal control over financial reporting, assessing the risk that a material weakness exists, and testing and evaluating the design and operating effectiveness of internal control based on the assessed risk. Our audit also included performing such other procedures as we considered necessary in the circumstances. We believe that our audit provides a reasonable basis for our opinion.
Definition and Limitations of Internal Control Over Financial Reporting
A company's internal control over financial reporting is a process designed to provide reasonable assurance regarding the reliability of financial reporting and the preparation of financial statements for external purposes in accordance with generally accepted accounting principles. A company's internal control over financial reporting includes those policies and procedures that (1) pertain to the maintenance of records that, in reasonable detail, accurately and fairly reflect the transactions and dispositions of the assets of the Company; (2) provide reasonable assurance that transactions are recorded as necessary to permit preparation of financial statements in accordance with generally accepted accounting principles, and that receipts and expenditures of the Company are being made only in accordance with authorizations of management and directors of the Company; and (3) provide reasonable assurance regarding prevention or timely detection of unauthorized acquisition, use or disposition of the Company's assets that could have a material effect on the financial statements.
Because of its inherent limitations, internal control over financial reporting may not prevent or detect misstatements. Also, projections of any evaluation of effectiveness to future periods are subject to the risk that controls may become inadequate because of changes in conditions, or that the degree of compliance with the policies or procedures may deteriorate.
/s/ RSM US LLP
Raleigh, North Carolina
June 13, 2018
82
|
Item 9.
|
Changes in and Disagreements with Accountants on Accounting and Financial Disclosure
|
The Company had no disagreements on accounting or financial disclosure matters with its independent registered public accounting firm to report under this Item 9.
|
Item 9A.
|
Controls and Procedures
|
Evaluation of Disclosure Controls and Procedures
Based on management’s evaluation (with the participation of our Chief Executive Officer (“CEO”) and Chief Financial Officer (“CFO”), as of the end of the period covered by this report, our CEO and CFO have concluded that our disclosure controls and procedures (as defined in Rules 13a-15(e) and 15d-15(e) under the Securities Exchange Act of 1934, as amended (the “Exchange Act”)), are effective to provide reasonable assurance that information required to be disclosed by us in reports that we file or submit under the Exchange Act is recorded, processed, summarized and reported within the time periods specified in SEC rules and forms and is accumulated and communicated to management, including our principal executive officer and principal financial officer, as appropriate, to allow timely decisions regarding required disclosure.
Changes in Internal Control Over Financial Reporting
Management previously identified material weaknesses in the Company's internal control over financial reporting as of March 31, 2017. During the period covered by this report, management took the following remedial actions, which have materially affected, or are reasonably likely to materially affect, our internal control over financial reporting:
|
•
|
identified and made appropriate personnel changes;
|
|
•
|
substantially implemented, with the assistance of an expert third-party contractor, a new accounts payable system for the management of vendors and payments in Mexico, which included requiring dual approval for all payments for legitimate and legal union commissions and fees;
|
|
•
|
implemented a new vendor management policy with the assistance of outside counsel in Mexico;
|
|
•
|
revamped, updated, and expanded our Mexico Code of Business Conduct and Ethics and overall compliance policies and procedures, which included implementing new internal controls around key laws and regulations related to our foreign subsidiaries requiring review of employee training on an annual basis to verify that it is up-to-date and designed appropriately;
|
|
•
|
developed and implemented new and/or additional policies and trainings related to compliance with the Foreign Corrupt Practices Act, anti-bribery, anti-corruption, and anti-money laundering laws and regulations;
|
|
•
|
reorganized the organizational structure of non-operational Mexico management including compliance, legal, and finance;
|
|
•
|
Expanded internal audit coverage and testing related to interim and year-end transaction testing, special documentation reviews, and an implementation review of the recently-installed Mexico vendor payables system; and
|
|
•
|
added the Mexico finance director as a member of the Disclosure Committee, whose members must, among other responsibilities, periodically certify that they are not aware of any inappropriate payments to government officials.
|
Management believes that these remedial actions have strengthened the Company's internal control over financial reporting and have fully remediated the material weaknesses in the Company's internal control over financial reporting.
Management Report on Internal Control Over Financial Reporting
Our management is responsible for establishing and maintaining adequate internal control over financial reporting (as defined in Rules 13a-15(f) and 15d-15(f) under the Exchange Act) to provide reasonable assurance regarding the reliability of our financial reporting and the preparation of financial statements for external purposes in accordance with U.S. generally accepted accounting principles.
83
Management assessed our internal control over financial reporting as of
March 31, 2018
, the end of our fiscal year. Management based its assessment on criteria established in the Internal Control—Integrated Framework (2013) issued by the Committee of Sponsoring Organizations of the Treadway Commission (COSO). Management’s assessment included evaluation of elements such as the design and operating effectiveness of key financial reporting controls, process documentation, accounting policies and our overall control environment.
Based on our assessment, management has concluded that our internal control over financial reporting was effective as of the end of the fiscal year to provide reasonable assurance regarding the reliability of financial reporting and the preparation of financial statements for external reporting purposes in accordance with U.S. generally accepted accounting principles. Management’s Report on Internal Control over Financial Reporting is included in Part II, Item 8 of this Form 10-K. We reviewed the results of management’s assessment with the Audit Compliance Committee of our Board of Directors.
Our independent registered public accounting firm, RSM US LLP, independently assessed the effectiveness of the Company’s internal control over financial reporting. RSM US LLP has issued an attestation report concurring with management’s assessment, which is included at the end of Part II, Item 8 of this Form 10-K.
Inherent Limitations on Effectiveness of Controls
Our management, including the CEO and CFO, does not expect that our disclosure controls and procedures or our internal control over financial reporting will prevent or detect all error and all fraud. A control system, no matter how well designed and operated, can provide only reasonable, not absolute, assurance that the control system’s objectives will be met. The design of a control system must reflect the fact that there are resource constraints, and the benefits of controls must be considered relative to their costs. Further, because of the inherent limitations in all control systems, no evaluation of controls can provide absolute assurance that misstatements due to error or fraud will not occur or that all control issues and instances of fraud, if any, have been detected. These inherent limitations include the realities that judgments in decision-making can be faulty and that breakdowns can occur because of simple error or mistake. Controls can also be circumvented by the individual acts of some persons, by collusion of two or more people, or by management override of the controls. The design of any system of controls is based in part on certain assumptions about the likelihood of future events, and there can be no assurance that any design will succeed in achieving its stated goals under all potential future conditions. Projections of any evaluation of the effectiveness of controls to future periods are subject to risks. Over time, controls may become inadequate because of changes in conditions or deterioration in the degree of compliance with policies or procedures.
|
Item 9B.
|
Other Information
|
None.
84
|
Item 10.
|
Directors, Executive Officers and Corporate Governance
|
Information contained under the captions “Proposal 1 - Election of Directors,” “Corporate Governance,” “Section 16(a) Beneficial Ownership Reporting Compliance” in the Proxy Statement is incorporated herein by reference in response to this Item 10. The information in response to this Item 10 regarding the executive officers of the Company is contained in Item 1, Part I hereof under the caption “Executive Officers of the Company.”
|
Item 11.
|
Executive Compensation
|
Information contained under the captions “Corporate Governance,” “Executive Compensation,” “Director Compensation,” and “Compensation Discussion and Analysis” is incorporated herein by reference in response to this Item 11. The “Report of the Compensation Committee,” which shall be deemed furnished, but not filed herewith, is incorporated herein by reference in response to this Item 11.
|
Item 12.
|
Security Ownership of Certain Beneficial Owners, Management and Related Stockholder Matters
|
Information contained under the captions “Security Ownership of Certain Beneficial Owners and Management” and “Equity Compensation Plan Information” in the Proxy Statement is incorporated by reference herein in response to this Item 12.
For additional information on our stock option plans, see Note 12 in the Notes to Consolidated Financial Statements for the year ended
March 31, 2018
.
|
Item 13.
|
Certain Relationships and Related Transactions and Director Independence
|
Information contained under the captions “Certain Relationships and Related Person Transactions” and “Corporate Governance” in the Proxy Statement is incorporated by reference in response to this Item 13.
|
Item 14.
|
Principal Accountant Fees and Services
|
Information contained under the caption “Proposal 4 - Ratification of Appointment of Independent Registered Public Accounting Firm” is incorporated by reference in response to this Item 14.
85
|
Item 15.
|
Exhibits and Financial Statement Schedules
|
(a)(1) The following Consolidated Financial Statements of the Company and Report of Independent Registered Public Accounting Firm are filed as part of this Annual Report under Item 8.
Consolidated Financial Statements:
Consolidated Balance Sheets at
March 31, 2018
and
2017
Consolidated Statements of Operations for the fiscal years ended
March 31, 2018
,
2017
and
2016
Consolidated Statements of Comprehensive Income for the fiscal years ended
March 31, 2018
,
2017
and
2016
Consolidated Statements of Shareholders' Equity for the fiscal years ended
March 31, 2018
,
2017
and
2016
Consolidated Statements of Cash Flows for the fiscal years ended
March 31, 2018
,
2017
and
2016
Notes to Consolidated Financial Statements
Reports of Independent Registered Public Accounting Firm
(a)(2) Financial Statement Schedules
All schedules for which provision is made in the applicable accounting regulations of the SEC are not required under the related instructions, are inapplicable, or the required information is included elsewhere in the Consolidated Financial Statements.
(a)(3) Exhibits
The list of exhibits filed as a part of this Form 10-K is set forth on the Exhibit Index immediately preceding the signatures to this Form 10-K and is incorporated by reference in this Item 15(a)(3).
(b) Exhibits
The exhibits listed in the accompanying Exhibit Index are filed as a part of this Annual Report on Form 10-K.
(c) Separate Financial Statements and Schedules
Financial statement schedules have been omitted since the required information is included in our Consolidated Financial
Statements contained in Item 8 of this Annual Report on Form 10-K.
86
|
Item 16.
|
Form 10-K Summary
|
None.
87
EXHIBIT INDEX
|
Exhibit
Number
|
Exhibit Description
|
Filed
Herewith
|
Incorporated by Reference
|
||
|
Form or
Registration
Number
|
Exhibit
|
Filing
Date
|
|||
|
3.01
|
S-8
|
3.1
|
07-29-03
|
||
|
3.02
|
8-K
|
3.1
|
01-09-18
|
||
|
4.01
|
Specimen Share Certificate
|
S-1A
|
4.1
|
10-28-91
|
|
|
4.02
|
8-K
|
10.2
|
09-21-10
|
||
|
4.03
|
8-K
|
10.3
|
09-21-10
|
||
|
10.01
|
8-K
|
10.1
|
09-21-10
|
||
|
10.02
|
8-K
|
10.1
|
09-01-11
|
||
|
10.03
|
8-K
|
10.1
|
05-01-12
|
||
|
10.04
|
8-K
|
10.1
|
11-20-12
|
||
|
10.05
|
8-K
|
10.1
|
09-09-13
|
||
|
10.06
|
8-K
|
10.1
|
03-19-14
|
||
|
10.07
|
8-K
|
10.1
|
11-20-14
|
||
|
10.08
|
8-K
|
10.1
|
04-07-15
|
||
|
10.09
|
8-K
|
10.1
|
05-08-15
|
||
|
10.10
|
8-K
|
10.1
|
06-24-15
|
||
|
10.11
|
8-K
|
10.1
|
07-14-16
|
||
|
10.12
|
8-K
|
10.1
|
05-08-17
|
||
|
10.13
|
8-K
|
10.1
|
06-01-18
|
||
|
10.14
|
8-K
|
10.4
|
09-21-10
|
||
|
10.15+
|
World Acceptance Corporation Executive Incentive Plan
|
10-K
|
10.6
|
06-29-94
|
|
|
10.16+
|
World Acceptance Corporation Retirement Savings Plan
|
S-8
|
4.1
|
10-18-96
|
|
|
10.17+
|
10-Q
|
10.1
|
02-02-09
|
||
|
10.18+
|
10-K
|
10.7
|
06-29-00
|
||
|
10.19+
|
10-Q
|
10.15
|
02-01-08
|
||
|
10.20+
|
10-Q
|
10.18
|
02-01-08
|
||
|
10.21+
|
10-Q
|
10.1
|
06-30-09
|
||
88
|
10.22+
|
10-K
|
10.6
|
06-29-00
|
||
|
10.23+
|
10-Q
|
10.13
|
02-01-08
|
||
|
10.24+
|
10-Q
|
10.16
|
02-01-08
|
||
|
10.25+
|
|
10-K
|
10.12
|
06-29-01
|
|
|
10.26+
|
10-Q
|
10.14
|
02-01-08
|
||
|
10.27+
|
10-Q
|
10.17
|
02-01-08
|
||
|
10.28+
|
DEF 14A
|
Appendix A
|
07-01-02
|
||
|
10.29+
|
10-Q
|
10.11
|
02-01-08
|
||
|
10.30+
|
|
DEF 14A
|
Appendix B
|
02-01-08
|
|
|
10.31+
|
10-Q
|
10.12
|
02-01-08
|
||
|
10.32+
|
DEF 14A
|
Appendix A
|
06-30-08
|
||
|
10.33+
|
8-K
|
99.1
|
12-10-12
|
||
|
10.34+
|
DEF 14A
|
Appendix A
|
06-29-11
|
||
|
10.35+
|
*
|
||||
|
10.36+
|
*
|
||||
|
10.37+
|
8-K
|
99.2
|
12-10-12
|
||
|
10.38+
|
8-K
|
99.3
|
12-10-12
|
||
|
10.39+
|
8-K
|
99.2
|
10-01-15
|
||
|
10.40+
|
8-K
|
10.1
|
03-22-16
|
||
|
10.41+
|
*
|
||||
|
10.42+
|
*
|
||||
|
10.43+
|
*
|
||||
|
10.44+
|
*
|
||||
|
10.45+
|
S-8
|
99
|
09-08-17
|
||
|
10.46+
|
8-K
|
10.2
|
01-22-18
|
||
|
10.47+
|
8-K
|
10.1
|
11-24-15
|
||
|
10.48+
|
8-K
|
10.1
|
01-22-18
|
||
|
10.49+
|
8-K
|
10.2
|
11-24-15
|
||
|
10.50+
|
10-K
|
10.31
|
06-01-16
|
||
|
10.51+
|
8-K
|
10.31
|
01-04-18
|
||
|
10.52+
|
8-K
|
10.1
|
09-01-16
|
||
|
10.53+
|
10-Q
|
10.3
|
11-04-16
|
||
|
21
|
*
|
|
|||
89
|
23
|
*
|
|
|||
|
31.01
|
*
|
|
|||
|
31.02
|
*
|
|
|||
|
32.01
|
*
|
|
|||
|
32.02
|
*
|
|
|||
|
101.01
|
The following materials from the Company’s Annual Report on Form 10-K for the fiscal year ended March 31, 2018, formatted in XBRL:
|
*
|
|||
|
(i) Consolidated Balance Sheets as of March 31, 2018 and March 31, 2017;
|
|||||
|
(ii) Consolidated Statements of Operations for the fiscal years ended March 31, 2018, March 31, 2017 and March 31, 2016;
|
|||||
|
(iii) Consolidated Statements of Comprehensive Income for the fiscal years ended March 31, 2018, March 31, 2017 and March 31, 2016;
|
|||||
|
(iv) Consolidated Statements of Shareholders’ Equity for the fiscal years ended March 31, 2018, March 31, 2017 and March 31, 2016;
|
|||||
|
(v) Consolidated Statements of Cash Flows for the fiscal years ended March 31, 2018, March 31, 2017 and March 31, 2016; and
|
|||||
|
(vi) Notes to Consolidated Financial Statements.
|
|||||
|
*
|
Submitted electronically herewith.
|
|
+
|
Management Contract or other compensatory plan required to be filed under Item 15 of this report and Item 601 of Regulation S-K of the Securities and Exchange Commission.
|
90
SIGNATURES
Pursuant to the requirements of Section 13 or 15(d) of the Securities Exchange Act of 1934, the registrant has duly caused this report to be signed on its behalf by the undersigned, thereunto duly authorized.
|
WORLD ACCEPTANCE CORPORATION
|
|||
|
|
|
||
|
|
By: /s/ James H. Wanserski
|
||
|
|
James H. Wanserski
|
||
|
|
President and Chief Executive Officer
|
||
|
|
Date:
|
June 13, 2018
|
|
Pursuant to the requirements of the Securities Exchange Act of 1934, this report has been signed by the following persons on behalf of the registrant and in the capacities and on the dates indicated.
|
/s/ James H. Wanserski
|
/s/ John L. Calmes, Jr.
|
|||
|
James H. Wanserski
|
John L. Calmes, Jr.
|
|||
|
President and Chief Executive Officer
|
Senior Vice President and Chief Financial Officer
|
|||
|
(Principal Executive Officer)
|
(Principal Financial and Accounting Officer)
|
|||
|
Date:
|
June 13, 2018
|
Date:
|
June 13, 2018
|
|
|
/s/ Ken R. Bramlett, Jr.
|
|
/s/ Scott J. Vassalluzzo
|
||
|
Ken R. Bramlett, Jr.
|
|
Scott J. Vassalluzzo
|
||
|
Chairman of the Board of Directors and a Director
|
|
Director
|
||
|
Date:
|
June 13, 2018
|
|
Date:
|
June 13, 2018
|
|
/s/ Charles D. Way
|
|
/s/ Darrell Whitaker
|
||
|
Charles D. Way
|
|
Darrell Whitaker
|
||
|
Director
|
|
Director
|
||
|
Date:
|
June 13, 2018
|
|
Date:
|
June 13, 2018
|
91
TABLE OF CONTENTS
Part IItem 1. Description Of BusinessItem 1A. Risk FactorsItem 1B. Unresolved Staff CommentsItem 2. PropertiesItem 3. Legal ProceedingsItem 4. Mine Safety DisclosuresPart IIItem 5. Market For Registrant's Common Equity, Related Stockholder Matters and Issuer Purchases Of Equity SecuritiesItem 6. Selected Financial DataItem 7. Management S Discussion and Analysis Of Financial Condition and Results Of OperationsItem 7A. Quantitative and Qualitative Disclosures About Market RiskItem 8. Financial Statements and Supplementary DataItem 9. Changes in and Disagreements with Accountants on Accounting and Financial DisclosureItem 9A. Controls and ProceduresItem 9B. Other InformationPart IIIItem 10. Directors, Executive Officers and Corporate GovernanceItem 11. Executive CompensationItem 12. Security Ownership Of Certain Beneficial Owners, Management and Related Stockholder MattersItem 13. Certain Relationships and Related Transactions and Director IndependenceItem 14. Principal Accountant Fees and ServicesPart IVItem 15. Exhibits and Financial Statement SchedulesItem 16. Form 10-k Summary