WEST BANCORPORATION INC
10-Ks and 10-Qs
|
|
|
|
|
|
|
|
|
|
|
|
|
|
|
|
|
|
|
|
|
|
|
|
|
|
|
|
|
|
|
|
|
|
|
|
|
|
|
|
|
|
|
|
|
|
|
|
|
|
|
|
|
|
|
|
UNITED STATES
SECURITIES AND EXCHANGE COMMISSION
WASHINGTON, D.C. 20549
FORM 10-K
|
(Mark One)
|
|
|
x
|
ANNUAL REPORT PURSUANT TO SECTION 13 OR 15(d) OF THE SECURITIES EXCHANGE ACT of 1934
|
|
For the fiscal year ended December 31, 2018
|
|
|
or
|
|
|
o
|
TRANSITION REPORT PURSUANT TO SECTION 13 or 15(d) OF THE SECURITIES EXCHANGE ACT OF 1934
|
|
For the transition period from __________ to __________
|
|
Commission file number:
0-49677
|
WEST BANCORPORATION, INC.
|
|
|
(Exact name of registrant as specified in its charter)
|
|
|
IOWA
|
42-1230603
|
|
(State of incorporation or organization)
|
(I.R.S. Employer Identification No.)
|
|
1601 22
nd
STREET, WEST DES MOINES, IOWA
|
50266
|
|
(Address of principal executive offices)
|
(Zip code)
|
Registrant’s telephone number, including area code:
(515) 222-2300
Securities registered pursuant to Section 12(b) of the Act:
|
Title of Class
|
Name of Each Exchange on Which Registered
|
|
|
Common Stock, No Par Value
|
The Nasdaq Global Select Market
|
|
Securities registered pursuant to Section 12(g) of the Act:
NONE
Indicate by check mark if the registrant is a well-known seasoned issuer, as defined in Rule 405 of the Securities Act.
Yes
o
No
x
Indicate by check mark if the registrant is not required to file reports pursuant to Section 13 or Section 15(d) of the Act.
Yes
o
No
x
Indicate by check mark whether the registrant (1) has filed all reports required to be filed by Section 13 or 15(d) of the Securities Exchange Act of 1934 during the preceding 12 months (or for such shorter period that the registrant was required to file such reports), and (2) has been subject to such filing requirements for the past 90 days. Yes
x
No
o
Indicate by check mark whether the registrant has submitted electronically every Interactive Data File required to be submitted pursuant to Rule 405 of Regulation S-T during the preceding 12 months (or for such shorter period that the registrant was required to submit and post such files). Yes
x
No
o
Indicate by check mark if disclosure of delinquent filers pursuant to Item 405 of Regulation S-K is not contained herein, and will not be contained, to the best of registrant’s knowledge, in definitive proxy or information statements incorporated by reference in Part III of this Form 10-K or any amendment to this Form 10-K.
x
1
Indicate by check mark whether the registrant is a large accelerated filer, an accelerated filer, a non-accelerated filer, a smaller reporting company or an emerging growth company. See the definitions of “large accelerated filer,” “accelerated filer,” “smaller reporting company,” and “emerging growth company” in Rule 12b-2 of the Exchange Act.
|
Large accelerated filer
|
o
|
|
|
Accelerated filer
|
x
|
|
|
Non-accelerated filer
|
o
|
|
|
Smaller reporting company
|
x
|
|
|
Emerging growth company
|
o
|
|
If an emerging growth company, indicate by check mark if the registrant has elected not to use the extended transition period for complying with any new or revised financial accounting standards provided pursuant to Section 13(a) of the Exchange Act.
o
Indicate by check mark whether the registrant is a shell company (as defined in Rule 12b-2 of the Act). Yes
o
No
x
The aggregate market value of the voting common stock held by non-affiliates of the registrant as of June 29, 2018, was approximately $396,500,665.
Indicate the number of shares outstanding of each of the registrant’s classes of common stock as of the most recent practicable date, February 27, 2019.
16,295,494 shares of common stock, no par value
DOCUMENTS INCORPORATED BY REFERENCE
The definitive proxy statement of West Bancorporation, Inc., which was filed on
February 28, 2019
, is incorporated by reference into Part III hereof to the extent indicated in such Part.
2
|
FORM 10-K
|
||
|
TABLE OF CONTENTS
|
||
|
|
||
|
|
|
|
|
PART I
|
||
|
|
|
|
|
ITEM 1.
|
||
|
|
|
|
|
ITEM 1A.
|
||
|
|
|
|
|
ITEM 1B.
|
||
|
|
|
|
|
ITEM 2.
|
||
|
|
|
|
|
ITEM 3.
|
||
|
|
|
|
|
ITEM 4.
|
||
|
|
|
|
|
PART II
|
||
|
|
|
|
|
ITEM 5.
|
||
|
|
|
|
|
ITEM 6.
|
||
|
|
|
|
|
ITEM 7.
|
||
|
|
|
|
|
ITEM 7A.
|
||
|
|
|
|
|
ITEM 8.
|
||
|
|
|
|
|
ITEM 9.
|
||
|
|
|
|
|
ITEM 9A.
|
||
|
|
|
|
|
ITEM 9B.
|
||
|
|
|
|
|
PART III
|
||
|
|
|
|
|
ITEM 10.
|
||
|
|
|
|
|
ITEM 11.
|
||
|
|
|
|
|
ITEM 12.
|
||
|
|
|
|
|
ITEM 13.
|
||
|
|
|
|
|
ITEM 14.
|
||
|
|
|
|
|
PART IV
|
||
|
|
|
|
|
ITEM 15.
|
||
|
ITEM 16.
|
||
3
(PAGE INTENTIONALLY LEFT BLANK)
4
“SAFE HARBOR” CONCERNING FORWARD-LOOKING STATEMENTS
Certain statements in this report, other than purely historical information, including estimates, projections, statements relating to the Company’s business plans, objectives and expected operating results, and the assumptions upon which those statements are based, are “forward-looking statements” within the meanings of the Private Securities Litigation Reform Act of 1995, Section 27A of the Securities Act of 1933, as amended, and Section 21E of the Securities Exchange Act of 1934, as amended (the Exchange Act). Forward-looking statements may appear throughout this report. These forward-looking statements are generally identified by the words “believes,” “expects,” “intends,” “anticipates,” “projects,” “future,” “may,” “should,” “will,” “strategy,” “plan,” “opportunity,” “will be,” “will likely result,” “will continue” or similar references, or references to estimates, predictions or future events. Such forward-looking statements are based upon certain underlying assumptions, risks and uncertainties. Because of the possibility that the underlying assumptions are incorrect or do not materialize as expected in the future, actual results could differ materially from these forward-looking statements. Risks and uncertainties that may affect future results include: interest rate risk; competitive pressures; pricing pressures on loans and deposits; changes in credit and other risks posed by the Company’s loan and investment portfolios, including declines in commercial or residential real estate values or changes in the allowance for loan losses dictated by new market conditions or regulatory requirements; actions of bank and nonbank competitors; changes in local, national and international economic conditions; changes in legal and regulatory requirements, limitations and costs; changes in customers’ acceptance of the Company’s products and services; cyber-attacks; unexpected outcomes of existing or new litigation involving the Company; and any other risks described in the “Risk Factors” sections of this and other reports filed by the Company with the Securities and Exchange Commission (the SEC). The Company undertakes no obligation to revise or update such forward-looking statements to reflect current or future events or circumstances after the date hereof or to reflect the occurrence of unanticipated events.
PART I
ITEM 1. BUSINESS
General Development of Business
West Bancorporation, Inc. (the Company or West Bancorporation) is an Iowa corporation and a financial holding company registered under the Bank Holding Company Act of 1956, as amended (BHCA). The Company was formed in 1984 to own West Bank, an Iowa-chartered bank headquartered in West Des Moines, Iowa. West Bank is a business-focused community bank that was organized in 1893. The Company’s primary activity during
2018
was the ownership of West Bank. The Company’s and West Bank’s only business is banking, and therefore, no segment information is presented in this report.
As a financial holding company, the Company has additional flexibility to engage in a broader range of financial activities through affiliates than are permissible for bank holding companies that are not financial holding companies. While the Company does not currently have a plan to engage in any new activities, as a financial holding company, it has the ability to respond more quickly to market developments and opportunities.
The Company operates in three markets: central Iowa, which is generally the greater Des Moines metropolitan area; eastern Iowa, which is the area including and surrounding Iowa City and Coralville, Iowa; and the Rochester, Minnesota, area.
The Company’s financial performance goal is to be in the top quartile of our benchmarking peer group, which at the end of
2018
consisted of 15 Midwestern, publicly traded financial institutions. The Company and West Bank achieved strong results in the fiscal year ended December 31,
2018
, as measured by the following four key metrics:
|
l
|
Return on average assets:
|
1.31
|
%
|
|
l
|
Return on average equity:
|
15.68
|
%
|
|
l
|
Efficiency ratio
(1)
:
|
48.92
|
%
|
|
l
|
Texas ratio:
|
0.93
|
%
|
(1) As presented, this is a non-GAAP financial measure. See Part II, Item 7 - "Non-GAAP Financial Measures" for additional details.
5
Based on peer group analysis using data from the nine months ended September 30,
2018
, which is the latest available data, the Company’s results and ratios for the fiscal year
2018
were better than those of each member of our defined peer group for each of the measures shown above, except for five peers that had a higher return on average assets. We currently believe our fiscal year
2018
results will similarly compare with the results of our peer group once comparable peer results are available for the fiscal year 2018.
2018 was a year of milestones for the Company. West Bancorporation reported record net income and total assets in 2018 and paid its highest level of dividends in the Company’s history. West Bank celebrated 125 years of building strong relationships with individuals, families and businesses who value our dedication to community banking. West Bank also celebrated five years of serving the Rochester, Minnesota market.
During 2018, the Company received a number of financial performance recognitions, including the following:
|
•
|
West Bancorporation received national recognition from investment bank and research firm Raymond James in the annual Raymond James Community Bankers Cup, which identifies America’s top performing publicly traded community banks with assets between $500 million and $10 billion. The Raymond James Community Bankers Cup recognizes the top 10% of exchange-traded community banks based on various profitability, operational efficiency, and balance sheet metrics. Raymond James ranked West Bancorporation number seven in the nation for 2017. This is the fifth consecutive year we have made this list.
|
|
•
|
West Bancorporation was ranked number 12 among the publicly traded banks with assets between $1 billion and $5 billion in
Bank Director Magazine’s
2017 Bank Performance Scorecard. In addition to this ranking, West Bancorporation was ranked number 21 in the nation across banks of all sizes in the same Bank Performance Scorecard. The rankings were based on five measures related to profitability, capitalization and asset quality. This is the sixth consecutive year we have made this list.
|
The Company continued to grow in
2018
, as loans outstanding at the end of
2018
totaled $
1.72
billion compared to $
1.51
billion at the end of
2017
, an increase of 14.0 percent. Total deposits grew 4.6 percent at
December 31, 2018
from the balances as of December 31,
2017
. We believe the pipeline for new business is good, as we continue to focus efforts on sales through strengthening existing relationships and developing new relationships. We are confident in our ability to cultivate quality relationships and deliver excellent service.
To meet the changing needs of customers and improve the efficiency of resources, the Company consolidated the Iowa City and Coralville branches in the fourth quarter of
2018
. Accordingly, the Company recognized a write-down of premises of $333 thousand related to the Iowa City branch facility. Eastern Iowa customers will continue to be served by our team at the Coralville branch and through our online and mobile banking platforms.
One of the keys to our
2018
operating success was an improvement in net interest income as a result of an increase in the average volume of interest-earning assets. Also contributing to our higher
2018
earnings was the continued low level of nonperforming assets. As of
December 31, 2018
, total nonperforming assets were $
1.9
million, or 0.08 percent of total assets, compared to $
0.6
million, or 0.03 percent of total assets, as of
December 31, 2017
. The Company also benefited in 2018 from the lower federal income tax rate.
The Company declared and paid cash dividends on common stock totaling $
0.78
per share in
2018
and declared a $0.20 quarterly dividend on January 23, 2019, payable on February 20, 2019 to stockholders of record on February 6, 2019. The Company expects to continue paying regular quarterly dividends in the future. In the opinion of management, the capital position of the Company was strong at
December 31, 2018
. At
December 31, 2018
, the Company’s tangible common equity ratio at was
8.32 percent
. As of
December 31, 2018
, the Company had
no
intangible assets or preferred stock.
Description of the Company’s Business
West Bank provides full-service community banking and trust services to customers located primarily in the Des Moines, Coralville and Iowa City, Iowa, and Rochester, Minnesota, metropolitan areas. West Bank has eight offices in the Des Moines area, one office in Coralville and one office in Rochester. West Bank offers many types of credit to its customers, including commercial, real estate and consumer loans. West Bank offers trust services, including the administration of estates, conservatorships, personal trusts and agency accounts.
6
West Bank offers a full range of deposit services, including checking, savings and money market accounts and time certificates of deposit. West Bank also offers internet, mobile banking and treasury management services, which help to meet the banking needs of its customers. Treasury management services offered to business customers include cash management, client-generated automated clearing house transactions, remote deposit and fraud protection services. Also offered are merchant credit card processing and corporate credit cards.
West Bank’s business strategy emphasizes strong business and personal relationships between West Bank and its customers and the delivery of products and services that meet the individualized needs of those customers. West Bank also emphasizes strong cost controls, while striving to achieve an above average return on equity and return on assets. To accomplish these goals, West Bank focuses on small- to medium-sized businesses in its local markets that traditionally wish to develop an exclusive relationship with a single bank. West Bank has the size to provide the personal attention required by local business owners and the financial expertise and entrepreneurial attitude to help businesses meet their financial service needs.
The economies in our market areas are fairly diversified. The Des Moines, Iowa, metropolitan area has a population of approximately 635,000 and an unemployment rate of 2.3 percent. The major sources of employment in this area include financial services companies, healthcare providers and agribusiness industries along with local school districts and federal, state and local governments. Major employers include Wells Fargo & Co., Mercy Medical Center, UnityPoint Health, Hy-Vee Inc., Principal Financial Group and federal, state and local governments. The Iowa City, Iowa, metropolitan area has a population of approximately 97,000 and an unemployment rate of 2.1 percent. The major sources of employment in this area include educational institutions, healthcare providers, and local schools and governments. Major employers include the University of Iowa and University of Iowa Hospitals and Clinics. The Rochester, Minnesota, metropolitan area has a population of approximately 116,000 and an unemployment rate of 2.3 percent. The major sources of employment in this area include healthcare providers, technology and agribusiness industries, and local schools and government. Major employers include Mayo Clinic and IBM, and local schools and governments.
The market areas served by West Bank are highly competitive with respect to both loans and deposits. West Bank competes with other commercial banks, many of which are subsidiaries of other bank holding companies, credit unions, mortgage companies and other financial service providers. According to the Federal Deposit Insurance Corporation’s (FDIC) Summary of Deposits, as of June 30, 2018, there were 36 banks operating within Polk County, Iowa, where seven of West Bank’s offices are located. As of the same date, West Bank ranked fourth based on total deposits of all banking offices in Polk County. As of June 30, 2018, there were 16 banks within Johnson County, Iowa, which includes the Coralville office. As of the same date, West Bank ranked fourth based on total deposits of all banking offices in Johnson County. West Bank also has one office located in Dallas County, Iowa, and as of June 30, 2018, had 2.1 percent of the deposits in Dallas County, Iowa. For the entire state of Iowa, West Bank ranked seventh in terms of deposit size as of June 30, 2018. As previously mentioned, West Bank also has one office located in Rochester, Minnesota, and as of June 30, 2018, had 1.1 percent of the deposits in Olmsted County, Minnesota.
Some of West Bank’s competitors are locally controlled, while others are regional, national or international companies. The larger national or regional banks have certain competitive advantages due to their ability to undertake substantial advertising campaigns and allocate their investment assets to out-of-market geographic regions with potentially higher returns. Such banks also offer certain services, such as international and conduit financing transactions, which are not offered directly by West Bank. These larger banking organizations also have much higher legal lending limits than West Bank, and therefore, may be better able to service large regional, national and global commercial customers.
In order to compete to the fullest extent possible with the other financial institutions in its primary market areas, West Bank uses the flexibility and knowledge of its local management, Board of Directors and community advisors. West Bank has a group of community advisors in each of its markets who provide insight to management on current business activity levels and trends. West Bank seeks to capitalize on customers who desire to do business with a local institution. This includes emphasizing specialized services, local promotional activities, and personal contacts by West Bank’s officers, directors and employees. In particular, West Bank competes for loans primarily by offering competitive interest rates, experienced lending personnel with local decision-making authority, flexible loan arrangements, quality products and services, and proactive relationship management. West Bank competes for deposits principally by offering depositors a variety of straight-forward deposit products and convenient office locations and hours, along with electronic access and other personalized services.
West Bank also competes with the general financial markets for funds. Yields on corporate and government debt securities and commercial paper affect West Bank’s ability to attract and hold deposits. West Bank also competes for funds with money market accounts and similar investment vehicles offered by brokerage firms, mutual fund companies, internet banks and others. The competition for these funds is based almost exclusively on yields to customers.
The Company and West Bank had approximately 163 full-time equivalent employees as of
December 31, 2018
.
7
Supervision and Regulation
General
FDIC-insured institutions, their holding companies and their affiliates are extensively regulated under federal and state law. As a result, our growth and earnings performance may be affected not only by management decisions and general economic conditions, but also by the requirements of federal and state statutes and by the regulations and policies of various bank regulatory agencies, including the Iowa Division of Banking, the Board of Governors of the Federal Reserve System (Federal Reserve), the FDIC and the Consumer Financial Protection Bureau (CFPB). Furthermore, taxation laws administered by the Internal Revenue Service and state taxing authorities, accounting rules developed by the Financial Accounting Standards Board (FASB), securities laws administered by the SEC and state securities authorities, and anti-money laundering laws enforced by the U.S. Department of the Treasury (Treasury) have an impact on our business. The effect of these statutes, regulations, regulatory policies and accounting rules are significant to our operations and results.
Federal and state banking laws impose a comprehensive system of supervision, regulation and enforcement on the operations of FDIC-insured institutions, their holding companies and affiliates that is intended primarily for the protection of the FDIC-insured deposits and depositors of banks, rather than stockholders. These federal and state laws, and the regulations of the bank regulatory agencies issued under them, affect, among other things, the scope of our business; the kinds and amounts of investments we may make; reserve requirements; required capital levels relative to our assets; the nature and amount of collateral for loans; the establishment of branches; our ability to merge, consolidate and acquire; dealings with our insiders and affiliates; and our payment of dividends. In reaction to the global financial crisis and particularly following the passage of the Dodd-Frank Wall Street Reform and Consumer Protection Act of 2010 (Dodd-Frank Act), we experienced heightened regulatory requirements and scrutiny. Although the reforms primarily targeted systemically important financial service providers, their influence filtered down in varying degrees to community banks over time and caused our compliance and risk management processes, and the costs thereof, to increase. After the 2016 federal elections, momentum to decrease the regulatory burden on community banks gathered strength. In May 2018, the Economic Growth, Regulatory Relief and Consumer Protection Act (Regulatory Relief Act) was enacted to modify or remove certain financial reform rules and regulations. While the Regulatory Relief Act maintains most of the regulatory structure established by the Dodd-Frank Act, it amends certain aspects of the regulatory framework for small depository institutions with assets of less than $10 billion, like us, and for large banks with assets of more than $50 billion. Many of these changes are intended to result in meaningful regulatory relief for community banks and their holding companies, including new rules that may make our capital requirements less complex. For a discussion of capital requirements, see “The Role of Capital.” It also eliminated questions about the applicability of certain Dodd-Frank Act reforms to community bank systems, including relieving us of any requirement to engage in mandatory stress tests, maintain a risk committee or comply with the Volker Rule’s complicated prohibitions on proprietary trading and ownership of private funds. We believe these reforms are favorable to our operations, but the true impact remains difficult to predict until rulemaking is complete and the reforms are fully implemented.
The supervisory framework for U.S. banking organizations subjects banks and bank holding companies to regular examination by their respective regulatory agencies, which results in examination reports and ratings that are not publicly available and that can impact the conduct and growth of their business. These examinations consider not only compliance with applicable laws and regulations, but also capital levels, asset quality and risk, management ability and performance, earnings, liquidity and various other factors. The regulatory agencies generally have broad discretion to impose restrictions and limitations on the operations of a regulated entity where the agencies determine, among other things, that such operations are unsafe or unsound, fail to comply with applicable law or are otherwise inconsistent with laws and regulations.
The following is a summary of the material elements of the supervisory and regulatory framework applicable to the Company and West Bank, beginning with a discussion of the continuing regulatory emphasis on our capital levels. It does not describe all of the statutes, regulations and regulatory policies that apply, nor does it restate all of the requirements of those that are described. The descriptions are qualified in their entirety by reference to the particular statutory and regulatory provision.
8
The Role of Capital
Regulatory capital represents the net assets of a banking organization available to absorb losses. Because of the risks attendant to their business, FDIC-insured institutions are generally required to hold more capital than other businesses, which directly affects their earnings capabilities. While capital has historically been one of the key measures of the financial health of both bank holding companies and banks, its role became fundamentally more important in the wake of the global financial crisis, as the banking regulators recognized that the amount and quality of capital held by banks prior to the crisis was insufficient to absorb losses during periods of severe stress. Certain provisions of the Dodd-Frank Act and Basel III, discussed below, establish strengthened capital standards for banks and bank holding companies, require more capital to be held in the form of common stock, and disallow certain funds from being included in capital determinations. These standards represent regulatory capital requirements that are meaningfully more stringent than those in place previously.
Minimum Required Capital Levels.
Banks have been required to hold minimum levels of capital based on guidelines established by the bank regulatory agencies since 1983. The minimums have been expressed in terms of ratios of “capital” divided by “total assets”. As discussed below, bank capital measures have become more sophisticated over the years and have focused more on the quality of capital and the risk of assets. Bank holding companies have historically had to comply with less stringent capital standards than their bank subsidiaries and have been able to raise capital with hybrid instruments such as trust preferred securities. The Dodd-Frank Act mandated the Federal Reserve to establish minimum capital levels for holding companies on a consolidated basis as stringent as those required for FDIC-insured institutions. A result of this change is that the proceeds of hybrid instruments, such as trust preferred securities, which holding companies could issue as capital, were excluded from capital over a phase-out period. However, if such securities were issued prior to May 19, 2010 by bank holding companies with less than $15 billion of assets, they may be retained, subject to certain restrictions. Because we have assets of less than $15 billion, we are able to maintain our trust preferred proceeds as capital but we will not be able to raise capital in the future through the issuance of trust preferred securities.
The Basel International Capital Accords.
The risk-based capital guidelines for U.S. banks since 1989 were based upon the 1988 capital accord known as “Basel I” adopted by the international Basel Committee on Banking Supervision, a committee of central banks and bank supervisors that acts as the primary global standard-setter for prudential regulation, as implemented by the U.S. bank regulatory agencies on an interagency basis. The accord recognized that bank assets for the purpose of the capital ratio calculations needed to be assigned risk weights (the theory being that riskier assets should require more capital) and that off-balance sheet exposures needed to be factored in the calculations. Basel I had a very simple formula for assigning risk weights to bank assets from 0 percent to 100 percent based on four categories. In 2008, the banking agencies collaboratively began to phase-in capital standards based on a second capital accord, referred to as “Basel II,” for large or “core” international banks (generally defined for U.S. purposes as having total assets of $250 billion or more, or consolidated foreign exposures of $10 billion or more) known as “advanced approaches” banks. The primary focus of Basel II was on the calculation of risk weights based on complex models developed by each advanced approaches bank. As most banks were not subject to Basel II, the U.S. bank regulators worked to improve the risk sensitivity of Basel I standards without imposing the complexities of Basel II. This “standardized approach” increased the number of risk-weight categories and recognized risks well above the original 100 percent risk weight. It is institutionalized by the Dodd-Frank Act for all banking organizations as a floor.
On September 12, 2010, the Group of Governors and Heads of Supervision, the oversight body of the Basel Committee on Banking Supervision, announced agreement on a strengthened set of capital requirements for banking organizations around the world, known as “Basel III”, to address deficiencies recognized in connection with the global financial crisis.
The Basel III Rule.
In July 2013, the U.S. federal banking agencies approved the implementation of the Basel III regulatory capital reforms in pertinent part, and, at the same time, promulgated rules effecting certain changes required by the Dodd-Frank Act (Basel III Rule). In contrast to capital requirements historically, which were in the form of guidelines, Basel III was released in the form of regulations by each of the regulatory agencies. The Basel III Rule is applicable to all banking organizations that are subject to minimum capital requirements, including federal and state banks and savings and loan associations, as well as to bank and savings and loan holding companies, other than “small bank holding companies” who are relieved from compliance with the Basel III Rule. While holding companies with consolidated assets of less than $3 billion, like the Company, are considered small bank holding companies for this purpose, we have securities registered with the SEC and that disqualifies us from taking advantage of the relief. Banking organizations became subject to the Basel IIII Rule on January 1, 2015 and its requirements were fully phased-in as of January 1, 2019.
The Basel III Rule impacts both the definitions of the various forms of capital used to calculate the ratios and how assets will be weighted for the purpose of calculating such ratios. It increased the required quantity and quality of capital and required more detailed categories of risk weights of riskier, more opaque assets. For nearly every class of assets, the Basel III Rule requires a more complex, detailed and calibrated assessment of risk in the calculation of risk-weight amounts.
9
Not only did the Basel III Rule increase most of the required minimum capital ratios in effect prior to January 1, 2015, but it introduced the concept of Common Equity Tier 1 Capital, which consists primarily of common stock, related surplus (net of Treasury stock), retained earnings, and Common Equity Tier 1 minority interests subject to certain regulatory adjustments. The Basel III Rule also changed the definition of capital by establishing more stringent criteria that instruments must meet to be considered Additional Tier 1 Capital (primarily noncumulative perpetual preferred stock that meets certain requirements) and Tier 2 Capital (primarily other types of preferred stock, subordinated debt and the allowance for loan losses, subject to limitations). A number of instruments that qualified as Tier 1 Capital under Basel I do not qualify, or their qualifications changed. For example, noncumulative perpetual preferred stock, which qualified as simple Tier 1 Capital under Basel I, does not qualify as Common Equity Tier 1 Capital, but qualifies as Additional Tier 1 Capital. The Basel III Rule also constrained the inclusion of minority interests, mortgage-servicing assets, and deferred tax assets in capital and requires deductions from Common Equity Tier 1 Capital in the event that such assets exceed a certain percentage of a banking institution’s Common Equity Tier 1 Capital.
The Basel III Rule required minimum capital ratios as of January 1, 2015, as follows:
|
•
|
A ratio of minimum Common Equity Tier 1 Capital equal to 4.5 percent of total risk-weighted assets;
|
|
•
|
An increase in the minimum required amount of Tier 1 Capital from 4 percent to 6 percent of total risk-weighted assets;
|
|
•
|
A continuation of the minimum required amount of Total Capital (Tier 1 plus Tier 2) at 8 percent of total risk-weighted assets; and
|
|
•
|
A minimum leverage ratio of Tier 1 Capital to total quarterly average assets equal to 4 percent in all circumstances.
|
In addition, institutions that seek the freedom to make capital distributions (including for dividends and repurchases of stock) and pay discretionary bonuses to executive officers without restriction must also maintain 2.5 percent in Common Equity Tier 1 Capital attributable to a capital conservation buffer (fully phased in as of January 1, 2019). The purpose of the conservation buffer is to ensure that banking institutions maintain a buffer of capital that can be used to absorb losses during periods of financial and economic stress. Factoring in the conservation buffer increases the minimum ratios depicted above to 7 percent for Common Equity Tier 1 Capital, 8.5 percent for Tier 1 Capital and 10.5 percent for Total Capital.
Well-Capitalized Requirements.
The ratios described above are minimum standards in order for banking organizations to be considered “adequately capitalized.” Bank regulatory agencies uniformly encourage banks to hold more capital and be “well-capitalized” and, to that end, federal law and regulations provide various incentives for banking organizations to maintain regulatory capital at levels in excess of minimum regulatory requirements. For example, a banking organization that is well-capitalized may: (i) qualify for exemptions from prior notice or application requirements otherwise applicable to certain types of activities; (ii) qualify for expedited processing of other required notices or applications; and (iii) accept, roll-over or renew brokered deposits. Higher capital levels could also be required if warranted by the particular circumstances or risk profiles of individual banking organizations. For example, the Federal Reserve’s capital guidelines contemplate that additional capital may be required to take adequate account of, among other things, interest rate risk, or the risks posed by concentrations of credit, nontraditional activities or securities trading activities. Further, any banking organization experiencing or anticipating significant growth would be expected to maintain capital ratios, including tangible capital positions (i.e., Tier 1 Capital less all intangible assets), well above the minimum levels.
Under the capital regulations of the FDIC and Federal Reserve, in order to be well-capitalized, a banking organization must maintain:
|
•
|
A Common Equity Tier 1 Capital ratio to total risk-weighted assets of 6.5 percent or more;
|
|
•
|
A ratio of Tier 1 Capital to total risk-weighted assets of 8 percent or more (6 percent under Basel I);
|
|
•
|
A ratio of Total Capital to total risk-weighted assets of 10 percent or more (the same as Basel I); and
|
|
•
|
A leverage ratio of Tier 1 Capital to total adjusted average quarterly assets of 5 percent or greater.
|
It is possible under the Basel III Rule to be well-capitalized while remaining out of compliance with the capital conservation buffer discussed above.
As of December 31, 2018: (i) West Bank was not subject to a directive from the FDIC to increase its capital; and (ii) West Bank was well-capitalized, as defined by FDIC regulations. As of December 31, 2018, the Company had regulatory capital in excess of the Federal Reserve’s requirements and met the fully phased-in Basel III Rule requirements.
10
Prompt Corrective Action.
The concept of being “well-capitalized” is part of a regulatory regime that provides the federal banking regulators with broad power to take “prompt corrective action” to resolve the problems of undercapitalized institutions based on the capital level of each particular institution. The extent of the regulators’ powers depends on whether the institution in question is “adequately capitalized,” “undercapitalized,” “significantly undercapitalized” or “critically undercapitalized,” in each case as defined by regulation. Depending upon the capital category to which an institution is assigned, the regulators’ corrective powers include: (i) requiring the institution to submit a capital restoration plan; (ii) limiting the institution’s asset growth and restricting its activities; (iii) requiring the institution to issue additional capital stock (including additional voting stock) or to sell itself; (iv) restricting transactions between the institution and its affiliates; (v) restricting the interest rates that the institution may pay on deposits; (vi) ordering a new election of directors of the institution; (vii) requiring that senior executive officers or directors be dismissed; (viii) prohibiting the institution from accepting deposits from correspondent banks; (ix) requiring the institution to divest certain subsidiaries; (x) prohibiting the payment of principal or interest on subordinated debt; and (xi) ultimately, appointing a receiver for the institution.
The Potential for Community Bank Capital Simplification.
Community banks have long raised concerns with bank regulators about the regulatory burden, complexity, and costs associated with certain provisions of the Basel III Rule. In response, Congress provided a potential Basel III “off-ramp” for institutions, like us, with total consolidated assets of less than $10 billion. Section 201 of the Regulatory Relief Act instructed the federal banking regulators to establish a single “Community Bank Leverage Ratio” (CBLR) of between 8 and 10 percent. On November 21, 2018, the agencies proposed setting the CBLR at 9 percent of tangible equity to total assets for a qualifying bank to be well-capitalized. Under the proposal, a community banking organization would be eligible to elect the new framework if it has: less than $10 billion in total consolidated assets, limited amounts of certain assets and off-balance sheet exposures, and a CBLR greater than 9 percent. The electing institution would not be required to calculate the existing risk-based and leverage capital requirements of the Basel III Rule and would not need to risk weight its assets for purposes of capital calculations.
We are in the process of considering the CBLR proposal and will await the final regulation to determine whether we will elect the framework.
Regulation and Supervision of the Company
General.
The Company, as the sole stockholder of West Bank, is a bank holding company that has elected financial holding company status. As a bank holding company, we are registered with, and subject to regulation by, the Federal Reserve under the Bank Holding Company Act of 1956, as amended (BHCA). We are legally obligated to act as a source of financial and managerial strength to West Bank and to commit resources to support West Bank in circumstances where we might not otherwise do so. Under the BHCA, we are subject to periodic examination by the Federal Reserve and are required to file with the Federal Reserve periodic reports of our operations and such additional information regarding our operations as the Federal Reserve may require.
Acquisitions and Activities/Financial Holding Company Election.
The primary purpose of a bank holding company is to control and manage banks. The BHCA generally requires the prior approval of the Federal Reserve for any merger involving a bank holding company or any acquisition by a bank holding company of another bank or bank holding company. Subject to certain conditions (including deposit concentration limits established by the BHCA), the Federal Reserve may allow a bank holding company to acquire banks located in any state of the United States. In approving interstate acquisitions, the Federal Reserve is required to give effect to applicable state law limitations on the aggregate amount of deposits that may be held by the acquiring bank holding company and its FDIC-insured institution affiliates in the state in which the target bank is located (provided that those limits do not discriminate against out-of-state institutions or their holding companies) and state laws that require that the target bank have been in existence for a minimum period of time (not to exceed five years) before being acquired by an out-of-state bank holding company. Furthermore, in accordance with the Dodd-Frank Act, bank holding companies must be well-capitalized and well-managed in order to effect interstate mergers or acquisitions. For a discussion of the capital requirements, see “The Role of Capital” above.
The BHCA generally prohibits the Company from acquiring direct or indirect ownership or control of more than five percent of the voting shares of any company that is not a bank and from engaging in any business other than that of banking, managing and controlling banks or furnishing services to banks and their subsidiaries. This general prohibition is subject to a number of exceptions. The principal exception allows bank holding companies to engage in, and to own shares of companies engaged in, certain businesses found by the Federal Reserve prior to November 11, 1999 to be “so closely related to banking ... as to be a proper incident thereto.” This authority would permit us to engage in a variety of banking-related businesses, including the ownership and operation of any entity engaged in consumer finance, equipment leasing, the operation of a computer service bureau (including software development), mortgage banking and brokerage services. The BHCA does not place territorial restrictions on the domestic activities of nonbank subsidiaries of bank holding companies.
11
Additionally, bank holding companies that meet certain eligibility requirements prescribed by the BHCA and elect to operate as financial holding companies may engage in, or own shares in companies engaged in, a wider range of nonbanking activities, including securities and insurance underwriting and sales, merchant banking and any other activity that the Federal Reserve, in consultation with the Secretary of the Treasury, determines by regulation or order is financial in nature or incidental to any such financial activity or that the Federal Reserve determines by order to be complementary to any such financial activity and does not pose a substantial risk to the safety or soundness of FDIC-insured institutions or the financial system generally. In the third quarter of 2016, we elected to operate as a financial holding company. In order to maintain our status as a financial holding company, both the Company and West Bank must be well-capitalized, well-managed, and have at least a satisfactory Community Reinvestment Act (CRA) rating. If the Federal Reserve determines that we are not well-capitalized or well-managed, we will have a period of time in which to achieve compliance, but during the period of noncompliance, the Federal Reserve may place any limitations on us it believes to be appropriate. Furthermore, if the Federal Reserve determines that West Bank has not received a satisfactory CRA rating, we will not be able to commence any new financial activities or acquire a company that engages in such activities. As of December 31, 2018, we retained our election as a financial holding company, but we have not engaged in any activity and did not own any assets for which a financial holding company designation was required. The election affords the ability to respond more quickly to market developments and opportunities.
Change in Control.
Federal law also prohibits any person or company from acquiring “control” of an FDIC-insured depository institution or its holding company without prior notice to the appropriate federal bank regulator. Control is conclusively presumed to exist upon the acquisition of 25 percent or more of the outstanding voting securities of a bank or bank holding company, but may arise under certain circumstances between 10 percent and 24.99 percent ownership.
Capital Requirements.
We have been subject to the complex consolidated capital requirements of the Basel III Rule since the U.S. federal banking agencies approved its implementation effective January 1, 2015. Only qualifying small bank holding companies were excluded from compliance with the Basel III Rule by virtue of the Federal Reserve’s “Small Bank Holding Company Policy Statement”. Prior to 2018, our assets were in excess of the maximum permitted in the definition of a small bank holding company for this purpose; however, the Regulatory Relief Act expanded the category of holding companies that may rely on the policy statement by raising the maximum amount of assets they may hold to $3 billion, and the Federal Reserve issued an interim final rule, effective August 30, 2018, to bring the policy statement in line with the law. As a result, qualifying holding companies with assets of less than $3 billion are not subject to the capital requirements of the Basel III Rule and are deemed to be “well-capitalized”. However, one of the qualifications for this treatment is that the holding company not have securities registered with the SEC. We are a public reporting company and have shares registered with the SEC. As such, we do not meet the qualifications of the Small Bank Holding Company Policy Statement. For a discussion of capital requirements, see “The Role of Capital” above.
Dividend Payments.
Our ability to pay dividends to our stockholders may be affected by both general corporate law considerations and policies of the Federal Reserve applicable to bank holding companies. As an Iowa corporation, we are subject to the limitations of Iowa law, which allows us to pay dividends unless, after such dividend, (i) we would not be able to pay our debts as they become due in the usual course of business or (ii) our total assets would be less than the sum of our total liabilities plus any amount that would be needed if we were to be dissolved at the time of the dividend payment, to satisfy the preferential rights upon dissolution of stockholders whose rights are superior to the rights of the stockholders receiving the distribution.
As a general matter, the Federal Reserve has indicated that the board of directors of a bank holding company should eliminate, defer or significantly reduce dividends to stockholders if: (i) the company’s net income available to stockholders for the past four quarters, net of dividends previously paid during that period, is not sufficient to fully fund the dividends; (ii) the prospective rate of earnings retention is inconsistent with the company’s capital needs and overall current and prospective financial condition; or (iii) the company will not meet, or is in danger of not meeting, its minimum regulatory capital adequacy ratios. The Federal Reserve also possesses enforcement powers over bank holding companies and their nonbank subsidiaries to prevent or remedy actions that represent unsafe or unsound practices or violations of applicable statutes and regulations. Among these powers is the ability to proscribe the payment of dividends by banks and bank holding companies. In addition, under the Basel III Rule, institutions that seek the freedom to pay dividends will have to maintain 2.5 percent in Common Equity Tier 1 Capital attributable to the capital conservation buffer. See “The Role of Capital” above.
12
Monetary Policy.
The monetary policy of the Federal Reserve has a significant effect on the operating results of financial or bank holding companies and their subsidiaries. Among the tools available to the Federal Reserve to affect the money supply are open market transactions in U.S. government securities, changes in the discount rate on bank borrowings and changes in reserve requirements against bank deposits. These means are used in varying combinations to influence overall growth and distribution of bank loans, investments and deposits, and their use may affect interest rates charged on loans or paid on deposits.
Federal Securities Regulation.
Our common stock is registered with the SEC under the Securities Exchange Act of 1934, as amended (Exchange Act). Consequently, we are subject to the information, proxy solicitation, insider trading and other restrictions and requirements of the SEC under the Exchange Act.
Corporate Governance.
The Dodd-Frank Act addressed many investor protection, corporate governance and executive compensation matters that will affect most U.S. publicly traded companies. The Dodd-Frank Act increased stockholder influence over boards of directors by requiring companies to give stockholders a nonbinding vote on executive compensation and so-called “golden parachute” payments, and authorizing the SEC to promulgate rules that would allow stockholders to nominate and solicit voters for their own candidates using a company’s proxy materials. The legislation also directed the Federal Reserve to promulgate rules prohibiting excessive compensation paid to executives of bank holding companies, regardless of whether such companies are publicly traded.
Regulation and Supervision of West Bank
General.
West Bank is an Iowa-chartered bank. The deposit accounts of West Bank are insured by the FDIC’s Deposit Insurance Fund (DIF) to the maximum extent provided under federal law and FDIC regulations, currently $250,000 per insured depositor category. As an Iowa-chartered FDIC-insured bank, West Bank is subject to the examination, supervision, reporting and enforcement requirements of the Iowa Division of Banking, the chartering authority for Iowa banks, and the FDIC, designated by federal law as the primary federal regulator of insured state banks that, like West Bank, are not members of the Federal Reserve System (nonmember banks).
Deposit Insurance.
As an FDIC-insured institution, West Bank is required to pay deposit insurance premium assessments to the FDIC. The FDIC has adopted a risk-based assessment system whereby FDIC-insured institutions pay insurance premiums at rates based on their risk classification. For institutions, like West Bank, that are not considered large and highly complex banking organizations, assessments are now based on examination ratings and financial ratios. The total base assessment rates currently range from 1.5 basis points to 30 basis points. At least semi-annually, the FDIC updates its loss and income projections for the DIF and, if needed, increases or decreases the assessment rates, following notice and comment on proposed rulemaking. The assessment base against which an FDIC-insured institution’s deposit insurance premiums paid to the DIF have been calculated since effectiveness of the Dodd-Frank Act is based on its average consolidated total assets less its average tangible equity. This method shifted the burden of deposit insurance premiums toward those large depository institutions that rely on funding sources other than U.S. deposits.
The reserve ratio is the FDIC insurance fund balance divided by estimated insured deposits. The Dodd-Frank Act altered the minimum reserve ratio of the DIF, increasing the minimum from 1.15 percent to 1.35 percent of the estimated amount of total insured deposits, and eliminating the requirement that the FDIC pay dividends to FDIC-insured institutions when the reserve ratio exceeds certain thresholds. The reserve ratio reached 1.36 percent as of September 30, 2018 (most recent available), exceeding the statutory required minimum reserve ratio of 1.35 percent. The FDIC will provide assessment credits to insured depository institutions, like West Bank, with total consolidated assets of less than $10 billion for the portion of their regular assessments that contribute to growth in the reserve ratio between 1.15 percent and 1.35 percent. The FDIC will apply the credits each quarter that the reserve ratio is at least 1.38 percent to offset the regular deposit insurance assessments of institutions with credits.
FICO Assessments.
In addition to paying basic deposit insurance assessments, FDIC-insured institutions must pay Financing Corporation (FICO) assessments. FICO is a mixed-ownership governmental corporation chartered by the former Federal Home Loan Bank Board pursuant to the Competitive Equality Banking Act of 1987 to function as a financing vehicle for the recapitalization of the former Federal Savings and Loan Insurance Corporation. FICO issued 30-year noncallable bonds of approximately $8.1 billion that mature in 2017 through 2019. FICO’s authority to issue bonds ended on December 12, 1991. Since 1996, federal legislation has required that all FDIC-insured institutions pay assessments to cover interest payments on FICO’s outstanding obligations. The FICO assessment rate is adjusted quarterly.
Supervisory Assessments.
All Iowa banks are required to pay supervisory assessments to the Iowa Division of Banking to fund the operations of that agency. The amount of the assessment is calculated on the basis of West Bank’s total assets.
Capital Requirements.
Banks are generally required to maintain capital levels in excess of other businesses. For a discussion of capital requirements, see “The Role of Capital” above.
13
Liquidity Requirements.
Liquidity is a measure of the ability and ease with which bank assets may be converted to cash. Liquid assets are those that can be converted to cash quickly if needed to meet financial obligations. To remain viable, FDIC-insured institutions must have enough liquid assets to meet their near-term obligations, such as withdrawals by depositors. In addition to liquidity guidelines already in place, the U.S. bank regulatory agencies implemented the Basel III Liquidity Coverage Ratios (LCR) in September 2014, which require large financial firms to hold levels of liquid assets sufficient to protect against constraints on their funding during times of financial turmoil. While the LCR only applies to the largest banking organizations in the country, we continue to review our liquidity risk management policies in light of these developments.
Dividend Payments.
The primary source of funds for the Company is dividends from West Bank. Under the Iowa Banking Act, Iowa-chartered banks generally may pay dividends only out of undivided profits. The Iowa Division of Banking may restrict the declaration or payment of a dividend by an Iowa-chartered bank, such as West Bank. The payment of dividends by any FDIC-insured institution is affected by the requirement to maintain adequate capital pursuant to applicable capital adequacy guidelines and regulations, and an FDIC-insured institution generally is prohibited from paying any dividends if, following payment thereof, the institution would be undercapitalized. As described above, West Bank exceeded its capital requirements under applicable guidelines as of December 31, 2018. Notwithstanding the availability of funds for dividends, however, the FDIC and the Iowa Division of Banking may prohibit the payment of dividends by West Bank if either or both determine such payment would constitute an unsafe or unsound practice. In addition, under the Basel III Rule, institutions that seek the freedom to pay dividends will have to maintain 2.5 percent in Common Equity Tier 1 Capital attributable to the capital conservation buffer. See “The Role of Capital” above.
State Bank Investments and Activities.
West Bank is permitted to make investments and engage in activities directly or through subsidiaries as authorized by Iowa law. However, under federal law and FDIC regulations, FDIC-insured state banks are prohibited, subject to certain exceptions, from making or retaining equity investments of a type, or in an amount, that are not permissible for a national bank. Federal law and FDIC regulations also prohibit FDIC-insured state banks and their subsidiaries, subject to certain exceptions, from engaging as principal in any activity that is not permitted for a national bank unless West Bank meets, and continues to meet, its minimum regulatory capital requirements and the FDIC determines that the activity would not pose a significant risk to the DIF. These restrictions have not had, and are not currently expected to have, a material impact on the operations of West Bank.
Insider Transactions.
West Bank is subject to certain restrictions imposed by federal law on “covered transactions” between West Bank and its “affiliates.” The Company is an affiliate of West Bank for purposes of these restrictions, and covered transactions subject to the restrictions include extensions of credit to the Company, investments in the stock or other securities of the Company, and the acceptance of the stock or other securities of the Company as collateral for loans made by West Bank. The Dodd-Frank Act enhanced the requirements for certain transactions with affiliates, including an expansion of the definition of “covered transactions” and an increase in the amount of time for which collateral requirements regarding covered transactions must be maintained.
Certain limitations and reporting requirements are also placed on extensions of credit by West Bank to its directors and officers, to directors and officers of the Company and its subsidiaries, to principal stockholders of the Company and to “related interests” of such directors, officers and principal stockholders. In addition, federal law and regulations may affect the terms upon which any person who is a director or officer of the Company or West Bank, or a principal stockholder of the Company, may obtain credit from banks with which West Bank maintains a correspondent relationship.
Safety and Soundness Standards/Risk Management.
FDIC-insured institutions are expected to operate in a safe and sound manner. The federal banking agencies have adopted operational and managerial standards to promote the safety and soundness of such institutions that address internal controls, information systems, internal audit systems, loan documentation, credit underwriting, interest rate exposure, asset growth, compensation, fees and benefits, asset quality and earnings.
In general, the safety and soundness standards prescribe the goals to be achieved in each area, and each institution is responsible for establishing its own procedures to achieve those goals. If an institution fails to operate in a safe and sound manner, the FDIC-insured institution’s primary federal regulator may require the institution to submit a plan for achieving and maintaining compliance. If an FDIC-insured institution fails to submit an acceptable compliance plan, or fails in any material respect to implement a compliance plan that has been accepted by its primary federal regulator, the regulator is required to issue an order directing the institution to cure the deficiency. Until the deficiency cited in the regulator’s order is cured, the regulator may restrict the FDIC-insured institution’s rate of growth, require the FDIC-insured institution to increase its capital, restrict the rates the institution pays on deposits or require the institution to take any action the regulator deems appropriate under the circumstances. Operating in an unsafe or unsound manner will also constitute grounds for other enforcement action by the federal bank regulatory agencies, including cease and desist orders and civil money penalty assessments.
14
During the past decade, the bank regulatory agencies have increasingly emphasized the importance of sound risk management processes and strong internal controls when evaluating the activities of the FDIC-insured institutions they supervise. Properly managing risks has been identified as critical to the conduct of safe and sound banking activities and has become even more important as new technologies, product innovation, and the size and speed of financial transactions have changed the nature of banking markets. The agencies have identified a spectrum of risks facing a banking institution including, but not limited to, credit, market, liquidity, operational, legal and reputational risk. In particular, recent regulatory pronouncements have focused on operational risk, which arises from the potential that inadequate information systems, operational problems, breaches in internal controls, fraud, or unforeseen catastrophes will result in unexpected losses. New products and services, third-party risk and cybersecurity are critical sources of operational risk that FDIC-insured institutions must address in the current environment. West Bank is expected to have active board and senior management oversight; adequate policies, procedures and limits; adequate risk measurement, monitoring and management information systems; and comprehensive internal controls.
Branching Authority.
Iowa banks, such as West Bank, have the authority under Iowa law to establish branches anywhere in the State of Iowa, subject to receipt of all required regulatory approvals. The Dodd-Frank Act permits well-capitalized and well-managed banks to establish new interstate branches or the acquisition of individual branches of a bank in another state (rather than the acquisition of an out-of-state bank in its entirety) without impediments. Federal law permits state and national banks to merge with banks in other states subject to: (i) regulatory approval; (ii) federal and state deposit concentration limits; and (iii) state law limitations requiring the merging bank to have been in existence for a minimum period of time (not to exceed five years) prior to the merger.
Transaction Account Reserves.
Federal Reserve regulations require FDIC-insured institutions to maintain reserves against their transaction accounts (primarily NOW and regular checking accounts). For 2019, the first $16.3 million of otherwise reservable balances are exempt from reserves and have a zero percent reserve requirement; for transaction accounts aggregating between $16.3 million to $124.2 million, the reserve requirement is 3 percent of those transaction account balances; and for net transaction accounts in excess of $124.2 million, the reserve requirement is 10 percent of the aggregate amount of total transaction account balances in excess of $124.2 million. These reserve requirements are subject to annual adjustment by the Federal Reserve.
Community Reinvestment Act Requirements.
CRA requires West Bank to have a continuing and affirmative obligation in a safe and sound manner to help meet the credit needs of its entire community, including low- and moderate-income neighborhoods. Federal regulators regularly assess West Bank’s record of meeting the credit needs of its communities. Applications for additional acquisitions would be affected by the evaluation of West Bank’s effectiveness in meeting its CRA requirements.
Anti-Money Laundering.
The Uniting and Strengthening America by Providing Appropriate Tools Required to Intercept and Obstruct Terrorism Act of 2001 (USA PATRIOT Act) is designed to deny terrorists and criminals the ability to obtain access to the U.S. financial system and has significant implications for FDIC-insured institutions, brokers, dealers and other businesses involved in the transfer of money. The USA PATRIOT Act mandates financial services companies to have policies and procedures with respect to measures designed to address any or all of the following matters: (i) customer identification programs; (ii) money laundering; (iii) terrorist financing; (iv) identifying and reporting suspicious activities and currency transactions; (v) currency crimes; and (vi) cooperation between FDIC-insured institutions and law enforcement authorities.
Privacy and Cybersecurity.
West Bank is subject to many U.S. federal and state laws and regulations governing requirements for maintaining policies and procedures to protect non-public confidential information of their customers. These laws require West Bank to periodically disclose their privacy policies and practices relating to sharing such information and permit consumers to opt out of their ability to share information with unaffiliated third parties under certain circumstances. They also impact West Bank’s ability to share certain information with affiliates and non-affiliates for marketing and/or non-marketing purposes, or to contact customers with marketing offers. In addition, West Bank is required to implement a comprehensive information security program that includes administrative, technical, and physical safeguards to ensure the security and confidentiality of customer records and information. These security and privacy policies and procedures, for the protection of personal and confidential information, are in effect across all businesses and geographic locations.
15
Concentrations in Commercial Real Estate.
Concentration risk exists when FDIC-insured institutions deploy too many assets to any one industry or segment. A concentration in commercial real estate is one example of regulatory concern. The interagency Concentrations in Commercial Real Estate Lending, Sound Risk Management Practices guidance (CRE Guidance) provides supervisory criteria, including the following numerical indicators, to assist bank examiners in identifying banks with potentially significant commercial real estate loan concentrations that may warrant greater supervisory scrutiny: (i) commercial real estate loans exceeding 300 percent of capital and increasing 50 percent or more in the preceding three years; or (ii) construction and land development loans exceeding 100 percent of capital. The CRE Guidance does not limit banks’ levels of commercial real estate lending activities, but rather guides institutions in developing risk management practices and levels of capital that are commensurate with the level and nature of their commercial real estate concentrations. On December 18, 2015, the federal banking agencies issued a statement to reinforce prudent risk-management practices related to CRE lending, having observed substantial growth in many markets, increased competitive pressures, rising CRE concentrations in banks, and an easing of CRE underwriting standards. The federal bank agencies reminded FDIC-insured institutions to maintain underwriting discipline and exercise prudent risk-management practices to identify, measure, monitor and manage the risks arising from CRE lending. In addition, FDIC-insured institutions must maintain capital commensurate with the level and nature of their CRE concentration risk.
West Bank has historically exceeded, and continues to exceed, the 300 percent guideline for commercial real estate loans. Additional monitoring processes have been implemented to manage this increased risk.
Consumer Financial Services.
The historical structure of federal consumer protection regulations applicable to all providers of consumer financial products and services changed significantly on July 21, 2011, when the CFPB commenced operations to supervise and enforce consumer protection laws. The CFPB has broad rulemaking authority for a wide range of consumer protection laws that apply to all providers of consumer products and services, including West Bank, as well as the authority to prohibit “unfair, deceptive or abusive” acts and practices. The CFPB has examination and enforcement authority over providers with more than $10 billion in assets. FDIC-insured institutions with $10 billion or less in assets, like West Bank, continue to be examined by their applicable bank regulators.
Because abuses in connection with residential mortgages were a significant factor contributing to the financial crisis, many new rules issued by the CFPB and required by the Dodd-Frank Act addressed mortgage and mortgage-related products, their underwriting, origination, servicing and sales. The Dodd-Frank Act significantly expanded underwriting requirements applicable to loans secured by 1-4 family residential real property and augmented federal law combating predatory lending practices. In addition to numerous disclosure requirements, the Dodd Frank Act imposed new standards for mortgage loan originations on all lenders in an effort to strongly encourage lenders to verify a borrower’s ability to repay, while also establishing a presumption of compliance for certain “qualified mortgages”. The Regulatory Relief Act provided relief in connection with mortgages for banks with assets of less than $10 billion, and, as a result, mortgages West Bank makes are now considered to be qualified mortgages if they are held in portfolio for the life of the loan.
We do not currently expect the CFPB’s rules to have a significant impact on our operations, except for higher compliance costs.
ADDITIONAL INFORMATION
The principal executive offices of the Company are located at 1601 22
nd
Street, West Des Moines, Iowa 50266. The Company’s telephone number is (515) 222-2300, and the internet address is www.westbankstrong.com. Copies of the Company’s annual reports on Form 10-K, quarterly reports on Form 10-Q, current reports on Form 8-K, and any amendments thereto are available for viewing or downloading free of charge from the Investor Relations section of the Company’s website as soon as reasonably practicable after the documents are filed with or furnished to the SEC. Copies of the Company’s filings with the SEC are also available from the SEC’s website (www.sec.gov) free of charge.
ITEM 1A. RISK FACTORS
West Bancorporation’s business is conducted almost exclusively through West Bank. West Bancorporation and West Bank are subject to many of the common risks that challenge publicly traded, regulated financial institutions. An investment in West Bancorporation’s common stock is also subject to the following specific risks. In addition to the risks and uncertainties described below, other risks and uncertainties not currently known to us or that we currently deem to be immaterial also may materially and adversely affect our business, financial condition and results of operations.
16
Risks Related to West Bancorporation’s Business
We must effectively manage the credit risks of our loan portfolio.
The largest component of West Bank’s income is interest received on loans. Our business depends on the creditworthiness of our customers. There are risks inherent in making loans, including risks of nonpayment, risks resulting from uncertainties of the future value of collateral and risks resulting from changes in economic and industry conditions. We attempt to reduce our credit risk through prudent loan application, underwriting and approval procedures, including internal loan reviews before and after proceeds have been disbursed, careful monitoring of the concentration of our loans within specific industries, and collateral and guarantee requirements. These procedures cannot, however, be expected to completely eliminate our credit risks, and we can make no guarantees concerning the strength of our loan portfolio.
Our loan portfolio includes commercial loans, which involve risks specific to commercial borrowers.
West Bank’s loan portfolio includes a significant amount of commercial real estate loans, construction and land development loans, commercial lines of credit and commercial term loans. West Bank’s typical commercial borrower is a small- or medium-sized, privately owned Iowa or Minnesota business entity. Commercial loans often have large balances, and repayment usually depends on the borrowers’ successful business operations. Commercial loans also are generally not fully repaid over the loan period and thus may require refinancing or a large payoff at maturity. If the general economy turns downward, commercial borrowers may not be able to repay their loans, and the value of their assets, which are usually pledged as collateral, may decrease rapidly and significantly. Also, when credit markets tighten due to adverse developments in specific markets or the general economy, opportunities for refinancing may become more expensive or unavailable, resulting in loan defaults.
Our loan portfolio includes commercial real estate loans, which involve risks specific to real estate values.
Commercial real estate loans were a significant portion of our total loan portfolio as of December 31, 2018. The market value of real estate can fluctuate significantly in a short period of time as a result of market conditions in the geographic area in which the real estate is located. Adverse developments affecting real estate values in one or more of our markets could increase the credit risk associated with our loan portfolio. Additionally, commercial real estate lending typically involves higher loan principal amounts, and repayment of the loans is generally dependent, in large part, on sufficient income from the properties securing the loans to cover operating expenses and debt service. Economic events or governmental regulations outside of the control of the borrower or lender could negatively impact the future cash flows and market values of the affected properties.
If the loans that are collateralized by real estate become troubled and the value of the real estate has been significantly impaired, then we may not be able to recover the full contractual amount of principal and interest that we anticipated at the time of originating the loans, which could cause us to charge off all or a portion of the loans. This could lead to an increased provision for loan losses and adversely affect our operating results and financial condition.
The level of our commercial real estate loan portfolio may subject us to additional regulatory scrutiny.
The federal banking regulators have promulgated joint guidance on sound risk management practices for financial institutions with concentrations in commercial real estate lending. Under this guidance, a financial institution that, like West Bank, is actively involved in commercial real estate lending should perform a risk assessment to identify concentrations. A financial institution may have a concentration in commercial real estate lending if, among other factors (i) total reported loans for construction, land development, and other land represent 100 percent or more of total capital, or (ii) total reported loans secured by multifamily and non-farm non-residential properties, loans for construction, land development and other land, and loans otherwise sensitive to the general commercial real estate market, including loans to commercial real estate related entities, represent 300 percent or more of total capital. Based on these criteria, West Bank had concentrations of 100 percent and 453 percent, respectively, as of December 31, 2018. The purpose of the guidance is to assist banks in developing risk management practices and capital levels commensurate with the level and nature of commercial real estate concentrations. The guidance states that management should employ heightened risk management practices, including board and management oversight, strategic planning, development of underwriting standards, and risk assessment and monitoring through market analysis and stress testing. West Bank believes that its current risk management processes adequately address the regulatory guidance; however, there can be no guarantee of the effectiveness of the risk management processes on an ongoing basis.
17
We are subject to environmental liability risk associated with real estate collateral securing our loans.
A significant portion of our loan portfolio is secured by real property. Under certain circumstances, we may take title to the real property collateral through foreclosure or other means. As the titleholder of the property, we may be responsible for environmental risks, such as hazardous materials, which attach to the property. For these reasons, prior to extending credit, we have an environmental risk assessment program to identify any known environmental risks associated with the real property that will secure our loans. In addition, we routinely inspect properties following the taking of title. When environmental risks are found, environmental laws and regulations may prescribe our approach to remediation. As a result, while we have ownership of a property, we may incur substantial expense and bear potential liability for any damages caused. The environmental risks may also materially reduce the property’s value or limit our ability to use or sell the property. We also cannot guarantee that our environmental risk assessment will detect all environmental issues relating to a property, which could subject us to additional liability.
Our allowance for loan losses may be insufficient to absorb potential losses in our loan portfolio.
We maintain an allowance for loan losses at a level we believe adequate to absorb probable losses inherent in our existing loan portfolio. The level of the allowance reflects management’s continuing evaluation of industry concentrations; specific credit risks; credit loss experience; current loan portfolio quality; present economic, political and regulatory conditions; and unidentified losses inherent in the current loan portfolio.
Determination of the allowance is inherently subjective as it requires significant estimates and management’s judgment of credit risks and future trends, all of which may undergo material changes. Deterioration in economic conditions affecting borrowers, new information regarding existing loans, identification of additional problem loans and other factors, both within and outside of our control, may require an increase in the allowance for loan losses. In addition, bank regulatory agencies periodically review our allowance and may require an increase in the provision for loan losses or the recognition of additional loan charge-offs, based on judgments different from those of management. Also, if charge-offs in future periods exceed the allowance for loan losses, we will need additional provisions to increase the allowance. Any increases in provisions will result in a decrease in net income and capital and may have a material adverse effect on our financial condition and results of operations.
A new accounting standard could require us to increase our allowance for loan losses and may have a material adverse effect on our financial condition and results of operations.
The FASB issued a new accounting standard that will be effective for the Company for the fiscal year beginning January 1, 2020. This standard, referred to as Current Expected Credit Loss (CECL), will require financial institutions to determine periodic estimates of lifetime expected credit losses on loans and recognize the expected credit losses as allowances for loan losses. This will change the current method of providing for loan losses that are probable, and may require us to increase our allowance for loan losses and to greatly increase the types of data we will need to collect and analyze to determine the appropriate level of the allowance for loan losses. Any increase in our allowance for loan losses or expenses incurred to determine the appropriate level of the allowance for loan losses will result in a decrease in net income and capital and may have a material adverse impact on our financial condition and results of operations. Moreover, the CECL model may create more volatility in our level of allowance for loan losses and could result in the need for additional capital.
Our accounting policies and methods are the basis for how we report our financial condition and results of operations, and they may require management to make estimates about matters that are inherently uncertain.
Our accounting policies and methods are fundamental to how we record and report our financial condition and results of operations. Our management must exercise judgment in selecting and applying many of these accounting policies and methods in order to ensure they comply with U.S. generally accepted accounting principles (GAAP) and reflect management’s judgment as to the most appropriate manner in which to record and report our financial condition and results of operations. In some cases, management must select the accounting policy or method to apply from two or more alternatives, any of which might be reasonable under the circumstances. The application of that chosen accounting policy or method might result in us reporting different amounts than would have been reported under a different alternative. If management’s estimates or assumptions are incorrect, the Company may experience a material loss.
From time to time, the FASB and the SEC change the financial accounting and reporting standards or the interpretation of those standards that govern the preparation of our financial statements. These changes are beyond our control, can be difficult to predict and could have a material adverse impact on our financial condition and results of operations.
18
If a significant portion of any unrealized losses in our portfolio of investment securities were to become other than temporarily impaired with credit losses, we would recognize a material charge to our earnings, and our capital ratios would be adversely impacted.
Factors beyond our control can significantly influence the fair value of investment securities in our portfolio and can cause potential adverse changes to the fair value of those securities. These factors include, but are not limited to, changes in interest rates, rating agency downgrades of the securities, defaults by the issuer or individual mortgagors with respect to the underlying securities, and instability in the credit markets. Any of the foregoing factors could cause an other than temporary impairment (OTTI) in future periods and result in realized losses.
We analyze our investment securities quarterly to determine whether, in the opinion of management, any of the securities have OTTI. To the extent that any portion of the unrealized losses in our portfolio of investment securities is determined to have OTTI and is credit-loss related, we will recognize a charge to our earnings in the quarter during which such determination is made, and our capital ratios will be adversely impacted. Generally, a fixed income security is determined to have OTTI when it appears unlikely that we will receive all the principal and interest due in accordance with the original terms of the investment. In addition to credit losses, losses are recognized for a security with an unrealized loss if the Company has the intent to sell the security or if it is more likely than not that the Company will be required to sell the security before collection of the principal amount.
We are subject to liquidity risks.
West Bank maintains liquidity primarily through customer deposits and other short-term funding sources, including advances from the Federal Home Loan Bank (FHLB) and purchased federal funds. If economic influences change so that we do not have access to short-term credit, or our depositors withdraw a substantial amount of their funds for other uses, West Bank might experience liquidity issues. Our efforts to monitor and manage liquidity risk may not be successful or sufficient to deal with dramatic or unanticipated reductions in our liquidity. If this were to occur and additional debt is needed for liquidity purposes in the future, there can be no assurance that such debt would be available or, if available, would be on favorable terms. In such events, our cost of funds may increase, thereby reducing our net interest income, or we may need to sell a portion of our investment portfolio, which, depending upon market conditions, could result in the Company or West Bank realizing losses. Although we believe West Bank’s current sources of funds are adequate for its liquidity needs, there can be no assurance in this regard for the future.
The competition for banking and financial services in our market areas is high, which could adversely affect our financial condition and results of operations.
We operate in highly competitive markets and face strong competition in originating loans, seeking deposits and offering our other services. We compete in making loans, attracting deposits, and recruiting and retaining talented employees. The Des Moines metropolitan market area, in particular, has attracted many new financial institutions within the last two decades. We also compete with nonbank financial service providers, many of which are not subject to the same regulatory restrictions that we are and may be able to compete more effectively as a result.
Customer loyalty can be influenced by a competitor’s new products, especially if those offerings are priced lower than our products. Some of our competitors may also be better able to attract customers because they provide products and services over a larger geographic area than we serve. This competitive climate can make it more difficult to establish and maintain relationships with new and existing customers, can lower the rate that we are able to charge on loans, and can affect our charges for other services. Our growth and profitability depend on our continued ability to compete effectively within our market, and our inability to do so could have a material adverse effect on our financial condition and results of operations.
Technology and other changes are allowing customers to complete financial transactions using nonbanks that historically have involved banks at one or both ends of the transaction. For example, customers can now pay bills and transfer funds directly without going through a bank. The process of eliminating banks as intermediaries, known as disintermediation, could result in the loss of fee income as well as the loss of customer deposits.
Loss of customer deposits due to increased competition could increase our funding costs.
We rely on bank deposits to be a low cost and stable source of funding. We compete with banks and other financial services companies for deposits. If our competitors raise the rates they pay on deposits, our funding costs may increase, either because we raise our rates to avoid losing deposits or because we lose deposits and must rely on more expensive sources of funding. Higher funding costs could reduce our net interest margin and net interest income and could have a material adverse effect on our financial condition and results of operations.
19
The occurrence of fraudulent activity, breaches or failures of our information security controls or cybersecurity-related incidents could have a material adverse effect on our business, financial condition, results of operations and growth prospects.
As a bank, we are susceptible to fraudulent activity, information security breaches and cybersecurity-related incidents that may be committed against us or our clients, which may result in financial losses or increased costs to us or our customers, disclosure or misuse of our information or our client information, misappropriation of assets, privacy breaches against our customers, litigation or damage to our reputation. Such fraudulent activity may take many forms, including check fraud, electronic fraud, wire fraud, phishing, social engineering and other dishonest acts. Information security breaches and cybersecurity-related incidents may include fraudulent or unauthorized access to systems used by us, our customers or third-party vendors, denial or degradation of service attacks, and malware or other cyber-attacks.
There continues to be a rise in electronic fraudulent activity, security breaches and cyber-attacks within the financial services industry, especially in the commercial banking sector due to cyber criminals targeting commercial bank accounts. Moreover, in recent periods, several large corporations, including financial institutions and retail companies, have suffered major data breaches, in some cases exposing not only confidential and proprietary corporate information, but also sensitive financial and other personal information of their customers and employees and subjecting them to potential fraudulent activity. Some of our customers may have been affected by these breaches, which could increase their risks of identity theft and other fraudulent activity that could involve their accounts with us.
Information pertaining to us and our customers is maintained, and transactions are executed, on networks and systems maintained by us and certain third-party partners, such as our online banking, mobile banking and core deposit and loan recordkeeping systems. The secure maintenance and transmission of confidential information, as well as execution of transactions over these systems, are essential to protect us and our customers against fraud and security breaches and to maintain the confidence of our customers. Breaches of information security also may occur through intentional or unintentional acts by those having access to our systems or the confidential information of our customers, including employees. In addition, increases in criminal activity levels and sophistication, advances in computer capabilities, new discoveries, vulnerabilities in third-party technologies (including browsers and operating systems) or other developments could result in a compromise or breach of the technology, processes and controls that we use to prevent fraudulent transactions and to protect data about us, our customers and underlying transactions, as well as the technology used by our customers to access our systems. Our third-party partners’ inability to anticipate, or failure to adequately mitigate, breaches of security could result in a number of negative events, including losses to us or our customers, loss of business or customers, damage to our reputation, the incurrence of additional expenses, disruption to our business, additional regulatory scrutiny or penalties, or our exposure to civil litigation and possible financial liability, any of which could have a material adverse effect on our business, financial condition, results of operations and growth prospects.
Furthermore, there has been heightened legislative and regulatory focus on privacy, data protection and information security. New or revised laws and regulations may significantly impact our current and planned privacy, data protection and information security-related practices, the collection, use, retention and safeguarding of customer and employee information, and current or planned business activities. Compliance with current or future privacy, data protection and information security laws could result in higher compliance and technology costs and could restrict our ability to provide certain products and services, which could adversely affect our business, financial condition or results of operations.
We depend on information technology and telecommunications systems of third parties, and any systems failures, interruptions or data breaches involving these systems could adversely affect our operations and financial condition.
Our business is highly dependent on the successful and uninterrupted functioning of our information technology and telecommunications systems, third-party servicers, accounting systems, mobile and online banking platforms and financial intermediaries. We outsource to third parties many of our major systems, such as data processing and mobile and online banking. The failure of these systems, or the termination of a third-party software license or service agreement on which any of these systems is based, could interrupt our operations. Because our information technology and telecommunications systems interface with and depend on third-party systems, we could experience service denials if demand for such services exceeds capacity or such third-party systems fail or experience interruptions. A system failure or service denial could result in a deterioration of our ability to process loans or gather deposits and provide customer service, compromise our ability to operate effectively, result in potential noncompliance with applicable laws or regulations, damage our reputation, result in a loss of customer business or subject us to additional regulatory scrutiny and possible financial liability, any of which could have a material adverse effect on business, financial condition, results of operations and growth prospects. In addition, failures of third parties to comply with applicable laws and regulations, or fraud or misconduct on the part of employees of any of these third parties, could disrupt our operations or adversely affect our reputation.
20
It may be difficult for us to replace some of our third-party vendors, particularly vendors providing our core banking and information services, in a timely manner if they are unwilling or unable to provide us with these services in the future for any reason, and even if we are able to replace them, it might be at higher cost or result in the loss of customers. Any such events could have a material adverse effect on our business, financial condition, results of operations and growth prospects.
Our operations rely heavily on the secure processing, storage and transmission of information and the monitoring of a large number of transactions on a minute-by-minute basis, and even a short interruption in service could have significant consequences. We also interact with and rely on retailers, for whom we process transactions, as well as financial counterparties and regulators. Each of these third parties may be targets of the same types of fraudulent activity, computer break-ins and other cybersecurity breaches described above, and the cybersecurity measures that they maintain to mitigate the risk of such activity may be different than our own and may be inadequate.
As a result of financial entities and technology systems becoming more interdependent and complex, a cyber incident, information breach or loss, or technology failure that compromises the systems or data of one or more financial entities could have a material impact on counterparties or other market participants, including ourselves. As a result of the foregoing, our ability to conduct business may be adversely affected by any significant disruptions to us or to third parties with whom we interact.
Failure to maintain effective internal controls over financial reporting could impair our ability to accurately and timely report our financial results and could increase the risk of fraud.
Effective internal controls over financial reporting are necessary to provide reliable financial reports and prevent fraud. Management believes that our internal controls over financial reporting are currently effective. While management will continue to assess our controls and procedures and take immediate action to remediate any future perceived issues, there can be no guarantee of the effectiveness of these controls and procedures on an ongoing basis. Any failure to maintain an effective internal control environment could impact our ability to report our financial results on an accurate and timely basis, which could result in regulatory actions, loss of investor confidence, and an adverse impact on our business operations and stock price.
Damage to our reputation could adversely affect our business.
Our business depends upon earning and maintaining the trust and confidence of our customers, stockholders and employees. Damage to our reputation could cause significant harm to our business. Harm to our reputation can arise from numerous sources, including employee misconduct, vendor nonperformance, cybersecurity breaches, compliance failures, litigation or governmental investigations, among other things. In addition, a failure to deliver appropriate standards of service, or a failure or perceived failure to treat customers and clients fairly, can result in customer dissatisfaction, litigation, and heightened regulatory scrutiny, all of which can lead to lost revenue, higher operating costs and harm to our reputation. Adverse publicity about West Bank, whether or not true, may also result in harm to our business. Should any events or circumstances that could undermine our reputation occur, there can be no assurance that any lost revenue from customers opting to move their business to another institution and the additional costs and expenses that we may incur in addressing such issues would not adversely affect our financial condition and results of operations.
We are subject to various legal claims and litigation.
We are periodically involved in routine litigation incidental to our business. Regardless of whether these claims and legal actions are founded or unfounded, if such legal actions are not resolved in a manner favorable to us, they may result in significant financial liability and/or adversely affect the Company’s reputation. In addition, litigation can be costly. Any financial liability, litigation costs or reputational damage caused by these legal claims could have a material adverse impact on our business, financial condition and results of operations.
The soundness of other financial institutions could adversely affect us.
Financial services institutions are interrelated as a result of trading, clearing, counterparty or other relationships. We have exposure to many different industries and counterparties, and we routinely execute transactions with counterparties in the financial services industry, including brokers and dealers, commercial banks, investment banks and other institutional clients. Many of these transactions expose us to credit risk in the event of default by our counterparty or client. In addition, our credit risk may be exacerbated when the collateral held by us cannot be realized or is liquidated at prices not sufficient to recover the full amount of the loan or derivative exposure due us. There is no assurance that any such losses would not materially and adversely affect our results of operations or earnings.
21
We may experience difficulties in managing our growth.
In the future, we may decide to expand into additional communities or attempt to strengthen our position in our current markets through opportunistic acquisitions of all or part of other financial institutions or related businesses or through the hiring of teams of bankers from other financial institutions that we believe provide a strategic fit with our business, or by opening new branches or loan production offices. To the extent that we undertake acquisitions or new office openings, we are likely to experience the effects of higher operating expense relative to operating income from the new operations, which may have an adverse effect on our overall levels of reported net income, return on average equity and return on average assets. To the extent we hire teams of bankers from other financial institutions, our salaries and employee benefits expense will likely increase, which may have an adverse effect on our net income, without any guarantee that the new lending team will be successful in generating new business. Other effects of engaging in such growth strategies may include potential diversion of our management’s time and attention and general disruption to our business.
To the extent that we grow through acquisitions or office openings, we cannot provide assurance that we will be able to adequately or profitably manage such growth. Acquiring other banks and businesses will involve risks similar to those commonly associated with new office openings, but may also involve additional risks. These additional risks include potential exposure to unknown or contingent liabilities of banks and businesses we acquire, exposure to potential asset quality issues of the acquired bank or related business, difficulty and expense of integrating the operations and personnel of banks and businesses we acquire, and the possible loss of key employees and customers of the banks and businesses we acquire.
Maintaining or increasing our market share may depend on lowering prices and the adoption of new products and services.
Our success depends, in part, on our ability to adapt our products and services to evolving industry standards. There may be increased pressure to provide products and services at lower prices. Lower prices can reduce our net interest margin and revenues from our fee-based products and services. In addition, the widespread adoption of new technologies could require us to make substantial expenditures to modify or adapt our existing products and services. Also, these and other capital investments in our business may not produce expected growth in earnings anticipated at the time of the expenditure. We may not be successful in introducing new products and services, achieving market acceptance of our products and services, or developing and maintaining loyal customers.
The loss of the services of any of our senior executive officers or key personnel could cause our business to suffer.
Much of our success is due to our ability to attract and retain senior management and key personnel experienced in banking and financial services who are very involved in the communities we currently serve. Our continued success depends to a significant extent upon the continued services of relatively few individuals. In addition, our success depends in significant part upon our senior management’s ability to develop and implement our business strategies. The loss of services of a few of our senior executive officers or key personnel, or the inability to recruit and retain qualified personnel in the future, could have an adverse effect on our business, financial condition or results of operations, at least in the short term.
Risks Related to the Banking Industry in General and Community Banking in Particular
We may be materially and adversely affected by the highly regulated environment in which we operate.
We are subject to extensive federal and state regulation, supervision and examination. A more detailed description of the primary federal and state banking laws and regulations that affect us is contained in Item 1 of this Form 10-K in the section captioned “Supervision and Regulation.” Banking regulations are primarily intended to protect depositors’ funds, FDIC funds, customers and the banking system as a whole, rather than our stockholders. These regulations affect our lending practices, capital structure, investment practices, dividend policy and growth, among other things.
As a financial holding company, we are subject to extensive regulation and supervision and undergo periodic examinations by our regulators, who have extensive discretion and authority to prevent or remedy unsafe or unsound practices or violations of law by banks and financial holding companies. Failure to comply with applicable laws, regulations or policies could result in sanctions by regulatory agencies, civil monetary penalties and/or damage to our reputation, which could have a material adverse effect on us. Although we have policies and procedures designed to mitigate the risk of any such violations, there can be no assurance that such violations will not occur.
22
Current or proposed regulatory or legislative changes to laws applicable to the financial industry may impact the profitability of our business activities and may change certain of our business practices, including our ability to offer new products, obtain financing, attract deposits, make loans and achieve satisfactory interest spreads, and could expose us to additional costs, including increased compliance costs. These changes also may require us to invest significant management attention and resources to make any necessary changes to operations in order to comply and could therefore also materially and adversely affect our business, financial condition and results of operations.
Our business is subject to domestic and, to a lesser extent, international economic conditions and other factors, many of which are beyond our control and could materially and adversely affect us.
Our financial performance generally, and in particular the ability of customers to pay interest on and repay principal on outstanding loans and the value of collateral securing those loans, as well as demand for loans and other products and services we offer, is highly dependent upon the business environment, not only in the markets where we operate, but also in the states of Iowa and Minnesota, generally, in the United States as a whole, and internationally. A favorable business environment is generally characterized by, among other factors, economic growth, efficient capital markets, low inflation, low unemployment, high business and investor confidence, and strong business earnings. Unfavorable or uncertain economic and market conditions can be caused by declines in economic growth, business activity, or investor or business confidence; limitations on the availability or increases in the cost of credit and capital; increases in inflation or interest rates; high unemployment; natural disasters; or a combination of these or other factors.
While economic conditions in our markets, the states of Iowa and Minnesota and the United States have generally improved since the recession, there can be no assurance that this improvement will continue or occur at a meaningful rate. A return of recessionary conditions and/or negative developments in the domestic and international credit markets may significantly affect the markets in which we do business, the value of our loans and investments, and our ongoing operations, costs and profitability. Such conditions could materially and adversely affect us.
Monetary policies and regulations of the Federal Reserve could adversely affect our business, financial condition and results of operations.
In addition to being affected by general economic conditions, our earnings and growth are affected by the policies of the Federal Reserve. An important function of the Federal Reserve is to regulate the money supply and credit conditions. Among the options available to the Federal Reserve to implement these objectives are open market operations in U.S. government securities, adjustments of the discount rate, and changes in reserve requirements against bank deposits. These monetary policy options are used in varying combinations to influence overall economic growth and the distribution of credit, bank loans, investments and deposits. Their use also affects interest rates charged on loans or paid on deposits.
The monetary policies and regulations of the Federal Reserve have had a significant effect on the operating results of commercial banks in the past and are expected to continue to do so in the future. The specific effects of such policies upon our business, financial condition and results of operations cannot be predicted.
Changes in interest rates could negatively impact our financial condition and results of operations.
Earnings in the banking industry, particularly the community bank segment, are substantially dependent on net interest income, which is the difference between interest earned on interest-earning assets (investments and loans) and interest paid on interest-bearing liabilities (deposits and borrowings). Interest rates are sensitive to many factors, including government monetary and fiscal policies and domestic and international economic and political conditions. The Federal Reserve has raised the target federal funds rate by 200 basis points since November 2016. If interest rates continue to increase, banks will experience competitive pressures to increase rates paid on deposits. Depending on competitive pressures, such deposit rate increases may occur faster than increases in rates received on loans, which may reduce net interest income during the transition periods. Changes in interest rates could also influence our ability to originate loans and obtain deposits, the fair value of our financial assets and liabilities, and the average duration of our securities portfolio. Community banks, such as West Bank, rely more heavily than larger institutions on net interest income as a revenue source. Larger institutions generally have more diversified sources of noninterest income. See Item 7A of this Form 10-K for a discussion of the Company’s interest rate risk management.
23
In July 2017, the head of the United Kingdom Financial Conduct Authority announced that it intends to phase out the use of LIBOR by the end of 2021. The Company currently has variable-rate loans, securities and long-term borrowings, and interest rate swap agreements that are tied to LIBOR. The U.S. Federal Reserve, in conjunction with the Alternative Reference Rates Committee, a steering committee comprised of large U.S. financial institutions, is considering replacing U.S.-dollar LIBOR with the Secured Overnight Financing Rate, or SOFR, a new index calculated by short-term repurchase agreements, backed by Treasury securities. Although there have been a few issuances utilizing SOFR or the Sterling Over Night Index Average, an alternative reference rate that is based on transactions, it is unknown whether these alternative reference rates will attain market acceptance as replacements for LIBOR. There is currently no definitive information regarding the future utilization of LIBOR or of any particular replacement rate. As such, the potential effect of any such event on our business, financial condition and results of operations cannot yet be determined.
We may be adversely affected by changes in U.S. tax laws and regulations.
The Tax Cuts and Jobs Act was signed into law in December 2017, reforming the U.S. tax code. The legislation included lowering the federal corporate income tax rate to 21 percent beginning in 2018 from a maximum rate of 35 percent, modifying the U.S. taxation of income earned outside the U.S. and limiting or eliminating various deductions, tax credits and/or other tax preferences. The legislation could negatively impact our customers because it lowers the existing caps on mortgage interest deductions and limits the state and local tax deductions. These changes could make it more difficult for borrowers to make their loan payments and could also negatively impact the housing market, which could adversely affect our business and loan growth.
Technology is changing rapidly and may put us at a competitive disadvantage.
The banking industry is undergoing rapid technological changes with frequent introductions of new technology-driven products and services. Effective use of technology increases efficiency and enables banks to better serve customers. Our future success depends, in part, on our ability to effectively implement new technology. Many of our larger competitors have substantially greater resources than we do to invest in technological improvements. As a result, they may be able to offer, or more quickly offer, additional or superior products that could put West Bank at a competitive disadvantage.
Risks Related to West Bancorporation’s Common Stock
Our stock is relatively thinly traded.
Although our common stock is traded on the Nasdaq Global Select Market, the average daily trading volume of our common stock is relatively small compared to many public companies. The desired market characteristics of depth, liquidity, and orderliness require the substantial presence of willing buyers and sellers in the marketplace at any given time. In our case, this presence depends on the individual decisions of a relatively small number of investors and general economic and market conditions over which we have no control. Due to the relatively small trading volume of our common stock, significant sales of our common stock, or the expectation of these sales, could cause the stock price to fall more than would be justified by the inherent worth of the Company. Conversely, attempts to purchase a significant amount of our stock could cause the market price to rise above the reasonable inherent worth of the Company.
The stock market can be volatile, and fluctuations in our operating results and other factors could cause our stock price to decline.
The stock market has experienced, and may continue to experience, fluctuations that significantly impact the market prices of securities issued by many companies. Market fluctuations could adversely affect our stock price. These fluctuations have often been unrelated or disproportionate to the operating performance of particular companies. These broad market fluctuations, as well as general economic, systemic, political and market conditions, such as recessions, loss of investor confidence, interest rate changes, government shutdowns, international trade wars or international currency fluctuations, may negatively affect the market price of our common stock. Moreover, our operating results may fluctuate and vary from period to period due to the risk factors set forth herein. As a result, period-to-period comparisons should not be relied upon as an indication of future performance. Our stock price could fluctuate significantly in response to the impact these risk factors have on our operating results or financial position.
24
Issuing additional common or preferred stock may adversely affect the market price of our common stock, and capital may not be available when needed.
The Company may issue additional shares of common or preferred stock in order to raise capital at some date in the future to support continued growth, either internally generated or through acquisitions. Common shares have been and will be issued through the Company’s 2012 Equity Incentive Plan and the Company’s 2017 Equity Incentive Plan as grants of restricted stock units vest. As additional shares of common or preferred stock are issued, the ownership interests of our existing stockholders may be diluted. The market price of our common stock might decline or fail to increase in response to issuing additional common or preferred stock. Our ability to raise additional capital, if needed, will depend on conditions in the capital markets at that time, which are outside of our control. Accordingly, we cannot provide any assurance that we will be able to raise additional capital, if needed, on acceptable terms.
The holders of our junior subordinated debentures have rights that are senior to those of our common stockholders.
As of December 31, 2018, the Company had $20.6 million in junior subordinated debentures outstanding that were issued to the Company’s subsidiary trust, West Bancorporation Capital Trust I. The junior subordinated debentures are senior to the Company’s shares of common stock. As a result, the Company must make payments on the junior subordinated debentures (and the related trust preferred securities (TPS)) before any dividends can be paid on its common stock, and, in the event of the Company’s bankruptcy, dissolution or liquidation, the holders of the debentures must be satisfied before any distributions can be made to the holders of the common stock. The Company has the right to defer distributions on the junior subordinated debentures (and the related TPS) for up to five years during which time no dividends may be paid to holders of the Company’s common stock. The Company’s ability to pay future distributions depends upon the earnings of West Bank and the issuance of dividends from West Bank to the Company, which may be inadequate to service the obligations. Interest payments on the junior subordinated debentures underlying the TPS are classified as a “dividend” by the Federal Reserve supervisory policies and therefore are subject to applicable restrictions and approvals imposed by the Federal Reserve Board.
There can be no assurances concerning continuing dividend payments.
Our common stockholders are only entitled to receive the dividends declared by our Board of Directors. Although we have historically paid quarterly dividends on our common stock, there can be no assurances that we will be able to continue to pay regular quarterly dividends or that any dividends we do declare will be in any particular amount. The primary source of money to pay our dividends comes from dividends paid to the Company by West Bank. West Bank’s ability to pay dividends to the Company is subject to, among other things, its earnings, financial condition and applicable regulations, which in some instances limit the amount that may be paid as dividends.
We are required to maintain capital to meet regulatory requirements, and if we fail to maintain sufficient capital, whether due to an inability to raise capital, operational losses, or otherwise, our financial condition, liquidity and results of operations, as well as our ability to maintain regulatory compliance, could be adversely affected.
The Company and West Bank are required by federal and state regulatory authorities to maintain adequate levels of capital to support their operations. The ability to raise additional capital, when and if needed, will depend on conditions in the capital markets, economic conditions, and a number of other factors, including investor perceptions regarding the banking industry and market conditions, and governmental activities, many of which are outside of our control, as well as on our financial condition and performance. Accordingly, we cannot provide assurance that we will be able to raise additional capital, if needed, or on terms acceptable to us. Failure to meet these capital and other regulatory requirements could affect customer confidence, our ability to grow, the costs of funds, FDIC insurance costs, the ability to pay dividends on common stock and to make distributions on the junior subordinated debentures, the ability to make acquisitions, the ability to make certain discretionary bonus payments to executive officers, and the results of operations and financial condition.
ITEM 1B. UNRESOLVED STAFF COMMENTS
There are no unresolved comments from the SEC staff.
25
ITEM 2. PROPERTIES
The corporate office of the Company is located in the main office building of West Bank, at 1601 22
nd
Street in West Des Moines, Iowa. West Bank leases its main office, including a full-service bank location that includes drive-up facilities, one automated teller machine and one interactive teller machine. In addition to its main office, West Bank also leases bank buildings and space for six branch offices located in the Des Moines, Iowa, metropolitan area and office space for operational departments. Three branch offices are full-service locations with drive-up facilities and an automated teller machine. The other three branch offices are drive-up only, express locations and offer drive-up services and an automated teller machine. West Bank also owns three full-service banking locations in Coralville and Waukee, Iowa, and Rochester, Minnesota. We believe each of our facilities is adequate to meet our needs.
ITEM 3. LEGAL PROCEEDINGS
Neither the Company nor West Bank is party to any material pending legal proceedings, other than ordinary litigation incidental to West Bank’s business, and no property of these entities is the subject of any such proceeding. The Company does not know of any proceedings contemplated by a governmental authority against the Company or West Bank.
ITEM 4. MINE SAFETY DISCLOSURES
Not applicable.
PART II
ITEM 5. MARKET FOR REGISTRANT’S COMMON EQUITY, RELATED STOCKHOLDER MATTERS, AND ISSUER PURCHASES OF EQUITY SECURITIES
West Bancorporation common stock is traded on the Nasdaq Global Select Market under the symbol “WTBA”. There were 180
holders of record of the Company’s common stock as of
February 15, 2019
, and an estimated 3,100 additional beneficial holders whose stock was held in street name by brokerages or fiduciaries. The closing price of the Company’s common stock was $22.85 on
February 15, 2019
.
In the aggregate, cash dividends paid to common stockholders in
2018
and
2017
were
$0.78
and
$0.71
per common share, respectively. Dividend declarations are evaluated and determined by the Board of Directors on a quarterly basis, and the dividends are paid quarterly. The ability of the Company to pay dividends in the future will depend primarily upon the earnings of West Bank and its ability to pay dividends to the Company.
The ability of West Bank to pay dividends is governed by various statutes. These statutes provide that a bank may pay dividends only out of undivided profits. In addition, applicable bank regulatory authorities have the power to require any bank to suspend the payment of dividends until the bank complies with all requirements that may be imposed by such authorities.
26
The following performance graph provides information regarding the cumulative, five-year return on an indexed basis of the common stock of the Company as compared with the Nasdaq Composite Index and the SNL Midwest Bank Index prepared by S&P Global Market Intelligence. The latter index reflects the performance of bank holding companies operating principally in the Midwest as selected by S&P Global Market Intelligence. The indices assume the investment of $100 on December 31, 2013, in the common stock of the Company, the Nasdaq Composite Index and the SNL Midwest Bank Index, with all dividends reinvested. The Company’s common stock price performance shown in the following graph is not indicative of future stock price performance.
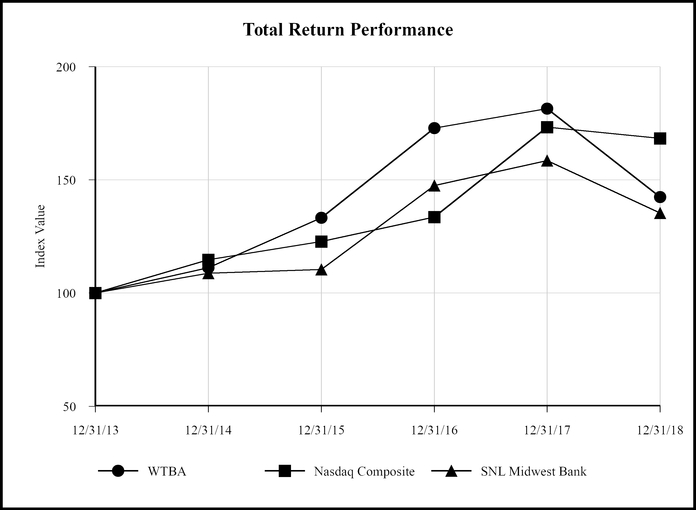
|
Period Ending
|
||||||||||||
|
Index
|
12/31/2013
|
12/31/2014
|
12/31/2015
|
12/31/2016
|
12/31/2017
|
12/31/2018
|
||||||
|
West Bancorporation, Inc.
|
100.00
|
|
111.20
|
|
133.27
|
|
172.88
|
|
181.47
|
|
142.39
|
|
|
Nasdaq Composite
|
100.00
|
|
114.75
|
|
122.74
|
|
133.62
|
|
173.22
|
|
168.30
|
|
|
SNL Midwest Bank
|
100.00
|
|
108.71
|
|
110.36
|
|
147.46
|
|
158.46
|
|
135.31
|
|
*Source: S&P Global Market Intelligence. Used with permission. All rights reserved.
27
ITEM 6. SELECTED FINANCIAL DATA
|
West Bancorporation, Inc. and Subsidiary
|
|
|
|
|
||||||||||||||||
|
Selected Financial Data
|
|
|
|
|
||||||||||||||||
|
|
As of and for the Years Ended December 31
|
|||||||||||||||||||
|
(in thousands, except per share amounts)
|
2018
|
|
2017
|
|
2016
|
|
2015
|
|
2014
|
|||||||||||
|
Operating Results
|
|
|
|
|
||||||||||||||||
|
Interest income
|
$
|
84,793
|
|
$
|
73,034
|
|
$
|
64,994
|
|
$
|
60,147
|
|
$
|
55,301
|
|
|||||
|
Interest expense
|
22,735
|
|
12,977
|
|
7,876
|
|
5,993
|
|
6,156
|
|
||||||||||
|
Net interest income
|
62,058
|
|
60,057
|
|
57,118
|
|
54,154
|
|
49,145
|
|
||||||||||
|
Provision for loan losses
|
(250
|
)
|
—
|
|
1,000
|
|
850
|
|
750
|
|
||||||||||
|
Net interest income after provision for loan losses
|
62,308
|
|
60,057
|
|
56,118
|
|
53,304
|
|
48,395
|
|
||||||||||
|
Noninterest income
|
7,752
|
|
8,648
|
|
7,982
|
|
8,203
|
|
10,296
|
|
||||||||||
|
Noninterest expense
|
34,992
|
|
32,267
|
|
31,148
|
|
30,068
|
|
32,002
|
|
||||||||||
|
Income before income taxes
|
35,068
|
|
36,438
|
|
32,952
|
|
31,439
|
|
26,689
|
|
||||||||||
|
Income taxes
|
6,560
|
|
13,368
|
|
9,936
|
|
9,697
|
|
6,649
|
|
||||||||||
|
Net income
|
$
|
28,508
|
|
$
|
23,070
|
|
$
|
23,016
|
|
$
|
21,742
|
|
$
|
20,040
|
|
|||||
|
|
|
|
|
|
||||||||||||||||
|
Dividends and Per Share Data
|
|
|
|
|
||||||||||||||||
|
Cash dividends
|
$
|
12,696
|
|
$
|
11,499
|
|
$
|
10,800
|
|
$
|
9,952
|
|
$
|
7,842
|
|
|||||
|
Cash dividends per common share
|
0.78
|
|
0.71
|
|
0.67
|
|
0.62
|
|
0.49
|
|
||||||||||
|
Basic earnings per common share
|
1.75
|
|
1.42
|
|
1.43
|
|
1.35
|
|
1.25
|
|
||||||||||
|
Diluted earnings per common share
|
1.74
|
|
1.41
|
|
1.42
|
|
1.35
|
|
1.25
|
|
||||||||||
|
Closing stock price per common share
|
19.09
|
|
25.15
|
|
24.70
|
|
19.75
|
|
17.02
|
|
||||||||||
|
Book value per common share
|
11.72
|
|
10.98
|
|
10.25
|
|
9.49
|
|
8.75
|
|
||||||||||
|
Average common shares outstanding
|
16,275
|
|
16,194
|
|
16,117
|
|
16,050
|
|
16,004
|
|
||||||||||
|
|
|
|
|
|
||||||||||||||||
|
Year-End and Average Balances
|
|
|
|
|
||||||||||||||||
|
Total assets
|
$
|
2,296,568
|
|
$
|
2,114,377
|
|
$
|
1,854,204
|
|
$
|
1,748,396
|
|
$
|
1,615,566
|
|
|||||
|
Average assets
|
2,169,399
|
|
1,954,242
|
|
1,806,250
|
|
1,675,652
|
|
1,512,506
|
|
||||||||||
|
Investment securities
|
465,795
|
|
498,920
|
|
319,794
|
|
384,420
|
|
339,208
|
|
||||||||||
|
Loans
|
1,721,830
|
|
1,510,500
|
|
1,399,870
|
|
1,246,688
|
|
1,184,045
|
|
||||||||||
|
Allowance for loan losses
|
(16,689
|
)
|
(16,430
|
)
|
(16,112
|
)
|
(14,967
|
)
|
(13,607
|
)
|
||||||||||
|
Deposits
|
1,894,529
|
|
1,810,813
|
|
1,546,605
|
|
1,440,729
|
|
1,270,462
|
|
||||||||||
|
Borrowings
|
185,343
|
|
119,711
|
|
125,410
|
|
127,175
|
|
129,916
|
|
||||||||||
|
Stockholders’ equity
|
191,023
|
|
178,098
|
|
165,376
|
|
152,377
|
|
140,175
|
|
||||||||||
|
Average stockholders’ equity
|
181,757
|
|
173,568
|
|
160,420
|
|
146,089
|
|
131,924
|
|
||||||||||
|
Performance Ratios
|
|
|
|
|
||||||||||||||||
|
Average equity to average assets ratio
|
8.38
|
%
|
8.88
|
%
|
8.88
|
%
|
8.72
|
%
|
8.72
|
%
|
||||||||||
|
Return on average assets
|
1.31
|
%
|
1.18
|
%
|
1.27
|
%
|
1.30
|
%
|
1.32
|
%
|
||||||||||
|
Return on average equity
|
15.68
|
%
|
13.29
|
%
|
14.35
|
%
|
14.88
|
%
|
15.19
|
%
|
||||||||||
|
Efficiency ratio
(1)(2)
|
48.92
|
%
|
45.39
|
%
|
46.03
|
%
|
46.30
|
%
|
49.93
|
%
|
||||||||||
|
Texas ratio
(1)
|
0.93
|
%
|
0.32
|
%
|
0.56
|
%
|
0.87
|
%
|
2.71
|
%
|
||||||||||
|
Net interest margin
(2)
|
3.02
|
%
|
3.37
|
%
|
3.49
|
%
|
3.59
|
%
|
3.59
|
%
|
||||||||||
|
Dividend payout ratio
|
44.53
|
%
|
49.84
|
%
|
46.92
|
%
|
45.77
|
%
|
39.13
|
%
|
||||||||||
|
Dividend yield
|
4.09
|
%
|
2.82
|
%
|
2.71
|
%
|
3.14
|
%
|
2.88
|
%
|
||||||||||
Definition of ratios:
|
•
|
Average equity to average assets ratio - average equity divided by average assets.
|
|
•
|
Return on average assets - net income divided by average assets.
|
|
•
|
Return on average equity - net income divided by average equity.
|
|
•
|
Efficiency ratio - noninterest expense (excluding other real estate owned expense and write-down of premises) divided by noninterest income (excluding net securities gains/losses and gains/losses on disposition of premises and equipment) plus tax-equivalent net interest income.
|
|
•
|
Texas ratio - total nonperforming assets divided by tangible common equity plus the allowance for loan losses.
|
|
•
|
Net interest margin - tax-equivalent net interest income divided by average interest-earning assets.
|
|
•
|
Dividend payout ratio - dividends paid to common stockholders divided by net income.
|
|
•
|
Dividend yield - dividends per share paid to common stockholders divided by closing year-end stock price.
|
(1) A lower ratio is better.
(2) As presented, this is a non-GAAP financial measure. See Part II, Item 7 - "Non-GAAP Financial Measures" for additional details.
28
ITEM 7. MANAGEMENT’S DISCUSSION AND ANALYSIS OF FINANCIAL CONDITION AND RESULTS OF OPERATIONS
(dollars in thousands, except per share amounts)
INTRODUCTION
The Company’s
2018
net income was
$28,508
compared to
$23,070
in
2017
. Net income for
2018
was a record for the Company. Basic and diluted earnings per common share for
2018
were
$1.75
and
$1.74
, respectively, compared to
$1.42
and
$1.41
, respectively, in
2017
. During
2018
, we paid our common stockholders
$12,696
(
$0.78
per common share) in dividends compared to
$11,499
(
$0.71
per common share) in
2017
. The dividend declared and paid in the first quarter of
2019
was $0.20 per common share, the same amount as paid in the fourth quarter of
2018
, and is the highest quarterly dividend ever paid by the Company.
Pre-tax net income for
2018
decreased $1,370 compared to
2017
, mainly due to the combination of a decrease in noninterest income and increase in noninterest expense. These were partially offset by an increase in net interest income in
2018
compared to
2017
.
Income tax expense for
2017
included a one-time adjustment to net deferred tax assets as a result of the enactment of Public Law 115-97, commonly known as the Tax Cuts and Jobs Act (Tax Act). The Tax Act lowered the federal corporate income tax rate to 21 percent in 2018 from a maximum rate of 35 percent in
2017
. This reduction in the federal corporate income tax rate required the Company to revalue the Company’s net deferred tax assets as of
December 31, 2017
, in accordance with GAAP, based upon the future lower income tax rate, and in turn caused the one-time increase in tax expense. This adjustment did not increase the amount of income taxes actually paid by the Company. The Tax Act is also the primary driver of the lower income tax expense in
2018
compared to
2017
.
Our loan portfolio grew to
$1,721,830
as of
December 31, 2018
, from
$1,510,500
at the end of
2017
. Deposits increased to
$1,894,529
as of
December 31, 2018
, from
$1,810,813
as of
December 31, 2017
. The growth in both was the result of our bankers working with existing customers to provide them with additional products and services, as well as business development efforts targeted at new customers. Our loan portfolio continues to have a high level of credit quality, as nonperforming assets remained at a historically low level. As shown in the table below, our Texas ratio remains lower than that of any financial institution in our defined peer group.
The Company has a quantitative peer analysis program in place for evaluating its results. The Company's benchmarking peer group of 15 financial institutions is selected based on their business focus, scope and location of operations, size and other considerations. The Company is in the middle of the group in terms of asset size. The group is periodically reviewed, with changes made primarily to reflect merger and acquisition activity. The group of 15 Midwestern, publicly traded, peer financial institutions against which we compared our performance for
2018
consisted of BankFinancial Corporation, First Business Financial Services, Inc., First Defiance Financial Corp., First Internet Bancorporation, First Mid-Illinois Bancshares, Inc., Hills Bancorporation, Horizon Bancorp, Isabella Bank Corporation, Mercantile Bank Corporation, MidWestOne Financial Group, Inc., MutualFirst Financial, Inc., Nicolet Bankshares, Inc., Peoples Bancorp, QCR Holdings, Inc. and Waterstone Financial, Inc. Our goal is to perform at or near the top of these peers relative to what we consider to be four key metrics: return on average assets (ROA), return on average equity (ROE), efficiency ratio and Texas ratio. We believe these measures encompass the factors that define the performance of a community bank. When contrasted with the peer group’s metrics for the nine months ended September 30, 2018 (latest data available), the Company’s metrics for the year ended
December 31, 2018
were better than those of each company in the peer group as shown in the table below, except for five peers that had a higher ROA. We expect that trend to have continued through the end of
2018
.
|
West Bancorporation, Inc.
|
Peer Group Range
|
||
|
Year ended December 31, 2018
|
Nine months ended September 30, 2018
|
||
|
Return on average assets
|
1.31%
|
0.77% - 1.80%
|
|
|
Return on average equity
|
15.68%
|
7.22% - 11.94%
|
|
|
Efficiency ratio*
(1)
|
48.92%
|
52.99% - 75.83%
|
|
|
Texas ratio*
|
0.93%
|
1.23% - 21.25%
|
|
|
* A lower ratio is better.
|
|||
|
(1)
|
As presented, this is a non-GAAP financial measure. For further information, refer to the section “Non-GAAP Financial Measures” of this Item.
|
Our earnings outlook is positive and we have strong capital resources. We anticipate the Company will be profitable in
2019
at a level that compares with that of our peers. The amount of our future profit is also dependent, in large part, on our ability to continue to grow the loan portfolio, the amount of loan losses we incur, fluctuations in market interest rates, and the strength of the local and national economy.
29
The following discussion describes the consolidated operations and financial condition of the Company, including its subsidiary West Bank and West Bank’s special purpose subsidiaries. Results of operations for the year ended
December 31, 2018
are compared to the results for the year ended
December 31, 2017
, results of operations for the year ended
December 31, 2017
are compared to the results for the year ended
December 31, 2016
, and the consolidated financial condition of the Company as of
December 31, 2018
is compared to
December 31, 2017
.
CRITICAL ACCOUNTING POLICIES
This report is based on the Company’s audited consolidated financial statements that have been prepared in accordance with GAAP established by the FASB. The preparation of the Company’s financial statements requires management to make estimates and judgments that affect the reported amounts of assets, liabilities, income and expenses. These estimates are based upon historical experience and on various other assumptions that management believes are reasonable under the circumstances, the results of which form the basis for making judgments about the carrying values of assets and liabilities that are not readily apparent from other sources. Actual results may differ from these estimates under different assumptions or conditions.
The Company’s significant accounting policies are described in the Notes to Consolidated Financial Statements. Based on its consideration of accounting policies that involve the most complex and subjective estimates and judgments, management has identified its most critical accounting policies to be those related to the fair value of financial instruments and the allowance for loan losses.
The fair value of a financial instrument is defined as the price that would be received to sell an asset or paid to transfer a liability in an orderly transaction between market participants in the market in which the reporting entity transacts business. A framework has been established for measuring the fair value of financial instruments that considers the attributes specific to particular assets or liabilities and includes a three-level hierarchy for determining fair value based on the transparency of inputs to each valuation as of the measurement date. The Company estimates the fair value of financial instruments using a variety of valuation methods. When financial instruments are actively traded and have quoted market prices, quoted market prices are used for fair value and are classified as Level 1. When financial instruments, such as investment securities and derivatives, are not actively traded, the Company determines fair value based on various sources and may apply matrix pricing with observable prices for similar instruments where a price for the identical instrument is not observable. The fair values of these financial instruments, which are classified as Level 2, are determined by pricing models that consider observable market data such as interest rate volatilities, LIBOR yield curve, credit spreads, prices from external market data providers and/or nonbinding broker-dealer quotations. When observable inputs do not exist, the Company estimates fair value based on available market data, and these values are classified as Level 3. Imprecision in estimating fair values can impact the carrying value of assets and the amount of revenue or loss recorded.
The allowance for loan losses is established through a provision for loan losses charged to expense. Loans are charged against the allowance for loan losses when management believes that collectability of the principal is unlikely. The Company has policies and procedures for evaluating the overall credit quality of its loan portfolio, including timely identification of potential problem loans. On a quarterly basis, management reviews the appropriate level for the allowance for loan losses, incorporating a variety of risk considerations, both quantitative and qualitative. Quantitative factors include the Company’s historical loss experience, delinquency and charge-off trends, collateral values, known information about individual loans and other factors. Qualitative factors include the general economic environment in the Company’s market areas and the expected trend of those economic conditions. While management uses the best information available to make its evaluation, future adjustments to the allowance may be necessary if there are significant changes in economic conditions or the other factors considered. To the extent that actual results differ from forecasts and management’s judgment, the allowance for loan losses may be greater or less than future charge-offs.
30
NON-GAAP FINANCIAL MEASURES
This report contains references to financial measures that are not defined in GAAP. Such non-GAAP financial measures include the Company’s presentation of net interest income and net interest margin on a fully taxable equivalent (FTE) basis, and the presentation of the efficiency ratio on an FTE basis, excluding certain income and expenses. Management believes these non-GAAP financial measures provide useful information to both management and investors to analyze and evaluate the Company’s financial performance. Both measures are considered standard measures of comparison within the banking industry. Limitations associated with non-GAAP financial measures include the risks that persons might disagree as to the appropriateness of items included in these measures and that different companies might calculate these measures differently. These non-GAAP disclosures should not be considered an alternative to the Company’s GAAP results. The following table reconciles the non-GAAP financial measures of net interest income, net interest margin and efficiency ratio on an FTE basis to GAAP.
|
|
As and for the Years Ended December 31
|
|||||||||||||||||||
|
2018
|
2017
|
2016
|
2015
|
2014
|
||||||||||||||||
|
Reconciliation of net interest income and net interest margin on an FTE basis to GAAP:
|
||||||||||||||||||||
|
Net interest income (GAAP)
|
$
|
62,058
|
|
$
|
60,057
|
|
$
|
57,118
|
|
$
|
54,154
|
|
$
|
49,145
|
|
|||||
|
Tax-equivalent adjustment
(1)
|
661
|
|
2,677
|
|
2,623
|
|
2,604
|
|
2,205
|
|
||||||||||
|
Net interest income on an FTE basis (non-GAAP)
|
$
|
62,719
|
|
$
|
62,734
|
|
$
|
59,741
|
|
$
|
56,758
|
|
$
|
51,350
|
|
|||||
|
Average interest-earning assets
|
$
|
2,075,372
|
|
$
|
1,863,791
|
|
$
|
1,711,612
|
|
$
|
1,583,059
|
|
$
|
1,429,593
|
|
|||||
|
Net interest margin on an FTE basis (non-GAAP)
|
3.02
|
%
|
3.37
|
%
|
3.49
|
%
|
3.59
|
%
|
3.59
|
%
|
||||||||||
|
Reconciliation of efficiency ratio on an FTE basis to GAAP:
|
||||||||||||||||||||
|
Net interest income on an FTE basis (non-GAAP)
|
$
|
62,719
|
|
$
|
62,734
|
|
$
|
59,741
|
|
$
|
56,758
|
|
$
|
51,350
|
|
|||||
|
Noninterest income
|
7,752
|
|
8,648
|
|
7,982
|
|
8,203
|
|
10,296
|
|
||||||||||
|
Adjustment for realized investment securities (gains) losses, net
|
263
|
|
(326
|
)
|
(66
|
)
|
(47
|
)
|
(223
|
)
|
||||||||||
|
Adjustment for (gains) losses on disposal of premises and
equipment, net
|
109
|
|
25
|
|
4
|
|
6
|
|
(1,069
|
)
|
||||||||||
|
Adjusted income
|
$
|
70,843
|
|
$
|
71,081
|
|
$
|
67,661
|
|
$
|
64,920
|
|
$
|
60,354
|
|
|||||
|
Noninterest expense
|
$
|
34,992
|
|
$
|
32,267
|
|
$
|
31,148
|
|
$
|
30,068
|
|
$
|
32,002
|
|
|||||
|
Less: Other real estate owned expenses
|
—
|
|
—
|
|
—
|
|
(10
|
)
|
(1,865
|
)
|
||||||||||
|
Adjustment for write-down of premises
|
(333
|
)
|
—
|
|
—
|
|
—
|
|
—
|
|
||||||||||
|
Adjusted expense
|
$
|
34,659
|
|
$
|
32,267
|
|
$
|
31,148
|
|
$
|
30,058
|
|
$
|
30,137
|
|
|||||
|
Efficiency ratio on an adjusted and FTE basis (non-GAAP)
(2)
|
48.92
|
%
|
45.39
|
%
|
46.03
|
%
|
46.30
|
%
|
49.93
|
%
|
||||||||||
(1) Computed on a tax-equivalent basis using a federal income tax rate of 21 percent in 2018 and 35 percent in 2014 through 2017, adjusted to reflect the effect of the nondeductible interest expense associated with owning tax-exempt securities and loans.
(2) The efficiency ratio expresses noninterest expense as a percent of fully taxable equivalent net interest income and noninterest income, excluding specific noninterest income and expenses. Management believes the presentation of this non-GAAP measure provides supplemental useful information for proper understanding of the financial results, as it enhances the comparability of income and expenses arising from taxable and nontaxable sources.
RESULTS OF OPERATIONS -
2018
COMPARED TO
2017
OVERVIEW
Key performance measures of our
2018
operations compared to
2017
included:
|
•
|
ROA was
1.31 percent
compared to
1.18 percent
in
2017
.
|
|
•
|
ROE was
15.68 percent
compared to
13.29 percent
in
2017
.
|
|
•
|
Efficiency ratio was
48.92 percent
compared to
45.39 percent
in
2017
.
|
|
•
|
Texas ratio was
0.93 percent
compared to
0.32 percent
in
2017
.
|
|
•
|
The loan portfolio grew 14.0 percent during
2018
.
|
|
•
|
Deposits increased by 4.6 percent during
2018
.
|
Net income for the year ended
December 31, 2018
, was
$28,508
, compared to
$23,070
for the year ended
December 31, 2017
. Basic and diluted earnings per common share for
2018
were
$1.75
and
$1.74
, respectively, and were
$1.42
and
$1.41
, respectively, for
2017
.
31
The increase in
2018
net income compared to
2017
was primarily the result of higher net interest income, a negative provision for loan losses and a decrease in income taxes, partially offset by an increase in noninterest expense and lower noninterest income. Net interest income grew $2,001, or 3.3 percent, in
2018
compared to
2017
. The increase in net interest income was primarily due to a $109,788 increase in average loans outstanding and a $103,934 increase in average investments in
2018
compared to
2017
. This was partially offset by a $236,524 increase in average interest-bearing deposits and an increase in average rates paid on deposits in
2018
compared to
2017
.
The Company recorded a negative provision for loan losses of $250 in
2018
compared to no provision in
2017
. Noninterest income declined
$896
, or
10.4 percent
, in
2018
compared to
2017
, mainly due to a nonrecurring gain from bank-owned life insurance in 2017 and net realized investment securities gains in 2017 compared to net realized investment securities losses in 2018, partially offset by credit related default guarantee fees, included in other income, recorded in 2018 and an increase in trust services. Noninterest expense grew
$2,725
in
2018
, primarily due to an increase in salaries and benefits, an increase in occupancy costs, the write-down of premises in 2018 and amortization expense related to an investment in a new markets tax credit project, included in other expenses, in the fourth quarter of 2018.
The Company has consistently used the efficiency ratio as one of its key financial metrics to measure expense control. For the year ended
December 31, 2018
, the Company’s efficiency ratio increased to
48.92 percent
from the prior year’s ratio of
45.39 percent
. This ratio is computed by dividing noninterest expense (excluding other real estate owned expense and write-down of premises) by the sum of tax-equivalent net interest income plus noninterest income (excluding net investment securities gains or losses and gains or losses on disposition of premises and equipment). The ratio for 2018 was significantly better than those of our identified peer group, which ranged from 52.99 percent to 75.83 percent for the nine months ended September 30, 2018 (most recent available data).
The Texas ratio, which is the ratio of nonperforming assets to tangible common equity plus the allowance for loan losses, increased to
0.93 percent
as of
December 31, 2018
, compared to
0.32 percent
as of
December 31, 2017
. A lower Texas ratio indicates a stronger credit quality condition. The ratio for 2018 was significantly better than those of our identified peer group, which ranged from 1.23 percent to 21.25 percent for the nine months ended September 30, 2018 (most recent available data). For more discussion on loan quality, see the “Loan Portfolio” and “Summary of the Allowance for Loan Losses” sections in this Item of this Form 10-K.
Net Interest Income
Net interest income increased to
$62,058
for
2018
from
$60,057
for
2017
, as the impact of the growth of interest-earning assets and increases in average yields exceeded the effect of an increase in the average balance and average rate paid on interest-bearing liabilities. The net interest margin for
2018
declined 35 basis points to
3.02 percent
compared to
3.37 percent
for
2017
. The average yield on earning assets increased by 6 basis points, while the rate paid on interest-bearing liabilities increased by 49 basis points. As a result, the net interest spread, which is the difference between the yields earned on assets and the rates paid on liabilities, declined to
2.68 percent
in
2018
from
3.11 percent
in
2017
. Management expects there to be continued pressure on the net interest margin in
2019
. For additional analysis of net interest income, see the section captioned “Distribution of Assets, Liabilities and Stockholders’ Equity; Interest Rates; and Interest Differential” in this Item of this Form 10-K.
Provision for Loan Losses and Loan Quality
The allowance for loan losses, which totaled
$16,689
as of
December 31, 2018
, represented
0.97 percent
of total loans and
865.6 percent
of nonperforming loans at year end, compared to
1.09 percent
and
2,641.5 percent
, respectively, as of
December 31, 2017
.
A negative provision for loan losses of
$250
was recorded in
2018
compared to no provision in
2017
. Net recoveries in
2018
included the recovery of $508 on a previously charged-off commercial loan. As a result, the net recoveries in
2018
exceeded the need for increases in the allowance for loan losses for loan growth and credit quality, therefore resulting in the negative provision. The net recoveries in 2017 were sufficient to increase the allowance for loan losses to a level deemed appropriate in relation to the
2017
loan growth and strong credit quality. Net recoveries were
0.03 percent
of average loans for
2018
compared to net recoveries of
0.02 percent
for
2017
.
Nonperforming loans at
December 31, 2018
totaled
$1,928
, or
0.11 percent
of total loans, up from
$622
, or
0.04 percent
of total loans, at
December 31, 2017
. The increase in nonperforming loans at
December 31, 2018
, compared to
December 31, 2017
, is primarily due to one borrower with commercial operating and commercial real estate loans that were put on nonaccrual status. Nonperforming loans include loans on nonaccrual status, loans past due 90 days or more and still accruing interest, and loans that have been considered to be troubled debt restructured (TDR) due to the borrowers’ financial difficulties. The Company held no other real estate properties as of
December 31, 2018
or
2017
.
32
Noninterest Income
The following table shows the variance from the prior year in the noninterest income categories shown in the Consolidated Statements of Income. In addition, accounts within the “Other income” category that represent a significant portion of the total or a significant variance are shown.
|
|
Years ended December 31
|
|||||||||||||
|
Noninterest income:
|
2018
|
2017
|
Change
|
Change %
|
||||||||||
|
Service charges on deposit accounts
|
$
|
2,541
|
|
$
|
2,632
|
|
$
|
(91
|
)
|
(3.46
|
)%
|
|||
|
Debit card usage fees
|
1,681
|
|
1,754
|
|
(73
|
)
|
(4.16
|
)%
|
||||||
|
Trust services
|
1,921
|
|
1,705
|
|
216
|
|
12.67
|
%
|
||||||
|
Increase in cash value of bank-owned life insurance
|
631
|
|
652
|
|
(21
|
)
|
(3.22
|
)%
|
||||||
|
Gain from bank-owned life insurance
|
—
|
|
307
|
|
(307
|
)
|
(100.00
|
)%
|
||||||
|
Realized investment securities gains (losses), net
|
(263
|
)
|
326
|
|
(589
|
)
|
(180.67
|
)%
|
||||||
|
Other income:
|
|
|
|
|
|
|
|
|
||||||
|
Loan fees
|
87
|
|
74
|
|
13
|
|
17.57
|
%
|
||||||
|
Letter of credit fees
|
76
|
|
73
|
|
3
|
|
4.11
|
%
|
||||||
|
Credit card fees
|
236
|
|
250
|
|
(14
|
)
|
(5.60
|
)%
|
||||||
|
Gain on sale of other assets
|
—
|
|
88
|
|
(88
|
)
|
(100.00
|
)%
|
||||||
|
Discount on purchased income tax credits
|
22
|
|
153
|
|
(131
|
)
|
(85.62
|
)%
|
||||||
|
Guarantee fees
|
254
|
|
—
|
|
254
|
|
N/A
|
|
||||||
|
All other
|
566
|
|
634
|
|
(68
|
)
|
(10.73
|
)%
|
||||||
|
Total other income
|
1,241
|
|
1,272
|
|
(31
|
)
|
(2.44
|
)%
|
||||||
|
Total noninterest income
|
$
|
7,752
|
|
$
|
8,648
|
|
$
|
(896
|
)
|
(10.36
|
)%
|
|||
The decrease in service charges on deposit accounts for
2018
compared to
2017
was driven primarily by the continued decline in nonsufficient funds fees. Nonsufficient funds fees declined $108 in
2018
compared to
2017
, consistent with the trend of the past several years. This decline was partially offset by an increase in service charges on retail deposit accounts, resulting from the realignment and simplification of the retail checking account products in March and April 2017. Revenue from trust services was higher in
2018
than in
2017
primarily due to higher amounts of one-time estate fees. Gain from bank-owned life insurance was recognized in
2017
as the result of a single policy event.
The net losses and gains on sales of investment securities during
2018
and
2017
primarily resulted from the Company’s strategy to reposition certain components of the investment portfolio into higher yielding securities without significantly increasing the risk profiles and only slightly increasing durations. Another contributing factor for these sales in
2018
was liquidity needs to support loan growth in the second half of the year.
Total revenue from discounts on purchased State of Iowa transferable income tax credits were lower in
2018
than in
2017
because the Company entered into additional agreements to purchase tax credits at a discount in the prior year that did not recur in
2018
. The Company reviews opportunities to acquire transferable State of Iowa income tax credits at favorable discounts as they are presented and as they are aligned with our projected ability to utilize them.
Nonrecurring credit related default guarantee fees were recognized in other income in
2018
. Gain on sale of other assets in 2017 included a nonrecurring gain related to a final payment received from the 2015 sale of WB Funding’s investment in SmartyPig, LLC.
33
Noninterest Expense
The following table shows the variance from the prior year in the noninterest expense categories shown in the Consolidated Statements of Income. In addition, accounts within the “Other expenses” category that represent a significant portion of the total or a significant variance are shown.
|
|
Years ended December 31
|
|||||||||||||
|
Noninterest expense:
|
2018
|
2017
|
Change
|
Change %
|
|
|||||||||
|
Salaries and employee benefits
|
$
|
18,791
|
|
$
|
17,633
|
|
$
|
1,158
|
|
6.57
|
%
|
|||
|
Occupancy
|
4,996
|
|
4,406
|
|
590
|
|
13.39
|
%
|
||||||
|
Data processing
|
2,682
|
|
2,677
|
|
5
|
|
0.19
|
%
|
||||||
|
FDIC insurance
|
685
|
|
677
|
|
8
|
|
1.18
|
%
|
||||||
|
Professional fees
|
840
|
|
1,075
|
|
(235
|
)
|
(21.86
|
)%
|
||||||
|
Director fees
|
1,014
|
|
950
|
|
64
|
|
6.74
|
%
|
||||||
|
Write-down of premises
|
333
|
|
—
|
|
333
|
|
N/A
|
|
||||||
|
Other expenses:
|
|
|
|
|
|
|
||||||||
|
Marketing
|
195
|
|
224
|
|
(29
|
)
|
(12.95
|
)%
|
||||||
|
Business development
|
824
|
|
779
|
|
45
|
|
5.78
|
%
|
||||||
|
Insurance expense
|
361
|
|
355
|
|
6
|
|
1.69
|
%
|
||||||
|
Subscriptions
|
341
|
|
297
|
|
44
|
|
14.81
|
%
|
||||||
|
Trust
|
400
|
|
432
|
|
(32
|
)
|
(7.41
|
)%
|
||||||
|
Consulting fees
|
256
|
|
297
|
|
(41
|
)
|
(13.80
|
)%
|
||||||
|
Postage and courier
|
289
|
|
303
|
|
(14
|
)
|
(4.62
|
)%
|
||||||
|
Supplies
|
241
|
|
267
|
|
(26
|
)
|
(9.74
|
)%
|
||||||
|
Low income housing projects amortization
|
541
|
|
435
|
|
106
|
|
24.37
|
%
|
||||||
|
New market tax credit project amortization
|
647
|
|
—
|
|
647
|
|
N/A
|
|
||||||
|
All other
|
1,556
|
|
1,460
|
|
96
|
|
6.58
|
%
|
||||||
|
Total other
|
5,651
|
|
4,849
|
|
802
|
|
16.54
|
%
|
||||||
|
Total noninterest expense
|
$
|
34,992
|
|
$
|
32,267
|
|
$
|
2,725
|
|
8.45
|
%
|
|||
Salaries and employee benefits increased in
2018
compared to
2017
, mainly as a result of increases in benefit costs, salaries and related payroll taxes, and additional payroll taxes related to the vesting of restricted stock units. Occupancy costs increased for
2018
compared to
2017
, primarily due to a periodic indexed rent adjustment in accordance with terms of the lease for the Company’s main office, an increase in property taxes, and an increase in service contracts. Professional fees declined for
2018
compared to
2017
, primarily due to lower legal fees at West Bank and one-time costs incurred in 2017 associated with the preparation and adoption of the West Bancorporation, Inc. 2017 Equity Incentive Plan. Director fees increased in
2018
from
2017
due to higher stock-based compensation costs and an increase in annual retainer fees effective April 2018.
The Company recognized a
$333
write-down of premises during
2018
related to the Iowa City branch facility. To meet the changing needs of customers and improve the efficiency of resources, the Company consolidated the Iowa City and Coralville branches in the fourth quarter of 2018. The Iowa City branch facility was sold in January 2019.
The increase in low income housing projects amortization in
2018
compared to
2017
was related to the Company commitment to an additional project in the second half of 2017. The Company recognized amortization expense related to an investment in a new markets tax credit project in the fourth quarter of 2018. This amortization is expected to be a recurring expense through the seven year term of the tax credit.
34
Income Taxes
The Company records a provision for income tax expense currently payable, along with a provision for those taxes payable or refundable in the future (deferred taxes). Deferred taxes arise from differences in the timing of certain items for financial statement reporting compared to income tax reporting and are measured using enacted tax rates expected to apply to taxable income in the years in which those temporary differences are expected to be recovered or settled. Federal income tax expense for
2018
and
2017
was approximately $4,735 and $11,349, respectively, while state income tax expense was approximately $1,825 and $2,019, respectively. The effective rate of income tax expense as a percent of income before income taxes was
18.7 percent
and
36.7 percent
, respectively, for
2018
and
2017
.
The effective income tax rates differ from the federal statutory income tax rates primarily due to tax-exempt interest income, the tax-exempt increase in cash value of bank-owned life insurance, tax-exempt gain on bank-owned life insurance, disallowed interest expense, stock compensation and state income taxes. The effective tax rate for both
2018
and
2017
was also impacted by federal income tax credits, including low income housing tax credits, of approximately $500 and $410, respectively. In addition, a federal new markets tax credit was generated by West Bank’s 2018 investment in a qualified community development entity. The credit, which totals $6,318, is being recognized over a seven-year period beginning in 2018.
The effective income tax rate for 2017 included a one-time increase in federal income tax expense related to the enactment of the Tax Act. The reduction in the corporate tax rate from the maximum rate of 35 percent to a flat tax rate of 21 percent required the Company to reduce net deferred tax assets as of December 31, 2017 by $2,340 and in turn caused the one-time increase in tax expense in 2017.
The Company continues to maintain a valuation allowance against the tax effect of state net operating losses carryforwards, as management believes it is likely that such carryforwards will expire without being utilized.
RESULTS OF OPERATIONS -
2017
COMPARED TO
2016
OVERVIEW
Key performance measures of our
2017
operations compared to
2016
included:
|
•
|
ROA was
1.18%
percent compared to
1.27%
percent in
2016
.
|
|
•
|
ROE was
13.29%
percent compared to
14.35%
percent in
2016
.
|
|
•
|
Efficiency ratio was
45.39%
percent compared to
46.03%
percent in
2016
.
|
|
•
|
Texas ratio was
0.32%
percent compared to
0.56%
percent in
2016
.
|
|
•
|
The loan portfolio grew 7.9 percent during
2017
.
|
|
•
|
Deposits increased by 17.1 percent during
2017
.
|
Net income for the year ended
December 31, 2017
, was
$23,070
, compared to
$23,016
for the year ended
December 31, 2016
. Basic and diluted earnings per common share for
2017
were
$1.42
and
$1.41
, respectively, and were
$1.43
and
$1.42
, respectively, for
2016
.
The improvement in
2017
net income compared to
2016
was primarily the result of an increase in interest income due to growth in average interest-earning assets, which exceeded the increase in interest expense on deposits and borrowed funds. The Company recorded no provision for loan losses in
2017
compared to $1,000 in
2016
. Noninterest income increased
$666
, or
8.3 percent
, in
2017
compared to
2016
, mainly as the result of an increase in revenue from trust services, net gains on sales of investment securities and higher service charges on deposit accounts. Partially offsetting these positive changes for
2017
was a
$1,119
, or
3.6 percent
, increase in noninterest expense. Noninterest expense grew primarily due to increases in salaries and benefits. As previously mentioned,
2017
income tax expense was impacted by a one-time increase of $2,340 due to the enactment of the Tax Act.
35
For the year ended
December 31, 2017
, the Company’s efficiency ratio improved slightly to
45.39 percent
from the prior year’s ratio of
46.03 percent
. This ratio is computed by dividing noninterest expense (excluding other real estate owned expense and write-down of premises) by the sum of tax-equivalent net interest income plus noninterest income (excluding net investment securities gains or losses and gains or losses on disposition of premises and equipment). The ratio for both years was significantly better than the respective averages of our peer group, which were approximately 67 percent and 68 percent, respectively, according to data in the December
2017
and December
2016
Bank Holding Company Performance Reports, which are prepared by the Federal Reserve Board’s Division of Banking Supervision and Regulation.
The Texas ratio, which is the ratio of nonperforming assets to tangible common equity plus the allowance for loan losses, improved to
0.32 percent
as of
December 31, 2017
, compared to
0.56 percent
as of
December 31, 2016
. A lower Texas ratio indicates a stronger credit quality condition. The ratio for both years was significantly better than peer group averages, which were approximately 8 percent and 10 percent, respectively, according to data in the December
2017
and December
2016
Bank Holding Company Performance Reports.
Net Interest Income
Net interest income increased to
$60,057
for
2017
from
$57,118
for
2016
, as the impact of the growth of interest-earning assets exceeded the effect of an increase in the average rate paid on interest-bearing liabilities. The net interest margin for
2017
declined 12 basis points to
3.37 percent
compared to
3.49 percent
for
2016
. The average yield on earning assets increased by 11 basis points, while the rate paid on interest-bearing liabilities increased by 27 basis points. As a result, the net interest spread, which is the difference between the yields earned on assets and the rates paid on liabilities, declined to
3.11 percent
in
2017
from
3.27 percent
in
2016
.
Provision for Loan Losses and Loan Quality
The allowance for loan losses, which totaled
$16,430
as of
December 31, 2017
, represented
1.09 percent
of total loans and
2,641.5 percent
of nonperforming loans at year end, compared to
1.15 percent
and
1,576.5 percent
, respectively, as of
December 31, 2016
. No provision for loan losses was recorded for
2017
compared to
$1,000
for
2016
, as recoveries on previously charged off loans exceeded charge-offs in
2017
. The net recoveries were sufficient to increase the allowance for loan losses to a level deemed appropriate in relation to the
2017
loan growth and strong credit quality. Net recoveries were
0.02 percent
of average loans for
2017
compared to net recoveries of
0.01 percent
for
2016
.
Nonperforming loans at
December 31, 2017
totaled
$622
, or
0.04 percent
of total loans, down from
$1,022
, or
0.07 percent
of total loans, at
December 31, 2016
. The Company held no other real estate properties as of
December 31, 2017
or
2016
.
36
Noninterest Income
The following table shows the variance from the prior year in the noninterest income categories shown in the Consolidated Statements of Income. In addition, accounts within the “Other income” category that represent a significant portion of the total or a significant variance are shown.
|
|
Years ended December 31
|
|||||||||||||
|
Noninterest income:
|
2017
|
2016
|
Change
|
Change %
|
||||||||||
|
Service charges on deposit accounts
|
$
|
2,632
|
|
$
|
2,461
|
|
$
|
171
|
|
6.95
|
%
|
|||
|
Debit card usage fees
|
1,754
|
|
1,825
|
|
(71
|
)
|
(3.89
|
)%
|
||||||
|
Trust services
|
1,705
|
|
1,310
|
|
395
|
|
30.15
|
%
|
||||||
|
Increase in cash value of bank-owned life insurance
|
652
|
|
647
|
|
5
|
|
0.77
|
%
|
||||||
|
Gain from bank-owned life insurance
|
307
|
|
443
|
|
(136
|
)
|
(30.70
|
)%
|
||||||
|
Realized investment securities gains, net
|
326
|
|
66
|
|
260
|
|
393.94
|
%
|
||||||
|
Other income:
|
|
|
|
|
|
|
|
|
||||||
|
Loan fees
|
74
|
|
110
|
|
(36
|
)
|
(32.73
|
)%
|
||||||
|
Letter of credit fees
|
73
|
|
96
|
|
(23
|
)
|
(23.96
|
)%
|
||||||
|
Credit card fees
|
250
|
|
261
|
|
(11
|
)
|
(4.21
|
)%
|
||||||
|
Gain on sale of other assets
|
88
|
|
—
|
|
88
|
|
N/A
|
|
||||||
|
Discount on purchased income tax credits
|
153
|
|
94
|
|
59
|
|
62.77
|
%
|
||||||
|
All other
|
634
|
|
669
|
|
(35
|
)
|
(5.23
|
)%
|
||||||
|
Total other income
|
1,272
|
|
1,230
|
|
42
|
|
3.41
|
%
|
||||||
|
Total noninterest income
|
$
|
8,648
|
|
$
|
7,982
|
|
$
|
666
|
|
8.34
|
%
|
|||
The increase in service charges on deposit accounts for
2017
compared to
2016
was driven by the March and April 2017 realignment and simplification of the retail checking account products provided to our customers. Nonsufficient funds fees declined $126 in
2017
compared to
2016
, consistent with the trend of the past several years.
Revenue from trust services was higher in
2017
than in
2016
due to the combination of a higher amount of one-time estate fees and asset growth achieved through ongoing business development efforts and strong financial markets.
Gain from bank-owned life insurance was recognized for both
2017
and
2016
.
The Company recognized net gains on sales of investment securities in
2017
, as the Company took advantage of the opportunity to sell various types of investment securities available for sale at net gains and reinvested the proceeds in higher yielding securities with similar risk profiles and slightly longer durations. The Company recognized investment securities gains of $66 during
2016
.
Loan fees declined in
2017
compared to the previous year, as
2016
included one-time fees of $39 from public company floating rate commercial loans. Letter of credit fees declined due to a lower level of standby letters of credit activity in
2017
compared to
2016
.
Gain on sale of other assets in
2017
included a nonrecurring gain related to a final payment received from the 2015 sale of WB Funding’s investment in SmartyPig, LLC.
Total revenue from discounts on purchased State of Iowa transferable income tax credits were higher in
2017
than in
2016
because the Company entered into additional agreements to purchase tax credits at a discount. The Company’s previous agreement to purchase wind energy tax credits expired in May
2017
.
All other income declined in
2017
compared to
2016
, primarily due to small losses on equipment disposals in
2017
.
37
Noninterest Expense
The following table shows the variance from the prior year in the noninterest expense categories shown in the Consolidated Statements of Income. In addition, accounts within the “Other expenses” category that represent a significant portion of the total or a significant variance are shown.
|
|
Years ended December 31
|
|||||||||||||
|
Noninterest expense:
|
2017
|
2016
|
Change
|
Change %
|
|
|||||||||
|
Salaries and employee benefits
|
$
|
17,633
|
|
$
|
16,731
|
|
$
|
902
|
|
5.39
|
%
|
|||
|
Occupancy
|
4,406
|
|
4,033
|
|
373
|
|
9.25
|
%
|
||||||
|
Data processing
|
2,677
|
|
2,510
|
|
167
|
|
6.65
|
%
|
||||||
|
FDIC insurance
|
677
|
|
937
|
|
(260
|
)
|
(27.75
|
)%
|
||||||
|
Professional fees
|
1,075
|
|
774
|
|
301
|
|
38.89
|
%
|
||||||
|
Director fees
|
950
|
|
888
|
|
62
|
|
6.98
|
%
|
||||||
|
Other expenses:
|
|
|
|
|
|
|
||||||||
|
Marketing
|
224
|
|
231
|
|
(7
|
)
|
(3.03
|
)%
|
||||||
|
Business development
|
779
|
|
701
|
|
78
|
|
11.13
|
%
|
||||||
|
Insurance expense
|
355
|
|
348
|
|
7
|
|
2.01
|
%
|
||||||
|
Investment advisory fees
|
110
|
|
442
|
|
(332
|
)
|
(75.11
|
)%
|
||||||
|
Subscriptions
|
297
|
|
177
|
|
120
|
|
67.80
|
%
|
||||||
|
Trust
|
432
|
|
415
|
|
17
|
|
4.10
|
%
|
||||||
|
Consulting fees
|
297
|
|
302
|
|
(5
|
)
|
(1.66
|
)%
|
||||||
|
Postage and courier
|
303
|
|
321
|
|
(18
|
)
|
(5.61
|
)%
|
||||||
|
Supplies
|
267
|
|
310
|
|
(43
|
)
|
(13.87
|
)%
|
||||||
|
Low income housing projects amortization
|
435
|
|
418
|
|
17
|
|
4.07
|
%
|
||||||
|
All other
|
1,350
|
|
1,610
|
|
(260
|
)
|
(16.15
|
)%
|
||||||
|
Total other
|
4,849
|
|
5,275
|
|
(426
|
)
|
(8.08
|
)%
|
||||||
|
Total noninterest expense
|
$
|
32,267
|
|
$
|
31,148
|
|
$
|
1,119
|
|
3.59
|
%
|
|||
Salaries and employee benefits increased in
2017
compared to
2016
, mainly as a result of an increase in the market price of Company common stock, which increased stock-based compensation costs.
Occupancy costs increased for
2017
compared to
2016
, partially as the result of operating costs associated with the new Rochester Minnesota, office, which opened in November 2016. Also impacting the increase in occupancy costs compared to the prior year was a first quarter 2016 one-time reversal of previously accrued rent related to the terms of the previous lease for the Waukee, Iowa, branch facility at the time the branch was acquired in February 2016.
The increase in data processing expense in
2017
compared to
2016
was primarily because of costs associated with upgrading credit analysis software, one-time costs associated with revising the retail checking account products, ongoing enhancements and monitoring tools for maintaining security, and an annual inflation-rate-based contractual increase in fees paid to our core applications system service provider.
The FDIC assessment rate calculation includes a series of risk-based factors. In May
2017
, the Company contributed capital in the amount of $40,000 into West Bank, and as a result, the capital ratio component improved enough to reduce the assessment rate to the minimum base assessment level established by the FDIC. This reduction in rate is the primary reason for the decline in FDIC insurance expense for
2017
compared to
2016
.
Professional fees increased for
2017
compared to
2016
, chiefly due to increased costs associated with preparation and adoption of the West Bancorporation, Inc. 2017 Equity Incentive Plan, filing an updated shelf registration statement with the SEC (which allows us to issue registered equity and debt instruments), services performed to analyze capital and debt structures, and higher legal fees at West Bank.
Director fees increased in
2017
from
2016
due to higher stock-based compensation costs.
38
The increase in business development expense in
2017
compared to
2016
was the result of efforts to cultivate new and expanded customer relationships.
Investment advisory fees declined in
2017
from
2016
, mainly as a result of bringing the administration of the investment portfolio in-house, effective October 1, 2016. The Company also pays an administrative fee to an investment management firm for the administration of public company floating rate commercial loans. That administration fee declined as a result of holding a lower level of those loans.
The increase in subscription costs in
2017
as contrasted to
2016
was primarily caused by subscribing to enhanced fraud monitoring, business continuity and investment research services.
All other expenses declined for
2017
compared to
2016
, primarily due to the elimination of certain costs related to a retail deposit product and lower loan-related costs. Additionally, the first quarter of 2016 included a one-time cost associated with a bank-owned life insurance claim.
Income Taxes
Federal income tax expense for
2017
and
2016
was approximately $11,349 and $8,335, respectively, while state income tax expense was approximately $2,019 and $1,601, respectively. The effective rate of income tax expense as a percent of income before income taxes was 36.7 percent and 30.2 percent, respectively, for
2017
and
2016
.
Income tax expense for
2017
included a one-time increase in federal income tax expense related to the enactment of the Tax Act. This legislation reduced the federal corporate income tax rate for 2018 and future years from the previous maximum rate of 35 percent to a flat tax rate of 21 percent. This future reduction in the corporate tax rate required the Company to reduce net deferred tax assets as of December 31, 2017 by $2,340 and in turn caused the one-time increase in tax expense in 2017. Exclusive of the one-time increase in federal income tax expense in 2017, the effective income tax rate differs from the federal statutory income tax rate primarily due to tax-exempt interest income, the tax-exempt increase in cash value of bank-owned life insurance, tax-exempt gain on bank-owned life insurance, disallowed interest expense and state income taxes.
Two other items significantly impacted the effective tax rate for
2017
compared to
2016
. The first item was the adoption of ASU No. 2016-09, Compensation—Stock Compensation (Topic 718), effective January 1, 2017, which simplified the recording of income taxes related to vesting of equity compensation. Beginning in 2017, the impact of an increase in the fair value of restricted stock over the vesting period was recorded as a reduction in income tax expense rather than as additional paid-in capital. During
2017
, a tax benefit of $285 was recorded as a result of this change in accounting method. By comparison, the tax benefit recorded in additional paid-in capital for 2016 was $105. The second item impacting the effective tax rate for both years was federal income tax credits, including low income housing tax credits, of approximately $410 and $405 for 2017 and 2016, respectively.
39
DISTRIBUTION OF ASSETS, LIABILITIES AND STOCKHOLDERS’ EQUITY; INTEREST RATES; AND INTEREST DIFFERENTIAL
Average Balances and an Analysis of Average Rates Earned and Paid
The following table shows average balances and interest income or interest expense, with the resulting average yield or rate by category of average interest-earning assets or interest-bearing liabilities for the years indicated. Interest income and the resulting net interest income are shown on a fully taxable basis. Interest expense includes the effect of interest rate swaps, if applicable.
|
2018
|
2017
|
2016
|
||||||||||||||||||||||||||||||
|
|
Average
Balance
|
Revenue/
Expense
|
Yield/
Rate |
Average
Balance
|
Revenue/
Expense
|
Yield/
Rate |
Average
Balance
|
Revenue/
Expense
|
Yield/
Rate |
|||||||||||||||||||||||
|
Assets
|
||||||||||||||||||||||||||||||||
|
Interest-earning assets:
|
||||||||||||||||||||||||||||||||
|
Loans:
(1) (2)
|
||||||||||||||||||||||||||||||||
|
Commercial
|
$
|
321,395
|
|
$
|
15,315
|
|
4.77
|
%
|
$
|
327,673
|
|
$
|
14,279
|
|
4.36
|
%
|
$
|
354,790
|
|
$
|
14,854
|
|
4.19
|
%
|
||||||||
|
Real estate
(3)
|
1,225,665
|
|
55,757
|
|
4.55
|
%
|
1,108,062
|
|
49,481
|
|
4.47
|
%
|
972,571
|
|
43,193
|
|
4.44
|
%
|
||||||||||||||
|
Consumer and other
|
6,613
|
|
282
|
|
4.26
|
%
|
8,150
|
|
330
|
|
4.05
|
%
|
8,795
|
|
348
|
|
3.95
|
%
|
||||||||||||||
|
Total loans
|
1,553,673
|
|
71,354
|
|
4.59
|
%
|
1,443,885
|
|
64,090
|
|
4.44
|
%
|
1,336,156
|
|
58,395
|
|
4.37
|
%
|
||||||||||||||
|
Investment securities:
|
|
|
|
|
|
|
|
|
|
|
|
|
||||||||||||||||||||
|
Taxable
|
322,795
|
|
8,124
|
|
2.52
|
%
|
248,698
|
|
5,501
|
|
2.21
|
%
|
236,770
|
|
4,201
|
|
1.77
|
%
|
||||||||||||||
|
Tax-exempt
(3)
|
173,449
|
|
5,489
|
|
3.16
|
%
|
143,612
|
|
5,789
|
|
4.03
|
%
|
118,622
|
|
4,913
|
|
4.14
|
%
|
||||||||||||||
|
Total investment securities
|
496,244
|
|
13,613
|
|
2.74
|
%
|
392,310
|
|
11,290
|
|
2.88
|
%
|
355,392
|
|
9,114
|
|
2.56
|
%
|
||||||||||||||
|
Federal funds sold
|
25,455
|
|
487
|
|
1.91
|
%
|
27,596
|
|
331
|
|
1.20
|
%
|
20,064
|
|
108
|
|
0.54
|
%
|
||||||||||||||
|
Total interest-earning assets
(3)
|
2,075,372
|
|
85,454
|
|
4.12
|
%
|
1,863,791
|
|
75,711
|
|
4.06
|
%
|
1,711,612
|
|
67,617
|
|
3.95
|
%
|
||||||||||||||
|
Noninterest-earning assets:
|
|
|
|
|
|
|
|
|
|
|
|
|
|
|
|
|
|
|
||||||||||||||
|
Cash and due from banks
|
33,934
|
|
|
|
|
|
34,477
|
|
|
|
|
|
44,875
|
|
|
|
|
|
||||||||||||||
|
Premises and equipment, net
|
22,271
|
|
|
|
|
|
23,088
|
|
|
|
|
|
18,843
|
|
|
|
|
|
||||||||||||||
|
Other, less allowance for
|
||||||||||||||||||||||||||||||||
|
loan losses
|
37,822
|
|
|
|
|
|
32,886
|
|
|
|
|
|
30,920
|
|
|
|
|
|
||||||||||||||
|
Total noninterest-earning assets
|
94,027
|
|
|
|
|
|
90,451
|
|
|
|
|
|
94,638
|
|
|
|
|
|
||||||||||||||
|
Total assets
|
$
|
2,169,399
|
|
|
|
|
|
$
|
1,954,242
|
|
|
|
|
|
$
|
1,806,250
|
|
|
|
|
|
|||||||||||
|
Liabilities and Stockholders’ Equity
|
|
|
|
|
|
|
|
|
|
|
|
|
|
|
|
|
||||||||||||||||
|
Interest-bearing liabilities:
|
|
|
|
|
|
|
|
|
|
|
|
|
|
|
|
|
|
|
||||||||||||||
|
Deposits:
|
|
|
|
|
|
|
|
|
|
|
|
|
|
|
|
|
|
|
||||||||||||||
|
Savings, interest-bearing
|
||||||||||||||||||||||||||||||||
|
demand and money markets
|
$
|
1,266,534
|
|
14,369
|
|
1.13
|
%
|
$
|
1,067,164
|
|
6,166
|
|
0.58
|
%
|
$
|
917,774
|
|
2,610
|
|
0.28
|
%
|
|||||||||||
|
Time
|
184,386
|
|
2,695
|
|
1.46
|
%
|
147,232
|
|
1,456
|
|
0.99
|
%
|
110,407
|
|
781
|
|
0.71
|
%
|
||||||||||||||
|
Total deposits
|
1,450,920
|
|
17,064
|
|
1.18
|
%
|
1,214,396
|
|
7,622
|
|
0.63
|
%
|
1,028,181
|
|
3,391
|
|
0.33
|
%
|
||||||||||||||
|
Other borrowed funds
|
127,836
|
|
5,671
|
|
4.44
|
%
|
146,577
|
|
5,355
|
|
3.65
|
%
|
136,535
|
|
4,485
|
|
3.28
|
%
|
||||||||||||||
|
Total interest-bearing liabilities
|
1,578,756
|
|
22,735
|
|
1.44
|
%
|
1,360,973
|
|
12,977
|
|
0.95
|
%
|
1,164,716
|
|
7,876
|
|
0.68
|
%
|
||||||||||||||
|
Noninterest-bearing liabilities:
|
|
|
|
|
|
|
|
|
|
|
|
|
|
|
|
|
||||||||||||||||
|
Demand deposits
|
401,778
|
|
|
|
412,078
|
|
|
|
|
|
473,380
|
|
|
|
|
|
||||||||||||||||
|
Other liabilities
|
7,108
|
|
|
|
7,623
|
|
|
|
|
|
7,734
|
|
|
|
|
|
||||||||||||||||
|
Stockholders’ equity
|
181,757
|
|
|
|
|
|
173,568
|
|
|
|
|
|
160,420
|
|
|
|
|
|
||||||||||||||
|
Total liabilities and
|
||||||||||||||||||||||||||||||||
|
stockholders’ equity
|
$
|
2,169,399
|
|
|
|
|
|
$
|
1,954,242
|
|
|
|
|
|
$
|
1,806,250
|
|
|
|
|
|
|||||||||||
|
Net interest income
(4)
/net interest spread
(3)
|
$
|
62,719
|
|
2.68
|
%
|
$
|
62,734
|
|
3.11
|
%
|
|
|
$
|
59,741
|
|
3.27
|
%
|
|||||||||||||||
|
Net interest margin
(3) (4)
|
|
|
|
|
3.02
|
%
|
|
|
|
|
3.37
|
%
|
|
|
|
|
3.49
|
%
|
||||||||||||||
|
(1)
|
Average loan balances include nonaccrual loans. Interest income recognized on nonaccrual loans has been included.
|
|
(2)
|
Interest income on loans includes amortization of loan fees and costs and prepayment penalties collected, which are not material.
|
|
(3)
|
Tax-exempt income has been adjusted to a tax-equivalent basis using a federal income tax rate of 21 percent in 2018 and 35 percent in 2017 and 2016 and is adjusted to reflect the effect of the nondeductible interest expense associated with owning tax-exempt investment securities and loans.
|
|
(4)
|
Net interest income (FTE) and net interest margin (FTE) are non-GAAP financial measures. For further information, refer to the section “Non-GAAP Financial Measures” of this Item.
|
40
Net Interest Income
The Company’s largest component of net income is net interest income, which is the difference between interest earned on interest-earning assets, consisting primarily of loans and investment securities, and interest paid on interest-bearing liabilities, consisting of deposits and borrowings. Fluctuations in net interest income can result from the combination of changes in the balances of asset and liability categories and changes in interest rates. Interest rates earned and paid are also affected by general economic conditions, particularly changes in market interest rates, and by competitive factors, government policies and the actions of regulatory authorities. The Federal Reserve increased the targeted federal funds interest rate by a total of 100 basis points in 2018, compared to an increase of 75 basis points in 2017. We expect the rate of increases to slow in 2019.
Net interest margin is a measure of the net return on interest-earning assets and is computed by dividing annualized tax-equivalent net interest income by total average interest-earning assets for the period. For the years ended
December 31, 2018
,
2017
and
2016
, the Company’s net interest margin on a tax-equivalent basis was
3.02
,
3.37
and
3.49
percent, respectively. There was a decrease of
$15
in tax-equivalent net interest income in
2018
compared to
2017
. This was primarily due to an increase in rates on deposits and borrowed funds, which was partially offset by an increase in the average balance of interest earning assets. Also impacting the net interest margin was the decline in the federal income tax rate to 21 percent in 2018, from 35 percent in 2017. The change in the federal income tax rate used in the tax-equivalent adjustment to net interest income accounted for approximately nine basis points of the decline in net interest margin for the year ended December 31, 2018 compared to the year ended December 31, 2017. Applying the 21 percent tax rate to the tax-equivalent adjustment reduced tax-equivalent net interest income by $1,804 for the year ended December 31, 2018, in comparison to the 35 percent tax rate.
Rate and Volume Analysis
The rate and volume analysis shown below, on a tax-equivalent basis, is used to determine how much of the change in interest income or expense is the result of a change in volume or a change in interest yield or rate. The change in interest that is due to both volume and rate has been allocated to the change due to volume and the change due to rate in proportion to the absolute value of the change in each.
|
|
2018 Compared to 2017
|
2017 Compared to 2016
|
|||||||||||||||||||||
|
|
Volume
|
Rate
|
Total
|
Volume
|
Rate
|
Total
|
|||||||||||||||||
|
Interest Income
|
|||||||||||||||||||||||
|
Loans:
(1)
|
|||||||||||||||||||||||
|
Commercial
|
$
|
(278
|
)
|
$
|
1,314
|
|
$
|
1,036
|
|
$
|
(1,166
|
)
|
$
|
591
|
|
$
|
(575
|
)
|
|||||
|
Real estate
(2)
|
5,335
|
|
941
|
|
6,276
|
|
6,049
|
|
239
|
|
6,288
|
|
|||||||||||
|
Consumer and other
|
(65
|
)
|
17
|
|
(48
|
)
|
(26
|
)
|
8
|
|
(18
|
)
|
|||||||||||
|
Total loans (including fees)
|
4,992
|
|
2,272
|
|
7,264
|
|
4,857
|
|
838
|
|
5,695
|
|
|||||||||||
|
Investment securities:
|
|
|
|
|
|
|
|
|
|
|
|
|
|||||||||||
|
Taxable
|
1,793
|
|
830
|
|
2,623
|
|
220
|
|
1,080
|
|
1,300
|
|
|||||||||||
|
Tax-exempt
(2)
|
1,076
|
|
(1,376
|
)
|
(300
|
)
|
1,010
|
|
(134
|
)
|
876
|
|
|||||||||||
|
Total investment securities
|
2,869
|
|
(546
|
)
|
2,323
|
|
1,230
|
|
946
|
|
2,176
|
|
|||||||||||
|
Federal funds sold
|
(27
|
)
|
183
|
|
156
|
|
52
|
|
171
|
|
223
|
|
|||||||||||
|
Total interest income
(2)
|
7,834
|
|
1,909
|
|
9,743
|
|
6,139
|
|
1,955
|
|
8,094
|
|
|||||||||||
|
Interest Expense
|
|
|
|
|
|
|
|
|
|
|
|
|
|||||||||||
|
Deposits:
|
|
|
|
|
|
|
|
|
|
|
|
|
|||||||||||
|
Savings, interest-bearing
|
|||||||||||||||||||||||
|
demand and money market
|
1,332
|
|
6,871
|
|
8,203
|
|
485
|
|
3,071
|
|
3,556
|
|
|||||||||||
|
Time
|
428
|
|
811
|
|
1,239
|
|
308
|
|
367
|
|
675
|
|
|||||||||||
|
Total deposits
|
1,760
|
|
7,682
|
|
9,442
|
|
793
|
|
3,438
|
|
4,231
|
|
|||||||||||
|
Other borrowed funds
|
(740
|
)
|
1,056
|
|
316
|
|
345
|
|
525
|
|
870
|
|
|||||||||||
|
Total interest expense
|
1,020
|
|
8,738
|
|
9,758
|
|
1,138
|
|
3,963
|
|
5,101
|
|
|||||||||||
|
Net interest income
(2) (3)
|
$
|
6,814
|
|
$
|
(6,829
|
)
|
$
|
(15
|
)
|
$
|
5,001
|
|
$
|
(2,008
|
)
|
$
|
2,993
|
|
|||||
|
(1)
|
Average balances of nonaccrual loans were included for computational purposes.
|
|
(2)
|
Tax-exempt income has been converted to a tax-equivalent basis using a federal income tax rate of 21 percent in 2018 and 35 percent in 2017 and 2016 and is adjusted for the effect of the nondeductible interest expense associated with owning tax-exempt investment securities and loans.
|
|
(3)
|
Net interest income (FTE) is a non-GAAP financial measure. For further information, refer to the section “Non-GAAP Financial Measures” of this Item.
|
41
Tax-equivalent interest income and fees on loans increased
$7,264
for the year ended
December 31, 2018
compared to
2017
. The average balance of loans increased
$109,788
in
2018
compared to
2017
, as West Bank lenders in each of our markets focused on business development. The average yield on loans increased
15
basis points in
2018
compared to
2017
. The increase in average yield on loans in 2018 is less than the increase in the cost of deposits due to the relatively flat yield curve. The yield on the Company’s loan portfolio is affected by the mix of the portfolio, the interest rate environment, the effects of competition, the level of nonaccrual loans, and reversals of previously accrued interest on charged-off loans. The political and economic environments can also influence the volume of new loan originations and the mix of variable-rate versus fixed-rate loans.
The average balance of investment securities in
2018
was
$103,934
higher than in
2017
, as a result of significant investment purchase activity during the second half of
2017
. The purchase activity in 2017 focused on higher yielding bonds within the existing risk profile and was the result of growth in deposits and the reinvestment of proceeds from sales and principal paydowns of investment securities. In certain cases, securities were sold and the funds were reinvested in securities with higher rates while slightly extending the duration of the portfolio. The change in the federal income tax rate used in the tax-equivalent adjustment of tax-exempt securities accounted for an approximately 78 basis point reduction in the yield on tax-exempt investment securities for
2018
compared to
2017
. This was partially offset by an improvement of 31 basis points in the yield on taxable investment securities for
2018
compared to
2017
.
The average balance of interest-bearing demand, savings and money market deposits increased
$199,370
in
2018
compared to
2017
. The increase was primarily due to an increase in average balances of money market accounts. In addition, approximately $76,000 of noninterest-bearing accounts were reclassified to interest-bearing accounts in April 2017 as part of a retail deposit product restructuring in which we realigned and simplified the retail checking account products provided to our customers. The average rate paid on interest-bearing demand, savings and money market deposits in
2018
increased to
1.13 percent
from
0.58 percent
for
2017
.
The related increase in interest expense was primarily due to increasing interest rates on certain money market deposit products in response to increases in the targeted federal funds rates. The average balance of time deposits increased
$37,154
in
2018
compared to
2017
. The growth was primarily due to customers responding to interest rate increases. Interest rates on time deposits increased
47
basis points in
2018
compared to
2017
, primarily due to higher market interest rates paid at the time new and renewed time deposits were issued.
The average rate paid on other borrowed funds increased
79
basis points in
2018
compared to
2017
, and the average balance decreased
$18,741
between the same time periods. The increase in the average rate paid was due to increases in rates for variable-rate FHLB advances, subordinated notes and long-term debt. The average balance of other borrowed funds declined from 2017 to 2018 primarily due to the December 2017 payoff of a $25,000 FHLB advance, partially offset by a $22,000 increase in long-term debt in May 2017.
INVESTMENT SECURITIES PORTFOLIO
The following table sets forth the composition of the Company’s investment portfolio as of the dates indicated.
|
|
As of December 31
|
||||||||||
|
|
2018
|
2017
|
2016
|
||||||||
|
Securities available for sale, at fair value:
|
|||||||||||
|
U.S. government agencies and corporations
|
$
|
—
|
|
$
|
—
|
|
$
|
2,593
|
|
||
|
State and political subdivisions
|
149,156
|
|
146,313
|
|
64,336
|
|
|||||
|
Collateralized mortgage obligations
|
157,004
|
|
159,932
|
|
101,950
|
|
|||||
|
Mortgage-backed securities
|
63,378
|
|
60,429
|
|
80,158
|
|
|||||
|
Asset-backed securities
|
31,903
|
|
45,195
|
|
—
|
|
|||||
|
Trust preferred security
|
1,900
|
|
2,006
|
|
1,250
|
|
|||||
|
Corporate notes
|
50,417
|
|
30,344
|
|
10,350
|
|
|||||
|
Total securities available for sale
|
$
|
453,758
|
|
$
|
444,219
|
|
$
|
260,637
|
|
||
|
Securities held to maturity, at amortized cost:
|
|||||||||||
|
State and political subdivisions
|
$
|
—
|
|
$
|
45,527
|
|
$
|
48,386
|
|
||
42
The investment securities available for sale presented in the following table are reported at fair value and by contractual maturity as of
December 31, 2018
. Expected maturities may differ from contractual maturities because issuers may have the right to call or prepay obligations with or without call or prepayment penalties. The collateralized mortgage obligations, mortgage-backed securities and asset-backed securities have monthly paydowns that are not reflected in the table.
|
Investments as of December 31, 2018
|
Within one
year
|
After one year
but within five
years
|
After five years
but within ten
years
|
After ten years
|
Total
|
|||||||||||||||
|
State and political subdivisions
|
$
|
—
|
|
$
|
1,350
|
|
$
|
31,441
|
|
$
|
116,365
|
|
$
|
149,156
|
|
|||||
|
Collateralized mortgage obligations
|
—
|
|
6,207
|
|
14,546
|
|
136,251
|
|
157,004
|
|
||||||||||
|
Mortgage-backed securities
|
—
|
|
—
|
|
22,917
|
|
40,461
|
|
63,378
|
|
||||||||||
|
Asset-backed securities
|
—
|
|
—
|
|
—
|
|
31,903
|
|
31,903
|
|
||||||||||
|
Trust preferred security
|
—
|
|
—
|
|
—
|
|
1,900
|
|
1,900
|
|
||||||||||
|
Corporate notes
|
—
|
|
1,987
|
|
48,430
|
|
—
|
|
50,417
|
|
||||||||||
|
Total
|
$
|
—
|
|
$
|
9,544
|
|
$
|
117,334
|
|
$
|
326,880
|
|
$
|
453,758
|
|
|||||
|
Weighted average yield:
|
|
|
|
|
|
|
|
|
|
|
||||||||||
|
State and political subdivisions
(1)
|
—
|
%
|
2.43
|
%
|
2.66
|
%
|
3.22
|
%
|
||||||||||||
|
Collateralized mortgage obligations
|
—
|
|
2.61
|
%
|
2.52
|
%
|
2.55
|
%
|
||||||||||||
|
Mortgage-backed securities
|
—
|
|
—
|
|
2.58
|
%
|
2.99
|
%
|
||||||||||||
|
Asset-backed securities
|
—
|
|
—
|
|
—
|
|
3.28
|
%
|
||||||||||||
|
Trust preferred security
|
—
|
|
—
|
|
—
|
|
5.75
|
%
|
||||||||||||
|
Corporate notes
|
—
|
|
4.19
|
%
|
4.27
|
%
|
—
|
|
||||||||||||
|
Total
|
—
|
%
|
2.91
|
%
|
3.30
|
%
|
2.94
|
%
|
||||||||||||
|
(1)
|
Yields on tax-exempt obligations have been computed on a tax-equivalent basis using a federal income tax rate of 21 percent and are adjusted to reflect the effect of the nondeductible interest expense associated with owning tax-exempt investment securities.
|
Management’s process for obtaining and validating the fair value of investment securities is discussed in Note 17 to the consolidated financial statements included in Item 8 of this Form 10-K.
As of
December 31, 2018
, the existing gross unrealized losses of
$11,113
were considered to be temporary in nature due to market interest rate fluctuations, not reduced estimated cash flows. The Company has the ability and the intent to hold the related securities with unrealized losses for a period of time sufficient to allow for a recovery, which may be at maturity. However, management may decide to sell securities with unrealized losses at a future date for liquidity purposes, to manage interest rate risk or to enhance interest income.
As of
December 31, 2018
, approximately
56
percent of the available for sale investment securities portfolio consisted of government agency guaranteed collateralized mortgage obligations, mortgage-backed securities and asset-backed securities. In the current interest rate environment, those securities provide relatively good yields, have little to no credit risk and provide fairly consistent cash flows. All collateralized mortgage obligations and mortgage-backed securities consist of residential mortgage pass-through securities and real estate mortgage investment conduits guaranteed by the Federal Home Loan Mortgage Corporation (FHLMC), Federal National Mortgage Association (FNMA), or Government National Mortgage Association (GNMA), and commercial mortgage pass-through securities guaranteed by the Small Business Administration (SBA). Pass-through asset-backed securities are guaranteed by the SBA and represent participating interests in pools of commercial working capital and equipment loans. The debt obligations were all within the credit ratings acceptable under West Bank’s investment policy.
The securities issued by state and political subdivisions were diversified in 27 states. As of
December 31, 2018
, the Company did not have securities from a single issuer, except for the United States government or its agencies, that exceeded 10 percent of consolidated stockholders’ equity.
43
LOAN PORTFOLIO
Types of Loans
The following table sets forth the composition of the Company’s loan portfolio by segment as of the dates indicated.
|
|
As of December 31
|
||||||||||||||||||
|
|
2018
|
2017
|
2016
|
2015
|
2014
|
||||||||||||||
|
Commercial
|
$
|
358,763
|
|
$
|
347,482
|
|
$
|
334,014
|
|
$
|
349,051
|
|
$
|
316,908
|
|
||||
|
Real estate:
|
|
|
|
|
|
|
|
|
|||||||||||
|
Construction, land and land development
|
245,810
|
|
207,451
|
|
205,610
|
|
174,602
|
|
154,490
|
|
|||||||||
|
1-4 family residential first mortgages
|
49,052
|
|
51,044
|
|
47,184
|
|
51,370
|
|
53,497
|
|
|||||||||
|
Home equity
|
14,469
|
|
13,811
|
|
18,057
|
|
21,749
|
|
24,500
|
|
|||||||||
|
Commercial
|
1,050,025
|
|
886,114
|
|
788,000
|
|
644,176
|
|
625,938
|
|
|||||||||
|
Consumer and other
|
6,211
|
|
6,363
|
|
8,355
|
|
6,801
|
|
9,318
|
|
|||||||||
|
Total loans
|
1,724,330
|
|
1,512,265
|
|
1,401,220
|
|
1,247,749
|
|
1,184,651
|
|
|||||||||
|
Deferred loan fees, net
|
(2,500
|
)
|
(1,765
|
)
|
(1,350
|
)
|
(1,061
|
)
|
(606
|
)
|
|||||||||
|
Total loans, net of deferred fees
|
$
|
1,721,830
|
|
$
|
1,510,500
|
|
$
|
1,399,870
|
|
$
|
1,246,688
|
|
$
|
1,184,045
|
|
||||
As of
December 31, 2018
, total loans were approximately
91 percent
of total deposits and
75 percent
of total assets. As of
December 31, 2018
, the majority of all loans were originated directly by West Bank to borrowers within West Bank’s principal market areas.
Loans outstanding at the end of
2018
increased 14.0 percent compared to the end of
2017
. The growth was primarily in the commercial, construction, land and land development, and commercial real estate segments. Management believes the growth was the result of continued improvement in our local economies and the Company’s overall business development efforts in all of our operating markets. Management believes the business development efforts are strong throughout the organization, and additional growth is expected in
2019
.
For a description of the loan segments, see Note 4 to the consolidated financial statements included in Item 8 of this Form 10-K. The interest rates charged on loans vary with the degree of risk and the amount and terms of the loan. Competitive pressures, the creditworthiness of the borrower, market interest rates, the availability of funds, and government regulations further influence the rate charged on a loan.
The Company follows a loan policy approved by West Bank’s Board of Directors. The loan policy is reviewed at least annually and is updated as considered necessary. The policy establishes lending limits, review criteria and other guidelines for loan administration and the allowance for loan losses, among other things. Loans are approved by West Bank’s Board of Directors and/or designated officers in accordance with the applicable guidelines and underwriting policies. Loans to any one borrower are limited by state banking laws. Loan officer lending authorities vary according to the individual loan officer’s experience and expertise.
Loans Secured by Real Estate
The commercial real estate market continues to be a significant source of business for West Bank. Management places a strong emphasis on monitoring the composition of the Company’s commercial real estate loan portfolio. The Company has an established lending policy which includes a number of underwriting factors to be considered in making a commercial real estate loan, including, but not limited to, location, loan-to-value ratio (LTV), cash flow, collateral and the credit history of the borrower. The lending policy also includes guidelines for real estate appraisals and evaluations, including minimum appraisal and evaluation standards.
Although repayment risk exists on all loans, different factors influence repayment risk for each type of loan. The primary risks associated with commercial real estate loans are the quality of the borrower’s management and the health of the national and regional economies. Underwriting on commercial properties is primarily based on the economic viability of the project with heavy consideration given to the creditworthiness and experience of the borrower. Recognizing that debt is paid via cash flow, the projected cash flows of the project are critical in underwriting because these determine the ultimate value of the property and the ability to service debt. Therefore, in most commercial real estate projects, we generally require a minimum stabilized debt service coverage ratio of 1.20 to 1.35, depending on the real estate type. Exceptions to this policy can be made for certain borrowers that exhibit other credit quality strength. Exceptions to policy are monitored by management. Our strategy with respect to the management of these types of risks is to consistently follow prudent loan policies and underwriting practices.
44
The Company recognizes that a diversified loan portfolio contributes to reducing risk. The specific loan portfolio mix is subject to change based on loan demand, the business environment and various economic factors. The Company actively monitors concentrations within the loan portfolio to ensure appropriate diversification is maintained. In addition, management tracks the level of owner-occupied commercial real estate loans versus non-owner occupied commercial real estate loans. Owner occupied commercial real estate loans are generally considered to have less risk.
In accordance with regulatory guidelines, the Company exercises heightened risk management practices when non-owner occupied commercial real estate lending exceeds 300 percent of total risk-based capital or construction, land development, and other land loans exceed 100 percent of total risk-based capital. Although the Company’s loan portfolio is heavily concentrated in real estate and its real estate portfolio levels exceed these regulatory guidelines, it has established risk management policies and procedures to regularly monitor the commercial real estate portfolio.
Commercial loans secured by real estate, including construction, land and land development totaled
$1,295,835
or
75 percent
of total loans at
December 31, 2018
. This loan category included concentrations of approximately $209,022 of loans for medical-related facilities and approximately $213,475 of loans secured by multifamily residential properties.
Non-owner occupied commercial real estate loan concentrations and the weighted average LTV by property type as of
December 31, 2018
are shown in the following table. LTV is determined using the maximum credit exposure of the loan compared to the most recent appraisal data on the property obtained in accordance with the Company’s lending policies.
|
As of December 31, 2018
|
||||||||||
|
Non-owner occupied commercial real estate
|
Balance
|
% of CRE Portfolio
|
Weighted Average LTV
|
|||||||
|
Multifamily
|
$
|
213,475
|
|
19.8
|
%
|
72
|
%
|
|||
|
Medical
|
188,710
|
|
17.5
|
%
|
66
|
%
|
||||
|
Warehouse
|
120,560
|
|
11.2
|
%
|
73
|
%
|
||||
|
Hotel
|
123,318
|
|
11.4
|
%
|
71
|
%
|
||||
|
Mixed use
|
116,857
|
|
10.8
|
%
|
67
|
%
|
||||
|
Offices
|
108,294
|
|
10.0
|
%
|
74
|
%
|
||||
|
Land for development
|
75,307
|
|
7.0
|
%
|
65
|
%
|
||||
|
All other
|
132,928
|
|
12.3
|
%
|
not available
|
|
||||
|
Total
|
$
|
1,079,449
|
|
100.0
|
%
|
|||||
The following table summarizes non-owner occupied commercial real estate loans by property type and risk rating as of
December 31, 2018
. Risk ratings are defined in Note 4 to the consolidated financial statements included in Item 8 of this Form 10-K.
|
As of December 31, 2018
|
|||||||||||||||||||||||||||
|
|
Risk Rating
|
||||||||||||||||||||||||||
|
|
Total
|
1-3
|
4
|
5
|
6
|
7
|
8
|
||||||||||||||||||||
|
Multifamily
|
$
|
213,475
|
|
$
|
30,788
|
|
$
|
168,202
|
|
$
|
3,625
|
|
$
|
10,860
|
|
$
|
—
|
|
$
|
—
|
|
||||||
|
Medical
|
188,710
|
|
116,803
|
|
50,676
|
|
21,231
|
|
—
|
|
—
|
|
—
|
|
|||||||||||||
|
Warehouse
|
120,560
|
|
55,111
|
|
58,756
|
|
6,593
|
|
—
|
|
—
|
|
100
|
|
|||||||||||||
|
Hotel
|
123,318
|
|
45,019
|
|
78,299
|
|
—
|
|
—
|
|
—
|
|
—
|
|
|||||||||||||
|
Mixed use
|
116,857
|
|
37,322
|
|
60,566
|
|
18,969
|
|
—
|
|
—
|
|
—
|
|
|||||||||||||
|
Offices
|
108,294
|
|
11,420
|
|
89,515
|
|
7,359
|
|
—
|
|
—
|
|
—
|
|
|||||||||||||
|
Land for development
|
75,307
|
|
8,892
|
|
56,762
|
|
9,653
|
|
—
|
|
—
|
|
—
|
|
|||||||||||||
|
All other
|
132,928
|
|
64,643
|
|
64,983
|
|
2,210
|
|
1,092
|
|
—
|
|
—
|
|
|||||||||||||
|
Total
|
$
|
1,079,449
|
|
$
|
369,998
|
|
$
|
627,759
|
|
$
|
69,640
|
|
$
|
11,952
|
|
$
|
—
|
|
$
|
100
|
|
||||||
As of December 31, 2018, there were no non-owner occupied commercial real estate loans that were past due 30 days or more.
45
Maturities of Loans
The contractual maturities of the Company’s loan portfolio are shown in the following tables. Actual maturities may differ from contractual maturities because individual borrowers may have the right to prepay loans with or without prepayment penalties.
|
Loans as of December 31, 2018
|
Within one
year
|
After one but
within five
years
|
After five
years
|
Total
|
||||||||||||
|
Commercial
|
$
|
127,300
|
|
$
|
155,893
|
|
$
|
75,570
|
|
$
|
358,763
|
|
||||
|
Real estate:
|
|
|
||||||||||||||
|
Construction, land and land development
|
101,978
|
|
109,317
|
|
34,515
|
|
245,810
|
|
||||||||
|
1-4 family residential first mortgages
|
6,364
|
|
38,025
|
|
4,663
|
|
49,052
|
|
||||||||
|
Home equity
|
5,005
|
|
9,435
|
|
29
|
|
14,469
|
|
||||||||
|
Commercial
|
86,596
|
|
472,168
|
|
491,261
|
|
1,050,025
|
|
||||||||
|
Consumer and other
|
1,980
|
|
4,231
|
|
—
|
|
6,211
|
|
||||||||
|
Total loans
|
$
|
329,223
|
|
$
|
789,069
|
|
$
|
606,038
|
|
$
|
1,724,330
|
|
||||
|
|
|
|
|
|
|
|
|
|
||||||||
|
|
|
After one but
within five
years
|
After five
years
|
|
|
|||||||||||
|
Loan maturities after one year with:
|
|
|
|
|
|
|
||||||||||
|
Fixed rates
|
$
|
650,945
|
|
$
|
375,877
|
|
|
|
||||||||
|
Variable rates
|
138,124
|
|
230,161
|
|
|
|
||||||||||
|
|
$
|
789,069
|
|
$
|
606,038
|
|
|
|
||||||||
Risk Elements
The following table sets forth the amount of nonperforming assets held by the Company and common ratio measurements of those assets as of the dates indicated.
|
|
Years Ended December 31
|
||||||||||||||||||
|
|
2018
|
2017
|
2016
|
2015
|
2014
|
||||||||||||||
|
Nonaccrual loans
|
$
|
1,928
|
|
$
|
622
|
|
$
|
1,022
|
|
$
|
1,381
|
|
$
|
1,561
|
|
||||
|
Loans past due 90 days and still accruing interest
|
—
|
|
—
|
|
—
|
|
—
|
|
—
|
|
|||||||||
|
Troubled debt restructured loans
(1)
|
—
|
|
—
|
|
—
|
|
80
|
|
376
|
|
|||||||||
|
Total nonperforming loans
|
1,928
|
|
622
|
|
1,022
|
|
1,461
|
|
1,937
|
|
|||||||||
|
Other real estate owned
|
—
|
|
—
|
|
—
|
|
—
|
|
2,235
|
|
|||||||||
|
Total nonperforming assets
|
$
|
1,928
|
|
$
|
622
|
|
$
|
1,022
|
|
$
|
1,461
|
|
$
|
4,172
|
|
||||
|
Nonperforming loans to total loans
|
0.11
|
%
|
0.04
|
%
|
0.07
|
%
|
0.12
|
%
|
0.16
|
%
|
|||||||||
|
Nonperforming assets to total assets
|
0.08
|
%
|
0.03
|
%
|
0.06
|
%
|
0.08
|
%
|
0.26
|
%
|
|||||||||
|
(1)
|
While TDR loans are commonly reported by the industry as nonperforming, those not classified in the nonaccrual category are accruing interest due to payment performance. TDR loans on nonaccrual status, if any, are included in the nonaccrual category.
|
Credit quality of the Company’s assets remains strong, as nonperforming assets continued to be at historically low levels during
2018
. The increase in nonperforming loans at
December 31, 2018
, compared to
December 31, 2017
, is primarily due to one borrower with commercial operating and commercial real estate loans that were put on nonaccrual status. The Company’s Texas ratio, which is computed by dividing nonperforming assets by tangible common equity plus the allowance for loan losses, was
0.93 percent
as of
December 31, 2018
, compared to
0.32 percent
as of
December 31, 2017
.
46
The accrual of interest on past due and other impaired loans is generally discontinued when loan payments are 90 days past due or when, in the opinion of management, the borrower may be unable to make all payments pursuant to contractual terms. Interest income is subsequently recognized only to the extent cash payments are received. Generally, all payments received while a loan is on nonaccrual status are applied to the principal balance of the loan. For the years ended
December 31, 2018
,
2017
and
2016
, interest income that would have been recorded during the nonaccrual period under the original terms of such loans was approximately
$96
,
$47
and
$72
, respectively. Loans are returned to accrual status when all principal and interest amounts contractually due are brought current and future payments are reasonably assured. In certain cases, interest may continue to accrue on loans past due more than 90 days when the value of the collateral is sufficient to cover both the principal amount of the loan and accrued interest and the loan is in the process of collection.
A loan is classified as a TDR loan when the Company separately concludes that a borrower is experiencing financial difficulties and a concession is granted that would not have otherwise been considered. Concessions may include restructuring of the loan terms to alleviate the burden of the borrower’s cash requirements, such as an extension of the payment terms beyond the original maturity date or a change in the interest rate charged. The payment history of the borrower, along with a current analysis of its cash flows, is used to determine the restructured terms. Underwriting procedures are similar to those of new loan originations and renewals of performing loans in that current financial information is obtained and analyzed. A current assessment of collateral is performed. The approval process for TDR loans is the same as that for new loans. The TDR loans with extended terms are accounted for as impaired until performance is established. A change to the interest rate would change the classification of a loan to a TDR loan if the restructured loan yields a rate that is below a market rate for that of a new loan with comparable risk. TDR loans with below-market rates are considered impaired until fully collected. TDR loans may also be reported as nonaccrual or 90 days past due if they are not performing per the restructured terms.
Interest income on other impaired loans is based upon the terms of the underlying loan agreement. However, the recorded net investment in impaired loans, including accrued interest, is limited to the present value of the expected cash flows of the impaired loan or the observable fair market value of the loan’s collateral. The average balance of all impaired loans during
2018
was approximately
$1,698
. Interest income recognized on impaired loans in
2018
,
2017
and
2016
was approximately
$6
,
$10
and
$1
, respectively.
As of
December 31, 2018
, West Bank had identified approximately $863 in loans to two commercial and commercial real estate customers as potential problem loans. None of these loans were in default at the end of the year. It is not now possible to predict the degree of problems these loans may develop. However, West Bank is closely monitoring each loan.
SUMMARY OF THE ALLOWANCE FOR LOAN LOSSES
The provision for loan losses represents charges made to earnings to maintain an adequate allowance for loan losses. The adequacy of the allowance for loan losses is evaluated quarterly by management and reviewed by the Board of Directors. The allowance for loan losses is management’s best estimate of probable losses inherent in the loan portfolio as of the balance sheet date.
Factors considered in establishing an appropriate allowance include: the borrower’s financial condition; the value and adequacy of loan collateral; the condition of the local economy and the borrower’s specific industry; the levels and trends of loans by segment; and a review of delinquent and classified loans. The quarterly evaluation focuses on factors such as specific loan reviews, changes in the components of the loan portfolio given the current and forecasted economic conditions, and historical loss experience. Any one of the following conditions may result in the review of a specific loan: concern about whether the customer’s cash flow or net worth is sufficient to repay the loan; delinquency status; criticism of the loan in a regulatory examination; the suspension of interest accrual; or other factors, including whether the loan has other special or unusual characteristics that suggest special monitoring is warranted. The Company’s concentration risks include geographic concentration in central and eastern Iowa and southeastern Minnesota. The local economies are composed primarily of service industries and state and county governments.
West Bank has a significant portion of its loan portfolio in commercial real estate loans, commercial lines of credit, commercial term loans, and construction and land development loans. West Bank’s typical commercial borrower is a small- or medium-sized, privately owned business entity. Compared to residential mortgages or consumer loans, commercial loans typically have larger balances and repayment usually depends on the borrowers’ successful business operations. Commercial loans also generally are not fully repaid over the loan period and, thus, may require refinancing or a large payoff at maturity. When the general economy turns downward, commercial borrowers may not be able to repay their loans, and the value of their assets, which are usually pledged as collateral, may decrease rapidly and significantly.
47
While management uses available information to recognize losses on loans, further reduction in the carrying amounts of loans may be necessary based on changes in circumstances, changes in the overall economy in the markets we currently serve, or later acquired information. Identifiable sectors within the general economy are subject to additional volatility, which at any time may have a substantial impact on the loan portfolio. In addition, regulatory agencies, as integral parts of their examination processes, periodically review the credit quality of the loan portfolio and the level of the allowance for loan losses. Such agencies may require West Bank to recognize additional losses based on such agencies’ review of information available to them at the time of their examinations.
Change in the Allowance for Loan Losses
West Bank’s policy is to charge off loans when, in management’s opinion, a loan or a portion of a loan is deemed uncollectible. Concerted efforts are made to maximize subsequent recoveries. The following table summarizes activity in the Company’s allowance for loan losses by loan segment for the years indicated, including amounts of loans charged off, recoveries, additions to the allowance charged to income and related ratios.
|
|
Analysis of the Allowance for Loan Losses for the Years Ended December 31
|
||||||||||||||||||
|
|
2018
|
2017
|
2016
|
2015
|
2014
|
||||||||||||||
|
Balance at beginning of period
|
$
|
16,430
|
|
$
|
16,112
|
|
$
|
14,967
|
|
$
|
13,607
|
|
$
|
13,791
|
|
||||
|
Charge-offs:
|
|
|
|
|
|
|
|
|
|
|
|||||||||
|
Commercial
|
(208
|
)
|
(199
|
)
|
(125
|
)
|
(408
|
)
|
(836
|
)
|
|||||||||
|
Real estate:
|
|
|
|
|
|
|
|
|
|
|
|||||||||
|
Construction, land and land development
|
—
|
|
—
|
|
(141
|
)
|
—
|
|
—
|
|
|||||||||
|
1-4 family residential first mortgages
|
—
|
|
—
|
|
(93
|
)
|
(23
|
)
|
(131
|
)
|
|||||||||
|
Home equity
|
(24
|
)
|
(176
|
)
|
—
|
|
(2
|
)
|
(138
|
)
|
|||||||||
|
Commercial
|
—
|
|
—
|
|
—
|
|
—
|
|
(112
|
)
|
|||||||||
|
Consumer and other
|
(3
|
)
|
—
|
|
(47
|
)
|
(6
|
)
|
—
|
|
|||||||||
|
Total charge-offs
|
(235
|
)
|
(375
|
)
|
(406
|
)
|
(439
|
)
|
(1,217
|
)
|
|||||||||
|
Recoveries:
|
|
|
|
|
|
|
|
|
|
|
|||||||||
|
Commercial
|
673
|
|
232
|
|
218
|
|
579
|
|
116
|
|
|||||||||
|
Real estate:
|
|
|
|
|
|
|
|
|
|
|
|||||||||
|
Construction, land and land development
|
—
|
|
398
|
|
217
|
|
250
|
|
8
|
|
|||||||||
|
1-4 family residential first mortgages
|
18
|
|
15
|
|
59
|
|
7
|
|
45
|
|
|||||||||
|
Home equity
|
24
|
|
28
|
|
36
|
|
87
|
|
99
|
|
|||||||||
|
Commercial
|
13
|
|
13
|
|
13
|
|
12
|
|
11
|
|
|||||||||
|
Consumer and other
|
16
|
|
7
|
|
8
|
|
14
|
|
4
|
|
|||||||||
|
Total recoveries
|
744
|
|
693
|
|
551
|
|
949
|
|
283
|
|
|||||||||
|
Net (charge-offs) recoveries
|
509
|
|
318
|
|
145
|
|
510
|
|
(934
|
)
|
|||||||||
|
Provision for loan losses charged to operations
|
(250
|
)
|
—
|
|
1,000
|
|
850
|
|
750
|
|
|||||||||
|
Balance at end of period
|
$
|
16,689
|
|
$
|
16,430
|
|
$
|
16,112
|
|
$
|
14,967
|
|
$
|
13,607
|
|
||||
|
Average loans outstanding
|
$
|
1,553,673
|
|
$
|
1,443,885
|
|
$
|
1,336,156
|
|
$
|
1,213,429
|
|
$
|
1,063,528
|
|
||||
|
Ratio of net (charge-offs) recoveries during the
|
|||||||||||||||||||
|
period to average loans outstanding
|
0.03
|
%
|
0.02
|
%
|
0.01
|
%
|
0.04
|
%
|
(0.09
|
)%
|
|||||||||
|
Ratio of allowance for loan losses to
|
|||||||||||||||||||
|
average loans outstanding
|
1.07
|
%
|
1.14
|
%
|
1.21
|
%
|
1.23
|
%
|
1.28
|
%
|
|||||||||
|
Ratio of allowance for loan losses to total
|
|||||||||||||||||||
|
loans at the end of period
|
0.97
|
%
|
1.09
|
%
|
1.15
|
%
|
1.20
|
%
|
1.15
|
%
|
|||||||||
48
Breakdown of Allowance for Loan Losses by Category
The following table sets forth information concerning the Company’s allocation of the allowance for loan losses by loan segment as of the dates indicated.
|
As of December 31
|
||||||||||||||||||||||||||||||||||
|
|
2018
|
2017
|
2016
|
2015
|
2014
|
|||||||||||||||||||||||||||||
|
|
Amount
|
%*
|
Amount
|
%*
|
Amount
|
%*
|
Amount
|
%*
|
Amount
|
%*
|
||||||||||||||||||||||||
|
Balance at end of
|
||||||||||||||||||||||||||||||||||
|
period applicable to:
|
|
|
|
|
|
|
|
|
|
|
||||||||||||||||||||||||
|
Commercial
|
$
|
3,508
|
|
20.81
|
%
|
$
|
3,866
|
|
22.98
|
%
|
$
|
3,881
|
|
23.84
|
%
|
$
|
4,369
|
|
27.97
|
%
|
$
|
4,415
|
|
26.75
|
%
|
|||||||||
|
Real estate:
|
|
|
|
|
|
|
|
|
|
|
|
|
|
|
|
|
||||||||||||||||||
|
Construction, land
|
||||||||||||||||||||||||||||||||||
|
and land development
|
2,384
|
|
14.26
|
%
|
2,213
|
|
13.72
|
%
|
2,639
|
|
14.67
|
%
|
2,338
|
|
13.99
|
%
|
2,151
|
|
13.04
|
%
|
||||||||||||||
|
1-4 family residential
|
||||||||||||||||||||||||||||||||||
|
first mortgages
|
250
|
|
2.84
|
%
|
319
|
|
3.38
|
%
|
317
|
|
3.37
|
%
|
508
|
|
4.12
|
%
|
466
|
|
4.51
|
%
|
||||||||||||||
|
Home equity
|
171
|
|
0.84
|
%
|
186
|
|
0.91
|
%
|
478
|
|
1.29
|
%
|
481
|
|
1.74
|
%
|
534
|
|
2.07
|
%
|
||||||||||||||
|
Commercial
|
10,301
|
|
60.89
|
%
|
9,770
|
|
58.59
|
%
|
8,697
|
|
56.23
|
%
|
7,254
|
|
51.63
|
%
|
6,013
|
|
52.84
|
%
|
||||||||||||||
|
Consumer and other
|
75
|
|
0.36
|
%
|
76
|
|
0.42
|
%
|
100
|
|
0.60
|
%
|
17
|
|
0.55
|
%
|
28
|
|
0.79
|
%
|
||||||||||||||
|
|
$
|
16,689
|
|
100.00
|
%
|
$
|
16,430
|
|
100.00
|
%
|
$
|
16,112
|
|
100.00
|
%
|
$
|
14,967
|
|
100.00
|
%
|
$
|
13,607
|
|
100.00
|
%
|
|||||||||
* Percent of loans in each category to total loans.
The allocation of the allowance for loan losses is dependent upon the change in balances outstanding in the various categories; the historical net loss experience by category, which can vary over time; specific reserves for loans considered impaired; and management’s assessment of economic factors that may influence potential losses in the loan portfolio. Growth in the U.S. economy has continued during
2018
, although it appears to have slowed slightly in the fourth quarter of 2018. Average monthly jobs growth in the last quarter of 2018 was approximately 254,000, while the national unemployment rate increased slightly to 3.9 percent as of December 2018 and growth estimates for gross domestic product for the fourth quarter of 2018 have declined to 2.6 percent. Activity in the housing market continued at a moderate pace. Short term interest rate increases are expected to be slower in 2019 than what was experienced in 2018. The economic environments in Iowa and Minnesota continued to improve. Based on the current economic indicators, the Company decided to reduce the economic factors used in the allowance for loan losses at December 31, 2018 by five basis points compared to the economic factors used at December 31,
2017
. The Company continued to use experience factors based on the highest losses calculated over a rolling 12-, 16- or 20-quarter period. Management believes that using the highest of these time periods will select the factor that best represents where we are in the economic cycle. For instance, if the economy worsens, the more recent activity should be more representative of the current environment. As the economy improves, the averages over a longer period of time should be more representative. Loss experience factors continued to decline in
2018
in all loan segments, except for home equity loans which experienced an insignificant increase.
The portion of the allowance for loan losses related to loans collectively evaluated for impairment increased $283 to a total of
$16,574
, or 0.96 percent, as of
December 31, 2018
compared to
$16,291
, or 1.08 percent, as of
December 31, 2017
. Based upon the quarterly evaluations, management determined a negative provision for loan losses of $250 was appropriate for the year ended
December 31, 2018
. The net recoveries in 2018 included the recovery of $508 on a previously charged-off commercial loan. Net recoveries in 2018 exceeded the need for increases in the allowance for loan losses related to loan growth and credit quality, therefore resulting in a negative provision. Management believes the resulting allowance for loan losses as of
December 31, 2018
was adequate to absorb the losses inherent in the loan portfolio.
Additional details on the allowance for loan losses is included in Note 4 to the consolidated financial statements included in Item 8 of this Form 10-K.
49
DEPOSITS
Deposits totaled
$1,894,529
as of
December 31, 2018
, which was
4.6 percent
higher than the total as of
December 31, 2017
. The increase in deposits was due to the combination of business development efforts and normal fluctuations as corporate and municipal customers’ liquidity needs vary at any given time. West Bank continues to offer the Insured Cash Sweep interest-bearing checking and money market products, which is a reciprocal program providing FDIC insurance coverage for all participating deposits. As of
December 31, 2018
, a significant related party relationship maintained total deposit balances with West Bank of approximately $152,000.
The volume of time deposits grew during
2018
, primarily as a result of interest rate increases. West Bank continues to offer the Certificate of Deposit Account Registry Service (CDARS) program. The CDARS program is also a reciprocal program providing FDIC insurance coverage for all participating deposits. CDARS time deposits made up approximately 45 percent of total time deposits at
December 31, 2018
.
Approximately 78 percent of the total time deposits issued by West Bank mature in the next year. It is anticipated that a significant portion of these time deposits will be renewed. In the event a substantial volume of time deposits is not renewed, management believes the Company has sufficient liquid assets and borrowing lines to fund the potential runoff.
The following table shows the amounts and remaining maturities of time certificates of deposit with balances of $100 or more as of
December 31, 2018
.
|
3 months or less
|
$
|
45,211
|
|
|
Over 3 through 6 months
|
55,831
|
|
|
|
Over 6 through 12 months
|
38,557
|
|
|
|
Over 12 months
|
32,179
|
|
|
|
|
$
|
171,778
|
|
The following table sets forth the average balances for each major category of deposits and the weighted average interest rate paid for those deposits during the years indicated.
|
|
Years ended December 31
|
|||||||||||||||||||
|
|
2018
|
2017
|
2016
|
|||||||||||||||||
|
Average
|
Average
|
Average
|
Average
|
Average
|
Average
|
|||||||||||||||
|
|
Balance
|
Rate
|
Balance
|
Rate
|
Balance
|
Rate
|
||||||||||||||
|
Noninterest-bearing demand
|
$
|
401,778
|
|
—
|
|
$
|
412,078
|
|
—
|
|
$
|
473,380
|
|
—
|
|
|||||
|
Interest-bearing demand:
|
|
|
|
|
|
|
|
|
|
|
|
|
||||||||
|
Reward Me checking
|
51,460
|
|
0.26
|
%
|
59,797
|
|
0.26
|
%
|
78,219
|
|
0.29
|
%
|
||||||||
|
Insured cash sweep
|
69,588
|
|
0.67
|
%
|
74,730
|
|
0.28
|
%
|
77,489
|
|
0.27
|
%
|
||||||||
|
Other interest-bearing demand
|
195,964
|
|
0.23
|
%
|
188,946
|
|
0.18
|
%
|
95,171
|
|
0.07
|
%
|
||||||||
|
Money market:
|
||||||||||||||||||||
|
Insured cash sweep
|
246,360
|
|
1.59
|
%
|
181,203
|
|
0.78
|
%
|
143,869
|
|
0.32
|
%
|
||||||||
|
Other money market
|
580,543
|
|
1.53
|
%
|
463,925
|
|
0.85
|
%
|
435,996
|
|
0.37
|
%
|
||||||||
|
Savings
|
122,619
|
|
0.42
|
%
|
98,563
|
|
0.12
|
%
|
87,030
|
|
0.05
|
%
|
||||||||
|
Time
|
184,386
|
|
1.46
|
%
|
147,232
|
|
0.99
|
%
|
110,407
|
|
0.71
|
%
|
||||||||
|
$
|
1,852,698
|
|
|
|
$
|
1,626,474
|
|
|
|
$
|
1,501,561
|
|
|
|
||||||
Management anticipates the average interest rates on money market and insured cash sweep demand deposits in
2019
will be higher than the average rates paid in
2018
because of multiple interest rate increases made by the Company during 2018 and the sensitivity of certain money market accounts to changes in the targeted federal funds rates. To limit the Company’s exposure to market interest rate increases, an interest rate swap is in place on $60,000 of deposit balances that effectively converts certain customer deposits with variable rates based on the federal funds upper target rate to fixed-rate instruments. This interest rate swap became effective in December 2018. Management does not expect interest rates on other interest-bearing demand, savings and time deposits in
2019
to be significantly different from the average rates paid in
2018
, unless market factors would dictate a change.
50
BORROWED FUNDS
The following table summarizes the outstanding principal balances, net of any discount or debt issuance costs, and the weighted average effective rate for each category of borrowed funds as of the dates indicated.
|
|
As of December 31
|
|||||||||||||||||||
|
|
2018
|
2017
|
2016
|
|||||||||||||||||
|
|
Balance
|
Rate
|
Balance
|
Rate
|
Balance
|
Rate
|
||||||||||||||
|
Federal funds purchased
|
$
|
19,985
|
|
2.61
|
%
|
$
|
545
|
|
1.00
|
%
|
$
|
9,690
|
|
0.47
|
%
|
|||||
|
Subordinated notes, net
(1)
|
20,425
|
|
4.88
|
%
|
20,412
|
|
4.81
|
%
|
20,398
|
|
4.11
|
%
|
||||||||
|
FHLB advances, net
(1)
|
137,878
|
|
3.97
|
%
|
76,382
|
|
4.22
|
%
|
99,886
|
|
3.56
|
%
|
||||||||
|
Long-term debt, net
|
27,040
|
|
2.92
|
%
|
22,917
|
|
3.34
|
%
|
5,126
|
|
2.48
|
%
|
||||||||
|
|
$
|
205,328
|
|
3.79
|
%
|
$
|
120,256
|
|
4.14
|
%
|
$
|
135,100
|
|
3.38
|
%
|
|||||
The following tables set forth the average principal balance, net of any discount or debt issuance costs, the average effective rate paid, and the maximum outstanding balance for each category of borrowed funds for the years indicated.
|
|
Years Ended December 31
|
|||||||||||||||||||
|
|
2018
|
2017
|
2016
|
|||||||||||||||||
|
|
Average
Balance
|
Average
Rate
|
Average
Balance
|
Average
Rate
|
Average
Balance
|
Average
Rate
|
||||||||||||||
|
Federal funds purchased
|
$
|
9,139
|
|
2.06
|
%
|
$
|
10,103
|
|
0.98
|
%
|
$
|
10,364
|
|
0.46
|
%
|
|||||
|
Subordinated notes, net
(1)
|
20,418
|
|
5.27
|
%
|
20,405
|
|
4.42
|
%
|
20,391
|
|
3.57
|
%
|
||||||||
|
FHLB advances, net
(1)
|
78,673
|
|
4.64
|
%
|
99,656
|
|
3.85
|
%
|
99,114
|
|
3.60
|
%
|
||||||||
|
Long-term debt, net
|
19,606
|
|
3.86
|
%
|
16,413
|
|
3.16
|
%
|
6,666
|
|
2.17
|
%
|
||||||||
|
|
$
|
127,836
|
|
4.44
|
%
|
$
|
146,577
|
|
3.65
|
%
|
$
|
136,535
|
|
3.28
|
%
|
|||||
|
|
2018
|
2017
|
2016
|
||||||||||||||
|
Maximum amount outstanding at any
|
|||||||||||||||||
|
month-end during the year:
|
|||||||||||||||||
|
Federal funds purchased
|
$
|
51,820
|
|
$
|
48,925
|
|
$
|
50,840
|
|
||||||||
|
Subordinated notes, net
|
20,425
|
|
20,412
|
|
20,398
|
|
|||||||||||
|
FHLB advances, net
|
137,878
|
|
101,255
|
|
99,886
|
|
|||||||||||
|
Long-term debt, net
|
27,040
|
|
25,483
|
|
8,405
|
|
|||||||||||
The fluctuation in the balances of federal funds purchased is dependent upon the activity of our downstream correspondent banks and in the Company’s liquidity needs, which from time to time may require the Company to draw on the federal funds purchased lines with our correspondent banks or on overnight FHLB advances. Depending on which has the lower interest rate, the Company may utilize either source of funding.
In October 2016, the Company entered into a forward-starting interest rate swap transaction with a notional amount of
$20,000
to effectively convert its variable-rate subordinated notes to fixed-rate debt as of the forward-starting date. The forward-starting date of this swap was September 30, 2018.
During December 2012, $80,000 of the FHLB advances were modified and converted to variable-rate advances tied to the three- month LIBOR interest rate. To limit the Company’s exposure to market interest rate increases, an interest rate swap is in place on $30,000 of the variable-rate FHLB advances. These FHLB advances have maturity dates of 2019 through 2020. In December 2018, the Company entered into two 30-day FHLB advances totaling $60,000 to fund loan growth. Subsequent to year-end, these advances were replaced with $50,000 of 90-day advances.
On May 25, 2017, the Company entered into a credit agreement with a commercial bank and borrowed $25,000. This credit agreement replaced a prior credit agreement with the same commercial bank that had a remaining balance of $3,000. The additional borrowing was used to make a capital injection into West Bank in 2017. Principal and interest under the term note are payable quarterly over five years. Required quarterly principal payments are $625, with the balance due at maturity. The Company may make additional principal payments without penalty. The interest rate is variable at 1.95 percent over the 30-day LIBOR rate.
51
During June 2013, the company purchased commercial lots in Coralville for a new eastern Iowa main office. A portion of the land purchase was financed with a $765, nine year variable-payment contract with a fixed interest rate of 1.25 percent.
In December 2018, West Bank’s special purpose subsidiary entered into a credit agreement for $11,486. Interest is payable monthly over the term of the agreement with an interest rate of 1.00 percent. Monthly principal payments begin in January 2026 and the agreement matures in December 2048.
OFF-BALANCE SHEET ARRANGEMENTS
In the normal course of business, West Bank commits to extend credit in the form of loan commitments and standby letters of credit in order to meet the financing needs of its customers. These commitments expose West Bank to varying degrees of credit and market risks in excess of the amounts recognized in the consolidated balance sheets and are subject to the same credit policies as are loans recorded on the balance sheets.
West Bank’s exposure to credit loss in the event of nonperformance by the other party to the financial instrument for commitments to extend credit and standby letters of credit is represented by the contractual amount of those instruments. West Bank uses the same credit policies in making commitments and conditional obligations as it does for on-balance sheet instruments. Commitments to lend are subject to borrowers’ continuing compliance with existing credit agreements. Management of the Company does not expect any significant losses as a result of these commitments. Off-balance sheet commitments are more fully discussed in Note 16 to the consolidated financial statements included in Item 8 of this Form 10-K.
CONTRACTUAL OBLIGATIONS
The following table sets forth the balance of the Company’s contractual obligations by maturity period as of
December 31, 2018
.
|
|
Payments due by period
|
||||||||||||||||||
|
|
Total
|
Less than
one year
|
One to
three years
|
Three to
five years
|
More than
five years
|
||||||||||||||
|
Time deposits
|
$
|
207,409
|
|
$
|
161,204
|
|
$
|
35,877
|
|
$
|
10,328
|
|
$
|
—
|
|
||||
|
Federal funds purchased
|
19,985
|
|
19,985
|
|
—
|
|
—
|
|
—
|
|
|||||||||
|
Subordinated notes
|
20,619
|
|
—
|
|
—
|
|
—
|
|
20,619
|
|
|||||||||
|
FHLB advances
|
140,000
|
|
85,000
|
|
55,000
|
|
—
|
|
—
|
|
|||||||||
|
Long-term debt
|
27,040
|
|
2,615
|
|
5,153
|
|
7,786
|
|
11,486
|
|
|||||||||
|
Noncancelable operating lease commitments
|
11,310
|
|
1,534
|
|
3,013
|
|
2,905
|
|
3,858
|
|
|||||||||
|
Total
|
$
|
426,363
|
|
$
|
270,338
|
|
$
|
99,043
|
|
$
|
21,019
|
|
$
|
35,963
|
|
||||
LIQUIDITY AND CAPITAL RESOURCES
The objective of liquidity management is to ensure the availability of sufficient cash flows to meet all financial commitments and to capitalize on opportunities for profitable business expansion. The Company’s principal source of funds is deposits. Other sources include loan principal repayments, proceeds from the maturity and sale of investment securities, principal payments on collateralized mortgage obligations, mortgage-backed securities and asset-backed securities, federal funds purchased, advances from the FHLB, and funds provided by operations. Liquidity management is conducted on both a daily and a long-term basis. Investments in liquid assets are adjusted based on expected loan demand, projected loan and investment securities maturities and payments, expected deposit flows and the objectives set by West Bank’s asset-liability management policy.
As of
December 31, 2018
, West Bank had additional borrowing capacity available from the FHLB of approximately $289,000. In addition, West Bank had $
67,000
in borrowing capacity available through unsecured federal funds lines of credit with correspondent banks. West Bank had no amounts outstanding under those unsecured federal funds lines as of
December 31, 2018
. Amounts reported as federal funds purchased include overnight borrowings from FHLB. Net cash from continuing operating activities contributed
$34,744
,
$29,357
and
$30,298
to liquidity for the years ended
December 31, 2018
,
2017
and
2016
, respectively. The combination of high levels of potentially liquid assets, cash flows from operations and additional borrowing capacity provided the Company with sufficient liquidity as of
December 31, 2018
.
52
The Company’s total stockholders’ equity increased to
$191,023
as of
December 31, 2018
from
$178,098
as of
December 31, 2017
. The increase was primarily the result of net income less dividends paid, partially offset by a decrease in AOCI. At
December 31, 2018
, tangible common equity as a percent of tangible assets was
8.32 percent
compared to
8.42 percent
as of
December 31, 2017
. As of December 31, 2018 and 2017, the Company had no intangible assets.
The Company and West Bank are subject to various regulatory capital requirements administered by federal and state banking agencies. Capital requirements are more fully discussed under the heading “Supervision and Regulation” included in Item 1 and in Note 15 to the consolidated financial statements included in Item 8 of this Form 10-K. The Company and West Bank met all capital adequacy requirements to which they were subject as of
December 31, 2018
, and West Bank’s capital ratios were in excess of the requirements to be well-capitalized under prompt corrective action provisions. Also, as of
December 31, 2018
, the ratios for the Company and West Bank were sufficient to meet the fully phased-in capital conservation buffer.
INFLATION
The primary impact of inflation on the Company’s operations is increased asset yields, deposit costs and operating overhead. Unlike most industries, virtually all the assets and liabilities of a financial institution are monetary in nature. As a result, interest rates generally have a more significant impact on a financial institution’s performance than they would have on nonfinancial companies. Although interest rates do not necessarily move in the same direction or to the same extent as the prices of goods and services, increases in inflation generally have resulted in increased interest rates. The effects of inflation can magnify the growth of assets and, if significant, require that equity capital increase at a faster rate than otherwise would be necessary.
EFFECTS OF NEW STATEMENTS OF FINANCIAL ACCOUNTING STANDARDS
A discussion of the effects of new financial accounting standards and developments as they relate to the Company is located in Note 1 to the consolidated financial statements included in Item 8 of this Form 10-K.
ITEM 7A. QUANTITATIVE AND QUALITATIVE DISCLOSURES ABOUT MARKET RISK
Not required for smaller reporting companies.
53
ITEM 8. FINANCIAL STATEMENTS AND SUPPLEMENTARY DATA

Report of Independent Registered Public Accounting Firm
To the Stockholders and the Board of Directors of West Bancorporation, Inc.
Opinion on the Financial Statements
We have audited the accompanying consolidated balance sheets of West Bancorporation, Inc. and its subsidiary (the Company) as of
December 31, 2018
and
2017
, the related consolidated statements of income, comprehensive income, stockholders’ equity and cash flows for each of the three years in the period ended
December 31, 2018
, and the related notes to the consolidated financial statements (collectively, the financial statements). In our opinion, the financial statements present fairly, in all material respects, the financial position of the Company as of
December 31, 2018
and
2017
, and the results of its operations and its cash flows for each of the three years in the period ended
December 31, 2018
, in conformity with accounting principles generally accepted in the United States of America.
We have also audited, in accordance with the standards of the Public Company Accounting Oversight Board (United States) (PCAOB), the Company’s internal control over financial reporting as of
December 31, 2018
, based on criteria established in
Internal Control - Integrated Framework
issued by the Committee of Sponsoring Organizations of the Treadway Commission in 2013, and our report dated
February 27, 2019
expressed an unqualified opinion on the effectiveness of the Company’s internal control over financial reporting.
Basis for Opinion
These financial statements are the responsibility of the Company’s management. Our responsibility is to express an opinion on the Company’s financial statements based on our audits. We are a public accounting firm registered with the PCAOB and are required to be independent with respect to the Company in accordance with U.S. federal securities laws and the applicable rules and regulations of the Securities and Exchange Commission and the PCAOB.
We conducted our audits in accordance with the standards of the PCAOB. Those standards require that we plan and perform the audits to obtain reasonable assurance about whether the financial statements are free of material misstatement, whether due to error or fraud. Our audits included performing procedures to assess the risks of material misstatement of the financial statements, whether due to error or fraud, and performing procedures that respond to those risks. Such procedures included examining, on a test basis, evidence regarding the amounts and disclosures in the financial statements. Our audits also included evaluating the accounting principles used and significant estimates made by management, as well as evaluating the overall presentation of the financial statements. We believe that our audits provide a reasonable basis for our opinion.
/s/ RSM US LLP
We have served as the Company’s auditor since 1998.
Des Moines, Iowa
February 27, 2019
54
Report of Independent Registered Public Accounting Firm
To the Stockholders and the Board of Directors of West Bancorporation, Inc.
Opinion on the Internal Control Over Financial Reporting
We have audited West Bancorporation, Inc.’s (the Company) internal control over financial reporting as of
December 31, 2018
, based on criteria established in
Internal Control - Integrated Framework
issued by the Committee of Sponsoring Organizations of the Treadway Commission in 2013. In our opinion, the Company maintained, in all material respects, effective internal control over financial reporting as of
December 31, 2018
, based on criteria established in
Internal Control - Integrated Framework
issued by the Committee of Sponsoring Organizations of the Treadway Commission in 2013.
We have also audited, in accordance with the standards of the Public Company Accounting Oversight Board (United States) (PCAOB), the consolidated balance sheets as of
December 31, 2018
and
2017
, and the consolidated statements of income, comprehensive income, stockholders' equity and cash flows for each of the three years in the period ended
December 31, 2018
, and the related notes to the consolidated financial statements of the Company and our report dated
February 27, 2019
expressed an unqualified opinion.
Basis for Opinion
The Company’s management is responsible for maintaining effective internal control over financial reporting and for its assessment of the effectiveness of internal control over financial reporting in the accompanying Managements’ Report on Internal Control over Financial Reporting. Our responsibility is to express an opinion on the Company’s internal control over financial reporting based on our audit. We are a public accounting firm registered with the PCAOB and are required to be independent with respect to the Company in accordance with U.S. federal securities laws and the applicable rules and regulations of the Securities and Exchange Commission and the PCAOB.
We conducted our audit in accordance with the standards of the PCAOB. Those standards require that we plan and perform the audit to obtain reasonable assurance about whether effective internal control over financial reporting was maintained in all material respects. Our audit included obtaining an understanding of internal control over financial reporting, assessing the risk that a material weakness exists, and testing and evaluating the design and operating effectiveness of internal control based on the assessed risk. Our audit also included performing such other procedures as we considered necessary in the circumstances. We believe that our audit provides a reasonable basis for our opinion.
Definition and Limitations of Internal Control Over Financial Reporting
A company’s internal control over financial reporting is a process designed to provide reasonable assurance regarding the reliability of financial reporting and the preparation of financial statements for external purposes in accordance with generally accepted accounting principles. A company’s internal control over financial reporting includes those policies and procedures that (1) pertain to the maintenance of records that, in reasonable detail, accurately and fairly reflect the transactions and dispositions of the assets of the company; (2) provide reasonable assurance that transactions are recorded as necessary to permit preparation of financial statements in accordance with generally accepted accounting principles, and that receipts and expenditures of the company are being made only in accordance with authorizations of management and directors of the company; and (3) provide reasonable assurance regarding prevention or timely detection of unauthorized acquisition, use or disposition of the company’s assets that could have a material effect on the financial statements.
Because of its inherent limitations, internal control over financial reporting may not prevent or detect misstatements. Also, projections of any evaluation of effectiveness to future periods are subject to the risk that controls may become inadequate because of changes in conditions, or that the degree of compliance with the policies or procedures may deteriorate.
/s/ RSM US LLP
Des Moines, Iowa
February 27, 2019
55
|
West Bancorporation, Inc. and Subsidiary
Consolidated Balance Sheets
December 31, 2018 and 2017
|
||||||||
|
(dollars in thousands, except per share data)
|
2018
|
2017
|
||||||
|
ASSETS
|
|
|||||||
|
Cash and due from banks
|
$
|
46,369
|
|
$
|
34,952
|
|
||
|
Federal funds sold
|
1,105
|
|
12,997
|
|
||||
|
Cash and cash equivalents
|
47,474
|
|
47,949
|
|
||||
|
Investment securities available for sale, at fair value
|
453,758
|
|
444,219
|
|
||||
|
Investment securities held to maturity, at amortized cost (fair value $45,890 at December 31, 2017)
|
—
|
|
45,527
|
|
||||
|
Federal Home Loan Bank stock, at cost
|
12,037
|
|
9,174
|
|
||||
|
Loans
|
1,721,830
|
|
1,510,500
|
|
||||
|
Allowance for loan losses
|
(16,689
|
)
|
(16,430
|
)
|
||||
|
Loans, net
|
1,705,141
|
|
1,494,070
|
|
||||
|
Premises and equipment, net
|
21,491
|
|
23,022
|
|
||||
|
Accrued interest receivable
|
7,631
|
|
7,344
|
|
||||
|
Bank-owned life insurance
|
34,249
|
|
33,618
|
|
||||
|
Deferred tax assets, net
|
6,518
|
|
4,645
|
|
||||
|
Other assets
|
8,269
|
|
4,809
|
|
||||
|
Total assets
|
$
|
2,296,568
|
|
$
|
2,114,377
|
|
||
|
|
|
|
||||||
|
LIABILITIES AND STOCKHOLDERS’ EQUITY
|
|
|
||||||
|
LIABILITIES
|
|
|
||||||
|
Deposits:
|
|
|
||||||
|
Noninterest-bearing demand
|
$
|
400,530
|
|
$
|
395,888
|
|
||
|
Interest-bearing demand
|
336,089
|
|
395,052
|
|
||||
|
Savings
|
950,501
|
|
850,216
|
|
||||
|
Time of $250 or more
|
55,745
|
|
16,965
|
|
||||
|
Other time
|
151,664
|
|
152,692
|
|
||||
|
Total deposits
|
1,894,529
|
|
1,810,813
|
|
||||
|
Federal funds purchased
|
19,985
|
|
545
|
|
||||
|
Subordinated notes, net
|
20,425
|
|
20,412
|
|
||||
|
Federal Home Loan Bank advances, net
|
137,878
|
|
76,382
|
|
||||
|
Long-term debt
|
27,040
|
|
22,917
|
|
||||
|
Accrued expenses and other liabilities
|
5,688
|
|
5,210
|
|
||||
|
Total liabilities
|
2,105,545
|
|
1,936,279
|
|
||||
|
COMMITMENTS AND CONTINGENCIES (Note 16)
|
|
|
|
|
||||
|
STOCKHOLDERS’ EQUITY
|
|
|
||||||
|
Preferred stock, $0.01 par value; authorized 50,000,000 shares; no shares issued and outstanding at December 31, 2018 and 2017
|
—
|
|
—
|
|
||||
|
Common stock, no par value; authorized 50,000,000 shares; 16,295,494 and 16,215,672 shares issued and outstanding at December 31, 2018 and 2017, respectively
|
3,000
|
|
3,000
|
|
||||
|
Additional paid-in capital
|
25,128
|
|
23,463
|
|
||||
|
Retained earnings
|
169,709
|
|
153,527
|
|
||||
|
Accumulated other comprehensive loss
|
(6,814
|
)
|
(1,892
|
)
|
||||
|
Total stockholders’ equity
|
191,023
|
|
178,098
|
|
||||
|
Total liabilities and stockholders’ equity
|
$
|
2,296,568
|
|
$
|
2,114,377
|
|
||
See Notes to Consolidated Financial Statements.
56
|
West Bancorporation, Inc. and Subsidiary
Consolidated Statements of Income
Years Ended December 31, 2018, 2017 and 2016
|
||||||||||||
|
(dollars in thousands, except per share data)
|
2018
|
2017
|
2016
|
|||||||||
|
Interest income:
|
|
|
||||||||||
|
Loans, including fees
|
$
|
71,189
|
|
$
|
63,242
|
|
$
|
57,419
|
|
|||
|
Investment securities:
|
|
|
||||||||||
|
Taxable
|
8,124
|
|
5,501
|
|
4,201
|
|
||||||
|
Tax-exempt
|
4,993
|
|
3,960
|
|
3,266
|
|
||||||
|
Federal funds sold
|
487
|
|
331
|
|
108
|
|
||||||
|
Total interest income
|
84,793
|
|
73,034
|
|
64,994
|
|
||||||
|
Interest expense:
|
|
|
|
|
||||||||
|
Deposits
|
17,064
|
|
7,622
|
|
3,391
|
|
||||||
|
Federal funds purchased
|
188
|
|
99
|
|
47
|
|
||||||
|
Subordinated notes
|
1,076
|
|
901
|
|
728
|
|
||||||
|
Federal Home Loan Bank advances
|
3,650
|
|
3,836
|
|
3,565
|
|
||||||
|
Long-term debt
|
757
|
|
519
|
|
145
|
|
||||||
|
Total interest expense
|
22,735
|
|
12,977
|
|
7,876
|
|
||||||
|
Net interest income
|
62,058
|
|
60,057
|
|
57,118
|
|
||||||
|
Provision for loan losses
|
(250
|
)
|
—
|
|
1,000
|
|
||||||
|
Net interest income after provision for loan losses
|
62,308
|
|
60,057
|
|
56,118
|
|
||||||
|
Noninterest income:
|
|
|
|
|
||||||||
|
Service charges on deposit accounts
|
2,541
|
|
2,632
|
|
2,461
|
|
||||||
|
Debit card usage fees
|
1,681
|
|
1,754
|
|
1,825
|
|
||||||
|
Trust services
|
1,921
|
|
1,705
|
|
1,310
|
|
||||||
|
Increase in cash value of bank-owned life insurance
|
631
|
|
652
|
|
647
|
|
||||||
|
Gain from bank-owned life insurance
|
—
|
|
307
|
|
443
|
|
||||||
|
Realized investment securities gains (losses), net
|
(263
|
)
|
326
|
|
66
|
|
||||||
|
Other income
|
1,241
|
|
1,272
|
|
1,230
|
|
||||||
|
Total noninterest income
|
7,752
|
|
8,648
|
|
7,982
|
|
||||||
|
Noninterest expense:
|
|
|
|
|
||||||||
|
Salaries and employee benefits
|
18,791
|
|
17,633
|
|
16,731
|
|
||||||
|
Occupancy
|
4,996
|
|
4,406
|
|
4,033
|
|
||||||
|
Data processing
|
2,682
|
|
2,677
|
|
2,510
|
|
||||||
|
FDIC insurance
|
685
|
|
677
|
|
937
|
|
||||||
|
Professional fees
|
840
|
|
1,075
|
|
774
|
|
||||||
|
Director fees
|
1,014
|
|
950
|
|
888
|
|
||||||
|
Write-down of premises
|
333
|
|
—
|
|
—
|
|
||||||
|
Other expenses
|
5,651
|
|
4,849
|
|
5,275
|
|
||||||
|
Total noninterest expense
|
34,992
|
|
32,267
|
|
31,148
|
|
||||||
|
Income before income taxes
|
35,068
|
|
36,438
|
|
32,952
|
|
||||||
|
Income taxes
|
6,560
|
|
13,368
|
|
9,936
|
|
||||||
|
Net income
|
$
|
28,508
|
|
$
|
23,070
|
|
$
|
23,016
|
|
|||
|
Basic earnings per common share
|
$
|
1.75
|
|
$
|
1.42
|
|
$
|
1.43
|
|
|||
|
Diluted earnings per common share
|
$
|
1.74
|
|
$
|
1.41
|
|
$
|
1.42
|
|
|||
See Notes to Consolidated Financial Statements.
57
|
West Bancorporation, Inc. and Subsidiary
Consolidated Statements of Comprehensive Income
Years Ended December 31, 2018, 2017 and 2016
|
||||||||||||
|
(dollars in thousands)
|
2018
|
2017
|
2016
|
|||||||||
|
Net income
|
$
|
28,508
|
|
$
|
23,070
|
|
$
|
23,016
|
|
|||
|
Other comprehensive loss:
|
||||||||||||
|
Unrealized gains (losses) on securities:
|
||||||||||||
|
Unrealized holding losses arising during the period
|
(7,807
|
)
|
(1,124
|
)
|
(2,249
|
)
|
||||||
|
Unrealized gains on investment securities transferred from held to maturity to available for sale
|
363
|
|
—
|
|
—
|
|
||||||
|
Plus: reclassification adjustment for net (gains) losses realized in net income
|
263
|
|
(326
|
)
|
(66
|
)
|
||||||
|
Less: other reclassification adjustment
|
(36
|
)
|
(268
|
)
|
(128
|
)
|
||||||
|
Income tax benefit
|
1,806
|
|
653
|
|
929
|
|
||||||
|
Other comprehensive loss on available for sale securities
|
(5,411
|
)
|
(1,065
|
)
|
(1,514
|
)
|
||||||
|
Unrealized gains (losses) on derivatives:
|
||||||||||||
|
Unrealized holding gains (losses) on derivatives arising during the period
|
1,044
|
|
(66
|
)
|
882
|
|
||||||
|
Plus: reclassification adjustment for net gain on derivatives realized
in net income
|
10
|
|
304
|
|
464
|
|
||||||
|
Plus: reclassification adjustment for amortization of derivative termination costs, realized in interest expense
|
95
|
|
109
|
|
109
|
|
||||||
|
Income tax expense
|
(290
|
)
|
(132
|
)
|
(553
|
)
|
||||||
|
Other comprehensive income on derivatives
|
859
|
|
215
|
|
902
|
|
||||||
|
Total other comprehensive loss
|
(4,552
|
)
|
(850
|
)
|
(612
|
)
|
||||||
|
Comprehensive income
|
$
|
23,956
|
|
$
|
22,220
|
|
$
|
22,404
|
|
|||
See Notes to Consolidated Financial Statements.
58
West Bancorporation, Inc. and Subsidiary
Consolidated Statements of Stockholders’ Equity
Years Ended
December 31, 2018
,
2017
and
2016
|
Accumulated
|
|||||||||||||||||||||||||||
|
Additional
|
Other
|
||||||||||||||||||||||||||
|
Preferred
|
Common Stock
|
Paid-in
|
Retained
|
Comprehensive
|
|||||||||||||||||||||||
|
(in thousands, except share and per share data)
|
Stock
|
Shares
|
Amount
|
Capital
|
Earnings
|
Loss
|
Total
|
||||||||||||||||||||
|
Balance, December 31, 2015
|
$
|
—
|
|
16,064,435
|
|
$
|
3,000
|
|
$
|
20,067
|
|
$
|
129,740
|
|
$
|
(430
|
)
|
$
|
152,377
|
|
|||||||
|
Net income
|
—
|
|
—
|
|
—
|
|
—
|
|
23,016
|
|
—
|
|
23,016
|
|
|||||||||||||
|
Other comprehensive loss, net of tax
|
—
|
|
—
|
|
—
|
|
—
|
|
—
|
|
(612
|
)
|
(612
|
)
|
|||||||||||||
|
Cash dividends declared, $0.67 per common share
|
—
|
|
—
|
|
—
|
|
—
|
|
(10,800
|
)
|
—
|
|
(10,800
|
)
|
|||||||||||||
|
Stock-based compensation costs
|
—
|
|
—
|
|
—
|
|
1,684
|
|
—
|
|
—
|
|
1,684
|
|
|||||||||||||
|
Issuance of common stock upon vesting of restricted stock units, net of shares withheld for payroll taxes
|
—
|
|
73,564
|
|
—
|
|
(394
|
)
|
—
|
|
—
|
|
(394
|
)
|
|||||||||||||
|
Excess tax benefits from vesting of restricted stock units
|
—
|
|
—
|
|
—
|
|
105
|
|
—
|
|
—
|
|
105
|
|
|||||||||||||
|
Balance, December 31, 2016
|
—
|
|
16,137,999
|
|
3,000
|
|
21,462
|
|
141,956
|
|
(1,042
|
)
|
165,376
|
|
|||||||||||||
|
Net income
|
—
|
|
—
|
|
—
|
|
—
|
|
23,070
|
|
—
|
|
23,070
|
|
|||||||||||||
|
Other comprehensive loss, net of tax
|
—
|
|
—
|
|
—
|
|
—
|
|
—
|
|
(850
|
)
|
(850
|
)
|
|||||||||||||
|
Cash dividends declared, $0.71 per common share
|
—
|
|
—
|
|
—
|
|
—
|
|
(11,499
|
)
|
—
|
|
(11,499
|
)
|
|||||||||||||
|
Stock-based compensation costs
|
—
|
|
—
|
|
—
|
|
2,632
|
|
—
|
|
—
|
|
2,632
|
|
|||||||||||||
|
Issuance of common stock upon vesting of restricted stock units, net of shares withheld for payroll taxes
|
—
|
|
77,673
|
|
—
|
|
(631
|
)
|
—
|
|
—
|
|
(631
|
)
|
|||||||||||||
|
Balance, December 31, 2017
|
—
|
|
16,215,672
|
|
3,000
|
|
23,463
|
|
153,527
|
|
(1,892
|
)
|
178,098
|
|
|||||||||||||
|
Reclassification of stranded tax effects of rate change
|
—
|
|
—
|
|
—
|
|
—
|
|
370
|
|
(370
|
)
|
—
|
|
|||||||||||||
|
Net income
|
—
|
|
—
|
|
—
|
|
—
|
|
28,508
|
|
—
|
|
28,508
|
|
|||||||||||||
|
Other comprehensive loss, net of tax
|
—
|
|
—
|
|
—
|
|
—
|
|
—
|
|
(4,552
|
)
|
(4,552
|
)
|
|||||||||||||
|
Cash dividends declared, $0.78 per common share
|
—
|
|
—
|
|
—
|
|
—
|
|
(12,696
|
)
|
—
|
|
(12,696
|
)
|
|||||||||||||
|
Stock-based compensation costs
|
—
|
|
—
|
|
—
|
|
2,741
|
|
—
|
|
—
|
|
2,741
|
|
|||||||||||||
|
Issuance of common stock upon vesting of restricted stock units, net of shares withheld for payroll taxes
|
—
|
|
79,822
|
|
—
|
|
(1,076
|
)
|
—
|
|
—
|
|
(1,076
|
)
|
|||||||||||||
|
Balance, December 31, 2018
|
$
|
—
|
|
16,295,494
|
|
$
|
3,000
|
|
$
|
25,128
|
|
$
|
169,709
|
|
$
|
(6,814
|
)
|
$
|
191,023
|
|
|||||||
See Notes to Consolidated Financial Statements.
59
|
West Bancorporation, Inc. and Subsidiary
Consolidated Statements of Cash Flows
Years Ended December 31, 2018, 2017 and 2016
|
||||||||||||
|
(dollars in thousands)
|
2018
|
2017
|
2016
|
|||||||||
|
Cash Flows from Operating Activities:
|
|
|
||||||||||
|
Net income
|
$
|
28,508
|
|
$
|
23,070
|
|
$
|
23,016
|
|
|||
|
Adjustments to reconcile net income to net cash provided by
operating activities:
|
||||||||||||
|
Provision for loan losses
|
(250
|
)
|
—
|
|
1,000
|
|
||||||
|
Net amortization and accretion
|
4,945
|
|
4,155
|
|
4,290
|
|
||||||
|
Investment securities (gains) losses, net
|
263
|
|
(326
|
)
|
(66
|
)
|
||||||
|
Stock-based compensation
|
2,741
|
|
2,632
|
|
1,684
|
|
||||||
|
Increase in cash value of bank-owned life insurance
|
(631
|
)
|
(652
|
)
|
(647
|
)
|
||||||
|
Gain from bank-owned life insurance
|
—
|
|
(307
|
)
|
(443
|
)
|
||||||
|
Depreciation
|
1,408
|
|
1,347
|
|
1,046
|
|
||||||
|
Write-down of premises
|
333
|
|
—
|
|
—
|
|
||||||
|
Deferred income taxes
|
(359
|
)
|
2,833
|
|
89
|
|
||||||
|
Change in assets and liabilities:
|
|
|
||||||||||
|
Increase in accrued interest receivable
|
(287
|
)
|
(2,023
|
)
|
(633
|
)
|
||||||
|
(Increase) decrease in other assets
|
(2,490
|
)
|
131
|
|
(85
|
)
|
||||||
|
Increase (decrease) in accrued expenses and other liabilities
|
563
|
|
(1,503
|
)
|
1,047
|
|
||||||
|
Net cash provided by operating activities
|
34,744
|
|
29,357
|
|
30,298
|
|
||||||
|
Cash Flows from Investing Activities:
|
|
|
|
|
||||||||
|
Proceeds from sales of investment securities available for sale
|
75,401
|
|
108,584
|
|
3,054
|
|
||||||
|
Proceeds from maturities and calls of investment securities
|
45,937
|
|
47,781
|
|
58,358
|
|
||||||
|
Purchases of investment securities available for sale
|
(96,170
|
)
|
(341,012
|
)
|
(3,500
|
)
|
||||||
|
Purchases of Federal Home Loan Bank stock
|
(16,334
|
)
|
(19,414
|
)
|
(17,407
|
)
|
||||||
|
Proceeds from redemption of Federal Home Loan Bank stock
|
13,471
|
|
21,011
|
|
19,083
|
|
||||||
|
Net increase in loans
|
(210,821
|
)
|
(110,312
|
)
|
(153,037
|
)
|
||||||
|
Purchases of premises and equipment
|
(210
|
)
|
(1,055
|
)
|
(12,802
|
)
|
||||||
|
Proceeds of principal and earnings from bank-owned life insurance
|
—
|
|
452
|
|
812
|
|
||||||
|
Net cash used in investing activities
|
(188,726
|
)
|
(293,965
|
)
|
(105,439
|
)
|
||||||
|
Cash Flows from Financing Activities:
|
||||||||||||
|
Net increase in deposits
|
83,716
|
|
264,208
|
|
105,876
|
|
||||||
|
Net increase (decrease) in federal funds purchased
|
19,440
|
|
(9,145
|
)
|
(12,070
|
)
|
||||||
|
Proceeds from long-term debt
|
11,486
|
|
22,000
|
|
—
|
|
||||||
|
Proceeds from Federal Home Loan Bank advances
|
60,000
|
|
—
|
|
—
|
|
||||||
|
Principal payments on long-term debt
|
(7,363
|
)
|
(4,212
|
)
|
(3,286
|
)
|
||||||
|
Principal payments on Federal Home Loan Bank advances
|
—
|
|
(25,000
|
)
|
—
|
|
||||||
|
Common stock dividends paid
|
(12,696
|
)
|
(11,499
|
)
|
(10,800
|
)
|
||||||
|
Restricted stock units withheld for payroll taxes
|
(1,076
|
)
|
(631
|
)
|
(394
|
)
|
||||||
|
Net cash provided by financing activities
|
153,507
|
|
235,721
|
|
79,326
|
|
||||||
|
Net increase (decrease) in cash and cash equivalents
|
(475
|
)
|
(28,887
|
)
|
4,185
|
|
||||||
|
Cash and Cash Equivalents:
|
||||||||||||
|
Beginning
|
47,949
|
|
76,836
|
|
72,651
|
|
||||||
|
Ending
|
$
|
47,474
|
|
$
|
47,949
|
|
$
|
76,836
|
|
|||
|
Supplemental Disclosure of Cash Flow Information:
|
||||||||||||
|
Cash payments for:
|
||||||||||||
|
Interest
|
$
|
22,154
|
|
$
|
12,520
|
|
$
|
7,940
|
|
|||
|
Income taxes
|
7,312
|
|
9,300
|
|
7,870
|
|
||||||
See Notes to Consolidated Financial Statements.
60
West Bancorporation, Inc. and Subsidiary
Notes to Consolidated Financial Statements
(dollars in thousands, except per share data)
Note 1. Organization and Nature of Business and Summary of Significant Accounting Policies
Organization and nature of business
: West Bancorporation, Inc. operates in the commercial banking industry through its wholly-owned subsidiary, West Bank. West Bank is a state chartered bank and has its main office in West Des Moines, Iowa, with
seven
additional offices located in the Des Moines, Iowa, metropolitan area,
one
office located in Coralville, Iowa, and
one
office located in Rochester, Minnesota. As used herein, the term “Company” refers to West Bancorporation, Inc., or if the context dictates, West Bancorporation, Inc. and its subsidiary.
Significant accounting policies
:
Accounting estimates and assumptions
: The consolidated financial statements have been prepared in conformity with U.S. generally accepted accounting principles (GAAP) established by the Financial Accounting Standards Board (FASB). References to GAAP issued by the FASB in these footnotes are to the FASB
Accounting Standards Codification
TM
, sometimes referred to as the Codification or ASC. In preparing the consolidated financial statements, management is required to make estimates and assumptions that affect the reported amounts of assets and liabilities, disclosure of contingent assets and liabilities at the date of the financial statements, and the reported amounts of revenue and expenses for the reporting period. Actual results could differ from those estimates. Material estimates that are particularly susceptible to significant change in the near term are the fair value of financial instruments and the allowance for loan losses.
Consolidation policy
: The consolidated financial statements include the accounts of the Company, West Bank and West Bank’s special purpose subsidiaries (which facilitate an investment in new market tax credit activity in 2018) and WB Funding Corporation (which was liquidated in March 2018). All significant intercompany transactions and balances have been eliminated in consolidation. In addition, the Company owns an unconsolidated subsidiary, West Bancorporation Capital Trust I (the Trust), which was formed for the purpose of issuing trust preferred securities. In accordance with GAAP, the results of the Trust are recorded on the books of the Company using the equity method of accounting and are not consolidated.
Segment information:
An operating segment is generally defined as a component of a business for which discrete financial information is available and whose operating results are regularly reviewed by the chief operating decision-maker. As a community-oriented financial institution, substantially all of West Bank’s operations involve the delivery of loan and deposit products to customers. Management makes operating decisions and assesses performance based on an ongoing review of the community banking activities, which constitutes the Company’s only operating segment for financial reporting purposes.
Comprehensive income
: Comprehensive income consists of net income and other comprehensive income (OCI). OCI consists of the net change in unrealized gains and losses on the Company’s investment securities available for sale, including the noncredit-related portion of unrealized gains (losses) of other than temporarily impaired (OTTI) securities, if any, and the effective portion of the change in fair value of derivative instruments. OCI also includes the amortization of derivative termination costs and the amortization of unrealized gains on investment securities transferred from available for sale to held to maturity.
Cash and cash equivalents and cash flows
: For statement of cash flow purposes, the Company considers cash, due from banks and federal funds sold to be cash and cash equivalents. Cash inflows and outflows from loans, deposits and federal funds purchased are reported on a net basis.
Investment securities
: Investment securities that management has the intent and ability to hold to maturity are classified as held to maturity and reported at amortized cost. Investment securities that may be sold for general liquidity needs, in response to market interest rate fluctuations, implementation of asset-liability management strategies, funding loan demand, changes in securities prepayment risk or other similar factors are classified as available for sale and reported at fair value, with unrealized gains and losses reported as a separate component of accumulated other comprehensive income (AOCI), net of deferred income taxes. Realized gains and losses on sales of investment securities are computed on a specific identification basis based on amortized cost.
61
West Bancorporation, Inc. and Subsidiary
Notes to Consolidated Financial Statements
(dollars in thousands, except per share data)
The amortized cost of debt securities classified as held to maturity or available for sale is adjusted for accretion of discounts to maturity and amortization of premiums over the estimated average life of each security or, in the case of callable securities, through the first call date, using the effective yield method. Such amortization and accretion is included in interest income. Interest income on securities is recognized using the interest method according to the terms of the investment security.
The Company evaluates each of its investment securities whose value has declined below amortized cost to determine whether the decline in fair value is OTTI. When determining whether an investment security is OTTI, management assesses the severity and duration of the decline in fair value, the length of time expected for recovery, the financial condition of the issuer and other qualitative factors, as well as whether: (a) it has the intent to sell the security, and (b) it is more likely than not that it will be required to sell the security prior to its anticipated recovery. In instances when a determination is made that an OTTI exists but management does not intend to sell the security and it is not more likely than not that it will be required to sell the security prior to its anticipated repayment or maturity, the OTTI is separated into: (a) the amount of the total OTTI related to a decrease in cash flows expected to be collected from the security (the credit loss); and (b) the amount of the total OTTI related to all other factors. The amount of the total OTTI related to the credit loss is recognized as a charge to earnings. The amount of the total OTTI related to all other factors is recognized in OCI. If the Company intends to sell or it is more likely than not that it will be required to sell a security with OTTI before recovery of its amortized cost basis, the OTTI is recognized in earnings equal to the entire difference between the investment’s amortized cost basis and its fair value at the balance sheet date.
Federal Home Loan Bank stock
: West Bank, as a member of the Federal Home Loan Bank (FHLB) system, is required to maintain an investment in capital stock of the FHLB in an amount equal to
0.12 percent
of total assets plus
4.00 percent
of outstanding advances from the FHLB and the outstanding principal balance of loans previously issued through the Mortgage Partnership Finance Program (MPF). No ready market exists for the FHLB stock, and it has
no
quoted market value. The Company evaluates this asset for impairment on a quarterly basis and determined there was no impairment as of
December 31, 2018
. All shares of FHLB stock are issued and redeemed at par value.
Loans
: Loans are stated at the principal amounts outstanding, net of unamortized loan fees and costs, with interest income recognized on the interest method based upon the terms of the loan. Loan origination fees, net of certain direct origination costs, are deferred and recognized as an adjustment of the related loan yield using the interest method. Loans are reported by the portfolio segments identified and are analyzed by management on this basis. All loan policies identified below apply to all segments of the loan portfolio.
Delinquencies are determined based on the payment terms of the individual loan agreements. The accrual of interest on past due and other impaired loans is generally discontinued at 90 days past due or when, in the opinion of management, the borrower may be unable to make all payments pursuant to contractual terms. Unless considered collectible, all interest accrued but not collected for loans that are placed on nonaccrual or charged off is reversed against interest income, if accrued in the current year, or charged to the allowance for loan losses, if accrued in the prior year. Generally, all payments received while a loan is on nonaccrual status are applied to the principal balance of the loan. Loans are returned to accrual status when all principal and interest amounts contractually due are brought current and future payments are reasonably assured.
A loan is classified as troubled debt restructured (TDR) when the Company separately concludes that a borrower is experiencing financial difficulties and a concession is granted that would not otherwise be considered. Concessions may include a restructuring of the loan terms to alleviate the burden of the borrower’s cash requirements, such as an extension of the payment terms beyond the original maturity date or a change in the interest rate charged. TDR loans with extended payment terms are accounted for as impaired until performance is established. A change to the interest rate would change the classification of a loan to a TDR loan if the restructured loan yields a rate that is below a market rate for that of a new loan with comparable risk. TDR loans with below market rates are considered impaired until fully collected. TDR loans may also be reported as nonaccrual or 90 days past due if they are not performing per the restructured terms.
62
West Bancorporation, Inc. and Subsidiary
Notes to Consolidated Financial Statements
(dollars in thousands, except per share data)
Based upon its ongoing assessment of credit quality within the loan portfolio, the Company maintains a Watch List, which includes loans classified as Doubtful, Substandard and Watch according to the Company’s classification criteria. These loans involve the anticipated potential for payment defaults or collateral inadequacies. A loan on the Watch List is considered impaired when management believes it is probable the Company will be unable to collect all contractual principal and interest payments due in accordance with the terms of the loan agreement. Impaired loans are measured based on the present value of expected future cash flows discounted at the loan’s effective interest rate or, as a practical expedient, at the loan’s observable market price or the fair value of the collateral if the loan is collateral dependent. The amount of impairment, if any, and any subsequent changes are included in the allowance for loan losses.
Allowance for loan losses
: The allowance for loan losses is established through a provision for loan losses charged to expense. The allowance is an amount that management believes will be adequate to absorb probable losses on existing loans based on an evaluation of the collectability of loans and prior loss experience. This evaluation also takes into consideration such factors as changes in the nature and volume of the loan portfolio, overall portfolio quality, the review of specific problem loans, and current economic conditions that may affect the borrowers’ ability to pay. Loans are charged off against the allowance for loan losses when management believes that collectability of the principal is unlikely. While management uses the best information available to make its evaluations, future adjustments to the allowance may be necessary if there are significant changes in economic conditions or the other factors relied upon.
The allowance for loan losses consists of specific and general components. The specific component relates to loans that meet the definition of impaired. The general component covers the remaining loans and is based on historical loss experience adjusted for qualitative factors such as delinquency trends, loan growth, economic elements and local market conditions. These same policies are applied to all segments of loans. In addition, regulatory agencies, as integral parts of their examination processes, periodically review the Company’s allowance for loan losses, and may require the Company to make additions to the allowance based on their judgment about information available to them at the time of their examinations.
Premises and equipment
: Premises and equipment are stated at cost less accumulated depreciation. The straight-line method of depreciation and amortization is used for calculating expense. The estimated useful lives of premises and equipment range up to
40 years
for buildings, up to
10 years
for furniture and equipment, and the shorter of the estimated useful life or lease term for leasehold improvements.
Other real estate owned
: Real estate properties acquired through or in lieu of foreclosure are initially recorded at fair value less estimated selling cost at the date of foreclosure, establishing a new cost basis. Fair value is determined by management by obtaining appraisals or other market value information at the time of foreclosure. Any write-downs in value at the date of acquisition are charged to the allowance for loan losses. After foreclosure, valuations are periodically performed by management by obtaining updated appraisals or other market value information at least annually. Any subsequent write-downs are recorded as a charge to operations, if necessary, to reduce the carrying value of a property to the updated fair value less estimated selling cost. Net costs related to the holding of properties are included in noninterest expense. As of
December 31, 2018
and
2017
, the Company had
no
other real estate owned.
Trust assets
: Assets held by West Bank in fiduciary or agency capacities, other than trust cash on deposit at West Bank, are not included in the consolidated balance sheets of the Company, as such assets are not assets of West Bank. The Company managed or administered accounts with assets totaling
$300,722
as of
December 31, 2018
, compared to assets totaling
$306,974
as of
December 31, 2017
.
Bank-owned life insurance
: The carrying amount of bank-owned life insurance consists of the initial premium paid, plus increases in cash value, less the carrying amount associated with any death benefit received. Death benefits paid in excess of the applicable carrying amount are recognized as income. Increases in cash value and the portion of death benefits recognized as income are exempt from income taxes.
63
West Bancorporation, Inc. and Subsidiary
Notes to Consolidated Financial Statements
(dollars in thousands, except per share data)
Derivatives:
The Company uses derivative financial instruments (which consist of interest rate swaps) to assist in its interest rate risk management. All derivatives are measured and reported at fair value on the Company’s consolidated balance sheet as other assets or other liabilities. The Company records cash flow hedges at the inception of the derivative contract based on the Company’s intentions and belief as to likely effectiveness as a hedge. The Company documents the strategy for entering into the transactions and the method of assessing ongoing effectiveness. Cash flow hedges represent a hedge of a forecasted transaction or the variability of cash flows to be received or paid related to a recognized asset or liability. For a cash flow hedge that is effective, the gain or loss on the derivative is reported in other comprehensive income and is reclassified into earnings in the same periods during which the hedged transaction affects earnings. The changes in the fair value of derivatives that are not highly effective in hedging the changes in expected cash flows of the hedged item are recognized immediately in current earnings. All of the Company’s cash flow hedges qualify for hedge accounting and are considered highly effective.
Net cash settlements on derivatives that qualify for hedge accounting are recorded in interest income or interest expense, based on the item being hedged. Cash flows on hedges are classified in the cash flow statement the same as the cash flows of the items being hedged. To determine fair value, the Company uses third party pricing models that incorporate assumptions about market conditions and risks that are current at the reporting date. The Company does not use derivative instruments for trading or speculative purposes.
The Company formally assesses, both at the hedge’s inception and on an ongoing basis, whether the derivative instruments that are used are highly effective in offsetting changes in cash flows of the hedged items. The Company discontinues hedge accounting when it determines that the derivative is no longer effective in offsetting changes in the fair value or cash flows of the hedged item, the derivative is settled or terminates, a hedged forecasted transaction is no longer probable, a hedged firm commitment is no longer firm, or treatment of the derivative as a hedge is no longer appropriate or intended.
When hedge accounting is discontinued, subsequent changes in fair value of the derivative are recorded as noninterest income. When a cash flow hedge is discontinued but the hedged cash flows or forecasted transactions are still expected to occur, gains or losses that were accumulated in other comprehensive income are amortized into earnings over the same periods in which the hedged transactions will affect earnings.
Stock-based compensation:
The Company’s current and previous equity incentive plans were approved by the stockholders as a means to attract, retain and reward selected participants. The plans are administered by the Compensation Committee of the Board of Directors. Compensation expense for stock-based awards is recognized on a straight-line basis over the vesting period, or until the participant reaches full retirement age if less than the vesting period, using the fair value of the award at the time of the grant. The restricted stock unit (RSU) participants do not have dividend rights prior to vesting, so the fair value of nonvested RSUs is equal to the fair market value of the underlying common stock at the grant date, reduced by the present value of the dividends expected to be paid on the underlying shares during the vesting period. Prior to January 1, 2017, the Company assumed
no
projected forfeitures on its stock-based compensation, since all RSUs were expected to vest and
no
forfeitures had occurred as of December 31, 2016. Upon adoption of ASU No. 2016-09, Compensation - Stock Compensation (Topic 718) on January 1, 2017, the Company made the accounting policy election to account for forfeitures as they occur.
Deferred compensation:
The West Bancorporation, Inc. Deferred Compensation Plan (the Deferred Compensation Plan) provides certain individuals with additional deferral opportunities in planning for retirement. Eligible participants, including directors and key officers of the Company, may choose to voluntarily defer receipt of a portion of their respective cash compensation. The Deferred Compensation Plan is an unfunded, nonqualified deferred compensation plan intended to conform to the requirements of Section 409A of the Internal Revenue Code. As of
December 31, 2018
, no individuals had chosen to participate in the Plan.
Transfer of financial assets
: Transfers of financial assets are accounted for as sales when control over the assets has been surrendered. Control over transferred assets is deemed to be surrendered when the assets have been isolated from the Company, the transferee obtains the right, free of conditions that constrain it from taking advantage of that right, to pledge or exchange the transferred assets, and the Company does not maintain effective control over the transferred assets through an agreement to repurchase them before their maturity.
64
West Bancorporation, Inc. and Subsidiary
Notes to Consolidated Financial Statements
(dollars in thousands, except per share data)
Income taxes
: The Company files a consolidated federal income tax return. Income tax expense is generally allocated as if the Company and its subsidiary file separate income tax returns. Deferred taxes are provided on an asset and liability method whereby deferred tax assets are recognized for deductible temporary differences, capital losses and net operating losses, and deferred tax liabilities are recognized for taxable temporary differences. Temporary differences are the differences between the reported amounts of assets and liabilities and their tax basis. Deferred tax assets are reduced by a valuation allowance when, in the opinion of management, it is more likely than not that some portion or all of the deferred tax assets will not be realized. Deferred tax assets and liabilities are measured using enacted tax rates expected to apply to taxable income in the years in which those temporary differences are expected to be recovered or settled. The effect on deferred tax assets and liabilities of a change in tax rates is recognized in income in the period that includes the enactment date.
When tax returns are filed, it is highly certain that some tax positions taken will be sustained upon examination by the taxing authorities, while others are subject to uncertainty about the merits of the positions taken or the amount of the position that would be ultimately sustained. The benefit of a tax position is recognized in the consolidated financial statements in the period during which, based on all available evidence, management believes it is more likely than not that the position will be sustained upon examination, including the resolution of appeals or litigation processes, if any. The evaluation of a tax position taken is considered by itself and is not offset or aggregated with other positions. Tax positions that meet the more likely than not recognition threshold are measured as the largest amount of tax benefit that is more than 50 percent likely of being realized upon settlement with the applicable taxing authority. Management does not believe the Company has any material uncertain tax positions to disclose.
Interest and penalties, if any, related to income taxes are recorded as other noninterest expense in the consolidated income statements in the year assessed.
Earnings per common share
: Basic earnings per common share are computed by dividing net income by the weighted average number of common shares outstanding for the period. Diluted earnings per common share reflect the potential dilution that could occur if the Company’s outstanding RSUs were vested. The dilutive effect is computed using the treasury stock method, which assumes all stock-based awards were exercised and the hypothetical proceeds from exercise were used by the Company to purchase common stock at the average market price during the period.
Current accounting developments
: In May 2014, the FASB issued ASU No. 2014-09, Revenue from Contracts with Customers (Topic 606). The guidance in this update supersedes the revenue recognition requirements in ASC Topic 605, Revenue Recognition, and most industry-specific guidance throughout the industry topics of the Codification. The core principle is that a company should recognize revenue to depict the transfer of promised goods and services to customers in an amount that reflects the consideration to which the entity expects to be entitled in exchange for those goods and services. For public companies, this update was effective for interim and annual periods beginning after December 15, 2017. The Company adopted the guidance effective January 1, 2018, using the modified retrospective method. The implementation of the new standard did not result in a change to the accounting for any in-scope revenue streams; as such, no cumulative effect adjustment to opening retained earnings was recorded. The Company's revenue is primarily composed of interest income on financial instruments, including investment securities and loans, which are excluded from the scope of Topic 606. Also excluded from the scope of the update is revenue from bank-owned life insurance, loan fees and letter of credit fees. Approximately 90 percent of the Company’s revenue is outside the scope of this update. Topic 606 is applicable to deposit account related fees, including general service fees charged for deposit account maintenance and activity and transaction-based fees charged for certain services, such as debit card, wire transfer or overdraft activities. Revenue is recognized when the performance obligation is completed, which is generally after a transaction is completed or monthly for account maintenance services. Topic 606 is also applicable to trust services, which include periodic fees earned from trusts and investment management agency accounts, estate administration, custody accounts, individual retirement accounts, and other related services. Fees are charged based on standard agreements or by statute and are recognized over the period of time the Company provides the contracted services.
65
West Bancorporation, Inc. and Subsidiary
Notes to Consolidated Financial Statements
(dollars in thousands, except per share data)
In January 2016, the FASB issued ASU No. 2016-01, Financial Instruments—Overall (Subtopic 825-10):
Recognition and Measurement of Financial Assets and Financial Liabilities.
The update enhances the reporting model for financial instruments to provide users of financial statements with more decision-useful information by updating certain aspects of recognition, measurement, presentation and disclosure of financial instruments. Among other changes, the update requires public business entities to use the exit price notion when measuring the fair value of financial instruments for disclosure purposes, and clarifies that entities should evaluate the need for a valuation allowance on a deferred tax asset related to available for sale securities in combination with the entities' other deferred tax assets. For public companies, this update was effective for interim and annual periods beginning after December 15, 2017. The Company adopted the guidance effective January 1, 2018, using the modified retrospective method. Upon adoption, the fair value of the Company’s loan portfolio is now presented using an exit price method. Also, the Company is no longer required to disclose the methodologies used for estimating fair value of financial assets and liabilities that are not measured at fair value on a recurring or nonrecurring basis. The remaining requirements of this update did not have a material impact on the Company’s consolidated financial statements.
In February 2016, the FASB issued ASU No. 2016-02, Leases (Topic 842). The guidance in the update supersedes the requirements in ASC Topic 840, Leases. The guidance is intended to increase transparency and comparability among organizations by recognizing lease assets and lease liabilities on the balance sheet for leases with terms of more than 12 months. For public companies, this update will be effective for interim and annual periods beginning after December 15, 2018. In July 2018, the FASB issued ASU No. 2018-11, Targeted Improvements, which amends ASC 842, Leases to provide for an adoption option that will not require earlier periods to be restated at the adoption date. The Company currently leases its main location and space for six other branch offices and operational departments under operating leases that will result in recognition of lease assets and lease liabilities on the consolidated balance sheets under the updates. The Company adopted this guidance effective January 1, 2019 and recorded a right-of-use asset of
$9,604
and lease liability of
$9,841
.
In June 2016, the FASB issued ASU No. 2016-13, Financial Instruments—Credit Losses (Topic 326). The amendments in this update require a financial asset (or a group of financial assets) measured at amortized cost basis to be presented at the net amount expected to be collected. The allowance for credit losses is a valuation account that is deducted from the amortized cost basis of the financial assets to present the net carrying value at the amount expected to be collected on the financial assets. Under the updates, the income statement will reflect the measurement of credit losses for newly recognized financial assets, as well as the expected increases or decreases of expected credit losses that have taken place during the period. The measurement of expected credit losses is based on relevant information about past events, including historical experience, current conditions, and reasonable and supportable forecasts that affect the collectibility of the reported amount of financial assets. An entity must use judgment in determining the relevant information and estimation methods that are appropriate in its circumstances. The allowance for credit losses for purchased financial assets with a more-than-insignificant amount of credit deterioration since origination that are measured at amortized cost basis is determined in a similar manner to other financial assets measured at amortized cost basis; however, the initial allowance for credit losses is added to the purchase price rather than being reported as a credit loss expense. Only subsequent changes in the allowance for credit losses are recorded as a credit loss expense for these assets. Off-balance-sheet arrangements such as commitments to extend credit, guarantees, and standby letters of credit that are not considered derivatives under ASC 815 and are not unconditionally cancellable are also within the scope of this update. Credit losses relating to available for sale debt securities should be recorded through an allowance for credit losses. For public companies, the update is effective for annual periods beginning after December 15, 2019, including interim periods within those fiscal years. All entities may adopt the amendments in this update earlier as of fiscal years beginning after December 15, 2018, including interim periods within those fiscal years. An entity will apply the amendments in this update on a modified retrospective basis through a cumulative-effect adjustment to retained earnings as of the beginning of the first reporting period in which the guidance is effective. The Company does not plan to early adopt this standard, but is working through implementation. The Company continues collecting and retaining historical loan and credit data and is currently evaluating various loss estimation models. While we currently cannot reasonably estimate the impact of adopting this standard, we expect the impact will be influenced by the composition, characteristics and quality of our loan and securities portfolios, as well as the general economic conditions and forecasts as of the adoption date.
66
West Bancorporation, Inc. and Subsidiary
Notes to Consolidated Financial Statements
(dollars in thousands, except per share data)
In August 2017, the FASB issued ASU No. 2017-12, Derivatives and Hedging (Topic 815):
Targeted Improvements to Accounting for Hedging Activities
. The amendments in this update make targeted changes to the existing hedge accounting model to better align the accounting rules with a company’s risk management activities, and to simplify the application of the hedge accounting model. The update expands the types of transactions eligible for hedge accounting, eliminates the requirement to separately measure and present hedge ineffectiveness, and simplifies the way assessments of hedge ineffectiveness may be performed. The update also permits a one-time reclassification of prepayable debt securities from held to maturity classification to available for sale. For public companies, the update is effective for annual periods beginning after December 15, 2018, with early adoption permitted, including in an interim period. The amendments’ presentation and disclosure guidance is required on a prospective basis. The Company adopted the guidance effective January 1, 2018. The requirements of this update related to the Company’s hedging activities did not have any impact on the Company’s consolidated financial statements. Upon adoption, the Company elected to transfer all its held to maturity securities portfolio to available for sale. The transferred securities had an amortized cost basis of
$45,527
and a fair value of
$45,890
. Upon transfer, the Company recorded an adjustment of
$273
to accumulated other comprehensive income (loss), net of deferred income taxes, for the unrealized gains and losses related to the transferred securities.
In February 2018, the FASB issued ASU No. 2018-02, Income Statement - Reporting Comprehensive Income (Topic 220):
Reclassification of Certain Tax Effects from Accumulated Other Comprehensive Income.
The amendment in this update allows a reclassification from accumulated other comprehensive income to retained earnings for stranded tax effects resulting from the December 22, 2017, enactment of Public Law 115-97, commonly known as the Tax Cut and Jobs Act (Tax Act), which reduced the federal corporate income tax rate and became effective in 2018. For public companies, the update is effective for annual periods beginning after December 15, 2018, with early adoption permitted. The amendment can be adopted at the beginning of the period or on a retrospective basis. The Company adopted the amendment effective January 1, 2018, using the beginning of period method. The reclassified amount was
$370
.
In August 2018, the FASB issued ASU No. 2018-13, Fair Value Measurement (Topic 820):
Disclosure Framework - Changes to the Disclosure Requirements for Fair Value Measurement
. The amendments in this update modify the disclosure requirements for fair value measurements by removing, modifying, or adding certain disclosures. The update is effective for interim and annual periods in fiscal years beginning after December 15, 2019, with early adoption permitted for the removed disclosures and delayed adoption until the fiscal year 2020 permitted for the new disclosures. The removed and modified disclosures will be adopted on a retrospective basis, and the new disclosures will be adopted on a prospective basis. The adoption will not have a material effect on the Company’s consolidated financial statements.
Note 2. Earnings per Common Share
The calculation of earnings per common share and diluted earnings per common share is presented below for the years ended
December 31, 2018
,
2017
and
2016
.
|
(in thousands, except per share data)
|
2018
|
2017
|
2016
|
||||||||
|
Net income
|
$
|
28,508
|
|
$
|
23,070
|
|
$
|
23,016
|
|
||
|
|
|
|
|
|
|
|
|||||
|
Weighted average common shares outstanding
|
16,275
|
|
16,194
|
|
16,117
|
|
|||||
|
Weighted average effect of restricted stock units outstanding
|
125
|
|
141
|
|
54
|
|
|||||
|
Diluted weighted average common shares outstanding
|
16,400
|
|
16,335
|
|
16,171
|
|
|||||
|
|
|
|
|
|
|
|
|||||
|
Basic earnings per common share
|
$
|
1.75
|
|
$
|
1.42
|
|
$
|
1.43
|
|
||
|
Diluted earnings per common share
|
$
|
1.74
|
|
$
|
1.41
|
|
$
|
1.42
|
|
||
|
Number of anti-dilutive common stock equivalents excluded from diluted earnings per share computation
|
103
|
|
—
|
|
102
|
|
|||||
67
West Bancorporation, Inc. and Subsidiary
Notes to Consolidated Financial Statements
(dollars in thousands, except per share data)
Note 3. Investment Securities
The following tables show the amortized cost, gross unrealized gains and losses and fair value of investment securities, by investment security type as of
December 31, 2018
and
2017
.
|
|
2018
|
||||||||||||||
|
|
Amortized
Cost
|
Gross Unrealized
Gains
|
Gross Unrealized
Losses
|
Fair
Value
|
|||||||||||
|
Securities available for sale:
|
|||||||||||||||
|
State and political subdivisions
|
$
|
152,293
|
|
$
|
156
|
|
$
|
(3,293
|
)
|
$
|
149,156
|
|
|||
|
Collateralized mortgage obligations
(1)
|
161,392
|
|
—
|
|
(4,388
|
)
|
157,004
|
|
|||||||
|
Mortgage-backed securities
(1)
|
64,813
|
|
—
|
|
(1,435
|
)
|
63,378
|
|
|||||||
|
Asset-backed securities
(2)
|
32,076
|
|
2
|
|
(175
|
)
|
31,903
|
|
|||||||
|
Trust preferred security
|
2,153
|
|
—
|
|
(253
|
)
|
1,900
|
|
|||||||
|
Corporate notes
|
51,862
|
|
124
|
|
(1,569
|
)
|
50,417
|
|
|||||||
|
|
$
|
464,589
|
|
$
|
282
|
|
$
|
(11,113
|
)
|
$
|
453,758
|
|
|||
|
|
2017
|
||||||||||||||
|
|
Amortized
Cost
|
Gross Unrealized
Gains
|
Gross Unrealized
Losses
|
Fair
Value
|
|||||||||||
|
Securities available for sale:
|
|||||||||||||||
|
State and political subdivisions
|
$
|
146,331
|
|
$
|
928
|
|
$
|
(946
|
)
|
$
|
146,313
|
|
|||
|
Collateralized mortgage obligations
(1)
|
162,631
|
|
28
|
|
(2,727
|
)
|
159,932
|
|
|||||||
|
Mortgage-backed securities
(1)
|
60,956
|
|
20
|
|
(547
|
)
|
60,429
|
|
|||||||
|
Asset-backed securities
(2)
|
45,539
|
|
8
|
|
(352
|
)
|
45,195
|
|
|||||||
|
Trust preferred security
|
2,134
|
|
—
|
|
(128
|
)
|
2,006
|
|
|||||||
|
Corporate notes
|
30,278
|
|
331
|
|
(265
|
)
|
30,344
|
|
|||||||
|
|
$
|
447,869
|
|
$
|
1,315
|
|
$
|
(4,965
|
)
|
$
|
444,219
|
|
|||
|
Securities held to maturity:
|
|||||||||||||||
|
State and political subdivisions
|
$
|
45,527
|
|
$
|
460
|
|
$
|
(97
|
)
|
$
|
45,890
|
|
|||
|
(1)
|
All collateralized mortgage obligations and mortgage-backed securities consist of residential mortgage pass-through securities and real estate mortgage investment conduits guaranteed by FNMA, FHLMC or GNMA, and commercial mortgage pass-through securities guaranteed by the SBA.
|
|
(2)
|
Pass-through asset-backed securities guaranteed by the SBA, representing participating interests in pools of commercial working capital and equipment loans.
|
Investment securities with an amortized cost of approximately
$126,531
and
$120,338
as of
December 31, 2018
and
2017
, respectively, were pledged to secure access to the Federal Reserve discount window, for public fund deposits, and for other purposes as required or permitted by law or regulation.
68
West Bancorporation, Inc. and Subsidiary
Notes to Consolidated Financial Statements
(dollars in thousands, except per share data)
The amortized cost and fair value of investment securities available for sale as of
December 31, 2018
, by contractual maturity, are shown below. Certain securities have call features that allow the issuer to call the securities prior to maturity. Expected maturities may differ from contractual maturities for collateralized mortgage obligations, mortgage-backed securities and asset-backed securities because borrowers may have the right to call or prepay obligations with or without call or prepayment penalties. Therefore, collateralized mortgage obligations, mortgage-backed securities and asset-backed securities are not included in the maturity categories within the following maturity summary.
|
|
2018
|
||||||
|
|
Amortized Cost
|
Fair Value
|
|||||
|
Due after one year through five years
|
$
|
3,371
|
|
$
|
3,337
|
|
|
|
Due after five years through ten years
|
81,619
|
|
79,870
|
|
|||
|
Due after ten years
|
121,318
|
|
118,266
|
|
|||
|
|
206,308
|
|
201,473
|
|
|||
|
Collateralized mortgage obligations, mortgage-backed and asset-backed securities
|
258,281
|
|
252,285
|
|
|||
|
|
$
|
464,589
|
|
$
|
453,758
|
|
|
The details of the sales of investment securities for the years ended
December 31, 2018
,
2017
and
2016
are summarized in the following table.
|
|
2018
|
2017
|
2016
|
||||||||
|
Proceeds from sales
|
$
|
75,401
|
|
$
|
108,584
|
|
$
|
3,054
|
|
||
|
Gross gains on sales
|
101
|
|
752
|
|
66
|
|
|||||
|
Gross losses on sales
|
364
|
|
426
|
|
—
|
|
|||||
69
West Bancorporation, Inc. and Subsidiary
Notes to Consolidated Financial Statements
(dollars in thousands, except per share data)
The following tables show the fair value and gross unrealized losses, aggregated by investment type and length of time that individual securities have been in a continuous loss position, as of
December 31, 2018
and
2017
.
|
|
2018
|
|||||||||||||||||||||||
|
|
Less than 12 months
|
12 months or longer
|
Total
|
|||||||||||||||||||||
|
|
Fair
Value
|
Gross Unrealized
Losses
|
Fair
Value
|
Gross Unrealized
Losses
|
Fair
Value
|
Gross Unrealized
Losses
|
||||||||||||||||||
|
Securities available for sale:
|
||||||||||||||||||||||||
|
State and political subdivisions
|
$
|
21,264
|
|
$
|
(221
|
)
|
$
|
102,853
|
|
$
|
(3,072
|
)
|
$
|
124,117
|
|
$
|
(3,293
|
)
|
||||||
|
Collateralized mortgage obligations
|
32,230
|
|
(250
|
)
|
124,775
|
|
(4,138
|
)
|
157,005
|
|
(4,388
|
)
|
||||||||||||
|
Mortgage-backed securities
|
10,960
|
|
(103
|
)
|
51,823
|
|
(1,332
|
)
|
62,783
|
|
(1,435
|
)
|
||||||||||||
|
Asset-backed securities
|
6,668
|
|
(31
|
)
|
16,486
|
|
(144
|
)
|
23,154
|
|
(175
|
)
|
||||||||||||
|
Trust preferred security
|
—
|
|
—
|
|
1,900
|
|
(253
|
)
|
1,900
|
|
(253
|
)
|
||||||||||||
|
Corporate notes
|
19,470
|
|
(611
|
)
|
19,041
|
|
(958
|
)
|
38,511
|
|
(1,569
|
)
|
||||||||||||
|
|
$
|
90,592
|
|
$
|
(1,216
|
)
|
$
|
316,878
|
|
$
|
(9,897
|
)
|
$
|
407,470
|
|
$
|
(11,113
|
)
|
||||||
|
|
2017
|
|||||||||||||||||||||||
|
|
Less than 12 months
|
12 months or longer
|
Total
|
|||||||||||||||||||||
|
|
Fair
Value
|
Gross Unrealized
Losses
|
Fair
Value
|
Gross Unrealized
Losses
|
Fair
Value
|
Gross Unrealized
Losses
|
||||||||||||||||||
|
Securities available for sale:
|
||||||||||||||||||||||||
|
State and political subdivisions
|
$
|
86,750
|
|
$
|
(946
|
)
|
$
|
—
|
|
$
|
—
|
|
$
|
86,750
|
|
$
|
(946
|
)
|
||||||
|
Collateralized mortgage obligations
|
107,526
|
|
(1,583
|
)
|
46,396
|
|
(1,144
|
)
|
153,922
|
|
(2,727
|
)
|
||||||||||||
|
Mortgage-backed securities
|
53,974
|
|
(547
|
)
|
—
|
|
—
|
|
53,974
|
|
(547
|
)
|
||||||||||||
|
Asset-backed securities
|
38,652
|
|
(352
|
)
|
—
|
|
—
|
|
38,652
|
|
(352
|
)
|
||||||||||||
|
Trust preferred security
|
—
|
|
—
|
|
2,006
|
|
(128
|
)
|
2,006
|
|
(128
|
)
|
||||||||||||
|
Corporate notes
|
14,735
|
|
(265
|
)
|
—
|
|
—
|
|
14,735
|
|
(265
|
)
|
||||||||||||
|
|
$
|
301,637
|
|
$
|
(3,693
|
)
|
$
|
48,402
|
|
$
|
(1,272
|
)
|
$
|
350,039
|
|
$
|
(4,965
|
)
|
||||||
|
Securities held to maturity:
|
||||||||||||||||||||||||
|
State and political subdivisions
|
$
|
12,611
|
|
$
|
(70
|
)
|
$
|
1,740
|
|
$
|
(27
|
)
|
$
|
14,351
|
|
$
|
(97
|
)
|
||||||
As of
December 31, 2018
, the available for sale investment securities with unrealized losses included
171
state and political subdivision securities,
45
collateralized mortgage obligations,
18
mortgage-backed securities,
six
asset-backed securities,
one
trust preferred security and
15
corporate notes. The Company believes the unrealized losses on investment securities available for sale as of
December 31, 2018
were due to market conditions, including interest rate fluctuations, rather than reduced estimated cash flows. The Company does not intend to sell these securities, does not anticipate that these securities will be required to be sold before anticipated recovery, and expects full principal and interest to be collected. Therefore, the Company does not consider these investments to have OTTI as of
December 31, 2018
.
70
West Bancorporation, Inc. and Subsidiary
Notes to Consolidated Financial Statements
(dollars in thousands, except per share data)
Note 4. Loans and Allowance for Loan Losses
Loans consisted of the following segments as of
December 31, 2018
and
2017
.
|
|
2018
|
2017
|
|||||
|
Commercial
|
$
|
358,763
|
|
$
|
347,482
|
|
|
|
Real estate:
|
|
|
|||||
|
Construction, land and land development
|
245,810
|
|
207,451
|
|
|||
|
1-4 family residential first mortgages
|
49,052
|
|
51,044
|
|
|||
|
Home equity
|
14,469
|
|
13,811
|
|
|||
|
Commercial
|
1,050,025
|
|
886,114
|
|
|||
|
Consumer and other
|
6,211
|
|
6,363
|
|
|||
|
|
1,724,330
|
|
1,512,265
|
|
|||
|
Net unamortized fees and costs
|
(2,500
|
)
|
(1,765
|
)
|
|||
|
|
$
|
1,721,830
|
|
$
|
1,510,500
|
|
|
The loan portfolio included
$1,142,413
and
$997,642
of fixed-rate loans and
$581,917
and
$514,623
of variable-rate loans as of
December 31, 2018
and
2017
, respectively.
Real estate loans of approximately
$800,000
and
$810,000
were pledged as security for FHLB advances as of
December 31, 2018
and
2017
, respectively.
The Company has had, and may be expected to have in the future, banking transactions in the ordinary course of business with directors, executive officers, their immediate families, and affiliated companies in which they are principal stockholders or executive officers (commonly referred to as related parties), all of which have been originated, in the opinion of management, on the same terms, including interest rates and collateral, as those prevailing at the time for comparable transactions with unrelated parties. Loan transactions with related parties were as follows for the years ended
December 31, 2018
and
2017
.
|
|
2018
|
2017
|
|||||
|
Balance, beginning of year
|
$
|
165,097
|
|
$
|
191,697
|
|
|
|
New loans
|
9,387
|
|
28,975
|
|
|||
|
Repayments
|
(21,008
|
)
|
(55,575
|
)
|
|||
|
Balance, end of year
|
$
|
153,476
|
|
$
|
165,097
|
|
|
71
West Bancorporation, Inc. and Subsidiary
Notes to Consolidated Financial Statements
(dollars in thousands, except per share data)
The following table summarizes the recorded investment in impaired loans by segment, broken down by loans with no related allowance and loans with a related allowance and the amount of that allowance as of
December 31, 2018
and
2017
.
|
December 31, 2018
|
December 31, 2017
|
|||||||||||||||||||||||
|
Recorded
Investment
|
Unpaid
Principal
Balance
|
Related
Allowance
|
Recorded
Investment
|
Unpaid
Principal
Balance
|
Related
Allowance
|
|||||||||||||||||||
|
With no related allowance recorded:
|
||||||||||||||||||||||||
|
Commercial
|
$
|
1,014
|
|
$
|
1,014
|
|
$
|
—
|
|
$
|
—
|
|
$
|
—
|
|
$
|
—
|
|
||||||
|
Real estate:
|
||||||||||||||||||||||||
|
Construction, land and land development
|
—
|
|
—
|
|
—
|
|
—
|
|
—
|
|
—
|
|
||||||||||||
|
1-4 family residential first mortgages
|
106
|
|
106
|
|
—
|
|
91
|
|
91
|
|
—
|
|
||||||||||||
|
Home equity
|
41
|
|
41
|
|
—
|
|
172
|
|
172
|
|
—
|
|
||||||||||||
|
Commercial
|
652
|
|
652
|
|
—
|
|
220
|
|
220
|
|
—
|
|
||||||||||||
|
Consumer and other
|
—
|
|
—
|
|
—
|
|
—
|
|
—
|
|
—
|
|
||||||||||||
|
1,813
|
|
1,813
|
|
—
|
|
483
|
|
483
|
|
—
|
|
|||||||||||||
|
With an allowance recorded:
|
||||||||||||||||||||||||
|
Commercial
|
15
|
|
15
|
|
15
|
|
—
|
|
—
|
|
—
|
|
||||||||||||
|
Real estate:
|
||||||||||||||||||||||||
|
Construction, land and land development
|
—
|
|
—
|
|
—
|
|
—
|
|
—
|
|
—
|
|
||||||||||||
|
1-4 family residential first mortgages
|
—
|
|
—
|
|
—
|
|
—
|
|
—
|
|
—
|
|
||||||||||||
|
Home equity
|
—
|
|
—
|
|
—
|
|
21
|
|
21
|
|
21
|
|
||||||||||||
|
Commercial
|
100
|
|
100
|
|
100
|
|
118
|
|
118
|
|
118
|
|
||||||||||||
|
Consumer and other
|
—
|
|
—
|
|
—
|
|
—
|
|
—
|
|
—
|
|
||||||||||||
|
115
|
|
115
|
|
115
|
|
139
|
|
139
|
|
139
|
|
|||||||||||||
|
Total:
|
||||||||||||||||||||||||
|
Commercial
|
1,029
|
|
1,029
|
|
15
|
|
—
|
|
—
|
|
—
|
|
||||||||||||
|
Real estate:
|
||||||||||||||||||||||||
|
Construction, land and land development
|
—
|
|
—
|
|
—
|
|
—
|
|
—
|
|
—
|
|
||||||||||||
|
1-4 family residential first mortgages
|
106
|
|
106
|
|
—
|
|
91
|
|
91
|
|
—
|
|
||||||||||||
|
Home equity
|
41
|
|
41
|
|
—
|
|
193
|
|
193
|
|
21
|
|
||||||||||||
|
Commercial
|
752
|
|
752
|
|
100
|
|
338
|
|
338
|
|
118
|
|
||||||||||||
|
Consumer and other
|
—
|
|
—
|
|
—
|
|
—
|
|
—
|
|
—
|
|
||||||||||||
|
Total impaired loans
|
$
|
1,928
|
|
$
|
1,928
|
|
$
|
115
|
|
$
|
622
|
|
$
|
622
|
|
$
|
139
|
|
||||||
The balance of impaired loans at
December 31, 2018
was composed of loans to
ten
different borrowers, and the balance of impaired loans at
December 31, 2017
was composed of loans to
five
different borrowers. As of
December 31, 2018
,
$250
of total impaired loans to
four
of the borrowers was also considered impaired as of
December 31, 2017
. The Company has
no
commitments to advance additional funds on any of the impaired loans.
72
West Bancorporation, Inc. and Subsidiary
Notes to Consolidated Financial Statements
(dollars in thousands, except per share data)
The following table summarizes the average recorded investment and interest income recognized on impaired loans by segment for the years ended
December 31, 2018
,
2017
and
2016
.
|
December 31, 2018
|
December 31, 2017
|
December 31, 2016
|
||||||||||||||||||||||
|
Average Recorded Investment
|
Interest Income Recognized
|
Average Recorded Investment
|
Interest Income Recognized
|
Average Recorded Investment
|
Interest Income Recognized
|
|||||||||||||||||||
|
With no related allowance recorded:
|
||||||||||||||||||||||||
|
Commercial
|
$
|
738
|
|
$
|
—
|
|
$
|
19
|
|
$
|
—
|
|
$
|
3
|
|
$
|
—
|
|
||||||
|
Real estate:
|
||||||||||||||||||||||||
|
Construction, land and
|
||||||||||||||||||||||||
|
land development
|
—
|
|
—
|
|
—
|
|
—
|
|
8
|
|
—
|
|
||||||||||||
|
1-4 family residential first mortgages
|
113
|
|
—
|
|
99
|
|
—
|
|
212
|
|
1
|
|
||||||||||||
|
Home equity
|
122
|
|
6
|
|
39
|
|
2
|
|
3
|
|
—
|
|
||||||||||||
|
Commercial
|
600
|
|
—
|
|
276
|
|
—
|
|
393
|
|
—
|
|
||||||||||||
|
Consumer and other
|
—
|
|
—
|
|
—
|
|
—
|
|
—
|
|
—
|
|
||||||||||||
|
1,573
|
|
6
|
|
433
|
|
2
|
|
619
|
|
1
|
|
|||||||||||||
|
With an allowance recorded:
|
||||||||||||||||||||||||
|
Commercial
|
1
|
|
—
|
|
60
|
|
7
|
|
127
|
|
—
|
|
||||||||||||
|
Real estate:
|
||||||||||||||||||||||||
|
Construction, land and
|
||||||||||||||||||||||||
|
land development
|
—
|
|
—
|
|
—
|
|
—
|
|
—
|
|
—
|
|
||||||||||||
|
1-4 family residential first mortgages
|
—
|
|
—
|
|
—
|
|
—
|
|
—
|
|
—
|
|
||||||||||||
|
Home equity
|
15
|
|
—
|
|
177
|
|
1
|
|
263
|
|
—
|
|
||||||||||||
|
Commercial
|
109
|
|
—
|
|
127
|
|
—
|
|
145
|
|
—
|
|
||||||||||||
|
Consumer and other
|
—
|
|
—
|
|
—
|
|
—
|
|
—
|
|
—
|
|
||||||||||||
|
125
|
|
—
|
|
364
|
|
8
|
|
535
|
|
—
|
|
|||||||||||||
|
Total:
|
||||||||||||||||||||||||
|
Commercial
|
739
|
|
—
|
|
79
|
|
7
|
|
130
|
|
—
|
|
||||||||||||
|
Real estate:
|
||||||||||||||||||||||||
|
Construction, land and
|
||||||||||||||||||||||||
|
land development
|
—
|
|
—
|
|
—
|
|
—
|
|
8
|
|
—
|
|
||||||||||||
|
1-4 family residential first mortgages
|
113
|
|
—
|
|
99
|
|
—
|
|
212
|
|
1
|
|
||||||||||||
|
Home equity
|
137
|
|
6
|
|
216
|
|
3
|
|
266
|
|
—
|
|
||||||||||||
|
Commercial
|
709
|
|
—
|
|
403
|
|
—
|
|
538
|
|
—
|
|
||||||||||||
|
Consumer and other
|
—
|
|
—
|
|
—
|
|
—
|
|
—
|
|
—
|
|
||||||||||||
|
Total impaired loans
|
$
|
1,698
|
|
$
|
6
|
|
$
|
797
|
|
$
|
10
|
|
$
|
1,154
|
|
$
|
1
|
|
||||||
Interest income forgone on impaired loans was
$96
,
$47
and
$72
, respectively, during the years ended
December 31, 2018
,
2017
and
2016
.
73
West Bancorporation, Inc. and Subsidiary
Notes to Consolidated Financial Statements
(dollars in thousands, except per share data)
The following tables provide an analysis of the payment status of the recorded investment in loans as of
December 31, 2018
and
2017
.
|
December 31, 2018
|
||||||||||||||||||||||||||||
|
30-59
Days Past
Due
|
60-89 Days Past Due
|
90 Days or More Past Due
|
Total
Past Due
|
Current
|
Nonaccrual Loans
|
Total Loans
|
||||||||||||||||||||||
|
Commercial
|
$
|
54
|
|
$
|
—
|
|
$
|
—
|
|
$
|
54
|
|
$
|
357,680
|
|
$
|
1,029
|
|
$
|
358,763
|
|
|||||||
|
Real estate:
|
|
|||||||||||||||||||||||||||
|
Construction, land and
|
|
|||||||||||||||||||||||||||
|
land development
|
—
|
|
—
|
|
—
|
|
—
|
|
245,810
|
|
—
|
|
245,810
|
|
||||||||||||||
|
1-4 family residential
|
|
|||||||||||||||||||||||||||
|
first mortgages
|
157
|
|
—
|
|
—
|
|
157
|
|
48,789
|
|
106
|
|
49,052
|
|
||||||||||||||
|
Home equity
|
—
|
|
—
|
|
—
|
|
—
|
|
14,428
|
|
41
|
|
14,469
|
|
||||||||||||||
|
Commercial
|
—
|
|
—
|
|
—
|
|
—
|
|
1,049,273
|
|
752
|
|
1,050,025
|
|
||||||||||||||
|
Consumer and other
|
—
|
|
—
|
|
—
|
|
—
|
|
6,211
|
|
—
|
|
6,211
|
|
||||||||||||||
|
Total
|
$
|
211
|
|
$
|
—
|
|
$
|
—
|
|
$
|
211
|
|
$
|
1,722,191
|
|
$
|
1,928
|
|
$
|
1,724,330
|
|
|||||||
|
December 31, 2017
|
||||||||||||||||||||||||||||
|
30-59
Days Past
Due
|
60-89 Days Past Due
|
90 Days or More Past Due
|
Total
Past Due
|
Current
|
Nonaccrual Loans
|
Total Loans
|
||||||||||||||||||||||
|
Commercial
|
$
|
40
|
|
$
|
20
|
|
$
|
—
|
|
$
|
60
|
|
$
|
347,422
|
|
$
|
—
|
|
$
|
347,482
|
|
|||||||
|
Real estate:
|
||||||||||||||||||||||||||||
|
Construction, land and
|
||||||||||||||||||||||||||||
|
land development
|
—
|
|
—
|
|
—
|
|
—
|
|
207,451
|
|
—
|
|
207,451
|
|
||||||||||||||
|
1-4 family residential
|
|
|||||||||||||||||||||||||||
|
first mortgages
|
—
|
|
75
|
|
—
|
|
75
|
|
50,878
|
|
91
|
|
51,044
|
|
||||||||||||||
|
Home equity
|
—
|
|
—
|
|
—
|
|
—
|
|
13,618
|
|
193
|
|
13,811
|
|
||||||||||||||
|
Commercial
|
—
|
|
—
|
|
—
|
|
—
|
|
885,776
|
|
338
|
|
886,114
|
|
||||||||||||||
|
Consumer and other
|
—
|
|
—
|
|
—
|
|
—
|
|
6,363
|
|
—
|
|
6,363
|
|
||||||||||||||
|
Total
|
$
|
40
|
|
$
|
95
|
|
$
|
—
|
|
$
|
135
|
|
$
|
1,511,508
|
|
$
|
622
|
|
$
|
1,512,265
|
|
|||||||
TDR loans totaled
$652
and
$220
as of
December 31, 2018
and
2017
, respectively, and were included in the nonaccrual category. There was
one
loan modification considered to be TDR that occurred during the year ended
December 31, 2018
and
no
loan modifications considered to be TDR that occurred during the years ended
December 31, 2017
and
2016
. The pre- and post-modification recorded investment in TDR loans that have occurred during the years ended
December 31, 2018
,
2017
and
2016
, totaled
$560
,
$0
and
$0
, respectively. The financial impact of charge-offs or specific reserves for these modified loans was immaterial.
TDR loans that have been modified within the twelve months ended
December 31, 2018
,
2017
and
2016
, which have subsequently had a payment default, totaled
$544
,
$0
and
$0
, respectively. A TDR loan is considered to have a payment default when it is past due 30 days or more.
74
West Bancorporation, Inc. and Subsidiary
Notes to Consolidated Financial Statements
(dollars in thousands, except per share data)
The following tables show the recorded investment in loans by credit quality indicator and loan segment as of
December 31, 2018
and
2017
.
|
December 31, 2018
|
||||||||||||||||||||
|
Pass
|
Watch
|
Substandard
|
Doubtful
|
Total
|
||||||||||||||||
|
Commercial
|
$
|
336,861
|
|
$
|
19,886
|
|
$
|
2,016
|
|
$
|
—
|
|
$
|
358,763
|
|
|||||
|
Real estate:
|
||||||||||||||||||||
|
Construction, land and land development
|
245,810
|
|
—
|
|
—
|
|
—
|
|
245,810
|
|
||||||||||
|
1-4 family residential first mortgages
|
47,923
|
|
963
|
|
166
|
|
—
|
|
49,052
|
|
||||||||||
|
Home equity
|
14,352
|
|
46
|
|
71
|
|
—
|
|
14,469
|
|
||||||||||
|
Commercial
|
1,019,256
|
|
29,063
|
|
1,706
|
|
—
|
|
1,050,025
|
|
||||||||||
|
Consumer and other
|
6,186
|
|
—
|
|
25
|
|
—
|
|
6,211
|
|
||||||||||
|
Total
|
$
|
1,670,388
|
|
$
|
49,958
|
|
$
|
3,984
|
|
$
|
—
|
|
$
|
1,724,330
|
|
|||||
|
December 31, 2017
|
||||||||||||||||||||
|
Pass
|
Watch
|
Substandard
|
Doubtful
|
Total
|
||||||||||||||||
|
Commercial
|
$
|
344,586
|
|
$
|
901
|
|
$
|
1,995
|
|
$
|
—
|
|
$
|
347,482
|
|
|||||
|
Real estate:
|
||||||||||||||||||||
|
Construction, land and land development
|
206,719
|
|
732
|
|
—
|
|
—
|
|
207,451
|
|
||||||||||
|
1-4 family residential first mortgages
|
49,905
|
|
890
|
|
249
|
|
—
|
|
51,044
|
|
||||||||||
|
Home equity
|
13,466
|
|
54
|
|
291
|
|
—
|
|
13,811
|
|
||||||||||
|
Commercial
|
856,789
|
|
20,574
|
|
8,751
|
|
—
|
|
886,114
|
|
||||||||||
|
Consumer and other
|
6,327
|
|
36
|
|
—
|
|
—
|
|
6,363
|
|
||||||||||
|
Total
|
$
|
1,477,792
|
|
$
|
23,187
|
|
$
|
11,286
|
|
$
|
—
|
|
$
|
1,512,265
|
|
|||||
All loans are subject to the assessment of a credit quality indicator. Risk ratings are assigned for each loan at the time of approval, and they change as circumstances dictate during the term of the loan. The Company utilizes a 9-point risk rating scale as shown below, with ratings 1 - 5 included in the Pass column, rating 6 included in the Watch column, ratings 7 - 8 included in the Substandard column, and rating 9 included in the Doubtful column. All loans classified as impaired that are included in the specific evaluation of the allowance for loan losses are included in the Substandard column along with all other loans with ratings of 7 - 8.
Risk rating 1: The loan is secured by cash equivalent collateral.
Risk rating 2: The loan is secured by properly margined marketable securities, bonds or cash surrender value of life insurance.
Risk rating 3: The borrower is in strong financial condition and has strong debt service capacity. The loan is performing as agreed, and the financial characteristics and trends of the borrower exceed industry statistics.
Risk rating 4: The borrower’s financial condition is satisfactory and stable. The borrower has satisfactory debt service capacity, and the loan is well secured. The loan is performing as agreed, and the financial characteristics and trends fall in line with industry statistics.
Risk rating 5: The borrower’s financial condition is less than satisfactory. The loan is still generally paying as agreed, but strained cash flow may cause some slowness in payments. The collateral values adequately preclude loss on the loan. Financial characteristics and trends lag industry statistics. There may be noncompliance with loan covenants.
Risk rating 6: The borrower’s financial condition is deficient. Payment delinquencies may be more common. Collateral values still protect from loss, but margins are narrow. The loan may be reliant on secondary sources of repayment, including liquidation of collateral and guarantor support.
75
West Bancorporation, Inc. and Subsidiary
Notes to Consolidated Financial Statements
(dollars in thousands, except per share data)
Risk rating 7: The loan is inadequately protected by the current sound worth and paying capacity of the obligor or of the collateral pledged, if any. Well-defined weaknesses exist that jeopardize the liquidation of the debt. The Company is inadequately protected by the valuation or paying capacity of the collateral pledged. If deficiencies are not corrected, there is a distinct possibility that a loss will be sustained.
Risk rating 8: All the characteristics of rating 7 exist with the added condition that the loan is past due more than 90 days or there is reason to believe the Company will not receive its principal and interest according to the terms of the loan agreement.
Risk rating 9: All the weaknesses inherent in risk ratings 7 and 8 exist with the added condition that collection or liquidation, on the basis of currently known facts, conditions and values, is highly questionable and improbable. A loan reaching this category would most likely be charged off.
Credit quality indicators for all loans and the Company’s risk rating process are dynamic and updated on a continuous basis. Risk ratings are updated as circumstances that could affect the repayment of an individual loan are brought to management’s attention through an established monitoring process. Individual lenders initiate changes as appropriate for ratings 1 through 5, and changes for ratings 6 through 9 are initiated via communications with management. The likelihood of loss increases as the risk rating increases and is generally preceded by a loan appearing on the Watch List, which consists of all loans with a risk rating of 6 or worse. Written action plans with firm target dates for resolution of identified problems are maintained and reviewed on a quarterly basis for all segments of loans included on the Watch List.
In addition to the Company’s internal credit monitoring practices and procedures, an outsourced independent credit review function is in place to further assess assigned internal risk classifications and monitor compliance with internal lending policies and procedures.
In all portfolio segments, the primary risks are that a borrower’s income stream diminishes to the point that it is not able to make scheduled principal and interest payments and any collateral securing the loan declines in value. The risk of declining collateral values is present for most types of loans.
Commercial loans consist primarily of loans to businesses for various purposes, including revolving lines to finance current operations, inventory and accounts receivable, and capital expenditure loans to finance equipment and other fixed assets. These loans generally have short maturities, have either adjustable or fixed interest rates, and are either unsecured or secured by inventory, accounts receivable and/or fixed assets. For commercial loans, the primary source of repayment is from the operation of the business.
Real estate loans include various types of loans for which the Company holds real property as collateral, and consist of loans on commercial properties and single and multifamily residences. Real estate loans are typically structured to mature or reprice every 5 to 10 years with payments based on amortization periods up to 30 years. The majority of construction loans are to contractors and developers for construction of commercial buildings or residential real estate. These loans typically have maturities up to 24 months. The Company’s loan policy includes minimum appraisal and other credit guidelines.
Consumer loans include loans extended to individuals for household, family and other personal expenditures not secured by real estate. The majority of the Company’s consumer lending is for vehicles, consolidation of personal debts and household improvements. The repayment source for consumer loans, including 1-4 family residential mortgages and home equity loans, is typically wages.
76
West Bancorporation, Inc. and Subsidiary
Notes to Consolidated Financial Statements
(dollars in thousands, except per share data)
The following tables detail changes in the allowance for loan losses by segment for the years ended
December 31, 2018
,
2017
and
2016
.
|
2018
|
|||||||||||||||||||||||||||
|
Real Estate
|
|||||||||||||||||||||||||||
|
Commercial
|
Construction and Land
|
1-4 Family Residential
|
Home Equity
|
Commercial
|
Consumer and Other
|
Total
|
|||||||||||||||||||||
|
Beginning balance
|
$
|
3,866
|
|
$
|
2,213
|
|
$
|
319
|
|
$
|
186
|
|
$
|
9,770
|
|
$
|
76
|
|
$
|
16,430
|
|
||||||
|
Charge-offs
|
(208
|
)
|
—
|
|
—
|
|
(24
|
)
|
—
|
|
(3
|
)
|
(235
|
)
|
|||||||||||||
|
Recoveries
|
673
|
|
—
|
|
18
|
|
24
|
|
13
|
|
16
|
|
744
|
|
|||||||||||||
|
Provision
(1)
|
(823
|
)
|
171
|
|
(87
|
)
|
(15
|
)
|
518
|
|
(14
|
)
|
(250
|
)
|
|||||||||||||
|
Ending balance
|
$
|
3,508
|
|
$
|
2,384
|
|
$
|
250
|
|
$
|
171
|
|
$
|
10,301
|
|
$
|
75
|
|
$
|
16,689
|
|
||||||
|
2017
|
|||||||||||||||||||||||||||
|
Real Estate
|
|||||||||||||||||||||||||||
|
Commercial
|
Construction and Land
|
1-4 Family Residential
|
Home Equity
|
Commercial
|
Consumer and Other
|
Total
|
|||||||||||||||||||||
|
Beginning balance
|
$
|
3,881
|
|
$
|
2,639
|
|
$
|
317
|
|
$
|
478
|
|
$
|
8,697
|
|
$
|
100
|
|
$
|
16,112
|
|
||||||
|
Charge-offs
|
(199
|
)
|
—
|
|
—
|
|
(176
|
)
|
—
|
|
—
|
|
(375
|
)
|
|||||||||||||
|
Recoveries
|
232
|
|
398
|
|
15
|
|
28
|
|
13
|
|
7
|
|
693
|
|
|||||||||||||
|
Provision
(1)
|
(48
|
)
|
(824
|
)
|
(13
|
)
|
(144
|
)
|
1,060
|
|
(31
|
)
|
—
|
|
|||||||||||||
|
Ending balance
|
$
|
3,866
|
|
$
|
2,213
|
|
$
|
319
|
|
$
|
186
|
|
$
|
9,770
|
|
$
|
76
|
|
$
|
16,430
|
|
||||||
|
2016
|
|||||||||||||||||||||||||||
|
Real Estate
|
|||||||||||||||||||||||||||
|
Commercial
|
Construction and Land
|
1-4 Family Residential
|
Home Equity
|
Commercial
|
Consumer and Other
|
Total
|
|||||||||||||||||||||
|
Beginning balance
|
$
|
4,369
|
|
$
|
2,338
|
|
$
|
508
|
|
$
|
481
|
|
$
|
7,254
|
|
$
|
17
|
|
$
|
14,967
|
|
||||||
|
Charge-offs
|
(125
|
)
|
(141
|
)
|
(93
|
)
|
—
|
|
—
|
|
(47
|
)
|
(406
|
)
|
|||||||||||||
|
Recoveries
|
218
|
|
217
|
|
59
|
|
36
|
|
13
|
|
8
|
|
551
|
|
|||||||||||||
|
Provision
(1)
|
(581
|
)
|
225
|
|
(157
|
)
|
(39
|
)
|
1,430
|
|
122
|
|
1,000
|
|
|||||||||||||
|
Ending balance
|
$
|
3,881
|
|
$
|
2,639
|
|
$
|
317
|
|
$
|
478
|
|
$
|
8,697
|
|
$
|
100
|
|
$
|
16,112
|
|
||||||
|
(1)
|
The negative provisions for the various segments are either related to the decline in outstanding balances in each of those portfolio segments during the time periods disclosed and/or improvement in the credit quality factors related to those portfolio segments.
|
77
West Bancorporation, Inc. and Subsidiary
Notes to Consolidated Financial Statements
(dollars in thousands, except per share data)
The following tables show a breakdown of the allowance for loan losses disaggregated on the basis of impairment analysis method by segment as of
December 31, 2018
and
2017
.
|
December 31, 2018
|
|||||||||||||||||||||||||||
|
Real Estate
|
|||||||||||||||||||||||||||
|
Commercial
|
Construction and Land
|
1-4 Family Residential
|
Home Equity
|
Commercial
|
Consumer and Other
|
Total
|
|||||||||||||||||||||
|
Ending balance:
|
|||||||||||||||||||||||||||
|
Individually evaluated for impairment
|
$
|
15
|
|
$
|
—
|
|
$
|
—
|
|
$
|
—
|
|
$
|
100
|
|
$
|
—
|
|
$
|
115
|
|
||||||
|
Collectively evaluated for impairment
|
3,493
|
|
2,384
|
|
250
|
|
171
|
|
10,201
|
|
75
|
|
16,574
|
|
|||||||||||||
|
Total
|
$
|
3,508
|
|
$
|
2,384
|
|
$
|
250
|
|
$
|
171
|
|
$
|
10,301
|
|
$
|
75
|
|
$
|
16,689
|
|
||||||
|
December 31, 2017
|
|||||||||||||||||||||||||||
|
Real Estate
|
|||||||||||||||||||||||||||
|
Commercial
|
Construction and Land
|
1-4 Family Residential
|
Home Equity
|
Commercial
|
Consumer and Other
|
Total
|
|||||||||||||||||||||
|
Ending balance:
|
|||||||||||||||||||||||||||
|
Individually evaluated for impairment
|
$
|
—
|
|
$
|
—
|
|
$
|
—
|
|
$
|
21
|
|
$
|
118
|
|
$
|
—
|
|
$
|
139
|
|
||||||
|
Collectively evaluated for impairment
|
3,866
|
|
2,213
|
|
319
|
|
165
|
|
9,652
|
|
76
|
|
16,291
|
|
|||||||||||||
|
Total
|
$
|
3,866
|
|
$
|
2,213
|
|
$
|
319
|
|
$
|
186
|
|
$
|
9,770
|
|
$
|
76
|
|
$
|
16,430
|
|
||||||
The following tables show the recorded investment in loans, exclusive of unamortized fees and costs, disaggregated on the basis of impairment analysis method by segment as of
December 31, 2018
and
2017
.
|
December 31, 2018
|
|||||||||||||||||||||||||||
|
Real Estate
|
|||||||||||||||||||||||||||
|
Commercial
|
Construction and Land
|
1-4 Family Residential
|
Home Equity
|
Commercial
|
Consumer and Other
|
Total
|
|||||||||||||||||||||
|
Ending balance:
|
|||||||||||||||||||||||||||
|
Individually evaluated for impairment
|
$
|
1,029
|
|
$
|
—
|
|
$
|
106
|
|
$
|
41
|
|
$
|
752
|
|
$
|
—
|
|
$
|
1,928
|
|
||||||
|
Collectively evaluated for impairment
|
357,734
|
|
245,810
|
|
48,946
|
|
14,428
|
|
1,049,273
|
|
6,211
|
|
1,722,402
|
|
|||||||||||||
|
Total
|
$
|
358,763
|
|
$
|
245,810
|
|
$
|
49,052
|
|
$
|
14,469
|
|
$
|
1,050,025
|
|
$
|
6,211
|
|
$
|
1,724,330
|
|
||||||
|
December 31, 2017
|
|||||||||||||||||||||||||||
|
Real Estate
|
|||||||||||||||||||||||||||
|
Commercial
|
Construction and Land
|
1-4 Family Residential
|
Home Equity
|
Commercial
|
Consumer and Other
|
Total
|
|||||||||||||||||||||
|
Ending balance:
|
|||||||||||||||||||||||||||
|
Individually evaluated for impairment
|
$
|
—
|
|
$
|
—
|
|
$
|
91
|
|
$
|
193
|
|
$
|
338
|
|
$
|
—
|
|
$
|
622
|
|
||||||
|
Collectively evaluated for impairment
|
347,482
|
|
207,451
|
|
50,953
|
|
13,618
|
|
885,776
|
|
6,363
|
|
1,511,643
|
|
|||||||||||||
|
Total
|
$
|
347,482
|
|
$
|
207,451
|
|
$
|
51,044
|
|
$
|
13,811
|
|
$
|
886,114
|
|
$
|
6,363
|
|
$
|
1,512,265
|
|
||||||
78
West Bancorporation, Inc. and Subsidiary
Notes to Consolidated Financial Statements
(dollars in thousands, except per share data)
Note 5. Premises and Equipment, Net
Premises and equipment consisted of the following as of
December 31, 2018
and
2017
.
|
|
2018
|
2017
|
|||||
|
Land
|
$
|
4,323
|
|
$
|
4,323
|
|
|
|
Buildings
|
14,120
|
|
14,423
|
|
|||
|
Leasehold improvements
|
3,941
|
|
3,880
|
|
|||
|
Furniture and equipment
|
7,927
|
|
7,946
|
|
|||
|
|
30,311
|
|
30,572
|
|
|||
|
Accumulated depreciation
|
(8,820
|
)
|
(7,550
|
)
|
|||
|
|
$
|
21,491
|
|
$
|
23,022
|
|
|
Note 6. Deposits
The scheduled maturities of time deposits were as follows as of
December 31, 2018
.
|
2019
|
$
|
161,204
|
|
|
2020
|
26,598
|
|
|
|
2021
|
9,279
|
|
|
|
2022
|
6,091
|
|
|
|
2023
|
4,237
|
|
|
|
|
$
|
207,409
|
|
Time deposits as of
December 31, 2018
and
2017
, included
$92,315
and
$100,091
, respectively, of Certificate of Deposit Account Registry Service deposits, which is a program that coordinates, on a reciprocal basis, a network of banks to spread deposits exceeding the FDIC insurance coverage limits out to numerous institutions in order to provide insurance coverage for all participating deposits.
Also included in total deposits as of
December 31, 2018
and
2017
, were
$94,203
and
$117,990
, respectively, of Insured Cash Sweep (ICS) interest-bearing checking and
$232,146
and
$213,587
, respectively, of ICS money market deposits. These are also reciprocal programs providing insurance coverage for all participating deposits.
Note 7. Subordinated Notes
On July 18, 2003, the Company issued
$20,619
in junior subordinated debentures to the Company’s subsidiary trust, West Bancorporation Capital Trust I. The junior subordinated debentures are senior to the Company’s common stock. As a result, the Company must make payments on the junior subordinated debentures (and the related trust preferred securities) before any dividends can be paid on its common stock, and, in the event of the Company’s bankruptcy, dissolution or liquidation, the holders of the debentures must be satisfied before any distribution can be made to the holders of the common stock. The Company has the right to defer distributions on the junior subordinated debentures (and the related trust preferred securities) for up to
five years
, during which time
no
dividends may be paid to holders of the Company’s common stock. The junior subordinated debentures have a 30-year term, do not require any principal amortization, and are callable at the issuer’s option. The interest rate is a variable rate based on the
3-month LIBOR
plus
3.05 percent
. At
December 31, 2018
, the interest rate was
5.85 percent
. Interest is payable
quarterly
, unless deferred. The Company has never deferred an interest payment. The effective cost of the junior subordinated debentures at
December 31, 2018
, including amortization of issuance costs, was
5.92 percent
. Holders of the trust preferred securities associated with the junior subordinated debentures have no voting rights, are unsecured, and rank junior in priority to all the Company’s indebtedness and senior to the Company’s common stock. The junior subordinated debentures are reported net of unamortized debt issuance costs of
$194
and
$207
as of
December 31, 2018
and
2017
, respectively. The Company has an interest rate swap contract that effectively converts
$20,000
of the variable-rate junior subordinated debentures to a fixed rate. See Note 10 for additional information on the interest rate swap. In addition, the junior subordinated debentures qualify as Tier 1 capital of the Company for regulatory purposes.
79
West Bancorporation, Inc. and Subsidiary
Notes to Consolidated Financial Statements
(dollars in thousands, except per share data)
Note 8. Federal Home Loan Bank and Other Borrowings
The following table presents the terms of all FHLB advances as of
December 31, 2018
and
2017
.
|
December 31, 2018
|
December 31, 2017
|
|||||||||||||||||||
|
Maturity
|
Interest
|
Effective
|
Interest
|
Effective
|
||||||||||||||||
|
Date
|
Variable/Fixed
|
Rate
|
Rate
(1)
|
Balance
|
Rate
|
Rate
(1)
|
Balance
|
|||||||||||||
|
1/18/2019
|
Fixed
|
2.66%
|
2.66%
|
$
|
30,000
|
|
—
|
|
—
|
|
$
|
—
|
|
|||||||
|
1/25/2019
|
Fixed
|
2.64%
|
2.64%
|
30,000
|
|
—
|
|
—
|
|
—
|
|
|||||||||
|
12/23/2019
|
Variable
|
3.08%
|
5.03%
|
25,000
|
|
1.93
|
%
|
3.90
|
%
|
25,000
|
|
|||||||||
|
6/22/2020
|
Variable
|
3.10%
|
5.20%
|
25,000
|
|
1.95
|
%
|
4.09
|
%
|
25,000
|
|
|||||||||
|
9/21/2020
|
Variable
|
3.10%
|
4.44%
|
30,000
|
|
1.95
|
%
|
4.44
|
%
|
30,000
|
|
|||||||||
|
140,000
|
|
80,000
|
|
|||||||||||||||||
|
Discount for modification
|
(2,122
|
)
|
(3,618
|
)
|
||||||||||||||||
|
Total FHLB advances, net of discount
|
$
|
137,878
|
|
$
|
76,382
|
|
||||||||||||||
|
(1)
|
The effective interest rate for the variable-rate advances includes the effects of the discount fee amortization and interest rate swaps, if applicable.
|
FHLB advances totaling
$80,000
were modified on December 21, 2012, to extend their terms and to convert the borrowings to a variable rate that is tied to 3-month LIBOR. In connection with these modifications, the Company paid a prepayment fee of
$11,152
, which is being amortized and recognized as interest expense over the remaining terms of the advances. For the years ended
December 31, 2018
,
2017
and
2016
, the Company amortized
$1,496
,
$1,496
and
$1,501
, respectively, of interest expense related to the discount. Interest is payable quarterly on the FHLB advances. The Company also has an interest rate swap contract that effectively converts the
$30,000
variable-rate advance to a fixed rate. See Note 10 for additional information on the interest rate swap.
The FHLB advances are collateralized by FHLB stock and real estate loans, as required by the FHLB’s collateral policy. West Bank had additional borrowing capacity of approximately
$289,000
at the FHLB as of
December 31, 2018
.
As of
December 31, 2018
, West Bank had arrangements that would allow it to borrow
$67,000
in unsecured federal funds lines of credit at correspondent banks that are available under the correspondent banks’ normal terms. The lines have no stated expiration dates. As of
December 31, 2018
, there were
no
amounts outstanding under these arrangements.
Note 9. Long-Term Debt
In May 2017, the Company entered into a credit agreement with a commercial bank and borrowed
$25,000
. This credit agreement replaced a prior credit agreement with the same commercial bank that had a remaining outstanding principal balance of $3,000. The additional borrowing was used to make a capital injection into West Bank in May 2017. Principal and interest under the term note are payable quarterly over
five years
. Required
quarterly
principal payments are
$625
, with the balance due at maturity. The Company may make additional principal payments without penalty. The interest rate is variable at
1.95 percent
plus
30-day LIBOR
, which totaled
4.33 percent
as of
December 31, 2018
. In the event of default, the unaffiliated commercial bank may accelerate payment of the loan. The outstanding balance was
$15,250
and
$22,500
as of
December 31, 2018
and
2017
, respectively. The note is secured by 100 percent of West Bank’s stock.
In June 2013, a portion of the property purchased for the branch office in Coralville, Iowa, was financed with a
$765
,
nine
year variable-payment contract with a fixed interest rate of
1.25 percent
. The outstanding balance on the contract was
$304
and
$417
as of
December 31, 2018
and
2017
, respectively.
In December 2018, West Bank’s special purpose subsidiary entered into a credit agreement for
$11,486
. Interest is payable
monthly
over the term of the agreement with an interest rate of
1.00 percent
. Monthly principal payments begin in January 2026 and the agreement matures in December 2048. The outstanding balance was
$11,486
as of December 31, 2018.
80
West Bancorporation, Inc. and Subsidiary
Notes to Consolidated Financial Statements
(dollars in thousands, except per share data)
Future required principal payments for long-term debt as of
December 31, 2018
are shown in the table below.
|
2019
|
$
|
2,615
|
|
|
2020
|
2,616
|
|
|
|
2021
|
2,537
|
|
|
|
2022
|
7,786
|
|
|
|
2023
|
—
|
|
|
|
Thereafter
|
11,486
|
|
|
|
$
|
27,040
|
|
|
Note 10. Derivatives
The Company uses interest rate swap agreements to manage the interest rate risk related to the variability of interest payments. The Company has variable-rate borrowings and deposits, which create exposure to variability in interest payments due to changes in interest rates. The notional amounts of the interest rate swaps do not represent amounts exchanged by the counterparties, but rather, the notional amount is used to determine, along with other terms of the derivative, the amounts to be exchanged between the counterparties.
The Company has two interest rate swaps that effectively convert variable-rate FHLB advances and junior subordinated notes to fixed-rate debt. The swap transactions were designated as cash flow hedges of the changes in cash flows attributable to changes in LIBOR, the benchmark interest rate being hedged, associated with the interest payments made on the underlying debt with quarterly interest rate reset dates. One of these swaps had a forward starting date of September 30, 2018. In January 2018, the Company entered into an interest rate swap agreement that effectively converts certain customer deposits with variable rates based on the federal funds upper target rate to fixed-rate instruments. This swap transaction has a notional amount of
$60,000
with a forward starting date of December 31, 2018 and is designated as a cash flow hedge of the risk of changes in total cash flows paid on certain customer deposits. Additionally, in January 2019, the Company entered into two new interest rate swap agreements that effectively convert certain borrowings to fixed rate instruments. These swap transactions have a notional amount of
$25,000
each with fixed rates of
2.57 percent
and
2.62 percent
and mature in February 2024 and January 2026.
Interest rate swaps, with a total notional amount of
$70,000
, were terminated in prior years, subject to termination fees totaling
$541
. The termination fees are being reclassified from accumulated other comprehensive income to interest expense over the remaining life of the underlying cash flows through June 2020.
At the inception of each hedge transaction, the Company represented that the underlying principal balance would remain outstanding throughout the hedge transaction, making it probable that sufficient LIBOR-based or fed funds-based interest payments would exist through the maturity date of the swaps. The cash flow hedges were determined to be fully effective during the remaining terms of the swaps. Therefore, the aggregate fair value of the swaps is recorded in other assets or other liabilities with changes in market value recorded in OCI, net of deferred taxes. See Note 17 for additional fair value information and disclosures. The amounts included in AOCI will be reclassified to interest expense should the hedge no longer be considered effective. The Company estimates there will be approximately
$404
reclassified from AOCI to interest expense through
December 31, 2019
. The Company will continue to assess the effectiveness of the hedges on a quarterly basis.
The Company is exposed to credit risk in the event of nonperformance by the interest rate swaps counterparty. The Company minimizes this risk by entering into derivative contracts with only large, stable financial institutions, and the Company has not experienced, and does not expect, any losses from counterparty nonperformance on the interest rate swaps. The Company monitors counterparty risk in accordance with the provisions of FASB ASC 815. In addition, the interest rate swap agreements contain language outlining collateral-pledging requirements for each counterparty. Collateral must be posted when the market value exceeds certain threshold limits. Derivative contracts are executed with a Credit Support Annex, which is a bilateral ratings-sensitive agreement that requires collateral postings at established credit threshold levels. These agreements protect the interests of the Company and its counterparties should either party suffer a credit rating deterioration. The Company was required to pledge
$0
and
$210
of cash as collateral to the counterparty as of
December 31, 2018
and
2017
, respectively. The Company’s counterparty was required to pledge
$2,410
and
$980
at
December 31, 2018
and
2017
, respectively.
81
West Bancorporation, Inc. and Subsidiary
Notes to Consolidated Financial Statements
(dollars in thousands, except per share data)
The table below identifies the balance sheet category and fair values of the Company’s derivative instruments designated as cash flow hedges as of
December 31, 2018
and
2017
.
|
Notional
Amount
|
Fair Value
|
Balance Sheet
Category
|
Weighted
Average
Receive Rate
|
Weighted
Average Pay
Rate
|
Maturity
|
||||||||||||||
|
December 31, 2018
|
|||||||||||||||||||
|
Interest rate swap
|
$
|
30,000
|
|
$
|
221
|
|
Other Assets
|
3.10
|
%
|
2.52
|
%
|
9/21/2020
|
|||||||
|
Interest rate swap
(1)
|
20,000
|
|
1,199
|
|
Other Assets
|
5.85
|
%
|
4.81
|
%
|
9/30/2026
|
|||||||||
|
Interest rate swap
(2)
|
60,000
|
|
443
|
|
Other Assets
|
2.50
|
%
|
2.31
|
%
|
12/31/2025
|
|||||||||
|
December 31, 2017
|
|||||||||||||||||||
|
Interest rate swap
|
$
|
30,000
|
|
$
|
(86
|
)
|
Other Liabilities
|
1.95
|
%
|
2.52
|
%
|
9/21/2020
|
|||||||
|
Interest rate swap
(1)
|
20,000
|
|
895
|
|
Other Assets
|
—
|
%
|
4.81
|
%
|
9/30/2026
|
|||||||||
(1) This swap is a forward-starting swap with a weighted average pay rate of
4.81 percent
beginning September 30, 2018. No interest payments were required related to this swap until December 30, 2018.
(2) This swap is a forward-starting swap with a weighted average pay rate of
2.31 percent
beginning December 31, 2018. No interest payments are required related to this swap until January 31, 2019.
The following table identifies the pretax gains or losses recognized on the Company’s derivative instruments designated as cash flow hedges for the years ended
December 31, 2018
,
2017
and
2016
.
|
Amount of Pretax
|
Reclassified from AOCI into Income
|
||||||||||
|
Gain (Loss)
|
|||||||||||
|
Years Ended:
|
Recognized in OCI
|
Category
|
Amount of Loss
|
||||||||
|
December 31, 2018
|
$
|
1,044
|
|
Interest Expense
|
$
|
(105
|
)
|
||||
|
December 31, 2017
|
$
|
(66
|
)
|
Interest Expense
|
$
|
(413
|
)
|
||||
|
December 31, 2016
|
$
|
882
|
|
Interest Expense
|
$
|
(573
|
)
|
||||
Note 11. Income Taxes
The Company files income tax returns in the U.S. federal and various state jurisdictions. Income tax returns for the years
2015
through
2018
remain open to examination by federal and state taxing authorities. No material income tax related interest or penalties were recognized during the years ended
December 31, 2018
,
2017
or
2016
.
The following table shows the components of income taxes for the years ended
December 31, 2018
,
2017
and
2016
.
|
|
2018
|
2017
|
2016
|
||||||||
|
Current:
|
|
|
|
||||||||
|
Federal
|
$
|
5,012
|
|
$
|
8,822
|
|
$
|
8,220
|
|
||
|
State
|
1,907
|
|
1,713
|
|
1,627
|
|
|||||
|
Deferred:
|
|
|
|
|
|||||||
|
Federal
|
(277
|
)
|
2,527
|
|
115
|
|
|||||
|
State
|
(82
|
)
|
306
|
|
(26
|
)
|
|||||
|
Income taxes
|
$
|
6,560
|
|
$
|
13,368
|
|
$
|
9,936
|
|
||
82
West Bancorporation, Inc. and Subsidiary
Notes to Consolidated Financial Statements
(dollars in thousands, except per share data)
Total income taxes for the year ended
December 31, 2018
differed from the amount computed by applying the U.S. federal income tax rate of 21 percent to income before income taxes, and for the years ended
December 31, 2017
and
2016
, total income taxes differed by the amount computed by applying the U.S. federal income tax rate of 35 percent to income before income taxes as shown in the following table.
|
|
2018
|
2017
|
2016
|
|||||||||||||||||
|
|
Amount
|
Percent
of Pretax
Income
|
Amount
|
Percent
of Pretax
Income
|
Amount
|
Percent
of Pretax
Income
|
||||||||||||||
|
Computed expected tax expense
|
$
|
7,364
|
|
21.0
|
%
|
$
|
12,753
|
|
35.0
|
%
|
$
|
11,533
|
|
35.0
|
%
|
|||||
|
State income tax expense, net of
|
||||||||||||||||||||
|
federal income tax benefit
|
1,425
|
|
4.1
|
%
|
1,146
|
|
3.2
|
%
|
1,004
|
|
3.0
|
%
|
||||||||
|
Tax-exempt interest income
|
(1,390
|
)
|
(4.0
|
)%
|
(2,023
|
)
|
(5.6
|
)%
|
(1,823
|
)
|
(5.5
|
)%
|
||||||||
|
Nondeductible interest expense to
|
||||||||||||||||||||
|
own tax-exempt securities
|
231
|
|
0.7
|
%
|
152
|
|
0.4
|
%
|
58
|
|
0.2
|
%
|
||||||||
|
Tax-exempt increase in cash value of
|
||||||||||||||||||||
|
life insurance and gains
|
(132
|
)
|
(0.4
|
)%
|
(336
|
)
|
(0.9
|
)%
|
(381
|
)
|
(1.2
|
)%
|
||||||||
|
Stock compensation
|
(219
|
)
|
(0.6
|
)%
|
(261
|
)
|
(0.7
|
)%
|
—
|
|
—
|
|
||||||||
|
Effect of change in federal
|
||||||||||||||||||||
|
income tax rate
|
—
|
|
—
|
|
2,340
|
|
6.4
|
%
|
—
|
|
—
|
|
||||||||
|
Amended tax returns
|
222
|
|
0.6
|
%
|
—
|
|
—
|
|
—
|
|
—
|
|
||||||||
|
Federal income tax credits
|
(1,140
|
)
|
(3.3
|
)%
|
(410
|
)
|
(1.1
|
)%
|
(405
|
)
|
(1.2
|
)%
|
||||||||
|
Other, net
|
199
|
|
0.6
|
%
|
7
|
|
—
|
|
(50
|
)
|
(0.1
|
)%
|
||||||||
|
Income taxes
|
$
|
6,560
|
|
18.7
|
%
|
$
|
13,368
|
|
36.7
|
%
|
$
|
9,936
|
|
30.2
|
%
|
|||||
On December 22, 2017, the Tax Act was signed into law. The Tax Act reduced the federal corporate income tax rate from the previous maximum rate of
35 percent
to
21 percent
effective for 2018 and future years. The enactment of the legislation and the reduction in the federal income tax rate required a one-time reduction in net deferred tax assets and an increase in tax expense of
$2,340
as shown in the table above for the year ended
December 31, 2017
.
Net deferred tax assets consisted of the following components as of
December 31, 2018
and
2017
.
|
|
2018
|
2017
|
|||||
|
Deferred tax assets:
|
|
|
|||||
|
Allowance for loan losses
|
$
|
4,172
|
|
$
|
4,108
|
|
|
|
Net unrealized losses on securities available for sale
|
2,708
|
|
902
|
|
|||
|
Intangibles
|
—
|
|
101
|
|
|||
|
Accrued expenses
|
346
|
|
176
|
|
|||
|
Restricted stock unit compensation
|
704
|
|
544
|
|
|||
|
State net operating loss carryforward
|
1,021
|
|
1,379
|
|
|||
|
Other
|
67
|
|
86
|
|
|||
|
|
9,018
|
|
7,296
|
|
|||
|
Deferred tax liabilities:
|
|
|
|
|
|||
|
Deferred loan costs
|
183
|
|
193
|
|
|||
|
Net unrealized gains on interest rate swaps
|
429
|
|
139
|
|
|||
|
Premises and equipment
|
694
|
|
792
|
|
|||
|
Other
|
173
|
|
148
|
|
|||
|
|
1,479
|
|
1,272
|
|
|||
|
Net deferred tax assets before valuation allowance
|
7,539
|
|
6,024
|
|
|||
|
Valuation allowance for deferred tax assets
|
(1,021
|
)
|
(1,379
|
)
|
|||
|
Net deferred tax assets
|
$
|
6,518
|
|
$
|
4,645
|
|
|
83
West Bancorporation, Inc. and Subsidiary
Notes to Consolidated Financial Statements
(dollars in thousands, except per share data)
As of
December 31, 2018
, the parent Company had approximately
$25,526
of Iowa net operating loss carryforwards available to offset future Iowa taxable income. The Company has recorded a valuation allowance against the tax effect of the Iowa net operating loss carryforwards, as management believes it is more likely than not that such carryforwards will expire without being utilized. The Iowa net operating loss carryforwards expire in
2020
and thereafter.
Note 12. Stock Compensation Plans
The West Bancorporation, Inc. 2017 Equity Incentive Plan (the 2017 Plan) was approved by the stockholders in April 2017. The 2017 Plan replaced the West Bancorporation, Inc. 2012 Equity Incentive Plan (the 2012 Plan). Upon approval of the 2017 Plan, the 2012 Plan was frozen and no new grants will be made under that plan. Outstanding awards under the 2012 Plan will continue pursuant to their terms and provisions. The Plans are administered by the Compensation Committee of the Board of Directors, which determines the specific individuals who will be granted awards under the 2017 Plan and the type and amount of any such awards. All employees and directors of, and service providers to, the Company and its subsidiary are eligible to become participants in the 2017 Plan, except that nonemployees may not be granted incentive stock options. Under the terms of the 2017 Plan, the Company may grant a total of
800,000
shares of the Company’s common stock as nonqualified and incentive stock options, stock appreciation rights and stock awards. As of
December 31, 2018
,
639,500
shares of the Company’s common stock remained available for future awards under the 2017 Plan.
Under the 2017 Plan, the Company may grant RSU awards, as determined by the Compensation Committee, that vest upon the completion of future service requirements or specified performance criteria. All RSUs granted through
December 31, 2018
under the 2017 and 2012 Plans were at
no
cost to the participants, and the participants will not be entitled to receive or accrue dividends until the RSUs have vested. Each RSU entitles the participant to receive
one
share of common stock on the vesting date or upon the participant’s termination due to death or disability, or upon a change in control of the Company if the RSUs are not fully assumed or if the RSUs are assumed and the participant’s employment is thereafter terminated by the Company without cause or by the participant for good reason. If a participant terminates employment prior to the end of the continuous service period other than due to death, disability or retirement, the award is forfeited. If a participant terminates service due to retirement, the RSUs will continue to vest, subject to provisions of the 2017 and 2012 Plans.
The following table includes a summary of nonvested RSU activity for the years ended
December 31, 2018
,
2017
and
2016
.
|
2018
|
2017
|
2016
|
||||||||||||||||||
|
Weighted
|
Weighted
|
Weighted
|
||||||||||||||||||
|
Average
|
Average
|
Average
|
||||||||||||||||||
|
Grant Date
|
Grant Date
|
Grant Date
|
||||||||||||||||||
|
Fair Value
|
Fair Value
|
Fair Value
|
||||||||||||||||||
|
(actual amounts, not in thousands)
|
Shares
|
Per Share
|
Shares
|
Per Share
|
Shares
|
Per Share
|
||||||||||||||
|
Nonvested shares, beginning balance
|
339,300
|
|
$
|
19.55
|
|
307,268
|
|
$
|
17.46
|
|
261,833
|
|
$
|
16.67
|
|
|||||
|
Granted
|
136,500
|
|
25.81
|
|
138,500
|
|
22.06
|
|
141,000
|
|
18.44
|
|
||||||||
|
Vested
|
(121,450
|
)
|
19.05
|
|
(106,468
|
)
|
16.79
|
|
(95,565
|
)
|
16.74
|
|
||||||||
|
Forfeited
|
—
|
|
—
|
|
—
|
|
—
|
|
—
|
|
—
|
|
||||||||
|
Nonvested shares, ending balance
|
354,350
|
|
$
|
22.13
|
|
339,300
|
|
$
|
19.55
|
|
307,268
|
|
$
|
17.46
|
|
|||||
The fair value of RSU awards that vested during
2018
,
2017
and
2016
was
$3,144
,
$2,371
and
$1,730
, respectively. Total compensation costs, including director compensation, recorded for the RSUs were
$2,741
,
$2,632
, and
$1,684
for the years ended
December 31, 2018
,
2017
and
2016
, respectively. The tax benefit related to vesting of RSUs totaled
$261
,
$285
and
$105
, respectively, for the years ended
December 31, 2018
,
2017
and
2016
. As of
December 31, 2018
, there was
$4,235
of unrecognized compensation cost related to nonvested RSUs, and the weighted average period over which these remaining costs are expected to be recognized was approximately
1.5
years.
84
West Bancorporation, Inc. and Subsidiary
Notes to Consolidated Financial Statements
(dollars in thousands, except per share data)
Note 13. Employee Savings and Stock Ownership Plan
The Company has an employee savings and stock ownership plan covering substantially all of its employees. The plan consists of two components. One component is an employee stock ownership plan. The other component is a discretionary contribution plan. Both components have a qualified cash or deferred arrangement under Internal Revenue Code Section 401(k). Matching and discretionary contributions are determined annually by the Board of Directors. The Company matched
100 percent
of the first
six percent
of employee deferrals and made an annual discretionary contribution of
four percent
of eligible employee compensation for the years ended
December 31, 2018
,
2017
and
2016
. Total matching and discretionary contribution expense for the years ended
December 31, 2018
,
2017
and
2016
, totaled
$1,040
,
$961
and
$1,023
, respectively.
As of
December 31, 2018
and
2017
, the plan held
306,678
and
294,423
shares, respectively, of the Company’s common stock. These shares are included in the computation of earnings per share. Dividends on shares held in the plan may be reinvested in Company common stock or paid in cash to the participants, at the election of the participants.
Note 14. Accumulated Other Comprehensive Income (Loss)
The following table summarizes the changes in the balances of each component of AOCI, net of tax, for the years ended
December 31, 2018
,
2017
and
2016
.
|
Unrealized
|
Accumulated
|
||||||||||
|
Unrealized
|
Gains
|
Other
|
|||||||||
|
Gains (Losses)
|
(Losses) on
|
Comprehensive
|
|||||||||
|
on Securities
|
Derivatives
|
Income (Loss)
|
|||||||||
|
Balance, December 31, 2015
|
$
|
342
|
|
$
|
(772
|
)
|
$
|
(430
|
)
|
||
|
Other comprehensive income (loss) before reclassifications
|
(1,394
|
)
|
547
|
|
(847
|
)
|
|||||
|
Amounts reclassified from accumulated other
|
|||||||||||
|
comprehensive income
|
(120
|
)
|
355
|
|
235
|
|
|||||
|
Net current period other comprehensive income (loss)
|
(1,514
|
)
|
902
|
|
(612
|
)
|
|||||
|
Balance, December 31, 2016
|
(1,172
|
)
|
130
|
|
(1,042
|
)
|
|||||
|
Other comprehensive (loss) before reclassifications
|
(697
|
)
|
(41
|
)
|
(738
|
)
|
|||||
|
Amounts reclassified from accumulated other
|
|||||||||||
|
comprehensive income
|
(368
|
)
|
256
|
|
(112
|
)
|
|||||
|
Net current period other comprehensive income (loss)
|
(1,065
|
)
|
215
|
|
(850
|
)
|
|||||
|
Balance, December 31, 2017
|
(2,237
|
)
|
345
|
|
(1,892
|
)
|
|||||
|
Transfer of securities held to maturity to securities available for sale
|
273
|
|
—
|
|
273
|
|
|||||
|
Other comprehensive income (loss) before reclassifications
|
(5,856
|
)
|
784
|
|
(5,072
|
)
|
|||||
|
Amounts reclassified from accumulated other
|
|||||||||||
|
comprehensive income
|
172
|
|
75
|
|
247
|
|
|||||
|
Net current period other comprehensive income (loss)
|
(5,411
|
)
|
859
|
|
(4,552
|
)
|
|||||
|
Reclassification of stranded tax effects
|
(475
|
)
|
105
|
|
(370
|
)
|
|||||
|
Balance, December 31, 2018
|
$
|
(8,123
|
)
|
$
|
1,309
|
|
$
|
(6,814
|
)
|
||
85
West Bancorporation, Inc. and Subsidiary
Notes to Consolidated Financial Statements
(dollars in thousands, except per share data)
Note 15. Regulatory Capital Requirements
The Company and West Bank are subject to various regulatory capital requirements administered by federal and state banking agencies. Failure to meet minimum capital requirements (as shown in the following table) can result in certain mandatory and possibly additional discretionary actions by regulators which, if undertaken, could have a direct material effect on the Company’s consolidated financial statements. Under capital adequacy guidelines and the regulatory framework for prompt corrective action, the Company and West Bank must meet specific capital guidelines that involve quantitative measures of their assets, liabilities and certain off-balance-sheet items as calculated under regulatory requirements. The Company’s and West Bank’s capital amounts and classifications are also subject to qualitative judgments by the regulators about components, risk weightings and other factors. Management believes the Company and West Bank met all capital adequacy requirements to which they were subject as of
December 31, 2018
.
The Company’s and West Bank’s capital amounts and ratios are presented in the following table as of
December 31, 2018
and
2017
.
|
Actual
|
For Capital Adequacy Purposes
|
For Capital
Adequacy Purposes With Capital Conservation Buffer
|
To Be Well-Capitalized
Under Prompt
Corrective
Action Provisions
|
|||||||||||||||||||||||||
|
|
Amount
|
Ratio
|
Amount
|
Ratio
|
Amount
|
Ratio
|
Amount
|
Ratio
|
||||||||||||||||||||
|
As of December 31, 2018:
|
|
|
|
|
|
|
||||||||||||||||||||||
|
Total Capital (to Risk-Weighted Assets)
|
||||||||||||||||||||||||||||
|
Consolidated
|
$
|
234,526
|
|
11.50
|
%
|
$
|
163,213
|
|
8.00
|
%
|
$
|
201,466
|
|
9.875
|
%
|
N/A
|
|
N/A
|
|
|||||||||
|
West Bank
|
245,962
|
|
12.07
|
%
|
163,076
|
|
8.00
|
%
|
201,297
|
|
9.875
|
%
|
$
|
203,845
|
|
10.00
|
%
|
|||||||||||
|
|
|
|
|
|
|
|
|
|
|
|
|
|
||||||||||||||||
|
Tier 1 Capital (to Risk-Weighted Assets)
|
|
|
|
|
|
|
|
|
|
|
||||||||||||||||||
|
Consolidated
|
217,837
|
|
10.68
|
%
|
122,410
|
|
6.00
|
%
|
160,663
|
|
7.875
|
%
|
N/A
|
|
N/A
|
|
||||||||||||
|
West Bank
|
229,273
|
|
11.25
|
%
|
122,307
|
|
6.00
|
%
|
160,528
|
|
7.875
|
%
|
163,076
|
|
8.00
|
%
|
||||||||||||
|
|
|
|
|
|
|
|
|
|
|
|
|
|
||||||||||||||||
|
Common Equity Tier 1 Capital (to Risk-Weighted Assets)
|
||||||||||||||||||||||||||||
|
Consolidated
|
197,837
|
|
9.70
|
%
|
91,807
|
|
4.50
|
%
|
130,060
|
|
6.375
|
%
|
N/A
|
|
N/A
|
|
||||||||||||
|
West Bank
|
229,273
|
|
11.25
|
%
|
91,730
|
|
4.50
|
%
|
129,951
|
|
6.375
|
%
|
132,499
|
|
6.50
|
%
|
||||||||||||
|
Tier 1 Capital (to Average Assets)
|
|
|
|
|
|
|
|
|
|
|
|
|
||||||||||||||||
|
Consolidated
|
217,837
|
|
9.74
|
%
|
89,485
|
|
4.00
|
%
|
89,485
|
|
4.00
|
%
|
N/A
|
|
N/A
|
|
||||||||||||
|
West Bank
|
229,273
|
|
10.26
|
%
|
89,410
|
|
4.00
|
%
|
89,410
|
|
4.00
|
%
|
111,762
|
|
5.00
|
%
|
||||||||||||
|
|
|
|
|
|
|
|
|
|
|
|
|
|
||||||||||||||||
|
As of December 31, 2017:
|
|
|
|
|
|
|
|
|
|
|
|
|
||||||||||||||||
|
Total Capital (to Risk-Weighted Assets)
|
|
|
|
|
|
|
|
|
|
|
||||||||||||||||||
|
Consolidated
|
$
|
216,420
|
|
11.76
|
%
|
$
|
147,169
|
|
8.00
|
%
|
$
|
170,164
|
|
9.250
|
%
|
N/A
|
|
N/A
|
|
|||||||||
|
West Bank
|
235,570
|
|
12.82
|
%
|
147,049
|
|
8.00
|
%
|
170,026
|
|
9.250
|
%
|
$
|
183,812
|
|
10.00
|
%
|
|||||||||||
|
|
|
|
|
|
|
|
|
|
|
|
|
|
||||||||||||||||
|
Tier 1 Capital (to Risk-Weighted Assets)
|
|
|
|
|
|
|
|
|
|
|
||||||||||||||||||
|
Consolidated
|
199,990
|
|
10.87
|
%
|
110,377
|
|
6.00
|
%
|
133,372
|
|
7.250
|
%
|
N/A
|
|
N/A
|
|
||||||||||||
|
West Bank
|
219,140
|
|
11.92
|
%
|
110,287
|
|
6.00
|
%
|
133,263
|
|
7.250
|
%
|
147,049
|
|
8.00
|
%
|
||||||||||||
|
Common Equity Tier 1 Capital (to Risk-Weighted Assets)
|
||||||||||||||||||||||||||||
|
Consolidated
|
179,990
|
|
9.78
|
%
|
82,783
|
|
4.50
|
%
|
105,778
|
|
5.750
|
%
|
N/A
|
|
N/A
|
|
||||||||||||
|
West Bank
|
219,140
|
|
11.92
|
%
|
82,715
|
|
4.50
|
%
|
105,692
|
|
5.750
|
%
|
119,478
|
|
6.50
|
%
|
||||||||||||
|
|
|
|
|
|
|
|
|
|
|
|
|
|
||||||||||||||||
|
Tier 1 Capital (to Average Assets)
|
|
|
|
|
|
|
|
|
|
|
||||||||||||||||||
|
Consolidated
|
199,990
|
|
9.60
|
%
|
83,326
|
|
4.00
|
%
|
83,326
|
|
4.00
|
%
|
N/A
|
|
N/A
|
|
||||||||||||
|
West Bank
|
219,140
|
|
10.52
|
%
|
83,287
|
|
4.00
|
%
|
83,287
|
|
4.00
|
%
|
104,109
|
|
5.00
|
%
|
||||||||||||
86
West Bancorporation, Inc. and Subsidiary
Notes to Consolidated Financial Statements
(dollars in thousands, except per share data)
On January 1, 2015, the Company and West Bank became subject to the rules of the Basel III Rule and related Dodd-Frank Wall Street Reform and Consumer Protection Act changes. The rules included the implementation of a capital conservation buffer that is added to the minimum requirements for capital adequacy purposes. The capital conservation buffer is subject to a three year phase-in period that began January 1, 2016 and will be fully phased-in on January 1, 2019 at 2.5 percent. The required phase-in capital conservation buffer was 1.875 percent during
2018
and 1.25 percent during
2017
. A banking organization with a conservation buffer of less than the required phase-in amount will be subject to limitations on capital distributions, including dividend payments and certain discretionary bonus payments to executive officers. As of
December 31, 2018
, the ratios for the Company and West Bank were sufficient to meet the fully phased-in conservation buffer.
The ability of the Company to pay dividends to its stockholders is dependent upon dividends paid by its subsidiary, West Bank. There are currently no restrictions on such dividends, besides the general restrictions imposed on all Iowa state-chartered banks by applicable law.
The Company’s tangible common equity ratio was
8.32 percent
and
8.42 percent
at
December 31, 2018
and
2017
, respectively. The tangible common equity ratio is computed by dividing total equity less preferred stock and intangible assets by total assets less intangible assets. As of
December 31, 2018
and
2017
, the Company had
no
intangible assets or preferred stock.
Note 16. Commitments and Contingencies
The Company leases real estate under a number of noncancelable operating lease agreements. Rent expense related to these leases was
$1,540
,
$1,344
and
$1,293
, for the years ended
December 31, 2018
,
2017
and
2016
, respectively.
Total estimated minimum rental commitments were as follows as of
December 31, 2018
.
|
2019
|
$
|
1,534
|
|
|
2020
|
1,534
|
|
|
|
2021
|
1,479
|
|
|
|
2022
|
1,448
|
|
|
|
2023
|
1,457
|
|
|
|
Thereafter
|
3,858
|
|
|
|
|
$
|
11,310
|
|
The Company had commitments to invest in qualified affordable housing projects totaling
$4,421
and
$6,130
as of
December 31, 2018
and
2017
, respectively.
Required reserve balances
: West Bank is required to maintain an average reserve balance with the Federal Reserve Bank, which is included in cash and due from banks. Required reserve balances were approximately
$4,527
and
$6,086
as of
December 31, 2018
and
2017
, respectively.
Financial instruments with off-balance sheet risk
: The Company is party to financial instruments with off-balance sheet risk in the normal course of business to meet the financing needs of its customers. These financial instruments include commitments to extend credit and standby letters of credit. These instruments involve, to varying degrees, elements of credit risk in excess of the amount recognized in the consolidated balance sheets. The Company’s exposure to credit loss in the event of nonperformance by the other party to the financial instrument for commitments to extend credit and standby letters of credit is represented by the contractual amount of those instruments. The Company uses the same credit policies in making commitments and conditional obligations that it uses for on-balance sheet instruments. Commitments to lend are subject to borrowers’ continuing compliance with existing credit agreements. The Company’s commitments consisted of the following approximate amounts as of
December 31, 2018
and
2017
.
|
|
2018
|
2017
|
|||||
|
Commitments to extend credit
|
$
|
641,581
|
|
$
|
617,949
|
|
|
|
Standby letters of credit
|
6,631
|
|
5,996
|
|
|||
|
|
$
|
648,212
|
|
$
|
623,945
|
|
|
87
West Bancorporation, Inc. and Subsidiary
Notes to Consolidated Financial Statements
(dollars in thousands, except per share data)
Commitments to extend credit are agreements to lend to a customer as long as there is no violation of any condition established in the contract and generally expire within one year. Commitments to extend credit of approximately
$90,781
at
December 31, 2018
, expire beyond one year. Since many of the commitments are expected to expire without being drawn upon, the total commitment amounts do not necessarily represent future cash requirements. The Company evaluates each customer’s creditworthiness on a case-by-case basis. The amount of collateral obtained is based on management’s credit evaluation of the party. Collateral held varies, but may include accounts receivable, inventory, equipment, and residential and commercial real estate.
Standby letters of credit are conditional commitments issued by the Company to guarantee the performance of a customer to a third party and generally expire within one year. Those guarantees are primarily issued to support public and private borrowing arrangements. The credit risk involved in issuing letters of credit is essentially the same as that involved in extending loan facilities to customers. Collateral held varies as specified above and is required in instances the Company deems necessary. In the event the customer does not perform in accordance with the terms of the third-party agreement, West Bank would be required to fund the commitment. The maximum potential amount of future payments West Bank could be required to make is represented by the contractual amount for letters of credit shown in the table above. If the commitment is funded, West Bank would be entitled to seek recovery from the customer. At
December 31, 2018
and
2017
, no amounts have been recorded as liabilities for West Bank’s potential obligations under these guarantees.
West Bank previously executed MPF Master Commitments (Commitments) with the FHLB of Des Moines to deliver residential mortgage loans and to guarantee the payment of any realized losses that exceed the FHLB’s first loss account for mortgages delivered under the Commitments. West Bank receives credit enhancement fees from the FHLB for providing this guarantee and continuing to assist with managing the credit risk of the MPF Program residential mortgage loans. The term of the most recent Commitment was through January 16, 2015 and was not renewed. The outstanding balance of mortgage loans sold under the MPF Program was
$78,024
and
$94,292
at
December 31, 2018
and
2017
, respectively.
Concentrations of credit risk
: Substantially all of the Company’s loans, commitments to extend credit and standby letters of credit have been granted to customers in the Company’s market areas (a 50-mile radius of the greater Des Moines, Iowa, metropolitan area, a 30-mile radius of the Iowa City, Iowa, metropolitan area and a 30-mile radius of the Rochester, Minnesota, metropolitan area). The concentrations of credit by type of loan are set forth in Note 4. The distribution of commitments to extend credit approximates the distribution of loans outstanding. Standby letters of credit were granted primarily to commercial borrowers.
Contingencies
: Neither the Company nor West Bank is a party, and no property of these entities is subject, to any material pending legal proceedings, other than ordinary routine litigation incidental to West Bank’s business. The Company does not know of any proceeding contemplated by a governmental authority against the Company or West Bank.
88
West Bancorporation, Inc. and Subsidiary
Notes to Consolidated Financial Statements
(dollars in thousands, except per share data)
Note 17. Fair Value Measurements
Accounting guidance on fair value measurements and disclosures
defines fair value and establishes a framework for measuring the fair value of assets and liabilities using a hierarchy system. Fair value is the price that would be received to sell an asset or paid to transfer a liability in an orderly transaction between market participants in the market in which the reporting entity transacts business.
The Company’s balance sheet contains investment securities available for sale and derivative instruments that are recorded at fair value on a recurring basis. The three-level valuation hierarchy for disclosure of fair value is as follows:
Level 1 uses quoted market prices in active markets for identical assets or liabilities.
Level 2 uses observable market-based inputs or unobservable inputs that are corroborated by market data.
Level 3 uses unobservable inputs that are not corroborated by market data.
The Company’s policy is to recognize transfers between Levels at the end of each reporting period, if applicable. There were
no
transfers between Levels of the fair value hierarchy during
2018
or
2017
.
The following is a description of valuation methodologies used for financial assets and liabilities recorded at fair value on a recurring basis.
Investment securities available for sale:
When available, quoted market prices are used to determine the fair value of investment securities (Level 1). If quoted market prices are not available, the Company determines fair value based on various sources and may apply matrix pricing with observable prices for similar bonds where a price for the identical bond is not observable (Level 2). The fair values of these securities are determined by pricing models that consider observable market data such as interest rate volatilities, LIBOR yield curve, credit spreads, prices from market makers and live trading systems. For the corporate bond portfolio, the Company has elected to use a matrix pricing model as a practical expedient to individual quoted market prices.
Generally, management obtains the fair value of investment securities at the end of each reporting period via a third-party pricing service. Management reviewed the valuation process used by the third party and believed that process was valid. On a quarterly basis, management corroborates the fair values of a randomly selected sample of investment securities by obtaining pricing from an independent investment portfolio management firm and compares the two sets of fair values. Any significant variances are reviewed and investigated. For a sample of securities, the fair values are further validated by management, with assistance from an independent investment portfolio management firm, by obtaining details of the inputs used by the pricing service. Those inputs were independently tested, and management concluded the fair values were consistent with GAAP requirements and the investment securities were properly classified in the fair value hierarchy.
Derivative instruments:
The Company’s derivative instruments consist of interest rate swaps, which are accounted for as cash flow hedges. The Company’s derivative positions are classified within Level 2 of the fair value hierarchy and are valued using models generally accepted in the financial services industry and that use actively quoted or observable market input values from external market data providers and/or nonbinding broker-dealer quotations. The fair value of the derivatives are determined using discounted cash flow models. These models’ key assumptions include the contractual terms of the respective contract along with significant observable inputs, including interest rates, yield curves, nonperformance risk and volatility.
89
West Bancorporation, Inc. and Subsidiary
Notes to Consolidated Financial Statements
(dollars in thousands, except per share data)
The following tables present the balances of financial assets and liabilities measured at fair value on a recurring basis by level as of
December 31, 2018
and
2017
.
|
|
2018
|
|||||||||||||||
|
Description
|
Total
|
Level 1
|
Level 2
|
Level 3
|
||||||||||||
|
Financial assets:
|
||||||||||||||||
|
Investment securities available for sale:
|
|
|
|
|
||||||||||||
|
State and political subdivisions
|
$
|
149,156
|
|
$
|
—
|
|
$
|
149,156
|
|
$
|
—
|
|
||||
|
Collateralized mortgage obligations
|
157,004
|
|
—
|
|
157,004
|
|
—
|
|
||||||||
|
Mortgage-backed securities
|
63,378
|
|
—
|
|
63,378
|
|
—
|
|
||||||||
|
Asset-backed securities
|
31,903
|
|
—
|
|
31,903
|
|
—
|
|
||||||||
|
Trust preferred security
|
1,900
|
|
—
|
|
1,900
|
|
—
|
|
||||||||
|
Corporate notes
|
50,417
|
|
—
|
|
50,417
|
|
—
|
|
||||||||
|
Derivative instrument, interest rate swaps
|
1,863
|
|
—
|
|
1,863
|
|
—
|
|
||||||||
|
|
2017
|
|||||||||||||||
|
Description
|
Total
|
Level 1
|
Level 2
|
Level 3
|
||||||||||||
|
Financial assets:
|
||||||||||||||||
|
Investment securities available for sale:
|
|
|
|
|
||||||||||||
|
State and political subdivisions
|
$
|
146,313
|
|
$
|
—
|
|
$
|
146,313
|
|
$
|
—
|
|
||||
|
Collateralized mortgage obligations
|
159,932
|
|
—
|
|
159,932
|
|
—
|
|
||||||||
|
Mortgage-backed securities
|
60,429
|
|
—
|
|
60,429
|
|
—
|
|
||||||||
|
Asset-backed securities
|
45,195
|
|
—
|
|
45,195
|
|
—
|
|
||||||||
|
Trust preferred security
|
2,006
|
|
—
|
|
2,006
|
|
—
|
|
||||||||
|
Corporate notes
|
30,344
|
|
—
|
|
30,344
|
|
—
|
|
||||||||
|
Derivative instrument, interest rate swap
|
895
|
|
—
|
|
895
|
|
—
|
|
||||||||
|
Financial liabilities:
|
||||||||||||||||
|
Derivative instrument, interest rate swap
|
$
|
86
|
|
$
|
—
|
|
$
|
86
|
|
$
|
—
|
|
||||
Certain assets are measured at fair value on a nonrecurring basis. That is, they are subject to fair value adjustments in certain circumstances (for example, when there is evidence of impairment). As of both
December 31, 2018
and
2017
, impaired loans with a fair value adjustment had a net book value of
$0
. Impaired loans are classified within Level 3 of the fair value hierarchy and are evaluated and valued at the lower of cost or fair value when the loan is identified as impaired. Fair value is measured based on the value of the collateral securing these loans. The types of collateral vary widely and could include accounts receivables, inventory, a variety of equipment and real estate. Evaluations of the underlying assets are completed for each impaired loan with a specific reserve. Collateral evaluations are reviewed and discounted as appropriate based on knowledge of the specific type of collateral. In the case of real estate, an independent appraisal may be obtained. Types of discounts considered included aging of receivables, condition of the collateral, potential market for the collateral and estimated disposal costs. These discounts will vary from loan to loan and may be discounted based on management’s opinions concerning market developments or the client’s business.
90
West Bancorporation, Inc. and Subsidiary
Notes to Consolidated Financial Statements
(dollars in thousands, except per share data)
GAAP requires disclosure of the fair value of financial assets and liabilities, including those that are not measured and reported at fair value on a recurring or nonrecurring basis. The following table presents the carrying amounts and approximate fair values of financial assets and liabilities as of
December 31, 2018
and
2017
.
|
|
2018
|
2017
|
|||||||||||||||
|
|
Fair Value
Hierarchy Level
|
Carrying
Amount
|
Approximate
Fair Value
|
Carrying
Amount
|
Approximate
Fair Value
|
||||||||||||
|
Financial assets:
|
|
|
|
|
|||||||||||||
|
Cash and due from banks
|
Level 1
|
$
|
46,369
|
|
$
|
46,369
|
|
$
|
34,952
|
|
$
|
34,952
|
|
||||
|
Federal funds sold
|
Level 1
|
1,105
|
|
1,105
|
|
12,997
|
|
12,997
|
|
||||||||
|
Investment securities available for sale
|
Level 2
|
453,758
|
|
453,758
|
|
444,219
|
|
444,219
|
|
||||||||
|
Investment securities held to maturity
|
Level 2
|
—
|
|
—
|
|
45,527
|
|
45,890
|
|
||||||||
|
Federal Home Loan Bank stock
|
Level 1
|
12,037
|
|
12,037
|
|
9,174
|
|
9,174
|
|
||||||||
|
Loans, net
|
Level 2
|
1,705,141
|
|
1,688,700
|
|
1,494,070
|
|
1,490,166
|
|
||||||||
|
Accrued interest receivable
|
Level 1
|
7,631
|
|
7,631
|
|
7,344
|
|
7,344
|
|
||||||||
|
Interest rate swaps
|
Level 2
|
1,863
|
|
1,863
|
|
895
|
|
895
|
|
||||||||
|
Financial liabilities:
|
|
|
|
|
|
|
|
|
|||||||||
|
Deposits
|
Level 2
|
$
|
1,894,529
|
|
$
|
1,893,621
|
|
$
|
1,810,813
|
|
$
|
1,810,924
|
|
||||
|
Federal funds purchased
|
Level 1
|
19,985
|
|
19,985
|
|
545
|
|
545
|
|
||||||||
|
Subordinated notes, net
|
Level 2
|
20,425
|
|
15,498
|
|
20,412
|
|
15,357
|
|
||||||||
|
Federal Home Loan Bank advances, net
|
Level 2
|
137,878
|
|
137,878
|
|
76,382
|
|
76,382
|
|
||||||||
|
Long-term debt, net
|
Level 2
|
27,040
|
|
27,000
|
|
22,917
|
|
22,860
|
|
||||||||
|
Accrued interest payable
|
Level 1
|
1,317
|
|
1,317
|
|
736
|
|
736
|
|
||||||||
|
Interest rate swap
|
Level 2
|
—
|
|
—
|
|
86
|
|
86
|
|
||||||||
|
Off-balance-sheet financial instruments:
|
|
|
|
|
|
|
|
|
|||||||||
|
Commitments to extend credit
|
Level 3
|
—
|
|
—
|
|
—
|
|
—
|
|
||||||||
|
Standby letters of credit
|
Level 3
|
—
|
|
—
|
|
—
|
|
—
|
|
||||||||
91
West Bancorporation, Inc. and Subsidiary
Notes to Consolidated Financial Statements
(dollars in thousands, except per share data)
Note 18. West Bancorporation, Inc. (Parent Company Only) Condensed Financial Statements
|
Balance Sheets
|
||||||||
|
December 31, 2018 and 2017
|
||||||||
|
|
2018
|
2017
|
||||||
|
ASSETS
|
|
|
||||||
|
Cash
|
$
|
3,951
|
|
$
|
3,226
|
|
||
|
Investment in West Bank
|
221,559
|
|
216,693
|
|
||||
|
Investment in West Bancorporation Capital Trust I
|
619
|
|
619
|
|
||||
|
Other assets
|
1,232
|
|
1,034
|
|
||||
|
Total assets
|
$
|
227,361
|
|
$
|
221,572
|
|
||
|
LIABILITIES AND STOCKHOLDERS’ EQUITY
|
|
|
|
|
||||
|
LIABILITIES
|
|
|
|
|
||||
|
Accrued expenses and other liabilities
|
$
|
663
|
|
$
|
562
|
|
||
|
Subordinated notes, net
|
20,425
|
|
20,412
|
|
||||
|
Long-term debt
|
15,250
|
|
22,500
|
|
||||
|
Total liabilities
|
36,338
|
|
43,474
|
|
||||
|
STOCKHOLDERS’ EQUITY
|
|
|
|
|
||||
|
Preferred stock
|
—
|
|
—
|
|
||||
|
Common stock
|
3,000
|
|
3,000
|
|
||||
|
Additional paid-in capital
|
25,128
|
|
23,463
|
|
||||
|
Retained earnings
|
169,709
|
|
153,527
|
|
||||
|
Accumulated other comprehensive loss
|
(6,814
|
)
|
(1,892
|
)
|
||||
|
Total stockholders’ equity
|
191,023
|
|
178,098
|
|
||||
|
Total liabilities and stockholders’ equity
|
$
|
227,361
|
|
$
|
221,572
|
|
||
92
West Bancorporation, Inc. and Subsidiary
Notes to Consolidated Financial Statements
(dollars in thousands, except per share data)
|
Statements of Income
|
||||||||||||
|
Years Ended December 31, 2018, 2017 and 2016
|
||||||||||||
|
2018
|
2017
|
2016
|
||||||||||
|
Operating income:
|
||||||||||||
|
Equity in net income of West Bank
|
$
|
30,282
|
|
$
|
23,933
|
|
$
|
23,544
|
|
|||
|
Equity in net income of West Bancorporation Capital Trust I
|
33
|
|
27
|
|
23
|
|
||||||
|
Intercompany rental income
|
—
|
|
333
|
|
503
|
|
||||||
|
Other rental income
|
—
|
|
21
|
|
50
|
|
||||||
|
Total operating income
|
30,315
|
|
24,314
|
|
24,120
|
|
||||||
|
Operating expenses:
|
||||||||||||
|
Interest on subordinated notes
|
1,076
|
|
901
|
|
728
|
|
||||||
|
Interest on long-term debt
|
750
|
|
517
|
|
145
|
|
||||||
|
Occupancy
|
—
|
|
187
|
|
280
|
|
||||||
|
Other expenses
|
530
|
|
602
|
|
443
|
|
||||||
|
Total operating expenses
|
2,356
|
|
2,207
|
|
1,596
|
|
||||||
|
Income before income taxes
|
27,959
|
|
22,107
|
|
22,524
|
|
||||||
|
Income tax benefits
|
(549
|
)
|
(963
|
)
|
(492
|
)
|
||||||
|
Net income
|
$
|
28,508
|
|
$
|
23,070
|
|
$
|
23,016
|
|
|||
93
West Bancorporation, Inc. and Subsidiary
Notes to Consolidated Financial Statements
(dollars in thousands, except per share data)
|
Statements of Cash Flows
|
||||||||||||
|
Years Ended December 31, 2018, 2017 and 2016
|
||||||||||||
|
|
2018
|
2017
|
2016
|
|||||||||
|
Cash Flows from Operating Activities:
|
|
|
|
|||||||||
|
Net income
|
$
|
28,508
|
|
$
|
23,070
|
|
$
|
23,016
|
|
|||
|
Adjustments to reconcile net income to net cash provided by
|
|
|
|
|
||||||||
|
operating activities:
|
|
|
|
|
||||||||
|
Equity in net income of West Bank
|
(30,282
|
)
|
(23,933
|
)
|
(23,544
|
)
|
||||||
|
Equity in net income of West Bancorporation Capital Trust I
|
(33
|
)
|
(27
|
)
|
(23
|
)
|
||||||
|
Dividends received from West Bank
|
22,300
|
|
16,800
|
|
14,400
|
|
||||||
|
Dividends received from West Bancorporation Capital Trust I
|
33
|
|
27
|
|
23
|
|
||||||
|
Amortization
|
13
|
|
17
|
|
20
|
|
||||||
|
Depreciation
|
—
|
|
178
|
|
244
|
|
||||||
|
Deferred income tax (benefits)
|
—
|
|
(240
|
)
|
97
|
|
||||||
|
Change in assets and liabilities:
|
||||||||||||
|
(Increase) decrease in other assets
|
107
|
|
50
|
|
(79
|
)
|
||||||
|
Increase (decrease) in accrued expenses and other liabilities
|
25
|
|
(549
|
)
|
641
|
|
||||||
|
Net cash provided by operating activities
|
20,671
|
|
15,393
|
|
14,795
|
|
||||||
|
Cash Flows from Investing Activities:
|
|
|
|
|
|
|
||||||
|
Proceeds from sales of premises
|
—
|
|
18,032
|
|
—
|
|
||||||
|
Purchases of premises
|
—
|
|
(16
|
)
|
(10,539
|
)
|
||||||
|
Capital contribution to West Bank
|
—
|
|
(40,000
|
)
|
—
|
|
||||||
|
Net cash (used in) investing activities
|
—
|
|
(21,984
|
)
|
(10,539
|
)
|
||||||
|
Cash Flows from Financing Activities:
|
|
|
|
|
|
|
||||||
|
Proceeds from long-term debt
|
—
|
|
22,000
|
|
—
|
|
||||||
|
Principal payments on long-term debt
|
(7,250
|
)
|
(4,629
|
)
|
(3,286
|
)
|
||||||
|
Common stock cash dividends
|
(12,696
|
)
|
(11,499
|
)
|
(10,800
|
)
|
||||||
|
Net cash provided by (used in) financing activities
|
(19,946
|
)
|
5,872
|
|
(14,086
|
)
|
||||||
|
Net increase (decrease) in cash
|
725
|
|
(719
|
)
|
(9,830
|
)
|
||||||
|
Cash:
|
|
|
||||||||||
|
Beginning
|
3,226
|
|
3,945
|
|
13,775
|
|
||||||
|
Ending
|
$
|
3,951
|
|
$
|
3,226
|
|
$
|
3,945
|
|
|||
94
West Bancorporation, Inc. and Subsidiary
Notes to Consolidated Financial Statements
(dollars in thousands, except per share data)
Note 19. Selected Quarterly Financial Data (unaudited)
|
|
2018
|
|||||||||||||||
|
Three months ended
|
March 31
|
June 30
|
September 30
|
December 31
|
||||||||||||
|
Interest income
|
$
|
19,730
|
|
$
|
20,537
|
|
$
|
21,920
|
|
$
|
22,606
|
|
||||
|
Interest expense
|
4,314
|
|
5,238
|
|
6,233
|
|
6,950
|
|
||||||||
|
Net interest income
|
15,416
|
|
15,299
|
|
15,687
|
|
15,656
|
|
||||||||
|
Provision for loan losses
|
150
|
|
—
|
|
(400
|
)
|
—
|
|
||||||||
|
Net interest income after provision for loan losses
|
15,266
|
|
15,299
|
|
16,087
|
|
15,656
|
|
||||||||
|
Noninterest income
|
1,913
|
|
2,023
|
|
2,114
|
|
1,702
|
|
||||||||
|
Noninterest expense
|
8,287
|
|
8,958
|
|
8,561
|
|
9,186
|
|
||||||||
|
Income before income taxes
|
8,892
|
|
8,364
|
|
9,640
|
|
8,172
|
|
||||||||
|
Income taxes
|
1,508
|
|
1,600
|
|
2,507
|
|
945
|
|
||||||||
|
Net income
|
$
|
7,384
|
|
$
|
6,764
|
|
$
|
7,133
|
|
$
|
7,227
|
|
||||
|
Basic earnings per common share
|
$
|
0.46
|
|
$
|
0.42
|
|
$
|
0.44
|
|
$
|
0.44
|
|
||||
|
Diluted earnings per common share
|
$
|
0.45
|
|
$
|
0.41
|
|
$
|
0.43
|
|
$
|
0.44
|
|
||||
|
|
2017
|
|||||||||||||||
|
Three months ended
|
March 31
|
June 30
|
September 30
|
December 31
|
||||||||||||
|
Interest income
|
$
|
16,791
|
|
$
|
18,166
|
|
$
|
18,560
|
|
$
|
19,517
|
|
||||
|
Interest expense
|
2,402
|
|
3,073
|
|
3,529
|
|
3,973
|
|
||||||||
|
Net interest income
|
14,389
|
|
15,093
|
|
15,031
|
|
15,544
|
|
||||||||
|
Provision for loan losses
|
—
|
|
—
|
|
—
|
|
—
|
|
||||||||
|
Net interest income after provision for loan losses
|
14,389
|
|
15,093
|
|
15,031
|
|
15,544
|
|
||||||||
|
Noninterest income
|
2,160
|
|
2,316
|
|
2,264
|
|
1,908
|
|
||||||||
|
Noninterest expense
|
8,043
|
|
8,172
|
|
8,020
|
|
8,032
|
|
||||||||
|
Income before income taxes
|
8,506
|
|
9,237
|
|
9,275
|
|
9,420
|
|
||||||||
|
Income taxes
|
2,400
|
|
2,872
|
|
2,870
|
|
5,226
|
|
||||||||
|
Net income
|
$
|
6,106
|
|
$
|
6,365
|
|
$
|
6,405
|
|
$
|
4,194
|
|
||||
|
Basic earnings per common share
|
$
|
0.38
|
|
$
|
0.39
|
|
$
|
0.40
|
|
$
|
0.26
|
|
||||
|
Diluted earnings per common share
|
$
|
0.37
|
|
$
|
0.39
|
|
$
|
0.39
|
|
$
|
0.26
|
|
||||
95
ITEM 9. CHANGES IN AND DISAGREEMENTS WITH ACCOUNTANTS ON ACCOUNTING AND FINANCIAL DISCLOSURE
Within the two years prior to the date of the most recent financial statements, there have been no changes in or disagreements with accountants of the Company.
ITEM 9A. CONTROLS AND PROCEDURES
Disclosure Controls and Procedures
As of the end of the period covered by this report, an evaluation of the effectiveness of the Company’s disclosure controls and procedures (as defined in Exchange Act Rule 13a-15(e)) was performed under the supervision and with the participation of the Company’s Chief Executive Officer and Chief Financial Officer. Based on that evaluation, the Chief Executive Officer and the Chief Financial Officer have concluded that the Company’s current disclosure controls and procedures were effective to ensure that information required to be disclosed by the Company in the reports that it files or submits under the Exchange Act was recorded, processed, summarized and reported within the time periods specified in the SEC’s rules and forms.
Management’s Report on Internal Control over Financial Reporting
Management of the Company is responsible for establishing and maintaining adequate internal control over financial reporting (as defined in Rule 13a-15(f) and 15d-15(f) under the Exchange Act). The Company’s internal control system is a process designed to provide reasonable assurance to the Company’s management and Board of Directors regarding the preparation and fair presentation of published financial statements.
Internal control over financial reporting of the Company includes those policies and procedures that pertain to the maintenance of records that, in reasonable detail, accurately and fairly reflect the transactions of the Company; provide reasonable assurance that transactions are recorded as necessary to permit preparation of financial statements in accordance with generally accepted accounting principles, and that receipts and expenditures of the Company are being made only in accordance with authorizations of management and directors of the Company; and provide reasonable assurance regarding prevention or timely detection of unauthorized acquisition, use or disposition of the Company’s assets that could have a material effect on the Company’s consolidated financial statements.
Because of inherent limitations in any system of internal control, no matter how well designed, misstatements due to error or fraud may occur and not be detected, including the possibility of the circumvention or overriding of controls. Accordingly, even effective internal control over financial reporting can provide only reasonable assurance with respect to financial statement preparation. Further, because of changes in conditions, internal control effectiveness may vary over time.
Management assessed the Company’s internal control over financial reporting as of December 31,
2018
. This assessment was based on criteria for effective internal control over financial reporting set forth by the Committee of Sponsoring Organizations of the Treadway Commission in
Internal Control-Integrated Framework
in 2013. Based on this assessment, the Chief Executive Officer and Chief Financial Officer assert that the Company maintained effective internal control over financial reporting as of December 31,
2018
based on the specified criteria.
The Company’s independent registered public accounting firm, which audited the consolidated financial statements included in this annual report, has issued a report on the Company’s internal control over financial reporting as of December 31,
2018
that appears in Item 8 of this Form 10-K.
Changes in Internal Control Over Financial Reporting
There were no changes in the Company’s internal control over financial reporting (as defined in Rule 13a-15(f) and 15d-15(f) under the Exchange Act) that occurred during the fourth fiscal quarter of
2018
that have materially affected, or are reasonably likely to materially affect, the Company’s internal control over financial reporting.
ITEM 9B. OTHER INFORMATION
The Company has no information to be disclosed under this item.
96
PART III
ITEM 10. DIRECTORS, EXECUTIVE OFFICERS, AND CORPORATE GOVERNANCE
The information for directors and executive officers as required pursuant to Item 401 of Regulation S-K can be found under the captions “Proposal 1. Election of Directors” and “Governance and Board of Directors—Executive Officers of the Company” in the Company’s definitive Proxy Statement on Form DEF 14A, which was filed with the SEC on
February 28, 2019
, and is incorporated herein by reference.
Section 16(a) Beneficial Ownership Reporting Compliance
Section 16(a) of the Exchange Act requires that the Company’s directors and executive officers and persons who own more than 10 percent of the Company’s common stock file initial reports of ownership and reports of changes of ownership with the SEC. Reporting persons are required by SEC regulations to furnish the Company with copies of all Section 16(a) forms they file. The Company has not received any Section 16(a) forms indicating that any one person owns more than 10 percent of the Company’s stock, and the Company does not know of any one stockholder who owns more than 10 percent of the Company’s stock. Based solely on its review of the copies of Section 16(a) forms received from its directors and executive officers and written representations that no other reports were required, the Company believes that all Section 16(a) reports applicable to its directors and officers during
2018
were filed on a timely basis.
Code of Ethics
The Company has adopted a Code of Conduct that applies to all directors, officers and employees, including the Chief Executive Officer, Chief Financial Officer and Chief Accounting Officer. A copy of the Code of Conduct is available at the Investor Relations, Corporate Governance section of the Company’s website at www.westbankstrong.com, and the Company intends to satisfy its disclosure requirement by this reference. We intend to satisfy the disclosure requirements under Item 5.05 of Form 8-K regarding any amendment to or waiver of the Code of Conduct with respect to our Chief Executive Officer, Chief Financial Officer and Chief Accounting Officer, and persons performing similar functions, by posting such information on our website.
Stockholder Recommendations for Nominees to the Board of Directors
The information required pursuant to Item 407(c)(3) of Regulation S-K can be found under the caption “General Matters—2020 Stockholder Proposals” in the Company’s definitive Proxy Statement on Form DEF 14A, which was filed with the SEC on
February 28, 2019
, and is incorporated herein by reference.
Identification of Audit Committee and Audit Committee Financial Expert
The Company has a standing Audit Committee that consists of Steven T. Schuler, Chair, David R. Milligan, James W. Noyce and Philip Jason Worth. The Board of Directors has determined that Mr. Schuler and Mr. Noyce are audit committee financial experts. The full Board of Directors has determined that all members of the Audit Committee are independent directors.
ITEM 11. EXECUTIVE COMPENSATION
The information required pursuant to Item 402 and Item 407(e)(4) of Regulation S-K can be found under the captions “Governance and Board of Directors—
2018
Director Compensation” and “Executive Compensation” in the Company’s definitive Proxy Statement on Form DEF 14A, which was filed with the SEC on
February 28, 2019
, and is incorporated herein by reference.
97
ITEM 12. SECURITY OWNERSHIP OF CERTAIN BENEFICIAL OWNERS AND MANAGEMENT AND RELATED STOCKHOLDER MATTERS
Effective as of the 2017 annual meeting of stockholders, the West Bancorporation, Inc. 2017 Equity Incentive Plan (2017 Plan) was adopted by the Board of Directors and approved by our stockholders. The prior 2012 Equity Incentive Plan (2012 Plan) was frozen with respect to future grants upon approval of the 2017 Plan. At the time the 2012 Plan was frozen, 232,318 shares had not been issued under the original authorization for that plan. Awards outstanding under the 2012 Plan will remain subject to the 2012 Plan as long as they remain outstanding. Under the terms of the 2017 Plan, the Company may grant a total of 800,000 shares of the Company’s common stock as nonqualified and incentive stock options, stock appreciation rights and stock awards. All employees, directors and service providers to the Company and its subsidiary are eligible to become participants in the 2017 Plan, except that nonemployees may not be granted incentive stock options. To date, only restricted stock units have been granted under either plan. Additional information regarding our equity incentive plans is presented in “Note 12. Stock Compensation Plans” in the notes to the consolidated financial statements pursuant to Item 8. The following table sets forth information regarding outstanding restricted stock units and shares available for future issuance under these plans as of
December 31, 2018
.
|
Number of shares to be
|
Weighted-average
|
Number of shares remaining available
|
||||||||
|
issued upon exercise of
|
exercise price of
|
for future issuance under equity
|
||||||||
|
outstanding options,
|
outstanding options,
|
compensation plans (excluding shares
|
||||||||
|
warrants and rights
|
warrants and rights
|
reflected in column (a))
|
||||||||
|
Plan Category
|
(a)
|
(b)
|
(c)
|
|||||||
|
Equity compensation plans
|
||||||||||
|
approved by stockholders
(1)
|
354,350
|
|
—
|
|
639,500
|
|
(2)
|
|||
|
Equity compensation plans not
|
||||||||||
|
approved by stockholders
|
—
|
|
—
|
|
—
|
|
||||
|
Total
|
354,350
|
|
—
|
|
639,500
|
|
||||
|
(1)
|
Includes the West Bancorporation, Inc. 2012 Equity Incentive Plan approved by stockholders on April 26, 2012 and the West Bancorporation, Inc. 2017 Equity Incentive Plan approved by stockholders on April 27, 2017.
|
|
(2)
|
Reflects the number of shares available for issuance under the West Bancorporation, Inc. 2017 Equity Incentive Plan as nonqualified and incentive stock options, stock appreciation rights and stock awards.
|
The information required pursuant to Item 403 of Regulation S-K can be found under the captions “Governance and Board of Directors—Security Ownership of Certain Beneficial Owners and Executive Officers,” “Governance and Board of Directors—Other Beneficial Owners” and “Governance and Board of Directors—Change in Control Agreements” in the Company’s definitive Proxy Statement on Form DEF 14A, which was filed with the SEC on
February 28, 2019
, and is incorporated herein by reference.
ITEM 13. CERTAIN RELATIONSHIPS AND RELATED TRANSACTIONS, AND DIRECTOR INDEPENDENCE
The information required pursuant to Item 404 and Item 407(a) of Regulation S-K can be found under the captions “Governance and Board of Directors” and “General Matters—Certain Relationships and Related Transactions” in the Company’s definitive Proxy Statement on Form DEF 14A, which was filed with the SEC on
February 28, 2019
, and is incorporated herein by reference.
ITEM 14. PRINCIPAL ACCOUNTANT FEES AND SERVICES
The information required pursuant to Item 9(e) of Schedule 14A can be found under the caption “Independent Registered Public Accounting Firm Fees and Services” in the Company’s definitive Proxy Statement on Form DEF 14A, which was filed with the SEC on
February 28, 2019
, and is incorporated herein by reference.
98
PART IV
ITEM 15. EXHIBITS AND FINANCIAL STATEMENT SCHEDULES
The following exhibits and financial statement schedules of the Company are filed as part of this report:
|
(a)
|
1. Financial Statements
|
See the consolidated financial statements which appear in Item 8 of this Form 10-K.
2. Financial Statement Schedules
All schedules are omitted because they are not applicable, not required, or because the required information is included in the consolidated financial statements or notes thereto.
3. Exhibits (not covered by independent registered public accounting firms’ reports)
|
3.1
|
Restatement of the Restated Articles of Incorporation of West Bancorporation, Inc.
(
incorporated herein by reference to Exhibit 3.1 filed with the Form 10-K on March 1, 2017
)
|
|
3.2
|
Amended and Restated Bylaws of West Bancorporation, Inc. as of January 23, 2019
(
incorporated herein by reference to Exhibit 3.1 filed with the Form 8-K on January 24, 2019
)
|
|
10.1*
|
West Bancorporation, Inc. 2012 Equity Incentive Plan
(
incorporated herein by reference to Exhibit A of the definitive proxy statement on Schedule 14A filed on March 7, 2012
)
|
|
10.2*
|
Form of Restricted Stock Unit Award Agreement under the West Bancorporation, Inc. 2012 Equity Incentive Plan
(
incorporated herein by reference to Exhibit 10.1 filed with the Form 10-Q on April 26, 2012
)
|
|
10.3*
|
Employment Agreement dated July 23, 2012, between West Bancorporation, Inc. and David D. Nelson
(
incorporated herein by reference to Exhibit 10.1 filed with the Form 8-K on July 25, 2012
)
|
|
10.4*
|
Employment Agreement dated July 23, 2012, between West Bancorporation, Inc. and Brad L. Winterbottom
(
incorporated herein by reference to Exhibit 10.2 filed with the Form 8-K on July 25, 2012
)
|
|
10.5*
|
Employment Agreement dated July 23, 2012, between West Bancorporation, Inc. and Harlee N. Olafson
(
incorporated herein by reference to Exhibit 10.3 filed with the Form 8-K on July 25, 2012
)
|
|
10.6*
|
Employment Agreement dated July 23, 2012, between West Bancorporation, Inc. and Douglas R. Gulling
(
incorporated herein by reference to Exhibit 10.4 filed with the Form 8-K on July 25, 2012
)
|
|
10.7*
|
West Bancorporation, Inc. Deferred Compensation Plan
(
incorporated herein by reference to Exhibit 10.1 filed with the Form 8-K on October 29, 2012
)
|
|
10.8*
|
West Bancorporation, Inc. Employee Savings and Stock Ownership Plan, as amended
(
incorporated herein by reference to Exhibit 10.20 filed with the Form 10-K on March 6, 2014
)
|
|
10.9*
|
West Bancorporation, Inc. 2017 Equity Incentive Plan
(
incorporated herein by reference to Exhibit A of the definitive proxy statement on Schedule 14A filed on March 1, 2017
)
|
|
10.10*
|
Form of Restricted Stock Unit Award Agreement under the West Bancorporation, Inc. 2017 Equity Incentive Plan
(
incorporated herein by reference to Exhibit 4.2 filed with the Form S-8 on April 28, 2017
)
|
|
10.11*
|
Form of Restricted Stock Award Agreement under the West Bancorporation, Inc. 2017 Equity Incentive Plan
(
incorporated herein by reference to Exhibit 4.3 filed with the Form S-8 on April 28, 2017
)
|
|
10.12*
|
Form of Nonqualified Stock Option Award Agreement under the West Bancorporation, Inc. 2017 Equity Incentive Plan
(
incorporated herein by reference to Exhibit 4.4 filed with the Form S-8 on April 28, 2017
)
|
|
10.13*
|
Form of Incentive Stock Option Award Agreement under the West Bancorporation, Inc. 2017 Equity Incentive Plan
(
incorporated herein by reference to Exhibit 4.5 filed with the Form S-8 on April 28, 2017
)
|
|
10.14*
|
Form of Stock Appreciation Right Award Agreement under the West Bancorporation, Inc. 2017 Equity Incentive Plan
(
incorporated herein by reference to Exhibit 4.6 filed with the Form S-8 on April 28, 2017
)
|
|
10.15*
|
First Amendment to the West Bancorporation, Inc. 2012 Equity Incentive Plan dated April 26, 2017
(incorporated herein by reference to Exhibit 10.15 filed with the Form 10-K on March 1, 2018)
|
|
10.16
|
Amended and Restated Lease Agreement Dated February 20, 2018
(incorporated herein by reference to Exhibit 10.16 filed with the Form 10-K on March 1, 2018)
|
|
21
|
|
|
23
|
|
|
31.1
|
|
|
31.2
|
|
|
32.1
|
|
|
32.2
|
|
99
|
101.INS
|
XBRL Instance Document
|
|
101.SCH
|
XBRL Taxonomy Extension Schema Document
|
|
101.CAL
|
XBRL Taxonomy Extension Calculation Linkbase Document
|
|
101.DEF
|
XBRL Taxonomy Extension Definition Linkbase Document
|
|
101.LAB
|
XBRL Taxonomy Extension Label Linkbase Document
|
|
101.PRE
|
XBRL Taxonomy Extension Presentation Linkbase Document
|
|
* Indicates management contract or compensatory plan or arrangement.
|
|
ITEM 16. FORM 10-K SUMMARY
None.
100
SIGNATURES
Pursuant to the requirements of Section 13 or 15(d) of the Securities Exchange Act of 1934, the Registrant has duly caused this report to be signed on its behalf by the undersigned, thereunto duly authorized.
WEST BANCORPORATION, INC.
(Registrant)
|
February 28, 2019
|
By:
|
/s/ David D. Nelson
|
|
|
|
David D. Nelson
|
|
|
|
Chief Executive Officer and President
|
Pursuant to the requirements of the Securities Exchange Act of 1934, this report has been signed below by the following persons on behalf of the registrant and in the capacities and on the dates indicated.
|
February 28, 2019
|
By:
|
/s/ David D. Nelson
|
|
|
|
David D. Nelson
|
|
|
|
Chief Executive Officer, Director and President
|
|
|
|
(Principal Executive Officer and Director)
|
|
|
|
|
|
|
|
|
|
February 28, 2019
|
By:
|
/s/ Douglas R. Gulling
|
|
|
|
Douglas R. Gulling
|
|
|
|
Executive Vice President, Treasurer and Chief Financial Officer
|
|
|
|
(Principal Financial Officer)
|
|
February 28, 2019
|
By:
|
/s/ Jane M. Funk
|
|
|
Jane M. Funk
|
|
|
|
|
Senior Vice President, Controller and Chief Accounting Officer
|
|
|
(Principal Accounting Officer)
|
|
|
BOARD OF DIRECTORS
|
||
|
February 28, 2019
|
By:
|
/s/ James W. Noyce
|
|
|
James W. Noyce
|
|
|
Chairman of the Board
|
||
|
February 28, 2019
|
By:
|
/s/ Steven K. Gaer
|
|
|
Steven K. Gaer
|
|
|
February 28, 2019
|
By:
|
/s/ Michael J. Gerdin
|
|
|
Michael J. Gerdin
|
|
101
|
February 28, 2019
|
By:
|
/s/ Kaye R. Lozier
|
|
|
|
Kaye R. Lozier
|
|
February 28, 2019
|
By:
|
/s/ Sean P. McMurray
|
|
|
|
Sean P. McMurray
|
|
February 28, 2019
|
By:
|
/s/ David R. Milligan
|
|
|
David R. Milligan
|
|
|
February 28, 2019
|
By:
|
/s/ George D. Milligan
|
|
|
George D. Milligan
|
|
|
|
|
|
|
February 28, 2019
|
By:
|
/s/ Robert G. Pulver
|
|
|
|
Robert G. Pulver
|
|
February 28, 2019
|
By:
|
/s/ Lou Ann Sandburg
|
|
|
|
Lou Ann Sandburg
|
|
|
||
|
February 28, 2019
|
By:
|
/s/ Steven T. Schuler
|
|
|
Steven T. Schuler
|
|
|
February 28, 2019
|
By:
|
/s/ Philip Jason Worth
|
|
|
|
Philip Jason Worth
|
102
TABLE OF CONTENTS
Part IItem 1. BusinessItem 1A. Risk FactorsItem 1B. Unresolved Staff CommentsItem 2. PropertiesItem 3. Legal ProceedingsItem 4. Mine Safety DisclosuresPart IIItem 5. Market For Registrant S Common Equity, Related Stockholder Matters, and Issuer Purchases Of Equity SecuritiesItem 6. Selected Financial DataItem 7. Management S Discussion and Analysis Of Financial Condition and Results Of OperationsItem 7A. Quantitative and Qualitative Disclosures About Market RiskItem 8. Financial Statements and Supplementary DataNote 1. Organization and Nature Of Business and Summary Of Significant Accounting PoliciesNote 2. Earnings Per Common ShareNote 3. Investment SecuritiesNote 4. Loans and Allowance For Loan LossesNote 5. Premises and Equipment, NetNote 6. DepositsNote 7. Subordinated NotesNote 8. Federal Home Loan Bank and Other BorrowingsNote 9. Long-term DebtNote 10. DerivativesNote 11. Income TaxesNote 12. Stock Compensation PlansNote 13. Employee Savings and Stock Ownership PlanNote 14. Accumulated Other Comprehensive Income (loss)Note 15. Regulatory Capital RequirementsNote 16. Commitments and ContingenciesNote 17. Fair Value MeasurementsNote 18. West Bancorporation, Inc. (parent Company Only) Condensed Financial StatementsNote 19. Selected Quarterly Financial Data (unaudited)Item 9. Changes in and Disagreements with Accountants on Accounting and Financial DisclosureItem 9A. Controls and ProceduresItem 9B. Other InformationPart IIIItem 10. Directors, Executive Officers, and Corporate GovernanceItem 11. Executive CompensationItem 12. Security Ownership Of Certain Beneficial Owners and Management and Related Stockholder MattersItem 13. Certain Relationships and Related Transactions, and Director IndependenceItem 14. Principal Accountant Fees and ServicesPart IVItem 15. Exhibits and Financial Statement SchedulesItem 16. Form 10-k Summary