WHITE MOUNTAINS INSURANCE GROUP LTD
10-Ks and 10-Qs
|
|
|
|
|
|
|
|
|
|
|
|
|
|
|
|
|
|
|
|
|
|
|
|
|
|
|
|
|
|
|
|
|
|
|
|
|
|
|
|
|
|
|
|
|
|
|
|
|
|
|
|
|
|
|
|
|
|
|
UNITED STATES
SECURITIES AND EXCHANGE COMMISSION
Washington, D.C. 20549
FORM 10-K
|
ý
|
ANNUAL REPORT PURSUANT TO SECTION 13 OR 15(d) OF
THE SECURITIES EXCHANGE ACT OF 1934
|
For the fiscal year ended
December 31, 2016
OR
|
o
|
TRANSITION REPORT PURSUANT TO SECTION 13 OR 15(d) OF
THE SECURITIES EXCHANGE ACT OF 1934
|
For the transition period from to
Commission file number 1-8993
WHITE MOUNTAINS INSURANCE GROUP, LTD.
(Exact name of Registrant as specified in its charter)
|
Bermuda
|
|
94-2708455
|
|
(State or other jurisdiction of
incorporation or organization)
|
|
(I.R.S. Employer
Identification No.)
|
|
80 South Main Street
|
|
|
|
Hanover, New Hampshire
|
|
03755-2053
|
|
(Address of principal executive offices)
|
|
(Zip Code)
|
Registrant’s telephone number, including area code:
(603) 640-2200
Securities registered pursuant to Section 12(b) of the Act:
|
Title of each class
|
|
Name of each exchange on which registered
|
|
Common Shares, par value $1.00
|
|
New York Stock Exchange
|
|
per share
|
|
Bermuda Stock Exchange
|
Securities registered pursuant to Section 12(g) of the Act:
None
Indicate by check mark if the Registrant is a well-known seasoned issuer, as defined in Rule 405 of the Securities Act. Yes
ý
No
o
Indicate by check mark if the Registrant is not required to file reports pursuant to Section 13 or Section 15(d) of the Act. Yes
o
No
ý
Indicate by check mark whether the Registrant (1) has filed all reports required to be filed by Section 13 or 15(d) of the Securities Exchange Act of 1934 during the preceding 12 months (or shorter period that the registrant was required to file such reports), and (2) has been subject to such filing requirements for the past 90 days. Yes
ý
No
o
Indicate by check mark whether the Registrant has submitted electronically and posted on its corporate Web site, if any, every Interactive Data File required to be submitted and posted pursuant to Rule 405 of Regulation S-T (§232.405 of this chapter) during the preceding 12 months (or shorter period that the registrant was required to submit and post such files). Yes
ý
No
o
Indicate by check mark if disclosure of delinquent filers pursuant to Item 405 of Regulation S-K (§229.405 of this chapter) is not contained herein, and will not be contained, to the best of the Registrant’s knowledge, in definitive proxy or information statements incorporated by reference in Part III of this Form 10-K or any amendment to this Form 10-K.
o
Indicate by check mark whether the registrant is a large accelerated filer, an accelerated filer, a non-accelerated filer, or a smaller reporting company. See definitions of “large accelerated filer,” “accelerated filer,” and “smaller reporting company” in Rule 12b-2 of the Exchange Act.
|
Large accelerated filer
x
|
Accelerated filer
o
|
Non-accelerated filer
o
|
Smaller reporting company
o
|
Indicate by check mark whether the Registrant is a shell company (as defined in Rule 12b-2 of the Act). Yes
o
No
ý
The aggregate market value of voting shares (based on the closing price of those shares listed on the New York Stock Exchange and the consideration received for those shares not listed on a national or regional exchange) held by non-affiliates of the Registrant as of June 30, 2016, was
$3,889,471,650
.
As of February 24, 2017,
4,561,057
common shares, par value of
$1.00
per share, were outstanding (which includes
48,404
restricted common shares that were not vested at such date).
DOCUMENTS INCORPORATED BY REFERENCE
Portions of the Registrant’s Definitive Proxy Statement to be filed with the Securities and Exchange Commission (“SEC”) pursuant to Regulation 14A under the Securities Exchange Act of 1934, as amended (the “Exchange Act”), relating to the Registrant’s Annual General Meeting of Members scheduled to be held May 25, 2017 are incorporated by reference into Part III of this Form 10-K. With the exception of the portions of the Proxy Statement specifically incorporated herein by reference, the Proxy Statement is not deemed to be filed as part of this Form 10-K.
TABLE OF CONTENTS
|
|
||
|
|
||
|
|
||
|
|
||
|
|
||
|
|
||
|
|
||
|
|
||
|
|
||
|
|
||
|
|
||
|
|
||
|
|
||
|
|
||
|
|
CERTIFICATIONS
|
C-1
|
GENERAL
White Mountains Insurance Group, Ltd. (the “Company” or the “Registrant”) is an exempted Bermuda limited liability company whose principal businesses are conducted through its insurance subsidiaries and other affiliates. Within this report, the term “White Mountains” is used to refer to one or more entities within the consolidated organization, as the context requires. The Company’s headquarters is located at 26 Reid Street, Hamilton, Bermuda HM 11, its principal executive office is located at 80 South Main Street, Hanover, New Hampshire 03755-2053 and its registered office is located at Clarendon House, 2 Church Street, Hamilton, Bermuda HM 11. White Mountains’s reportable segments are OneBeacon, HG Global/BAM and Other Operations.
As discussed further in the Company’s consolidated financial statements in
Note 2 - “Significant Transactions”
on page F-14, on April 18, 2016, White Mountains completed its sale of Sirius International Insurance Group, Ltd., and its subsidiaries (collectively, “Sirius Group”) to CM International Holding PTE Ltd. (“CMI”), the Singapore-based investment arm of China Minsheng Investment Corp., Ltd. Also, on July 21, 2016, White Mountains completed its sale of Tranzact Holdings, LLC (“Tranzact”) to an affiliate of Clayton, Dubilier & Rice, LLC. For the years ended December 31, 2016 and 2015, Sirius Group and Tranzact have been presented as discontinued operations. See
Note 22 - “Held for Sale and Discontinued Operations”
on page F-87.
The OneBeacon segment consists of OneBeacon Insurance Group, Ltd. (“OneBeacon Ltd.”), an exempted Bermuda limited liability company that owns a family of property and casualty insurance companies, and Split Rock Insurance, Ltd. (“Split Rock”), a Bermuda based reinsurance company (collectively, “OneBeacon”). OneBeacon is a specialty property and casualty insurance writer that offers a wide range of insurance products in the United States primarily through independent agencies, regional and national brokers, wholesalers and managing general agencies. As of
December 31, 2016
and 2015, White Mountains owned
76.1%
and
75.5%
of OneBeacon Ltd.’s outstanding common shares. In December 2014, OneBeacon completed the sale of its runoff business. Accordingly, OneBeacon’s runoff business is presented as discontinued operations in White Mountains’s financial statements. See
Note 22 - “Held for Sale and Discontinued Operations”
on page F-87.
The HG Global/BAM segment consists of HG Global Ltd. (“HG Global”) and the consolidated results of Build America Mutual Assurance Company (“BAM”). BAM is the first and only mutual bond insurance company in the United States. By insuring the timely payment of principal and interest, BAM provides market access to, and lowers interest expense for, issuers of municipal bonds used to finance essential public purposes such as schools, utilities and transportation facilities. BAM is owned by and operated for the benefit of its members, the municipalities that purchase BAM’s insurance for their debt issuances. BAM is domiciled in New York. HG Global was established to fund the startup of BAM and, through its wholly-owned subsidiary, HG Re Ltd. (“HG Re”), to provide 15%-of-par, first loss reinsurance protection for policies underwritten by BAM. HG Global, together with its subsidiaries, provided the initial capitalization of BAM through the purchase of $503 million of surplus notes issued by BAM (the “BAM Surplus Notes”). As of both December 31, 2016 and 2015, White Mountains owned 96.9% of HG Global’s preferred equity and 88.4% of its common equity. White Mountains does not have an ownership interest in BAM. However, generally accepted accounting principles in the United States (“GAAP”) require White Mountains to consolidate BAM’s results in its financial statements. BAM’s results do not affect White Mountains’s adjusted book value per share and are attributed to non-controlling interests.
White Mountains’s Other Operations segment consists of the Company and its intermediate holding companies, its wholly-owned investment management subsidiary, White Mountains Advisors LLC (“WM Advisors”) and certain consolidated and unconsolidated private capital investments. The consolidated private capital investments consist of QL Holdings LLC (“MediaAlpha”), Wobi Insurance Agency Ltd. (“Wobi”), Star & Shield Services LLC, Star & Shield Risk Management LLC, and Star & Shield Claims Services LLC (collectively “Star & Shield”) and Removal Stars Ltd. (“Buzzmove”). Star & Shield provides management services for a fee to Star & Shield Insurance Exchange (“SSIE”), a reciprocal that is owned by its members, who are policyholders. On January 13, 2017, White Mountains reached an agreement to sell Star & Shield and its investment in surplus notes issued by SSIE (the “SSIE Surplus Notes”) to K2 Insurance Services LLC. As a result, White Mountains has presented Star & Shield’s and SSIE’s assets and liabilities as held for sale as of December 31, 2016 and 2015. White Mountains’s Other Operations segment also includes its variable annuity reinsurance business (“WM Life Re”), which completed its runoff with all of its contracts maturing by June 30, 2016.
1
White Mountains’s Operating Principles
White Mountains strives to operate within the spirit of four operating principles. These are:
Underwriting Comes First.
An insurance enterprise must respect the fundamentals of insurance. There must be a realistic expectation of underwriting profit on all business written, and demonstrated fulfillment of that expectation over time, with focused attention to the loss ratio and to all the professional insurance disciplines of pricing, underwriting and claims management.
Invest for Total Return.
Historically, GAAP accounting has tended to hide unrealized gains and losses on the investment portfolio and over reward reported investment income (interest and dividends). Regardless of the accounting, White Mountains must invest for the best growth in value over time. In addition to investing our bond portfolios for total after-tax return, that will mean prudent investment in equities consistent with leverage and insurance risk considerations.
Think Like Owners.
Thinking like owners has a value all its own. There are stakeholders in a business enterprise and doing good work requires more than this quarter’s profit. Thinking like an owner embraces all that without losing the touchstone of a capitalist enterprise.
ONEBEACON
OneBeacon, with its U.S. corporate headquarters in Plymouth, Minnesota, is a specialty property and casualty insurance provider that offers a wide range of insurance products in the United States primarily through independent agencies, regional and national brokers, wholesalers and managing general agencies. As a specialty underwriter, OneBeacon believes that it will generate superior returns as compared to an underwriter that takes a more “generalist” underwriting approach and that its knowledge about specialized insurance products, targeted industries, classes of business, risk characteristics and limited number of specialized competitors provides it with a competitive edge when determining the terms and conditions on individual accounts.
Historically, OneBeacon offered a range of specialty, commercial and personal products and services. However, as a result of a series of transactions over the past several years, OneBeacon is now focused exclusively on specialty businesses. The most recent of these transactions was the sale of runoff business consisting of assets, liabilities and capital related principally to OneBeacon’s non-specialty business, including the vast majority of its asbestos and environmental reserves (the “Runoff Business”) to an affiliate of Armour Group Holdings Limited (“Armour”), which closed on December 23, 2014 (the “Runoff Transaction”). See
Note 2 — “Significant Transactions”
on page F-14.
With the closing of the Runoff Transaction, OneBeacon completed its transformation into a specialty insurance company and its balance sheet and risk profile have changed significantly. Its exposure to claims from policies related to the Runoff Business, such as commercial general liability, including asbestos and environmental exposures and workers compensation policies, is now limited to the value of the surplus notes issued in conjunction with the Runoff Transaction (the “OneBeacon Surplus Notes”), which have a fair value of $72 million as of December 31, 2016. OneBeacon’s total outstanding reserves as of December 31, 2016 for 2004 and prior accident years total less than $1 million and for accident years prior to 2007 total $6.9 million.
As of both
December 31, 2016 and 2015
, OneBeacon had $3.6 billion of total assets and $1.0 billion of common shareholders’ equity. As of December 31, 2016 and 2015, White Mountains owned 76.1% and 75.5% of OneBeacon Ltd.’s outstanding common shares and reported $245 million and $246 million of non-controlling interest related to its ownership in OneBeacon. OneBeacon wrote $1.1 billion, $1.1 billion and $1.2 billion in net written premiums in 2016, 2015 and 2014, respectively.
2
Business Overview
Generally, property and casualty insurance companies write insurance policies in exchange for premiums paid by their customers (the insureds). An insurance policy is a contract between the insurance company and the insured where the insurance company agrees to pay for losses suffered by the insured or a third party claimant that are covered under the contract. Such contracts are often subject to subsequent legal interpretation by courts, legislative action and arbitration.
Insurance companies incur a significant amount of their total expenses from policy obligations, which are commonly referred to as claims or losses. In settling claims, various loss adjustment expenses (“LAE”) are incurred such as insurance adjusters’ fees and litigation expenses. Loss and LAE are categorized by the year in which the claim is incurred, or “accident year.” In the following calendar years, as OneBeacon increases or decreases its estimate for the ultimate loss and LAE for claims incurred in prior accident years, it will record favorable or unfavorable loss reserve development, which is recorded in the current calendar year period. In addition, insurance companies incur policy acquisition expenses, such as commissions paid to agents and premium taxes, and other expenses related to the underwriting process, including employee compensation and benefits. The key measure of relative underwriting performance for an insurance company is the combined ratio. An insurance company’s GAAP combined ratio is calculated by adding the ratio of incurred loss and LAE to earned premiums (the “loss and LAE ratio”) and the ratio of policy acquisition and other underwriting expenses to earned premiums (the “expense ratio”). A combined ratio under 100% indicates that an insurance company is generating an underwriting profit. However, when considering investment returns, insurance companies operating at a combined ratio of greater than 100% can be profitable.
OneBeacon writes both property insurance and casualty insurance in its Specialty Products and Specialty Industries underwriting groups. Property insurance generally covers the financial consequences of accidental losses to the insured’s property, such as a business’s building, inventory and equipment or personal property. Premiums from ocean and inland marine, certain commercial multiple peril and fire and allied lines generally represent OneBeacon’s short-tail property lines of business, and claims from such business are typically reported and settled in a relatively short period of time. Casualty insurance (often referred to as liability insurance) generally covers the financial consequences of a legal liability of an individual or an organization resulting from negligent acts or omissions causing bodily injury, property damages and/or economic damages to a third party. Premiums from general liability, workers compensation, commercial auto liability and certain commercial multiple peril policies generally represent OneBeacon’s long-tail casualty lines of business, and claims from such business can take years, even decades, to settle. In addition, OneBeacon provides some coverages that do not fall into the “Property” or “Casualty” insurance definitions, primarily accident and credit insurance. OneBeacon also provides surety coverage, which typically has a low frequency but high severity of losses. In July 2015, OneBeacon exited the multiple peril crop insurance (“MPCI”) business and the related crop-hail business (collectively, “Crop Business”) and as a result has no material net exposure related to the Crop Business. See
“OneBeacon Crop Insurance”
on page 5.
OneBeacon’s net written premiums by line of business for the years ended
December 31, 2016, 2015 and 2014
consisted of the following:
|
Net written premiums by line of business
|
Year Ended December 31,
|
|||||||||||
|
Millions
|
2016
|
2015
|
2014
|
|||||||||
|
Property lines
|
||||||||||||
|
Ocean and inland marine
|
$
|
176.0
|
|
$
|
190.1
|
|
$
|
201.9
|
|
|||
|
Commercial multi-peril and auto physical damage
|
88.9
|
|
94.6
|
|
82.0
|
|
||||||
|
Fire and allied
|
36.5
|
|
39.3
|
|
44.7
|
|
||||||
|
Total property lines
|
301.4
|
|
324.0
|
|
328.6
|
|
||||||
|
Casualty lines
|
||||||||||||
|
General liability
|
344.9
|
|
334.8
|
|
402.1
|
|
||||||
|
Workers compensation
|
78.1
|
|
86.1
|
|
83.7
|
|
||||||
|
Automobile liability
|
67.6
|
|
88.4
|
|
91.4
|
|
||||||
|
Other casualty
|
59.9
|
|
51.8
|
|
40.3
|
|
||||||
|
Total casualty lines
|
550.5
|
|
561.1
|
|
617.5
|
|
||||||
|
Other lines
|
||||||||||||
|
Accident and health
|
131.4
|
|
151.1
|
|
149.8
|
|
||||||
|
Credit and other
|
62.6
|
|
59.0
|
|
58.0
|
|
||||||
|
Surety
|
54.6
|
|
50.7
|
|
28.9
|
|
||||||
|
Crop Business
(1)
|
.2
|
|
(9.3
|
)
|
(1)
|
34.1
|
|
|||||
|
Total other lines
|
248.8
|
|
251.5
|
|
270.8
|
|
||||||
|
Total
|
$
|
1,100.7
|
|
$
|
1,136.6
|
|
$
|
1,216.9
|
|
|||
(1)
Crop Business net written premiums for the year ended December 31, 2015 primarily relates to premiums ceded under a 100% quota-share agreement to reinsure the remaining net Crop Business exposure for the 2015 reinsurance year.
3
OneBeacon derives substantially all of its revenues from earned premiums, investment income and net realized and unrealized investment gains on investment securities. Written premiums represent the amount charged to an insured in order to provide coverage under an insurance contract, which are recognized as earned premiums within revenue over the period of time that insurance coverage is provided (i.e., ratably over the life of the policy). Unearned premiums represent the portion of premiums written that are applicable to future insurance coverage provided by policies. A significant period of time often elapses between receipt of insurance premiums and payment of insurance claims. During this time, OneBeacon invests the premiums, earns investment income and generates net realized and unrealized gains on investment securities.
Insurance Business
OneBeacon’s insurance business is comprised of sixteen underwriting units that are reported in two underwriting groups, Specialty Industries and Specialty Products. OneBeacon has added, and expects to continue to add, new businesses both organically and through acquisition, guided by its focus on profitable growth while prudently managing underwriting risk. OneBeacon’s net written premiums by underwriting group for the years ended
December 31, 2016, 2015 and 2014
consisted of the following:
|
Underwriting Group
|
Year Ended December 31,
|
|||||||||||
|
Millions
|
2016
|
2015
|
2014
|
|||||||||
|
Specialty Industries
|
$
|
559.8
|
|
$
|
603.6
|
|
$
|
610.0
|
|
|||
|
Specialty Products
|
540.9
|
|
533.0
|
|
606.9
|
|
||||||
|
Total
|
$
|
1,100.7
|
|
$
|
1,136.6
|
|
$
|
1,216.9
|
|
|||
Specialty Products
For the years ended
December 31, 2016, 2015 and 2014
, OneBeacon’s Specialty Products net written premiums by underwriting unit were as follows:
|
Underwriting Unit
|
Year Ended December 31,
|
|||||||||||
|
Millions
|
2016
|
2015
|
2014
|
|||||||||
|
Healthcare
|
$
|
132.4
|
|
$
|
147.1
|
|
$
|
180.4
|
|
|||
|
Tuition Reimbursement
|
76.8
|
|
72.1
|
|
70.5
|
|
||||||
|
Programs
|
66.8
|
|
99.1
|
|
50.8
|
|
||||||
|
Other Professional Lines
|
51.8
|
|
46.8
|
|
80.4
|
|
||||||
|
Surety
|
50.3
|
|
47.4
|
|
28.9
|
|
||||||
|
Management Liability
|
45.3
|
|
40.6
|
|
50.1
|
|
||||||
|
Financial Services
|
42.0
|
|
38.2
|
|
40.8
|
|
||||||
|
Other Specialty Products
|
75.5
|
|
41.7
|
|
105.0
|
|
||||||
|
Total Specialty Products
|
$
|
540.9
|
|
$
|
533.0
|
|
$
|
606.9
|
|
|||
A description of business written by each underwriting unit in OneBeacon’s Specialty Products follows:
OneBeacon Healthcare Group (“Healthcare”)
Healthcare provides professional liability and other specialized coverages, including provider excess insurance and excess of loss or HMO reinsurance. Healthcare targets a variety of customer groups, including hospitals, physicians, free-standing medical facilities, senior living organizations, and managed care organizations.
Tuition Reimbursement
A.W.G. Dewar, Inc. (“Dewar”) has been a leading provider of tuition reimbursement insurance since 1930. Dewar’s product, primarily classified within the credit line of business, protects both schools and parents from the financial consequences of a student's withdrawal or dismissal from school. OneBeacon owns 81% of Dewar.
OneBeacon Program Group (“Programs”)
Programs provides a full range of multi-line package insurance for select specialty programs overseen by dedicated agencies that perform all policy administration functions. Products are available on an admitted and nonadmitted basis. Programs works primarily with managing general agents and managing general underwriters, commonly referred to as program administrators.
4
Other Professional Lines
Other Professional Lines consists primarily of the OneBeacon Architects & Engineers and OneBeacon Media businesses. OneBeacon Architect & Engineers offers professional liability coverages for various design customer groups including architects, civil engineers, construction managers, and design/build contractors. OneBeacon Media offers professional liability coverages to publishers, broadcasters, advertising agencies, authors, producers and other media professionals, with coverage that is customizable for any company or individual that creates content. Other Professional Lines
also includes the results of OneBeacon’s exited lawyers professional liability business.
OneBeacon Surety Group (“Surety”)
Surety offers a broad range of commercial surety bonds targeting Fortune 2500 and large private companies written through a network of independent agencies, brokers and wholesalers. Business is serviced through eight regions throughout the United States.
OneBeacon Management Liability (“Management Liability”)
Management Liability offers directors and officers liability, employment practices liability, fiduciary liability and crime insurance to a wide variety of private for-profit and nonprofit organizations, including private nonprofit healthcare organizations. Coverages are available on a modular form approach, allowing for tailored solutions.
OneBeacon Financial Services (“Financial Services”)
Financial Services offers property and casualty coverages for commercial banks, savings banks and savings and loan institutions, security broker-dealers, investment advisers, insurance companies and credit unions. Specialty coverages, including professional liability, trust errors & omissions, cyber liability and financial institution bond, are also available for institutions with less than $3 billion in assets.
Other Specialty Products:
OneBeacon Specialty Property (“Specialty Property”)
Specialty Property provides excess property and inland marine solutions for layered insurance policies. Target classes of business include apartments and condominiums, commercial real estate, small-to-medium manufacturing, retail/wholesale, education and public entities. Specialty Property products are provided primarily through surplus lines wholesalers.
OneBeacon Environmental (“Environmental”)
Environmental specializes in environmental risk solutions designed to address a variety of exposures for a broad range of businesses, including multiline casualty placements for the environmental industry. The product suite includes commercial general liability, contractors environmental liability, professional services liability, environmental premises liability, products pollution liability, follow-form excess, environmental excess and business auto.
OneBeacon Financial Institutions (“Financial Institutions”)
Financial Institutions provides a wide range of coverage solutions to address the insurance needs of financial institutions, including, but not limited to, professional and management liability. Target industries include banks (greater than $5 billion in corporate assets), security broker dealers and captive agents, insurance companies, insurance agents and brokers, investment advisers, mutual funds, hedge funds, real estate investment trusts, business development companies, private equity and venture capital firms. Products include directors and officers liability, professional liability, fiduciary liability, cyber liability, and financial institutions bonds.
OneBeacon Crop Insurance
Prior to July 2015, through its exclusive relationship with a managing general agency, Climate Crop Insurance Agency (“CCIA”), OneBeacon offered MPCI through the federal crop insurance program administered by the U.S. Department of Agriculture’s Risk Management Agency. OneBeacon and CCIA also offered crop-hail products to supplement the federal crop insurance program. On July 31, 2015, Monsanto Company sold CCIA to an affiliate of AmTrust. As a result of this sale, OneBeacon exited the Crop Business and has no material net exposure related to the Crop Business.
5
Specialty Industries
For the years ended
December 31, 2016, 2015 and 2014
, OneBeacon’s Specialty Industries net written premiums by underwriting unit were as follows:
|
Underwriting Unit
|
Year Ended December 31,
|
|||||||||||
|
Millions
|
2016
|
2015
|
2014
|
|||||||||
|
Technology
|
$
|
124.1
|
|
$
|
127.3
|
|
$
|
133.1
|
|
|||
|
Ocean Marine
|
115.7
|
|
122.7
|
|
127.1
|
|
||||||
|
Accident
|
114.5
|
|
118.8
|
|
113.4
|
|
||||||
|
Government Risks
|
82.8
|
|
84.5
|
|
82.3
|
|
||||||
|
Entertainment
|
61.5
|
|
88.0
|
|
88.6
|
|
||||||
|
Inland Marine
|
61.2
|
|
62.3
|
|
65.5
|
|
||||||
|
Total Specialty Industries
|
$
|
559.8
|
|
$
|
603.6
|
|
$
|
610.0
|
|
|||
A description of business written by each underwriting unit in OneBeacon’s Specialty Industries follows:
OneBeacon Technology Insurance (“Technology”)
Technology provides all-lines underwriting solutions for the technology, life science and medical technology, and telecommunications industries. The specific capabilities offered include risk control, claims and third-party vendor solutions. Products span property, casualty, cyber, errors & omissions, international, products liability and professional coverages.
Inland Marine Underwriters (“IMU”) - Ocean Marine (“Ocean Marine”)
Ocean Marine traces its roots to the early 1900s and offers a full range of ocean marine insurance solutions. Ocean Marine products include, but are not limited to: commercial hull and marine liabilities at both the primary and excess levels, ocean and air cargo with coverage extensions such as inland transit, warehousing and processing, yachts, and several marine package products with comprehensive property, auto and liability coverage.
OneBeacon Accident Group (“Accident”)
Accident focuses on analyzing and developing specialized accident solutions for the transportation, non-subscription and corporate accident marketplace, while also developing specialized accident insurance programs. The Accident product suite includes accidental death and dismemberment, occupational accident, sports accident, non-truckers liability, vehicle physical damage and other accident coverages. Accident also provides employers and affinity groups with access to services including identity theft management services and travel assistance services.
OneBeacon Entertainment (“Entertainment”)
Entertainment provides specialized commercial insurance, including professional liability protection, for the entertainment, sports and leisure industries. Coverages include film and television portfolio, producers portfolio, theatrical package, event cancellation, premises liability, event liability and participant liability.
OneBeacon Government Risks (“Government Risks”)
Government Risks provides solutions for mid-sized municipalities and counties, special districts including water, sanitation and fire, non-rail transit authorities and other publicly funded agencies. Government Risks products include property, casualty, and professional liability (comprised of law enforcement, public officials and employment practices liability coverages) offered on a fully insured, deductible, self-insured retention or assumed reinsurance basis.
IMU - Inland Marine (“Inland Marine”)
Inland Marine offers a full range of inland marine insurance solutions. Inland Marine products include builders risks, contractors equipment, installation floaters, fine arts, motor truck cargo, transportation, miscellaneous articles floaters, warehousemen’s legal liability and other inland marine opportunities.
6
Geographic Concentration
Substantially all of OneBeacon’s net written premiums are derived from business produced in the United States. For the years ended
December 31, 2016, 2015 and 2014
, business was produced in the following states:
|
Year Ended December 31,
|
|||||||||
|
Net written premiums by state
|
2016
|
2015
|
2014
|
||||||
|
California
|
18
|
%
|
18
|
%
|
16
|
%
|
|||
|
New York
|
12
|
|
10
|
|
10
|
|
|||
|
Texas
|
7
|
|
6
|
|
7
|
|
|||
|
District of Columbia
|
6
|
|
6
|
|
5
|
|
|||
|
Florida
|
5
|
|
5
|
|
6
|
|
|||
|
Other
|
52
|
|
55
|
|
56
|
|
|||
|
Total
|
100
|
%
|
100
|
%
|
100
|
%
|
|||
Marketing and Distribution
OneBeacon offers its products and services through a network of approximately 2,300 independent agents, regional and national brokers, wholesalers and managing general agencies. OneBeacon selectively enters these relationships with producers who demonstrate an understanding of OneBeacon’s target markets, capabilities and the specialized needs of their clients. OneBeacon believes this selective distribution approach creates greater insight into the underwriting and management of the risks associated with OneBeacon’s particular lines of business. Further, OneBeacon believes that agents and brokers will continue to represent a significant share of the business OneBeacon seeks to write going forward.
Underwriting and Pricing
OneBeacon believes there must be a realistic expectation of attaining an underwriting profit on all the business it writes, as well as a demonstrated fulfillment of that expectation over time. Consistent with the “underwriting comes first” operating principle, adequate pricing is a critical component for achieving an underwriting profit. OneBeacon underwrites its book with a disciplined approach towards pricing its insurance products and is willing to forgo a business opportunity if it believes it is not priced appropriately to the exposure.
OneBeacon actively monitors pricing activity and measures its use of tiers, credits, debits and limits, and expends considerable effort to measure and verify exposures and insured values. In addition, OneBeacon regularly updates base rates to achieve targeted returns on capital and attempts to shift writings away from lines and classes where pricing is inadequate. To the extent changes in premium rates, policy forms or other matters are subject to regulatory approval. See
“REGULATION—United States”
on page 17 and
“Risk Factors—
Regulation may restrict our ability to operate
”
on page 27. OneBeacon proactively monitors its pending regulatory filings to facilitate, to the extent possible, their prompt processing and approval.
Competition
Property and casualty insurance is highly competitive. OneBeacon’s businesses each compete against a different subset of companies. In general, OneBeacon competes in one or more of its businesses with most of the large multi-line insurance companies, such as Chubb, AIG, Beazley, CNA, Hartford, Liberty Mutual, Travelers and Zurich. OneBeacon also competes with most of the specialty companies, such as Axis, Tokio Marine, The Navigators Group, Markel, RLI and W.R. Berkley as well as various local and regional insurance companies and niche carriers.
The more significant competitive factors for most insurance products OneBeacon offers are price, product terms and conditions, agency and broker relationships, claims service, company scale and financial stability. OneBeacon’s underwriting principles and dedication to independent distribution partners are unlikely to make it the low-cost provider in most markets. While it is often difficult for insurance companies to differentiate their products, OneBeacon believes that by providing superior specialty products to satisfy market needs and relying on agents and brokers who value its targeted expertise, superior claims service, and disciplined underwriting, it establishes a competitive advantage.
7
Claims Management
Effective claims management is a critical factor in achieving satisfactory underwriting results. OneBeacon maintains an experienced staff of claims handlers and managers located throughout its operating territories.
OneBeacon has dedicated claims managers and adjusters for many of its specialty businesses. These individuals ensure that OneBeacon has the appropriate level of expertise to handle claims involving complex issues. Within the claims organization, OneBeacon also uses various shared services to both more efficiently manage costs and ensure the delivery of superior claims results. These shared services include non-specialty property and casualty insurance claims adjusters, operational and information technology support, subrogation and recovery support, medical and legal bill review, a special investigation unit to detect insurance fraud, and dedicated legal support.
OneBeacon has adopted a total claims cost management approach that gives equal importance to controlling claims handling expenses, legal expenses and claim payments. OneBeacon collects and reviews various metrics to analyze claims handling results.
OneBeacon’s claims department uses an online claims system to record reserves, payments and adjuster activity. The system also helps claim handlers identify recovery potential, estimate property damage, evaluate claims and identify fraud. OneBeacon maintains a paperless claim file system.
Catastrophe Risk Management and Reinsurance Protection
Catastrophes are severe losses resulting from a wide variety of events. Examples of catastrophes include losses caused by earthquakes, wildfires, hurricanes and other types of storms and terrorist acts. While OneBeacon’s exposure to catastrophe losses has decreased meaningfully as a result of its repositioning in recent years as a specialty-only company, OneBeacon is still exposed to catastrophe losses. The timing and size of catastrophe losses are unpredictable and the level of losses experienced in any year could be material to OneBeacon’s operating results and financial condition. The extent of losses caused by a catastrophic event is a function of severity and the amount and type of insured exposure in the affected area. In the normal course of business, OneBeacon’s insurance subsidiaries seek to limit losses that may arise from catastrophes or other events through individual risk selection, imposing deductibles and limits, limiting its concentration of insurance in catastrophe-prone areas, such as coastal regions, and reinsuring with third-party reinsurers.
OneBeacon uses models (primarily AIR Worldwide Touchstone version 4.1) to estimate potential losses from catastrophes. OneBeacon uses this model output in conjunction with other data to manage its exposure to catastrophe losses based on a probable maximum loss forecast to quantify its exposure to an extreme catastrophe event.
OneBeacon’s insurance subsidiaries enter into reinsurance contracts to protect their businesses from losses due to concentration of risk and to limit losses arising from catastrophic events. OneBeacon purchases a general catastrophe reinsurance treaty with third-party reinsurers to manage its exposure to large catastrophe losses. Effective May 1, 2016, OneBeacon renewed its property catastrophe reinsurance program through April 30, 2017. The program provides coverage for OneBeacon’s property business as well as certain acts of terrorism. Under the program, the first $20 million of losses resulting from any single catastrophe are retained, with 100.0% of the next $110 million of losses resulting from the catastrophe being reinsured. Any part of losses from a catastrophe in excess of $130 million would be retained in full. In the event of a catastrophe, OneBeacon's property catastrophe reinsurance program is reinstated for the remainder of the original contract term by paying a reinstatement premium that is based on the percentage of coverage reinstated and the original property catastrophe coverage premium. OneBeacon anticipates that the $130 million limit is more than sufficient to cover the maximum hurricane and earthquake losses with a modeled 0.4% probability of occurrence (1-in-250-year). This $130 million limit is consistent with the limit that OneBeacon’s previous catastrophe reinsurance program provided.
OneBeacon’s property catastrophe reinsurance program does not cover property losses resulting from nuclear events or biological, chemical or radiological terrorist attacks. Also excluded are losses resulting from certified acts of terrorism committed by an individual or individuals acting on behalf of any foreign person or foreign interest as defined under the Terrorism Risk Insurance Program (“the Terrorism Act”).
8
OneBeacon also purchases property-per-risk reinsurance coverage to reduce large loss volatility. The property-per-risk reinsurance program reinsures 100% of losses in excess of $3 million up to $100 million. Individual risk facultative reinsurance is purchased above $100 million. The property-per-risk treaty provides one limit of reinsurance protection for losses in excess of $3 million up to $100 million on an individual risk basis for certified acts of foreign terrorism committed on behalf of any foreign person or foreign interest. However, any nuclear events, or biological, chemical or radiological terrorist attacks are not covered.
In addition to the corporate catastrophe and property-per-risk reinsurance protection, OneBeacon also purchases reinsurance protection for certain lines of business. Specialty Property purchases a property catastrophe program providing 100% coverage for $34 million of loss in excess of $6 million of loss, which inures to the benefit of the broader property catastrophe reinsurance program described previously. This treaty limit cannot be reinstated.
In addition to the coverage provided under these treaties, OneBeacon utilizes a number of other catastrophe and general insurance treaties covering specific lines of business. See
Note 4—“Third-Party Reinsurance”
on page F-32 for descriptions of the significant types of our reinsurance agreements.
As reinsurance contracts do not relieve OneBeacon of its obligation to its policyholders, collectability of balances due from reinsurers is important to OneBeacon’s financial strength.
Terrorism
OneBeacon’s current third party reinsurance programs provide varying degrees of coverage for terrorism events. OneBeacon’s overall terrorism exposure is reduced by the Terrorism Act, which is a federal program administered by the U.S. Department of the Treasury that provides for a shared system of public and private compensation for commercial property and casualty losses resulting from events that reach the threshold for losses ($140 million in 2017 and increasing $20 million per year in subsequent years until the threshold becomes $200 million in 2020) and are certified as an act of terrorism by the U.S. Secretary of the Treasury, in concurrence with the U.S. Secretary of Homeland Security and the Attorney General of the United States. The current program was signed into law on January 12, 2015 and is authorized through December 31, 2020. See
Note 4 — “Third-Party Reinsurance”
on page F-32 for a further description of the Terrorism Act, including OneBeacon’s estimated retention level.
OneBeacon closely monitors and manages its concentration of risk for terrorism losses by geographic area. OneBeacon controls its exposures so that the total maximum expected loss from a terrorism event within any half-mile radius in a metropolitan area or around a target risk will not exceed $450 million on a pre-tax basis before considering the federal government participation under the Terrorism Act. Reports monitoring OneBeacon’s terrorism exposures are generated quarterly. In addition, OneBeacon’s underwriting process evaluates all potential new business to determine if it would add exposure to an already existing concentration of risk or would individually add significant risk. As a result, OneBeacon believes that it has appropriately limited its exposure to losses from terrorist attacks. Nonetheless, risks insured by OneBeacon remain exposed to terrorist attacks and, even considering the coverage provided by the Terrorism Act, the possibility remains that losses resulting from future terrorist attacks could prove to be material.
Loss and LAE Reserves
OneBeacon establishes loss and LAE reserves that are estimates of amounts needed to pay claims and related expenses in the future for insured events that have already occurred. The process of estimating reserves involves a considerable degree of judgment by management and is always inherently uncertain. See
“CRITICAL ACCOUNTING ESTIMATES — Loss and LAE Reserves — OneBeacon”
on page 66 and
Note 3 — “Unpaid Losses and Loss Adjustment Expenses”
on page F-17 for a full discussion regarding OneBeacon’s loss reserving process.
OneBeacon’s Senior Notes
In November 2012, OneBeacon U.S. Holdings, Inc. (“OBH”), an intermediate holding company of OneBeacon, issued $275 million face value of senior unsecured notes (the “OBH Senior Notes”) through a public offering, at an issue price of 99.9%. The net proceeds from the issuance of the OBH Senior Notes were used to repurchase OBH’s existing outstanding senior notes that were issued in May 2003. The OBH Senior Notes, which are fully and unconditionally guaranteed as to the payment of principal and interest by OneBeacon Ltd., bear an annual interest rate of 4.6% and are payable semi-annually in arrears on May 9 and November 9 until maturity on November 9, 2022. See
Note 7 — “Debt”
on page F-53 for more details regarding the OBH Senior Notes.
9
HG GLOBAL/BAM
BAM is the first and only mutual municipal bond insurance company in the United States. By insuring the timely payment of principal and interest, BAM provides market access to, and lowers interest expense for, issuers of municipal bonds used to finance essential public purposes. BAM is owned by and operated for the benefit of its mutual policyholders, the municipalities that purchase BAM’s insurance for their debt issuances. BAM is domiciled in New York.
HG Global was established to fund the startup of BAM and, through its subsidiary, HG Re, to provide reinsurance to BAM. HG Global is domiciled in Bermuda.
BAM charges an insurance premium on each municipal bond insurance policy it writes. A portion of the premium is a member’s surplus contribution (“MSC” or “Members Surplus Contribution”) and the remainder is a risk premium. The MSC conveys to the municipal issuer/policyholder certain interests in BAM, including the right to receive dividends in the future, subject to regulatory approval. In the event of a bond refunding, the MSC from the original issuance can be reutilized, in effect serving as a credit against the total insurance premium on the refunding of bonds.
BAM focuses on municipal bonds issued to finance essential public purposes, such as schools, utilities and transportation facilities. BAM focuses on small-to-medium sized investment grade bonds, primarily in the AA-, A and BBB categories. BAM seeks to build a relatively low risk insurance portfolio with conservative single risk limits. White Mountains believes that municipal bonds insured by BAM have strong appeal to retail investors, who buy smaller, less liquid issues, have less portfolio diversification and have fewer credit differentiation skills and analytical resources than institutional investors.
BAM launched in July 2012 after securing an “AA/stable” rating from Standard & Poor’s Financial Services LLC (“Standard & Poor’s”). “AA” is the third highest of twenty-one financial strength ratings assigned by Standard & Poor’s.
At inception in 2012, HG Global was capitalized with $609 million. HG Global, together with its subsidiaries, funded the initial capitalization of BAM through the purchase of $503 million of BAM Surplus Notes. See
“CRITICAL ACCOUNTING ESTIMATES — Surplus Notes Valuation — BAM Surplus Notes”
on page 72 for a discussion on the accounting and risks associated with the BAM Surplus Notes. HG Global contributed the remaining capital and $300 million of the BAM Surplus Notes in order to capitalize HG Re, its wholly owned reinsurance entity.
At inception in 2012, BAM and HG Re entered into a first loss reinsurance treaty (“FLRT”). HG Re provides first loss protection up to 15% of par outstanding on each bond insured by BAM. In return, BAM cedes 60% of the risk premium on the bond, net of a ceding commission.
HG Re’s obligations under the FLRT are satisfied by the assets in two collateral trusts: a Regulation 114 Trust and a Supplemental Trust. Losses required to be reimbursed to BAM by HG Re are subject to an aggregate limit equal to the assets held in the collateral trusts at any point in time. The Regulation 114 Trust target balance is equal to gross ceded unearned premiums and unpaid ceded loss and LAE expenses, if any. The Supplemental Trust target balance is equal to approximately $400 million. The collateral trust balances must be at target levels before excess capital can be distributed out of the Supplemental Trust to HG Re.
If, at any point in time, the sum of the Regulation 114 Trust balance and the Supplemental Trust balance equals zero, BAM may choose to terminate the FLRT on a runoff basis. However, HG Re can elect to continue the FLRT by depositing into the Regulation 114 Trust assets with a fair market value not less than the greater of (i) $100 million or (ii) 10% of the then Regulation 114 Trust target balance.
At inception in 2012, the Supplemental Trust contained $300 million of BAM Surplus Notes and $100 million of cash and fixed income securities. As the BAM Surplus Notes are repaid over time, the BAM Surplus Notes will be replaced in the Supplemental Trust by cash and fixed income securities.
10
The FLRT is a perpetuating agreement, with an initial term of 10 years. The FLRT can be amended after the first 10-year period and after each subsequent 5-year period on a prospective basis. If the parties are unable to mutually agree to amended terms, the dispute is resolved through arbitration, according to certain principles agreed to by the parties. Amended contract terms must be approved by the New York State Department of Financial Services (“NYDFS”). Should BAM consider the amended terms to be unacceptable, it has the option to purchase HG Re, or cause another reinsurer to purchase HG Re, at fair value.
Pursuant to the FLRT, BAM’s underwriting guidelines may only be amended with the consent of HG Re. In addition, HG Global has the right to designate two directors for election to BAM’s board of directors.
As of December 31, 2016 and 2015, HG Global reported $787 million and $739 million of total assets, and $539 million and $558 million of shareholders’ equity. As of December 31, 2016 and 2015, White Mountains owned 96.9% of HG Global's preferred equity and 88.4% of its common equity. As of both December 31, 2016 and 2015, White Mountains reported $17 million of non-controlling interest related to its ownership in HG Global.
As of December 31, 2016 and 2015, White Mountains reported $533 million and $503 million of total assets, and $(151) million and $(140) million of non-controlling interest related to BAM.
Competition
The municipal bond insurance industry is highly competitive. BAM’s primary competitors are Assured Guaranty (“Assured”) and National Public Finance Guarantee (“National”).
BAM, Assured and National each seeks to differentiate itself through financial strength ratings, claims paying resources and underwriting strategies. BAM believes it has a number of distinct competitive advantages. BAM’s insured portfolio consists only of essential public purpose U.S. municipal bonds, and it has no exposure to mortgage and asset-backed securities, derivatives, non-U.S. structured or sovereign credit or territorial credits, such as Puerto Rico. BAM believes that, over time, its mutual structure will deliver a cost of capital advantage relative to its stock company competitors.
BAM seeks to provide transparency with respect to its insured portfolio and each insured issuer. In order to allow issuers and investors in BAM-insured bonds to monitor financial strength first-hand, BAM periodically publishes Credit Profiles on every insured issuer. Credit Profiles are accessible by CUSIP, obligor, state or sector on BAM’s website.
Pricing (i.e., premium level) is affected by a number of factors, including interest rate levels, credits spreads, trading value, and capture rate (i.e., the % of total interest savings captured in the form of insurance premium). All other things being equal, pricing is higher when interest rates are higher, credit spreads are wider, BAM’s trading value is higher relative to competitors and the capture rate is higher.
Insured Portfolio
The following tables present BAM’s insured portfolio by asset class:
|
Sector
|
December 31, 2016
|
December 31, 2015
|
||||||||||
|
Millions
|
Gross Par Outstanding
|
Average Credit Rating
(1)
|
Gross Par Outstanding
|
Average Credit Rating
(1)
|
||||||||
|
General Obligation
|
$
|
19,821.8
|
|
A
|
$
|
13,963.6
|
|
A
|
||||
|
Utility
|
4,338.9
|
|
A+
|
3,032.8
|
|
A
|
||||||
|
Dedicated Tax
|
3,752.0
|
|
A
|
2,503.6
|
|
A
|
||||||
|
General Fund
|
3,016.3
|
|
A
|
1,786.6
|
|
A
|
||||||
|
Public Higher Education
|
1,334.4
|
|
A-
|
630.4
|
|
A
|
||||||
|
Transportation
|
716.3
|
|
A
|
561.5
|
|
A
|
||||||
|
Other Public Finance
|
77.6
|
|
A
|
77.5
|
|
A
|
||||||
|
Total gross par outstanding
|
$
|
33,057.3
|
|
A
|
$
|
22,556.0
|
|
A
|
||||
(1)
The average credit ratings are based on Standard & Poor’s credit ratings, or if unrated by Standard & Poor’s, the Standard & Poor’s equivalent of credit ratings provided by Moody’s Investor Service (“Moody’s”)
11
The following table presents BAM’s ten largest direct exposures based upon gross par outstanding as of
December 31, 2016
:
|
$ in millions
|
Gross Par Outstanding
|
Percent of Total Gross Par Outstanding
|
Credit Rating
(1)
|
||||||||
|
Municipal Authority of Westmoreland County, PA
(Westmoreland County) Water
|
$
|
198.1
|
|
0.6
|
%
|
A+
|
|||||
|
Shreveport, City of, LA (Caddo Parish), Water & Sewer
|
182.3
|
|
0.6
|
|
A-
|
||||||
|
Pennsylvania, Commonwealth of
|
181.2
|
|
0.5
|
|
A
|
||||||
|
Illinois, State of
|
177.8
|
|
0.5
|
|
BBB
|
||||||
|
New Brunswick, City of, NJ (Middlesex County)
|
163.6
|
|
0.5
|
|
A+
|
||||||
|
New Jersey, State Of
|
151.4
|
|
0.5
|
|
BBB+
|
||||||
|
Evansville, City of, IN (Vanderburgh County)
|
139.2
|
|
0.4
|
|
A
|
||||||
|
Hamden, Town of, CT (New Haven County)
|
132.6
|
|
0.4
|
|
A+
|
||||||
|
Monroe County, NY (Monroe County)
|
125.4
|
|
0.4
|
|
A
|
||||||
|
Coachella Valley USD, CA, (Riverside County)
|
124.9
|
|
0.4
|
|
BBB+
|
||||||
|
Total of top ten exposures
|
$
|
1,576.5
|
|
4.8
|
%
|
||||||
(1)
“A+” is the fifth highest, “A” is the sixth highest, “A-“ is the seventh highest, “BBB+” is the eighth highest and “BBB” is the ninth highest of twenty-eight credit ratings assigned by Standard & Poor’s.
The following table presents the geographic distribution of BAM’s insured portfolio as of
December 31, 2016
and 2015:
|
December 31, 2016
|
||||||||||
|
$ in millions
|
Number of Risks
|
Gross Par Outstanding
|
Percent of Total Gross Par Outstanding
|
|||||||
|
California
|
365
|
|
$
|
7,446.9
|
|
22.5
|
%
|
|||
|
Texas
|
448
|
|
4,940.1
|
|
14.9
|
|
||||
|
Pennsylvania
|
284
|
|
4,831.1
|
|
14.6
|
|
||||
|
New York
|
231
|
|
2,489.0
|
|
7.5
|
|
||||
|
Illinois
|
179
|
|
2,021.0
|
|
6.1
|
|
||||
|
New Jersey
|
81
|
|
1,440.0
|
|
4.4
|
|
||||
|
Florida
|
44
|
|
917.7
|
|
2.8
|
|
||||
|
Arizona
|
43
|
|
883.3
|
|
2.7
|
|
||||
|
Ohio
|
60
|
|
865.5
|
|
2.6
|
|
||||
|
Michigan
|
68
|
|
773.8
|
|
2.3
|
|
||||
|
Other States
|
521
|
|
6,448.9
|
|
19.6
|
|
||||
|
Total insured portfolio
|
2,324
|
|
$
|
33,057.3
|
|
100.0
|
%
|
|||
12
|
December 31, 2015
|
||||||||||
|
$ in millions
|
Number of Risks
|
Gross Par Outstanding
|
Percent of Total Gross Par Outstanding
|
|||||||
|
California
|
264
|
|
$
|
5,204.2
|
|
23.1
|
%
|
|||
|
Texas
|
370
|
|
3,751.9
|
|
16.6
|
|
||||
|
Pennsylvania
|
232
|
|
3,323.8
|
|
14.7
|
|
||||
|
New York
|
177
|
|
1,966.6
|
|
8.7
|
|
||||
|
Illinois
|
118
|
|
1,256.7
|
|
5.6
|
|
||||
|
New Jersey
|
60
|
|
902.6
|
|
4.0
|
|
||||
|
Florida
|
35
|
|
623.7
|
|
2.8
|
|
||||
|
Ohio
|
37
|
|
568.2
|
|
2.5
|
|
||||
|
Michigan
|
49
|
|
525.3
|
|
2.3
|
|
||||
|
Louisiana
|
25
|
|
440.7
|
|
2.0
|
|
||||
|
Other States
|
351
|
|
3,992.3
|
|
17.7
|
|
||||
|
Total insured portfolio
|
1,718
|
|
$
|
22,556.0
|
|
100.0
|
%
|
|||
The following table sets forth BAM’s insured portfolio by issue size of exposure as of
December 31, 2016
and 2015:
|
Original Par Amount Per Issue
|
December 31, 2016
|
|||||||||
|
$ in millions
|
Number of Risks
|
Gross Par Outstanding
|
Percent of Total Gross Par Outstanding
|
|||||||
|
Less than $10 million
|
1,388
|
|
$
|
6,309.2
|
|
19.0
|
%
|
|||
|
$10 to $50 million
|
806
|
|
16,628.4
|
|
50.3
|
|
||||
|
$50 to $100 million
|
103
|
|
6,628.9
|
|
20.1
|
|
||||
|
$100 to $200 million
|
27
|
|
3,490.8
|
|
10.6
|
|
||||
|
Total insured portfolio
|
2,324
|
|
$
|
33,057.3
|
|
100.0
|
%
|
|||
|
Original Par Amount Per Issue
|
December 31, 2015
|
|||||||||
|
$ in millions
|
Number of Risks
|
Gross Par Outstanding
|
Percent of Total Gross Par Outstanding
|
|||||||
|
Less than $10 million
|
1,099
|
|
$
|
5,160.6
|
|
22.9
|
%
|
|||
|
$10 to $50 million
|
541
|
|
11,777.2
|
|
52.2
|
|
||||
|
$50 to $100 million
|
69
|
|
4,398.5
|
|
19.5
|
|
||||
|
$100 to $200 million
|
9
|
|
1,219.7
|
|
5.4
|
|
||||
|
Total insured portfolio
|
1,718
|
|
$
|
22,556.0
|
|
100.0
|
%
|
|||
13
OTHER OPERATIONS
White Mountains’s Other Operations segment consists of the Company and its intermediate holding companies, its wholly-owned investment management subsidiary, WM Advisors, WM Capital Investments, which includes the consolidated results of MediaAlpha, Wobi, Star & Shield and Buzzmove, and various other private capital investments. On January 13, 2017, White Mountains reached an agreement to sell Star & Shield and its investment in the SSIE Surplus Notes to K2 Insurance Services LLC. As a result, White Mountains has presented Star & Shield's and SSIE's assets and liabilities as held for sale as of December 31, 2016 and 2015.
WM Advisors
WM Advisors is a registered investment adviser that manages substantially all of White Mountains’s investment portfolio, which consists of fixed maturity investments, short-term investments, common equity securities and other long-term investments, including hedge funds and private equity funds. Other long-term investments also include various non-controlling interests in private capital investments and the OneBeacon Surplus Notes. WM Advisors also has investment management agreements with certain third parties that have an affiliation with White Mountains. As of December 31, 2016, WM Advisors had approximately $5.0 billion in assets under management.
On February 1, 2016, Symetra Financial Corporation (“Symetra”) closed its merger agreement with Sumitomo Life Insurance Company (“Sumitomo Life”). On April 18, 2016, White Mountains completed the sale of Sirius Group to CMI. WM Advisors managed the investment portfolios of both Symetra and Sirius Group for a transition period after each respective transaction. As of December 31, 2016, WM Advisors no longer managed any invested assets for Symetra or Sirius Group.
WM Capital Investments
White Mountains, through its wholly-owned subsidiary White Mountains Capital, Inc. (“WM Capital”), sources, executes and monitors private capital investments (“WM Capital Investments”). When making investments, WM Capital seeks to invest in and partner with like-minded owners and management teams. WM Capital tailors the structure of each investment according to the unique needs of the situation. WM Capital believes its long-term approach can be a competitive advantage over traditional private capital investors who often have more rigid holding periods. The investments in which WM Capital holds a controlling ownership interest are consolidated within the Other Operations segment. The investments in which WM Capital holds a non-controlling interest are unconsolidated and are accounted for at fair value within other long-term investments. WM Capital’s Investments include:
Consolidated WM Capital Investments
MediaAlpha
In March 2014, White Mountains invested in MediaAlpha, an advertising technology company that develops transparent and efficient platforms for the buying and selling of insurance and other vertical-specific performance media (i.e., clicks, calls and leads). MediaAlpha’s exchange technology, machine learning and analytical tools facilitate transparent, real-time transactions between advertisers (buyers of advertising inventory) and publishers (sellers of advertising inventory). MediaAlpha works with over 300 advertisers and 225 publishers across a number of insurance (auto, motorcycle, home, renter, health and life) and non-insurance (travel, education, personal finance and solar) verticals.
As of December 31, 2016 and 2015, White Mountains reported total assets of $58 million and $63 million related to MediaAlpha and shareholders’ equity of $29 million and $36 million ($18 million and $22 million net of non-controlling interests). As of December 31, 2016, White Mountains has invested approximately $36 million in MediaAlpha ($22 million, net of distributions received) and owns 60% of the company’s outstanding Class A common units.
Wobi
In February 2014, White Mountains invested in Wobi, the leading financial-sector price comparison business in Israel. Wobi has built a consumer-facing technology platform to enable price comparison and has assembled a panel of large, branded insurance carriers. The company sells five insurance lines of business today (auto, home, travel, health and mortgage) and earns commissions on all policy sales. Wobi also offers a pension products comparison service for Israeli customers and earns transaction fees when customers use the service to connect to companies that sell those pension products.
As of December 31, 2016 and 2015, White Mountains reported total assets of $27 million and $23 million related to Wobi, and shareholders’ equity of $18 million and $15 million ($17 million and $14 million net of non-controlling interests). White Mountains has made a series of investments in Wobi since its initial investment to (i) support growth, (ii) increase its ownership stake through additional share purchases and (iii) fund the acquisition of Tnuva Finansit Ltd. (“Cashboard”), the core platform for the Wobi pension business. As of December 31, 2016, White Mountains has invested approximately NIS 173 (approximately $47 million) in Wobi and owns approximately 95% of the company.
14
Buzzmove
In August 2016, White Mountains invested in Buzzmove, an online price comparison and booking platform for all moving related services in the United Kingdom. Buzzmove manages a panel of over 350 moving company partners that bid in real-time on customers’ moving-related jobs through the company’s technology platform.
As of December 31, 2016, White Mountains reported total assets of $10 million related to Buzzmove and shareholders’ equity of $10 million ($7 million net of non-controlling interests). As of December 31, 2016, White Mountains has invested approximately GBP 6 million (approximately $8 million) in Buzzmove and owns 71% of the company on a fully converted basis.
Unconsolidated WM Capital Investments
Compare.com
In May 2012, White Mountains invested in Compare.com, a U.S. based online price comparison business for auto insurance. Since 2012, White Mountains has made additional investments in the company to (i) support growth and (ii) increase its ownership stake through additional share purchases. As of December 31, 2016, White Mountains has invested approximately $34 million in Compare.com and owns approximately 22% of the company.
Captricity
In December 2015, White Mountains invested in Captricity, a company that provides proprietary artificial intelligence technology solutions to modernize legacy workflow for enterprise clients, including insurance clients. As of December 31, 2016, White Mountains has invested approximately $29 million in Captricity and owns 22% of the company on a fully-converted basis.
PassportCard
In April 2015, White Mountains invested in PassportCard, a global travel insurance business based on a proprietary card-based technology solution that enables real-time travel insurance service and claims. As of December 31, 2016, White Mountains has invested approximately $21 million in PassportCard and owns 50% of the company.
durchblicker
In July 2014, White Mountains invested in durchblicker, an Austrian online price comparison business for both insurance (auto, home, legal, accident, travel) and non-insurance (energy, telephone, financial products) verticals. As of December 31, 2016, White Mountains has invested approximately EUR 9 million (approximately $12 million) in durchblicker and owns 45% of the company on a fully converted basis.
Enlightenment Capital
In November 2012, in connection with its limited partnership investment in Enlightenment Capital Fund I, White Mountains acquired a 15% general partner interest in Enlightenment Capital, a private investment firm that provides flexible capital solutions to middle market businesses in the aerospace, defense and government sectors. White Mountains also holds non-controlling limited partnership interests in both Enlightenment Capital Fund I and Enlightenment Capital Fund II. Through December 31, 2016, White Mountains has invested approximately $30 million in the Enlightenment Capital Funds ($14 million, net of distributions received).
OneTitle
In December 2015, White Mountains invested in OneTitle, a direct-to-consumer title insurance business based in New York. As of December 31, 2016, White Mountains has invested approximately $3 million in OneTitle and owns 20% of the company. White Mountains has a contingent commitment to an affiliate of OneTitle through a $10 million surplus note facility. This facility was undrawn at December 31, 2016.
15
HELD FOR SALE AND DISCONTINUED OPERATIONS
Sirius Group
On April 18, 2016, White Mountains completed the sale of Sirius Group to CMI for approximately $2.6 billion. $162 million of this amount was used to purchase certain assets to be retained by White Mountains out of Sirius Group, including shares of OneBeacon. The amount paid at closing was based on an estimate of Sirius Group’s closing date tangible common shareholder’s equity. In 2016, White Mountains reported a $477 million gain from sale of Sirius Group in discontinued operations. See
Note 2 — “Significant Transactions”
on page F-14.
While owned by White Mountains, Sirius Group provided reinsurance and insurance products for property, accident and health, aviation and space, trade credit, marine, agriculture and certain other exposures on a worldwide basis through its subsidiary, Sirius International Insurance Corporation. Sirius Global Solutions, formerly known as White Mountains Solutions, specialized in the acquisition and management of runoff liabilities for insurance and reinsurance companies both in the United States and internationally.
See
Note 22 — “Held for Sale and Discontinued Operations”
on page F-87 for details of amounts included in net assets held for sale, net income (loss) from discontinued operations and gains (losses) from sales of discontinued operations.
Tranzact
On July 21, 2016, White Mountains completed the sale of Tranzact to an affiliate of Clayton, Dubilier & Rice, LLC and received net proceeds of $221 million at closing. While owned by White Mountains, Tranzact was a New Jersey-based provider of comprehensive direct-to-consumer customer acquisition solutions, primarily to insurance companies. Tranzact developed a technology-enabled platform that provides sophisticated direct marketing solutions, fully-provisioned sales and/or robust customer management systems to brand-focused companies seeking to target and acquire a large number of customers on a direct basis. Tranzact operated in the health, life, and property and casualty insurance verticals (as well as several non-insurance verticals). Tranzact generated revenues through commissions and technology licensing, maintenance, and professional fees.
In the third quarter of 2016 White Mountains reported an $82 million increase to book value and adjusted book value from the sale of Tranzact. See
Note 2 — “Significant Transactions”
on page F-14.
See
Note 22 — “Held for Sale and Discontinued Operations”
on page F-87 of the accompanying consolidated financial statements for details of amounts included in net assets held for sale, net income (loss) from discontinued operations and gains (losses) from sales of discontinued operations.
Star & Shield
On July 1, 2016, SSIE voluntarily ceased writing new policies. As a result, White Mountains wrote off its investment in the SSIE Surplus Notes which resulted in a $21 million total decrease to net income attributable to White Mountain’s common shareholders and a corresponding increase to net income attributable to non-controlling interests. On August 19, 2016, White Mountains reached an agreement to sell Star & Shield and its investment in the SSIE Surplus Notes to National General Holdings Corp., which was subsequently terminated on December 2, 2016. On January 13, 2017, White Mountains reached an agreement to sell Star & Shield and its investment in the SSIE Surplus Notes to K2 Insurance Services LLC. As a result, White Mountains has presented Star & Shield’s and SSIE’s assets and liabilities as held for sale as of December 31, 2016 and 2015.
See
Note 22 — “Held for Sale and Discontinued Operations”
on page F-87 for details of amounts included in net assets held for sale, net income (loss) from discontinued operations and gains (losses) from sales of discontinued operations.
OneBeacon Runoff Business
On December 23, 2014, OneBeacon completed the Runoff Transaction, which included the transfer of certain legal entities that contain the assets, liabilities (including gross and ceded loss reserves) and capital supporting the Runoff Business as well as certain infrastructure, such as staff and office space. Additionally, as part of the Runoff Transaction, OneBeacon provided financing in the form of the OneBeacon Surplus Notes. See
Note 2 — “Significant Transactions”
on page F-14.
See
Note 22 — “Held for Sale and Discontinued Operations”
on page F-87 for details of amounts included in net assets held for sale, net income (loss) from discontinued operations and gains (losses) from sales of discontinued operations.
16
INVESTMENTS
White Mountains’s investment philosophy is to maximize long-term total returns (after tax) while taking prudent levels of risk and maintaining a diversified portfolio, subject to White Mountains’s investment guidelines and various regulatory restrictions. Under White Mountains’s philosophy, each dollar of after-tax investment income or investment gains (realized or unrealized) is valued equally.
White Mountains’s investment portfolio as of
December 31, 2016
and 2015 consisted in large part of high-quality, short-duration, fixed maturity investments and short-term investments. During the third quarter of 2016, White Mountains established a portfolio of high-yield fixed maturity investments. White Mountains also maintains an equity portfolio that consisted of common equity securities and other long-term investments, including hedge funds, private equity funds, various non-controlling interests in private capital investments and the OneBeacon Surplus Notes. White Mountains’s management believes that prudent levels of investments in high-yield fixed maturity investments, common equity securities and other long-term investments are likely to enhance long-term after-tax total returns. See
“Portfolio Composition”
on page 54.
White Mountains’s fixed maturity investment strategy is to purchase securities that are attractively priced in relation to their investment risks. White Mountains also actively manages the average duration of the portfolio. As of December 31, 2016, the fixed income portfolio duration, including short-term investments but excluding high-yield fixed maturity investments, was approximately 2.6 years. Including both short-term investments and high-yield fixed maturity investments, duration was approximately 2.8 years as of
December 31, 2016
.
White Mountains looks to enhance long-term after-tax total returns by investing a portion of the portfolio in common equity securities and other long-term investments. White Mountains owns passive exchange traded funds (ETFs) that seek to provide investment results that, before expenses, correspond to the performance of broad market indices.
White Mountains has also established relationships with third party registered investment advisers to manage its high-yield fixed maturity investments and publicly-traded common equity securities. As of December 31, 2016, these relationships were with Principal Global Investors, LLC (“Principal”), Lateef Investment Management (“Lateef”) and Silchester International Investors (“Silchester”).
Symetra
In 2004, White Mountains, Berkshire Hathaway, Inc. and several other private investors capitalized Symetra in order to purchase the life and investment operations of Safeco Corporation for $1.35 billion, during which White Mountains invested $195 million in Symetra. As of February 1, 2016 and December 31, 2015, White Mountains owned
20,562,379
common shares of Symetra, a
17.7%
common share ownership. On February 1, 2016, Symetra closed its merger agreement with Sumitomo Life and White Mountains received proceeds of $658 million, or $32 per common share. During the period White Mountains held its investment, Symetra focused mainly on group insurance, individual life insurance, structured settlements and retirement services. Symetra’s common shares were traded under the symbol “SYA” on the New York Stock Exchange.
Symetra’s total revenues and net income through September 30, 2015, which was the last period White Mountains accounted for Symetra common shares under the equity method before changing to fair value, were $1.6 billion and $90 million. As of September 30, 2015, Symetra had total assets of $35.0 billion and shareholders’ equity of $3.1 billion. Symetra’s total revenues and net income for the year ended December 31, 2014 was $2.2 billion and $254 million. During the period White Mountains held its investment, White Mountains received a total of $151 million in cash dividends from Symetra.
REGULATION
United States
White Mountains’s U.S.-based insurance subsidiaries are subject to regulation and supervision in each of the states where they are domiciled and licensed to conduct business. Generally, state regulatory authorities have broad supervisory and administrative powers over such matters as licenses, standards of solvency, premium rates, policy forms, investments, statutory deposits, methods of accounting, form and content of financial statements, reserves for unpaid loss and LAE, reinsurance, minimum capital and surplus requirements, dividends and other distributions to shareholders, annual and other report filings and other market conduct. In general, such regulation is for the protection of policyholders rather than shareholders. White Mountains believes that it is in compliance with all applicable laws and regulations pertaining to its business that would have a material effect on its financial position in the event of non-compliance.
17
State Accreditation and Monitoring
All states have laws establishing standards that an insurer must meet to maintain its license to write business. In addition, all states have enacted laws substantially similar to the National Association of Insurance Commissioners’ (“NAIC”) risk-based capital (“RBC”) standards for property and casualty companies, which are designed to determine minimum capital requirements and to raise the level of protection that statutory surplus provides for policyholder obligations. The RBC formula for property and casualty insurance companies measures three major areas of risk: underwriting, which encompasses the risk of adverse loss developments and inadequate pricing; declines in asset values arising from market and/or credit risk; and off-balance sheet risk arising from adverse experience from non-controlled assets, guarantees for affiliates or other contingent liabilities and excessive premium growth. Under laws adopted by individual states, insurers having less total adjusted capital than that required by the RBC calculation will be subject to varying degrees of regulatory action, depending on the level of capital inadequacy. The current RBC ratios of White Mountains’s active U.S.-based insurance subsidiaries are satisfactory and such ratios are not expected to result in any adverse regulatory action. White Mountains is not aware of any current recommendations by regulatory authorities that would be expected to have a material effect on its results of operations or liquidity.
The NAIC has a set of financial relationships or tests known as the Insurance Regulatory Information System (“IRIS”) to assist state insurance regulators in monitoring the financial condition of insurance companies and identifying companies that require special regulatory attention. Insurance companies generally submit data annually to the NAIC, which in turn analyzes the data using prescribed financial data ratios (“IRIS ratios”), each with defined "usual ranges." Generally, regulators will begin to investigate or monitor an insurance company if its IRIS ratios fall outside the usual ranges for four or more of the ratios. If an insurance company has insufficient capital, regulators may act to reduce the amount of insurance it can issue or, in severe situations, assume control of the company. White Mountains currently believes that all of its U.S.-based insurance subsidiaries are within an acceptable IRIS range, and is not aware of any IRIS-related regulatory investigations related to its U.S.-based insurance subsidiaries.
Many states have laws and regulations that limit an insurer's ability to exit a market. For example, certain states prohibit an insurer from withdrawing from one or more lines of insurance business in the state without providing prior notice to or obtaining the state regulator's approval. State regulators may refuse to approve withdrawal plans on the grounds that they could lead to market disruption, or for other reasons, including political and tax-related reasons. Some states also limit canceling or non-renewing certain policies for specific reasons.
State insurance laws and regulations include numerous provisions governing marketplace activities of insurers, including provisions governing marketing and sales practices, policyholder services, claims management and complaint handling. State regulatory authorities generally test and enforce these provisions through periodic market conduct examinations.
The NAIC’s Annual Financial Reporting Model Regulation, or the Model Audit Rule (“MAR”), which includes provisions that are similar to certain Sarbanes-Oxley requirements for public companies, requires certain insurance companies to appoint audit committees to oversee accounting and financial reporting processes as well as oversee the audit of the insurer’s statutory financial statements. Audit committees also are required to appoint independent auditors, among other things. The appointed audit committee receives reports regarding significant deficiencies, material weaknesses and solvency concerns at the insurance company level. Certain insurance companies are also required to annually file a management report on internal control over financial reporting.
Regulators in states that adopted the NAIC’s 2010 amendment to the Model Insurance Holding Company System Regulatory Act (the “Model Holding Company Act”) have enhanced authority to regulate insurers as well as their affiliated entities. The amendment to the Model Holding Company Act requires the ultimate controlling person in an insurer’s holding company structure to identify and report to state insurance regulators material risks within the structure that could pose enterprise risk to the insurer.
Guaranty Funds and Mandatory Shared Market Mechanisms
As a condition of their license to do business in certain states, White Mountains’s U.S.-based insurance subsidiaries are required to participate in guaranty funds, in which licensed insurers within the state bear a portion of the loss suffered by claimants due to the insolvency of other insurers in that state. Certain states also impose mandatory shared market mechanisms, such as assigned risk plans, with each state dictating the types of insurance and the level of coverage that must be provided. Assigned risk plans require insurers licensed within the applicable state to accept applications for insurance policies from customers who are unable to obtain insurance in the voluntary market. The total number of such policies an insurer is required to accept is based on its market share of voluntary business in the state. Underwriting results related to assigned risk plans are typically adverse. Accordingly, White Mountains may be required to underwrite policies with a higher risk of loss than it would otherwise accept.
18
Reinsurance facilities are another type of shared market mechanism. Reinsurance facilities require an insurance company to accept all applications submitted by certain state designated agents. The reinsurance facility then allows the insurer to cede some of its business to the reinsurance facility and the facility will reimburse the insurer for claims paid on ceded business. Typically, however, reinsurance facilities operate at a deficit, which is funded through assessments against the same insurers. As a result, White Mountains could be required to underwrite policies with a higher risk of loss than it would otherwise voluntarily accept.
Pricing, Investments and Dividends
Nearly all states have insurance laws requiring property and casualty insurance companies to file their rates, rules and policy or coverage forms with the state’s regulatory authority. In most cases, such rates, rules and forms must be approved prior to use. While pricing laws vary from state to state, their objectives are generally to ensure that rates are not excessive, unfairly discriminatory or used to engage in unfair price competition. The ability and timing of White Mountains’s U.S.-based insurance subsidiaries to increase rates are dependent upon the regulatory requirements in each state.
White Mountains’s U.S.-based insurance subsidiaries are subject to state laws and regulations that require investment portfolio diversification and that dictate the quality, quantity and general types of investments they may hold. Non-compliance may cause non-conforming investments to be non-admitted when measuring statutory surplus and, in some instances, may require divestiture. White Mountains’s investment portfolio as of
December 31, 2016
complied with such laws and regulations in all material respects.
One of the primary sources of cash inflows for the Company and certain of its intermediate holding companies is dividends or distributions received from its insurance subsidiaries. Under the insurance laws of the domiciliary states under which White Mountains’s U.S.-based insurance subsidiaries are domiciled, an insurer is restricted with respect to the timing or the amount of dividends it may pay without prior approval by regulatory authorities. See
“Dividend Capacity”
on page 56 for further discussion.
Holding Company Structure
White Mountains is subject to regulation under certain state insurance holding company acts. These regulations contain reporting requirements relating to the capital structure, ownership, financial condition and general business operations of White Mountains’s insurance subsidiaries. These regulations also contain special reporting and prior approval requirements with respect to certain transactions among affiliates. Since the Company is an insurance holding company, the domiciliary states of its insurance subsidiaries impose regulatory application and approval requirements on acquisitions of White Mountains’s common shares which may be deemed to confer control over those subsidiaries, as that concept is defined under the applicable state laws. Acquisition of 10% of White Mountains’s common shares, or in some states as little as 5%, may be deemed to confer control under the insurance laws of some jurisdictions, and the application process for approval can be extensive and time consuming.
Legislation
Although the federal government does not directly regulate the insurance business, federal legislation and administrative policies impact the industry. In addition, legislation has been introduced in recent years that, if enacted, could result in the federal government assuming a more direct role in the regulation of the insurance industry. Notably, the Dodd-Frank Wall Street Reform and Consumer Protection Act (the “Dodd-Frank Act”) created the Federal Insurance Office (“FIO”) within the Treasury Department, which is responsible for gathering information and monitoring the insurance industry to identify gaps in the regulation of insurers that could contribute to a systemic crisis in the insurance industry or U.S. financial system.
White Mountains’s U.S.-based insurance subsidiaries are impacted by other federal regulations targeted at the insurance industry, such as the Terrorism Act, which established a federal “backstop” for commercial property and casualty losses. See
“ONEBEACON — Terrorism”
on page 9 for a further discussion of the Terrorism Act. For example, the generally applicable levels of reinsurance support that the federal government provides to authorized carriers under the Terrorism Act could be reduced by legislation. A number of additional enacted and pending legislative measures could lead to increased consolidation and increased competition for business and for capital in the financial services industry. White Mountains cannot predict whether any state or federal measures will be adopted to change the nature or scope of the regulation of the insurance business or what effect such measures may have on its insurance operations.
In addition to emerging federal regulation, many states are adopting laws that attempt to strengthen the ability of regulators to understand and regulate the risk management practices of insurers and insurance groups. For example, many states have adopted measures related to the NAIC’s Solvency Modernization Initiative (“SMI”), which have included model regulations that require insurers to summarize their key risks and risk management strategies to regulators. The SMI resulted in a 2010 amendment to the NAIC’s Model Insurance Holding Company System Regulatory Act (the “Model Holding Company Act”), which requires the ultimate controlling person in an insurer’s holding company structure to identify and report material enterprise risks to the state insurance regulator.
19
The SMI also produced the NAIC Risk Management and Own Risk Solvency Model Act (“ORSA”), which requires insurers meeting premium thresholds to: 1) maintain a risk management framework; and 2) annually submit a comprehensive report designed to assess the adequacy of an insurer’s risk management practices, including risks related to the insurer’s future solvency position. ORSA requirements became effective in 2015 in all of the domiciliary states of White Mountains’s U.S.-based insurance company subsidiaries.
WM Advisors is a registered investment adviser and is regulated by the United States Securities and Exchange Commission under the United States Investment Advisers Act of 1940.
Bermuda
Insurance Regulation
The Insurance Act 1978 of Bermuda and related regulations, as amended (the “Insurance Act”), regulates the insurance businesses of Split Rock and HG Re, and provides that no person may carry on any insurance business in or from within Bermuda unless registered as an insurer under the Insurance Act by the Bermuda Monetary Authority (“BMA”). The BMA, in deciding whether to grant registration, has broad discretion to act as it thinks fit in the public interest. The BMA is required by the Insurance Act to determine whether the applicant is a fit and proper body to be engaged in the insurance business and, in particular, whether it has, or has available to it, adequate knowledge and expertise to operate an insurance business. In addition, the BMA is required by the Insurance Act to determine whether a person who proposes to control 10 percent, 20 percent, 33 percent or 50 percent (as applicable) of the voting powers of a Bermuda registered insurer or its parent company is a fit and proper person to exercise such degree of control. See
“Dividend Capacity”
on page 56 for further discussion.
The continued registration of an applicant as an insurer is subject to the applicant complying with the terms of its registration and such other conditions as the BMA may impose from time to time. The Insurance Act also grants to the BMA powers to supervise, investigate and intervene in the affairs of Bermuda insurance companies.
The Insurance Act imposes solvency and liquidity standards on Bermuda insurance companies, as well as auditing and reporting requirements. White Mountains believes that it is in compliance with all applicable laws and regulations pertaining to its business that would have a material effect on its financial position in the event of non-compliance.
Certain Other Bermuda Law Considerations
The Company is an exempted company incorporated and organized under the Companies Act 1981 of Bermuda (the “Companies Act”). As a result, the Company is required to comply with the provisions of the Companies Act regulating the payment of dividends and making of distributions from contributed surplus. A company is prohibited from declaring or paying a dividend, or making a distribution out of contributed surplus, if there are reasonable grounds for believing that:
|
(1)
|
the company is, or would after the payment be, unable to pay its liabilities as they become due; or
|
|
(2)
|
the realizable value of the company’s assets would thereby be less than its liabilities.
|
Under the Company’s bye-laws, each common share is entitled to dividends if, and when, dividends are declared by its board of directors, subject to any preferred dividend rights of the holders of any preference shares. Issued share capital is the aggregate par value of the company’s issued shares, and the share premium account is the aggregate amount paid for issued shares over and above their par value. Share premium accounts may be reduced in certain limited circumstances. In addition, the Companies Act regulates return of capital, reduction of capital and any purchase or redemption of shares by the Company.
Although the Company is incorporated in Bermuda, it has been designated as non-resident of Bermuda for exchange control purposes by the BMA. Pursuant to its non-resident status, the Company may hold any currency other than Bermuda dollars and convert that currency into any other currency, other than Bermuda dollars, without restriction.
Shares may be offered or sold in Bermuda only in compliance with the provisions of the Investment Business Act 2003 and the Exchange Control Act 1972, and related regulations of Bermuda which regulate the sale of securities in Bermuda. In addition, specific permission is required from the BMA pursuant to the provisions of the Exchange Control Act 1972 and related regulations, for all issuances and transfers of securities of Bermuda companies, other than in cases where the BMA has granted a general permission. The BMA in its policy dated June 1, 2005 provides that where any equity securities, including the Company’s common shares, of a Bermuda company are listed on an appointed stock exchange, general permission is given for the issue and subsequent transfer of any securities of a company from and/or to a non-resident, for as long as any equity securities of such company remain so listed. The New York Stock Exchange is deemed to be an appointed stock exchange under Bermuda law. Notwithstanding the above general permission, the BMA has granted the Company permission to, subject to its common shares being listed on an appointed stock exchange, (a) issue and transfer its shares, up to the amount of its authorized capital from time to time, to persons resident and non-resident of Bermuda for exchange control purposes; (b) issue and transfer options, warrants, depositary receipts, rights, and other securities; and (c) issue and transfer loan notes and other debt instruments and options, warrants, receipts, rights over loan notes and other debt instruments to persons resident and non-resident of Bermuda for exchange control purposes.
20
Under Bermuda law, exempted companies are companies formed for the purpose of conducting business outside Bermuda from a principal place in Bermuda. As an exempted company, the Company may not, without the express authorization of the Bermuda legislature or under a license granted by the Bermuda Minister of Economic Development (the “Minister”), participate in various specified business transactions, including
|
•
|
the acquisition or holding of land in Bermuda, except land held by way of lease or tenancy agreement which is required for the Company’s business and held for a term not exceeding 50 years, or which is used to provide accommodation or recreational facilities for the Company’s officers and employees and held with the consent of the Minister, for a term not exceeding 21 years;
|
|
•
|
the taking of mortgages on land in Bermuda in excess of $50,000;
|
|
•
|
the acquisition of any bonds or debentures secured by any land in Bermuda, other than certain types of Bermuda government or public authority securities; or
|
|
•
|
subject to some exceptions, the carrying on of business of any kind in Bermuda for which the Company is not licensed in Bermuda.
|
Under Bermuda law, non-Bermudians (other than spouses of Bermudians, holders of permanent resident certificates and holders of working resident certificates) may not engage in any gainful occupation in Bermuda without an appropriate governmental work permit. Work permits may be granted or extended by the Bermuda government upon showing that, after proper public advertisement in most cases, no Bermudian (or spouse of a Bermudian or a holder of a permanent resident’s certificate or holder of a working resident’s certificate) is available who meets the minimum standard requirements for the advertised position. A waiver from advertising is automatically granted in respect of any chief executive officer position and other chief officer positions.
RATINGS
Insurance companies are evaluated by various rating agencies in order to measure each company’s financial strength. Higher ratings generally indicate financial stability and a stronger ability to pay claims. White Mountains believes that strong ratings are important factors in the marketing and sale of insurance products and services to agents and consumers and ceding companies.
The following table presents the financial strength ratings assigned to White Mountains’s principal insurance subsidiaries within OneBeacon as of February 27, 2017:
|
A.M. Best
(1)
|
Fitch
(2)
|
Moody’s
(3)
|
Standard &
Poor’s
(4)
|
||||
|
OneBeacon
|
|||||||
|
Rating
|
“A” (Excellent)
|
“A” (Strong)
|
“A3” (Good)
|
“A-” (Strong)
|
|||
|
Outlook
|
Stable
|
Stable
|
Stable
|
Stable
|
|||
|
(1)
|
“A” is the third highest of sixteen financial strength ratings assigned by A.M. Best Company (“A.M. Best”).
|
|
(2)
|
“A” is the sixth highest of nineteen international financial strength ratings assigned by Fitch Ratings (“Fitch”).
|
|
(3)
|
“A3” is the seventh highest of twenty-one financial strength ratings assigned by Moody’s
|
|
(4)
|
“A-” is the seventh highest of twenty-one financial strength ratings assigned by Standard & Poor’s.
|
As of February 27, 2017 BAM is rated “AA/stable” by Standard & Poor’s. “AA” is the third highest of twenty-one financial strength ratings assigned by Standard & Poor’s.
EMPLOYEES
As of
December 31, 2016
, White Mountains employed approximately 1,400 people (consisting of 52 people at the Company, its intermediate holding companies and HG Global, approximately 1,100 people at OneBeacon, 102 people at Wobi, 36 people at MediaAlpha, 31 people at Star & Shield, 30 people at WM Advisors and 21 people at Buzzmove). Management believes that White Mountains has satisfactory relations with its employees.
21
AVAILABLE INFORMATION
The Company is subject to the informational reporting requirements of the Exchange Act. In accordance therewith, the Company files reports, proxy statements and other information with the SEC. These documents are available at
www.whitemountains.com
shortly after such material is electronically filed with or furnished to the SEC. In addition, the Company’s code of business conduct and ethics as well as the various charters governing the actions of certain of the Company’s Committees of its Board of Directors, including its Audit Committee, Compensation Committee and Nominating and Governance Committee, are available at
www.whitemountains.com
.
The Company will provide to any shareholder, upon request and without charge, copies of these documents (excluding any applicable exhibits unless specifically requested). Written or telephone requests should be directed to the Corporate Secretary, White Mountains Insurance Group, Ltd., 26 Reid Street, Hamilton, HM 11 Bermuda, telephone number (441) 278-3160. Additionally, all such documents are physically available at the Company’s registered office at Clarendon House, 2 Church Street, Hamilton, HM 11 Bermuda.
The information contained in this report may contain “forward-looking statements” within the meaning of Section 27A of the Securities Act of 1933 and Section 21E of the Securities Exchange Act of 1934.
See
“FORWARD-LOOKING STATEMENTS”
on page 75 for specific important factors that could cause actual results to differ materially from those contained in forward-looking statements.
The Company’s actual future results and trends may differ materially depending on a variety of factors including, but not limited to, the risks and uncertainties discussed below.
Our investment portfolio may suffer reduced returns or losses, which could materially adversely affect our results of operations and financial condition. Adverse changes in interest rates, debt markets, equity markets, market volatility or foreign currency exchange rates could result in significant losses to the fair value of our investment portfolio.
Our investment portfolio consists of fixed maturity investments, short-term investments, common equity securities and other long-term investments, including hedge funds, private equity funds, various non-controlling interests in private capital investments and the OneBeacon Surplus Notes. We invest to maximize long-term total returns (after tax) while taking prudent levels of risk and maintaining a diversified portfolio subject to our investment guidelines and various regulatory restrictions. However, investing entails substantial risks. We may not achieve our investment objectives, and our investment performance may vary substantially over time. Investment returns are an important part of our strategy to grow adjusted book value per share, and fluctuations in the fixed income or equity markets could adversely affect our results of operations and financial condition.
Both the investment income we generate and the fair market value of our investment portfolio are affected by general economic and market conditions that are outside of our control, including fluctuations in interest rates, debt market levels, equity market levels, market volatility, foreign currency exchange rates and credit losses sustained by issuers. Interest rates are highly sensitive to many factors, including governmental monetary policies, economic and political conditions and other factors beyond our control. In particular, a significant increase in interest rates could result in significant losses in the fair value of our investment portfolio and, consequently, could adversely affect our results of operations and financial condition. We are also exposed to changes in equity markets. A significant decline in the equity markets such as that experienced from September 2008 to March 2009 could have a material adverse effect on our results of operations and financial condition. We also hold investments, such as hedge funds, private equity funds, various non-controlling interests in private capital investments and surplus notes that are not regularly traded in active investment markets and may be illiquid. These investments can experience greater volatility in their returns or valuation, which could adversely affect our results of operations and financial condition. Additionally, a portion of our investment portfolio is invested in securities denominated in currencies other than the U.S. dollar, predominantly the British Pound Sterling and the Euro. A significant strengthening of the U.S. dollar against these other currencies could adversely affect our results of operations and financial condition.
22
If BAM does not pay some or all of the interest and principal due on the BAM Surplus Notes, White Mountains’s adjusted book value per share, results of operations and financial condition could be materially adversely affected.
As of December 31, 2016, White Mountains owns $503 million in BAM Surplus Notes and has accrued $108 million in interest due thereon. BAM has not yet made any cash payments to White Mountains for amounts owed under the BAM Surplus Notes. No payment of interest or principal on the BAM Surplus Notes may be made (1) without the approval of the New York State Department of Financial Services and (2) unless BAM maintains Qualified Statutory Capital of at least $500 million. Under its agreements with HG Global, BAM is required to seek regulatory approval to pay interest and principal on the BAM Surplus Notes only to the extent that its capital resources support its outstanding obligations, business plan and ratings. It is unlikely that BAM will pay interest and principal on the BAM Surplus Notes if such payments could lead to a ratings downgrade.
Interest payments on the BAM Surplus Notes are due quarterly but are subject to deferral, without penalty or default and without compounding, for payment in the future. No principal is due on the BAM Surplus Notes prior to the stated maturity date of 2042.
BAM’s premiums are dependent on a number of factors, many of which are beyond BAM’s control, including primary municipal bond issuance levels, insured penetration rates, interest rate levels, credit spreads, trading value, capture rate and market share.
During 2016, BAM’s total premiums were $77 million, of which $38 million were MSC and $39 million were risk premiums. BAM must increase these premium levels in the future in order to be able to pay the amounts due on the BAM Surplus Notes. If BAM does not pay some or all of the amounts due on the BAM Surplus Notes, our adjusted book value per share, results of operations and financial condition could be materially adversely impacted.
Our loss and LAE reserves may be inadequate to cover our ultimate liability for losses, and as a result, our results of operations and financial condition could be adversely affected.
We must maintain reserves adequate to cover our estimated ultimate liabilities for loss and LAE. Loss and LAE reserves are typically comprised of (1) case reserves for claims reported and (2) IBNR reserves for losses that have occurred but for which claims have not yet been reported and for expected future development on case reserves. Loss and LAE reserves are estimates of what we believe the settlement and administration of claims will cost based on facts and circumstances then known to us. These estimates involve actuarial and claims assessments, and require us to make a number of assumptions about future events that are subject to unexpected changes and are beyond our control, such as future trends in claim severity, emerging coverage issues, frequency, inflation, legislative and judicial changes and other factors. Because of uncertainties associated with estimating ultimate loss and LAE reserves, we cannot be certain that our reserves are adequate. In the event that our reserves become insufficient to cover our actual losses and LAE, we may need to add to our reserves, which could have a material adverse effect on our results of operations and financial condition. For further discussion of our loss and LAE reserves, see
“CRITICAL ACCOUNTING ESTIMATES - Loss and LAE Reserves”
on page 66.
The segments of the insurance industry in which White Mountains participates are highly competitive and cyclical and we may not be able to compete effectively in the future.
The property and casualty insurance industry is highly competitive and has historically been cyclical, experiencing periods of severe price competition and less selective underwriting standards (“soft markets”) followed by periods of relatively high prices and more selective underwriting standards (“hard markets”). Cyclicality may adversely affect our results of operations and financial condition by reducing the rates we can charge for property and casualty insurance during soft markets. We expect to continue to experience the effects of cyclicality and may not be able to successfully manage the associated risks.
Insurance markets are highly competitive. In general terms, OneBeacon competes in one or more of its businesses with most of the large multi-line insurance companies, most of the specialty insurance companies and various local and regional insurance companies. OneBeacon also competes with new companies formed to enter insurance markets. Recent consolidation in the U.S. property and casualty insurance industry may increase the size and/or financial strength of some of OneBeacon’s competitors. Increased competition could result in fewer submissions, lower premium rates and less favorable policy terms and conditions, which could adversely impact our results of operations and financial condition.
OneBeacon could fail to build and sustain the kind of business relationships, including distribution relationships, that are necessary to compete. OneBeacon offers its products through a select network of independent agents, regional and national brokers, wholesalers and managing general agencies, or “MGA”s.
If OneBeacon’s distribution partners find that its competitor insurers offer better priced coverage, OneBeacon may be unable to maintain a competitive position, which in turn may adversely affect our results of operations and financial condition. Additionally, consolidation among brokers and agents may make it more difficult for OneBeacon to distribute its products.
The municipal bond insurance industry is also highly competitive. BAM’s primary competitors are Assured and National. BAM, Assured and National each seeks to differentiate itself through financial strength ratings, claims paying resources and underwriting strategies. If BAM does not differentiate itself from Assured and National it could result in fewer policies issued, lower premium levels and less favorable policy terms and conditions, which could adversely impact our results of operations and financial condition.
23
Unpredictable catastrophic events could adversely affect our results of operations and financial condition.
We write insurance policies that cover unpredictable catastrophic events. Covered unpredictable catastrophic events include natural disasters, such as hurricanes, windstorms, earthquakes, floods, wildfires and severe winter weather, and other disasters such as terrorist attacks, explosions, infrastructure failures, political instability and wide-impact pandemics.
Our exposure to hurricanes and earthquakes is the largest natural catastrophe risk to our business. Key exposures include:
(1) hurricane or windstorm damage in the U.S. Northeast Atlantic Coast and Gulf Coast regions, (2) a major California earthquake, (3) convective storms, and (4) losses from terrorist attacks in the United States, such as the attacks on September 11, 2001. The extent of catastrophe losses is a function of the number of events, the severity of each event and total amount of insured exposure affected by the event. Increases in the value and concentration of insured property or insured employees, the effects of inflation, changes in weather patterns and increased terrorism could increase the future frequency and/or severity of claims from catastrophic events. Claims from catastrophic events could materially adversely affect our results of operations and financial condition. Our ability to write new insurance policies could also be impacted as a result of corresponding reductions in our capital levels.
Our efforts to mitigate our exposure to catastrophes, which include analyzing possible catastrophe losses through a variety of tools such as catastrophe modeling software and purchasing reinsurance, may be unsuccessful. Loss estimates produced by catastrophe models depend on many variables, including assumptions about demand surge, storm surge, loss adjustment expenses and event intensity. If the assumptions defining our modeling variables are incorrect, or the model itself is incorrect, the losses we might incur from an actual catastrophe could be materially higher than our expectation of losses generated from modeled catastrophe scenarios. To the extent these losses are not covered by reinsurance, our results of operations and financial condition could be materially adversely affected.
Terrorism risk presents unique challenges because of the unpredictability of targets, the frequency and severity of potential terrorist attacks, the limited availability of terrorism reinsurance, and the limited protection provided by government programs. Furthermore, we cannot predict the extent to which our future insurance contracts will be prohibited from excluding terrorism coverage from insurance offered to certain classes of business. Under the Terrorism Act, the U.S. federal government is required to provide assistance to insurers for certain terrorism events. However, the benefits to insurers are limited, the law is untested, and it is possible that Congress will terminate or modify the Terrorism Act, which could adversely affect our business by increasing our exposure to terrorism losses. There is a possibility that losses resulting from future terrorist attacks could prove to be material to our results of operations and financial condition.
Changes in tax laws or tax treaties could adversely affect our results of operations and financial condition.
The taxable income of our U.S. subsidiaries is subject to U.S. federal, state and local income tax and other taxes. Potential changes to these laws, for example, disallowing the deduction for reinsurance purchased from a reinsurer outside the U.S. or disallowing deductions for interest expense, could adversely affect the Company.
The income of the non-U.S. companies in our group is generally subject to a lower tax rate than that imposed by the United States. Certain of our non-U.S. companies are eligible for the benefits of tax treaties between the United States and other countries. We believe our non-U.S. companies will continue to be eligible for treaty benefits. However, it is possible that factual changes or changes to U.S. tax laws or changes to tax treaties that presently apply to our non-U.S. companies could increase income subject to tax, or the tax rate on income, in the United States. Similarly, changes to the applicable tax laws, treaties or regulations of other countries could subject the income of members of our group to higher rates of tax outside the United States. Additionally, the base erosion and profit shifting (“BEPS”) project currently being undertaken by the Organization for Economic Cooperation and Development (“OECD”) and the European Commission’s investigation into illegal state aid may result in changes to long standing tax principles, which could adversely affect our results of operations and financial condition.
The Company and our non-U.S. subsidiaries may become subject to U.S. tax, which may have an adverse effect on our results of operations and financial condition and our shareholders’ investments.
The Company and our non-U.S. subsidiaries operate in a manner such that none of these companies should be subject to U.S. tax (other than U.S. excise tax on insurance and reinsurance premium income attributable to insuring or reinsuring U.S. risks and U.S. withholding tax on some types of U.S. source investment income) because none of these companies should be treated as engaged in a trade or business within the United States. However, because there is considerable uncertainty as to the activities that constitute being engaged in a trade or business within the United States, we cannot be certain that the Internal Revenue Service (“IRS”) will not contend successfully that the Company or its non-U.S. subsidiaries are engaged in a trade or business in the United States. If the Company or any of its non-U.S. subsidiaries were considered to be engaged in a trade or business in the United States, such entity could be subject to U.S. corporate income and branch profits taxes on the portion of its earnings effectively connected to such U.S. business, which could adversely affect our results of operations and financial condition.
24
We have significant deferred tax assets, which we may be unable to utilize if we do not generate sufficient future taxable income.
We have a deferred tax asset of $93 million (net of a valuation allowance of $117 million) related to net operating loss carryforwards, capital loss carryforwards and tax credit carryforwards as of December 31, 2016 that is subject to carryforward limitations in the United States. Utilization of these assets and other assets included in our worldwide net deferred tax asset of $127 million (net of a valuation allowance of $147 million) is dependent on generating sufficient future taxable income of the appropriate character (i.e. ordinary income or capital gains) in the appropriate jurisdiction. If it is determined that it is more likely than not that sufficient future taxable income will not be generated, we would be required to increase the valuation allowance in future periods, which could have a material adverse effect on our results of operations and financial condition. Additionally, future tax law changes that reduce the U.S. corporate tax rate would have an adverse effect on our deferred tax assets. A reduction in the federal income tax rate to between 20% and 15% would reduce the Company’s net deferred tax asset by $54 million to $72 million.
We may not maintain favorable financial strength or creditworthiness ratings, which could adversely affect our ability to conduct business.
Third-party rating agencies assess and rate the financial strength of insurers, including claims-paying ability. These ratings are based upon criteria established by the rating agencies and are subject to revision at any time at the sole discretion of the agencies. Some of the criteria relate to general economic conditions and other circumstances outside the rated company’s control. These financial strength ratings are used by policyholders, agents and brokers to assess the suitability of insurers as business counterparties, and are an important factor in establishing the competitive position of insurance companies.
The maintenance of an “A-” or better financial strength rating from A.M. Best and/or Standard & Poor’s is particularly important to our ability to write new or renewal property and casualty insurance business in most markets, while the maintenance of an “AA” or better financial strength rating from Standard & Poor’s is particularly important to BAM’s ability to write municipal bond insurance or meet its debt service obligations under the BAM Surplus Notes. General creditworthiness ratings are used by existing or potential investors to assess the likelihood of repayment on a particular debt issue. The maintenance of an investment grade creditworthiness rating (e.g., “BBB-” or better from Standard & Poor’s, “Baa3” or better from Moody’s or “BBB-” or better from Fitch) is important to our ability to raise new debt with acceptable terms. We believe that strong creditworthiness ratings are important factors that provide better financial flexibility when issuing new debt or restructuring existing debt.
Rating agencies periodically evaluate us to confirm that we continue to meet the criteria of the ratings previously assigned to us. See
“RATINGS”
on page 21 for a summary of financial strength ratings on our principal insurance subsidiaries. A downgrade, withdrawal or negative watch/outlook of our financial strength ratings could severely limit or prevent our insurance subsidiaries ability to write new policies or renew existing policies, which could have a material adverse effect on our results of operations and financial condition. A downgrade, withdrawal or negative watch/outlook of our creditworthiness ratings could limit our ability to raise new debt or could make new debt more costly and/or have more restrictive conditions.
We may be unable to adequately maintain our systems and safeguard the security of our data, which may adversely impact our ability to operate our business and cause reputational harm and financial loss.
Because our business and operations rely on secure and efficient information technology systems, we depend on our ability, and the ability of certain third parties, including vendors and business partners, to access our computer systems to perform necessary functions such as providing quotes and product pricing, billing and processing premiums, administering claims, and reporting our financial results. The functioning of these systems may be impacted by any number of events, including power outages, natural and manmade catastrophes, and cyber-attacks. In the event we are unable to access any of our systems, or any third party system that we rely upon, our ability to operate our business effectively may be significantly impaired.
Our business also depends upon our ability to securely process, store, transmit and safeguard confidential and proprietary information that is in our possession. This information includes confidential information relating to our business, and personally identifiable information (“PII”) and protected health information (“PHI”) belonging to our employees, customers, claimants and business partners. Because our systems may be vulnerable to a variety of forms of unauthorized access that could result in a data breach, including hackers, computer viruses, and other cyber-attacks, as well as breaches that result from dishonest employees, errors by employees or lost or stolen computer devices, we may not be able to protect the confidentiality of such information.
Third parties present an additional risk of cyber-related events. We outsource certain technological and business process functions to third-party providers. We rely on these third parties to maintain and store PII and PHI and other confidential information on their systems. We also routinely transmit such information by e-mail and other electronic means. Although we attempt to establish sufficient controls and secure capabilities to transmit such information and to prevent unauthorized disclosure, these controls may not be sufficient. Furthermore, third-party providers may not have appropriate controls in place to protect such information.
25
Our computer systems have been and will continue to be the target of cyber-attacks, although we are not aware that we have experienced a material cybersecurity breach. We are also not aware of any third-party vendor having experienced a material cybersecurity breach that impacted our data. The risk of cyber-attack may increase, and we may experience more significant attacks in the future.
The risks identified above could expose us to data breaches, disruptions of service, financial losses and significant increases in compliance costs and reputational harm to us, any of which could adversely affect our business and results of operations and financial condition. In addition, a data breach that involves the compromise of PII or PHI, could subject us to legal liability or regulatory action under data protection and privacy laws and regulations enacted by federal, state and foreign governments, or other regulatory bodies. As a result, our ability to conduct our business and our results of operations and financial condition might be adversely affected.
Our debt and related service obligations could adversely affect our business.
As of December 31, 2016, we had approximately $288 million face value of indebtedness. We also had a total of $490 million of undrawn revolving credit facilities at the Company and OneBeacon. Our ability to meet our debt related service obligations will depend on our future performance, which will be affected by financial, business, economic, regulatory and other factors, many of which are beyond our control.
We are also subject to restrictive financial covenants contained in both White Mountains’s and OneBeacon’s revolving credit facilities. These covenants require us to maintain specified financial ratios and to satisfy certain financial condition tests. These covenants can restrict us in several ways, including our ability to incur additional indebtedness. An uncured breach of these covenants could result in an event of default under our revolving credit facilities which would allow lenders to declare any amounts owed under our revolving credit facilities to be immediately due and payable. In addition, a default under our revolving credit facilities could occur if certain of our subsidiaries fail to pay principal and interest on a credit facility, mortgage or similar debt agreement (collectively, “covered debt”), or fail to otherwise comply with obligations in such covered debt agreements where such a default gives the holder of the covered debt the right to accelerate at least $75 million of principal amount of covered debt.
A failure by OneBeacon Ltd. or its subsidiaries to pay principal and interest on covered debt or to comply with obligations in covered debt agreements that results in the acceleration of at least $75 million of principal amount of covered debt could trigger the acceleration of the OBH Senior Notes.
We could incur additional indebtedness or issue preferred stock or other obligations in the future. To the extent new debt, preferred stock or other obligations are added to our and our subsidiaries’ current debt levels, the risks described in the previous paragraph would increase.
We may not successfully alleviate risk through reinsurance arrangements. Additionally, we may not collect all amounts due from our reinsurers under our existing reinsurance arrangements.
We attempt to limit our risk of loss through reinsurance arrangements. The availability and cost of reinsurance protection is subject to market conditions, which are outside of our control. In addition, the coverage provided by our reinsurance arrangements may be inadequate to cover our future liabilities. As a result, we may not be able to successfully alleviate risk through these arrangements, which could have a material adverse effect on our results of operations and financial condition.
Purchasing reinsurance does not relieve us of our underlying obligations to policyholders or ceding companies, so any inability to collect amounts due from reinsurers could adversely affect our financial condition and results of operations. Inability to collect amounts due from reinsurers can result from a number of scenarios, including: (1) reinsurers choosing to withhold payment due to a dispute or other factors beyond our control; and (2) reinsurers becoming unable to pay amounts owed to us as a result of a deterioration in their financial condition. While we regularly review the financial condition of our reinsurers and currently believe their condition is strong, it is possible that one or more of our reinsurers will be adversely affected by future significant losses or economic events, causing them to be unable or unwilling to pay amounts owed to us.
In addition, due to factors such as the price or availability of reinsurance coverage, we sometimes decide to increase the amount of risk we retain by purchasing less reinsurance. Such determinations have the effect of increasing our financial exposure to losses associated with such risks and, in the event of significant losses associated with a given risk, could have a material adverse effect on our financial condition and results of operations.
26
We are a holding company with no direct operations, and our insurance subsidiaries’ ability to pay dividends and other distributions to us is restricted by law.
As a holding company with no direct operations, we rely in large part on dividends, tax sharing payments and other permitted payments from our insurance subsidiaries to pay our expenses, interest on debt and dividends to shareholders. Our insurance subsidiaries may not be able to generate cash flow sufficient to pay a dividend or distribute funds to us. In addition, under the insurance laws of the jurisdictions in which our insurance subsidiaries are domiciled, an insurer is restricted with respect to the timing or the amount of dividends it may pay without prior approval by regulatory authorities.
As of December 31, 2016, our top tier regulated insurance subsidiaries have the ability to pay
$60 million
of dividends to us without prior approval of regulatory authorities. As of December 31, 2016, the Company and its intermediate holding companies had
$1.7 billion
of net unrestricted cash, short-term investments and fixed maturity investments,
$286 million
of common equity securities and
$67 million
of other long-term investments outside of OneBeacon and $425 million available to be drawn from our revolving credit facility. In addition, as of December 31, 2016, OneBeacon Ltd. and its intermediate holding companies had
$65 million
of net unrestricted cash, short-term investments and fixed maturity investments and
$12 million
of common equity securities outside of its regulated and unregulated insurance subsidiaries and $65 million available to be drawn from OneBeacon’s credit facility. See
“Dividend Capacity”
on page 56. If our insurance subsidiaries cannot pay dividends, tax sharing and other permitted payments in future periods, we may have difficulty servicing our debt, paying dividends to shareholders and paying our holding company expenses. For additional information relating to regulations governing our operations, see
“Regulation”
on page 17.
We may suffer losses from unfavorable outcomes from litigation and other legal proceedings.
In the ordinary course of business, we are subject to litigation and other legal proceedings as part of the claims process, the outcomes of which are uncertain. We maintain reserves for claims-related legal proceedings as part of our loss and LAE reserves. Adverse outcomes are possible and could negatively impact our results of operations and financial condition.
Furthermore, as industry practices and legal, judicial, social and other conditions change, unexpected issues related to claims and coverage may emerge. These issues may adversely affect our results of operations and financial condition by either extending coverage beyond our underwriting intent or by increasing the number and size of claims. In some instances, these changes may not become apparent until sometime after we have issued the affected insurance contracts. Examples of emerging claims and coverage issues include, but are not limited to:
|
•
|
New theories of liability and disputes regarding medical causation with respect to certain diseases;
|
|
•
|
Claims related to data security breaches, information system failures or cyber-attacks; and
|
|
•
|
Claims related to blackouts caused by space weather.
|
In addition, from time to time we are subject to legal proceedings that are not related to the claims process. In the event of an unfavorable outcome in one or more non-claims legal matters, our ultimate liability may be in excess of amounts we have reserved and such additional amounts could adversely affect our results of operations and financial condition. Furthermore, it is possible that these non-claims legal proceedings could result in equitable remedies or other unexpected outcomes that could adversely affect our results on operations and financial condition.
Regulation may restrict our ability to operate.
The insurance industry is subject to extensive regulation under federal, state and Bermuda law. The primary goal of the regulation is the protection of policyholders rather than shareholders. For example, in order to protect insurer solvency, state insurance regulations impose restrictions on the amount and type of investments, establish detail minimum capital standards and require the maintenance of reserves. Our insurance underwriting is heavily dependent on information gathered from third parties such as insurance rating bureaus, highly regulated credit report agencies and other data aggregators. Regulatory changes related to the availability or use of this information could materially affect how we underwrite and price premiums.
Changes in laws and regulations may restrict our ability to operate and/or have an adverse effect upon the profitability of our business within a given jurisdiction. For example, as a result of various state, federal and international regulatory efforts to modernize and harmonize insurer solvency regulations in the wake of the recent financial crisis, the states could further restrict allowable investments or increase our capital requirements, both of which could materially impact our results of operations and financial condition.
27
We have successfully created shareholder value through acquisitions and dispositions. We may not be able to continue to create shareholder value through such transactions in the future.
In past years, we have completed numerous acquisitions and dispositions, many of which have contributed significantly to our growth in adjusted book value. Failure to identify and complete future acquisition and disposition opportunities could limit our ability to achieve our target returns. Even if we were to identify and complete future acquisition or disposition opportunities, there is no assurance that such opportunities will ultimately achieve their anticipated benefits.
We depend on our key personnel to manage our business effectively and they may be difficult to replace.
Our performance substantially depends on the efforts and abilities of our management team and other executive officers and key employees. Furthermore, much of our competitive advantage is based on the expertise, experience and know-how of our key management personnel. We do not have fixed term employment agreements with any of our key employees or key man life insurance and the loss of one or more of these key employees could adversely affect our results of operations and financial condition. Our success also depends on the ability to hire and retain additional personnel. Difficulty in hiring or retaining personnel could adversely affect our results of operations and financial condition.
We are exposed to credit risk in certain of our business operations.
In addition to exposure to credit risk related to our investment portfolio and reinsurance recoverables, we are exposed to credit risk in other areas of our business operations.
When policyholders purchase insurance policies from us through independent agents and brokers, the premiums are often first received by the independent agents and brokers, who then route premiums to us. In most jurisdictions, the premiums are deemed paid to us whether or not we receive them. Consequently, we assume a degree of credit risk associated with amounts due from independent agents and brokers.
Under many of our policies, our customers are responsible to reimburse us for an agreed-upon amount per claim. In these circumstances, we are exposed to credit risk because we are typically required under these policies to pay covered claims first and then seek reimbursement from our customers.
We are exposed to credit risk in OneBeacon’s surety business, where we guarantee to a third party that our customer will satisfy certain performance obligations. We sometimes mitigate the surety customer credit risk by requiring customers to post collateral for some or all of their performance obligations, often in the form of pledged securities such as money market funds or letters of credit provided by banks. However, there is credit risk associated with any collateral - if we are holding collateral other than cash and our customer is unable to honor his or her obligations, we may be exposed to credit risks associated with pledged securities or banks that issued letters of credit. Economic downturns generally increase these credit risks. If credit risks materialize and control mechanisms like underwriting guidelines and collateral requirements are unsuccessful, we could be left with collateral that has little or no value.
As a result, our exposure to the above credit risks could materially adversely affect our results of operations and financial condition.
Bermuda law differs from the laws in effect in the United States and may afford less protection to shareholders.
We are organized under the laws of Bermuda, and a portion of our assets are located outside the United States. As a result, it may not be possible for our shareholders to enforce court judgments obtained in the United States against us based on the civil liability provisions of the federal or state securities laws of the United States, either in Bermuda or in countries other than the United States where we will have assets. In addition, there is some doubt as to whether the courts of Bermuda and other countries would recognize or enforce judgments of U.S. courts obtained against us or our directors or officers based on the civil liabilities provisions of the federal or state securities laws of the United States or would hear actions against us or those persons based on those laws.
Our corporate affairs are governed by the Companies Act. The Companies Act differs in some material respects from laws generally applicable to U.S. corporations and shareholders, including the provisions relating to interested directors, amalgamations, mergers and acquisitions, takeovers, shareholder lawsuits and indemnification of directors. Generally, the duties of directors and officers of a Bermuda company are owed to the company only. Shareholders of Bermuda companies generally do not have rights to take action against directors or officers of the company and may only do so in limited circumstances. Class actions and derivative actions are generally not available to shareholders under Bermuda law. The Bermuda courts, however, would ordinarily be expected to permit a shareholder to commence an action in the name of a company to remedy a wrong to the company where the act complained of is alleged to be beyond the corporate power of the company or illegal, or would result in the violation of the company’s memorandum of association or bye-laws. Furthermore, consideration would be given by a Bermuda court to acts that are alleged to constitute a fraud against non-controlling shareholders or, for instance, where an act requires the approval of a greater percentage of the company’s shareholders than that which actually approved it.
28
When the affairs of a company are being conducted in a manner that is oppressive or prejudicial to the interests of some part of the shareholders, one or more shareholders may apply to the Supreme Court of Bermuda, which may make such order as it sees fit, including an order regulating the conduct of the company’s affairs in the future or ordering the purchase of the shares of any shareholders by other shareholders or by the company. Additionally, under our bye-laws and as permitted by Bermuda law, each shareholder has waived any claim or right of action against our directors or officers for any action taken by directors or officers in the performance of their duties, except for actions involving fraud or dishonesty. In addition, the rights of our shareholders and the fiduciary responsibilities of our directors under Bermuda law are not as clearly established as under statutes or judicial precedent in existence in jurisdictions in the United States, particularly the State of Delaware. Therefore, our shareholders may have more difficulty protecting their interests than would shareholders of a corporation incorporated in a jurisdiction within the United States.
We have foreign operations that expose us to certain additional risks.
Our foreign operations are subject to legal, political and operational risks that may be greater than those present in the United States. As a result, our operations at these foreign locations could be temporarily or permanently disrupted. Additionally, a portion of our assets, liabilities, revenues and expenses are denominated in currencies other than the U.S. dollar and are therefore subject to foreign currency risk. Significant changes in foreign exchange rates may adversely affect our results of operations and financial condition.
We could be adversely affected if our controls designed to ensure compliance with guidelines, policies, and legal and regulatory standards are not effective.
Our business is highly dependent on our ability to successfully execute a large number of transactions, many of which are complex. These processes are often subject to internal guidelines and policies, and government regulation. A control system, no matter how well designed and operated, can provide only reasonable assurance that the control system’s objectives will be met. If controls are not effective, it could lead to financial loss, unanticipated risk exposure, or damage to our reputation.
1B. Unresolved Staff Comments
As of the date of this report, the Company had no unresolved comments from the Commission staff regarding its periodic or current reports under the Exchange Act.
The Company maintains two professional offices in Hamilton, Bermuda, which serve as its headquarters and its registered office. The Company’s principal executive office is in Hanover, New Hampshire. In addition, White Mountains maintains professional offices in Guilford, Connecticut, which house its investment and corporate finance functions, and Boston, Massachusetts, which house its corporate accounting, reporting and internal audit functions.
OneBeacon Ltd.’s headquarters are located in Hamilton, Bermuda and the headquarters of its U.S. operations and principal executive office are located in Plymouth, Minnesota. OneBeacon also maintains branch offices in various cities throughout the United States.
HG Global headquarters are located in Hamilton, Bermuda and BAM’s headquarters are located in New York, New York.
MediaAlpha’s headquarters are located in Los Angeles, California, Wobi’s headquarters are located in Tel Aviv, Israel, Buzzmove’s headquarters are located in London, United Kingdom, Star & Shield Services LLC’s and Star & Shield Claims Services LLC’s headquarters are located in Alpharetta, Georgia and Star & Shield Risk Management LLC’s headquarters are located in Orlando, Florida.
The Company’s headquarters, registered office, principal executive office, and corporate accounting, reporting and internal audit offices are leased. White Mountains owns its investment and corporate finance office in Guilford, Connecticut. OneBeacon’s headquarters, U.S. corporate headquarters and branch offices are leased. HG Global’s and BAM’s offices are leased, as are MediaAlpha’s, Wobi’s, Star & Shield’s and Buzzmove’s offices. Management considers its office facilities suitable and adequate for its current level of operations.
29
White Mountains, and the insurance industry in general, are routinely subject to claims-related litigation and arbitration in the normal course of business, as well as litigation and arbitration that do not arise from, or are directly related to, claims activity. Other than those items listed below, White Mountains was not a party to any material litigation or arbitration other than as routinely encountered in claims activity, none of which is expected by management to have a material adverse effect on its financial condition, results of operations or cash flows.
Tribune Company
In June 2011, Deutsche Bank Trust Company Americas, Law Debenture Company of New York and Wilmington Trust Company (collectively referred to as “Plaintiffs”), in their capacity as trustees for certain senior notes issued by the Tribune Company (“Tribune”), filed lawsuits in various jurisdictions (the “Noteholder Actions”) against numerous defendants including OneBeacon, OneBeacon-sponsored benefit plans and other affiliates of White Mountains in their capacity as former shareholders of Tribune seeking recovery of the proceeds from the sale of common stock of Tribune in connection with Tribune's leveraged buyout in 2007 (the “LBO”). Tribune filed for bankruptcy in 2008 in the Delaware bankruptcy court (the “Bankruptcy Court”). The Bankruptcy Court granted Plaintiffs permission to commence these LBO-related actions, and in 2011, the Judicial Panel on Multidistrict Litigation granted a motion to consolidate the actions for pretrial matters and transferred all such proceedings to the U.S. District Court for the Southern District of New York (the “SDNY”). Plaintiffs seek recovery of the proceeds received by the former Tribune shareholders on a theory of constructive fraudulent transfer asserting that Tribune purchased or repurchased its common shares without receiving fair consideration at a time when it was, or as a result of the purchases of shares, was rendered, insolvent. OneBeacon has entered into a joint defense agreement with other affiliates of White Mountains that are defendants in the action. OneBeacon received approximately $32 million for Tribune common stock tendered in connection with the LBO.
The Court granted an omnibus motion to dismiss the Noteholder Actions in September 2013 and the plaintiffs appealed. On March 29, 2016, a three judge panel of the U.S. Second Circuit Court of Appeals affirmed the dismissal of the Noteholder Actions. On July 22, 2016, the Plaintiff's petition to the Second Circuit for reconsideration or for a rehearing en banc was denied in full. On September 9, 2016, the Plaintiffs filed for a writ of certiorari, seeking review in the U.S. Supreme Court.
In addition, OneBeacon, OneBeacon-sponsored benefit plans and other affiliates of White Mountains in their capacity as former shareholders of Tribune, along with thousands of former Tribune shareholders, have been named as defendants in an adversary proceeding brought by the Official Committee of Unsecured Creditors of the Tribune Company (the “Committee”), on behalf of the Tribune Company, which seeks to avoid the repurchase of shares by Tribune in the LBO on a theory of intentional fraudulent transfer (the “Committee Action”). Tribune emerged from bankruptcy in 2012, and a litigation trustee replaced the Committee as plaintiff in the Committee Action. This matter was consolidated for pretrial matters with the Noteholder Actions in the SDNY and was stayed pending the motion to dismiss in the Noteholder Actions. An omnibus motion to dismiss the shareholder defendants in the Committee Action was filed in May 2014 and the motion was granted on January 6, 2017. The plaintiff has requested permission to move the SDNY to certify the decision as a final judgment capable of immediate appeal. No amount has been accrued in connection with this matter as of December 31, 2016, as the amount of loss, if any, cannot be reasonably estimated.
None.
30
Executive Officers of the Registrant and its Subsidiaries (As of February 27, 2017)
|
Name
|
Position
|
Age
|
Executive
Officer since
|
|||
|
Raymond Barrette
|
Chairman and CEO
|
66
|
2007
|
|||
|
Reid T. Campbell
|
Managing Director of WM Capital
and President of WM Advisors
|
49
|
2007
|
|||
|
David T. Foy
|
Executive Vice President and Chief Financial Officer
|
50
|
2003
|
|||
|
David B. Linker
|
Chief Investment Officer of WM Advisors
|
54
|
2016
|
|||
|
T. Michael Miller
|
President and CEO of OneBeacon Ltd.
|
58
|
2005
|
|||
|
J. Brian Palmer
|
Managing Director and Chief Accounting Officer
|
44
|
2001
|
|||
|
G. Manning Rountree
|
Executive Vice President of the Company and President of
WM Capital
|
44
|
2009
|
|||
|
Robert L. Seelig
|
Managing Director and General Counsel
|
48
|
2002
|
|||
All executive officers of the Company and its subsidiaries are elected by the Board for a term of one year or until their successors have been elected and have duly qualified. Information with respect to the principal occupation and relevant business experience of the Executive Officers follows:
Mr. Barrette
has served as Chairman and CEO of the Company since January 2007. He served as a director of the Company from 2000 to 2005 and was re-appointed as a director in August 2006. He previously served as President and CEO of the Company from 2003 to 2005, as CEO of OneBeacon from 2001 to 2002, as President of the Company from 2000 to 2001 and as Executive Vice President and Chief Financial Officer of the Company from 1997 to 2000. Mr. Barrette also serves as a director of OneBeacon Ltd and BAM.
Mr. Campbell
has served as a Managing Director of WM Capital since January 2004 and as the President of WM Advisors since January 2015. He joined White Mountains in 1994 and has served in a variety of financial management positions with the Company and its subsidiaries. Prior to joining White Mountains, Mr. Campbell spent three years with KPMG LLP. Mr. Campbell also serves as a director of OneBeacon Ltd.
Mr. Foy
was appointed Executive Vice President and Chief Financial Officer of the Company in April 2003. Prior to joining White Mountains in 2003, Mr. Foy served as Senior Vice President and Chief Financial Officer of Hartford Life Inc. and joined that company in 1993. Prior to joining Hartford Life, Mr. Foy was with Milliman and Robertson, an actuarial consulting firm. Mr. Foy also serves as a director of OneBeacon Ltd.
Mr. Linker
was appointed Chief Investment Officer of WM Advisors in May 2015. Prior to this, he served as Managing Director and Head of Fixed Income of WM Advisors. Mr. Linker joined WM Advisors in 2001. Prior to joining WM Advisors, Mr. Linker held positions with Imperial Credit Industries, Inc., Koch Investments, Inc. and Merrill Lynch, having begun his career with L.F. Rothschild & Co, Inc. in 1987.
Mr. Miller
was appointed President and CEO of OneBeacon in July 2005 and joined OneBeacon as its Chief Operating Officer in April 2005. Prior to joining OneBeacon, Mr. Miller spent 10 years at St. Paul Travelers, most recently as Co-Chief Operating Officer. Prior to joining St. Paul Travelers, Mr. Miller spent 14 years with The Chubb Corporation. Mr. Miller also serves as a director of OneBeacon Ltd.
Mr. Palmer
is Managing Director and Chief Accounting Officer of the Company. Prior to joining White Mountains in 1999, Mr. Palmer spent four years with PricewaterhouseCoopers LLP.
Mr. Rountree
is an Executive Vice President of the Company and President of WM Capital. He joined White Mountains in 2004 and served as the President of White Mountains Advisors from February 2009 until December 2014. Prior to joining White Mountains, Mr. Rountree was a Senior Vice President at Putnam Investments for two years. Prior to joining Putnam Investments, Mr. Rountree spent 3 years with McKinsey & Company. Mr. Rountree also serves as a director of BAM.
Mr. Seelig
is Managing Director and General Counsel of the Company. Prior to joining White Mountains in September 2002, Mr. Seelig was with the law firm of Cravath, Swaine & Moore.
31
White Mountains’s common shares are listed on the New York Stock Exchange (symbol “WTM”) and the Bermuda Stock Exchange (symbol “WTM-BH”). As of February 24, 2017, there were 274 registered holders of White Mountains common shares, par value $1.00 per share. The quarterly range of the high and low sales price for common shares during
2016 and 2015
is presented below:
|
2016
|
2015
|
|||||||||||||||
|
Quarter ended:
|
High
|
Low
|
High
|
Low
|
||||||||||||
|
December 31
|
$
|
874.69
|
|
$
|
815.04
|
|
$
|
808.00
|
|
$
|
721.00
|
|
||||
|
September 30
|
852.58
|
|
804.44
|
|
778.19
|
|
645.00
|
|
||||||||
|
June 30
|
845.37
|
|
786.33
|
|
704.50
|
|
635.00
|
|
||||||||
|
March 31
|
809.99
|
|
689.31
|
|
696.48
|
|
618.00
|
|
||||||||
For information on securities authorized for issuance under the Company’s equity compensation plans, see “
Security Ownership of Certain Beneficial Owners and Management and Related Stockholder Matters
” on page 78.
The following graph shows the five-year cumulative total return for a shareholder who invested $100 in common shares as of December 31, 2011, assuming re-investment of dividends. Cumulative returns for the five-year period ended
December 31, 2016
are also shown for the Standard & Poor’s 500 Stocks (Property & Casualty) Capitalization Weighted Index (“S&P P&C”) and the Standard & Poor’s 500 Stocks Capitalization Weighted Index (“S&P 500”) for comparison.
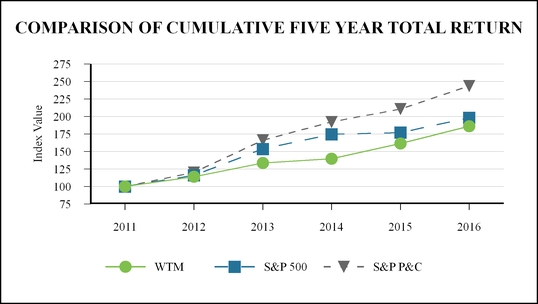
Purchases of Equity Securities by the Company
The following table provides information regarding common shares repurchased by the Company during the fourth quarter of 2016:
|
Months
|
Total Number of
Shares
Purchased
|
Average Price
Paid per
Share
|
Total Number of Shares
Purchased as Part of Publicly Announced Plan
(1)
|
Maximum Number of Shares that
May Yet Be Purchased
Under the Plan
(1)
|
|||||||||
|
October 1 - 31, 2016
|
13,458
|
|
$
|
824.48
|
|
13,458
|
|
389,480
|
|
||||
|
November 1 - 30, 2016
|
11,350
|
|
$
|
823.90
|
|
11,350
|
|
878,130
|
|
||||
|
December 1 - 31, 2016
|
—
|
|
$
|
—
|
|
—
|
|
878,130
|
|
||||
|
Total
|
24,808
|
|
$
|
824.22
|
|
24,808
|
|
878,130
|
|
||||
|
(1)
|
During the past several years, White Mountains’s board of directors has authorized the Company to repurchase its common shares, from time to time, subject to market conditions. Most recently, in November 2016, White Mountains’s Board of Directors authorized the Company to repurchase up to an additional 500,000 common shares. The repurchase authorization does not have a stated expiration.
|
32
Selected consolidated income statement data and ending balance sheet data for each of the five years ended through
December 31, 2016
, follows:
|
Year Ended December 31,
|
||||||||||||||||||||
|
$ in millions, except share and per share amounts
|
2016
|
2015
|
2014
|
2013
|
2012
|
|||||||||||||||
|
Income Statement Data:
|
||||||||||||||||||||
|
Revenues
(a)
|
$
|
1,361
|
|
$
|
1,622
|
|
$
|
1,411
|
|
$
|
1,362
|
|
$
|
1,358
|
|
|||||
|
Expenses
|
1,401
|
|
1,464
|
|
1,440
|
|
1,204
|
|
1,260
|
|
||||||||||
|
Pre-tax (loss) income
|
(40
|
)
|
158
|
|
(29
|
)
|
158
|
|
98
|
|
||||||||||
|
Income tax benefit (expense)
|
45
|
|
—
|
|
15
|
|
(33
|
)
|
(121
|
)
|
||||||||||
|
Non-controlling interest
|
(7
|
)
|
18
|
|
22
|
|
13
|
|
14
|
|
||||||||||
|
Equity in earnings of unconsolidated affiliates
|
—
|
|
25
|
|
45
|
|
37
|
|
29
|
|
||||||||||
|
Discontinued operations, net of tax
(b)
|
415
|
|
97
|
|
259
|
|
147
|
|
187
|
|
||||||||||
|
Net income attributable to White Mountains’s common shareholders
|
$
|
413
|
|
$
|
298
|
|
$
|
312
|
|
$
|
322
|
|
$
|
207
|
|
|||||
|
Income attributable to White Mountains’s common
shareholders per share:
|
||||||||||||||||||||
|
Basic — continuing operations
|
$
|
(0.47
|
)
|
$
|
34.12
|
|
$
|
8.70
|
|
$
|
28.22
|
|
$
|
3.03
|
|
|||||
|
Basic — discontinued operations
|
82.71
|
|
16.48
|
|
42.43
|
|
23.63
|
|
27.47
|
|
||||||||||
|
Total basic income per share
|
$
|
82.24
|
|
$
|
50.60
|
|
$
|
51.13
|
|
$
|
51.85
|
|
$
|
30.50
|
|
|||||
|
Diluted — continuing operations
|
$
|
(0.47
|
)
|
$
|
34.12
|
|
$
|
8.70
|
|
$
|
28.22
|
|
$
|
3.03
|
|
|||||
|
Diluted — discontinued operations
|
82.66
|
|
16.48
|
|
42.43
|
|
23.63
|
|
27.47
|
|
||||||||||
|
Total diluted income per share
|
$
|
82.19
|
|
$
|
50.60
|
|
$
|
51.13
|
|
$
|
51.85
|
|
$
|
30.50
|
|
|||||
|
Balance Sheet Data:
|
||||||||||||||||||||
|
Total assets
|
$
|
6,545
|
|
$
|
10,283
|
|
$
|
10,456
|
|
$
|
12,144
|
|
$
|
12,895
|
|
|||||
|
Debt
(c)
|
286
|
|
338
|
|
276
|
|
275
|
|
350
|
|
||||||||||
|
Non-controlling interests
(d)
|
134
|
|
455
|
|
543
|
|
492
|
|
526
|
|
||||||||||
|
White Mountains’s common shareholders’ equity
|
3,603
|
|
3,913
|
|
3,996
|
|
3,905
|
|
3,732
|
|
||||||||||
|
Book value per share
|
$
|
789.53
|
|
$
|
695.84
|
|
$
|
667.48
|
|
$
|
632.22
|
|
$
|
593.16
|
|
|||||
|
Adjusted book value per share
(e)(f)
|
$
|
793.58
|
|
$
|
698.95
|
|
$
|
664.50
|
|
$
|
642.20
|
|
$
|
587.60
|
|
|||||
|
Share Data:
|
||||||||||||||||||||
|
Cash dividends paid per common share
|
$
|
1.00
|
|
$
|
1.00
|
|
$
|
1.00
|
|
$
|
1.00
|
|
$
|
1.00
|
|
|||||
|
Ending common shares (000’s)
(g)
|
4,564
|
|
5,624
|
|
5,986
|
|
6,177
|
|
6,291
|
|
||||||||||
|
(a)
|
In 2015, White Mountains changed the accounting for its investment in Symetra from the equity method to fair value and recognized $259 of unrealized investment gains through net income. See
Note 17 — “Investments in Unconsolidated Affiliates”
on page F-81.
|
|
(b)
|
As a result of the Sirius Group Sale, the Tranzact sale, Esurance and the Runoff Transaction, White Mountains has reclassified the results from these businesses for the past five years in the table above to discontinued operations, net of tax. In 2016, discontinued operations, net of tax, includes a gain from sale of Sirius and Tranzact of $363 and $52. In 2015, discontinued operations, net of tax, includes a gain from sale of Esurance of $18 and net income of $79. In 2014, discontinued operations, net of tax, includes a loss on sale of other discontinued operations of $19, mostly offset by a gain from sale of Fireman’s Fund Insurance Company (“FFIC”) of $14, and net income of $261, primarily related to the operations of Sirius Group. See
Note 22 — “Held for Sale and Discontinued Operations”
on page F-87. In 2013, discontinued operations, net of tax, includes a gain from sale of the Runoff Business of $47 and a net loss of $42 related to the operations of the Runoff Business. In 2012, discontinued operations, net of tax, includes a gain from sale of the Runoff Business $91 and a net loss of $24 related to the operations of the Runoff Business.
|
|
(c)
|
As of December 31, 2015, White Mountains had $50 outstanding under its credit facility, which was repaid in April 2016. As of December 31, 2012, White Mountains had $75 outstanding under its credit facility, which was repaid in January 2013.
|
|
(d)
|
See
Note 14 — “Common Shareholders’ Equity and Non-controlling Interests”
on page F-74 for a detailed breakdown of non-controlling interests by consolidated entity.
|
|
(e)
|
Adjusted book value per share as of December 31, 2016 includes the impact of 40,000 non-qualified options exercisable for $742 per common share. Prior periods exclude the non-qualified stock options, which were anti-dilutive to adjusted book value.
|
|
(f)
|
Adjusted book value per share is a non-GAAP measure which is derived by expanding the GAAP book value per share calculation to include the effects of assumed conversion of all in-the-money convertible securities and to exclude the net unrealized investment gains (losses) from Symetra’s fixed maturity portfolio and unearned restricted common shares. See the reconciliation of book value per share to adjusted book value per share on page 36.
|
|
(g)
|
During 2016, 2015, 2014, 2013 and 2012, White Mountains repurchased
1,106,145
, 387,495, 217,879, 141,535 and 1,329,640, respectively, of its common shares through a combination of tender offers, open market transactions and other transactions.
|
33
The following discussion contains “forward-looking statements”. White Mountains intends statements that are not historical in nature, which are hereby identified as forward-looking statements, to be covered by the safe harbor provisions of the Private Securities Litigation Reform Act of 1995. White Mountains cannot promise that its expectations in such forward-looking statements will turn out to be correct. White Mountains’s actual results could be materially different from and worse than its expectations. See “
FORWARD-LOOKING STATEMENTS
” on page 75 for specific important factors that could cause actual results to differ materially from those contained in forward-looking statements.
The following discussion also includes four non-GAAP financial measures, adjusted comprehensive income, adjusted book value per share, consolidated portfolio returns excluding Symetra and common equity securities and other long-term investment returns excluding Symetra, and the return on common equity and other long-term investments including high-yield fixed maturity investments that have been reconciled to their most comparable GAAP financial measures on page 64. White Mountains believes these measures to be useful in evaluating White Mountains’s financial performance and condition.
RESULTS OF OPERATIONS FOR THE YEARS ENDED
December 31, 2016, 2015 and 2014
Overview—Year Ended
December 31, 2016
versus Year Ended December 31, 2015
White Mountains ended 2016 with book value per share of $790 and adjusted book value per share of $794, an increase of 13.6% and 13.7% for the year, including dividends. Comprehensive income attributable to common shareholders increased to
$558 million
in 2016 compared to
$197 million
in 2015. The increases in 2016 are driven by larger transaction related gains. In 2016, a gain of $477 million from the sale of Sirius Group increased book value per share and adjusted book value per share by $90, while $82 million of comprehensive income generated from the sale of Tranzact increased book value per share and adjusted book value per share by $16. In 2015, White Mountains recognized $241 million of comprehensive income that increased book value per share and adjusted book value per share by $43, which was the result of a change in accounting for the investment in Symetra from the equity method to fair value, caused by White Mountains’s relinquishment of its representation on Symetra’s board of directors subsequent to Symetra entering into a merger agreement with Sumitomo Life. See
Note 2 - “Significant Transactions”
on page F-14 for a description of each transaction.
For the year ended December 31, 2016, White Mountains repurchased and retired 1,106,145 of its common shares for $887 million at an average share price of $802.08, approximately 101% of White Mountains’s December 31, 2016 adjusted book value per share.
OneBeacon’s book value per share increased 11.1% during 2016, including dividends, compared to an increase of 3.8% during 2015, including dividends. OneBeacon’s GAAP combined ratio was
97%
for 2016 compared to
96%
for 2015. OneBeacon’s current accident year loss ratio was 58% for the year ended December 31, 2016, compared to 60% for year ended December 31, 2015. OneBeacon had one point of net unfavorable loss reserve development in the year ended December 31, 2016 compared to insignificant loss reserve development in the year ended December 31, 2015. The decrease in the current accident year loss ratio reflects improved relative performance across most business units. The expense ratio was 38% for the year ended December 31, 2016, compared to 36% for the year ended December 31, 2015. The increase in the expense ratio was primarily due to lower earned premium volume and changing business mix. The increase in book value per share for the year ended December 31, 2016 included a $16 million tax benefit related to the settlement of IRS examinations for tax years 2007-2012. OneBeacon’s net written premiums were $1.1 billion for both the year ended December 31, 2016 and the year ended December 31, 2015.
BAM insured municipal bonds with par value of $11.3 billion in 2016, compared to $10.6 billion in 2015. The average total premium (including both risk premiums and Member Surplus Contributions), weighted by insured par, of insurance provided by BAM in the primary and secondary markets in 2016 was 68 basis points, up from 52 basis points in 2015. As of December 31, 2016, BAM’s total claims paying resources were $644 million on total par insured of $33 billion. Total claims paying resources increased $43 million from December 31, 2015, reflecting positive cashflow building in the BAM system. The GAAP pre-tax total return on invested assets was 2.7% for 2016, compared to 3.6% for 2015. In local currencies, the fixed income portfolio, excluding high yield investments, returned 2.1% for 2016, essentially in-line with the longer duration Bloomberg Barclays U.S. Intermediate Aggregate Index. The portfolio of common equity securities, other long-term investments and high-yield fixed maturity investments returned 4.0% for 2016, underperforming the S&P 500 Index return of 12.0%. The underperformance versus the S&P 500 Index return was primarily attributable to the overall conservative positioning of the risk asset portfolio, including the new high-yield mandate, which we do not expect to keep pace with strong up markets. The underperformance was also due to unfavorable results from publicly-traded common equity securities managed by third party investment advisers and pockets of poor performance in other long-term investments, including unfavorable results from private equity funds and non-controlling interests in private capital investments.
34
Sirius Group’s results inured to White Mountains until April 18, 2016, the closing date of the sale to CMI. For the 2016 period, White Mountains reported Sirius Group’s comprehensive income of $27 million and a combined ratio of 102%, which was driven by $17 million of recorded losses from the Ecuador earthquake that occurred on April 16, 2016.
In 2016, White Mountains returned approximately $900 million of capital to shareholders, primarily through share repurchases.
Overview—Year Ended December 31, 2015 versus Year Ended December 31, 2014
White Mountains ended 2015 with book value per share of $696 and adjusted book value per share of $699, an increase of 4.4% and 5.3% for the year, including dividends. During 2015, White Mountains signed an agreement to sell Sirius Group to CMI, and Symetra announced that it entered into a merger agreement with Sumitomo Life pursuant to which Sumitomo Life will acquire all of the outstanding shares of Symetra. Substantially all of the benefit from the Symetra transaction was recorded in 2015, while the benefit from the Sirius Group transaction was recorded at closing in the second quarter of 2016. Including dividends, Symetra produced $264 million of adjusted comprehensive income for White Mountains in 2015, of which $241 million was recognized as an after-tax unrealized investment gain in the fourth quarter.
White Mountains reported comprehensive income attributable to common shareholders of $197 million and adjusted comprehensive income of
$232 million
in 2015 compared to comprehensive income attributable to common shareholders of $211 million and adjusted comprehensive income of
$135 million
in 2014. The increase in adjusted comprehensive income was driven by $264 million from Symetra and lower foreign currency losses, partially offset by lower investment returns excluding Symetra and increased incentive compensation expense recorded in connection with the agreements to sell Sirius Group and Symetra. Comprehensive income attributable to common shareholders was also affected by the change in net unrealized investment gains (losses) from White Mountains’s share of Symetra’s fixed maturity portfolio prior to the accounting change. Net unrealized investment losses from Symetra’s fixed maturity portfolio were $35 million in 2015 compared to net unrealized gains of $75 million in 2014.
For the year ended December 31, 2015, White Mountains repurchased and retired 387,495 of its common shares for $284 million at an average share price of $733, approximately 105% of White Mountains’s December 31, 2015 adjusted book value per share. The average share price paid was approximately 94% of White Mountains’s December 31, 2015 adjusted book value per share including the estimated gain on the Sirius Group transaction, which was announced previous to when the vast majority of the 2015 share repurchases were completed but prior to the recording of the gain in adjusted book value per share, which occurred at closing on April 18, 2016.
OneBeacon’s book value per share increased 3.8% during 2015, including dividends, compared to an increase of 2.1% during 2014, including dividends. OneBeacon’s GAAP combined ratio was 96% for 2015 compared to 102% for 2014. The lower combined ratio was primarily the result of the $109 million loss reserve charge in the fourth quarter of 2014, partially offset by higher expense ratios driven by higher incentive compensation expense, changes in business mix and the impact of exiting the Crop Business. OneBeacon’s net written premiums decreased 7% to $1.1 billion in 2015, primarily due to the exit from the Crop Business and lawyers liability business, a decrease in the Healthcare business and the termination of an affiliated reinsurance treaty, partially offset by increases in OneBeacon’s newer Programs and Surety businesses.
Sirius Group’s GAAP combined ratio was 85% for 2015 compared to 76% for 2014. The increase was primarily due to lower favorable net loss reserve development and a significantly higher frequency of non-catastrophe per risk and pro rata loss events, including $18 million in losses from the Tianjin port explosions, partially offset by lower catastrophe losses. Additionally, the combined ratio for the year ended December 31, 2015 included 1 point from the cost of ILW covers purchased to mitigate the potential impact of major events on Sirius Group’s balance sheet pending the close of the sale to CMI.
BAM insured municipal bonds with par value of $10.6 billion in 2015, compared to $7.8 billion in 2014. The average total premium (including both risk premiums and Member Surplus Contributions), weighted by insured par, of insurance provided by BAM in the primary and secondary markets in 2015 was 52 basis points, up from 43 basis points in 2014. As of December 31, 2015, BAM’s total claims paying resources were $601 million on total par insured of $22.6 billion. Total claims paying resources increased $20 million from December 31, 2014.
The GAAP pre-tax total return on invested assets was 3.6% for 2015. Excluding the results from Symetra, the GAAP pre-tax total return on invested assets was -0.2% for 2015, which included 0.9% of currency losses, compared to a return of 1.9% for 2014, which included 1.9% of currency losses. In local currencies, the fixed income portfolio returned 1.1% for 2015, essentially in-line with the longer duration Bloomberg Barclays U.S. Intermediate Aggregate Index. The portfolio of common equity securities and other long-term investments returned 19.3% for 2015. Excluding the results from Symetra, the portfolio of common equity securities and other long-term investments returned -1.8% for 2015, underperforming the S&P 500 Index return of 1.4%. The underperformance versus the S&P 500 Index return was primarily due to unfavorable mark-to-market adjustments to the OneBeacon Surplus Notes and losses in energy exposed private equity funds and a distressed hedge fund.
In 2015, White Mountains deployed approximately $400 million of capital, primarily through $284 million of share repurchases and approximately $120 million through the purchase of various private capital investments, both in new investments and additional financings in existing investments to support growth and acquisitions.
35
Adjusted Book Value Per Share
The following table presents White Mountains’s adjusted book value per share, a non-GAAP financial measure, for the years ended
December 31, 2016, 2015 and 2014
and reconciles this non-GAAP measure to the most comparable GAAP measure. See
“NON-GAAP FINANCIAL MEASURES”
on page 64.
|
December 31,
|
||||||||||||
|
2016
|
2015
|
2014
|
||||||||||
|
Book value per share numerators (in millions):
|
||||||||||||
|
White Mountains’s common shareholders’ equity
|
$
|
3,603.3
|
|
$
|
3,913.2
|
|
$
|
3,995.7
|
|
|||
|
Equity in net unrealized investment losses from Symetra’s fixed maturity portfolio
(2)
|
—
|
|
—
|
|
(34.9
|
)
|
||||||
|
Future proceeds from options
(1)
|
$
|
29.7
|
|
—
|
|
—
|
|
|||||
|
Adjusted book value per share numerator
|
$
|
3,633.0
|
|
$
|
3,913.2
|
|
$
|
3,960.8
|
|
|||
|
Book value per share denominators (in thousands of shares):
|
||||||||||||
|
Common shares outstanding
|
4,563.8
|
|
5,623.7
|
|
5,986.2
|
|
||||||
|
Unearned restricted shares
|
(25.9
|
)
|
(25.0
|
)
|
(25.7
|
)
|
||||||
|
Options assumed issued
(1)
|
40.0
|
|
—
|
|
—
|
|
||||||
|
Adjusted book value per share denominator
|
4,577.9
|
|
5,598.7
|
|
5,960.5
|
|
||||||
|
Book value per share
|
$
|
789.53
|
|
$
|
695.84
|
|
$
|
667.48
|
|
|||
|
Adjusted book value per share
|
$
|
793.58
|
|
$
|
698.95
|
|
$
|
664.50
|
|
|||
|
Dividends paid per share
|
$
|
1.00
|
|
$
|
1.00
|
|
$
|
1.00
|
|
|||
|
(1)
|
Adjusted book value per share at December 31, 2016 includes the impact of 40,000 non-qualified stock options exercisable for $742 per common share. Prior periods exclude the non-qualified stock options, which were anti-dilutive to book value.
|
|
(2)
|
For the year ended December 31, 2014, equity in net unrealized investment losses from Symetra’s fixed maturity portfolio includes tax expense of $2.6.
|
The following table is a summary of goodwill and intangible assets that are included in White Mountains’s adjusted book value as of December 31, 2016, 2015 and 2014:
|
December 31,
|
||||||||||||
|
Millions
|
2016
|
2015
|
2014
|
|||||||||
|
Goodwill
|
||||||||||||
|
MediaAlpha
|
18.3
|
|
18.3
|
|
18.3
|
|
||||||
|
Wobi
|
5.8
|
|
5.8
|
|
5.5
|
|
||||||
|
Buzzmove
|
7.6
|
|
—
|
|
—
|
|
||||||
|
Total goodwill
|
31.7
|
|
24.1
|
|
23.8
|
|
||||||
|
.
|
|
|||||||||||
|
Intangible assets
|
||||||||||||
|
MediaAlpha
|
18.3
|
|
24.4
|
|
32.5
|
|
||||||
|
Wobi and Other
|
5.9
|
|
6.9
|
|
6.2
|
|
||||||
|
Total intangible assets
|
24.2
|
|
31.3
|
|
38.7
|
|
||||||
|
Total goodwill and intangible assets
(1)
|
55.9
|
|
55.4
|
|
62.5
|
|
||||||
|
Goodwill and other intangible assets held for sale
|
—
|
|
331.9
|
|
303.9
|
|
||||||
|
Goodwill and intangible assets attributed to non-controlling interests
|
(17.6
|
)
|
(136.4
|
)
|
(141.8
|
)
|
||||||
|
Goodwill and intangible assets included in adjusted book value
|
$
|
38.3
|
|
$
|
250.9
|
|
$
|
224.6
|
|
|||
(1)
See
Note 6 - “Goodwill and Other Intangible Assets”
on page F-52 for details of other intangible assets.
36
Review of Consolidated Results
A summary of White Mountains’s consolidated financial results for the years ended
December 31, 2016, 2015 and 2014
follows:
|
Year Ended December 31,
|
||||||||||||
|
Millions
|
2016
|
2015
|
2014
|
|||||||||
|
Gross written premiums
|
$
|
1,273.2
|
|
$
|
1,361.7
|
|
$
|
1,362.2
|
|
|||
|
Net written premiums
|
$
|
1,145.8
|
|
$
|
1,172.6
|
|
$
|
1,239.0
|
|
|||
|
Revenues
|
||||||||||||
|
Earned insurance premiums
|
$
|
1,114.0
|
|
$
|
1,188.2
|
|
$
|
1,185.0
|
|
|||
|
Net investment income
|
86.8
|
|
60.8
|
|
59.5
|
|
||||||
|
Net realized and unrealized investment gains
|
10.3
|
|
225.4
|
|
78.5
|
|
||||||
|
Other revenue
|
149.6
|
|
147.3
|
|
88.1
|
|
||||||
|
Total revenues
|
1,360.7
|
|
1,621.7
|
|
1,411.1
|
|
||||||
|
Expenses
|
||||||||||||
|
Losses and LAE
|
664.0
|
|
708.9
|
|
824.0
|
|
||||||
|
Insurance acquisition expenses
|
211.6
|
|
220.1
|
|
206.2
|
|
||||||
|
Other underwriting expenses
|
209.5
|
|
218.6
|
|
179.6
|
|
||||||
|
General and administrative expenses
|
287.4
|
|
291.6
|
|
208.2
|
|
||||||
|
General and administrative expenses — amortization of intangible assets
|
12.5
|
|
10.6
|
|
8.3
|
|
||||||
|
Interest expense
|
16.1
|
|
14.6
|
|
14.2
|
|
||||||
|
Total expenses
|
1,401.1
|
|
1,464.4
|
|
1,440.5
|
|
||||||
|
Pre-tax (loss) income
|
(40.4
|
)
|
157.3
|
|
(29.4
|
)
|
||||||
|
Income tax benefit
|
45.4
|
|
.2
|
|
14.8
|
|
||||||
|
Net income (loss) from continuing operations
|
5.0
|
|
157.5
|
|
(14.6
|
)
|
||||||
|
Net gain from sale of Sirius Group, net of tax
|
363.2
|
|
—
|
|
—
|
|
||||||
|
Net gain from sale of Tranzact, net of tax
|
51.9
|
|
—
|
|
—
|
|
||||||
|
Net gain (loss) from sale of discontinued operations, net of tax
|
—
|
|
18.2
|
|
(1.6
|
)
|
||||||
|
Net (loss) gain from discontinued operations, net of tax
|
(.3
|
)
|
78.7
|
|
260.6
|
|
||||||
|
Equity in earnings of unconsolidated affiliates, net of tax
|
—
|
|
25.1
|
|
45.6
|
|
||||||
|
Net income
|
419.8
|
|
279.5
|
|
290.0
|
|
||||||
|
Net (loss) gain attributable to non-controlling interests
|
(7.3
|
)
|
18.1
|
|
22.2
|
|
||||||
|
Net income attributable to White Mountains’s common shareholders
|
412.5
|
|
297.6
|
|
312.2
|
|
||||||
|
Change in equity in net unrealized investment (losses) gains from investments in Symetra common shares
|
—
|
|
(34.9
|
)
|
75.3
|
|
||||||
|
Change in foreign currency translation and pension liability
|
.3
|
|
(.5
|
)
|
(10.7
|
)
|
||||||
|
Change in foreign currency translation and other items from discontinued operations
|
32.0
|
|
(65.0
|
)
|
(169.5
|
)
|
||||||
|
Change in foreign currency translation and other items from sale of Sirius Group
|
113.3
|
|
—
|
|
—
|
|
||||||
|
Comprehensive income
|
558.1
|
|
197.2
|
|
207.3
|
|
||||||
|
Comprehensive (income) loss attributable to non-controlling interests
|
(.3
|
)
|
—
|
|
3.3
|
|
||||||
|
Comprehensive income attributable to White Mountains’s common shareholders
|
557.8
|
|
197.2
|
|
210.6
|
|
||||||
|
Change in net unrealized investment gains (losses) from Symetra’s fixed
maturity portfolio
(2)
|
—
|
|
34.9
|
|
(75.3
|
)
|
||||||
|
Adjusted comprehensive income
(1)
|
$
|
557.8
|
|
$
|
232.1
|
|
$
|
135.3
|
|
|||
|
(1)
|
Adjusted comprehensive income is a non-GAAP measure. For a description of the most comparable GAAP measure. See
NON-GAAP FINANCIAL MEASURES
on page 64.
|
|
(2)
|
Change in equity in net unrealized investment losses from investments in Symetra common shares includes tax benefit of $2.6 and tax expense of $5.8 for the years ended December 31, 2015 and 2014.
|
37
Consolidated Results—Year Ended
December 31, 2016
versus Year Ended
December 31, 2015
White Mountains’s total revenues decreased 16% to
$1.4 billion
in 2016, which was driven by lower net realized and unrealized investment gains, primarily from $259 million of net unrealized investment gains recognized in 2015 related to Symetra that did not recur in 2016. Earned insurance premiums decreased by 6% in 2016, primarily due to OneBeacon writing less premiums in several lines of business. Net investment income increased 43% to
$87 million
, driven by a higher invested asset base resulting primarily from the sale of Sirius Group. White Mountains reported net realized and unrealized investment gains of
$10 million
in 2016, compared to gains of $225 million in 2015, which included the gain from Symetra. See “
Summary of Investment Results
” on page 50 for a discussion and analysis of White Mountains’s investment returns. Other revenue increased to $150 million in 2016 from $147 million in 2015. Other revenue in 2016 included $117 million from MediaAlpha compared to $106 million in 2015. Other revenue also included a $20 million pre-tax gain in 2015 from the sale of Hamer LLC, a small manufacturing company that White Mountains received in 2012 in connection with the liquidation of a limited partnership fund.
White Mountains’s total expenses decreased 4% to
$1.4 billion
in 2016, which was driven by lower expenses in OneBeacon’s insurance business. Losses and LAE decreased 6% in 2016, which is in line with the decrease in earned premiums, while insurance acquisition expenses and other underwriting expenses both decreased 4% in 2016 reflecting decreased earned premiums and changes in business mix. See
“Summary of Operations by Segment”
on page 39. General and administrative expenses decreased 1% in 2016 to $287 million, which was primarily due to lower incentive compensation costs in 2016, partially offset by higher expenses from consolidated WM Capital Investments, driven by MediaAlpha with expenses of
$110 million
in 2016 compared to $99 million in 2015.
Consolidated Results—Year Ended December 31, 2015 versus Year Ended December 31, 2014
White Mountains’s total revenues increased 15% to $1.6 billion in 2015, which was driven by other revenues associated with consolidated WM Capital Investments. Earned insurance premiums in 2015 were in line with 2014. Net investment income increased 2% to $61 million, as lower investment expenses were mostly offset by lower common stock dividends. White Mountains reported net realized and unrealized investment gains of $225 million in 2015, which included $259 million from Symetra, compared to $79 million of gains in 2014. See
“Summary of Investment Results”
on page 50 for a discussion and analysis of White Mountains’s investment returns. Other revenue increased to $147 million in 2015 from $88 million in 2014. Other revenue in 2015 included $106 million from MediaAlpha compared to $65 million from MediaAlpha in 2014. Other revenue also included a $20 million pre-tax gain in 2015 from the sale of Hamer LLC, a small manufacturing company that White Mountains received in 2012 in connection with the liquidation of a limited partnership fund.
White Mountains’s total expenses increased 2% to $1.5 billion in 2015, which was driven by increases in other expenses associated with consolidated WM Capital Investments, partially offset by lower expenses in OneBeacon’s insurance business. Losses and LAE decreased 14%, primarily due to the $109 million reserve charge recorded by OneBeacon related to the actuarial analysis performed in the fourth quarter of 2014, while insurance acquisition expenses and other underwriting expenses increased 7% and 22% in 2015 due to changes in business mix and higher incentive compensation expense. See
“Summary of Operations by Segment”
on page 39. General and administrative expenses in 2015 included $99 million from MediaAlpha compared to $61 million from MediaAlpha in 2014.
Income Taxes
The Company and its Bermuda-domiciled subsidiaries are not subject to Bermuda income tax under current Bermuda law. In the event there is a change in the current law such that taxes are imposed, the Company and its Bermuda-domiciled subsidiaries would be exempt from such tax until March 31, 2035, pursuant to the Bermuda Exempted Undertakings Tax Protection Act of 1966. The Company has subsidiaries and branches that operate in various other jurisdictions around the world that are subject to tax in the jurisdictions in which they operate.
White Mountains reported income tax benefit of
$45 million
in
2016
on pre-tax loss of
$40 million
. White Mountains’s effective tax rate for
2016
was different than the U.S. statutory rate of 35% due primarily to a $21 million tax benefit recognized in continuing operations related to the reversal of a valuation allowance that resulted from income that was recognized within discontinued operations, a $12.8 million favorable settlement of the 2007-2009 IRS exam and a $3.5 million favorable settlement of the 2010-2012 IRS exam. The rate was also impacted by income generated in jurisdictions with lower tax rates than the United States. The $21 million tax benefit recorded in continuing operations in 2016 related to the reversal of a valuation allowance was generated by the Tranzact Sale, which is accounted for in discontinued operations. See
Note 8 — “Income Taxes”
on page F-55.
White Mountains reported near break-even income tax in 2015 on pre-tax income of $157 million. White Mountains’s effective tax rate for 2015 was near zero, which was lower than the U.S. statutory rate of 35% due primarily to income generated in jurisdictions with lower tax rates than the United States.
White Mountains reported an income tax benefit of $15 million in 2014 on pre-tax loss of $29 million. White Mountains’s effective tax rate for 2014 was 51%, which was higher than the U.S. statutory rate of 35% due primarily to losses generated in the United States and income generated in jurisdictions with lower tax rates than the United States.
38
I. Summary of Operations By Segment
White Mountains conducts its operations through three segments: (1) OneBeacon, (2) HG Global/BAM and (3) Other Operations. While investment results are included in these segments, because White Mountains manages the majority of its investments through its wholly-owned subsidiary, WM Advisors, a discussion of White Mountains’s consolidated investment operations is included after the discussion of operations by segment. White Mountains’s segment information is presented in
Note 16 — “Segment Information”
on page F-77 to the Consolidated Financial Statements.
As a result of the Sirius Group and Tranzact sales, the results of operations for Sirius Group and Tranzact have been classified as discontinued operations and are now presented separately, net of related income taxes, in the statement of comprehensive income. Prior year amounts have been reclassified to conform to the current period’s presentation See
Note 22 — “Held for Sale and Discontinued Operations”
on page F-87.
OneBeacon
Financial results and GAAP combined ratios for OneBeacon for the years ended
December 31, 2016, 2015 and 2014
follow:
|
Year Ended December 31,
|
||||||||||||
|
$ in millions
|
2016
|
2015
|
2014
|
|||||||||
|
Gross written premiums
|
$
|
1,221.3
|
|
$
|
1,315.9
|
|
$
|
1,323.4
|
|
|||
|
Net written premiums
|
$
|
1,100.7
|
|
$
|
1,136.6
|
|
$
|
1,216.9
|
|
|||
|
Earned insurance premiums
|
$
|
1,100.6
|
|
$
|
1,176.2
|
|
$
|
1,177.1
|
|
|||
|
Net investment income
|
50.6
|
|
45.9
|
|
43.4
|
|
||||||
|
Net realized and unrealized investment gains (losses)
|
37.7
|
|
(35.1
|
)
|
40.4
|
|
||||||
|
Other revenue
|
5.5
|
|
(.6
|
)
|
5.8
|
|
||||||
|
Total revenues
|
1,194.4
|
|
1,186.4
|
|
1,266.7
|
|
||||||
|
Losses and LAE
|
656.0
|
|
700.7
|
|
815.1
|
|
||||||
|
Insurance acquisition expenses
|
206.0
|
|
213.8
|
|
203.3
|
|
||||||
|
Other underwriting expenses
|
209.0
|
|
218.2
|
|
179.2
|
|
||||||
|
General and administrative expenses
|
13.0
|
|
14.1
|
|
12.4
|
|
||||||
|
Amortization of intangible assets
|
1.2
|
|
1.3
|
|
1.4
|
|
||||||
|
Interest expense on debt
|
13.1
|
|
13.0
|
|
13.0
|
|
||||||
|
Total expenses
|
1,098.3
|
|
1,161.1
|
|
1,224.4
|
|
||||||
|
Pre-tax income
|
$
|
96.1
|
|
$
|
25.3
|
|
$
|
42.3
|
|
|||
|
GAAP Ratios:
|
||||||||||||
|
Losses and LAE
|
59
|
%
|
60
|
%
|
69
|
%
|
||||||
|
Expense
|
38
|
|
36
|
|
33
|
|
||||||
|
Combined
|
97
|
%
|
96
|
%
|
102
|
%
|
||||||
The following table presents OneBeacon’s book value per share.
|
December 31,
|
||||||||||||
|
Millions, except per share amounts
|
2016
|
2015
|
2014
|
|||||||||
|
OneBeacon’s common shareholders’ equity
|
$
|
1,021.3
|
|
$
|
1,000.9
|
|
$
|
1,045.8
|
|
|||
|
OneBeacon common shares outstanding
|
94.3
|
|
95.1
|
|
95.3
|
|
||||||
|
OneBeacon book value per common share
|
$
|
10.82
|
|
$
|
10.53
|
|
$
|
10.97
|
|
|||
|
Dividends paid per common share
|
$
|
.84
|
|
$
|
.84
|
|
$
|
.84
|
|
|||
39
OneBeacon Results—Year Ended
December 31, 2016
versus Year Ended
December 31, 2015
OneBeacon ended 2016 with a book value per share of $10.82, an increase of 11.1% during 2016, including dividends, compared to an increase of 3.8% during 2015, including dividends. Solid underwriting results and investment returns drove the increase. The increase in book value for the year ended December 31, 2016 also included a $16 million tax benefit related to the settlement of IRS examinations for tax years 2007-2012.
OneBeacon’s GAAP combined ratio increased to 97% for 2016 from 96% for 2015. The increase was primarily due to a higher expense ratio. The loss ratio of 59% for the year ended December 31, 2016 compared to the year ended December 31, 2015 ratio of 60%, as improved results primarily in the Entertainment, Accident and Inland Marine businesses were offset by lower results primarily in the Healthcare business. Net unfavorable loss reserve development for the year ended December 31, 2016 was 1 point and was primarily from the Healthcare ($41 million), Architects & Engineers ($15 million), and Programs ($13 million) businesses, partially offset by favorable net loss reserve development in the Accident ($16 million), Entertainment ($9 million), Technology ($9 million) and Financial Services ($8 million) businesses. Net loss reserve development was insignificant in the year ended December 31, 2015. The expense ratio increased by 2 points to 38% for the year ended December 31, 2016, compared to the year ended December 31, 2015, primarily due to lower premium volume and changing business mix.
The increase in other revenue for the year ended December 31, 2016 compared to the year ended December 31, 2015 was primarily driven by a loss of $4 million OneBeacon recognized in 2015 that did not recur in 2016. The loss was for an assessment from the Michigan Catastrophic Claims Association payable to Markel Corporation pursuant to the indemnification provisions in the stock purchase agreement governing the sale of Essentia Insurance Company (“Essentia”). OneBeacon previously recognized a pretax gain of $23 million in 2013 on the sale of Essentia, an indirect wholly-owned subsidiary which wrote legacy collector cars and boats business, to Markel Corporation.
OneBeacon’s net written premiums were $1.101 billion for the year ended December 31, 2016, a decrease of 3% compared to the year ended December 31, 2015. Decreases in the Programs ($32 million), Entertainment ($27 million) and Healthcare ($15 million) businesses were partially offset by increases in Financial Institutions ($18 million) and various other businesses.
Reinsurance protection.
OneBeacon purchases reinsurance in order to minimize the loss from large risks or catastrophic events. OneBeacon also purchases individual property reinsurance coverage for certain risks to reduce large loss volatility through property-per-risk excess of loss reinsurance programs and individual risk facultative reinsurance. OneBeacon also maintains excess of loss casualty reinsurance programs that provide protection for individual risk or catastrophe losses involving workers compensation, general liability, automobile liability, professional liability or umbrella liability. The availability and cost of reinsurance protection is subject to market conditions, which are outside of management’s control. Limiting risk of loss through reinsurance arrangements serves to mitigate the impact of large losses; however, the cost of this protection in an individual period may exceed the benefit.
For 2016 and 2015, OneBeacon’s net combined ratio was higher than the gross combined ratio by 4 points and 1 point as a result of the cost of the reinsurance programs more than offsetting the benefits from ceded losses.
OneBeacon Surplus Notes issued pursuant to the Runoff Transaction.
As part of closing the Runoff Transaction on December 23, 2014, OneBeacon provided financing in the form of the OneBeacon Surplus Notes with a par value of $101 million issued by OneBeacon Insurance Company (“OBIC”), one of the entities that was transferred from OneBeacon to Armour as part of the transaction. As of December 31, 2016 and December 31, 2015, the OneBeacon Surplus Notes had a fair value of $72 million and $52 million, based on a discounted cash flow model. The OneBeacon Surplus Notes are included in OneBeacon’s investment portfolio, categorized within other long-term investments, and subsequent changes in value thereon are reflected in continuing operations. See “
Critical Accounting Estimates
” on page 65 for a sensitivity analysis of potential changes in these key variables that can impact the estimated fair value of the OneBeacon Surplus Notes and “
Summary of Investment Results
” on page 50 for a discussion and analysis of White Mountains’s investment returns.
40
OneBeacon Results—Year Ended December 31, 2015 versus Year Ended December 31, 2014
OneBeacon ended 2015 with a book value per share of $10.53, an increase of 3.8% during 2015, including dividends, compared to an increase of 2.1% during 2014, including dividends. Improved underwriting results drove the increase in OneBeacon’s book value per share growth for 2015.
OneBeacon’s GAAP combined ratio decreased to 96% for 2015 from 102% for 2014. The decrease was primarily driven by a 9 point decrease in the loss ratio from non-recurrence of adverse prior accident year loss reserve development in 2015, partially offset by an increase in the expense ratio and the impact of increasingly competitive markets on the current accident year loss ratio. There was no net loss reserve development in 2015, primarily attributable to favorable net loss reserve development from the Technology, Collector Cars and Boats, Specialty Property and Financial Services lines of business, offset by unfavorable net loss reserve development from the Entertainment and Ocean Marine lines of business. In 2014, there was $90 million, or 8 points, of unfavorable net prior accident year adverse loss reserve development (described below in “
2014 Fourth Quarter Loss and LAE Reserve Increase.
”). The increase in the expense ratio for 2015 was primarily due to higher incentive compensation expense, higher acquisition costs due to changes in business mix and the impact of exiting the Crop Business.
During 2015, OneBeacon recognized a loss of $4 million in other revenues in connection with an assessment from the Michigan Catastrophic Claims Association payable to Markel Corporation pursuant to the indemnification provisions in the stock purchase agreement governing the sale of Essentia.
OneBeacon’s net written premiums decreased 7% in 2015 to $1.1 billion, primarily due to the exit from the Crop Business ($44 million) and lawyers liability business ($28 million), a decrease in the Healthcare business ($33 million) and the termination of an affiliated reinsurance treaty ($20 million), partially offset by increases in OneBeacon’s newer Programs and Surety businesses ($67 million). Excluding the impact of OneBeacon’s exit from the Crop Business and lawyers liability business and the affiliated reinsurance treaty termination, consolidated net written premiums increased $13 million, or 1.1%.
2014 Fourth Quarter Loss and LAE Reserve Increase
Through the first nine months of 2014, OneBeacon recorded $14 million of net unfavorable loss and LAE reserve development, driven by greater-than-expected large losses in several underwriting units, primarily in the professional and management liability lines within Professional Insurance. This large loss activity, which occurred mostly during the second and third quarters of 2014, also impacted the current accident year loss and LAE estimates. Additionally, OneBeacon incurred higher-than-usual claim coverage determination costs, a component of LAE expenses, during the first nine months of 2014. Other underwriting units also reported increased claim activity, including Entertainment, Government Risks, and Accident.
Since the increased level of loss and LAE activity continued into the early part of the fourth quarter, the high level of activity in the second and third quarters no longer seemed to be isolated occurrences. As such, during the fourth quarter of 2014, OneBeacon enhanced its actuarial and claims review in several areas. OneBeacon isolated the recent large loss activity in each of its underwriting units and examined the emergence of large losses relative to the timing and amounts of expected large losses. OneBeacon also conducted additional analyses in the lawyers’ professional liability line within Professional Insurance. These new analyses included a claim level review and the application of additional actuarial methods and loss development assumptions. The results of these analyses indicated that the assumed tail risk included in the loss development patterns used to record IBNR reserves for this line were insufficient and needed to be increased for remaining long-tail exposures. OneBeacon’s claims and actuarial staff also conducted an in-depth review of coverage determination, litigation and other claim-specific adjusting expenses as a result of an emerging trend of increased expenses in these areas over recent quarters, particularly coverage determination expenses. This review concluded that the ultimate costs of these loss adjustment expenses were larger than previously estimated, causing management to record an increase in estimated LAE expenses, primarily in Professional Insurance. Finally, OneBeacon also recorded unfavorable prior year development in other underwriting units, including Entertainment and Government Risks. The unfavorable loss development in Entertainment and Government Risks resulted from heavier than expected claim activity during the fourth quarter, predominantly in the general liability and commercial auto liability lines.
41
In order to fully reflect these recent trends, OneBeacon recorded a $109 million increase in loss and LAE reserves, which included a $75 million increase in prior accident year loss and LAE reserves and a $34 million increase in the current accident year loss and LAE reserves recorded at September 30, 2014. The components of the 2014 fourth quarter loss and LAE reserve increase and the net loss and LAE development for the full year are provided below:
|
Millions
|
2014 Fourth Quarter Reserve Increases
|
Full Year 2014
|
||||||||||||||
|
Underwriting Unit
|
Current Accident Year
|
Prior Accident Year
|
Total
|
Net Prior Year Development
|
||||||||||||
|
Professional Insurance
|
$
|
22.9
|
|
$
|
46.4
|
|
$
|
69.3
|
|
$
|
59.1
|
|
||||
|
Specialty Property
|
(1.1
|
)
|
5.7
|
|
4.6
|
|
1.1
|
|
||||||||
|
Crop Business
|
3.8
|
|
—
|
|
3.8
|
|
—
|
|
||||||||
|
Other
|
2.8
|
|
(.4
|
)
|
2.4
|
|
1.6
|
|
||||||||
|
Specialty Products
|
28.4
|
|
51.7
|
|
80.1
|
|
61.8
|
|
||||||||
|
Entertainment
|
1.5
|
|
11.6
|
|
13.1
|
|
13.5
|
|
||||||||
|
Government Risks
|
1.2
|
|
7.1
|
|
8.3
|
|
8.5
|
|
||||||||
|
Accident
|
—
|
|
3.5
|
|
3.5
|
|
6.0
|
|
||||||||
|
Other
|
2.6
|
|
1.6
|
|
4.2
|
|
—
|
|
||||||||
|
Specialty Industries
|
5.3
|
|
23.8
|
|
29.1
|
|
28.0
|
|
||||||||
|
Total
|
$
|
33.7
|
|
$
|
75.5
|
|
$
|
109.2
|
|
$
|
89.8
|
|
||||
As noted above, OneBeacon increased its provision for current accident year losses and LAE by $34 million in the fourth quarter of 2014. In making its loss and LAE reserve picks for the 2014 accident year, OneBeacon considered the results of the enhanced actuarial and claim review and the fact that reported large claims were approaching estimated ultimate held reserves for large losses sooner than originally expected. $4 million of the increase was related to higher-than-expected reports of Crop Business losses that emerged in the fourth quarter. The remaining $30 million of the increase reflects an increase in management’s best estimate of current losses and LAE as of December 31, 2014 from those recorded in the first nine months of 2014. This increase primarily affected Professional Insurance, which represented $23 million of the total provision.
Reinsurance protection.
For 2015 and 2014, OneBeacon’s net combined ratio was higher than the gross combined ratio by 1 point and 2 points as a result of the cost of the reinsurance programs more than offsetting the benefits from ceded losses.
OneBeacon Discontinued Operations - Runoff Transaction
In October 2012, OneBeacon entered into an agreement to sell its Runoff Business to Armour. The Runoff Transaction closed in the fourth quarter of 2014. See
Note 22 — “Held for Sale and Discontinued Operations”
on page F-87 for more details regarding the Runoff Transaction. During 2014, OneBeacon reported a $21 million after-tax net loss in discontinued operations related to the Runoff Transaction, which included a $19 million after-tax loss from sale of the Runoff Business (further described below) and a $2 million after-tax loss from the underwriting results of the Runoff Business.
As part of closing the Runoff Transaction on December 23, 2014, OneBeacon provided financing in the form of the OneBeacon Surplus Notes with a par value of $101 million issued by OneBeacon Insurance Company (“OBIC”), one of the entities that were transferred from OneBeacon to Armour as part of the transaction. As of December 31, 2014, the OneBeacon Surplus Notes had a fair value of $65 million, based on a discounted cash flow model, resulting in a total valuation adjustment of $36 million pre-tax ($23 million after tax) included in loss from sale of discontinued operations. Subsequent to closing, the OneBeacon Surplus Notes are included in OneBeacon’s investment portfolio, categorized within other long-term investments, and subsequent changes in value thereon are reflected in continuing operations. See “
Critical Accounting Estimates
” on page 65 for a sensitivity analysis of potential changes in these key variables that can impact the estimated fair value of the OneBeacon Surplus Notes and “
Summary of Investment Results
” on page 50 for a discussion and analysis of White Mountains’s investment returns.
42
HG Global/BAM
The following table presents the components of pre-tax income included in White Mountains’s HG Global/BAM segment related to the consolidation of HG Global, which includes HG Re and its other wholly-owned subsidiaries, and BAM for the years ended
December 31, 2016, 2015 and 2014
:
|
|
Year Ended December 31, 2016
|
|||||||||||||||
|
Millions
|
HG Global
|
BAM
|
Eliminations
|
Total
|
||||||||||||
|
Gross written premiums
|
$
|
—
|
|
$
|
38.6
|
|
$
|
—
|
|
$
|
38.6
|
|
||||
|
Assumed (ceded) written premiums
|
27.2
|
|
(27.2
|
)
|
—
|
|
—
|
|
||||||||
|
Net written premiums
|
$
|
27.2
|
|
$
|
11.4
|
|
$
|
—
|
|
$
|
38.6
|
|
||||
|
Earned insurance and reinsurance premiums
|
$
|
4.4
|
|
$
|
1.5
|
|
$
|
—
|
|
$
|
5.9
|
|
||||
|
Net investment income
|
2.2
|
|
6.8
|
|
—
|
|
9.0
|
|
||||||||
|
Net investment income - BAM Surplus Notes
|
17.8
|
|
—
|
|
(17.8
|
)
|
—
|
|
||||||||
|
Net realized and unrealized investment gains
|
.1
|
|
.6
|
|
—
|
|
.7
|
|
||||||||
|
Other revenue
|
—
|
|
1.1
|
|
—
|
|
1.1
|
|
||||||||
|
Total revenues
|
24.5
|
|
10.0
|
|
(17.8
|
)
|
16.7
|
|
||||||||
|
Insurance and reinsurance acquisition expenses
|
.9
|
|
2.5
|
|
—
|
|
3.4
|
|
||||||||
|
Other underwriting expenses
|
—
|
|
.4
|
|
—
|
|
.4
|
|
||||||||
|
General and administrative expenses
|
1.4
|
|
38.2
|
|
—
|
|
39.6
|
|
||||||||
|
Interest expense - BAM Surplus Notes
|
—
|
|
17.8
|
|
(17.8
|
)
|
—
|
|
||||||||
|
Total expenses
|
2.3
|
|
58.9
|
|
(17.8
|
)
|
43.4
|
|
||||||||
|
Pre-tax income (loss)
|
$
|
22.2
|
|
$
|
(48.9
|
)
|
$
|
—
|
|
$
|
(26.7
|
)
|
||||
|
Supplemental information:
|
||||||||||||||||
|
Member Surplus Contributions
(1)
|
$
|
—
|
|
$
|
38.0
|
|
$
|
—
|
|
$
|
38.0
|
|
||||
|
|
Year Ended December 31, 2015
|
|||||||||||||||
|
Millions
|
HG Global
|
BAM
|
Eliminations
|
Total
|
||||||||||||
|
Gross written premiums
|
$
|
—
|
|
$
|
25.9
|
|
$
|
—
|
|
$
|
25.9
|
|
||||
|
Assumed (ceded) written premiums
|
19.3
|
|
(19.3
|
)
|
—
|
|
—
|
|
||||||||
|
Net written premiums
|
$
|
19.3
|
|
$
|
6.6
|
|
$
|
—
|
|
$
|
25.9
|
|
||||
|
Earned insurance and reinsurance premiums
|
$
|
2.5
|
|
$
|
.8
|
|
$
|
—
|
|
$
|
3.3
|
|
||||
|
Net investment income
|
1.9
|
|
4.2
|
|
—
|
|
6.1
|
|
||||||||
|
Net investment income - BAM Surplus Notes
|
15.8
|
|
—
|
|
(15.8
|
)
|
—
|
|
||||||||
|
Net realized and unrealized investment (losses) gains
|
(.3
|
)
|
.9
|
|
—
|
|
.6
|
|
||||||||
|
Other revenue
|
—
|
|
.7
|
|
—
|
|
.7
|
|
||||||||
|
Total revenues
|
19.9
|
|
6.6
|
|
(15.8
|
)
|
10.7
|
|
||||||||
|
Insurance and reinsurance acquisition expenses
|
.6
|
|
2.3
|
|
—
|
|
2.9
|
|
||||||||
|
Other underwriting expenses
|
—
|
|
.4
|
|
—
|
|
.4
|
|
||||||||
|
General and administrative expenses
|
1.4
|
|
35.4
|
|
—
|
|
36.8
|
|
||||||||
|
Interest expense - BAM Surplus Notes
|
—
|
|
15.8
|
|
(15.8
|
)
|
—
|
|
||||||||
|
Total expenses
|
2.0
|
|
53.9
|
|
(15.8
|
)
|
40.1
|
|
||||||||
|
Pre-tax income (loss)
|
$
|
17.9
|
|
$
|
(47.3
|
)
|
$
|
—
|
|
$
|
(29.4
|
)
|
||||
|
Supplemental information:
|
||||||||||||||||
|
Member Surplus Contributions
(1)
|
$
|
—
|
|
$
|
29.2
|
|
$
|
—
|
|
$
|
29.2
|
|
||||
43
|
|
Year Ended December 31, 2014
|
|||||||||||||||
|
Millions
|
HG Global
|
BAM
|
Eliminations
|
Total
|
||||||||||||
|
Gross written premiums
|
$
|
—
|
|
$
|
16.2
|
|
$
|
—
|
|
$
|
16.2
|
|
||||
|
Assumed (ceded) written premiums
|
12.3
|
|
(12.3
|
)
|
—
|
|
—
|
|
||||||||
|
Net written premiums
|
$
|
12.3
|
|
$
|
3.9
|
|
$
|
—
|
|
$
|
16.2
|
|
||||
|
Earned insurance and reinsurance premiums
|
$
|
1.4
|
|
$
|
.4
|
|
$
|
—
|
|
$
|
1.8
|
|
||||
|
Net investment income
|
1.4
|
|
5.7
|
|
—
|
|
7.1
|
|
||||||||
|
Net investment income - BAM Surplus Notes
|
15.7
|
|
—
|
|
(15.7
|
)
|
—
|
|
||||||||
|
Net realized and unrealized investment gains
|
1.7
|
|
6.6
|
|
—
|
|
8.3
|
|
||||||||
|
Other revenue
|
—
|
|
.6
|
|
—
|
|
.6
|
|
||||||||
|
Total revenues
|
20.2
|
|
13.3
|
|
(15.7
|
)
|
17.8
|
|
||||||||
|
Insurance and reinsurance acquisition expenses
|
.3
|
|
1.8
|
|
—
|
|
2.1
|
|
||||||||
|
Other underwriting expenses
|
—
|
|
.4
|
|
—
|
|
.4
|
|
||||||||
|
General and administrative expenses
|
1.6
|
|
35.9
|
|
—
|
|
37.5
|
|
||||||||
|
Interest expense - BAM Surplus Notes
|
—
|
|
15.7
|
|
(15.7
|
)
|
—
|
|
||||||||
|
Total expenses
|
1.9
|
|
53.8
|
|
(15.7
|
)
|
40.0
|
|
||||||||
|
Pre-tax income (loss)
|
$
|
18.3
|
|
$
|
(40.5
|
)
|
$
|
—
|
|
$
|
(22.2
|
)
|
||||
|
Supplemental information:
|
||||||||||||||||
|
Member Surplus Contributions
(1)
|
$
|
—
|
|
$
|
16.2
|
|
$
|
—
|
|
$
|
16.2
|
|
||||
(1)
Member Surplus Contributions are recorded directly to BAM’s equity, which is recorded as non-controlling interest on White Mountains’s balance sheet.
HG Global/BAM Results-Year Ended December 31, 2016 versus Year Ended December 31, 2015
BAM is a mutual insurance company whose affairs are managed on a statutory accounting basis, and it does not report stand-alone GAAP financial results. BAM is owned by its members, the municipalities that purchase BAM’s insurance for their debt issuances. BAM charges an insurance premium on each municipal bond insurance policy it insures. A portion of the premium is a Member Surplus Contribution, which is contributed to BAM’s qualified statutory capital and conveys to the issuer certain interests in BAM, including the right to receive dividends in the future, subject to regulatory approval. The remainder is a risk premium, which is recorded as gross written premiums.
In 2016, BAM insured $11.3 billion of municipal bonds, $10.3 billion of which were in the primary market, up 7% from 2015. The average total premium (including both risk premiums and Member Surplus Contributions), weighted by insured par, of insurance provided by BAM in the primary and secondary markets in 2016 was 68 basis points, up from 52 basis points in 2015.
HG Global reported GAAP pre-tax income of
$22 million
and
$18 million
in 2016 and 2015, which was driven by
$18 million
and $16 million of interest income on the BAM Surplus Notes.
As a mutual insurance company that is owned by its members, BAM’s results do not affect White Mountains’s book value per share and adjusted book value per share. However, White Mountains is required to consolidate BAM’s results in its GAAP financial statements and its results are attributed to non-controlling interests. White Mountains reported
$49 million
of GAAP pre-tax losses on BAM in 2016, driven by
$18 million
of interest expense on the BAM Surplus Notes and
$38 million
of operating expenses, compared to $47 million of pre-tax losses in 2015, driven by $16 million of interest expense on the BAM Surplus Notes and $35 million of operating expenses.
BAM’s “claims paying resources” represent the capital and other financial resources BAM has available to pay claims and, as such, is a key indication of BAM’s financial strength. BAM’s claims-paying resources include BAM’s qualified statutory capital, including Member Surplus Contributions, net unearned premiums, contingency reserves, present value of future installment premiums and the first loss reinsurance protection provided by HG Re, which is collateralized and held in trusts. BAM expects Member Surplus Contributions and HG Re’s reinsurance protection to be the primary drivers of continued growth of its claims-paying resources.
44
In 2016, BAM’s claims paying resources increased
7%
to $
644 million
at December 31, 2016. The increase was primarily driven by
$38 million
of Member Surplus Contributions and a $26 million increase in the HG Re collateral trusts, partially offset by BAM’s 2016 statutory net loss of $33 million.
The following table presents BAM’s total claims paying resources as of December 31, 2016 and 2015:
|
Millions
|
As of
December 31, 2016 |
As of
December 31, 2015 |
||||||
|
Policyholders’ surplus
|
$
|
431.5
|
|
$
|
437.2
|
|
||
|
Contingency reserve
|
22.7
|
|
12.4
|
|
||||
|
Qualified statutory capital
|
454.2
|
|
449.6
|
|
||||
|
Net unearned premiums
|
23.2
|
|
12.5
|
|
||||
|
Present value of future installment premiums
|
3.3
|
|
2.6
|
|
||||
|
Collateral trusts
|
163.0
|
|
136.6
|
|
||||
|
Claims paying resources
|
$
|
643.7
|
|
$
|
601.3
|
|
||
HG Global/BAM Results-Year Ended December 31, 2015 versus Year Ended December 31, 2014
In 2015, BAM insured $10.6 billion of municipal bonds, $10.0 billion of which were in the primary market, up 36% from 2014. The average total premium (including both risk premiums and Member Surplus Contributions), weighted by insured par, of insurance provided by BAM in the primary and secondary markets in 2015 was 52 basis points, up from 43 basis points in 2014.
HG Global reported GAAP pre-tax income of $18 million in both 2015 and 2014, which was driven by $16 million of interest income on the BAM Surplus Notes in both periods.
White Mountains reported $47 million of GAAP pre-tax losses on BAM in 2015, driven by $16 million of interest expense on the BAM Surplus Notes and $35 million of operating expenses, compared to $41 million of pre-tax losses in 2014, driven by $16 million of interest expense on the BAM Surplus Notes and $36 million of operating expenses, partially offset by $7 million of net realized and unrealized investment gains.
In 2015, BAM’s claims paying resources increased 3% to $601 million at December 31, 2015. The increase was primarily driven by $29 million of Member Surplus Contributions and a $17 million increase in the HG Re collateral trusts, partially offset by BAM’s 2015 statutory net loss of $32 million.
The following table presents BAM’s total claims paying resources as of December 31, 2015 and 2014:
|
Millions
|
As of
December 31, 2015 |
As of
December 31, 2014 |
||||||
|
Policyholders’ surplus
|
$
|
437.2
|
|
$
|
448.7
|
|
||
|
Contingency reserve
|
12.4
|
|
4.7
|
|
||||
|
Qualified statutory capital
|
449.6
|
|
453.4
|
|
||||
|
Net unearned premiums
|
12.5
|
|
6.4
|
|
||||
|
Present value of future installment premiums
|
2.6
|
|
1.4
|
|
||||
|
Collateral trusts
|
136.6
|
|
120.0
|
|
||||
|
Claims paying resources
|
$
|
601.3
|
|
$
|
581.2
|
|
||
45
The following table presents amounts from HG Global, which includes HG Re and its other wholly-owned subsidiaries, and BAM that are contained within White Mountains’s consolidated balance sheet as of
December 31, 2016
and 2015:
|
As of December 31, 2016
|
||||||||||||||||
|
Millions
|
HG Global
|
BAM
|
Eliminations and Segment Adjustment
|
Total Segment
|
||||||||||||
|
Assets
|
||||||||||||||||
|
Fixed maturity investments
|
$
|
155.2
|
|
$
|
430.0
|
|
$
|
—
|
|
$
|
585.2
|
|
||||
|
Short-term investments
|
6.4
|
|
38.1
|
|
—
|
|
44.5
|
|
||||||||
|
Total investments
|
161.6
|
|
468.1
|
|
—
|
|
629.7
|
|
||||||||
|
Cash
|
1.9
|
|
25.1
|
|
—
|
|
27.0
|
|
||||||||
|
BAM Surplus Notes
|
503.0
|
|
—
|
|
(503.0
|
)
|
—
|
|
||||||||
|
Accrued interest receivable on BAM Surplus Notes
|
108.0
|
|
—
|
|
(108.0
|
)
|
—
|
|
||||||||
|
Other assets
|
12.5
|
|
39.9
|
|
(1.0
|
)
|
51.4
|
|
||||||||
|
Total assets
|
$
|
787.0
|
|
$
|
533.1
|
|
$
|
(612.0
|
)
|
$
|
708.1
|
|
||||
|
Liabilities
|
||||||||||||||||
|
BAM Surplus Notes
(1)
|
$
|
—
|
|
$
|
503.0
|
|
$
|
(503.0
|
)
|
$
|
—
|
|
||||
|
Accrued interest payable on BAM Surplus Notes
(2)
|
—
|
|
108.0
|
|
(108.0
|
)
|
—
|
|
||||||||
|
Preferred dividends payable to White Mountains's subsidiaries
(3)
|
180.5
|
|
—
|
|
—
|
|
180.5
|
|
||||||||
|
Preferred dividends payable to non-controlling interests
|
5.7
|
|
—
|
|
—
|
|
5.7
|
|
||||||||
|
Other liabilities
|
61.4
|
|
73.0
|
|
(1.0
|
)
|
133.4
|
|
||||||||
|
Total liabilities
|
247.6
|
|
684.0
|
|
(612.0
|
)
|
319.6
|
|
||||||||
|
Equity
|
||||||||||||||||
|
White Mountains’s common shareholders’ equity
|
522.8
|
|
—
|
|
—
|
|
522.8
|
|
||||||||
|
Non-controlling interests
|
16.6
|
|
(150.9
|
)
|
—
|
|
(134.3
|
)
|
||||||||
|
Total equity
|
539.4
|
|
(150.9
|
)
|
—
|
|
388.5
|
|
||||||||
|
Total liabilities and equity
|
$
|
787.0
|
|
$
|
533.1
|
|
$
|
(612.0
|
)
|
$
|
708.1
|
|
||||
|
As of December 31, 2015
|
||||||||||||||||
|
Millions
|
HG Global
|
BAM
|
Eliminations and Segment Adjustment
|
Total Segment
|
||||||||||||
|
Assets
|
||||||||||||||||
|
Fixed maturity investments
|
$
|
130.6
|
|
$
|
417.0
|
|
$
|
—
|
|
$
|
547.6
|
|
||||
|
Short-term investments
|
5.6
|
|
43.3
|
|
—
|
|
48.9
|
|
||||||||
|
Total investments
|
136.2
|
|
460.3
|
|
—
|
|
596.5
|
|
||||||||
|
Cash
|
.1
|
|
15.8
|
|
—
|
|
15.9
|
|
||||||||
|
BAM Surplus Notes
|
503.0
|
|
—
|
|
(503.0
|
)
|
—
|
|
||||||||
|
Accrued interest receivable on BAM Surplus Notes
|
90.2
|
|
—
|
|
(90.2
|
)
|
—
|
|
||||||||
|
Other assets
|
9.5
|
|
26.8
|
|
(.8
|
)
|
35.5
|
|
||||||||
|
Total assets
|
$
|
739.0
|
|
$
|
502.9
|
|
$
|
(594.0
|
)
|
$
|
647.9
|
|
||||
|
Liabilities
|
||||||||||||||||
|
BAM Surplus Notes
(1)
|
$
|
—
|
|
$
|
503.0
|
|
$
|
(503.0
|
)
|
$
|
—
|
|
||||
|
Accrued interest payable on BAM Surplus Notes
(2)
|
—
|
|
90.2
|
|
(90.2
|
)
|
—
|
|
||||||||
|
Preferred dividends payable to White Mountains's subsidiaries
(3)
|
135.4
|
|
—
|
|
—
|
|
135.4
|
|
||||||||
|
Preferred dividends payable to non-controlling interests
|
4.3
|
|
—
|
|
—
|
|
4.3
|
|
||||||||
|
Other liabilities
|
41.5
|
|
49.7
|
|
(.8
|
)
|
90.4
|
|
||||||||
|
Total liabilities
|
181.2
|
|
642.9
|
|
(594.0
|
)
|
230.1
|
|
||||||||
|
Equity
|
||||||||||||||||
|
White Mountains’s common shareholders’ equity
|
540.7
|
|
—
|
|
—
|
|
540.7
|
|
||||||||
|
Non-controlling interests
|
17.1
|
|
(140.0
|
)
|
—
|
|
(122.9
|
)
|
||||||||
|
Total equity
|
557.8
|
|
(140.0
|
)
|
—
|
|
417.8
|
|
||||||||
|
Total liabilities and equity
|
$
|
739.0
|
|
$
|
502.9
|
|
$
|
(594.0
|
)
|
$
|
647.9
|
|
||||
|
(1)
|
Under GAAP, the BAM Surplus Notes are classified as debt by the issuer. Under U.S. Statutory accounting, they are classified as Surplus.
|
|
(2)
|
Under GAAP, interest accrues daily on the BAM Surplus Notes. Under U.S. Statutory accounting, interest is not accrued on the BAM Surplus Notes until it has been approved for payment by insurance regulators.
|
|
(3)
|
For segment reporting, the HG Global preferred dividend receivable at White Mountains is reclassified from the Other Operations segment to the HG Global/BAM segment. Dividends on HG Global preferred shares payable to White Mountains’s subsidiaries are eliminated in White Mountains’s consolidated financial statements.
|
46
The following table presents the gross par value of policies priced and closed by BAM for the years ended
December 31, 2016 and 2015
:
|
Year Ended December 31,
|
||||||||
|
Millions
|
2016
|
2015
|
||||||
|
Gross par value of primary market policies priced
|
$
|
10,390.5
|
|
$
|
9,911.8
|
|
||
|
Gross par value of secondary market policies priced
|
967.4
|
|
611.1
|
|
||||
|
Total gross par value of market policies priced
|
11,357.9
|
|
10,522.9
|
|
||||
|
Less: Gross par value of policies priced yet to close
|
(353.2
|
)
|
(298.6
|
)
|
||||
|
Gross par value of policies closed that were previously priced
|
298.6
|
|
381.7
|
|
||||
|
Total gross par value of market policies issued
|
$
|
11,303.3
|
|
$
|
10,606.0
|
|
||
Other Operations
A summary of White Mountains’s financial results from its Other Operations segment for the years ended
December 31, 2016, 2015 and 2014
follows:
|
Year Ended December 31,
|
||||||||||||
|
Millions
|
2016
|
2015
|
2014
|
|||||||||
|
Earned insurance premiums
|
$
|
7.5
|
|
$
|
8.7
|
|
$
|
6.1
|
|
|||
|
Net investment income
|
27.2
|
|
8.8
|
|
9.0
|
|
||||||
|
Net realized and unrealized investment (losses) gains
|
(28.1
|
)
|
259.9
|
|
29.8
|
|
||||||
|
Other revenue—MediaAlpha
|
116.5
|
|
105.5
|
|
65.3
|
|
||||||
|
Other revenue - other
|
26.5
|
|
41.7
|
|
16.4
|
|
||||||
|
Total revenues
|
149.6
|
|
424.6
|
|
126.6
|
|
||||||
|
Losses and LAE
|
8.0
|
|
8.2
|
|
8.9
|
|
||||||
|
Insurance and reinsurance acquisition expenses
|
2.2
|
|
3.4
|
|
.8
|
|
||||||
|
Other underwriting expenses
|
.1
|
|
—
|
|
—
|
|
||||||
|
General and administrative expenses—MediaAlpha
|
109.6
|
|
99.0
|
|
60.6
|
|
||||||
|
General and administrative expenses—amortization of intangible assets
|
11.3
|
|
9.3
|
|
6.9
|
|
||||||
|
General and administrative expenses - other
|
125.2
|
|
141.7
|
|
97.7
|
|
||||||
|
Interest expense on debt
|
3.0
|
|
1.6
|
|
1.2
|
|
||||||
|
Total expenses
|
259.4
|
|
263.2
|
|
176.1
|
|
||||||
|
Pre-tax (loss) income
|
$
|
(109.8
|
)
|
$
|
161.4
|
|
$
|
(49.5
|
)
|
|||
Other Operations Results—Year Ended
December 31, 2016
versus Year Ended
December 31, 2015
White Mountains’s Other Operations segment reported pre-tax loss of
$110 million
in 2016 compared to pre-tax income of
$161 million
in 2015. The decrease is primarily due to the recognition of a $259 million unrealized investment gain on White Mountains’s investment in Symetra in the fourth quarter of 2015. This gain was the result of a change in accounting for the investment in Symetra from the equity method to fair value, caused by White Mountains’s relinquishment of its representation on Symetra’s board of directors subsequent to Symetra entering into a merger agreement with Sumitomo Life.
White Mountains’s Other Operations segment reported net realized and unrealized investment losses of
$28 million
in 2016, compared to net realized and unrealized investment gains of
$260 million
in 2015, which included the gain from Symetra. The net realized and unrealized investment losses for the year ended December 31, 2016 included $21 million of losses in two private equity investments. See “
Summary of Investment Results”
on page 50. The Other Operations segment reported net investment income of
$27 million
in 2016 compared to
$9 million
in 2015, driven by a higher invested asset base resulting primarily from the sale of Sirius Group. Other revenues in 2016 includes
$117 million
from MediaAlpha compared to
$106 million
from MediaAlpha in 2015. Other revenue also includes a $20 million pre-tax gain in 2015 from the sale of Hamer LLC, a small manufacturing company that White Mountains received in 2012 in connection with the liquidation of a limited partnership fund. In addition, other revenues in 2016 included third-party investment management fee income at WM Advisors of $10 million, compared to $13 million in 2015.
47
General and administrative expenses in 2016 included
$110 million
from MediaAlpha compared to
$99 million
from MediaAlpha in 2015. General and administrative expenses decreased in the year ended December 31, 2016 compared to the year ended December 31, 2015 as compensation expenses during 2016, driven by the rising market price of White Mountains’s common shares, were more than offset by the impact from $36 million of incentive compensation expense recorded during 2015 related to the agreements to sell Sirius Group and Symetra.
WM Life Re reported losses of $3 million in 2016 compared to $6 million in 2015. WM Life Re has completed its run-off as all of its contracts matured as of June 30, 2016. See
Note 9 — “Derivatives”
on page F-59 for details regarding WM Life Re’s total impact on White Mountains’s statement of operations.
During the year ended December 31, 2016, White Mountains wrote down its investment in the SSIE Surplus Notes, which reduced book value per share by approximately $4. White Mountains consolidates SSIE, the issuer of the SSIE Surplus Notes. As a result, the impact of the write down is eliminated in pre-tax income. However, the write down resulted in a $21 million decrease to White Mountains’s book value and a corresponding increase to non-controlling interest equity.
Share repurchases
. White Mountains repurchased and retired
1,106,145
of its common shares for
$887 million
in 2016 at an average price per share of $802.08, or approximately 101% of White Mountains’s December 31, 2016 adjusted book value per share.
Other Operations Results—Year Ended
December 31, 2015
versus Year Ended
December 31, 2014
White Mountains’s Other Operations segment reported pre-tax income of
$161 million
in 2015 compared to a pre-tax loss of
$50 million
in 2014. White Mountains’s Other Operations segment reported net realized and unrealized investment gains of
$260 million
in 2015 compared to
$30 million
in 2014, primarily related to the $259 million unrealized investment gain from the investment in Symetra common shares. See
“Summary of Investment Results”
on page 50. The Other Operations segment reported net investment income of $9 million in both 2015 and 2014. Other revenues in 2015 includes
$106 million
from MediaAlpha compared to
$65 million
from MediaAlpha in 2014. Other revenue also includes a $20 million pre-tax gain in 2015 from the sale of Hamer LLC, a small manufacturing company that White Mountains received in 2012 in connection with the liquidation of a limited partnership fund. In addition, other revenues in 2015 included third-party investment management fee income at WM Advisors of $13 million, compared to $17 million in 2014.
General and administrative expenses in 2015 included $99 million from MediaAlpha compared to $61 million from MediaAlpha in 2014. General and administrative expenses also included $36 million of increased incentive compensation expense recorded in connection with the agreements to sell Sirius Group and Symetra.
WM Life Re reported losses of $6 million in 2015 compared to $9 million in 2014. See
Note 9 — “Derivatives”
on page F-59 for details regarding WM Life Re’s total impact on White Mountains’s statement of operations.
White Mountains’s Other Operations segment reported a $4 million GAAP pre-tax loss relating to SSIE in 2015 compared to $12 million in 2014. As a reciprocal insurance exchange that is owned by its policyholders, SSIE’s results are attributed to non-controlling interests and do not affect White Mountains’s adjusted book value per share.
Share repurchases
. White Mountains repurchased and retired 387,495 of its common shares for $284 million in 2015 at an average price per share of $733.37, or approximately 105% of White Mountains’s December 31, 2015 adjusted book value per share. The average share price paid was approximately 94% of White Mountains’s December 31, 2015 adjusted book value per share including the estimated gain from the Sirius Group transaction as of December 31, 2015 of $84.02 per share.
48
Discontinued Operations
During 2016, 2015 and 2014, White Mountains entered into a number of sale transactions that have been accounted for as discontinued operations within its consolidated financial statements. See
Note 22 — “Held for Sale and Discontinued Operations”
on page F-87 for detailed financial information on each business sold.
Sirius Group
Sirius Group Results—Period Ended April 18, 2016
On April 18, 2016, White Mountains completed the sale of Sirius Group to CMI. Sirius Group’s results inured to White Mountains until the closing date of the transaction. For the 2016 period, White Mountains reported Sirius Group’s comprehensive income of $27 million and a combined ratio of 102%, which was driven by $17 million of recorded losses from the Ecuador earthquake that occurred on April 16, 2016.
Sirius Group Results—Year Ended December 31, 2015 versus Year Ended December 31, 2014
Sirius Group's GAAP combined ratio was 85% for the year ended December 31, 2015 compared to 76% for 2014. Loss and expense ratios for the 2015 periods were increased by a higher frequency of non-catastrophe per risk and pro rata loss events, which primarily impacted the property, aviation, contingency, and marine lines of business, as well as continued pressure on rates and terms due to continued competitive market conditions. The 2015 results included $18 million of losses after reinstatement premiums from the Tianjin port explosion. Also, the combined ratios for the year ended December 31, 2015 were higher by 1 point due to the cost of ILW covers purchased to mitigate the potential impact of major events on Sirius Group’s balance sheet pending the close of the sale to CMI. The 2015 period included 3 points of catastrophe losses, primarily from the Chennai flood in Southern India and winter storms in the Northeastern United States, compared to 7 points in 2014. Favorable net loss reserve development was 6 points in 2015 primarily due to decreases in casualty and property loss reserves, compared to 11 points of favorable net loss reserve development in 2014.
Reinsurance protection.
In addition to the ILW covers, Sirius Group’s reinsurance protection primarily consists of pro-rata and excess of loss protections to cover aviation, trade credit, and certain accident and health and property exposures. Sirius Group’s proportional reinsurance programs provide protection for part of the non-proportional treaty accounts written in Europe, the Americas, Asia, the Middle East and Australia. This reinsurance is designed to increase underwriting capacity where appropriate, and to reduce exposure both to large catastrophe losses and to a frequency of smaller loss events. Attachment points and coverage limits vary by region and line of business around the world.
Sirius Group’s net combined ratio was 6 points higher than the gross combined ratio for the year ended December 31, 2015 and 1 point lower than the gross combined ratio for 2014. In 2015, the net combined ratio was higher than the gross combined ratio primarily due to the cost of property retrocessional coverage, including the ILW covers, with limited or no loss recoveries. In 2014, the net combined ratio was lower than the gross combined ratio because ceded loss recoveries, primarily in the accident and health and aviation lines, mostly offset the premiums ceded under Sirius Group’s reinsurance protection programs.
Tranzact
On July 21, 2016, White Mountains completed the sale of Tranzact to an affiliate of Clayton, Dubilier & Rice, LLC. Tranzact's results inured to White Mountains until the closing date of the transaction. For the 2016 period, White Mountains reported Tranzact's net loss from discontinued operations of $3 million. Tranzact’s results were near break-even for the year ended December 31, 2015.
OneBeacon Runoff
For the year ended 2015, White Mountains recorded $0.3 million to the gain from sale of discontinued operations related to an adjustment on the estimated loss on sale of the Runoff Transaction, which included the final settlement of certain post-closing items. For year ended 2015, the net loss from discontinued operations relating to the Runoff Transaction, net of tax, was $0.5 million.
During 2014, OneBeacon recorded a $19 million net loss on sale of discontinued operations on the Runoff Transaction, which included a $24 million after-tax loss from the change in the estimated value of the OneBeacon Surplus Notes issued with the Runoff Transaction, partially offset by a reduction in the loss on sale from the Runoff Transaction related to the change in the treatment of the $7 million pre-tax ($5 million after-tax) reserve charge recorded during the second quarter of 2013. Previously, OneBeacon expected that the Runoff Business Stock Purchase Agreement (“Runoff SPA”) would be amended to provide for the transfer of $7 million of additional assets to support the reserve charge. The Runoff SPA was instead revised to increase the cap on seller financing.
49
Esurance
During 2015 and 2014, White Mountains recognized $18 million and $3 million of net income from discontinued operations related to the final settlement with Allstate for favorable development on loss reserves transferred in the sale of Esurance and Answer Financial. Since the closing of the transaction through September 30, 2015, White Mountains received a net amount of $28 million from Allstate, primarily related to the favorable development on loss reserves.
II. Summary of Investment Results
White Mountains’s total operations investment results include continuing operations and discontinued operations. During the third quarter of 2015, White Mountains signed an agreement to sell Sirius Group, which closed on April 18, 2016. Sirius Group’s results inured to White Mountains through the closing date of the transaction.
During the third quarter of 2016, White Mountains established a portfolio of high-yield fixed maturity investments. Given the risk profile of these investments, White Mountains’s management believes that the returns associated with high-yield fixed maturity investments are more appropriately included with the returns from common equity securities and other long-term investments instead of with returns associated with short-term investments and investment grade fixed maturity investments. See
“NON-GAAP FINANCIAL MEASURES”
on page 64.
For purposes of discussing rates of return, all percentages are presented gross of management fees and trading expenses in order to produce a better comparison to benchmark returns, while all dollar amounts are presented net of management fees and trading expenses. A summary of White Mountains’s consolidated total operations’ pre-tax investment results, including the returns from discontinued operations, for the years ended December 31, 2016, 2015 and 2014 follows:
Gross investment returns and benchmark returns
|
Year Ended December 31,
|
|||||||||
|
2016
|
2015
|
2014
|
|||||||
|
Short-term investments
|
0.8
|
%
|
(0.9
|
)%
|
(2.0
|
)%
|
|||
|
Investment grade fixed maturity investments
|
2.6
|
%
|
0.3
|
%
|
0.9
|
%
|
|||
|
High-yield fixed maturity investments
|
1.0
|
%
|
N/A
|
|
N/A
|
|
|||
|
Total GAAP fixed income investments
(1)
|
2.4
|
%
|
0.2
|
%
|
0.5
|
%
|
|||
|
Bloomberg Barclays U.S. Intermediate Aggregate Index
|
2.0
|
%
|
1.2
|
%
|
4.1
|
%
|
|||
|
Common equity securities
|
6.2
|
%
|
33.2
|
%
|
7.5
|
%
|
|||
|
Other long-term investments
|
0.8
|
%
|
(10.1
|
)%
|
6.5
|
%
|
|||
|
Total GAAP common equity securities and other long-term investments
|
4.3
|
%
|
19.3
|
%
|
7.2
|
%
|
|||
|
Total common equity securities, other long-term investments and high-yield fixed maturity investments
|
4.0
|
%
|
19.3
|
%
|
7.2
|
%
|
|||
|
S&P 500 Index (total return)
|
12.0
|
%
|
1.4
|
%
|
13.7
|
%
|
|||
|
Total consolidated portfolio
|
2.7
|
%
|
3.6
|
%
|
1.9
|
%
|
|||
(1)
The impact of excluding high-yield fixed maturity investments from the GAAP fixed maturity investment returns was insignificant in 2016.
Investment Returns—Year Ended December 31, 2016 versus Year Ended December 31, 2015
White Mountains’s GAAP pre-tax total return on invested assets was 2.7% for 2016, which included 0.2% from foreign currency gains, compared to 3.6% for 2015, which included 0.9% from foreign currency losses. The 2015 results were primarily driven by $259 million in pre-tax unrealized investment gains recognized in the fourth quarter of 2015 resulting from the Symetra transaction. Excluding the results from Symetra, the GAAP total return on invested assets was -0.2% for 2015, which included 0.9% from foreign currency losses. White Mountains’s total operations after-tax net realized and unrealized investment gains were $2 million and $203 million for 2016 and 2015.
50
Fixed income results
White Mountains maintains a high quality, short-duration fixed income portfolio, as well as the recently established high-yield portfolio, which is discussed in the next section. As of December 31, 2016, the fixed income portfolio duration, including short-term investments but excluding high-yield fixed maturity investments, was approximately 2.6 years compared to 2.2 years as of December 31, 2015. Including both short-term investments and high-yield fixed maturity investments, duration was approximately 2.8 years as of December 31, 2016.
The increase in the fixed income portfolio’s duration was primarily a result of buying into the fourth-quarter bond market selloff and the establishment of a new medium duration British Pound Sterling (GBP) investment grade corporate bond mandate with Legal & General Investment Management, Ltd. (“LGIM”), a third party registered investment adviser, in October 2016. The duration of the LGIM portfolio was approximately 7.3 years as of December 31, 2016.
White Mountains entered into a foreign currency forward contract to manage its GBP foreign currency exposure relating to this new mandate. As of December 31, 2016, this contract had a total gross notional value of approximately $185 million (GBP 150 million). While White Mountains actively manages its overall foreign currency position, mismatches between movements in foreign currency rates and its foreign currency forward contract may result in foreign currency positions being outside pre-defined ranges and/or foreign currency losses. The results of White Mountains’s forward foreign currency contract is included in other long-term investments.
The fixed income portfolio returned 2.4% for 2016. In local currencies, the fixed income portfolio returned 2.1% for 2016, essentially in-line with the longer duration Bloomberg Barclays U.S. Intermediate Aggregate Index return of 2.0%. The fixed income portfolio returned 0.2% for 2015. In local currencies, the fixed income portfolio returned 1.1% for 2015, essentially in-line with the longer duration Bloomberg Barclays U.S. Intermediate Aggregate Index return of 1.2%.
Common equity securities, other long-term investments, and high-yield fixed maturity investments results
White Mountains maintains a portfolio of common equity securities, other long-term investments and high-yield fixed maturity investments. White Mountains’s management believes that prudent levels of investments in common equity securities, other long-term investments and high-yield fixed maturity investments are likely to enhance long-term after-tax total returns.
White Mountains’s portfolio of common equity securities, other long-term investments and high-yield fixed maturity investments represented approximately 20% and 23% of total GAAP invested assets as of December 31, 2016 and December 31, 2015. When reflecting the close of the Symetra sale on February 1, 2016 and the close of the Sirius Group sale on April 18, 2016, White Mountains’s portfolio of common equity securities and other long-term investments represented approximately 12% of total GAAP invested assets as of December 31, 2015.
White Mountains’s portfolio of common equity securities, other long-term investments and high-yield fixed maturity investments returned 4.0% for 2016, underperforming the S&P 500 Index return of 12.0%. The underperformance versus the S&P 500 Index return was primarily attributable to the overall conservative positioning of the risk asset portfolio, including the new high-yield mandate, which we do not expect to keep pace with strong up markets. The underperformance was also due to unfavorable results from publicly-traded common equity securities managed by third party investment advisers and pockets of poor performance in other long-term investments, including unfavorable results from private capital investments and private equity funds and non-controlling interests in private capital investments.
White Mountains’s portfolio of common equity securities and other long-term investments returned 19.3% for 2015. Excluding the results from Symetra, the portfolio of common equity securities and other long-term investments returned -1.8% for 2015, underperforming the S&P 500 Index return of 1.4%. The underperformance versus the S&P 500 Index return was primarily attributable to unfavorable mark-to-market adjustments to the OneBeacon Surplus Notes and unfavorable results from energy exposed private equity funds and a distressed hedge fund.
White Mountains’s portfolio of common equity securities returned 6.2% for 2016, underperforming the S&P 500 Index return of 12.0%. White Mountains’s portfolio of common equity securities returned 33.2% for 2015. Excluding the results from Symetra, the portfolio of common equity securities returned 2.9% for 2015, outperforming the S&P 500 Index return of 1.4%.
White Mountains invests in ETFs that seek to provide investment results that, before expenses, generally correspond to the performance of broad market indices. As of December 31, 2016 and December 31, 2015, White Mountains had approximately $322 million and $356 million invested in ETFs.
51
The following summarizes White Mountains’s investments in ETFs by exposure to each index:
|
Index
|
Market Value
|
Market Value
|
|||||
|
Millions
|
December 31, 2016
|
December 31, 2015
|
|||||
|
S&P 500
|
$
|
321.6
|
|
$
|
297.3
|
|
|
|
Russell 1000 Value
|
—
|
|
40.8
|
|
|||
|
Russell 1000
|
—
|
|
17.7
|
|
|||
|
Total
|
$
|
321.6
|
|
$
|
355.8
|
|
|
In 2016 and 2015, the ETFs essentially earned the effective index return, before expenses, over the period in which White Mountains was invested in each respective fund.
White Mountains has established relationships with third party registered investment advisers to actively manage publicly-traded common equity securities and convertibles. The largest of these relationships have been with Prospector Partners LLC (“Prospector”), Lateef and Silchester. During the second quarter of 2015, White Mountains instructed Prospector to liquidate its separate account portfolios and redeemed its investments in hedge funds managed by Prospector and reallocated a portion of the proceeds into ETFs. White Mountains has since terminated its investment management agreements with Prospector. White Mountains continues to have publicly-traded common equity securities actively managed by Lateef and Silchester.
The Lateef separate account is a highly concentrated portfolio of mid-cap and large-cap growth companies. Lateef is a growth at a reasonable price manager focused on investing in high return businesses at reasonable valuations. Lateef uses a bottom up, fundamental research-driven investment process that is focused on absolute returns, low turnover and a long-term investment horizon. As a highly concentrated portfolio of approximately 20 positions, relative performance to the S&P 500 Index return is often driven, positively or negatively, by individual positions, especially in the short-term. The Lateef separate account returned 1.2% for 2016, underperforming the S&P 500 Index return of 12.0%. The Lateef separate account returned 3.6% for 2015, outperforming the S&P 500 Index return of 1.4%.
White Mountains has an investment in the Calleva Trust, an open-ended unit trust established as an Undertaking for Collective Investment in Transferable Securities (“UCITS”) under the European Communities Regulations that is managed by Silchester. Silchester invests primarily in value-oriented non-U.S. equity securities. Silchester’s investment strategy focuses on companies with low market multiples of earnings, cash flow, asset value or dividends. In U.S. dollars, the Silchester portfolio returned 8.2% for 2016, underperforming the S&P 500 Index return of 12.0%. In local currencies, the Silchester portfolio returned 12.5% for 2016, outperforming the MCSI EAFE Index return of 5.3%. In U.S. dollars, the Silchester portfolio returned 1.2% for 2015, underperforming the S&P 500 Index return of 1.4%. In local currencies, the Silchester portfolio returned 6.5% for 2015, outperforming the MCSI EAFE Index return of 5.3%.
White Mountains maintains a portfolio of other long-term investments that consists primarily of hedge funds, private equity funds, various non-controlling interests in private capital investments, the OneBeacon Surplus Notes and various other investments. As of December 31, 2016, approximately 41% of these other long-term investments were in private equity funds, with a general emphasis on narrow, sector-focused funds, and hedge funds, with a general emphasis on long-short equity funds.
White Mountains’s other long-term investments portfolio returned 0.8% for 2016, underperforming the S&P 500 Index return of 12.0%. The portfolio’s underperformance versus the S&P 500 Index return was primarily attributable to write-downs in private equity funds and non-controlling interests in private capital investments partially offset by favorable mark-to-market adjustments to the OneBeacon Surplus Notes. White Mountains’s other long-term investments portfolio returned -10.1% for 2015, underperforming the S&P 500 Index return of 1.4%. The portfolio’s underperformance versus the S&P 500 Index return was primarily due to unfavorable mark-to-market adjustments to the OneBeacon Surplus Notes and write-downs in energy exposed private equity funds and a distressed hedge fund.
During the third quarter of 2016, White Mountains established a new relationship with Principal Global Investors, LLC (“Principal”), a third party registered investment adviser, to manage a relatively concentrated portfolio of high-yield fixed maturity investments. The Principal portfolio is invested in issuers of U.S. dollar denominated publicly traded and 144A debt securities issued by corporations with generally at least one rating between "B-" and “BB+” inclusive by Standard and Poor's or similar ratings from other rating agencies. The fair value of the high-yield fixed maturity investments was $275.3 million as of December 31, 2016. The duration of the Principal portfolio was approximately 4.9 years as of December 31, 2016. From its inception in late July through the end of 2016, the high-yield fixed maturity investments returned 1.0%, underperforming the S&P 500 Index return of 4.3% over the comparable period.
52
Investment Returns—Year Ended December 31, 2015 versus Year Ended December 31, 2014
White Mountains’s GAAP pre-tax total return on invested assets was 3.6% for 2015, compared to 1.9% for 2014. The 2015 results were primarily driven by $259 million in pre-tax unrealized investment gains recognized in the fourth quarter of 2015 resulting from the Symetra transaction. The 2015 and 2014 returns included 0.9% and 1.9% of foreign currency losses. Excluding the results from Symetra, the GAAP total return on invested assets was -0.2% for 2015. White Mountains’s total operations after tax realized and unrealized investment gains were $203 million and $214 million for 2015 and 2014.
Fixed income results
As of December 31, 2015, the fixed income portfolio duration, including short-term investments, was approximately 2.2 years compared to 2.0 years as of December 31, 2014.
The fixed income portfolio returned 0.2% for 2015. In local currencies, the fixed income portfolio returned 1.1% for 2015, which was essentially in-line with the longer duration Bloomberg Barclays U.S. Intermediate Aggregate Index return of 1.2%. The fixed income portfolio returned 0.5% for 2014. In local currencies, the fixed income portfolio returned 2.7% for 2014, underperforming the longer duration Bloomberg Barclays U.S. Intermediate Aggregate Index return of 4.1%. The portfolio’s short duration positioning contributed to the underperformance versus the longer duration Bloomberg Barclays U.S. Intermediate Aggregate Index return as interest rates fell in 2014.
Common equity securities and other long-term investments results
White Mountains’s portfolio of common equity securities and other long-term investments represented approximately 23% and 18% of GAAP invested assets as of December 31, 2015 and December 31, 2014.
The portfolio of common equity securities and other long-term investments returned 19.3% for 2015. Excluding the results from Symetra, the portfolio of common equity securities and other long-term investments returned -1.8% for 2015, underperforming the S&P 500 Index return of 1.4%. The underperformance versus the S&P 500 Index return was primarily due to unfavorable mark-to-market adjustments to the OneBeacon Surplus Notes and unfavorable results from energy exposed private equity funds and a distressed hedge fund. The portfolio of common equity securities and other long-term investments returned 7.2% for 2014, underperforming the S&P 500 Index return of 13.7%.
White Mountains’s portfolio of common equity securities returned 33.2% for 2015. Excluding the results from Symetra, the portfolio of common equity securities returned 2.9% for 2015, outperforming the S&P 500 Index return of 1.4%. White Mountains’s portfolio of common equity securities returned 7.5% for 2014, underperforming the S&P 500 Index return of 13.7%.
During the second quarter of 2015, White Mountains instructed Prospector to liquidate its separate account portfolios and reallocated a portion of the proceeds into ETFs. In 2015, the ETFs earned the effective market return, before expenses, over the period in which White Mountains was invested in each broad market fund.
The Lateef separate account, which consists of a highly concentrated portfolio where relative performance to the S&P 500 Index return is often driven, positively or negatively, by individual positions returned 3.6% for 2015, outperforming the S&P 500 Index return of 1.4%. The Lateef separate account returned 6.5% for 2014, underperforming the S&P 500 Index return of 13.7%.
White Mountains’s investment in the Calleva Trust, which is managed by Silchester and invests primarily in value-oriented non-U.S. equity securities returned 1.2% in U.S. dollars for 2015, underperforming the S&P 500 Index return of 1.4%. In local currency, the Silchester portfolio returned 6.5% for 2015, outperforming the MCSI EAFE Index return of 5.3%. The Silchester portfolio returned -1.7% in U.S. dollars for 2014, underperforming the S&P 500 Index return of 13.7%. In local currencies, the Silchester portfolio returned 8.6% for 2014, outperforming the MCSI EAFE Index return of 5.9%
White Mountains’s other long-term investment portfolio returned -10.1% for 2015, underperforming the S&P 500 Index return of 1.4%. The portfolio’s underperformance versus the S&P 500 Index return was primarily due to unfavorable mark-to-market adjustments to the OneBeacon Surplus Notes and write-downs in energy exposed private equity funds and a distressed hedge fund. For 2014, the other long-term investments portfolio returned 6.5%, underperforming the S&P 500 Index return of 13.7%.
53
Portfolio Composition
The following table presents the composition of White Mountains’s total operations investment portfolio as of
December 31, 2016 and 2015
:
|
As of December 31, 2016
|
As of December 31, 2015
|
|||||||||||||
|
$ in millions
|
Carrying
value
|
% of total
|
Carrying
value
|
% of total
|
||||||||||
|
Fixed maturity investments
|
$
|
4,256.8
|
|
79.7
|
%
|
$
|
5,013.7
|
|
69.1
|
%
|
||||
|
Short-term investments
|
287.1
|
|
5.4
|
|
563.3
|
|
7.8
|
|
||||||
|
Common equity securities
|
474.3
|
|
8.9
|
|
1,288.3
|
|
17.8
|
|
||||||
|
Other long-term investments
|
323.3
|
|
6.0
|
|
388.0
|
|
5.3
|
|
||||||
|
Total investments
|
$
|
5,341.5
|
|
100
|
%
|
$
|
7,253.3
|
|
100
|
%
|
||||
The breakdown of White Mountains’s fixed maturity investment as of
December 31, 2016
by credit class, based upon issue credit ratings provided by Standard & Poor’s, or if unrated by Standard & Poor’s, long term obligation ratings provided by Moody’s, is as follows:
|
As of December 31, 2016
|
||||||||||||||
|
$ in millions
|
Amortized
cost
|
% of total
|
Carrying
Value
|
% of total
|
||||||||||
|
U.S. government and government-sponsored entities
(1)
|
$
|
938.3
|
|
22.0
|
%
|
$
|
930.2
|
|
21.9
|
%
|
||||
|
AAA/Aaa
|
991.3
|
|
23.2
|
|
987.7
|
|
23.2
|
|
||||||
|
AA/Aa
|
677.9
|
|
15.9
|
|
678.2
|
|
15.9
|
|
||||||
|
A/A
|
520.0
|
|
12.2
|
|
520.9
|
|
12.2
|
|
||||||
|
BBB/Baa
|
835.2
|
|
19.6
|
|
838.5
|
|
19.7
|
|
||||||
|
BB
|
219.5
|
|
5.1
|
|
217.0
|
|
5.1
|
|
||||||
|
B
|
29.9
|
|
.7
|
|
30.0
|
|
.7
|
|
||||||
|
Other/not rated
|
53.9
|
|
1.3
|
|
54.3
|
|
1.3
|
|
||||||
|
Total fixed maturity investments
|
$
|
4,266.0
|
|
100
|
%
|
$
|
4,256.8
|
|
100
|
%
|
||||
|
(1)
|
Includes mortgage-backed securities, which carry the full faith and credit guaranty of the U.S. government (i.e., GNMA) or are guaranteed by a government sponsored entity (i.e., FNMA, FHLMC).
|
The cost or amortized cost and carrying value of White Mountains’s fixed maturity investments as of
December 31, 2016
is presented below by contractual maturity. Actual maturities could differ from contractual maturities because certain borrowers may call or prepay their obligations with or without call or prepayment penalties.
|
As of December 31, 2016
|
||||||||
|
Millions
|
Amortized
cost
|
Carrying
Value
|
||||||
|
Due in one year or less
|
$
|
212.8
|
|
$
|
213.3
|
|
||
|
Due after one year through five years
|
1,272.6
|
|
1,270.2
|
|
||||
|
Due after five years through ten years
|
462.8
|
|
458.4
|
|
||||
|
Due after ten years
|
167.8
|
|
168.0
|
|
||||
|
Mortgage and asset-backed securities
|
2,141.7
|
|
2,132.9
|
|
||||
|
Preferred stocks
|
8.3
|
|
14.0
|
|
||||
|
Total fixed maturity investments
|
$
|
4,266.0
|
|
$
|
4,256.8
|
|
||
54
Foreign Currency Translation
The majority of White Mountains’s exposure to foreign currency exchange rate risk was eliminated when Sirius Group was sold to CMI on April 18, 2016. As of December 31, 2016, White Mountains’s remaining gross foreign currency exchange rate risk was approximately $291 million and relates to cash and fixed income securities denominated in GBP, common equity securities managed by Silchester, Wobi and various other consolidated and non-controlling interests in private capital investments. In 2016, White Mountains entered into a foreign currency forward contract to economically hedge the GBP foreign currency exposure in its LGIM portfolio. At December 31, 2016, the fair value of the LGIM portfolio, including cash, was approximately $184 million and White Mountains held
$185 million
(GBP
150 million
) total gross notional value of a foreign currency forward contract, with a fair value of approximately $186 million. At December 31, 2016, White Mountains’s net foreign currency exchange rate risk was approximately $105 million.
Investment in Symetra Common Shares
During the third quarter of 2015, Symetra announced that it entered into a merger agreement with Sumitomo Life pursuant to which Sumitomo Life would acquire all of the outstanding shares of Symetra. Following the announcement and Symetra shareholders’ November 5, 2015 meeting to approve the transaction, White Mountains relinquished its representation on Symetra’s board of directors. As a result, White Mountains changed its accounting for Symetra common shares from the equity method to fair value. The carrying value per Symetra share used in the calculation of White Mountains’s adjusted book value per share was $31.77 at December 31, 2015. On February 1, 2016, Symetra closed its merger agreement with Sumitomo Life and White Mountains received proceeds of $658 million, or $32 per common share. White Mountains recognized $5 million in pre-tax net investment gains associated with Symetra during 2016.
Symetra’s total revenues and net income through September 30, 2015 were $1.6 billion and $90 million. As of September 30, 2015, Symetra had total assets of $35.0 billion and shareholders’ equity of $3.1 billion. Symetra’s total revenues and net income for the year ended December 31, 2014 was $2.2 billion and $254 million. Since inception, White Mountains received a total of $149 million in cash dividends recorded as a reduction of White Mountains investment in Symetra under the equity method. White Mountains received a cash dividend of $2 million in the fourth quarter of 2015 recorded within net investment income.
LIQUIDITY AND CAPITAL RESOURCES
Operating Cash and Short-term Investments
Holding company level.
The primary sources of cash for the Company and certain of its intermediate holding companies are expected to be distributions and tax sharing payments received from its insurance and other operating subsidiaries, capital raising activities, net investment income, proceeds from sales and maturities of investments and, from time to time, proceeds from the sales of operating subsidiaries. The primary uses of cash are expected to be repurchases of the Company’s common shares, payments on and repurchases/retirements of its debt obligations, dividend payments to holders of the Company’s common shares and to non-controlling interest holders of OneBeacon Ltd.’s common shares, distributions to non-controlling interest holders of other consolidated subsidiaries, purchases of investments, payments to tax authorities, contributions to operating subsidiaries, operating expenses and, from time to time, purchases of operating subsidiaries.
Operating subsidiary level.
The primary sources of cash for White Mountains’s insurance and other operating subsidiaries are expected to be premium and fee collections, net investment income, proceeds from sales and maturities of investments, contributions from holding companies, capital raising activities and, from time to time, proceeds from the sales of operating subsidiaries. The primary uses of cash are expected to be claim payments, policy acquisition costs, purchases of investments, payments on and repurchases/retirements of its debt obligations, distributions and tax sharing payments made to holding companies, distributions to non-controlling interest holders, operating expenses and, from time to time, purchases of operating subsidiaries.
Both internal and external forces influence White Mountains’s financial condition, results of operations and cash flows. Claim settlements, premium levels and investment returns may be impacted by changing rates of inflation and other economic conditions. In many cases, significant periods of time, sometimes several years or more, may lapse between the occurrence of an insured loss, the reporting of the loss to White Mountains and the settlement of the liability for that loss. The exact timing of the payment of claims and benefits cannot be predicted with certainty. White Mountains’s insurance subsidiaries maintain portfolios of invested assets with varying maturities and a substantial amount of cash and short-term investments to provide adequate liquidity for the payment of claims.
Management believes that White Mountains’s cash balances, cash flows from operations, routine sales and maturities of investments and the liquidity provided by White Mountains’s revolving credit facility (the “WTM Bank Facility”), OneBeacon’s revolving credit facility (the “OneBeacon Bank Facility”) and other revolving credit facilities are adequate to meet expected cash requirements for the foreseeable future on both a holding company and insurance subsidiary level.
55
Dividend Capacity
Under the insurance laws of the states and jurisdictions that White Mountains’s insurance subsidiaries are domiciled, an insurer is restricted with respect to the timing and the amount of dividends it may pay without prior approval by regulatory authorities. Accordingly, there can be no assurance regarding the amount of such dividends that may be paid by such subsidiaries in the future. Following is a description of the dividend capacity of White Mountains’s insurance and other operating subsidiaries:
OneBeacon:
OneBeacon’s top-tier regulated U.S. insurance subsidiary, Atlantic Specialty Insurance Company (“ASIC”), has the ability to pay dividends to its immediate parent without the prior approval of regulatory authorities in an amount set by formula based on the lesser of (i) adjusted net investment income, as defined by statute, or (ii) 10% of statutory surplus, in both cases as most recently reported to regulatory authorities, subject to the availability of earned surplus. Based upon the formula described above, as of December 31, 2016, ASIC had the ability to pay
$11 million
of dividends without prior approval of regulatory authorities. When taking into consideration the rolling 12-month portion of this statutorily-defined calculation, including
adjusted net investment income, and the timing of dividends paid, OneBeacon anticipates that ASIC will have the ability to pay dividends of approximately $30 million during 2017. As of
December 31, 2016
, ASIC had
$625 million
of statutory surplus and
$69 million
of earned surplus. During 2016, ASIC paid
$27 million
of dividends to its immediate parent.
In 2017, Split Rock has the ability to distribute statutory capital without the prior approval of the BMA, provided it does not reduce its total statutory capital, as shown in the previous year’s statutory financial statements, by 15% or more.
In addition, Split Rock has the ability to pay dividends without the prior notification of regulatory authorities of up to 25% of its previous financial year’s total statutory capital and surplus, subject to meeting all appropriate liquidity and solvency requirements as specified in the Insurance Act of 1978 and the Companies Act of 1981. As of December 31, 2016, Split Rock had
$210 million
of statutory capital and
$60 million
of statutory surplus for total statutory capital and surplus of
$270 million
.
Based upon the limitations described above, Split Rock currently has the ability to distribute up to
$32 million
of statutory capital and pay up to
$60 million
of dividends during 2017 without the prior approval of regulatory authorities. During 2016, Split Rock paid
$25 million
of dividends to its immediate parent.
During
2016
, OneBeacon’s unregulated insurance subsidiaries paid
$6 million
of dividends to their immediate parent. As of
December 31, 2016
, OneBeacon’s unregulated insurance subsidiaries had
$56 million
of net unrestricted cash, short-term investments and fixed maturity investments and
$72 million
of other long-term investments, consisting of the OneBeacon Surplus Notes.
During
2016
, OneBeacon Ltd. paid
$79 million
of regular quarterly dividends to its common shareholders. White Mountains received
$60 million
of these dividends.
As of
December 31, 2016
, OneBeacon Ltd. and its intermediate holding companies had
$65 million
of net unrestricted cash, short-term investments and fixed maturity investments and
$12 million
of common equity securities outside of its regulated and unregulated insurance subsidiaries.
HG Global/BAM:
As of
December 31, 2016
, HG Global had
$619 million
face value of preferred shares outstanding, of which White Mountains owned
96.9%
. Holders of the HG Global preferred shares receive cumulative dividends at a fixed annual rate of
6.0%
on a quarterly basis, when and if declared by HG Global. HG Global did not declare or pay any preferred dividends in 2016. As of
December 31, 2016
, HG Global has accrued
$186 million
of dividends payable to holders of its preferred shares,
$180 million
of which is payable to White Mountains and eliminated in consolidation.
HG Re is a Special Purpose Insurer subject to regulation and supervision by the BMA, but does not require regulatory approval to pay dividends. However, HG Re’s dividend capacity is limited to amounts held outside of the collateral trusts pursuant to the FLRT with BAM. As of
December 31, 2016
, HG Re had statutory capital and surplus of
$467 million
, of which
$465 million
was held in the collateral trusts pursuant to the FLRT with BAM.
56
Effective January 1, 2014, HG Global and BAM agreed to change the interest rate on the BAM Surplus Notes for the five years ending December 31, 2018 from a fixed rate of 8.0% to a variable rate equal to the one-year U.S. treasury rate plus 300 basis points, set annually, which was
3.54%
for 2016 and is
3.78%
for 2017. Prior to the end of 2018, BAM has the option to extend the variable rate period for an additional three years. At the end of the variable rate period, the interest rate will be fixed at the higher of the then current variable rate or 8.0%. BAM is required to seek regulatory approval to pay interest and principal on the BAM Surplus Notes only when adequate capital resources have accumulated beyond BAM’s initial capitalization and a level that continues to support its outstanding obligations, business plan and ratings. BAM did not pay any interest on the BAM Surplus Notes in 2016.
Other Operations:
During
2016
, WM Advisors did not pay any dividends to its immediate parent. As of
December 31, 2016
, WM Advisors had
$18 million
of net unrestricted cash, short-term investments and fixed maturity investments.
During
2016
, White Mountains paid a
$5 million
common share dividend. As of
December 31, 2016
, the Company and its intermediate holding companies had
$1,655 million
of net unrestricted cash, short-term investments and fixed maturity investments,
$286 million
of common equity securities and
$67 million
of other long-term investments included in its Other Operations segment.
Insurance Float
Insurance float is an important aspect of White Mountains’s insurance operations. Insurance float represents funds that an insurance company holds for a limited time. In an insurance operation, float arises because premiums are collected before losses are paid. This interval can extend over many years. During that time, the insurer invests the funds. When the premiums that an insurer collects do not cover the losses and expenses it eventually must pay, the result is an underwriting loss, which can be considered as the cost of insurance float. One manner to calculate insurance float is to take insurance liabilities and subtract insurance assets. Although insurance float can be calculated using numbers determined under GAAP, insurance float is not a GAAP concept and, therefore, there is no comparable GAAP measure.
Insurance float can increase in a number of ways, including through acquisitions of insurance operations, organic growth in existing insurance operations and recognition of losses that do not immediately cause a corresponding reduction in investment assets. Conversely, insurance float can decrease in a number of other ways, including sales of insurance operations, shrinking or runoff of existing insurance operations, the acquisition of operations that do not have substantial investment assets (e.g., an agency) and the recognition of gains that do not cause a corresponding increase in investment assets. It is White Mountains’s intention to generate low-cost float over time through a combination of acquisitions and organic growth in its existing insurance operations. However, White Mountains seeks to increase overall profitability, which sometimes reduces insurance float, such as in the Sirius Group transaction.
Certain operational leverage metrics can be measured with ratios that are calculated using insurance float. There are many activities that do not change the amount of insurance float at an insurance company but can have a significant impact on the company’s operational leverage metrics. For example, investment gains and losses, foreign currency gains and losses, debt issuances and repurchases/retirements, common and preferred share issuances and repurchases and dividends paid to shareholders are all activities that do not change insurance float but that can meaningfully impact operational leverage metrics that are calculated using insurance float.
57
The following table illustrates White Mountains’s consolidated insurance float position as of
December 31, 2016 and 2015
:
|
December 31,
|
||||||||||||||||
|
2016
|
2015
|
|||||||||||||||
|
$ in millions
|
Continuing Operations
|
Continuing Operations
|
Sirius
Group
(1)
|
Total
|
||||||||||||
|
Loss and LAE reserves
|
$
|
1,365.6
|
|
$
|
1,389.8
|
|
$
|
1,644.4
|
|
$
|
3,034.2
|
|
||||
|
Unearned insurance and reinsurance premiums
|
658.0
|
|
610.5
|
|
342.2
|
|
952.7
|
|
||||||||
|
Ceded reinsurance payable
|
17.0
|
|
24.9
|
|
67.1
|
|
92.0
|
|
||||||||
|
Funds held under insurance and reinsurance contracts
|
153.0
|
|
137.8
|
|
52.9
|
|
190.7
|
|
||||||||
|
Deferred tax on safety reserve
|
—
|
|
—
|
|
279.2
|
|
279.2
|
|
||||||||
|
Insurance liabilities
|
2,193.6
|
|
2,163.0
|
|
2,385.8
|
|
4,548.8
|
|
||||||||
|
Cash in regulated insurance and reinsurance subsidiaries
|
$
|
13.6
|
|
$
|
43.9
|
|
$
|
129.2
|
|
$
|
173.1
|
|
||||
|
Reinsurance recoverable on paid and unpaid losses
|
179.5
|
|
193.5
|
|
293.3
|
|
486.8
|
|
||||||||
|
Insurance and reinsurance premiums receivable
|
229.9
|
|
220.3
|
|
323.6
|
|
543.9
|
|
||||||||
|
Funds held by ceding entities
|
—
|
|
—
|
|
90.6
|
|
90.6
|
|
||||||||
|
Deferred acquisition costs
|
106.9
|
|
107.6
|
|
74.6
|
|
182.2
|
|
||||||||
|
Ceded unearned insurance and reinsurance premiums
|
44.2
|
|
29.5
|
|
87.7
|
|
117.2
|
|
||||||||
|
Insurance assets
|
574.1
|
|
594.8
|
|
999.0
|
|
1,593.8
|
|
||||||||
|
Insurance float
|
$
|
1,619.5
|
|
$
|
1,568.2
|
|
$
|
1,386.8
|
|
$
|
2,955.0
|
|
||||
|
Insurance float as a multiple of total capital
|
0.4x
|
|
0.3x
|
|
N/A
|
0.6x
|
|
|||||||||
|
Insurance float as a multiple of White Mountains’s common shareholders’ equity
|
0.4x
|
|
0.4x
|
|
N/A
|
0.8x
|
|
|||||||||
(1)
Included in Net Assets Held for Sale. See
Note 22—“Held for Sale and Discontinued Operations”
on page F-87.
During
2016
, insurance float from continuing operations increased by $51 million, primarily due to an increase of unrestricted collateral held related to OneBeacon’s surety business.
Financing
The following table summarizes White Mountains’s capital structure as of
December 31, 2016 and 2015
:
|
December 31,
|
||||||||
|
$ in millions
|
2016
|
2015
|
||||||
|
WTM Bank Facility
|
$
|
—
|
|
$
|
50.0
|
|
||
|
OneBeacon Bank Facility
|
—
|
|
—
|
|
||||
|
OBH Senior Notes, carrying value
|
273.2
|
|
272.9
|
|
||||
|
MediaAlpha Bank Facility, carrying value
|
12.7
|
|
14.7
|
|
||||
|
Total debt in continuing operations
|
285.9
|
|
337.6
|
|
||||
|
Total debt in discontinued operations
(1)
|
—
|
|
506.4
|
|
||||
|
Total debt
|
285.9
|
|
844.0
|
|
||||
|
Non-controlling interest - OneBeacon Ltd.
|
244.6
|
|
245.6
|
|
||||
|
Non-controlling interest - SIG Preference Shares
|
—
|
|
250.0
|
|
||||
|
Non-controlling interests - other, excluding mutuals and reciprocals
|
35.8
|
|
115.2
|
|
||||
|
Total White Mountains’s common shareholders’ equity
|
3,603.3
|
|
3,913.2
|
|
||||
|
Total capital
|
4,169.6
|
|
5,368.0
|
|
||||
|
Total debt to total capital
|
7
|
%
|
16
|
%
|
||||
|
(1)
|
See
Note 22 - “Held for Sale and Discontinued Operations”
on page F-87.
|
58
Management believes that White Mountains has the flexibility and capacity to obtain funds externally as needed through debt or equity financing on both a short-term and long-term basis. However, White Mountains can provide no assurance that, if needed, it would be able to obtain additional debt or equity financing on satisfactory terms, if at all.
White Mountains has an unsecured revolving credit facility with a syndicate of lenders administered by Wells Fargo Bank, N.A., which has a total commitment of $425 million and a maturity date of August 14, 2018. During 2016, White Mountains borrowed
$350 million
and repaid
$400 million
under the WTM Bank Facility. As of December 31, 2016, the WTM Bank Facility was undrawn.
On September 29, 2015, OneBeacon Ltd. and OBH, as co-borrowers and co-guarantors, entered into a revolving credit facility administered by U.S. Bank N.A. and also including BMO Harris Bank N.A., which has a total commitment of $65 million and has a maturity date of September 29, 2019. As of December 31, 2016 the OneBeacon Bank Facility was undrawn.
The WTM and OneBeacon Bank Facilities contain various affirmative, negative and financial covenants that White Mountains considers to be customary for such borrowings, including certain minimum net worth and maximum debt to capitalization standards. These covenants can restrict White Mountains in several ways, including its ability to incur additional indebtedness. An uncured breach of these covenants could result in an event of default under the WTM or OneBeacon Bank Facilities, which would allow lenders to declare any amounts owed under the WTM or OneBeacon Bank Facilities to be immediately due and payable. In addition, a default under the WTM or OneBeacon Bank Facilities could occur if certain of White Mountains’s subsidiaries fail to pay principal and interest on a credit facility, mortgage or similar debt agreement (collectively, “covered debt”), or fail to otherwise comply with obligations in such covered debt agreements where such a default gives the holder of the covered debt the right to accelerate at least $75 million of principal amount of covered debt.
On July 23, 2015, MediaAlpha entered into a credit facility with Opus Bank, which has a total commitment of $20 million and has a maturity date of July 23, 2019 (the “MediaAlpha Bank Facility”). The MediaAlpha Bank Facility consists of a $15 million term loan facility, which had a principal balance of approximately $13 million as of December 31, 2016, and a $5 million revolving credit facility, which was undrawn as of December 31, 2016.
The MediaAlpha Bank Facility is secured by the intellectual property and the common stock of MediaAlpha's subsidiaries and contains various affirmative, negative and financial covenants which White Mountains considers to be customary for such borrowings, including a maximum leverage ratio. The MediaAlpha Bank Facility carries a variable interest rate, based on the U.S. dollar LIBOR rate.
In November 2012, OBH issued $275 million face value of senior unsecured debt through a public offering, at an issue price of 99.9% (the “OBH Senior Notes”). The net proceeds from the issuance of the OBH Senior Notes were used to repurchase OBH’s previously issued senior notes. The OBH Senior Notes, which are fully and unconditionally guaranteed as to the payment of principal and interest by OneBeacon Ltd., bear an annual interest rate of 4.60%, payable semi-annually in arrears on May 9 and November 9, until maturity on November 9, 2022.
The OBH Senior Notes were issued under indentures that contain restrictive covenants which, among other things, limit the ability of OneBeacon Ltd., OBH and their respective subsidiaries to create liens and enter into sale and leaseback transactions and limits the ability of OneBeacon Ltd. and OBH to consolidate, merge or transfer its properties and assets. The indentures do not contain any financial ratios or specified levels of net worth or liquidity to which OneBeacon Ltd. or OBH must adhere. In addition, a failure by OneBeacon Ltd. or OBH or their respective subsidiaries to pay principal and interest on covered debt, where such failure results in the acceleration of at least $75 million of principal amount of covered debt, could trigger the acceleration of the OBH Senior Notes.
It is possible that, in the future, one or more of the rating agencies may lower White Mountains’s existing ratings. If one or more of its ratings were lowered, White Mountains could incur higher borrowing costs on future borrowings and its ability to access the capital markets could be impacted.
Covenant Compliance
At December 31, 2016, White Mountains was in compliance with all of the covenants under all of its debt instruments and expects to remain in compliance for the foreseeable future.
59
Contractual Obligations and Commitments
Below is a schedule of White Mountains’s material contractual obligations and commitments as of
December 31, 2016
:
|
Millions
|
Due in
Less Than
One Year
|
Due in
One to Three
Years
|
Due in
Three to Five
Years
|
Due After
Five
Years
|
Total
|
|||||||||||||||
|
Loss and LAE reserves
(1)(3)
|
$
|
499.8
|
|
$
|
508.0
|
|
$
|
187.1
|
|
$
|
170.7
|
|
$
|
1,365.6
|
|
|||||
|
Debt
|
5.0
|
|
7.9
|
|
—
|
|
275.0
|
|
287.9
|
|
||||||||||
|
Interest on debt
|
13.2
|
|
25.7
|
|
25.3
|
|
12.6
|
|
76.8
|
|
||||||||||
|
Long-term incentive compensation
|
30.9
|
|
81.2
|
|
1.8
|
|
3.2
|
|
117.1
|
|
||||||||||
|
Pension and other benefit plan obligations
(2)
|
10.7
|
|
6.5
|
|
6.2
|
|
25.9
|
|
49.3
|
|
||||||||||
|
Operating leases
|
10.6
|
|
17.1
|
|
11.7
|
|
22.3
|
|
61.7
|
|
||||||||||
|
Total contractual obligations and commitments
|
$
|
570.2
|
|
$
|
646.4
|
|
$
|
232.1
|
|
$
|
509.7
|
|
$
|
1,958.4
|
|
|||||
|
(1)
|
Represents expected future cash outflows resulting from loss and LAE payments. The amounts presented are gross of reinsurance recoverables on unpaid losses of
$173
and net of the discount on OneBeacon’s workers compensation loss and LAE reserves of
$2
as of
December 31, 2016
.
|
|
(2)
|
Includes expected future cash outflows under OneBeacon’s non-qualified, non-contributory, defined benefit pension plan and 401(k) savings and employee stock ownership plan. OneBeacon’s pension plans were curtailed in 2002. See
|
|
(3)
|
Excludes amount related to SSIE. See
Note 22 — “Held for Sale and Discontinued Operations”
on page F-87.
|
White Mountains’s loss reserves do not have contractual maturity dates. However, based on historical payment patterns, the preceding table includes an estimate of when management expects White Mountains’s loss reserves to be paid. The timing of claim payments is subject to significant uncertainty. White Mountains maintains a portfolio of marketable investments with varying maturities and a substantial amount of short-term investments to provide adequate liquidity for the payment of claims.
The balances included in the table above regarding White Mountains’s long-term incentive compensation plans include amounts payable for performance shares and units, as well as deferred compensation balances. Exact amounts to be paid for performance shares cannot be predicted with certainty, as the ultimate amounts of these liabilities are based on the future performance of White Mountains and in some cases the market price of the Company’s and OneBeacon Ltd.’s common shares at the time the payments are made.
The estimated payments reflected in the table are based on current accrual factors (including performance relative to targets and common share price) and assume that all outstanding balances were 100% vested as of
December 31, 2016
.
There are no provisions within White Mountains’s operating leasing agreements that would trigger acceleration of future lease payments. The capital lease that OneBeacon entered into in conjunction with the sale-leaseback of certain of OneBeacon’s fixed assets and capitalized software contains provisions that could trigger an event of default, including a failure to make payments when due under the capital lease. If an event of default were to occur, the lessor would have a number of remedies available including the acceleration of future lease payments or the possession of the property covered under the lease agreement.
White Mountains does not finance its operations through the securitization of its trade receivables, through special purpose entities or through synthetic leases. Further, White Mountains has not entered into any material arrangements requiring it to guarantee payment of third-party debt or lease payments or to fund losses of an unconsolidated special purpose entity.
White Mountains also has future binding commitments to fund certain other long-term investments. These commitments, which total approximately
$138 million
, do not have fixed funding dates and are therefore excluded from the table above.
60
Share Repurchase Programs
The Company:
White Mountains’s board of directors has authorized the Company to repurchase its common shares, from time to time, subject to market conditions. The repurchase authorizations do not have a stated expiration date. As of February 27, 2017, White Mountains may purchase an additional 878,130 shares under the board authorizations. In addition, from time to time White Mountains has also repurchased its common shares through tender offers that were separately approved by its board of directors.
The following table presents common shares repurchased by the Company, as well as the average price per share as a percent of adjusted book value per share. For 2015, the table also presents the average price per share as a percent of adjusted book value per share, including the estimated gain from the Sirius Group sale of $84 per share as of December 31, 2015 that was reported in the Company’s 2015 Form 10-K.
|
Average price per share as % of
|
|||||||||||||||
|
Adjusted book
|
|||||||||||||||
|
Average
|
value per share,
|
||||||||||||||
|
Shares
|
Cost
|
price
|
Adjusted book
|
including estimated
|
|||||||||||
|
Dates
|
Repurchased
|
(millions)
|
per share
|
value per share
|
gain from Sirius sale
|
||||||||||
|
Year ended December 31, 2016
|
1,106,145
|
|
$
|
887.2
|
|
$
|
802.08
|
|
101%
|
N/A
|
|||||
|
Year ended December 31, 2015
|
387,495
|
|
$
|
284.2
|
|
$
|
733.37
|
|
105%
|
94%
|
|||||
|
Year ended December 31, 2014
|
217,879
|
|
$
|
134.5
|
|
$
|
617.29
|
|
93%
|
N/A
|
|||||
OneBeacon
In 2007, OneBeacon’s board authorized management to repurchase up to $200 million of OneBeacon’s Class A common shares from time to time, subject to market conditions. Shares may be repurchased on the open market or through privately negotiated transactions. This authorization does not have a stated expiration date. Since the inception of this authorization, OneBeacon has repurchased and retired 6.7 million of its Class A common shares. During 2016, OneBeacon repurchased and retired
850,349
of its common shares under the share repurchase authorization for
$11 million
at an average share price of $12.42. During 2015, OneBeacon repurchased and retired 166,368 of its common shares under the share repurchase authorization for $2 million at an average price of $12.62. During 2014, no shares were repurchased under the share repurchase authorization. The amount of authorization remaining is $75 million as of December 31, 2016.
Cash Flows
Detailed information concerning White Mountains’s cash flows during
2016, 2015 and 2014
follows:
Cash flows from continuing operations for the years ended
2016, 2015 and 2014
Net cash flows (used for) provided from continuing operations was
$(131) million
,
$120 million
and
$70 million
for the years ended
2016, 2015 and 2014
. The decrease in cash flow from continuing operations in 2016 relative to 2015 was driven by (i) a decrease at OneBeacon, due primarily to lower collateral received from its Surety business and amounts received in conjunction with exiting its Crop business, lower premium collections, higher incentive compensation payments and a large claim payment at the end of 2016 (which is expected to be mostly offset in 2017 by a recovery under reinsurance and corporate insurance policies, (ii) the settlement of certain liabilities and transaction costs in connection with the sales of Sirius Group and Tranzact, and (iii) an increase in incentive compensation payments in the Other Operations segment in 2016 relative to 2015. Cash flows from continuing operations increased $79 million in 2015 compared to 2014 primarily due to increased cash collateral received from OneBeacon’s Surety business and from higher amounts of cash provided by WTM Life Re from the sale and settlement of derivative instruments as its business ran off. White Mountains does not believe that these trends will have a meaningful impact on its future liquidity or its ability to meet its future cash requirements.
61
Other items affecting cash flows from operations:
White Mountains made long-term incentive payments totaling $50 million, $36 million and $38 million during 2016, 2015 and 2014.
OneBeacon paid a total of $13 million of interest on the OBH Senior Notes during each of 2016, 2015 and 2014.
Cash flows from investing and financing activities for the year ended December 31, 2016
Financing and Other Capital Activities
During 2016, the Company declared and paid a
$5 million
cash dividend to its common shareholders.
During 2016, the Company repurchased and retired
1,106,145
of its common shares for
$887 million
, which included 8,022 common shares repurchased under employee benefit plans.
During 2016, the Company borrowed a total of
$350 million
and repaid a total of
$400 million
under the WTM Bank Facility.
During 2016, OneBeacon Ltd. declared and paid
$79 million
of cash dividends to its common shareholders. White Mountains received a total of
$60 million
of these dividends.
During 2016, OneBeacon Ltd. repurchased and retired
850,349
shares of its Class A common stock for
$11 million
.
During 2016, HG Global raised $6 million of additional capital through the issuance of preferred shares, 97% of which were purchased by White Mountains. HG Global used $3 million of the proceeds to repay and cancel an internal credit facility with White Mountains.
During 2016, BAM received $38 million in Member Surplus Contributions.
During 2016, MediaAlpha paid $3 million of dividends, of which $2 million was paid to White Mountains. During 2016, MediaAlpha repaid $2 million of the term loan portion and borrowed $3 million and repaid $3 million under the revolving loan portion of the MediaAlpha Bank Facility.
During 2016, Star & Shield borrowed a total of $4 million under an internal revolving credit facility from White Mountains.
During 2016, White Mountains contributed $15 million to WM Advisors.
During 2016, WM Life Re returned $73 million of capital to White Mountains.
Acquisitions and Dispositions
On January 7, 2016, Wobi settled its acquisition of the remaining share capital of Cashboard for NIS 16 million (approximately $4 million based upon the foreign exchange spot rate at the date of acquisition).
On February 1, 2016, Symetra closed its merger agreement with Sumitomo Life and White Mountains received proceeds of $658 million, or $32.00 per Symetra common share.
On February 26, 2016, White Mountains paid $8 million in settlement of the contingent purchase adjustment for its acquisition of MediaAlpha in 2014.
On March 8, 2016 and August 3, 2016, White Mountains purchased additional shares in Captricity for a total of approximately $2 million.
On April 18, 2016, White Mountains completed the sale of Sirius Group to CMI for approximately $2.6 billion. $162 million of this amount was used to purchase certain assets to be retained by White Mountains out of Sirius Group, including shares of OneBeacon.
On various occasions during 2016, White Mountains increased its investment in Wobi through the purchase of newly-issued convertible preferred shares for a total of NIS 36 million (approximately $10 million). As of December 31, 2016, White Mountains’s ownership share of Wobi was 95% on a fully converted basis.
On July 21, 2016, White Mountains completed the sale of Tranzact and received net proceeds of $221 million at closing. On October 5, White Mountains received additional proceeds of $1 million following the release of the post-closing purchase price adjustment escrow.
On August 4, 2016, White Mountains purchased 110,461 common shares of Buzzmove for GBP 4 million (approximately $5 million) and 54,172 shares of newly issued convertible preferred shares of Buzzmove for GBP 2 million (approximately $3 million), representing a 70.9% ownership share of Buzzmove on a fully converted basis.
On October 10, 2016, White Mountains completed the sale of Ashmere and received proceeds of $15 million.
62
Cash flows from investing and financing activities for the year ended December 31, 2015
Financing and Other Capital Activities
During 2015, the Company declared and paid a $6 million cash dividend to its common shareholders.
During 2015, the Company repurchased and retired 387,495 of its common shares for $284 million, which included 12,156 common shares repurchased under employee benefit plans and 13,500 common shares from the Prospector Offshore Fund redemption.
During 2015, the Company borrowed a total of $125 million and subsequently repaid a total of $75 million under the WTM Bank Facility.
During 2015, OneBeacon Ltd. declared and paid $80 million of cash dividends to its common shareholders. White Mountains received a total of $60 million of these dividends.
During 2015, BAM received $29 million in Member Surplus Contributions.
During 2015, MediaAlpha paid $4 million of dividends, of which approximately
$2 million was paid to White Mountains.
During 2015, MediaAlpha borrowed $15 million under the term loan portion of the MediaAlpha Bank Facility and used the proceeds to make a $15 million return of capital payment to its unit holders, of which White Mountains received $9 million.
During 2015, White Mountains provided approximately $13 million of additional growth capital to Compare.com.
During 2015, White Mountains contributed $8 million to WM Life Re.
During 2015, WM Life Re repaid $23 million under an internal revolving credit facility with an intermediate holding company of White Mountains.
Acquisitions and Dispositions
On February 23, 2015, Wobi acquired 56.2% of the outstanding share capital of Cashboard for NIS 10 million (approximately $2 million based upon the foreign exchange spot rate at the date of acquisition). During the second quarter of 2015, Wobi purchased newly issued common shares of Cashboard for NIS 10 million (approximately $3 million).
During 2015, White Mountains increased its ownership interest in Wobi through (i) the purchase of common and convertible preferred shares from a non-controlling interest shareholder for NIS 35 million (approximately $9 million) and (ii) the purchase of newly-issued convertible preferred shares for NIS 56 million (approximately $15 million). As of December 31, 2015, White Mountains’s ownership share of Wobi was 96.1% on a fully converted basis.
On April 2, 2015, White Mountains closed on its investment in PassportCard, a 50/50 joint venture with DavidShield and contributed $21 million of assets to a newly formed entity, PassportCard Limited (formerly PPCI Global Limited).
On May 27, 2015, White Mountains sold its interest in Hamer LLC and received cash proceeds of $24 million.
On December 21, 2015, White Mountains purchased a non-controlling interest in Captricity for approximately $27 million.
On December 22, 2015, White Mountains closed on its investment in OneTitle for approximately $3 million.
During 2015, White Mountains purchased $4 million of SSIE Surplus Notes, which increased its investment in SSIE Surplus Notes to $21 million as of December 31, 2015.
Cash flows from investing and financing activities for the year ended December 31, 2014
Financing and Other Capital Activities
During 2014, the Company declared and paid a $6 million cash dividend to its common shareholders.
During 2014, the Company repurchased and retired 217,879 of its common shares for $134 million, which included 10,475 common shares repurchased under employee benefit plans.
During 2014, the Company borrowed and repaid a total of $65 million under the WTM Bank Facility.
During 2014, OneBeacon Ltd. declared and paid $80 million of cash dividends to its common shareholders. White Mountains received a total of $60 million of these dividends.
During 2014, BAM received $16 million in Member Surplus Contributions.
During 2014, MediaAlpha paid $2 million of dividends, of which $1 million was paid to White Mountains.
During 2014, White Mountains contributed $15 million to WM Advisors.
During 2014, WTM Life Re borrowed a total of $82 million and repaid a total of $89 million under an internal revolving credit facility with an intermediate holding company of White Mountains.
63
Acquisitions and Dispositions
On January 28 2014, White Mountains acquired certain assets and liabilities of Star & Shield Holdings LLC, including SSRM, the attorney-in-fact for SSIE, for a purchase price of $2 million. White Mountains also purchased $17 million of SSIE Surplus Notes during 2014.
On February 19, 2014, White Mountains acquired 54% of the outstanding common shares of Wobi for NIS 14 million (approximately $4 million based upon the foreign exchange spot rate at the date of acquisition). In addition to the common shares, White Mountains also purchased NIS 32 million (approximately $9 million based upon the foreign exchange spot rates at the dates of acquisition) of newly-issued convertible preferred shares of Wobi.
On March 14, 2014, White Mountains acquired 60% of the outstanding Class A common units of MediaAlpha for an initial purchase price of $28 million.
On July 3, 2014, White Mountains acquired approximately 45% of the outstanding common shares of durchblicker, for EUR 9 million (approximately $12 million based upon the foreign exchange spot rate at the date of acquisition).
During 2014, OneBeacon transferred $51 million of cash in connection with the sale of the Runoff Business.
TRANSACTIONS WITH RELATED PERSONS
See
Note 20 — “Transactions with Related Persons”
on page F-84 in the accompanying Consolidated Financial Statements.
NON-GAAP FINANCIAL MEASURES
This report includes four non-GAAP financial measures that have been reconciled to their most comparable GAAP financial measures. White Mountains believes these measures to be useful in evaluating White Mountains’s results of operations and financial condition.
Adjusted comprehensive income is a non-GAAP financial measure that
,
for periods that White Mountains accounted for its investment in Symetra under the equity method, excludes the change in equity in net unrealized investment gains (losses) from Symetra’s fixed maturity portfolio from comprehensive income. White Mountains accounted for its investment in Symetra under the equity method until November 5, 2015, when it changed its accounting to fair value. In the calculation of comprehensive income under GAAP, fixed maturity investments are marked-to-market while the liabilities to which those assets are matched are not. Symetra attempts to earn a “spread” between what it earns on its investments and what it pays out on its products. In order to try to fix this spread, Symetra invests in a manner that tries to match the duration and cash flows of its investments with the required cash outflows associated with its life insurance and structured settlements products. As a result, Symetra typically earns the same spread on in-force business whether interest rates fall or rise. Further, at any given time, some of Symetra’s structured settlement obligations may extend 40 or 50 years into the future, which is further out than the longest maturing fixed maturity investments regularly available for purchase in the market (typically 30 years). For these long-dated products, Symetra is unable to fully match the obligation with assets until the remaining expected payout schedule comes within the duration of securities available in the market. If at that time, these fixed maturity investments have yields that are lower than the yields expected when the structured settlement product was originally priced, the spread for the product will shrink and Symetra will ultimately harvest lower returns for its shareholders. GAAP comprehensive income increases when rates decline, which would suggest an increase in the value of Symetra - the opposite of what is happening to the intrinsic value of the business. Therefore, White Mountains’s management and Board of Directors historically used adjusted comprehensive income when assessing Symetra’s quarterly financial performance. In addition, this measure is typically the predominant component of change in adjusted book value per share, which is used in calculation of White Mountains’s performance for both short-term (annual bonus) and long-term incentive plans. The reconciliation of GAAP comprehensive income to adjusted comprehensive income is included on page 37.
Adjusted book value per share is a non-GAAP financial measure which is derived by expanding the calculation of GAAP book value per share to exclude equity in net unrealized investment gains (losses) from Symetra’s fixed maturity portfolio for periods that White Mountains accounted for its investment in Symetra under the equity method. White Mountains accounted for its investment in Symetra under the equity method until November 5, 2015, when it changed its accounting to fair value. Adjusted book value per share includes the dilutive effects of outstanding non-qualified options. In addition, the number of common shares outstanding used in the calculation of adjusted book value per share per White Mountains’s common share is adjusted to exclude unearned restricted common shares, the compensation cost of which, at the date of calculation, has yet to be amortized. The reconciliation of GAAP book value per share to adjusted book value per share is included on page 36.
64
Total consolidated portfolio returns excluding Symetra and total common equity securities and other long-term investments returns excluding Symetra are non-GAAP financial measures that remove the $259 million pre-tax unrealized investment gain recognized in the fourth quarter of 2015 that was the result of the change in accounting for Symetra common shares from the equity method to fair value. White Mountains believes these measures make the returns in the current year more comparable to the prior period. A reconciliation of the GAAP returns to the returns excluding Symetra follows:
|
For the year ended December 31, 2015
|
|||||||||
|
GAAP returns
|
Remove Symetra
|
Returns - excluding Symetra
|
|||||||
|
Total consolidated portfolio returns
|
3.6
|
%
|
(3.8
|
)%
|
(0.2
|
)%
|
|||
|
Total common equity securities and
other long-term investments returns
|
19.3
|
%
|
(21.1
|
)%
|
(1.8
|
)%
|
|||
|
Total common equity securities
|
33.2
|
%
|
(30.3
|
)%
|
2.9
|
%
|
|||
In the third quarter of 2016, White Mountains purchased high-yield fixed maturity investments, which are U.S. dollar denominated publicly traded and 144A debt securities issued by corporations with generally at least one rating between "B-" and “BB+” inclusive by Standard and Poor’s or similar ratings from other rating agencies. Given the risk profile of these investments, White Mountains has included returns on high-yield fixed maturity investments with returns on common equity securities and other long-term investments. A reconciliation of the GAAP return to the reported return follows:
|
December 31, 2016
|
|||||||||
|
Common equity securities and other long-term investment returns
|
GAAP return
|
Include: Impact of return on high-yield fixed maturity investments
(1)
|
Reported return
|
||||||
|
Year-to-date
|
4.3
|
%
|
(0.3
|
)%
|
4.0
|
%
|
|||
(1)
High-yield fixed maturity investments returned 1.0% for the full year of 2016. The impact of excluding high-yield fixed maturity investments from the GAAP fixed maturity investment returns was insignificant in 2016.
CRITICAL ACCOUNTING ESTIMATES
Management’s Discussion and Analysis of Financial Condition and Results of Operations discuss the Company’s consolidated financial statements, which have been prepared in accordance with GAAP. The financial statements presented herein include all adjustments considered necessary by management to fairly present the financial position, results of operations and cash flows of White Mountains.
The preparation of financial statements in conformity with GAAP requires management to make estimates and assumptions that affect the reported amounts of assets and liabilities as of the date of the financial statements and the reported amounts of revenues and expenses during the reporting period. Certain of these estimates are considered critical in that they involve a higher degree of judgment and are subject to a significant degree of variability. On an ongoing basis, management evaluates its estimates, including those related to fair value measurements of investments and other financial instruments, valuation of liabilities associated with an assumed reinsurance agreement covering benefit guarantees on variable annuities in Japan, its property-casualty loss and LAE reserves and its property-casualty reinsurance contracts. Management bases it estimates on historical experience and on various other factors that are believed to be reasonable under the circumstances, the results of which form the basis for making judgments about the carrying values of assets and liabilities that are not readily apparent from other sources.
65
1. Loss and LAE Reserves
General
White Mountains establishes loss and LAE reserves that are estimates of amounts needed to pay claims and related expenses in the future for insured events that have already occurred. The process of estimating reserves involves a considerable degree of judgment by management and, as of any given date, is inherently uncertain. See
Note 3 — “Reserves for Unpaid Losses and Loss Adjustment Expenses”
on page F-17 for a description of White Mountains’s loss and LAE reserves and actuarial methods.
White Mountains performs an actuarial review of its recorded reserves each quarter. As part of that review, White Mountains’s actuaries compare the previous quarter’s projections of incurred, paid and case reserve activity, including amounts incurred but not reported, to amounts experienced in the quarter. Differences between previous estimates and actual experience evaluated to determine whether a given actuarial method for estimating loss and LAE should be relied upon to a greater or lesser extent than it had been in the past. While some variance is expected each quarter due to the inherent uncertainty in loss and LAE, persistent or large variances would indicate that prior assumptions and/or reliance on certain reserving methods may need to be revised going forward.
Upon completion of each quarterly review, OneBeacon’s actuaries select indicated reserve levels based on the results of the actuarial methods described previously, which are the primary consideration in determining management’s best estimate of required reserves. However, in making its best estimate, management also considers other qualitative factors that may lead to a difference between held reserves and actuarially indicated reserve levels. Typically, these factors exist when management and OneBeacon’s actuaries conclude that there is insufficient historical incurred and paid loss information or that there is particular uncertainty about whether trends included in the historical incurred and paid loss information are unlikely to repeat in the future. Such factors include, among others, recent entry into new markets or new products, improvements in the claims department that are expected to lessen future ultimate loss costs, legal and regulatory developments, or other volatilities that may arise.
OneBeacon
The process of establishing loss and LAE reserves, including amounts incurred but not reported, is complex and imprecise as it must consider many variables that are subject to the outcome of future events. As a result, informed subjective estimates and judgments as to OneBeacon’s ultimate exposure to losses are an integral component of the loss and LAE reserving process. OneBeacon categorizes and tracks insurance reserves by “line of business” as either property short-tailed lines, casualty long-tailed lines, or other (accident, surety and credit) lines.
OneBeacon regularly reviews the appropriateness of reserve levels at the line of business level, considering the variety of trends that impact the ultimate settlement of claims for the subsets of claims in each particular line of business.
Loss and LAE Reserves by Line of Business
OneBeacon’s loss and LAE reserves, net of reinsurance recoverables, as of
December 31, 2016 and 2015
were as follows:
|
December 31, 2016
|
December 31, 2015
|
|||||||||||||||||||||||
|
Millions
|
Case
|
IBNR
|
Total
|
Case
|
IBNR
|
Total
|
||||||||||||||||||
|
Property Lines:
|
||||||||||||||||||||||||
|
Property
|
$
|
42.4
|
|
$
|
22.6
|
|
$
|
65.0
|
|
$
|
33.9
|
|
$
|
37.6
|
|
$
|
71.5
|
|
||||||
|
Ocean Marine
|
39.5
|
|
39.0
|
|
78.5
|
|
52.8
|
|
38.7
|
|
91.5
|
|
||||||||||||
|
Total Property Lines
|
81.9
|
|
61.6
|
|
143.5
|
|
86.7
|
|
76.3
|
|
163.0
|
|
||||||||||||
|
Casualty Lines:
|
||||||||||||||||||||||||
|
Automobile liability
|
52.0
|
|
65.7
|
|
117.7
|
|
49.8
|
|
57.7
|
|
107.5
|
|
||||||||||||
|
General liability - occurrence
|
72.9
|
|
208.8
|
|
281.7
|
|
69.7
|
|
201.1
|
|
270.8
|
|
||||||||||||
|
General liability - claims made
|
79.8
|
|
150.1
|
|
229.9
|
|
86.8
|
|
179.2
|
|
266.0
|
|
||||||||||||
|
Medical malpractice
|
102.6
|
|
101.0
|
|
203.6
|
|
84.4
|
|
94.5
|
|
178.9
|
|
||||||||||||
|
Workers compensation
|
57.7
|
|
65.1
|
|
122.8
|
|
54.1
|
|
62.2
|
|
116.3
|
|
||||||||||||
|
Other
|
.4
|
|
4.8
|
|
5.2
|
|
.2
|
|
4.6
|
|
4.8
|
|
||||||||||||
|
Total Casualty Lines
|
365.4
|
|
595.5
|
|
960.9
|
|
345.0
|
|
599.3
|
|
944.3
|
|
||||||||||||
|
Other Lines
|
22.4
|
|
65.9
|
|
88.3
|
|
23.6
|
|
72.9
|
|
96.5
|
|
||||||||||||
|
Total
|
$
|
469.7
|
|
$
|
723.0
|
|
$
|
1,192.7
|
|
$
|
455.3
|
|
$
|
748.5
|
|
$
|
1,203.8
|
|
||||||
66
For loss and allocated LAE reserves, the key assumption as of
December 31, 2016
was that the impact of the various reserving factors, as described in
Note 3 — “Reserves for Unpaid Losses and Loss Adjustment Expenses”
, on future paid losses would be similar to the impact of those factors on the historical loss data with the exception of severity trends. Severity trends have been relatively stable over the relevant historical period. The actuarial methods used would project losses assuming continued stability in severity trends. Management has considered a range of assumptions regards future increases in loss severity trends, including the impact of inflation, in making its reserve selections.
The major causes of material uncertainty (“reserving factors”) generally will vary for each line, as well as for each separately analyzed component of the line. Also, reserving factors can have offsetting or compounding effects on estimated reserves. For example, in workers compensation, the use of expensive medical procedures that result in medical cost inflation may enable workers to return to work faster, thereby lowering indemnity costs. Thus, in almost all cases, it is impossible to discretely measure the effect of a single reserving factor and construct a meaningful sensitivity expectation. Actual results will likely vary from expectations for each of these assumptions, resulting in an ultimate claim liability that is different from that being estimated currently.
Additional causes of material uncertainty exist in most product lines and may impact the types of claims that could occur within a particular operating segment or book of business. Examples where reserving factors, within an underwriting unit or book of business, are subject to change include changing types of insured (e.g., type of insured vehicle, size of account, industry insured, jurisdiction, etc.), changing underwriting standards, or changing policy provisions (e.g., deductibles, policy limits, or endorsements).
OneBeacon Loss and LAE Development
See
Note 3 — “Reserves for Unpaid Losses and Loss Adjustment Expenses”
on page F-17 for prior year loss and LAE development discussions for the years ended December 31, 2016, 2015 and 2014.
Range of Reserves
OneBeacon’s range of loss and LAE reserve estimates was evaluated to consider the strengths and weaknesses of the various actuarial methods applied against OneBeacon’s historical claims experience data. The following table shows the recorded loss and LAE reserves and the high and low ends of OneBeacon’s range of reasonable loss reserve estimates, net of reinsurance recoverable on unpaid losses, as of
December 31, 2016 and 2015
. The high and low ends of the range of reserve estimates in the table below are based on the results of various actuarial methods. See
Note 3 — “Reserves for Unpaid Losses and Loss Adjustment Expenses”
on page F-17 for a description of White Mountains’s loss and LAE reserves and actuarial methods.
|
December 31, 2016
|
December 31, 2015
|
|||||||||||||||||||||||
|
Millions
|
Low
|
Recorded
|
High
|
Low
|
Recorded
|
High
|
||||||||||||||||||
|
Total
|
$
|
1,011.6
|
|
$
|
1,192.7
|
|
$
|
1,363.4
|
|
$
|
1,009.1
|
|
$
|
1,203.8
|
|
$
|
1,356.1
|
|
||||||
The recorded reserves represent management's best estimate of unpaid loss and LAE reserves. OneBeacon uses the results of several different actuarial methods to develop its estimate of ultimate reserves. While it has not determined the statistical probability of actual ultimate paid losses falling within the range, OneBeacon believes that it is reasonably likely that actual ultimate paid losses will fall within the ranges noted above because the ranges were developed by using several different generally accepted actuarial methods.
Although OneBeacon believes its reserves are reasonably stated, ultimate losses may deviate, perhaps materially, from the recorded reserve amounts and could be above the high end of the range of actuarial projections. This is because ranges are developed based on known events as of the valuation date, whereas the ultimate disposition of losses is subject to the outcome of events and circumstances that may be unknown as of the valuation date.
67
Sensitivity Analysis
The following discussion includes disclosure of possible variations from current estimates of loss and LAE reserves due to changes in a few of the many key assumptions. Each of the impacts described below is estimated individually, without consideration for any correlation among key assumptions. Further, there is uncertainty around other assumptions not explicitly quantified in the discussion below. Therefore, it would be inappropriate to take each of the amounts described below and add them together in an attempt to estimate volatility for OneBeacon’s reserves in total. It is important to note that the volatilities and variations discussed below are not meant to be a worst-case scenarios or an all-inclusive list, and therefore it is possible that future volatilities and variations may be more than amounts discussed below.
|
•
|
Various sources of inflation volatility impact all of OneBeacon’s reserves in different ways. Using its internal economic capital model, OneBeacon has derived a distribution of future loss payments under the range of inflation scenarios and related claim cost trends in its economic scenario set, holding all other sources of reserve volatility constant. At the 75th percentile of modeled outcomes, the estimated impact of claim cost inflation above OneBeacon’s actuarially indicated reserves is $34 million, net of reinsurance. The following are intended to provide additional insight into the impact of inflation on key lines of business:
|
|
◦
|
Professional liability:
Recorded loss and LAE reserves, net of reinsurance recoverables, for professional liability were $438 million as of December 31, 2016. A key assumption for professional liability is the implicit loss cost trend, particularly the severity inflation trend component of loss costs. Across the entire reserve base, a 5.0 point change in assumed annual severity trend would have changed the estimated net reserve by approximately $84 million as of December 31, 2016, in either direction.
|
|
◦
|
Workers compensation:
Recorded workers compensation loss and LAE reserves, net of reinsurance recoverables, were $123 million as of December 31, 2016. The two most important assumptions for workers compensation reserves are loss development factors and loss cost trends, particularly medical cost inflation. Loss development patterns are dependent on medical cost inflation. Approximately half of the workers compensation net reserves are related to future medical costs. Across the entire reserve base, a 1.0 point change in calendar year medical inflation would have changed the estimated net reserve by approximately $3 million as of December 31, 2016, in either direction.
|
|
•
|
The volatility associated with the frequency and severity of large losses, defined as claims greater than or equal to $2.5 million, can have a material impact on OneBeacon’s results. The frequency and severity of large claims is driven primarily by the random nature of the insurance process but also by claim cost inflation and parameter risk. These large losses often emerge over a long time period potentially leading to a material impact on OneBeacon’s reserves. One way OneBeacon considers this sensitivity is by examining the volatility of large losses in the current accident year using its economic capital model. At the 75th percentile of modeled outcomes, OneBeacon estimates that large losses could exceed the mean by $18 million gross of reinsurance and $8 million, net of the current reinsurance structure.
|
|
•
|
As OneBeacon starts up new businesses, its initial loss estimates and development patterns are often based on industry data. As actual losses develop OneBeacon will revise its initial expectations with its actual experience. However, depending on the tail for the specific business, it can be a few years before OneBeacon has sufficient internal data to rely on. As of December 31, 2016, OneBeacon has $311 million of inception-to-date premium from its newer businesses (Programs, Environmental and Financial Institutions). A 10% error in OneBeacon’s initial loss ratio estimates could result in approximately $31 million of adverse net variance in loss reserves.
|
68
2. Fair Value Measurements
General
White Mountains measures certain assets and liabilities at estimated fair value in its consolidated financial statements, with changes therein recognized in current period earnings. In addition, White Mountains discloses estimated fair value for certain liabilities measured at historical or amortized cost. Fair value is defined as the price that would be received to sell an asset or paid to transfer a liability in an orderly transaction between market participants (an exit price) at a particular measurement date. Fair value measurements are categorized into a hierarchy that distinguishes between inputs based on market data from independent sources (“observable inputs”) and a reporting entity's internal assumptions based upon the best information available when external market data is limited or unavailable (“unobservable inputs”). Quoted prices in active markets for identical assets or liabilities have the highest priority (“Level 1”), followed by observable inputs other than quoted prices, including prices for similar but not identical assets or liabilities (“Level 2”) and unobservable inputs, including the reporting entity's estimates of the assumptions that market participants would use, having the lowest priority (“Level 3”).
Assets and liabilities carried at fair value include substantially all of the investment portfolio; derivative instruments, both exchange traded and over the counter instruments; and reinsurance assumed liabilities associated with variable annuity benefit guarantees. Valuation of assets and liabilities measured at fair value require management to make estimates and apply judgment to matters that may carry a significant degree of uncertainty. In determining its estimates of fair value, White Mountains uses a variety of valuation approaches and inputs. Whenever possible, White Mountains estimates fair value using valuation methods that maximize the use of observable prices and other inputs. Where appropriate, assets and liabilities measured at fair value have been adjusted for the effect of counterparty credit risk.
Invested Assets
White Mountains used quoted market prices or other observable inputs to determine fair value for 94% of its investment portfolio as of December 31, 2016. Investments valued using Level 1 inputs include fixed maturity investments, primarily investments in U.S. Treasuries, short-term investments, which include U.S. Treasury Bills, and common equity securities. Investments valued using Level 2 inputs are primarily comprised of fixed maturity investments, which have been disaggregated into classes, including debt securities issued by corporations, municipal obligations, mortgage and asset-backed securities, foreign government, agency and provincial obligations and preferred stocks. Investments valued using Level 2 inputs also include certain ETFs that track U.S. stock indices such as the S&P 500 but are traded on foreign exchanges and that management values using the fund’s published net asset value (“NAV”) to account for the difference in market close times. Fair value estimates for investments that trade infrequently and have few or no observable market prices are classified as Level 3 measurements. Level 3 fair value estimates based upon unobservable inputs include White Mountains’s investments in surplus notes, as well as certain investments in fixed maturity investments, common equity securities and other long-term investments where quoted market prices are unavailable or are not considered reasonable. Transfers between levels are based on investments held as of the beginning of the period.
White Mountains uses brokers and outside pricing services to assist in determining fair values. For investments in active markets, White Mountains uses the quoted market prices provided by outside pricing services to determine fair value. The outside pricing services White Mountains uses have indicated that they will only provide prices where observable inputs are available. In circumstances where quoted market prices are unavailable or are not considered reasonable, White Mountains estimates the fair value using industry standard pricing methodologies and observable inputs such as benchmark yields, reported trades, broker-dealer quotes, issuer spreads, benchmark securities, bids, offers, credit ratings, prepayment speeds, reference data including research publications and other relevant inputs. Given that many fixed maturity investments do not trade on a daily basis, the outside pricing services evaluate a wide range of fixed maturity investments by regularly drawing parallels from recent trades and quotes of comparable securities with similar features. The characteristics used to identify comparable fixed maturity investments vary by asset type and take into account market convention.
White Mountains’s process to assess the reasonableness of the market prices obtained from the outside pricing sources covers substantially all of its fixed maturity investments and includes, but is not limited to, the evaluation of pricing methodologies, and a review of the pricing services’ quality control processes and procedures on at least an annual basis, comparison of its invested asset market prices to prices obtained from alternate independent pricing vendors on at least a semi-annual basis, monthly analytical reviews of certain prices and a review of the underlying assumptions utilized by the pricing service for selected measurements on an ad hoc basis throughout the year.
69
White Mountains also performs back-testing of selected sales activity to determine whether there are any significant differences between the market price used to value the security prior to sale and the actual sale price on an ad-hoc basis throughout the year. Prices provided by the pricing services that vary by more than 5% and $1.0 million from the expected price based on these procedures are considered outliers. Also considered outliers are prices that have not changed from period to period and prices that have trended unusually compared to market conditions. In circumstances where the results of White Mountains’s review process does not appear to support the market price provided by the pricing services, White Mountains challenges the price. If White Mountains cannot gain satisfactory evidence to support the challenged price, it relies upon its own pricing methodologies to estimate the fair value of the security in question.
The valuation process above is generally applicable to all of White Mountains’s fixed maturity investments. The techniques and inputs specific to asset classes within White Mountains’s fixed maturity investments for Level 2 securities that use observable inputs are as follow:
Debt securities issued by corporations:
The fair value of debt securities issued by corporations is determined from a pricing evaluation technique that uses information from market sources and integrates relative credit information, observed market movements, and sector news. Key inputs include benchmark yields, reported trades, broker-dealer quotes, issuer spreads, two-sided markets, benchmark securities, bids, offers, and reference data including sector, coupon, credit quality ratings, duration, credit enhancements, early redemption features and market research publications.
Mortgage and asset-backed securities:
The fair value of mortgage and asset-backed securities is determined from a pricing evaluation technique that uses information from market sources and leveraging similar securities. Key inputs include benchmark yields, reported trades, underlying tranche cash flow data, collateral performance, plus new issue data, as well as broker-dealer quotes, issuer spreads, two-sided markets, benchmark securities, bids, offers, and reference data including issuer, vintage, loan type, collateral attributes, prepayment speeds, default rates, recovery rates, cash flow stress testing, credit quality ratings and market research publications.
Municipal obligations:
The fair value of municipal obligations is determined from a pricing evaluation technique that uses information from market makers, brokers-dealers, buy-side firms, and analysts along with general market information. Key inputs include benchmark yields, reported trades, issuer financial statements, material event notices and new issue data, as well as broker-dealer quotes, issuer spreads, two-sided markets, benchmark securities, bids, offers, and reference data including type, coupon, credit quality ratings, duration, credit enhancements, geographic location and market research publications.
Foreign government, agency and provincial obligations:
The fair value of foreign government, agency and provincial obligations is determined from a pricing evaluation technique that uses feeds from data sources in each respective country, including active market makers and inter-dealer brokers. Key inputs include benchmark yields, reported trades, broker-dealer quotes, two-sided markets, benchmark securities, bids, offers, local exchange prices, foreign exchange rates and reference data including coupon, credit quality ratings, duration and market research publications.
Preferred stocks:
The fair value of preferred stocks is determined from a pricing evaluation technique that calculates the appropriate spread over a comparable security for each issue. Key inputs include exchange prices (underlying and common stock of same issuer), benchmark yields, reported trades, broker-dealer quotes, issuer spreads, two-sided markets, benchmark securities, bids, offers, and reference data including sector, coupon, credit quality ratings, duration, credit enhancements, early redemption features and market research publications.
Level 3 valuations are generated from techniques that use assumptions not observable in the market. These unobservable assumptions reflect White Mountains’s assumptions that market participants would use in valuing the investment. Generally, certain securities may start out as Level 3 when they are originally issued but as observable inputs become available in the market, they may be reclassified to Level 2.
White Mountains employs a number of procedures to assess the reasonableness of the fair value measurements for its other long-term investments, including obtaining and reviewing periodic and audited annual financial statements of hedge funds and private equity funds and discussing each fund’s pricing with the fund manager throughout the year. However, since the fund managers do not provide sufficient information to evaluate the pricing inputs and methods for each underlying investment, the inputs are considered to be unobservable. The fair value of White Mountains’s investments in hedge funds and private equity funds has generally been determined using NAV.
70
The following table summarizes White Mountains’s fair value measurements and the percentage of Level 3 investments as of
December 31, 2016
. The major security types were based on the legal form of the securities. White Mountains has disaggregated its fixed maturity investments based on the issuing entity type, which impacts credit quality, with debt securities issued by U.S. government entities carrying minimal credit risk, while the credit and other risks associated with other issuers, such as debt securities issued by corporations, foreign governments, municipalities or entities issuing mortgage and asset-backed securities vary depending on the nature of the issuing entity type:
|
December 31, 2016
|
|||||||||||
|
$ in millions
|
Fair value
|
Level 3 Inputs
|
Level 3 Inputs as a % of
total fair value
|
||||||||
|
U.S. Government and agency obligations
|
$
|
278.3
|
|
$
|
—
|
|
—
|
|
|||
|
Debt securities issued by corporations
|
1,509.4
|
|
—
|
|
—
|
|
|||||
|
Mortgage and asset-backed securities
|
2,132.9
|
|
—
|
|
—
|
|
|||||
|
Municipal obligations
|
309.0
|
|
—
|
|
—
|
|
|||||
|
Foreign government, agency and provincial obligations
|
13.2
|
|
—
|
|
—
|
|
|||||
|
Preferred stocks
|
14.0
|
|
—
|
|
—
|
%
|
|||||
|
Fixed maturity investments
(1)
|
4,256.8
|
|
—
|
|
—
|
%
|
|||||
|
Short-term investments
(1)
|
287.1
|
|
—
|
|
—
|
|
|||||
|
Common equity securities
|
474.3
|
|
—
|
|
—
|
%
|
|||||
|
Other long-term investments
(2)(3)
|
177.7
|
|
177.7
|
|
100
|
%
|
|||||
|
Total investments
|
$
|
5,195.9
|
|
$
|
177.7
|
|
3
|
%
|
|||
(1)
Includes carrying value of
$6.6
in fixed maturity investments and
$0.1
in short-term investments that are classified as assets held for sale related to SSIE.
(2)
Excludes carrying value of
$3.5
associated with other long-term investment limited partnerships accounted for using the equity method and
$(1.2)
related to foreign currency forward contracts. Excludes carrying value of
$12.3
associated with a tax advantaged federal affordable housing development fund accounted for using the proportional amortization method.
(3)
Excludes carrying value of
$131.0
associated with hedge funds and private equity funds for which fair value is generally measured at NAV using the practical expedient.
White Mountains uses quoted market prices where available as the inputs to estimate fair value for its investments in active markets. Such measurements are considered to be either Level 1 or Level 2 measurements, depending on whether the quoted market price inputs are for identical securities (Level 1) or similar securities (Level 2). See
Note 5
— “Investment Securities”
on page F-35 for tables that summarize the changes in White Mountains’s fair value measurements by level for the years ended
December 31, 2016 and 2015
and for amount of total gains (losses) included in earnings attributable to net unrealized investment gains (losses) for Level 3 investments for years ended
December 31, 2016, 2015 and 2014
.
Other Long-Term Investments
White Mountains’s other long-term investments as of
December 31, 2016
include $
60 million
in hedge funds and $
71 million
in private equity funds. As of
December 31, 2016
, White Mountains held investments in
5
hedge funds and
23
private equity funds. The largest investment in a single fund was
$37 million
and
$23 million
as of
December 31, 2016 and 2015
.
The fair value of White Mountains’s investments in hedge funds and private equity funds is based upon White Mountains’s proportionate interest in the underlying fund’s NAV, which is deemed to approximate fair value. White Mountains employs a number of procedures to assess the reasonableness of the fair value measurements for its other long-term investments, including obtaining and reviewing each fund’s audited financial statements and discussing each fund’s pricing with the fund manager. However, since the fund managers do not provide sufficient information to independently evaluate the pricing inputs and methods for each underlying investment, the inputs are considered to be unobservable.
In circumstances where the underlying investments are publicly traded, such as the investments made by hedge funds, the fund manager uses current market prices to determine fair value. In circumstances where the underlying investments are not publicly traded, such as the investments made by private equity funds, the private equity fund managers generally consider the need for a liquidity discount on each of the underlying investments when determining the fund’s NAV. In the event White Mountains believes that its estimated NAV differs from the valuation provided by the fund manager, White Mountains will adjust the fund manager’s reported NAV to more appropriately represent the fair value of its interest in the investment. As of
December 31, 2016
, White Mountains determined that certain underlying investments held in six separate private equity funds required an adjustment to the fund manager's reported NAV. The total adjustment to the fund manager’s reported NAV relating to these underlying investments resulted in a $5.0 million reduction to the fair value of White Mountains’s private equity fund portfolio as of
December 31, 2016
.
71
Sensitivity analysis of likely returns on other long-term investments
White Mountains maintains a portfolio of other long-term investments that consists primarily of hedge funds, private equity funds, non-controlling interests in private capital investments, the OneBeacon Surplus Notes, and various other investments. The underlying investments of hedge funds and private equity funds are typically publicly traded and private common equity securities and, as such, are subject to market risks that are similar to White Mountains’s common equity securities. The following illustrates the estimated effect on
December 31, 2016
fair values resulting from a 10% change and a 30% change in market value:
|
Change in fair value
|
||||||||||||||||||||
|
Carrying Value at
|
December 31, 2016
|
|||||||||||||||||||
|
Millions
|
December 31, 2016
|
10% decline
|
10% increase
|
30% decline
|
30% increase
|
|||||||||||||||
|
Hedge funds
|
$
|
59.8
|
|
$
|
(6.0
|
)
|
$
|
6.0
|
|
$
|
(17.9
|
)
|
$
|
17.9
|
|
|||||
|
Private equity funds
|
71.2
|
|
$
|
(7.1
|
)
|
$
|
7.1
|
|
$
|
(21.4
|
)
|
$
|
21.4
|
|
||||||
|
Private equity securities and
limited liability companies
|
72.0
|
|
$
|
(7.2
|
)
|
$
|
7.2
|
|
$
|
(21.6
|
)
|
$
|
21.6
|
|
||||||
|
OneBeacon Surplus Notes
|
71.9
|
|
$
|
(7.2
|
)
|
$
|
7.2
|
|
$
|
(21.6
|
)
|
$
|
21.6
|
|
||||||
|
Other
|
48.4
|
|
$
|
(4.8
|
)
|
$
|
4.8
|
|
$
|
(14.5
|
)
|
$
|
14.5
|
|
||||||
|
Total other-long term investments
|
$
|
323.3
|
|
$
|
(32.3
|
)
|
$
|
32.3
|
|
$
|
(97.0
|
)
|
$
|
97.0
|
|
|||||
3. Surplus Note Valuation
BAM Surplus Notes
As of December 31, 2016, White Mountains owned $503 million of BAM Surplus Notes and has accrued $108 million in interest due thereon. BAM has not yet made any cash payments to White Mountains for amounts owed under the BAM Surplus Notes. Because BAM is consolidated in White Mountains’s financial statements, the BAM Surplus Notes and accrued interest are classified as intercompany notes, carried at face value and eliminated in consolidation. However, the BAM Surplus Notes and accrued interest are carried as assets at HG Global, of which White Mountains owns 97% of the preferred equity, while the BAM Surplus Notes are carried as liabilities at BAM, which White Mountains has no ownership interest in and is completely attributed to non-controlling interests.
Any write-off of the carried amount of the BAM Surplus Notes and/or the accrued interest thereon would adversely impact White Mountains’s adjusted book value per share. See Item 1A., Risk Factors, “
If BAM does not pay some or all of the interest and principal due on the BAM Surplus Notes, White Mountains’s adjusted book value per share, results of operations and financial condition could be materially adversely affected.”
on page 23.
Periodically, White Mountains’s management reviews the recoverability of amounts recorded from the BAM Surplus Notes. As of December 31, 2016, White Mountains believes such notes and interest thereon to be fully recoverable.
White Mountains’s review is based on a debt service model that forecasts 20 years of operating results for BAM. The model depends on assumptions regarding future trends for the issuance of municipal bonds, interest rates, credit spreads, competitive activity in the market for bond insurance and other factors affecting the demand for and price of BAM’s bond insurance. Assumptions regarding future trends for these factors are a matter of significant judgment.
The model assumes increases in insured market penetration, annual par insured volume and premium rates, which in turn lead to substantial increases in total premium written over the next six years (flattening thereafter). Under these assumptions, we project that BAM can begin making payments on the BAM Surplus Notes in 2019 and can fully repay all principal and interest due on the BAM Surplus Notes approximately 15 years prior to final maturity.
The model assumptions are based on historical trends, current conditions and expected future developments. Whether actual results will follow forecast is subject to a number of risks and uncertainties.
No payment of interest or principal on the BAM Surplus Notes may be made without the approval of the New York State Department of Financial Services. BAM has stated its intention to seek regulatory approval to pay interest and principal on its surplus notes only to the extent that its remaining qualified statutory capital (“QSC”) exceeds $500 million and its remaining QSC and other capital resources continue to support its outstanding obligations, business plan and its AA stable rating from S&P.
Interest payments on the BAM Surplus Notes are due quarterly but are subject to deferral, without penalty or default and without compounding, for payment in the future. No principal is due on the BAM Surplus Notes prior to the stated maturity date of 2042. BAM has the right to prepay principal in whole or in part at any time.
72
OneBeacon Runoff Transaction
In the fourth quarter of 2014, in conjunction with the Runoff Transaction, OneBeacon provided financing in the form of the OneBeacon Surplus Notes with a par value of $101 million, which had a fair value of $65 million at the date of closing. As of December 31, 2016 and 2015 the OneBeacon Surplus Notes had a fair value of $72 million and $52 million. The OneBeacon Surplus Notes, issued by one of the transferred entities, OBIC, since renamed Bedivere (“Issuer”), were in the form of both seller priority and pari passu notes.
Under the contractual terms of both the seller priority and pari passu notes, scheduled interest payments accrue at 6.0% until the scheduled maturity date of March 15, 2020 and at a floating interest rate thereafter, should any principal remain outstanding. As required by the Pennsylvania Insurance Department (“PID”), interest on the notes does not compound. The notes restrict the Issuer’s ability to make distributions to holders of its equity interest. All such distributions are prohibited while the seller priority note is outstanding, and while the pari passu note is outstanding, distributions are permitted only if the Issuer concurrently repays a pro rata amount of any outstanding principal on the pari passu note.
Pursuant to the notes, the Issuer shall seek to redeem the notes annually each March 15 at a requested redemption amount such that the Issuer’s total adjusted capital following the proposed redemption payment would equal 200% of the Issuer’s “authorized control level RBC,” as such term is defined by the insurance laws of the Commonwealth of Pennsylvania and as prescribed by the PID. All redemptions or repayments of principal and payments of interest on the notes are subject to approval by the PID.
Below is a table illustrating the valuation adjustments taken to arrive at the estimated fair value of the OneBeacon Surplus Notes as of December 31, 2016 and December 31, 2015:
|
Type of Surplus Note
|
Total as of December 31, 2016
|
Total as of December 31, 2015
|
||||||||||||||
|
Millions
|
Seller Priority
|
Pari Passu
|
||||||||||||||
|
Par Value
|
$
|
57.9
|
|
$
|
43.1
|
|
$
|
101.0
|
|
$
|
101.0
|
|
||||
|
Fair value adjustments to reflect:
|
||||||||||||||||
|
Current market rates on public debt and contract-based repayments
(1)
|
6.2
|
|
(1.1
|
)
|
5.1
|
|
(15.1
|
)
|
||||||||
|
Regulatory approval
(2)
|
(.2
|
)
|
(15.4
|
)
|
(15.6
|
)
|
(24.2
|
)
|
||||||||
|
Liquidity adjustment
(3)
|
(12.8
|
)
|
(5.8
|
)
|
(18.6
|
)
|
(10.2
|
)
|
||||||||
|
Total adjustments
|
(6.8
|
)
|
(22.3
|
)
|
(29.1
|
)
|
(49.5
|
)
|
||||||||
|
Fair value
(4)
|
$
|
51.1
|
|
$
|
20.8
|
|
$
|
71.9
|
|
$
|
51.5
|
|
||||
(1)
Represents the value of the surplus notes, at current market yields on comparable publicly traded debt, and assuming issuer is allowed to make principal and interest payments when its financial capacity is available, as measured by statutory capital in excess of a 250% RBC score under the NAIC’s risk-based capital standards for property and casualty companies. The favorable year-over-year change in impact is due principally to the narrowing of non-investment grade credit spreads as well as the time value of money benefit from moving one year closer to modeled cash receipts.
(2)
Represents anticipated delay in securing regulatory approvals of interest and principal payments to reflect graduated changes in Issuer's statutory surplus. The monetary impact of the anticipated delay is measured based on credit spreads of public securities with roughly equivalent percentages of discounted payments missed. The favorable year-over-year change in impact is driven primarily by the narrowing of non-investment grade credit spreads, which causes the anticipated delay in securing regulatory approval to be less punitive, partially offset by the change in estimates and assumptions regarding the timeline, amounts, and process necessary to obtain regulatory approval for principal and interest payments described below.
(3)
Represents impact of liquidity spread to account for OneBeacon’s sole ownership of the OneBeacon Surplus Notes, lack of a trading market and unique nature of the ongoing regulatory approval process. The unfavorable year-over-year change in impact is due largely to the increased fair value of the notes as well as a higher effective duration resulting from a lower overall yield to maturity; there was no change in the magnitude of the liquidity spread in 2016.
(4)
The increase in the fair value of the OneBeacon Surplus Notes during the year ended December 31, 2016 was driven primarily by the narrowing of non-investment grade credit spreads, partially offset by the impact of a change in estimates and assumptions regarding the timing of regulatory approval of principal and interest payments on the notes.
73
The internal valuation model used to estimate the fair value is based on discounted expected cash flows using information as of the measurement date. The estimated fair value of the OneBeacon Surplus Notes is sensitive to changes in treasury rates and public debt credit spreads, as well as changes in estimates with respect to other variables including a discount to reflect the private nature of the notes (and the related lack of liquidity), the credit quality of the notes - based on the financial performance of the Issuer relative to expectations, and the timing, amount, and likelihood of interest and principal payments on the notes, which are subject to regulatory approval and therefore may vary from the contractual terms. Anticipating a change in the assumed timeline, amounts, and process necessary to obtain regulatory approval, OneBeacon made a change in its estimate as of December 31, 2016 with regard to the timing of regulatory approval of principal and interest payments on the notes. For the purpose of estimating fair value, OneBeacon has currently assumed that all accrued unpaid interest on the seller priority note since the date of issuance is paid in 2020, with regular annual interest payments on both the seller priority note and pari passu note beginning thereafter, all accrued but unpaid interest on the pari passu note since the date of issuance is paid in 2025, and principal repayments begin on a graduated basis in 2030 for the seller priority note and 2035 for the pari passu note. Previously, including as of December 31, 2015, OneBeacon had assumed for the purpose of estimating fair value that interest payouts, including all accrued but unpaid amounts, began in 2020 for both notes and that principal repayments began on a graduated basis in 2025 for the seller priority note and 2030 for the pari passu note.
Although these variables involve considerable judgment, the Company does not currently expect any resulting changes in the estimated value of the OneBeacon Surplus Notes to be material to its financial position. Given these significant unobservable inputs, the OneBeacon Surplus Notes have been classified as Level 3 under the fair value hierarchy. See
“Significant Unobservable Inputs”
in
Note 5 — “Investment Securities”
on page F-50.
As a means to provide the degree of variability for each of the key assumptions that affect the fair value of the OneBeacon Surplus Notes, below is a table of sensitivities which measure hypothetical changes in such variables and the resulting pre-tax increase (or decrease) impact on the valuation of the OneBeacon Surplus Notes as of December 31, 2016.
|
Estimates affecting fair value
|
Pre-tax increase (decrease) in fair value
|
|||||||||||||||
|
Millions
|
||||||||||||||||
|
Liquidity Spread
(1)
|
-100 bp
|
-50 bp
|
+50 bp
|
+100 bp
|
||||||||||||
|
Seller priority note
|
$
|
4.6
|
|
$
|
2.3
|
|
$
|
(2.1
|
)
|
$
|
(4.1
|
)
|
||||
|
Pari passu note
|
2.1
|
|
1.0
|
|
(1.0
|
)
|
(1.9
|
)
|
||||||||
|
Total OneBeacon Surplus Notes
|
$
|
6.7
|
|
$
|
3.3
|
|
$
|
(3.1
|
)
|
$
|
(6.0
|
)
|
||||
|
Credit Assignment
(2)
|
+2 Notches
|
+1 Notch
|
-1 Notch
|
-2 Notches
|
||||||||||||
|
Seller priority note
|
$
|
9.1
|
|
$
|
4.3
|
|
$
|
(3.9
|
)
|
$
|
(7.3
|
)
|
||||
|
Pari passu note
|
4.2
|
|
1.9
|
|
(1.7
|
)
|
(3.3
|
)
|
||||||||
|
Total OneBeacon Surplus Notes
|
$
|
13.3
|
|
$
|
6.2
|
|
$
|
(5.6
|
)
|
$
|
(10.6
|
)
|
||||
|
Principal Repayments
(3)
|
-3 Years
|
-1 Year
|
+1 Year
|
+3 Years
|
||||||||||||
|
Seller priority note
|
$
|
.6
|
|
$
|
0.2
|
|
$
|
(.2
|
)
|
$
|
(.6
|
)
|
||||
|
Pari passu note
|
.7
|
|
0.2
|
|
(.2
|
)
|
(.4
|
)
|
||||||||
|
Total OneBeacon Surplus Notes
|
$
|
1.3
|
|
$
|
0.4
|
|
$
|
(0.4
|
)
|
$
|
(1.0
|
)
|
||||
|
Interest Repayments
(4)
|
-3 Years
|
-1 Year
|
+1 Year
|
+3 Years
|
||||||||||||
|
Seller priority note
|
$
|
1.9
|
|
$
|
0.9
|
|
$
|
(1.1
|
)
|
$
|
(3.8
|
)
|
||||
|
Pari passu note
|
4.4
|
|
1.4
|
|
(1.5
|
)
|
(4.5
|
)
|
||||||||
|
Total OneBeacon Surplus Notes
|
$
|
6.3
|
|
$
|
2.3
|
|
$
|
(2.6
|
)
|
$
|
(8.3
|
)
|
||||
(1)
Represents the sensitivity to changes in the estimate of the liquidity spread added to account for OneBeacon’s sole ownership of the OneBeacon Surplus Notes, lack of a liquid trading market and unique nature of the ongoing regulatory approval process.
(2)
Represents the sensitivity to changes in the estimate of the underlying equivalent credit quality of the OneBeacon Surplus Notes. Such credit quality is approximated by comparing the expected percentage of discounted payments missed, as calculated in a proprietary Stochastic simulation, to a series of benchmarks derived from data published by Standard & Poor’s. Note that “notch” is defined as the difference between, for example a “B” and “B+” rated instrument.
(3)
Represents the sensitivity to changes in the estimate of timing of the first principal payment received by OneBeacon. The fair value model assumes a delay in the receipt of principal cash flows as a result of the regulatory approval required before such payments may occur; and assuming repayments are made with a graduated impact on statutory surplus.
(4)
Represents the sensitivity to changes in the estimate of timing of the first interest payment received by OneBeacon. The fair value model assumes a delay in the receipt of interest cash flows as a result of the regulatory approval required before such payments may occur; and assuming repayments are made with a graduated impact on statutory surplus.
74
FORWARD-LOOKING STATEMENTS
This report may contain “forward-looking statements” within the meaning of Section 27A of the Securities Act of 1933 and Section 21E of the Securities Exchange Act of 1934. All statements, other than statements of historical facts, included or referenced in this report which address activities, events or developments which White Mountains expects or anticipates will or may occur in the future are forward-looking statements. The words “will”, “believe”, “intend”, “expect”, “anticipate”, “project”, “estimate”, “predict” and similar expressions are also intended to identify forward-looking statements. These forward-looking statements include, among others, statements with respect to White Mountains’:
|
•
|
change in adjusted book value per share or return on equity;
|
|
•
|
business strategy;
|
|
•
|
financial and operating targets or plans;
|
|
•
|
incurred loss and loss adjustment expenses and the adequacy of its loss and loss adjustment expense reserves and related reinsurance;
|
|
•
|
projections of revenues, income (or loss), earnings (or loss) per share, dividends, market share or other financial forecasts;
|
|
•
|
expansion and growth of its business and operations; and
|
|
•
|
future capital expenditures.
|
These statements are based on certain assumptions and analyses made by White Mountains in light of its experience and perception of historical trends, current conditions and expected future developments, as well as other factors believed to be appropriate in the circumstances. However, whether actual results and developments will conform to its expectations and predictions is subject to a number of risks and uncertainties that could cause actual results to differ materially from expectations, including:
|
•
|
the risks associated with Item 1A of this Report on Form 10-K;
|
|
•
|
claims arising from catastrophic events, such as hurricanes, earthquakes, floods, fires, terrorist attacks or severe winter weather;
|
|
•
|
the continued availability of capital and financing;
|
|
•
|
general economic, market or business conditions;
|
|
•
|
business opportunities (or lack thereof) that may be presented to it and pursued;
|
|
•
|
competitive forces, including the conduct of other property and casualty insurers;
|
|
•
|
changes in domestic or foreign laws or regulations, or their interpretation, applicable to White Mountains, its competitors or its customers;
|
|
•
|
an economic downturn or other economic conditions adversely affecting its financial position;
|
|
•
|
recorded loss reserves subsequently proving to have been inadequate;
|
|
•
|
actions taken by ratings agencies from time to time, such as financial strength or credit ratings downgrades or placing ratings on negative watch; and
|
|
•
|
other factors, most of which are beyond White Mountains’s control.
|
Consequently, all of the forward-looking statements made in this report are qualified by these cautionary statements, and there can be no assurance that the actual results or developments anticipated by White Mountains will be realized or, even if substantially realized, that they will have the expected consequences to, or effects on, White Mountains or its business or operations. White Mountains assumes no obligation to publicly update any such forward-looking statements, whether as a result of new information, future events or otherwise.
White Mountains’s consolidated balance sheet includes a substantial amount of assets and liabilities whose fair values are subject to market risk. The term market risk refers to the risk of loss arising from adverse changes in interest rates, credit spreads, equity markets prices and other relevant market rates and prices. Due to White Mountains’s sizable investment portfolio market risk can have a significant effect on White Mountains’s consolidated financial position.
75
Interest Rate and Credit Spread Risk
Fixed Maturity Investments.
In connection with the Company’s consolidated insurance subsidiaries, White Mountains invests in interest rate sensitive securities. White Mountains generally manages the interest rate risk associated with its portfolio of fixed maturity investments by monitoring the average duration of the portfolio. White Mountains’s fixed maturity investments are comprised primarily of investment grade debt securities issued by corporations, U.S. government and agency obligations, foreign government, agency and provincial obligations, preferred stocks, mortgage and asset-backed securities and municipal obligations.
Increases and decreases in prevailing interest rates generally translate into decreases and increases in fair values of fixed maturity investments, respectively. Additionally, fair values of interest rate sensitive instruments may be affected by the creditworthiness of the issuer, prepayment options, relative values of alternative investments, the liquidity of the instrument and other market factors.
The table below summarizes the estimated effects of hypothetical increases and decreases in market interest rates on White Mountains’s fixed maturity investments. Size of interest rate decreases may be limited in order to floor interest rates at a de minimis level.
|
$ in millions
|
Fair Value at
December 31, 2016
|
Assumed Change in Relevant Interest Rate
|
Estimated Fair Value
After Change in
Interest Rate
|
After-Tax Increase(Decrease) in Carrying Value
|
||||||||||
|
Fixed maturity investments
(1)
|
$
|
4,256.8
|
|
100 bp decrease
|
$
|
4,368.8
|
|
$
|
94.4
|
|
||||
|
50 bp decrease
|
4,317.3
|
|
51.0
|
|
||||||||||
|
50 bp increase
|
4,192.0
|
|
(55.1
|
)
|
||||||||||
|
100 bp increase
|
4,125.7
|
|
(111.5
|
)
|
||||||||||
(1)
Includes carrying value of
$6.6
in fixed maturity investments that are classified as assets held for sale related to SSIE.
The magnitude of the fair value decrease in rising rates scenarios may be more significant than the fair value increase in comparable falling rates scenarios. This can occur because (a) the analysis floors interest rates at a de minimis level in falling rate scenarios, muting price increases, (b) portions of the fixed maturity investment portfolio may be callable, muting price increases in falling interest rate scenarios and or (c) portions of the fixed maturity investment portfolio may experience cash flow extension in higher interest rate environments, which generally results in lower prices.
White Mountains’s overall fixed maturity investment strategy is to purchase securities that are attractively priced in relation to their investment risks. Widening and tightening of credit spreads translate into decreases and increases in fair values of fixed maturity investments, respectively. The table below summarizes the estimated pre-tax effects of hypothetical widening and tightening of credit spreads on White Mountains’s fixed maturity investment portfolio.
|
December 31, 2016
|
||||||||||||||||||||
|
Millions
|
Fair Value
|
Tighten 50
|
Tighten 25
|
Widen 25
|
Widen 50
|
|||||||||||||||
|
U.S. Government and agency obligations
|
$
|
278.3
|
|
$
|
—
|
|
$
|
—
|
|
$
|
—
|
|
$
|
—
|
|
|||||
|
Foreign government, agency and provincial obligations
|
13.2
|
|
—
|
|
—
|
|
—
|
|
—
|
|
||||||||||
|
Tighten 100
|
Tighten 50
|
Widen 50
|
Widen 100
|
|||||||||||||||||
|
Agency mortgage-backed
|
652.0
|
|
15.5
|
|
9.0
|
|
(9.7
|
)
|
(19.0
|
)
|
||||||||||
|
Asset-backed
|
1,148.1
|
|
13.0
|
|
8.5
|
|
(10.5
|
)
|
(21.0
|
)
|
||||||||||
|
Tighten 200
|
Tighten 100
|
Widen 100
|
Widen 200
|
|||||||||||||||||
|
Debt securities issued by corporations
(1)
|
1,509.4
|
|
79.8
|
|
53.9
|
|
(58.2
|
)
|
(114.5
|
)
|
||||||||||
|
Municipal obligations
|
309.0
|
|
16.9
|
|
9.1
|
|
(10.6
|
)
|
(20.7
|
)
|
||||||||||
|
Tighten 400
|
Tighten 200
|
Widen 200
|
Widen 400
|
|||||||||||||||||
|
Non-agency commercial mortgage-backed
|
127.5
|
|
10.9
|
|
7.2
|
|
(7.8
|
)
|
(15.0
|
)
|
||||||||||
|
Tighten 600
|
Tighten 300
|
Widen 300
|
Widen 600
|
|||||||||||||||||
|
Preferred stocks
|
14.0
|
|
2.0
|
|
2.0
|
|
(5.3
|
)
|
(7.8
|
)
|
||||||||||
|
Non-agency residential mortgage-backed
|
205.3
|
|
16.1
|
|
16.1
|
|
(21.9
|
)
|
(39.5
|
)
|
||||||||||
(1)
Includes carrying value of
$6.6
in fixed maturity investments that are classified as assets held for sale related to SSIE.
76
The magnitude of the fair value decrease in wider credit spread scenarios may be more significant than the fair value increase in comparable tighter credit spread scenarios. This can occur because the analysis limits the credit spread tightening in order to floor yields of non-government bonds above yields of short government bonds, muting price increases.
Common Equity Securities and Other Long-term Investments Price Risk
The carrying values of White Mountains’s common equity securities and other long-term investments are based on quoted market prices or management’s estimates of fair value as of the balance sheet date. Market prices of common equity securities, in general, are subject to fluctuations. These fluctuations could cause the amount realized upon sale or exercise of these instruments to differ significantly from the current reported value. The fluctuations may result from perceived changes in the underlying economic characteristics of the investment, the relative price of alternative investments, supply and demand imbalances for a particular security, or other market factors. Assuming a hypothetical 10% and 30% increase or decrease in the value of White Mountains’s common equity securities and other long-term investments as of December 31, 2016, the carrying value of White Mountains’s common equity securities and other long-term investments would have increased or decreased by approximately $80 million and $239 million pre-tax.
Long-term obligations
White Mountains carries its financial instruments on its balance sheet at fair value with the exception of the OBH Senior Notes and the MediaAlpha Bank Facility.
The following table summarizes the fair value and carrying value of these financial instruments as of
December 31, 2016 and 2015
:
|
December 31, 2016
|
December 31, 2015
|
|||||||||||||||
|
Millions
|
Fair
Value
|
Carrying
Value
|
Fair
Value
|
Carrying
Value
|
||||||||||||
|
OBH Senior Notes
|
$
|
274.2
|
|
$
|
273.2
|
|
$
|
276.4
|
|
$
|
272.9
|
|
||||
|
MediaAlpha Bank Facility
|
13.0
|
|
12.7
|
|
15.0
|
|
14.7
|
|
||||||||
The fair value estimate for the OBH Senior Notes has been determined using observable inputs and is considered a Level 2 measurement. The fair value estimate for the MediaAlpha Bank Facility has been determined based on a discounted cash flows approach and is considered to be a Level 3 measurement.
Foreign Currency Exchange Risk
The majority of White Mountains’s exposure to foreign currency exchange rate risk was eliminated when Sirius Group was sold to CMI on April 18, 2016. As of December 31, 2016, White Mountains’s remaining gross foreign currency exchange rate risk was approximately $291 million and relates to cash and fixed income securities denominated in GBP, common equity securities managed by Silchester, Wobi and various other consolidated and non-controlling interests in private capital investments. In 2016, White Mountains entered into a foreign currency forward contract to economically hedge the GBP foreign currency exposure in its LGIM portfolio. At December 31, 2016, the fair value of the LGIM portfolio, including cash, was approximately $184 million and White Mountains held
$185 million
(GBP
150 million
) total gross notional value of a foreign currency forward contract, with a fair value of approximately $186 million. At December 31, 2016, White Mountains’s net foreign currency exchange rate risk was approximately $105 million.
The financial statements and supplementary data have been filed as a part of this Annual Report on Form 10-K as indicated in the Index to Consolidated Financial Statements and Financial Statement Schedules appearing on page 83 of this report.
The financial statements of Symetra for the interim period ended September 30, 2015 and the year ended December 31, 2014 have been filed as a part of this Annual Report on Form 10-K (see Exhibits 99.1 and 99.2 on page 81 of this report).
None.
77
The Principal Executive Officer (“PEO”) and the Principal Financial Officer (“PFO”) of White Mountains have evaluated the effectiveness of its disclosure controls and procedures (as defined in Rule 13a-15(e) of the Exchange Act) as of
December 31, 2016
. Based on that evaluation, the PEO and PFO have concluded that White Mountains’s disclosure controls and procedures are adequate and effective.
The PEO and the PFO of White Mountains have evaluated the effectiveness of its internal control over financial reporting as of
December 31, 2016
. Based on that evaluation, the PEO and PFO have concluded that White Mountains’s internal control over financial reporting is effective. Management’s annual report on internal control over financial reporting is included on page F-94 of this report. The attestation report on the effectiveness of our internal control over financial reporting by PricewaterhouseCoopers LLP is included on page F-95 of this report.
There has been no change in White Mountains’s internal controls over financial reporting that occurred during the fourth quarter of
2016
that has materially affected, or is reasonably likely to materially affect White Mountains’s internal control over financial reporting.
None.
Item 10.
Directors, Executive Officers and Corporate Governance
Reported under the captions “The Board of Directors”, “Section 16(a) Beneficial Ownership Reporting Compliance” and “Corporate Governance—Committees of the Board—Audit Committee” in the Company’s 2017 Proxy Statement, herein incorporated by reference, and under the caption “Executive Officers of the Registrant” of this Annual Report on Form 10-K.
The Company’s Code of Business Conduct, which applies to all directors, officers and employees in carrying out their responsibilities to and on behalf of the Company, is available at
www.whitemountains.com
and is also included as Exhibit 14 on the Form 10-K. The Company’s Code of Business Conduct is also available in print free of charge to any shareholder upon request.
There have been no material changes to the procedures by which shareholders may recommend nominees to the Company’s Board of Directors. The procedures for shareholders to nominate directors are reported under the caption “Corporate Governance—Committees of the Board—Nominating and Governance Committee” in the Company’s 2017 Proxy Statement, herein incorporated by reference.
Reported under the captions “Executive Compensation” and “Corporate Governance—Compensation Committee Interlocks and Insider Participation” in the Company’s 2017 Proxy Statement, herein incorporated by reference.
Reported under the captions “Voting Securities and Principal Holders Thereof” and “Equity Compensation Plan Information” in the Company’s 2017 Proxy Statement, herein incorporated by reference.
Reported under the caption “Transactions with Related Persons, Promoters and Certain Control Persons” and “Corporate Governance—Director Independence” in the Company’s 2017 Proxy Statement, herein incorporated by reference.
Reported under the caption “Principal Accountant Fees and Services” in the Company’s 2017 Proxy Statement, herein incorporated by reference.
78
a.
Documents Filed as Part of the Report
The financial statements and financial statement schedules and reports of independent auditors have been filed as part of this Annual Report on Form 10-K as indicated in the Index to Consolidated Financial Statements and Financial Statement Schedules appearing on page 83 of this report. A listing of exhibits filed as part of the report appear on pages 79 through 81 of this report.
b.
Exhibits
|
Exhibit
number
|
Name
|
|
|
2
|
Plan of Reorganization (incorporated by reference herein to the Company’s Registration Statement on S-4 (No. 333-87649) dated September 23, 1999)
|
|
|
3.1
|
Memorandum of Continuance of the Company (incorporated by reference herein to Exhibit (3)(i) of the Company’s Current Report on Form 8-K dated November 1, 1999)
|
|
|
3.2
|
Amended and Restated Bye-Laws of the Company (incorporated by reference herein to Exhibit 3.2 of the Company’s 2012 Annual Report on Form 10-K)
|
|
|
4.1
|
Indenture, dated as of November 9, 2012, among OneBeacon U.S. Holdings, Inc., the Company, and The Bank of New York Mellon Trust Company, N.A. (incorporated by reference herein to Exhibit 4.3 of the Company’s 2012 Annual Report on Form 10-K)
|
|
|
4.2
|
First Supplemental Indenture, dated as of November 9, 2012, among OneBeacon U.S. Holdings, Inc., the Company and The Bank of New York Mellon Trust Company, N.A. (incorporated by reference herein to Exhibit 4.4 of the Company’s 2012 Annual Report on Form 10-K)
|
|
|
10.1
|
$425,000,000 Credit Agreement, dated August 14, 2013 among the Company, as the Borrower, Wells Fargo Bank, N.A., as Administrative Agent, Swing Line Lender and Issuing Lender, and the other lenders party hereto (incorporated by reference herein to Exhibit 10.1 of the Company’s Report on Form 10-Q dated October 28, 2013)
|
|
|
10.2
|
Amendment No.1 to the $425,000,000 Credit Agreement, dated August 14, 2013 among the Company, as the Borrower, Wells Fargo Bank, N.A., as Administrative Agent, Swing Line Lender and Issuing Lender, and the other lenders party hereto.(incorporated by reference herein to Exhibit 10.1 of the Company’s Report on Form 10-Q dated October 29, 2014)
|
|
|
10.3
|
Amended and restated Investment Management Agreement between White Mountains Advisors, LLC and OneBeacon dated December 23, 2014 (incorporated by reference herein to Exhibit 10.6 of the Company’s 2014 Annual Report on Form 10-K)
|
|
|
10.4
|
White Mountains Long-Term Incentive Plan, as amended, (incorporated by reference to Appendix A of the Company’s Notice of 2013 Annual General Meeting of Members and Proxy Statement dated April 10, 2013)
|
|
|
10.5
|
White Mountains Bonus Plan (incorporated by reference herein to Exhibit 10.10 of the Company’s 2015 Annual Report on Form 10-K)
|
|
|
10.6
|
OneBeacon Deferred Compensation Plan (incorporated by reference herein to Exhibit 10.16 of the Company’s 2012 Annual Report on Form 10-K)
|
|
|
10.7
|
OneBeacon Long-Term Incentive Plan (2007) (incorporated by reference herein to Exhibit 10.15 of the Company’s 2014 Annual Report on Form 10-K)
|
|
|
10.8
|
OneBeacon’s 2016 Management Incentive Plan (*)
|
|
|
10.9
|
Restricted Share Award Agreement by and between OneBeacon Insurance Group, Ltd. And T. Michael Miller dated as of May 27, 2011(incorporated by reference herein to Exhibit 10.22 of the Company’s 2011 Annual Report on Form 10-K)
|
|
79
|
Exhibit
number
|
Name
|
|
|
10.10
|
Nonqualified Stock Option Agreement made as of the 6th day of March 2007, by and between the Company and Raymond Barrette (incorporated by reference herein to Exhibit 99.1 of the Company’s Report on Form 8-K/A dated March 7, 2007)
|
|
|
10.11
|
Amendment No. 1 to Nonqualified Stock Option Agreement made as of the 10th day of August 2010, by and between the Company and Raymond Barrette (incorporated by reference herein to Exhibit 10.1 of the Company’s Report on Form 10-Q dated October 29, 2010)
|
|
|
10.12
|
Restricted Share Award Agreement made as of the 6th day of March 2007, by and between the Company and Raymond Barrette (incorporated by reference herein to Exhibit 99.2 of the Company’s Report on Form 8-K/A dated March 7, 2007)
|
|
|
10.13
|
Amendment No.1 to Restricted Share Award Agreement made as of the 10th day of August 2010, by and between the Company and Raymond Barrette (incorporated by reference herein to Exhibit 10.2 of the Company’s Report on Form 10-Q dated October 29, 2010)
|
|
|
10.14
|
Stock Purchase Agreement, dated May 17, 2011, between White Mountains Holdings (Luxembourg) S.à r.l. and The Allstate Corporation (incorporated by reference herein to Exhibit 10.1 of the Company’s Report on Form 8-K dated May 18, 2011)
|
|
|
10.15
|
$57,900,000 Seller Priority Surplus Note, dated as of December 23, 2014, of Bedivere Insurance Company (formerly OneBeacon Insurance Company) (*)
|
|
|
10.16
|
$43,100,000 Seller Pari Passu Surplus Note, dated as of December 23, 2014, of Bedivere Insurance Company (formerly OneBeacon Insurance Company) (*)
|
|
|
10.17
|
Regulation 114 Trust Agreement by and among Build America Mutual Assurance Company, HG Re Ltd. and The Bank of New York Mellon, dated as of July 20, 2012. (incorporated by reference herein to Exhibit 10.2 of the Company’s Report on 10-Q dated October 30, 2012)
|
|
|
10.18
|
Supplemental Trust Agreement by and among Build America Mutual Assurance Company, HGR Patton (Luxembourg) S.à r.l., United States of America Branch,
and The Bank of New York Mellon, dated as of July 20, 2012. (incorporated by reference herein to Exhibit 10.3 of the Company’s Report on 10-Q dated
October 30, 2012)
|
|
|
10.19
|
Surplus Note Purchase Agreement between Build America Mutual Assurance Company, as Issuer and HG Holdings Ltd. and HG Re Ltd. as Purchasers dated as of July 17, 2012.(incorporated by reference herein to Exhibit 10.4 of the Company’s Report on 10-Q dated October 30, 2012)
|
|
|
10.20
|
Amended and Restated Surplus Note Purchase Agreement between Build America Mutual Assurance Company, as Issuer and HG Holdings Ltd. and HG Re Ltd. as Purchasers dated as of January 1, 2014.(incorporated by reference herein to Exhibit 10.1 of the Company’s Report on 10-Q dated April 28, 2014)
|
|
|
10.21
|
Stock Purchase Agreement dated July 24, 2015 between Lone Tree Holdings Ltd., Sirius International Insurance Group, Ltd., CM International Holding Pte. Ltd. and CM Bermuda Limited (incorporated by reference herein to Exhibit 10.1 of the Company's Report on Form 8-K dated July 24, 2015)
|
|
|
11
|
Statement Re Computation of Per Share Earnings (**)
|
|
|
12
|
Statement Re Computation of Ratio of Earnings to Fixed Charges (*)
|
|
|
14
|
The Company’s Code of Business Conduct, which applies to all directors, officers and employees in carrying out their responsibilities to and on behalf of the Company (incorporated by reference herein to Exhibit 14 of the Company’s 2015 Annual Report on Form 10-K)
|
|
|
21
|
Subsidiaries of the Registrant (*)
|
|
|
23.1
|
Consent of PricewaterhouseCoopers LLP (*)
|
|
|
23.2
|
Consent of Ernst & Young LLP (*)
|
|
80
|
Exhibit
number
|
Name
|
|
|
24
|
Powers of Attorney (*)
|
|
|
31.1
|
Principal Executive Officer Certification Pursuant to Rule 13a-14 (a) of the Securities Exchange Act of 1934 (*)
|
|
|
31.2
|
Principal Financial Officer Certification Pursuant to Rule 13a-14 (a) of the Securities Exchange Act of 1934 (*)
|
|
|
32.1
|
Principal Executive Officer Certification Pursuant to 18 U.S.C. Section 1350, as Adopted Pursuant to Section 906 of the Sarbanes-Oxley Act of 2002 (*)
|
|
|
32.2
|
Principal Financial Officer Certification Pursuant to 18 U.S.C. Section 1350, as Adopted Pursuant to Section 906 of the Sarbanes-Oxley Act of 2002 (*)
|
|
|
99.1
|
Symetra Financial Corporation’s financial statement for the years ended December 31, 2014 (incorporated by reference herein from Symetra Financial Corporation’s 2014 Annual Report on Form 10-K dated February 26, 2015 and Form 10-K/A dated April 22, 2015, Commission file number: 001-33808) (***)
|
|
|
99.2
|
Symetra Financial Corporation’s financial statements for the interim period ended September 30, 2015 (incorporated by reference herein from Symetra Financial Corporation’s Report on Form 10-Q dated November 6, 2015, Commission file number: 001-33808) (***)
|
|
|
101.1
|
The following financial information from White Mountains’s Annual Report on Form 10-K for the year ended December 31, 2016 formatted in XBRL: (i) Consolidated balance sheets as of December 31, 2016 and December 31, 2015; (ii) Consolidated statements of operations and comprehensive income for each of the years ended December 31, 2016, 2015 and 2014; (iii) Consolidated statements of shareholders’ equity for each of the years ended December 31, 2016, 2015 and 2014; (iv) Consolidated statements of cash flows for each of the years ended December 31, 2016, 2015 and 2014; and (v) Notes to consolidated financial statements (*).
|
|
|
(*)
|
Included herein.
|
|
(**)
|
Not included herein as the information is contained elsewhere within report. See
|
|
(***)
|
Exhibits 99.1 and 99.2 to this Annual Report on Form 10-K are being filed to provide audited and unaudited financial statements and the related footnotes of Symetra in accordance with SEC Rule 3-09 of Regulation S-X. The management of Symetra is solely responsible for the form and content of the Symetra financial statements. White Mountains has no responsibility for the form or content of the Symetra financial statements since it does not control Symetra.
|
c.
Financial Statement Schedules
The financial statement schedules and report of independent registered public accounting firm have been filed as part of this Annual Report on Form 10-K as indicated in the Index to Consolidated Financial Statements and Financial Statement Schedules appearing on page 83 of this report.
None.
81
SIGNATURES
Pursuant to the requirements of Section 13 or 15(d) of the Securities Exchange Act of 1934, the Company has duly caused this report to be signed on its behalf by the undersigned, thereunto duly authorized.
|
WHITE MOUNTAINS INSURANCE GROUP, LTD.
|
|||
|
Date:
|
February 27, 2017
|
By:
|
/s/ J. BRIAN PALMER
|
|
J. Brian Palmer
|
|||
|
Managing Director and Chief Accounting Officer
|
|||
Pursuant to the requirements of the Securities Exchange Act of 1934, this report has been signed below by the following persons on behalf of the Company and in the capacities and on the dates indicated.
|
Signature
|
Title
|
Date
|
||
|
/s/ RAYMOND BARRETTE
|
Chairman, CEO (Principal Executive Officer) and Director
|
February 27, 2017
|
||
|
Raymond Barrette
|
||||
|
YVES BROUILLETTE*
|
Director
|
February 27, 2017
|
||
|
Yves Brouillette
|
||||
|
MORGAN W. DAVIS*
|
Director
|
February 27, 2017
|
||
|
Morgan W. Davis
|
||||
|
A. MICHAEL FRINQUELLI*
|
Director
|
February 27, 2017
|
||
|
A. Michael Frinquelli
|
||||
|
/s/ DAVID T. FOY
|
Executive Vice President and CFO (Principal Financial Officer)
|
February 27, 2017
|
||
|
David T. Foy
|
||||
|
EDITH E. HOLIDAY*
|
Director
|
February 27, 2017
|
||
|
Edith E. Holiday
|
||||
|
/s/ J. BRIAN PALMER
|
Managing Director and Chief Accounting Officer (Principal Accounting Officer)
|
February 27, 2017
|
||
|
Brian Palmer
|
||||
|
LOWNDES A. SMITH*
|
Director
|
February 27, 2017
|
||
|
Lowndes A. Smith
|
||||
|
GARY C. TOLMAN*
|
Director
|
February 27, 2017
|
||
|
Gary C. Tolman
|
||||
|
* By:
|
/s/ RAYMOND BARRETTE
|
|
|
Raymond Barrette,
Attorney-in-Fact
|
||
82
WHITE MOUNTAINS INSURANCE GROUP, LTD.
Index to Consolidated Financial Statements and Financial Statement Schedules
|
Form 10-K
page(s)
|
||
|
Consolidated financial statements:
|
||
|
December 31, 201
6, 2015 and 2014
|
||
|
December 31, 201
6, 2015 and 2014
|
F-3
|
|
|
F-4
|
||
|
F-5
|
||
|
Other financial information:
|
||
|
Financial statement schedules:
|
||
83
|
CONSOLIDATED BALANCE SHEETS
|
||||||||
|
|
December 31,
|
|||||||
|
Millions, except share and per share amounts
|
2016
|
|
2015
|
|||||
|
Assets
|
||||||||
|
Fixed maturity investments, at fair value
|
$
|
4,250.2
|
|
|
$
|
2,630.2
|
|
|
|
Short-term investments, at amortized cost (which approximates fair value)
|
287.0
|
|
|
211.2
|
|
|||
|
Common equity securities, at fair value
|
474.3
|
|
|
1,113.9
|
|
|||
|
Other long-term investments
|
323.3
|
|
|
315.8
|
|
|||
|
Total investments
|
5,334.8
|
|
|
4,271.1
|
|
|||
|
Cash (restricted $0.0 and $5.8)
|
149.8
|
|
|
173.0
|
|
|||
|
Reinsurance recoverable on unpaid losses
|
172.9
|
|
|
186.0
|
|
|||
|
Reinsurance recoverable on paid losses
|
6.6
|
|
|
7.5
|
|
|||
|
Insurance premiums receivable
|
229.9
|
|
|
220.3
|
|
|||
|
Deferred acquisition costs
|
106.9
|
|
|
107.6
|
|
|||
|
Deferred tax asset
|
126.7
|
|
|
112.8
|
|
|||
|
Ceded unearned insurance premiums
|
44.2
|
|
|
29.5
|
|
|||
|
Accrued investment income
|
26.1
|
|
|
13.9
|
|
|||
|
Accounts receivable on unsettled investment sales
|
6.2
|
|
|
41.9
|
|
|||
|
Goodwill and intangible assets
|
55.9
|
|
55.4
|
|
||||
|
Other assets
|
274.6
|
|
|
273.2
|
|
|||
|
Assets held for sale
|
10.1
|
|
|
4,790.4
|
|
|||
|
Total assets
|
$
|
6,544.7
|
|
|
$
|
10,282.6
|
|
|
|
Liabilities
|
|
|
|
|
|
|||
|
Loss and loss adjustment expense reserves
|
$
|
1,365.6
|
|
|
$
|
1,389.8
|
|
|
|
Unearned insurance premiums
|
658.0
|
|
|
610.5
|
|
|||
|
Debt
|
285.9
|
|
|
337.6
|
|
|||
|
Accrued incentive compensation
|
140.0
|
|
|
140.7
|
|
|||
|
Funds held under insurance contracts
|
153.0
|
|
|
137.8
|
|
|||
|
Other liabilities
|
199.9
|
|
|
250.8
|
|
|||
|
Liabilities held for sale
|
5.1
|
|
|
3,047.4
|
|
|||
|
Total liabilities
|
2,807.5
|
|
|
5,914.6
|
|
|||
|
Equity
|
|
|
|
|
|
|||
|
White Mountains’s common shareholders’ equity
|
|
|
|
|
|
|||
|
White Mountains’s common shares at $1 par value per share—authorized 50,000,000
shares; issued and outstanding 4,563,814 and 5,623,735 shares |
4.6
|
|
|
5.6
|
|
|||
|
Paid-in surplus
|
806.1
|
|
|
972.6
|
|
|||
|
Retained earnings
|
2,797.2
|
|
|
3,084.9
|
|
|||
|
Accumulated other comprehensive loss, after-tax:
|
|
|||||||
|
Net unrealized foreign currency translation losses
|
(1.4
|
)
|
|
(145.6
|
)
|
|||
|
Pension liability and other
|
(3.2
|
)
|
|
(4.3
|
)
|
|||
|
Total White Mountains’s common shareholders’ equity
|
3,603.3
|
|
|
3,913.2
|
|
|||
|
Non-controlling interests
|
133.9
|
|
454.8
|
|
||||
|
Total equity
|
3,737.2
|
|
4,368.0
|
|
||||
|
Total liabilities and equity
|
$
|
6,544.7
|
|
$
|
10,282.6
|
|
||
See Notes to Consolidated Financial Statements including
Note 14
for non-controlling interests and
Note 21
for Commitments and Contingencies.
F-1
|
Year Ended December 31,
|
||||||||||||
|
Millions, except per share amounts
|
2016
|
2015
|
2014
|
|||||||||
|
Revenues
|
||||||||||||
|
Earned insurance premiums
|
$
|
1,114.0
|
|
$
|
1,188.2
|
|
$
|
1,185.0
|
|
|||
|
Net investment income
|
86.8
|
|
60.8
|
|
59.5
|
|
||||||
|
Net realized and unrealized investment gains
|
10.3
|
|
225.4
|
|
78.5
|
|
||||||
|
Other revenue
|
149.6
|
|
147.3
|
|
88.1
|
|
||||||
|
Total revenues
|
1,360.7
|
|
1,621.7
|
|
1,411.1
|
|
||||||
|
Expenses
|
||||||||||||
|
Loss and loss adjustment expenses
|
664.0
|
|
708.9
|
|
824.0
|
|
||||||
|
Insurance acquisition expenses
|
211.6
|
|
220.1
|
|
206.2
|
|
||||||
|
Other underwriting expenses
|
209.5
|
|
218.6
|
|
179.6
|
|
||||||
|
General and administrative expenses
|
299.9
|
|
302.2
|
|
216.5
|
|
||||||
|
Interest expense on debt
|
16.1
|
|
14.6
|
|
14.2
|
|
||||||
|
Total expenses
|
1,401.1
|
|
1,464.4
|
|
1,440.5
|
|
||||||
|
Pre-tax (loss) income from continuing operations
|
(40.4
|
)
|
157.3
|
|
(29.4
|
)
|
||||||
|
Income tax benefit
|
45.4
|
|
.2
|
|
14.8
|
|
||||||
|
Net income (loss) from continuing operations
|
5.0
|
|
157.5
|
|
(14.6
|
)
|
||||||
|
Gain from sale of Sirius Group, net of tax
|
363.2
|
|
—
|
|
—
|
|
||||||
|
Gain from sale of Tranzact, net of tax
|
51.9
|
|
—
|
|
—
|
|
||||||
|
Gain from sale of Esurance and AFI, net of tax
|
—
|
|
17.9
|
|
3.2
|
|
||||||
|
Gain (loss) from sale of other discontinued operations, net of tax
|
—
|
|
.3
|
|
(4.8
|
)
|
||||||
|
Net (loss) income from discontinued operations, net of tax
|
(.3
|
)
|
78.7
|
|
260.6
|
|
||||||
|
Income before equity in earnings of unconsolidated affiliates
|
419.8
|
|
254.4
|
|
244.4
|
|
||||||
|
Equity in earnings of unconsolidated affiliates, net of tax
|
—
|
|
25.1
|
|
45.6
|
|
||||||
|
Net income
|
419.8
|
|
279.5
|
|
290.0
|
|
||||||
|
Net (income) loss attributable to non-controlling interests
|
(7.3
|
)
|
18.1
|
|
22.2
|
|
||||||
|
Net income attributable to White Mountains’s common shareholders
|
412.5
|
|
297.6
|
|
312.2
|
|
||||||
|
Other comprehensive income, net of tax:
|
||||||||||||
|
Change in equity in net unrealized investment (losses) gains in Symetra common shares, net of tax
|
—
|
|
(34.9
|
)
|
75.3
|
|
||||||
|
Change in foreign currency translation, pension liability and other, net of tax
|
.3
|
|
(.5
|
)
|
(10.7
|
)
|
||||||
|
Change in foreign currency translation and other from discontinued operations, net of tax
|
32.0
|
|
(65.0
|
)
|
(169.5
|
)
|
||||||
|
Recognition of foreign currency translation and other from sale of Sirius Group, net of tax
|
113.3
|
|
—
|
|
—
|
|
||||||
|
Comprehensive income
|
558.1
|
|
197.2
|
|
207.3
|
|
||||||
|
Comprehensive (income) loss attributable to non-controlling interests
|
(.3
|
)
|
—
|
|
3.3
|
|
||||||
|
Comprehensive income attributable to White Mountains’s common
shareholders |
$
|
557.8
|
|
$
|
197.2
|
|
$
|
210.6
|
|
|||
|
Earnings per share attributable to White Mountains’s common
shareholders
|
||||||||||||
|
Basic earnings per share
|
||||||||||||
|
Continuing operations
|
$
|
(.47
|
)
|
$
|
34.12
|
|
$
|
8.70
|
|
|||
|
Discontinued operations
|
82.71
|
|
16.48
|
|
42.43
|
|
||||||
|
Total consolidated operations
|
$
|
82.24
|
|
$
|
50.60
|
|
$
|
51.13
|
|
|||
|
Diluted earnings per share
|
||||||||||||
|
Continuing operations
|
$
|
(.47
|
)
|
$
|
34.12
|
|
$
|
8.70
|
|
|||
|
Discontinued operations
|
82.66
|
|
16.48
|
|
42.43
|
|
||||||
|
Total consolidated operations
|
$
|
82.19
|
|
$
|
50.60
|
|
$
|
51.13
|
|
|||
|
Dividends declared and paid per White Mountains’s common share
|
$
|
1.00
|
|
$
|
1.00
|
|
$
|
1.00
|
|
|||
See Notes to Consolidated Financial Statements.
F-2
|
CONSOLIDATED STATEMENTS OF SHAREHOLDERS’ EQUITY
|
||||||||||||||||||||||||
|
White Mountains’s Common Shareholders’ Equity
|
||||||||||||||||||||||||
|
Millions
|
Common shares and
paid-in
surplus
|
Retained
earnings
|
AOCL,
after-tax
|
Total
|
Non-controlling
Interests
|
Total Equity
|
||||||||||||||||||
|
Balances at December 31, 2013
|
$
|
1,051.1
|
|
$
|
2,801.9
|
|
$
|
52.1
|
|
$
|
3,905.1
|
|
$
|
491.7
|
|
$
|
4,396.8
|
|
||||||
|
Net income (loss)
|
—
|
|
312.2
|
|
—
|
|
312.2
|
|
(22.2
|
)
|
290.0
|
|
||||||||||||
|
Net change in unrealized investment gains in unconsolidated affiliates
|
—
|
|
—
|
|
75.3
|
|
75.3
|
|
—
|
|
75.3
|
|
||||||||||||
|
Net change in foreign currency translation
|
—
|
|
—
|
|
(168.2
|
)
|
(168.2
|
)
|
(.3
|
)
|
(168.5
|
)
|
||||||||||||
|
Net change in pension liability and other accumulated comprehensive items
|
—
|
|
—
|
|
(8.7
|
)
|
(8.7
|
)
|
(3.0
|
)
|
(11.7
|
)
|
||||||||||||
|
Comprehensive income (loss)
|
—
|
|
312.2
|
|
(101.6
|
)
|
210.6
|
|
(25.5
|
)
|
185.1
|
|
||||||||||||
|
Dividends declared on common shares
|
—
|
|
(6.2
|
)
|
—
|
|
(6.2
|
)
|
—
|
|
(6.2
|
)
|
||||||||||||
|
Dividends/distributions to
non-controlling interests
|
—
|
|
—
|
|
—
|
|
—
|
|
(40.7
|
)
|
(40.7
|
)
|
||||||||||||
|
Issuances of common shares
|
4.8
|
|
—
|
|
—
|
|
4.8
|
|
—
|
|
4.8
|
|
||||||||||||
|
Repurchases and retirements of common shares
|
(37.1
|
)
|
(97.4
|
)
|
—
|
|
(134.5
|
)
|
—
|
|
(134.5
|
)
|
||||||||||||
|
Net contributions from non-controlling interests
|
—
|
|
—
|
|
—
|
|
—
|
|
8.3
|
|
8.3
|
|
||||||||||||
|
Acquisition of subsidiary
|
—
|
|
—
|
|
—
|
|
—
|
|
122.1
|
|
122.1
|
|
||||||||||||
|
Redemptions of Prospector Turtle Fund
|
—
|
|
—
|
|
—
|
|
—
|
|
(14.0
|
)
|
(14.0
|
)
|
||||||||||||
|
Amortization of restricted share and
option awards
|
15.9
|
|
—
|
|
—
|
|
15.9
|
|
.8
|
|
16.7
|
|
||||||||||||
|
Balances at December 31, 2014
|
1,034.7
|
|
3,010.5
|
|
(49.5
|
)
|
3,995.7
|
|
542.7
|
|
4,538.4
|
|
||||||||||||
|
Net income (loss)
|
—
|
|
297.6
|
|
—
|
|
297.6
|
|
(18.1
|
)
|
279.5
|
|
||||||||||||
|
Net change in unrealized investment losses in unconsolidated affiliates
|
—
|
|
—
|
|
(34.9
|
)
|
(34.9
|
)
|
—
|
|
(34.9
|
)
|
||||||||||||
|
Net change in foreign currency translation
|
—
|
|
—
|
|
(65.8
|
)
|
(65.8
|
)
|
—
|
|
(65.8
|
)
|
||||||||||||
|
Net change in pension liability and
other accumulated comprehensive items
|
—
|
|
—
|
|
.3
|
|
.3
|
|
—
|
|
.3
|
|
||||||||||||
|
Comprehensive income (loss)
|
—
|
|
297.6
|
|
(100.4
|
)
|
197.2
|
|
(18.1
|
)
|
179.1
|
|
||||||||||||
|
Dividends declared on common shares
|
—
|
|
(6.0
|
)
|
—
|
|
(6.0
|
)
|
—
|
|
(6.0
|
)
|
||||||||||||
|
Dividends/distributions to non-controlling interests
|
—
|
|
—
|
|
—
|
|
—
|
|
(51.1
|
)
|
(51.1
|
)
|
||||||||||||
|
Issuances of common shares
|
.9
|
|
—
|
|
—
|
|
.9
|
|
—
|
|
.9
|
|
||||||||||||
|
Repurchases and retirements of common shares
|
(67.0
|
)
|
(217.2
|
)
|
—
|
|
(284.2
|
)
|
—
|
|
(284.2
|
)
|
||||||||||||
|
Net contributions from non-controlling interests
|
—
|
|
—
|
|
—
|
|
—
|
|
17.5
|
|
17.5
|
|
||||||||||||
|
Acquisition from non-controlling interests
|
(5.3
|
)
|
—
|
|
—
|
|
(5.3
|
)
|
(2.7
|
)
|
(8.0
|
)
|
||||||||||||
|
Redemptions of Prospector Turtle Fund
|
—
|
|
—
|
|
—
|
|
—
|
|
(31.5
|
)
|
(31.5
|
)
|
||||||||||||
|
Amortization of restricted share and
option awards
|
14.9
|
|
—
|
|
—
|
|
14.9
|
|
(2.0
|
)
|
12.9
|
|
||||||||||||
|
Balances at December 31, 2015
|
978.2
|
|
3,084.9
|
|
(149.9
|
)
|
3,913.2
|
|
454.8
|
|
4,368.0
|
|
||||||||||||
|
Net income
|
—
|
|
412.5
|
|
—
|
|
412.5
|
|
7.3
|
|
419.8
|
|
||||||||||||
|
Net change in foreign currency translation
|
—
|
|
—
|
|
31.4
|
|
31.4
|
|
—
|
|
31.4
|
|
||||||||||||
|
Net change in pension liability and
other accumulated comprehensive items
|
—
|
|
—
|
|
.6
|
|
.6
|
|
.3
|
|
.9
|
|
||||||||||||
|
Recognition of foreign currency translation and other accumulated comprehensive items from the sale of Sirius Group
|
—
|
|
—
|
|
113.3
|
|
113.3
|
|
—
|
|
113.3
|
|
||||||||||||
|
Comprehensive income
|
—
|
|
412.5
|
|
145.3
|
|
557.8
|
|
7.6
|
|
565.4
|
|
||||||||||||
|
Dividends declared on common shares
|
—
|
|
(5.4
|
)
|
—
|
|
(5.4
|
)
|
—
|
|
(5.4
|
)
|
||||||||||||
|
Dividends to non-controlling interests
|
—
|
|
—
|
|
—
|
|
—
|
|
(22.7
|
)
|
(22.7
|
)
|
||||||||||||
|
Issuances of common shares
|
9.1
|
|
—
|
|
—
|
|
9.1
|
|
—
|
|
9.1
|
|
||||||||||||
|
Repurchases and retirements of common shares
|
(192.4
|
)
|
(694.8
|
)
|
—
|
|
(887.2
|
)
|
—
|
|
(887.2
|
)
|
||||||||||||
|
Deconsolidation of non-controlling interests associated with the sale of Sirius Group
|
—
|
|
—
|
|
—
|
|
—
|
|
(250.0
|
)
|
(250.0
|
)
|
||||||||||||
|
Deconsolidation of non-controlling interests associated with the sale of Tranzact
|
—
|
|
—
|
|
—
|
|
—
|
|
(78.4
|
)
|
(78.4
|
)
|
||||||||||||
|
Acquisition of subsidiary
|
—
|
|
—
|
|
—
|
|
—
|
|
3.3
|
|
3.3
|
|
||||||||||||
|
Acquisition from non-controlling interests - OneBeacon
|
(2.7
|
)
|
—
|
|
—
|
|
(2.7
|
)
|
(8.8
|
)
|
(11.5
|
)
|
||||||||||||
|
Net contributions from non-controlling interests
|
—
|
|
—
|
|
—
|
|
—
|
|
27.3
|
|
27.3
|
|
||||||||||||
|
Amortization of restricted share and
option awards
|
18.5
|
|
—
|
|
—
|
|
18.5
|
|
.8
|
|
19.3
|
|
||||||||||||
|
Balances at December 31, 2016
|
$
|
810.7
|
|
$
|
2,797.2
|
|
$
|
(4.6
|
)
|
$
|
3,603.3
|
|
$
|
133.9
|
|
$
|
3,737.2
|
|
||||||
See Notes to Consolidated Financial Statements.
F-3
|
CONSOLIDATED STATEMENTS OF CASH FLOWS
|
||||||||||||
|
Year Ended December 31,
|
||||||||||||
|
Millions
|
2016
|
2015
|
2014
|
|||||||||
|
Cash flows from operations:
|
||||||||||||
|
Net income
|
$
|
419.8
|
|
$
|
279.5
|
|
$
|
290.0
|
|
|||
|
Charges (credits) to reconcile net income to net cash (used for) provided from operations:
|
|
|
|
|
|
|
||||||
|
Net realized and unrealized investment gains
|
(10.3
|
)
|
(225.4
|
)
|
(78.5
|
)
|
||||||
|
Net gain on sale of consolidated and unconsolidated affiliates
|
(.5
|
)
|
(16.1
|
)
|
—
|
|
||||||
|
Amortization and depreciation
|
64.5
|
|
46.4
|
|
35.3
|
|
||||||
|
Deferred income tax expense (benefit)
|
2.9
|
|
5.6
|
|
(22.5
|
)
|
||||||
|
Undistributed equity in earnings from unconsolidated affiliates, after-tax
|
—
|
|
(25.1
|
)
|
(45.6
|
)
|
||||||
|
Net loss (income) from discontinued operations
|
.3
|
|
(78.7
|
)
|
(260.6
|
)
|
||||||
|
Net (gain) loss on sale of discontinued operations
|
(415.1
|
)
|
(18.2
|
)
|
1.6
|
|
||||||
|
Other operating items:
|
||||||||||||
|
Net change in loss and loss adjustment expense reserves
|
(25.2
|
)
|
45.8
|
|
282.2
|
|
||||||
|
Net change in reinsurance recoverable on paid and unpaid losses
|
14.2
|
|
(20.1
|
)
|
(83.2
|
)
|
||||||
|
Net change in unearned insurance premiums
|
46.5
|
|
(4.1
|
)
|
57.6
|
|
||||||
|
Net change in ceded unearned insurance premiums
|
(14.7
|
)
|
(11.6
|
)
|
(3.5
|
)
|
||||||
|
Net change in insurance premiums receivable
|
(8.1
|
)
|
17.8
|
|
(8.8
|
)
|
||||||
|
Net change in deferred acquisition costs
|
.7
|
|
(.4
|
)
|
(1.8
|
)
|
||||||
|
Net change in funds held under insurance contracts
|
15.3
|
|
56.7
|
|
17.7
|
|
||||||
|
Net change in restricted cash
|
5.8
|
|
17.9
|
|
32.4
|
|
||||||
|
Net change in other assets and liabilities, net
|
(226.7
|
)
|
49.7
|
|
(142.4
|
)
|
||||||
|
Net cash (used for) provided from continuing operations
|
(130.6
|
)
|
119.7
|
|
69.9
|
|
||||||
|
Net cash (used for) provided from discontinued operations
|
(24.7
|
)
|
56.0
|
|
48.9
|
|
||||||
|
Net cash (used for) provided from operations
|
(155.3
|
)
|
175.7
|
|
118.8
|
|
||||||
|
Cash flows from investing activities:
|
||||||||||||
|
Net change in short-term investments
|
(70.1
|
)
|
140.0
|
|
(138.0
|
)
|
||||||
|
Sales of fixed maturity and convertible investments
|
3,428.7
|
|
1,281.7
|
|
2,210.8
|
|
||||||
|
Maturities, calls and paydowns of fixed maturity and convertible investments
|
726.9
|
|
335.0
|
|
452.4
|
|
||||||
|
Sales of common equity securities
|
1,200.8
|
|
461.4
|
|
609.8
|
|
||||||
|
Distributions and redemptions of other long-term investments
|
28.9
|
|
84.7
|
|
64.5
|
|
||||||
|
Sales of unconsolidated affiliates and consolidated subsidiaries, net of cash sold
|
2,646.2
|
|
24.0
|
|
—
|
|
||||||
|
Proceeds paid to non-controlling common shareholders from the sale of consolidated subsidiaries
|
(141.6
|
)
|
—
|
|
—
|
|
||||||
|
Purchases of other long-term investments
|
(39.5
|
)
|
(78.0
|
)
|
(114.7
|
)
|
||||||
|
Net settlement of investment cash flows and contributions with discontinued operations
|
(402.0
|
)
|
17.5
|
|
(88.1
|
)
|
||||||
|
Purchases of common equity securities
|
(538.3
|
)
|
(409.9
|
)
|
(289.7
|
)
|
||||||
|
Purchases of fixed maturity and convertible investments
|
(5,802.9
|
)
|
(1,867.2
|
)
|
(2,456.1
|
)
|
||||||
|
Purchases of consolidated and unconsolidated affiliates (net of cash acquired)
|
(13.4
|
)
|
(2.6
|
)
|
(205.0
|
)
|
||||||
|
Net change in unsettled investment purchases and sales
|
35.7
|
|
(4.6
|
)
|
(44.7
|
)
|
||||||
|
Net (acquisitions) dispositions of property and equipment
|
(4.3
|
)
|
34.7
|
|
(4.5
|
)
|
||||||
|
Net cash provided from (used for) investing activities — continuing operations
|
1,055.1
|
|
16.7
|
|
(3.3
|
)
|
||||||
|
Net cash provided from investing activities — discontinued operations
|
221.7
|
|
(5.4
|
)
|
51.2
|
|
||||||
|
Net cash provided from investing activities
|
1,276.8
|
|
11.3
|
|
47.9
|
|
||||||
|
Cash flows from financing activities:
|
||||||||||||
|
Draw down of debt and revolving line of credit
|
352.5
|
|
171.5
|
|
133.6
|
|
||||||
|
Repayment of debt and revolving line of credit
|
(404.6
|
)
|
(76.1
|
)
|
(65.2
|
)
|
||||||
|
Change in capital lease obligation
|
(1.7
|
)
|
(5.4
|
)
|
(5.3
|
)
|
||||||
|
Cash dividends paid to the Company’s common shareholders
|
(5.4
|
)
|
(6.0
|
)
|
(6.2
|
)
|
||||||
|
Acquisitions of additional shares from non-controlling interest
|
—
|
|
(9.1
|
)
|
—
|
|
||||||
|
(Contributions to) distributions from discontinued operations
|
(3.0
|
)
|
(7.6
|
)
|
12.1
|
|
||||||
|
Common shares repurchased
|
(881.3
|
)
|
(268.6
|
)
|
(128.2
|
)
|
||||||
|
OneBeacon Ltd. common shares repurchased and retired
|
(11.5
|
)
|
(3.7
|
)
|
(1.7
|
)
|
||||||
|
Proceeds from issuances of common shares
|
3.7
|
|
—
|
|
—
|
|
||||||
|
Capital contributions from non-controlling interest of consolidated LPs
|
—
|
|
—
|
|
4.9
|
|
||||||
|
Redemptions paid to non-controlling interest of consolidated LPs
|
—
|
|
—
|
|
(5.5
|
)
|
||||||
|
Distributions to non-controlling interest shareholders
|
(21.1
|
)
|
(27.2
|
)
|
(19.8
|
)
|
||||||
|
Payments to contingent considerations related to purchases of consolidated subsidiaries
|
(7.8
|
)
|
—
|
|
—
|
|
||||||
|
Capital contributions from BAM members
|
38.0
|
|
29.2
|
|
16.2
|
|
||||||
|
Net cash used for financing activities — continuing operations
|
(942.2
|
)
|
(203.0
|
)
|
(65.1
|
)
|
||||||
|
Net cash used for financing activities — discontinued operations
|
(.2
|
)
|
(11.6
|
)
|
(64.5
|
)
|
||||||
|
Net cash used for financing activities
|
(942.4
|
)
|
(214.6
|
)
|
(129.6
|
)
|
||||||
|
Effect of exchange rate changes on cash (excludes $0.0, $(4.5) and $(14.3) related to discontinued operations)
|
—
|
|
—
|
|
—
|
|
||||||
|
Net change in cash during the period - continuing operations
|
(17.7
|
)
|
(66.6
|
)
|
1.5
|
|
||||||
|
Cash balance at beginning of year (excludes restricted cash balances of $5.8, $23.7, $56.1 and held for sale and discontinued operations cash balances of $150.2, $116.8, and $93.2)
|
167.2
|
|
232.7
|
|
233.5
|
|
||||||
|
Add: cash held for sale at the beginning of period
|
1.2
|
|
2.3
|
|
—
|
|
||||||
|
Less: cash held for sale at the end of period
|
.9
|
|
1.2
|
|
2.3
|
|
||||||
|
Cash balance at end of year (excludes restricted cash balances of $0.0, $5.8 and $23.7 and held for sale and discontinued operations cash balances of $0.9, $150.2, $116.8)
|
$
|
149.8
|
|
$
|
167.2
|
|
$
|
232.7
|
|
|||
See Notes to Consolidated Financial Statements.
|
|
F-4
|
|
NOTES TO CONSOLIDATED FINANCIAL STATEMENTS
Basis of Presentation
The accompanying consolidated financial statements have been prepared in accordance with generally accepted accounting principles in the United States (“GAAP”) and include the accounts of White Mountains Insurance Group, Ltd. (the “Company” or the “Registrant”), its subsidiaries (collectively with the Company, “White Mountains”) and and other entities required to be consolidated under GAAP. The Company is an exempted Bermuda limited liability company whose principal businesses are conducted through its insurance subsidiaries and other affiliates. The Company’s headquarters is located at 26 Reid Street, Hamilton, Bermuda HM 11, its principal executive office is located at 80 South Main Street, Hanover, New Hampshire 03755-2053 and its registered office is located at Clarendon House, 2 Church Street, Hamilton, Bermuda HM 11. White Mountains’s reportable segments are OneBeacon, HG Global/BAM and Other Operations.
As discussed further in the Company’s consolidated financial statements in
Note 2 — “Significant Transactions”
, on April 18, 2016, White Mountains completed its sale of Sirius International Insurance Group, Ltd., and its subsidiaries (collectively, “Sirius Group”) to CM International Holding PTE Ltd. (“CMI”), the Singapore-based investment arm of China Minsheng Investment Corp., Ltd. Also, on July 21, 2016, White Mountains completed its sale of Tranzact Holdings, LLC (“Tranzact”) to an affiliate of Clayton, Dubilier & Rice, LLC. For the year ended December 31, 2016, Sirius Group and Tranzact have been presented as discontinued operations in the statement of operations and comprehensive income. Prior year amounts have been reclassified to conform to the current period’s presentation. The assets and liabilities of Sirius Group and Tranzact are classified as held for sale in the balance sheet as of
December 31, 2015
. See
Note 22 — “Held for Sale and Discontinued Operations”
.
The OneBeacon segment consists of OneBeacon Insurance Group, Ltd. (“OneBeacon Ltd.”), an exempted Bermuda limited liability company that owns a family of property and casualty insurance companies and Split Rock Insurance, Ltd. (“Split Rock”), a Bermuda based reinsurance company (collectively “OneBeacon”). OneBeacon is a specialty property and casualty insurance writer that offers a wide range of insurance products in the United States primarily through independent agencies, regional and national brokers, wholesalers and managing general agencies. As of
December 31, 2016 and 2015
, White Mountains owned
76.1%
and
75.5%
of OneBeacon Ltd.’s outstanding common shares. As discussed further in
Note 2 — “Significant Transactions”
, in December 2014, OneBeacon completed the sale of its of runoff business consisting of assets, liabilities and capital related principally to OneBeacon’s non-specialty business, including the vast majority of its asbestos and environmental reserves (“Runoff Business”) to an affiliate of Armour Group Holdings Limited (the “Runoff Transaction”). Accordingly, OneBeacon’s runoff business is presented as discontinued operations in the statement of operations and comprehensive income. In the second quarter of 2015, OneBeacon completed the sale of its building in Canton, MA for
$58.0 million
.
The HG Global/BAM segment consists of White Mountains’s investment in HG Global Ltd. (“HG Global”) and the consolidated results of Build America Mutual Assurance Company (“BAM”). BAM is the first and only mutual bond insurance company in the United States. By insuring the timely payment of principal and interest, BAM provides market access to, and lowers interest expense for, issuers of municipal bonds used to finance essential public purposes such as schools, utilities, and transportation facilities. BAM is owned by and operated for the benefit of its members, the municipalities that purchase BAM’s insurance for their debt issuances. HG Global was established to fund the startup of BAM and, through its wholly-owned subsidiary, HG Re Ltd. (“HG Re”), to provide
15%
-of-par, first loss reinsurance protection for policies underwritten by BAM. HG Global, together with its subsidiaries, provided the initial capitalization of BAM through the purchase of
$503.0 million
of surplus notes issued by BAM (the “BAM Surplus Notes”). As of
December 31, 2016 and 2015
, White Mountains owned
96.9%
of HG Global's preferred equity and
88.4%
of its common equity. White Mountains does not have an ownership interest in BAM. However, GAAP requires White Mountains to consolidate BAM’s results in its financial statements. BAM’s results are attributed to non-controlling interests.
F-5
White Mountains’s Other Operations segment consists of the Company and its intermediate holding companies, its wholly-owned investment management subsidiary, White Mountains Advisors LLC (“WM Advisors”) and certain consolidated and unconsolidated private capital investments. The consolidated private capital investments consist of QL Holdings LLC (“MediaAlpha”), Wobi Insurance Agency Ltd. (“Wobi”), Star & Shield Services LLC, Star & Shield Risk Management LLC, and Star & Shield Claims Services LLC (collectively “Star & Shield”) and Removal Stars Ltd. (“Buzzmove”). Star & Shield provides management services for a fee to Star & Shield Insurance Exchange (“SSIE”), a reciprocal that is owned by its members, who are policyholders. SSRM’s role as the attorney-in-fact to SSIE gives it the power to direct the significant economic activities of SSIE. As a result, White Mountains is required to consolidate SSIE in its GAAP financial statements. SSIE’s results do not affect White Mountains’s common shareholders’ equity as they are attributable to non-controlling interests. On January 13, 2017, White Mountains reached an agreement to sell Star & Shield and the SSIE Surplus Notes to K2 Insurance Services LLC. As a result, White Mountains has presented Star & Shield’s and SSIE’s assets and liabilities as held for sale as of December 31, 2016 and 2015. White Mountains’s Other Operations segment also includes its variable annuity reinsurance business, White Mountains Life Reinsurance (Bermuda) Ltd. (“Life Re Bermuda”), which completed its runoff with all of its contracts maturing by June 30, 2016, and its U.S.-based service provider, White Mountains Financial Services LLC (collectively, “WM Life Re”).
All significant intercompany transactions have been eliminated in consolidation. Certain amounts in the prior period financial statements have been reclassified to conform to the current presentation. The preparation of financial statements in conformity with GAAP requires management to make estimates and assumptions that affect the reported amounts of assets and liabilities and disclosure of contingent assets and liabilities as of the date of the financial statements and the reported amounts of revenues and expenses during the reporting period. Actual results could differ from those estimates.
Significant Accounting Policies
Investment Securities
As of
December 31, 2016
, White Mountains’s invested assets consisted of securities and other investments held for general investment purposes. White Mountains’s portfolio of fixed maturity investments, common equity securities and other long-term investments held for general investment purposes are classified as trading securities and are reported at fair value as of the balance sheet date. Changes in net unrealized investment gains (losses) are reported pre-tax in revenues. Realized investment gains (losses) are accounted for using the specific identification method and are reported pre-tax in revenues. Premiums and discounts on all fixed maturity investments are amortized and accreted to income over the anticipated life of the investment.
White Mountains’s invested assets that are measured at fair value include fixed maturity investments, common equity securities and other long-term investments, such as interests in hedge funds, private equity funds, various non-controlling interests in private capital investments and the OneBeacon Surplus Notes issued in connection with the Runoff Transaction. In determining its estimates of fair value, White Mountains uses a variety of valuation approaches and inputs. Whenever possible, White Mountains estimates fair value using valuation methods that maximize the use of quoted prices and other observable inputs.
As of
December 31, 2016 and 2015
, approximately
94%
and
91%
of the investment portfolio recorded at fair value was priced based upon quoted market prices or other observable inputs. Investments valued using Level 1 inputs include fixed maturity investments, primarily investments in U.S. Treasuries, short-term investments, which include U.S. Treasury Bills and common equity securities. Investments valued using Level 2 inputs are comprised of fixed maturity investments including debt securities issued by corporations, municipal obligations, mortgage and asset-backed securities, foreign government, agency and provincial obligations and preferred stocks. Fair value estimates for investments that trade infrequently and have few or no observable market prices are classified as Level 3 measurements. Level 3 fair value estimates based upon unobservable inputs include certain debt securities, including asset-backed securities, where quoted market prices are unavailable. White Mountains determines when transfers between levels have occurred as of the beginning of the period. White Mountains uses brokers and outside pricing services to assist in determining fair values. For investments in active markets, White Mountains uses the quoted market prices provided by outside pricing services to determine fair value. The outside pricing services used by White Mountains have indicated that if no observable inputs are available for a security, they will not provide a price. In those circumstances, White Mountains estimates the fair value using industry standard pricing methodologies and observable inputs such as benchmark interest rates, market comparables, broker quotes, issuer spreads, bids, offers, credit rating prepayment speeds and other relevant inputs.
F-6
White Mountains performs procedures to validate the market prices obtained from the outside pricing sources. Such procedures, which cover substantially all of its fixed maturity investments include, but are not limited to, the evaluation of pricing methodologies and a review of the pricing services’ quality control processes and procedures on at least an annual basis, comparison of our invested asset market prices to prices obtained from different independent pricing vendors on at least a semi-annual basis, monthly analytical reviews of certain prices, and review of the underlying assumptions utilized by the pricing service for selected measurements on an ad hoc basis throughout the year. White Mountains also performs back-testing of selected sales activity to determine whether there are any significant differences between the market price used to value the security prior to sale and the actual sale price on an ad-hoc basis throughout the year. Prices provided by the pricing services that vary by more than
5%
and
$1.0 million
from the expected price based on these procedures are considered outliers. Prices that have not changed from period to period and prices that have trended unusually compared to market conditions are also considered outliers.
In circumstances where the results of White Mountains’s review process do not appear to support the market price provided by the pricing services, White Mountains challenges the price. During the past year,
nine
securities fell outside White Mountains’s expected results, thereby triggering the challenge with the pricing service. If White Mountains cannot gain satisfactory evidence to support the challenged price, it relies upon its own pricing methodologies to estimate the fair value of the security in question. The fair values of such securities are considered to be Level 3 measurements.
White Mountains’s investments in debt securities, including mortgage and asset-backed securities, are generally valued using pricing evaluation techniques that considers relevant market information, relevant credit information, perceived market movements and sector news. Key inputs include benchmark yields, benchmark securities, reported trades, issuer spreads, bids, offers, credit ratings and prepayment speeds. Income on mortgage and asset-backed securities is recognized using an effective yield based on anticipated prepayments and the estimated economic life of the securities. When actual prepayments differ significantly from anticipated prepayments, the estimated economic life is recalculated and the remaining unamortized premium or discount is amortized prospectively over the remaining economic life.
Short-term investments consist of interest bearing money market funds, certificates of deposit, time deposits and other securities which, at the time of purchase, mature or become available for use within one year. Short-term investments are carried at amortized cost, which approximated fair value as of
December 31, 2016 and 2015
.
Other Long-term Investments
Other long-term investments consist primarily of hedge funds, private equity funds, various non-controlling interests in private capital investments and the OneBeacon Surplus Notes. See
Note 5 — “Investment Securities”
. White Mountains has taken the fair value option for most of its investments in hedge funds, private equity funds, various non-controlling interests in private capital investments and the OneBeacon Surplus Notes. For the investments for which White Mountains has taken the fair value option, changes in fair value are reported in revenues on a pre-tax basis. For those long-term investments for which White Mountains has not made the fair value election, White Mountains accounts for its interests under the equity method.
Derivative Financial Instruments
White Mountains occasionally holds a variety of derivative financial instruments for risk management purposes. White Mountains recognizes all derivatives as either assets or liabilities, measured at fair value, in the consolidated balance sheets. Changes in the fair value of derivative instruments are recognized in current period pre-tax income.
Warrants
From time to time, White Mountains holds warrants that it has received in the restructuring (e.g., securities received from bankruptcy proceedings) of certain of its common equity securities and fixed maturity investments. White Mountains accounts for its investments in warrants as derivatives.
Derivatives—Variable Annuity Reinsurance
White Mountains has entered into agreements to reinsure death and living benefit guarantees associated with certain variable annuities in Japan through its wholly owned subsidiary, WM Life Re. The accounting for benefit guarantees differs depending on whether or not the guarantee is classified as a derivative or an insurance liability.
Guaranteed minimum accumulation benefits (“GMABs”) are paid to an annuitant for any shortfall between accumulated account value at the end of the accumulation period and the annuitant’s total deposit, less any withdrawal payments made to the annuitant during the accumulation period. GMABs meet the definition of a derivative for accounting purposes. Therefore, GMABs are carried at fair value, with changes thereon recognized in income in the period of the change. The liability for the reinsured GMAB contracts has been determined using internal valuation methodologies that use assumptions for interest rates, equity markets, foreign exchange rates and market volatilities at the valuation date, as well as annuitant-related actuarial assumptions, including surrender and mortality rates.
F-7
If an annuitant dies during the accumulation period of an annuity contract, guaranteed minimum death benefits (“GMDBs”) are paid to the annuitant’s beneficiary for shortfalls between accumulated account value at the time of an annuitant’s death and the annuitant’s total deposit, less any living benefit payments or withdrawal payments previously made to the annuitant. White Mountains elected to measure its GMDB liabilities at fair value.
The valuation of these liabilities involves significant judgment and is subject to change based upon changes in capital market assumptions and emerging surrender and mortality experience of the underlying contracts in force.
WM Life Re has completed its run-off as all of its contracts matured as of June 30, 2016. WM Life Re entered into derivative contracts that were designed to economically hedge against changes in the fair value of living and death benefit liabilities associated with its variable annuity reinsurance arrangements. The derivatives included futures and over-the-counter option contracts on interest rates, major bond and equity indices, and foreign currencies. All WM Life Re’s derivative instruments were recorded as assets or liabilities at fair value on the balance sheet within other assets. These derivative financial instruments did not meet the criteria for hedge accounting treatment, and accordingly, changes in fair value were recognized in the appropriate period as gains or losses in the income statement within other revenues.
WM Life Re included the effect of counterparty credit risk when determining the fair value of its derivative contracts and its GMAB and GMDB liabilities.
Cash
Cash includes amounts on hand and demand deposits with banks and other financial institutions. Amounts presented in the statement of cash flows are shown net of balances acquired and sold in the purchase or sale of the Company’s consolidated subsidiaries and exclude changes in amounts of restricted cash. See
Note 9 — “Derivatives”
.
Insurance and Reinsurance Operations
White Mountains accounts for insurance and reinsurance policies that it writes in accordance with ASC 944. Premiums written are recognized as revenues and are earned ratably over the term of the related policy or reinsurance treaty. Unearned premiums represent the portion of premiums written that are applicable to future insurance and reinsurance coverage provided by policies or treaties in force. White Mountains charges fees on certain of its insurance policies. Refundable fees are classified with premiums and recognized in earnings over the policy term. Fees that represent a reimbursement of expenses, such as installment fees, are recorded as a reduction of underwriting expenses.
Deferred acquisition costs represent commissions, premium taxes, brokerage expenses and other costs which are directly attributable to and vary with the production of business. These costs are deferred and amortized to the extent they relate to successful contract acquisitions over the applicable premium recognition period as insurance and reinsurance acquisition expenses. Amortization of deferred acquisition costs are presented within insurance and reinsurance acquisition expenses. Deferred acquisition costs are limited to the amount expected to be recovered from future earned premiums and anticipated investment income. This limitation is referred to as a premium deficiency. A premium deficiency is recognized if the sum of expected loss and loss adjustment expenses (“LAE”), expected dividends to policyholders, unamortized acquisition costs, and maintenance costs exceeds related unearned premiums and anticipated investment income. A premium deficiency is recognized by charging any unamortized acquisition costs to expense to the extent required in order to eliminate the deficiency. If the premium deficiency exceeds unamortized acquisition costs then a liability is accrued for the excess deficiency.
Losses and LAE are charged against income as incurred. Unpaid insurance losses and LAE are based on estimates (generally determined by claims adjusters, legal counsel and actuarial staff) of the ultimate costs of settling claims, including the effects of inflation and other societal and economic factors. Unpaid reinsurance losses and LAE are based primarily on reports received from ceding companies and actuarial projections. Unpaid loss and LAE reserves represent management’s best estimate of ultimate losses and LAE, net of estimated salvage and subrogation recoveries, if applicable. Such estimates are regularly reviewed and updated and any resulting adjustments are reflected in current operations. The process of estimating loss and LAE involves a considerable degree of judgment by management and the ultimate amount of expense to be incurred could be considerably greater than or less than the amounts currently reflected in the financial statements.
White Mountains’s insurance and reinsurance subsidiaries enter into ceded reinsurance contracts from time to time to protect their businesses from losses due to concentration of risk, to manage their operating leverage ratios and to limit losses arising from catastrophic events. Such reinsurance contracts are executed through excess of loss treaties and catastrophe contracts under which the reinsurer indemnifies White Mountains for a specified part or all of certain types of losses over stipulated amounts arising from any one occurrence or event. White Mountains has also entered into quota share treaties with reinsurers under which all risks meeting prescribed criteria are covered on a pro-rata basis. The amount of each risk ceded by White Mountains is subject to maximum limits which vary by line of business and type of coverage.
F-8
Amounts recoverable from reinsurers are estimated in a manner consistent with the claim liability associated with the reinsured policies. The collectability of reinsurance recoverables is also subject to the solvency of the reinsurers. White Mountains is selective in regard to its reinsurers, principally placing reinsurance with those reinsurers with a strong financial condition, industry ratings and underwriting ability. Management monitors the financial condition and ratings of its reinsurers on an ongoing basis.
Reinsurance premiums, commissions, expense reimbursements and reserves related to reinsured business are accounted for on a basis consistent with those used in accounting for the original policies issued and the terms of the reinsurance contracts. Premiums ceded to other companies are reported as a reduction of premiums written. Expense allowances received in connection with reinsurance ceded have been accounted for as a reduction of the related policy acquisition costs and are deferred and amortized accordingly. Funds held by ceding companies represent amounts due to White Mountains in connection with certain assumed reinsurance agreements in which the ceding company retains a portion of the premium to provide security against future loss payments. The funds held by ceding companies are generally invested by the ceding company and a contractually agreed interest amount is credited to the Company and recognized as investment income. Funds held under insurance and reinsurance contracts represent contractual payments due to White Mountains that have been retained to secure such obligations. Such amounts are recorded as liabilities in the consolidated financial statements.
Accruals for contingent commission liabilities are established for reinsurance contracts that provide for the stated commission percentage to increase or decrease based on the loss experience of the contract. Changes in the estimated liability for such arrangements are recorded as contingent commissions. Accruals for contingent commission liabilities are determined through the review of the contracts that have these adjustable features and are estimated based on expected loss and LAE.
Municipal Bond Insurance
All of the contracts issued by BAM are accounted for as insurance contracts under ASC 944-605,
Financial Guarantee Insurance Contracts.
Premiums are generally received upfront and an unearned premium revenue liability, equal to the amount of the premium received, is established at contract inception. Premium revenues are recognized in revenue over the period of the contracts in proportion to the amount of insurance protection provided using a constant rate. The constant rate is calculated based on the relationship between the par outstanding in a given reporting period compared with the sum of each of the par amounts outstanding for all periods.
Deferred acquisition costs represent commissions, premium taxes, excise taxes and other costs which are directly attributable to and vary with the production of business. These costs are deferred and amortized to the extent they relate to successful contract acquisitions over the applicable premium recognition period as acquisition expenses. Deferred acquisition costs are limited to the amount expected to be recovered from future earned premiums and anticipated investment income.
Funds Held
Funds held under reinsurance contracts primarily represent amounts due to White Mountains in connection with the Standard Reinsurance Agreement (“SRA”) with the Federal Crop Insurance Corporation (“FCIC”), which is managed by an agency of the U.S. Department of Agriculture. The SRA governs the relationship, including the exchange of funds, between private insurance companies, including White Mountains, and the FCIC relating to our MPCI crop insurance business. Funds held under insurance contracts represents unrestricted collateral held by White Mountains primarily relating to the surety business.
Mandatory Shared Market Mechanisms
As a condition to its licenses to do business in certain states, White Mountains’s insurance operations must participate in various mandatory shared market mechanisms commonly referred to as “residual” or “involuntary” markets. These markets generally consist of risks considered to be undesirable from a standard or routine underwriting perspective. Each state dictates the levels of insurance coverage that are mandatorily assigned to participating insurers within these markets. The total amount of such business an insurer must accept in a particular state is generally based on that insurer’s market share of voluntary business written within that state. In certain cases, White Mountains is obligated to write business from shared market mechanisms at a future date based on its historical market share of all voluntary policies written within that state. Involuntary business generated from mandatory shared market mechanisms is accounted for as direct insurance business or as assumed reinsurance depending upon the structure of the mechanism.
OneBeacon’s market assignments are typically required to be written in the current period, however, in certain cases OneBeacon is required to accept policy assignments at a future date. Anticipated losses associated with future market assignments are recognized when the amount of such anticipated losses is determined to be probable and can be reasonably estimated.
F-9
Insurance-related Assessments
Under existing guaranty fund laws in all states, insurers licensed to do business in those states can be assessed for certain obligations of insolvent insurance companies to policyholders and claimants. White Mountains records guaranty fund assessments when it is probable that an assessment will be made and the amount can be reasonably estimated.
Deferred Software Costs
White Mountains capitalizes costs related to computer software developed for internal use during the application development stage of software development projects. These costs generally consist of certain external, payroll and payroll-related costs. White Mountains begins amortization of these costs once the project is completed and ready for its intended use. Amortization is on a straight-line basis and over a useful life of eighteen months to
five
years.
Costs related to software developed for sale to third parties are expensed until technological feasibility has been established. Once technological feasibility has been established, software development costs are capitalized and reported at their net realizable value. Upon product release, the amortization of software development costs is determined annually as the greater of the amount calculated using the ratio of current gross revenues to the total of current and expected gross revenues for the product or the straight-line method over the estimated economic life, which is generally between 18 to 36 months.
As of
December 31, 2016 and 2015
, White Mountains had unamortized deferred software costs of
$16.4 million
and
$15.8 million
. Amortization expense of software development costs of
$6.3 million
,
$4.4 million
and
$2.9 million
were recognized for the years ended December 31, 2016, 2015 and 2014, respectively.
Commission and Other Revenue Recognition
White Mountains recognizes agent commissions and other revenues when it has fulfilled all of its obligations necessary to earn the revenue and when it can reliably estimate both the amount of revenue, net of any amounts expected to be uncollectible, and any amounts associated with expected cancellations.
Federal and Foreign Income Taxes
A significant portion of White Mountains’s subsidiaries file consolidated tax returns in the United States. Income earned or losses generated by companies outside the United States are generally subject to an overall effective tax rate lower than that imposed by the United States.
Deferred tax assets and liabilities are recorded when a difference between the carrying amounts of assets and liabilities for financial reporting purposes and the amounts for tax purposes exists, and for other temporary differences. The deferred tax asset or liability is recorded based on tax rates expected to be in effect when the difference reverses. The deferred tax asset is recognized when it is more likely than not that it will be realized.
Foreign Currency Exchange
The U.S. dollar is the functional currency for all of White Mountains’s businesses except for Sirius International and certain other smaller international activities. White Mountains also invests in securities denominated in foreign currencies. Assets and liabilities recorded in these foreign currencies are translated into U.S. dollars at exchange rates in effect at the balance sheet date, and revenues and expenses are converted using the weighted average exchange rates for the period. Net foreign exchange gains and losses arising from the translation of functional currencies are generally reported in shareholders’ equity, in accumulated other comprehensive income or loss.
Assets and liabilities relating to foreign operations are translated into the functional currency using current exchange rates; revenues and expenses are translated into the functional currency using the weighted average exchange rate for the period. The resulting exchange gains and losses are reported as a component of net income in the period in which they arise. As of
December 31, 2016 and 2015
, White Mountains had unrealized foreign currency translation losses of
$1.4 million
and
$145.6 million
recorded in accumulated other comprehensive income on its consolidated balance sheet.
The following rates of exchange for the U.S. dollar have been used for the most significant operations:
|
Currency
|
Opening Rate
2016
|
Closing Rate
2016
|
Opening Rate
2015
|
Closing Rate
2015
|
||||||||
|
Israeli Shekels
|
3.9051
|
|
3.8476
|
|
3.8865
|
|
3.9051
|
|
||||
|
British Pound Sterling
|
0.6757
|
|
0.8074
|
|
0.6426
|
|
0.6757
|
|
||||
|
Euro
|
0.9189
|
|
0.9479
|
|
0.8245
|
|
0.9189
|
|
||||
|
Swedish Kronor
(1)
|
8.4247
|
|
N/A
|
|
7.7737
|
|
8.4247
|
|
||||
(1)
On April 18, 2016 White Mountains completed its sale of Sirius Group.
F-10
Goodwill and Other Intangible Assets
Goodwill represents the excess of the amount paid to acquire subsidiaries over the fair value of identifiable net assets at the date of acquisition. Other intangible assets consist primarily of trademarks, URL and online names, customer relationships, information technology and insurance licenses.
Goodwill is not amortized, but rather is evaluated for impairment on an annual basis, or whenever indications of potential impairment exist. In the absence of any indications of potential impairment, the evaluation of goodwill is performed during the fourth quarter of each year. White Mountains initially evaluates goodwill using a qualitative approach (“step zero”) to determine whether it is more likely than not that the fair value of goodwill is greater than its carrying value. If the results of the qualitative evaluation indicate that it is more likely than not that the carrying value of goodwill exceeds its fair value, White Mountains, performs the two-step quantitative test for impairment.
Other intangible assets with finite lives are measured at their acquisition date fair values, are amortized over their economic lives and presented net of accumulated amortization on the balance sheet. Other intangible assets with finite lives are evaluated for impairment at least annually and when events or changes in circumstances indicate that it is more likely than not that the asset is impaired.
White Mountains evaluated the recoverability of goodwill and other intangible assets and did not recognize any impairment losses for any of the years ended December 31, 2016, 2015 and 2014. See
Note 6 — “Goodwill and Other Intangible Assets”
.
Non-controlling Interest
Non-controlling interests consist of the ownership interests of non-controlling shareholders in consolidated subsidiaries, and are presented separately on the balance sheet. The portion of comprehensive income attributable to non-controlling interests is presented net of related income taxes in the statement of operations and comprehensive income. See
Note 14 — “Common Shareholders’ Equity and Non-controlling Interests”
.
Variable Interest Entities
White Mountains consolidates a variable interest entity (“VIE”) when it has both the power to direct the activities of the VIE that most significantly impact its economic performance and either the obligation to absorb losses or the right to receive returns from the VIE that could potentially be significant to the VIE. See
Note 18 — “Variable Interest Entities”
.
Recently Adopted Changes in Accounting Principles
Short-Duration Contracts
Effective December 31, 2016, White Mountains adopted ASU 2015-09,
Disclosures about Short Duration Contracts
(ASC 944), which requires expanded footnote disclosures about loss and loss adjustment expense (“LAE”) reserves. Upon adoption, White Mountains modified its footnote disclosures to include loss development tables on a disaggregated basis by accident year and a reconciliation of loss development data to the loss and LAE reserves reflected on the balance sheet. The footnote disclosures have also been expanded to include information about claim frequency data, including a description of how the claims frequency data is measured. Prior year disclosures have been modified to conform to the new disclosures. See
Note 3 — “Reserves for Unpaid Losses and Loss Adjustment Expenses”
.
Business Combinations - Measurement Period Adjustments
Effective January 1, 2016, White Mountains adopted ASU 2015-16,
Simplifying the Accounting for Measurement-Period Adjustments
(ASC 805)
,
which requires adjustments to provisional amounts recorded in connection with a business combination that are identified during the measurement period to be recorded in the reporting period in which the adjustment amounts are determined, rather than as retroactive adjustments to prior periods. White Mountains has not recognized any adjustments to estimated purchase accounting amounts for the year to date period ended
December 31, 2016
and accordingly, there was no effect to White Mountains’s financial statements upon adoption.
Fair Value Measurements
On January 1, 2016, White Mountains adopted ASU 2015-07,
Fair Value Measurement - Disclosures for Investments in Certain Entities that Calculate Net Asset Value per Share (or Its Equivalent)
(ASC 820), which eliminates the requirement to disclose the fair value hierarchy level for investments for which fair value is measured at net asset value (“NAV”) using the practical expedient in ASC 820. White Mountains measures the fair value of its investments in hedge funds and private equity funds using this practical expedient. Upon adoption, these fair value measurements are no longer classified within the fair value hierarchy. Prior year amounts have been modified to conform to the current year’s disclosures.
F-11
Amendments to Consolidation Analysis
On January 1, 2016, White Mountains adopted ASU 2015-02,
Amendments to the Consolidation Analysis
(ASC 810) which amends the guidance for determining whether an entity is a VIE. ASU 2015-02 eliminates the separate consolidation guidance for limited partnerships and, with it, the presumption that a general partner should consolidate a limited partnership. In addition, ASU 2015-02 changes the guidance for determining if fee arrangements qualify as variable interests and the effect fee arrangements have on the determination of the primary beneficiary. Adoption of ASU 2015-02 did not affect the consolidation analysis for any of White Mountains’s investments.
Share-Based Compensation Awards
On January 1, 2016, White Mountains adopted ASU 2014-12,
Share-Based Payments When the Terms of an Award Provide That a Performance Target Could Be Achieved after the Requisite Service Period
(ASC 718)
.
The new guidance requires that a performance target that affects vesting and that can be achieved after the requisite service period be treated as a performance condition. Compensation cost is to be recognized in the period when it becomes probable the performance target will be achieved in an amount equal to the compensation cost attributable to the periods for which service has been rendered. Adoption did not have a significant effect on White Mountains’s financial position, results of operations, cash flows, presentation or disclosures.
Debt Issuance Costs
On January 1, 2016, White Mountains adopted ASU 2015-03,
Imputation of Interest
(ASC 835), which requires debt issuance costs to be presented as a deduction from the carrying amount of the related debt, consistent with the treatment required for debt discounts. The new guidance requires amortization of debt issuance costs to be classified within interest expense and also requires disclosure to the debt’s effective interest rate. White Mountains has applied the guidance retrospectively and as a result has reclassified
$1.9 million
of unamortized debt issuance costs from other assets to debt as of December 31, 2015, reflecting these amounts as a reduction from the related debt, and has modified its disclosures to include the required effective interest rate on its debt. As of
December 31, 2016
, the unamortized debt issuance costs included in debt is
$1.6 million
.
Reporting Discontinued Operations and Disclosures of Disposals of Components of an Entity
Effective January 1, 2015, White Mountains adopted ASU 2014-08,
Reporting Discontinued Operations and Disclosures of Disposals of Components of an Entity
(ASC 205 and ASC 360), which limits discontinued operations treatment to disposals that have a major effect on a reporting entity’s operations and financial results to be reported as discontinued operations. ASU 2014-08 also requires expanded disclosure in the financial statements for discontinued operations as well as for disposals of significant components of an entity that do not qualify for discontinued operations presentation. As discussed further in Note 2, White Mountains completed its sale of Sirius Group on April 18, 2016. Sirius Group has been presented as discontinued operations for all periods presented.
Qualified Affordable Housing Projects
Effective January 1, 2015, White Mountains adopted ASU 2014-01,
Accounting for Investments in Qualified Affordable Housing Projects (
“
QAHP
”
)
(ASC 323). ASU 2014-01 allows investors in QAHP to make a policy election to use the proportional amortization method. Under the proportional amortization method, the investor amortizes the initial cost of the investment in proportion to the tax credits and other tax benefits received and recognizes the investment results, net of the related tax benefits, as a component of income tax expense. Prior to adoption, White Mountains accounted for its QAHP investment under the equity method and recognized its share of its QAHP investment's losses in investment income. White Mountains made the policy election to account for its investment in its QAHP investment using the proportional amortization method, applied retrospectively. Under the proportional amortization method, the cumulative loss recognized through December 31, 2014 and December 31, 2013 was
$0.9 million
and
$0.4 million
. The retrospective adoption resulted in an increase of
$1.7 million
and
$1.9 million
to net investment income and a net increase of
$2.3 million
and
$2.2 million
to income tax expense for the years ended December 31, 2014 and 2013. Footnote disclosures for prior year amounts have been amended to be consistent with the restated amounts described above.
F-12
Pushdown Accounting
ASU 2014-17,
Pushdown Accounting, a consensus of the FASB Emerging Issues Task Force
(ASC 805) became effective upon its issuance on November 18, 2014
.
The new guidance, which is applicable prospectively, gives an acquired non-public company the option to apply pushdown accounting in its separate company financial statements in the period in which it is acquired in a change of control transaction. Once pushdown accounting has been applied, the election is irreversible. Acquired entities that chose not to apply pushdown accounting at the time of acquisition may apply pushdown accounting in a subsequent period as a change in accounting principle under ASC 250,
Accounting Changes and Error Corrections
. White Mountains has not had any acquisitions for which it has elected to apply pushdown accounting since ASU 2014-17 became effective.
Recently Issued Accounting Pronouncements
Cash Flow Statement
In August 2016, the FASB issued ASU 2016-15,
Statement of Cash Flows: Classification of Certain Cash Receipts and Cash Payments
(ASC 230), which addresses the classification and presentation of certain items, including debt prepayment and extinguishment costs, contingent consideration payments made after a business combination and distributions received from equity method investees, for which there was diversity in practice.
In November 2016, the FASB issued ASU 2016-18,
Statement of Cash Flows: Restricted Cash
(ASC 230)
.
Under current guidance, restricted amounts of cash or cash equivalents are excluded from the cash flow statement. The new guidance requires restricted cash and restricted cash equivalents to be included in the reconciliation of beginning and end-of-period amounts presented on the statement of cash flows. In addition, the new guidance requires a description of the nature of the changes in restricted cash and cash equivalents during the periods presented.
The updated guidance in ASU 2016-15 and ASU 2016-18 are both effective for interim and annual reporting periods beginning after December 15, 2017, with early adoption permitted. White Mountains is evaluating the expected impact of this new guidance.
Credit Losses
In June 2016, the FASB issued ASU 2016-13,
Measurement of Credit Losses on Financial Instruments
(ASC 326), which establishes new guidance for the recognition of credit losses for financial assets measured at amortized cost. The new ASU, which applies to financial assets that have the contractual right to receive cash requires reporting entities to estimate the credit losses expected over the life of a credit exposure using historical information, current information and reasonable and supportable forecasts that affect the collectability of the financial asset. The types of assets included in the scope of the new guidance includes premium receivables, reinsurance recoverables and loans. ASU 2016-13 is effective for annual periods beginning after January 1, 2020, including interim periods. White Mountains measures financial assets at fair value with changes therein recognized in current period earnings and accordingly, does not expect adoption to have a significant impact on its financial statements.
Stock Compensation
In March 2016, the Board issued ASU 2016-09,
Improvements to Employee Share-Based Payment Accounting
(ASC 718)
which is intended to simplify certain aspects of the accounting for share-based compensation, including forfeiture assumptions, net settlement of equity awards for withholding taxes and accounting for excess tax benefits. The new guidance provides an accounting policy election to account for forfeitures by either applying an assumption, as required under existing guidance, or by recognizing forfeitures when they actually occur. The new ASU also permits net settlement of equity awards for withholding taxes up to the maximum statutory rate and requires such amounts to be classified as a financing activities in the statement of cash flows. In addition, the new guidance changes the accounting for excess tax benefits and deficiencies by requiring recognition in the income statement, with treatment of the tax effects as discrete items in determining a reporting entity’s effective rate in the period in which exercise or vesting of awards occurs. The new guidance became effective on January 1, 2017 for White Mountains and did not have a significant effect upon adoption.
Leases
In February 2016, the FASB issued ASU 2016-02,
Leases
(ASC 842). The new guidance requires lessees to recognize lease assets and liabilities on the balance sheet for both operating and financing leases, with the exception of leases with an original term of 12 months or less. Under existing guidance recognition of lease assets and liabilities is not required for operating leases. The lease assets and liabilities to be recognized are both measured initially based on the present value of the lease payments. Under the new guidance, a sale-leaseback transaction must meet the recognition criteria under ASC 606,
Revenues
in order to be accounted for as sale. The new guidance is effective for White Mountains for years beginning after December 15, 2018, including interim periods therein. White Mountains is evaluating the impact of this new guidance and available adoption methods.
F-13
Financial Instruments - Recognition and Measurement
In January 2016, the FASB issued ASU 2016-01,
Recognition and Measurement of Financial Assets and Financial Liabilities
(ASC 825-10). The new ASU modifies the guidance for financial instruments, including investments in equity securities. Under the new guidance, all equity securities with readily determinable fair values are required to be measured at fair value with changes therein recognized through current period earnings. In addition, the new ASU requires a qualitative assessment for equity securities without readily determinable fair values to identify impairment, and for impaired equity securities to be measured at fair value. ASU 2016-01 is effective for fiscal years beginning after December 15, 2017, with early adoption permitted. White Mountains measures its portfolio of investment securities at fair value with changes therein recognized through current period earnings accordingly, does not expect the adoption of ASU 2016-01 to have a significant impact on its financial statements.
Revenue Recognition
In May 2014, the FASB issued ASU 2014-09,
Revenue from Contracts with Customers
(ASC 606)
,
which modifies the guidance for revenue recognition. Under ASU 2014-09, revenue is to be recognized at an amount that reflects the consideration to which an entity expects to be entitled in exchange for goods or services transferred to customers. The new guidance sets forth the steps to be followed to recognize revenue: (i) identify the contract(s) with a customer, (ii) identify the performance obligations in the contract, (iii) determine the transaction price, (iv) allocate the transaction price to the performance obligations in the contract and (v) recognize revenue when (or as) the entity satisfies a performance obligation. Subsequently, the FASB issued additional ASUs clarifying the guidance in and providing implementation guidance for ASU 2014-09. In August 2015, the FASB issued ASU 2015-14,
Revenue from Contracts with Customers
, which delays the effective date of ASU 2014-09 and all related ASUs to annual and interim reporting periods beginning after December 15, 2017. Most of White Mountains’s revenue from customers relates to insurance contracts, which are excluded from the scope of ASU 2014-09, as are investment income and investments gains and losses. However, the new guidance is applicable to some of White Mountains’s revenue streams, including certain fee arrangements as well as commissions and other non-insurance revenues. White Mountains is evaluating the new guidance, but does not expect ASU 2014-09 to have a significant effect on recognition of White Mountains’s non-insurance revenues from customers.
Acquisitions
The following acquisitions are included in White Mountains’s consolidated financial statements from the date of acquisition. The total assets acquired and liabilities assumed have been measured at their acquisition date fair values.
Buzzmove
On August 4, 2016, White Mountains acquired a
70.9%
ownership share in Buzzmove for a purchase price of GBP
6.1 million
(approximately
$8.1 million
based upon the foreign exchange spot rate at the date of acquisition). White Mountains recognized total assets acquired related to Buzzmove of
$11.5 million
, including
$7.6 million
of goodwill and
$1.1 million
of intangible assets, and total liabilities assumed of
$0.1 million
, reflecting acquisition date fair values.
MediaAlpha
On March 14, 2014, White Mountains acquired
60.0%
of the outstanding Class A common units of MediaAlpha. White Mountains paid an initial purchase price of
$28.1 million
. The purchase price was subject to adjustment equal to
62.5%
of the 2015 gross profit in excess of the 2013 gross profit. On February 26, 2016, White Mountains paid
$7.8 million
in
settlement of the final purchase adjustment. After adjustment for the estimated contingent purchase price adjustment, White Mountains recognized total assets acquired related to MediaAlpha of
$70.1 million
, including
$18.3 million
of goodwill and
$38.5 million
of other intangible assets, and total liabilities assumed of
$10.0 million
, reflecting acquisition date fair values.
On January 15, 2016, MediaAlpha acquired certain assets from Oversee.net for a purchase price of
$3.9 million
. The majority of assets acquired, which are included in other intangible assets, consists of customer relationships, a customer contract, a non-compete agreement from the seller, domain names and technology.
F-14
Wobi
On February 19, 2014, White Mountains acquired
54.0%
of the outstanding common shares of Wobi for NIS
14.4 million
(approximately
$4.1 million
based upon the foreign exchange spot rate at the date of acquisition). During 2014, in addition to the common shares, White Mountains also purchased NIS
31.5 million
(approximately
$9.0 million
based upon the foreign exchange spot rate at the dates of acquisition) of convertible preferred shares of Wobi. As of the acquisition date, White Mountains recognized total assets acquired related to Wobi of
$13.4 million
, including
$5.5 million
of goodwill and
$2.9 million
of other intangible assets; and total liabilities assumed of
$0.7 million
at their estimated acquisition date fair values.
During 2015, White Mountains purchased NIS
79.6 million
(approximately
$20.7 million
based upon the foreign exchange spot rate at the dates of acquisition) of convertible preferred shares of Wobi. In addition, during 2015 White Mountains also purchased NIS
11.8 million
(approximately $
3.1 million
based upon the foreign exchange spot rate at the date of acquisition) of common shares of Wobi.
On February 23, 2015, Wobi acquired
56.2%
of the outstanding share capital of Tnuva Finansit Ltd. (“Cashboard”) for NIS
9.5 million
(approximately $
2.4 million
). The acquisition of Cashboard accelerated Wobi’s development of its pension products comparison service. As of the acquisition date, Wobi recognized total assets acquired of
$5.5 million
, including
$0.3 million
of goodwill and $
2.8 million
of other intangible assets; and total liabilities assumed of $
1.2 million
at their estimated acquisition date fair values. During 2015, Wobi purchased the remaining share capital of Cashboard for NIS
26.4 million
(approximately
$6.5 million
).
During 2016, White Mountains purchased NIS
35.9 million
(approximately
$9.6 million
based upon the foreign exchange spot rates at the dates of acquisitions) of convertible preferred shares of Wobi. As of December 31, 2016 and 2015, White Mountains’s ownership share was
95.0%
and
96.1%
.
Star & Shield
On January 31, 2014, White Mountains acquired certain assets and liabilities of Star & Shield Holdings LLC, including SSRM, the attorney-in-fact for SSIE, for a purchase price of
$1.8 million
.
During 2015 and 2014, White Mountains also purchased $
4.0 million
and
$17.0 million
of SSIE Surplus Notes. Principal and interest on the SSIE Surplus Notes are payable to White Mountains only with approval from the Florida Office of Insurance Regulation.
On July 1, 2016, SSIE voluntarily ceased writing new policies. As a result, White Mountains wrote off its investment in the SSIE Surplus Notes which resulted in a
$21.0 million
total decrease to net income attributable to White Mountain’s common shareholders and a corresponding increase to net income attributable to non-controlling interests. On January 13, 2017, White Mountains reached an agreement to sell Star & Shield and its investment in SSIE Surplus Notes to K2 Insurance Services LLC. As a result, White Mountains has presented Star & Shield's and SSIE’s assets and liabilities as held for sale as of December 31, 2016 and 2015.
On December 30, 2016, SSIE entered into a Consent Order with the Florida Office of Insurance Regulation governing its wind down and the surrender and termination of SSIE’s Certificate of Authority as a domestic reciprocal in the State of Florida. Pursuant to the Consent Order, it is anticipated that SSIE will non-renew its last policy in August 2017.
SSIE is a Florida-domiciled reciprocal insurance exchange providing private passenger auto insurance to the public safety community and their families. SSIE is a VIE. SSRM’s role as the attorney-in-fact for SSIE gives it the power to direct the significant economic activities of SSIE and therefore, White Mountains is required to consolidate SSIE. See
Note 18 — “Variable Interest Entities”
.
Dispositions
Sale of Sirius Group
On April 18, 2016, White Mountains completed the sale of Sirius Group to CMI for approximately
$2.6 billion
.
$161.8 million
of this amount was used to purchase certain assets to be retained by White Mountains out of Sirius Group, including shares of OneBeacon. The amount paid at closing was based on an estimate of Sirius Group’s closing date tangible common shareholder’s equity. During 2016, White Mountains recorded
$363.2 million
of gain from sale of Sirius Group in discontinued operations and
$113.3 million
in other comprehensive income from discontinued operations.
Through April 18, 2016, Sirius Group’s results are reported as discontinued operations and assets and liabilities held for sale within White Mountains’s GAAP financial statements. Assets held for sale do not include White Mountains’s investment in OneBeacon and certain other investments that were held in the Sirius Group legal entities as of December 31, 2015. The value of these investments, net of related tax effects, was approximately
$686.2 million
, of which
$528.6 million
was Symetra common shares, as of December 31, 2015.
The transactions to purchase the investments in OneBeacon and the other investments held by Sirius Group prior to the closing are presented in the statement of cash flows as net settlement of investment cash flows with discontinued operations. See
Note 22 — “Held for Sale and Discontinued Operations”
.
F-15
Symetra
On February 1, 2016, White Mountains sold its investment in Symetra Financial Corporation (“Symetra”) for proceeds of
$658.0 million
, or
$32.00
per share. See
Note 17 — “Investments in Unconsolidated Affiliates”
.
Sale of Tranzact
On July 21, 2016, White Mountains completed the sale of Tranzact to Clayton, Dubilier & Rice, LLC and received net proceeds of
$221.3 million
at closing. In connection with the sale of Tranzact, the purchaser directly repaid
$56.3 million
for the portion of Tranzact's debt attributable to White Mountains's common shareholders. On October 5, 2016, White Mountains received additional proceeds of
$1.2 million
following the release of the post-closing purchase price adjustment escrow.
White Mountains recorded a
$51.9 million
gain from the sale of Tranzact in discontinued operations, which included a $
30.2 million
tax expense for the reversal of a tax valuation allowance that is offset by a tax benefit recorded in continuing operations. See
Note 8 — “Income Taxes”
. The increase to White Mountains’s book value from the sale of Tranzact was
$82.1 million
. A reconciliation of the gain reported in discontinued operations to the impact to White Mountains's book value is as follows:
|
Millions
|
||||
|
Gain from sale of Tranzact reported in discontinued operations
|
$
|
51.9
|
|
|
|
Add back reclassification from continuing operations for the release of
a tax valuation allowance
|
30.2
|
|
||
|
Comprehensive income from sale of Tranzact
|
$
|
82.1
|
|
|
Through July 21, 2016, Tranzact’s results of operations are reported as discontinued operations and assets and liabilities held for sale within White Mountains's GAAP financial statements. See
Note 22 — “Held for Sale and Discontinued Operations”
.
OneBeacon Crop Business
On July 31, 2015, OneBeacon exited its multiple peril crop insurance (“MPCI”) and its related crop-hail business (collectively, “Crop Business”) as its exclusive managing general agency, Climate Crop Insurance Agency (“CCIA”), exited the business through a sale of the agency to an affiliate of AmTrust. As a result of the transaction, OneBeacon and CCIA agreed to an early termination of the existing five-year agreement. During the year ended December 31, 2015, in connection with the termination of the agreement, OneBeacon received a payment of
$3.0 million
recorded in other revenues. Also related to the transaction, OneBeacon withdrew its 2016 Plan of Operations, which previously authorized it to write MPCI for the 2016 Reinsurance Year, and affiliates of AmTrust agreed to reinsure the Company’s remaining net Crop Business exposure for the 2015 Reinsurance Year under a related
100%
quota share reinsurance agreement which, coupled with other transfer and assignment agreements as well as communications with policyholders and agents, had the effect of assumption reinsurance.
Sale of OneBeacon Runoff Business
On December 23, 2014, OneBeacon completed the sale of its Runoff Business to Trebuchet US Holdings, Inc., a wholly-owned subsidiary of Armour Group Holdings Limited (“Armour”). Financing was provided in the form of the OneBeacon Surplus Notes of
$101.0 million
that had a fair value of
$64.9 million
on the date of sale. Subsequent to closing, the OneBeacon Surplus Notes are included in OneBeacon’s investment portfolio, categorized within other long-term investments. See
Note 5 - “Investment Securities”
. The difference of
$36.1 million
between the par value and the fair value of the OneBeacon Surplus Notes at the date of sale is included in the loss from sale of discontinued operations. See
Note 22 — “Held for Sale and Discontinued Operations”
.
Sale of Essentia Insurance Company
Effective January 1, 2013, OneBeacon completed the sale of Essentia Insurance Company (“Essentia”), an indirect wholly-owned subsidiary which wrote the collector cars and boats business, to Markel Corporation. Concurrently therewith, OneBeacon and Hagerty Insurance Agency (“Hagerty”) terminated their underwriting arrangement with respect to the collector cars and boats business. OneBeacon recognized a pre-tax gain on sale of
$23.0 million
(
$15.0 million
after tax) in the first quarter of 2013. During the year ended December 31, 2015, OneBeacon recognized in other revenues a
$3.7 million
negative adjustment to the pre-tax gain on sale of Essentia in connection with an assessment from the Michigan Catastrophic Claims Association (“MCCA”) payable to Markel Corporation pursuant to the indemnification provisions in the stock purchase agreement governing the sale of Essentia.
F-16
Insurance Operations
White Mountains establishes loss and LAE reserves that are estimates of amounts needed to pay claims and related expenses in the future for insured events that have already occurred. The process of estimating reserves involves a considerable degree of judgment by management and, as of any given date, is inherently uncertain.
Loss and LAE reserves are typically comprised of (1) case reserves for claims reported and (2) IBNR reserves, which include a provision for expected future development on case reserves and for losses that have occurred but for which claims have not yet been reported. Case reserves are estimated based on the experience and knowledge of claims staff regarding the nature and potential cost of each claim and are adjusted as additional information becomes known or payments are made. IBNR reserves are derived by subtracting paid loss and LAE and case reserves from estimates of ultimate loss and LAE. Actuaries estimate ultimate loss and LAE using various generally accepted actuarial methods applied to known losses and other relevant information. Like case reserves, IBNR reserves are adjusted as additional information becomes known or payments are made.
Ultimate loss and LAE are generally determined by extrapolation of claim emergence and settlement patterns observed in the past that can reasonably be expected to persist into the future. In forecasting ultimate loss and LAE with respect to any line of business, past experience with respect to that line of business is the primary resource, but cannot be relied upon in isolation. White Mountains’s own experience, particularly claims development experience, such as trends in case reserves, payments on and closings of claims, as well as changes in business mix and coverage limits, is the most important information for estimating its reserves. External data, available from organizations such as statistical bureaus, consulting firms and reinsurance companies, is sometimes used to supplement or corroborate White Mountains’s own experience. External data can be especially useful for estimating costs on newer lines of business (e.g., Programs and Surety).
For some lines of business, such as “long-tail” coverages discussed below, claims data reported in the most recent accident or report year or years is often too limited to provide a meaningful basis for analysis due to the typical delay in reporting and settling of claims. For this type of business, White Mountains uses an expected loss ratio method for the initial accident year or years. This is a standard and accepted actuarial reserve estimation method in these circumstances in which the loss ratio is selected based upon information used in pricing policies for that line of business, as well as any publicly available industry data, such as industry pricing, experience and trends, for that line of business.
Uncertainties in estimating ultimate loss and LAE are magnified by the time lag between when a claim actually occurs and when it is reported and eventually settled. This time lag is sometimes referred to as the “claim-tail”. The claim-tail for most property coverages is typically short (usually a few days up to a few months). The claim-tail for casualty coverages, such as automobile liability, general liability including the liability portion of multiple peril coverage, workers compensation, and professional liability can be especially long as claims are often reported and ultimately paid or settled years, even decades, after the related loss events occur. During the long claims reporting and settlement period, additional facts regarding coverages written in prior accident years, as well as about actual claims and trends may become known that cause White Mountains to adjust its reserves. If management determines that an adjustment is appropriate, the adjustment is booked in the accounting period in which such determination is made. Accordingly, should reserves need to be increased or decreased in the future from amounts currently established, future results of operations would be negatively or positively impacted.
In determining ultimate loss and LAE, the cost to indemnify claimants, provide needed legal defense and other services for insureds and administer the investigation and adjustment of claims are considered. These claim costs are influenced by many factors that change over time, such as expanded coverage definitions as a result of new court decisions, inflation in costs to repair or replace damaged property, inflation in the cost of medical services, and legislated changes in statutory benefits, as well as by the particular, unique facts that pertain to each claim. As a result, the rate at which claims arose in the past and the costs to settle them may not always be representative of what will occur in the future. The factors influencing changes in claim costs are often difficult to isolate or quantify and developments in paid and incurred losses from historical trends are frequently subject to multiple and conflicting interpretations. Changes in coverage terms or claims handling practices may also cause future experience and/or development patterns to vary from the past. A key objective of actuaries in developing estimates of ultimate loss and LAE and resulting IBNR reserves is to identify aberrations and systemic changes occurring within historical experience and accurately adjust for them so that the future can be projected more reliably. Because of the factors previously discussed, this process requires the use of informed judgment and is inherently uncertain.
F-17
White Mountains’s actuaries use several generally accepted actuarial methods to evaluate its loss reserves, each of which has its own strengths and weaknesses. Management places more or less reliance on a particular method based on the facts and circumstances at the time the reserve estimates are made. These methods generally fall into one of the following categories or are hybrids of one or more of the following categories:
|
•
|
Historical paid loss development methods:
These methods use historical loss payments over discrete periods of time to estimate future losses. Historical paid loss development methods assume that the ratio of losses paid in one period to losses paid in an earlier period will remain constant. These methods necessarily assume that factors that have affected paid losses in the past, such as inflation or the effects of litigation, will remain constant in the future. Because historical paid loss development methods do not use case reserves to estimate ultimate losses, they can be more reliable than the other methods discussed below that look to case reserves (such as actuarial methods that use incurred losses) in situations where there are significant changes in how case reserves are established by a company’s claims adjusters. However, historical paid loss development methods are more leveraged, meaning that small changes in payments have a larger impact on estimates of ultimate losses, than actuarial methods that use incurred losses because cumulative loss payments take much longer to approach the expected ultimate losses than cumulative incurred amounts. In addition, and for similar reasons, historical paid loss development methods are often slow to react to situations when new or different factors arise than those that have affected paid losses in the past.
|
|
•
|
Historical incurred loss development methods:
These methods, like historical paid loss development methods, assume that the ratio of losses in one period to losses in an earlier period will remain constant in the future. However, instead of using paid losses, these methods use incurred losses (i.e., the sum of cumulative historical loss payments plus outstanding case reserves) over discrete periods of time to estimate future losses. Historical incurred loss development methods can be preferable to historical paid loss development methods because they explicitly take into account open cases and the claims adjusters’ evaluations of the cost to settle all known claims. However, historical incurred loss development methods necessarily assume that case reserving practices are consistently applied over time. Therefore, when there have been significant changes in how case reserves are established, using incurred loss data to project ultimate losses can be less reliable than other methods.
|
|
•
|
Expected loss ratio methods:
These methods are based on the assumption that ultimate losses vary proportionately with premiums. Expected loss ratios are typically developed based upon the information used in pricing, and are multiplied by the total amount of premiums earned to calculate ultimate losses. Expected loss ratio methods are useful for estimating ultimate losses in the early years of long-tailed lines of business, when little or no paid or incurred loss information is available.
|
|
•
|
Bornhuetter-Ferguson methods:
These methods are a blend of the expected loss ratio and loss development methods. The percent of incurred (or paid) loss to ultimate loss implied by the selected development pattern from the incurred (or paid) loss development method is used to determine the percentage of ultimate loss yet to be developed. Inception to date losses are added to losses yet to be developed, yielding an estimate of ultimate for each accident year.
|
|
•
|
Adjusted historical paid and incurred loss development methods:
These methods take traditional historical paid and incurred loss development methods and adjust them for the estimated impact of changes from the past in factors such as inflation, the speed of claim payments or the adequacy of case reserves. Adjusted historical paid and incurred loss development methods are often more reliable methods of predicting ultimate losses in periods of significant change, provided the actuaries can develop methods to reasonably quantify the impact of changes.
|
White Mountains performs an actuarial review of its recorded reserves each quarter. As part of that review, White Mountains’s actuaries compare the previous quarter’s projections of incurred, paid and case reserve activity, including amounts incurred but not reported, to amounts experienced in the quarter. Differences between previous estimates and actual experience are evaluated to determine whether a given actuarial method for estimating loss and LAE should be relied upon to a greater or lesser extent than it had been in the past. While some variance is expected each quarter due to the inherent uncertainty in loss and LAE, persistent or large variances would indicate that prior assumptions and/or reliance on certain reserving methods may need to be revised going forward.
F-18
Upon completion of each quarterly review, White Mountains’s actuaries select indicated reserve levels based on the results of the actuarial methods described previously, which are the primary consideration in determining management's best estimate of required reserves. However, in making its best estimate, management also considers other qualitative factors that may lead to a difference between held reserves and the actuarial central estimate of reserves. Typically, these factors exist when management and our actuaries conclude that there is insufficient historical incurred and paid loss information or that trends included in the historical incurred and paid loss information are unlikely to repeat in the future. Such factors include, among others, recent entry into new markets or new products, improvements in the claims department that are expected to lessen future ultimate loss costs, legal and regulatory developments, or other volatilities that may arise.
OneBeacon Reserve Estimation by Line of Business
The process of establishing loss and LAE reserves, including amounts incurred but not reported, is complex and imprecise as it must consider many variables that are subject to the outcome of future events. As a result, informed subjective estimates and judgments as to the ultimate exposure to losses are an integral component of the loss and LAE reserving process. OneBeacon categorizes and tracks insurance reserves by “line of business”, which are summarized herein as either property short-tailed lines, casualty long-tailed lines, or other (accident, surety, and credit) lines.
OneBeacon regularly reviews the appropriateness of reserve levels at the line of business level, considering the variety of trends that impact the ultimate settlement of claims for the subsets of claims in each particular line of business.
For loss and allocated LAE reserves, the key assumption as of December 31, 2016 was that the impact of the various reserving factors, as described below, on future paid losses would be similar to the impact of those factors on the historical loss data with the exception of severity trends. Severity trends have been relatively stable over the relevant historical period. The actuarial methods used would project losses assuming continued stability in severity trends. OneBeacon has considered a range of assumptions regarding future increases in loss severity trends, including the impact of inflation, in making its reserve selections.
The major causes of material uncertainty (“reserving factors”) generally will vary for each line, as well as for each separately analyzed component of the line. The following section details reserving factors by product line. Also, reserving factors can have offsetting or compounding effects on estimated reserves. For example, in workers compensation, the use of expensive medical procedures that result in medical cost inflation may enable workers to return to work faster, thereby lowering indemnity costs. Thus, in almost all cases, it is impossible to discretely measure the effect of a single reserving factor and construct a meaningful sensitivity expectation. Actual results will likely vary from expectations for each of these assumptions, resulting in an ultimate claim liability that is different from that being estimated currently.
Additional causes of material uncertainty exist in most product lines and may impact the types of claims that could occur within a particular underwriting unit or book of business. Examples where reserving factors, within an underwriting unit or book of business, are subject to change include changing types of insured (e.g. type of insured vehicle, size of account, industry insured, jurisdiction, etc.), changing underwriting standards, or changing policy provisions (e.g. deductibles, policy limits, or endorsements).
Following is a detailed description of the reserve factors and consideration for each of the major product lines.
Property
The property short-tailed lines represent lines for which the payout of the claim liability occurs shortly after the occurrence of the loss. Reserving for property lines generally involves less uncertainty given the short-tailed nature of these lines.
Property lines, including the property portion of the multiple peril coverage and Inland Marine, cover losses to a business' premises, inventory and equipment as a result of weather, fire, theft and other causes. Claims associated with property coverage generally take a relatively short period of time to close. The reserve risk is driven by occasional catastrophic events or large single losses. The relatively high attachment points and insured values of the property policies underwritten in the Specialty Property underwriting units present a potentially longer tail and greater uncertainty than our standard property business. Property also includes the comprehensive and collision coverages of automobile policies characterized by low severity payments that are made quickly. Additionally, Property includes all of the Ocean Marine products. Ocean Marine has property and liability exposure related to commercial hull, marine, and cargo products. The exposure is generally low severity and short to medium tailed.
F-19
Casualty
The casualty long-tailed lines represent lines for which the loss may not be paid, or even reported, until well after the loss occurred. As a result, the amount of liability may not be known at the date of the loss. Reserving for casualty lines generally involves more uncertainty given these factors.
Casualty lines cover a variety of losses associated with policies that cover general liability, the liability portion of commercial multiple peril, professional liability, workers compensation, and commercial automobile liability lines. Losses associated with casualty coverage generally take a longer period of time to close claims. Most of the general reserving factors for casualty are applicable across these underwriting units, while certain underwriting units have additional reserving factors.
Casualty policies can generally be written on either a claims made or occurrence form. Most professional liability, management liability, and medical professional policies are written on a claims made basis, under which the trigger of loss is based on the date the loss is discovered or the loss is reported to OneBeacon. Professional liability policies cover the defense expenses and damages related to negligence claims brought against the insured professional services firm or government entity. The coverage focuses on damages resulting from an alleged failure to perform, error or omission in the product or service provided by the policyholder. OneBeacon liability policies cover the defense expenses and damages related to alleged wrongful acts committed by the directors and officers of the insured organization. Medical professional liability policies cover the defense expenses and damages related to negligence claims brought against the insured health care institution or provider. The coverage focuses on damages resulting from an alleged failure to perform, error or omission in the service provided by the policyholder.
Most general liability policies are written on an occurrence basis under which the trigger of loss is based on the date the loss happened. They cover businesses for any liability resulting from bodily injury and property damage arising from general business operations, accidents on business premises and the products manufactured or sold. Reserves for these policies generally include two components: bodily injury and property damage. Bodily injury payments reimburse the claimant for damages pertaining to physical injury as a result of the policyholder's legal obligation arising from non-intentional acts such as negligence, subject to the insurance policy provisions. In some cases the damages can include future wage loss, which is a function of future earnings power and wage inflation, and future medical treatment costs. Property damage payments result from damages to the claimant’s private property arising from the policyholder's legal obligation for non-intentional acts. In most cases, property damage losses are a function of costs as of the loss date or soon thereafter. Defense costs are also a part of the insured costs covered by liability policies and can be significant, sometimes greater than the cost of the actual paid claims, though for some products this risk is mitigated by policy language such that the insured portion of defense costs erodes the amount of policy limit available to pay the claim.
Casualty coverages are generally considered long-tail line business, as it takes a relatively long period of time to finalize and settle claims from a given accident year. The speed of claim reporting and claim settlement is a function of the specific coverage provided and the jurisdiction, among other factors. There are numerous components underlying these product lines. Some of these have relatively moderate payment patterns, with most of the claims for a given accident year closed within 5 to 7 years, while others can have extreme lags in both reporting and payment of claims (e.g., a reporting lag of a decade for construction defect claims).
Examples of common reserving factors across casualty lines that can change and, thus, affect estimated casualty reserves include:
|
•
|
Changes in claim handling philosophies (e.g., case reserving standards), including the use of third party claims administrators
|
|
•
|
Changes in the pattern of underlying claims, including frequency and severity
|
|
•
|
Changes in policy provisions or court interpretations of such provisions
|
|
•
|
New theories of liability (e.g., cyber related claims)
|
|
•
|
Trends in litigation or jury awards, including the propensity to sue
|
|
•
|
Changes in statutes of limitations
|
|
•
|
Shifts in lawsuit mix between federal and state courts
|
|
•
|
Changes in tort or case law
|
|
•
|
Distortions from losses resulting from large single accounts or single issues
|
|
•
|
Subrogation opportunities
|
While these reserving factors are applicable to most casualty reserving product lines, there are certain underwriting units within the casualty major product line that have additional unique reserving factors. These include commercial automobile liability and workers compensation.
F-20
Commercial automobile liability coverage insures relatively short-tailed property damage liability claims and longer-tailed, more difficult to estimate, bodily injury claims. In general, claim reporting lags are minor, claim complexity is not a major issue, and the line is viewed as high frequency, low to moderate severity. In addition to the examples of common reserving factors related to casualty described above, other examples that affect estimated commercial automobile liability reserves include:
|
•
|
Frequency of claims with payment capped by policy limits
|
|
•
|
Change in average severity of accidents, or proportion of severe accidents
|
|
•
|
Frequency of visits to health providers
|
|
•
|
Number of medical procedures given during visits to health providers
|
|
•
|
Types of health providers used
|
|
•
|
Types of medical treatments received
|
|
•
|
Changes in cost of medical treatments
|
|
•
|
Degree of patient responsiveness to treatment
|
Workers compensation covers an employer's liability for injuries, disability or death of employees, without regard to fault, as prescribed by state workers compensation law and other statutes. Workers compensation is a long-tail coverage as it takes a relatively long period of time to finalize claims from a given accident year. While certain payments such as initial medical treatment or temporary wage replacement for the injured worker are made quickly, some other payments are made over the course of several years, such as awards for permanent partial injuries. In addition, some payments can run as long as the injured worker's life, such as permanent disability benefits and ongoing medical care. Despite the possibility of long payment tails, the reporting lags are generally short, settlements are generally not complex, and most of the claims can be considered high frequency with moderate severity. The largest reserve risk generally comes from the low frequency, high severity claims providing lifetime coverage for medical expenses arising from a worker's injury. Examples of common reserving factors that can change and, thus, affect the estimated workers compensation reserves include:
|
•
|
Changes in the type, frequency of utilization or cost of medical treatments (e.g. changes in the use of pharmaceutical drugs, types of health providers used, use of preferred provider networks and other medical cost containment practices)
|
|
•
|
Availability of new medical processes and equipment
|
|
•
|
Degree of patient responsiveness to treatment
|
|
•
|
Mortality trends of injured workers with lifetime indemnity and medical treatment benefits
|
|
•
|
Degree of cost shifting between workers compensation and health insurance
|
|
•
|
Time required to recover from the injury and return to regular or transitional work
|
|
•
|
Future wage inflation for states that index benefits
|
Other lines
Other lines represent lines that do not fall into either the property or casualty definition. These lines have unique characteristics that are taken into consideration during the reserving process.
Accident
includes accidental death and dismemberment, occupational accident, sports accident, non-truckers liability and other accident coverages. It has a short to medium tailed development pattern and moderate severity profile.
Credit
represents primarily the Tuition Reimbursement underwriting operating segment which provides insurance protection for schools and parents from the financial consequences of a student's withdrawal or dismissal. The reserve risk for this line is relatively low given the extremely short-tailed and low severity nature.
Surety
, which also has a significant credit risk component, is a short-tailed but high severity coverage. As a newer business, lack of historical data means external data is heavily relied upon where available and applicable. Surety reserving factors that can change and, thus, affect estimated surety reserves include size of payment (severity) which is impacted by the bond limit, the ability of the principal (insured) or OneBeacon to mitigate the loss, or amount and collectability of assets or other collateral available to mitigate loss.
F-21
Cumulative Number of Reported Claims
OneBeacon counts a claim for each unique combination of individual claimant and major coverage (e.g. auto liability - bodily injury, auto liability - property damage, auto physical damage, etc.). The claim is counted only if, net of any applicable deductibles, a payment has been made or a case reserve has been recorded. As a point of clarification, it is counted if a case reserve is established and the claim is later closed with no payment. For a relatively small amount of bulk-coded assumed reinsurance and pools & association losses there are no claim counts available.
Discount
OneBeacon discounts its long-term workers compensation loss and LAE reserves, as such liabilities constitute unpaid but settled claims under which the payment pattern and ultimate costs are fixed and determinable on an individual basis. OneBeacon discounts these reserves using the statutory rate (
2.5%
as of both
December 31, 2016 and 2015
). For the years ended December 31, 2016 and 2015, reserves for unpaid loss and LAE were reduced by
$1.6 million
and
$1.1 million
. Changes in loss and LAE reserves resulting from a change in the average long-term workers compensation discount rate is recorded within incurred loss and LAE expense.
Loss and Loss Adjustment Expense Reserve Summary
The following table summarizes the loss and LAE reserve activities of White Mountains’s insurance subsidiaries for the years ended
December 31, 2016, 2015 and 2014
:
|
Year Ended December 31,
|
||||||||||||
|
Millions
|
2016
|
2015
|
2014
|
|||||||||
|
Gross beginning balance
|
$
|
1,389.8
|
|
$
|
1,342.2
|
|
$
|
1,054.3
|
|
|||
|
Less beginning reinsurance recoverable on unpaid losses
|
(186.0
|
)
|
(161.6
|
)
|
(80.2
|
)
|
||||||
|
Net loss and LAE reserves
|
1,203.8
|
|
1,180.6
|
|
974.1
|
|
||||||
|
Loss and LAE reserves consolidated - SSIE
|
—
|
|
—
|
|
13.6
|
|
||||||
|
Add: SSIE reserves held for sale at the beginning of the period
(1)
|
5.5
|
|
7.7
|
|
—
|
|
||||||
|
Losses and LAE incurred relating to:
|
||||||||||||
|
Current year losses
|
649.2
|
|
712.9
|
|
732.0
|
|
||||||
|
Prior year losses
|
14.8
|
|
(4.0
|
)
|
92.0
|
|
||||||
|
Total incurred losses and LAE
|
664.0
|
|
708.9
|
|
824.0
|
|
||||||
|
Loss and LAE paid relating to:
|
|
|
|
|
|
|
||||||
|
Current year losses
|
(192.8
|
)
|
(208.8
|
)
|
(202.6
|
)
|
||||||
|
Prior year losses
|
(483.1
|
)
|
(479.1
|
)
|
(420.8
|
)
|
||||||
|
Total loss and LAE payments
|
(675.9
|
)
|
(687.9
|
)
|
(623.4
|
)
|
||||||
|
Less: SSIE reserves held for sale at the end of the period
(1)
|
4.7
|
|
5.5
|
|
7.7
|
|
||||||
|
Net ending balance
|
1,192.7
|
|
1,203.8
|
|
1,180.6
|
|
||||||
|
Plus ending reinsurance recoverable on unpaid losses
|
172.9
|
|
186.0
|
|
161.6
|
|
||||||
|
Gross ending balance
|
$
|
1,365.6
|
|
$
|
1,389.8
|
|
$
|
1,342.2
|
|
|||
(1)
See
Note 22 - “Held for Sale and Discontinued Operations”
.
F-22
Loss and LAE development —2016
During the year ended
December 31, 2016
, White Mountains experienced
$14.8 million
of net unfavorable loss reserve development, which consisted of
$15.4 million
of net unfavorable loss reserve development at OneBeacon partially offset by
$0.6 million
of net favorable loss reserve development at SSIE. The net unfavorable loss reserve development at OneBeacon was primarily due to unfavorable net loss reserve development in the Healthcare (
$40.7 million
) and Programs (
$13.3 million
) underwriting units, partially offset by favorable net loss reserve development in the Accident (
$16.1 million
), Entertainment (
$9.4 million
), Technology (
$9.3 million
) and Financial Services (
$8.2 million
) underwriting units.
The
$40.7 million
unfavorable net loss reserve development from OneBeacon’s Healthcare business was principally related to the complex risk business, which provides professional liability coverage to hospitals, physicians, and physician groups as well as physicians’ extended reporting period coverage, and the senior living business, which provides medical malpractice and general liability insurance for extended care facilities, including assisted living, memory care and continuing care facilities. As a result of the continuing loss activity experienced in these areas, OneBeacon management conducted in-depth claim file and actuarial reviews and determined that increased frequency in the more recent prior accident years and adverse loss trends in the more high-risk categories of business within the senior living business warranted an increase to its best estimate of prior accident year loss reserves. OneBeacon management also increased its loss provisions for the current accident year based on the updated actuarial indications. In addition, also within OneBeacon’s Healthcare business, there were two large claims within the managed care errors and omissions business related to unexpected outcomes from mediation and extended costs associated with claim defense, which contributed to the unfavorable development in prior accident years.
Despite the reserve actions taken through the first three quarters of 2016, case incurred loss activity continued to exceed expectations during the fourth quarter of 2016. The adverse development was driven by recent prior accident years spread across the complex risks, extended care, managed care errors and omissions, and medical excess businesses.
Loss and LAE development —2015
During the year ended
December 31, 2015
, White Mountains experienced
$4.0 million
of net favorable loss reserve development, which consisted of
$1.8 million
of net favorable loss reserve development at OneBeacon and
$2.2 million
of net favorable loss reserve development at SSIE. The OneBeacon net favorable loss reserve development was primarily attributable to favorable loss reserve development in Technology, Collector Cars and Boats, Specialty Property and Financial Services businesses, offset by unfavorable net loss reserve development from the Entertainment and Ocean Marine businesses.
Loss and LAE development —2014
During the year ended
December 31, 2014
, White Mountains experienced
$92.0 million
of net unfavorable loss reserve development, which consists of
$89.8 million
of net unfavorable loss reserve development at OneBeacon, of which
$75.5 million
related to the 2014 fourth quarter reserve increase described below, and
$2.2 million
of net unfavorable loss reserve development at SSIE.
OneBeacon 2014 Fourth Quarter Loss and LAE Reserve Increase
Through the first nine months of 2014, OneBeacon recorded
$14.3 million
of unfavorable loss and LAE reserve development, driven by greater-than-expected large losses in several underwriting units, primarily in the professional and management liability lines within Professional Insurance. In 2015, Professional Insurance was reorganized into Other Professional Lines, Management Liability, Financial Services and Healthcare. This large loss activity, which occurred mostly during the second and third quarters of 2014, also impacted the current accident year loss and LAE estimates. Additionally, OneBeacon incurred higher-than-usual claim coverage determination costs, a component of LAE expenses, during the first nine months of 2014. Other underwriting units also reported increased claim activity, including the Entertainment, Government Risks, and Accident underwriting units.
F-23
Since the increased level of loss and LAE activity continued into the early part of the fourth quarter of 2014, the high level of activity in the second and third quarters no longer seemed to be isolated occurrences. As such, during the fourth quarter of 2014, OneBeacon enhanced its actuarial and claims review in several areas. OneBeacon isolated the recent large loss activity in each of its underwriting units and examined the emergence of large losses relative to the timing and amounts of expected large losses. OneBeacon also conducted additional analyses in the lawyers’ professional liability line within Professional Insurance. These new analyses included a claim level review and the application of additional actuarial methods and loss development assumptions. The results of these analyses indicated that the assumed tail risk included in the loss development patterns used to record IBNR reserves for this line were insufficient and needed to be increased for remaining long-tail exposures. OneBeacon’s claims and actuarial staff also conducted an in-depth review of coverage determination, litigation and other claim-specific adjusting expenses as a result of an emerging trend of increased expenses in these areas over recent quarters, particularly coverage determination expenses. This review concluded that the ultimate costs of these loss adjustment expenses were larger than previously estimated, causing management to record an increase in estimated LAE expenses, primarily in Professional Insurance. Finally, OneBeacon also recorded unfavorable prior year development in other underwriting units, including Entertainment and Government Risks. The unfavorable loss development in Entertainment and Government Risks resulted from heavier than expected claim activity during the fourth quarter, predominantly in the general liability and commercial auto liability lines.
In order to fully reflect these recent trends, OneBeacon recorded a
$109.2 million
increase in loss and LAE reserves, which included a
$75.5 million
increase in prior accident year loss and LAE reserves and a
$33.7 million
increase in the current accident year loss and LAE reserves recorded at September 30, 2014.
The components of the 2014 fourth quarter loss and LAE reserve increase and the net loss and LAE development for the full year are provided below:
|
Underwriting Unit
|
2014 Fourth Quarter Reserve Increases
|
Full Year 2014
|
||||||||||||||
|
Millions
|
Current Accident Year
|
Prior Accident Year
|
Total
|
Net Prior Year Development
|
||||||||||||
|
Professional Insurance
(1)
|
$
|
22.9
|
|
$
|
46.4
|
|
$
|
69.3
|
|
$
|
59.1
|
|
||||
|
Specialty Property
|
(1.1
|
)
|
5.7
|
|
4.6
|
|
1.1
|
|
||||||||
|
Crop Business
|
3.8
|
|
—
|
|
3.8
|
|
—
|
|
||||||||
|
Other
|
2.8
|
|
(.4
|
)
|
2.4
|
|
1.6
|
|
||||||||
|
Specialty Products
|
28.4
|
|
51.7
|
|
80.1
|
|
61.8
|
|
||||||||
|
Entertainment
|
1.5
|
|
11.6
|
|
13.1
|
|
13.5
|
|
||||||||
|
Government Risks
|
1.2
|
|
7.1
|
|
8.3
|
|
8.5
|
|
||||||||
|
Accident
|
—
|
|
3.5
|
|
3.5
|
|
6.0
|
|
||||||||
|
Other
|
2.6
|
|
1.6
|
|
4.2
|
|
—
|
|
||||||||
|
Specialty Industries
|
5.3
|
|
23.8
|
|
29.1
|
|
28.0
|
|
||||||||
|
Total
|
$
|
33.7
|
|
$
|
75.5
|
|
$
|
109.2
|
|
$
|
89.8
|
|
||||
(1)
Professional Insurance includes Other Professional Lines, Management Liability, Financial Services and Healthcare.
As noted above, OneBeacon increased its provision for current accident year losses and LAE by
$33.7 million
in the fourth quarter of 2014. In making its loss and LAE reserve picks for the 2014 accident year, OneBeacon considered the results of the enhanced actuarial and claim review and the fact that reported large claims were approaching estimated ultimate held reserves for large losses sooner than originally expected.
$3.8 million
of the increase is related to higher-than-expected reports of Crop Business losses that emerged in the fourth quarter. The remaining
$29.9 million
of the increase reflects an increase in management’s best estimate of current losses and LAE as of December 31, 2014 from those recorded in the first nine months of 2014. This increase primarily affected the Professional Insurance underwriting unit, which represented
$22.9 million
of the total provision.
Reconciliation of liabilities for unpaid loss and LAE
The following table reconciles loss and LAE reserves determined on a statutory basis to loss and LAE reserves determined in accordance with GAAP as of December 31, 2016 and 2015 as follows:
|
December 31,
|
||||||||
|
Millions
|
2016
|
2015
|
||||||
|
Statutory reserves (unaudited)
|
$
|
1,192.7
|
|
$
|
1,203.8
|
|
||
|
Reinsurance recoverable on unpaid losses and LAE
(1)
|
172.9
|
|
186.0
|
|
||||
|
GAAP reserves
|
$
|
1,365.6
|
|
$
|
1,389.8
|
|
||
|
(1)
|
Represents adjustments made to add back reinsurance recoverables on unpaid losses and LAE included with the presentation of reserves under statutory accounting.
|
F-24
The following table summarizes the ending liabilities for unpaid loss and LAE, net of reinsurance for each of OneBeacon’s major lines of business by underwriting group as of December 31, 2016:
|
Liabilities for unpaid claims and claims adjustment expenses, net of reinsurance
Millions
|
As of December 31, 2016
|
|||
|
Specialty Products - Property
|
$
|
30.2
|
|
|
|
Specialty Industries - Property
|
108.5
|
|
||
|
Specialty Products - Casualty
|
568.7
|
|
||
|
Specialty Industries - Casualty
|
360.0
|
|
||
|
Specialty Products - Other
|
38.2
|
|
||
|
Specialty Industries - Other
|
47.4
|
|
||
|
Total unpaid and undiscounted loss and allocated LAE reserves, net of reinsurance
|
1,153.0
|
|
||
|
Less: Discount on workers compensation reserves
|
(1.6
|
)
|
||
|
Total unpaid loss and allocated LAE reserves, net of reinsurance
|
1,151.4
|
|
||
|
Plus: Unallocated LAE
|
41.3
|
|
||
|
Total unpaid loss and LAE reserves, net of reinsurance
|
1,192.7
|
|
||
|
Plus: Reinsurance recoverables on unpaid losses
|
||||
|
Specialty Products - Property
|
40.9
|
|
||
|
Specialty Industries - Property
|
13.2
|
|
||
|
Specialty Products - Casualty
|
64.0
|
|
||
|
Specialty Industries - Casualty
|
19.9
|
|
||
|
Specialty Products - Other
|
16.0
|
|
||
|
Specialty Industries - Other
|
.6
|
|
||
|
Investing, Financing and Corporate
(1)
|
18.3
|
|
||
|
Plus: Total Reinsurance recoverables on unpaid losses
|
172.9
|
|
||
|
Total unpaid loss and LAE reserves
|
$
|
1,365.6
|
|
|
(1)
OneBeacon’s subsidiary, Atlantic Specialty Insurance Company (“ASIC”) , entered into a
100%
quota share reinsurance agreement with OBIC, an entity sold to Armour, as part of the sale of the Runoff Business. See
Note 22 — “Held for Sale and Discontinued Operations”
.
As of December 31, 2016,
$18.3
is included in reinsurance recoverables on unpaid losses within Investing, Financing, and Corporate resulting from that agreement.
The following six table groupings, reflecting one table each for the Property, Casualty and Other major lines of business for each of the Specialty Products and Specialty Industries underwriting groups and include three sections.
The first table (top section) presents, for each of the previous 10 accident years (1) cumulative total undiscounted incurred loss and allocated LAE, net of reinsurance, as of each of the previous 10 year-end evaluations, (2) total IBNR plus expected development on reported claims as of December 31, 2016, and (3) the cumulative number of reported claims as of December 31, 2016.
The second table (middle section) presents cumulative paid loss and allocated LAE, net of reinsurance, for each of the previous 10 accident years as of each of the previous 10 year-end evaluations. Also included in this table is a calculation of the liability for loss and allocated LAE as of December 31, 2016 which is then included the reconciliation to the consolidated balance sheet presented above. The liability as of December 31, 2016 is calculated as the cumulative incurred loss and allocated LAE from the first table less the cumulative paid loss and allocated from the second table, plus any outstanding liabilities from accident years prior to 2007.
The third table (bottom section) is supplementary information about the average historical claims duration as of December 31, 2016. It shows the weighted average annual percentage payout of incurred loss and allocated LAE by accident year as of each age. For example, the first column is calculated as the incremental paid loss and allocated LAE in the first calendar year for each given accident year (e.g. calendar year 2008 for accident year 2008, calendar year 2009 for accident year 2009) divided by the cumulative incurred loss and allocated LAE as of December 31, 2016 for that accident year. The resulting ratios are weighted together using cumulative incurred loss and allocated LAE as of December 31, 2016.
F-25
|
Specialty Products - Property
|
|||||||||||||||||||||||||||||||||||||
|
$ in millions
|
|||||||||||||||||||||||||||||||||||||
|
Incurred Loss and Allocated LAE, Net of Reinsurance
|
|||||||||||||||||||||||||||||||||||||
|
For the Years Ended December 31,
|
As of December 31, 2016
|
||||||||||||||||||||||||||||||||||||
|
Accident Year
|
2007
|
2008
|
2009
|
2010
|
2011
|
2012
|
2013
|
2014
|
2015
|
2016
|
Total IBNR plus expected development on reported claims
|
Cumulative number of reported claims
|
|||||||||||||||||||||||||
|
Unaudited
|
|||||||||||||||||||||||||||||||||||||
|
2007
|
$
|
12.0
|
|
$
|
11.1
|
|
$
|
9.1
|
|
$
|
7.6
|
|
$
|
7.6
|
|
$
|
7.7
|
|
$
|
8.7
|
|
$
|
8.6
|
|
$
|
8.6
|
|
$
|
8.6
|
|
$
|
—
|
|
250
|
|||
|
2008
|
—
|
|
31.3
|
|
29.2
|
|
25.4
|
|
25.6
|
|
26.6
|
|
26.8
|
|
26.8
|
|
26.8
|
|
26.8
|
|
—
|
|
3,466
|
||||||||||||||
|
2009
|
—
|
|
—
|
|
55.2
|
|
52.1
|
|
52.9
|
|
53.3
|
|
52.9
|
|
52.6
|
|
52.5
|
|
51.6
|
|
—
|
|
8,768
|
||||||||||||||
|
2010
|
—
|
|
—
|
|
—
|
|
51.0
|
|
49.5
|
|
55.6
|
|
56.7
|
|
55.9
|
|
55.8
|
|
55.8
|
|
—
|
|
10,170
|
||||||||||||||
|
2011
|
—
|
|
—
|
|
—
|
|
—
|
|
58.7
|
|
59.8
|
|
60.2
|
|
60.6
|
|
60.8
|
|
60.7
|
|
.2
|
|
11,121
|
||||||||||||||
|
2012
|
—
|
|
—
|
|
—
|
|
—
|
|
—
|
|
79.9
|
|
86.7
|
|
92.9
|
|
92.2
|
|
92.2
|
|
.2
|
|
12,405
|
||||||||||||||
|
2013
|
—
|
|
—
|
|
—
|
|
—
|
|
—
|
|
—
|
|
36.4
|
|
27.6
|
|
27.6
|
|
27.7
|
|
.3
|
|
5,267
|
||||||||||||||
|
2014
|
—
|
|
—
|
|
—
|
|
—
|
|
—
|
|
—
|
|
—
|
|
37.5
|
|
32.1
|
|
31.6
|
|
.4
|
|
1,227
|
||||||||||||||
|
2015
|
—
|
|
—
|
|
—
|
|
—
|
|
—
|
|
—
|
|
—
|
|
—
|
|
28.3
|
|
25.7
|
|
1.1
|
|
2,186
|
||||||||||||||
|
2016
|
—
|
|
—
|
|
—
|
|
—
|
|
—
|
|
—
|
|
—
|
|
—
|
|
24.5
|
|
5.2
|
|
1,825
|
||||||||||||||||
|
Total
|
|
$
|
405.2
|
|
|||||||||||||||||||||||||||||||||
|
Specialty Products - Property
|
||||||||||||||||||||||||||||||||
|
$ in millions
|
||||||||||||||||||||||||||||||||
|
Cumulative Paid Loss and Allocated LAE, Net of Reinsurance
|
||||||||||||||||||||||||||||||||
|
For the Years Ended December 31,
|
||||||||||||||||||||||||||||||||
|
Accident Year
|
2007
|
2008
|
2009
|
2010
|
2011
|
2012
|
2013
|
2014
|
2015
|
2016
|
||||||||||||||||||||||
|
Unaudited
|
||||||||||||||||||||||||||||||||
|
2007
|
$
|
1.8
|
|
$
|
3.7
|
|
$
|
6.8
|
|
$
|
7.0
|
|
$
|
7.0
|
|
$
|
7.0
|
|
$
|
8.7
|
|
$
|
8.6
|
|
$
|
8.6
|
|
$
|
8.6
|
|
||
|
2008
|
—
|
|
15.5
|
|
23.5
|
|
25.2
|
|
25.5
|
|
26.0
|
|
26.8
|
|
26.8
|
|
26.8
|
|
26.8
|
|
||||||||||||
|
2009
|
—
|
|
—
|
|
41.5
|
|
47.3
|
|
51.2
|
|
51.9
|
|
51.9
|
|
51.6
|
|
51.6
|
|
51.6
|
|
||||||||||||
|
2010
|
—
|
|
—
|
|
—
|
|
43.1
|
|
47.9
|
|
53.3
|
|
55.2
|
|
55.7
|
|
55.7
|
|
55.7
|
|
||||||||||||
|
2011
|
—
|
|
—
|
|
—
|
|
—
|
|
51.8
|
|
59.0
|
|
59.7
|
|
60.1
|
|
60.4
|
|
60.5
|
|
||||||||||||
|
2012
|
—
|
|
—
|
|
—
|
|
—
|
|
—
|
|
58.8
|
|
72.5
|
|
78.3
|
|
79.0
|
|
78.8
|
|
||||||||||||
|
2013
|
—
|
|
—
|
|
—
|
|
—
|
|
—
|
|
—
|
|
24.3
|
|
26.9
|
|
27.1
|
|
27.4
|
|
||||||||||||
|
2014
|
—
|
|
—
|
|
—
|
|
—
|
|
—
|
|
—
|
|
—
|
|
19.8
|
|
28.2
|
|
31.2
|
|
||||||||||||
|
2015
|
—
|
|
—
|
|
—
|
|
—
|
|
—
|
|
—
|
|
—
|
|
—
|
|
15.0
|
|
22.1
|
|
||||||||||||
|
2016
|
—
|
|
—
|
|
—
|
|
—
|
|
—
|
|
—
|
|
—
|
|
—
|
|
—
|
|
12.3
|
|
||||||||||||
|
Total
|
|
375.0
|
|
|||||||||||||||||||||||||||||
|
All outstanding liabilities before 2007, net of reinsurance
|
—
|
|
||||||||||||||||||||||||||||||
|
Liabilities for loss and allocated LAE, net of reinsurance
|
$
|
30.2
|
|
|||||||||||||||||||||||||||||
|
Specialty Products - Property
|
||||||||||
|
Average Annual Percentage Payout of Incurred Losses and Allocated LAE by Age, Net of Reinsurance
|
||||||||||
|
Unaudited
|
||||||||||
|
Years
|
1
|
2
|
3
|
4
|
5
|
6
|
7
|
8
|
9
|
10
|
|
70.1%
|
14.6%
|
5.9%
|
1.1%
|
0.3%
|
0.2%
|
0.4%
|
—%
|
—%
|
—%
|
|
F-26
|
Specialty Industries - Property
|
|||||||||||||||||||||||||||||||||||||
|
$ in millions
|
|||||||||||||||||||||||||||||||||||||
|
Incurred Loss and Allocated LAE, Net of Reinsurance
|
|||||||||||||||||||||||||||||||||||||
|
For the Years Ended December 31,
|
As of December 31, 2016
|
||||||||||||||||||||||||||||||||||||
|
Accident Year
|
2007
|
2008
|
2009
|
2010
|
2011
|
2012
|
2013
|
2014
|
2015
|
2016
|
Total IBNR plus expected development on reported claims
|
Cumulative number of reported claims
|
|||||||||||||||||||||||||
|
Unaudited
|
|||||||||||||||||||||||||||||||||||||
|
2007
|
$
|
110.0
|
|
$
|
104.8
|
|
$
|
101.3
|
|
$
|
94.9
|
|
$
|
95.1
|
|
$
|
95.3
|
|
$
|
95.1
|
|
$
|
95.1
|
|
$
|
95.1
|
|
$
|
94.9
|
|
$
|
—
|
|
4,828
|
|||
|
2008
|
—
|
|
147.3
|
|
137.6
|
|
129.6
|
|
129.3
|
|
132.0
|
|
132.7
|
|
130.0
|
|
129.8
|
|
129.7
|
|
.1
|
|
6,603
|
||||||||||||||
|
2009
|
—
|
|
—
|
|
124.5
|
|
118.6
|
|
118.2
|
|
117.9
|
|
118.8
|
|
118.6
|
|
118.7
|
|
118.6
|
|
.1
|
|
6,718
|
||||||||||||||
|
2010
|
—
|
|
—
|
|
—
|
|
131.4
|
|
131.5
|
|
127.2
|
|
130.0
|
|
129.7
|
|
131.4
|
|
131.2
|
|
—
|
|
8,617
|
||||||||||||||
|
2011
|
—
|
|
—
|
|
—
|
|
—
|
|
138.5
|
|
141.5
|
|
141.1
|
|
143.5
|
|
143.2
|
|
142.5
|
|
.3
|
|
9,704
|
||||||||||||||
|
2012
|
—
|
|
—
|
|
—
|
|
—
|
|
—
|
|
126.9
|
|
123.8
|
|
126.7
|
|
130.4
|
|
130.1
|
|
.8
|
|
9,697
|
||||||||||||||
|
2013
|
—
|
|
—
|
|
—
|
|
—
|
|
—
|
|
—
|
|
125.1
|
|
127.0
|
|
142.9
|
|
143.6
|
|
1.9
|
|
8,085
|
||||||||||||||
|
2014
|
—
|
|
—
|
|
—
|
|
—
|
|
—
|
|
—
|
|
—
|
|
123.9
|
|
123.5
|
|
130.1
|
|
3.9
|
|
8,352
|
||||||||||||||
|
2015
|
—
|
|
—
|
|
—
|
|
—
|
|
—
|
|
—
|
|
—
|
|
—
|
|
142.3
|
|
138.9
|
|
10.2
|
|
8,607
|
||||||||||||||
|
2016
|
—
|
|
—
|
|
—
|
|
—
|
|
—
|
|
—
|
|
—
|
|
—
|
|
—
|
|
120.3
|
|
32.8
|
|
7,429
|
||||||||||||||
|
Total
|
$
|
1,279.9
|
|
||||||||||||||||||||||||||||||||||
|
Specialty Industries - Property
|
||||||||||||||||||||||||||||||||
|
$ in millions
|
||||||||||||||||||||||||||||||||
|
Cumulative Paid Loss and Allocated LAE, Net of Reinsurance
|
||||||||||||||||||||||||||||||||
|
For the Years Ended December 31,
|
||||||||||||||||||||||||||||||||
|
Accident Year
|
2007
|
2008
|
2009
|
2010
|
2011
|
2012
|
2013
|
2014
|
2015
|
2016
|
||||||||||||||||||||||
|
Unaudited
|
||||||||||||||||||||||||||||||||
|
2007
|
$
|
42.2
|
|
$
|
70.9
|
|
$
|
82.7
|
|
$
|
87.6
|
|
$
|
91.7
|
|
$
|
93.4
|
|
$
|
94.2
|
|
$
|
94.5
|
|
$
|
94.5
|
|
$
|
94.6
|
|
||
|
2008
|
—
|
|
62.5
|
|
101.4
|
|
116.8
|
|
123.4
|
|
129.5
|
|
129.1
|
|
129.2
|
|
129.3
|
|
129.3
|
|
||||||||||||
|
2009
|
—
|
|
—
|
|
50.4
|
|
85.9
|
|
105.4
|
|
111.0
|
|
115.5
|
|
117.2
|
|
118.0
|
|
118.4
|
|
||||||||||||
|
2010
|
—
|
|
—
|
|
—
|
|
69.0
|
|
106.2
|
|
118.2
|
|
122.8
|
|
125.9
|
|
129.3
|
|
130.8
|
|
||||||||||||
|
2011
|
—
|
|
—
|
|
—
|
|
—
|
|
72.5
|
|
117.4
|
|
130.7
|
|
138.0
|
|
139.5
|
|
141.4
|
|
||||||||||||
|
2012
|
—
|
|
—
|
|
—
|
|
—
|
|
—
|
|
64.2
|
|
103.1
|
|
116.4
|
|
128.5
|
|
131.9
|
|
||||||||||||
|
2013
|
—
|
|
—
|
|
—
|
|
—
|
|
—
|
|
—
|
|
59.8
|
|
101.5
|
|
126.1
|
|
137.7
|
|
||||||||||||
|
2014
|
—
|
|
—
|
|
—
|
|
—
|
|
—
|
|
—
|
|
—
|
|
56.5
|
|
94.6
|
|
111.6
|
|
||||||||||||
|
2015
|
—
|
|
—
|
|
—
|
|
—
|
|
—
|
|
—
|
|
—
|
|
—
|
|
68.6
|
|
114.4
|
|
||||||||||||
|
2016
|
—
|
|
—
|
|
—
|
|
—
|
|
—
|
|
—
|
|
—
|
|
—
|
|
—
|
|
61.3
|
|
||||||||||||
|
Total
|
|
$
|
1,171.4
|
|
||||||||||||||||||||||||||||
|
All outstanding liabilities before 2007, net of reinsurance
|
—
|
|
||||||||||||||||||||||||||||||
|
Liabilities for loss and allocated LAE, net of reinsurance
|
$
|
108.5
|
|
|||||||||||||||||||||||||||||
|
Specialty Industries - Property
|
||||||||||
|
Average Annual Percentage Payout of Incurred Losses and Allocated LAE by Age, Net of Reinsurance
|
||||||||||
|
Unaudited
|
||||||||||
|
Years
|
1
|
2
|
3
|
4
|
5
|
6
|
7
|
8
|
9
|
10
|
|
47.4%
|
27.3%
|
9.9%
|
4.1%
|
1.8%
|
0.7%
|
0.2%
|
0.1%
|
—%
|
—%
|
|
F-27
|
Specialty Products - Casualty
|
|||||||||||||||||||||||||||||||||||||
|
$ in millions
|
|||||||||||||||||||||||||||||||||||||
|
Incurred Loss and Allocated LAE, Net of Reinsurance
|
|||||||||||||||||||||||||||||||||||||
|
For the Years Ended December 31,
|
As of December 31, 2016
|
||||||||||||||||||||||||||||||||||||
|
Accident Year
|
2007
|
2008
|
2009
|
2010
|
2011
|
2012
|
2013
|
2014
|
2015
|
2016
|
Total IBNR plus expected development on reported claims
|
Cumulative number of reported claims
|
|||||||||||||||||||||||||
|
Unaudited
|
|||||||||||||||||||||||||||||||||||||
|
2007
|
$
|
138.3
|
|
$
|
120.2
|
|
$
|
97.3
|
|
$
|
90.7
|
|
$
|
70.5
|
|
$
|
70.1
|
|
$
|
61.8
|
|
$
|
58.3
|
|
$
|
57.1
|
|
$
|
56.5
|
|
$
|
2.5
|
|
1,236
|
|||
|
2008
|
—
|
|
145.6
|
|
128.6
|
|
118.2
|
|
100.8
|
|
98.3
|
|
95.5
|
|
95.3
|
|
97.3
|
|
96.8
|
|
3.3
|
|
2,199
|
||||||||||||||
|
2009
|
—
|
|
—
|
|
169.5
|
|
186.2
|
|
194.9
|
|
193.2
|
|
192.0
|
|
194.9
|
|
195.0
|
|
195.5
|
|
4.9
|
|
4,002
|
||||||||||||||
|
2010
|
—
|
|
—
|
|
—
|
|
211.5
|
|
225.4
|
|
226.2
|
|
225.0
|
|
232.3
|
|
234.9
|
|
240.0
|
|
7.8
|
|
6,029
|
||||||||||||||
|
2011
|
—
|
|
—
|
|
—
|
|
—
|
|
194.9
|
|
189.8
|
|
205.4
|
|
214.2
|
|
214.8
|
|
214.9
|
|
9.4
|
|
6,661
|
||||||||||||||
|
2012
|
—
|
|
—
|
|
—
|
|
—
|
|
—
|
|
213.5
|
|
220.1
|
|
246.1
|
|
248.8
|
|
249.4
|
|
14.4
|
|
6,794
|
||||||||||||||
|
2013
|
—
|
|
—
|
|
—
|
|
—
|
|
—
|
|
—
|
|
205.2
|
|
233.1
|
|
229.6
|
|
247.9
|
|
20.3
|
|
5,866
|
||||||||||||||
|
2014
|
—
|
|
—
|
|
—
|
|
—
|
|
—
|
|
—
|
|
—
|
|
240.5
|
|
235.9
|
|
258.9
|
|
44.4
|
|
6,504
|
||||||||||||||
|
2015
|
—
|
|
—
|
|
—
|
|
—
|
|
—
|
|
—
|
|
—
|
|
—
|
|
206.9
|
|
213.4
|
|
78.5
|
|
9,710
|
||||||||||||||
|
2016
|
—
|
|
—
|
|
—
|
|
—
|
|
—
|
|
—
|
|
—
|
|
—
|
|
—
|
|
202.8
|
|
142.8
|
|
9,093
|
||||||||||||||
|
Total
|
|
$
|
1,976.1
|
|
|||||||||||||||||||||||||||||||||
|
Specialty Products - Casualty
|
||||||||||||||||||||||||||||||||
|
$ in millions
|
||||||||||||||||||||||||||||||||
|
Cumulative Paid Losses and Allocated LAE, Net of Reinsurance
|
||||||||||||||||||||||||||||||||
|
For the Years Ended December 31,
|
||||||||||||||||||||||||||||||||
|
Accident Year
|
2007
|
2008
|
2009
|
2010
|
2011
|
2012
|
2013
|
2014
|
2015
|
2016
|
||||||||||||||||||||||
|
Unaudited
|
||||||||||||||||||||||||||||||||
|
2007
|
$
|
6.8
|
|
$
|
24.8
|
|
$
|
32.4
|
|
$
|
41.7
|
|
$
|
44.4
|
|
$
|
50.7
|
|
$
|
51.9
|
|
$
|
53.6
|
|
$
|
54.0
|
|
$
|
54.0
|
|
||
|
2008
|
—
|
|
8.8
|
|
32.3
|
|
50.8
|
|
65.4
|
|
77.6
|
|
83.1
|
|
85.3
|
|
88.1
|
|
91.5
|
|
||||||||||||
|
2009
|
—
|
|
—
|
|
26.5
|
|
81.8
|
|
124.0
|
|
147.8
|
|
161.4
|
|
169.9
|
|
178.3
|
|
187.8
|
|
||||||||||||
|
2010
|
—
|
|
—
|
|
—
|
|
32.0
|
|
107.0
|
|
157.8
|
|
180.5
|
|
196.3
|
|
213.6
|
|
220.3
|
|
||||||||||||
|
2011
|
—
|
|
—
|
|
—
|
|
—
|
|
25.8
|
|
88.9
|
|
131.3
|
|
163.7
|
|
186.2
|
|
192.5
|
|
||||||||||||
|
2012
|
—
|
|
—
|
|
—
|
|
—
|
|
—
|
|
25.8
|
|
86.7
|
|
157.7
|
|
193.6
|
|
219.8
|
|
||||||||||||
|
2013
|
—
|
|
—
|
|
—
|
|
—
|
|
—
|
|
—
|
|
26.4
|
|
86.3
|
|
143.1
|
|
194.2
|
|
||||||||||||
|
2014
|
—
|
|
—
|
|
—
|
|
—
|
|
—
|
|
—
|
|
—
|
|
34.3
|
|
95.2
|
|
156.7
|
|
||||||||||||
|
2015
|
—
|
|
—
|
|
—
|
|
—
|
|
—
|
|
—
|
|
—
|
|
—
|
|
19.9
|
|
78.4
|
|
||||||||||||
|
2016
|
—
|
|
—
|
|
—
|
|
—
|
|
—
|
|
—
|
|
—
|
|
—
|
|
—
|
|
16.5
|
|
||||||||||||
|
Total
|
|
1,411.7
|
|
|||||||||||||||||||||||||||||
|
All outstanding liabilities before 2007, net of reinsurance
|
4.3
|
|
||||||||||||||||||||||||||||||
|
Liabilities for loss and allocated LAE, net of reinsurance
|
$
|
568.7
|
|
|||||||||||||||||||||||||||||
|
Specialty Products - Casualty
|
||||||||||
|
Average Annual Percentage Payout of Incurred Losses and Allocated LAE by Age, Net of Reinsurance
|
||||||||||
|
Unaudited
|
||||||||||
|
Years
|
1
|
2
|
3
|
4
|
5
|
6
|
7
|
8
|
9
|
10
|
|
11.3%
|
24.0%
|
17.8%
|
9.6%
|
4.7%
|
2.2%
|
0.9%
|
0.7%
|
0.2%
|
—%
|
|
F-28
|
Specialty Industries - Casualty
|
|||||||||||||||||||||||||||||||||||||
|
$ in millions
|
|||||||||||||||||||||||||||||||||||||
|
Incurred Loss and Allocated LAE, Net of Reinsurance
|
|||||||||||||||||||||||||||||||||||||
|
For the Years Ended December 31,
|
As of December 31, 2016
|
||||||||||||||||||||||||||||||||||||
|
Accident Year
|
2007
|
2008
|
2009
|
2010
|
2011
|
2012
|
2013
|
2014
|
2015
|
2016
|
Total IBNR plus expected development on reported claims
|
Cumulative number of reported claims
|
|||||||||||||||||||||||||
|
Unaudited
|
|||||||||||||||||||||||||||||||||||||
|
2007
|
$
|
24.9
|
|
$
|
24.3
|
|
$
|
21.7
|
|
$
|
34.0
|
|
$
|
34.9
|
|
$
|
35.1
|
|
$
|
35.1
|
|
$
|
36.0
|
|
$
|
37.1
|
|
$
|
36.9
|
|
$
|
.3
|
|
1,770
|
|||
|
2008
|
—
|
|
26.3
|
|
26.2
|
|
30.4
|
|
26.4
|
|
25.8
|
|
25.2
|
|
23.7
|
|
22.2
|
|
22.1
|
|
.5
|
|
1,835
|
||||||||||||||
|
2009
|
—
|
|
—
|
|
51.0
|
|
51.1
|
|
51.5
|
|
49.6
|
|
54.8
|
|
53.6
|
|
51.6
|
|
51.0
|
|
1.0
|
|
2,982
|
||||||||||||||
|
2010
|
—
|
|
—
|
|
—
|
|
80.8
|
|
72.4
|
|
69.3
|
|
69.4
|
|
73.3
|
|
75.5
|
|
77.2
|
|
3.5
|
|
4,791
|
||||||||||||||
|
2011
|
—
|
|
—
|
|
—
|
|
—
|
|
88.1
|
|
87.5
|
|
90.2
|
|
100.5
|
|
111.8
|
|
112.2
|
|
3.8
|
|
5,254
|
||||||||||||||
|
2012
|
—
|
|
—
|
|
—
|
|
—
|
|
—
|
|
118.8
|
|
103.4
|
|
102.0
|
|
101.8
|
|
98.8
|
|
7.9
|
|
6,298
|
||||||||||||||
|
2013
|
—
|
|
—
|
|
—
|
|
—
|
|
—
|
|
—
|
|
121.9
|
|
131.5
|
|
133.6
|
|
138.2
|
|
18.0
|
|
7,107
|
||||||||||||||
|
2014
|
—
|
|
—
|
|
—
|
|
—
|
|
—
|
|
—
|
|
—
|
|
135.6
|
|
127.4
|
|
124.2
|
|
35.7
|
|
7,633
|
||||||||||||||
|
2015
|
—
|
|
—
|
|
—
|
|
—
|
|
—
|
|
—
|
|
—
|
|
—
|
|
146.3
|
|
127.7
|
|
61.8
|
|
7,315
|
||||||||||||||
|
2016
|
—
|
|
—
|
|
—
|
|
—
|
|
—
|
|
—
|
|
—
|
|
—
|
|
—
|
|
129.9
|
|
98.4
|
|
5,701
|
||||||||||||||
|
Total
|
|
$
|
918.2
|
|
|||||||||||||||||||||||||||||||||
|
Specialty Industries - Casualty
|
||||||||||||||||||||||||||||||||
|
$ in millions
|
||||||||||||||||||||||||||||||||
|
Cumulative Paid Loss and Allocated LAE, Net of Reinsurance
|
||||||||||||||||||||||||||||||||
|
For the Years Ended December 31,
|
||||||||||||||||||||||||||||||||
|
Accident Year
|
2007
|
2008
|
2009
|
2010
|
2011
|
2012
|
2013
|
2014
|
2015
|
2016
|
||||||||||||||||||||||
|
Unaudited
|
||||||||||||||||||||||||||||||||
|
2007
|
$
|
2.8
|
|
$
|
5.5
|
|
$
|
7.9
|
|
$
|
13.8
|
|
$
|
27.9
|
|
$
|
29.9
|
|
$
|
32.4
|
|
$
|
32.9
|
|
$
|
34.3
|
|
$
|
35.9
|
|
||
|
2008
|
—
|
|
3.2
|
|
6.9
|
|
11.5
|
|
14.2
|
|
17.3
|
|
19.9
|
|
21.2
|
|
20.8
|
|
20.9
|
|
||||||||||||
|
2009
|
—
|
|
—
|
|
5.1
|
|
16.6
|
|
25.0
|
|
34.5
|
|
42.9
|
|
46.3
|
|
46.3
|
|
47.4
|
|
||||||||||||
|
2010
|
—
|
|
—
|
|
—
|
|
8.7
|
|
21.1
|
|
37.3
|
|
51.4
|
|
57.5
|
|
65.3
|
|
68.9
|
|
||||||||||||
|
2011
|
—
|
|
—
|
|
—
|
|
—
|
|
11.1
|
|
34.2
|
|
53.7
|
|
69.8
|
|
88.9
|
|
96.4
|
|
||||||||||||
|
2012
|
—
|
|
—
|
|
—
|
|
—
|
|
—
|
|
12.9
|
|
31.9
|
|
50.6
|
|
67.8
|
|
79.7
|
|
||||||||||||
|
2013
|
—
|
|
—
|
|
—
|
|
—
|
|
—
|
|
—
|
|
18.6
|
|
45.5
|
|
72.7
|
|
96.6
|
|
||||||||||||
|
2014
|
—
|
|
—
|
|
—
|
|
—
|
|
—
|
|
—
|
|
—
|
|
16.6
|
|
40.2
|
|
61.4
|
|
||||||||||||
|
2015
|
—
|
|
—
|
|
—
|
|
—
|
|
—
|
|
—
|
|
—
|
|
—
|
|
13.6
|
|
39.3
|
|
||||||||||||
|
2016
|
—
|
|
—
|
|
—
|
|
—
|
|
—
|
|
—
|
|
—
|
|
—
|
|
—
|
|
11.8
|
|
||||||||||||
|
Total
|
|
$
|
558.3
|
|
||||||||||||||||||||||||||||
|
All outstanding liabilities before 2007, net of reinsurance
|
.1
|
|
||||||||||||||||||||||||||||||
|
Liabilities for loss and allocated LAE, net of reinsurance
|
$
|
360.0
|
|
|||||||||||||||||||||||||||||
|
Specialty Industries - Casualty
|
||||||||||
|
Average Annual Percentage Payout of Incurred Losses and Allocated LAE by Age, Net of Reinsurance
|
||||||||||
|
Unaudited
|
||||||||||
|
Years
|
1
|
2
|
3
|
4
|
5
|
6
|
7
|
8
|
9
|
10
|
|
11.4%
|
16.2%
|
12.9%
|
9.7%
|
6.8%
|
2.5%
|
0.8%
|
0.1%
|
0.2%
|
0.2%
|
|
F-29
|
Specialty Products - Other
|
|||||||||||||||||||||||||||||||||||||
|
$ in millions
|
|||||||||||||||||||||||||||||||||||||
|
Incurred Loss and Allocated LAE, Net of Reinsurance
|
|||||||||||||||||||||||||||||||||||||
|
For the Years Ended December 31,
|
As of December 31, 2016
|
||||||||||||||||||||||||||||||||||||
|
Accident Year
|
2007
|
2008
|
2009
|
2010
|
2011
|
2012
|
2013
|
2014
|
2015
|
2016
|
Total IBNR plus expected development on reported claims
|
Cumulative number of reported claims
|
|||||||||||||||||||||||||
|
Unaudited
|
|||||||||||||||||||||||||||||||||||||
|
2007
|
$
|
26.8
|
|
$
|
26.7
|
|
$
|
26.8
|
|
$
|
28.6
|
|
$
|
28.6
|
|
$
|
28.6
|
|
$
|
28.6
|
|
$
|
28.6
|
|
$
|
28.6
|
|
$
|
28.6
|
|
$
|
—
|
|
5,073
|
|||
|
2008
|
—
|
|
31.7
|
|
31.5
|
|
31.2
|
|
31.2
|
|
31.2
|
|
31.2
|
|
31.2
|
|
31.2
|
|
31.2
|
|
—
|
|
5,192
|
||||||||||||||
|
2009
|
—
|
|
—
|
|
33.8
|
|
31.4
|
|
31.3
|
|
30.8
|
|
30.9
|
|
30.9
|
|
30.9
|
|
30.9
|
|
—
|
|
5,138
|
||||||||||||||
|
2010
|
—
|
|
—
|
|
—
|
|
34.7
|
|
34.3
|
|
32.5
|
|
32.6
|
|
32.5
|
|
32.5
|
|
32.5
|
|
—
|
|
5,182
|
||||||||||||||
|
2011
|
—
|
|
—
|
|
—
|
|
—
|
|
33.2
|
|
35.5
|
|
35.4
|
|
35.4
|
|
35.4
|
|
35.4
|
|
—
|
|
5,306
|
||||||||||||||
|
2012
|
—
|
|
—
|
|
—
|
|
—
|
|
—
|
|
36.6
|
|
36.9
|
|
36.9
|
|
36.9
|
|
37.0
|
|
—
|
|
5,324
|
||||||||||||||
|
2013
|
—
|
|
—
|
|
—
|
|
—
|
|
—
|
|
—
|
|
39.6
|
|
40.6
|
|
39.2
|
|
39.2
|
|
—
|
|
5,510
|
||||||||||||||
|
2014
|
—
|
|
—
|
|
—
|
|
—
|
|
—
|
|
—
|
|
—
|
|
96.6
|
|
90.8
|
|
92.9
|
|
—
|
|
9,971
|
||||||||||||||
|
2015
|
—
|
|
—
|
|
—
|
|
—
|
|
—
|
|
—
|
|
—
|
|
—
|
|
75.5
|
|
73.2
|
|
1.8
|
|
10,704
|
||||||||||||||
|
2016
|
—
|
|
—
|
|
—
|
|
—
|
|
—
|
|
—
|
|
—
|
|
—
|
|
—
|
|
77.1
|
|
33.8
|
|
4,306
|
||||||||||||||
|
Total
|
|
$
|
478.0
|
|
|||||||||||||||||||||||||||||||||
|
Specialty Products - Other
|
||||||||||||||||||||||||||||||||
|
$ in millions
|
||||||||||||||||||||||||||||||||
|
Cumulative Paid Loss and Allocated LAE, Net of Reinsurance
|
||||||||||||||||||||||||||||||||
|
For the Years Ended December 31,
|
||||||||||||||||||||||||||||||||
|
Accident Year
|
2007
|
2008
|
2009
|
2010
|
2011
|
2012
|
2013
|
2014
|
2015
|
2016
|
||||||||||||||||||||||
|
Unaudited
|
||||||||||||||||||||||||||||||||
|
2007
|
$
|
19.8
|
|
$
|
28.4
|
|
$
|
28.6
|
|
$
|
28.6
|
|
$
|
28.6
|
|
$
|
28.6
|
|
$
|
28.6
|
|
$
|
28.6
|
|
$
|
28.6
|
|
$
|
28.6
|
|
||
|
2008
|
—
|
|
21.3
|
|
31.1
|
|
31.2
|
|
31.2
|
|
31.2
|
|
31.2
|
|
31.2
|
|
31.2
|
|
31.2
|
|
||||||||||||
|
2009
|
—
|
|
—
|
|
21.6
|
|
30.8
|
|
30.8
|
|
30.9
|
|
30.9
|
|
30.9
|
|
30.9
|
|
30.9
|
|
||||||||||||
|
2010
|
—
|
|
—
|
|
—
|
|
22.4
|
|
32.4
|
|
32.5
|
|
32.5
|
|
32.5
|
|
32.5
|
|
32.5
|
|
||||||||||||
|
2011
|
—
|
|
—
|
|
—
|
|
—
|
|
25.2
|
|
35.2
|
|
35.4
|
|
35.4
|
|
35.4
|
|
35.4
|
|
||||||||||||
|
2012
|
—
|
|
—
|
|
—
|
|
—
|
|
—
|
|
26.1
|
|
36.8
|
|
36.9
|
|
36.9
|
|
37.0
|
|
||||||||||||
|
2013
|
—
|
|
—
|
|
—
|
|
—
|
|
—
|
|
—
|
|
27.4
|
|
39.0
|
|
39.2
|
|
39.2
|
|
||||||||||||
|
2014
|
—
|
|
—
|
|
—
|
|
—
|
|
—
|
|
—
|
|
—
|
|
46.2
|
|
88.5
|
|
90.3
|
|
||||||||||||
|
2015
|
—
|
|
—
|
|
—
|
|
—
|
|
—
|
|
—
|
|
—
|
|
—
|
|
41.7
|
|
70.6
|
|
||||||||||||
|
2016
|
—
|
|
—
|
|
—
|
|
—
|
|
—
|
|
—
|
|
—
|
|
—
|
|
—
|
|
44.2
|
|
||||||||||||
|
Total
|
|
$
|
439.9
|
|
||||||||||||||||||||||||||||
|
All outstanding liabilities before 2007, net of reinsurance
|
.1
|
|
||||||||||||||||||||||||||||||
|
Liabilities for loss and allocated LAE, net of reinsurance
|
$
|
38.2
|
|
|||||||||||||||||||||||||||||
|
Specialty Products - Other
|
||||||||||
|
Average Annual Percentage Payout of Incurred Losses and Allocated LAE by Age, Net of Reinsurance
|
||||||||||
|
Unaudited
|
||||||||||
|
Years
|
1
|
2
|
3
|
4
|
5
|
6
|
7
|
8
|
9
|
10
|
|
61.9%
|
29.5%
|
0.6%
|
—%
|
—%
|
—%
|
—%
|
—%
|
—%
|
—%
|
|
F-30
|
Specialty Industries - Other
|
|||||||||||||||||||||||||||||||||||||
|
$ in millions
|
|||||||||||||||||||||||||||||||||||||
|
Incurred Loss and Allocated LAE, Net of Reinsurance
|
|||||||||||||||||||||||||||||||||||||
|
For the Years Ended December 31,
|
As of December 31, 2016
|
||||||||||||||||||||||||||||||||||||
|
Accident Year
|
2007
|
2008
|
2009
|
2010
|
2011
|
2012
|
2013
|
2014
|
2015
|
2016
|
Total IBNR plus expected development on reported claims
|
Cumulative number of reported claims
|
|||||||||||||||||||||||||
|
Unaudited
|
|||||||||||||||||||||||||||||||||||||
|
2007
|
$
|
4.3
|
|
$
|
4.6
|
|
$
|
4.5
|
|
$
|
4.4
|
|
$
|
4.4
|
|
$
|
4.4
|
|
$
|
4.4
|
|
$
|
4.4
|
|
$
|
4.4
|
|
$
|
4.4
|
|
$
|
—
|
|
291
|
|||
|
2008
|
—
|
|
10.4
|
|
10.8
|
|
12.2
|
|
11.9
|
|
11.9
|
|
11.8
|
|
12.1
|
|
12.1
|
|
12.3
|
|
—
|
|
975
|
||||||||||||||
|
2009
|
—
|
|
—
|
|
19.1
|
|
19.2
|
|
19.0
|
|
19.3
|
|
20.9
|
|
21.4
|
|
21.5
|
|
21.7
|
|
.2
|
|
1,763
|
||||||||||||||
|
2010
|
—
|
|
—
|
|
—
|
|
25.6
|
|
26.6
|
|
27.1
|
|
27.9
|
|
28.2
|
|
28.4
|
|
28.4
|
|
—
|
|
2,449
|
||||||||||||||
|
2011
|
—
|
|
—
|
|
—
|
|
—
|
|
35.1
|
|
36.0
|
|
37.7
|
|
38.5
|
|
38.2
|
|
38.2
|
|
.2
|
|
3,638
|
||||||||||||||
|
2012
|
—
|
|
—
|
|
—
|
|
—
|
|
—
|
|
42.0
|
|
39.6
|
|
40.1
|
|
41.1
|
|
41.6
|
|
.3
|
|
3,861
|
||||||||||||||
|
2013
|
—
|
|
—
|
|
—
|
|
—
|
|
—
|
|
—
|
|
41.1
|
|
41.2
|
|
42.2
|
|
42.5
|
|
.7
|
|
4,245
|
||||||||||||||
|
2014
|
—
|
|
—
|
|
—
|
|
—
|
|
—
|
|
—
|
|
—
|
|
42.6
|
|
40.4
|
|
40.6
|
|
1.9
|
|
3,497
|
||||||||||||||
|
2015
|
—
|
|
—
|
|
—
|
|
—
|
|
—
|
|
—
|
|
—
|
|
—
|
|
46.6
|
|
31.9
|
|
4.9
|
|
3,301
|
||||||||||||||
|
2016
|
—
|
|
—
|
|
—
|
|
—
|
|
—
|
|
—
|
|
—
|
|
—
|
|
—
|
|
33.2
|
|
19.4
|
|
2,222
|
||||||||||||||
|
Total
|
|
$
|
294.8
|
|
|||||||||||||||||||||||||||||||||
|
Specialty Industries - Other
|
||||||||||||||||||||||||||||||||
|
$ in millions
|
||||||||||||||||||||||||||||||||
|
Cumulative Paid Loss and Allocated LAE, Net of Reinsurance
|
||||||||||||||||||||||||||||||||
|
For the Years Ended December 31,
|
||||||||||||||||||||||||||||||||
|
Accident Year
|
2007
|
2008
|
2009
|
2010
|
2011
|
2012
|
2013
|
2014
|
2015
|
2016
|
||||||||||||||||||||||
|
Unaudited
|
||||||||||||||||||||||||||||||||
|
2007
|
$
|
1.2
|
|
$
|
4.0
|
|
$
|
4.3
|
|
$
|
4.3
|
|
$
|
4.3
|
|
$
|
4.3
|
|
$
|
4.3
|
|
$
|
4.4
|
|
$
|
4.4
|
|
$
|
4.4
|
|
||
|
2008
|
—
|
|
3.8
|
|
9.0
|
|
11.1
|
|
11.7
|
|
11.8
|
|
11.7
|
|
12.0
|
|
12.0
|
|
12.2
|
|
||||||||||||
|
2009
|
—
|
|
—
|
|
6.3
|
|
14.6
|
|
17.7
|
|
18.3
|
|
19.2
|
|
21.2
|
|
21.4
|
|
21.4
|
|
||||||||||||
|
2010
|
—
|
|
—
|
|
—
|
|
8.3
|
|
22.9
|
|
25.1
|
|
26.9
|
|
27.6
|
|
28.0
|
|
28.1
|
|
||||||||||||
|
2011
|
—
|
|
—
|
|
—
|
|
—
|
|
13.5
|
|
29.4
|
|
34.6
|
|
36.5
|
|
37.2
|
|
37.3
|
|
||||||||||||
|
2012
|
—
|
|
—
|
|
—
|
|
—
|
|
—
|
|
13.2
|
|
30.7
|
|
35.8
|
|
38.3
|
|
39.1
|
|
||||||||||||
|
2013
|
—
|
|
—
|
|
—
|
|
—
|
|
—
|
|
—
|
|
13.0
|
|
29.3
|
|
37.2
|
|
39.6
|
|
||||||||||||
|
2014
|
—
|
|
—
|
|
—
|
|
—
|
|
—
|
|
—
|
|
—
|
|
12.6
|
|
28.9
|
|
34.8
|
|
||||||||||||
|
2015
|
—
|
|
—
|
|
—
|
|
—
|
|
—
|
|
—
|
|
—
|
|
—
|
|
9.8
|
|
22.2
|
|
||||||||||||
|
2016
|
—
|
|
—
|
|
—
|
|
—
|
|
—
|
|
—
|
|
—
|
|
—
|
|
—
|
|
8.0
|
|
||||||||||||
|
Total
|
|
$
|
247.1
|
|
||||||||||||||||||||||||||||
|
All outstanding liabilities before 2007, net of reinsurance
|
(.3
|
)
|
||||||||||||||||||||||||||||||
|
Liabilities for loss and allocated LAE, net of reinsurance
|
$
|
47.4
|
|
|||||||||||||||||||||||||||||
|
Specialty Industries - Other
|
||||||||||
|
Average Annual Percentage Payout of Incurred Losses and Allocated LAE by Age, Net of Reinsurance
|
||||||||||
|
Unaudited
|
||||||||||
|
Years
|
1
|
2
|
3
|
4
|
5
|
6
|
7
|
8
|
9
|
10
|
|
30.4%
|
37.0%
|
10.8%
|
3.3%
|
1.1%
|
0.9%
|
0.2%
|
—%
|
0.1%
|
—%
|
|
F-31
In the normal course of business, White Mountains’s insurance subsidiaries seek to limit losses that may arise from catastrophes or other events by reinsuring with third-party reinsurers. White Mountains remains liable for risks reinsured in the event that the reinsurer does not honor its obligations under reinsurance contracts. The effects of reinsurance on White Mountains’s insurance subsidiaries’ written and earned premiums and on losses and LAE were as follows (see
Note 10 — “Municipal Bond Guarantee Insurance”
for balances related to White Mountains financial guarantee business):
|
Year ended December 31, 2016
|
||||||||||||||||
|
Millions
|
OneBeacon
|
HG/BAM
(1)
|
Other
|
Total
|
||||||||||||
|
Written premiums:
|
||||||||||||||||
|
Direct
|
$
|
1,193.3
|
|
$
|
38.6
|
|
$
|
13.3
|
|
$
|
1,245.2
|
|
||||
|
Assumed
|
28.0
|
|
—
|
|
—
|
|
28.0
|
|
||||||||
|
Gross written premiums
|
1,221.3
|
|
38.6
|
|
13.3
|
|
1,273.2
|
|
||||||||
|
Ceded
|
(120.6
|
)
|
—
|
|
(6.8
|
)
|
(127.4
|
)
|
||||||||
|
Net written premiums
|
$
|
1,100.7
|
|
$
|
38.6
|
|
$
|
6.5
|
|
$
|
1,145.8
|
|
||||
|
Earned premiums:
|
||||||||||||||||
|
Direct
|
$
|
1,177.0
|
|
$
|
5.9
|
|
$
|
15.2
|
|
$
|
1,198.1
|
|
||||
|
Assumed
|
29.4
|
|
—
|
|
—
|
|
29.4
|
|
||||||||
|
Gross earned premiums
|
1,206.4
|
|
5.9
|
|
15.2
|
|
1,227.5
|
|
||||||||
|
Ceded
|
(105.8
|
)
|
—
|
|
(7.7
|
)
|
(113.5
|
)
|
||||||||
|
Net earned premiums
|
$
|
1,100.6
|
|
5.9
|
|
$
|
7.5
|
|
$
|
1,114.0
|
|
|||||
|
Losses and LAE:
|
||||||||||||||||
|
Direct
|
$
|
679.5
|
|
$
|
—
|
|
$
|
14.3
|
|
$
|
693.8
|
|
||||
|
Assumed
|
21.2
|
|
—
|
|
—
|
|
21.2
|
|
||||||||
|
Gross losses and LAE
|
700.7
|
|
—
|
|
14.3
|
|
715.0
|
|
||||||||
|
Ceded
|
(44.7
|
)
|
—
|
|
(6.3
|
)
|
(51.0
|
)
|
||||||||
|
Net losses and LAE
|
$
|
656.0
|
|
$
|
—
|
|
$
|
8.0
|
|
$
|
664.0
|
|
||||
(1)
During 2016, BAM ceded
$27.2
in written premiums and
$21.0
in earned premiums to HG Global, which have been eliminated within the HG/BAM segment.
|
Year ended December 31, 2015
|
||||||||||||||||
|
Millions
|
OneBeacon
|
HG/BAM
(1)
|
Other
|
Total
|
||||||||||||
|
Written premiums:
|
||||||||||||||||
|
Direct
|
$
|
1,279.9
|
|
$
|
25.9
|
|
$
|
19.9
|
|
$
|
1,325.7
|
|
||||
|
Assumed
|
36.0
|
|
—
|
|
—
|
|
36.0
|
|
||||||||
|
Gross written premiums
|
1,315.9
|
|
25.9
|
|
19.9
|
|
1,361.7
|
|
||||||||
|
Ceded
|
(179.3
|
)
|
(2)
|
—
|
|
(9.8
|
)
|
(189.1
|
)
|
|||||||
|
Net written premiums
|
$
|
1,136.6
|
|
$
|
25.9
|
|
$
|
10.1
|
|
$
|
1,172.6
|
|
||||
|
Earned premiums:
|
|
|
|
|
||||||||||||
|
Direct
|
$
|
1,298.0
|
|
$
|
3.3
|
|
$
|
20.7
|
|
$
|
1,322.0
|
|
||||
|
Assumed
|
45.9
|
|
—
|
|
—
|
|
45.9
|
|
||||||||
|
Gross earned premiums
|
1,343.9
|
|
3.3
|
|
20.7
|
|
1,367.9
|
|
||||||||
|
Ceded
|
(167.7
|
)
|
(2)
|
—
|
|
(12.0
|
)
|
(179.7
|
)
|
|||||||
|
Net earned premiums
|
$
|
1,176.2
|
|
3.3
|
|
$
|
8.7
|
|
$
|
1,188.2
|
|
|||||
|
Losses and LAE:
|
|
|
|
|
||||||||||||
|
Direct
|
$
|
783.0
|
|
$
|
—
|
|
$
|
19.5
|
|
$
|
802.5
|
|
||||
|
Assumed
|
55.7
|
|
—
|
|
—
|
|
55.7
|
|
||||||||
|
Gross losses and LAE
|
838.7
|
|
—
|
|
19.5
|
|
858.2
|
|
||||||||
|
Ceded
|
(138.0
|
)
|
(2)
|
—
|
|
(11.3
|
)
|
(149.3
|
)
|
|||||||
|
Net losses and LAE
|
$
|
700.7
|
|
$
|
—
|
|
$
|
8.2
|
|
$
|
708.9
|
|
||||
(1)
During 2015, BAM ceded $
19.3
in written premiums and $
16.0
in earned premiums to HG Global, which have been eliminated within the HG/BAM segment.
(2)
During 2015, OneBeacon recorded ceded
$33.3
in written premiums,
$33.3
in earned premiums and
$33.4
in loss and LAE as a result of the exit of the Crop Business due to the
100%
quota share reinsurance agreement with AmTrust.
F-32
|
Year ended December 31, 2014
|
||||||||||||||||
|
Millions
|
OneBeacon
|
HG/BAM
(1)
|
Other
(2)
|
Total
|
||||||||||||
|
Written premiums:
|
||||||||||||||||
|
Direct
|
$
|
1,257.5
|
|
$
|
16.2
|
|
$
|
22.6
|
|
$
|
1,296.3
|
|
||||
|
Assumed
|
65.9
|
|
—
|
|
—
|
|
65.9
|
|
||||||||
|
Gross written premiums
|
1,323.4
|
|
16.2
|
|
22.6
|
|
1,362.2
|
|
||||||||
|
Ceded
|
(106.5
|
)
|
—
|
|
(16.7
|
)
|
(123.2
|
)
|
||||||||
|
Net written premiums
|
$
|
1,216.9
|
|
$
|
16.2
|
|
$
|
5.9
|
|
$
|
1,239.0
|
|
||||
|
Earned premiums:
|
||||||||||||||||
|
Direct
|
$
|
1,209.1
|
|
$
|
1.8
|
|
$
|
22.6
|
|
$
|
1,233.5
|
|
||||
|
Assumed
|
70.9
|
|
—
|
|
—
|
|
70.9
|
|
||||||||
|
Gross earned premiums
|
1,280.0
|
|
1.8
|
|
22.6
|
|
1,304.4
|
|
||||||||
|
Ceded
|
(102.9
|
)
|
—
|
|
(16.5
|
)
|
(119.4
|
)
|
||||||||
|
Net earned premiums
|
$
|
1,177.1
|
|
$
|
1.8
|
|
$
|
6.1
|
|
$
|
1,185.0
|
|
||||
|
Losses and LAE:
|
||||||||||||||||
|
Direct
|
$
|
778.7
|
|
$
|
—
|
|
$
|
24.1
|
|
$
|
802.8
|
|
||||
|
Assumed
|
115.7
|
|
—
|
|
—
|
|
115.7
|
|
||||||||
|
Gross losses and LAE
|
894.4
|
|
—
|
|
24.1
|
|
918.5
|
|
||||||||
|
Ceded
|
(79.3
|
)
|
—
|
|
(15.2
|
)
|
(94.5
|
)
|
||||||||
|
Net losses and LAE
|
$
|
815.1
|
|
$
|
—
|
|
$
|
8.9
|
|
$
|
824.0
|
|
||||
(1)
During 2014, BAM ceded $
12.3
in written premiums and $
1.4
in earned premiums to HG Global, which have been eliminated within the HG/BAM segment.
(2)
During 2014, SSIE ceded
$16.0
in written premiums,
$15.7
in earned premiums, and
$16.9
in loss and LAE to OneBeacon, which have been eliminated in consolidation.
OneBeacon
The timing and size of catastrophe losses are unpredictable and the level of losses experienced in any year could be material to OneBeacon’s operating results and financial condition. Examples of catastrophes include losses caused by earthquakes, wildfires, hurricanes and other types of storms and terrorist acts. The extent of losses caused by a catastrophic event is a function of severity and the amount and type of insured exposure in the affected area. In the normal course of business, OneBeacon's insurance subsidiaries seek to limit losses that may arise from catastrophes or other events through individual risk selection, imposing deductibles and limits, limiting its concentration of insurance in catastrophe-prone areas, such as coastal regions, and reinsuring with third-party reinsurers.
OneBeacon uses models (primarily AIR Worldwide Touchstone version 4.1) to estimate potential losses from catastrophes. OneBeacon uses this model output in conjunction with other data to manage its exposure to catastrophe losses based on a probable maximum loss forecast to quantify its exposure to an extreme catastrophe event.
OneBeacon utilizes a general catastrophe reinsurance treaty with third-party reinsurers to manage its exposure to large catastrophe losses. Effective May 1, 2016, OneBeacon renewed its property catastrophe reinsurance program through April 30, 2017. The program provides coverage for OneBeacon’s property business as well as certain acts of terrorism. Under the program, the first
$20.0 million
of losses resulting from any single catastrophe are retained and
100%
of the next
$110.0 million
of losses resulting from the catastrophe are reinsured. Any part of a catastrophe loss in excess of
$130.0 million
would be retained in full. In the event of a catastrophe, OneBeacon’s property catastrophe reinsurance program is reinstated for the remainder of the original contract term by paying a reinstatement premium that is based on the percentage of coverage reinstated and the original property catastrophe coverage premium.
OneBeacon’s current third party reinsurance programs provide varying degrees of coverage for terrorism events. The Company's overall terrorism exposure is impacted by the Terrorism Risk Insurance Program (the “Terrorism Act”), which is a federal program administered by the Department of the Treasury that provides for a shared system of public and private compensation for commercial property and casualty losses resulting from events that reach the threshold for losses (
$140.0 million
in 2017 and increasing
$20.0 million
in subsequent years until the threshold becomes
$200.0 million
in 2020) and are certified as an act of terrorism by the U.S. Secretary of the Treasury, in concurrence with the Secretary of Homeland Security and the Attorney General of the United States. The Terrorism Act limits the industry's aggregate liability for losses from certified terrorist acts by requiring the federal government to share a set amount of losses (
83%
in 2017 and decreasing
1%
annually in subsequent years until it reaches a floor of
80%
in 2020) once a company meets a specific retention or deductible as determined by its prior year's direct written premiums. It also limits the aggregate liability to be paid by the government and industry without further action by Congress to
$100.0 billion
. In exchange for this “backstop,” primary insurers are required to make coverage available to commercial insureds for losses from acts of terrorism as specified in the Terrorism Act. The following types of coverage are excluded from the program: commercial automobile, burglary and theft, surety, farmowners multi-peril and all professional liability coverage except directors and officers coverage.
F-33
All losses that result from a nuclear, biological, chemical or radiological terrorist attack are excluded from OneBeacon’s current third party reinsurance program. OneBeacon’s property catastrophe treaty also excludes acts of terrorism certified pursuant to the Terrorism Act and committed by an individual or individuals acting on behalf of any foreign person or foreign interest. OneBeacon's casualty clash treaty provides coverage for losses that result from certified and non-certified acts of terrorism, on an aggregated basis, subject to a maximum of one full treaty limit. OneBeacon's property per risk, casualty and workers compensation treaties each provide full coverage for certified acts of terrorism on behalf of a non-foreign person or interest, but are sublimited to one full treaty limit for certified acts of terrorism committed on behalf of any foreign person or foreign interest. OneBeacon’s healthcare treaty is sublimited to one full treaty limit of coverage for all acts of terrorism.
OneBeacon estimates its individual retention level for commercial policies subject to the Terrorism Act to be approximately
$140.0 million
in 2017. The federal government will pay
83%
of covered terrorism losses that exceed OneBeacon’s or the industry’s retention levels in 2017, up to a total of
$100.0 billion
. As indicated above, OneBeacon’s
17%
copay will increase annually beginning in 2017 by
1%
until it reaches a limit of
20%
in 2020.
In addition to the corporate catastrophe reinsurance protection, OneBeacon also purchases dedicated reinsurance protection for certain lines of business. The following table summarizes the reinsurance coverage currently in effect as of December 31, 2016:
|
$ in millions
|
||||||||||||||||
|
Coverage
|
Contract Type
|
Renewal Date
|
First-Dollar Retention
|
Per Risk Limit Purchased
|
Maximum Retention
|
|||||||||||
|
Corporate Property Catastrophe - Property and Inland Marine
|
Excess of Loss
|
5/1
|
$
|
20.0
|
|
$
|
110.0
|
|
$
|
20.0
|
|
|||||
|
Property Per Risk - Property and Inland Marine
|
Excess of Loss
|
5/1
|
3.0
|
|
100.0
|
|
3.0
|
|
||||||||
|
Specialty Property - Excess and Surplus Property Catastrophe
|
Excess of Loss
|
5/1
|
6.0
|
|
34.0
|
|
6.0
|
|
||||||||
|
Medical Excess - HMO/Provider Excess
|
Excess of Loss
|
1/1
|
5.0
|
|
Unlimited
|
5.0
|
|
|||||||||
|
Ocean and Inland Marine
|
Excess of Loss
|
4/1
|
2.5
|
|
57.5
|
|
7.0
|
|
||||||||
|
Surety
|
Excess of Loss
|
10/1
|
5.0
|
|
45.0
|
|
5.0
|
|
||||||||
|
Film Completion Bonds
|
Excess of Loss
|
6/1
|
2.0
|
|
38.0
|
|
2.0
|
|
||||||||
|
Casualty Clash/Workers Compensation Catastrophe
|
Excess of Loss
|
6/1
|
6.0
|
|
34.0
|
|
6.0
|
|
||||||||
|
Workers Compensation Catastrophe
|
Excess of Loss
|
6/1
|
40.0
|
|
20.0
|
|
6.0
|
|
||||||||
|
Financial Institutions - Professional Liability
|
Quota Share
|
6/1
|
N/A
|
|
10.0
|
|
5.0
|
|
||||||||
|
Combined Healthcare/Casualty 2nd Layer - Various lines
|
Excess of Loss
|
6/1
|
10.0 / 11.0
|
|
10.0
|
|
3.0
|
|
||||||||
|
Casualty Per Policy - Various lines
|
Excess of Loss
|
6/1
|
3.0
|
|
8.0
|
|
3.0
|
|
||||||||
|
Workers Compensation Per Occurrence
|
Excess of Loss
|
6/1
|
2.0
|
|
8.0
|
|
2.0
|
|
||||||||
|
Healthcare Professional Liability
|
Excess of Loss
|
6/1
|
3.0
|
|
7.0
|
|
3.0
|
|
||||||||
As of
December 31, 2016
, OneBeacon had
$6.6 million
and
$172.9 million
of reinsurance recoverables on paid and unpaid losses. As reinsurance contracts do not relieve OneBeacon of its obligation to its policyholders, collectability of balances due from reinsurers is important to OneBeacon’s financial strength. OneBeacon is selective with its reinsurers, placing reinsurance with only those reinsurers having a strong financial condition. OneBeacon monitors the financial strength of its reinsurers on an ongoing basis. Uncollectible amounts historically have not been significant.
The following table summarizes A.M. Best Company, Inc. (“A.M. Best”) ratings for OneBeacon’s reinsurers.
|
A.M. Best’s Rating
(1)
|
|||||||
|
$ in millions
|
Balance at December 31, 2016
|
% of Total
|
|||||
|
A+ or better
|
$
|
73.9
|
|
41
|
%
|
||
|
A- to A
|
79.7
|
|
44
|
%
|
|||
|
B, Not rated and other
(2)
|
25.9
|
|
15
|
%
|
|||
|
Total
|
$
|
179.5
|
|
100
|
%
|
||
(1)
A.M. Best’s ratings as detailed above are “A+ or better” (Superior), “A- to A” (Excellent) and “B” (Fair).
(2)
Includes reinsurance recoverable on unpaid losses of
$18.3 million
related to OBIC, an unrated entity sold to Armour as part of the sale of the Runoff Business.
F-34
White Mountains’s invested assets consist of investment securities and other long-term investments held for general investment purposes. The portfolio of investment securities includes fixed maturity investments, short-term investments, common equity securities, and other-long term investments which are all classified as trading securities. Trading securities are reported at fair value as of the balance sheet date. Net realized and unrealized investment gains (losses) on trading securities are reported in pre-tax revenues.
White Mountains’s fixed maturity investments are generally valued using industry standard pricing methodologies. Key inputs include benchmark yields, benchmark securities, reported trades, issuer spreads, bids, offers, credit ratings and prepayment speeds. Income on mortgage and asset-backed securities is recognized using an effective yield based on anticipated prepayments and the estimated economic life of the securities. When actual prepayments differ significantly from anticipated prepayments, the estimated economic life is recalculated and the remaining unamortized premium or discount is amortized prospectively over the remaining economic life.
Realized investment gains (losses) resulting from sales of investment securities are accounted for using the specific identification method. Premiums and discounts on all fixed maturity investments are amortized or accreted to income over the anticipated life of the investment. Short-term investments consist of interest-bearing money market funds, certificates of deposit and other securities which, at the time of purchase, mature or become available for use within one year. Short-term investments are carried at amortized or accreted cost, which approximated fair value as of
December 31, 2016
and
December 31, 2015
.
Other long-term investments consist primarily of hedge funds, private equity funds, non-controlling interests in private capital investments and the OneBeacon Surplus Notes.
Net Investment Income
White Mountains’s net investment income is comprised primarily of interest income associated with White Mountains’s fixed maturity investments and short-term investments and dividend income from its common equity securities and other long-term investments.
Pre-tax net investment income for
2016, 2015 and 2014
consisted of the following:
|
Year Ended December 31,
|
||||||||||||
|
Millions
|
2016
|
2015
|
2014
|
|||||||||
|
Investment income:
|
||||||||||||
|
Fixed maturity investments
|
$
|
77.3
|
|
$
|
52.6
|
|
$
|
51.3
|
|
|||
|
Short-term investments
|
1.1
|
|
.2
|
|
.1
|
|
||||||
|
Common equity securities
|
7.5
|
|
10.1
|
|
16.6
|
|
||||||
|
Other long-term investments
|
4.0
|
|
3.3
|
|
4.4
|
|
||||||
|
Total investment income
|
89.9
|
|
66.2
|
|
72.4
|
|
||||||
|
Third-party investment expenses
|
(3.1
|
)
|
(5.4
|
)
|
(12.9
|
)
|
||||||
|
Net investment income, pre-tax
|
$
|
86.8
|
|
|
$
|
60.8
|
|
|
$
|
59.5
|
|
|
Net Realized and Unrealized Investment Gains (Losses)
Net realized and unrealized investment gains (losses) consisted of the following:
|
Year Ended December 31,
|
||||||||||||
|
Millions
|
2016
|
2015
|
2014
|
|||||||||
|
Net realized investment gains, pre-tax
|
$
|
280.3
|
|
$
|
77.3
|
|
$
|
166.8
|
|
|||
|
Net unrealized investment (losses) gains, pre-tax
|
(270.0
|
)
|
148.1
|
|
(88.3
|
)
|
||||||
|
Net realized and unrealized investment gains, pre-tax
|
10.3
|
|
|
225.4
|
|
|
78.5
|
|
||||
|
Income tax expense attributable to net realized and unrealized investment gains
|
(8.8
|
)
|
(35.2
|
)
|
(18.0
|
)
|
||||||
|
Net realized and unrealized investment gains, after tax
|
$
|
1.5
|
|
$
|
190.2
|
|
$
|
60.5
|
|
|||
F-35
Net realized investment gains
Net realized investment gains for
2016, 2015 and 2014
consisted of the following:
|
Year ended December 31, 2016
|
||||||||||||
|
Millions
|
Net realized (losses) gains
|
Net foreign
exchange gains |
Total net realized (losses) gains reflected in earnings
|
|||||||||
|
Fixed maturity investments
|
$
|
(2.1
|
)
|
$
|
.4
|
|
$
|
(1.7
|
)
|
|||
|
Short-term investments
|
.4
|
|
—
|
|
.4
|
|
||||||
|
Common equity securities
|
280.7
|
|
—
|
|
280.7
|
|
||||||
|
Other long-term investments
|
.9
|
|
—
|
|
.9
|
|
||||||
|
Net realized investment gains, pre-tax
|
279.9
|
|
.4
|
|
280.3
|
|
||||||
|
Income tax expense attributable to net realized investment gains
|
(49.5
|
)
|
—
|
|
(49.5
|
)
|
||||||
|
Net realized investment gains, after-tax
|
$
|
230.4
|
|
$
|
.4
|
|
$
|
230.8
|
|
|||
|
Year ended December 31, 2015
|
||||||||||||
|
Millions
|
Net realized gains
|
Net foreign
exchange gains |
Total net realized
gains reflected in earnings |
|||||||||
|
Fixed maturity investments
|
$
|
1.9
|
|
$
|
—
|
|
$
|
1.9
|
|
|||
|
Common equity securities
|
64.4
|
|
.4
|
|
64.8
|
|
||||||
|
Other long-term investments
|
10.6
|
|
—
|
|
10.6
|
|
||||||
|
Net realized investment gains, pre-tax
|
76.9
|
|
.4
|
|
77.3
|
|
||||||
|
Income tax expense attributable to net realized investment gains
|
(22.8
|
)
|
—
|
|
(22.8
|
)
|
||||||
|
Net realized investment gains, after-tax
|
$
|
54.1
|
|
$
|
.4
|
|
$
|
54.5
|
|
|||
|
Year ended December 31, 2014
|
||||||||||||
|
Millions
|
Net realized gains
|
Net foreign
exchange gains |
Total net realized
gains reflected in earnings |
|||||||||
|
Fixed maturity investments
|
$
|
5.8
|
|
$
|
—
|
|
$
|
5.8
|
|
|||
|
Common equity securities
|
138.0
|
|
—
|
|
138.0
|
|
||||||
|
Other long-term investments
|
23.0
|
|
—
|
|
23.0
|
|
||||||
|
Net realized investment gains, pre-tax
|
166.8
|
|
—
|
|
166.8
|
|
||||||
|
Income tax expense attributable to net realized investment gains
|
(28.4
|
)
|
—
|
|
(28.4
|
)
|
||||||
|
Net realized investment gains, after-tax
|
$
|
138.4
|
|
$
|
—
|
|
$
|
138.4
|
|
|||
Net unrealized investment gains (losses)
The following table summarizes net unrealized investment gains (losses) and changes in the carrying value of investments measured at fair value:
|
Year ended December 31, 2016
|
||||||||||||
|
Millions
|
Net
unrealized losses
|
Net foreign
exchange
gains (losses)
|
Total net unrealized losses reflected in earnings
|
|||||||||
|
Fixed maturity investments
|
$
|
(12.1
|
)
|
$
|
2.1
|
|
$
|
(10.0
|
)
|
|||
|
Common equity securities
|
(254.6
|
)
|
(3.3
|
)
|
(257.9
|
)
|
||||||
|
Other long-term investments
|
(.6
|
)
|
(.3
|
)
|
(.9
|
)
|
||||||
|
Forward contracts
|
—
|
|
(1.2
|
)
|
(1.2
|
)
|
||||||
|
Net unrealized investment losses, pre-tax
|
(267.3
|
)
|
(2.7
|
)
|
(270.0
|
)
|
||||||
|
Income tax benefit attributable to net unrealized investment losses
|
40.7
|
|
—
|
|
40.7
|
|
||||||
|
Net unrealized investment losses, after-tax
|
$
|
(226.6
|
)
|
$
|
(2.7
|
)
|
$
|
(229.3
|
)
|
|||
F-36
|
Year ended December 31, 2015
|
||||||||||||
|
Millions
|
Net
unrealized (losses) gains |
Net foreign
exchange losses |
Total net unrealized
(losses) gains reflected in earnings |
|||||||||
|
Fixed maturity investments
|
$
|
(15.6
|
)
|
$
|
—
|
|
$
|
(15.6
|
)
|
|||
|
Common equity securities
|
207.6
|
|
(3.7
|
)
|
203.9
|
|
||||||
|
Other long-term investments
|
(39.1
|
)
|
(1.1
|
)
|
(40.2
|
)
|
||||||
|
Net unrealized investment gains (losses), pre-tax
|
152.9
|
|
(4.8
|
)
|
148.1
|
|
||||||
|
Income tax expense attributable to net unrealized investment gains (losses)
|
(12.3
|
)
|
(.1
|
)
|
(12.4
|
)
|
||||||
|
Net unrealized investment gains (losses), after-tax
|
$
|
140.6
|
|
$
|
(4.9
|
)
|
$
|
135.7
|
|
|||
|
Year ended December 31, 2014
|
||||||||||||
|
Millions
|
Net
unrealized
gains (losses)
|
Net foreign
exchange losses
|
Total net unrealized
gains (losses) reflected in
earnings
|
|||||||||
|
Fixed maturity investments
|
$
|
11.3
|
|
$
|
—
|
|
$
|
11.3
|
|
|||
|
Common equity securities
|
(83.0
|
)
|
(7.7
|
)
|
(90.7
|
)
|
||||||
|
Other long-term investments
|
(7.6
|
)
|
(1.3
|
)
|
(8.9
|
)
|
||||||
|
Net unrealized investment losses, pre-tax
|
(79.3
|
)
|
(9.0
|
)
|
(88.3
|
)
|
||||||
|
Income tax benefit attributable to net unrealized investment losses
|
9.9
|
|
.5
|
|
10.4
|
|
||||||
|
Net unrealized investment losses, after-tax
|
$
|
(69.4
|
)
|
$
|
(8.5
|
)
|
$
|
(77.9
|
)
|
|||
White Mountains recognized gross realized investment gains of
$315.5 million
,
$112.9 million
and
$194.0 million
and gross realized investment losses of
$35.2 million
,
$35.6 million
and
$27.2 million
on sales of investment securities during 2016, 2015 and 2014.
The following table summarizes the amount of total gains (losses) included in earnings attributable to net unrealized investment gains (losses) for Level 3 investments for the years ended
December 31, 2016, 2015 and 2014
.
|
Year Ended December 31,
|
||||||||||||
|
Millions
|
2016
|
2015
|
2014
|
|||||||||
|
Fixed maturity investments
|
$
|
.1
|
|
$
|
(1.1
|
)
|
$
|
1.9
|
|
|||
|
Common equity securities
|
—
|
|
(9.0
|
)
|
5.8
|
|
||||||
|
Other long-term investments
|
6.1
|
|
(13.0
|
)
|
—
|
|
||||||
|
Total net unrealized investment gains (losses), pre-tax - Level 3 investments
|
$
|
6.2
|
|
$
|
(23.1
|
)
|
$
|
7.7
|
|
|||
The components of White Mountains’s net realized and unrealized investment gains (losses), after-tax, as recorded on the statements of operations and comprehensive income were as follows:
|
Year Ended December 31,
|
||||||||||||
|
Millions
|
2016
|
2015
|
2014
|
|||||||||
|
Net change in pre-tax unrealized investment (losses) gains on investments in
unconsolidated affiliates
|
$
|
—
|
|
$
|
(39.2
|
)
|
$
|
81.2
|
|
|||
|
Income tax benefit (expense)
|
—
|
|
2.9
|
|
(5.9
|
)
|
||||||
|
Net change in unrealized investment (losses) gains on investments in
unconsolidated affiliates, after tax
|
—
|
|
(36.3
|
)
|
75.3
|
|
||||||
|
Reversal of accumulated other comprehensive income related to change in
accounting for the investment in Symetra
|
—
|
|
1.4
|
|
—
|
|
||||||
|
Total investment (losses) gains through accumulated other
comprehensive income
|
—
|
|
(34.9
|
)
|
75.3
|
|
||||||
|
Net realized and unrealized investment gains, after-tax
|
1.5
|
|
190.2
|
|
60.5
|
|
||||||
|
Total investment gains recorded during the period, after-tax
|
$
|
1.5
|
|
$
|
155.3
|
|
$
|
135.8
|
|
|||
F-37
Investment Holdings
The cost or amortized cost, gross unrealized investment gains (losses), net foreign currency gains, and carrying values of White Mountains’s fixed maturity investments as of
December 31, 2016 and 2015
, were as follows:
|
December 31, 2016
|
||||||||||||||||||||
|
Millions
|
Cost or
amortized
cost
|
Gross
unrealized
gains
|
Gross
unrealized
losses
|
Net foreign
currency
gains
|
Carrying
value
|
|||||||||||||||
|
US Government and agency obligations
|
$
|
281.7
|
|
$
|
.1
|
|
$
|
(3.5
|
)
|
$
|
—
|
|
$
|
278.3
|
|
|||||
|
Debt securities issued by corporations
|
1,512.6
|
|
8.4
|
|
(13.7
|
)
|
2.1
|
|
1,509.4
|
|
||||||||||
|
Municipal obligations
|
308.8
|
|
1.9
|
|
(1.7
|
)
|
—
|
|
309.0
|
|
||||||||||
|
Mortgage and asset-backed securities
|
2,141.7
|
|
2.6
|
|
(11.4
|
)
|
—
|
|
2,132.9
|
|
||||||||||
|
Foreign government, agency and provincial
obligations
|
12.9
|
|
.3
|
|
—
|
|
—
|
|
13.2
|
|
||||||||||
|
Preferred stocks
|
8.3
|
|
5.7
|
|
—
|
|
—
|
|
14.0
|
|
||||||||||
|
Total fixed maturity investments
|
4,266.0
|
|
19.0
|
|
(30.3
|
)
|
2.1
|
|
4,256.8
|
|
||||||||||
|
Fixed maturity investments reclassified to
assets held for sale related to SSIE |
(6.6
|
)
|
||||||||||||||||||
|
Total fixed maturity investments
|
$
|
4,250.2
|
|
|||||||||||||||||
|
December 31, 2015
|
||||||||||||||||||||
|
Millions
|
Cost or
amortized
cost
|
Gross
unrealized
gains
|
Gross
unrealized
losses
|
Net foreign
currency
gains (losses)
|
Carrying
value
|
|||||||||||||||
|
US Government and agency obligations
|
$
|
160.4
|
|
$
|
—
|
|
$
|
(.4
|
)
|
$
|
—
|
|
$
|
160.0
|
|
|||||
|
Debt securities issued by corporations
|
1,001.0
|
|
4.3
|
|
(5.3
|
)
|
—
|
|
1,000.0
|
|
||||||||||
|
Municipal obligations
|
227.8
|
|
2.2
|
|
(1.2
|
)
|
—
|
|
228.8
|
|
||||||||||
|
Mortgage and asset-backed securities
|
1,170.6
|
|
2.0
|
|
(5.6
|
)
|
—
|
|
1,167.0
|
|
||||||||||
|
Foreign government, agency and provincial
obligations
|
1.0
|
|
.2
|
|
—
|
|
—
|
|
1.2
|
|
||||||||||
|
Preferred stocks
|
78.3
|
|
4.4
|
|
—
|
|
—
|
|
82.7
|
|
||||||||||
|
Total fixed maturity investments
|
2,639.1
|
|
13.1
|
|
(12.5
|
)
|
$
|
—
|
|
2,639.7
|
|
|||||||||
|
Fixed maturity investments reclassified to
assets held for sale related to SSIE
|
(9.5
|
)
|
||||||||||||||||||
|
Total fixed maturity investments
|
$
|
2,630.2
|
|
|||||||||||||||||
The weighted average duration of White Mountains’s fixed income portfolio was approximately
2.8
years, including short-term investments, and approximately
3.0
years excluding short-term investments as of
December 31, 2016
.
F-38
The cost or amortized cost and carrying value of White Mountains’s fixed maturity investments as of
December 31, 2016
is presented below by contractual maturity. Actual maturities could differ from contractual maturities because borrowers may have the right to call or prepay certain obligations with or without call or prepayment penalties.
|
December 31, 2016
|
||||||||
|
Millions
|
Cost or amortized cost
|
Carrying value
|
||||||
|
Due in one year or less
|
$
|
212.8
|
|
$
|
213.3
|
|
||
|
Due after one year through five years
|
1,272.6
|
|
1,270.2
|
|
||||
|
Due after five years through ten years
|
462.8
|
|
458.4
|
|
||||
|
Due after ten years
|
167.8
|
|
168.0
|
|
||||
|
Mortgage and asset-backed securities
|
2,141.7
|
|
2,132.9
|
|
||||
|
Preferred stocks
|
8.3
|
|
14.0
|
|
||||
|
Total
|
$
|
4,266.0
|
|
$
|
4,256.8
|
|
||
(1)
Includes carrying value of
$6.6
in fixed maturity investments that are classified as assets held for sale related to SSIE.
The cost or amortized cost, gross unrealized investment gains (losses), net foreign currency gains (losses), and carrying values of White Mountains’s common equity securities and other long-term investments as of
December 31, 2016 and 2015
were as follows:
|
December 31, 2016
|
||||||||||||||||||||
|
Millions
|
Cost or
amortized cost
|
Gross unrealized
gains
|
Gross unrealized
losses
|
Net foreign
currency losses
|
Carrying
value
|
|||||||||||||||
|
Common equity securities
|
$
|
440.8
|
|
$
|
35.9
|
|
$
|
(2.4
|
)
|
$
|
—
|
|
$
|
474.3
|
|
|||||
|
Other long-term investments
|
$
|
314.9
|
|
$
|
40.3
|
|
$
|
(28.0
|
)
|
$
|
(3.9
|
)
|
$
|
323.3
|
|
|||||
|
December 31, 2015
|
||||||||||||||||||||
|
Millions
|
Cost or
amortized cost
|
Gross unrealized
gains
|
Gross unrealized
losses
|
Net foreign
currency losses
|
Carrying
value
|
|||||||||||||||
|
Common equity securities
|
$
|
822.5
|
|
$
|
302.8
|
|
$
|
(11.4
|
)
|
$
|
—
|
|
$
|
1,113.9
|
|
|||||
|
Other long-term investments
|
$
|
304.5
|
|
$
|
32.0
|
|
$
|
(18.4
|
)
|
$
|
(2.3
|
)
|
$
|
315.8
|
|
|||||
Proceeds from the sales and maturities of investments, excluding short-term investments, totaled
$5.4 billion
,
$2.2 billion
and
$3.3 billion
for the years ended
December 31, 2016, 2015 and 2014
.
Investments Held on Deposit or as Collateral
As of
December 31, 2016 and 2015
, investments of
$165.9 million
and
$143.6 million
, were held in trusts required to be maintained in relation to various reinsurance agreements. White Mountains’s insurance subsidiaries are required to maintain deposits with certain insurance regulatory agencies in order to maintain their insurance licenses. The fair value of such deposits which are included within total investments totaled
$93.5 million
and
$88.0 million
as of
December 31, 2016 and 2015
.
As of
December 31, 2016 and 2015
, OneBeacon held unrestricted collateral from its customers, which is included in cash and invested assets, relating to its surety business of
$153.0 million
and
$137.7 million
. The obligation to return these funds is included in funds held under insurance and reinsurance contracts in the consolidated balance sheets.
F-39
Fair value measurements as of
December 31, 2016
Fair value measurements are categorized into a hierarchy that distinguishes between inputs based on market data from independent sources (“observable inputs”) and a reporting entity's internal assumptions based upon the best information available when external market data is limited or unavailable (“unobservable inputs”). Quoted prices in active markets for identical assets or liabilities have the highest priority (“Level 1”), followed by observable inputs other than quoted prices, including prices for similar but not identical assets or liabilities (“Level 2”) and unobservable inputs, including the reporting entity's estimates of the assumptions that market participants would use, having the lowest priority (“Level 3”).
As of December 31, 2016 and December 31, 2015 White Mountains used quoted market prices or other observable inputs to determine fair value for approximately
94%
and
91%
of its investment portfolio. Investments valued using Level 1 inputs include fixed maturity investments, primarily investments in U.S. Treasuries, short-term investments, which include U.S. Treasury Bills and common equity securities. Investments valued using Level 2 inputs are primarily comprised of fixed maturity investments, which have been disaggregated into classes, including debt securities issued by corporations, municipal obligations, mortgage and asset-backed securities, foreign government, agency and provincial obligations and preferred stocks. Investments valued using Level 2 inputs also include certain passive exchange traded funds (“ETFs”) that track U.S. stock indices such as the S&P 500 but are traded on foreign exchanges and that management values using the fund manager’s published NAV to account for the difference in market close times. Fair value estimates for investments that trade infrequently and have few or no observable market prices are classified as Level 3 measurements. Level 3 fair value estimates based upon unobservable inputs include White Mountains’s investments in the OneBeacon Surplus Notes, as well as certain investments in fixed maturity investments, common equity securities and other long-term investments where quoted market prices are unavailable or are not considered reasonable. Transfers between levels are based on investments held as of the beginning of the period.
White Mountains uses brokers and outside pricing services to assist in determining fair values. For investments in active markets, White Mountains uses the quoted market prices provided by outside pricing services to determine fair value. The outside pricing services White Mountains uses have indicated that they will only provide prices where observable inputs are available. In circumstances where quoted market prices are unavailable or are not considered reasonable, White Mountains estimates the fair value using industry standard pricing methodologies and observable inputs such as benchmark yields, reported trades, broker-dealer quotes, issuer spreads, benchmark securities, bids, offers, credit ratings, prepayment speeds, reference data including research publications and other relevant inputs. Given that many fixed maturity investments do not trade on a daily basis, the outside pricing services evaluate a wide range of fixed maturity investments by regularly drawing parallels from recent trades and quotes of comparable securities with similar features. The characteristics used to identify comparable fixed maturity investments vary by asset type and take into account market convention.
White Mountains’s process to assess the reasonableness of the market prices obtained from the outside pricing sources covers substantially all of its fixed maturity investments and includes, but is not limited to, the evaluation of pricing methodologies and a review of the pricing services’ quality control processes and procedures on at least an annual basis, a comparison of its invested asset prices obtained from alternate independent pricing vendors on at least a semi-annual basis, monthly analytical reviews of certain prices and a review of the underlying assumptions utilized by the pricing services for select measurements on an ad hoc basis throughout the year. White Mountains also performs back-testing of selected sales activity to determine whether there are any significant differences between the market price used to value the security prior to sale and the actual sale price on an ad-hoc basis throughout the year. Prices provided by the pricing services that vary by more than
5%
and
$1.0 million
from the expected price based on these assessment procedures are considered outliers. Also considered outliers are prices that have not changed from period to period and prices that have trended unusually compared to market conditions. In circumstances where the results of White Mountains’s review process does not appear to support the market price provided by the pricing services, White Mountains challenges the vendor provided price. If White Mountains cannot gain satisfactory evidence to support the challenged price, it relies upon its own pricing methodologies to estimate the fair value of the security in question.
F-40
The valuation process described above is generally applicable to all of White Mountains’s fixed maturity investments. The techniques and inputs specific to asset classes within White Mountains’s fixed maturity investments for Level 2 securities that use observable inputs are as follow:
Debt securities issued by corporations:
The fair value of debt securities issued by corporations is determined from a pricing evaluation technique that uses information from market sources and integrates relative credit information, observed market movements, and sector news. Key inputs include benchmark yields, reported trades, broker-dealer quotes, issuer spreads, two-sided markets, benchmark securities, bids, offers, and reference data including sector, coupon, credit quality ratings, duration, credit enhancements, early redemption features and market research publications.
Mortgage and asset-backed securities:
The fair value of mortgage and asset-backed securities is determined from a pricing evaluation technique that uses information from market sources and leveraging similar securities. Key inputs include benchmark yields, reported trades, underlying tranche cash flow data, collateral performance, plus new issue data, as well as broker-dealer quotes, issuer spreads, two-sided markets, benchmark securities, bids, offers, and reference data including issuer, vintage, loan type, collateral attributes, prepayment speeds, default rates, recovery rates, cash flow stress testing, credit quality ratings and market research publications.
Municipal obligations:
The fair value of municipal obligations is determined from a pricing evaluation technique that uses information from market makers, brokers-dealers, buy-side firms, and analysts along with general market information. Key inputs include benchmark yields, reported trades, issuer financial statements, material event notices and new issue data, as well as broker-dealer quotes, issuer spreads, two-sided markets, benchmark securities, bids, offers, and reference data including type, coupon, credit quality ratings, duration, credit enhancements, geographic location and market research publications.
Foreign government, agency and provincial obligations:
The fair value of foreign government, agency and provincial obligations is determined from a pricing evaluation technique that uses feeds from data sources in each respective country, including active market makers and inter-dealer brokers. Key inputs include benchmark yields, reported trades, broker-dealer quotes, two-sided markets, benchmark securities, bids, offers, local exchange prices, foreign exchange rates and reference data including coupon, credit quality ratings, duration and market research publications.
Preferred stocks:
The fair value of preferred stocks is determined from a pricing evaluation technique that calculates the appropriate spread over a comparable security for each issue. Key inputs include exchange prices (underlying and common stock of same issuer), benchmark yields, reported trades, broker-dealer quotes, issuer spreads, two-sided markets, benchmark securities, bids, offers, and reference data including sector, coupon, credit quality ratings, duration, credit enhancements, early redemption features and market research publications.
Level 3 valuations are generated from techniques that use assumptions not observable in the market. These unobservable assumptions reflect White Mountains’s assumptions that market participants would use in valuing the investment. Generally, certain securities may start out as Level 3 when they are originally issued but as observable inputs become available in the market, they may be reclassified to Level 2.
White Mountains employs a number of procedures to assess the reasonableness of the fair value measurements for its other long-term investments, including obtaining and reviewing periodic and audited annual financial statements of hedge funds and private equity funds and discussing each fund’s pricing with the fund manager throughout the year. However, since the fund managers do not provide sufficient information to evaluate the pricing inputs and methods for each underlying investment, the inputs are considered to be unobservable. The fair value of White Mountains’s investments in hedge funds and private equity funds has generally been determined using the fund manager’s NAV. In the event White Mountains believes that its estimate of NAV of a hedge fund or private equity fund differs from that reported by the fund manager due to illiquidity or other factors, White Mountains will adjust the reported NAV to more appropriately represent the fair value of its interest in the hedge fund or private equity fund investment. As of December 31, 2016 and 2015, White Mountains recorded negative adjustments of
$5.0
million and
$2.4 million
to the reported NAV of certain investments in private equity funds.
F-41
Fair Value Measurements by Level
The following tables summarize White Mountains’s fair value measurements for investments as of
December 31, 2016 and 2015
by level. The major security types were based on the legal form of the securities. White Mountains has disaggregated its fixed maturity investments based on the issuing entity type, which impacts credit quality, with debt securities issued by U.S. government entities carrying minimal credit risk, while the credit and other risks associated with other issuers, such as corporations, foreign governments, municipalities or entities issuing mortgage and asset-backed securities vary depending on the nature of the issuing entity type. White Mountains further disaggregates debt securities issued by corporations and common equity securities by industry sector because investors often reference commonly used benchmarks and their subsectors to monitor risk and performance. Accordingly, White Mountains has further disaggregated these asset classes into subclasses based on the similar sectors and industry classifications it uses to evaluate investment risk and performance against commonly used benchmarks, such as the Bloomberg Barclays U.S. Intermediate Aggregate and S&P 500 indices. The fair value measurements for derivative assets associated with White Mountains’s variable annuity business are presented in
Note 9
.
|
December 31, 2016
|
||||||||||||||||
|
Millions
|
Fair value
|
Level 1
|
Level 2
|
Level 3
|
||||||||||||
|
Fixed maturity investments:
|
||||||||||||||||
|
U.S. Government and agency obligations
|
$
|
278.3
|
|
$
|
268.8
|
|
$
|
9.5
|
|
$
|
—
|
|
||||
|
Debt securities issued by corporations:
|
|
|
||||||||||||||
|
Consumer
|
385.6
|
|
—
|
|
385.6
|
|
—
|
|
||||||||
|
Health Care
|
244.2
|
|
—
|
|
244.2
|
|
—
|
|
||||||||
|
Utilities
|
180.3
|
|
—
|
|
180.3
|
|
—
|
|
||||||||
|
Financials
|
176.0
|
|
—
|
|
176.0
|
|
—
|
|
||||||||
|
Industrial
|
146.4
|
|
—
|
|
146.4
|
|
—
|
|
||||||||
|
Communications
|
131.4
|
|
—
|
|
131.4
|
|
—
|
|
||||||||
|
Materials
|
102.6
|
|
—
|
|
102.6
|
|
—
|
|
||||||||
|
Technology
|
89.4
|
|
—
|
|
89.4
|
|
—
|
|
||||||||
|
Energy
|
53.5
|
|
—
|
|
53.5
|
|
—
|
|
||||||||
|
Total debt securities issued by corporations:
|
1,509.4
|
|
—
|
|
1,509.4
|
|
—
|
|
||||||||
|
Mortgage and asset-backed securities
|
2,132.9
|
|
—
|
|
2,132.9
|
|
—
|
|
||||||||
|
Municipal obligations
|
309.0
|
|
—
|
|
309.0
|
|
—
|
|
||||||||
|
Foreign government, agency and provincial obligations
|
13.2
|
|
.6
|
|
12.6
|
|
—
|
|
||||||||
|
Preferred stocks
|
14.0
|
|
—
|
|
14.0
|
|
—
|
|
||||||||
|
Total fixed maturity investments
(4)
|
4,256.8
|
|
269.4
|
|
3,987.4
|
|
—
|
|
||||||||
|
Short-term investments
(4)(5)
|
287.1
|
|
274.4
|
|
12.7
|
|
—
|
|
||||||||
|
Common equity securities:
|
|
|
|
|
|
|
|
|
||||||||
|
|
|
|
|
|
|
|
|
|
||||||||
|
Exchange traded funds
(1)
|
321.6
|
|
270.4
|
|
51.2
|
|
—
|
|
||||||||
|
Health Care
|
20.9
|
|
20.9
|
|
—
|
|
—
|
|
||||||||
|
Consumer
|
12.9
|
|
12.9
|
|
—
|
|
—
|
|
||||||||
|
Financials
|
11.6
|
|
11.6
|
|
—
|
|
—
|
|
||||||||
|
Technology
|
11.0
|
|
11.0
|
|
—
|
|
—
|
|
||||||||
|
Communications
|
10.5
|
|
10.5
|
|
—
|
|
—
|
|
||||||||
|
Energy
|
|
3.7
|
|
3.7
|
|
—
|
|
—
|
|
|||||||
|
Industrial
|
2.2
|
|
2.2
|
|
—
|
|
—
|
|
||||||||
|
Other
|
79.9
|
|
—
|
|
79.9
|
|
—
|
|
||||||||
|
Total common equity securities
|
474.3
|
|
343.2
|
|
131.1
|
|
—
|
|
||||||||
|
Other long-term investments
(2)(3)
|
177.7
|
|
—
|
|
—
|
|
177.7
|
|
||||||||
|
Total investments
(2)(3)(4)
|
$
|
5,195.9
|
|
$
|
887.0
|
|
$
|
4,131.2
|
|
$
|
177.7
|
|
||||
(1)
ETFs traded on foreign exchanges are priced using the fund's published NAV to account for the difference in market close times and are therefore designated a level 2 measurement.
(2)
Excludes carrying value of
$3.5
associated with other long-term investment limited partnerships accounted for using the equity method and
$(1.2)
related to foreign currency forward contracts. Excludes carrying value of
$12.3
associated with a tax advantaged federal affordable housing development fund accounted for using the proportional amortization method.
(3)
Excludes carrying value of
$131.0
associated with hedge funds and private equity funds for which fair value is measured at NAV using the practical expedient.
(4)
Includes carrying value of
$6.6
in fixed maturity investments and
$0.1
in short-term investments that are classified as assets held for sale related to SSIE.
(5)
Short-term investments are measured at amortized cost, which approximates fair value.
F-42
|
December 31, 2015
|
||||||||||||||||
|
Millions
|
Fair value
|
Level 1
|
Level 2
|
Level 3
|
||||||||||||
|
Fixed maturity investments:
|
|
|
|
|
|
|
|
|
||||||||
|
U.S. Government and agency obligations
|
$
|
160.0
|
|
$
|
133.4
|
|
$
|
26.6
|
|
$
|
—
|
|
||||
|
Debt securities issued by corporations:
|
|
|
|
|
|
|
|
|
||||||||
|
Consumer
|
253.3
|
|
—
|
|
253.3
|
|
—
|
|
||||||||
|
Financials
|
175.9
|
|
—
|
|
175.9
|
|
—
|
|
||||||||
|
Health Care
|
151.3
|
|
—
|
|
151.3
|
|
—
|
|
||||||||
|
Industrial
|
135.6
|
|
—
|
|
135.6
|
|
—
|
|
||||||||
|
Energy
|
82.0
|
|
—
|
|
82.0
|
|
—
|
|
||||||||
|
Utilities
|
61.5
|
|
—
|
|
61.5
|
|
—
|
|
||||||||
|
Technology
|
60.0
|
|
—
|
|
60.0
|
|
—
|
|
||||||||
|
Communications
|
49.2
|
|
—
|
|
49.2
|
|
—
|
|
||||||||
|
Materials
|
31.2
|
|
—
|
|
31.2
|
|
—
|
|
||||||||
|
Total debt securities issued by corporations:
|
1,000.0
|
|
—
|
|
1,000.0
|
|
—
|
|
||||||||
|
Mortgage and asset-backed securities
|
1,167.0
|
|
—
|
|
1,167.0
|
|
—
|
|
||||||||
|
Municipal obligations
|
228.8
|
|
—
|
|
228.8
|
|
—
|
|
||||||||
|
Foreign government, agency and provincial obligations
|
1.2
|
|
.6
|
|
.6
|
|
—
|
|
||||||||
|
Preferred stocks
|
82.7
|
|
—
|
|
12.7
|
|
70.0
|
|
||||||||
|
Total fixed maturity investments
(4)
|
2,639.7
|
|
134.0
|
|
2,435.7
|
|
70.0
|
|
||||||||
|
Short-term investments
(4)(5)
|
211.3
|
|
211.3
|
|
—
|
|
—
|
|
||||||||
|
Common equity securities:
|
|
|
|
|
|
|
|
|
||||||||
|
Financials
|
653.2
|
|
653.2
|
|
—
|
|
—
|
|
||||||||
|
Exchange traded funds
(1)
|
183.3
|
|
162.0
|
|
21.3
|
|
—
|
|
||||||||
|
Consumer
|
70.0
|
|
70.0
|
|
—
|
|
—
|
|
||||||||
|
Communications
|
43.7
|
|
43.7
|
|
—
|
|
—
|
|
||||||||
|
Health Care
|
35.7
|
|
35.7
|
|
—
|
|
—
|
|
||||||||
|
Technology
|
27.0
|
|
27.0
|
|
—
|
|
—
|
|
||||||||
|
Industrial
|
26.6
|
|
26.6
|
|
—
|
|
—
|
|
||||||||
|
Other
|
74.4
|
|
—
|
|
74.4
|
|
—
|
|
||||||||
|
Total common equity securities
|
1,113.9
|
|
1,018.2
|
|
95.7
|
|
—
|
|
||||||||
|
Other long-term investments
(2)(3)
|
169.5
|
|
—
|
|
—
|
|
169.5
|
|
||||||||
|
Total investments
(2)(3)(4)
|
$
|
4,134.4
|
|
$
|
1,363.5
|
|
$
|
2,531.4
|
|
$
|
239.5
|
|
||||
(1)
ETFs traded on foreign exchanges are priced using the fund's published NAV to account for the difference in market close times and are therefore designated a level 2 measurement.
(2)
Excludes carrying value of
$3.8
associated with other long-term investment limited partnerships accounted for using the equity method. Excludes carrying value of
$14.7
associated with a tax advantaged federal affordable housing development fund accounted for using the proportional amortization method.
(3)
Excludes carrying value of
$127.8
associated with hedge funds and private equity funds for which fair value is measured at NAV using the practical expedient.
(4)
Includes carrying value of
$9.5
in fixed maturity investments and
$0.1
in short-term investments that are classified as assets held for sale related to SSIE.
(5)
Short-term investments are measured at amortized cost, which approximates fair value.
F-43
Debt securities issued by corporations
The following table summarizes the ratings of debt securities issued by corporations held in White Mountains’s investment portfolio as of December 31, 2016 and 2015:
|
Fair Value at
December 31,
|
||||||||
|
Millions
|
2016
|
2015
|
||||||
|
AA
|
$
|
100.9
|
|
$
|
95.2
|
|
||
|
A
|
381.9
|
|
397.7
|
|
||||
|
BBB
|
786.5
|
|
507.1
|
|
||||
|
BB
|
214.0
|
|
—
|
|
||||
|
B
|
26.1
|
|
—
|
|
||||
|
Debt securities issued by corporations
(1)
|
$
|
1,509.4
|
|
$
|
1,000.0
|
|
||
|
(1)
|
Credit ratings are assigned based on the following hierarchy: 1) Standard & Poors Financial Services LLC (“Standard & Poor’s”) and 2) Moody’s Investor Services (“Moody’s”)
|
Mortgage and Asset-backed Securities
White Mountains purchases commercial mortgage-backed securities (“CMBS”) and residential mortgage-backed securities (“RMBS”) with the goal of maximizing risk adjusted returns in the context of a diversified portfolio. White Mountains considers sub-prime mortgage-backed securities as those that have underlying loan pools that exhibit weak credit characteristics, or those that are issued from dedicated sub-prime shelf registrations or dedicated second-lien shelf registrations (i.e., White Mountains considers investments backed primarily by second-liens to be sub-prime risks regardless of credit scores or other metrics).
White Mountains categorizes mortgage-backed securities as “non-prime” (also called “Alt A” or “A-”) if they are backed by collateral that has overall credit quality between prime and sub-prime based on White Mountains’s review of the characteristics of their underlying mortgage loan pools, such as credit scores and financial ratios. White Mountains’s non-agency RMBS portfolio is generally moderate-term and structurally senior. White Mountains does not own any collateralized loan obligations. White Mountains does not own any collateralized debt obligations, with the exception of
$30.2 million
of non-agency residential mortgage resecuritization tranches, each a senior tranche in its own right and each collateralized by a single earlier vintage Super Senior or Senior non-agency RMBS.
The following table summarizes the carrying value of White Mountains’s mortgage and asset-backed securities as of
December 31, 2016
and
December 31, 2015
:
|
|
December 31, 2016
|
December 31, 2015
|
||||||||||||||||||||||
|
Millions
|
Fair Value
|
Level 2
|
Level 3
|
Fair Value
|
Level 2
|
Level 3
|
||||||||||||||||||
|
Mortgage-backed securities:
|
|
|
|
|
|
|
|
|
|
|
|
|
||||||||||||
|
Agency:
|
|
|
|
|
|
|
|
|
|
|
|
|
||||||||||||
|
GNMA
|
$
|
283.9
|
|
$
|
283.9
|
|
$
|
—
|
|
$
|
265.5
|
|
$
|
265.5
|
|
$
|
—
|
|
||||||
|
FNMA
|
278.3
|
|
278.3
|
|
—
|
|
42.2
|
|
42.2
|
|
—
|
|
||||||||||||
|
FHLMC
|
89.8
|
|
89.8
|
|
—
|
|
22.8
|
|
22.8
|
|
—
|
|
||||||||||||
|
Total Agency
(1)
|
652.0
|
|
652.0
|
|
—
|
|
330.5
|
|
330.5
|
|
—
|
|
||||||||||||
|
Non-agency:
|
|
|
|
|
|
|
|
|
|
|
|
|
||||||||||||
|
Residential
|
205.3
|
|
205.3
|
|
—
|
|
133.2
|
|
133.2
|
|
—
|
|
||||||||||||
|
Commercial
|
127.5
|
|
127.5
|
|
—
|
|
140.4
|
|
140.4
|
|
—
|
|
||||||||||||
|
Total Non-agency
|
332.8
|
|
332.8
|
|
—
|
|
273.6
|
|
273.6
|
|
—
|
|
||||||||||||
|
Total mortgage-backed securities
|
984.8
|
|
984.8
|
|
—
|
|
604.1
|
|
604.1
|
|
—
|
|
||||||||||||
|
Other asset-backed securities:
|
|
|
|
|
||||||||||||||||||||
|
Vehicle receivables
|
479.5
|
|
479.5
|
|
—
|
|
269.7
|
|
269.7
|
|
—
|
|
||||||||||||
|
Credit card receivables
|
438.3
|
|
438.3
|
|
—
|
|
217.7
|
|
217.7
|
|
—
|
|
||||||||||||
|
Other
|
230.3
|
|
230.3
|
|
—
|
|
75.5
|
|
75.5
|
|
—
|
|
||||||||||||
|
Total other asset-backed securities
|
1,148.1
|
|
1,148.1
|
|
—
|
|
562.9
|
|
562.9
|
|
—
|
|
||||||||||||
|
Total mortgage and asset-backed securities
|
$
|
2,132.9
|
|
$
|
2,132.9
|
|
$
|
—
|
|
$
|
1,167.0
|
|
$
|
1,167.0
|
|
$
|
—
|
|
||||||
|
(1)
|
Represents publicly traded mortgage-backed securities which carry the full faith and credit guaranty of the U.S. government (i.e., GNMA) or are guaranteed by a government sponsored entity (i.e., FNMA, FHLMC).
|
F-44
Non-agency Mortgage-backed Securities
The security issuance years of White Mountains’s investments in non-agency RMBS and non-agency CMBS securities as of
December 31, 2016
are as follows:
|
Security Issuance Year
|
||||||||||||||||||||||||||||||||||||||||||||||||||||||||
|
Millions
|
Fair Value
|
2004
|
2005
|
2006
|
2007
|
2008
|
2009
|
2010
|
2011
|
2012
|
2013
|
2014
|
2015
|
2016
|
||||||||||||||||||||||||||||||||||||||||||
|
Non-agency RMBS
|
$
|
205.3
|
|
$
|
19.4
|
|
$
|
5.7
|
|
$
|
3.0
|
|
$
|
—
|
|
$
|
2.7
|
|
$
|
—
|
|
$
|
7.4
|
|
$
|
9.9
|
|
$
|
5.0
|
|
$
|
15.3
|
|
$
|
53.3
|
|
$
|
48.3
|
|
$
|
35.3
|
|
||||||||||||||
|
Non-agency CMBS
|
127.5
|
|
—
|
|
—
|
|
—
|
|
—
|
|
—
|
|
—
|
|
4.3
|
|
—
|
|
18.1
|
|
11.5
|
|
23.4
|
|
44.4
|
|
$
|
25.8
|
|
|||||||||||||||||||||||||||
|
Total
|
$
|
332.8
|
|
$
|
19.4
|
|
$
|
5.7
|
|
$
|
3.0
|
|
$
|
—
|
|
$
|
2.7
|
|
$
|
—
|
|
$
|
11.7
|
|
$
|
9.9
|
|
$
|
23.1
|
|
$
|
26.8
|
|
$
|
76.7
|
|
$
|
92.7
|
|
$
|
61.1
|
|
||||||||||||||
Non-agency Residential Mortgage-backed Securities
The classification of the underlying collateral quality and the tranche levels of White Mountains’s non-agency RMBS securities are as follows as of
December 31, 2016
:
|
Millions
|
Fair Value
|
Super Senior
(1)
|
Senior
(2)
|
Subordinate
(3)
|
||||||||||||
|
Prime
|
$
|
205.3
|
|
$
|
150.6
|
|
$
|
54.7
|
|
$
|
—
|
|
||||
|
Non-prime
|
—
|
|
—
|
|
—
|
|
—
|
|
||||||||
|
Sub-prime
|
—
|
|
—
|
|
—
|
|
—
|
|
||||||||
|
Total non-agency RMBS
|
$
|
205.3
|
|
$
|
150.6
|
|
$
|
54.7
|
|
$
|
—
|
|
||||
|
(1)
|
At issuance, Super Senior, or in the case of resecuritization, the underlying securities, were rated “AAA” by Standard & Poor’s, “Aaa” by Moody’s or “AAA” by Fitch Ratings (“Fitch”) and were senior to other “AAA” or “Aaa” bonds.
|
|
(2)
|
At issuance, Senior, or in the case of resecuritization, the underlying securities, were rated “AAA” by Standard & Poor’s, “Aaa” by Moody’s or “AAA” by Fitch and were senior to non-“AAA” or non-“Aaa” bonds.
|
|
(3)
|
At issuance, Subordinate were not rated “AAA” by Standard & Poor’s, “Aaa” by Moody’s or “AAA” by Fitch and were junior to “AAA” or “Aaa” bonds.
|
Non-agency Commercial Mortgage-backed Securities
White Mountains’s non-agency CMBS portfolio is generally short-term and structurally senior, with more than
25
points of seniority on average for both fixed rate CMBS and floating rate CMBS as of
December 31, 2016
. In general, seniority represents the percentage principal loss on the underlying collateral that would be absorbed by other securities lower in the capital structure before the more senior security incurs a loss. As of
December 31, 2016
, none of the underlying loans of the non-agency CMBS held by White Mountains were reported as non-performing.
The amount of fixed and floating rate securities and their tranche levels of White Mountains’s non-agency CMBS securities are as follows as of
December 31, 2016
:
|
Millions
|
Fair Value
|
Super Senior
(1)
|
Senior
(2)
|
Subordinate
(3)
|
||||||||||||
|
Fixed rate CMBS
|
$
|
116.0
|
|
$
|
8.7
|
|
$
|
59.1
|
|
$
|
48.2
|
|
||||
|
Floating rate CMBS
|
11.5
|
|
—
|
|
—
|
|
11.5
|
|
||||||||
|
Total non-agency CMBS
|
$
|
127.5
|
|
$
|
8.7
|
|
$
|
59.1
|
|
$
|
59.7
|
|
||||
|
(1)
|
At issuance, Super Senior, or in the case of resecuritization, the underlying securities, were rated “AAA” by Standard & Poor’s, “Aaa” by Moody’s or “AAA” by Fitch and were senior to other “AAA” or “Aaa” bonds.
|
|
(2)
|
At issuance, Senior, or in the case of resecuritization, the underlying securities, were rated “AAA” by Standard & Poor’s, “Aaa” by Moody’s or “AAA” by Fitch and were senior to non-“AAA” or non-“Aaa” bonds.
|
|
(3)
|
At issuance, Subordinate were not rated “AAA” by Standard & Poor’s, “Aaa” by Moody’s or “AAA” by Fitch and were junior to “AAA” or “Aaa” bonds.
|
F-45
Other Long-term Investments
Other long-term investments consist of the following as of December 31, 2016 and 2015:
|
Carrying Value at
|
||||||||
|
Millions
|
December 31, 2016
|
December 31, 2015
|
||||||
|
Hedge funds and private equity funds, at fair value
(1)
|
$
|
131.0
|
|
$
|
127.8
|
|
||
|
Private equity securities and limited liability companies, at fair value
(1)
|
72.0
|
|
82.1
|
|
||||
|
OneBeacon Surplus Notes, at fair value
(1)
|
71.9
|
|
51.5
|
|
||||
|
Private convertible preferred securities, at fair value
(1)
|
30.6
|
|
32.7
|
|
||||
|
Tax advantaged federal affordable housing development fund
(2)
|
12.3
|
|
14.7
|
|
||||
|
Partnership investments accounted for under the equity method
|
3.5
|
|
3.8
|
|
||||
|
Other
|
2.0
|
|
3.2
|
|
||||
|
Total other-long term investments
|
$
|
323.3
|
|
$
|
315.8
|
|
||
(1)
See
Fair Value Measurements by Level
table.
(2)
Fund accounted for using the proportional amortization method.
Hedge Funds and Private Equity Funds
White Mountains holds investments in hedge funds and private equity funds, which are included in other long-term investments. The fair value of these investments has generally been estimated using the NAV of the funds. As of
December 31, 2016
, White Mountains held investments in
5
hedge funds and
23
private equity funds. The largest investment in a single fund was
$36.5 million
as of
December 31, 2016
and
$22.7 million
as of
December 31, 2015
. The following table summarizes investments in hedge funds and private equity funds by investment objective and sector as of
December 31, 2016 and 2015
:
|
|
December 31, 2016
|
December 31, 2015
|
||||||||||||||
|
Millions
|
Fair Value
|
Unfunded
Commitments |
Fair Value
|
Unfunded
Commitments |
||||||||||||
|
Hedge funds
|
|
|
|
|
|
|
|
|
||||||||
|
Long/short banks and financial
|
$
|
36.5
|
|
$
|
—
|
|
$
|
12.8
|
|
$
|
—
|
|
||||
|
Long/short equity REIT
|
19.9
|
|
—
|
|
20.6
|
|
—
|
|
||||||||
|
Other
|
3.4
|
|
—
|
|
3.6
|
|
—
|
|
||||||||
|
Total hedge funds
|
59.8
|
|
—
|
|
37.0
|
|
—
|
|
||||||||
|
Private equity funds
|
|
|
|
|
|
|
|
|
||||||||
|
Aerospace/Defense/Government
|
19.4
|
|
25.9
|
|
19.8
|
|
30.3
|
|
||||||||
|
Manufacturing/Industrial
|
15.9
|
|
22.4
|
|
24.9
|
|
2.5
|
|
||||||||
|
Energy infrastructure & services
|
14.1
|
|
3.2
|
|
20.7
|
|
3.4
|
|
||||||||
|
Multi-sector
|
11.4
|
|
2.0
|
|
14.8
|
|
2.1
|
|
||||||||
|
Healthcare
|
3.5
|
|
.4
|
|
3.8
|
|
.4
|
|
||||||||
|
Private equity secondaries
|
3.0
|
|
2.1
|
|
4.4
|
|
2.1
|
|
||||||||
|
Direct lending/Mezzanine debt
|
1.8
|
|
35.7
|
|
—
|
|
—
|
|
||||||||
|
Financial Services
|
1.0
|
|
5.0
|
|
—
|
|
—
|
|
||||||||
|
Insurance
|
.8
|
|
41.3
|
|
2.0
|
|
41.3
|
|
||||||||
|
Real estate
|
.3
|
|
.1
|
|
.4
|
|
.1
|
|
||||||||
|
Total private equity funds
|
71.2
|
|
138.1
|
|
90.8
|
|
82.2
|
|
||||||||
|
Total hedge and private equity funds included
in other long-term investments
|
$
|
131.0
|
|
$
|
138.1
|
|
$
|
127.8
|
|
$
|
82.2
|
|
||||
F-46
Redemption of investments in certain hedge funds is subject to restrictions including lock-up periods where no redemptions or withdrawals are allowed, restrictions on redemption frequency and advance notice periods for redemptions. Amounts requested for redemptions remain subject to market fluctuations until the redemption effective date, which generally falls at the end of the defined redemption period. As of December 31, 2016,
one
hedge fund with a fair value of
$21.5 million
was subject to a lock-up period that expires on September 1, 2018. The following summarizes the
December 31, 2016
fair value of hedge funds subject to restrictions on redemption frequency and advance notice period requirements for investments in active hedge funds:
|
Millions
|
Notice Period
|
|||||||||||||||
|
Redemption frequency
|
30-59 days
notice
|
60-89 days
notice
|
90-119 days
notice
|
Total
|
||||||||||||
|
Monthly
|
$
|
—
|
|
$
|
—
|
|
$
|
—
|
|
$
|
—
|
|
||||
|
Quarterly
|
15.9
|
|
—
|
|
—
|
|
15.9
|
|
||||||||
|
Semi-annual
|
21.6
|
|
19.9
|
|
—
|
|
41.5
|
|
||||||||
|
Annual
|
—
|
|
—
|
|
2.4
|
|
2.4
|
|
||||||||
|
Total
|
$
|
37.5
|
|
$
|
19.9
|
|
$
|
2.4
|
|
$
|
59.8
|
|
||||
Certain of White Mountains’s investments in hedge funds are no longer active and are in the process of disposing of their underlying investments. Distributions from such funds are remitted to investors as the fund’s underlying investments are liquidated. As of
December 31, 2016
, the fair value of hedge funds in liquidation was
$1.0 million
. The actual amount of the final distribution remittances remain subject to market fluctuations. The date at which such remittances will be received is not determinable as of
December 31, 2016
.
White Mountains has also submitted redemption requests for certain of its investments in active hedge funds. As of
December 31, 2016
, redemptions of
$2.4
million are outstanding that would be subject to market fluctuations. The date at which such redemptions will be received is not determinable as of
December 31, 2016
. Redemptions are recorded as receivables when the investment is no longer subject to market fluctuations.
Investments in private equity funds are generally subject to a lock-up period during which investors may not request a redemption. Distributions prior to the expected termination date of the fund may be limited to dividends or proceeds arising from the liquidation of the fund’s underlying investments. In addition, certain private equity funds provide an option to extend the lock-up period at either, the sole discretion of the fund manager or upon agreement between the fund and the investors.
As of
December 31, 2016
, investments in private equity funds were subject to lock-up periods as follows:
|
Millions
|
1-3 years
|
3 – 5 years
|
5 – 10 years
|
>10 years
|
Total
|
|||||||||||||||
|
Private Equity Funds — expected lock-up period remaining
|
$
|
14.8
|
|
$
|
3.5
|
|
$
|
50.0
|
|
$
|
2.9
|
|
$
|
71.2
|
|
|||||
OneBeacon Surplus Notes
In the fourth quarter of 2014, in conjunction with OneBeacon's sale of its runoff business to an affiliate of Armour Group Holdings Limited (the “OneBeacon Runoff Transaction”), OneBeacon provided financing in the form of the OneBeacon Surplus Notes with a par value of
$101.0 million
, which had a fair value of
$71.9 million
and
$51.5 million
as of December 31, 2016 and December 31, 2015. Subsequent to closing, the OneBeacon Surplus Notes are included in OneBeacon’s investment portfolio, classified within other long-term investments.
F-47
The internal valuation model used to estimate the fair value is based on a discounted expected cash flow model using information as of the measurement date. The estimated fair value of the OneBeacon Surplus Notes is sensitive to changes in public debt credit spreads, as well as changes in estimates with respect to other variables including a discount to reflect the private nature of the notes (and the related lack of liquidity), the credit quality of the notes, based on the financial performance of the Issuer relative to expectations, and the timing, amount, and likelihood of interest and principal payments on the notes, which are subject to regulatory approval and therefore may vary from the contractual terms. Anticipating a change in the assumed timeline, amounts, and process necessary to obtain regulatory approval, OneBeacon made a change in estimate as of December 31, 2016 with regard to the timing of regulatory approval of principal and interest payments on the notes. For the purpose of estimating fair value at December 31, 2016, OneBeacon assumed that all accrued but unpaid interest on the seller priority note since the date of issuance is paid in 2020, with regular annual interest payments on both the seller priority note and pari passu note beginning thereafter, all accrued but unpaid interest on the pari passu note since the date of issuance is paid in 2025, and principal repayments begin on a graduated basis in 2030 for the seller priority note and 2035 for the pari passu note. Previously, including as of December 31, 2015, OneBeacon had assumed for the purpose of estimating fair value that interest payouts, including all accrued but unpaid amounts, began in 2020 for both notes and that principal repayments began on a graduated basis in 2025 for the seller priority note and 2030 for the pari passu note. Although these variables involve considerable judgment, OneBeacon does not currently expect any resulting changes in the estimated value of the OneBeacon Surplus Notes to be material to its financial position.
Below is a table illustrating the valuation adjustments taken to arrive at the estimated fair value of the OneBeacon Surplus Notes as of December 31, 2016 and 2015:
|
Type of Surplus Note
|
Total as of December 31, 2016
|
Total as of December 31, 2015
|
||||||||||||||
|
Millions
|
Seller Priority
|
Pari Passu
|
||||||||||||||
|
Par Value
|
$
|
57.9
|
|
$
|
43.1
|
|
$
|
101.0
|
|
$
|
101.0
|
|
||||
|
Fair value adjustments to reflect:
|
||||||||||||||||
|
Current market rates on public debt and
contract-based repayments
(1)
|
6.2
|
|
(1.1
|
)
|
5.1
|
|
(15.1
|
)
|
||||||||
|
Regulatory approval
(2)
|
(.2
|
)
|
(15.4
|
)
|
(15.6
|
)
|
(24.2
|
)
|
||||||||
|
Liquidity adjustment
(3)
|
(12.8
|
)
|
(5.8
|
)
|
(18.6
|
)
|
(10.2
|
)
|
||||||||
|
Total adjustments
|
(6.8
|
)
|
(22.3
|
)
|
(29.1
|
)
|
(49.5
|
)
|
||||||||
|
Fair value
(4)
|
$
|
51.1
|
|
$
|
20.8
|
|
$
|
71.9
|
|
$
|
51.5
|
|
||||
(1)
Represents the value of the surplus notes, at current market yields on comparable publicly traded debt, and assuming issuer is allowed to make principal and interest payments when its financial capacity is available, as measured by statutory capital in excess of a 250% RBC score under the NAIC’s risk-based capital standards for property and casualty companies. The favorable year-over-year change in impact is due principally to the narrowing of non-investment grade credit spreads as well as the time value of money benefit from moving one year closer to modeled cash receipts.
(2)
Represents anticipated delay in securing regulatory approvals of interest and principal payments to reflect graduated changes in Issuer's statutory surplus. The monetary impact of the anticipated delay is measured based on credit spreads of public securities with roughly equivalent percentages of discounted payments missed. The favorable year-over-year change in impact is driven primarily by the narrowing of non-investment grade credit spreads, which causes the anticipated delay in securing regulatory approval to be less punitive, partially offset by the change in estimates and assumptions regarding the timeline, amounts, and process necessary to obtain regulatory approval for principal and interest payments described below.
(3)
Represents impact of liquidity spread to account for OneBeacon’s sole ownership of the OneBeacon Surplus Notes, lack of a trading market and unique nature of the ongoing regulatory approval process. The unfavorable year-over-year change in impact is due largely to the increased fair value of the notes as well as a higher effective duration resulting from a lower overall yield to maturity; there was no change in the magnitude of the liquidity spread in 2016.
(4)
The increase in the fair value of the OneBeacon Surplus Notes during the year ended December 31, 2016 was driven primarily by the narrowing of non-investment grade credit spreads, partially offset by the impact of a change in estimates and assumptions regarding the timing of regulatory approval of principal and interest payments on the notes.
F-48
Rollforward of Fair Value Measurements by Level
White Mountains uses quoted market prices where available as the inputs to estimate fair value for its investments in active markets. Such measurements are considered to be either Level 1 or Level 2 measurements, depending on whether the quoted market price inputs are for identical securities (Level 1) or similar securities (Level 2). Level 3 measurements for fixed maturity investments, common equity securities and other long-term investments as of
December 31, 2016 and 2015
consist of securities for which the estimated fair value has not been determined based upon quoted market price inputs for identical or similar securities.
The following tables summarize the changes in White Mountains’s fair value measurements by level for the years ended
December 31, 2016 and 2015
:
|
Level 3 Investments
|
|||||||||||||||||||||||||||||
|
Millions
|
Level 1
Investments
|
Level 2
Investments
|
Fixed
maturity investments
|
Common
equity
securities
|
Other long-term
investments
|
Hedge Funds and Private Equity Funds measured at NAV
(3)
|
Total
|
||||||||||||||||||||||
|
Balance at January 1, 2016
|
$
|
1,152.2
|
|
$
|
2,531.4
|
|
$
|
70.0
|
|
$
|
—
|
|
$
|
169.5
|
|
$
|
127.8
|
|
$
|
4,050.9
|
|
(1)(2)(4)
|
|||||||
|
Total net realized and unrealized investment
gains (losses)
|
11.3
|
|
.2
|
|
.1
|
|
—
|
|
6.1
|
|
(6.1
|
)
|
11.6
|
|
|||||||||||||||
|
Amortization/Accretion
|
.1
|
|
(19.4
|
)
|
—
|
|
—
|
|
—
|
|
—
|
|
(19.3
|
)
|
|||||||||||||||
|
Purchases
|
2,243.7
|
|
3,979.8
|
|
120.8
|
|
—
|
|
2.2
|
|
35.2
|
|
6,381.7
|
|
|||||||||||||||
|
Sales
|
(2,794.8
|
)
|
(2,491.5
|
)
|
(72.9
|
)
|
—
|
|
(.1
|
)
|
(25.9
|
)
|
(5,385.2
|
)
|
|||||||||||||||
|
Transfers in
|
—
|
|
118.0
|
|
—
|
|
—
|
|
—
|
|
—
|
|
118.0
|
|
|
||||||||||||||
|
Transfers out
|
—
|
|
—
|
|
(118.0
|
)
|
—
|
|
—
|
|
—
|
|
(118.0
|
)
|
|
||||||||||||||
|
Balance at December 31, 2016
|
$
|
612.5
|
|
$
|
4,118.5
|
|
$
|
—
|
|
$
|
—
|
|
$
|
177.7
|
|
$
|
131.0
|
|
$
|
5,039.7
|
|
(1)(2)(4)
|
|||||||
|
(1)
|
Excludes carrying value of
$3.5
and
$3.8
as of
December 31, 2016
and
January 1, 2016
associated with other long-term investments accounted for using the equity method and
$(1.2)
related to foreign currency forward contracts. Excludes carrying value of
$12.3
and
$14.7
at
December 31, 2016
and
January 1, 2016
associated with a tax advantaged federal affordable housing development fund accounted for using the proportional amortization method.
|
|
(2)
|
Excludes carrying value of
$287.1
and
$211.3
as of
December 31, 2016
and
January 1, 2016
classified as short-term investments, of which
$0.1
and
$0.1
is classified as held for sale at
December 31, 2016
and
January 1, 2016
.
|
|
(3)
|
Investments for which fair value is measured at NAV using the practical expedient are no longer classified within the fair value hierarchy. See
|
|
(4)
|
Includes carrying value of
$6.6
and
$9.5
of fixed maturity investments at
December 31, 2016
and
January 1, 2016
that is classified as assets held for sale related to SSIE.
|
|
|
|
|
Level 3 Investments
|
||||||||||||||||||||||||||
|
Millions
|
Level 1
Investments
|
Level 2
Investments
|
Fixed
maturity investments |
Common
equity
securities
|
Other long-term
investments
|
Hedge Funds and Private Equity Funds measured at NAV
(3)
|
|
Total
|
|
||||||||||||||||||||
|
Balance at January 1, 2015
|
$
|
550.6
|
|
$
|
2,372.9
|
|
$
|
76.4
|
|
$
|
39.5
|
|
$
|
125.9
|
|
$
|
178.3
|
|
(1)
|
$
|
3,343.6
|
|
(1)(2)
|
||||||
|
Total net realized and unrealized investment gains (losses)
|
263.0
|
|
(13.7
|
)
|
(1.1
|
)
|
7.8
|
|
(20.0
|
)
|
(9.2
|
)
|
|
226.8
|
|
(3)(4)
|
|||||||||||||
|
Amortization/Accretion
|
—
|
|
(19.6
|
)
|
—
|
|
—
|
|
—
|
|
—
|
|
|
(19.6
|
)
|
||||||||||||||
|
Purchases
|
814.5
|
|
1,436.0
|
|
35.3
|
|
—
|
|
76.5
|
|
14.8
|
|
|
2,377.1
|
|
||||||||||||||
|
Sales
|
(825.7
|
)
|
(1,286.0
|
)
|
—
|
|
(43.7
|
)
|
(12.9
|
)
|
(41.8
|
)
|
(2,210.1
|
)
|
|||||||||||||||
|
Symetra transfer
|
394.5
|
|
—
|
|
—
|
|
—
|
|
—
|
|
—
|
|
394.5
|
|
|||||||||||||||
|
Effect of redemption of Prospector hedge funds
|
(43.5
|
)
|
—
|
|
—
|
|
(3.6
|
)
|
—
|
|
(14.3
|
)
|
(61.4
|
)
|
|||||||||||||||
|
Transfers in
|
—
|
|
41.8
|
|
—
|
|
—
|
|
—
|
|
—
|
|
|
41.8
|
|
||||||||||||||
|
Transfers out
|
(1.2
|
)
|
—
|
|
(40.6
|
)
|
—
|
|
—
|
|
—
|
|
|
(41.8
|
)
|
||||||||||||||
|
Balance at December 31, 2015
|
$
|
1,152.2
|
|
$
|
2,531.4
|
|
$
|
70.0
|
|
$
|
—
|
|
$
|
169.5
|
|
$
|
127.8
|
|
(1)
|
$
|
4,050.9
|
|
(1)(2)
|
||||||
|
(1)
|
Excludes carrying value of
$3.8
and
$5.2
as of
December 31, 2015
and
January 1, 2015
associated with other long-term investment limited partnerships accounted for using the equity method. Excludes carrying value of
$14.7
and
$16.8
at December 31, 2015 and January 1, 2015 associated with a tax advantaged federal affordable housing development fund accounted for using the proportional amortization method.
|
|
(2)
|
Excludes carrying value of
$211.3
and
$376.8
as of
December 31, 2015
and
January 1, 2015
classified as short-term investments.
|
|
(3)
|
Excludes
$0.8
of net realized and unrealized investment losses associated with the Prospector Funds and consolidation of investment-related liabilities.
|
|
(4)
|
Includes unrealized investment gains of
$258.8
associated with the Symetra transfer from investments in unconsolidated affiliates to common equity securities.
|
(5)
Includes carrying value of
$10.1
and
$9.5
of fixed maturity investments at January 1, 2015 and December 31, 2015 that is classified as assets held for sale related to SSIE.
F-49
Fair Value Measurements — transfers between levels
Transfers between levels are recorded using the fair value measurement as of the end of the quarterly period in which the event or change in circumstance giving rise to the transfer occurred.
During 2016, there were
three
fixed maturity investments classified as Level 3 measurements in the prior period that were transferred to Level 2 measurements because quoted market prices for similar securities that were considered reliable and could be validated against an alternative source were available at
December 31, 2016
.
These measurements comprise “Transfers out” of Level 3 and “Transfers in” to Level 2 of
$118.0 million
for the period ended
December 31, 2016
.
During 2015, there were
six
fixed maturity investments classified as Level 3 measurements in the prior period that were transferred to Level 2 measurements because quoted market prices for similar securities that were considered reliable and could be validated against an alternative source were available as of
December 31, 2015
.
These measurements comprise “Transfers out” of Level 3 and “Transfers in” to Level 2 of $
40.6 million
for the period ended
December 31, 2015
.
Significant Unobservable Inputs
The following summarizes significant unobservable inputs used in estimating the fair value of investment securities, other than hedge funds and private equity funds, classified within Level 3 as of December 31, 2016 and December 31, 2015. The fair value of investments in hedge funds and private equity funds are generally estimated using the NAV of the funds.
|
|
||||||||
|
Description
|
December 31, 2016
|
|||||||
|
$ in millions, except share price
|
Valuation Technique(s)
|
Fair Value
(1)
|
Unobservable Input
|
|||||
|
Private equity security
|
Share price of most recent transaction
|
$21.0
|
Share price
|
-
|
$1.00
|
|||
|
Private equity security
|
Discounted cash flow
|
$22.1
|
Discount rate
|
-
|
25.0%
|
|||
|
Private equity security
|
Share price of most recent transaction
|
$3.2
|
Share price
|
-
|
$2.52
|
|||
|
Private convertible preferred security
|
Multiple of EBITDA
|
$3.6
|
EBITDA multiple
|
-
|
6.00
|
|||
|
Private convertible preferred security
|
Share price of most recent transaction
|
$27.0
|
Share price
|
-
|
$3.83
|
|||
|
Community reinvestment vehicle
|
Member share of GAAP net equity
|
$14.3
|
GAAP net equity
|
$14.3
|
||||
|
Private equity security
|
Discounted cash flow/ Option pricing method
|
$9.3
|
Discount rate
|
-
|
21.0%
|
|||
|
Time until expiration
|
-
|
4 years
|
||||||
|
Volatility/Standard deviation
|
-
|
50.0%
|
||||||
|
Risk free rate
|
-
|
1.00%
|
||||||
|
OneBeacon Surplus Notes:
|
||||||||
|
- Seller priority
|
Discounted cash flow
|
$51.1
|
Discount rate
(2)
|
-
|
9.6%
|
|||
|
Timing of interest payments
(4)
|
-
|
2020
|
||||||
|
Timing of principal payments
(4)
|
-
|
2030
|
||||||
|
- Pari passu
|
Discounted cash flow
|
$20.8
|
Discount rate
(3)
|
-
|
15.0%
|
|||
|
Timing of interest payments
(5)
|
-
|
2021
|
||||||
|
Timing of principal payments
(5)
|
-
|
2035
|
||||||
(1)
Includes the net unrealized investment gains (losses) associated with foreign currency; foreign currency effects based on observable inputs.
(2)
Stochastic modeling supporting the fair value estimation indicates that the average percentage of discounted payments missed on the seller priority note is roughly equivalent to that of a conventional debt security with a credit rating of ‘B’. The corresponding credit spread increased by an additional 250 basis points to reflect both a liquidity discount for a private debt instrument and regulatory payment approval uncertainty, was added to the treasury rate to determine the discount rate for the seller priority note.
(3)
Stochastic modeling supporting the fair value estimation indicates that the average percentage of discounted payments missed on the pari passu note is roughly equivalent to that of a conventional debt security with a credit rating of ‘CCC’. The corresponding credit spread increased by an additional 250 basis points to reflect both a liquidity discount for a private debt instrument and regulatory payment approval uncertainty, was added to the treasury rate to determine the discount rate for the seller priority note.
(4)
As of December 31, 2016, OneBeacon has assumed for the purpose of estimating fair value that all accrued but unpaid interest on the seller priority note since the date of issuance is paid in 2020, with regular annual interest payments beginning thereafter. Principal repayments are assumed to begin on a graduated basis in 2030.
(5)
As of December 31, 2016, OneBeacon has assumed for the purpose of estimating fair value that regular annual interest payments on the pari passu note begin in 2021. All accrued but unpaid interest since the date of issuance is assumed to be paid in 2025. Principal repayments are assumed to begin on a graduated basis in 2035.
F-50
|
Description
|
December 31, 2015
|
|||||||
|
$ in millions, except share price
|
Valuation Technique(s)
|
Fair Value
(1)
|
Unobservable Input
|
|||||
|
Preferred Stock
|
Par value
(2)
|
$70.0
|
Issuer’s intent to call
|
-
|
$70.0
|
|||
|
Private equity security
|
Share price of most recent transaction
|
$21.0
|
Share price
|
-
|
$1.00
|
|||
|
Private equity security
|
Share price of most recent transaction
|
$33.8
|
Share price
|
-
|
$1.03
|
|||
|
Private equity security
|
Share price of most recent transaction
|
$3.0
|
Share price
|
-
|
$2.52
|
|||
|
Private convertible preferred security
|
Multiple of EBITDA
|
$5.7
|
EBITDA multiple
|
-
|
6.00
|
|||
|
Private convertible preferred security
|
Share price of most recent transaction
|
$27.0
|
Share price
|
-
|
$3.83
|
|||
|
Community reinvestment vehicle
|
Member share of GAAP net equity
|
$14.3
|
GAAP net equity
|
$14.3
|
||||
|
Private equity security
|
Option pricing method
|
$9.6
|
|
|||||
|
|
Time until expiration
|
-
|
4 years
|
|||||
|
Volatility/Standard deviation
|
-
|
60.0%
|
||||||
|
Risk free rate
|
-
|
1.15%
|
||||||
|
OneBeacon Surplus Notes
(7)
:
|
||||||||
|
- Seller priority
|
Discounted cash flow
|
$38.0
|
Discount rate
(3)
|
-
|
13.0%
|
|||
|
Timing of interest payments
(5)
|
-
|
2020
|
||||||
|
Timing of principal payments
(5)
|
-
|
2025
|
||||||
|
- Pari passu
|
Discounted cash flow
|
$13.5
|
Discount rate
(4)
|
-
|
22.4%
|
|||
|
Timing of interest payments
(6)
|
-
|
2020
|
||||||
|
Timing of principal payments
(6)
|
-
|
2030
|
||||||
(1)
Includes the net unrealized investment gains (losses) associated with foreign currency; foreign currency effects based on observable inputs.
(2)
Valuation based on the issuer’s intent as of December 31, 2015 to call the security in the near term.
(3)
Stochastic modeling supporting the fair value estimation indicates that the average percentage of discounted payments missed on the seller priority note is roughly equivalent to that of a conventional debt security with a credit rating of ‘B’. The corresponding credit spread increased by an additional 250 basis points to reflect both a liquidity discount for a private debt instrument and regulatory payment approval uncertainty, was added to the treasury rate to determine the discount rate for the seller priority note.
(4)
Stochastic modeling supporting the fair value estimation indicates that the average percentage of discounted payments missed on the pari passu note is roughly equivalent to that of a conventional debt security with a credit rating of ‘CCC’. The corresponding credit spread increased by an additional 250 basis points to reflect both a liquidity discount for a private debt instrument and regulatory payment approval uncertainty, was added to the treasury rate to determine the discount rate for the seller priority note.
(5)
As of December 31, 2015, OneBeacon assumed for the purpose of estimating fair value that all accrued but unpaid interest on the seller priority note since the date of issuance was paid in 2020, with regular annual payments beginning thereafter. Principal repayments were assumed to begin on a graduated basis in 2025.
(6)
As of December 31, 2015, OneBeacon assumed for the purpose of estimating fair value that all accrued but unpaid interest on the pari passu note since the date of issuance was paid in 2020, with regular annual payments beginning thereafter. Principal repayments were assumed to begin on a graduated basis in 2030.
(7)
The decrease in the fair value of the OneBeacon Surplus Notes during the twelve months ended December 31, 2015 was primarily due to widening of non-investment grade credit spreads.
F-51
White Mountains has recognized goodwill and other identifiable intangible assets at the acquisition date fair values in connection with its purchases of subsidiaries. The following table shows the economic lives, acquisition date values, accumulated amortization and net carrying values for other intangible assets and goodwill, for each company acquired:
|
$ in millions
|
Weighted Average Economic
life
(in years)
|
December 31, 2016
|
December 31, 2015
|
|||||||||||||||||||||||
|
Acquisition date fair value
|
Accumulated amortization
|
Net carrying value
|
Acquisition date fair value
|
Accumulated amortization
|
Net carrying value
|
|||||||||||||||||||||
|
Goodwill:
|
||||||||||||||||||||||||||
|
MediaAlpha
|
N/A
|
$
|
18.3
|
|
$
|
—
|
|
$
|
18.3
|
|
$
|
18.3
|
|
$
|
—
|
|
$
|
18.3
|
|
|||||||
|
Wobi
|
N/A
|
5.8
|
|
—
|
|
5.8
|
|
5.8
|
|
—
|
|
5.8
|
|
|||||||||||||
|
Buzzmove
|
N/A
|
7.6
|
|
—
|
|
7.6
|
|
—
|
|
—
|
|
—
|
|
|||||||||||||
|
Total goodwill
|
31.7
|
|
—
|
|
31.7
|
|
24.1
|
|
—
|
|
24.1
|
|
||||||||||||||
|
Other intangible assets:
|
||||||||||||||||||||||||||
|
MediaAlpha
|
||||||||||||||||||||||||||
|
Customer relationships
|
3
|
10.0
|
|
6.2
|
|
3.8
|
|
6.5
|
|
2.9
|
|
3.6
|
|
|||||||||||||
|
Information technology
|
5
|
32.4
|
|
17.9
|
|
14.5
|
|
32.0
|
|
11.2
|
|
20.8
|
|
|||||||||||||
|
Subtotal
|
42.4
|
|
24.1
|
|
18.3
|
|
38.5
|
|
14.1
|
|
24.4
|
|
||||||||||||||
|
Wobi
|
||||||||||||||||||||||||||
|
Trademark
|
8
|
2.1
|
|
.8
|
|
1.3
|
|
2.1
|
|
.5
|
|
1.6
|
|
|||||||||||||
|
Information technology
|
7
|
3.6
|
|
1.2
|
|
2.4
|
|
3.6
|
|
.7
|
|
2.9
|
|
|||||||||||||
|
Subtotal
|
5.7
|
|
2.0
|
|
3.7
|
|
5.7
|
|
1.2
|
|
4.5
|
|
||||||||||||||
|
Buzzmove
|
||||||||||||||||||||||||||
|
Trademark
|
7
|
.6
|
|
.1
|
|
.5
|
|
—
|
|
—
|
|
—
|
|
|||||||||||||
|
Information technology
|
5
|
.5
|
|
—
|
|
.5
|
|
—
|
|
—
|
|
—
|
|
|||||||||||||
|
Subtotal
|
1.1
|
|
.1
|
|
1.0
|
|
—
|
|
—
|
|
—
|
|
||||||||||||||
|
OneBeacon
|
10
|
9.4
|
|
8.2
|
|
1.2
|
|
9.4
|
|
7.0
|
|
2.4
|
|
|||||||||||||
|
Total other intangible assets
|
58.6
|
|
34.4
|
|
24.2
|
|
53.6
|
|
22.3
|
|
31.3
|
|
||||||||||||||
|
Total goodwill and other intangible assets
(1)
|
$
|
90.3
|
|
$
|
34.4
|
|
$
|
55.9
|
|
$
|
77.7
|
|
$
|
22.3
|
|
$
|
55.4
|
|
||||||||
(1)
Excludes amounts related to Star & Shield. See
Note 22 — “Held for Sale and Discontinued Operations”
.
The goodwill recognized for the above acquisitions is attributed to expected future cash flows. The acquisition date fair values of other intangible assets with finite lives are estimated using income approach techniques, which use future expected cash flows to develop a discounted present value amount.
The multi-period-excess-earnings method estimates fair value using the present value of the incremental after-tax cash flows attributable solely to the intangible asset over its remaining life. This approach was used to estimate the fair value of intangible assets associated with trademarks, brand names, customer relationships and contracts and information technology.
The relief-from-royalty method was used to estimate fair value for intangible assets that relate to rights that could be obtained via a license from a third-party owner. Under this method, the fair value is estimated using the present value of license fees avoided by owning rather than leasing the asset. This technique was used to estimate the fair value of domain names.
The with-or-without method estimates the fair value of an intangible asset that provides an incremental benefit. Under this method, the fair value of the intangible asset is calculated by comparing the value of the entity with and without the intangible asset. This approach was used to estimate the fair value of favorable lease terms, which is included in other.
F-52
The following table shows the change in goodwill and other intangible assets:
|
December 31,
|
||||||||||||||||
|
2016
|
2015
|
|||||||||||||||
|
Millions
|
Goodwill
|
Other intangible assets
|
Goodwill
|
Other intangible assets
|
||||||||||||
|
Beginning balance
|
$
|
24.1
|
|
$
|
31.3
|
|
$
|
23.8
|
|
$
|
38.7
|
|
||||
|
Add: Star & Shield amounts held for sale at beginning of the period
(1)
|
—
|
|
.4
|
|
—
|
|
.8
|
|
||||||||
|
Acquisitions of businesses
|
7.6
|
|
1.1
|
|
.3
|
|
2.8
|
|
||||||||
|
Acquisitions of other intangible assets
|
—
|
|
3.9
|
|
—
|
|
—
|
|
||||||||
|
Amortization, including foreign currency translation
|
—
|
|
(12.5
|
)
|
—
|
|
(10.6
|
)
|
||||||||
|
Less: Star & Shield amounts held for sale at end of the period
(1)
|
—
|
|
—
|
|
—
|
|
.4
|
|
||||||||
|
Ending balance
|
$
|
31.7
|
|
$
|
24.2
|
|
$
|
24.1
|
|
$
|
31.3
|
|
||||
(1)
See
Note 22 — “Held for Sale and Discontinued Operations”
.
Amortization expense was
$12.5 million
,
$10.6 million
and
$8.3 million
for the years ended
December 31, 2016, 2015 and 2014
.
White Mountains expects to recognize amortization expense in each of the next five years as follows:
|
Millions
|
Amortization expense
|
|||
|
2017
|
$
|
10.9
|
|
|
|
2018
|
8.3
|
|
||
|
2019
|
2.3
|
|
||
|
2020
|
.7
|
|
||
|
2021
|
.9
|
|
||
|
Total
|
$
|
23.1
|
|
|
White Mountains’s debt outstanding as of
December 31, 2016 and 2015
consisted of the following:
|
December 31,
|
Effective
|
December 31,
|
Effective
|
|||||||||
|
Millions
|
2016
|
Rate
(1)
|
2015
|
Rate
(1)
|
||||||||
|
WTM Bank Facility
|
$
|
—
|
|
N/A
|
$
|
50.0
|
|
3.9%
|
||||
|
OneBeacon Bank Facility
|
—
|
|
N/A
|
—
|
|
N/A
|
||||||
|
OBH Senior Notes, at face value
|
275.0
|
|
4.7%
|
275.0
|
|
4.7%
|
||||||
|
Unamortized original issue discount and debt issuance costs
|
(1.8
|
)
|
(2.1
|
)
|
||||||||
|
OBH Senior Notes, carrying value
|
273.2
|
|
272.9
|
|
||||||||
|
MediaAlpha Bank Facility
|
12.9
|
|
5.7%
|
15.0
|
|
5.5%
|
||||||
|
Unamortized issuance cost
|
(.2
|
)
|
(.3
|
)
|
||||||||
|
MediaAlpha Bank Facility, carrying value
|
12.7
|
|
14.7
|
|
||||||||
|
Total debt
|
$
|
285.9
|
|
$
|
337.6
|
|
||||||
(1)
Effective rate considers the effect of the debt issuance costs.
F-53
A schedule of contractual repayments of White Mountains’s debt as of
December 31, 2016
, follows:
|
Millions
|
December 31,
2016 |
|||
|
Due in one year or less
|
$
|
5.0
|
|
|
|
Due in two to three years
|
7.9
|
|
||
|
Due in four to five years
|
—
|
|
||
|
Due after five years
|
275.0
|
|
||
|
Total
|
$
|
287.9
|
|
|
WTM Bank Facility
On August 14, 2013, White Mountains entered into a revolving credit facility with a syndicate of lenders administered by Wells Fargo Bank, N.A. which has a total commitment of
$425.0 million
and has a maturity date of August 14, 2018 (the “WTM Bank Facility”). The WTM Bank Facility replaced White Mountains’s previous revolving credit facility, which had a total commitment of
$375.0 million
. During 2016, White Mountains borrowed a total of
$350.0 million
and repaid a total of
$400.0 million
under the WTM Bank Facility at a blended interest rate of
3.85%
. During 2015, White Mountains borrowed a total of
$125.0 million
and repaid a total of
$75.0 million
under the WTM Bank Facility at a blended interest rate of
3.74%
. As of
December 31, 2016
, the WTM Bank Facility was undrawn. White Mountains recorded
$1.2 million
,
$0.1 million
,
$0.3 million
of interest expense on the WTM Bank Facility for the years ended
December 31, 2016, 2015 and 2014
.
The WTM Bank Facility contains various affirmative, negative and financial covenants that White Mountains considers to be customary for such borrowings, including certain minimum net worth and maximum debt to capitalization standards. These covenants can restrict White Mountains in several ways, including its ability to incur additional indebtedness.
OneBeacon Bank Facility
On September 29, 2015, OneBeacon Ltd. and OBH, as co-borrowers and co-guarantors, entered into a revolving credit facility administered by U.S. Bank N.A. and also including BMO Harris Bank N.A., which has a total commitment of
$65.0 million
and has a maturity date of September 29, 2019 (the “OneBeacon Bank Facility”). As of
December 31, 2016
, the OneBeacon Bank Facility was undrawn.
The OneBeacon Bank Facility contains various affirmative, negative and financial covenants which White Mountains considers to be customary for such borrowings, including certain minimum net worth and maximum debt to capitalization standards. These covenants can restrict White Mountains in several ways, including its ability to incur additional indebtedness.
OBH Senior Notes
In November 2012, OneBeacon U.S. Holdings, Inc. (“OBH”), an intermediate holding company of OneBeacon, issued
$275.0 million
face value of senior unsecured notes (“OBH Senior Notes”) through a public offering, at an issue price of
99.9%
and received
$272.9 million
of proceeds. The OBH Senior Notes bear an annual interest rate of
4.6%
payable semi-annually in arrears on May 9 and November 9, until maturity on November 9, 2022, and are fully and unconditionally guaranteed as to the payment of principal and interest by OneBeacon Ltd. Taking into effect the amortization of the original issue discount and all underwriting and issuance expenses, the OBH Senior Notes have an effective yield to maturity of approximately
4.7%
per annum.
In December 2012, the proceeds from the OBH Senior Notes were utilized to repurchase the remaining
$269.8 million
of outstanding senior notes issued in 2003 by OBH with an annual interest rate of
5.875%
for
$275.9 million
. The repurchase resulted in a
$6.3 million
loss, including transaction fees and the write-off of the remaining
$0.2 million
in unamortized deferred costs and original issue discount at the time of repurchase.
OBH recorded
$13.1 million
,
$13.0 million
and $
13.0 million
in interest expense on the OBH Senior Notes for the years ended
December 31, 2016, 2015 and 2014
.
The OBH Senior Notes were issued under indentures that contain restrictive covenants which, among other things, limit the ability of OneBeacon Ltd., OBH, and their respective subsidiaries to create liens and enter into sale and leaseback transactions and limits the ability of OneBeacon Ltd. and OBH and their respective subsidiaries to consolidate, merge or transfer their properties and assets. The indentures do not contain any financial ratios or specified levels of net worth or liquidity to which OneBeacon Ltd. or OBH must adhere.
F-54
MediaAlpha Bank Facility
On July 23, 2015, MediaAlpha entered into a credit facility with Opus Bank, which has a total commitment of
$20.0 million
and has a maturity date of July 23, 2019 (the “MediaAlpha Bank Facility”). The MediaAlpha Bank Facility consists of a
$15.0 million
term loan facility, which had an outstanding balance of
$12.9 million
as of December 31, 2016, and a
$5.0 million
revolving credit facility, which was undrawn as of
December 31, 2016
. During 2016, MediaAlpha repaid a total of
$2.1 million
under the term loan facility and borrowed and repaid
$2.5 million
under the revolving loan facility. The MediaAlpha Bank Facility carries a variable interest rate that is based on the Prime Rate, as published by the Wall Street Journal, plus a spread of
1.5%
as of
December 31, 2016
.
The MediaAlpha Bank Facility is secured by the intellectual property and the common stock of MediaAlpha's subsidiaries, and contains various affirmative, negative and financial covenants that White Mountains considers to be customary for such borrowings, including a maximum leverage ratio.
Debt Covenants
As of
December 31, 2016
, White Mountains was in compliance with all of the covenants under all of its debt facilities.
Interest
Total interest expense incurred by White Mountains for its indebtedness was
$16.1 million
,
$14.6 million
and
$14.2 million
in
2016, 2015 and 2014
. Total interest paid by White Mountains for its indebtedness was
$14.8 million
,
$12.8 million
, and
$13.0 million
in
2016, 2015 and 2014
.
The Company and its Bermuda domiciled subsidiaries are not subject to Bermuda income tax under current Bermuda law. In the event there is a change in the current law such that taxes are imposed, the Company and its Bermuda domiciled subsidiaries would be exempt from such tax until March 31, 2035, pursuant to the Bermuda Exempted Undertakings Tax Protection Act of 1966. The Company has subsidiaries and branches that operate in various other jurisdictions around the world that are subject to tax in the jurisdictions in which they operate. The jurisdictions in which the Company’s subsidiaries and branches are subject to tax are Barbados, Gibraltar, Ireland, Israel, Luxembourg, the Netherlands, the United Kingdom and the United States.
The total income tax benefit for the years ended
December 31, 2016, 2015 and 2014
consisted of the following:
|
Year Ended December 31,
|
||||||||||||
|
Millions
|
2016
|
2015
|
2014
|
|||||||||
|
Current tax benefit (expense):
|
|
|
|
|
|
|
||||||
|
U.S. federal
|
$
|
50.7
|
|
$
|
9.1
|
|
$
|
(4.3
|
)
|
|||
|
State
|
(1.6
|
)
|
(1.8
|
)
|
(2.0
|
)
|
||||||
|
Non-U.S.
|
(.8
|
)
|
(1.5
|
)
|
(1.4
|
)
|
||||||
|
Total current tax benefit (expense)
|
48.3
|
|
5.8
|
|
(7.7
|
)
|
||||||
|
Deferred tax (expense) benefit:
|
|
|
|
|
|
|
||||||
|
U.S. federal
|
(2.3
|
)
|
(6.7
|
)
|
22.8
|
|
||||||
|
State
|
(.6
|
)
|
1.1
|
|
(.3
|
)
|
||||||
|
Total deferred tax (expense) benefit
|
(2.9
|
)
|
(5.6
|
)
|
22.5
|
|
||||||
|
Total income tax benefit
|
$
|
45.4
|
|
$
|
.2
|
|
$
|
14.8
|
|
|||
F-55
Effective Rate Reconciliation
A reconciliation of taxes calculated using the
35%
U.S. statutory rate (the tax rate at which the majority of White Mountains’s worldwide operations are taxed) to the income tax (expense) benefit on pre-tax income follows:
|
Year Ended December 31,
|
||||||||||||
|
Millions
|
2016
|
2015
|
2014
|
|||||||||
|
Tax benefit (expense) at the U.S. statutory rate
|
$
|
14.1
|
|
$
|
(55.1
|
)
|
$
|
10.3
|
|
|||
|
Differences in taxes resulting from:
|
|
|
|
|
|
|
||||||
|
Tax reserve adjustments
|
13.7
|
|
(1.7
|
)
|
5.2
|
|
||||||
|
Change in valuation allowance
|
9.1
|
|
(19.4
|
)
|
(35.7
|
)
|
||||||
|
Non-U.S. earnings, net of foreign taxes
|
6.9
|
|
76.7
|
|
37.8
|
|
||||||
|
Tax rate changes
|
(3.5
|
)
|
—
|
|
—
|
|
||||||
|
Tax exempt interest and dividends
|
2.5
|
|
2.6
|
|
2.5
|
|
||||||
|
Withholding tax
|
(.5
|
)
|
(1.2
|
)
|
(2.4
|
)
|
||||||
|
Other, net
|
3.1
|
|
(1.7
|
)
|
(2.9
|
)
|
||||||
|
Total income tax benefit on pre-tax income
|
$
|
45.4
|
|
$
|
.2
|
|
$
|
14.8
|
|
|||
The non-U.S. component of pre-tax income was
$16.3 million
,
$208.5 million
and
$60.4 million
for the years ended
December 31, 2016, 2015 and 2014
.
Tax Payments and Receipts
Net income (receipts from) tax payments to national governments (primarily the United States) totaled
$(12.8) million
,
$(6.5) million
, and
$2.7 million
for the years ended
December 31, 2016, 2015 and 2014
.
Deferred Tax Inventory
Deferred income taxes reflect the net tax effects of temporary differences between the carrying amounts of assets and liabilities for financial reporting purposes and the amounts for tax purposes.
An outline of the significant components of White Mountains’s deferred tax assets and liabilities follows:
|
December 31,
|
||||||||
|
Millions
|
2016
|
2015
|
||||||
|
Deferred income tax assets related to:
|
|
|
|
|
||||
|
U.S. federal net operating and capital loss carryforwards
|
$
|
189.3
|
|
$
|
191.0
|
|
||
|
Incentive compensation
|
42.5
|
|
49.0
|
|
||||
|
Unearned premiums
|
37.8
|
|
37.5
|
|
||||
|
Non-U.S. net operating loss carryforwards
|
29.5
|
|
33.8
|
|
||||
|
Tax credit carryforwards
|
20.7
|
|
16.9
|
|
||||
|
Loss reserve discount
|
18.1
|
|
26.8
|
|
||||
|
Runoff Transaction
|
12.6
|
|
12.6
|
|
||||
|
Deferred compensation
|
5.7
|
|
6.2
|
|
||||
|
Accrued interest
|
2.2
|
|
1.3
|
|
||||
|
Other items
|
4.0
|
|
8.6
|
|
||||
|
Total gross deferred income tax assets
|
362.4
|
|
383.7
|
|
||||
|
Less: valuation allowances
|
(146.6
|
)
|
(165.4
|
)
|
||||
|
Total net deferred income tax assets
|
215.8
|
|
218.3
|
|
||||
|
Deferred income tax liabilities related to:
|
|
|
|
|
||||
|
Deferred acquisition costs
|
33.6
|
|
34.9
|
|
||||
|
Members surplus contributions
|
30.0
|
|
19.0
|
|
||||
|
SSIE Surplus Notes
|
7.1
|
|
—
|
|
||||
|
Pension and benefit accruals
|
6.4
|
|
3.5
|
|
||||
|
Capitalized software
|
4.7
|
|
4.5
|
|
||||
|
Investment basis difference
|
4.1
|
|
15.2
|
|
||||
|
Net unrealized investment gains
|
2.9
|
|
28.4
|
|
||||
|
Other items
|
.3
|
|
—
|
|
||||
|
Total deferred income tax liabilities
|
89.1
|
|
105.5
|
|
||||
|
Net deferred tax asset
|
$
|
126.7
|
|
$
|
112.8
|
|
||
F-56
White Mountains’s deferred tax assets are net of U.S. federal, state, and non-U.S. valuation allowances and, to the extent they relate to non-U.S. jurisdictions, they are shown at year-end exchange rates.
Valuation Allowance
White Mountains records a valuation allowance against deferred tax assets if it becomes more likely than not that all or a portion of a deferred tax asset will not be realized. Changes in valuation allowances from period to period are included in income tax expense in the period of change. In determining whether or not a valuation allowance, or change therein, is warranted, White Mountains considers factors such as prior earnings history, expected future earnings, carryback and carryforward periods and strategies that if executed would result in the realization of a deferred tax asset. It is possible that certain planning strategies or projected earnings in certain subsidiaries may not be feasible to utilize the entire deferred tax asset, which could result in material changes to White Mountains’s deferred tax assets and tax expense.
Of the
$146.6 million
valuation allowance as of
December 31, 2016
,
$117.3 million
relates to deferred tax assets on net operating losses in the United States and other federal and state deferred tax benefits,
$24.4 million
relates to deferred tax assets on net operating losses in Luxembourg subsidiaries,
$4.6 million
relates to net operating losses in the Israel subsidiaries and
$0.3 million
relates to net operating losses in the United Kingdom subsidiary. Of the
$165.4 million
valuation allowance as of
December 31, 2015
,
$131.5 million
relates to deferred tax assets on U.S. losses and other federal and state deferred tax benefits,
$28.3 million
relates to deferred tax assets on net operating losses in Luxembourg subsidiaries,
$5.5 million
relates to net operating losses in the Israel subsidiaries and
$0.1 million
relates to net operating losses in the Netherlands subsidiary.
United States
During 2016 and 2015, White Mountains recorded tax expense of
$17.1 million
and
$9.1 million
to establish a valuation allowance against deferred tax assets of Guilford Holdings, Inc. and subsidiaries (“Guilford”), as White Mountains management does not anticipate sufficient taxable income to utilize the deferred tax assets. Guilford consists of service companies and certain other investments that are included in the Other Operations segment. Also during 2016, Guilford has income in discontinued operations that is available to offset its loss from continuing operations. However, ASC 740 includes an exception to the general principle of intra-period tax allocations that requires a consolidated tax group, such as Guilford, with a current period loss within continuing operations to consider income recorded in other categories, including discontinued operations, in determining the tax benefit that is allocated to continuing operations. As a result of Guilford’s current period losses within continuing operations, White Mountains recorded a tax benefit of
$21.4 million
in continuing operations, with an offsetting tax expense in discontinued operations.
During 2016 and 2015, White Mountains recorded tax expense of
$3.6 million
and
$6.3 million
to establish valuation allowances against deferred tax assets of BAM, as it is uncertain if it will have sufficient taxable income to utilize its deferred tax assets. Also during 2016 and 2015, BAM has income in other comprehensive income that is available to offset its loss from continuing operations, as a result, BAM recorded a tax benefit of
$11.0 million
and
$8.7 million
, in continuing operations, with an offsetting tax expense in other comprehensive income. However, since BAM is a mutual insurance company that is owned by its members, its results do not affect White Mountains’s common shareholders’ equity, as they are attributable to non-controlling interests.
During 2016, Houston General Insurance Exchange (“HGIE”) recorded tax expense of
$0.1 million
as it is uncertain if it will have sufficient taxable income to utilize its deferred tax assets. During 2015, HGIE recorded a tax benefit of
$0.5 million
to reduce a valuation allowance, primarily due to the restructuring of the surplus note issued by HGIE (“HGIE Surplus Notes”).
During 2016, SSIE recorded a tax benefit of
$6.9 million
to reduce a valuation allowance, primarily due to the write down of the SSIE Surplus Notes. During 2015, SSIE recorded tax expense of
$1.2 million
, as it is uncertain if it will have sufficient taxable income to utilize its deferred tax assets. SSIE is a reciprocal, which is included in the White Mountains’s consolidated results as a variable interest entity. See
Note 18
—
“Variable Interest Entities”
.
Non-U.S. jurisdictions
During 2016, White Mountains recorded tax expense of
$2.8 million
for a reduction to deferred tax assets, and a corresponding reduction to the valuation allowance, which primarily related to a decrease in the corporate income tax rate for Luxembourg-domiciled subsidiaries. During 2015, White Mountains recorded tax expense of
$0.3 million
to establish a valuation allowance against deferred tax assets at certain Luxembourg-domiciled subsidiaries, as White Mountains management does not anticipate sufficient taxable income to utilize the deferred tax assets.
During 2016 and 2015, White Mountains recorded tax expense of
$1.1 million
and
$3.0 million
to establish a valuation allowance against deferred tax assets at certain Israeli-domiciled subsidiaries, as White Mountains management does not anticipate sufficient taxable income to utilize the deferred tax assets.
During 2016, White Mountains recorded tax expense of
$0.1 million
to establish a valuation allowance against deferred tax assets at certain United Kingdom-domiciled subsidiaries, as White Mountains management does not anticipate sufficient taxable income to utilize the deferred tax assets.
F-57
Net Operating Loss and Capital Loss Carryforwards
Net operating loss and capital loss carryforwards as of
December 31, 2016
, the expiration dates and the deferred tax assets thereon are as follows:
|
December 31, 2016
|
||||||||||||||||||||
|
Millions
|
United States
|
Luxembourg
|
United Kingdom
|
Israel
|
Total
|
|||||||||||||||
|
2017-2021
|
$
|
.8
|
|
$
|
—
|
|
$
|
—
|
|
$
|
—
|
|
$
|
.8
|
|
|||||
|
2022-2026
|
1.6
|
|
—
|
|
—
|
|
—
|
|
1.6
|
|
||||||||||
|
2027-2036
|
556.3
|
|
—
|
|
—
|
|
—
|
|
556.3
|
|
||||||||||
|
No expiration date
|
—
|
|
93.8
|
|
3.2
|
|
19.8
|
|
116.8
|
|
||||||||||
|
Total
|
$
|
558.7
|
|
$
|
93.8
|
|
$
|
3.2
|
|
$
|
19.8
|
|
$
|
675.5
|
|
|||||
|
Gross deferred tax asset
|
189.3
|
|
24.4
|
|
.5
|
|
4.6
|
|
218.8
|
|
||||||||||
|
Valuation allowance
|
(115.4
|
)
|
(24.4
|
)
|
(.5
|
)
|
(4.6
|
)
|
(144.9
|
)
|
||||||||||
|
Net deferred tax asset
|
$
|
73.9
|
|
$
|
—
|
|
$
|
—
|
|
$
|
—
|
|
$
|
73.9
|
|
|||||
Included in the U.S. net operating loss carryforwards are losses of
$4.2 million
subject to an annual limitation on utilization under Internal Revenue Code Section 382. These loss carryforwards will begin to expire in 2025. Also included in the U.S. net operating loss carryforwards are losses of
$9.9 million
due to additional deductions related to equity compensation. These loss carryforwards begin to expire in 2030. As of
December 31, 2016
, there are U.S. foreign tax credit carryforwards available of
$0.4 million
, which begin to expire in 2023. As of
December 31, 2016
, there are U.S. alternative minimum tax credit carryforwards of
$2.3 million
which do not expire. As of
December 31, 2016
, there are U.S. low income housing credit carryforwards of
$18.0 million
, which begin to expire in 2031.
Uncertain Tax Positions
Recognition of the benefit of a given tax position is based upon whether a company determines that it is more likely than not that a tax position will be sustained upon examination based upon the technical merits of the position. In evaluating the more-likely-than-not recognition threshold, White Mountains must presume that the tax position will be subject to examination by a taxing authority with full knowledge of all relevant information. If the recognition threshold is met, then the tax position is measured at the largest amount of benefit that is more than
50%
likely of being realized upon ultimate settlement.
A reconciliation of the beginning and ending amount of unrecognized tax benefits is as follows:
|
Millions
|
Permanent
Differences
(1)
|
Temporary
Differences
(2)
|
Interest and
Penalties
(3)
|
Total
|
||||||||||||
|
Balance at January 1, 2014
|
$
|
8.4
|
|
$
|
16.6
|
|
$
|
8.7
|
|
$
|
33.7
|
|
||||
|
Changes in prior year tax positions
|
(2.2
|
)
|
(.8
|
)
|
(1.9
|
)
|
(4.9
|
)
|
||||||||
|
Tax positions taken during the current year
|
—
|
|
7.3
|
|
—
|
|
7.3
|
|
||||||||
|
Lapse in statute of limitations
|
(.8
|
)
|
—
|
|
(.3
|
)
|
(1.1
|
)
|
||||||||
|
Balance at December 31, 2014
|
5.4
|
|
23.1
|
|
6.5
|
|
35.0
|
|
||||||||
|
Changes in prior year tax positions
|
—
|
|
(12.4
|
)
|
1.7
|
|
(10.7
|
)
|
||||||||
|
Balance at December 31, 2015
|
5.4
|
|
10.7
|
|
8.2
|
|
24.3
|
|
||||||||
|
Changes in prior year tax positions
|
—
|
|
(5.5
|
)
|
.1
|
|
(5.4
|
)
|
||||||||
|
Settlements with tax authorities
|
(5.4
|
)
|
—
|
|
(8.3
|
)
|
(13.7
|
)
|
||||||||
|
Balance at December 31, 2016
|
$
|
—
|
|
$
|
5.2
|
|
$
|
—
|
|
$
|
5.2
|
|
||||
|
(1)
|
Represents the amount of unrecognized tax benefits that, if recognized, would impact the effective tax rate.
|
|
(2)
|
Represents the amount of unrecognized tax benefits that, if recognized would create a temporary difference between the reported amount of an item in White Mountains’s Consolidated Balance Sheet and its tax basis.
|
|
(3)
|
Net of tax benefit.
|
If White Mountains determines in the future that its reserves for unrecognized tax benefits on temporary differences are not needed, the reversal of
$5.2 million
of such reserves as of
December 31, 2016
would not impact the effective tax rate due to deferred tax accounting but would accelerate the payment of cash to the taxing authority. The vast majority of White Mountains’s reserves for unrecognized tax benefits on temporary differences relate to deductions for loss reserves where the timing of the deductions is uncertain.
F-58
White Mountains classifies all interest and penalties on unrecognized tax benefits as part of income tax expense. During the years ended
December 31, 2016, 2015 and 2014
, White Mountains recognized
$(8.2) million
,
$1.7 million
,
$(2.2) million
in net interest (income) expense. There was no accrued interest as of December 31, 2016. The accrued interest as of December 31, 2015 is
$8.2 million
, net of any tax benefit.
Tax Examinations
With few exceptions, White Mountains is no longer subject to U.S. federal, state, or non-U.S. income tax examinations by tax authorities for years before 2012.
On May 27, 2016, White Mountains received the Closing Letter (Letter 1156) from the IRS Revenue Agent relating to the examination of tax years 2010, 2011 and 2012 for certain U.S. subsidiaries of OneBeacon. All disputed items have now been agreed to and resolved. As the receipt of the Closing Letter described above represents formal settlement, White Mountains recorded a tax benefit of
$3.5
million in the second quarter of 2016 related to tax years 2010, 2011 and 2012.
On January 19, 2016, White Mountains received Form 870-AD (Offer to Waive Restrictions on Assessment and Collection Tax Deficiency and to Accept Overassessment) from the IRS Appeals Office relating to the examination of tax years 2007, 2008 and 2009 for certain U.S. subsidiaries of OneBeacon. All disputed items have now been agreed to and resolved with the Joint Committee on Taxation. As the receipt of the Form 870-AD described above represents formal settlement, White Mountains recorded a tax benefit of
$12.8 million
in the first quarter of 2016 related to tax years 2007, 2008 and 2009.
White Mountains recorded a tax benefit of
$5.0 million
in the first quarter of 2014 relating to the examination of tax years 2005 and 2006 for certain U.S. subsidiaries of OneBeacon.
On June 22, 2016, White Mountains received the Closing Letter (Letter 1156) from the IRS Revenue Agent relating to the examination of tax year 2012 for Guilford Holdings, Inc. and subsidiaries. All disputed items have now been agreed to and resolved. As the receipt of the Closing Letter described above represents formal settlement, White Mountains recorded an increase to the deferred tax asset on net operating loss carryforwards of
$0.6
million, and a corresponding increase to the valuation allowance, related to tax year 2012.
Variable Annuity Reinsurance
White Mountains entered into agreements to reinsure death and living benefit guarantees associated with certain variable annuities in Japan. During the third quarter of 2015, the variable annuity contracts reinsured by WM Life Re began to mature and were fully runoff by June 30, 2016. The reinsurance agreement was commuted in December 2016.
The following table summarizes the pre-tax operating results of WM Life Re for the years ended
December 31, 2016, 2015 and 2014
:
|
Year Ended December 31,
|
||||||||||||
|
Millions
|
2016
|
2015
|
2014
|
|||||||||
|
Fees, included in other revenue
|
$
|
1.2
|
|
$
|
9.3
|
|
$
|
18.6
|
|
|||
|
Change in fair value of variable annuity liability, included in other revenue
|
(.3
|
)
|
(.4
|
)
|
52.9
|
|
||||||
|
Change in fair value of derivatives, included in other revenue
|
(2.0
|
)
|
(8.8
|
)
|
(72.4
|
)
|
||||||
|
Foreign exchange, included in other revenue
|
1.3
|
|
(1.3
|
)
|
(3.2
|
)
|
||||||
|
Other investment income and losses
|
—
|
|
(.4
|
)
|
(1.4
|
)
|
||||||
|
Total revenues
|
.2
|
|
(1.6
|
)
|
(5.5
|
)
|
||||||
|
Change in fair value of variable annuity death benefit liabilities, included in
general and administrative expenses
|
—
|
|
—
|
|
.6
|
|
||||||
|
Death benefit claims paid, included in general and administrative expenses
|
(.3
|
)
|
(.1
|
)
|
(.1
|
)
|
||||||
|
General and administrative expenses
|
(2.6
|
)
|
(4.0
|
)
|
(4.3
|
)
|
||||||
|
Pre-tax loss
|
$
|
(2.7
|
)
|
$
|
(5.7
|
)
|
$
|
(9.3
|
)
|
|||
During 2013, the ratio of annuitants’ aggregate account values to the aggregate guarantee value provided by WM Life Re increased, and as a result, annuitants surrendered their policies at higher rates than WM Life Re observed in the past. In response to this trend, WM Life Re adjusted the projected surrender assumptions used in the valuation of its variable annuity reinsurance liability upward. In 2014, surrender rates continued to outpace assumptions and WM Life Re again adjusted the projected surrender assumptions. For the year ended December 31, 2014, the change in the fair value of the variable annuity liability included
$0.2 million
of losses associated with changes in projected surrender assumptions. There was no change in projected surrender assumptions in 2015 or 2016.
F-59
The following summarizes net realized and unrealized derivative gains (losses) recognized in other revenue for the years ended
December 31, 2016, 2015 and 2014
and the carrying values, included in other assets, as of
December 31, 2016 and 2015
by type of instrument:
|
Carrying Value
|
||||||||||||||||||||
|
Year Ended December 31,
|
December 31,
|
|||||||||||||||||||
|
Millions
|
2016
|
2015
|
2014
|
2016
|
2015
|
|||||||||||||||
|
Fixed income/interest rate
|
$
|
1.8
|
|
$
|
6.4
|
|
$
|
(33.7
|
)
|
$
|
—
|
|
$
|
.5
|
|
|||||
|
Foreign exchange
|
(4.8
|
)
|
(7.3
|
)
|
(1.3
|
)
|
—
|
|
14.8
|
|
||||||||||
|
Equity
|
1.0
|
|
(7.9
|
)
|
(37.4
|
)
|
—
|
|
4.8
|
|
||||||||||
|
Total
|
$
|
(2.0
|
)
|
$
|
(8.8
|
)
|
$
|
(72.4
|
)
|
$
|
—
|
|
$
|
20.1
|
|
|||||
The following table summarizes the changes in White Mountains’s variable annuity reinsurance liabilities and derivative instruments for the year ended
December 31, 2016, 2015 and 2014
:
|
Variable Annuity
(Liabilities)
|
Derivative Instruments
|
|||||||||||||||||||
|
Millions
|
Level 3
|
Level 3
(1)(6)
|
Level 2
(1)(2)
|
Level 1
(3)
|
Total
(4)
|
|||||||||||||||
|
Balance at January 1, 2016
|
$
|
.3
|
|
$
|
2.7
|
|
$
|
16.5
|
|
$
|
.9
|
|
$
|
20.1
|
|
|||||
|
Purchases
|
—
|
|
—
|
|
—
|
|
—
|
|
—
|
|
||||||||||
|
Net realized and unrealized (losses) gains
|
(.3
|
)
|
(5)
|
2.9
|
|
(.7
|
)
|
(4.2
|
)
|
(2.0
|
)
|
|||||||||
|
Transfers in (out)
|
—
|
|
—
|
|
—
|
|
—
|
|
—
|
|
||||||||||
|
Sales/settlements
|
—
|
|
(5.6
|
)
|
(15.8
|
)
|
3.3
|
|
(18.1
|
)
|
||||||||||
|
Balance at December 31, 2016
|
$
|
—
|
|
$
|
—
|
|
$
|
—
|
|
$
|
—
|
|
$
|
—
|
|
|||||
|
|
Variable Annuity
(Liabilities)
|
Derivative Instruments
|
||||||||||||||||||
|
Millions
|
Level 3
|
Level 3
(1)(6)
|
Level 2
(1)(2)
|
Level 1
(3)
|
Total
(4)
|
|||||||||||||||
|
Balance at January 1, 2015
|
$
|
.7
|
|
$
|
18.9
|
|
$
|
33.8
|
|
$
|
3.7
|
|
$
|
56.4
|
|
|||||
|
Purchases
|
—
|
|
—
|
|
—
|
|
—
|
|
—
|
|
||||||||||
|
Net realized and unrealized (losses) gains
|
(.4
|
)
|
(5)
|
(9.7
|
)
|
(7.5
|
)
|
8.4
|
|
(8.8
|
)
|
|||||||||
|
Transfers in (out)
|
—
|
|
—
|
|
—
|
|
—
|
|
—
|
|
||||||||||
|
Sales/settlements
|
—
|
|
(6.5
|
)
|
(9.8
|
)
|
(11.2
|
)
|
(27.5
|
)
|
||||||||||
|
Balance at December 31, 2015
|
$
|
.3
|
|
$
|
2.7
|
|
$
|
16.5
|
|
$
|
.9
|
|
$
|
20.1
|
|
|||||
|
Variable Annuity
(Liabilities)
|
Derivative Instruments
|
|||||||||||||||||||
|
Millions
|
Level 3
|
Level 3
(1)(6)
|
Level 2
(1)(2)
|
Level 1
(3)
|
Total
(4)
|
|||||||||||||||
|
Balance at January 1, 2014
|
$
|
(52.8
|
)
|
$
|
63.4
|
|
$
|
4.7
|
|
$
|
1.1
|
|
$
|
69.2
|
|
|||||
|
Purchases
|
—
|
|
—
|
|
—
|
|
—
|
|
—
|
|
||||||||||
|
Net realized and unrealized gains (losses)
|
53.5
|
|
(5)
|
(38.6
|
)
|
(71.0
|
)
|
37.2
|
|
(72.4
|
)
|
|||||||||
|
Transfers in (out)
|
—
|
|
—
|
|
—
|
|
—
|
|
—
|
|
||||||||||
|
Sales/settlements
|
—
|
|
(5.9
|
)
|
100.1
|
|
(34.6
|
)
|
59.6
|
|
||||||||||
|
Balance at December 31, 2014
|
$
|
.7
|
|
$
|
18.9
|
|
$
|
33.8
|
|
$
|
3.7
|
|
$
|
56.4
|
|
|||||
|
(1)
|
Consists of over-the-counter instruments.
|
|
(2)
|
Consists of interest rate swaps, total return swaps, foreign currency forward contracts, and bond forwards. Fair value measurement based upon bid/ask pricing quotes for similar instruments that are actively traded, where available. Swaps for which an active market does not exist have been priced using observable inputs including the swap curve and the underlying bond index.
|
|
(3)
|
Consists of exchange traded equity index, foreign currency and interest rate futures. Fair value measurements based upon quoted prices for identical instruments that are actively traded.
|
|
(4)
|
In addition to derivative instruments, WM Life Re held cash, short-term and fixed maturity investments of
$0.0
,
$5.8
and
$33.2
as of
December 31, 2016, 2015 and 2014
posted as collateral to its reinsurance counterparties.
|
|
(5)
|
There was no changes in the fair value of variable annuity death benefit liabilities for the years ended December 31, 2016 and December 31, 2015. In 2014,
$0.6
related to the change in
the fair value of variable annuity death benefit liabilities, which are included in general and administrative expenses.
|
|
(6)
|
Consists of foreign currency options and equity options.
|
F-60
In addition to derivative instruments, WM Life Re held cash and fixed maturity investments posted as collateral to its variable annuity reinsurance counterparties. The total collateral includes the following:
|
December 31,
|
||||||||
|
Millions
|
2016
|
2015
|
||||||
|
Cash
|
$
|
—
|
|
$
|
5.8
|
|
||
|
Fixed maturity investments
|
—
|
|
—
|
|
||||
|
Total
|
$
|
—
|
|
$
|
5.8
|
|
||
Collateral in the form of fixed maturity securities consisted of Government of Japan Bonds, recorded at fair value. Collateral in the form of short-term investments consisted of money-market instruments, carried at amortized cost, which approximated fair value.
All of White Mountains’s variable annuity reinsurance liabilities were classified as Level 3 measurements. The fair value of White Mountains’s variable annuity reinsurance liabilities were estimated using actuarial and capital market assumptions related to the projected discounted cash flows over the term of the reinsurance agreement. Actuarial assumptions regarding future policyholder behavior, including surrender and lapse rates, were generally unobservable inputs and significantly impacted the fair value estimates. Generally, the liabilities associated with these guarantees increased with declines in the equity markets, interest rates and currencies against the Japanese yen, as well as with increases in market volatilities. White Mountains used derivative instruments to mitigate the risks associated with changes in the fair value of the reinsured variable annuity guarantees. The types of inputs used to estimate the fair value of these derivative instruments, with the exception of actuarial assumptions regarding policy holder behavior and risk margins, were generally the same as those used to estimate the fair value of variable annuity liabilities. There were no open derivatives instruments remaining as of December 31, 2016.
WM Life Re entered into both over-the-counter (“OTC”) and exchange traded derivative instruments to economically hedge the liability from the variable annuity benefit guarantee. In the case of OTC derivatives, WM Life Re had exposure to credit risk for amounts that were uncollateralized by counterparties. WM Life Re’s internal risk management guidelines established net counterparty exposure thresholds that took into account OTC counterparties’ credit ratings. The OTC derivative contracts were subject to restrictions on liquidation of the instruments and distribution of proceeds under collateral agreements. In the case of exchange traded instruments, WM Life Re had exposure to credit risk for amounts uncollateralized by margin balances. WM Life Re had master netting agreements with certain of its counterparties whereby the collateral provided (held) was calculated on a net basis. The following summarizes amounts offset under master netting agreements:
|
December 31, 2015
|
||||||||||||
|
Millions
|
Gross asset amounts before offsets
(1)
|
Gross liability amounts offset under master netting arrangements
|
Net amounts recognized in Other Assets
|
|||||||||
|
Interest rate contracts
|
||||||||||||
|
OTC
|
$
|
2.4
|
|
$
|
(2.1
|
)
|
$
|
.3
|
|
|||
|
Exchange traded
|
.1
|
|
(.1
|
)
|
—
|
|
||||||
|
Foreign exchange contracts
|
||||||||||||
|
OTC
|
15.0
|
|
—
|
|
15.0
|
|
||||||
|
Exchange traded
|
.1
|
|
(.3
|
)
|
(.2
|
)
|
||||||
|
Equity contracts
|
||||||||||||
|
OTC
|
4.4
|
|
(.6
|
)
|
3.8
|
|
||||||
|
Exchange traded
|
1.2
|
|
—
|
|
1.2
|
|
||||||
|
Total
(2)
|
$
|
23.2
|
|
$
|
(3.1
|
)
|
$
|
20.1
|
|
|||
(1)
Amount equal to fair value of instrument as recognized in other assets.
(2)
All derivative instruments held by WM Life Re were subject to master netting arrangements.
F-61
There were no open derivative instruments as of December 31, 2016 and no exposure to credit losses on OTC and exchanged traded derivatives as of that date. The following summarizes the value, collateral held or provided by WM Life Re and net exposure to credit losses on OTC and exchange traded derivative instruments by counterparty recorded within other assets as of December 31, 2015:
|
December 31, 2015
|
|||||||||||||||||||||||||||||||||||
|
Millions
|
Net amount of assets reflected in Balance Sheet
|
Collateral provided to counterparty - Cash
|
Collateral provided to counter-party - Financial Instruments
|
Net amount of exposure after effect of collateral provided
|
Excess collateral provided to counter-party- Cash
|
Excess collateral provided - Financial Instruments
|
Counter-party collateral held by WM Life Re- Cash
|
Net amount of exposure to counter-party
|
Standard
& Poor's
Rating
(1)
|
||||||||||||||||||||||||||
|
JP Morgan
|
$
|
8.5
|
|
$
|
—
|
|
$
|
—
|
|
$
|
8.5
|
|
$
|
—
|
|
$
|
—
|
|
$
|
5.5
|
|
$
|
3.0
|
|
A
|
+
|
|||||||||
|
Bank of America
|
.7
|
|
$
|
—
|
|
—
|
|
.7
|
|
$
|
—
|
|
—
|
|
—
|
|
.7
|
|
A
|
|
|||||||||||||||
|
Citigroup - OTC
|
9.9
|
|
—
|
|
—
|
|
9.9
|
|
—
|
|
—
|
|
1.4
|
|
8.5
|
|
A
|
||||||||||||||||||
|
Citigroup - Exchange Traded
|
1.0
|
|
—
|
|
—
|
|
1.0
|
|
5.8
|
|
—
|
|
—
|
|
6.8
|
|
A
|
||||||||||||||||||
|
Total
|
$
|
20.1
|
|
$
|
—
|
|
$
|
—
|
|
$
|
20.1
|
|
$
|
5.8
|
|
$
|
—
|
|
$
|
6.9
|
|
$
|
19.0
|
|
|||||||||||
|
(1)
|
Standard & Poor’s ratings as detailed above are: “A+” (Strong, which is the fifth highest of
twenty-three
creditworthiness ratings),“A” (which is the sixth highest of
twenty-three
creditworthiness ratings), “A-” (which is the seventh highest of
twenty-three
creditworthiness ratings), and BBB+ (which is the eighth highest of
twenty-three
creditworthiness ratings).
|
Forward Contracts
White Mountains holds investment grade fixed maturity investments denominated in British Pound Sterling (“GBP”). In October 2016, White Mountains entered into a foreign currency forward contract to manage its GBP foreign currency exposure. The contract does not meet the criteria to be accounted for as a hedge. White Mountains monitors its exposure to foreign currency and adjusts its foreign currency position within the risk guidelines and ranges established by senior management. While White Mountains actively manages its foreign currency position, mismatches between movements in foreign currency rates and its foreign currency forward contract may result in foreign currency positions being outside pre-defined ranges and/or foreign currency losses. At December 31, 2016, White Mountains held
$184.6 million
(GBP
150.0 million
) total gross notional value of a foreign currency forward contract.
White Mountains’s foreign currency forward contract is traded over-the-counter. The fair value of the contract has been estimated using OTC quotes for similar instruments and accordingly, the measurements have been classified as Level 2 measurements at
December 31, 2016
.
The net realized and unrealized derivative gains (losses) recognized in net realized and unrealized investment gains (losses) for the year ended December 31, 2016 was $
(1.2) million
. White Mountains’s forward contract is subject to a master netting agreement. As of December 31, 2016, the gross liability amount offset under the master netting agreement and the net amount recognized in other long-term investments was $
(1.2) million
.
White Mountains does not hold or provide any collateral under its forward contract. The following table summarizes the notional amount and the uncollateralized balance associated with the forward currency contract:
|
December 31, 2016
|
||||||||||
|
Millions
|
Notional Amount
|
Carrying Value
|
Standard & Poor's
Rating
(1)
|
|||||||
|
Barclays Bank PLC
|
$
|
184.6
|
|
$
|
(1.2
|
)
|
A-
|
|||
(1)
Standard & Poor’s ratings “A-” (Strong, which is the ninth highest of twenty-one creditworthiness ratings).
F-62
In 2012, HG Global was capitalized with
$594.5 million
from White Mountains and
$14.5 million
from non-controlling interests to fund BAM, a newly formed mutual municipal bond insurer. As of
December 31, 2016
, White Mountains owned
96.9%
of HG Global’s preferred equity and
88.4%
of its common equity. HG Global, together with its subsidiaries, provided the initial capitalization of BAM through the purchase of
$503.0 million
of BAM Surplus Notes. HG Global provides first loss reinsurance protection for policies underwritten by BAM of up to
15%
of par outstanding on a per policy basis through HG Re, which had statutory capital and surplus of
$467.2 million
and
$452.9 million
as of
December 31, 2016
and 2015. HG Re’s obligations to BAM are collateralized in trusts, and there is an aggregate loss limit that is equal to the total assets in the collateral trusts at any point in time. At December 31, 2016 and 2015, the collateral trusts held assets of
$465.4 million
and
$441.0 million
, which included
$300 million
of BAM Surplus Notes. As of
December 31, 2016 and 2015
, HG Global had pre-tax income of
$22.2 million
and
$17.9 million
, which included
$17.8 million
and
$15.8 million
of interest income on the BAM Surplus Notes. As of
December 31, 2016 and 2015
, BAM had a pre-tax loss of
$48.9 million
and
$47.3 million
that was recorded in net loss attributable to non-controlling interests, which included
$17.8 million
and
$15.8 million
of interest expense on the BAM Surplus Notes. As of December 31, 2016, HG Global has accrued
$108.0 million
of interest receivable on the BAM Surplus Notes.
The following table provides a schedule of BAM’s insured obligations:
|
December 31, 2016
|
December 31, 2015
|
|||||||
|
Contracts outstanding
|
4,807
|
|
3,103
|
|
||||
|
Remaining weighted average contract period (in years)
|
10.8
|
|
12.8
|
|
||||
|
Contractual debt service outstanding (in millions):
|
||||||||
|
Principal
|
$
|
33,057.3
|
|
$
|
22,556.0
|
|
||
|
Interest
|
$
|
16,396.6
|
|
$
|
11,984.4
|
|
||
|
Gross unearned insurance premiums
|
$
|
83.0
|
|
$
|
50.2
|
|
||
The following table is a schedule of BAM’s expected premiums to be collected as of
December 31, 2016
:
|
Millions
|
December 31, 2016
|
|||
|
January 1, 2017 - March 31, 2017
|
$
|
1.9
|
|
|
|
April 1, 2017 - June 30, 2017
|
1.8
|
|
||
|
July 1, 2017 - September 30, 2017
|
1.8
|
|
||
|
October 1, 2017 - December 31, 2017
|
1.8
|
|
||
|
7.3
|
|
|||
|
2018
|
7.0
|
|
||
|
2019
|
6.6
|
|
||
|
2020
|
6.3
|
|
||
|
2021
|
5.9
|
|
||
|
2022 and thereafter
|
49.9
|
|
||
|
Total
|
$
|
83.0
|
|
|
F-63
Basic earnings per share amounts are based on the weighted average number of common shares outstanding including unvested restricted shares that are considered participating securities. Diluted earnings per share amounts are based on the weighted average number of common shares including unvested restricted shares and the net effect of potentially dilutive common shares outstanding. The following table outlines the Company’s computation of earnings per share from continuing operations for the years ended
December 31, 2016, 2015 and 2014
. See
Note 22
—
“Held for Sale and Discontinued Operations”
for earnings per share amounts for discontinued operations.
|
Year Ended December 31,
|
||||||||||||
|
2016
|
2015
|
2014
|
||||||||||
|
Basic and diluted earnings per share numerators (in millions):
|
|
|
|
|
|
|
||||||
|
Net income from continuing operations attributable to
White Mountains’s common shareholders
|
$
|
(2.3
|
)
|
$
|
200.7
|
|
$
|
53.2
|
|
|||
|
Allocation of income for unvested restricted common shares
(1)
|
—
|
|
(2.3
|
)
|
(0.7
|
)
|
||||||
|
Dividends declared on participating restricted common shares
(1)
|
—
|
|
(.1
|
)
|
(.1
|
)
|
||||||
|
Total allocation to restricted common shares
|
—
|
|
(2.4
|
)
|
(0.8
|
)
|
||||||
|
Net income attributable to White Mountains’s common shareholders,
net of restricted share amounts |
$
|
(2.3
|
)
|
$
|
198.3
|
|
$
|
52.4
|
|
|||
|
Undistributed net earnings (in millions):
|
||||||||||||
|
Net income attributable to White Mountains’s common shareholders,
net of restricted common share amounts |
$
|
(2.3
|
)
|
$
|
198.3
|
|
$
|
52.4
|
|
|||
|
Dividends declared net of restricted common share amounts
(1)
|
(5.4
|
)
|
(5.9
|
)
|
(6.1
|
)
|
||||||
|
Total undistributed net earnings, net of restricted common share amounts
|
$
|
(7.7
|
)
|
$
|
192.4
|
|
$
|
46.3
|
|
|||
|
Basic earnings per share denominators (in thousands):
|
||||||||||||
|
Total average common shares outstanding during the period
|
5,014.9
|
|
5,879.2
|
|
6,104.9
|
|
||||||
|
Average unvested restricted common shares
(2)
|
(64.8
|
)
|
(68.0
|
)
|
(78.9
|
)
|
||||||
|
Basic earnings per share denominator
|
4,950.1
|
|
5,811.2
|
|
6,026.0
|
|
||||||
|
Diluted earnings per share denominator (in thousands):
|
||||||||||||
|
Total average common shares outstanding during the period
|
5,018.1
|
|
5,879.2
|
|
6,104.9
|
|
||||||
|
Average unvested restricted common shares
(2)
|
(64.8
|
)
|
(68.0
|
)
|
(78.9
|
)
|
||||||
|
Diluted earnings per share denominator
(3)
|
4,953.3
|
|
5,811.2
|
|
6,026.0
|
|
||||||
|
Basic earnings per share (in dollars):
|
||||||||||||
|
Net income attributable to White Mountains’s common shareholders
|
$
|
(0.47
|
)
|
$
|
34.12
|
|
$
|
8.70
|
|
|||
|
Dividends declared and paid
|
(1.00
|
)
|
(1.00
|
)
|
(1.00
|
)
|
||||||
|
Undistributed (loss) earnings
|
$
|
(1.47
|
)
|
$
|
33.12
|
|
$
|
7.70
|
|
|||
|
Diluted earnings per share (in dollars)
|
||||||||||||
|
Net income attributable to White Mountains’s common shareholders
|
$
|
(0.47
|
)
|
$
|
34.12
|
|
$
|
8.70
|
|
|||
|
Dividends declared and paid
|
(1.00
|
)
|
(1.00
|
)
|
(1.00
|
)
|
||||||
|
Undistributed (loss) earnings
|
$
|
(1.47
|
)
|
$
|
33.12
|
|
$
|
7.70
|
|
|||
|
(1)
|
Restricted shares issued by White Mountains receive dividends, and therefore, are considered participating securities.
|
|
(2)
|
Restricted common shares outstanding vest either in equal annual installments or upon a stated date. See
Note 13 — “Employee Share-Based Incentive Compensation Plans”
.
|
|
(3)
|
The diluted earnings (loss) per share denominator for the year ended December 31, 2016, includes the impact of
40,000
common shares issuable upon exercise of the non-qualified options outstanding, which results in
3,217
incremental shares outstanding over the period. Prior periods do not include the impact of
125,000
common shares issuable upon exercise of the non-qualified options outstanding as they are anti-dilutive to the calculation.
|
F-64
OneBeacon previously sponsored the OneBeacon qualified pension plan (the “Qualified Plan”). During the year ended December 31, 2016, the Qualified Plan finalized its termination by purchasing group annuity contracts from the Principal Financial Group (“Principal”), and making lump sum distributions to Qualified Plan participants electing such payments, which eliminated the remaining Qualified Plan liability and also ceased administratively paying benefits. During the year ended December 31, 2016, OneBeacon recognized an estimated pre-tax pension settlement gain of
$3.0 million
, primarily resulting from a refund from Principal related to the final settlement of the Qualified Plan. As of December 31, 2016, OneBeacon no longer has a projected benefit obligation with respect to the Qualified Plan. During the year ended December 31, 2016, OneBeacon transferred
$47.1 million
of excess invested assets from the Qualified Plan into the trust supporting the OneBeacon 401(k) Savings and Employee Stock Ownership Plan (“KSOP”), which OneBeacon determined to be the Qualified Replacement Plan (“QRP”). See
Note 13 — “Employee Share-Based Incentive Compensation Plans”
. As of December 31, 2016, an additional
$13.0 million
of excess invested assets remain in the Qualified Plan trust for potential post-termination obligations of that plan, as approved by a March 2016 private letter ruling from the IRS. The invested assets related to both the Qualified Plan and the QRP are included in other assets and are accounted for at fair value with related income recognized in net other revenues (expenses).
OneBeacon continues to sponsor a non-qualified, non-contributory, defined benefit pension plan (“Non-qualified Plan”) covering certain employees who were employed as of December 31, 2001 and former employees who had met the eligibility requirements, as well as retirees. The Non-qualified Plan was frozen and curtailed in 2002, resulting in the pension benefit obligation being equal to the accumulated benefit obligation. The benefits are based primarily on years of service and employees’ compensation through December 31, 2002. OneBeacon’s funding policy is generally to contribute amounts to satisfy actual disbursements for the calendar year. There are no regulatory funding requirements that apply to the Non-qualified Plan.
The following tables set forth the obligations and funded status, assumptions, plan assets and cash flows associated with the Plans as of
December 31, 2016 and 2015
:
|
Pension Benefits
December 31,
|
||||||||
|
Millions
|
2016
|
2015
|
||||||
|
Change in projected benefit obligation:
|
|
|
|
|
||||
|
Projected benefit obligation at beginning of year
|
$
|
109.5
|
|
$
|
119.7
|
|
||
|
Service cost
|
.2
|
|
.9
|
|
||||
|
Interest cost
|
1.5
|
|
4.6
|
|
||||
|
Settlement loss (gain) on projected benefit obligation
(1)(2)
|
1.2
|
|
(1.8
|
)
|
||||
|
Assumption changes
|
(.9
|
)
|
(3.5
|
)
|
||||
|
Actuarial loss
|
.4
|
|
.9
|
|
||||
|
Annuity contract purchases related to termination of Qualified Plan
(3)
|
(69.0
|
)
|
—
|
|
||||
|
Benefits, including lump sum payments, and expenses paid with plan assets
(3)
|
(17.0
|
)
|
(13.7
|
)
|
||||
|
Benefits paid directly by OneBeacon
|
(2.1
|
)
|
(2.2
|
)
|
||||
|
Remeasurement due to plan termination
(4)
|
—
|
|
4.6
|
|
||||
|
Projected benefit obligation at end of year
|
$
|
23.8
|
|
$
|
109.5
|
|
||
|
Change in plan assets:
|
|
|
|
|
||||
|
Fair value of plan assets at beginning of year
|
$
|
139.8
|
|
$
|
146.0
|
|
||
|
Actual return on plan assets
|
6.3
|
|
7.5
|
|
||||
|
Annuity contract purchases related to termination of Qualified Plan
(3)
|
(69.0
|
)
|
—
|
|
||||
|
Transfer of assets to the QRP
(5)
|
(47.1
|
)
|
—
|
|
||||
|
Benefits and expenses paid
|
(17.0
|
)
|
(13.7
|
)
|
||||
|
Fair value of plan assets at end of year
|
$
|
13.0
|
|
$
|
139.8
|
|
||
|
(Unfunded) over funded status at end of year
|
$
|
(10.8
|
)
|
$
|
30.3
|
|
||
(1)
During the year ended December 31, 2016, OneBeacon recognized a
$1.2 million
settlement loss primarily resulting from final settlement of the Qualified Plan.
(2)
During the fourth quarter of 2015, OneBeacon triggered settlement accounting for the Qualified Plan as the total lump sum payments exceeded the service plus interest costs, resulting in a
$1.8
adverse effect on accumulated other comprehensive income.
(3)
During the year ended December 31, 2016, the Qualified Plan finalized its termination by purchasing group annuity contracts for
$69.0 million
from Principal and making lump sum distributions, included in the
$17.0 million
above, to Qualified Plan participants electing such payments.
(4)
As of December 31, 2015, the projected benefit obligation was valued on a plan termination basis.
(5)
During the year ended December 31, 2016, OneBeacon transferred excess invested assets from the Qualified Plan after its termination into the trust supporting the QRP.
F-65
The unfunded status of the consolidated pension plans as of
December 31, 2016
was
$10.8 million
, which includes
$13.0 million
of excess invested assets remaining in the Qualified Plan trust for potential post-termination obligations of that plan and an under-funding of
$23.8 million
related to the Non-qualified Plan. The Non-qualified Plan, which is unfunded, does not hold any assets. OneBeacon has set aside
$20.6 million
in an irrevocable rabbi trust for the benefit of Non-qualified Plan participants. Assets held in the rabbi trust are not reflected in the unfunded status of the consolidated pension plans as presented but are included in other assets in the consolidated balance sheet.
During the year ended December 31, 2016, OneBeacon transferred $47.1 million of excess invested assets from the Qualified Plan into the QRP. Amounts recognized in the financial statements as of
December 31, 2016 and 2015
consist of:
|
December 31,
|
||||||||
|
Millions
|
2016
|
2015
|
||||||
|
Net balance sheet asset recorded in other assets
|
$
|
13.0
|
|
$
|
55.8
|
|
||
|
Net balance sheet liability recorded in other liabilities
|
(23.8
|
)
|
(25.5
|
)
|
||||
|
Net amount recognized in the financial statements
|
$
|
(10.8
|
)
|
$
|
30.3
|
|
||
Information for the Non-qualified Plan, which had accumulated benefit obligations in excess of plan assets, was as follows:
|
December 31,
|
||||||||
|
Millions
|
2016
|
2015
|
||||||
|
Projected benefit obligation
|
$
|
23.8
|
|
$
|
25.5
|
|
||
|
Accumulated benefit obligation
|
$
|
23.8
|
|
$
|
25.5
|
|
||
|
Fair value of plan assets
|
$
|
—
|
|
$
|
—
|
|
||
During the year ended December 31, 2016, information for the Qualified Plan, which had accumulated benefit obligations less than plan assets until its termination, was finalized. Information for the Qualified Plan was as follows:
|
December 31,
|
|||||||||
|
Millions
|
2016
|
2015
|
|||||||
|
Projected benefit obligation
|
$
|
—
|
|
$
|
84.0
|
|
(1)
|
||
|
Accumulated benefit obligation
|
$
|
—
|
|
$
|
84.0
|
|
(1)
|
||
|
Fair value of plan net assets
|
$
|
13.0
|
|
$
|
139.8
|
|
|||
(1)
Measured on a plan termination basis
The amounts recognized in accumulated other comprehensive loss on a pre-tax basis and before non-controlling interest for the years ended
December 31, 2016 and 2015
were as follows:
|
December 31,
|
||||||||
|
Millions
|
2016
|
2015
|
||||||
|
Accumulated other comprehensive loss beginning balance
|
$
|
(8.0
|
)
|
$
|
(8.0
|
)
|
||
|
Increase (decrease) in accumulated other comprehensive loss:
|
|
|
|
|
||||
|
Amortization of net actuarial gains recognized during the year
|
1.3
|
|
1.3
|
|
||||
|
Net actuarial gains (losses) occurring during the year
(1)
|
3.2
|
|
(1.3
|
)
|
||||
|
Qualified Plan termination impact
(2)
|
(3.0
|
)
|
—
|
|
||||
|
Accumulated other comprehensive loss ending balance
|
$
|
(6.5
|
)
|
$
|
(8.0
|
)
|
||
|
(1)
|
Net actuarial gains in 2016 resulted from investment returns and demographic experience different than assumed. The 2015 net actuarial losses reflect the valuation of the Qualified Plan on a termination basis.
|
|
(2)
|
During the year ended December 31, 2016, OneBeacon recognized a $
3.0 million
gain resulting from the final settlement of the Qualified Plan.
|
The amount in accumulated other comprehensive loss, on a pre-tax basis, that has not yet been recognized as a component of net periodic benefit cost for the year ended
December 31, 2016
is attributable to net losses. During 2017, OneBeacon expects
$0.9 million
will be amortized from accumulated other comprehensive loss into net periodic benefit cost.
F-66
The components of net periodic benefit cost (income) for the years ended
December 31, 2016, 2015 and 2014
were as follows:
|
Year Ended December 31,
|
||||||||||||
|
Millions
|
2016
|
2015
|
2014
|
|||||||||
|
Service cost
|
$
|
.2
|
|
$
|
.9
|
|
$
|
.6
|
|
|||
|
Interest cost
|
1.5
|
|
4.6
|
|
4.7
|
|
||||||
|
Expected return on plan assets
|
(1.0
|
)
|
(8.7
|
)
|
(8.5
|
)
|
||||||
|
Amortization of net actuarial losses
|
1.3
|
|
1.3
|
|
.3
|
|
||||||
|
Net periodic pension (cost) income before special termination benefits
|
2.0
|
|
(1.9
|
)
|
(2.9
|
)
|
||||||
|
Settlement gain
(1)
|
(3.0
|
)
|
—
|
|
—
|
|
||||||
|
Special termination benefits expense
(2)
|
—
|
|
—
|
|
.3
|
|
||||||
|
Total net periodic benefit income
|
$
|
(1.0
|
)
|
$
|
(1.9
|
)
|
$
|
(2.6
|
)
|
|||
(1)
Represents the impact of the termination of the Qualified Plan during the year ended December 31, 2016.
(2)
Special termination benefits represent additional payments made from the Qualified Plan to certain vested participants when their employment was terminated due to a reduction in force.
Assumptions
The weighted average discount rate assumptions used to determine benefit obligations was
3.78%
and
3.22%
as of
December 31, 2016 and 2015
. The weighted average assumptions used to determine net periodic benefit cost included a
3.88%
discount rate and
3.00%
expected long-term rate of return on plan assets for the year ended
December 31, 2016
. The weighted average assumptions used to determine net periodic benefit cost included a
3.91%
discount rate and
6.00%
expected long-term rate of return on plan assets for the year ended
December 31, 2015
.
OneBeacon’s discount rate assumptions used to account for the Plans reflect the rates at which the benefit obligations could be effectively settled. In addition to consideration of published yields for high quality long-term corporate bonds, U.S. Treasuries and insurance company annuity contract pricings, consideration was given to cash flow matching analyses.
OneBeacon performed an analysis of expected long-term rates of return based on the allocation of its Qualified Plan assets as of December 31, 2015 and 2014 to develop expected rates of return for 2016 and 2015 for each significant asset class or economic indicator. A range of returns was developed based both on forecasts and on broad market historical benchmarks for expected return, correlation, and volatility for each asset class. During 2015, OneBeacon changed the asset allocation to more fixed income and shorter duration in anticipation of the plan termination, which resulted in a decrease in this assumption as compared to the prior year.
Plan
Assets
The remaining assets of the Qualified Plan, which are managed internally by OneBeacon and consist substantially of common equity securities tracking the S&P 500 and Russell 1000 indices, are held for potential post-termination obligations of the plan, as approved by a March 2016 private letter ruling from the IRS. The Qualified Plan's investments are stated at fair value.
The fair value of the Qualified Plan’s assets and their related inputs as of
December 31, 2016 and 2015
by asset category were as follows:
|
December 31, 2016
|
December 31, 2015
|
|||||||||||||||||||||||||||||||
|
Millions
|
Fair
Value
(1)
|
Level 1
Inputs
|
Level 2
Inputs
|
Level 3
Inputs
|
Fair
Value
|
Level 1
Inputs
|
Level 2
Inputs
|
Level 3
Inputs
|
||||||||||||||||||||||||
|
Common equity securities
|
$
|
12.8
|
|
$
|
12.8
|
|
$
|
—
|
|
$
|
—
|
|
$
|
—
|
|
$
|
—
|
|
$
|
—
|
|
$
|
—
|
|
||||||||
|
Fixed maturity investments
|
—
|
|
—
|
|
—
|
|
—
|
|
132.4
|
|
132.4
|
|
—
|
|
—
|
|
||||||||||||||||
|
Short-term investments
|
—
|
|
—
|
|
—
|
|
—
|
|
7.0
|
|
7.0
|
|
—
|
|
—
|
|
||||||||||||||||
|
Total
|
$
|
12.8
|
|
$
|
12.8
|
|
$
|
—
|
|
$
|
—
|
|
$
|
139.4
|
|
$
|
139.4
|
|
$
|
—
|
|
$
|
—
|
|
||||||||
(1)
Excludes cash and short-term investments
There were no transfers between Levels 1, 2 or 3 during the years ended
December 31, 2016
and
2015
.
F-67
The Qualified Plan’s asset allocations as of
December 31, 2016 and 2015
, by asset category were as follows:
|
Plan Assets at
December 31,
|
||||||
|
Asset Category
|
2016
|
2015
|
||||
|
Common equity securities
|
98.5
|
%
|
—
|
%
|
||
|
Fixed maturity investments
|
—
|
|
95.0
|
|
||
|
Cash and short-term investments
|
1.5
|
|
5.0
|
|
||
|
Total
|
100.0
|
%
|
100.0
|
%
|
||
Cash Flows
OneBeacon anticipates contributing
$2.1 million
to the Non-qualified Plan in 2017, for which OneBeacon has assets held in a rabbi trust.
The following benefit payments, which reflect expected future service, as appropriate, are expected to be paid:
|
Millions
|
Expected Benefit Payments
|
|||
|
2017
|
$
|
2.1
|
|
|
|
2018
|
2.1
|
|
||
|
2019
|
2.0
|
|
||
|
2020
|
2.0
|
|
||
|
2021
|
1.9
|
|
||
|
2022 - 2026
|
8.4
|
|
||
Other Benefit Plans
OneBeacon sponsors a defined contribution plan, the OneBeacon 401(k) Savings and KSOP, covering the majority of its employees. The contributory plan provides qualifying employees with matching contributions of
50%
up to the first
6%
of salary (subject to U.S. federal limits on allowable contributions in a given year). During 2016, the matching contribution of the contributory plan was replaced with a fixed
3%
of salary employer contribution (subject to federal limits on allowable contributions in a given year). The total expense for employer contributions to the plan was
$3.2 million
,
$3.0 million
and
$2.7 million
in
2016, 2015 and 2014
.
The employee stock ownership component of the KSOP provides all of its participants with an annual base contribution in common shares equal to
3%
of their salary, up to the applicable Social Security wage base (
$118,500
for
2016
). Additionally, those participants not otherwise eligible to receive certain other OneBeacon benefits can earn a variable contribution of up to
6%
of their salary, subject to the applicable IRS annual covered compensation limits (
$265,000
for
2016
) and contingent upon OneBeacon’s performance. White Mountains recorded
$5.5 million
,
$5.7 million
and
$4.4 million
in compensation expense to pay benefits and allocate common shares to participant’s accounts for the years ended
2016, 2015 and 2014
.
OneBeacon had a post-employment benefit liability, which primarily relates to disability and health benefits available to former employees, of
$3.1 million
and
$4.1 million
as of
December 31, 2016 and 2015
.
OneBeacon also had a post-employment benefit liability related to death benefits to beneficiaries of former executives of
$12.8 million
and
$12.5 million
as of
December 31, 2016 and 2015
. OneBeacon has set aside funds to satisfy its obligation in a rabbi trust of
$29.3 million
and
$33.9 million
as of
December 31, 2016 and 2015
. During 2016, OneBeacon withdrew
$5.5 million
from the rabbi trust in accordance with the trust agreement, which remains overfunded.
F-68
White Mountains’s share-based incentive compensation plans are designed to incentivize key employees and service providers to maximize shareholder value over long periods of time. White Mountains believes that this is best pursued by utilizing a pay-for-performance program that closely aligns the financial interests of management with those of its shareholders. White Mountains accomplishes this by emphasizing highly variable long-term compensation that is contingent on performance over a number of years rather than entitlements. White Mountains expenses all its share-based compensation. As a result, White Mountains’s calculation of its owners’ returns includes the expense of all outstanding share-based compensation awards.
Incentive Compensation Plans
White Mountains’s Long-Term Incentive Plan (the “WTM Incentive Plan”) provides for grants of various types of share-based and non-share-based incentive awards to key employees and service providers of White Mountains. The WTM Incentive Plan was adopted by the Board, was approved by the Company’s sole shareholder in 1985 and was subsequently amended by its shareholders in 1995, 2001, 2003, 2005, 2010 and 2013. Share-based incentive awards that may be granted under the plan include performance shares, restricted shares, incentive stock options and non-qualified stock options (“Non-Qualified Options”). Performance shares are conditional grants of a specified maximum number of common shares or an equivalent amount of cash. Awards generally vest at the end of a
three
-year period, are subject to the attainment of pre-specified performance goals, and are valued based on the market value of common shares at the time awards are paid. Performance shares earned under the WTM Incentive Plan are typically paid in cash but may be paid in common shares. Compensation expense is recognized on a pro rata basis over the vesting period of the awards.
The OneBeacon Long-Term Incentive Plan (the “OneBeacon Incentive Plan”) provides for grants to key employees of OneBeacon various types of share-based incentive awards, including performance shares, restricted shares, restricted stock units and Non-Qualified Options.
White Mountains offers certain types of share-based compensation under qualified retirement plans. The defined contribution plan sponsored by OneBeacon, the OneBeacon 401(k) Savings and Employee Stock Ownership Plan (“KSOP”), offers U.S. domiciled participants the ability to invest their balances in several different investment options, including the common shares of the Company or OneBeacon.
The employee stock ownership component of the KSOP provides all participants with an annual base contribution in common shares of the Company or OneBeacon, depending on their employer, equal to
3%
of their salary, up to the applicable Social Security wage base (
$118,500
for
2016
). Additionally, those participants not otherwise eligible to receive certain other benefits can earn a variable contribution of up to
6%
of their salary, subject to the applicable IRS annual covered compensation limits (
$265,000
for
2016
) and contingent upon the Company’s or OneBeacon’s performance.
Performance Shares
Performance shares are designed to reward company-wide performance. The level of payout ranges from
zero
to
two
times the number of shares initially granted, depending on White Mountains’s financial performance. Performance shares become payable at the conclusion of a performance cycle (typically
three
years) if pre-defined financial targets are met.
The principal performance measure used for determining performance share payouts is after-tax growth in White Mountains’s intrinsic business value per share. The Compensation Committee historically has considered the growth in intrinsic business value per share to be based equally on the growth of economic value per share and growth in adjusted book value per share, both inclusive of dividends. Economic value is calculated by adjusting the GAAP book value per share for differences between the GAAP carrying values of certain assets and liabilities and White Mountains’s estimate of their underlying economic values (for example, the time value discount in loss reserves).
F-69
The following summarizes performance share activity for the years ended
December 31, 2016, 2015 and 2014
for performance shares granted under the WTM Incentive Plan:
|
Year Ended December 31,
|
|||||||||||||||||||||
|
2016
|
2015
|
2014
|
|||||||||||||||||||
|
$ in millions
|
Target
Performance
Shares
Outstanding
|
Accrued
Expense
|
Target
Performance
Shares
Outstanding
|
Accrued
Expense
|
Target
Performance
Shares
Outstanding
|
Accrued
Expense
|
|||||||||||||||
|
Beginning of period
|
93,654
|
|
$
|
57.7
|
|
111,257
|
|
$
|
44.4
|
|
108,605
|
|
$
|
54.9
|
|
||||||
|
Shares paid or expired
(1)
|
(36,294
|
)
|
(41.0
|
)
|
(42,959
|
)
|
(30.8
|
)
|
(33,730
|
)
|
(24.5
|
)
|
|||||||||
|
New grants
|
22,615
|
|
—
|
|
29,195
|
|
—
|
|
39,590
|
|
—
|
|
|||||||||
|
Assumed forfeitures and cancellations
(2)
|
378
|
|
.5
|
|
(3,839
|
)
|
(.3
|
)
|
(3,208
|
)
|
(.1
|
)
|
|||||||||
|
Expense recognized
|
—
|
|
25.2
|
|
—
|
|
44.4
|
|
—
|
|
14.1
|
|
|||||||||
|
End of period
(3)
|
80,353
|
|
$
|
42.4
|
|
93,654
|
|
$
|
57.7
|
|
111,257
|
|
$
|
44.4
|
|
||||||
|
(1)
|
WTM performance share payments in 2016 for the 2013-2015 performance cycle ranged from
140%
to
142%
of target. WTM performance shares payments in 2015 for the 2012-2014 performance cycle ranged from
91%
to
145.5%
of target. WTM performance shares payments in 2014 for the 2011-2013 performance cycle ranged from
88%
to
131.5%
of target.
|
|
(2)
|
Amounts include changes in assumed forfeitures, as required under GAAP.
|
|
(3)
|
Outstanding performance share awards as of December 31, 2016, 2015 and 2014 exclude
7,315
,
10,826
and
12,607
unvested performance shares awards for employees of Sirius Group.
|
For the 2013-2015 performance cycle, the Company issued common shares for
5,000
performance shares earned and all other performance shares earned were settled in cash. For the 2012-2014 performance cycle, all performance shares earned were settled in cash. For 2011-2013 performance cycle, the Company issued
3,570
performance shares earned and all performance shares earned were settled in cash.
If the outstanding WTM performance shares had vested on
December 31, 2016
, the total additional compensation cost to be recognized would have been
$23.1 million
, based on accrual factors as of
December 31, 2016
(common share price and payout assumptions).
Performance shares granted under the WTM Incentive Plan
The following table summarizes performance shares outstanding and accrued expense for performance shares awarded under the WTM Incentive Plan as of
December 31, 2016
for each performance cycle:
|
$ in millions
|
Target WTM
Performance Shares
Outstanding
|
Accrued Expense
|
|||||
|
Performance cycle:
|
|
|
|
|
|||
|
2016 – 2018
|
19,615
|
|
$
|
5.4
|
|
||
|
2015 – 2017
|
31,795
|
|
19.1
|
|
|||
|
2014 – 2016
|
30,167
|
|
18.6
|
|
|||
|
Sub-total
|
81,577
|
|
43.1
|
|
|||
|
Assumed forfeitures
|
(1,224
|
)
|
(.7
|
)
|
|||
|
Total at December 31, 2016
|
80,353
|
|
$
|
42.4
|
|
||
For the 2016-2018 performance cycle, the Compensation Committee will use its judgment to evaluate management’s performance by taking into account all facts the Compensation Committee deems relevant including the Company’s growth in intrinsic business value per share to determine the payout of the performance shares on a
0%
-
200%
scale.
For the 2015-2017 performance cycle, the targeted performance goal for full payment of outstanding performance shares granted under the WTM Incentive Plan to non-investment personnel is an
8%
growth in intrinsic business value per share. Growth of
2%
or less would result in no payout and growth of
14%
or more would result in a payout of
200%
.
F-70
For the 2014-2016 performance cycle, the targeted performance goal for full payment of outstanding performance shares granted under the WTM Incentive Plan to non-investment personnel is a
9%
growth in intrinsic business value per share. Growth of
3%
or less would result in no payout and growth of
15%
or more would result in a payout of
200%
.
For investment personnel, the targeted performance goal for full payment of outstanding performance shares granted under the WTM Incentive Plan is based one-third on growth in intrinsic business value per share (as described above), one-third on achieving a total return on invested assets as measured against metrics based on U.S. Treasury Note returns and one-third on achieving a total return on invested assets as measured against metrics based on the Bloomberg Barclays U.S. Intermediate Aggregate Index returns.
Restricted Shares
The following outlines the unrecognized compensation cost associated with the outstanding restricted share awards under the WTM Incentive Plan for the years ended
December 31, 2016, 2015 and 2014
:
|
Year Ended December 31,
|
|||||||||||||||||||||
|
2016
|
2015
|
2014
|
|||||||||||||||||||
|
$ in millions
|
Restricted
Shares
|
Unamortized
Issue Date Fair
Value
|
Restricted
Shares
|
Unamortized
Issue Date Fair
Value
|
Restricted
Shares
|
Unamortized
Issue Date Fair
Value
|
|||||||||||||||
|
Non-vested,
|
|||||||||||||||||||||
|
Beginning of period
|
70,675
|
|
$
|
15.7
|
|
83,314
|
|
$
|
14.3
|
|
94,130
|
|
$
|
17.0
|
|
||||||
|
Issued
|
25,365
|
|
20.2
|
|
23,640
|
|
15.7
|
|
23,440
|
|
13.1
|
|
|||||||||
|
Vested
|
(24,620
|
)
|
—
|
|
(36,279
|
)
|
—
|
|
(33,205
|
)
|
—
|
|
|||||||||
|
Forfeited
|
(800
|
)
|
(.3
|
)
|
—
|
|
—
|
|
(1,051
|
)
|
(.5
|
)
|
|||||||||
|
Expense recognized
|
—
|
|
(15.9
|
)
|
—
|
|
(14.3
|
)
|
—
|
|
(15.3
|
)
|
|||||||||
|
End of period
(1)
|
70,620
|
|
$
|
19.7
|
|
70,675
|
|
$
|
15.7
|
|
83,314
|
|
$
|
14.3
|
|
||||||
|
(1)
|
Outstanding restricted share awards as of December 31, 2016, 2015 and 2014 include
5,235
,
9,205
, and
12,477
unvested restricted shares for employees of Sirius Group.
|
During 2016, White Mountains issued
24,615
restricted shares that vest on January 1, 2019 and
750
restricted shares that vest on January 1, 2018. During 2015, White Mountains issued
23,640
restricted shares that vest on January 1, 2018. During 2014, White Mountains issued
23,440
restricted shares that vest on January 1, 2017. The unrecognized compensation cost as of
December 31, 2016
is expected to be recognized ratably over the remaining vesting periods.
Stock Options
Non-Qualified Options
As of December 31, 2016 and 2015, the Company’s Chairman and CEO held
40,000
and
125,000
Non-Qualified Options, which are exercisable at a fixed price of
$742
per common share and expire on January 20, 2017. During 2016,
5,000
Non-Qualified Options, with an intrinsic value of
$0.4 million
, were exercised at
$742
per common share and
80,000
Non-Qualified Options, with an intrinsic value of
$8.4 million
, were exercised in exchange for
9,930
common shares with an equal total market value. Intrinsic value represents the difference between the market price of the Company’s common shares at the date of exercise less the strike price of
$742
per common share. The Non-Qualified Options were fully amortized as of 2011.
Share-Based Compensation Based on OneBeacon Ltd. Common Shares
The OneBeacon Long-Term Incentive Plan (the “OneBeacon Incentive Plan”) provides for grants to key employees of OneBeacon various types of share-based and non share-based incentive awards. OneBeacon’s share-based incentive awards include OneBeacon performance shares and restricted shares.
F-71
OneBeacon Performance Shares
The following summarizes activity for the years ended
December 31, 2016, 2015 and 2014
for OneBeacon performance shares granted under the OneBeacon Incentive Plan:
|
Year Ended December 31,
|
|||||||||||||||||||||
|
2016
|
2015
|
2014
|
|||||||||||||||||||
|
$ in millions
|
Target
Performance
Shares
Outstanding
|
Accrued
Expense
|
Target
Performance
Shares
Outstanding
|
Accrued
Expense
|
Target
Performance
Shares
Outstanding
|
Accrued
Expense
|
|||||||||||||||
|
Beginning of period
|
449,435
|
|
$
|
1.4
|
|
517,470
|
|
$
|
3.4
|
|
493,421
|
|
$
|
4.0
|
|
||||||
|
Payments and deferrals
(1)
|
(167,300
|
)
|
(.6
|
)
|
(181,290
|
)
|
(1.5
|
)
|
(142,138
|
)
|
(1.0
|
)
|
|||||||||
|
New awards
|
163,150
|
|
—
|
|
154,887
|
|
—
|
|
165,800
|
|
—
|
|
|||||||||
|
Forfeitures and cancellations
(2)
|
7,234
|
|
—
|
|
(41,632
|
)
|
(.1
|
)
|
387
|
|
—
|
|
|||||||||
|
Expense recognized
|
—
|
|
.8
|
|
—
|
|
(.4
|
)
|
—
|
|
.4
|
|
|||||||||
|
End of period
|
452,519
|
|
$
|
1.6
|
|
449,435
|
|
$
|
1.4
|
|
517,470
|
|
$
|
3.4
|
|
||||||
|
(1)
|
OneBeacon performance share payments in 2016 for the 2013-2015 performance cycle were at
24.3%
of target. OneBeacon performance share payments in 2015 for the 2012-2014 performance cycle were at
45.7%
of target. OneBeacon performance share payments in 2014 for the 2011-2013 performance cycle were at
37.1%
of target.
|
|
(2)
|
Amounts include changes in assumed forfeitures, as required under GAAP.
|
The following summarizes OneBeacon performance shares outstanding awarded under the OneBeacon Incentive Plan as of
December 31, 2016
for each performance cycle:
|
$ in millions
|
Target
OneBeacon
Performance
Shares
Outstanding
|
Accrued
Expense
|
|||||
|
Performance cycle:
|
|
|
|
|
|||
|
2016 – 2018
|
163,150
|
|
$
|
.9
|
|
||
|
2015 – 2017
|
146,659
|
|
.7
|
|
|||
|
2014 – 2016
|
142,710
|
|
—
|
|
|||
|
Total at December 31, 2016
|
452,519
|
|
$
|
1.6
|
|
||
If the outstanding OneBeacon performance shares had been vested on
December 31, 2016
, the total additional compensation cost to be recognized would have been
$2.1 million
, based on
December 31, 2016
accrual factors (common share price, accumulated dividends and payout assumptions).
The targeted performance goal for full payment of the outstanding OneBeacon performance shares granted during 2016 is growth in book value per share of
12%
. At a growth in book value per share of
5%
or less, no performance shares would be earned and at a growth in book value per share of
19%
or more,
200%
of performance shares would be earned.
The targeted performance goal for full payment of the outstanding OneBeacon performance shares granted during 2015 is growth in book value per share of
13%
. At a growth in book value per share of
6%
or less, no performance shares would be earned and at a growth in book value per share of
20%
or more,
200%
of performance shares would be earned.
The targeted performance goal for full payment of the outstanding OneBeacon performance shares granted during 2014 is growth in book value per share of
14%
. At a growth in book value per share of
7%
or less, no performance shares would be earned and at a growth in book value per share of
21%
or more,
200%
of performance shares would be earned.
F-72
OneBeacon Restricted Shares
The following table summarizes the unrecognized compensation cost associated with the outstanding OneBeacon restricted stock awards for the years ended
December 31, 2016, 2015 and 2014
.
|
Year Ended December 31,
|
|||||||||||||||||||||
|
2016
|
2015
|
2014
|
|||||||||||||||||||
|
$ in millions
|
Restricted Shares
|
Unamortized Issue Date Fair Value
|
Restricted Shares
|
Unamortized Issue Date Fair Value
|
Restricted Shares
|
Unamortized Issue Date Fair Value
|
|||||||||||||||
|
Beginning of period
|
382,722
|
|
$
|
2.5
|
|
612,500
|
|
$
|
3.5
|
|
915,000
|
|
$
|
6.5
|
|
||||||
|
Issued
|
170,650
|
|
2.3
|
|
75,950
|
|
1.1
|
|
—
|
|
—
|
|
|||||||||
|
Vested
|
(157,500
|
)
|
—
|
|
(296,000
|
)
|
—
|
|
(300,000
|
)
|
—
|
|
|||||||||
|
Forfeited
|
—
|
|
—
|
|
(9,728
|
)
|
(.1
|
)
|
(2,500
|
)
|
—
|
|
|||||||||
|
Expense recognized
|
—
|
|
(2.7
|
)
|
—
|
|
(2.0
|
)
|
—
|
|
(3.0
|
)
|
|||||||||
|
End of period
|
395,872
|
|
$
|
2.1
|
|
382,722
|
|
$
|
2.5
|
|
612,500
|
|
$
|
3.5
|
|
||||||
On February 24, 2016, OneBeacon issued
170,650
shares of restricted stock, of which
92,500
restricted shares vest on February 24, 2018 and
78,150
vest on January 1, 2019. On February 24, 2015, OneBeacon issued to certain employees
75,950
shares of restricted stock, which are scheduled to cliff vest on January 1, 2018.
On May 25, 2011, OneBeacon issued
630,000
restricted shares to its CEO that vest in
four
equal annual installments beginning on February 22, 2014, 2015, 2016 and 2017. Concurrently with the grant of the restricted shares,
35,000
OneBeacon performance shares issued to OneBeacon’s CEO for the 2011-2013 performance share cycle were forfeited and performance share awards to OneBeacon’s CEO for the subsequent
5
years have been or will also be reduced by
35,000
shares. The restricted shares contain dividend participation features, and therefore, are considered participating securities.
The unrecognized compensation cost as of
December 31, 2016
is expected to be recognized ratably over the remaining vesting periods.
OneBeacon Restricted Stock Units
During the year ended
December 31, 2016
,
233,461
RSUs were issued, with
214,506
RSUs outstanding as of
December 31, 2016
that are scheduled to cliff vest on December 31, 2018. During the year ended December 31, 2015,
226,778
RSUs were issued, with
173,042
RSUs outstanding as of December 31, 2016 that are scheduled to cliff vest on December 31, 2017. At vesting the RSUs will be paid out in cash or common shares at the discretion of the Compensation Committee. Compensation expense associated with the RSUs, which is recognized ratably over the three year vesting period, was
$2.1 million
and
$0.8 million
for the year ended December 31, 2016 and 2015.
If
100%
of the outstanding RSUs had been vested on December 31, 2016, the total additional compensation cost to be recognized would have been
$3.9 million
, based on current accrual factors (common share price and accumulated dividends) as of December 31, 2016.
Share-based Compensation Under Qualified Retirement Plans
Contributions to the KSOP with respect to the years ended
2016, 2015 and 2014
were made with either the Company’s or OneBeacon Ltd.’s common shares, dependent on the employer. The variable contribution amounts for eligible participants of the KSOP constituted approximately
3%
,
3%
and
2%
of salary for the years ended
2016, 2015 and 2014
. White Mountains recorded
$5.5 million
,
$5.7 million
and
$4.4 million
in compensation expense to pay benefits and allocate common shares to participant’s accounts for the years ended
2016, 2015 and 2014
. As of
December 31, 2016 and 2015
, the plans owned less than
3%
or less of either of the Company’s or OneBeacon Ltd.’s total common shares outstanding. All White Mountains common shares held by the KSOP are considered outstanding for earnings (loss) per share computations.
F-73
Common Shares Repurchased and Retired
During the past several years, White Mountains’s board of directors authorized the Company to repurchase its common shares, from time to time, subject to market conditions. Shares may be repurchased on the open market or through privately negotiated transactions. The repurchase authorizations do not have a stated expiration date. As of
December 31, 2016
, White Mountains may repurchase an additional
878,130
shares under these board authorizations. In addition, from time to time White Mountains has also repurchased its common shares through tender offers that were separately approved by its board of directors.
During 2016, the Company repurchased
1,106,145
common shares for
$887.2 million
at an average share price of
$802
, which were comprised of
1,098,123
common shares repurchased under the board authorization for
$881.4 million
at an average share price of
$803
and
8,022
common shares repurchased pursuant to employee benefit plans. Shares repurchased pursuant to employee benefit plans do not fall under the board authorizations referred to above.
During 2015, the Company repurchased
387,495
common shares for
$284.2 million
at an average share price of
$733
, which were comprised of
361,839
common shares repurchased under the board authorization for
$267.4 million
at an average share price of
$739
and
10,802
common shares repurchased pursuant to employee benefit plans.
During 2014, the Company repurchased
217,879
common shares for
$134.5 million
at an average share price of
$617
, which were comprised of
207,404
common shares repurchased under the board authorization for
$128.2 million
at an average share price of
$618
and
10,475
common shares repurchased pursuant to employee benefit plans.
Common Shares Issued
During
2016
, the Company issued a total of
47,030
common shares, which consisted of
25,365
restricted shares to key personnel,
14,930
shares issued to the Company’s Chairman and CEO as a result of exercised options,
5,000
shares issued in satisfaction of performance shares and
1,735
shares issued to directors of the Company.
During
2015
, the Company issued a total of
25,016
common shares, which consisted of
23,640
restricted shares issued to key management personnel and
1,376
shares issued to directors of the Company.
During
2014
, the Company issued a total of
28,405
common shares, which consisted of
23,440
restricted shares to key personnel,
3,570
shares issued in satisfaction of performance shares and
1,395
shares issued to directors of the Company.
Dividends on Common Shares
For the years ended
December 31, 2016, 2015 and 2014
, the Company declared and paid cash dividends totaling
$5.4 million
,
$6.0 million
and
$6.2 million
(or
$1.00
per common share).
Non-controlling Interests
Non-controlling interests consist of the ownership interests of non-controlling shareholders in consolidated entities and are presented separately on the balance sheet. The following table details the balance of non-controlling interests included in White Mountains’s total equity and the related percentage of each consolidated entity’s total equity owned by non-controlling shareholders as of December 31, 2016 and 2015:
|
|
December 31, 2016
|
December 31, 2015
|
||||||||||||
|
$ in millions
|
Non-controlling Percentage
|
Non-controlling Equity
|
Non-controlling Percentage
|
Non-controlling Equity
|
||||||||||
|
OneBeacon Ltd.
|
23.9
|
%
|
$
|
244.6
|
|
24.5
|
%
|
$
|
245.6
|
|
||||
|
SIG Preference Shares
|
—
|
|
—
|
|
100.0
|
|
250.0
|
|
||||||
|
Other, excluding mutuals and reciprocals
|
||||||||||||||
|
HG Global
|
3.1
|
|
16.6
|
|
3.1
|
|
17.1
|
|
||||||
|
MediaAlpha
|
40.0
|
|
11.7
|
|
40.0
|
|
14.4
|
|
||||||
|
Dewar
|
18.8
|
|
3.9
|
|
19.0
|
|
3.7
|
|
||||||
|
Buzzmove
|
29.1
|
|
2.9
|
|
—
|
|
—
|
|
||||||
|
Wobi
|
5.0
|
|
.7
|
|
3.9
|
|
.6
|
|
||||||
|
Tranzact
|
—
|
|
—
|
|
36.8
|
|
79.4
|
|
||||||
|
Total other, excluding mutuals and reciprocals
|
35.8
|
|
115.2
|
|
||||||||||
|
Mutuals and reciprocals
|
||||||||||||||
|
BAM
|
100.0
|
|
(150.9
|
)
|
100.0
|
|
(140.0
|
)
|
||||||
|
SSIE
|
100.0
|
|
4.4
|
|
100.0
|
|
(16.0
|
)
|
||||||
|
Total mutuals and reciprocals
|
(146.5
|
)
|
(156.0
|
)
|
||||||||||
|
Total non-controlling interests
|
$
|
133.9
|
|
$
|
454.8
|
|
||||||||
F-74
White Mountains’s insurance operations are subject to regulation and supervision in each of the jurisdictions where they are domiciled and licensed to conduct business. Generally, regulatory authorities have broad supervisory and administrative powers over such matters as licenses, standards of solvency, premium rates, policy forms, investments, security deposits, methods of accounting, form and content of financial statements, reserves for unpaid loss and LAE, reinsurance, minimum capital and surplus requirements, dividends and other distributions to shareholders, periodic examinations and annual and other report filings. In general, such regulation is for the protection of policyholders rather than shareholders.
The NAIC uses risk-based capital (“RBC”) standards for U.S. property and casualty insurers as a means of monitoring certain aspects affecting the overall financial condition of insurance companies. As of
December 31, 2016
, White Mountains’s active U.S. insurance operating subsidiaries exceeded their respective RBC requirements.
The Insurance Act 1978 of Bermuda and related regulations, as amended (“Insurance Act”), regulates the insurance business of Bermuda-domiciled insurers. Under the Insurance Act, insurers are required to maintain available statutory capital and surplus at a level equal to or in excess of its enhanced capital requirement which is established by reference to either a Bermuda Solvency Capital Requirement (“BSCR”) model or an approved internal capital model. Generally, the Bermuda Monetary Authority (“BMA”) has broad supervisory and administrative powers over such matters as licenses, standards of solvency, investments, methods of accounting, form and content of financial statements, minimum capital and surplus requirements, and annual and other report filings.
OneBeacon:
OneBeacon’s U.S. combined statutory surplus was
$624.8 million
and
$622.3 million
as of
December 31, 2016 and 2015
. OneBeacon’s combined U.S. statutory net income (loss) for the years ended
December 31, 2016, 2015 and 2014
was
$36.7 million
,
$44.5 million
and
$(14.2) million
. The minimum policyholders' surplus necessary to satisfy OneBeacon’s top tier regulated U.S. insurance subsidiary, ASIC, regulatory requirements was
$107.5 million
as of
December 31, 2016
, which equals the authorized control level of the NAIC risk-based capital of ASIC’s policyholders’ surplus.
Split Rock’s statutory capital and surplus was
$270.2 million
and
$249.5 million
as of
December 31, 2016
and 2015, which met Bermuda’s statutory capital and surplus requirements. Split Rock reported
$42.4 million
,
$45.5 million
and
$46.2 million
of statutory net income for the years ended
December 31, 2016, 2015 and 2014
.
The principle differences between OneBeacon’s combined U.S. and Split Rock’s statutory reported amounts, and the amounts reported in accordance with GAAP include deferred acquisition costs, deferred taxes, and market value adjustments for debt securities. OneBeacon’s insurance subsidiaries' statutory policyholders’ surplus as of
December 31, 2016
was in excess of the minimum requirements of relevant state and Bermuda insurance regulations.
HG Global/BAM:
HG Re is a Special Purpose Insurer under Bermuda insurance regulations and is subject to regulation and supervision by the BMA. As of
December 31, 2016
, HG Re had statutory capital and surplus of
$467.2 million
. As a Special Purpose Insurer, HG Re does not have minimum regulatory capital requirements.
BAM is domiciled in New York and is subject to regulation by the New York State Department of Financial Services (“NYDFS”). New York financial guarantee insurance law establishes single risk and aggregate limits with respect to insured obligations insured by financial guarantee insurers. BAM’s statutory net loss for the years ended
December 31, 2016, 2015 and 2014
was
$32.7 million
,
$32.0 million
and
$31.8 million
. BAM’s members’ surplus, as reported to regulatory authorities as of
December 31, 2016
was
$431.5 million
, which exceeds the minimum members’ surplus necessary for BAM to maintain its New York State financial guarantee insurance license of
$66.0 million
.
Other Operations:
SSIE’s policyholders’ surplus, as reported to regulatory authorities as of December 31, 2016 and 2015, was
$4.4 million
and
$5.0 million
. SSIE’s statutory net income (loss) for the year ended December 31, 2016 and 2015 was
$20.4 million
and
$(3.5) million
. The minimum policyholders’ surplus necessary to satisfy SSIE’s regulatory requirements was
$0.4 million
as of December 31, 2016, which equals the authorized control level of the NAIC risk-based capital based on SSIE’s policyholders’ surplus. On December 30, 2016, SSIE entered into a Consent Order with the Florida Office of Insurance Regulation governing its wind down and the surrender and termination of SSIE’s Certificate of Authority as a domestic reciprocal in the State of Florida. Pursuant to the Consent Order, it is anticipated that SSIE will non-renew its last policy in August 2017.
F-75
Dividend Capacity
There are no restrictions under Bermuda law or the law of any other jurisdiction on the payment of dividends from retained earnings by White Mountains, provided that after the payment of any dividend, the Company would continue to be able to pay its liabilities as they become due and the realizable value of the Company’s assets would remain greater that its liabilities. However, under the insurance laws of the states and jurisdictions under which White Mountains’s insurance operating subsidiaries are domiciled, an insurer is restricted with respect to the timing and the amount of dividends it may pay without prior approval by regulatory authorities. As of
December 31, 2016
, White Mountains’s top tier insurance subsidiaries have approximately
$562.5 million
of GAAP shareholders’ equity (net of
$177.1 million
of non-controlling interest at OneBeacon),
$60.0 million
of which can be distributed to White Mountains without prior regulatory approval. As a result, as of
December 31, 2016
,
$502.5 million
of White Mountains’s GAAP shareholders’ equity held in its insurance subsidiaries was not available for the payment of dividends without prior regulatory approval, and approximately
$2.3 billion
of White Mountains’s retained earnings is unrestricted with respect to the payment of dividends to White Mountains’s common shareholders. When determining whether to make distributions from its insurance subsidiaries, White Mountains also considers factors such as internal capital targets and rating agency capital requirements. Accordingly, there can be no assurance regarding the amount of such dividends that may be paid by such subsidiaries in the future.
Following is a description of the dividend capacity of White Mountains’s insurance operating subsidiaries:
OneBeacon:
On December 23, 2014, OneBeacon Insurance Company (subsequently renamed Bedivere) distributed ASIC to its immediate parent at a value of
$700.5 million
as part of the Runoff Transaction. OBIC also distributed
$151.2 million
of cash and other securities to its immediate parent in accordance with the prescribed minimum capital to be included in the company at the time of its sale to Armour, as approved by the PID.
OneBeacon’s top-tier regulated U.S. insurance subsidiary, ASIC, has the ability to pay dividends to its immediate parent without the prior approval of regulatory authorities in an amount set by formula based on the lesser of (i) adjusted net investment income, as defined by statute, or (ii)
10%
of statutory surplus, in both cases as most recently reported to regulatory authorities, subject to the availability of earned surplus. Based upon the formula above, ASIC currently has the ability to pay
$11.4 million
of dividends without prior approval of regulatory authorities. As of
December 31, 2016
, ASIC had
$624.8 million
of statutory surplus and
$69.0 million
of earned surplus. During 2016, ASIC paid
$26.5 million
of dividends to its immediate parent.
In 2017, Split Rock has the ability to distribute statutory capital without the prior approval of the BMA, provided it does not reduce its total statutory capital, as shown in the previous year’s statutory financial statements, by
15%
or more.
In addition, Split Rock has the ability to pay dividends without the prior notification of regulatory authorities of up to
25%
of its previous financial year’s total statutory capital and surplus, subject to meeting all appropriate liquidity and solvency requirements as specified in the Insurance Act of 1978 and the Companies Act of 1981. As of December 31, 2016, Split Rock had
$210.1 million
of statutory capital and
$60.1 million
of statutory surplus for total statutory capital and surplus of
$270.2 million
.
Based upon the limitations described above, Split Rock currently has the ability to distribute up to
$31.5 million
of statutory capital and pay up to
$60.1 million
of dividends during 2017 without the prior approval of regulatory authorities. During 2016, Split Rock paid
$25.0 million
of dividends to its immediate parent and paid no such dividends during 2015. Also, during 2015, OneBeacon Ltd., through an intermediary holding company, contributed
$85.0 million
to Split Rock as statutory capital.
During 2016 and 2015, OneBeacon’s unregulated insurance subsidiaries paid
$5.7 million
and
$5.3 million
of dividends to their immediate parent. As of
December 31, 2016
, OneBeacon’s unregulated insurance subsidiaries had
$56.4 million
of net unrestricted cash, short-term investments and fixed maturity investments and
$71.9 million
of other long-term investments, consisting of the OneBeacon Surplus Notes.
During 2016 and 2015, OneBeacon Ltd. paid
$79.2 million
and
$80.0 million
of regular quarterly dividends to its common shareholders. For both 2016 and 2015, White Mountains received
$60.3 million
of these dividends.
As of
December 31, 2016
, OneBeacon Ltd. and its intermediate holding companies subsidiaries had
$64.5 million
of net unrestricted cash, short-term investments and fixed maturity investments and
$11.9 million
of common equity securities outside of its regulated and unregulated insurance subsidiaries.
F-76
HG Global/BAM:
As of
December 31, 2016
, HG Global had
$619.0 million
face value of preferred shares outstanding, of which White Mountains owned
96.9%
. Holders of the HG Global preferred shares receive cumulative dividends at a fixed annual rate of
6.0%
on a quarterly basis, when and if declared by HG Global. HG Global did not declare or pay any preferred dividends in 2016. As of
December 31, 2016
, HG Global has accrued
$186.2 million
of dividends payable to holders of its preferred shares,
$180.2 million
of which is payable to White Mountains and eliminated in consolidation.
HG Re is a Special Purpose Insurer subject to regulation and supervision by the BMA, but does not require regulatory approval to pay dividends. However, HG Re’s dividend capacity is limited to amounts held outside of the collateral trusts pursuant to the first loss reinsurance treaty (“FLRT”) with BAM. As of
December 31, 2016
, HG Re had statutory capital and surplus of
$467.2 million
, of which
$465.4 million
was held in the collateral trusts pursuant to the FLRT with BAM.
Effective January 1, 2014, HG Global and BAM agreed to change the interest rate on the BAM Surplus Notes for the
five
years ending December 31, 2018 from a fixed rate of
8.0%
to a variable rate equal to the one-year U.S. treasury rate plus 300 basis points, set annually, which was
3.54%
for 2016 and is
3.78%
for 2017. Prior to the end of 2018, BAM has the option to extend the variable rate period for an additional
three
years. At the end of the variable rate period, the interest rate will be fixed at the higher of the then current variable rate or
8.0%
. BAM is required to seek regulatory approval to pay interest and principal on the BAM Surplus Notes only when adequate capital resources have accumulated beyond BAM’s initial capitalization and a level that continues to support its outstanding obligations, business plan and ratings. BAM did not pay any interest on the BAM Surplus Notes in 2016, 2015 or 2014.
Other Operations:
During
2016
, WM Advisors did not pay any dividends to its immediate parent. As of
December 31, 2016
, WM Advisors held
$17.8 million
of net unrestricted cash and short-term investments.
During 2016, White Mountains paid a
$5.4 million
common share dividend. As of
December 31, 2016
, the Company and its intermediate holding companies held
$1,655.0 million
of net unrestricted cash, short-term investments and fixed maturity investments,
$285.6 million
of common equity securities and
$66.9 million
of other long-term investments included in its Other Operations segment.
White Mountains has determined that its reportable segments are OneBeacon, HG Global/BAM and Other Operations. As a result of the Sirius Group and Tranzact sale, the results of operations for Sirius Group and Tranzact have been classified as discontinued operations and are now presented as such, net of related income taxes, in the statement of operations and comprehensive income. Prior year amounts have been reclassified to conform to the current period’s presentation. See
Note 22 — “Held for Sale and Discontinued Operations”
.
White Mountains has made its segment determination based on consideration of the following criteria: (i) the nature of the business activities of each of the Company’s subsidiaries and affiliates; (ii) the manner in which the Company’s subsidiaries and affiliates are organized; (iii) the existence of primary managers responsible for specific subsidiaries and affiliates; and (iv) the organization of information provided to the chief operating decision makers and the Board of Directors.
OneBeacon is a specialty property and casualty insurance writer that offers a wide range of insurance products through independent agencies, regional and national brokers, wholesalers and managing general agencies.
The HG Global/BAM segment consists of White Mountains’s investment in HG Global and the consolidated results of BAM. BAM is a municipal bond insurer domiciled in New York that was established to provide insurance on bonds issued to support essential U.S. public purposes such as schools, utilities, core governmental functions and existing transportation facilities. HG Global, together with its subsidiaries, provided the initial capitalization of BAM through the purchase of BAM Surplus Notes. HG Global also provides
15%
-of-par, first loss reinsurance protection for policies underwritten by BAM. BAM's results are attributed to non-controlling interests.
Other Operations consists of the Company and its intermediate holding companies, its
wholly-owned investment management subsidiary, WM Advisors, WM Life Re, WM Capital Investments, which includes the consolidated results of MediaAlpha, Wobi, Buzzmove and Star & Shield, and various other investments. In 2016, White Mountains reached an agreement to sell Star & Shield and its investment in SSIE Surplus Notes. As a result, White Mountains has presented Star & Shield’s and SSIE’s assets and liabilities as held for sale as of December 31, 2016 and 2015. SSIE’s results are attributed to non-controlling interests.
Significant intercompany transactions among White Mountains’s segments have been eliminated herein.
F-77
Financial information for White Mountains’s segments follows:
|
HG Global/BAM
|
||||||||||||||||||||
|
Millions
|
OneBeacon
|
HG Global
|
BAM
(1)
|
Other
Operations
|
Total
|
|||||||||||||||
|
Year Ended December 31, 2016
|
|
|
|
|
|
|
||||||||||||||
|
Earned insurance and reinsurance premiums
|
$
|
1,100.6
|
|
$
|
4.4
|
|
$
|
1.5
|
|
$
|
7.5
|
|
$
|
1,114.0
|
|
|||||
|
Net investment income
|
50.6
|
|
2.2
|
|
6.8
|
|
27.2
|
|
86.8
|
|
||||||||||
|
Net investment income (loss) - BAM Surplus Note
|
—
|
|
17.8
|
|
(17.8
|
)
|
—
|
|
—
|
|
||||||||||
|
Net realized and unrealized investment gains (losses)
|
37.7
|
|
.1
|
|
.6
|
|
(28.1
|
)
|
10.3
|
|
||||||||||
|
Other revenue
|
5.5
|
|
—
|
|
1.1
|
|
143.0
|
|
(4)
|
149.6
|
|
|||||||||
|
Total revenues
(3)
|
1,194.4
|
|
24.5
|
|
(7.8
|
)
|
149.6
|
|
1,360.7
|
|
||||||||||
|
Losses and LAE
|
656.0
|
|
—
|
|
—
|
|
8.0
|
|
664.0
|
|
||||||||||
|
Insurance and reinsurance acquisition expenses
|
206.0
|
|
.9
|
|
2.5
|
|
2.2
|
|
211.6
|
|
||||||||||
|
Other underwriting expenses
|
209.0
|
|
—
|
|
.4
|
|
.1
|
|
209.5
|
|
||||||||||
|
General and administrative expenses
|
13.0
|
|
1.4
|
|
38.2
|
|
234.8
|
|
(5)
|
287.4
|
|
|||||||||
|
Amortization of intangible assets
|
1.2
|
|
—
|
|
—
|
|
11.3
|
|
12.5
|
|
||||||||||
|
Interest expense
|
13.1
|
|
—
|
|
—
|
|
3.0
|
|
16.1
|
|
||||||||||
|
Total expenses
|
1,098.3
|
|
2.3
|
|
41.1
|
|
259.4
|
|
1,401.1
|
|
||||||||||
|
Pre-tax income (loss)
|
$
|
96.1
|
|
$
|
22.2
|
|
$
|
(48.9
|
)
|
$
|
(109.8
|
)
|
$
|
(40.4
|
)
|
|||||
|
HG Global/BAM
|
||||||||||||||||||||
|
Millions
|
OneBeacon
|
HG Global
|
BAM
(1)
|
Other
Operations
|
Total
|
|||||||||||||||
|
Year Ended December 31, 2015
|
|
|
|
|
|
|
||||||||||||||
|
Earned insurance and reinsurance premiums
|
$
|
1,176.2
|
|
$
|
2.5
|
|
$
|
.8
|
|
$
|
8.7
|
|
$
|
1,188.2
|
|
|||||
|
Net investment income
|
45.9
|
|
1.9
|
|
4.2
|
|
8.8
|
|
60.8
|
|
||||||||||
|
Net investment income (loss) - BAM Surplus Note
|
—
|
|
15.8
|
|
(15.8
|
)
|
—
|
|
—
|
|
||||||||||
|
Net realized and unrealized investment (losses) gains
|
(35.1
|
)
|
(.3
|
)
|
.9
|
|
259.9
|
|
(2)
|
225.4
|
|
|||||||||
|
Other (loss) revenue
|
(.6
|
)
|
—
|
|
.7
|
|
147.2
|
|
(4)
|
147.3
|
|
|||||||||
|
Total revenues
(3)
|
1,186.4
|
|
19.9
|
|
(9.2
|
)
|
424.6
|
|
1,621.7
|
|
||||||||||
|
Losses and LAE
|
700.7
|
|
—
|
|
—
|
|
8.2
|
|
708.9
|
|
||||||||||
|
Insurance and reinsurance acquisition expenses
|
213.8
|
|
.6
|
|
2.3
|
|
3.4
|
|
220.1
|
|
||||||||||
|
Other underwriting expenses
|
218.2
|
|
—
|
|
.4
|
|
—
|
|
218.6
|
|
||||||||||
|
General and administrative expenses
|
14.1
|
|
1.4
|
|
35.4
|
|
240.7
|
|
(5)
|
291.6
|
|
|||||||||
|
Amortization of intangible assets
|
1.3
|
|
—
|
|
—
|
|
9.3
|
|
10.6
|
|
||||||||||
|
Interest expense
|
13.0
|
|
—
|
|
—
|
|
1.6
|
|
14.6
|
|
||||||||||
|
Total expenses
|
1,161.1
|
|
2.0
|
|
38.1
|
|
263.2
|
|
1,464.4
|
|
||||||||||
|
Pre-tax income (loss)
|
$
|
25.3
|
|
$
|
17.9
|
|
$
|
(47.3
|
)
|
$
|
161.4
|
|
$
|
157.3
|
|
|||||
F-78
|
HG Global/BAM
|
||||||||||||||||||||
|
Millions
|
OneBeacon
|
HG Global
|
BAM
(1)
|
Other
Operations
|
Total
|
|||||||||||||||
|
Year Ended December 31, 2014
|
|
|
|
|
|
|
||||||||||||||
|
Earned insurance and reinsurance premiums
|
$
|
1,177.1
|
|
$
|
1.4
|
|
$
|
.4
|
|
$
|
6.1
|
|
$
|
1,185.0
|
|
|||||
|
Net investment income
|
43.4
|
|
1.4
|
|
5.7
|
|
9.0
|
|
59.5
|
|
||||||||||
|
Net investment income (loss) - BAM Surplus Note
|
—
|
|
15.7
|
|
(15.7
|
)
|
—
|
|
—
|
|
||||||||||
|
Net realized and unrealized investment gains
|
40.4
|
|
1.7
|
|
6.6
|
|
29.8
|
|
78.5
|
|
||||||||||
|
Other revenue
|
5.8
|
|
—
|
|
.6
|
|
81.7
|
|
(4)
|
88.1
|
|
|||||||||
|
Total revenues
(3)
|
1,266.7
|
|
20.2
|
|
(2.4
|
)
|
126.6
|
|
1,411.1
|
|
||||||||||
|
Losses and LAE
|
815.1
|
|
—
|
|
—
|
|
8.9
|
|
824.0
|
|
||||||||||
|
Insurance and reinsurance acquisition expenses
|
203.3
|
|
.3
|
|
1.8
|
|
0.8
|
|
206.2
|
|
||||||||||
|
Other underwriting expenses
|
179.2
|
|
—
|
|
.4
|
|
—
|
|
179.6
|
|
||||||||||
|
General and administrative expenses
|
12.4
|
|
1.6
|
|
35.9
|
|
158.3
|
|
(5)
|
208.2
|
|
|||||||||
|
Amortization of intangible assets
|
1.4
|
|
—
|
|
—
|
|
6.9
|
|
8.3
|
|
||||||||||
|
Interest expense
|
13.0
|
|
—
|
|
—
|
|
1.2
|
|
14.2
|
|
||||||||||
|
Total expenses
|
1,224.4
|
|
1.9
|
|
38.1
|
|
176.1
|
|
1,440.5
|
|
||||||||||
|
Pre-tax income (loss)
|
$
|
42.3
|
|
$
|
18.3
|
|
$
|
(40.5
|
)
|
$
|
(49.5
|
)
|
$
|
(29.4
|
)
|
|||||
|
(1)
|
BAM manages its affairs on a statutory accounting basis. BAM’s statutory surplus includes BAM Surplus Notes and is not reduced by accruals of interest expense on the BAM Surplus Notes. BAM’s statutory surplus is reduced only after a payment of principal or interest has been approved by the New York Department of Financial Services.
|
|
(2)
|
Net realized and unrealized investment gains (losses) in the Other Operations segment includes the unrealized investment gain of
$258.8
related to the investment in Symetra common shares, representing the difference between the carrying value under the equity method at November 5, 2015 and the fair value at December 31, 2015. See
|
|
(3)
|
Total revenues includes both revenues from customers, as well as, investment performance.
|
|
(4)
|
Includes
$116.5
from MediaAlpha for the year ended December 31, 2016;
$105.5
from MediaAlpha for the year ended December 31, 2015;
$65.3
from MediaAlpha for the year ended December 31, 2014.
|
|
(5)
|
Includes
$109.6
from MediaAlpha for the year ended December 31, 2016; and
$99.0
from MediaAlpha for the year ended December 31, 2015;
$60.6
from MediaAlpha for the year ended December 31, 2014.
|
F-79
|
HG Global/BAM
|
||||||||||||||||||||||||||||
|
Selected Balance Sheet Data
Millions
|
OneBeacon
|
HG Global
|
BAM
|
Other
Operations
|
Eliminations
|
Held for Sale
|
Total
|
|||||||||||||||||||||
|
December 31, 2016:
|
|
|
|
|
|
|
||||||||||||||||||||||
|
Total investments
|
$
|
2,620.4
|
|
$
|
161.6
|
|
$
|
468.1
|
|
$
|
2,084.7
|
|
$
|
—
|
|
$
|
—
|
|
$
|
5,334.8
|
|
|||||||
|
Reinsurance recoverable on paid
and unpaid losses
|
179.5
|
|
—
|
|
—
|
|
—
|
|
—
|
|
—
|
|
179.5
|
|
||||||||||||||
|
Assets held for sale
|
—
|
|
—
|
|
—
|
|
—
|
|
—
|
|
10.1
|
|
10.1
|
|
||||||||||||||
|
Total assets
|
3,589.4
|
|
787.0
|
|
(78.9
|
)
|
(1)
|
2,417.3
|
|
(180.2
|
)
|
10.1
|
|
6,544.7
|
|
|||||||||||||
|
Loss and LAE reserves
|
1,365.6
|
|
—
|
|
—
|
|
—
|
|
—
|
|
—
|
|
1,365.6
|
|
||||||||||||||
|
Liabilities held for sale
|
—
|
|
—
|
|
—
|
|
—
|
|
—
|
|
5.1
|
|
5.1
|
|
||||||||||||||
|
Total liabilities
|
2,564.2
|
|
247.6
|
|
72.0
|
|
98.8
|
|
(180.2
|
)
|
5.1
|
|
2,807.5
|
|
||||||||||||||
|
Total White Mountains’s
common shareholders’ equity
|
780.6
|
|
522.8
|
|
—
|
|
2,294.9
|
|
—
|
|
5.0
|
|
3,603.3
|
|
||||||||||||||
|
Non-controlling interest
|
244.6
|
|
16.6
|
|
(150.9
|
)
|
23.6
|
|
—
|
|
—
|
|
133.9
|
|
||||||||||||||
|
December 31, 2015:
|
|
|
|
|
|
|
||||||||||||||||||||||
|
Total investments
|
$
|
2,591.4
|
|
$
|
136.2
|
|
$
|
460.3
|
|
$
|
1,083.2
|
|
$
|
—
|
|
$
|
—
|
|
$
|
4,271.1
|
|
|||||||
|
Reinsurance recoverable on paid
and unpaid losses
|
193.5
|
|
—
|
|
—
|
|
—
|
|
—
|
|
—
|
|
193.5
|
|
||||||||||||||
|
Assets held for sale
|
—
|
|
—
|
|
—
|
|
—
|
|
—
|
|
4,790.4
|
|
4,790.4
|
|
||||||||||||||
|
Total assets
|
3,600.8
|
|
739.0
|
|
(91.1
|
)
|
(1)
|
1,378.8
|
|
(135.3
|
)
|
4,790.4
|
|
10,282.6
|
|
|||||||||||||
|
Loss and LAE reserves
|
1,389.8
|
|
—
|
|
—
|
|
—
|
|
—
|
|
—
|
|
1,389.8
|
|
||||||||||||||
|
Liabilities held for sale
|
—
|
|
—
|
|
—
|
|
—
|
|
—
|
|
3,047.4
|
|
3,047.4
|
|
||||||||||||||
|
Total liabilities
|
2,596.3
|
|
181.2
|
|
48.9
|
|
176.1
|
|
(135.3
|
)
|
3,047.4
|
|
5,914.6
|
|
||||||||||||||
|
Total White Mountains’s
common shareholders’ equity |
755.2
|
|
540.7
|
|
—
|
|
1,124.3
|
|
—
|
|
1,493.0
|
|
3,913.2
|
|
||||||||||||||
|
Non-controlling interest
|
249.3
|
|
17.1
|
|
(140.0
|
)
|
78.4
|
|
—
|
|
—
|
|
(2)
|
204.8
|
|
|||||||||||||
|
(1)
|
BAM total assets reflect the elimination of
$503.0
in the BAM Surplus Notes issued to HG Global and its subsidiaries, and
$108.0
and
$90.2
in accrued interest related to the BAM Surplus Notes as of December 31, 2016 and 2015.
|
(2)
Excludes
$250.0
related to SIG Preference Shares. See
Note 14 — “Common Shareholders’ Equity and Non-controlling Interests”.
As of December 31, 2016 and 2015, HG Global has accrued
$180.2
million and
$135.3
million of preferred dividends payable to Lone Tree Holdings, which is included in the Other Operations segment and eliminated in consolidation. As of December 31, 2016 and 2015, the total amount of capital White Mountains has committed to HG Global/BAM, comprised of total common shareholders’ equity and the preferred dividends receivable at Lone Tree Holdings, is
$703.0 million
and
$676.0 million
.
F-80
White Mountains’s investments in unconsolidated affiliates represent investments in other companies in which White Mountains has a significant voting and economic interest but does not control the entity.
Symetra
In 2004, White Mountains, Berkshire Hathaway, Inc. and several other private investors capitalized Symetra in order to purchase the life and investment operations of Safeco Corporation for
$1.35 billion
, during which White Mountains invested
$195 million
in Symetra. As of February 1, 2016 and December 31, 2015, White Mountains owned
20,562,379
common shares of Symetra, a
17.7%
common share ownership. On February 1, 2016, Symetra closed its merger agreement with Sumitomo Life Insurance Company (“Sumitomo Life”) and White Mountains received proceeds of
$658 million
, or
$32
per common share.
In August 2015, Symetra announced it had entered into a merger agreement with Sumitomo Life pursuant to which Sumitomo Life would acquire all of the outstanding shares of Symetra. Following the announcement and Symetra shareholders’ November 5, 2015 meeting to approve the transaction, White Mountains relinquished its representation on Symetra’s board of directors. As a result, White Mountains changed its accounting for Symetra common shares from the equity method to fair value. During the fourth quarter of 2015, White Mountains recognized
$258.8 million
(
$241.1 million
after tax) of unrealized investment gains through net income, representing the difference between the carrying value of Symetra common shares under the equity method at the date of change and fair value at December 31, 2015. During the first quarter of 2016, White Mountains recognized an additional
$4.7 million
of unrealized investment gains through net income.
As of December 31, 2011, White Mountains concluded that its investment in Symetra common shares was other-than-temporarily impaired and wrote down the GAAP book value of the investment to its estimated fair value of
$261.0 million
or
$15
per share. This impairment, as well as the effect of Symetra capital transactions, resulted in a basis difference between the GAAP carrying value of White Mountains’s investment in Symetra common shares under the equity method and the amount derived by multiplying the percentage of White Mountains common share ownership by Symetra’s total GAAP equity. As of November 5, 2015, the pre-tax unamortized basis difference was
$159.9 million
, of which
$32.6 million
is attributable to equity in earnings of unconsolidated affiliates and
$127.3 million
is attributable to equity in net unrealized investment gains from investments in unconsolidated affiliates. The pre-tax basis differences were to be amortized over a
30
-year period, based on estimated future cash flows associated with Symetra’s underlying assets and liabilities to which the basis differences were attributed. White Mountains recognized the amortization of the basis differences through equity in earnings of unconsolidated affiliates and equity in net unrealized investment gains (losses) from investments in unconsolidated affiliates consistent with the original attribution of the basis differences between equity in earnings and equity in net unrealized investment gains (losses). For the period ended November 5, 2015, White Mountains recognized after-tax amortization of
$2.2 million
through equity in earnings of unconsolidated affiliates and
$8.9 million
through equity in net unrealized investment gains from investments in unconsolidated affiliates. For 2014, White Mountains recognized after-tax amortization of
$2.8 million
through equity in earnings of unconsolidated affiliates and
$11.7 million
through equity in net unrealized investment gains from investments in unconsolidated affiliates.
F-81
The following table summarizes amounts recorded by White Mountains under the equity method relating to its investment in Symetra through November 5, 2015:
|
Millions
|
||||
|
Equity method carrying value of investment in Symetra as of December 31, 2014
(1)
|
$
|
411.4
|
|
|
|
Equity in earnings
(2)(3)(4)
|
25.1
|
|
||
|
Equity in net unrealized investment losses from Symetra’s fixed maturity portfolio
(5)(6)
|
(39.2
|
)
|
||
|
Distribution from Prospector Offshore Fund
(7)
|
12.4
|
|
||
|
Dividends received
|
(16.9
|
)
|
||
|
Equity method carrying value of investment in Symetra as of November 5, 2015
(1)(8)
|
$
|
392.8
|
|
|
|
(1)
|
Includes White Mountains’s equity in net unrealized investment (losses) gains from Symetra’s fixed maturity portfolio of
$(1.6)
and
$37.6
, as of November 5, 2015 and December 31, 2014, which excludes tax benefit (expense) of
$0.2
and
$(2.7)
.
|
|
(2)
|
Equity in earnings for the period ended November 5, 2015 excludes tax expense of
$1.6
.
|
|
(3)
|
Equity in earnings for the period ended November 5, 2015 includes an increase of
$2.3
relating to the pre-tax amortization of the Symetra common share basis difference.
|
|
(4)
|
Equity in earnings for the period ended November 5, 2015 includes losses of
$(0.1)
from the dilutive effect of Symetra’s yearly dividend and the issuance of restricted shares by Symetra
|
|
(5)
|
Net unrealized investment losses for the period ended November 5, 2015 includes an increase of
$9.4
relating to the pre-tax amortization of the Symetra common share basis difference.
|
|
(6)
|
Net unrealized investment losses from Symetra’s fixed maturity portfolio excludes a tax benefit of
$2.9
for the period ended November 5, 2015.
|
|
(7)
|
During 2015, pursuant to the redemption of White Mountains's investments in the Prospector Funds,
513,500
common shares of Symetra were distributed to White Mountains.
|
|
(8)
|
The aggregate value of White Mountains’s investment in common shares of Symetra was
$651.2
based upon the quoted market price of
$31.67
per share as of November 5, 2015.
|
The following table summarizes financial information for Symetra as of September 30, 2015:
|
September 30,
|
||||
|
Millions
|
2015
|
|||
|
Symetra balance sheet data:
|
|
|
||
|
Total investments
|
$
|
32,409.2
|
|
|
|
Separate account assets
|
885.9
|
|
||
|
Total assets
|
34,962.8
|
|
||
|
Policyholder liabilities
|
29,492.0
|
|
||
|
Long-term debt
|
697.5
|
|
||
|
Separate account liabilities
|
885.9
|
|
||
|
Total liabilities
|
31,836.7
|
|
||
|
Common shareholders’ equity
|
3,126.1
|
|
||
The following table summarizes financial information for Symetra for the nine months ended September 30, 2015 and year ended December 31, 2014:
|
Nine months ended September 30,
|
Year ended December 31,
|
|||||||
|
Millions
|
2015
|
2014
|
||||||
|
Symetra income statement data:
|
||||||||
|
Net premiums earned
|
$
|
539.3
|
|
$
|
629.1
|
|
||
|
Net investment income
|
994.3
|
|
1,320.5
|
|
||||
|
Total revenues
|
1,605.9
|
|
2,182.4
|
|
||||
|
Policy benefits
|
1,143.7
|
|
1,399.7
|
|
||||
|
Total expenses
|
1,543.6
|
|
1,882.5
|
|
||||
|
Net income
|
89.6
|
|
254.4
|
|
||||
|
Comprehensive net (loss) income
|
(234.1
|
)
|
397.0
|
|
||||
F-82
Hamer
On May 27, 2015, White Mountains sold its interest in Hamer LLC, a small manufacturing company that White Mountains received in 2012 in connection with the liquidation of a limited partnership fund, which resulted in a gain of
$20.0 million
recorded in other revenue. Prior to the sale, White Mountains recorded equity in earnings of
$1.6 million
for the six months ended June 30, 2015 and
$1.9 million
for the year ended December 31, 2014.
BAM
As a mutual insurance company, BAM is owned by its members. BAM charges an insurance premium on each municipal bond insurance policy it insures, a portion of which is contributed to BAM’s qualified statutory capital and conveys to the issuer certain interests in BAM. During 2012, White Mountains formed and capitalized HG Global to fund the startup of BAM through the purchase of
$503.0 million
of BAM Surplus Notes. The equity at risk funded by BAM’s members is not sufficient to fund its operations without the additional subordinated financial support provided by the BAM Surplus Notes and accordingly, BAM is considered to be a VIE.
BAM and HG Global, through its wholly-owned subsidiary, HG Re, entered into a first loss reinsurance treaty (“FLRT”), under which HG Re will provide first loss protection up to
15%
of par outstanding on each bond insured by BAM in exchange for
60%
of the premium, net of a ceding commission, charged by BAM. HG Re’s obligations under the FLRT are satisfied by the assets in
two
collateral trusts: a Regulation 114 Trust and a Supplemental Trust. Losses required to be reimbursed to BAM by HG Re are subject to an aggregate limit equal to the assets held in the collateral trusts at any point in time. In addition, HG Global has the right to designate
two
directors for election to BAM’s board of directors. White Mountains is required to consolidate the results of BAM. Since BAM is owned by its members, its equity and results of operations are included in non-controlling interests.
Reciprocals
Reciprocals are policyholder-owned insurance carriers organized as unincorporated associations. Each policyholder insured by the reciprocal shares risk with the other policyholders. Policyholders share profits and losses in the same proportion as the amount of insurance purchased but are not subject to assessment for net losses of the reciprocal.
Houston General Insurance Exchange
Houston General Management Company, a wholly-owned indirect subsidiary of OneBeacon provides management services for a fee to a reciprocal, HGIE. OneBeacon holds HGIE Surplus Notes, the remaining balance of which is
$5.0 million
as of
December 31, 2016
. The principal and interest on the HGIE Surplus Notes is repayable to OneBeacon only with regulatory approval. The obligation to repay principal on the note is subordinated to all other liabilities including obligations to policyholders and claimants for benefits under insurance policies. OneBeacon has no ownership interest in the reciprocal.
OneBeacon has determined that HGIE qualifies as a VIE. Furthermore, OneBeacon has determined that it is the primary beneficiary as a result of the management services provided to the reciprocal and the funds loaned to it. Accordingly, OneBeacon consolidates HGIE.
Consolidated amounts related to HGIE included total assets of
$5.1 million
and total liabilities of
$5.0 million
as of both
December 31, 2016 and 2015
. As of
December 31, 2016
, the net amount of capital at risk is equal to the HGIE Surplus Notes of
$5.0 million
less the accumulated losses of
$0.5 million
which includes accrued interest on the HGIE Surplus Notes of
$0.6 million
that eliminates in consolidation.
Star & Shield Insurance Exchange
SSRM’s role as the attorney-in-fact to SSIE gives it the power to direct the significant economic activities of SSIE. Furthermore, White Mountains has determined that it is the primary beneficiary as a result of the management services provided to the reciprocal. Thus, SSIE qualifies as a VIE and is required to consolidate SSIE in its GAAP financial statements.
As of December 31, 2015, White Mountains held
$21.0 million
of SSIE Surplus Notes. On July 1, 2016, SSIE voluntarily ceased writing new policies. As a result, White Mountains wrote off its investment in the SSIE Surplus Notes which resulted in a
$21.0 million
decrease to net income attributable to White Mountains’s common shareholders and a corresponding increase to net income attributable to non-controlling interests.
On August 19, 2016, White Mountains reached an agreement to sell Star & Shield and its investment in SSIE Surplus Notes to National General Holdings Corp., which was subsequently terminated on December 2, 2016. On January 13, 2017, White Mountains reached an agreement to sell Star & Shield and its investment in SSIE Surplus Notes to K2 Insurance Services LLC. Consequently, White Mountains has presented Star & Shield’s and SSIE’s assets and liabilities as held for sale as of December 31, 2016 and 2015. As of December 31, 2016 and 2015, SSIE had total assets of
$9.2 million
and
$14.2 million
and total liabilities of
$4.8 million
and
$30.3 million
.
F-83
Prospector Offshore Fund
In 2015, White Mountains redeemed its interest in the Prospector Offshore Fund, Ltd. of which White Mountains’s owned
67.6%
prior to the redemption on June 30, 2015. The consolidated results of the Prospector Offshore Fund are included in Other Operations from January 1, 2015 through June 30, 2015, at which point the results of the Prospector Offshore Fund were no longer consolidated by White Mountains. Prior to the redemption, White Mountains determined that the Prospector Offshore Fund was a VIE of which White Mountains was the primary beneficiary and was required to consolidate.
White Mountains accounts for its financial instruments at fair value with the exception of the OBH Senior Notes and MediaAlpha Bank Facility, which are recorded as debt at face value less unamortized original issue discount. The following table summarizes the fair values and book values as of
December 31, 2016 and 2015
:
|
December 31, 2016
|
December 31, 2015
|
|||||||||||||||
|
Millions
|
Fair
Value
|
Carrying
Value
|
Fair
Value
|
Carrying
Value
|
||||||||||||
|
OBH Senior Notes
|
$
|
274.2
|
|
$
|
273.2
|
|
$
|
276.4
|
|
$
|
272.9
|
|
||||
|
MediaAlpha Bank Facility
|
13.0
|
|
12.7
|
|
15.0
|
|
14.7
|
|
||||||||
The fair value estimate for the OBH Senior Notes has been determined using observable inputs and is considered a Level 2 measurement. The fair value estimate for the MediaAlpha Bank Facility has been determined based on a discounted cash flows approach and is considered to be Level 3 measurement.
Prospector
Mr. John Gillespie, the founder and Managing Member of Prospector, retired from the WTM Board of Directors in May 2015. Until June 30, 2015, Prospector served as a discretionary adviser with respect to specified assets, primarily common equity securities and convertible fixed maturity investments, managed directly or through WM Advisors on behalf of White Mountains and other clients of WM Advisors. At that time, the investment management agreements between WM Advisors and Prospector and OneBeacon and Prospector and the Consulting Agreement described below were terminated.
Pursuant to an investment management agreements with WM Advisors (the “WMA Agreement”) and OneBeacon (the “OneBeacon Agreement”), Prospector charged WM Advisors and OneBeacon fees based on the following schedule: 100 basis points on the first
$200 million
of assets under management; 50 basis points on the next
$200 million
; and 25 basis points on amounts over
$400 million
. During 2015 and 2014, Prospector earned
$2.1 million
and
$6.5 million
in total fees pursuant to the investment management agreements with WM Advisors and OneBeacon. Prospector also had a separate investment management agreement with Symetra that was terminated in the fourth quarter of 2015.
Prospector also advised White Mountains on matters including capital management, asset allocation, private equity investments and mergers and acquisitions. Pursuant to a Consulting Agreement for those services, Prospector was granted
6,250
performance shares for the 2014-2016 cycle and
7,000
performance shares for the 2013-2015 cycle. Under the terms of the Consulting Agreement, Prospector earned a prorated portion of the outstanding performance share grants at the time of the termination of the Consulting Agreement and was paid
$5.5 million
in respect thereof.
Pursuant to a pre-existing revenue sharing agreement (the “Revenue Agreement”), Prospector paid White Mountains
6%
of the annual revenues in excess of
$500,000
of certain of Prospector’s funds in return for White Mountains having made a founding investment in 1997. White Mountains and Prospector mutually agreed to terminate the Revenue Agreement as of June 30, 2015. During 2014, White Mountains earned
$0.4 million
under the Revenue Agreement. No amount was earned under the Revenue Agreement in 2015.
Prior to fully redeeming their interests on June 30, 2015, White Mountains and OneBeacon had interests in limited partnership investments managed by Prospector (the “Funds”). For the years ended December 31, 2015 and 2014, White Mountains and OneBeacon incurred
$0.4 million
and
$1.1 million
in management fees and
$0.1 million
and
$0.7 million
in incentive fees.
F-84
Other Relationships and Transactions
WM Advisors provided investment advisory and management services to Symetra through the fourth quarter of 2016. In August 2015, Symetra announced it had entered into a merger agreement with Sumitomo Life pursuant to which Sumitomo Life would acquire all of the outstanding shares of Symetra. Following the announcement and Symetra shareholders’ November 5, 2015 meeting to approve the transaction, White Mountains relinquished its representation on Symetra’s board of directors and Symetra was no longer a related party to White Mountains. During 2015 and 2014, WMA earned
$8.0 million
and
$18.4 million
in fees from Symetra.
During 2016, the Company repurchased shares from Franklin Mutual Advisers in two transactions. On April 19, 2016, the Company repurchased
325,000
WTM common shares for
$807.00
per share, the market price at the time the agreement was reached. On September 15, 2016, the Company repurchased
305,000
WTM common shares for
$820.00
per share, the market price at the time the agreement was reached.
During 2015, the Company repurchased shares from Franklin Mutual Advisers, a beneficial owner of the Company, in two transactions. On June 1, 2015, the Company repurchased
19,688
WTM common shares for
$650.03
per share, the market price at the time the agreement was reached. On September 17, 2015, the Company repurchased
26,300
WTM common shares for
$761.50
, the market price at the time the agreement was reached.
White Mountains leases certain office space under non-cancellable operating leases that expire on various dates through 2021. Rental expense for all of White Mountains’s locations was
$14.1 million
,
$14.0 million
and
$12.9 million
for the years ended
December 31, 2016, 2015 and 2014
. White Mountains also has various other lease obligations that are immaterial in the aggregate. White Mountains’s future annual minimum rental payments required under non-cancellable leases, which are primarily for office space, are
$11.4 million
,
$9.5 million
,
$8.0 million
, and
$32.6 million
for the years 2017, 2018, 2019 and 2020 and thereafter.
White Mountains also has future binding commitments to fund certain other-long term investments. These commitments, which total
$138.1 million
, do not have fixed funding dates.
Capital Lease
In December 2016, OneBeacon’s lease agreement with Fifth Third expired and OneBeacon purchased the leased assets under the agreement. In December 2016, the lease agreement with US Bancorp expired and OneBeacon’s leased assets under the agreement with a remaining book value of
$1.3 million
transferred back to OneBeacon.
As of December 31, 2015, OneBeacon had a capital lease obligation of
$1.7 million
, included within other liabilities, and a capital lease asset of
$2.4 million
, included within other assets. As of December 31, 2016, OneBeacon does not have capital lease assets or obligations.
Assigned Risks
As a condition of its license to do business in certain states, White Mountains’s insurance operations are required to participate in mandatory shared market mechanisms. Each state dictates the types of insurance and the level of coverage that must be provided. The total amount of business an insurer is required to accept is based on its market share of voluntary business in the state. In certain cases, White Mountains is obligated to write business from mandatory shared market mechanisms at some time in the future based on the market share of voluntary policies it is currently writing. Underwriting results related to assigned risk plans are typically adverse and are not subject to the predictability associated with White Mountains’s voluntarily written business.
Under existing guaranty fund laws in all states, insurers licensed to do business in those states can be assessed for certain obligations of insolvent insurance companies to policyholders and claimants. White Mountains accrues any significant insolvencies when the loss is probable and the assessment amount can be reasonably estimated. The actual amount of such assessments will depend upon the final outcome of rehabilitation proceedings and will be paid over several years. As of
December 31, 2016
, the reserve for such assessments totaled
$8.0 million
.
F-85
Legal Contingencies
White Mountains, and the insurance industry in general, are routinely subject to claims related litigation and arbitration in the normal course of business, as well as litigation and arbitration that do not arise from, or are directly related to, claims activity. White Mountains’s estimates of the costs of settling matters routinely encountered in claims activity are reflected in the reserves for unpaid loss and LAE. See
Note 3 - “Reserves for Unpaid Losses and Loss Adjustment Expenses”
.
White Mountains considers the requirements of ASC 450 when evaluating its exposure to non-claims related litigation and arbitration. ASC 450 requires that accruals be established for litigation and arbitration if it is probable that a loss has been incurred and it can be reasonably estimated. ASC 450 also requires that litigation and arbitration be disclosed if it is probable that a loss has been incurred or it there is a reasonable possibility that a loss may have been incurred.
Although the ultimate outcome of claims and non-claims related litigation and arbitration, and the amount or range of potential loss at any particular time, is often inherently uncertain, management does not believe that the ultimate outcome of such claims and non-claims related litigation and arbitration will have a material adverse effect on White Mountains’s financial condition, results of operations or cash flows.
The following summarizes significant legal contingencies, ongoing non-claims related litigation or arbitration as of
December 31, 2016
:
Esurance
On October 7, 2011, the Company completed the sale of its Esurance and Answer Financial subsidiaries (the “Transferred Subsidiaries”) to The Allstate Corporation (“Allstate”) pursuant to a Stock Purchase Agreement dated as of May 17, 2011. Subject to specified thresholds and limits, the Company remains contingently liable to Allstate for specified matters related to the pre-closing period, including (a) losses of the Transferred Subsidiaries arising from extra-contractual claims and claims in excess of policy limits, (b) certain corporate reorganizations effected to remove entities from the Transferred Subsidiaries that were not being sold in the transaction, and (c) certain tax matters, including certain net operating losses being less than stated levels.
Tribune Company
In June 2011, Deutsche Bank Trust Company Americas, Law Debenture Company of New York and Wilmington Trust Company (collectively referred to as “Plaintiffs”), in their capacity as trustees for certain senior notes issued by the Tribune Company (“Tribune”), filed lawsuits in various jurisdictions (the “Noteholder Actions”) against numerous defendants including OneBeacon, OneBeacon-sponsored benefit plans and other affiliates of White Mountains in their capacity as former shareholders of Tribune seeking recovery of the proceeds from the sale of common stock of Tribune in connection with Tribune's leveraged buyout in 2007 (the “LBO”). Tribune filed for bankruptcy in 2008 in the Delaware bankruptcy court (the “Bankruptcy Court”). The Bankruptcy Court granted Plaintiffs permission to commence these LBO-related actions, and in 2011, the Judicial Panel on Multidistrict Litigation granted a motion to consolidate the actions for pretrial matters and transferred all such proceedings to the U.S. District Court for the Southern District of New York (the “SDNY”). Plaintiffs seek recovery of the proceeds received by the former Tribune shareholders on a theory of constructive fraudulent transfer asserting that Tribune purchased or repurchased its common shares without receiving fair consideration at a time when it was, or as a result of the purchases of shares, was rendered, insolvent. OneBeacon received approximately
$32.0 million
and Sirius Group, which is now included in discontinued operations, received
$6.1 million
for Tribune common stock tendered in connection with the LBO.
The Court granted an omnibus motion to dismiss the Noteholder Actions in September 2013 and Plaintiffs’ appealed. On March 29, 2016, a three judge panel of the U.S Second Circuit Court of Appeals affirmed the dismissal of the Noteholder Actions. On July 22, 2016, the Plaintiff's petition to the Second Circuit for reconsideration or for a rehearing en banc was denied in full. On September 9, 2016 the Plaintiffs filed for a writ of certiorari, seeking review in the U. S. Supreme Court.
F-86
In addition, OneBeacon, OneBeacon-sponsored benefit plans and other affiliates of White Mountains in their capacity as former shareholders of Tribune, along with thousands of former Tribune shareholders, have been named as defendants in an adversary proceeding brought by the Official Committee of Unsecured Creditors of the Tribune Company (the “Committee”), on behalf of the Tribune Company, which seeks to avoid the repurchase of shares by Tribune in the LBO on a theory of intentional fraudulent transfer (the “Committee Action”). Tribune emerged from bankruptcy in 2012, and a litigation trustee replaced the Committee as plaintiff in the Committee Action. This matter was consolidated for pretrial matters with the Noteholder Actions in the SDNY and was stayed pending the motion to dismiss in the Noteholder Actions. An omnibus motion to dismiss the shareholder defendants in the Committee Action was filed in May 2014 and the motion was granted on January 6, 2017. The plaintiff has requested permission to move the SDNY to certify the decision as a final judgment capable of immediate appeal. No amount has been accrued in connection with this matter as of December 31, 2016, as the amount of loss, if any, cannot be reasonably estimated.
OneTitle
White Mountains holds a
20%
ownership interest in OneTitle Holdings LLC (“OTH”) and has provided a
$10.0 million
surplus note facility under which OTH’s wholly-owned insurance subsidiary, OneTitle National Guaranty Company, Inc. may, under certain circumstances, draw funds. At December 31, 2016, no funds had been drawn on the surplus note facility.
Sirius Group
On April 18, 2016, White Mountains completed the sale of Sirius Group to CMI for approximately
$2.6 billion
.
$161.8 million
of this amount was used to purchase certain assets to be retained by White Mountains out of Sirius Group, including shares of OneBeacon. The amount paid at closing was based on an estimate of Sirius Group’s closing date tangible common shareholder’s equity. During 2016, White Mountains recorded
$363.2 million
of gain from sale of Sirius Group in discontinued operations in the statement of operations and
$113.3 million
in other comprehensive income from discontinued operations.
Through April 18, 2016, Sirius Group’s results are reported as discontinued operations and assets and liabilities held for sale within White Mountains’s GAAP financial statements. Assets held for sale did not include White Mountains’s investment in OneBeacon and certain other investments that were held in the Sirius Group legal entities. As of December 31, 2015, the value of these investments, net of related tax effects, was
$686.2 million
, of which
$528.6 million
related to Symetra. Net income (loss) from discontinued operations does not include White Mountains’s net investment income and net realized and unrealized investment gains (losses) associated with these investments. For the years ended December 31, 2016, 2015 and 2014,
$3.7 million
,
$205.0 million
, of which
$200.8 million
is related to Symetra, and
$2.7 million
of net investment income and net realized and unrealized investment gains (losses), net of related tax effects, that were included in the Sirius Group legal entities have been excluded from net income (loss) from discontinued operations. For the years ended December 31, 2016, 2015 and 2014, White Mountains recorded
$(4.3) million
,
$81.1 million
and
$262.0 million
of net (loss) income from discontinued operations and
$32.0 million
,
$(65.0) million
, and
$(169.5) million
of other comprehensive income (loss) from Sirius Group.
The transactions to purchase the investments in OneBeacon and the other investments held by Sirius Group prior to the closing are presented in the statement of cash flows as net settlement of investment cash flows with discontinued operations.
Tranzact
On June 9, 2016, White Mountains announced that it had entered into an agreement for the sale of Tranzact to an affiliate of Clayton, Dubilier & Rice, LLC. On July 21, 2016, White Mountains completed the sale of Tranzact and received net proceeds of
$221.3 million
at closing. On October 5, White Mountains received additional proceeds of
$1.2 million
following the release of the post-closing purchase price adjustment escrow. For the year ended December 31, 2016, White Mountains recorded
$51.9 million
of gain from the sale of Tranzact in discontinued operations in the statement of operations. See
Note 2 - “Significant Transactions”
.
Through July 21, 2016, Tranzact's results of operations are reported as discontinued operations and assets and liabilities held for sale within White Mountains's GAAP financial statements. For the year ended December 31, 2016, 2015, and 2014, White Mountains recorded net income (loss) from discontinued operations of
$6.1 million
,
$(1.9) million
and
$0.4 million
from Tranzact.
F-87
White Mountains recognized a
$21.4 million
tax benefit in continuing operations related to the reversal of a valuation allowance that resulted from the gain on the sale of Tranzact recognized within discontinued operations. This tax benefit was recorded in continuing operations with an offsetting amount of net tax expense recorded in discontinued operations,
$30.2 million
of tax expense was recorded to gain from sale of Tranzact in discontinued operations and a
$8.8 million
tax benefit was recorded to net income from discontinued operations.
Star & Shield
On July 1, 2016, SSIE voluntarily ceased writing new policies. As a result, White Mountains wrote off its investment in SSIE Surplus Notes which resulted in a
$21.0 million
total decrease to net income attributable to White Mountain’s common shareholders and a corresponding increase to net income attributable to non-controlling interests. On January 13, 2017, White Mountains reached an agreement to sell Star & Shield and its investment in SSIE Surplus Notes to K2 Insurance Services LLC. As a result, White Mountains has presented Star & Shield’s and SSIE’s assets and liabilities as held for sale as of December 31, 2016 and 2015.
OneBeacon Runoff
In December 2014, OneBeacon completed the Runoff Transaction. The results of operations for the Runoff Business have been classified as discontinued operations and are presented, net of related income taxes, in the statement of operations and comprehensive income. The amounts classified as discontinued operations exclude investing and financing activities that are conducted on an overall consolidated level and, accordingly, there were no separately identifiable investments associated with the Runoff Business. The vast majority of the gross and net run-off unpaid loss and LAE reserves were included in the entities that were transferred to Armour. As of December 31, 2016 and 2015, gross loss and LAE reserves of
$18.3 million
and
$20.4 million
related to the Runoff Business were ceded to OBIC, an indirect wholly-owned subsidiary of Armour, beginning December 23, 2014, by a
100%
quota share agreement with ASIC.
For the year ended December 31, 2015, White Mountains recorded
$0.3 million
to the gain from sale of discontinued operations related to an adjustment on the estimated loss on sale, which included the final settlement of certain post-closing items. For the year ended December 31, 2015, the net loss from discontinued operations relating to the Runoff Business, net of tax, was
$0.5 million
.
Esurance
For the years ended December 31, 2015 and 2014, White Mountains recorded a gain from sale of Esurance and AFI in discontinued operations of
$17.9 million
and
$3.2 million
, which primarily related to a payments from Allstate for favorable development on loss reserves. Since the closing of the transaction through December 31, 2016, White Mountains has received a net amount of
$28.3 million
from Allstate, primarily related to the favorable development on loss reserves. See
Note 21 - “Commitments and Contingencies”.
Fireman's Fund
During 2014, White Mountains recorded a gain in discontinued operations of
$14.0 million
from a payment received from Allianz, the purchaser of White Mountains's former subsidiary Fireman’s Fund Insurance Company (“FFIC”), related to the utilization of alternative minimum tax credits associated with the tax loss on the sale of FFIC in 1991.
F-88
Summary of Reclassified Balances and Related Items
Net Assets Held for Sale
The following summarizes the assets and liabilities associated with business classified as held for sale. At December 31, 2016, the amounts presented relate to Star and Shield and SSIE. At December 31, 2015, amounts presented relate to Sirius Group, Tranzact, Star and Shield and SSIE.
|
December 31,
|
||||||||
|
Millions
|
2016
|
2015
|
||||||
|
Assets held for sale
|
||||||||
|
Fixed maturity investments, at fair value
|
$
|
6.6
|
|
$
|
2,383.5
|
|
||
|
Short-term investments, at amortized cost (which approximates fair value)
|
.2
|
|
352.1
|
|
||||
|
Common equity securities, at fair value
|
—
|
|
174.4
|
|
||||
|
Other long-term investments
|
—
|
|
72.2
|
|
||||
|
Total Investments
|
6.8
|
|
2,982.2
|
|
||||
|
Cash
|
.9
|
|
150.2
|
|
||||
|
Reinsurance recoverable on unpaid losses
|
.3
|
|
283.6
|
|
||||
|
Reinsurance recoverable on paid losses
|
—
|
|
10.2
|
|
||||
|
Insurance and reinsurance premiums receivable
|
1.5
|
|
326.6
|
|
||||
|
Deferred acquisition costs
|
—
|
|
74.6
|
|
||||
|
Deferred tax asset
|
—
|
|
303.1
|
|
||||
|
Ceded unearned insurance and reinsurance premiums
|
—
|
|
87.7
|
|
||||
|
Accounts receivable on unsettled investment sales
|
—
|
|
29.0
|
|
||||
|
Goodwill and other intangible assets
|
—
|
|
330.5
|
|
||||
|
Other assets
|
.6
|
|
212.7
|
|
||||
|
Total assets held for sale
|
$
|
10.1
|
|
$
|
4,790.4
|
|
||
|
Liabilities held for sale
|
||||||||
|
Loss and loss adjustment expense reserves
|
$
|
5.0
|
|
$
|
1,650.4
|
|
||
|
Unearned insurance and reinsurance premiums
|
1.2
|
|
344.3
|
|
||||
|
Debt
|
—
|
|
506.4
|
|
||||
|
Deferred tax liability
|
—
|
|
270.6
|
|
||||
|
Accrued incentive compensation
|
—
|
|
64.2
|
|
||||
|
Funds held under reinsurance treaties
|
—
|
|
52.9
|
|
||||
|
Other liabilities
|
(1.1
|
)
|
158.6
|
|
||||
|
Total liabilities held for sale
|
5.1
|
|
3,047.4
|
|
||||
|
Net assets held for sale
|
$
|
5.0
|
|
$
|
1,743.0
|
|
||
F-89
Net Income (Loss) from Discontinued Operations
The following summarizes the results of operations, including related income taxes associated with the business classified as discontinued operations. For the year ended December 31, 2016, the amounts presented relate to Sirius Group and Tranzact. For the years ended December 31, 2015 and 2014, the amounts presented relate to Sirius Group, Tranzact, Esurance, and the OneBeacon's runoff business. The results of discontinued operations from Sirius Group and Tranzact up to the closing date of the transaction inure to White Mountains.
|
Year Ended December 31, 2016
|
||||||||||||
|
Millions
|
Sirius Group
|
Other Disc Ops
|
Total
|
|||||||||
|
Revenues
|
|
|
||||||||||
|
Earned insurance premiums
|
$
|
240.1
|
|
$
|
—
|
|
$
|
240.1
|
|
|||
|
Net investment income
|
14.4
|
|
—
|
|
14.4
|
|
||||||
|
Net realized and unrealized investment losses
|
(1.5
|
)
|
—
|
|
(1.5
|
)
|
||||||
|
Other revenue
|
.6
|
|
119.6
|
|
120.2
|
|
||||||
|
Total revenues
|
253.6
|
|
119.6
|
|
373.2
|
|
||||||
|
Expenses
|
||||||||||||
|
Loss and loss adjustment expenses
|
154.9
|
|
—
|
|
154.9
|
|
||||||
|
Insurance and reinsurance acquisition expenses
|
59.0
|
|
—
|
|
59.0
|
|
||||||
|
Other underwriting expenses
|
30.9
|
|
—
|
|
30.9
|
|
||||||
|
Interest expense on debt
|
7.9
|
|
3.2
|
|
11.1
|
|
||||||
|
General and administrative expenses
|
8.3
|
|
118.8
|
|
127.1
|
|
||||||
|
Total expenses
|
261.0
|
|
122.0
|
|
383.0
|
|
||||||
|
Pre-tax loss
|
(7.4
|
)
|
(2.4
|
)
|
(9.8
|
)
|
||||||
|
Income tax benefit
|
3.1
|
|
6.4
|
|
9.5
|
|
||||||
|
Net (loss) income from discontinued operations
|
(4.3
|
)
|
4.0
|
|
(.3
|
)
|
||||||
|
Gain from sale of Sirius Group, net of tax
|
363.2
|
|
—
|
|
363.2
|
|
||||||
|
Gain from sale of Tranzact, net of tax
|
—
|
|
51.9
|
|
51.9
|
|
||||||
|
Total income from discontinued operations
|
358.9
|
|
55.9
|
|
414.8
|
|
||||||
|
Change in foreign currency translation and
other from discontinued operations, net of tax
|
32.0
|
|
—
|
|
32.0
|
|
||||||
|
Recognition of foreign currency translation and other
from sale of Sirius Group, net of tax
|
113.3
|
|
—
|
|
113.3
|
|
||||||
|
Comprehensive income from discontinued operations
|
$
|
504.2
|
|
$
|
55.9
|
|
$
|
560.1
|
|
|||
F-90
|
Year Ended December 31, 2015
|
||||||||||||
|
Millions
|
Sirius Group
|
Other Disc Ops
|
Total
|
|||||||||
|
Revenues
|
|
|
||||||||||
|
Earned insurance premiums
|
$
|
847.0
|
|
$
|
—
|
|
$
|
847.0
|
|
|||
|
Net investment income
|
40.7
|
|
—
|
|
40.7
|
|
||||||
|
Net realized and unrealized investment gains
|
15.1
|
|
—
|
|
15.1
|
|
||||||
|
Other (loss) revenue
|
(20.6
|
)
|
186.2
|
|
165.6
|
|
||||||
|
Total revenues
|
882.2
|
|
186.2
|
|
1,068.4
|
|
||||||
|
Expenses
|
|
|
||||||||||
|
Loss and loss adjustment expenses
|
422.7
|
|
—
|
|
422.7
|
|
||||||
|
Insurance and reinsurance acquisition expenses
|
189.8
|
|
—
|
|
189.8
|
|
||||||
|
Other underwriting expenses
|
107.9
|
|
—
|
|
107.9
|
|
||||||
|
Interest expense on debt
|
26.6
|
|
4.0
|
|
30.6
|
|
||||||
|
General and administrative expenses
|
27.0
|
|
185.3
|
|
212.3
|
|
||||||
|
Total expenses
|
774.0
|
|
189.3
|
|
963.3
|
|
||||||
|
Pre-tax income (loss)
|
108.2
|
|
(3.1
|
)
|
105.1
|
|
||||||
|
Income tax (expense) benefit
|
(27.1
|
)
|
.7
|
|
(26.4
|
)
|
||||||
|
Net income (loss) from discontinued operations
|
81.1
|
|
(2.4
|
)
|
78.7
|
|
||||||
|
Gain from sale of OneBeacon, net of tax
|
—
|
|
.3
|
|
.3
|
|
||||||
|
Gain from sale of Esurance and AFI, net of tax
|
—
|
|
17.9
|
|
17.9
|
|
||||||
|
Total income from discontinued operations
|
81.1
|
|
15.8
|
|
96.9
|
|
||||||
|
Change in foreign currency translation and
other from discontinued operations, net of tax
|
(65.0
|
)
|
—
|
|
(65.0
|
)
|
||||||
|
Comprehensive income from discontinued operations
|
$
|
16.1
|
|
$
|
15.8
|
|
$
|
31.9
|
|
|||
F-91
|
Year Ended December 31, 2014
|
||||||||||||
|
Millions
|
Sirius Group
|
Other Disc Ops
|
Total
|
|||||||||
|
Revenues
|
|
|
||||||||||
|
Earned insurance premiums
|
$
|
873.9
|
|
$
|
.1
|
|
$
|
874.0
|
|
|||
|
Net investment income
|
40.9
|
|
—
|
|
40.9
|
|
||||||
|
Net realized and unrealized investment gains
|
205.4
|
|
—
|
|
205.4
|
|
||||||
|
Other (loss) revenue
|
(62.4
|
)
|
43.0
|
|
(19.4
|
)
|
||||||
|
Total revenues
|
1,057.8
|
|
43.1
|
|
1,100.9
|
|
||||||
|
Expenses
|
|
|
||||||||||
|
Loss and loss adjustment expenses
|
345.3
|
|
(.7
|
)
|
344.6
|
|
||||||
|
Insurance and reinsurance acquisition expenses
|
193.6
|
|
.1
|
|
193.7
|
|
||||||
|
Other underwriting expenses
|
129.7
|
|
3.5
|
|
133.2
|
|
||||||
|
Interest expense on debt
|
26.3
|
|
1.4
|
|
27.7
|
|
||||||
|
General and administrative expenses
|
30.5
|
|
41.2
|
|
71.7
|
|
||||||
|
Total expenses
|
725.4
|
|
45.5
|
|
770.9
|
|
||||||
|
Pre-tax income (loss)
|
332.4
|
|
(2.4
|
)
|
330.0
|
|
||||||
|
Income tax (expense) benefit
|
(70.4
|
)
|
1.0
|
|
(69.4
|
)
|
||||||
|
Net income (loss) from discontinued operations
|
262.0
|
|
(1.4
|
)
|
260.6
|
|
||||||
|
Gain from sale of FFIC, net of tax
|
—
|
|
14.0
|
|
14.0
|
|
||||||
|
Loss from sale of OneBeacon, net of tax
|
—
|
|
(18.8
|
)
|
(18.8
|
)
|
||||||
|
Gain from sale of Esurance and AFI, net of tax
|
—
|
|
3.2
|
|
3.2
|
|
||||||
|
Total income (loss) from discontinued operations
|
262.0
|
|
(3.0
|
)
|
259.0
|
|
||||||
|
Change in foreign currency translation and
other from discontinued operations, net of tax
|
(169.5
|
)
|
—
|
|
(169.5
|
)
|
||||||
|
Comprehensive income (loss) from discontinued operations
|
$
|
92.5
|
|
$
|
(3.0
|
)
|
$
|
89.5
|
|
|||
Net Change in Cash from Discontinued Operations
The following summarizes the net change in cash associated with the businesses classified as discontinued operations:
|
Year ended
|
||||||||||||
|
December 31,
|
||||||||||||
|
Millions
|
2016
|
2015
|
2014
|
|||||||||
|
Net cash (used for) provided from operations
|
$
|
(24.7
|
)
|
$
|
56.0
|
|
$
|
48.9
|
|
|||
|
Net cash provided from investing activities
|
221.7
|
|
(5.4
|
)
|
51.2
|
|
||||||
|
Net cash used for financing activities
|
(.2
|
)
|
(11.6
|
)
|
(64.5
|
)
|
||||||
|
Effect of exchange rate changes on cash
|
—
|
|
(4.5
|
)
|
(14.3
|
)
|
||||||
|
Net change in cash during the period
|
196.8
|
|
34.5
|
|
21.3
|
|
||||||
|
Cash balances at beginning of period
|
150.2
|
|
116.8
|
|
93.2
|
|
||||||
|
Net change in cash held for sale
|
(.3
|
)
|
(1.1
|
)
|
2.3
|
|
||||||
|
Cash sold as part of sale of consolidated subsidiaries
|
345.8
|
|
—
|
|
—
|
|
||||||
|
Cash balances at end of period
|
$
|
.9
|
|
$
|
150.2
|
|
$
|
116.8
|
|
|||
F-92
Earnings Per Share
Basic earnings per share amounts are based on the weighted average number of common shares outstanding including unvested restricted shares that are considered participating securities. Diluted earnings per share amounts are based on the weighted average number of common shares including unvested restricted shares and the net effect of potentially dilutive common shares outstanding. The following table outlines the computation of earnings per share for discontinued operations for the years ended
December 31, 2016, 2015 and 2014
:
|
Year Ended December 31,
|
||||||||||||
|
2016
|
2015
|
2014
|
||||||||||
|
Basic and diluted earnings per share numerators (in millions):
|
|
|
|
|
||||||||
|
Net income attributable to White Mountains’s common shareholders
|
$
|
414.8
|
|
$
|
96.9
|
|
$
|
259.0
|
|
|||
|
Allocation of income for participating unvested restricted common shares
(1)
|
(5.4
|
)
|
(1.1
|
)
|
(3.3
|
)
|
||||||
|
Net income attributable to White Mountains’s common shareholders, net of
restricted common share amounts
(2)
|
$
|
409.4
|
|
$
|
95.8
|
|
$
|
255.7
|
|
|||
|
Basic earnings per share denominators (in thousands):
|
|
|
|
|
||||||||
|
Total average common shares outstanding during the period
|
5,014.9
|
|
5,879.2
|
|
6,104.9
|
|
||||||
|
Average unvested restricted common shares
(3)
|
(64.8
|
)
|
(68.0
|
)
|
(78.9
|
)
|
||||||
|
Basic earnings per share denominator
|
4,950.1
|
|
5,811.2
|
|
6,026.0
|
|
||||||
|
Diluted earnings per share denominator (in thousands):
|
|
|
|
|
||||||||
|
Total average common shares outstanding during the period
|
5,018.1
|
|
5,879.2
|
|
6,104.9
|
|
||||||
|
Average unvested restricted common shares
(3)
|
(64.8
|
)
|
(68.0
|
)
|
(78.9
|
)
|
||||||
|
Diluted earnings per share denominator
(4)
|
4,953.3
|
|
5,811.2
|
|
6,026.0
|
|
||||||
|
Basic earnings per share (in dollars):
|
$
|
82.71
|
|
$
|
16.48
|
|
$
|
42.43
|
|
|||
|
Diluted earnings per share (in dollars):
|
$
|
82.66
|
|
$
|
16.48
|
|
$
|
42.43
|
|
|||
|
(1)
|
Restricted shares issued by White Mountains contain dividend participation features, and therefore, are considered participating securities.
|
|
(2)
|
Net income (loss) attributable to White Mountains’s common shareholders, net of restricted share amounts, is equal to undistributed earnings for the years ended
December 31, 2016, 2015 and 2014
.
|
|
(3)
|
Restricted common shares outstanding vest either in equal annual installments or upon a stated date. See
|
|
(4)
|
The diluted earnings (loss) per share denominator for the years ended December 31, 2016, includes the impact of
40,000
common shares issuable upon exercise of the non-qualified options outstanding, which results in
3,217
incremental shares outstanding over the period.
|
Fair Value of Financial Instruments
The following table summarizes the fair value and carrying value of the Sirius Group financials instruments, the SIG Senior Notes and the SIG Preference Shares, and the Tranzact Bank Facility, which were carried at face value less unamortized issuance costs, as of December 31, 2015:
|
|
December 31, 2015
|
|||||||
|
Millions
|
Fair
Value
|
Carrying
Value
|
||||||
|
SIG Senior Notes
|
$
|
410.0
|
|
$
|
399.8
|
|
||
|
SIG Preference Shares
|
255.0
|
|
250.0
|
|
||||
|
Tranzact Bank Facility
|
102.8
|
|
102.9
|
|
||||
The fair value estimates for the SIG Senior Notes and the SIG Preference Shares have been determined based on indicative broker quotes and are considered to be Level 3 measurements. The fair value estimate for the Tranzact Bank Facility was determined based on a discount cash flows approach and is considered to be Level 3 measurements.
F-93
MANAGEMENT’S RESPONSIBILITY FOR FINANCIAL STATEMENTS
Management is responsible for the preparation and fair presentation of the financial statements included in this report. The financial statements have been prepared in conformity with GAAP in the United States. The preparation of financial statements in conformity with GAAP requires management to make estimates and assumptions that affect the reported amounts of assets and liabilities as of the date of the financial statements and the reported amounts of revenues and expenses during the reporting period. Actual results could differ from those estimates.
The Audit Committee of the Board, which is comprised entirely of independent, qualified directors, is responsible for the oversight of our accounting policies, financial reporting and internal control including the appointment and compensation of our independent registered public accounting firm. The Audit Committee meets periodically with management, our independent registered public accounting firm and our internal auditors to ensure they are carrying out their responsibilities. The Audit Committee is also responsible for performing an oversight role by reviewing our financial reports. Our independent registered public accounting firm and internal auditors have full and unlimited access to the Audit Committee, with or without management present, to discuss the adequacy of internal control over financial reporting and any other matters which they believe should be brought to their attention.
MANAGEMENT’S ANNUAL REPORT ON INTERNAL CONTROL OVER FINANCIAL REPORTING
Management is responsible for establishing and maintaining adequate internal control over financial reporting as defined in Rules 13a-15(f) and 15d-15(f) under the Securities Exchange Act of 1934. There are inherent limitations in the effectiveness of any internal control over financial reporting, including the possibility of human error and the circumvention or overriding of internal control. Accordingly, even effective internal control over financial reporting can provide only reasonable assurance with respect to financial statement preparation. Further, an effective internal control environment as of a point in time may become inadequate in the future because of changes in conditions, or deterioration in the degree of compliance with the policies and procedures.
We assessed the effectiveness of White Mountains’s internal control over financial reporting as of December 31, 2016. Our assessment did not include an assessment of the internal control over financial reporting for Removal Stars Ltd (“Buzzmove”) which was acquired on August 4, 2016. This acquisition represents less than 1% of White Mountains’ total assets as of December 31, 2016 and less than 1% of White Mountains’s total revenue for the year ended December 31, 2016. In making our assessment, we used the criteria set forth by the Committee of Sponsoring Organizations of the Treadway Commission (COSO) in Internal Control-Integrated Framework (2013). Based on this assessment, we have concluded that White Mountains maintained effective internal control over financial reporting as of December 31, 2016.
PricewaterhouseCoopers LLP, the Company’s independent registered public accounting firm, has audited the effectiveness of White Mountains’s internal control over financial reporting as of December 31, 2016 as stated in their report which appears on page F-95.
February 27, 2017
|
/s/ RAYMOND BARRETTE
|
|
/s/ DAVID T. FOY
|
|
Chairman and CEO
(Principal Executive Officer)
|
|
Executive Vice President and CFO
(Principal Financial Officer)
|
F-94
Report of Independent Registered Public Accounting Firm
To the Board of Directors and Shareholders of White Mountains Insurance Group, Ltd.:
In our opinion, the consolidated financial statements listed in the accompanying index present fairly, in all material respects, the financial position of White Mountains Insurance Group, Ltd. and its subsidiaries at December 31, 2016 and 2015, and the results of their operations and their cash flows for each of the three years in the period ended December 31, 2016 in conformity with accounting principles generally accepted in the United States of America. In addition, in our opinion, the financial statement schedules listed in the accompanying index
present fairly, in all material respects, the information set forth therein when read in conjunction with the related consolidated financial statements. Also in our opinion, the Company maintained, in all material respects, effective internal control over financial reporting as of December 31, 2016, based on criteria established in
Internal Control - Integrated Framework (2013)
issued by the Committee of Sponsoring Organizations of the Treadway Commission (COSO). The Company's management is responsible for these financial statements and financial statement schedules, for maintaining effective internal control over financial reporting and for its assessment of the effectiveness of internal control over financial reporting, included in the accompanying Management's annual report on internal control over financial reporting. Our responsibility is to express opinions on these financial statements, on the financial statement schedules, and on the Company's internal control over financial reporting based on our integrated audits. We conducted our audits in accordance with the standards of the Public Company Accounting Oversight Board (United States). Those standards require that we plan and perform the audits to obtain reasonable assurance about whether the financial statements are free of material misstatement and whether effective internal control over financial reporting was maintained in all material respects. Our audits of the financial statements included examining, on a test basis, evidence supporting the amounts and disclosures in the financial statements, assessing the accounting principles used and significant estimates made by management, and evaluating the overall financial statement presentation. Our audit of internal control over financial reporting included obtaining an understanding of internal control over financial reporting, assessing the risk that a material weakness exists, and testing and evaluating the design and operating effectiveness of internal control based on the assessed risk. Our audits also included performing such other procedures as we considered necessary in the circumstances. We believe that our audits provide a reasonable basis for our opinions.
A company’s internal control over financial reporting is a process designed to provide reasonable assurance regarding the reliability of financial reporting and the preparation of financial statements for external purposes in accordance with generally accepted accounting principles. A company’s internal control over financial reporting includes those policies and procedures that (i) pertain to the maintenance of records that, in reasonable detail, accurately and fairly reflect the transactions and dispositions of the assets of the company; (ii) provide reasonable assurance that transactions are recorded as necessary to permit preparation of financial statements in accordance with generally accepted accounting principles, and that receipts and expenditures of the company are being made only in accordance with authorizations of management and directors of the company; and (iii) provide reasonable assurance regarding prevention or timely detection of unauthorized acquisition, use, or disposition of the company’s assets that could have a material effect on the financial statements.
Because of its inherent limitations, internal control over financial reporting may not prevent or detect misstatements. Also, projections of any evaluation of effectiveness to future periods are subject to the risk that controls may become inadequate because of changes in conditions, or that the degree of compliance with the policies or procedures may deteriorate.
As described in Management’s annual report on internal control over financial reporting, management has excluded Removal Stars Ltd (“Buzzmove”) from its assessment of internal control over financial reporting as of December 31, 2016 because this entity was acquired by the Company during 2016. We have also excluded Buzzmove from our audit of internal control over financial reporting. Buzzmove is a consolidated subsidiary whose total assets and total revenues represent less than 1% and 1%, respectively, of the related consolidated financial statement amounts as of and for the year-ended December 31, 2016.
|
/s/ PricewaterhouseCoopers LLP
|
|
|
Boston, Massachusetts
|
|
|
February 27, 2017
|
|
F-95
SELECTED QUARTERLY FINANCIAL DATA
(Unaudited)
Selected quarterly financial data for
2016
and
2015
is shown in the following table. The quarterly financial data includes, in the opinion of management, all recurring adjustments necessary for a fair presentation of the results of operations for the interim periods. As a result of the sale of Tranzact, Sirius, and Esurance and the Runoff Business, the results of operations for Tranzact, Sirius, Esurance and the Runoff Business have been classified as discontinued operations and are now presented, net of related income taxes, as such in the statement of comprehensive income. Prior year amounts have been reclassified to conform to the current period’s presentation. See
Note 22 — “Held for Sale and Discontinued Operations”
.
|
2016 Three Months Ended
|
2015 Three Months Ended
|
|||||||||||||||||||||||||||||||
|
Millions, except per share amounts
|
Dec. 31
|
Sept. 30
|
June 30
|
Mar. 31
|
Dec. 31
|
Sept. 30
|
June 30
|
Mar. 31
|
||||||||||||||||||||||||
|
Revenues
|
$
|
268.2
|
|
$
|
365.0
|
|
$
|
358.2
|
|
$
|
369.3
|
|
$
|
602.6
|
|
$
|
296.1
|
|
$
|
368.7
|
|
$
|
354.3
|
|
||||||||
|
Expenses
|
335.0
|
|
345.0
|
|
360.3
|
|
360.8
|
|
356.3
|
|
383.0
|
|
373.8
|
|
351.3
|
|
||||||||||||||||
|
Pre-tax (loss) income
|
(66.8
|
)
|
20.0
|
|
(2.1
|
)
|
8.5
|
|
246.3
|
|
(86.9
|
)
|
(5.1
|
)
|
3.0
|
|
||||||||||||||||
|
Tax benefit (expense)
|
23.0
|
|
6.7
|
|
6.0
|
|
9.7
|
|
1.0
|
|
1.6
|
|
2.2
|
|
(4.6
|
)
|
||||||||||||||||
|
(Loss) income from continuing operations
|
(43.8
|
)
|
26.7
|
|
3.9
|
|
18.2
|
|
247.3
|
|
(85.3
|
)
|
(2.9
|
)
|
(1.6
|
)
|
||||||||||||||||
|
(Loss) income from discontinued operations, net of tax
|
(6.8
|
)
|
61.9
|
|
358.6
|
|
1.1
|
|
19.6
|
|
6.5
|
|
(.5
|
)
|
71.3
|
|
||||||||||||||||
|
Non-controlling interest in consolidated subsidiaries
|
17.3
|
|
3.1
|
|
(21.4
|
)
|
(6.3
|
)
|
(6.1
|
)
|
16.0
|
|
.9
|
|
7.3
|
|
||||||||||||||||
|
Equity in earnings of unconsolidated affiliates
|
—
|
|
—
|
|
—
|
|
—
|
|
7.1
|
|
3.9
|
|
6.8
|
|
7.3
|
|
||||||||||||||||
|
(Loss) income attributable to White Mountains’s common shareholders
|
$
|
(33.3
|
)
|
$
|
91.7
|
|
$
|
341.1
|
|
$
|
13.0
|
|
$
|
267.9
|
|
$
|
(58.9
|
)
|
$
|
4.3
|
|
$
|
84.3
|
|
||||||||
|
(Loss) income attributable to White Mountains’s common shareholders per share:
|
||||||||||||||||||||||||||||||||
|
Basic
|
||||||||||||||||||||||||||||||||
|
Continuing operations
|
$
|
(5.81
|
)
|
$
|
6.12
|
|
$
|
(3.44
|
)
|
$
|
2.51
|
|
$
|
43.82
|
|
$
|
(11.10
|
)
|
$
|
0.80
|
|
$
|
1.76
|
|
||||||||
|
Discontinued operations
|
(1.49
|
)
|
12.72
|
|
70.37
|
|
(.17
|
)
|
3.46
|
|
1.09
|
|
(.08
|
)
|
12.33
|
|
||||||||||||||||
|
Total consolidated operations
|
$
|
(7.30
|
)
|
$
|
18.84
|
|
$
|
66.93
|
|
$
|
2.34
|
|
$
|
47.28
|
|
$
|
(10.01
|
)
|
$
|
0.72
|
|
$
|
14.09
|
|
||||||||
|
Diluted
|
|
|
|
|
|
|
|
|
|
|
|
|
|
|
|
|
||||||||||||||||
|
Continuing operations
|
$
|
(5.81
|
)
|
$
|
6.11
|
|
$
|
(3.43
|
)
|
$
|
2.51
|
|
$
|
43.79
|
|
$
|
(11.10
|
)
|
$
|
0.80
|
|
$
|
1.76
|
|
||||||||
|
Discontinued operations
|
(1.49
|
)
|
12.69
|
|
70.22
|
|
(.17
|
)
|
3.46
|
|
1.09
|
|
(.08
|
)
|
12.33
|
|
||||||||||||||||
|
Total consolidated operations
|
$
|
(7.30
|
)
|
$
|
18.80
|
|
$
|
66.79
|
|
$
|
2.34
|
|
$
|
47.25
|
|
$
|
(10.01
|
)
|
$
|
0.72
|
|
$
|
14.09
|
|
||||||||
F-96
SCHEDULE I
WHITE MOUNTAINS INSURANCE GROUP, LTD.
SUMMARY OF INVESTMENTS—OTHER THAN
INVESTMENTS IN RELATED PARTIES
At
December 31, 2016
|
Millions
|
Cost
|
Carrying
Value
|
Fair
Value
|
|||||||||
|
Fixed maturity investments:
|
|
|
|
|
|
|
||||||
|
Bonds:
|
||||||||||||
|
U.S. Government and government agencies and authorities
|
$
|
281.7
|
|
$
|
278.3
|
|
$
|
278.3
|
|
|||
|
Debt securities issued by corporations
|
1,512.6
|
|
1,509.4
|
|
1,509.4
|
|
||||||
|
States, municipalities and political subdivisions
|
308.8
|
|
309.0
|
|
309.0
|
|
||||||
|
Mortgage and asset-backed securities
|
2,141.7
|
|
2,132.9
|
|
2,132.9
|
|
||||||
|
Foreign governments
|
12.9
|
|
13.2
|
|
13.2
|
|
||||||
|
Preferred stocks
|
8.3
|
|
14.0
|
|
14.0
|
|
||||||
|
Total fixed maturity investments
(1)
|
4,266.0
|
|
4,256.8
|
|
4,256.8
|
|
||||||
|
Short-term investments
(1)
|
287.1
|
|
287.1
|
|
287.1
|
|
||||||
|
Common equity securities:
|
|
|
|
|||||||||
|
Exchange traded funds
|
316.4
|
|
321.6
|
|
321.6
|
|
||||||
|
Banks, trust and insurance companies
|
11.2
|
|
11.6
|
|
11.6
|
|
||||||
|
Public utilities
|
—
|
|
—
|
|
—
|
|
||||||
|
Industrial, miscellaneous and other
|
113.2
|
|
141.1
|
|
141.1
|
|
||||||
|
Total common equity securities
|
440.8
|
|
474.3
|
|
474.3
|
|
||||||
|
Other long-term investments
(2)
|
314.9
|
|
323.3
|
|
323.3
|
|
||||||
|
Total investments
|
$
|
5,308.8
|
|
$
|
5,341.5
|
|
$
|
5,341.5
|
|
|||
|
(1)
|
Includes carrying value of
$6.6
in fixed maturity investments and
$0.1
in short-term investments that are classified as assets held for sale related to SSIE.
|
|
(2)
|
Includes carrying value of
$3.5
associated with other long-term investment limited partnerships accounted for using the equity method,
$(1.2)
related to foreign currency forward contracts, and
$12.3
for the carrying value of tax advantaged federal affordable housing development fund accounted for using the proportional amortization method.
|
Schedules of the Registrant should be read in conjunction with the Consolidated Financial Statements and Notes.
FS-1
SCHEDULE II
CONDENSED FINANCIAL INFORMATION OF THE REGISTRANT
CONDENSED BALANCE SHEETS
|
December 31,
|
||||||||
|
Millions
|
2016
|
2015
|
||||||
|
Assets:
|
|
|
|
|
||||
|
Cash
|
$
|
3.1
|
|
$
|
.3
|
|
||
|
Fixed maturity investments, at fair value
|
80.0
|
|
—
|
|
||||
|
Other long-term investments
(1)
|
(1.2
|
)
|
—
|
|
||||
|
Short-term investments, at amortized cost
|
12.5
|
|
23.4
|
|
||||
|
Other assets
|
1.4
|
|
6.3
|
|
||||
|
Investments in consolidated and unconsolidated affiliates
|
4,898.2
|
|
4,350.9
|
|
||||
|
Total assets
|
$
|
4,994.0
|
|
$
|
4,380.9
|
|
||
|
Liabilities:
|
|
|
|
|
||||
|
Revolving line of credit
|
$
|
—
|
|
$
|
50.0
|
|
||
|
Payable to subsidiary
(2)
|
1,387.2
|
|
400.0
|
|
||||
|
Other liabilities
|
3.5
|
|
17.7
|
|
||||
|
Total liabilities
|
1,390.7
|
|
467.7
|
|
||||
|
White Mountains’s common shareholders’ equity
|
3,603.3
|
|
3,913.2
|
|
||||
|
Total liabilities and equity
|
$
|
4,994.0
|
|
$
|
4,380.9
|
|
||
CONDENSED STATEMENTS OF OPERATIONS AND COMPREHENSIVE INCOME
|
Year Ended December 31,
|
|||||||||||||
|
Millions
|
2016
|
2015
|
2014
|
||||||||||
|
(Loss) revenues (including realized gains and losses)
|
$
|
(1.0
|
)
|
$
|
5.0
|
|
$
|
.3
|
|
||||
|
Expenses
|
68.2
|
|
59.9
|
|
32.3
|
|
|||||||
|
Pre-tax loss
|
(69.2
|
)
|
(54.9
|
)
|
(32.0
|
)
|
|||||||
|
Income tax (expense) benefit
|
(.5
|
)
|
—
|
|
.9
|
|
|||||||
|
Net loss
|
(69.7
|
)
|
(54.9
|
)
|
(31.1
|
)
|
|||||||
|
Net gain from discontinued operations, net of tax
|
—
|
|
—
|
|
13.9
|
|
(3)
|
||||||
|
Equity in earnings from consolidated and unconsolidated affiliates
|
482.2
|
|
352.5
|
|
329.4
|
|
|||||||
|
Net income attributable to White Mountains’s common shareholders
|
412.5
|
|
297.6
|
|
312.2
|
|
|||||||
|
Other comprehensive income (loss) items, after-tax
|
145.3
|
|
(100.4
|
)
|
(101.6
|
)
|
|||||||
|
Comprehensive income attributable to White Mountains’s common
shareholders |
$
|
557.8
|
|
$
|
197.2
|
|
$
|
210.6
|
|
||||
|
Computation of net income available to common shareholders:
|
|||||||||||||
|
Net income available to common shareholders
|
$
|
412.5
|
|
$
|
297.6
|
|
$
|
312.2
|
|
||||
(1)
Other investments includes
$(1.2)
related to foreign currency forward contracts. See
Note 9 — “Derivatives
”.
(2)
During 2016 and 2015, the Company used cash proceeds received from the issuance of debt from its direct wholly-owned subsidiary, Lone Tree Holdings, Ltd., primarily to fund repurchases of its common shares.
(3)
During 2014, the Company received a payment from Allianz, the purchaser of White Mountains’s former subsidiary Fireman’s Fund Insurance Company (“FFIC”), related to the utilization of alternative minimum tax credits associated with the tax loss on the sale of FFIC in 1991. See
Note 22 — “Held for Sale and Discontinued Operations”
.
Schedules of the Registrant should be read in conjunction with the Consolidated Financial Statements and Notes.
FS-2
SCHEDULE II
(continued)
|
Year Ended December 31,
|
||||||||||||
|
Millions
|
2016
|
2015
|
2014
|
|||||||||
|
Net income attributable to White Mountains’s common shareholders
|
$
|
412.5
|
|
$
|
297.6
|
|
$
|
312.2
|
|
|||
|
Charges (credits) to reconcile net income to net cash from operations:
|
|
|
|
|
|
|
||||||
|
Net realized and unrealized investment gains (losses) on sales of investments
|
1.1
|
|
—
|
|
(.2
|
)
|
||||||
|
Undistributed current earnings from subsidiaries
|
(482.2
|
)
|
(352.5
|
)
|
(329.4
|
)
|
||||||
|
Net gain on sale of other discontinued operations
(1)
|
—
|
|
—
|
|
(13.9
|
)
|
||||||
|
Other non-cash reconciling items including restricted share and option amortization
|
17.9
|
|
(.4
|
)
|
12.9
|
|
||||||
|
Net change in other assets and liabilities
(2)
|
(11.4
|
)
|
21.4
|
|
(7.6
|
)
|
||||||
|
Net cash used for continuing operations
|
(62.1
|
)
|
(33.9
|
)
|
(26.0
|
)
|
||||||
|
Net cash provided from discontinued operations
(1)
|
—
|
|
—
|
|
13.9
|
|
||||||
|
Net cash used for operations
|
(62.1
|
)
|
(33.9
|
)
|
(12.1
|
)
|
||||||
|
Cash flows from investing activities:
|
|
|
|
|
|
|
||||||
|
Net decrease in short-term investments
|
10.9
|
|
7.6
|
|
(29.6
|
)
|
||||||
|
Purchases of investment securities
|
—
|
|
—
|
|
(7.6
|
)
|
||||||
|
Sales and maturities of investment securities
|
—
|
|
—
|
|
39.4
|
|
||||||
|
Issuance of debt from subsidiaries
(4)
|
992.0
|
|
271.0
|
|
144.6
|
|
||||||
|
Repayment of debt to subsidiaries
|
(5.0
|
)
|
(35.0
|
)
|
(30.0
|
)
|
||||||
|
Receipt of cash flows from discontinued operations
(1)
|
—
|
|
—
|
|
13.9
|
|
||||||
|
Distributions from subsidiaries
(3)
|
—
|
|
15.0
|
|
|
29.7
|
|
|||||
|
Net cash provided from investing activities — continuing operations
|
997.9
|
|
258.6
|
|
160.4
|
|
||||||
|
Net cash used for investing activities — discontinued operations
|
—
|
|
—
|
|
(13.9
|
)
|
||||||
|
Net cash provided from investing activities
|
997.9
|
|
258.6
|
|
146.5
|
|
||||||
|
Cash flows from financing activities:
|
|
|
|
|
|
|
||||||
|
Draw down of revolving line of credit
(5)
|
350.0
|
|
125.0
|
|
65.0
|
|
||||||
|
Repayment of revolving line of credit
(5)
|
(400.0
|
)
|
(75.0
|
)
|
(65.0
|
)
|
||||||
|
Proceeds from issuances of common shares
|
3.7
|
|
—
|
|
—
|
|
||||||
|
Repurchases and retirement of common shares
(4)
|
(881.3
|
)
|
(268.6
|
)
|
(128.2
|
)
|
||||||
|
Dividends paid on common shares
|
(5.4
|
)
|
(6.0
|
)
|
(6.2
|
)
|
||||||
|
Net cash used for financing activities — continuing operations
|
(933.0
|
)
|
(224.6
|
)
|
(134.4
|
)
|
||||||
|
Net cash (used for) provided from financing activities — discontinued operations
|
—
|
|
—
|
|
—
|
|
||||||
|
Net cash used for financing activities
|
(933.0
|
)
|
(224.6
|
)
|
(134.4
|
)
|
||||||
|
Net decrease in cash during the year
|
2.8
|
|
.1
|
|
—
|
|
||||||
|
Cash balance at beginning of year
|
.3
|
|
.2
|
|
.2
|
|
||||||
|
Cash balance at end of year
|
$
|
3.1
|
|
$
|
.3
|
|
$
|
.2
|
|
|||
|
Supplemental cash flow information:
|
||||||||||||
|
Interest paid
|
$
|
(1.2
|
)
|
$
|
—
|
|
$
|
(.3
|
)
|
|||
|
(1)
|
During 2014, the Company received a payment from Allianz, the purchaser of White Mountains’s former subsidiary Fireman’s Fund Insurance Company (“FFIC”), related to the utilization of alternative minimum tax credits associated with the tax loss on the sale of FFIC in 1991. See
Note 22 — “Held for Sale and Discontinued Operations”
.
|
|
(2)
|
For 2016, 2015 and 2014, net change in other assets and liabilities included a
$0.2
,
$2.4
, and
0.7
payable to the Company’s subsidiaries.
|
|
(3)
|
During 2016, the Company received a non-cash distribution of
$80.0
from Lone Tree Holdings, Ltd., a direct wholly-owned subsidiary. The distribution was completed through the transfer of fixed maturity investments. During 2015 and 2014, the Company received cash distributions of
$15.0
and
$29.7
from Lone Tree Holdings, Ltd.
|
|
(4)
|
During 2016, 2015 and 2014, the Company used cash proceeds received from the issuance of debt from Lone Tree Holdings, Ltd. primarily to fund repurchases of its common shares.
|
|
(5)
|
The WTM Bank Facility presented in
|
Schedules of the Registrant should be read in conjunction with the Consolidated Financial Statements and Notes.
FS-3
SCHEDULE III
WHITE MOUNTAINS INSURANCE GROUP, LTD.
SUPPLEMENTARY INSURANCE INFORMATION
(3)
(Millions)
|
Column
A
|
Column
B
|
Column C
|
Column
D
|
Column E
|
Column
F
|
Column
G
|
Column
H
|
Column
I
|
Column
J
|
Column
K
|
||||||||||||||||||||||||||||||
|
Segment
Millions
|
Deferred
acquisition
costs
|
Future policy
benefits, losses, claims
and loss
expenses
|
Unearned
premiums
|
Other policy
claims and
benefits
payable
|
Premiums
earned
|
Net
investment
income
(1)
|
Benefits,
claims,
losses, and
settlement
expenses
|
Amortization
of deferred
policy
acquisition
costs
|
Other
operating
expenses
|
Premiums
written
|
||||||||||||||||||||||||||||||
|
Years ended:
|
|
|
|
|
|
|
|
|
|
|
|
|
|
|
|
|
|
|
|
|
||||||||||||||||||||
|
December 31, 2016
|
|
|
|
|
|
|
|
|
|
|
|
|
|
|
|
|
|
|
|
|
||||||||||||||||||||
|
OneBeacon
|
$
|
96.3
|
|
$
|
1,365.6
|
|
$
|
575.1
|
|
$
|
—
|
|
$
|
1,100.6
|
|
$
|
50.6
|
|
$
|
656.0
|
|
$
|
206.0
|
|
$
|
209.0
|
|
$
|
1,100.7
|
|
||||||||||
|
HG Global/BAM
|
10.6
|
|
—
|
|
82.9
|
|
—
|
|
5.9
|
|
9.0
|
|
—
|
|
3.4
|
|
.4
|
|
38.6
|
|
||||||||||||||||||||
|
Other operations
(2)
|
—
|
|
5.0
|
|
1.2
|
|
—
|
|
7.5
|
|
.2
|
|
8.0
|
|
2.2
|
|
.1
|
|
6.5
|
|
||||||||||||||||||||
|
December 31, 2015
|
|
|
|
|
|
|
|
|
|
|
|
|
|
|
|
|
|
|
|
|
||||||||||||||||||||
|
OneBeacon
|
$
|
100.7
|
|
$
|
1,389.8
|
|
$
|
560.3
|
|
$
|
—
|
|
$
|
1,176.2
|
|
$
|
45.9
|
|
$
|
700.7
|
|
$
|
213.8
|
|
$
|
218.2
|
|
$
|
1,136.6
|
|
||||||||||
|
HG Global/BAM
|
6.9
|
|
—
|
|
50.2
|
|
—
|
|
3.3
|
|
6.1
|
|
—
|
|
2.9
|
|
.4
|
|
25.9
|
|
||||||||||||||||||||
|
Other operations
(2)
|
—
|
|
6.0
|
|
2.1
|
|
—
|
|
8.7
|
|
.2
|
|
8.2
|
|
3.4
|
|
—
|
|
10.1
|
|
||||||||||||||||||||
|
December 31, 2014
|
|
|
|
|
|
|
|
|
|
|
|
|
|
|
|
|
|
|
|
|
||||||||||||||||||||
|
OneBeacon
|
$
|
103.2
|
|
$
|
1,342.2
|
|
$
|
588.3
|
|
$
|
—
|
|
$
|
1,177.1
|
|
$
|
43.4
|
|
$
|
815.1
|
|
$
|
203.3
|
|
$
|
179.2
|
|
$
|
1,216.9
|
|
||||||||||
|
HG Global/BAM
|
4.0
|
|
—
|
|
27.6
|
|
—
|
|
1.8
|
|
7.1
|
|
—
|
|
2.1
|
|
.4
|
|
16.2
|
|
||||||||||||||||||||
|
Other operations
(2)
|
—
|
|
7.8
|
|
.8
|
|
—
|
|
6.1
|
|
.2
|
|
8.9
|
|
.8
|
|
—
|
|
5.9
|
|
||||||||||||||||||||
(1)
The amounts shown exclude net investment income relating to non-insurance operations of
$27.0
,
$8.6
and
$8.8
for the twelve months ended
December 31, 2016, 2015 and 2014
, respectively.
(2)
The Other operations amounts shown relate to SSIE. SSIE’s results are attributed to non-controlling interests.
(3)
Schedule excludes activity related to Sirius Group for all periods presented. See
Note 22 — “Held for Sale and Discontinued Operations”
.
Schedules of the Registrant should be read in conjunction with the Consolidated Financial Statements and Notes.
FS-4
SCHEDULE IV
WHITE MOUNTAINS INSURANCE GROUP, LTD.
REINSURANCE
(3)
(Millions)
|
Column A
|
Column B
|
Column C
|
Column D
|
Column E
|
Column F
|
||||||||||||||
|
Premiums earned
$ in millions
|
Gross amount
|
Ceded to other
companies
|
Assumed from
other companies
|
Net amount
|
Percentage of
amount assumed
to net
|
||||||||||||||
|
Years ended:
|
|
|
|
|
|
|
|
|
|
|
|||||||||
|
December 31, 2016
|
|
|
|
|
|
|
|
|
|
|
|||||||||
|
OneBeacon
|
$
|
1,177.0
|
|
$
|
(105.8
|
)
|
$
|
29.4
|
|
$
|
1,100.6
|
|
2.7
|
%
|
|||||
|
HG/BAM
|
5.9
|
|
—
|
|
—
|
|
5.9
|
|
—
|
%
|
|||||||||
|
Other operations
(2)
|
15.2
|
|
(7.7
|
)
|
—
|
|
7.5
|
|
—
|
|
|||||||||
|
December 31, 2015
|
|
|
|
|
|
|
|
|
|
|
|||||||||
|
OneBeacon
(1)
|
$
|
1,298.0
|
|
$
|
(167.7
|
)
|
$
|
45.9
|
|
$
|
1,176.2
|
|
3.9
|
%
|
|||||
|
HG/BAM
|
3.3
|
|
—
|
|
—
|
|
3.3
|
|
—
|
%
|
|||||||||
|
Other operations
(2)
|
20.7
|
|
(12.0
|
)
|
—
|
|
8.7
|
|
—
|
|
|||||||||
|
December 31, 2014
|
|
|
|
|
|
|
|
|
|||||||||||
|
OneBeacon
(1)
|
$
|
1,209.1
|
|
$
|
(102.9
|
)
|
$
|
70.9
|
|
$
|
1,177.1
|
|
6.0
|
%
|
|||||
|
HG/BAM
|
1.8
|
|
—
|
|
—
|
|
1.8
|
|
—
|
%
|
|||||||||
|
Other operations
(2)
|
$
|
22.6
|
|
$
|
(16.5
|
)
|
$
|
—
|
|
$
|
6.1
|
|
—
|
%
|
|||||
|
(1)
|
The amounts shown excludes balances reclassified to discontinued operations in the consolidated income statement related to the Runoff Transaction as of December 31, 2015 and 2014. See
Note 22 — “Held for Sale and Discontinued Operations”
.
|
|
(2)
|
The Other operations amounts shown relate to SSIE. SSIE’s results are attributed to non-controlling interests.
|
|
(3)
|
Schedule excludes activity related to Sirius Group for all periods presented. See
Note 22 — “Held for Sale and Discontinued Operations”
.
|
Schedules of the Registrant should be read in conjunction with the Consolidated Financial Statements and Notes.
FS-5
SCHEDULE V
WHITE MOUNTAINS INSURANCE GROUP, LTD.
VALUATION AND QUALIFYING ACCOUNTS
(3)
|
Column A
|
Column B
|
Column C
|
Column D
|
Column E
|
||||||||||||||||
|
Additions (subtractions)
|
||||||||||||||||||||
|
Millions
|
Balance at beginning of
period
|
Charged to costs
and expenses
|
Charged to other
accounts
(1)
|
Deductions described
(2)
|
Balance at end of
period
|
|||||||||||||||
|
Years ended:
|
|
|
|
|
|
|
|
|
|
|
||||||||||
|
December 31, 2016
|
|
|
|
|
|
|
|
|
|
|
||||||||||
|
Reinsurance recoverable on paid losses:
|
|
|
|
|
|
|
|
|
|
|
||||||||||
|
Allowance for reinsurance balances
|
$
|
.7
|
|
$
|
.2
|
|
$
|
—
|
|
$
|
—
|
|
$
|
.9
|
|
|||||
|
Property and casualty insurance and reinsurance premiums receivable:
|
|
|
|
|
|
|
|
|
|
|
||||||||||
|
Allowance for uncollectible accounts
|
2.0
|
|
(.3
|
)
|
(.4
|
)
|
—
|
|
1.3
|
|
||||||||||
|
December 31, 2015
|
|
|
|
|
|
|
|
|
|
|
||||||||||
|
Reinsurance recoverable on paid losses:
|
|
|
|
|
|
|
|
|
|
|
||||||||||
|
Allowance for reinsurance balances
|
$
|
2.2
|
|
$
|
(.1
|
)
|
$
|
—
|
|
$
|
(1.4
|
)
|
$
|
.7
|
|
|||||
|
Property and casualty insurance and reinsurance premiums receivable:
|
|
|
|
|
|
|
|
|
|
|
||||||||||
|
Allowance for uncollectible accounts
|
1.9
|
|
.8
|
|
(.7
|
)
|
—
|
|
2.0
|
|
||||||||||
|
December 31, 2014
|
|
|
|
|
|
|
|
|
|
|
||||||||||
|
Reinsurance recoverable on paid losses:
|
|
|
|
|
|
|
|
|
|
|
||||||||||
|
Allowance for reinsurance balances
|
$
|
14.3
|
|
$
|
(.5
|
)
|
$
|
—
|
|
$
|
(11.6
|
)
|
$
|
2.2
|
|
|||||
|
Property and casualty insurance and reinsurance premiums receivable:
|
|
|
|
|
|
|
|
|
|
|
||||||||||
|
Allowance for uncollectible accounts
|
3.1
|
|
(.2
|
)
|
(1.0
|
)
|
—
|
|
1.9
|
|
||||||||||
|
(1)
|
Amount credited to other accounts represents a reduction in the allowance for uncollectible premiums receivable which was offset by a corresponding reduction in gross premiums receivable. There was no impact to premiums receivable as presented in the consolidated balance sheet.
|
|
(2)
|
Represents net collections (charge-offs) of balances receivable.
|
|
(3)
|
Schedule excludes activity related to Sirius Group and Tranzact for all periods presented. See
Note 22 — “Held for Sale and Discontinued Operations”
.
|
Schedules of the Registrant should be read in conjunction with the Consolidated Financial Statements and Notes.
FS-6
SCHEDULE VI
WHITE MOUNTAINS INSURANCE GROUP, LTD.
SUPPLEMENTAL INFORMATION FOR PROPERTY AND CASUALTY INSURANCE UNDERWRITERS
(3)
(Millions)
|
Column A
|
Column B
|
Column C
|
Column D
|
Column E
|
Column F
|
Column G
|
Column H
|
Column I
|
Column J
|
Column K
|
||||||||||||||||||||||||||||||||||
|
Affiliation with
registrant
|
Deferred acquisition
costs
|
Reserves
for Unpaid Claims and Claims Adjustment
Expenses
|
Discount, if any, deducted in
Column C
|
Unearned
Premiums
|
Earned
Premiums
|
Net investment
income
|
Claims and Claims
Adjustment Expenses
Incurred Related to
|
Amortization
of deferred policy acquisition
costs
|
Paid
Claims and Claims Adjustment
Expenses
|
Premiums
written
|
||||||||||||||||||||||||||||||||||
|
Millions
|
Current
Year
(1)
|
Prior
Year
|
||||||||||||||||||||||||||||||||||||||||||
|
OneBeacon:
|
||||||||||||||||||||||||||||||||||||||||||||
|
2016
|
$
|
96.3
|
|
$
|
1,365.6
|
|
$
|
1.6
|
|
(1)
|
$
|
575.1
|
|
$
|
1,100.6
|
|
$
|
50.6
|
|
$
|
640.6
|
|
$
|
15.4
|
|
$
|
(206.0
|
)
|
$
|
667.1
|
|
$
|
1,100.7
|
|
||||||||||
|
2015
|
100.7
|
|
1,389.8
|
|
1.1
|
|
(1)
|
560.3
|
|
1,176.2
|
|
45.9
|
|
702.5
|
|
(1.8
|
)
|
(213.8
|
)
|
677.5
|
|
1,136.6
|
|
|||||||||||||||||||||
|
2014
|
103.2
|
|
1,342.2
|
|
1.0
|
|
(1)
|
588.3
|
|
1,177.1
|
|
43.4
|
|
725.3
|
|
89.8
|
|
(203.3
|
)
|
608.6
|
|
1,216.9
|
|
|||||||||||||||||||||
|
Other operations
(2)
:
|
||||||||||||||||||||||||||||||||||||||||||||
|
2016
|
$
|
—
|
|
$
|
5.0
|
|
$
|
—
|
|
$
|
1.2
|
|
$
|
7.5
|
|
$
|
.2
|
|
$
|
8.6
|
|
$
|
(0.6
|
)
|
$
|
—
|
|
$
|
8.8
|
|
$
|
6.5
|
|
|||||||||||
|
2015
|
—
|
|
6.0
|
|
—
|
|
2.1
|
|
8.7
|
|
.2
|
|
10.4
|
|
(2.2
|
)
|
—
|
|
10.4
|
|
10.1
|
|
||||||||||||||||||||||
|
2014
|
—
|
|
7.8
|
|
—
|
|
.8
|
|
6.1
|
|
.2
|
|
6.7
|
|
2.2
|
|
—
|
|
14.8
|
|
5.9
|
|
||||||||||||||||||||||
|
(1)
|
The amounts shown represent OneBeacon’s discount on its long-term workers compensation loss and LAE reserves, as such liabilities constitute unpaid but settled claims under which the payment pattern and ultimate costs are fixed and determinable on an individual basis. OneBeacon discounts these reserves using a discount rate which is determined based on the facts and circumstances applicable at the time the claims are settled (
2.5%
as of
December 31, 2016, 2015 and 2014
).
|
|
(2)
|
The Other operations amounts shown relate to SSIE. SSIE’s results are attributed to non-controlling interests. SSIE’s assets and liabilities are presented held for sale. See
Note 22 — “Held for Sale and Discontinued Operations”
.
|
|
(3)
|
Schedule excludes amounts related to Sirius Group for all periods presented. See
|
Schedules of the Registrant should be read in conjunction with the Consolidated Financial Statements and Notes.
FS-7
TABLE OF CONTENTS
Part IItem 1. BusinessNote 2 - Significant TransactionsNote 22 - Held For Sale and Discontinued OperationsNote 2 Significant TransactionsNote 4 Third-party ReinsuranceNote 3 Unpaid Losses and Loss Adjustment ExpensesNote 7 DebtNote 22 Held For Sale and Discontinued OperationsItem 1A. Risk FactorsItem 2. PropertiesItem 3. Legal ProceedingsItem 4. Mine Safety DisclosuresPart IIItem 5. Market For The Company S Common Equity, Related Shareholder Matters and Issuer Purchases Of Equity SecuritiesItem 6. Selected Financial DataNote 17 Investments in Unconsolidated AffiliatesNote 14 Common Shareholders Equity and Non-controlling InterestsItem 7. Management S Discussion and Analysis Of Financial Condition and Results Of OperationsNote 6 - Goodwill and Other Intangible AssetsNote 8 Income TaxesNote 16 Segment InformationNote 9 DerivativesNote 12 Retirement and Postretirement PlansNote 20 Transactions with Related PersonsNote 3 Reserves For Unpaid Losses and Loss Adjustment ExpensesNote 5 Investment SecuritiesItem 7A. Quantitative and Qualitative Disclosures About Market RiskItem 8. Financial Statements and Supplementary DataItem 9. Changes in and Disagreements with Accountants on Accounting and Financial DisclosureItem 9A. Controls and ProceduresItem 9B. Other InformationPart IIIItem 10. Directors, Executive Officers and Corporate GovernanceItem 11. Executive CompensationItem 12. Security Ownership Of Certain Beneficial Owners and Management and Related Stockholder MattersItem 13. Certain Relationships, Related Transactions and Director IndependenceItem 14. Principal Accountant Fees and ServicesPart IVItem 15. Exhibits and Financial Statement SchedulesNote 11 Earnings Per ShareItem 16. Form 10-k SummaryNote 1. Summary Of Significant Accounting PoliciesNote 6 Goodwill and Other Intangible AssetsNote 18 Variable Interest EntitiesNote 2. Significant TransactionsNote 5 - Investment SecuritiesNote 3. Reserves For Unpaid Losses and Loss Adjustment ExpensesNote 4. Third-party ReinsuranceNote 10 Municipal Bond Guarantee InsuranceNote 5. Investment SecuritiesNote 1 Summary Of Significant Accounting PoliciesNote 6. Goodwill and Other Intangible AssetsNote 7. DebtNote 8. Income TaxesNote 9. DerivativesNote 10. Municipal Bond Guarantee InsuranceNote 11. Earnings Per ShareNote 13 Employee Share-based Incentive Compensation PlansNote 12. Retirement and Postretirement PlansNote 13. Employee Share-based Incentive Compensation PlansNote 14. Common Shareholders Equity and Non-controlling InterestsNote 15. Statutory Capital and SurplusNote 16. Segment InformationNote 17. Investments in Unconsolidated AffiliatesNote 18. Variable Interest EntitiesNote 19. Fair Value Of Financial InstrumentsNote 20. Transactions with Related PersonsNote 21. Commitments and ContingenciesNote 3 - Reserves For Unpaid Losses and Loss Adjustment ExpensesNote 22. Held For Sale and Discontinued OperationsNote 21 - Commitments and Contingencies