WEYERHAEUSER CO
10-Ks and 10-Qs
|
|
|
|
|
|
|
|
|
|
|
|
|
|
|
|
|
|
|
|
|
|
|
|
|
|
|
|
|
|
|
|
|
|
|
|
|
|
|
|
|
|
|
|
|
|
|
|
|
|
|
|
|
|
|
|
UNITED STATES
SECURITIES AND EXCHANGE COMMISSION
WASHINGTON, D.C. 20549
FORM 10-K
[X] ANNUAL REPORT PURSUANT TO SECTION 13 OR 15(D) OF THE SECURITIES EXCHANGE ACT OF 1934
FOR THE FISCAL YEAR ENDED
DECEMBER 31, 2013
or
[ ] TRANSITION REPORT PURSUANT TO SECTION 13 OR 15(D) OF THE SECURITIES EXCHANGE ACT OF 1934
FOR THE TRANSITION PERIOD FROM
TO
COMMISSION FILE NUMBER 1-4825
WEYERHAEUSER COMPANY
A WASHINGTON CORPORATION
91-0470860
(IRS EMPLOYER IDENTIFICATION NO.)
33663 WEYERHAEUSER WAY SOUTH, FEDERAL WAY, WASHINGTON 98063-9777 TELEPHONE (253) 924-2345
SECURITIES REGISTERED PURSUANT TO SECTION 12(B) OF THE ACT:
|
TITLE OF EACH CLASS
|
|
NAME OF EACH EXCHANGE ON WHICH REGISTERED:
|
|
Common Shares ($1.25 par value)
|
|
Chicago Stock Exchange
|
|
|
New York Stock Exchange
|
|
|
6.375% Mandatory Convertible Preference Shares, Series A ($1.00 par value)
|
New York Stock Exchange
|
|
Indicate by check mark if the registrant is a well-known seasoned issuer, as defined in Rule 405 of the Securities Act. [X] Yes [ ] No
Indicate by check mark if the registrant is not required to file reports pursuant to Section 13 or Section 15(d) of the Act. [ ] Yes [X] No
Indicate by check mark whether the registrant (1) has filed all reports required to be filed by Section 13 or 15(d) of the Securities Exchange Act of 1934 during the preceding 12 months (or for such shorter period that the registrant was required to file such reports), and (2) has been subject to such filing requirements for the past 90 days. [X] Yes [ ] No
Indicate by check mark whether the registrant has submitted electronically and posted on its corporate Website, if any, every Interactive Data File required to be submitted and posted pursuant to Rule 405 of Regulation S-T (§ 232.405 of this chapter) during the preceding 12 months (or for such shorter period that the registrant was required to submit and post such files). [X] Yes [ ] No
Indicate by check mark if disclosure of delinquent filers pursuant to Item 405 of Regulation S-K (§ 229.405 of this chapter) is not contained herein, and will not be contained, to the best of registrant’s knowledge, in definitive proxy or information statements incorporated by reference in Part III of this Form 10-K or any amendment to this Form 10-K. [ ]
Indicate by check mark whether the registrant is a large accelerated filer, an accelerated filer, a non-accelerated filer, or a smaller reporting company. See the definitions of “large accelerated filer,” “accelerated filer” and “smaller reporting company” in Rule 12b-2 of the Exchange Act.
Large accelerated filer [X] Accelerated filer [ ] Non-accelerated filer [ ] Smaller reporting company [ ]
Indicate by check mark whether the registrant is a shell company (as defined in Rule 12b-2 of the Act). [ ] Yes [X] No
As of
June 30, 2013
, the aggregate market value of the registrant’s common stock held by non-affiliates of the registrant was
$16.2 billion
based on the closing sale price as reported on the New York Stock Exchange Composite Price Transactions.
As of
January 31, 2014
,
583,829,677
shares of the registrant’s common stock ($1.25 par value) were outstanding.
DOCUMENTS INCORPORATED BY REFERENCE
Portions of the
Notice of
2014
Annual Meeting of Shareholders and Proxy Statement
for the company’s Annual Meeting of Shareholders to be held
April 10, 2014
, are incorporated by reference into Part II and III.
WEYERHAEUSER COMPANY >
2013 ANNUAL REPORT AND FORM 10-K
TABLE OF CONTENTS
|
PART I
|
||
|
ITEM 1.
|
||
|
EXECUTIVE OFFICERS OF THE REGISTRANT
|
||
|
ITEM 1A.
|
||
|
• STRATEGIC INITIATIVES
|
||
|
• PEOPLE
|
||
|
• REAL ESTATE TRANSACTION
|
||
|
ITEM 1B.
|
||
|
ITEM 2.
|
||
|
ITEM 3.
|
||
|
ITEM 4.
|
MINE SAFETY DISCLOSURES — NOT APPLICABLE
|
|
|
PART II
|
|||
|
ITEM 5.
|
|
||
|
ITEM 6.
|
|
||
|
ITEM 7.
|
|
||
|
|
|||
|
|
|||
|
|
|||
|
|
|||
|
|
|||
|
|
|||
|
|
|||
|
|
|||
|
|
|||
|
|
|||
|
|
|||
|
|
|||
|
|
|||
|
|
|||
|
|
|||
|
|
|||
|
|
|||
|
|
|||
|
|
|||
|
|
|||
|
|
|||
|
ITEM 7A.
|
|
||
|
|
|||
|
ITEM 8.
|
|
||
|
|
|||
|
|
|||
|
|
|||
|
|
|||
|
|
|||
|
|
|||
|
|
|||
|
|
|||
|
ITEM 9.
|
|
||
|
ITEM 9A.
|
|
||
|
|
|||
|
|
|||
|
|
|||
|
|
|||
|
ITEM 9B.
|
OTHER INFORMATION — NOT APPLICABLE
|
||
|
PART III
|
|||
|
ITEM 10.
|
DIRECTORS, EXECUTIVE OFFICERS
AND CORPORATE GOVERNANCE
|
|
|
|
ITEM 11.
|
|
||
|
ITEM 12.
|
|
||
|
ITEM 13.
|
|
||
|
ITEM 14.
|
|
||
|
PART IV
|
|||
|
ITEM 15.
|
|
||
|
|
|||
|
|
|||
|
CERTIFICATIONS
|
110
|
|
|
|
COMPANY OFFICERS
|
113
|
|
|
OUR BUSINESS
We are one of the world's largest private owners of timberlands. We own or control nearly
7 million
acres of timberlands, primarily in the U.S., and manage another
14 million
acres under long-term licenses in Canada. We manage these timberlands on a sustainable basis in compliance with internationally recognized forestry standards. We are also one of the largest manufacturers of wood and specialty cellulose fibers products, and we develop real estate, primarily as a builder of single-family homes. Our company is a real estate investment trust (REIT).
We are committed to operate as a sustainable company and are listed on the Dow Jones World Sustainability Index. We focus on increasing energy and resource efficiency, reducing greenhouse gas emissions, reducing water consumption, conserving natural resources, and offering products that meet human needs with superior sustainability attributes. We operate with world class safety results, understand and address the needs of the communities in which we operate, and present ourselves transparently.
In
2013
, we generated
$8.5 billion
in net sales and employed approximately
13,700
people who serve customers worldwide.
This portion of our Annual Report and Form 10-K provides detailed information about who we are, what we do and where we are headed. Unless otherwise specified, current information reported in this Form 10-K is as of the fiscal year ended
December 31, 2013
.
We break out financial information such as revenues, earnings and assets by the business segments that form our company. We also discuss the development of our company and the geographic areas where we do business.
Throughout this Form 10-K, unless specified otherwise, references to “we,” “our,” “us” and “the company” refer to the consolidated company.
|
WE CAN TELL YOU MORE
|
AVAILABLE INFORMATION
We meet the information-reporting requirements of the Securities Exchange Act of 1934 by filing periodic reports, proxy statements and other information with the Securities and Exchange Commission (SEC). These reports and statements — information about our company’s business, financial results and other matters — are available at:
|
•
|
the SEC Internet site — www.sec.gov;
|
|
•
|
the SEC’s Public Conference Room, 100 F St. N.E., Washington, D.C., 20549, (800) SEC-0330; and
|
|
•
|
our Internet site — www.weyerhaeuser.com.
|
When we file the information electronically with the SEC, it also is added to our Internet site.
|
WHO WE ARE
|
We started out as Weyerhaeuser Timber Company, incorporated in the state of Washington in January 1900, when Frederick Weyerhaeuser and 15 partners bought 900,000 acres of timberland. Today, we are working to grow a truly great company for our shareholders, customers and employees by striving to deliver quality products that our customers want and will pay for, at the lowest possible cost.
REAL ESTATE INVESTMENT TRUST (REIT) ELECTION
Starting with our 2010 fiscal year, we elected to be taxed as a REIT. We expect to derive most of our REIT income from investments in timberlands, including the sale of standing timber through pay-as-cut sales contracts. REIT income can be distributed to shareholders without first paying corporate level tax, substantially eliminating the double taxation on income. A significant portion of our timberland segment earnings receives this favorable tax treatment. We are, however, subject to corporate taxes on built-in-gains (the excess of fair market value over tax basis at January 1, 2010) on sales of real property (other than standing timber) held by the REIT during the first 10 years following the REIT conversion. We continue to be required to pay federal corporate income taxes on earnings of our Taxable REIT Subsidiary (TRS), which principally includes our manufacturing businesses, our real estate development and single-family home building operations and the portion of our Timberlands segment income included in the TRS.
OUR BUSINESS SEGMENTS
In the
Consolidated Results
section of
Management’s Discussion and Analysis of Financial Condition and Results of Operations
, you will find our overall performance results for our business segments:
|
•
|
Timberlands,
|
|
•
|
Wood Products,
|
|
•
|
Cellulose Fibers and
|
|
•
|
Real Estate.
|
Detailed financial information about our business segments and our geographic locations is in
Note 2: Business Segments
and
Note 23: Geographic Areas
in the
Notes to Consolidated Financial Statements
,
as well as in this section and in the
Management’s Discussion and Analysis of Financial Condition and Results of Operations
.
EFFECT OF MARKET CONDITIONS
The health of the U.S. housing market strongly affects our Real Estate, Wood Products and Timberlands segments. Real Estate focuses on building single family homes. Wood Products primarily sells into the new residential building and repair and remodel markets. Demand for logs from our Timberlands segment is affected by the production of wood-based building products as well as export demand. Cellulose Fibers is primarily affected by global demand and the relative strength of the U.S. dollar.
WEYERHAEUSER COMPANY >
2013 ANNUAL REPORT AND FORM 10-K
1
COMPETITION IN OUR MARKETS
We operate in highly competitive domestic and foreign markets, with numerous companies selling similar products. Many of our products also face competition from substitutes for wood and wood-fiber products. In real estate development, our competitors include numerous regional and national firms. We compete in our markets primarily through price, product quality an
d service levels. We are relentlessly focused on improving operational excellence to ensure a competitive cost structure and producing quality products customers want and are wiling to pay for.
Our business segments’ competitive strategies are as follows:
|
•
|
Timberlands — Extract maximum value from each acre we own or manage.
|
|
•
|
Wood Products — Deliver high-quality lumber, structural panels, engineered wood products and complementary products for residential applications.
|
|
•
|
Cellulose Fibers — Concentrate on value-added pulp products.
|
|
•
|
Real Estate — Deliver unique value propositions in target markets.
|
SALES OUTSIDE THE U.S.
In
2013
,
$2.5 billion
—
29 percent
— of our total consolidated sales from continuing operations were to customers outside the U.S. Exports from the U.S. increased $209 million, or 12 percent, primarily due to higher log export prices and volumes in our Timberlands segment and higher pulp sales volumes in our Cellulose Fibers segment. The table below shows sales outside the U.S. for the last three years.
|
SALES OUTSIDE THE U.S. IN MILLIONS OF DOLLARS
|
|||||||||
|
|
2013
|
|
2012
|
|
2011
|
|
|||
|
Exports from the U.S.
|
$
|
1,891
|
|
$
|
1,682
|
|
$
|
1,775
|
|
|
Canadian export and domestic sales
|
488
|
|
348
|
|
363
|
|
|||
|
Other foreign sales
|
114
|
|
92
|
|
70
|
|
|||
|
Total
|
$
|
2,493
|
|
$
|
2,122
|
|
$
|
2,208
|
|
|
Percent of total sales
|
29
|
%
|
30
|
%
|
36
|
%
|
|||
OUR EMPLOYEES
We have approximately
13,700
employees. This number includes:
|
•
|
12,850 employed in North America and
|
|
•
|
850 employed by our operations outside of North America.
|
Of these employees, approximately 3,560 are members of unions covered by multi-year collective-bargaining agreements. More information about these agreements is in
Note 10: Pension and Other Postretirement Benefit Plans
in the
Notes to Consolidated Financial Statements
.
|
WHAT WE DO
|
This section provides information about how we:
|
•
|
grow and harvest trees,
|
|
•
|
manufacture and sell products made from them,
|
|
•
|
build and sell homes and
|
|
•
|
develop land.
|
For each of our business segments, we provide details about what we do, where we do it, how much we sell and where we are headed.
TIMBERLANDS
Our Timberlands business segment manages
6.9 million
acres of private commercial forestland worldwide. We own 6.2 million of those acres and have long-term leases on the other 0.7 million acres. In addition, we have renewable, long-term licenses on
13.9 million
acres of forestland located in four Canadian provinces. The tables presented in this section include data from this segment's business units as of the end of
2013
.
WHAT WE DO
Forestry Management
Our Timberlands business segment:
|
•
|
grows and harvests trees for use as lumber, other wood and building products and pulp and paper;
|
|
•
|
exports logs to other countries where they are made into products;
|
|
•
|
plants seedlings to reforest harvested areas using the most effective regeneration method for the site and species (in parts of Canada natural regeneration is employed);
|
|
•
|
monitors and cares for the new trees as they grow to maturity; and
|
|
•
|
seeks to sustain and maximize the timber supply from our forestlands while keeping the health of our environment a key priority.
|
Our goal is to maximize returns by selling logs and stumpage to internal and external customers. We focus on solid wood and use intensive silviculture to improve forest productivity and returns while managing our forests on a sustainable basis to meet customer and public expectations.
Sustainable Forestry Practices
We are committed to responsible environmental stewardship wherever we operate, managing forests to produce financially mature timber while protecting the ecosystem services they provide. Our working forests include places with unique environmental, cultural, historical or recreational
WEYERHAEUSER COMPANY >
2013 ANNUAL REPORT AND FORM 10-K
2
value. To protect their unique qualities, we follow regulatory requirements, voluntary standards and implement the Sustainable Forestry Initiative
®
(SFI) standard. Independent auditing of all of the forests we own or manage in the United States and Canada certifies that we meet the SFI standard. Our forestlands in Uruguay are Forest Stewardship Council (FSC) certified or managed to the Uruguayan national forestry management standard designed to meet the Program for the Endorsement of Forest Certification (PEFC).
Canadian Forestry Operations
In Canada, we have licenses to operate forestlands that provide raw material for our manufacturing units in various provinces. When we harvest trees, we pay the provinces at stumpage rates set by the government, which generally are based on prevailing market prices. We transfer logs to our manufacturing units at cost, which means that we do not generate any profit in the Timberlands segment from the harvest of timber from the licensed acres in Canada.
Other Values From Our Timberlands
In the United States, we actively manage mineral, oil and gas leases on our land and use geologic databases to identify and market opportunities for commercial mineral and geothermal development. We recognize leasing revenue over the terms of agreements with customers. Revenue primarily comes from:
|
•
|
royalty payments on oil and gas production;
|
|
•
|
upfront bonus payments from oil and gas leasing and exploration activity;
|
|
•
|
royalty payments on hard minerals (rock, sand and gravel);
|
|
•
|
geothermal lease and option revenues; and
|
|
•
|
the sale of mineral assets.
|
In managing mineral resources, we generate revenue related to our ownership of the minerals and, separately, related to our ownership of the surface. The ownership of mineral rights and surface acres may be held by two separate parties. Materials that can be mined from the surface, and whose value comes from factors other than their chemical composition, typically belong to the surface owner. Examples of surface materials include rock, sand, gravel, dirt and topsoil. The mineral owner holds the title to commodities that derive value from their unique chemical composition. Examples of mineral rights include oil, gas, coal (even if mined at the surface) and precious metals. If the two types of rights conflict, then mineral rights generally are superior to surface rights. A third type of land right is geothermal, which can belong to either the surface or mineral owner. We routinely reserve mineral and geothermal rights when selling surface timberlands acreage.
Timberlands Products
|
PRODUCTS
|
HOW THEY’RE USED
|
|
Logs
|
Logs are made into lumber, other wood and building products and pulp and paper products.
|
|
Timberlands
|
Timberland tracts are exchanged to improve our timberland portfolio or are sold to third parties by our land development subsidiary within this segment.
|
|
Timber
|
Standing timber is sold to third parties.
|
|
Minerals, oil and gas
|
Minerals, oil and gas are sold into construction and energy markets.
|
|
Other products
|
Other products includes seed and seedlings, recreational leases, as well as plywood and hardwood lumber produced by our international operations, primarily in South America.
|
HOW WE MEASURE OUR PRODUCT
We report Timberlands data in cubic meters. Cubic meters measure the total volume of wood fiber in a tree or log that we can sell. Cubic meter volume is determined from the large and small-end diameters and length and provides a more consistent and comparative measure of timber and log volume among operating regions, species, size and seasons of the year than other units of measure.
We also use two other units of measure when transacting business including:
|
•
|
thousand board feet (MBF) — used in the West to measure the expected lumber recovery from a tree or log, but this measure does not include taper or recovery of non-lumber residual products; and
|
|
•
|
green tons — used in the South to measure weight, but factors used for conversion to product volume can vary by species, size, location and season.
|
Both measures are accurate in the regions where they are used, but they do not provide a meaningful basis for comparisons between the regions.
The conversion rate for MBF to cubic meters varies based on several factors including diameter, length and taper of the timber. The average conversion rate for MBF to cubic meters is approximately 6.7 cubic meters per MBF.
The conversion rate from green tons to cubic meters also varies based on the season harvested and the specific gravity of the wood for the region where the timber is grown. An average conversion rate for green tons to cubic meters is approximately 0.825 cubic meters per green ton.
WHERE WE DO IT
Our timberlands assets are located primarily in North America. In the U.S. we own and manage sustainable forests in nine states for use in wood products and pulp and paper manufacturing. We own or lease:
|
•
|
4.0 million acres in the southern U.S. (Alabama, Arkansas, Louisiana, Mississippi, North Carolina, Oklahoma and Texas); and
|
|
•
|
2.6 million acres in the Pacific Northwest (Oregon and Washington).
|
Our international operations are located primarily in Uruguay. In Uruguay we own 300,000 acres and have long-term leases on 26,000 acres. In China we had a joint venture where we managed 44,000 acres of timberland. We sold our interest in this joint venture during 2012.
In addition, we have renewable, long-term licenses on
13.9 million
acres of forestland owned by the provincial government of four Canadian provinces.
WEYERHAEUSER COMPANY >
2013 ANNUAL REPORT AND FORM 10-K
3
Our total timber inventory — including timber on owned and leased land in our U.S. and international operations — is approximately
334 million
cubic meters. The timber inventory on licensed lands in Canada is approximately
453 million
cubic meters. The amount of timber inventory does not translate into an amount of lumber or panel products because the quantity of end products:
|
•
|
varies according to the species, size and quality of the timber; and
|
|
•
|
will change through time as the mix of these variables adjust.
|
The species, size and grade of the trees affects the relative value of our timberlands.
We maintain our timber inventory in an integrated resource inventory and geographic information system (“GIS”). The resource inventory component of the system is proprietary and is largely based on internally developed technologies, including growth and yield models developed by our research and development organization. The GIS component is based on GIS software that is viewed as the standard in our industry.
Timber inventory data collection and verification techniques include the use of industry standard field sampling procedures as well as proprietary remote sensing technologies in some geographies where they generate improved estimates. The data is collected and maintained at the timber stand level.
DISCUSSION OF OPERATIONS BY GEOGRAPHY
Summary of
2013
Timber Inventory and Timberland Locations
United States
|
GEOGRAPHIC AREA
|
MILLIONS
OF CUBIC
METERS
|
|
THOUSANDS OF ACRES AT
DECEMBER 31, 2013
|
|||||
|
|
TOTAL
INVENTORY
|
|
FEE
OWNERSHIP
|
|
LONG-
TERM
LEASES
|
|
TOTAL
ACRES
|
|
|
U.S.:
|
|
|
|
|
||||
|
West
|
199
|
|
2,597
|
|
—
|
|
2,597
|
|
|
South
|
135
|
|
3,370
|
|
651
|
|
4,021
|
|
|
Total U.S.
|
334
|
|
5,967
|
|
651
|
|
6,618
|
|
We provide a constant year round flow of logs to internal and third-party customers. We sell grade logs to mills that manufacture a diverse range of products including lumber, plywood and veneer. We also sell chips and fiber logs to pulp, paper and oriented strand board mills. Our timberlands are well located to take advantage of road, logging and transportation systems for efficient delivery of logs to these customers.
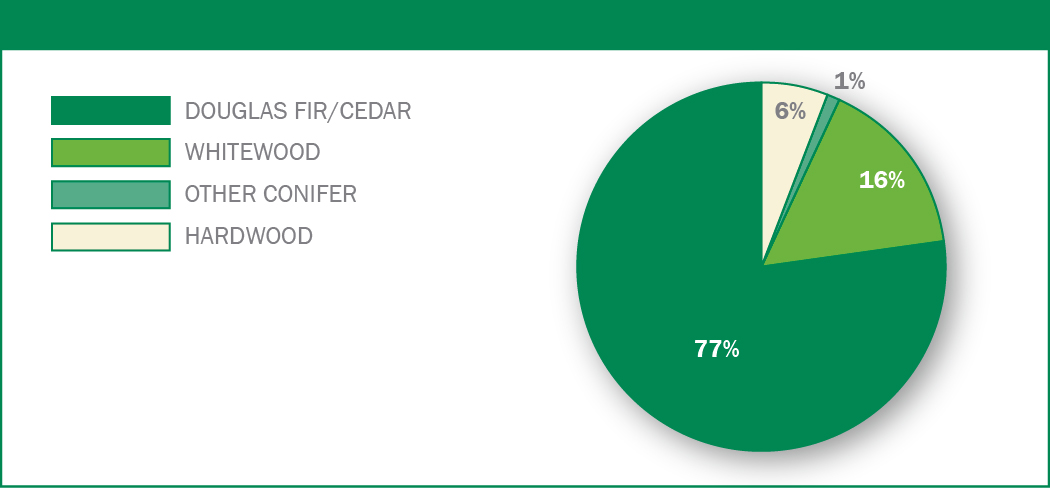
Western United States
Our Western acres are well situated to serve the wood product markets in Oregon and Washington. In addition, our location on the West Coast provides access to higher-value export markets for Douglas fir and whitewood logs in Japan, China and Korea. The size and quality of our Western timberlands, coupled with their proximity to several deep-water port facilities, positions us to meet the needs of Pacific Rim log markets.
Our lands are composed primarily of Douglas fir, a species highly valued for its structural strength. Our coastal lands also contain whitewood and have a higher proportion of whitewood than our interior holdings. Our management systems, which provide us a competitive operating advantage, range from research and forestry, to technical planning models, mechanized harvesting and marketing and logistics.
On July 23, 2013, we purchased 100 percent of the equity interests in Longview Timber LLC (Longview Timber) for $1.58 billion cash and assumed debt of $1.07 billion, for an aggregate purchase price of $2.65 billion. Longview Timber was a privately-held Delaware limited liability company engaged in the ownership and management of approximately 645,000 acres of timberlands in Oregon and Washington. We believe Longview Timber has productive lands with favorable age class distribution that will provide us with optionality for harvest. More information on this transaction can be found in
Note 3: Longview Timber Purchase
in the
Notes to Consolidated Financial Statements
.
2013
WESTERN U.S. INVENTORY BY SPECIES
WEYERHAEUSER COMPANY >
2013 ANNUAL REPORT AND FORM 10-K
4
2013
WESTERN U.S. INVENTORY BY AGE / SPECIES
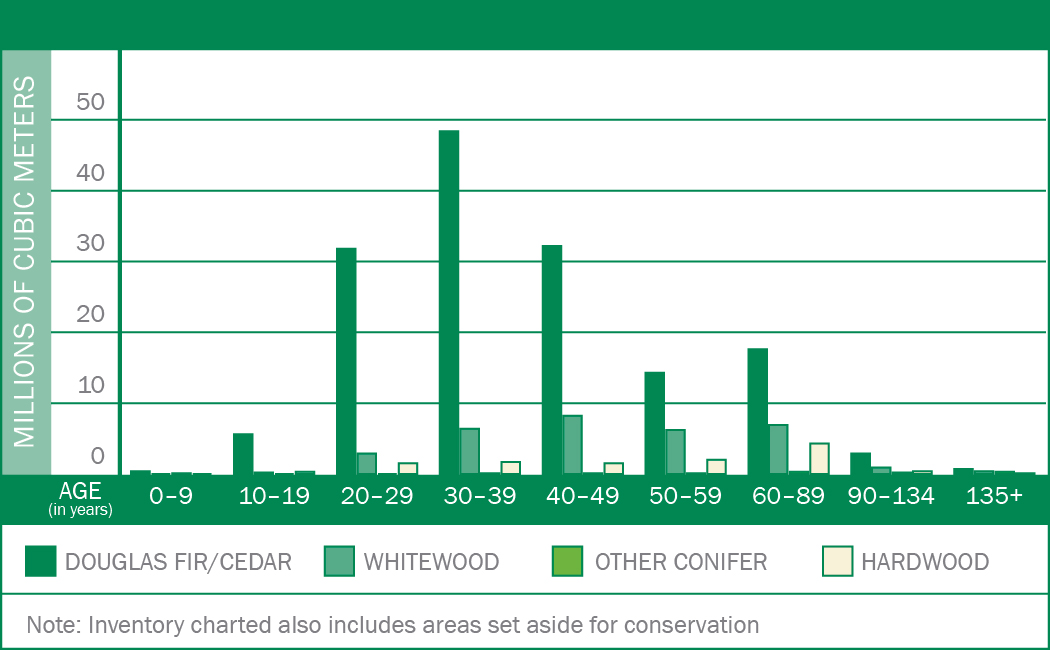
The average age of timber harvested in
2013
was 53 years. Most of our U.S. timberland is intensively managed for timber production, but some areas are conserved for environmental, historical, recreational or cultural reasons. Some of our older trees are protected in acreage set aside for conservation, and some are not yet logged due to harvest rate regulations. While over the long term our average harvest age will decrease in accordance with our sustainable forestry practices, we will only harvest approximately 1.5 percent of our Western acreage each year.
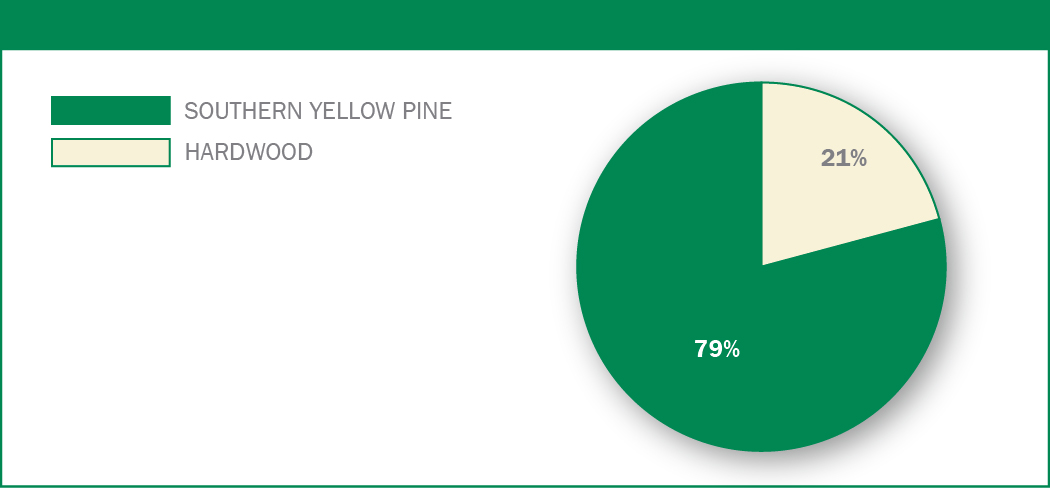
Southern United States
Our Southern acres predominantly contain southern yellow pine and encompass timberlands in seven states.
We intensively manage our timber plantations using forestry research and planning systems to optimize grade log production. We also actively manage our land to capture revenues from our oil, gas and hard minerals resources. We do this while providing quality habitat for a range of animals and birds, which is in high demand for recreational purposes. We lease more than 94 percent of our acres to the public and state wildlife agencies for recreational purposes.
2013
SOUTHERN U.S. INVENTORY BY SPECIES
2013
SOUTHERN U.S. INVENTORY BY AGE / SPECIES
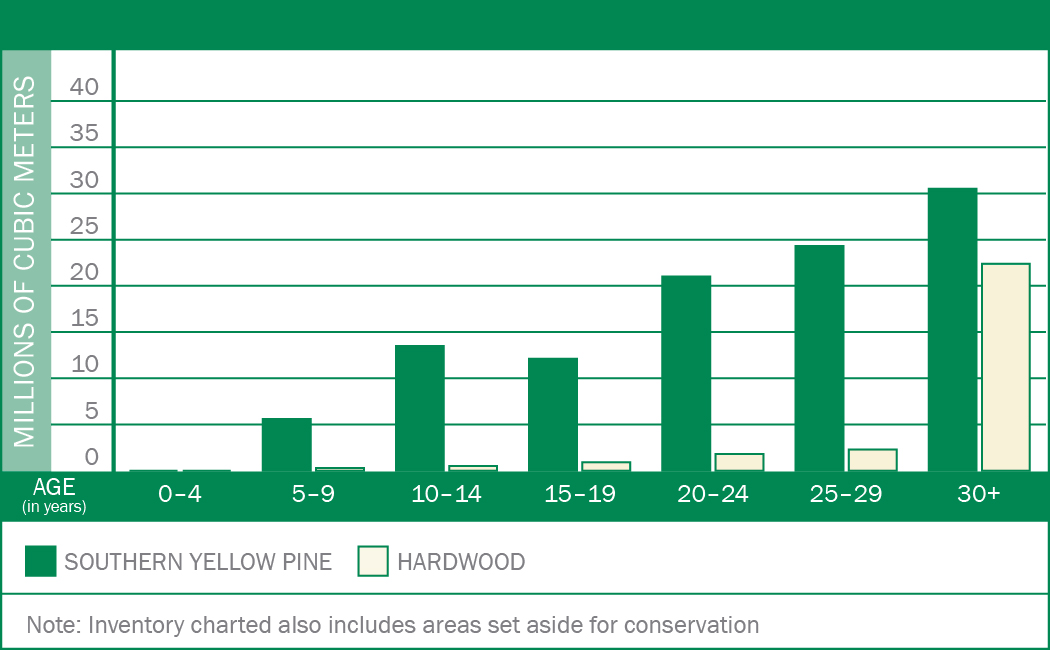
The average age of timber harvested in
2013
was 32 years for southern yellow pine. In accordance with our sustainable forestry practices, we harvest approximately 3.0 percent to 3.5 percent of our acreage each year in the South.
WEYERHAEUSER COMPANY >
2013 ANNUAL REPORT AND FORM 10-K
5
International
|
GEOGRAPHIC AREA
|
MILLIONS
OF CUBIC
METERS
|
|
THOUSANDS OF ACRES AT
DECEMBER 31, 2013
|
|||||
|
|
TOTAL
INVENTORY
|
|
FEE
OWNERSHIP
|
|
LONG-TERM
LEASES
|
|
TOTAL
ACRES
|
|
|
Uruguay
|
9
|
|
298
|
|
25
|
|
323
|
|
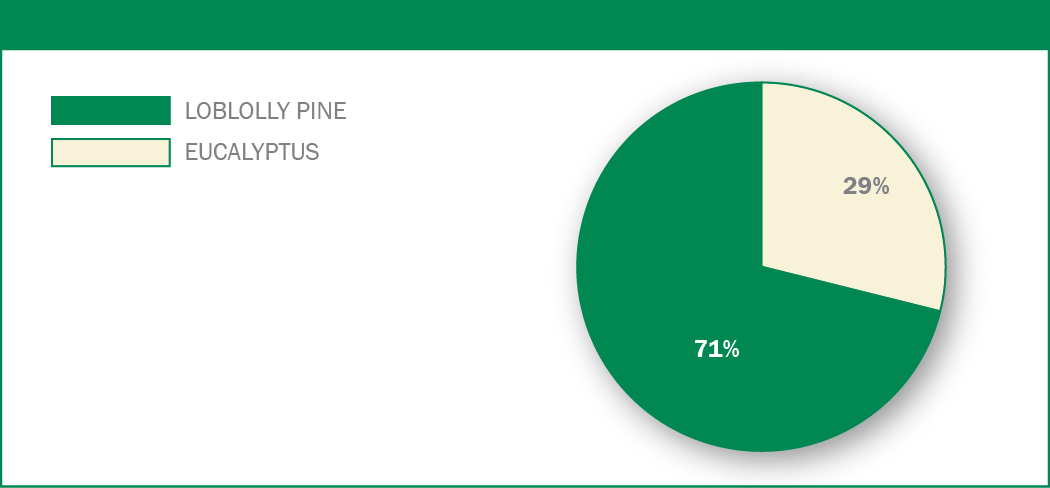
Our forestland acres in Uruguay are split approximately 50 percent loblolly pine and 50 percent eucalyptus. Loblolly pine comprises more of our timber inventory due to its older age. On average, the timber in Uruguay is in the second third of its rotation age. It is entering into that part of the growth rotation when we will see increased volume accretion. About 95 percent of the area to be planted has been afforested to date.
2013
INTERNATIONAL INVENTORY BY SPECIES (URUGUAY)
In Uruguay, the target rotation ages are 21 to 22 years for pine and 14 to 17 years for eucalyptus. We manage both species to a grade (appearance) regime.
We also operate a plywood mill in Uruguay with a production capacity of 210,000 cubic meters. Production volume reached 192,000 cubic meters in
2013
.
In Brazil, Weyerhaeuser is a managing partner in a joint venture. We own 67 percent and Fibria Celulose SA owns 33 percent. A hardwood sawmill with 55,000 cubic meters of capacity produces high-value eucalyptus (Lyptus
®
) lumber and related appearance wood products. The mill’s production in
2013
was 48,500 cubic meters.
Canada — Licensed Timberlands
|
GEOGRAPHIC AREA
|
MILLIONS
OF CUBIC
METERS
|
|
THOUSANDS OF ACRES AT
DECEMBER 31, 2013
|
|
|
|
TOTAL
INVENTORY
LICENSED
STANDING VOLUME
|
|
TOTAL
LICENSE
ARRANGEMENTS
|
|
|
Canada:
|
|
|||
|
Alberta
|
274
|
|
5,304
|
|
|
British Columbia
|
38
|
|
1,012
|
|
|
Ontario
|
39
|
|
2,573
|
|
|
Saskatchewan
|
102
|
|
4,968
|
|
|
Total Canada
|
453
|
|
13,857
|
|
We lease and license forestland in Canada from the provincial government to secure the volume for our manufacturing units in the various provinces. When the volume is harvested, we pay the province at stumpage rates set by the government and generally based on prevailing market prices. The harvested logs are transferred to our manufacturing facilities at cost (stumpage plus harvest, haul and overhead costs less any margin on selling logs to third parties). Any conversion profit is recognized at the respective mill in either the Cellulose Fibers or Wood Products segment.
Five-Year Summary of Timberlands Production
|
PRODUCTION IN THOUSANDS
|
||||||||||
|
|
2013
|
|
2012
|
|
2011
|
|
2010
|
|
2009
|
|
|
Fee depletion – cubic meters:
|
|
|
|
|
|
|
||||
|
West
|
8,907
|
|
7,170
|
|
6,595
|
|
5,569
|
|
6,359
|
|
|
South
|
11,596
|
|
11,488
|
|
9,738
|
|
8,197
|
|
8,996
|
|
|
International
|
818
|
|
763
|
|
854
|
|
349
|
|
503
|
|
|
Total
|
21,321
|
|
19,421
|
|
17,187
|
|
14,115
|
|
15,858
|
|
Our Timberlands annual fee depletion represents the harvest of the timber assets we own. Depletion is a method of expensing the cost of establishing the fee timber asset base over the harvest or timber sales volume. The increase in fee depletion from 2011 through 2013 reflects improving market conditions. The increase in fee depletion in the West in 2013 also reflects the purchase of Longview Timber.
WEYERHAEUSER COMPANY >
2013 ANNUAL REPORT AND FORM 10-K
6
Five-Year Summary of Timberlands Production - Percentage of Grade and Fiber
|
PERCENTAGE OF GRADE AND FIBER
|
|||||||||||
|
|
2013
|
|
2012
|
|
2011
|
|
2010
|
|
2009
|
|
|
|
West
|
Grade
|
90
|
%
|
90
|
%
|
90
|
%
|
92
|
%
|
90
|
%
|
|
Fiber
|
10
|
%
|
10
|
%
|
10
|
%
|
8
|
%
|
10
|
%
|
|
|
South
|
Grade
|
57
|
%
|
59
|
%
|
58
|
%
|
55
|
%
|
55
|
%
|
|
Fiber
|
43
|
%
|
41
|
%
|
42
|
%
|
45
|
%
|
45
|
%
|
|
|
International
|
Grade
|
60
|
%
|
67
|
%
|
55
|
%
|
65
|
%
|
65
|
%
|
|
Fiber
|
40
|
%
|
33
|
%
|
45
|
%
|
35
|
%
|
35
|
%
|
|
|
Total
|
Grade
|
69
|
%
|
71
|
%
|
70
|
%
|
70
|
%
|
70
|
%
|
|
Fiber
|
31
|
%
|
29
|
%
|
30
|
%
|
30
|
%
|
30
|
%
|
|
HOW MUCH WE SELL
Our net sales to unaffiliated customers over the last two years were:
|
•
|
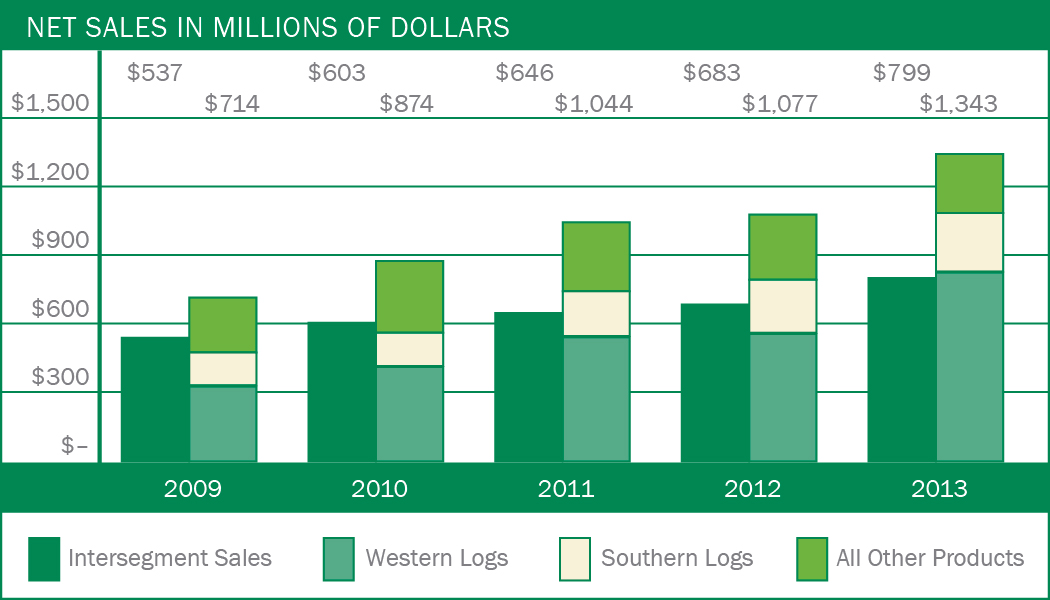
$1.3 billion
in
2013
— up 25 percent from
2012
; and
|
|
•
|
$1.1 billion
in
2012
.
|
Our intersegment sales over the last two years were:
|
•
|
$799 million
in
2013
— up 17 percent from
2012
; and
|
|
•
|
$683 million
in
2012
.
|
Five-Year Summary of Net Sales for Timberlands
|
NET SALES IN MILLIONS OF DOLLARS
|
|||||||||||||||
|
|
2013
|
|
2012
|
|
2011
|
|
2010
|
|
2009
|
|
|||||
|
To unaffiliated customers:
|
|
|
|
|
|
||||||||||
|
Logs:
|
|
|
|
|
|
||||||||||
|
West
|
$
|
828
|
|
$
|
559
|
|
$
|
545
|
|
$
|
414
|
|
$
|
329
|
|
|
South
|
256
|
|
233
|
|
196
|
|
145
|
|
144
|
|
|||||
|
Canada
|
19
|
|
19
|
|
17
|
|
17
|
|
13
|
|
|||||
|
Total
|
1,103
|
|
811
|
|
758
|
|
576
|
|
486
|
|
|||||
|
Pay as cut timber sales
|
9
|
|
13
|
|
7
|
|
8
|
|
8
|
|
|||||
|
Chip sales
|
9
|
|
18
|
|
19
|
|
16
|
|
15
|
|
|||||
|
Timberlands sales and exchanges
(1)
|
65
|
|
59
|
|
77
|
|
109
|
|
66
|
|
|||||
|
Higher and better use land sales
(1)
|
19
|
|
22
|
|
25
|
|
22
|
|
11
|
|
|||||
|
Minerals, oil and gas
|
32
|
|
31
|
|
53
|
|
60
|
|
62
|
|
|||||
|
Products from international operations
(2)
|
90
|
|
106
|
|
86
|
|
65
|
|
44
|
|
|||||
|
Other products
|
16
|
|
17
|
|
19
|
|
18
|
|
22
|
|
|||||
|
Subtotal sales to unaffiliated customers
|
1,343
|
|
1,077
|
|
1,044
|
|
874
|
|
714
|
|
|||||
|
Intersegment sales:
|
|
|
|
|
|
||||||||||
|
United States
|
518
|
|
447
|
|
424
|
|
409
|
|
392
|
|
|||||
|
Other
|
281
|
|
236
|
|
222
|
|
194
|
|
145
|
|
|||||
|
Subtotal intersegment sales
|
799
|
|
683
|
|
646
|
|
603
|
|
537
|
|
|||||
|
Total
|
$
|
2,142
|
|
$
|
1,760
|
|
$
|
1,690
|
|
$
|
1,477
|
|
$
|
1,251
|
|
|
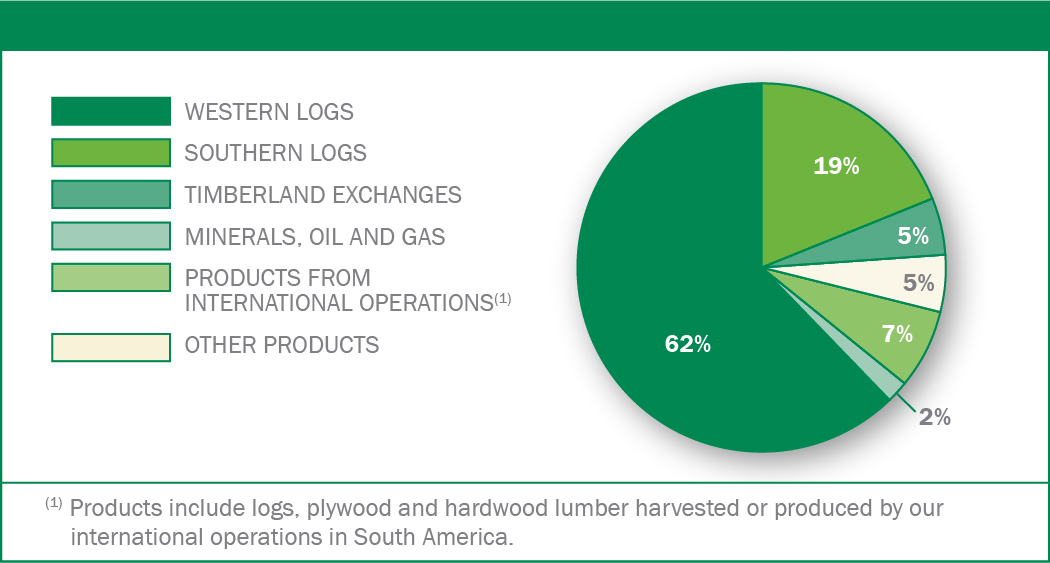
(1) Significant dispositions of higher and better use timberland and some non-strategic timberlands are made through subsidiaries.
(2) Products include logs, plywood and hardwood lumber harvested or produced by our international operations, primarily in South America.
|
|||||||||||||||
WEYERHAEUSER COMPANY >
2013 ANNUAL REPORT AND FORM 10-K
7
Five-Year Trend for Total Net Sales in Timberlands
Percentage of
2013
Sales to Unaffiliated Customers
Log Sales Volumes
Logs sold to unaffiliated customers in
2013
increased 2.1 million cubic meters — 17 percent — from
2012
.
|
•
|
Sales volumes in the West increased 1.8 million cubic meters — 31 percent — primarily due to strong export and domestic demand and the purchase of Longview Timber. Our western sales to unaffiliated customers generally are higher-grade logs sold into the export market and domestic-grade logs sold to West Coast sawmills.
|
|
•
|
Sales to unaffiliated customers in the South increased 313 thousand cubic meters — 6 percent — primarily due to increased harvest levels and increased sales of logs to third parties. Our southern sales volumes to unaffiliated customers generally are lower-grade fiber logs sold to pulp or containerboard mills. We use most of our high-grade logs in our own converting facilities.
|
|
•
|
Sales volumes from Canada decreased 20 thousand cubic meters — 4 percent — in
2013
. This decrease in volume to unaffiliated customers primarily was due to increased internal mill demand.
|
|
•
|
Sales volumes from our international operations increased 14 thousand cubic meters — 4 percent — in
2013
. This increase in volume was mainly due to increased domestic demand in Uruguay.
|
We sell three grades of logs — domestic grade, domestic fiber and export. Factors that may affect log sales in each of these categories include:
|
•
|
domestic grade log sales — lumber usage, primarily for housing starts and repair and remodel activity, the needs of our own mills and the availability of logs from both outside markets and our own timberlands;
|
|
•
|
domestic fiber log sales — demand for chips by pulp and containerboard mills; and
|
|
•
|
export log sales — the level of housing starts in Japan and construction in China.
|
Our sales volumes include logs purchased in the open market and all our domestic and export logs that are sold to unaffiliated customers or transferred at market prices to our internal mills by the sales and marketing staff within our Timberlands business units.
Five-Year Summary of Log Sales Volumes to Unaffiliated Customers for Timberlands
|
SALES VOLUMES IN THOUSANDS
|
||||||||||
|
|
2013
|
|
2012
|
|
2011
|
|
2010
|
|
2009
|
|
|
Logs – cubic
meters:
|
|
|
|
|
|
|||||
|
West
|
7,708
|
|
5,898
|
|
5,267
|
|
4,476
|
|
4,479
|
|
|
South
|
5,888
|
|
5,575
|
|
4,879
|
|
3,357
|
|
3,536
|
|
|
Canada
|
511
|
|
531
|
|
479
|
|
507
|
|
409
|
|
|
International
|
357
|
|
343
|
|
314
|
|
283
|
|
305
|
|
|
Total
|
14,464
|
|
12,347
|
|
10,939
|
|
8,623
|
|
8,729
|
|
WEYERHAEUSER COMPANY >
2013 ANNUAL REPORT AND FORM 10-K
8
Log Prices
The majority of our log sales to unaffiliated customers involve sales to domestic sawmills and the export market. Log prices in the following tables are on a delivered (mill) basis:
Five-Year Summary of Published Domestic Log Prices (#2 Sawlog Bark On — $/MBF)
Five-Year Summary of Export Log Prices (#2 Sawlog Bark On — $/MBF)
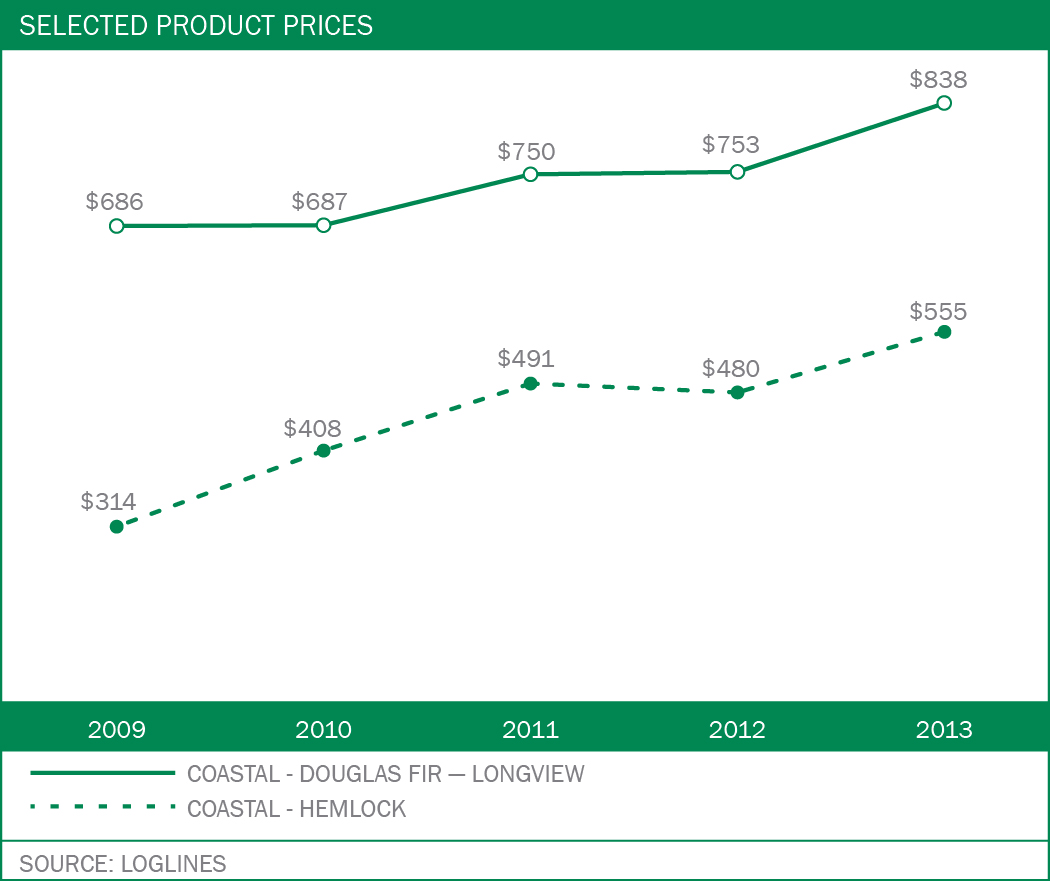
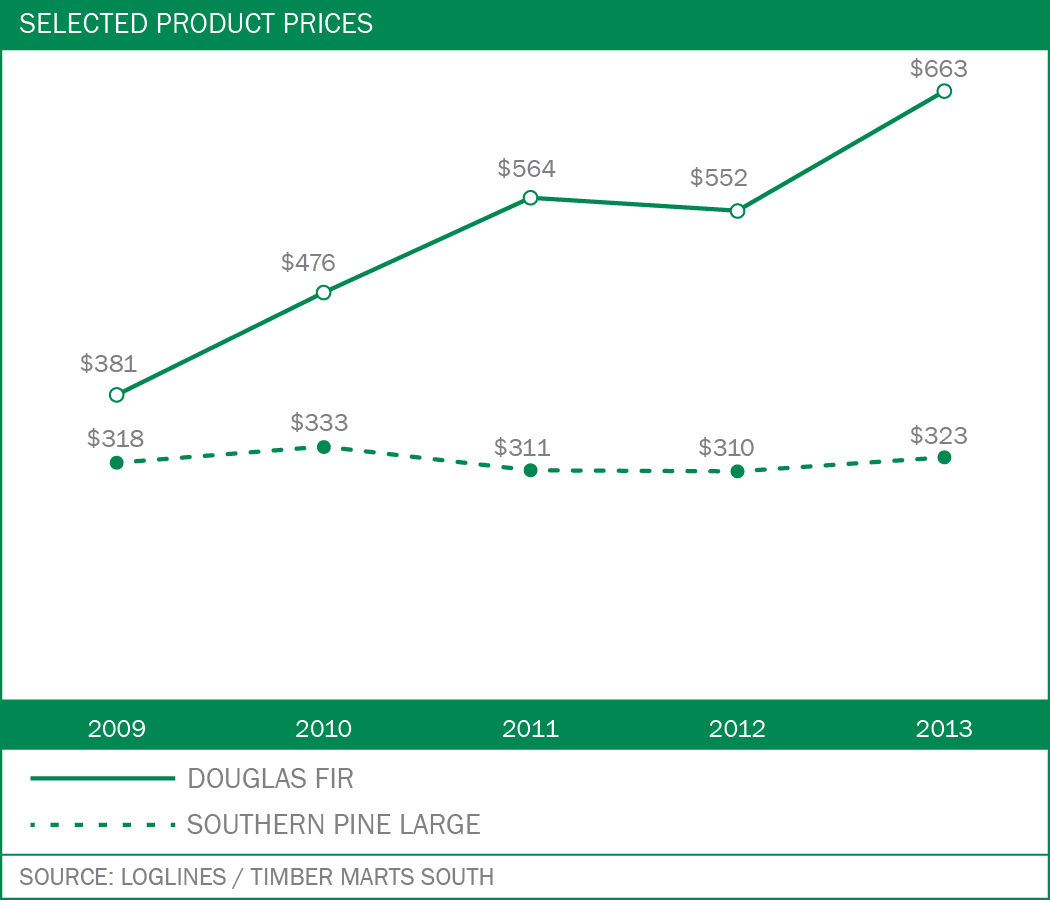
Our log prices are affected by the supply of and demand for grade and fiber logs and are influenced by the same factors that affect log sales. Export log prices are particularly affected by the Japanese housing market.
Our average
2013
log realizations in the West increased from
2012
— primarily due to stronger demand for logs in the Chinese market and a tightening log supply in the domestic market. Our average
2013
log realizations in the South increased from
2012
— primarily due to improved demand for logs in the South.
Minerals and Energy Products
Mineral revenue increased slightly in
2013
from increases in royalty revenue resulting from improvements in natural gas prices, construction aggregates, and industrial minerals.
WEYERHAEUSER COMPANY >
2013 ANNUAL REPORT AND FORM 10-K
9
WHERE WE’RE HEADED
Our competitive strategies include:
|
•
|
maximizing cash flow through operational excellence
|
– positioning ourselves as one of the largest, lowest-cost growers of softwood timber;
– reducing the time it takes to realize returns by practicing intensive forest management and focusing on the most advantageous markets;
– efficiently delivering high quality raw materials to external customers and internal supply chains;
– investing in technology and advances in silviculture to improve yields and timber quality;
– leveraging our mineral ownership position;
|
•
|
capturing the full value of the Longview Timber acquisition;
|
|
•
|
continuously reviewing our portfolio of land holdings to create the greatest value for the company; and
|
|
•
|
positioning ourselves to take advantage of new market opportunities that may be created by energy and climate change legislation and regulation.
|
WOOD PRODUCTS
We are a large manufacturer and distributor of wood products primarily in North America and Asia.
WHAT WE DO
Our wood products segment:
|
•
|
provides a family of high-quality softwood lumber, engineered lumber, structural panels and other specialty products to the residential, multi-family and light commercial markets;
|
|
•
|
sells our products and services primarily through our own sales organizations and distribution facilities as well as building materials that we purchase from other manufacturers;
|
|
•
|
sells certain products into the repair and remodel market through the wood preserving and home-improvement warehouse channels; and
|
|
•
|
exports our softwood lumber, oriented strand board (OSB) and engineered building materials to Asia.
|
Wood Products
|
PRODUCTS
|
HOW THEY’RE USED
|
|
Structural lumber
|
Structural framing for new residential, repair and remodel, treated applications, industrial and commercial structures
|
|
Engineered lumber
• Solid section
• I-joists
|
Floor and roof joists, and headers and beams for residential, multi-family and commercial structures
|
|
Structural panels
• Oriented strand board (OSB)
• Softwood plywood
|
Structural sheathing, subflooring and stair tread for residential, multi-family and commercial structures
|
|
Other products
|
Complementary building products such as cedar, decking, siding, insulation, rebar and engineered lumber connectors
|
WHERE WE DO IT
We operate manufacturing facilities in the United States and Canada. We distribute through a combination of Weyerhaeuser and third-party locations. Information about the locations, capacities and actual production of our manufacturing facilities is included below.
Principal Manufacturing Locations
Locations of our principal manufacturing facilities as of
December 31, 2013
, by major product group were:
|
•
|
Structural lumber
|
– U.S. — Alabama, Arkansas, Louisiana, Mississippi, North Carolina, Oklahoma, Oregon and Washington
– Canada — Alberta and British Columbia
|
•
|
Engineered lumber
|
– U.S. — Alabama, Louisiana, Oregon and West Virginia
– Canada — British Columbia and Ontario
|
•
|
Oriented strand board
|
– U.S. — Louisiana, Michigan, North Carolina and West Virginia
– Canada — Alberta and Saskatchewan
|
•
|
Softwood plywood
|
– U.S. — Arkansas and Louisiana
WEYERHAEUSER COMPANY >
2013 ANNUAL REPORT AND FORM 10-K
10
Summary of
2013
Wood Products Capacities
|
CAPACITIES IN MILLIONS
|
||||
|
|
PRODUCTION
CAPACITY
|
|
NUMBER OF
FACILITIES
|
|
|
Structural lumber – board feet
|
4,614
|
|
18
|
|
|
Engineered solid section – cubic feet
|
32
|
|
6
|
|
|
Engineered I-joists – lineal feet
|
304
|
|
3
|
|
|
Oriented strand board – square feet (3/8”)
|
3,015
|
|
6
|
|
|
Softwood plywood – square feet (3/8”)
|
460
|
|
2
|
|
|
Capacities include one facility closed throughout 2013 that produces engineered solid section and I-joists products.
|
||||
Production capacities listed represent annual production volume under normal operating conditions and producing a normal product mix for each individual facility. Production capacities do not include any capacity for facilities that were sold or permanently closed as of the end of
2013
.
During 2013, we decided to permanently close our Colbert, Georgia engineered lumber facility and reopen in 2014 our Evergreen, Alabama engineered lumber facility. Both facilities were previously indefinitely closed.
Additionally, our hardwoods operations were sold in 2011 and are excluded from our Wood Product's results below. More information about this sale is included in
Note 5: Discontinued Operations
in the
Notes to Consolidated Financial Statements
.
Five-Year Summary of Wood Products Production
|
PRODUCTION IN MILLIONS
|
||||||||||
|
|
2013
|
|
2012
|
|
2011
|
|
2010
|
|
2009
|
|
|
Structural lumber – board feet
|
4,084
|
|
3,846
|
|
3,528
|
|
3,289
|
|
3,098
|
|
|
Engineered solid section – cubic feet
(1)
|
18.0
|
|
15.4
|
|
13.4
|
|
14.5
|
|
11.3
|
|
|
Engineered I-joists – lineal feet
(1)
|
168
|
|
147
|
|
122
|
|
133
|
|
109
|
|
|
Oriented strand board – square feet (3/8”)
|
2,723
|
|
2,511
|
|
2,127
|
|
1,721
|
|
1,448
|
|
|
Softwood plywood – square feet (3/8”)
(2)
|
241
|
|
214
|
|
197
|
|
212
|
|
150
|
|
|
(1) Weyerhaeuser engineered I-joist facilities also may produce engineered solid section.
(2) All Weyerhaeuser plywood facilities also produce veneer.
|
||||||||||
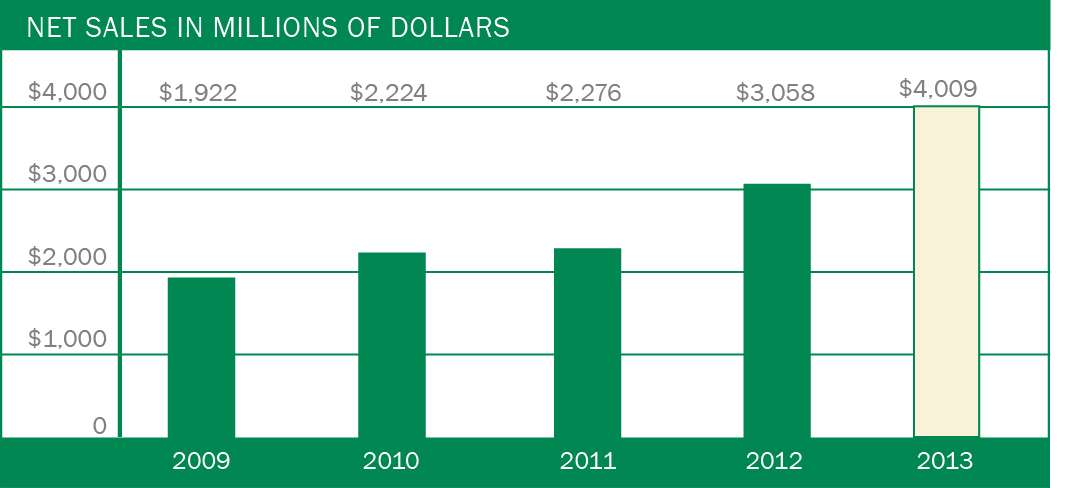
HOW MUCH WE SELL
Revenues of our Wood Products segment come from sales to wood products dealers, do-it-yourself retailers, builders and industrial users. In
2013
, Wood Products net sales were
$4.0 billion
, an increase of 31 percent, compared with
$3.1 billion
in
2012
.
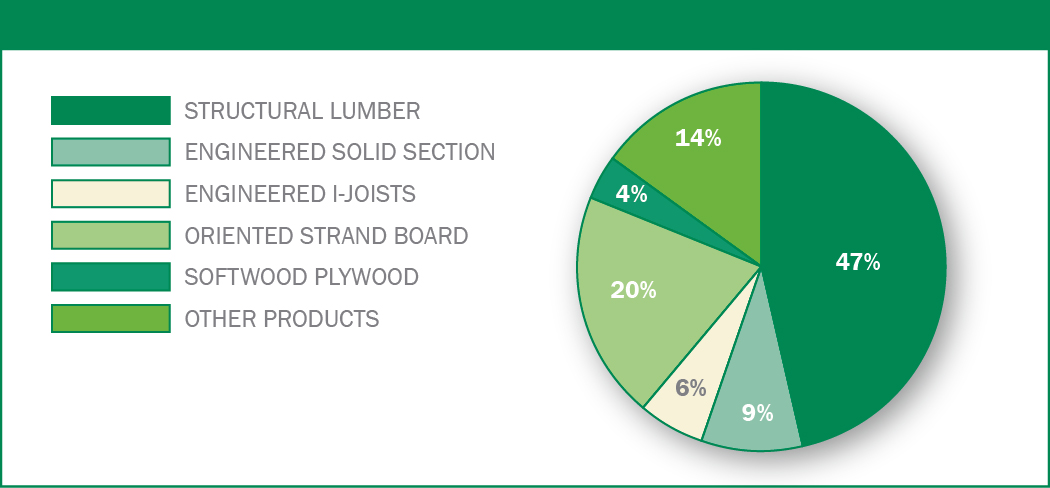
Five-Year Summary of Net Sales for Wood Products
|
NET SALES IN MILLIONS OF DOLLARS
|
|||||||||||||||
|
|
2013
|
|
2012
|
|
2011
|
|
2010
|
|
2009
|
|
|||||
|
Structural lumber
|
$
|
1,873
|
|
$
|
1,400
|
|
$
|
1,087
|
|
$
|
1,044
|
|
$
|
846
|
|
|
Engineered solid section
|
353
|
|
279
|
|
235
|
|
246
|
|
219
|
|
|||||
|
Engineered I-joists
|
247
|
|
190
|
|
161
|
|
171
|
|
162
|
|
|||||
|
Oriented strand board
|
809
|
|
612
|
|
354
|
|
319
|
|
226
|
|
|||||
|
Softwood plywood
|
144
|
|
115
|
|
66
|
|
65
|
|
50
|
|
|||||
|
Other products produced
|
171
|
|
167
|
|
142
|
|
125
|
|
130
|
|
|||||
|
Other products purchased for resale
|
412
|
|
295
|
|
231
|
|
254
|
|
289
|
|
|||||
|
Total
|
$
|
4,009
|
|
$
|
3,058
|
|
$
|
2,276
|
|
$
|
2,224
|
|
$
|
1,922
|
|
Five-Year Trend for Total Net Sales in Wood Products
WEYERHAEUSER COMPANY >
2013 ANNUAL REPORT AND FORM 10-K
11
Percentage of
2013
Net Sales in Wood Products
Wood Products Volume
The volume of structural lumber, OSB, and engineered lumber sold in
2013
increased from
2012
due to increased operating capacity, targeted capital improvements and new product offerings.
Five-Year Summary of Sales Volume for Wood Products
|
SALES VOLUMES IN MILLIONS
|
||||||||||
|
|
2013
|
|
2012
|
|
2011
|
|
2010
|
|
2009
|
|
|
Structural lumber – board feet
|
4,436
|
|
4,031
|
|
3,586
|
|
3,356
|
|
3,317
|
|
|
Engineered solid section – cubic feet
|
18.2
|
|
15.4
|
|
12.3
|
|
13.1
|
|
12.2
|
|
|
Engineered I-joists – lineal feet
|
177
|
|
152
|
|
128
|
|
145
|
|
139
|
|
|
Oriented strand board – square feet (3/8”)
|
2,772
|
|
2,508
|
|
1,977
|
|
1,547
|
|
1,386
|
|
|
Softwood Plywood – square feet (3/8”)
|
402
|
|
340
|
|
249
|
|
237
|
|
200
|
|
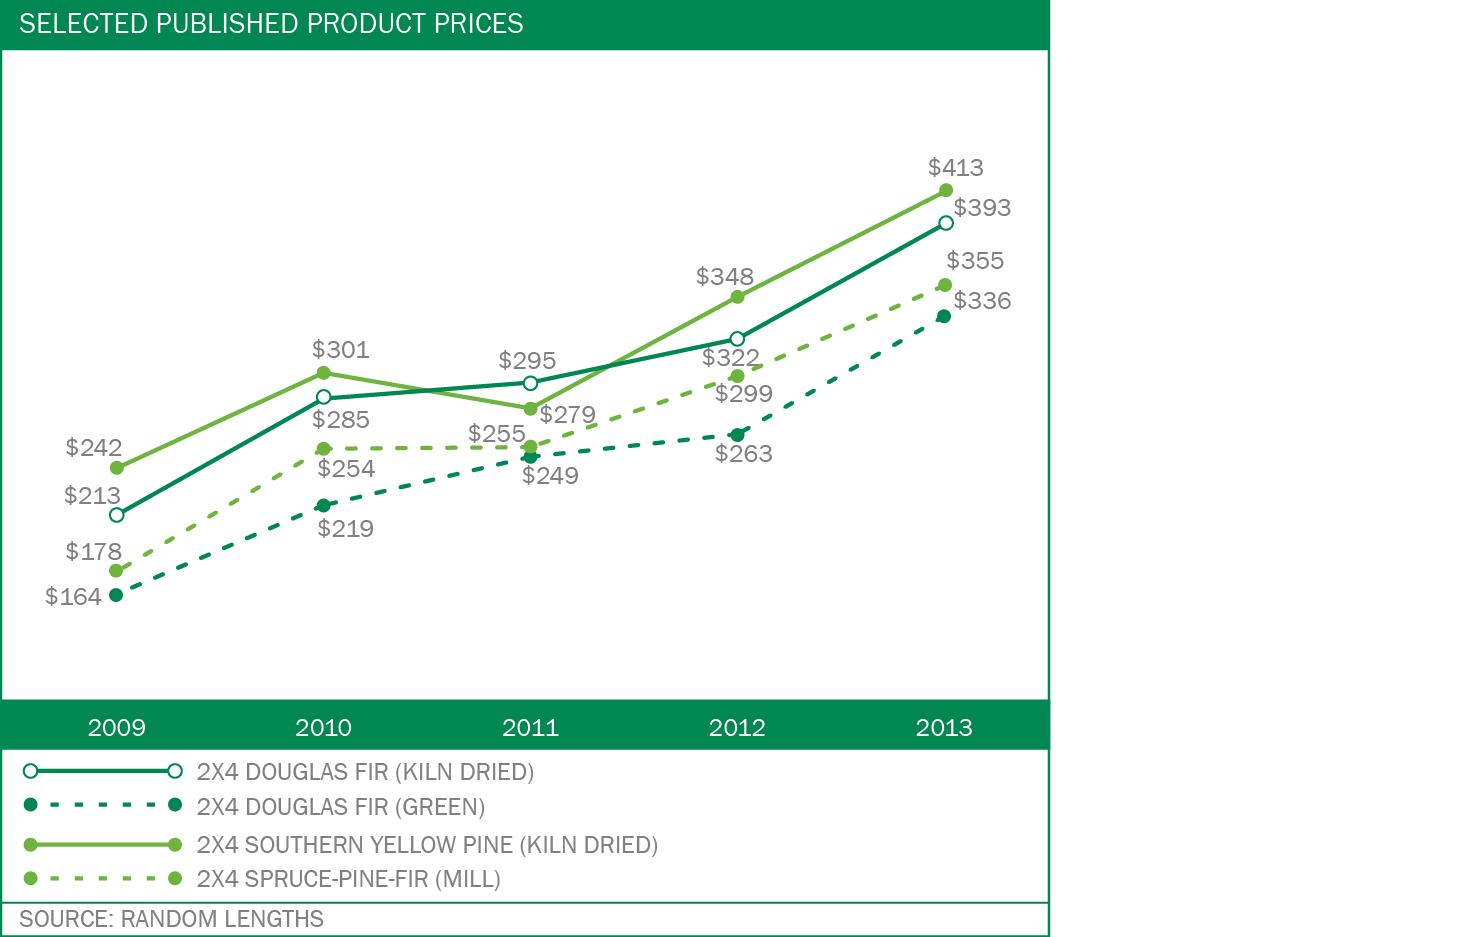
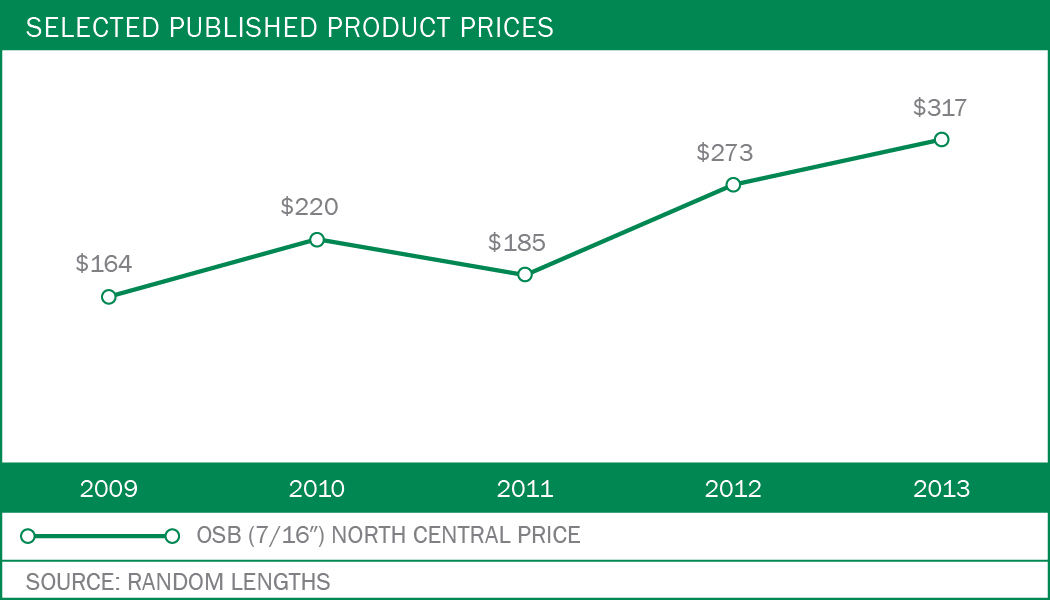
Wood Products Prices
Prices for commodity wood products — Structural lumber, OSB and Plywood — increased in
2013
from
2012
.
In general, the following factors influence prices for wood products:
|
•
|
Demand for wood products used in residential and multi-family construction and the repair and remodel of existing homes affects prices. Residential construction is influenced by factors such as population growth and other demographics, the level of employment, consumer confidence, consumer income, availability of financing and interest rate levels, and the supply and pricing of existing homes on the market. Repair and remodel activity is affected by the size and age of existing housing inventory and access to home equity financing and other credit.
|
|
•
|
The availability of supply of commodity building products such as structural lumber, OSB and plywood affects prices. A number of factors can influence supply, including changes in production capacity and utilization rates, weather, raw material supply and availability of transportation.
|
The North American housing market continued to show sustained improvement in
2013
. This improvement led to increased demand and resulted in improved pricing for commodity wood products in
2013
. The following graphs reflect product price trends for the past five years.
Five-Year Summary of Published Lumber Prices — $/MBF
WEYERHAEUSER COMPANY >
2013 ANNUAL REPORT AND FORM 10-K
12
Five-Year Summary of Published Oriented Strand Board Prices — $/MSF
WHERE WE’RE HEADED
Our competitive strategies include:
|
•
|
reduce controllable manufacturing costs through operational excellence;
|
|
•
|
maintain a value-added product mix;
|
|
•
|
leverage our brand and reputation as the preferred provider of quality building products; and
|
|
•
|
pursue disciplined, profitable sales growth including increasing in geographies outside of North America.
|
CELLULOSE FIBERS
Our cellulose fibers segment is one of the world’s largest producers of absorbent fluff pulp used in products such as diapers. We also manufacture liquid packaging board and other pulp products. We have a 50 percent interest in North Pacific Paper Corporation (NORPAC) — a joint venture with Nippon Paper Industries that produces newsprint and high-brightness publication papers.
WHAT WE DO
Our cellulose fibers segment:
|
•
|
provides cellulose fibers for absorbent products in markets around the world;
|
|
•
|
works closely with our customers to develop unique or specialized applications;
|
|
•
|
manufactures liquid packaging board used primarily for the production of containers for liquid products; and
|
|
•
|
is largely energy self sufficient, with 83 percent of its energy derived from black liquor produced at the mills and biomass.
|
Cellulose Fibers Products
|
PRODUCTS
|
HOW THEY’RE USED
|
|
Pulp
• Fluff pulp (Southern softwood kraft fiber)
• Softwood papergrade pulp
• Specialty chemical cellulose pulp
|
• Used in sanitary disposable products that require bulk, softness and absorbency
• Used in products that include printing and writing papers and tissue
• Used in textiles, absorbent products, specialty packaging, specialty applications and proprietary high-bulking fibers
|
|
Liquid packaging board
|
Converted into containers to hold liquids such as milk, juice and tea
|
|
Other products
• Slush pulp
• Wet lap pulp
|
Used in the manufacture of paper products
|
WHERE WE DO IT
Our cellulose fibers (pulp) products are distributed through a global direct sales network, and our liquid packaging products are sold directly to carton and food product packaging converters in North America and Asia. Locations of our principal manufacturing facilities by major product group are:
|
•
|
Pulp Manufacturing
|
- U.S. - Georgia (2), Mississippi and North Carolina
- Canada - Alberta
|
•
|
Pulp Converting
|
- U.S. - Mississippi
-
Poland (began converting in first quarter 2013)
|
•
|
Liquid packaging board
|
- U.S. - Washington
WEYERHAEUSER COMPANY >
2013 ANNUAL REPORT AND FORM 10-K
13
Summary of
2013
Cellulose Fibers Capacities
|
CAPACITIES IN THOUSANDS
|
||||
|
|
PRODUCTION
CAPACITY
|
|
NUMBER OF
FACILITIES
|
|
|
Pulp – air-dry metric tons
|
1,848
|
|
5
|
|
|
Liquid packaging board – tons
|
315
|
|
1
|
|
Production capacities listed represent annual production volume under normal operating conditions and producing a normal product mix for each individual facility.
Five-Year Summary of Cellulose Fibers Production
|
PRODUCTION IN THOUSANDS
|
||||||||||
|
|
2013
|
|
2012
|
|
2011
|
|
2010
|
|
2009
|
|
|
Pulp – air-dry metric tons
|
1,815
|
|
1,773
|
|
1,769
|
|
1,774
|
|
1,629
|
|
|
Liquid packaging board – tons
|
307
|
|
292
|
|
307
|
|
316
|
|
282
|
|
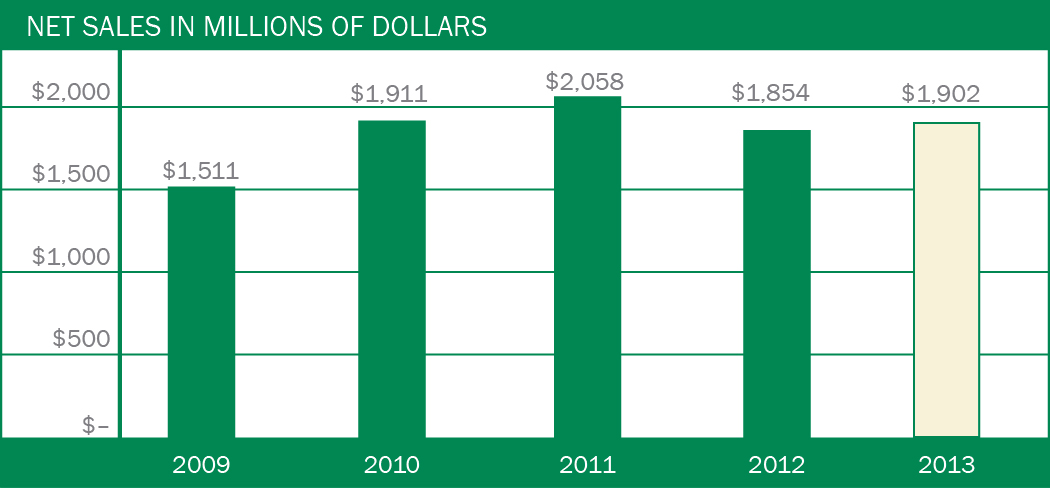
HOW MUCH WE SELL
Revenues of our Cellulose Fibers segment come from sales to customers who use the products for further manufacturing or distribution and for direct use. Our net sales were
$1.9 billion
in
2013
, comparable to
$1.9 billion
in
2012
.
Five-Year Summary of Net Sales for Cellulose Fibers
|
NET SALES IN MILLIONS OF DOLLARS
|
|||||||||||||||
|
|
2013
|
|
2012
|
|
2011
|
|
2010
|
|
2009
|
|
|||||
|
Pulp
|
$
|
1,501
|
|
$
|
1,433
|
|
$
|
1,617
|
|
$
|
1,489
|
|
$
|
1,148
|
|
|
Liquid packaging board
|
326
|
|
332
|
|
346
|
|
337
|
|
290
|
|
|||||
|
Other products
|
75
|
|
89
|
|
95
|
|
85
|
|
73
|
|
|||||
|
Total
|
$
|
1,902
|
|
$
|
1,854
|
|
$
|
2,058
|
|
$
|
1,911
|
|
$
|
1,511
|
|
Five-Year Trend for Total Net Sales in Cellulose Fibers
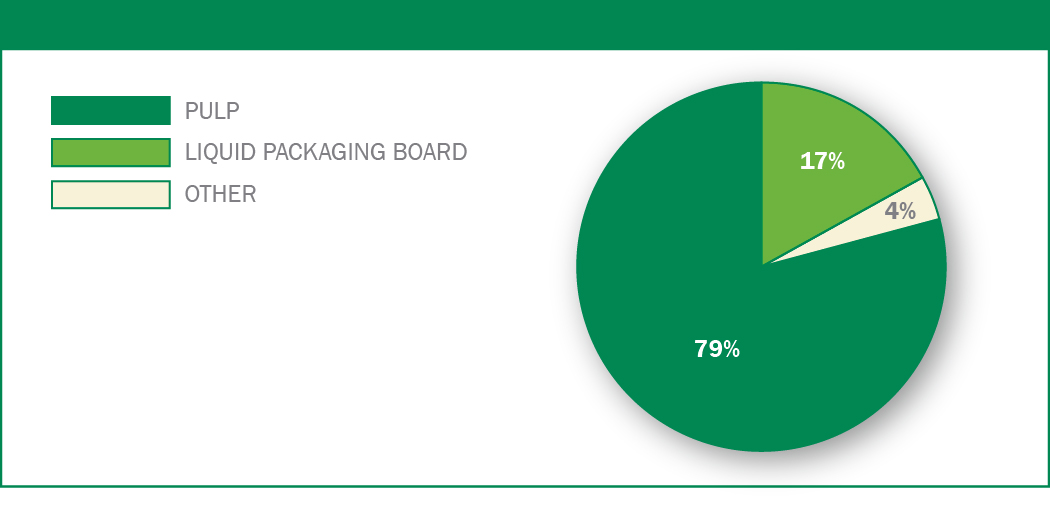
Percentage of
2013
Net Sales in Cellulose Fibers
Pulp Volumes
Our sales volumes of cellulose fiber products were 1.9 million tons in
2013
and 1.8 million tons in
2012
.
Factors that affect sales volumes for cellulose fiber products include:
|
•
|
growth of the world gross domestic product and
|
|
•
|
demand for absorbent hygiene products and paper.
|
WEYERHAEUSER COMPANY >
2013 ANNUAL REPORT AND FORM 10-K
14
Five-Year Summary of Sales Volume for Cellulose Fibers
|
SALES VOLUMES IN THOUSANDS
|
||||||||||
|
|
2013
|
|
2012
|
|
2011
|
|
2010
|
|
2009
|
|
|
Pulp – air-dry metric tons
|
1,866
|
|
1,762
|
|
1,756
|
|
1,714
|
|
1,697
|
|
|
Liquid packaging board – tons
|
305
|
|
289
|
|
297
|
|
311
|
|
288
|
|
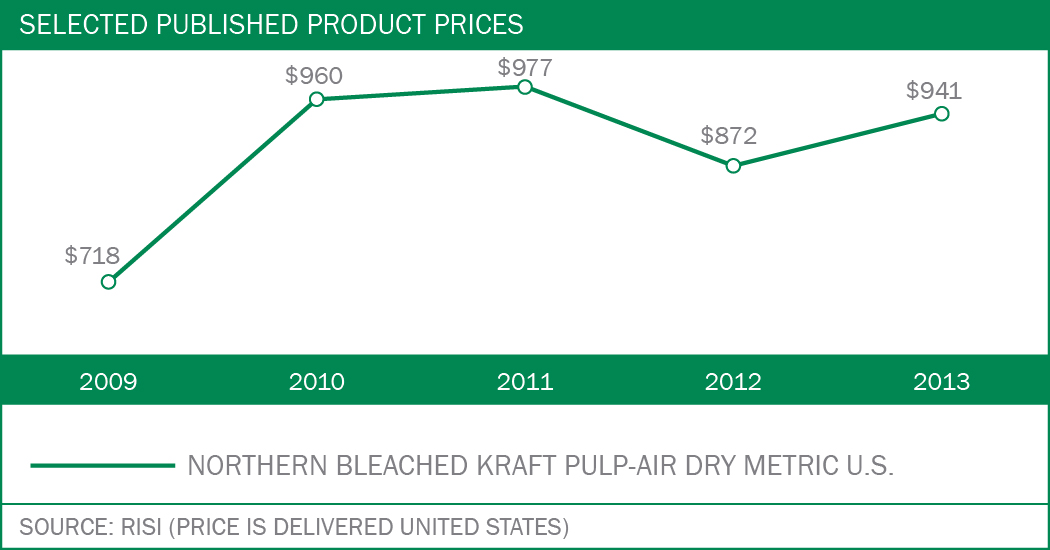
Pulp Prices
Our average pulp prices in
2013
decreased slightly compared with
2012
. The improvement in northern bleached softwood kraft (NBSK) markets was more than offset by decreases in viscose and fluff realizations as a result of market supply greater than demand. NBSK is considered the benchmark softwood pulp price and generally the starting point price for other softwood pulps including southern bleached softwood kraft and fluff.
Five-Year Summary of Published NBSK Pulp Prices — $/ADMT
WHERE WE’RE HEADED
Our competitive strategies include:
|
•
|
improving cost-competitiveness through operational excellence;
|
|
•
|
focusing capital investments on product quality, cost reduction and green energy opportunities; and
|
|
•
|
driving growth of higher margin products
|
– pursuing new products that expand and improve the range of applications for cellulose fibers
– increasing sales of specialty chemical cellulose pulp
– growing with global customers.
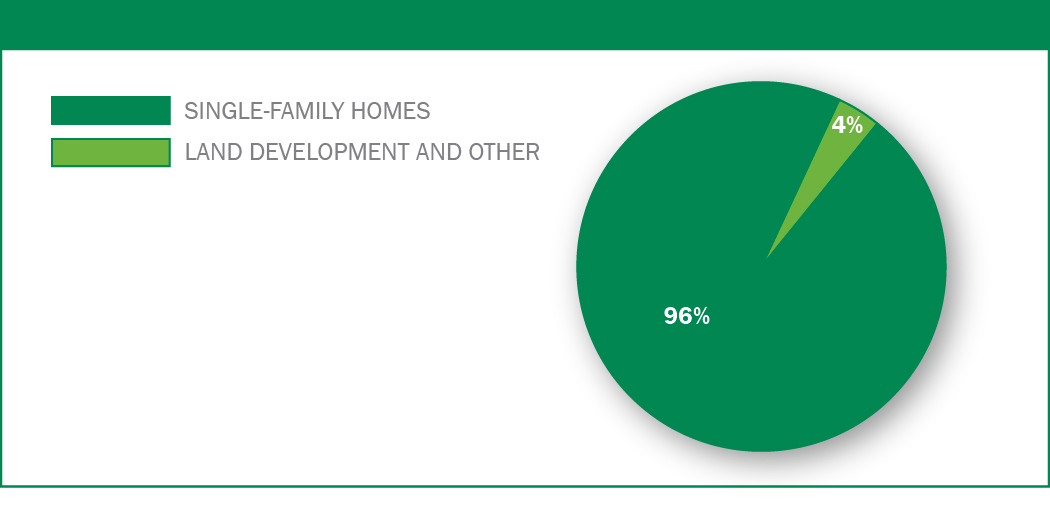
REAL ESTATE
Our Real Estate business segment includes our wholly-owned subsidiary Weyerhaeuser Real Estate Company (WRECO) and its subsidiaries.
WHAT WE DO
The Real Estate segment focuses on:
|
•
|
constructing single-family housing and
|
|
•
|
developing residential lots for our use and for sale.
|
Real Estate Products and Activities
|
PRODUCTS
|
HOW THEY’RE USED
|
|
Single-family housing
|
Residential living
|
|
Land
|
Residential lots and land for construction and sale, master-planned communities with mixed-use property
|
On June 16, 2013, we announced that our Board of Directors authorized the exploration of strategic alternatives with respect to Weyerhaeuser
Real Estate Company (WRECO), our homebuilding and real estate development business. The Board indicated that it intended to consider a
broad range of alternatives including, but not limited to, continuing to operate WRECO, or a merger, sale or spin-off of the business. On
November 4, 2013, we announced that we had entered into a transaction agreement dated as of November 3, 2013 with TRI Pointe Homes, Inc.
(TRI Pointe). Pursuant to the transaction agreement, WRECO will be divested through a Reverse Morris Trust transaction and ultimately become
a wholly owned subsidiary of TRI Pointe. More information on this transaction can be found in
Note 4: Real Estate Divestiture
in the
Notes to
Consolidated Financial Statements and on our Current Report on Form 8-K filed with the Securities and Exchange Commission on November 4,
Consolidated Financial Statements and on our Current Report on Form 8-K filed with the Securities and Exchange Commission on November 4,
2013.
During fourth quarter 2013 we recorded a
$356 million
non-cash impairment charge relating to a large master-planned community located north of Las Vegas, Nevada (the "Coyote Springs Property
”
), which is excluded from the transaction agreement with Tri Pointe Homes, Inc., as a result of management determining that our strategy for development will differ from the prior development plan. Of this amount,
$343 million
was recorded in our Real Estate segment and
$13 million
in Unallocated Items. The fair value of the property was primarily based on an independent appraisal that was determined using both other observable inputs (Level 2) related to other market transactions and significant unobservable inputs (Level 3) such as the timing and amounts of future cash flows related to the development of the property, timing and amounts of proceeds from acreage sales, access to water for use on the property and discount rates applicable to the future cash flows.
WEYERHAEUSER COMPANY >
2013 ANNUAL REPORT AND FORM 10-K
15
WHERE WE DO IT
Our operations are concentrated in metropolitan areas in Arizona, California, Maryland, Nevada, Texas, Virginia and Washington.
Controlled Lots by Primary Market as of
December 31, 2013
|
PRIMARY MARKETS
|
NUMBER OF LOTS AT
DECEMBER 31, 2013
|
|
|
Arizona
|
2,307
|
|
|
California
|
17,056
|
|
|
Maryland and Virginia
|
3,193
|
|
|
Nevada
(1)
|
1,920
|
|
|
Texas
|
1,753
|
|
|
Washington
|
1,384
|
|
|
Total controlled lots
|
27,613
|
|
|
(1) Nevada excludes 10,686 owned lots and 56,413 lots under option for the Coyote Springs Property which is excluded from the transaction agreement with TRI Pointe Homes, Inc. and was impaired in 2013 due to a change in our strategy for development.
|
||
Our lots are controlled through both ownership and the use of options and are in various stages of development. Of the total lots we have under control, approximately 17 percent of them are intended for sale to other builders.
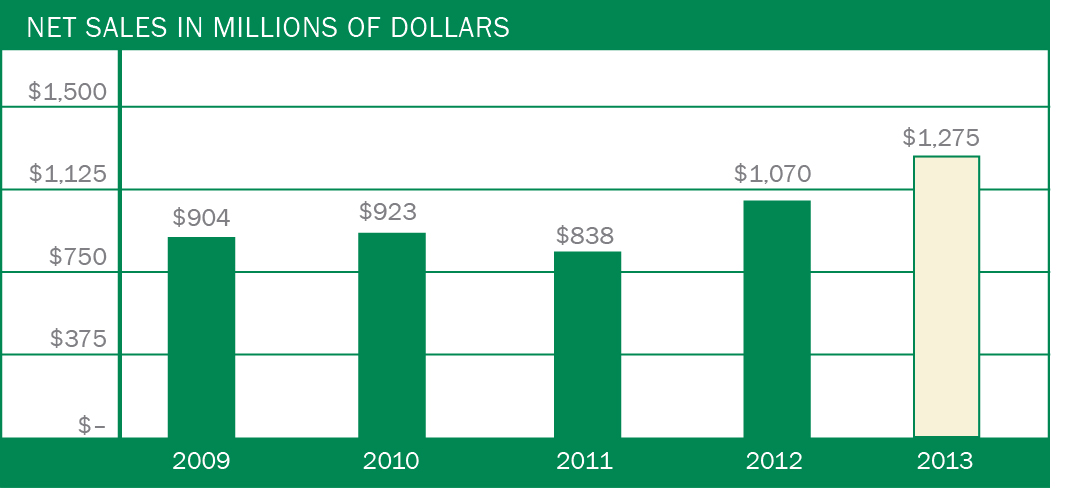
HOW MUCH WE SELL
We are one of the top 20 homebuilding companies in the United States as measured by annual single-family home closings.
Our revenues increased to
$1.3 billion
in
2013
, up 19 percent, compared with
$1.1 billion
in
2012
. Revenues from single-family housing increased
$349 million
, or 40 percent, as a result of a 27 percent increase in home closings. Revenues from land and lot sales decreased
$141 million
. 2012 included the sale of a 3,200-acre master planned community in Houston, Texas and the sale of commercial acreage and multi-family lots in southern California.
The following factors affect revenues in our Real Estate business segment:
|
•
|
The market prices of the homes that we build varies.
|
|
•
|
The product and geographic mix of sales varies based on the following:
|
– The markets where we build vary by geography.
– We build homes that range in price points to meet our target customers’ needs, from first-time to semi-custom homes based on geography.
– The mix of price points, which differ for traditional, single-family detached homes and attached products such as townhomes and condominiums.
|
•
|
Land and lot sales are a component of our activities. These sales do not occur evenly from year to year and may range from approximately 5 percent to 20 percent of total Real Estate revenues annually.
|
|
•
|
From time to time, we sell apartment buildings and other income producing properties.
|
Five-Year Summary of Net Sales for Real Estate
|
REVENUE IN MILLIONS OF DOLLARS
|
|||||||||||||||
|
|
2013
|
|
2012
|
|
2011
|
|
2010
|
|
2009
|
|
|||||
|
Single-family housing
|
$
|
1,219
|
|
$
|
870
|
|
$
|
768
|
|
$
|
842
|
|
$
|
832
|
|
|
Land
|
52
|
|
193
|
|
67
|
|
64
|
|
68
|
|
|||||
|
Other
|
4
|
|
7
|
|
3
|
|
17
|
|
4
|
|
|||||
|
Total
|
$
|
1,275
|
|
$
|
1,070
|
|
$
|
838
|
|
$
|
923
|
|
$
|
904
|
|
Five-Year Trend for Total Net Sales in Real Estate
WEYERHAEUSER COMPANY >
2013 ANNUAL REPORT AND FORM 10-K
16
Percentage Breakdown of
2013
Net Sales in Real Estate
Five-Year Summary of Single-Family Unit Statistics
|
SINGLE-FAMILY UNIT STATISTICS
|
|||||||||||||||
|
|
2013
|
|
2012
|
|
2011
|
|
2010
|
|
2009
|
|
|||||
|
Homes sold
|
3,048
|
|
2,659
|
|
1,902
|
|
1,914
|
|
2,269
|
|
|||||
|
Homes closed
|
2,939
|
|
2,314
|
|
1,912
|
|
2,125
|
|
2,177
|
|
|||||
|
Homes sold but not closed (backlog)
|
883
|
|
774
|
|
429
|
|
439
|
|
650
|
|
|||||
|
Cancellation rate
|
15.4
|
%
|
14.9
|
%
|
15.7
|
%
|
19.9
|
%
|
23.3
|
%
|
|||||
|
Buyer traffic
|
68,466
|
|
64,410
|
|
50,125
|
|
68,430
|
|
65,781
|
|
|||||
|
Average price of homes closed
|
$
|
415,000
|
|
$
|
376,000
|
|
$
|
402,000
|
|
$
|
396,000
|
|
$
|
382,000
|
|
|
Single-family gross margin (%)
(1)
|
22.0
|
%
|
20.3
|
%
|
22.0
|
%
|
22.3
|
%
|
(9.9
|
)%
|
|||||
|
Single-family gross margin - excluding impairments (%)
(2)
|
22.2
|
%
|
20.7
|
%
|
23.3
|
%
|
23.7
|
%
|
17.5
|
%
|
|||||
|
(1) Single-family gross margin equals revenue less cost of sales and period costs.
(2) Single-family gross margin - excluding impairments equals revenue less cost of sales and period costs (other than impairments, deposit write-offs and project abandonments).
|
|||||||||||||||
WHERE WE
’
RE HEADED
Our competitive strategies include:
|
•
|
offering customer-driven, distinct value propositions to specific market niches in each of our targeted geographies;
|
|
•
|
delivering quality homes to satisfied customers
-
measured, in part, by
“
willingness to refer
”
rates from independent surveys of homebuyers;
|
|
•
|
replicating best practices developed in each geographic area; and
|
|
•
|
optimizing value from our land portfolio, through both internal absorption of lots for homebuilding and sales to third parties.
|
WEYERHAEUSER COMPANY >
2013 ANNUAL REPORT AND FORM 10-K
17
|
EXECUTIVE OFFICERS OF THE REGISTRANT
|
 Patricia M. Bedient
, 60, has been executive vice president and chief financial officer since 2007. She was senior vice president, Finance and Strategic Planning, from February 2006 to 2007. She served as vice president, Strategic Planning, from 2003, when she joined the company, to 2006. Prior to joining the company, she was a partner with Arthur Andersen LLP (Independent Accountant) from 1987 to 2002 and served as the managing partner for the Seattle office and as the partner in charge of the firm
’
s forest products practice from 1999 to 2002. She is on the Board of Directors for Alaska Air Group and also serves as a Board member of Oregon State University and Overlake Hospital Medical Center. She is a CPA and member of the American Institute of CPAs.
Patricia M. Bedient
, 60, has been executive vice president and chief financial officer since 2007. She was senior vice president, Finance and Strategic Planning, from February 2006 to 2007. She served as vice president, Strategic Planning, from 2003, when she joined the company, to 2006. Prior to joining the company, she was a partner with Arthur Andersen LLP (Independent Accountant) from 1987 to 2002 and served as the managing partner for the Seattle office and as the partner in charge of the firm
’
s forest products practice from 1999 to 2002. She is on the Board of Directors for Alaska Air Group and also serves as a Board member of Oregon State University and Overlake Hospital Medical Center. She is a CPA and member of the American Institute of CPAs.
 Adrian M. Blocker
, 57, has been senior vice president, Lumber, since August 21, 2013. He joined Weyerhaeuser in May 2013 as vice president, Lumber. Prior to that role, he served as CEO of the Wood Products Council and Chairman. Throughout his career in the industry, he held numerous leadership positions at West Fraser, International Paper and Champion International focused on forest management, fiber procurement, consumer packaging, strategic planning, business development and manufacturing.
Adrian M. Blocker
, 57, has been senior vice president, Lumber, since August 21, 2013. He joined Weyerhaeuser in May 2013 as vice president, Lumber. Prior to that role, he served as CEO of the Wood Products Council and Chairman. Throughout his career in the industry, he held numerous leadership positions at West Fraser, International Paper and Champion International focused on forest management, fiber procurement, consumer packaging, strategic planning, business development and manufacturing.
 Srinivasan Chandrasekaran
, 64, has been senior vice president, Cellulose Fibers, since 2006. He was vice president, Manufacturing, Cellulose Fibers, from 2005 to 2006; vice president and mill manager at the Kamloops, British Columbia, cellulose fiber mill from 2003 to 2005; and vice president and mill manager at the Kingsport, Tennessee, paper mill from 2002 to 2003. He joined Weyerhaeuser in 2002 with the company’s acquisition of Willamette Industries Inc., where he served in a number of leadership positions.
Srinivasan Chandrasekaran
, 64, has been senior vice president, Cellulose Fibers, since 2006. He was vice president, Manufacturing, Cellulose Fibers, from 2005 to 2006; vice president and mill manager at the Kamloops, British Columbia, cellulose fiber mill from 2003 to 2005; and vice president and mill manager at the Kingsport, Tennessee, paper mill from 2002 to 2003. He joined Weyerhaeuser in 2002 with the company’s acquisition of Willamette Industries Inc., where he served in a number of leadership positions.
 John A. Hooper
, 59, has been senior vice president, Human Resources, since July 2008. He was vice president, Human Resources Operations, from 2006 to 2008; Human Resources director from 2003 to 2006; and strategic projects consultant from 2001, when he joined the company, until 2003. Prior to joining the company, he was a management consultant specializing in leadership effectiveness, human resources strategy and change management from 1986 to 2001. From 1979 to 1986, he held leadership positions in Eaton Corp. and Tektronix.
John A. Hooper
, 59, has been senior vice president, Human Resources, since July 2008. He was vice president, Human Resources Operations, from 2006 to 2008; Human Resources director from 2003 to 2006; and strategic projects consultant from 2001, when he joined the company, until 2003. Prior to joining the company, he was a management consultant specializing in leadership effectiveness, human resources strategy and change management from 1986 to 2001. From 1979 to 1986, he held leadership positions in Eaton Corp. and Tektronix.
 Rhonda Hunter
, 51, has been senior vice president Timberlands, since January 1, 2014. Prior to her current position, she was vice president, Southern Timberlands, from 2010 to 2014. She held a number of leadership positions in the Southern
Rhonda Hunter
, 51, has been senior vice president Timberlands, since January 1, 2014. Prior to her current position, she was vice president, Southern Timberlands, from 2010 to 2014. She held a number of leadership positions in the Southern
WEYERHAEUSER COMPANY >
2013 ANNUAL REPORT AND FORM 10-K
18
Timberlands organization with experience in inventory and planning, regional timberlands management, environmental and work systems, finance, and land acquisition. She joined Weyerhaeuser in 1987 as an accountant.
 Sandy D. McDade
, 62, has been senior vice president and general counsel since September 2006. He was senior vice president, Industrial Wood Products and International, from 2005 to 2006; senior vice president, Canada, from 2003 to 2005; vice president, Strategic Planning, from 2000 to 2003; and corporate secretary from 1993 to 2000. He joined Weyerhaeuser in 1980 and worked as a corporate and transaction lawyer until 2000.
Sandy D. McDade
, 62, has been senior vice president and general counsel since September 2006. He was senior vice president, Industrial Wood Products and International, from 2005 to 2006; senior vice president, Canada, from 2003 to 2005; vice president, Strategic Planning, from 2000 to 2003; and corporate secretary from 1993 to 2000. He joined Weyerhaeuser in 1980 and worked as a corporate and transaction lawyer until 2000.
 Peter M. Orser
, 57, has been president, Weyerhaeuser Real Estate Company, a subsidiary of the company, since October
1, 2010. Prior to becoming president, Weyerhaeuser Real Estate Company, Mr.
Orser was president, Quadrant Corporation, a subsidiary of the company, from 2003 to 2010. He was executive vice president, Quadrant Corporation, from 2001 to 2003; residential senior vice president, Quadrant Corporation, from 1996 to 2001; vice president, Community Development, from 1992 to 1995; and held various leadership positions with Quadrant Corporation from 1987, when he joined the company, to 1992.
Peter M. Orser
, 57, has been president, Weyerhaeuser Real Estate Company, a subsidiary of the company, since October
1, 2010. Prior to becoming president, Weyerhaeuser Real Estate Company, Mr.
Orser was president, Quadrant Corporation, a subsidiary of the company, from 2003 to 2010. He was executive vice president, Quadrant Corporation, from 2001 to 2003; residential senior vice president, Quadrant Corporation, from 1996 to 2001; vice president, Community Development, from 1992 to 1995; and held various leadership positions with Quadrant Corporation from 1987, when he joined the company, to 1992.
 Doyle R. Simons
, 50, was elected president and chief executive officer effective August 1. 2013. He served as director of the Company since 2012, was appointed as chief executive officer elect and an executive officer of the Company effective June 17, 2013. He served as chairman and chief executive officer of Temple-Inland, Inc. from 2008 until February 2012 when it was acquired by International Paper Company. Previously, he held various management positions with Temple-Inland, including executive vice president from 2005 through 2007 and chief administrative officer from 2003 to 2005. Prior to joining the company in 1992, he practiced real estate and banking law with Hutcheson and Grundy, L.L.P. He also serves on the Board of Fiserv, Inc. He has extensive experience in managing forest products companies and capital intensive industries, with strong skills in corporate finance, executive compensation, and strategic planning.
Doyle R. Simons
, 50, was elected president and chief executive officer effective August 1. 2013. He served as director of the Company since 2012, was appointed as chief executive officer elect and an executive officer of the Company effective June 17, 2013. He served as chairman and chief executive officer of Temple-Inland, Inc. from 2008 until February 2012 when it was acquired by International Paper Company. Previously, he held various management positions with Temple-Inland, including executive vice president from 2005 through 2007 and chief administrative officer from 2003 to 2005. Prior to joining the company in 1992, he practiced real estate and banking law with Hutcheson and Grundy, L.L.P. He also serves on the Board of Fiserv, Inc. He has extensive experience in managing forest products companies and capital intensive industries, with strong skills in corporate finance, executive compensation, and strategic planning.
 Catherine I. Slater
, 50, has been senior vice president, Oriented Strand Board, Engineered Lumber Products and Distribution, since August 21, 2013. She was vice president, Oriented Strand Board (OSB) from 2011 to 2013. Prior to that role, she held a number of other leadership roles in the company’s Wood Products segment, including vice president for both engineered wood products manufacturing and veneer technologies. Before joining the Wood Products team, she held numerous positions in the company’s Cellulose Fibers business, including leadership roles at the Flint River and Port Wentworth, Ga., pulp mills, and leadership oversight for the company’s operations in Alberta, which included the pulp, timberlands, OSB, lumber, and engineered lumber. Prior to joining Weyerhaeuser in 1992, she held several leadership roles at Procter and Gamble.
Catherine I. Slater
, 50, has been senior vice president, Oriented Strand Board, Engineered Lumber Products and Distribution, since August 21, 2013. She was vice president, Oriented Strand Board (OSB) from 2011 to 2013. Prior to that role, she held a number of other leadership roles in the company’s Wood Products segment, including vice president for both engineered wood products manufacturing and veneer technologies. Before joining the Wood Products team, she held numerous positions in the company’s Cellulose Fibers business, including leadership roles at the Flint River and Port Wentworth, Ga., pulp mills, and leadership oversight for the company’s operations in Alberta, which included the pulp, timberlands, OSB, lumber, and engineered lumber. Prior to joining Weyerhaeuser in 1992, she held several leadership roles at Procter and Gamble.
WEYERHAEUSER COMPANY >
2013 ANNUAL REPORT AND FORM 10-K
19
|
NATURAL RESOURCE AND ENVIRONMENTAL MATTERS
|
We are subject to a multitude of laws and regulations in the operations of our businesses. We also participate in voluntary certification of our timberlands to assure that we sustain their values including the protection of wildlife and water quality. Changes in law and regulation, or certification processes, can significantly affect our business.
REGULATIONS AFFECTING FORESTRY PRACTICES
In the United States, regulations established by federal, state and local governments or agencies to protect water quality and wetlands could affect future harvests and forest management practices on some of our timberlands. Forest practice laws and regulations that affect present or future harvest and forest management activities in certain states include:
|
•
|
limits on the size of clearcuts,
|
|
•
|
requirements that some timber be left unharvested to protect water quality and fish and wildlife habitat,
|
|
•
|
regulations regarding construction and maintenance of forest roads,
|
|
•
|
rules requiring reforestation following timber harvest, and
|
|
•
|
various related permit programs.
|
Each state in which we own timberlands has developed best management practices to reduce the effects of forest practices on water quality and aquatic habitats. Additional and more stringent regulations may be adopted by various state and local governments to achieve water-quality standards under the federal Clean Water Act, protect fish and wildlife habitats, or achieve other public policy objectives.
In Canada, our forest operations are carried out on public forestlands under forest licenses with the provinces. All forest operations are subject to:
|
•
|
forest practices and environmental regulations
,
and
|
|
•
|
license requirements established by contract between us and the relevant province designed to:
|
-
protect environmental values
,
and
-
encourage other stewardship values.
On May 18, 2010, 21 member companies of the Forest Products Association of Canada (FPAC), including Weyerhaeuser
’
s Canadian subsidiary, announced the signing of a Canadian Boreal Forest Agreement (CBFA) with nine environmental organizations. The CBFA applies to approximately 72 million hectares of public forests licensed to FPAC members and, when fully implemented, is expected to lead to the conservation of significant areas of Canada
’
s boreal forest and protection of boreal species at risk, in particular woodland caribou. CBFA signatories continue to work on management plans with provincial governments, and seek the participation of aboriginal and local communities in advancing the goals of the CBFA. Progress under the CBFA is measured and reported on by an independent auditor.
ENDANGERED SPECIES PROTECTIONS
In the United States, a number of fish and wildlife species that inhabit geographic areas near or within our timberlands have been listed as threatened or endangered under the federal Endangered Species Act (ESA) or similar state laws, including:
|
•
|
the northern spotted owl, the marbled murrelet, a number of salmon species, bull trout and steelhead trout in the Pacific Northwest,
|
|
•
|
several freshwater mussel and sturgeon species, and
|
|
•
|
the red-cockaded woodpecker, gopher tortoise, gopher frog and American burying beetle in the South or Southeast.
|
Additional species or populations may be listed as threatened or endangered as a result of pending or future citizen petitions or petitions initiated by federal or state agencies. In addition, significant citizen litigation seeks to compel the federal agencies to designate "critical habitat" for ESA-listed species, and many cases have resulted in settlements under which designations will be implemented over time. Such designations may adversely affect some management activities and options. Restrictions on timber harvests can result from:
|
•
|
federal and state requirements to protect habitat for threatened and endangered species,
|
|
•
|
regulatory actions by federal or state agencies to protect these species and their habitat, and
|
|
•
|
citizen suits under the ESA.
|
Such actions could increase our operating costs and affect timber supply and prices in general. To date, we do not believe that these measures have had, and we do not believe that in
2014
they will have, a significant effect on our harvesting operations. We anticipate that likely future actions will not disproportionally affect Weyerhaeuser as compared with comparable operations of U.S. competitors.
In Canada:
|
•
|
The federal Species at Risk Act (SARA) requires protective measures for species identified as being at risk and for critical habitat
,
|
|
•
|
Environment Canada announced a series of western science studies in 2010 that, with other landscape information, are designed to
|
identify critical habitat
,
and
|
•
|
The Canadian Minister of the Environment released for comment in 2011 a strategy for the recovery of the boreal population of woodland caribou under the SARA. The next step in boreal caribou recovery is the development of range plans and action plans by the provinces and territories, working with Environment Canada, aboriginal communities and stakeholders.
|
The identification and protection of habitat and the implementation of range plans and land use action plans may, over time, result in additional restrictions on timber harvests and other forest management practices that could increase operating costs for operators of forestlands in Canada. To date, we do not believe that these Canadian measures have had, and we do not believe that in
2014
they will have, a significant effect on our harvesting operations. We anticipate that likely future measures will not disproportionally affect Weyerhaeuser as compared with similar operations of Canadian competitors.
WEYERHAEUSER COMPANY >
2013 ANNUAL REPORT AND FORM 10-K
20
FOREST CERTIFICATION STANDARDS
We operate in North America under the Sustainable Forestry Initiative
(SFI
®
). This is a certification standard designed to supplement government regulatory programs with voluntary landowner initiatives to further protect certain public resources and values. SFI
®
is an independent standard, overseen by a governing board consisting of:
|
•
|
conservation organizations,
|
|
•
|
academia,
|
|
•
|
the forest industry
,
and
|
|
•
|
large and small forest landowners.
|
Ongoing compliance with SFI
®
may result in some increases in our operating costs and curtailment of our timber harvests in some areas. There also is competition from other private certification systems, primarily the Forest Stewardship Council (FSC), coupled with efforts by supporters to further those systems by persuading customers of forest products to require products certified to their preferred system. Certain features of the FSC system could impose additional operating costs on timberland management. Because of the considerable variation in FSC standards, and variability in how those standards are interpreted and applied, if sufficient marketplace demand develops for products made from raw materials sourced from other than SFI-certified forests, we could incur substantial additional costs for operations and be required to reduce harvest levels.
WHAT THESE REGULATIONS AND CERTIFICATION PROGRAMS MEAN TO US
The regulatory and nonregulatory forest management programs described above have:
|
•
|
increased our operating costs,
|
|
•
|
resulted in changes in the value of timber and logs from our timberlands,
|
|
•
|
contributed to increases in the prices paid for wood products and wood chips during periods of high demand,
|
|
•
|
sometimes made it more difficult for us to respond to rapid changes in markets, extreme weather or other unexpected circumstances, and
|
|
•
|
potentially encouraged further reductions in the use of, or substitution of other products for, lumber, oriented strand board, and plywood.
|
We believe that these kinds of programs have not had, and in
2014
will not have, a significant effect on the total harvest of timber in the United States or Canada. However, these kinds of programs may have such an effect in the future. We expect we will not be disproportionately affected by these programs as compared with typical owners of comparable timberlands. We also expect that these programs will not significantly disrupt our planned operations over large areas or for extended periods.
CANADIAN ABORIGINAL RIGHTS
Many of the Canadian forestlands are subject to the constitutionally protected treaty or common-law rights of aboriginal peoples of Canada. Most of British Columbia (B.C.) is not covered by treaties, and as a result the claims of B.C.
’
s aboriginal peoples relating to forest resources are
largely unresolved, although many aboriginal groups are engaged in treaty discussions with the governments of B.C. and Canada.
Final or interim resolution of claims brought by aboriginal groups is expected to result in:
|
•
|
additional restrictions on the sale or harvest of timber,
|
|
•
|
potential increase in operating costs, and
|
|
•
|
impact to timber supply and prices in Canada.
|
We believe that such claims will not have a significant effect on our total harvest of timber or production of forest products in
2014
, although they may have such an effect in the future. In 2008, FPAC, of which we are a member, signed a Memorandum of Understanding with the Assembly of First Nations, under which the parties agree to work together to strengthen Canada
’
s forest sector through economic-development initiatives and business investments, strong environmental stewardship and the creation of skill-development opportunities particularly targeted to aboriginal youth.
POLLUTION-CONTROL REGULATIONS
Our operations are subject to various laws and regulations, including:
|
•
|
federal,
|
|
•
|
state,
|
|
•
|
provincial, and
|
|
•
|
local pollution controls.
|
These laws and regulations, as well as market demands, impose controls with regard to:
|
•
|
air, water and land,
|
|
•
|
solid and hazardous waste management,
|
|
•
|
disposal and remediation, and
|
|
•
|
the chemical content of some of our products.
|
Compliance with these laws, regulations and demands usually involves capital expenditures as well as additional operating costs. We cannot easily quantify the future amounts of capital expenditures we might have to make to comply with these laws, regulations and demands or the effects on our operating costs because in some instances compliance standards have not been developed or have not become final or definitive. In addition, it is difficult to isolate the environmental component of most manufacturing capital projects.
Our capital projects typically are designed to:
|
•
|
enhance safety,
|
|
•
|
extend the life of a facility,
|
|
•
|
increase capacity,
|
|
•
|
increase efficiency,
|
|
•
|
change raw material requirements,
|
|
•
|
increase the economic value of assets or products, and
|
|
•
|
comply with regulatory standards.
|
WEYERHAEUSER COMPANY >
2013 ANNUAL REPORT AND FORM 10-K
21
We had no material capital expenditures relating primarily to environmental compliance in
2013
. Based on our understanding of current regulatory requirements in the U.S. and Canada, we expect approximately $10 million of capital expenditures relating primarily to environmental compliance in
2014
.
ENVIRONMENTAL CLEANUP
We are involved in the environmental investigation or remediation of numerous sites. Of these sites:
|
•
|
we may have the sole obligation to remediate,
|
|
•
|
we may share that obligation with one or more parties,
|
|
•
|
several parties may have joint and several obligations to remediate, or
|
|
•
|
we may have been named as a potentially responsible party for sites designated as U
.
S
.
Superfund sites.
|
Our liability with respect to these various sites ranges from insignificant to substantial. The amount of liability depends on:
|
•
|
the quantity, toxicity and nature of materials at the site, and
|
|
•
|
the number and economic viability of the other responsible parties.
|
We spent approximately
$6 million
in
2013
and expect to spend approximately $6 million in
2014
on environmental remediation of these sites.
It is our policy to accrue for environmental-remediation costs when we:
|
•
|
determine it is probable that such an obligation exists, and
|
|
•
|
can reasonably estimate the amount of the obligation.
|
We currently believe it is reasonably possible that our costs to remediate all the identified sites may exceed our current accruals of
$30 million
. The excess amounts required may be insignificant or could range, in the aggregate, up to
$101 million
over several years. This estimate of the upper end of the range of reasonably possible additional costs is much less certain than the estimates we currently are using to determine how much to accrue. The estimate of the upper range also uses assumptions less favorable to us among the range of reasonably possible outcomes.
REGULATION OF AIR EMISSIONS IN THE U.S.
The United States Environmental Protection Agency (EPA) had promulgated regulations for air emissions from:
|
•
|
pulp and paper manufacturing facilities,
|
|
•
|
wood products facilities and
|
|
•
|
industrial boilers.
|
These regulations cover:
|
•
|
hazardous air pollutants that require use of maximum achievable control technology (MACT); and
|
|
•
|
controls for pollutants that contribute to smog, haze and more recently, greenhouse gases.
|
In 2011 and 2013, EPA issued new MACT standards for industrial boilers and process heaters and in 2012 completed a technology and residual risk review for the MACT standards applicable to pulping and bleaching operations at pulp and paper manufacturing facilities. As a result of these recent final actions by the EPA, we expect we might spend as much as $25 million to $45 million over the next several years to comply with the MACT standards.
The EPA must still promulgate:
|
•
|
technology and residual risk review standards for additional operations at pulp and paper manufacturing facilities and
|
|
•
|
supplemental MACT standards for plywood, lumber and composite wood products facilities.
|
We cannot currently quantify the amount of capital we will need in the future to comply with new regulations being developed by the EPA because final rules have not been promulgated.
In 2007, the U.S. Supreme Court ruled that greenhouse gases are pollutants that can be subject to regulation under the Clean Air Act. As a result, the EPA:
|
•
|
promulgated regulations in 2009 for reporting greenhouse gas emissions that are applicable to our manufacturing operations;
|
|
•
|
issued a final rule in 2010 that applies to our manufacturing operations on a project-by-project basis that would limit the growth in greenhouse gas emissions from new projects meeting certain emission thresholds; and
|
|
•
|
initiated in 2011 efforts to further develop independent scientific analysis and rulemaking on how biomass emissions should be treated.
|
The EPA also issued a final rule deferring until mid-2014 greenhouse gas permitting requirements for carbon dioxide emissions from biomass. The U.S. Court of Appeals for the District of Columbia Circuit vacated this rule in August 2013. However, the court has withheld putting its decision into effect pending a decision in a U.S. Supreme Court review of the 2010 greenhouse gas emissions rule referenced above. The impacts of this decision are uncertain while the other litigation is unresolved and until EPA issues the final rules regarding how biomass emissions will be regulated
.
It is unclear what the effect of EPA
’
s greenhouse gas regulations will be on our operations until final rules regarding biomass emissions are promulgated.
To address concerns about greenhouse gases as a pollutant, we:
|
•
|
closely monitor legislative, regulatory and scientific developments pertaining to climate change;
|
|
•
|
adopted in 2006, as part of the Company's sustainability program, a goal of reducing greenhouse gas emissions by 40 percent by 2020 compared with our emissions in 2000, assuming a comparable portfolio and regulations;
|
|
•
|
determined to achieve this goal by increasing energy efficiency and using more greenhouse gas-neutral, biomass fuels instead of fossil fuels;
|
|
•
|
issued a final rule revision for portions of the GHG mandatory reporting rule in November 2013 that will apply to the 2013 data year reporting due in March 2014; and
|
|
•
|
reduced greenhouse gas emissions by approximately 28 percent considering changes in the asset portfolio according to 2012 data, compared to our 2000 baseline.
|
WEYERHAEUSER COMPANY >
2013 ANNUAL REPORT AND FORM 10-K
22
Additional factors that could affect greenhouse gas emissions in the future include:
|
•
|
policy proposals by state governments regarding regulation of greenhouse gas emissions,
|
|
•
|
Congressional legislation regulating greenhouse gas emissions within the next several years and
|
|
•
|
establishment of a multistate or federal greenhouse gas emissions reduction trading systems with potentially significant implications for all U.S. businesses.
|
It is not yet known when and to what extent these policy activities may come into force or how they may relate to each other in the future.
We believe these measures have not had, and in
2014
will not have, a significant effect on our operations, although they may have such an effect in the future. We expect we will not be disproportionately affected by these measures as compared with typical owners of comparable operations. We maintain an active forestry research program to track and understand any potential effect from actual climate change related parameters that could affect the forests we own and manage and do not anticipate any disruptions to our planned operations.
REGULATION OF AIR EMISSIONS IN CANADA
The Canadian federal government has proposed an air quality management system (AQMS) as a comprehensive approach for improving air quality in Canada. On October 11, 2012, most Canadian provincial and territorial jurisdictions agreed to begin implementing the AQMS. The federal proposed AQMS includes:
|
•
|
ambient air quality standards for outdoor air quality management across the country,
|
|
•
|
a framework for air zone air management within provinces and territories that targets specific sources of air emissions,
|
|
•
|
regional airsheds that facilitate coordinated action across borders,
|
|
•
|
industrial sector based emission requirements that set a base level of performance for major industries in Canada, and
|
|
•
|
improved intergovernmental collaboration to reduce emissions from the transportation sector.
|
Environment Canada is developing a
“
Greenhouse Gas Emission Framework
”
that is expected to be proposed in 2015 with implementation in 2020. The framework will put in place a national, sector-based greenhouse gas reduction program applicable to a number of industries, including pulp and paper manufacturing.
All Canadian provincial governments:
|
•
|
have greenhouse gas reporting requirements
,
|
|
•
|
are working on reduction strategies
,
and
|
|
•
|
together with the Canadian federal government, are considering new or revised emission standards.
|
In addition, British Columbia has adopted a carbon tax and Alberta has a mandatory GHG emission reduction regulation. Our Grande Prairie cellulose fiber mill generates and sells carbon credits.
We believe these measures have not had, and in
2014
will not have, a significant effect on our operations, although they may have such an effect in the future. We expect we will not be disproportionately affected by these measures as compared with typical owners of comparable operations. We also expect that these measures will not significantly disrupt our planned operations.
REGULATION OF AIR EMISSIONS IN URUGUAY AND POLAND
The European Union
’
s
“
Clean Air Programme
”
includes new air quality objectives that Poland and other E.U. countries will implement over the coming years, up through 2030. Some provinces in Uruguay have established air quality monitoring networks and ambient air objectives have been proposed for the region where our Los Piques mill is located.
We believe these measures have not had, and in 2014 will not have, a significant effect on our operations, although they may have such an effect in the future. We expect we will not be disproportionately affected by these measures as compared with typical owners of comparable operations. We also expect that these measures will not significantly disrupt our planned operations
.
REGULATION OF WATER
In the U.S., as a result of litigation under the federal Clean Water Act
,
additional federal or state permits are now required in some states for the application of pesticides, including herbicides, on forest lands. Those permits have entailed additional costs. In addition, there is continuing litigation in the federal courts that may result in permit requirements for pollution discharges from forest roads and other drainage features on forest land, which would entail additional costs for forest landowners including Weyerhaeuser. Finally, the federal regulatory agencies are considering expanding the definition of waters subject to federal Clean Water Act jurisdiction, which could increase the scope and number of permits required for forestry-related activities and entail additional costs for Weyerhaeuser and other forest landowners in the U.S.
In 2014, the EPA is expected to issue final regulations on water intakes for the protection of aquatic resources. It is unclear what the effect, if any, of EPA
’
s water intake regulations will be on our U.S. pulp operations until final rules are promulgated.
In 2014, the Washington state Department of Ecology (WA DOE) is expected to propose rules to update the Human Health Water Quality Criteria for the protection of human health. It is unclear what the effect, if any, of the WA DOE regulations will have on our manufacturing operations in Washington state. On November 25, 2013, amendments to the Canadian federal Fisheries Act came into force. The amendments change the focus from habitat protection to fisheries protection and increase penalties. Uruguay’s national policy for water includes river basin planning, management and water use permits. Wastewater discharge authorization is required for industry. In response to an E.U. Water Framework Directive, Poland is to develop, by end of 2015, a water management plan for every river basin, to reduce total nitrogen and phosphorous loads in Municipal waste water by 75 percent.
WEYERHAEUSER COMPANY >
2013 ANNUAL REPORT AND FORM 10-K
23
POTENTIAL CHANGES IN POLLUTION REGULATION
State governments continue to promulgate total maximum daily load (TMDL) requirements for pollutants in water bodies that do not meet state or EPA water quality standards. State TMDL requirements may:
|
•
|
set limits on pollutants that may be discharged to a body of water; or
|
|
•
|
set additional requirements, such as best management practices for nonpoint sources, including timberland operations, to reduce the amounts of pollutants.
|
It is not possible to estimate the capital expenditures that may be required for us to meet pollution allocations across the various proposed state TMDL programs until a specific TMDL is promulgated.
In Canada, various levels of government have been working to address water issues including use, quality and management. Recent areas of focus include water allocation, regional watershed protection, protection of drinking water, water pricing and a national water quality index.
We established a goal in May 2008 to reduce water use at our cellulose fibers mills 20 percent by 2012, using a 2007 baseline. We achieved a 19 percent water use reduction in 2012 compared to our 2007 baseline.
WEYERHAEUSER COMPANY >
2013 ANNUAL REPORT AND FORM 10-K
24
|
FORWARD-LOOKING STATEMENTS
|
This report contains statements concerning our future results and performance that are forward-looking statements within the meaning of the Private Securities Litigation Reform Act of 1995. These statements:
|
•
|
are based on various assumptions we make, and
|
|
•
|
may not be accurate because of risks and uncertainties surrounding the assumptions we make.
|
Factors listed in this section, as well as other factors not included, may cause our actual results to differ from our forward-looking statements. There is no guarantee that any of the events anticipated by our forward-looking statements will occur. Or if any of the events occur, there is no guarantee what effect it will have on our operations or financial condition.
We will not update our forward-looking statements after the date of this report.
FORWARD-LOOKING TERMINOLOGY
Some forward-looking statements discuss our plans, strategies and intentions. They use words such as expects, may, will, believes, should, approximately, anticipates, estimates, projects, intends, and plans. In addition, these words may use the positive or negative or other variations of those terms.
STATEMENTS
We make forward-looking statements in this report, including with respect to estimated tax rates, future dividends, future pretax charges, expected results of litigation and the sufficiency of litigation reserves, anticipated effects of regulatory rulemaking, our expected capital expenditures for 2014, our expectations relating to pension contributions and benefit payments, additional optionality for future harvests as a result of the Longview Timber acquisition and recognition of certain tax benefits in the future. Such forward-looking statements also include statements regarding the proposed transaction with TRI Pointe relating to our homebuilding and real estate development business, the anticipated timing and benefits of such transaction, assets that may be excluded from such transaction, and tax implications relating to such transaction.
In addition, we base our forward-looking statements on the expected effect of:
|
•
|
the economy,
|
|
•
|
regulations,
|
|
•
|
adverse litigation outcomes and the adequacy of reserves,
|
|
•
|
changes in accounting principles,
|
|
•
|
contributions to pension plans,
|
|
•
|
projected benefit payments,
|
|
•
|
projected tax rates and credits, and
|
|
•
|
other related matters.
|
RISKS, UNCERTAINTIES AND ASSUMPTIONS
Major risks and uncertainties, and assumptions that we make, that affect our business and may cause actual results to differ from these forward-looking statements include, but are not limited to:
|
•
|
the effect of general economic conditions, including employment rates, housing starts, interest rate levels, availability of financing for home mortgages and strength of the U.S. dollar;
|
|
•
|
market demand for our products, which is related to the strength of the various U.S. business segments and U.S. and international economic conditions;
|
|
•
|
performance of our manufacturing operations, including maintenance requirements;
|
|
•
|
level of competition from domestic and foreign producers;
|
|
•
|
raw material availability and prices;
|
|
•
|
the effect of weather;
|
|
•
|
the risk of loss from fires, floods, windstorms, hurricanes, pest infestations and other natural disasters;
|
|
•
|
energy prices;
|
|
•
|
the successful execution of our internal plans and strategic initiatives;
|
|
•
|
transportation costs;
|
|
•
|
federal tax policies;
|
|
•
|
the effect of forestry, land use, environmental and other governmental regulations;
|
|
•
|
legal proceedings;
|
|
•
|
performance of pension fund investments and related derivatives;
|
|
•
|
the effect of timing of retirements and changes in the market price of our common stock on charges for share-based compensation;
|
|
•
|
changes in accounting principles;
|
|
•
|
our ability to successfully integrate operations of Longview Timber and realize expected benefits from the acquisition;
|
|
•
|
our and TRI Pointe's ability to complete the transaction relating to our homebuilding and real estate development business, as described above, on the anticipated terms and schedule, including the ability to obtain shareholder and regulatory approvals and the anticipated tax treatment of the transactions and related transactions; and
|
|
•
|
other factors described under Risk Factors.
|
EXPORTING ISSUES
We are a large exporter, affected by changes in:
|
•
|
economic activity in Europe and Asia, especially Japan and China;
|
|
•
|
currency exchange rates, particularly the relative value of the U.S. dollar to the euro and the Canadian dollar, and the relative value of the euro to the yen; and
|
|
•
|
restrictions on international trade or tariffs imposed on imports.
|
WEYERHAEUSER COMPANY >
2013 ANNUAL REPORT AND FORM 10-K
25
RISK FACTORS
We are subject to certain risks and events that, if one or more of them occur, could adversely affect our business, our financial condition, our results of operations and the trading price of our common stock.
You should consider the following risk factors, in addition to the other information presented in this report and the matters described in “
Forward-Looking Statements
,” as well as the other reports and registration statements we file from time to time with the SEC, in evaluating us, our business and an investment in our securities.
The risks below are not the only risks we face. Additional risks not currently known to us or that we currently deem immaterial also may adversely affect our business.
|
RISKS RELATED TO OUR INDUSTRIES AND BUSINESS
|
MACROECONOMIC CONDITIONS
The industries in which we operate are sensitive to macroeconomic conditions and consequently highly cyclical.
The overall levels of demand for the products we manufacture and distribute reflect fluctuations in levels of end-user demand which consequently impact our sales and profitability. End-user demand depends in part on general macroeconomic conditions in North America and worldwide as well as on local economic conditions. Current economic conditions in the United States reflect growth below historical trends, moderately improving consumer confidence and general business uncertainty, fueled by fiscal concerns within the U.S. as well as global economic issues such as slowing growth and rising inflation in emerging countries. The homebuilding industry (including our Real Estate business), has recently experienced increased demand for new homes resulting in falling inventories, which contributed to some improvement in selling prices for new and existing homes. This improvement is highly dependent on continued improvement in the overall economy, the relative health of which has been subject to the numerous shocks and obstacles, including those mentioned earlier. Our Wood Products segment is highly dependent on the strength of the homebuilding industry. The decline in home construction activity over the past several years, which occurred as a result of the credit bubble and recession, resulted in depressed prices of and demand for wood products and building materials. This was reflected in lower prices and demand for logs and reduced harvests in our Timberland segment. The length and magnitude of industry cycles have varied over time and by product, but generally reflect changes in macroeconomic conditions. Those conditions improved recently for some sectors such as homebuilding and wood products, while other sectors such as cellulose fibers have been adversely impacted by the slowdown in global economic growth, as this is a major driver of demand for products made from cellulose fibers.
COMMODITY PRODUCTS
Many of our products are commodities that are widely available from other producers.
Because commodity products have few distinguishing properties from producer to producer, competition for these products is based primarily on price, which is determined by supply relative to demand and competition from substitute products. Prices for our products are affected by many factors outside of our control, and we have no influence over the timing and extent of price changes, which often are volatile. Our profitability with respect to these products depends, in part, on managing our costs, particularly raw material and energy costs, which represent significant components of our operating costs and can fluctuate based upon factors beyond our control. Prices of and demand for many of our products have fluctuated significantly in recent quarters, while many of our raw material or energy costs have increased. As a result, both sales and profitability are subject to volatility due to market forces beyond our control.
INDUSTRY SUPPLY OF LOGS, WOOD PRODUCTS AND PULP
Excess supply of products may adversely affect prices and margins.
Oversupply of products also may result from producers introducing new capacity or increasing harvest levels in response to favorable short-term pricing trends. Industry supplies of pulp also are influenced by overseas production capacity, which has grown in recent years and is expected to continue to grow. While the weakness of the U.S. dollar in recent years has improved the company
’
s competitive position, the recent strengthening of the U.S. dollar and decreases in demand for consumer products in emerging markets may result in lower prices. Continuation of these factors could materially and adversely affect sales volumes and margins of our operations..
HOMEBUILDING MARKET AND ECONOMIC RISKS
High unemployment, low demand and low levels of consumer confidence can adversely affect our business and results of operations.
Many of our businesses are dependent upon the health of the U.S. housing market. Demand for homes is sensitive to changes in economic conditions such as the level of employment, consumer confidence, consumer income, the availability of financing and interest rate levels. The legacy of the housing bubble, its collapse and ensuing credit crisis has been one of tightened credit requirements and a reduced number of mortgage loans available for financing home purchases. Credit conditions have begun to ease, but remain significantly more restrictive than prior to the housing bubble. Demand for new homes also has been adversely affected by factors such as continued high unemployment and weak consumer confidence. Additionally, rising student loan debt among younger adults is limiting access to mortgage financing and home ownership. Foreclosure rates and distress sales of houses, while still at elevated levels, have fallen and are less of an impact compared to the years immediately following the housing collapse.
Homebuyers
’
ability to qualify for and obtain affordable mortgages could be affected by changes in government sponsored entities and private mortgage insurance companies supporting the mortgage market.
The federal government has historically had a significant role in supporting mortgage lending through its sponsorship of Fannie Mae and Freddie Mac. As a result of turbulence in the credit markets and mortgage finance industry in the last few years, the effect of the federal government
’
s conservatorship of these government sponsored entities on the short-term and long-term demand for new housing remains unclear.
The liquidity provided to the mortgage industry by Fannie Mae and Freddie Mac, both of which purchase home mortgages and mortgage-backed securities originated by mortgage lenders, is critical to the housing market. There have been significant concerns about the future purpose of Fannie Mae and Freddie Mac and a number of proposals to curtail their activities over time are under review. Any limitations or restrictions on the availability
WEYERHAEUSER COMPANY >
2013 ANNUAL REPORT AND FORM 10-K
26
of financing by these entities could adversely affect interest rates, mortgage financing, and increase the effective cost of our homes, which could reduce demand for our homes and adversely affect our results of operations.
Changes in mortgage interest expense and real estate tax regulations could harm our future sales and earnings.
Significant costs of homeownership include mortgage interest expense and real estate taxes, both of which are generally deductible for an individual
’
s federal and, in some cases, state income taxes. Any changes to income tax laws by the federal government or a state government to eliminate or substantially reduce these income tax deductions, as has been considered from time to time, would increase the after-tax cost of owning a home. Increases in real estate taxes by local governmental authorities also increase the cost of homeownership. Any such increases to the cost of homeownership could adversely affect the demand for and sales prices of new homes.
CAPITAL MARKETS
Deterioration in economic conditions and the credit markets could adversely affect our access to capital.
Upset financial or credit market conditions can impair the company
’
s ability to borrow money or otherwise access credit markets on terms acceptable to us, which may, among other impacts, reduce our ability to take advantage of growth and expansion opportunities. Similarly, our customers may be unable to borrow money to fund their operations. Similarly, deteriorating or volatile market conditions could have an adverse effect on our customers and suppliers and their ability to purchase our products or sell products to us.
CHANGES IN CREDIT RATINGS
Changes in credit ratings issued by nationally recognized rating organizations could adversely affect our cost of financing and have an adverse effect on the market price of our securities.
Credit rating agencies rate our debt securities on factors that include our operating results, actions that we take, their view of the general outlook for our industry and their view of the general outlook for the economy. Actions taken by the rating agencies can include maintaining, upgrading or downgrading the current rating or placing the company on a watch list for possible future downgrading. Downgrading the credit rating of our debt securities or placing us on a watch list for possible future downgrading could limit our access to the credit markets, increase our cost of financing, and have an adverse effect on the market price of our securities.
SUBSTITUTION
Some of our products are vulnerable to declines in demand due to competing technologies or materials.
Our products may compete with nonfiber-based alternatives or with alternative products in certain market segments. For example, plastic, wood/plastic or composite materials may be used by builders as alternatives to the products produced by our Wood Products businesses such as lumber, veneer, plywood and oriented strand board. Changes in prices for oil, chemicals and wood-based fiber can change the competitive position of our products relative to available alternatives and could increase substitution of those products for our products. As the use of these alternatives grows, demand for our products may further decline.
CHANGES IN PRODUCT MIX OR PRICING
Our results of operations and financial condition could be materially adversely affected by changes in product mix or pricing.
Our results may be adversely affected by a change in our product mix or pricing. If we are not successful in implementing previously announced or future price increases, or plans to move customers to higher-priced products, or if there are delays in acceptance of price increases or failure of customers to accept higher-priced products our results of operations and financial condition could be materially adversely affected. Moreover, price discounting, if required to maintain our competitive position, could result in lower than anticipated price realizations.
INTENSE COMPETITION
We face intense competition in our markets, and the failure to compete effectively could have a material adverse effect on our business, financial condition and results of operations.
We compete with North American and, for many of our product lines, global producers, some of which may have greater financial resources and lower production costs than we do. The principal basis for competition for many of our products is selling price. Our ability to maintain satisfactory margins depends in large part on our ability to control our costs. Our industries also are particularly sensitive to other factors including innovation, design, quality and service, with varying emphasis on these factors depending on the product line. To the extent that one or more of our competitors become more successful with respect to any key competitive factor, our ability to attract and retain customers could be materially adversely affected. If we are unable to compete effectively, such failure could have a material adverse effect on our business, financial condition and results of operations.
Another emerging form of competition is between brands of sustainably produced products; customer demand for certain brands could reduce competition among buyers for our products or cause other adverse effects.
In North America, our forests are third party-certified to the Sustainable Forestry Initiative (SFI
®
) standard. Some of our customers have expressed a preference in certain of our product lines for products made from raw materials sourced from forests certified to different standards, including standards of the Forest Stewardship Council (FSC). If and to the extent that this preference becomes a customer requirement, there may be reduced demand and lower prices for our products relative to competitors who can supply products sourced from forests certified to competing certification standards. If we seek to comply with such other standards, we could incur materially increased costs for our operations or be required to reduce harvest levels. FSC, in particular, employs standards that are geographically variable and could cause a material reduction in the harvest levels of some of our timberlands, most notably in the Pacific Northwest.
WEYERHAEUSER COMPANY >
2013 ANNUAL REPORT AND FORM 10-K
27
MATERIAL DISRUPTION OF MANUFACTURING
A material disruption at one of our manufacturing facilities could prevent us from meeting customer demand, reduce our sales or negatively affect our results of operation and financial condition.
Any of our manufacturing facilities, or any of our machines within an otherwise operational facility, could cease operations unexpectedly due to a number of events, including:
|
•
|
unscheduled maintenance outages,
|
|
•
|
prolonged power failures,
|
|
•
|
equipment failure,
|
|
•
|
a chemical spill or release,
|
|
•
|
explosion of a boiler,
|
|
•
|
the effect of a drought or reduced rainfall on its water supply,
|
|
•
|
labor difficulties,
|
|
•
|
disruptions in the transportation infrastructure, including roads, bridges, railroad tracks and tunnels,
|
|
•
|
fires, floods, windstorms, earthquakes, hurricanes or other catastrophes,
|
|
•
|
terrorism or threats of terrorism,
|
|
•
|
governmental regulations, and
|
|
•
|
other operational problems.
|
Any such downtime or facility damage could prevent us from meeting customer demand for our products or require us to make unplanned capital expenditures. If one of these machines or facilities were to incur significant downtime, our ability to meet our production targets and satisfy customer requirements could be impaired, resulting in lower sales and income.
STRATEGIC INITIATIVES
Our business and financial results may be adversely impacted if we are unable to successfully execute on important strategic initiatives.
There can be no assurance that we will be able to successfully implement important strategic initiatives in accordance with our expectations, which may result in an adverse impact on our business and financial results. These strategic initiatives are designed to improve our results of operations and drive long-term shareholder value, and include, among others: maximizing cash flow through operational excellence; reducing costs to achieve industry-leading cost structure; and innovating in higher-margin products
.
CAPITAL REQUIREMENTS
Our operations require substantial capital.
The company has substantial capital requirements for expansion and repair or replacement of existing facilities or equipment. Although we maintain our production equipment with regular scheduled maintenance, key pieces of equipment may need to be repaired or replaced periodically. The costs of repairing or replacing such equipment and the associated downtime of the affected production line could have a material adverse effect on our financial condition, results of operations and cash flows.
We believe our capital resources will be adequate to meet our current projected operating needs, capital expenditures and other cash requirements. If for any reason we are unable to provide for our operating needs, capital expenditures and other cash requirements on economic terms, we could experience a material adverse effect on our business, financial condition, results of operations and cash flows.
ENVIRONMENTAL LAWS AND REGULATIONS
We could incur substantial costs as a result of compliance with, violations of, or liabilities under applicable environmental laws and other laws and regulations.
We are subject to a wide range of general and industry-specific laws and regulations relating to the protection of the environment, including those governing:
|
•
|
air emissions,
|
|
•
|
wastewater discharges,
|
|
•
|
harvesting and other silvicultural activities,
|
|
•
|
forestry operations and endangered species habitat protection,
|
|
•
|
surface water management,
|
|
•
|
the storage, management and disposal of hazardous substances and wastes,
|
|
•
|
the cleanup of contaminated sites,
|
|
•
|
landfill operation and closure obligations,
|
|
•
|
building codes, and
|
|
•
|
health and safety matters.
|
For example, the U.S. Environmental Protection Agency (EPA) is in the process of implementing final rules regulating greenhouse gases that apply to our operations on a project-by-project basis and may be applied to carbon dioxide emissions from biomass. These and similar laws and regulations in the U.S. and Canada will require us to obtain authorizations from and comply with the authorization requirements of the appropriate governmental authorities, which have considerable discretion over the terms and timing of permits.
We have incurred, and we expect to continue to incur, significant capital, operating and other expenditures complying with applicable environmental laws and regulations and as a result of remedial obligations. We also could incur substantial costs, such as civil or criminal fines, sanctions and enforcement actions (including orders limiting our operations or requiring corrective measures, installation of pollution control equipment or other remedial actions), cleanup and closure costs, and third-party claims for property damage and personal injury as a result of violations of, or liabilities under, environmental laws and regulations.
As the owner and operator of real estate, including in our homebuilding business, we may be liable under environmental laws for cleanup, closure and other damages resulting from the presence and release of hazardous substances on or from our properties or operations. In
WEYERHAEUSER COMPANY >
2013 ANNUAL REPORT AND FORM 10-K
28
addition, surface water management regulations may present liabilities and are subject to change. The amount and timing of environmental expenditures is difficult to predict, and in some cases, our liability may exceed forecasted amounts or the value of the property itself. The discovery of additional contamination or the imposition of additional cleanup obligations at our sites or third-party sites may result in significant additional costs. Any material liability we incur could adversely affect our financial condition or preclude us from making capital expenditures that otherwise would benefit our business.
We also anticipate public policy developments at the state, federal and international level regarding climate change and energy access, security and competitiveness. We expect these developments to address emission of carbon dioxide, renewable energy and fuel standards, and the monetization of carbon. Compliance with regulations that implement new public policy in these areas might require significant expenditures. These developments may also include mandated changes to energy use and building codes which could affect our homebuilding practices. Enactment of new environmental laws or regulations or changes in existing laws or regulations, or the interpretation of these laws or regulations, might require significant expenditures. We also anticipate public policy developments at the state, federal and international level regarding taxes, health care and a number of other areas that could require significant expenditures.
CURRENCY EXCHANGE RATES
We will be affected by changes in currency exchange rates.
We have manufacturing operations in Canada, Poland, Uruguay and Brazil. We are also a large exporter and compete with producers of products very similar to ours. Therefore, we are affected by changes in the strength of the U.S. dollar relative to the Canadian dollar, euro and yen, and the strength of the euro relative to the yen.
AVAILABILITY OF RAW MATERIALS AND ENERGY
Our business and operations could be materially adversely affected by changes in the cost or availability of raw materials and energy.
We rely heavily on certain raw materials (principally wood fiber and chemicals) and energy sources (principally natural gas, electricity, coal and fuel oil) in our manufacturing processes. Our ability to increase earnings has been, and will continue to be, affected by changes in the costs and availability of such raw materials and energy sources. We may not be able to fully offset the effects of higher raw material or energy costs through hedging arrangements, price increases, productivity improvements or cost-reduction programs.
PEOPLE
Our business is dependent upon attracting, retaining and developing key personnel.
We believe that our success depends, to a significant extent, upon our ability to attract, retain and develop key senior management and operations management personnel. Our failure to recruit, retain, and develop these key personnel could adversely affect our financial condition or results of operations.
TRANSPORTATION
We depend on third parties for transportation services and increases in costs and the availability of transportation could materially adversely affect our business and operations.
Our business depends on the transportation of a large number of products, both domestically and internationally. We rely primarily on third parties for transportation of the products we manufacture or distribute as well as delivery of our raw materials. In particular, a significant portion of the goods we manufacture and raw materials we use are transported by railroad or trucks, which are highly regulated.
If any of our third-party transportation providers were to fail to deliver the goods we manufacture or distribute in a timely manner, we may be unable to sell those products at full value, or at all. Similarly, if any of these providers were to fail to deliver raw materials to us in a timely manner, we may be unable to manufacture our products in response to customer demand. In addition, if any of these third parties were to cease operations or cease doing business with us, we may be unable to replace them at reasonable cost.
Any failure of a third-party transportation provider to deliver raw materials or finished products in a timely manner could harm our reputation, negatively affect our customer relationships and have a material adverse effect on our financial condition and results of operation.
In addition, an increase in transportation rates or fuel surcharges could materially adversely affect our sales and profitability.
REIT STATUS AND TAX IMPLICATIONS
If we fail to remain qualified as a REIT, our taxable income would be subject to tax at corporate rates and we would not be able to deduct dividends to shareholders.
In any taxable year in which we fail to qualify as a REIT, unless we are entitled to relief under the Internal Revenue Code:
|
•
|
We would not be allowed to deduct dividends to shareholders in computing our taxable income.
|
|
•
|
We would be subject to federal and state income tax on our taxable income at regular corporate rates.
|
|
•
|
We also would be disqualified from treatment as a REIT for the four taxable years following the year during which we lost qualification.
|
Qualification as a REIT involves the application of highly technical and complex provisions of the Internal Revenue Code to our operations and the determination of various factual matters and circumstances not entirely within our control. There are only limited judicial or administrative interpretations of these provisions. Although we operate in a manner consistent with the REIT qualification rules, we cannot assure you that we are or will remain so qualified.
In addition, federal and state tax laws are constantly under review by persons involved in the legislative process, the Internal Revenue Service, the United States Department of the Treasury, and state taxing authorities. Changes to the tax law could adversely affect our shareholders. We cannot predict with certainty whether, when, in what forms, or with what effective dates, the tax laws applicable to us or our shareholders may be changed.
WEYERHAEUSER COMPANY >
2013 ANNUAL REPORT AND FORM 10-K
29
Certain of our business activities are subject to corporate-level income tax and potentially subject to prohibited transactions tax
.
Under the Internal Revenue Code, REITs generally must engage in the ownership and management of income producing real estate. For the Company, this generally includes owning and managing a timberland portfolio for the production and sale of standing timber. Accordingly, the manufacture and sale by us of wood products, the harvesting and sale of logs, and the development or sale of certain timberlands, the manufacture and sale of pulp products, the development of real estate, the building and sale of single-family houses and the development and sale of land and lots for real estate development are conducted through one or more of our wholly-owned taxable REIT subsidiaries (TRSs) because such activities could generate non-qualifying REIT income and could constitute
“
prohibited transactions.
”
Prohibited transactions are defined by the Internal Revenue Code generally to be sales or other dispositions of property to customers in the ordinary course of a trade or business. By conducting our business in this manner we believe that we satisfy the REIT requirements of the Internal Revenue Code and are not subject to the 100 percent tax that could be imposed if a REIT were to conduct a prohibited transaction. The net income of our TRSs is subject to corporate-level income tax.
The extent of our use of our TRS may affect the price of our common shares relative to the share price of other REITs.
We conduct a significant portion of our business activities through one or more TRSs. Our use of our TRSs enables us to engage in non-REIT qualifying business activities such as the sale of logs, production and sale of wood products and pulp products, real estate development and single-family home sales, and sale of HBU property. Our TRSs are subject to corporate-level tax. Therefore, we pay income taxes on the income generated by our TRSs. Under the Code, no more than 25 percent of the value of the gross assets of a REIT may be represented by securities of one or more TRS. This limitation may affect our ability to increase the size of our TRSs
’
operations. Furthermore, our use of TRSs may cause the market to value our common shares differently than the shares of other REITs, which may not use TRSs as extensively as we use them.
We may be limited in our ability to fund distributions using cash generated through our taxable REIT subsidiaries.
The ability of the REIT to receive dividends from our TRS is limited by the rules with which we must comply to maintain our status as a REIT. In particular, at least 75 percent of gross income for each taxable year as a REIT must be derived from passive real estate sources including sales of our standing timber and other types of qualifying real estate income and no more than 25 percent of our gross income may consist of dividends from our TRS and other non-real estate income.
This limitation on our ability to receive dividends from our TRSs may affect our ability to fund cash distributions to our shareholders using cash flows from our TRSs. The net income of our TRSs is not required to be distributed, and income that is not distributed will not be subject to the REIT income distribution requirement.
Our cash dividends are not guaranteed and may fluctuate.
Generally, REITs are required to distribute 90 percent of their ordinary taxable income and 95 percent of their net capital gains income. Capital gains may be retained by the REIT, but would be subject to income taxes. If capital gains are retained rather than distributed, our shareholders would be notified and they would be deemed to have received a taxable distribution, with a refundable credit for any federal income tax paid by the REIT. Accordingly, we believe that we are not required to distribute material amounts of cash since substantially all of our taxable income is treated as capital gains income. Our Board of Directors, in its sole discretion, determines the amount of quarterly dividends to be provided to our shareholders based on consideration of a number of factors. These factors include, but are not limited to, our results of operations, cash flow and capital requirements, economic conditions, tax considerations, borrowing capacity and other factors, including debt covenant restrictions that may impose limitations on cash payments, future acquisitions and divestitures, harvest levels, changes in the price and demand for our products and general market demand for timberlands including those timberland properties that have higher and better uses. Consequently, our dividend levels may fluctuate.
We may not be able to complete desired like-kind exchange transactions for timberlands and real estate we sell.
When we sell timberlands and real estate, we generally seek to match these sales with the acquisition of suitable replacement timberlands. This allows us
“
like-kind exchange
”
treatment for these transactions under section 1031 and related regulations of the Code. This matching of sales and purchases provides us with significant tax benefits, most importantly the deferral of any gain on the property sold until ultimate disposition of the replacement property. While we attempt to complete like-kind exchanges wherever practical, we may not be able to do so in all instances due to various factors, including the lack of availability of suitable replacement property on acceptable terms and our inability to complete a qualifying like-kind exchange transaction within the time frames required by the Code. The inability to obtain like-kind exchange treatment would result in the payment of taxes with respect to the property sold, and a corresponding reduction in earnings and cash available for distribution to shareholders as dividends.
LEGAL PROCEEDINGS
We are a party to a number of legal proceedings, and adverse judgments in certain legal proceedings could have a material adverse effect on our financial condition.
The costs and other effects of pending litigation against us and related insurance recoveries cannot be determined with certainty. Although the disclosure in
Note 17: Legal Proceedings, Commitments and Contingencies
of
Notes to Consolidated Financial Statements
contains management
’
s current views of the effect such litigation will have on our financial results, there can be no assurance that the outcome of such proceedings will be as expected.
It is possible that there could be adverse judgments against us in some or all major litigation against us and that we could be required to take a charge and make cash payments for all or a portion of any damage award. Any such charge or cash payment could materially and adversely affect our results of operations or cash flows for the quarter or year in which we record or pay it.
WEYERHAEUSER COMPANY >
2013 ANNUAL REPORT AND FORM 10-K
30
EXPORT TAXES
We may be required to pay significant export taxes or countervailing and anti-dumping duties for exported products.
We may experience reduced revenues and margins on some of our businesses as a result of export taxes or countervailing and anti-dumping duty assessments. International trade disputes occur frequently and can be taken to an International Trade Court for resolution of unfair trade practices between countries. For example, there have been many disputes and subsequent trade agreements regarding sales of softwood lumber between Canada and the United States. The current Softwood Lumber Act signed in October 2006 requires our Canadian softwood lumber facilities to pay an export tax when the price of lumber is at or below a threshold price. The export tax could be as high as 22.5
percent if a province exceeds its total allotted export share. It is possible that additional countervailing duty and antidumping tariffs, or similar type tariffs could be imposed on us in the future. We may experience reduced revenues and margins in any business that is subject to such tariffs or to the terms of the settlements of such international disputes. These tariffs or settlement terms could have a material adverse effect on our business, financial results and financial condition, including facility closures or impairments of assets.
NATURAL DISASTERS
Our business and operations could be adversely affected by weather, fire, infestation or natural disasters.
Our timberlands assets may be damaged by adverse weather, severe wind and rainstorms, fires, pest infestation or other natural disasters. Because our manufacturing processes primarily use wood fiber, in many cases from our own timberlands, in the event of material damage to our timberlands, our operations could be disrupted or our production costs could be increased. As is typical in the forestry industry, we do not insure against losses of timber, including losses due to these causes.
ACQUISITION OF LONGVIEW TIMBER LLC
We may fail to realize the full benefits anticipated as a result of the acquisition of Longview Timber LLC.
There are a number of risks and uncertainties relating to our recent acquisition of Longview Timber LLC. The ultimate success of the acquisition will depend, in part, on our ability to realize the anticipated business opportunities and growth prospects from combining our businesses with those of Longview Timber. We may not fully realize our expected business opportunities, synergies and growth prospects. Integrating operations may require significant efforts and expenditures from us. We may also be required to make unanticipated capital expenditures or investments in order to maintain, improve or sustain the operations or assets of Longview Timber or take write-offs or impairment charges or recognize amortization expenses resulting from the acquisition and may be subject to unanticipated or unknown liabilities relating to Longview Timber and its business. If any of these factors limit our ability to fully integrate the businesses successfully or on a timely basis, the expectations of future results of operations following the acquisition might not be met.
REAL ESTATE TRANSACTION
The Real Estate transaction may not be completed on the terms or timeline currently contemplated, or at all.
On November 4, 2013, we announced that the Company and Weyerhaeuser Real Estate Company, an indirect wholly owned subsidiary of the Company (
“
WRECO
”
), had entered into a Transaction Agreement dated November 3, 2013 with TRI Pointe Homes, Inc. ("TRI Pointe") and one of TRI Pointe
’
s subsidiaries (
“
Merger Sub
”
)
.
Pursuant to the Transaction Agreement, Weyerhaeuser Company will distribute all the shares of common stock of WRECO to its shareholders (i) on a pro rata basis, (ii) in an exchange offer or (iii) in a combination thereof (the
“
Distribution
”
). Immediately following the Distribution, Merger Sub will merge with and into WRECO (the
“
Merger
”
), with WRECO surviving the Merger and becoming a wholly owned subsidiary of TRI Pointe.
The consummation of the transaction is subject to numerous conditions, including (i) consummation of certain financings and transactions contemplated by the Transaction Agreement, (ii) the receipt of TRI Pointe stockholder approval, (iii) the receipt of applicable regulatory approvals, (iv) the receipt of certain tax opinions, and (v) other customary closing conditions. We can make no assurances that the transaction will be consummated on the terms or timeline currently contemplated, or at all. We have and will continue to expend significant management time and resources and incur significant expenses due to legal, advisory and financial services fees related to the transaction.
|
RISKS RELATED TO OWNERSHIP OF OUR COMMON STOCK
|
STOCK-PRICE VOLATILITY
The market price of our common stock may be influenced by many factors, some of which are beyond our control, including those described above under "
Risks Related to our Industries and Business
" and the following:
|
•
|
actual or anticipated fluctuations in our operating results or our competitors' operating results,
|
|
•
|
announcements by us or our competitors of new products, capacity changes, significant contracts, acquisitions or strategic investments,
|
|
•
|
our growth rate and our competitors
’
growth rates,
|
|
•
|
the financial market and general economic conditions,
|
|
•
|
changes in stock market analyst recommendations regarding us, our competitors or the forest products industry generally, or lack of analyst coverage of our common stock,
|
|
•
|
sales of our common stock by our executive officers, directors and significant stockholders or sales of substantial amounts of common stock,
|
|
•
|
changes in accounting principles, and
|
|
•
|
changes in tax laws and regulations.
|
In addition, there has been significant volatility in the market price and trading volume of securities of companies operating in the forest products industry that often has been unrelated to the operating performance of particular companies.
Some companies that have had volatile market prices for their securities have had securities litigation brought against them. If litigation of this type is brought against us, it could result in substantial costs and would divert management
’
s attention and resources.
WEYERHAEUSER COMPANY >
2013 ANNUAL REPORT AND FORM 10-K
31
PREFERENCE SHARES
Our common shares will rank junior to our mandatory convertible preference shares with respect to dividends and amounts payable in the event of our liquidation.
Our common shares will rank junior to our mandatory convertible preference shares with respect to the payment of dividends and amounts payable in the event of our liquidation, dissolution or winding-up. This means that, unless full cumulative dividends have been paid or set aside for payment on all outstanding mandatory convertible preference shares for all past dividend periods and the then current dividend period, no dividends may be declared or paid on our common shares. Likewise, in the event of our voluntary or involuntary liquidation, dissolution or winding-up, no distribution of our assets may be made to holders of our common shares until we have paid to holders of the mandatory convertible preference shares a liquidation preference equal to $50.00 per share plus accrued and unpaid dividends.
Certain provisions in the mandatory convertible preference shares could delay or prevent an otherwise beneficial takeover or takeover attempt of us and, therefore, the ability of holders to exercise their rights associated with a potential fundamental change.
Certain provisions in our mandatory convertible preference shares could make it more difficult or more expensive for a third party to acquire us. For example, if a fundamental change were to occur on or prior to July 1, 2016, holders of the mandatory convertible preference shares may have the right to convert their mandatory convertible preference shares, in whole or in part, at an increased conversion rate and will also be entitled to receive a fundamental change dividend make-whole amount equal to the present value of all remaining dividend payments on their mandatory convertible preference shares. These features of the mandatory convertible preference shares could increase the cost of acquiring us or otherwise discourage a third party from acquiring us or removing incumbent management.
UNRESOLVED STAFF COMMENTS
There are no unresolved comments that were received from the SEC staff relating to our periodic or current reports under the Securities Exchange Act of 1934.
PROPERTIES
Details about our facilities, production capacities and locations are found in the
Our Business — What We Do
section of this report.
|
•
|
For details about our Timberlands properties, go to
Our Business/What We Do/Timberlands/Where We Do It
.
|
|
•
|
For details about our Wood Products properties, go to
Our Business/What We Do/Wood Products/Where We Do It
.
|
|
•
|
For details about our Cellulose Fibers properties, go to
Our Business/What We Do/Cellulose Fibers/Where We Do It
.
|
|
•
|
For details about our Real Estate properties, go to
Our Business/What We Do/Real Estate/Where We Do It
.
|
LEGAL PROCEEDINGS
See
Note 17: Legal Proceedings, Commitments and Contingencies
in the
Notes to Consolidated Financial Statements
for a summary of legal proceedings.
WEYERHAEUSER COMPANY >
2013 ANNUAL REPORT AND FORM 10-K
32
MARKET FOR REGISTRANT’S COMMON EQUITY, RELATED STOCKHOLDER MATTERS AND ISSUER PURCHASES OF EQUITY SECURITIES
Our common stock trades on the following exchanges under the symbol WY:
|
•
|
New York Stock Exchange and
|
|
•
|
Chicago Stock Exchange
|
As of
December 31, 2013
, there were
8,859
holders of record of our common shares. Dividend-per-share data and the range of closing market prices for our common stock for each of the four quarters in
2013
and
2012
are included in
Note 24: Selected Quarterly Financial Information (unaudited)
in the
Notes to Consolidated Financial Statements
.
INFORMATION ABOUT SECURITIES AUTHORIZED FOR ISSUANCE UNDER OUR EQUITY COMPENSATION PLAN
|
NUMBER OF
SECURITIES TO BE
ISSUED UPON
EXERCISE OF
OUTSTANDING
OPTIONS,
WARRANTS AND
RIGHTS
|
|
WEIGHTED
AVERAGE EXERCISE
PRICE OF
OUTSTANDING
OPTIONS,
WARRANTS AND
RIGHTS
|
|
NUMBER OF
SECURITIES
REMAINING AVAILABLE
FOR FUTURE ISSUANCE
UNDER EQUITY
COMPENSATION PLANS
(EXCLUDING
SECURITIES TO BE ISSUED UPON EXERCISE)
|
|
||
|
Equity compensation plans approved by security holders
(1)
|
20,397,209
|
|
$
|
23.12
|
|
19,902,470
|
|
|
Equity compensation plans not approved by security holders
|
N/A
|
|
N/A
|
|
N/A
|
|
|
|
Total
|
20,397,209
|
|
$
|
23.12
|
|
19,902,470
|
|
|
(1) Includes 1,546,348 restricted stock units and 1,101,523 performance share units. Because there is no exercise price associated with restricted stock units and performance share units, such stock units are not included in the weighted average price calculation.
|
|||||||
INFORMATION ABOUT COMMON STOCK REPURCHASES
We did not repurchase any common shares in
2013
or
2012
. During 2011, we repurchased
1,199,800
shares of common stock for
$20 million
under the 2008 stock repurchase program. On August 11, 2011, our Board of Directors terminated the 2008 stock repurchase program and approved the 2011 stock repurchase program under which we are authorized to repurchase up to
$250 million
of outstanding shares. During 2011, we repurchased
1,089,824
shares of common stock for
$17 million
under the 2011 program. As of
December 31, 2013
, we had remaining authorization of
$233 million
for future share repurchases.
COMPARISON OF FIVE-YEAR CUMULATIVE TOTAL SHAREHOLDER RETURN
Weyerhaeuser Company, S&P 500 and S&P Global Timber & Forestry Index
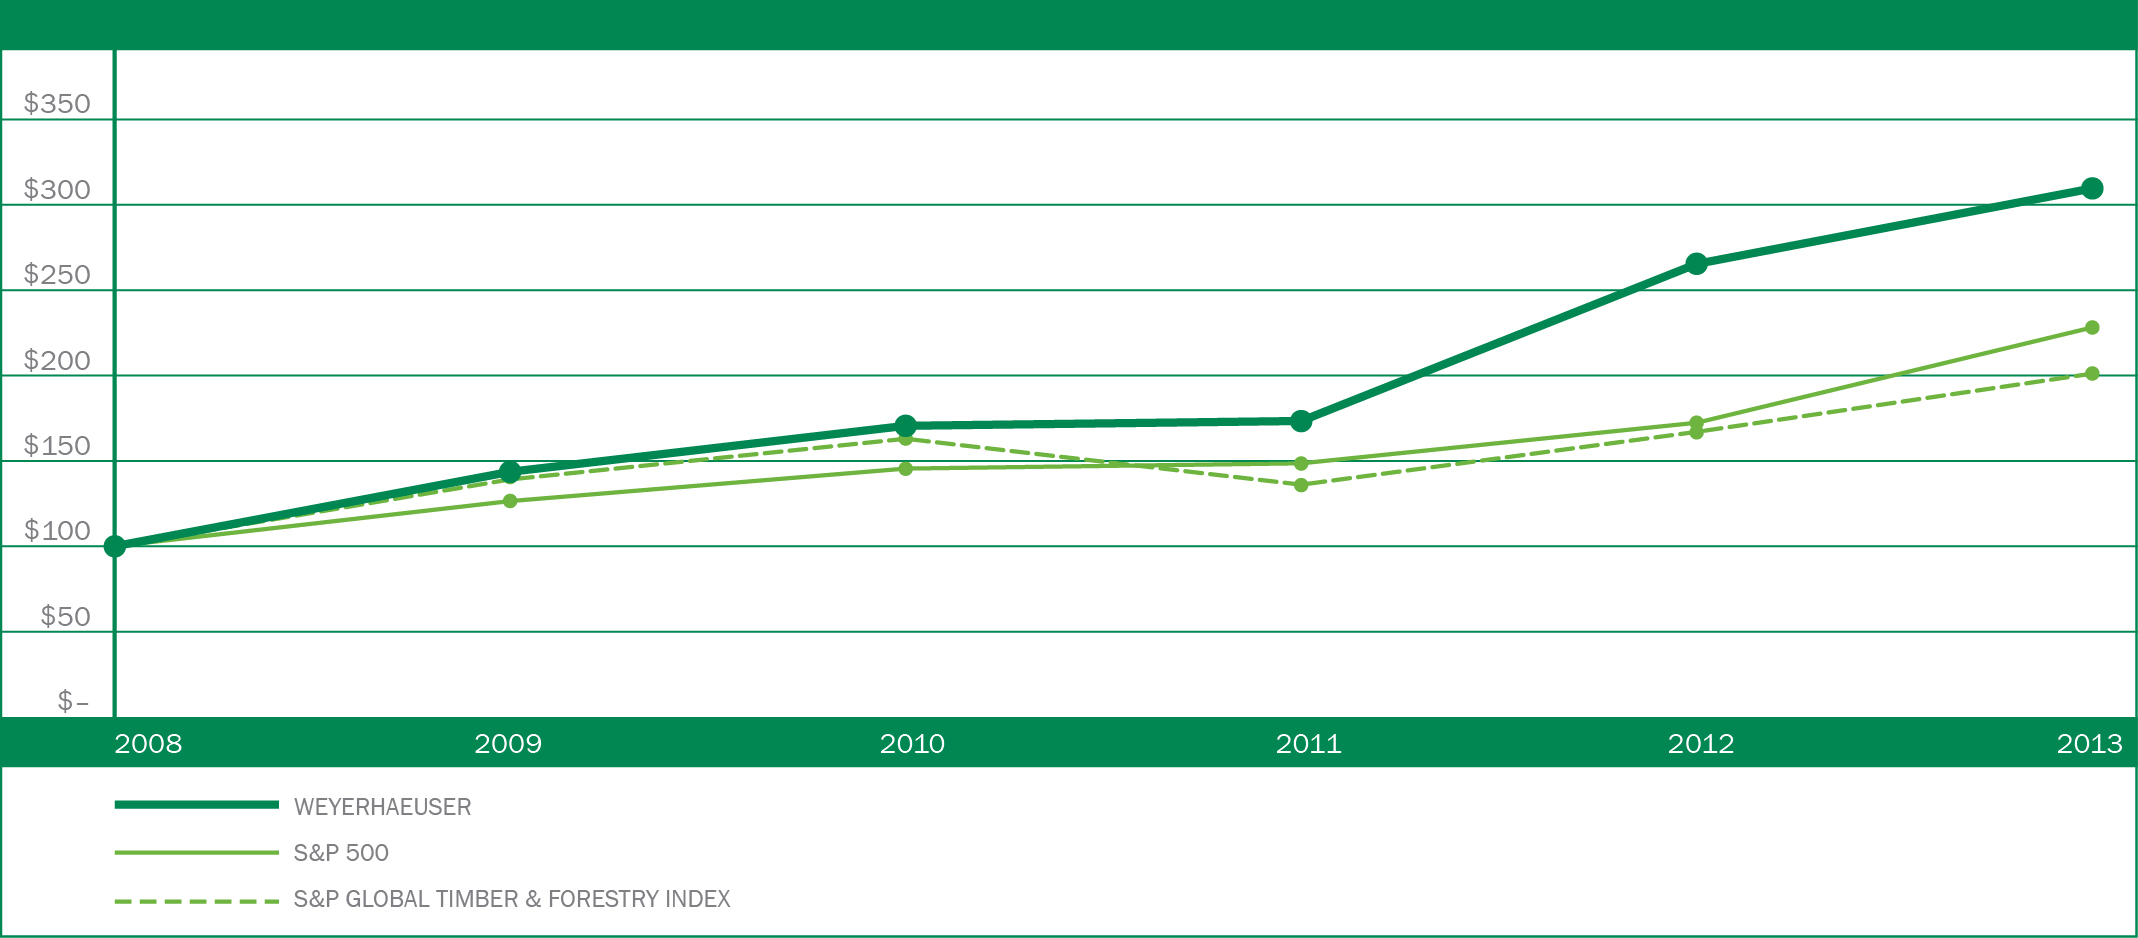
Performance Graph Assumptions
|
•
|
Assumes $100 invested on
December 31, 2008
in Weyerhaeuser common stock, the S&P 500 Index and the S&P Global Timber & Forestry Index.
|
|
•
|
Total return assumes dividends received are reinvested at month end.
|
|
•
|
Measurement dates are the last trading day of the calendar year shown.
|
WEYERHAEUSER COMPANY >
2013 ANNUAL REPORT AND FORM 10-K
33
SELECTED FINANCIAL DATA
DOLLAR AMOUNTS IN MILLIONS, EXCEPT PER-SHARE FIGURES
|
PER COMMON SHARE
|
|||||||||||
|
|
2013
|
|
2012
|
|
2011
|
|
2010
|
|
2009
|
|
|
|
Diluted earnings (loss) from continuing operations attributable to Weyerhaeuser common shareholders
|
$
|
0.95
|
|
0.71
|
|
0.59
|
|
3.96
|
|
(2.38
|
)
|
|
Diluted earnings (loss) from discontinued operations attributable to Weyerhaeuser common shareholders
(1)
|
—
|
|
—
|
|
0.02
|
|
0.03
|
|
(0.20
|
)
|
|
|
Diluted net earnings (loss) attributable to Weyerhaeuser common shareholders
|
$
|
0.95
|
|
0.71
|
|
0.61
|
|
3.99
|
|
(2.58
|
)
|
|
Dividends paid per common share
|
$
|
0.81
|
|
0.62
|
|
0.60
|
|
26.61
|
|
0.60
|
|
|
Weyerhaeuser shareholders’ interest (end of year)
|
$
|
11.64
|
|
7.50
|
|
7.95
|
|
8.60
|
|
19.13
|
|
|
FINANCIAL POSITION
|
|||||||||||
|
|
2013
|
|
2012
|
|
2011
|
|
2010
|
|
2009
|
|
|
|
Total assets
|
$
|
14,498
|
|
12,592
|
|
12,634
|
|
13,464
|
|
15,319
|
|
|
Total long-term debt
|
$
|
4,891
|
|
4,291
|
|
4,478
|
|
5,060
|
|
5,686
|
|
|
Weyerhaeuser shareholders’ interest
|
$
|
6,795
|
|
4,070
|
|
4,263
|
|
4,612
|
|
4,044
|
|
|
Percent earned on average Weyerhaeuser shareholders’ interest
|
9.9
|
%
|
9.2
|
%
|
7.5
|
%
|
29.6
|
%
|
(12.3
|
)%
|
|
|
OPERATING RESULTS
|
|||||||||||
|
|
2013
|
|
2012
|
|
2011
|
|
2010
|
|
2009
|
|
|
|
Net sales
|
$
|
8,529
|
|
7,059
|
|
6,216
|
|
5,954
|
|
5,068
|
|
|
Earnings (loss) from continuing operations
|
$
|
563
|
|
384
|
|
319
|
|
1,274
|
|
(525
|
)
|
|
Discontinued operations, net of income taxes
(1)
|
—
|
|
—
|
|
12
|
|
9
|
|
(43
|
)
|
|
|
Net earnings (loss)
|
563
|
|
384
|
|
331
|
|
1,283
|
|
(568
|
)
|
|
|
Net loss (earnings) attributable to noncontrolling interest
|
—
|
|
1
|
|
—
|
|
(2
|
)
|
23
|
|
|
|
Net earnings (loss) attributable to Weyerhaeuser
|
563
|
|
385
|
|
331
|
|
1,281
|
|
(545
|
)
|
|
|
Dividends on preference shares
|
(23
|
)
|
—
|
|
—
|
|
—
|
|
—
|
|
|
|
Net earnings (loss) attributable to Weyerhaeuser common shareholders
|
$
|
540
|
|
385
|
|
331
|
|
1,281
|
|
(545
|
)
|
|
CASH FLOWS
|
|||||||||||
|
|
2013
|
|
2012
|
|
2011
|
|
2010
|
|
2009
|
|
|
|
Net cash from operations
|
$
|
1,004
|
|
581
|
|
291
|
|
689
|
|
(203
|
)
|
|
Cash from investing activities
|
$
|
(1,829
|
)
|
(192
|
)
|
122
|
|
164
|
|
276
|
|
|
Cash from financing activities
|
$
|
762
|
|
(444
|
)
|
(927
|
)
|
(1,255
|
)
|
(498
|
)
|
|
Net change in cash and cash equivalents
|
$
|
(63
|
)
|
(55
|
)
|
(514
|
)
|
(402
|
)
|
(425
|
)
|
|
STATISTICS (UNAUDITED)
|
|||||||||||
|
|
2013
|
|
2012
|
|
2011
|
|
2010
|
|
2009
|
|
|
|
Number of employees
|
13,700
|
|
13,200
|
|
12,800
|
|
14,250
|
|
14,888
|
|
|
|
Number of common shareholder accounts at year-end
|
8,859
|
|
9,227
|
|
9,724
|
|
10,050
|
|
10,577
|
|
|
|
Number of common shares outstanding at year-end (thousands)
|
583,548
|
|
542,393
|
|
536,425
|
|
535,976
|
|
211,359
|
|
|
|
Weighted average common shares outstanding – diluted (thousands)
|
571,239
|
|
542,310
|
|
539,879
|
|
321,096
|
|
211,342
|
|
|
|
(1)
|
To implement our decision to be taxed as a REIT, we distributed to our shareholders our accumulated earnings and profits, determined under federal income tax provisions, as a “Special Dividend.” On September 1, 2010, we paid a dividend of $5.6 billion which included the Special Dividend and the regular quarterly dividend of approximately $11 million. At the election of each shareholder, the Special Dividend was paid in cash or Weyerhaeuser common shares. The number of common shares issued was approximately 324 million. The stock portion of the Special Dividend was treated as the issuance of new shares for accounting purposes and affects our earnings per share only for periods after the distribution. Prior periods are not restated. The required treatment results in earnings per share that is less than would have been the case had the common shares not been issued.
WEYERHAEUSER COMPANY >
2013 ANNUAL REPORT AND FORM 10-K
34
MANAGEMENT’S DISCUSSION AND ANALYSIS OF FINANCIAL CONDITION AND RESULTS OF OPERATIONS (MD&A)
|
WHAT YOU WILL FIND IN THIS MD&A
|
Our MD&A includes the following major sections:
|
•
|
economic and market conditions affecting our operations;
|
|
•
|
financial performance summary;
|
|
•
|
results of our operations — consolidated and by segment;
|
|
•
|
liquidity and capital resources — where we discuss our cash flows;
|
|
•
|
off-balance sheet arrangements;
|
|
•
|
environmental matters, legal proceedings and other contingencies; and
|
|
•
|
accounting matters — where we discuss critical accounting policies and areas requiring judgments and estimates.
|
|
ECONOMIC AND MARKET CONDITIONS AFFECTING OUR OPERATIONS
|
In 2013, the U.S. economy continued to advance at a sluggish pace. Growth in the U.S. economy was hindered by fiscal issues which included the fiscal cliff, sequestration and a budget impasse which caused a partial shutdown of the government for 16 days. Private sector growth was an area of comparative strength, but not without incident
,
as hints of tapering of the Federal Reserve asset purchases caused an abrupt rise in interest rates which rattled markets. These factors significantly affected the economy, limiting anticipated improvements in key economic indicators. The U.S. housing market, while affected by these factors, continued to show signs of improvement in 2013 as lower inventories of new and existing homes led to increases in new home construction and rises in home values. The strength of the U.S. housing market strongly affects our Real Estate, Wood Products and Timberlands segments.
Real Estate focuses on building single-family homes. As published by the U.S. Census Bureau, total U.S. housing starts for 2013 were 923 thousand units, with single family units accounting for 618 thousand of the total. This represents a 15 percent increase in single family starts from 2012, which was 535 thousand units. Multifamily construction also increased in 2013 to 305 thousand units compared with 246 thousand in 2012. While a significant improvement, current housing demand remains well below 1 million or more single family starts, the typical level during the 15-year period of 1992-2007. In 2013, new home sales in the U.S. averaged 430 thousand units. This level represents a 17 percent increase over 2012.
Wood Products primarily sells into the new residential building and repair and remodel markets. Demand for wood products has continued to improve as housing starts have increased. This has resulted in higher prices than those observed in 2012. Prices for most commodity wood products were higher in 2013, with the greatest increases observed in Douglas fir lumber and oriented strand board (OSB). Higher prices led to improved industry operating rates for lumber and OSB. Despite the improvement, demand for both lumber and panels remain below peak levels.
Demand for logs from our Timberlands segment is affected by the production of wood-based building products as well as export demand. In the South, several years of deferred harvest due to weak demand have created increased inventories and as a result southern pine log prices were modestly higher in 2013 while western log prices, helped by resurgent demand from China and Japan, increased more substantially in 2013.
Cellulose Fibers is primarily affected by global demand and the relative strength of the U.S. dollar. The U.S. dollar was relatively stable compared to most global currencies during 2013 with some notable exceptions. The volatility which characterized the Euro in 2012 was mostly absent in 2013. The U.S. dollar weakened slightly against the euro for much of 2013, which improved our pulp mills competitiveness against competitors with euro denominated costs and had a positive effect on Cellulose Fibers pricing. Demand in the key global economies of Europe and China improved from 2012.
WEYERHAEUSER COMPANY >
2013 ANNUAL REPORT AND FORM 10-K
35
|
FINANCIAL PERFORMANCE SUMMARY
|
Net Sales by Segment
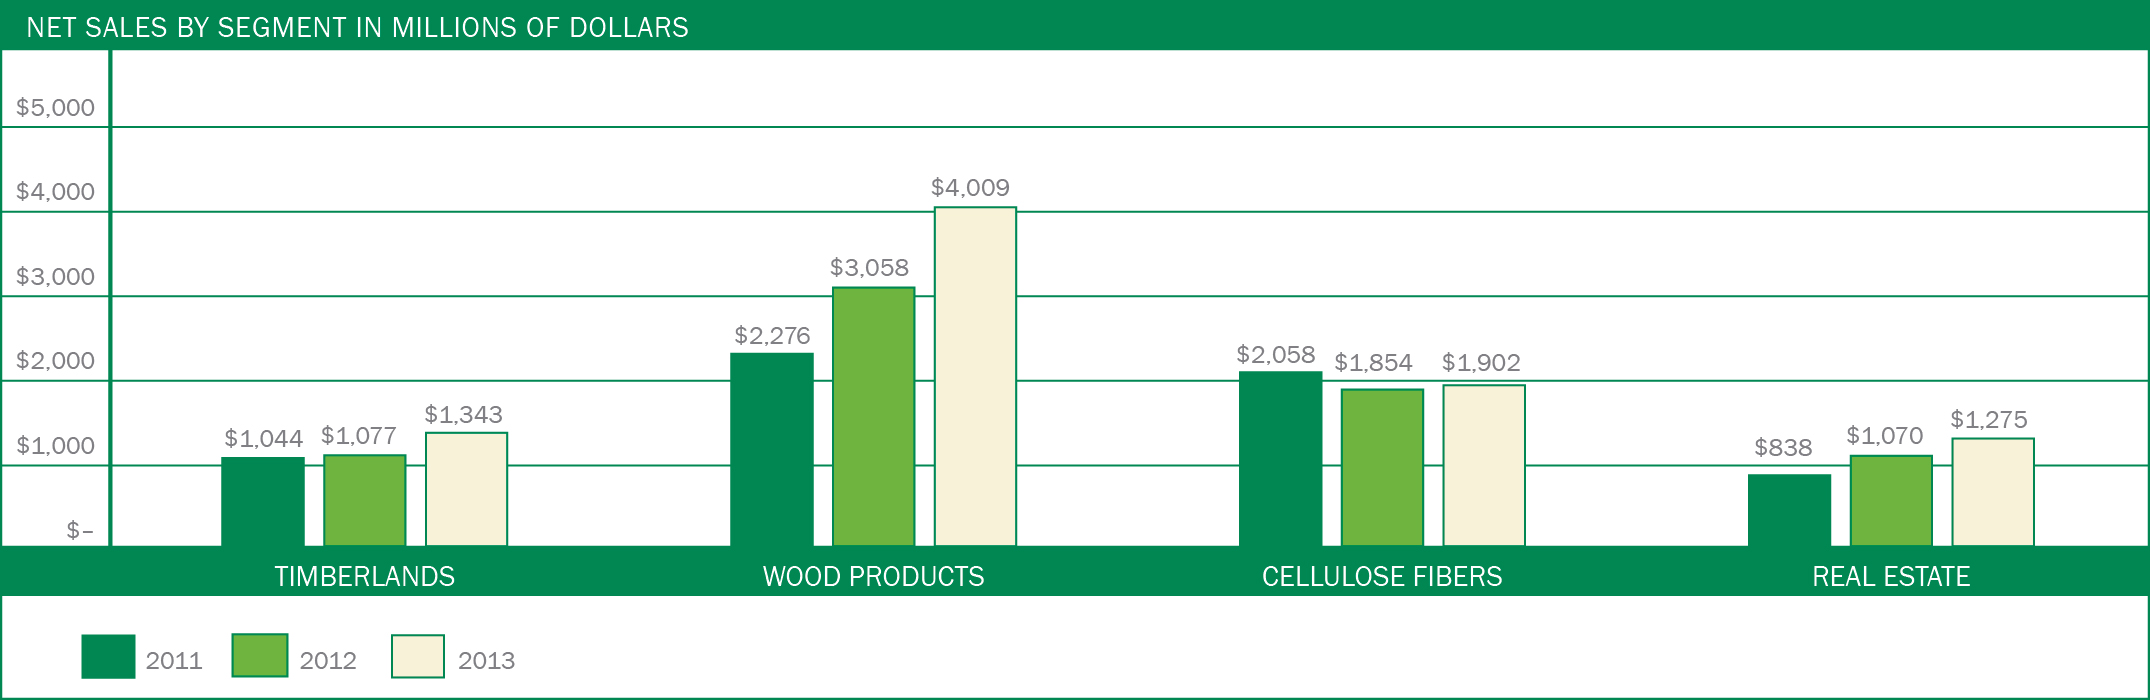
Contribution (Charge) to Pretax Earnings by
Segment, Excluding Discontinued Operations
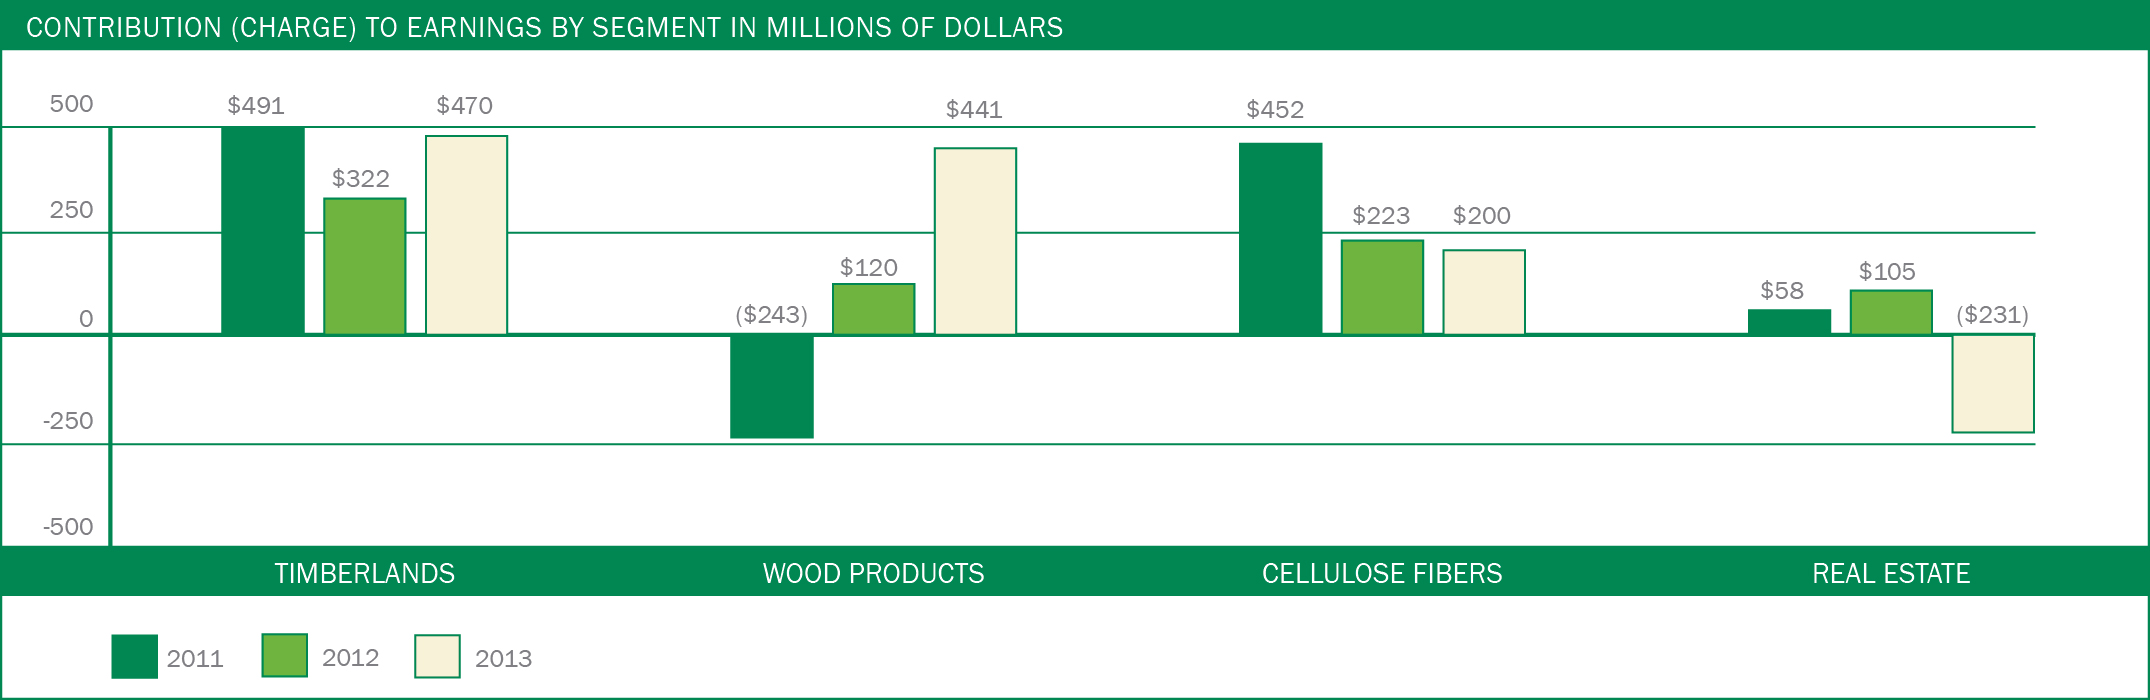
WEYERHAEUSER COMPANY >
2013 ANNUAL REPORT AND FORM 10-K
36
|
RESULTS OF OPERATIONS
|
In reviewing our results of operations, it is important to understand these terms:
|
•
|
Sales realizations refer to net selling prices — this includes selling price plus freight minus normal sales deductions.
|
|
•
|
Net contribution to earnings can be positive or negative and refers to earnings (loss) attributable to Weyerhaeuser shareholders before interest expense and income taxes.
|
CONSOLIDATED RESULTS
HOW WE DID IN
2013
Summary of Financial Results
|
DOLLAR AMOUNTS IN MILLIONS, EXCEPT PER-SHARE FIGURES
|
|||||||||||||||
|
|
|
|
|
AMOUNT OF CHANGE
|
|||||||||||
|
|
2013
|
|
2012
|
|
2011
|
|
2013
vs. 2012 |
|
2012
vs. 2011 |
|
|||||
|
Net sales
|
$
|
8,529
|
|
$
|
7,059
|
|
$
|
6,216
|
|
$
|
1,470
|
|
$
|
843
|
|
|
Operating income
|
$
|
747
|
|
$
|
735
|
|
$
|
594
|
|
$
|
12
|
|
$
|
141
|
|
|
Earnings from discontinued operations, net of tax
|
$
|
—
|
|
$
|
—
|
|
$
|
12
|
|
$
|
—
|
|
$
|
(12
|
)
|
|
Net earnings attributable to Weyerhaeuser common shareholders
|
$
|
540
|
|
$
|
385
|
|
$
|
331
|
|
$
|
155
|
|
$
|
54
|
|
|
Basic earnings per share attributable to Weyerhaeuser common shareholders
|
$
|
0.95
|
|
$
|
0.71
|
|
$
|
0.62
|
|
$
|
0.24
|
|
$
|
0.09
|
|
|
Diluted earnings per share attributable to Weyerhaeuser common shareholders
|
$
|
0.95
|
|
$
|
0.71
|
|
$
|
0.61
|
|
$
|
0.24
|
|
$
|
0.10
|
|
COMPARING
2013
WITH
2012
Net Sales
Net sales increased
$1,470 million
— 21 percent — primarily due to the following:
|
•
|
Wood Products segment sales increased $951 million, primarily due to higher sales realizations and higher sales volumes across all major product lines.
|
|
•
|
Timberlands segment sales increased $266 million, primarily due to higher export and domestic log prices, increased sales volumes and the purchase of Longview Timber.
|
|
•
|
Real Estate segment sales increased $205 million, primarily due to increased home closings and improved average prices for homes closed.
|
|
•
|
Cellulose Fibers segment sales increased $48 million primarily due to increased sales volumes.
|
Net Earnings Attributable to Weyerhaeuser Common Shareholders
Our net earnings attributable to Weyerhaeuser common shareholders increased
$155 million
— 40 percent — primarily due to the following:
|
•
|
a $537 million increase in gross margin in our Wood Products, Timberlands and Real Estate segments. Our Wood Products and Timberlands segment increases were primarily due to higher sales realizations and sales volumes. Increased gross margin in our Real Estate segment was primarily due to increased single-family home closings and improved average prices for homes closed.
|
|
•
|
a $184 million change in income taxes from an expense in 2012 to a benefit in 2013 primarily related to a previously unrecognized tax benefit recorded in 2013.
|
These increases in our earnings were partially offset by:
|
•
|
a $358 million increase in charges for restructuring, closure and asset impairments primarily related to a non-cash impairment charge relating to a large master-planned community in our Real Estate segment;
|
|
•
|
a $155 million decrease in other operating income, primarily due to a $103 million pretax gain recognized in 2012 related to a previously announced postretirement plan amendment; and
|
|
•
|
a $45 million increase in our selling, general and administrative expenses.
|
COMPARING
2012
WITH
2011
Net Sales
Net sales increased
$843 million
— 14 percent — primarily due to the following:
|
•
|
Wood Products segment sales increased $782 million, primarily due to higher sales volumes across all major product lines and improved selling prices for structural lumber, OSB and plywood.
|
|
•
|
Real Estate segment sales increased $232 million, primarily due to the sale of a 3,200 acre master planned community in Houston, Texas, sale of commercial acreage and multi-family lots in southern California and increased home closings.
|
These increases were partially offset by a decrease of $204 million in Cellulose Fibers segment sales, primarily due to lower pulp price realizations.
WEYERHAEUSER COMPANY >
2013 ANNUAL REPORT AND FORM 10-K
37
Net Earnings Attributable to Weyerhaeuser Common Shareholders
Our net earnings attributable to Weyerhaeuser common shareholders increased
$54 million
— 16 percent — primarily due to the following:
|
•
|
a $355 million increase in gross margin from our Wood Products segment, primarily due to higher price realizations for lumber, OSB and plywood;
|
|
•
|
a $103 million pretax gain recognized in 2012 related to a postretirement plan amendment;
|
|
•
|
charges for restructuring, closures and asset impairments decreased $51 million; and
|
|
•
|
a $48 million increase in gross margin from our Real Estate segment, primarily due to increased contributions from land and lot sales.
|
These increases in our earnings were partially offset by:
|
•
|
a $240 million decrease in gross margin from our Cellulose Fibers segment, primarily due to lower pulp price realizations;
|
|
•
|
a pretax gain of $152 million on the sale of 82,000 acres of non-strategic timberlands in 2011; and
|
|
•
|
a $117 million increase in income taxes due to higher income in our TRS in 2012 compared to 2011, and lower tax benefits primarily due to foreign tax credits recognized in 2011.
|
TIMBERLANDS
HOW WE DID IN
2013
We report sales volume and annual production data for our Timberlands business segment in
Our Business/What We Do/Timberlands
.
Here is a comparison of net sales to unaffiliated customers, intersegment sales, and net contribution to earnings for the last three years:
Net Sales and Net Contribution to Earnings for Timberlands
|
DOLLAR AMOUNTS IN MILLIONS
|
|||||||||||||||
|
|
|
|
|
AMOUNT OF CHANGE
|
|||||||||||
|
|
2013
|
|
2012
|
|
2011
|
|
2013
vs. 2012 |
|
2012
vs. 2011 |
|
|||||
|
Net sales to unaffiliated customers:
|
|
|
|
|
|
||||||||||
|
Logs:
|
|
|
|
|
|
||||||||||
|
West
|
$
|
828
|
|
$
|
559
|
|
$
|
545
|
|
$
|
269
|
|
$
|
14
|
|
|
South
|
256
|
|
233
|
|
196
|
|
23
|
|
37
|
|
|||||
|
Canada
|
19
|
|
19
|
|
17
|
|
—
|
|
2
|
|
|||||
|
Total
|
1,103
|
|
811
|
|
758
|
|
292
|
|
53
|
|
|||||
|
Pay as cut timber sales
|
9
|
|
13
|
|
7
|
|
(4
|
)
|
6
|
|
|||||
|
Chip sales
|
9
|
|
18
|
|
19
|
|
(9
|
)
|
(1
|
)
|
|||||
|
Timberlands exchanges
(1)
|
65
|
|
59
|
|
77
|
|
6
|
|
(18
|
)
|
|||||
|
Higher and better-use land sales
(1)
|
19
|
|
22
|
|
25
|
|
(3
|
)
|
(3
|
)
|
|||||
|
Minerals, oil and gas
|
32
|
|
31
|
|
53
|
|
1
|
|
(22
|
)
|
|||||
|
Products from international operations
(2)
|
90
|
|
106
|
|
86
|
|
(16
|
)
|
20
|
|
|||||
|
Other products
|
16
|
|
17
|
|
19
|
|
(1
|
)
|
(2
|
)
|
|||||
|
Subtotal sales to unaffiliated customers
|
1,343
|
|
1,077
|
|
1,044
|
|
266
|
|
33
|
|
|||||
|
Intersegment sales:
|
|
|
|
|
|
||||||||||
|
United States
|
518
|
|
447
|
|
424
|
|
71
|
|
23
|
|
|||||
|
Other
|
281
|
|
236
|
|
222
|
|
45
|
|
14
|
|
|||||
|
Subtotal intersegment sales
|
799
|
|
683
|
|
646
|
|
116
|
|
37
|
|
|||||
|
Total
|
$
|
2,142
|
|
$
|
1,760
|
|
$
|
1,690
|
|
$
|
382
|
|
$
|
70
|
|
|
Net contribution to earnings
|
$
|
470
|
|
$
|
322
|
|
$
|
491
|
|
$
|
148
|
|
$
|
(169
|
)
|
|
(1) Significant disposition of higher and better use timberland and some non-strategic timberlands are made through subsidiaries.
(2) Includes logs, plywood and hardwood lumber harvested or produced by our international operations, primarily in South America.
|
|||||||||||||||
On July 23, 2013, we purchased 100 percent of the equity interests in Longview Timber LLC (Longview Timber) for cash and assumed debt. The sales and net contribution to earnings of our acquired entity from the acquisition date to the end of the year are included in the West results of our Timberlands segment. Longview Timber was and continues to be a supplier to our Wood Products segment and those sales are shown in intersegment sales. More information on this transaction can be found in
Note 3: Longview Timber Purchase
in the
Notes to Consolidated Financial Statements
.
WEYERHAEUSER COMPANY >
2013 ANNUAL REPORT AND FORM 10-K
38
COMPARING
2013
WITH
2012
Net Sales — Unaffiliated Customers
Net sales to unaffiliated customers increased
$266 million
— 25 percent — primarily from the following:
|
•
|
Western log sales increased $269 million due to higher export and domestic log prices and a 31 percent increase in sales volume as a result of increased export and domestic demand and the purchase of Longview Timber; and
|
|
•
|
Southern log sales increased $23 million due to higher log prices and a 6 percent increase in sales volume as the result of increased thinning activity.
|
These increases were partially offset by:
|
•
|
a $16 million decrease in sales from our International operations primarily due to a shift toward internal sales of manufactured products; and
|
|
•
|
a $9 million decrease in chip sales.
|
Intersegment Sales
Intersegment sales increased
$116 million
— 17 percent — primarily due to the following:
|
•
|
a $71 million increase, primarily due to higher log prices and increased volume in our legacy Western timberlands and the South and the purchase of Longview Timber; and
|
|
•
|
a $45 million increase due to higher log prices in Canada.
|
Net contribution to earnings
Net contribution to earnings increased
$148 million
— 46 percent — primarily from:
|
•
|
a $104 million increase due to higher sales volumes and demand for export and domestic logs in our legacy Western timberlands. Harvest levels increased 5 percent in our legacy Western timberlands;
|
|
•
|
a $49 million increase due to higher log prices in our legacy Western timberlands and the South; and
|
|
•
|
a $36 million increase due to the purchase of Longview Timber.
|
These increases were partially offset by:
|
•
|
a $30 million increase in operating costs in our legacy Western timberlands primarily due to a higher mix of higher cost logs from internal and outside purchases and increased silviculture costs; and
|
|
•
|
$14 million increase in selling, general and administrative costs, excluding Longview Timber.
|
COMPARING
2012
WITH
2011
Net Sales — Unaffiliated Customers
Net sales to unaffiliated customers increased
$33 million
— 3 percent — primarily due to the following:
|
•
|
Southern log sales increased $37 million due to increased sales volumes of 14 percent and increased price realizations of 4 percent, as a result of increased harvest levels in response to increased third party demand.
|
|
•
|
Sales from our international operations increased $20 million, primarily due to increased plywood prices of 16 percent and a 33 percent increase in plywood sales volumes.
|
|
•
|
Western log sales increased by $14 million due to increased sales volumes of 12 percent, partially offset by lower export and domestic log prices.
|
The above items were partially offset by:
|
•
|
a $22 million decrease in minerals, oil and gas revenue primarily due to lower natural gas prices; and
|
|
•
|
a $21 million decrease in timberland exchanges.
|
Intersegment Sales
Intersegment sales increased
$37 million
— 6 percent — primarily from the following:
|
•
|
a $23 million increase due to higher sales volumes in the West and South, partially offset by lower log prices in the South; and
|
|
•
|
a $14 million increase due to increased Canadian log and chip sales volumes.
|
Net contribution to earnings
Net contribution to earnings decreased
$169 million
— 34 percent — primarily from the following:
|
•
|
a $152 million decrease due to the sale of 82,000 acres of non-strategic timberlands in 2011;
|
|
•
|
a $36 million decrease as the mix of export log sales compared to domestic log sales decreased in the West and both domestic and export log prices were lower in the West;
|
|
•
|
a $22 million decrease in mineral income, primarily as a result of lower natural gas prices;
|
|
•
|
a $15 million decrease due to fewer timberland exchanges and higher and better-use land sales; and
|
|
•
|
a $12 million increase in operating costs in the West, primarily due to increased logging and maintenance costs.
|
The above items were partially offset by:
|
•
|
a $46 million increase, primarily due to higher sales volumes and demand for domestic and export logs and an increase in harvest levels of 9 percent in the West and 18 percent in the South;
|
|
•
|
a $10 million increase in earnings from our international operations, primarily due to higher plywood prices and sales volumes; and
|
|
•
|
a $7 million increase due to higher log prices in the South.
|
WEYERHAEUSER COMPANY >
2013 ANNUAL REPORT AND FORM 10-K
39
WOOD PRODUCTS
HOW WE DID IN
2013
We report sales volume and annual production data for our Wood Products business segment in
Our Business/What We Do/Wood Products
.
Net Sales and Net Contribution to Earnings for Wood Products
|
DOLLAR AMOUNTS IN MILLIONS
|
|||||||||||||||
|
|
|
|
|
AMOUNT OF CHANGE
|
|||||||||||
|
|
2013
|
|
2012
|
|
2011
|
|
2013
vs. 2012 |
|
2012
vs. 2011 |
|
|||||
|
Net sales:
|
|
|
|
|
|
||||||||||
|
Structural lumber
|
$
|
1,873
|
|
$
|
1,400
|
|
$
|
1,087
|
|
$
|
473
|
|
$
|
313
|
|
|
Engineered solid section
|
353
|
|
279
|
|
235
|
|
74
|
|
44
|
|
|||||
|
Engineered I-joists
|
247
|
|
190
|
|
161
|
|
57
|
|
29
|
|
|||||
|
Oriented strand board
|
809
|
|
612
|
|
354
|
|
197
|
|
258
|
|
|||||
|
Softwood plywood
|
144
|
|
115
|
|
66
|
|
29
|
|
49
|
|
|||||
|
Other products produced
|
171
|
|
167
|
|
142
|
|
4
|
|
25
|
|
|||||
|
Other products purchased for resale
|
412
|
|
295
|
|
231
|
|
117
|
|
64
|
|
|||||
|
Net sales from continuing operations
|
$
|
4,009
|
|
$
|
3,058
|
|
$
|
2,276
|
|
$
|
951
|
|
$
|
782
|
|
|
Net contribution to earnings from continuing operations
|
$
|
441
|
|
$
|
120
|
|
$
|
(243
|
)
|
$
|
321
|
|
$
|
363
|
|
|
Net contribution to earnings from discontinued operations
|
—
|
|
—
|
|
(25
|
)
|
—
|
|
25
|
|
|||||
|
Net contribution to earnings
|
$
|
441
|
|
$
|
120
|
|
$
|
(268
|
)
|
$
|
321
|
|
$
|
388
|
|
COMPARING
2013
WITH
2012
Overall performance in our Wood Products segment improved year over year. We continue to focus on reducing costs and increasing revenues by broadening our customer base, introducing new products, growing our specialty, as well as commodity building products business and improving our operational capabilities. These improvement efforts and better market conditions, have resulted in higher production rates in all primary product lines.
Net Sales
Net sales increased
$951 million
— 31 percent — primarily due to the following:
|
•
|
Structural lumber shipment volumes increased 10 percent and average sales realizations increased 22 percent.
|
|
•
|
OSB shipment volumes increased 11 percent and average sales realizations increased 20 percent.
|
|
•
|
Engineered solid section shipment volumes increased 18 percent and average sales realizations increased 7 percent.
|
|
•
|
Engineered I-joist shipment volumes increased 16 percent and average sales realizations increased 11 percent.
|
|
•
|
Softwood plywood shipment volumes increased 18 percent and average sales realizations increased 6 percent.
|
|
•
|
Complementary products purchased for resale increased 40 percent.
|
Net Contribution to Earnings
Net contribution to earnings increased
$321 million
primarily from:
|
•
|
a $454 million increase, primarily due to higher sales realizations across all major product lines;
|
|
•
|
a $58 million increase in sales volumes across all major products; and
|
|
•
|
a $14 million increase in other products improvements.
|
These increases were partially offset by:
|
•
|
an $88 million increase in log cost due to continued strong lumber demand and increasing log prices;
|
|
•
|
a $51 million increase in freight expense due to higher shipment volumes;
|
|
•
|
a $38 million increase in manufacturing costs due to higher raw material, maintenance and labor costs; and
|
|
•
|
a $27 million increase in selling, general and administrative costs.
|
COMPARING
2012
WITH
2011
Restructuring, Closures and Asset Impairments
During 2011, we recognized $29 million of impairment charges in the Wood Products segment primarily related to the decision to permanently close four engineered lumber facilities that had been previously indefinitely closed. These facilities are located in Albany, Oregon; Dodson, Louisiana; Pine Hill, Alabama; and Simsboro, Louisiana. Total restructuring, closures and asset impairment charges in 2011 for the segment were $64 million and 2012 were not significant.
Net Sales
Net sales and revenues increased
$782 million
— 34 percent — primarily due to the following:
|
•
|
Structural lumber shipment volumes increased 12 percent and average price realizations increased 15 percent.
|
|
•
|
OSB shipment volumes increased 27 percent and average price realizations increased 36 percent.
|
|
•
|
Engineered solid section shipment volumes increased 25 percent.
|
|
•
|
Engineered I-joist shipment volumes increased 19 percent.
|
WEYERHAEUSER COMPANY >
2013 ANNUAL REPORT AND FORM 10-K
40
|
•
|
Softwood plywood shipment volumes increased 37 percent and average price realizations increased 28 percent.
|
|
•
|
Other products produced increased 18 percent.
|
|
•
|
Other products purchased for resale increased 28 percent.
|
The above items were partially offset by a decrease of 6 percent in engineered solid section average price realizations.
Net Contribution to Earnings
Net contribution to earnings increased
$388 million
primarily from:
|
•
|
a $363 million increase as higher lumber, OSB and plywood price realizations more than offset lower prices for engineered I-joists and engineered solid section:
|
|
•
|
a $58 million decrease in charges for restructuring, closures and asset impairments;
|
|
•
|
a $25 million loss from discontinued operations included in 2011 earnings; and
|
|
•
|
a $23 million increase in sales volumes across all products.
|
These changes were partially offset by a $51 million increase in freight expense due to higher shipment volumes.
CELLULOSE FIBERS
HOW WE DID IN
2013
We report sales volume and annual production data for our Cellulose Fibers business segment in
Our Business/What We Do/Cellulose Fibers
.
Here is a comparison of net sales and net contribution to earnings for the last three years:
Net Sales and Net Contribution to Earnings for Cellulose Fibers
|
DOLLAR AMOUNTS IN MILLIONS
|
|||||||||||||||
|
|
|
|
|
AMOUNT OF CHANGE
|
|||||||||||
|
|
2013
|
|
2012
|
|
2011
|
|
2013
vs. 2012 |
|
2012
vs. 2011 |
|
|||||
|
Net sales:
|
|
|
|
|
|
||||||||||
|
Pulp
|
$
|
1,501
|
|
$
|
1,433
|
|
$
|
1,617
|
|
$
|
68
|
|
$
|
(184
|
)
|
|
Liquid packaging board
|
326
|
|
332
|
|
346
|
|
(6
|
)
|
(14
|
)
|
|||||
|
Other products
|
75
|
|
89
|
|
95
|
|
(14
|
)
|
(6
|
)
|
|||||
|
Total
|
$
|
1,902
|
|
$
|
1,854
|
|
$
|
2,058
|
|
$
|
48
|
|
$
|
(204
|
)
|
|
Net contribution to earnings
|
$
|
200
|
|
$
|
223
|
|
$
|
452
|
|
$
|
(23
|
)
|
$
|
(229
|
)
|
COMPARING
2013
WITH
2012
Net Sales
Net sales increased
$48 million
— 3 percent — primarily due to:
|
•
|
Increased sales volumes of 6 percent for pulp, resulting from increased demand, which was partially offset by decreased pulp sales realizations of $9 per ton — 1 percent.
|
|
•
|
Liquid packaging board sales realizations decreased $82 per ton — 7 percent — resulting primarily from mix of products.
|
Net Contribution to Earnings
Net contribution to earnings decreased
$23 million
— 10 percent — primarily due to:
|
•
|
a $25 million decrease in liquid packaging sales realizations; and
|
|
•
|
a $17 million decrease in pulp sales realizations;
|
These decreases were partially offset by a $16 million decrease in chemical and energy costs.
COMPARING
2012
WITH
2011
Net Sales
Net sales decreased
$204 million
— 10 percent — primarily due to:
|
•
|
Pulp sales realizations decreased $108 per ton — 12 percent — resulting from weak global economies and a weak euro. The effect of the price decrease was partially offset by an improved sales mix to higher valued products.
|
|
•
|
Sales volumes for liquid packaging board decreased 8,000 tons — 3 percent — as the result of weaker demand in Japan.
|
Net Contribution to Earnings
Net contribution to earnings decreased
$229 million
— 51 percent — primarily due to:
|
•
|
a $190 million decrease due to lower pulp sales realizations, partially offset by an improved sales mix to higher value products; and
|
|
•
|
a $35 million increase in chemical, freight, warehousing and other operating costs.
|
WEYERHAEUSER COMPANY >
2013 ANNUAL REPORT AND FORM 10-K
41
REAL ESTATE
HOW WE DID IN
2013
We report single-family unit statistics for our Real Estate business segment in
Our Business/What We Do/Real Estate
.
Here is a comparison of net sales and net contribution to earnings for the last three years:
Net Sales and Net Contribution to Earnings for Real Estate
|
DOLLAR AMOUNTS IN MILLIONS
|
|||||||||||||||
|
|
|
|
|
AMOUNT OF CHANGE
|
|||||||||||
|
|
2013
|
|
2012
|
|
2011
|
|
2013
vs. 2012 |
|
2012
vs. 2011 |
|
|||||
|
Net sales:
|
|
|
|
|
|
|
|
|
|
|
|||||
|
Single-family housing
|
$
|
1,219
|
|
$
|
870
|
|
$
|
768
|
|
$
|
349
|
|
$
|
102
|
|
|
Land
|
52
|
|
193
|
|
67
|
|
(141
|
)
|
126
|
|
|||||
|
Other
|
4
|
|
7
|
|
3
|
|
(3
|
)
|
4
|
|
|||||
|
Total
|
$
|
1,275
|
|
$
|
1,070
|
|
$
|
838
|
|
$
|
205
|
|
$
|
232
|
|
|
Net contribution to earnings
|
$
|
(231
|
)
|
$
|
105
|
|
$
|
58
|
|
$
|
(336
|
)
|
$
|
47
|
|
On June 16, 2013, we announced that our Board of Directors authorized the exploration of strategic alternatives with respect to Weyerhaeuser Real Estate Company (WRECO), our homebuilding and real estate development business. The Board indicated that it intended to consider a broad range of alternatives including, but not limited to, continuing to operate WRECO, or a merger, sale or spin-off of the business. On November 4, 2013, we announced that we had entered into a transaction agreement dated as of November 3, 2013 with TRI Pointe Homes, Inc. (TRI Pointe). Pursuant to the transaction agreement, WRECO will be divested through a Reverse Morris Trust transaction and ultimately become a wholly owned subsidiary of TRI Pointe. More information on this transaction can be found in
Note 4: WRECO Divestiture
in the
Notes to Consolidated Financial Statements
and on our Current Report on Form 8-K filed with the Securities and Exchange Commission on November 4, 2013.
COMPARING
2013
WITH
2012
Net Sales
Net sales increased
$205 million
— 19 percent — primarily due to an increase of $349 million in revenue from single-family home sales. Home closings increased 27 percent from 2,314 in 2012 to 2,939 in 2013. The average price of homes closed increased 10 percent from $376,000 in 2012 to $415,000 in 2013. On a same store basis, prices have increased across all markets. Our margins have remained steady across all markets.
This was partially offset by a decrease of $141 million in revenue from land and lot sales. 2012 included the sale of a 3,200-acre master planned community in Houston, Texas. The 2013 land and lot sales were primarily residential lot sales and an acreage sale related to a school site.
Net Contribution to Earnings
Net contribution to earnings decreased
$336 million
, primarily due to:
|
•
|
a $351 million increase in charges for impairments and restructuring including a $343 million impairment of Coyote Springs and $6 million restructuring costs related to Real Estate divestiture in 2013; and
|
|
•
|
a $60 million decrease in contributions to earnings from land and lot sales.
|
These decreases were partially offset by a $73 million increase in contribution for single-family operations due to higher volume and higher average sales prices of homes closed. Single-family gross margins improved to 22.0 percent in 2013 compared to 20.3 percent in 2012, reflecting changes in mix.
COMPARING
2012
WITH
2011
Net Sales
Net sales increased
$232 million
— 28 percent — primarily due to:
|
•
|
Single-family housing revenues increased $102 million. Home closings increased 21 percent to 2,314 in 2012 from 1,912 in 2011. The average price of homes closed declined 6 percent to $376,000 in 2012 from $402,000 in 2011.
|
|
•
|
Revenues from land and lot sales increased $126 million. 2012 included the sale of a 3,200 acre master planned community in Houston, Texas and the sale of commercial acreage and multi-family lots in southern California.
|
Net Contribution to Earnings
Net contribution to earnings increased
$47 million
— 81 percent — primarily due to:
|
•
|
a $54 million increase in contribution from land and lot sales; and
|
|
•
|
an $8 million decrease in charges for impairments and restructuring.
|
These improvements were partially offset by the following:
|
•
|
a $7 million increase in selling expenses, primarily due to volume related increases in sales and marketing costs; and
|
|
•
|
a $7 million decrease in income from loss reserves for adjustments for settled matters.
|
WEYERHAEUSER COMPANY >
2013 ANNUAL REPORT AND FORM 10-K
42
Net contribution from single-family housing was comparable year-over-year. Improvements from the higher volume of closings was offset by the decrease in the average price of homes closed and lower single-family gross margins. Average single-family gross margins were 20.7 percent in 2012 compared to 23.3 percent in 2011.
UNALLOCATED ITEMS
Unallocated Items are gains or charges not related to or allocated to an individual operating segment. They include a portion of items such as: share-based compensation, pension and postretirement costs, foreign exchange transaction gains and losses associated with financing, and the elimination of intersegment profit in inventory and the LIFO reserve.
Net Contribution to Earnings for Unallocated Items
|
DOLLAR AMOUNTS IN MILLIONS
|
|||||||||||||||
|
|
|
|
|
AMOUNT OF CHANGE
|
|||||||||||
|
|
2013
|
|
2012
|
|
2011
|
|
2013
vs. 2012 |
|
2012
vs. 2011 |
|
|||||
|
Unallocated corporate function expenses
|
$
|
(15
|
)
|
$
|
(22
|
)
|
$
|
(44
|
)
|
$
|
7
|
|
$
|
22
|
|
|
Unallocated share-based compensation
|
(8
|
)
|
(16
|
)
|
(5
|
)
|
8
|
|
(11
|
)
|
|||||
|
Unallocated pension and postretirement costs
|
(40
|
)
|
(29
|
)
|
(26
|
)
|
(11
|
)
|
(3
|
)
|
|||||
|
Foreign exchange gains (losses)
|
(7
|
)
|
7
|
|
(5
|
)
|
(14
|
)
|
12
|
|
|||||
|
Elimination of intersegment profit in inventory and LIFO
|
15
|
|
(16
|
)
|
(25
|
)
|
31
|
|
9
|
|
|||||
|
Other
|
(67
|
)
|
56
|
|
(45
|
)
|
(123
|
)
|
101
|
|
|||||
|
Operating income (loss)
|
(122
|
)
|
(20
|
)
|
(150
|
)
|
(102
|
)
|
130
|
|
|||||
|
Interest income and other
|
47
|
|
38
|
|
33
|
|
9
|
|
5
|
|
|||||
|
Net contribution to earnings from continuing operations
|
(75
|
)
|
18
|
|
(117
|
)
|
(93
|
)
|
135
|
|
|||||
|
Net contribution to earnings from discontinued operations
|
—
|
|
—
|
|
45
|
|
—
|
|
(45
|
)
|
|||||
|
Net contribution to earnings
|
$
|
(75
|
)
|
$
|
18
|
|
$
|
(72
|
)
|
$
|
(93
|
)
|
$
|
90
|
|
Interest income and other Unallocated Items in 2013 included a $10 million pretax gain for the sale of part of our investment in Liaison Technologies Inc. See
Note 9: Equity Affiliates
in the
Notes to Consolidated Financial Statements
for more information.
Other Unallocated Items in 2012 included a gain of $103 million related to a postretirement plan amendment. See
Note 10: Pension and Other Postretirement Benefit Plans
in the
Notes to Consolidated Financial Statements
for more information.
INTEREST EXPENSE
Our net interest expense incurred for the last three years was:
|
•
|
$371 million
in
2013
,
|
|
•
|
$348 million
in
2012
and
|
|
•
|
$384 million
in
2011
.
|
Increases (reductions) in our amount of outstanding debt were:
|
•
|
$600 million
in
2013
,
|
|
•
|
$(187) million in
2012
and
|
|
•
|
$(583) million in
2011
.
|
In connection with repayments, included in our net interest expense, we recognized the following pretax losses on early extinguishment of debt:
|
•
|
$25 million
in
2013
and
|
|
•
|
$26 million
in
2011
.
|
Interest expense in 2013 includes $11 million in fees related to a bridge loan we did not use in the acquisition of Longview Timber that was expensed. Excluding this item and loss on early extinguishment of debt, interest expense decreased due to lower average interest rate on remaining debt.
INCOME TAXES
Our provision (benefit) for income taxes for our continuing operations over the last three years was:
|
•
|
$(129) million
in
2013
,
|
|
•
|
$55 million
in
2012
and
|
|
•
|
$(62) million in
2011
.
|
During 2013, we recorded the following tax benefits or charges:
|
•
|
a $193 million tax benefit related to unrecognized tax benefits and
|
|
•
|
a $21 million tax charge related to the repatriation of Canadian earnings.
|
WEYERHAEUSER COMPANY >
2013 ANNUAL REPORT AND FORM 10-K
43
During 2012, we recorded the following tax benefits or charges:
|
•
|
a $36 million tax charge related to a previously announced postretirement plan amendment and
|
|
•
|
a $12 million tax benefit related to income tax settlements.
|
During 2011, we recorded the following tax benefits or charges:
|
•
|
a $76 million tax benefit related to foreign tax credits associated with the repatriation of Canadian earnings,
|
|
•
|
a $57 million tax charge resulting from the sale of non-strategic timberlands and
|
|
•
|
a $10 million tax benefit due to the early extinguishment of debt.
|
As a REIT, we generally are not subject to corporate level tax on income of the REIT that is distributed to shareholders. We will, however, be subject to corporate taxes on built-in-gains (the excess of fair market value over tax basis at January 1, 2010) on sales of real property (other than standing timber) held by the REIT during the first 10 years following the REIT conversion. We also will continue to be required to pay federal corporate income taxes on earnings of our TRS, which principally includes our manufacturing businesses, our real estate development business and the portion of our timberlands segment income included in the TRS.
The table below summarizes the historical tax characteristics of distributions to shareholders for the years ended December 31:
|
AMOUNTS PER SHARE
|
|||||||||
|
|
2013
|
|
2012
|
|
2011
|
|
|||
|
Capital gain dividend
|
$
|
0.81
|
|
$
|
0.62
|
|
$
|
0.60
|
|
|
Non-taxable return of capital
|
—
|
|
—
|
|
—
|
|
|||
|
Total distributions
|
$
|
0.81
|
|
$
|
0.62
|
|
$
|
0.60
|
|
|
LIQUIDITY AND CAPITAL RESOURCES
|
We are committed to maintaining a sound, conservative capital structure that enables us to:
|
•
|
protect the interests of our shareholders and lenders and
|
|
•
|
have access at all times to major financial markets.
|
CASH FROM OPERATIONS
Cash from operations includes:
|
•
|
cash received from customers;
|
|
•
|
cash paid to employees, suppliers and others;
|
|
•
|
cash paid for interest on our debt; and
|
|
•
|
cash paid or received for taxes.
|
Consolidated net cash provided by our operations was:
|
•
|
$1,004 million
in
2013
,
|
|
•
|
$581 million
in
2012
and
|
|
•
|
$291 million
in
2011
.
|
COMPARING
2013
WITH
2012
Net cash provided by operations increased $423 million in
2013
as compared with
2012
, primarily due to a $1,476 million increase in cash received from customers partially offset by a $1,031 million increase in cash paid to employees, suppliers and others as sales and production increased in our Wood Products, Timberlands and Real Estate segments. Receivables, primarily in our Wood Products segment, increased significantly in 2013 compared to 2012 as sales increased.
COMPARING
2012
WITH
2011
Net cash provided by operations increased $290 million in
2012
as compared with
2011
:
|
•
|
Cash we received from customers in our Wood Products and Real Estate segments increased $931 million, primarily due to increased sales and cash received of $120 million for land and lot sales.
|
|
•
|
Cash paid for interest decreased $69 million, primarily due to the early retirement of $518 million of debt in 2011. We paid interest of $351 million in 2012 compared to $420 million in 2011.
|
|
•
|
Net cash inflows related to income taxes increased $41 million. We received income tax refunds of $13 million in 2012 and paid $28 million in 2011.
|
Partially offsetting these increases were:
|
•
|
Cash paid to employees, suppliers and others increased $638 million in our Wood Products and Real Estate segments due to increased production.
|
|
•
|
Cash we received from customers in our Cellulose Fibers segment decreased $129 million due to decreased sales.
|
WEYERHAEUSER COMPANY >
2013 ANNUAL REPORT AND FORM 10-K
44
Pension Contributions and Benefit Payments Made and Expected
During
2013
, we:
|
•
|
contributed
$79 million
for our Canadian registered plan in accordance with minimum funding rules and respective provincial regulations;
|
|
•
|
contributed to or made benefit payments for our Canadian nonregistered pension plans of $3 million;
|
|
•
|
made benefit payments of
$21 million
for our U.S. nonqualified pension plans; and
|
|
•
|
made benefit payments of
$34 million
for our U.S. and Canadian other postretirement plans.
|
There was no minimum required contribution for our U.S. qualified plan for
2013
, nor were any contributions made to this plan in 2013.
During
2014
, based on estimated year-end assets and projections of plan liabilities, we expect to:
|
•
|
be required to contribute approximately
$53 million
for our Canadian registered plan;
|
|
•
|
be required to contribute or make benefit payments for our Canadian nonregistered plans of
$3 million
;
|
|
•
|
make benefit payments of
$20 million
for our U.S. nonqualified pension plans; and
|
|
•
|
make benefit payments of
$35 million
for our U.S. and Canadian other postretirement plans.
|
We do not anticipate a contribution being required to our U.S. qualified pension plan for
2014
.
INVESTING IN OUR BUSINESS
Cash from investing activities includes:
|
•
|
acquisitions of property, equipment, timberlands and reforestation;
|
|
•
|
investments in or distribution from equity affiliates;
|
|
•
|
proceeds from sale of assets and operations; and
|
|
•
|
purchases and redemptions of short-term investments.
|
Consolidated net cash provided by (used in) investing activities was:
|
•
|
$(1,829) million
in
2013
,
|
|
•
|
$(192) million
in
2012
and
|
|
•
|
$122 million
in
2011
.
|
Longview Timber Purchase
On
July 23, 2013
, we purchased
100 percent
of the equity interests in Longview Timber LLC (Longview Timber) for
$1.58 billion
cash and assumed debt of
$1.07 billion
, for an aggregate purchase price of
$2.65 billion
. More information can be found in
Note 3: Longview Timber Purchase
in the
Notes to Consolidated Financial Statements
and the "Cash from financing activities" section below.
Three-Year Summary of Capital Spending by Business Segment
|
DOLLAR AMOUNTS IN MILLIONS
|
|||||||||
|
|
2013
|
|
2012
|
|
2011
|
|
|||
|
Timberlands
|
$
|
73
|
|
$
|
60
|
|
$
|
53
|
|
|
Wood Products
|
113
|
|
56
|
|
35
|
|
|||
|
Cellulose Fibers
|
92
|
|
160
|
|
146
|
|
|||
|
Real Estate
|
10
|
|
4
|
|
3
|
|
|||
|
Unallocated Items
|
5
|
|
5
|
|
1
|
|
|||
|
Discontinued operations
|
—
|
|
—
|
|
3
|
|
|||
|
Total
|
$
|
293
|
|
$
|
285
|
|
$
|
241
|
|
We anticipate that our net capital expenditures for
2014
— excluding acquisitions — to approximate $390 million. However, that amount could change due to:
|
•
|
future economic conditions,
|
|
•
|
environmental regulations,
|
|
•
|
weather and
|
|
•
|
timing of equipment purchases.
|
VARIABLE INTEREST ENTITIES
In 2013, we repaid a $162 million note and received $184 million related to one of our timber monetization special-purpose entities (SPEs) undertaken in 2003. Net proceeds were $22 million. More information about these entities, which were formed in connection with the sale of nonstrategic timberlands in 2003, can be found in
Note 11: Variable Interest Entities
in the
Notes to Consolidated Financial Statements
and our annual report on Form 10-K for 2003.
EQUITY AFFILIATES
In 2013, we sold part of our investment in Liaison Technologies Inc. and received $10 million in cash, which is recorded in "Other" in the "Cash flows from investing activities" in our
Consolidated Statement of Cash Flows
. See
Note 9: Equity Affiliates
in the
Notes to Consolidated Financial Statements
for more information
.
WEYERHAEUSER COMPANY >
2013 ANNUAL REPORT AND FORM 10-K
45
PROCEEDS FROM THE SALE OF NONSTRATEGIC ASSETS
Proceeds received from the sale of nonstrategic assets over the last three years were:
|
•
|
$20 million
in
2013
for the sale of various non-strategic assets.
|
|
•
|
$80 million
in
2012
for the sale of various non-strategic assets.
|
|
•
|
$362 million
in
2011
including:
|
– $192 million for the sale of 82,000 acres of non-strategic timberlands in southwestern Washington;
– $84 million for the sale of our hardwoods operations (we expect to receive an additional $25 million plus interest in 2016 from a note receivable);
– $58 million for the sale of our Westwood Shipping Lines operations; and
– $28 million for the sale of other non-strategic assets.
Discontinued operations are discussed in
Note 5: Discontinued Operations
in the
Notes to Consolidated Financial Statements
.
FINANCING
Cash from financing activities includes:
|
•
|
issuances and payments of long-term debt,
|
|
•
|
borrowings and payments under revolving lines of credit,
|
|
•
|
changes in book overdrafts,
|
|
•
|
proceeds from stock offerings and option exercises and
|
|
•
|
payments of cash dividends and repurchasing stock.
|
Consolidated net cash provided by (used in) financing activities was:
|
•
|
$762 million
in
2013
,
|
|
•
|
$(444) million
in
2012
and
|
|
•
|
$(927) million
in
2011
.
|
LONGVIEW TIMBER PURCHASE
In order to finance our purchase of Longview Timber, see
Note 3: Longview Timber Purchase
in the
Notes to Consolidated Financial Statements
for more information, we issued the following:
|
•
|
29 million
common shares on
June 24, 2013
, at the price of
$27.75
per share for net proceeds of
$781 million
;
|
|
•
|
4.4 million
common shares on
July 8, 2013
, at the price of
$27.75
per share for net proceeds of
$116 million
, in connection with the exercise of an overallotment option; and
|
|
•
|
13.8 million
of our 6.375 percent Mandatory Convertible Preference Shares, Series A, par value
$1.00
and liquidation preference of
$50.00
per share on
June 24, 2013
, for net proceeds of
$669 million
.
|
We paid
$11 million
in fees related to a bridge loan in 2013, which is recorded in "Other" in the "Cash flows from financing activities" in our
Consolidated Statement of Cash Flows
. As of the close of the Longview Timber purchase, we did not use the loan and these fees were expensed in 2013.
In order to repay the debt that we assumed in the acquisition of Longview Timber, in 2013 we issued $500 million of 4.625 percent notes due September 15, 2023. The net proceeds after deducting the discount, underwriting fees and issuance costs were $494 million. We also entered into a $550 million 7-year senior unsecured term loan credit facility maturing in September 2020 and borrowed $550 million. Borrowings are at LIBOR plus a spread or at other interest rates mutually agreed upon between the borrower and the lending banks.
On October 15, 2013, we repaid the $1,118 million carrying value of the debt that we assumed in the acquisition of Longview Timber and related fees, expenses and premiums using the proceeds from the notes issued and the borrowings from our term loan credit facility borrowed in 2013. A pretax charge of $25 million was included in our net interest expense in 2013, for early retirement premiums and other miscellaneous charges in connection with the early extinguishment of debt. See
Note 3: Longview Timber Purchase
in the
Notes to Consolidated Financial Statements
for more information.
DEBT
Our consolidated long-term debt was:
|
•
|
$4.9 billion
as of
December 31, 2013
;
|
|
•
|
$4.3 billion
as of
December 31, 2012
; and
|
|
•
|
$4.5 billion
as of
December 31, 2011
.
|
Long-term debt proceeds were $1,050 million in
2013
. There were no proceeds in
2012
or
2011
.
Long-term debt we retired according to its scheduled maturity was:
|
•
|
$409 million in
2013
,
|
|
•
|
$187 million in
2012
and
|
|
•
|
$33 million in
2011
.
|
Long-term debt we retired prior to its scheduled maturity was:
|
•
|
$1,158 million in
2013
and
|
|
•
|
$550 million in
2011
.
|
WEYERHAEUSER COMPANY >
2013 ANNUAL REPORT AND FORM 10-K
46
Losses recognized on early extinguishment of debt and included in our net interest expense were:
|
•
|
$25 million
in
2013
and
|
|
•
|
$26 million
in
2011
.
|
There are no debt maturities in the next twelve months.
See
Note 15: Long-Term Debt
in the
Notes to Consolidated Financial Statements
for more information.
REVOLVING CREDIT FACILITIES
During September 2013, Weyerhaeuser Company and Weyerhaeuser Real Estate Company (WRECO) entered into a new $1 billion 5-year senior unsecured revolving credit facility that expires in September 2018. This replaces a $1 billion revolving credit facility that was set to expire June 2015. WRECO can borrow up to $50 million under this facility. Neither of the entities is a guarantor of the borrowing of the other under this credit facility.
There were no net proceeds from the issuance of debt or from borrowings (repayments) under our available credit facility in
2013
,
2012
or
2011
.
Debt covenants:
As of
December 31, 2013
, Weyerhaeuser Company and WRECO:
|
•
|
had no borrowings outstanding under our credit facility and
|
|
•
|
were in compliance with the credit facility covenants.
|
Weyerhaeuser Company Covenants:
Key covenants related to Weyerhaeuser Company include the requirement to maintain:
|
•
|
a minimum defined net worth of $3.0 billion;
|
|
•
|
a defined debt-to-total-capital ratio of 65 percent or less; and
|
|
•
|
ownership of, or long-term leases on, no less than four million acres of timberlands.
|
Weyerhaeuser Company’s defined net worth is comprised of:
|
•
|
total Weyerhaeuser shareholders’ interest,
|
|
•
|
excluding accumulated comprehensive income (loss) related to pension and postretirement benefits,
|
|
•
|
minus Weyerhaeuser Company’s investment in subsidiaries in our Real Estate segment or other unrestricted subsidiaries.
|
Total Weyerhaeuser Company capitalization is comprised of:
|
•
|
total Weyerhaeuser Company (excluding WRECO) debt
|
|
•
|
plus total defined net worth.
|
As of
December 31, 2013
, Weyerhaeuser Company had:
|
•
|
a defined net worth of $7.0 billion and
|
|
•
|
a defined debt-to-total-capital ratio of 41.3 percent.
|
Weyerhaeuser Real Estate Company Covenants:
Key covenants related to WRECO revolving credit facility include the requirement to maintain:
|
•
|
a minimum capital base of $100 million, and
|
|
•
|
Weyerhaeuser Company or a subsidiary must own at least 79 percent of WRECO.
|
WRECO’s defined net worth is:
|
•
|
total WRECO shareholders’ interest,
|
|
•
|
minus intangible assets,
|
|
•
|
minus WRECO’s investment in joint ventures and partnerships.
|
As of
December 31, 2013
, WRECO had a capital base of $758 million.
There are no other significant financial debt covenants related to our third party debt. See
Note 14: Lines of Credit
in the
Notes to Consolidated Financial Statements
for more information.
CREDIT RATINGS
On April 22, 2013, Moody's Investors Service upgraded our senior unsecured note rating to Baa3 from Ba1 and changed their outlook to stable.
OPTION EXERCISES
Our cash proceeds from the exercise of stock options were:
|
•
|
$162 million
in
2013
,
|
|
•
|
$112 million
in
2012
and
|
|
•
|
$38 million
in
2011
.
|
The increase in exercises of stock options is primarily due to the increase in our average stock price of $29.69, $23.14 and $20.15 in
2013
,
2012
and
2011
, respectively.
WEYERHAEUSER COMPANY >
2013 ANNUAL REPORT AND FORM 10-K
47
PAYING DIVIDENDS AND REPURCHASING STOCK
We paid cash dividends on commons shares of:
|
•
|
$458 million
in
2013
,
|
|
•
|
$334 million
in
2012
and
|
|
•
|
$323 million
in
2011
.
|
Changes in the amount of dividends we paid were primarily due to:
|
•
|
an increase in our quarterly dividend from 5 cents per share to 15 cents per share in February 2011;
|
|
•
|
an increase in our quarterly dividend from 15 cents per share to 17 cents per share in November 2012;
|
|
•
|
an increase in our quarterly dividend from 17 cents per share to 20 cents per share in April 2013; and
|
|
•
|
an increase in our quarterly dividend from 20 cents per share to 22 cents per share in August 2013.
|
We paid cash dividends on preference shares of
$23 million
in
2013
.
Our dividends declared on preference shares were:
|
•
|
85.88 cents per share in August 2013 and
|
|
•
|
79.69 cents per share in October 2013.
|
On February 13, 2014, our Board of Directors declared a dividend of 22 cents per share, payable on March 14, 2014, to shareholders of record at the close of business February 28, 2014. Additionally, our Board of Directors declared a dividend of 79.69 cents per share on our 6.375 percent Mandatory Convertible Preference Shares, Series A, payable on April 1, 2014, to shareholders of record at the close of business March 15, 2014.
During 2011, we repurchased
1,199,800
shares of common stock for
$20 million
under the 2008 stock repurchase program. On August 11, 2011, our Board of Directors terminated the 2008 stock repurchase program and approved the 2011 stock repurchase program under which we are authorized to repurchase up to
$250 million
of outstanding shares. During 2011, we repurchased
1,089,824
shares of common stock for
$17 million
under the 2011 program. As of
December 31, 2013
, we had remaining authorization of
$233 million
for future share repurchases.
OUR CONTRACTUAL OBLIGATIONS AND COMMERCIAL COMMITMENTS
More details about our contractual obligations and commercial commitments are in
Note 10: Pension and Other Postretirement Benefit Plans
,
Note 15: Long-Term Debt
,
Note 17: Legal Proceedings, Commitments and Contingencies
and
Note 22: Income Taxes
in the
Notes to Consolidated Financial Statements
.
Significant Contractual Obligations as of
December 31, 2013
|
DOLLAR AMOUNTS IN MILLIONS
|
|||||||||||||||
|
|
|
|
PAYMENTS DUE BY PERIOD
|
||||||||||||
|
|
TOTAL
|
|
LESS
THAN 1
YEAR
|
|
1–3
YEARS
|
|
3–5
YEARS
|
|
MORE
THAN 5
YEARS
|
|
|||||
|
Long-term debt obligations
|
$
|
4,896
|
|
$
|
—
|
|
$
|
—
|
|
$
|
343
|
|
$
|
4,553
|
|
|
Interest
(1)
|
4,021
|
|
320
|
|
640
|
|
619
|
|
2,442
|
|
|||||
|
Operating lease obligations
|
216
|
|
39
|
|
41
|
|
24
|
|
112
|
|
|||||
|
Purchase obligations
(2)
|
95
|
|
61
|
|
20
|
|
6
|
|
8
|
|
|||||
|
Employee-related obligations
(3)
|
567
|
|
206
|
|
54
|
|
41
|
|
90
|
|
|||||
|
Liabilities related to unrecognized tax benefits
(4)
|
30
|
|
—
|
|
—
|
|
—
|
|
—
|
|
|||||
|
Total
|
$
|
9,825
|
|
$
|
626
|
|
$
|
755
|
|
$
|
1,033
|
|
$
|
7,205
|
|
|
(1) Amounts presented for interest payments assume that all long-term debt obligations outstanding as of December 31, 2013 will remain outstanding until maturity, and interest rates on variable-rate debt in effect as of December 31, 2013 will remain in effect until maturity.
(2) Purchase obligations include agreements to purchase goods or services that are enforceable and legally binding on the company and that specify all significant terms, including: fixed or minimum quantities to be purchased; fixed, minimum or variable price provisions; and the approximate timing of the transaction. Purchase obligations exclude arrangements that the company can cancel without penalty.
(3) The timing of certain of these payments will be triggered by retirements or other events. When the timing of payment is uncertain, the amounts are included in the total column only. Minimum pension funding is required by established funding standards and estimates are not made beyond 2015. Estimated payments of contractually obligated postretirement benefits are not made beyond 2013.
(4) We have recognized total liabilities related to unrecognized tax benefits of $30 million as of December 31, 2013, including interest of $4 million. The timing of payments related to these obligations is uncertain; however, none of this amount is expected to be paid within the next year.
|
|||||||||||||||
WEYERHAEUSER COMPANY >
2013 ANNUAL REPORT AND FORM 10-K
48
|
OFF-BALANCE SHEET ARRANGEMENTS
|
Off-balance sheet arrangements have not had — and are not reasonably likely to have — a material effect on our current or future financial condition, results of operations or cash flows.
Note 11: Variable Interest Entities
and
Note 14: Lines of Credit
in the
Notes to Consolidated Financial Statements
contain our disclosures of:
|
•
|
surety bonds,
|
|
•
|
letters of credit and guarantees and
|
|
•
|
information regarding variable interest entities.
|
|
ENVIRONMENTAL MATTERS, LEGAL PROCEEDINGS AND OTHER CONTINGENCIES
|
See
Note 17: Legal Proceedings, Commitments and Contingencies
in the
Notes to Consolidated Financial Statements
.
|
ACCOUNTING MATTERS
|
CRITICAL ACCOUNTING POLICIES
Our critical accounting policies involve a higher degree of judgment and estimates. They also have a high degree of complexity.
In accounting, we base our judgments and estimates on:
|
•
|
historical experience and
|
|
•
|
assumptions we believe are appropriate and reasonable under current circumstances.
|
Actual results, however, may differ from the estimated amounts we have recorded.
Our most critical accounting policies relate to our:
|
•
|
pension and postretirement benefit plans;
|
|
•
|
potential impairments of long-lived assets; and
|
|
•
|
legal, environmental and product liability reserves.
|
Details about our other significant accounting policies — what we use and how we estimate — are in
Note 1: Summary of Significant Accounting Policies
in the
Notes to Consolidated Financial Statements
.
PENSION AND POSTRETIREMENT BENEFIT PLANS
We sponsor several pension and postretirement benefit plans for our employees. Key assumptions we use in accounting for the plans include our:
|
•
|
expected long-term rate of return,
|
|
•
|
discount rates,
|
|
•
|
anticipated trends in health care costs,
|
|
•
|
assumed increases in salaries and
|
|
•
|
mortality rates.
|
At the end of every year, we review our assumptions with external advisers and make adjustments as appropriate. Actual experience that differs from our assumptions or any changes in our assumptions could have a significant effect on our financial position, results of operations and cash flows.
Other factors that affect our accounting for the plans include:
|
•
|
actual pension fund performance,
|
|
•
|
level of lump sum distributions,
|
|
•
|
plan changes,
|
|
•
|
changes in plan participation or coverage and
|
|
•
|
portfolio changes and restructuring.
|
This section provides more information about our:
|
•
|
expected long-term rate of return and
|
|
•
|
discount rates.
|
Expected Long-Term Rate of Return
Plan assets are assets of the pension plan trusts that fund the benefits provided under the pension plans. The expected long-term rate of return is our estimate of the long-term rate of return that our plan assets will earn. Our expected long-term rate of return is important in determining the net income or expense we recognize for our plans.
Over the 29 years it has been in place, our U.S. pension trust investment strategy has achieved a
14.8 percent
net compound annual return rate.
After considering available information at the end of
2013
, we continue to assume an expected long-term rate of return of 9.0 percent. Factors we considered include:
|
•
|
the net compounded annual return of 10.0 percent achieved by our U.S. pension trust investment strategy the past 10 years and
|
|
•
|
current and expected valuation levels in the global equity and credit markets.
|
WEYERHAEUSER COMPANY >
2013 ANNUAL REPORT AND FORM 10-K
49
Our expected long-term rate of return is important in determining the net income or expense we recognize for our plans. Every 0.5 percent decrease in our expected long-term rate of return would increase expense or reduce a credit by approximately:
|
•
|
$22 million for our U.S. qualified pension plans and
|
|
•
|
$4 million for our Canadian registered pension plans.
|
Likewise, every 0.5 percent increase in our expected long-term rate of return would decrease expense or increase a credit by those same amounts.
The actual return on plan assets in any given year may vary from our expected long-term rate of return. Actual returns on plan assets affect the funded status of the plans. Differences between actual returns on plan assets and the expected long-term rate of return are reflected as adjustments to cumulative other comprehensive income (loss), a component of total equity.
Discount Rates
Our discount rates as of
December 31, 2013
, are:
|
•
|
4.9 percent
for our U.S. pension plans — compared with
3.7 percent
at
December 31, 2012
;
|
|
•
|
4.0 percent
for our U.S. postretirement plans — compared with
3.0 percent
at
December 31, 2012
;
|
|
•
|
4.7 percent
for our Canadian pension plans — compared with
4.1 percent
at
December 31, 2012
; and
|
|
•
|
4.6 percent
for our Canadian postretirement plans — compared with
4.0 percent
at
December 31, 2012
.
|
We review our discount rates annually and revise them as needed. The discount rates are selected at the measurement date by matching current spot rates of high-quality corporate bonds with maturities similar to the timing of expected cash outflows for benefits.
Pension and postretirement benefit expenses for
2014
will be based on the
4.9 percent
and
4.0 percent
assumed discount rates for U.S. plans and
4.7 percent
and
4.6 percent
assumed discount rates for the Canadian plans.
Our discount rates are important in determining the cost of our plans. A 0.5 percent decrease in our discount rate would increase expense or reduce a credit by approximately:
|
•
|
$21 million for our U.S. qualified pension plans and
|
|
•
|
$4 million for our Canadian registered pension plans.
|
LONG-LIVED ASSETS
We review the carrying value of our long-lived assets whenever events or changes in circumstances indicate that the carrying value of the assets may not be recoverable through future operations. The carrying value is the amount assigned to long-lived assets in our financial statements.
An impairment occurs when the carrying value of long-lived assets will not be recovered from future cash flows and is more than fair market value. Fair market value is the estimated amount we would receive if we were to sell the assets.
In determining fair market value and whether impairment has occurred, we are required to estimate:
|
•
|
future cash flows,
|
|
•
|
residual values and
|
|
•
|
fair values of the assets.
|
Key assumptions we use in developing the estimates include:
|
•
|
probability of alternative outcomes,
|
|
•
|
product pricing,
|
|
•
|
raw material costs,
|
|
•
|
product sales and
|
|
•
|
discount rate.
|
IMPAIRMENT OF LONG-LIVED ASSETS: REAL ESTATE
We review homebuilding long-lived assets for impairment whenever events or changes in circumstances indicate that the carrying amount of the assets may not be recoverable.
Real Estate In Process of Development and Land Being Processed for Development
Real estate in process of development and land being processed for development includes subdivisions and master planned communities (MPCs). MPCs typically include several product segments such as residential, active adult, retail and commercial. We evaluate impairment at the subdivision or MPC product segment level. Factors that are considered when evaluating a subdivision or MPC product segment for impairment include:
|
•
|
gross margins and selling costs on homes closed in recent months;
|
|
•
|
projected gross margins and selling costs based on our operating budgets;
|
|
•
|
competitor pricing and incentives in the same or nearby communities; and
|
|
•
|
trends in average selling prices, discounts, incentives, sales velocity and cancellations.
|
We update the undiscounted cash flow forecast for each subdivision and MPC product segment that may be impaired. The undiscounted cash flow forecasts are affected by community-specific factors that include:
|
•
|
estimates and timing of future revenues;
|
|
•
|
estimates and timing of future land development, materials, labor and contractor costs;
|
|
•
|
community location and desirability, including availability of schools, retail, mass transit and other services;
|
|
•
|
local economic and demographic trends regarding employment, new jobs and taxes;
|
|
•
|
competitor presence, product types, future competition, pricing, incentives and discounts; and
|
|
•
|
land availability, number of lots we own or control, entitlement restrictions and alternative uses.
|
WEYERHAEUSER COMPANY >
2013 ANNUAL REPORT AND FORM 10-K
50
The carrying amount of each subdivision and MPC product segment is written down to fair value when the forecasted cash flows are less than the carrying amount of a subdivision or MPC product segment. An impairment charge for a subdivision or MPC product segment is allocated to each lot in the community in the same manner as land and development costs are allocated to each lot.
Real Estate for Sale
Real estate for sale includes homes that have been completed and land that we intend to sell. We regularly sell land or lots that do not fit our value proposition or development plans.
The carrying amount of real estate for sale is reduced to fair value less estimated costs to sell if the forecasted net proceeds are less than the carrying amount. The fair value analysis is affected by local market economic conditions, demographic factors and competitor actions, and is inherently uncertain. Actual net proceeds can differ from the estimates. The carrying amount of real estate for sale is evaluated quarterly.
Market Approach
We use the market approach to determine fair value of real estate assets when information for comparable assets is available. This approach is commonly used for completed inventory and individual assets for sale. We typically use:
|
•
|
sales prices for comparable assets,
|
|
•
|
market studies,
|
|
•
|
appraisals or
|
|
•
|
legitimate offers.
|
Income Approach
We generally use the income approach to determine fair value of real estate for our inactive projects and assets in process of development. The income approach uses valuation techniques to convert future amounts (for example, cash flows or earnings) to a single present amount (discounted). The fair value measurement is based on the value indicated by current market expectations regarding those future estimated cash inflows and outflows. We use present value techniques based on discounting the estimated cash flows at a rate commensurate with the inherent risks associated with the assets and related estimated cash flow streams. The income approach relies on management judgment regarding the various inputs to the undiscounted cash flow forecasts.
CONTINGENT LIABILITIES
We are subject to lawsuits, investigations and other claims related to environmental, product and other matters, and are required to assess the likelihood of any adverse judgments or outcomes to these matters, as well as potential ranges of probable losses.
We record contingent liabilities when:
|
•
|
it becomes probable that we will have to make payments and
|
|
•
|
the amount of loss can be reasonably estimated.
|
Assessing probability of loss and estimating probable losses requires analysis of multiple factors, including:
|
•
|
historical experience,
|
|
•
|
judgments about the potential actions of third party claimants and courts and
|
|
•
|
r
ecommendations of legal counsel.
|
In addition to contingent liabilities recorded for probable losses, we disclose contingent liabilities when there is a reasonable possibility that an ultimate loss may occur.
While we do our best in developing our projections, recorded contingent liabilities are based on the best information available and actual losses in any future period are inherently uncertain. If estimated probable future losses or actual losses exceed our recorded liability for such claims, we would record additional charges in other (income) expense, net. These exposures and proceedings can be significant and the ultimate negative outcomes could be material to our operating results or cash flow in any given quarter or year. See
Note 15: Legal Proceedings, Commitments and Contingencies
in the
Notes to Consolidated Financial Statements
for more information.
PROSPECTIVE ACCOUNTING PRONOUNCEMENTS
Currently there are no significant prospective accounting pronouncements that are expected to have a material impact on us.
WEYERHAEUSER COMPANY >
2013 ANNUAL REPORT AND FORM 10-K
51
QUANTITATIVE AND QUALITATIVE DISCLOSURES ABOUT MARKET RISK
|
|
The following summary of our long-term debt obligations includes:
|
•
|
scheduled principal repayments for the next five years and after,
|
|
•
|
weighted average interest rates for debt maturing in each of the next five years and after and
|
|
•
|
estimated fair values of outstanding obligations.
|
We estimate the fair value of long-term debt based on quoted market prices we received for the same types and issues of our debt or on the discounted value of the future cash flows using market yields for the same type and comparable issues of debt. Changes in market rates of interest affect the fair value of our fixed-rate debt.
SUMMARY OF LONG-TERM DEBT OBLIGATIONS AS OF
DECEMBER 31, 2013
|
DOLLAR AMOUNTS IN MILLIONS
|
||||||||||||||||||||||||
|
|
2014
|
|
2015
|
|
2016
|
|
2017
|
|
2018
|
|
THEREAFTER
|
|
TOTAL
|
|
FAIR VALUE
|
|
||||||||
|
Fixed-rate debt
|
$
|
—
|
|
$
|
—
|
|
$
|
—
|
|
$
|
281
|
|
$
|
62
|
|
$
|
4,003
|
|
$
|
4,346
|
|
$
|
5,133
|
|
|
Average interest rate
|
—
|
%
|
—
|
%
|
—
|
%
|
6.95
|
%
|
7.00
|
%
|
7.13
|
%
|
7.12
|
%
|
N/A
|
|
||||||||
|
Variable-rate debt
|
$
|
—
|
|
$
|
—
|
|
$
|
—
|
|
$
|
—
|
|
$
|
—
|
|
$
|
550
|
|
$
|
550
|
|
$
|
550
|
|
|
Average interest rate
|
—
|
%
|
—
|
%
|
—
|
%
|
—
|
%
|
—
|
%
|
1.99
|
%
|
1.99
|
%
|
N/A
|
|
||||||||
WEYERHAEUSER COMPANY >
2013 ANNUAL REPORT AND FORM 10-K
52
FINANCIAL STATEMENTS AND SUPPLEMENTARY DATA
|
REPORT OF INDEPENDENT REGISTERED PUBLIC ACCOUNTING FIRM
|
The Board of Directors and Shareholders
Weyerhaeuser Company:
We have audited the accompanying consolidated balance sheets of Weyerhaeuser Company and subsidiaries as of December 31, 2013 and 2012, and the related consolidated statements of operations, comprehensive income, cash flows, and changes in equity for each of the years in the three-year period ended December 31, 2013. These consolidated financial statements are the responsibility of the Company’s management. Our responsibility is to express an opinion on these consolidated financial statements based on our audits.
We conducted our audits in accordance with the standards of the Public Company Accounting Oversight Board (United States). Those standards require that we plan and perform the audit to obtain reasonable assurance about whether the financial statements are free of material misstatement. An audit includes examining, on a test basis, evidence supporting the amounts and disclosures in the financial statements. An audit also includes assessing the accounting principles used and significant estimates made by management, as well as evaluating the overall financial statement presentation. We believe that our audits provide a reasonable basis for our opinion.
In our opinion, the consolidated financial statements referred to above present fairly, in all material respects, the financial position of Weyerhaeuser Company and subsidiaries as of December 31, 2013 and 2012, and the results of their operations and their cash flows for each of the years in the three-year period ended December 31, 2013, in conformity with U.S. generally accepted accounting principles.
We also have audited, in accordance with the standards of the Public Company Accounting Oversight Board (United States), Weyerhaeuser Company’s internal control over financial reporting as of December 31, 2013, based on criteria established in
Internal Control — Integrated Framework (1992)
issued by the Committee of Sponsoring Organizations of the Treadway Commission (COSO), and our report dated February 18, 2014 expressed an unqualified opinion on the effectiveness of the Company’s internal control over financial reporting.
/s/ KPMG LLP
Seattle, Washington
February 18, 2014
WEYERHAEUSER COMPANY >
2013 ANNUAL REPORT AND FORM 10-K
53
|
|
FOR THE THREE-YEAR PERIOD ENDED
DECEMBER 31, 2013
|
DOLLAR AMOUNTS IN MILLIONS, EXCEPT PER-SHARE FIGURES
|
|||||||||
|
|
2013
|
|
2012
|
|
2011
|
|
|||
|
Net sales
|
$
|
8,529
|
|
$
|
7,059
|
|
$
|
6,216
|
|
|
Costs of products sold
|
6,709
|
|
5,810
|
|
5,120
|
|
|||
|
Gross margin
|
1,820
|
|
1,249
|
|
1,096
|
|
|||
|
Selling expenses
|
220
|
|
194
|
|
178
|
|
|||
|
General and administrative expenses
|
455
|
|
436
|
|
423
|
|
|||
|
Research and development expenses
|
33
|
|
32
|
|
30
|
|
|||
|
Charges for restructuring, closures and impairments
(Note 20)
|
390
|
|
32
|
|
83
|
|
|||
|
Other operating income, net
(Note 21)
|
(25
|
)
|
(180
|
)
|
(212
|
)
|
|||
|
Operating income
|
747
|
|
735
|
|
594
|
|
|||
|
Interest income and other
|
58
|
|
52
|
|
47
|
|
|||
|
Interest expense, net of capitalized interest
|
(371
|
)
|
(348
|
)
|
(384
|
)
|
|||
|
Earnings from continuing operations before income taxes
|
434
|
|
439
|
|
257
|
|
|||
|
Income taxes
(Note 22)
|
129
|
|
(55
|
)
|
62
|
|
|||
|
Earnings from continuing operations
|
563
|
|
384
|
|
319
|
|
|||
|
Earnings from discontinued operations, net of income taxes
(Note 5)
|
—
|
|
—
|
|
12
|
|
|||
|
Net earnings
|
563
|
|
384
|
|
331
|
|
|||
|
Net loss attributable to noncontrolling interests
|
—
|
|
1
|
|
—
|
|
|||
|
Net earnings attributable to Weyerhaeuser
|
563
|
|
385
|
|
331
|
|
|||
|
Dividends on preference shares
|
(23
|
)
|
—
|
|
—
|
|
|||
|
Net earnings attributable to Weyerhaeuser common shareholders
|
$
|
540
|
|
$
|
385
|
|
$
|
331
|
|
|
Basic earnings per share attributable to Weyerhaeuser common shareholders
(Note 6)
:
|
|
|
|||||||
|
Continuing operations
|
$
|
0.95
|
|
$
|
0.71
|
|
$
|
0.60
|
|
|
Discontinued operations
|
—
|
|
—
|
|
0.02
|
|
|||
|
Net earnings per share
|
$
|
0.95
|
|
$
|
0.71
|
|
$
|
0.62
|
|
|
Diluted earnings per share attributable to Weyerhaeuser common shareholders
(Note 6)
:
|
|
|
|
||||||
|
Continuing operations
|
$
|
0.95
|
|
$
|
0.71
|
|
$
|
0.59
|
|
|
Discontinued operations
|
—
|
|
—
|
|
0.02
|
|
|||
|
Net earnings per share
|
$
|
0.95
|
|
$
|
0.71
|
|
$
|
0.61
|
|
|
Dividends paid per common share
|
$
|
0.81
|
|
$
|
0.62
|
|
$
|
0.60
|
|
|
Weighted average shares outstanding (in thousands)
(Note 6)
:
|
|
|
|
||||||
|
Basic
|
566,329
|
|
539,140
|
|
537,534
|
|
|||
|
Diluted
|
571,239
|
|
542,310
|
|
539,879
|
|
|||
See accompanying
Notes to Consolidated Financial Statements
.
WEYERHAEUSER COMPANY >
2013 ANNUAL REPORT AND FORM 10-K
54
|
CONSOLIDATED STATEMENT OF COMPREHENSIVE INCOME
|
FOR THE THREE-YEAR PERIOD ENDED
DECEMBER 31, 2013
|
DOLLAR AMOUNTS IN MILLIONS
|
|||||||||
|
|
2013
|
|
2012
|
|
2011
|
|
|||
|
Comprehensive income (loss):
|
|
|
|
||||||
|
Consolidated net earnings
|
$
|
563
|
|
$
|
384
|
|
$
|
331
|
|
|
Other comprehensive income (loss):
|
|
|
|
||||||
|
Foreign currency translation adjustments
|
(59
|
)
|
2
|
|
(8
|
)
|
|||
|
Changes in unamortized net pension and other postretirement benefit gain (loss), net of tax expense (benefit) of $480 in 2013, ($191) in 2012, and ($243) in 2011
|
902
|
|
(258
|
)
|
(463
|
)
|
|||
|
Changes in unamortized prior service credit (cost), net of tax expense (benefit) of $23 in 2013, ($51) in 2012, and $49 in 2011
|
27
|
|
(123
|
)
|
82
|
|
|||
|
Unrealized gains on available-for-sale securities
|
2
|
|
—
|
|
1
|
|
|||
|
Total comprehensive income (loss)
|
1,435
|
|
5
|
|
(57
|
)
|
|||
|
Comprehensive loss attributable to noncontrolling interests
|
—
|
|
1
|
|
—
|
|
|||
|
Total comprehensive income (loss) attributable to Weyerhaeuser shareholders
|
$
|
1,435
|
|
$
|
6
|
|
$
|
(57
|
)
|
See accompanying
Notes to Consolidated Financial Statements
.
WEYERHAEUSER COMPANY >
2013 ANNUAL REPORT AND FORM 10-K
55
|
|
|
ASSETS
|
||||||
|
DOLLAR AMOUNTS IN MILLIONS
|
||||||
|
|
DECEMBER 31,
2013 |
|
DECEMBER 31,
2012 |
|
||
|
Current assets:
|
|
|
||||
|
Cash and cash equivalents
|
$
|
835
|
|
$
|
898
|
|
|
Receivables, less discounts and allowances of $6 and $7
|
569
|
|
523
|
|
||
|
Receivables for taxes
|
101
|
|
95
|
|
||
|
Inventories
(Note 7)
|
542
|
|
531
|
|
||
|
Prepaid expenses
|
128
|
|
88
|
|
||
|
Deferred tax assets
(Note 22)
|
151
|
|
88
|
|
||
|
Restricted financial investments held by variable interest entities
(Note 11)
|
—
|
|
184
|
|
||
|
Total current assets
|
2,326
|
|
2,407
|
|
||
|
Property and equipment, less accumulated depreciation of $6,368 and $6,388
(Note 8)
|
2,704
|
|
2,872
|
|
||
|
Construction in progress
|
112
|
|
50
|
|
||
|
Timber and timberlands at cost, less depletion charged to disposals
(Note 3)
|
6,580
|
|
3,961
|
|
||
|
Real estate in process of development and for sale
(Note 12)
|
851
|
|
695
|
|
||
|
Land being processed for development
(Note 20)
|
613
|
|
971
|
|
||
|
Investments in and advances to equity affiliates
(Note 9)
|
211
|
|
213
|
|
||
|
Goodwill
|
42
|
|
40
|
|
||
|
Deferred tax assets
(Note 22)
|
41
|
|
368
|
|
||
|
Other assets
|
403
|
|
400
|
|
||
|
Restricted financial investments held by variable interest entities
(Note 11)
|
615
|
|
615
|
|
||
|
Total assets
|
$
|
14,498
|
|
$
|
12,592
|
|
|
LIABILITIES AND EQUITY
|
||||||
|
Current liabilities:
|
||||||
|
Notes payable
|
$
|
2
|
|
$
|
—
|
|
|
—
|
|
409
|
|
|||
|
Current maturities of long-term debt (nonrecourse to the company) held by variable interest entities
(Note 11)
|
—
|
|
161
|
|
||
|
Accounts payable
|
384
|
|
373
|
|
||
|
Accrued liabilities
(Note 13)
|
742
|
|
662
|
|
||
|
Total current liabilities
|
1,128
|
|
1,605
|
|
||
|
4,891
|
|
3,882
|
|
|||
|
Long-term debt (nonrecourse to the company) held by variable interest entities
(Note 11)
|
516
|
|
511
|
|
||
|
Deferred income taxes
(Note 22)
|
206
|
|
—
|
|
||
|
Deferred pension and other postretirement benefits
(Note 10)
|
516
|
|
1,930
|
|
||
|
Other liabilities
|
409
|
|
551
|
|
||
|
Commitments and contingencies
(Note 17)
|
||||||
|
Total liabilities
|
7,666
|
|
8,479
|
|
||
|
Equity:
|
||||||
|
Mandatory convertible preference shares, series A: $1.00 par value; $50.00 liquidation; authorized 40,000,000 shares; issued and outstanding: 13,800,000 and 0 shares
(Note 3)
|
14
|
|
—
|
|
||
|
Common shares: $1.25 par value; authorized 1,360,000,000 shares; issued and outstanding: 583,548,428 and 542,392,642 shares
(Note 3)
|
729
|
|
678
|
|
||
|
Other capital
(Note 3)
|
6,444
|
|
4,731
|
|
||
|
Retained earnings
|
294
|
|
219
|
|
||
|
Cumulative other comprehensive loss
|
(686
|
)
|
(1,558
|
)
|
||
|
Total Weyerhaeuser shareholders’ interest
|
6,795
|
|
4,070
|
|
||
|
Noncontrolling interests
|
37
|
|
43
|
|
||
|
Total equity
|
6,832
|
|
4,113
|
|
||
|
Total liabilities and equity
|
$
|
14,498
|
|
$
|
12,592
|
|
See accompanying
Notes to Consolidated Financial Statements
.
WEYERHAEUSER COMPANY >
2013 ANNUAL REPORT AND FORM 10-K
56
|
|
FOR THE THREE-YEAR PERIOD ENDED
DECEMBER 31, 2013
|
DOLLAR AMOUNTS IN MILLIONS
|
|||||||||
|
|
2013
|
|
2012
|
|
2011
|
|
|||
|
Cash flows from operations:
|
|
|
|
||||||
|
Net earnings
|
$
|
563
|
|
$
|
384
|
|
$
|
331
|
|
|
Noncash charges (credits) to income:
|
|
|
|
||||||
|
Depreciation, depletion and amortization
|
472
|
|
456
|
|
480
|
|
|||
|
Deferred income taxes, net
(Note 22)
|
(29
|
)
|
109
|
|
(26
|
)
|
|||
|
Pension and other postretirement benefits
(Note 10)
|
101
|
|
(19
|
)
|
81
|
|
|||
|
Share-based compensation expense
(Note 19)
|
42
|
|
37
|
|
25
|
|
|||
|
Charges for impairment of assets
(Notes 20)
|
372
|
|
24
|
|
56
|
|
|||
|
Net gains on dispositions of assets and operations
(1)
|
(58
|
)
|
(69
|
)
|
(236
|
)
|
|||
|
Foreign exchange transaction (gains) losses
(Note 21)
|
7
|
|
(6
|
)
|
6
|
|
|||
|
Change in, net of acquisition:
|
|
|
|
||||||
|
Receivables less allowances
|
(27
|
)
|
(33
|
)
|
(53
|
)
|
|||
|
Receivable for taxes
|
(6
|
)
|
(73
|
)
|
(37
|
)
|
|||
|
Inventories
|
(13
|
)
|
(54
|
)
|
(46
|
)
|
|||
|
Real estate and land
|
(166
|
)
|
(75
|
)
|
(12
|
)
|
|||
|
Prepaid expenses
|
(26
|
)
|
(16
|
)
|
3
|
|
|||
|
Accounts payable and accrued liabilities
|
(51
|
)
|
18
|
|
(133
|
)
|
|||
|
Deposits on land positions and other assets
|
(18
|
)
|
4
|
|
(4
|
)
|
|||
|
Pension and postretirement contributions / benefit payments
|
(137
|
)
|
(145
|
)
|
(143
|
)
|
|||
|
Other
|
(22
|
)
|
39
|
|
(1
|
)
|
|||
|
Net cash from operations
|
1,004
|
|
581
|
|
291
|
|
|||
|
Cash flows from investing activities:
|
|
|
|
||||||
|
Property and equipment
|
(261
|
)
|
(256
|
)
|
(212
|
)
|
|||
|
Timberlands reforestation
|
(32
|
)
|
(29
|
)
|
(29
|
)
|
|||
|
Acquisition of Longview Timber LLC, net of cash acquired
(Note 3)
|
(1,581
|
)
|
—
|
|
—
|
|
|||
|
Proceeds from sale of assets and operations
|
20
|
|
80
|
|
362
|
|
|||
|
Net proceeds of investments held by special purpose entities
(Note 11)
|
22
|
|
13
|
|
—
|
|
|||
|
Other
|
3
|
|
—
|
|
1
|
|
|||
|
Cash from investing activities
|
(1,829
|
)
|
(192
|
)
|
122
|
|
|||
|
Cash flows from financing activities:
|
|
|
|
||||||
|
Net proceeds from issuance of common shares
(Note 3)
|
897
|
|
—
|
|
—
|
|
|||
|
Net proceeds from issuance of preference shares
(Note 3)
|
669
|
|
—
|
|
—
|
|
|||
|
Net proceeds from issuance of debt
(Note 15)
|
1,044
|
|
—
|
|
—
|
|
|||
|
Cash dividends on common shares
|
(458
|
)
|
(334
|
)
|
(323
|
)
|
|||
|
Cash dividends on preference shares
|
(23
|
)
|
—
|
|
—
|
|
|||
|
Change in book overdrafts
|
7
|
|
(32
|
)
|
2
|
|
|||
|
Payments on debt
(Note 15)
|
(1,567
|
)
|
(187
|
)
|
(583
|
)
|
|||
|
Exercises of stock options
|
162
|
|
112
|
|
38
|
|
|||
|
Repurchase of common stock
(Note 18)
|
—
|
|
—
|
|
(37
|
)
|
|||
|
Other
|
31
|
|
(3
|
)
|
(24
|
)
|
|||
|
Cash from financing activities
|
762
|
|
(444
|
)
|
(927
|
)
|
|||
|
Net change in cash and cash equivalents
|
(63
|
)
|
(55
|
)
|
(514
|
)
|
|||
|
Cash and cash equivalents at beginning of year
|
898
|
|
953
|
|
1,467
|
|
|||
|
Cash and cash equivalents at end of year
|
$
|
835
|
|
$
|
898
|
|
$
|
953
|
|
|
Cash paid (received) during the year for:
|
|
|
|
||||||
|
Interest, net of amounts capitalized of $21 in 2013, $18 in 2012 and $30 in 2011
|
$
|
366
|
|
$
|
351
|
|
$
|
420
|
|
|
Income taxes
|
$
|
8
|
|
$
|
(13
|
)
|
$
|
28
|
|
|
Noncash investing and financing activity: Acquisition of Longview Timber LLC, debt assumed
(Note 3)
|
$
|
1,070
|
|
$
|
—
|
|
$
|
—
|
|
|
(1) Includes gain on timberland exchanges.
|
|||||||||
See accompanying
Notes to Consolidated Financial Statements
.
WEYERHAEUSER COMPANY >
2013 ANNUAL REPORT AND FORM 10-K
57
|
CONSOLIDATED STATEMENT OF CHANGES IN EQUITY
|
FOR THE THREE-YEAR PERIOD ENDED
DECEMBER 31, 2013
|
DOLLAR AMOUNTS IN MILLIONS
|
|||||||||
|
|
2013
|
|
2012
|
|
2011
|
|
|||
|
Mandatory convertible preference shares, series A:
|
|
|
|
|
|||||
|
Balance at beginning of year
|
$
|
—
|
|
$
|
—
|
|
$
|
—
|
|
|
New issuance
|
14
|
|
—
|
|
—
|
|
|||
|
Conversion to common shares
|
—
|
|
—
|
|
—
|
|
|||
|
Balance at end of year
|
$
|
14
|
|
$
|
—
|
|
$
|
—
|
|
|
Common shares:
|
|
|
|
|
|||||
|
Balance at beginning of year
|
$
|
678
|
|
$
|
671
|
|
$
|
670
|
|
|
New issuance
|
42
|
|
—
|
|
—
|
|
|||
|
Issued for exercise of stock options
|
9
|
|
7
|
|
4
|
|
|||
|
Share repurchases
|
—
|
|
—
|
|
(3
|
)
|
|||
|
Balance at end of year
|
$
|
729
|
|
$
|
678
|
|
$
|
671
|
|
|
Other capital:
|
|
|
|
||||||
|
Balance at beginning of year
|
$
|
4,731
|
|
$
|
4,595
|
|
$
|
4,552
|
|
|
New issuance
|
1,509
|
|
—
|
|
—
|
|
|||
|
Exercise of stock options
|
152
|
|
105
|
|
35
|
|
|||
|
Repurchase of common shares
|
—
|
|
—
|
|
(34
|
)
|
|||
|
Share-based compensation
|
42
|
|
34
|
|
27
|
|
|||
|
Other transactions, net
|
10
|
|
(3
|
)
|
15
|
|
|||
|
Balance at end of year
|
$
|
6,444
|
|
$
|
4,731
|
|
$
|
4,595
|
|
|
Retained earnings:
|
|
|
|
||||||
|
Balance at beginning of year
|
$
|
219
|
|
$
|
176
|
|
$
|
181
|
|
|
Net earnings attributable to Weyerhaeuser common shareholders
|
563
|
|
385
|
|
331
|
|
|||
|
Dividends on common shares
(Note 18)
|
(465
|
)
|
(342
|
)
|
(336
|
)
|
|||
|
Cash dividends on preference shares
(Note 18)
|
(23
|
)
|
—
|
|
—
|
|
|||
|
Balance at end of year
|
$
|
294
|
|
$
|
219
|
|
$
|
176
|
|
|
Cumulative other comprehensive loss:
|
|
|
|
||||||
|
Balance at beginning of year
|
$
|
(1,558
|
)
|
$
|
(1,179
|
)
|
$
|
(791
|
)
|
|
Annual changes – net of tax:
|
|
|
|
||||||
|
Foreign currency translation adjustments
|
(59
|
)
|
2
|
|
(8
|
)
|
|||
|
Changes in unamortized net pension and other postretirement benefit loss
(Note 10)
|
902
|
|
(258
|
)
|
(463
|
)
|
|||
|
Changes in unamortized prior service credit (cost)
(Note 10)
|
27
|
|
(123
|
)
|
82
|
|
|||
|
Unrealized gains on available-for-sale securities
|
2
|
|
—
|
|
1
|
|
|||
|
Balance at end of year
|
$
|
(686
|
)
|
$
|
(1,558
|
)
|
$
|
(1,179
|
)
|
|
Total Weyerhaeuser shareholders’ interest:
|
|
|
|
||||||
|
Balance at end of year
|
$
|
6,795
|
|
$
|
4,070
|
|
$
|
4,263
|
|
|
Noncontrolling interests:
|
|
|
|
||||||
|
Balance at beginning of year
|
$
|
43
|
|
$
|
4
|
|
$
|
2
|
|
|
Net loss attributable to noncontrolling interests
|
—
|
|
(1
|
)
|
—
|
|
|||
|
Contributions
|
—
|
|
—
|
|
2
|
|
|||
|
New consolidations, de-consolidations and other transactions
|
(6
|
)
|
40
|
|
—
|
|
|||
|
Balance at end of year
|
$
|
37
|
|
$
|
43
|
|
$
|
4
|
|
|
Total equity:
|
|
|
|
||||||
|
Balance at end of year
|
$
|
6,832
|
|
$
|
4,113
|
|
$
|
4,267
|
|
See accompanying
Notes to Consolidated Financial Statements
.
WEYERHAEUSER COMPANY >
2013 ANNUAL REPORT AND FORM 10-K
58
|
INDEX FOR NOTES TO CONSOLIDATED FINANCIAL STATEMENTS
|
|
NOTE 1:
|
||
|
NOTE 2:
|
||
|
NOTE 3:
|
LONGVIEW TIMBER PURCHASE
|
|
|
NOTE 4:
|
REAL ESTATE DIVESTITURE
|
|
|
NOTE 5:
|
||
|
NOTE 6:
|
||
|
NOTE 7:
|
||
|
NOTE 8:
|
||
|
NOTE 9:
|
||
|
NOTE 10:
|
||
|
NOTE 11:
|
||
|
NOTE 12:
|
||
|
NOTE 13:
|
||
|
NOTE 14:
|
||
|
NOTE 15:
|
||
|
NOTE 16:
|
||
|
NOTE 17:
|
||
|
NOTE 18:
|
||
|
NOTE 19:
|
||
|
NOTE 20:
|
||
|
NOTE 21:
|
||
|
NOTE 22:
|
||
|
NOTE 23:
|
||
|
NOTE 24:
|
||
WEYERHAEUSER COMPANY >
2013 ANNUAL REPORT AND FORM 10-K
59
|
NOTES TO CONSOLIDATED FINANCIAL STATEMENTS
|
FOR THE THREE-YEAR PERIOD ENDED
DECEMBER 31, 2013
NOTE 1:
SUMMARY OF SIGNIFICANT ACCOUNTING POLICIES
Our significant accounting policies describe:
|
•
|
our election to be taxed as a real estate investment trust,
|
|
•
|
how we report our results,
|
|
•
|
changes in how we report our results and
|
|
•
|
how we account for various items.
|
OUR ELECTION TO BE TAXED AS A REAL ESTATE INVESTMENT TRUST (REIT)
Starting with our 2010 fiscal year, we elected to be taxed as a REIT. We expect to derive most of our REIT income from investments in timberlands, including the sale of standing timber through pay-as-cut sales contracts. REIT income can be distributed to shareholders without first paying corporate level tax, substantially eliminating the double taxation on income. A significant portion of our timberland segment earnings receives this favorable tax treatment. We are, however, subject to corporate taxes on built-in-gains (the excess of fair market value over tax basis at January 1, 2010) on sales of real property (other than standing timber) held by the REIT during the first 10 years following the REIT conversion. We continue to be required to pay federal corporate income taxes on earnings of our Taxable REIT Subsidiary (TRS), which principally includes our manufacturing businesses, our real estate development business and our non-qualified timberland segment income.
HOW WE REPORT OUR RESULTS
Our report includes:
|
•
|
consolidated financial statements,
|
|
•
|
our business segments,
|
|
•
|
foreign currency translation,
|
|
•
|
estimates, and
|
|
•
|
fair value measurements.
|
CONSOLIDATED FINANCIAL STATEMENTS
Our consolidated financial statements provide an overall view of our results and financial condition. They include our accounts and the accounts of entities that we control, including:
|
•
|
majority-owned domestic and foreign subsidiaries and
|
|
•
|
variable interest entities in which we are the primary beneficiary.
|
They do not include our intercompany transactions and accounts, which are eliminated, and noncontrolling interests are presented as a separate component of equity.
We account for investments in and advances to unconsolidated equity affiliates using the equity method, with taxes provided on undistributed earnings. This means that we record earnings and accrue taxes in the period that the earnings are recorded by our unconsolidated equity affiliates.
Throughout these Notes to Consolidated Financial Statements, unless specified otherwise, references to “Weyerhaeuser,” “we” and “our” refer to the consolidated company.
OUR BUSINESS SEGMENTS
We are principally engaged in:
|
•
|
growing and harvesting timber;
|
|
•
|
manufacturing, distributing and selling forest products; and
|
|
•
|
developing real estate and building single-family homes.
|
Our business segments are organized based primarily on products and services.
Our Business Segments and Products
|
SEGMENT
|
PRODUCTS AND SERVICES
|
|
Timberlands
|
Logs, timber, minerals, oil and gas and international wood products
|
|
Wood Products
|
Softwood lumber, engineered lumber, structural panels and building materials distribution
|
|
Cellulose Fibers
|
Pulp, liquid packaging board and an equity interest in a newsprint joint venture
|
|
Real Estate
|
Real estate development and single-family home building operations
|
We also transfer raw materials, semifinished materials and end products among our business segments. Because of this intracompany activity, accounting for our business segments involves:
|
•
|
allocating joint conversion and common facility costs according to usage by our business segment product lines and
|
|
•
|
pricing products transferred between our business segments at current market values.
|
WEYERHAEUSER COMPANY >
2013 ANNUAL REPORT AND FORM 10-K
60
Gains or charges not related to or allocated to an individual operating segment are held in Unallocated Items. This includes a portion of items such as: share-based compensation; pension and postretirement costs; foreign exchange transaction gains and losses associated with financing; and the elimination of intersegment profit in inventory and the LIFO reserve.
FOREIGN CURRENCY TRANSLATION
Local currencies are the functional currencies for most of our operations outside the U.S. We translate foreign currencies into U.S. dollars in two ways:
|
•
|
assets and liabilities — at the exchange rates in effect as of our balance sheet date; and
|
|
•
|
revenues and expenses — at average monthly exchange rates throughout the year.
|
ESTIMATES
We prepare our financial statements according to U.S. generally accepted accounting principles (U.S. GAAP). This requires us to make estimates and assumptions during our reporting periods and at the date of our financial statements. The estimates and assumptions affect our:
|
•
|
reported amounts of assets, liabilities and equity;
|
|
•
|
disclosure of contingent assets and liabilities; and
|
|
•
|
reported amounts of revenues and expenses.
|
While we do our best in preparing these estimates, actual results can and do differ from those estimates and assumptions.
FAIR VALUE MEASUREMENTS
We use a fair value hierarchy in accounting for certain nonfinancial assets and liabilities including:
|
•
|
long-lived assets (asset groups) measured at fair value for an impairment assessment,
|
|
•
|
reporting units measured at fair value in the first step of a goodwill impairment test,
|
|
•
|
nonfinancial assets and nonfinancial liabilities measured at fair value in the second step of a goodwill impairment assessment,
|
|
•
|
assets acquired and liabilities assumed in a business acquisition and
|
|
•
|
asset retirement obligations initially measured at fair value.
|
The fair value hierarchy is based on inputs to valuation techniques that are used to measure fair value that are either observable or unobservable. Observable inputs reflect assumptions market participants would use in pricing an asset or liability based on market data obtained from independent sources while unobservable inputs reflect a reporting entity’s pricing based upon its own market assumptions.
The fair value hierarchy consists of the following three levels:
|
•
|
Level 1 — Inputs are quoted prices in active markets for identical assets or liabilities.
|
|
•
|
Level 2 — Inputs are:
|
– quoted prices for similar assets or liabilities in an active market;
– quoted prices for identical or similar assets or liabilities in markets that are not active; or
– inputs other than quoted prices that are observable and market-corroborated inputs, which are derived principally from or corroborated by observable market data.
|
•
|
Level 3 — Inputs are derived from valuation techniques in which one or more significant inputs or value drivers are unobservable.
|
CHANGES IN HOW WE REPORT OUR RESULTS
Changes in how we report our results come from:
|
•
|
accounting changes made upon our adoption of new accounting guidance and
|
|
•
|
our reclassification of certain balances and results from prior years to make them consistent with our current reporting.
|
RECLASSIFICATIONS
We have reclassified certain balances and results from the prior years to be consistent with our
2013
reporting. This makes year-to-year comparisons easier. Our reclassifications had no effect on net earnings or Weyerhaeuser shareholders’ interest. Our reclassifications record our variable interest entities assets and liabilities into their respective line items on our
Consolidated Balance Sheet
. Additionally, our real estate and forest products asset and liability line items have been combined into respective total asset and liability line items on our
Consolidated Balance Sheet
and in the related footnotes.
HOW WE ACCOUNT FOR VARIOUS ITEMS
This section provides information about how we account for certain key items related to:
|
•
|
capital investments,
|
|
•
|
financing our business and
|
|
•
|
operations.
|
ITEMS RELATED TO CAPITAL INVESTMENTS
Key items related to accounting for capital investments pertain to property and equipment, timber and timberlands, impairment of long-lived assets and goodwill.
WEYERHAEUSER COMPANY >
2013 ANNUAL REPORT AND FORM 10-K
61
Property and Equipment
We maintain property accounts on an individual asset basis. Here is how we handle major items:
|
•
|
Improvements to and replacements of major units of property are capitalized.
|
|
•
|
Maintenance, repairs and minor replacements are expensed.
|
|
•
|
Depreciation is calculated using a straight-line method at rates based on estimated service lives.
|
|
•
|
Logging roads are generally amortized — as timber is harvested — at rates based on the volume of timber estimated to be removed.
|
|
•
|
Cost and accumulated depreciation of property sold or retired are removed from the accounts and the gain or loss is included in earnings.
|
Timber and Timberlands
We carry timber and timberlands at cost less depletion charged to disposals. Depletion refers to the carrying value of timber that is harvested, lost as a result of casualty, or sold.
Key activities affecting how we account for timber and timberlands include:
|
•
|
reforestation,
|
|
•
|
depletion and
|
|
•
|
forest management in Canada.
|
Reforestation.
Generally, we capitalize initial site preparation and planting costs as reforestation. We transfer reforestation to a merchantable timber classification when the timber is considered harvestable. That generally occurs after:
|
•
|
15
years in the South and
|
|
•
|
30
years in the West.
|
Generally, we expense costs after the first planting as they are incurred or over the period of expected benefit. These costs include:
|
•
|
fertilization,
|
|
•
|
vegetation and insect control,
|
|
•
|
pruning and precommercial thinning,
|
|
•
|
property taxes and
|
|
•
|
interest.
|
Accounting practices for these costs do not change when timber becomes merchantable and harvesting starts.
Depletion.
To determine depletion rates, we divide the net carrying value of timber by the related volume of timber estimated to be available over the growth cycle. To determine the growth cycle volume of timber, we consider:
|
•
|
regulatory and environmental constraints,
|
|
•
|
our management strategies,
|
|
•
|
inventory data improvements,
|
|
•
|
growth rate revisions and recalibrations and
|
|
•
|
known dispositions and inoperable acres.
|
We include the cost of timber harvested in the carrying values of raw materials and product inventories. As these inventories are sold to third parties, we include them in the cost of products sold.
Forest management in Canada.
We hold forest management licenses in various Canadian provinces that are:
|
•
|
granted by the provincial governments;
|
|
•
|
granted for initial periods of
15
to
25
years; and
|
|
•
|
renewable every five years provided we meet reforestation, operating and management guidelines.
|
Calculation of the fees we pay on the timber we harvest:
|
•
|
varies from province to province,
|
|
•
|
is tied to product market pricing and
|
|
•
|
depends upon the allocation of land management responsibilities in the license.
|
Impairment of Long-Lived Assets
We review long-lived assets — including certain identifiable intangibles — for impairment whenever events or changes in circumstances indicate that the carrying amount of the assets may not be recoverable. Impaired assets held for use are written down to fair value. Impaired assets held for sale are written down to fair value less cost to sell. We determine fair value based on:
|
•
|
appraisals,
|
|
•
|
market pricing of comparable assets,
|
|
•
|
discounted value of estimated cash flows from the asset and
|
|
•
|
replacement values of comparable assets.
|
Goodwill
Goodwill is the purchase price minus the fair value of net assets acquired when we buy another entity. We assess goodwill for impairment:
|
•
|
using a fair-value-based approach and
|
|
•
|
at least annually — at the beginning of the fourth quarter.
|
In
2013
the fair value of the reporting unit with goodwill substantially exceeded its carrying value.
ITEMS RELATED TO FINANCING OUR BUSINESS
Key items related to financing our business include financial instruments, cash and cash equivalents, accounts payable and concentration of risk.
WEYERHAEUSER COMPANY >
2013 ANNUAL REPORT AND FORM 10-K
62
Financial Instruments
We estimate the fair value of financial instruments where appropriate. The assumptions we use — including the discount rate and estimates of cash flows — can significantly affect our fair-value amounts. Our fair values are estimates and may not match the amounts we would realize upon sale or settlement of our financial positions.
Cash and Cash Equivalents
Cash equivalents are investments with original maturities of
90
days or less. We state cash equivalents at cost, which approximates market.
Accounts Payable
Our banking system replenishes our major bank accounts daily as checks we have issued are presented for payment. As a result, we have negative book cash balances due to outstanding checks that have not yet been paid by the bank. These negative balances are included in accounts payable on our
Consolidated Balance Sheet
. Changes in these negative cash balances are reported as financing activities in our
Consolidated Statement of Cash Flows
. Negative book cash balances were:
|
•
|
$22 million
at
December 31, 2013
; and
|
|
•
|
$15 million
at
December 31, 2012
.
|
Concentration of Risk
We disclose customers that represent a concentration of credit risk. As of
December 31, 2013
, one customer accounted for approximately
14 percent
of our accounts receivable balance.
ITEMS RELATED TO OPERATIONS
Key items related to operations include revenue recognition, inventories, shipping and handling costs, income taxes, share-based compensation, pension and other postretirement plans, and environmental remediation.
Revenue Recognition
Operations generally recognize revenue upon shipment to customers. For certain export sales, revenue is recognized when title transfers at the foreign port.
For real estate and timberland sales, we recognize revenue when:
|
•
|
closings have occurred,
|
|
•
|
required down payments have been received,
|
|
•
|
title and possession have been transferred to the buyer and
|
|
•
|
all other criteria for sale and profit recognition have been satisfied.
|
Inventories
We state inventories at the lower of cost or market. Cost includes labor, materials and production overhead. LIFO — the last-in, first-out method — applies to major inventory products held at our U.S. domestic locations. We began to use the LIFO method for domestic products in the 1940s as required to conform with the tax method elected. Subsequent acquisitions of entities added new products under the FIFO — the first-in, first-out method — or moving average cost methods that have continued under those methods. The FIFO or moving average cost methods applies to the balance of our domestic raw material and product inventories as well as for all material and supply inventories and all foreign inventories.
Shipping and Handling Costs
We classify shipping and handling costs in the costs of products sold in our
Consolidated Statement of Operations
.
Income Taxes
We account for income taxes under the asset and liability method. Unrecognized tax benefits represent potential future funding obligations to taxing authorities if uncertain tax positions the company has taken on previously filed tax returns are not sustained. In accordance with the company’s accounting policy, accrued interest and penalties related to unrecognized tax benefits are recognized as a component of income tax expense.
We recognize deferred tax assets and liabilities to reflect:
|
•
|
future tax consequences due to differences between the carrying amounts for financial purposes and the tax bases of certain items and
|
|
•
|
operating loss and tax credit carryforwards.
|
To measure deferred tax assets and liabilities, we:
|
•
|
determine when the differences between the carrying amounts and tax bases of affected items are expected to be recovered or resolved and
|
|
•
|
use enacted tax rates expected to apply to taxable income in those years.
|
Share-Based Compensation
We generally measure the fair value of share-based awards on the dates they are granted or modified. These measurements establish the cost of the share-based awards for accounting purposes. We then recognize the cost of share-based awards in our
Consolidated Statement of Operations
over each employee’s required service period.
Note 17: Share-Based Compensation
provides more information about our share-based compensation.
Pension and Other Postretirement Benefit Plans
We recognize the overfunded or underfunded status of our defined benefit pension and other postretirement plans on our
Consolidated Balance Sheet
and recognize changes in the funded status through comprehensive income (loss) in the year in which the changes occur.
WEYERHAEUSER COMPANY >
2013 ANNUAL REPORT AND FORM 10-K
63
Actuarial valuations determine the amount of the pension and other postretirement benefit obligations and the net periodic benefit cost we recognize. The net periodic benefit cost includes:
|
•
|
cost of benefits provided in exchange for employees’ services rendered during the year;
|
|
•
|
interest cost of the obligations;
|
|
•
|
expected long-term return on fund assets;
|
|
•
|
gains or losses on plan settlements and curtailments;
|
|
•
|
amortization of prior service costs and plan amendments over the average remaining service period of the active employee group covered by the plans; and
|
|
•
|
amortization of cumulative unrecognized net actuarial gains and losses — generally in excess of 10 percent of the greater of the accrued benefit obligation or market-related value of plan assets at the beginning of the year — over the average remaining service period of the active employee group covered by the plans or the average remaining life expectancy in situations where the plan participants are inactive.
|
Pension plans.
We have pension plans covering most of our employees. Determination of benefits differs for salaried, hourly and union employees:
|
•
|
Salaried employee benefits are based on each employee’s highest monthly earnings for five consecutive years during the final 10 years before retirement.
|
|
•
|
Hourly and union employee benefits generally are stated amounts for each year of service.
|
|
•
|
Union employee benefits are set through collective-bargaining agreements.
|
We contribute to our U.S. and Canadian pension plans according to established funding standards. The funding standards for the plans are:
|
•
|
U.S. pension plans — according to the Employee Retirement Income Security Act of 1974; and
|
|
•
|
Canadian pension plans — according to the applicable provincial pension act and the Income Tax Act.
|
Postretirement benefits other than pensions.
We provide certain postretirement health care and life insurance benefits for some retired employees. In some cases, we pay a portion of the cost of the benefit.
Note 10: Pension and Other Postretirement Benefit Plans
provides additional information about changes made in our postretirement benefit plans during
2013
and
2012
.
Environmental Remediation
We accrue losses associated with environmental remediation obligations when such losses are probable and reasonably estimable. Future expenditures for environmental remediation obligations are not discounted to their present value. Recoveries of environmental remediation costs from other parties are recorded as assets when the recovery is deemed probable and does not exceed the amount of losses previously recorded.
NOTE 2:
BUSINESS SEGMENTS
Our business segments and how we account for those segments are discussed in
Note 1: Summary of Significant Accounting Policies
. This note provides key financial data by business segment.
DISCONTINUED OPERATIONS
We have disposed of various businesses and operations that are excluded from the segment results below. See
Note 5: Discontinued Operations
for information regarding our discontinued operations and the segments affected.
KEY FINANCIAL DATA BY BUSINESS SEGMENT
Sales and Contribution (Charge) to Earnings
|
DOLLAR AMOUNTS IN MILLIONS
|
||||||||||||||||||
|
|
TIMBERLANDS
|
|
WOOD
PRODUCTS
|
|
CELLULOSE
FIBERS
|
|
REAL
ESTATE
|
|
UNALLOCATED ITEMS
(1)
AND INTERSEGMENT ELIMINATIONS
|
|
CONSOLIDATED
|
|
||||||
|
Sales to unaffiliated customers
|
||||||||||||||||||
|
2013
|
$
|
1,343
|
|
$
|
4,009
|
|
$
|
1,902
|
|
$
|
1,275
|
|
$
|
—
|
|
$
|
8,529
|
|
|
2012
|
$
|
1,077
|
|
$
|
3,058
|
|
$
|
1,854
|
|
$
|
1,070
|
|
$
|
—
|
|
$
|
7,059
|
|
|
2011
|
$
|
1,044
|
|
$
|
2,276
|
|
$
|
2,058
|
|
$
|
838
|
|
$
|
—
|
|
$
|
6,216
|
|
|
Intersegment sales
|
||||||||||||||||||
|
2013
|
$
|
799
|
|
$
|
71
|
|
$
|
—
|
|
$
|
—
|
|
$
|
(870
|
)
|
$
|
—
|
|
|
2012
|
$
|
683
|
|
$
|
74
|
|
$
|
—
|
|
$
|
—
|
|
$
|
(757
|
)
|
$
|
—
|
|
|
2011
|
$
|
646
|
|
$
|
80
|
|
$
|
—
|
|
$
|
—
|
|
$
|
(726
|
)
|
$
|
—
|
|
|
Contribution (charge) to earnings from continuing operations
|
||||||||||||||||||
|
2013
|
$
|
470
|
|
$
|
441
|
|
$
|
200
|
|
$
|
(231
|
)
|
$
|
(75
|
)
|
$
|
805
|
|
|
2012
|
$
|
322
|
|
$
|
120
|
|
$
|
223
|
|
$
|
105
|
|
$
|
18
|
|
$
|
788
|
|
|
2011
|
$
|
491
|
|
$
|
(243
|
)
|
$
|
452
|
|
$
|
58
|
|
$
|
(117
|
)
|
$
|
641
|
|
|
(1) Unallocated Items are gains or charges not related to or allocated to an individual operating segment. They include a portion of items such as: share-based compensation, pension and postretirement costs, foreign exchange transaction gains and losses associated with financing, and the elimination of intersegment profit in inventory and the LIFO reserve.
|
||||||||||||||||||
WEYERHAEUSER COMPANY >
2013 ANNUAL REPORT AND FORM 10-K
64
Management evaluates segment performance based on the contributions to earnings of the respective segments. An analysis and reconciliation of our business segment information to the consolidated financial statements follows:
Reconciliation of Contribution to Earnings to Net Earnings Attributable to Weyerhaeuser
|
DOLLAR AMOUNTS IN MILLIONS
|
|||||||||
|
|
2013
|
|
2012
|
|
2011
|
|
|||
|
Net contribution to earnings from continuing operations
|
$
|
805
|
|
$
|
788
|
|
$
|
641
|
|
|
Net contribution to earnings from discontinued operations
|
—
|
|
—
|
|
20
|
|
|||
|
Total contribution to earnings
|
805
|
|
788
|
|
661
|
|
|||
|
Interest expense, net of capitalized interest
|
(371
|
)
|
(348
|
)
|
(384
|
)
|
|||
|
Income before income taxes (continuing and discontinued operations)
|
434
|
|
440
|
|
277
|
|
|||
|
Income taxes (continuing and discontinued operations)
|
129
|
|
(55
|
)
|
54
|
|
|||
|
Net earnings attributable to Weyerhaeuser
|
$
|
563
|
|
$
|
385
|
|
$
|
331
|
|
Additional Financial Information
|
DOLLAR AMOUNTS IN MILLIONS
|
||||||||||||||||||
|
|
TIMBERLANDS
|
|
WOOD
PRODUCTS
|
|
CELLULOSE
FIBERS
|
|
REAL
ESTATE
|
|
UNALLOCATED
ITEMS
|
|
CONSOLIDATED
|
|
||||||
|
Depreciation, depletion and amortization
|
||||||||||||||||||
|
2013
|
$
|
166
|
|
$
|
123
|
|
$
|
156
|
|
$
|
14
|
|
$
|
13
|
|
$
|
472
|
|
|
2012
|
$
|
142
|
|
$
|
133
|
|
$
|
150
|
|
$
|
12
|
|
$
|
19
|
|
$
|
456
|
|
|
2011
|
$
|
137
|
|
$
|
151
|
|
$
|
147
|
|
$
|
13
|
|
$
|
28
|
|
$
|
476
|
|
|
Net pension and postretirement cost
(1)
|
||||||||||||||||||
|
2013
|
$
|
10
|
|
$
|
28
|
|
$
|
18
|
|
$
|
5
|
|
$
|
40
|
|
$
|
101
|
|
|
2012
|
$
|
8
|
|
$
|
25
|
|
$
|
14
|
|
$
|
4
|
|
$
|
29
|
|
$
|
80
|
|
|
2011
|
$
|
7
|
|
$
|
22
|
|
$
|
13
|
|
$
|
4
|
|
$
|
26
|
|
$
|
72
|
|
|
Charges for restructuring, closures and impairments
(2)
|
||||||||||||||||||
|
2013
|
$
|
2
|
|
$
|
13
|
|
$
|
—
|
|
$
|
357
|
|
$
|
18
|
|
$
|
390
|
|
|
2012
|
$
|
2
|
|
$
|
6
|
|
$
|
—
|
|
$
|
6
|
|
$
|
18
|
|
$
|
32
|
|
|
2011
|
$
|
—
|
|
$
|
64
|
|
$
|
1
|
|
$
|
14
|
|
$
|
4
|
|
$
|
83
|
|
|
Equity in income (loss) of equity affiliates and unconsolidated entities
|
||||||||||||||||||
|
2013
|
$
|
—
|
|
$
|
—
|
|
$
|
3
|
|
$
|
—
|
|
$
|
8
|
|
$
|
11
|
|
|
2012
|
$
|
—
|
|
$
|
—
|
|
$
|
5
|
|
$
|
2
|
|
$
|
(3
|
)
|
$
|
4
|
|
|
2011
|
$
|
—
|
|
$
|
—
|
|
$
|
2
|
|
$
|
2
|
|
$
|
(4
|
)
|
$
|
—
|
|
|
Capital expenditures
|
||||||||||||||||||
|
2013
|
$
|
73
|
|
$
|
113
|
|
$
|
92
|
|
$
|
10
|
|
$
|
5
|
|
$
|
293
|
|
|
2012
|
$
|
60
|
|
$
|
56
|
|
$
|
160
|
|
$
|
4
|
|
$
|
5
|
|
$
|
285
|
|
|
2011
|
$
|
53
|
|
$
|
35
|
|
$
|
146
|
|
$
|
3
|
|
$
|
1
|
|
$
|
238
|
|
|
Investments in and advances to equity affiliates and unconsolidated entities
|
||||||||||||||||||
|
2013
|
$
|
—
|
|
$
|
—
|
|
$
|
190
|
|
$
|
21
|
|
$
|
—
|
|
$
|
211
|
|
|
2012
|
$
|
—
|
|
$
|
—
|
|
$
|
191
|
|
$
|
21
|
|
$
|
1
|
|
$
|
213
|
|
|
2011
|
$
|
—
|
|
$
|
—
|
|
$
|
191
|
|
$
|
21
|
|
$
|
1
|
|
$
|
213
|
|
|
Total assets
(3)
|
||||||||||||||||||
|
2013
|
$
|
7,578
|
|
$
|
1,326
|
|
$
|
2,299
|
|
$
|
1,916
|
|
$
|
1,379
|
|
$
|
14,498
|
|
|
2012
|
$
|
4,697
|
|
$
|
1,319
|
|
$
|
2,386
|
|
$
|
2,003
|
|
$
|
2,187
|
|
$
|
12,592
|
|
|
2011
|
$
|
4,694
|
|
$
|
1,256
|
|
$
|
2,435
|
|
$
|
1,917
|
|
$
|
2,332
|
|
$
|
12,634
|
|
|
(1) Net pension and postretirement cost (credit) excludes special items, as well as the recognition of curtailments, settlements and special termination benefits due to closures, restructuring or divestitures. See
Note 10: Pension and Other Postretirement Benefit Plans
for more information.
(2) See Note 20: Charges for Restructuring, Closures and Asset Impairments for more information
(3) Timberlands total assets increased primarily due to the acquisition of Longview Timber. See
Note 3: Longview Timber Purchase
for more information.
|
||||||||||||||||||
NOTE 3:
LONGVIEW TIMBER PURCHASE
On
July 23, 2013
, we purchased
100 percent
of the equity interests in Longview Timber LLC (Longview Timber) for
$1.58 billion
cash and assumed debt of
$1.07 billion
, for an aggregate purchase price of
$2.65 billion
. Longview Timber was a privately-held Delaware limited liability company engaged in the ownership and management of approximately
645,000
acres of timberlands in Oregon and Washington. We believe Longview Timber has productive lands with favorable age class distribution that will provide us with optionality for harvest. Earnings, assets and liabilities from this business are reported as part of the Timberlands segment beginning in third quarter 2013.
Summarized Unaudited Pro Forma Information that Presents Combined Amounts as if this Acquisition Occurred at the Beginning of 2012
WEYERHAEUSER COMPANY >
2013 ANNUAL REPORT AND FORM 10-K
65
|
DOLLAR AMOUNTS IN MILLIONS, EXCEPT PER-SHARE FIGURES
|
||||||
|
|
2013
|
|
2012
|
|
||
|
Net sales
|
$
|
8,646
|
|
$
|
7,236
|
|
|
Net earnings attributable to Weyerhaeuser common shareholders
|
$
|
557
|
|
$
|
348
|
|
|
Net earnings per share attributable to Weyerhaeuser common shareholders, basic
|
$
|
0.96
|
|
$
|
0.61
|
|
|
Net earnings per share attributable to Weyerhaeuser common shareholders, diluted
|
$
|
0.95
|
|
$
|
0.60
|
|
Estimated Fair Values of Identifiable Assets Acquired and Liabilities Assumed as of the Acquisition Date
|
DOLLAR AMOUNTS IN MILLIONS
|
|||||||||
|
|
July 23,
2013 |
|
Measurement Period Adjustments
|
|
December 31,
2013 |
|
|||
|
Current assets
|
$
|
46
|
|
$
|
—
|
|
$
|
46
|
|
|
Property and equipment
|
39
|
|
1
|
|
40
|
|
|||
|
Timber and timberlands
|
2,654
|
|
2
|
|
2,656
|
|
|||
|
Other assets
|
2
|
|
—
|
|
2
|
|
|||
|
Total assets acquired
|
2,741
|
|
3
|
|
2,744
|
|
|||
|
Current liabilities
|
10
|
|
—
|
|
10
|
|
|||
|
Long-term debt
|
1,122
|
|
—
|
|
1,122
|
|
|||
|
Other liabilities
|
5
|
|
3
|
|
8
|
|
|||
|
Total liabilities assumed
|
1,137
|
|
3
|
|
1,140
|
|
|||
|
Net assets acquired
|
$
|
1,604
|
|
$
|
—
|
|
$
|
1,604
|
|
The initial allocations of purchase price were recorded at the estimated fair value of assets acquired and liabilities assumed based upon the best information available to management. The purchase price allocation was finalized in the fourth quarter 2013. The measurement period adjustments reflect additional information obtained to record the fair value of certain assets acquired and liabilities assumed based on facts and circumstances existing as of the acquisition date.
In order to finance our purchase of Longview Timber, we issued the following:
|
•
|
29 million
common shares on
June 24, 2013
, at the price of
$27.75
per share for net proceeds of
$781 million
;
|
|
•
|
4.4 million
common shares on
July 8, 2013
, at the price of
$27.75
per share for net proceeds of
$116 million
, in connection with the exercise of an overallotment option; and
|
|
•
|
13.8 million
of our 6.375 percent Mandatory Convertible Preference Shares, Series A, par value
$1.00
and liquidation preference of
$50.00
per share on
June 24, 2013
, for net proceeds of
$669 million
. See
Note 18: Shareholders' Interest
for more
|
For issuances of shares, excess of par value is recorded in "Other capital" in our
Consolidated Balance Sheet
.
Proceeds were used to finance the acquisition and pay related fees and expenses. We paid
$11 million
in fees related to a bridge loan in 2013. As of the close of the Longview Timber purchase, we did not use the loan and these fees were expensed in 2013, which is recorded in "Interest expense" in our
Consolidated Statement of Operations
.
We obtained additional debt financing in 2013 which was used to repay all of the assumed debt in 2013. See
Note 15: Long-term Debt
.
NOTE 4:
REAL ESTATE DIVESTITURE
On June 16, 2013, we announced that our Board of Directors authorized the exploration of strategic alternatives with respect to Weyerhaeuser Real Estate Company (WRECO), our homebuilding and real estate development business. The Board indicated that it intended to consider a broad range of alternatives including, but not limited to, continuing to operate WRECO, or a merger, sale or spin-off of the business.
On November 4, 2013, we announced that we had entered into a transaction agreement dated as of November 3, 2013 with TRI Pointe Homes, Inc. (TRI Pointe). Pursuant to the transaction agreement, WRECO will be divested through a Reverse Morris Trust transaction and ultimately become a wholly owned subsidiary of TRI Pointe.
We intend to exclude certain assets of our real estate business from the transaction. The most significant of these entails a large master-planned community located north of Las Vegas, Nevada (the "Coyote Springs Property
”
). During fourth quarter 2013 we recorded a
$356 million
non-cash impairment charge relating to the Coyote Springs Property, which is excluded from the transaction agreement with Tri Pointe Homes, Inc., as a result of management determining that our strategy for development will differ from the prior development plan. More information about this asset impairment can be found in
Note 20: Charges for Restructuring, Closures and Asset Impairments
.
We expect the transaction to close in second quarter 2014.
WEYERHAEUSER COMPANY >
2013 ANNUAL REPORT AND FORM 10-K
66
NOTE 5:
DISCONTINUED OPERATIONS
There are no operations classified as discontinued in December 31, 2013 or December 31, 2012. Discontinued operations in December 31, 2011 include our hardwoods and Westwood Shipping Lines operations, both of which were sold in third quarter 2011.
OPERATIONS INCLUDED IN DISCONTINUED OPERATIONS
Discontinued Operations
|
Operations
|
Disposition
|
Segment where activities
were included
|
Pretax gain or loss on sale
|
|
Hardwoods
|
Sold 2011 — third quarter
|
Wood Products
|
$22 million loss in Wood Products
|
|
Westwood Shipping Lines
|
Sold 2011 — third quarter
|
Corporate and Other
|
$49 million gain in Unallocated Items
|
Sale of Hardwoods
On
August 1, 2011
, we completed the sale of our hardwoods operations to American Industrial Partners for consideration of
$109 million
, of which
$25 million
was a note receivable. During second quarter 2011, we reduced our hardwoods assets to their fair value less selling costs which resulted in the recognition of a
$9 million
charge. An additional
$10 million
pension curtailment charge was recognized in third quarter 2011 when the transaction closed. Total pre-tax charges on the sale of
$22 million
were recorded in our Wood Products segment. We recognized a tax benefit on the sale of
$8 million
, resulting in a year-to-date net loss of
$14 million
.
The following operating assets were included as part of the transaction:
|
•
|
seven primary hardwood mills with a total capacity of 300 million board feet,
|
|
•
|
four concentration yards,
|
|
•
|
three remanufacturing plants,
|
|
•
|
one log merchandising yard and
|
|
•
|
sales offices in the U.S., Canada, Japan, China and Hong Kong.
|
Sale of Westwood Shipping Lines
On
September 30, 2011
, we completed the sale of Westwood Shipping Lines to J-WesCo of Japan for
$58 million
in cash. We recognized a pre-tax gain of
$49 million
in Unallocated Items and recorded tax expense of
$18 million
, resulting in a net gain of
$31 million
. This transaction also reduced our operating lease obligations by approximately
$130 million
.
NET EARNINGS FROM DISCONTINUED OPERATIONS
Sales and Net Earnings from Discontinued Operations
|
DOLLAR AMOUNTS IN MILLIONS
|
|||
|
|
2011
|
|
|
|
Net sales:
|
|||
|
Hardwoods
|
$
|
222
|
|
|
Westwood Shipping Lines
|
180
|
|
|
|
Total net sales from discontinued operations
|
$
|
402
|
|
|
Loss from operations:
|
|||
|
Hardwoods
|
$
|
(3
|
)
|
|
Westwood Shipping Lines
|
—
|
|
|
|
Other discontinued operations
|
(13
|
)
|
|
|
Total loss from discontinued operations
|
(16
|
)
|
|
|
Income taxes
|
5
|
|
|
|
Net loss from operations
|
(11
|
)
|
|
|
Net gain (loss) on sale (after-tax):
|
|||
|
Hardwoods
|
(14
|
)
|
|
|
Westwood Shipping Lines
|
31
|
|
|
|
Sale of property
|
6
|
|
|
|
Net earnings from discontinued operations
|
$
|
12
|
|
Results of discontinued operations exclude certain general corporate overhead costs that have been allocated to and are included in contribution to earnings for the operating segments.
Other discontinued operations relate to gains or losses for businesses we have divested in prior years and are included in Unallocated Items. During 2011 we increased our reserve for estimated future environmental remediation costs and recognized an
$11 million
charge associated with discontinued operations.
WEYERHAEUSER COMPANY >
2013 ANNUAL REPORT AND FORM 10-K
67
NOTE 6:
NET EARNINGS PER SHARE
Our basic earnings per share attributable to Weyerhaeuser common shareholders for the last three years were:
|
•
|
$0.95
in
2013
,
|
|
•
|
$0.71
in
2012
and
|
|
•
|
$0.62
in
2011
.
|
Our diluted earnings per share attributable to Weyerhaeuser common shareholders for the last three years were:
|
•
|
$0.95
in
2013
,
|
|
•
|
$0.71
in
2012
and
|
|
•
|
$0.61
in
2011
.
|
This note discloses:
|
•
|
how we calculate basic and diluted net earnings per share and
|
|
•
|
shares excluded from dilutive effect.
|
HOW WE CALCULATE BASIC AND DILUTED NET EARNINGS PER SHARE
"Basic earnings" per share is net earnings available to common shareholders divided by the weighted average number of our outstanding common shares, including stock equivalent units where there is no circumstance under which those shares would not be issued.
"Diluted earnings" per share is net earnings available to common shareholders divided by the sum of the:
|
•
|
weighted average number of our outstanding common shares and
|
|
•
|
the effect of our outstanding dilutive potential common shares.
|
Dilutive potential common shares may include:
|
•
|
outstanding stock options,
|
|
•
|
restricted stock units,
|
|
•
|
performance share units and
|
|
•
|
preference shares.
|
We use the treasury stock method to calculate the effect of our outstanding stock options, restricted stock units and performance share units. Share-based payment awards that are contingently issuable upon the achievement of specified performance or market conditions are included in our diluted earnings per share calculation in the period in which the conditions are satisfied.
We use the if-converted method to calculate the effect of our outstanding preference shares. In applying the if-converted method, conversion is not assumed for purposes of computing diluted earnings per share if the effect would be antidilutive. Preference shares are antidilutive whenever the amount of the dividend declared in or accumulated for the current period per common share obtainable on conversion exceeds diluted earnings per share exclusive of the preference shares.
Preference shares are evaluated for participation on a quarterly basis to determine whether two-class presentation is required. Preference shares are considered to be participating as of the financial reporting period end to the extent they would participate in dividends paid to common shareholders. Preference shares are not considered participating for the year ended December 31, 2013. Under the provisions of the two-class method, basic and diluted earnings per share would be presented for both preference and common shareholders.
SHARES EXCLUDED FROM DILUTIVE EFFECT
The following shares were not included in the computation of diluted earnings per share because they were either antidilutive or the required performance or market conditions were not met. Some or all of these shares may be dilutive potential common shares in future periods.
We issued
13.8 million
6.375 percent Mandatory Convertible Preference Shares, Series A on
June 24, 2013
. We do not include these shares in our calculation of diluted earnings per share because they are antidilutive. See
Note 3: Longview Timber Purchase
.
Potential Shares Not Included in the Computation of Diluted Earnings per Share
|
Shares in thousands
|
2013
|
|
2012
|
|
2011
|
|
|
Stock options
|
4,618
|
|
3,519
|
|
23,363
|
|
|
Performance share units
|
—
|
|
—
|
|
396
|
|
|
Preference Shares
|
24,865
|
|
—
|
|
—
|
|
WEYERHAEUSER COMPANY >
2013 ANNUAL REPORT AND FORM 10-K
68
NOTE 7:
INVENTORIES
Inventories include raw materials, work-in-process and finished goods.
Inventories as of the End of Our Last Two Years
|
DOLLAR AMOUNTS IN MILLIONS
|
||||||
|
|
DECEMBER 31,
2013 |
|
DECEMBER 31,
2012 |
|
||
|
LIFO inventories:
|
||||||
|
Logs and chips
|
$
|
15
|
|
$
|
17
|
|
|
Lumber, plywood, panels and engineered lumber
|
46
|
|
46
|
|
||
|
Pulp and paperboard
|
97
|
|
121
|
|
||
|
Other products
|
11
|
|
8
|
|
||
|
FIFO or moving average cost inventories:
|
||||||
|
Logs and chips
|
33
|
|
28
|
|
||
|
Lumber, plywood, panels and engineered lumber
|
70
|
|
66
|
|
||
|
Pulp and paperboard
|
30
|
|
19
|
|
||
|
Other products
|
94
|
|
87
|
|
||
|
Materials and supplies
|
146
|
|
139
|
|
||
|
Total
|
$
|
542
|
|
$
|
531
|
|
If we used FIFO for all inventories, our stated inventories would have been higher by
$112 million
as of both
December 31, 2013
and
December 31, 2012
.
HOW WE ACCOUNT FOR OUR INVENTORIES
The Inventories section of
Note 1: Summary of Significant Accounting Policies
provides details about how we account for our inventories.
NOTE 8:
PROPERTY AND EQUIPMENT
Property and equipment includes land, buildings and improvements, machinery and equipment, roads and other items.
Carrying Value of Property and Equipment and Estimated Service Lives
|
DOLLAR AMOUNTS IN MILLIONS
|
|||||||
|
|
RANGE OF LIVES
|
DECEMBER 31,
2013 |
|
DECEMBER 31,
2012 |
|
||
|
Property and equipment, at cost:
|
|
|
|
||||
|
Land
|
N/A
|
$
|
129
|
|
$
|
129
|
|
|
Buildings and improvements
|
5–40
|
1,275
|
|
1,327
|
|
||
|
Machinery and equipment
|
2–25
|
6,742
|
|
6,926
|
|
||
|
Roads
|
10–20
|
594
|
|
549
|
|
||
|
Other
|
3–10
|
332
|
|
329
|
|
||
|
Total cost
|
|
9,072
|
|
9,260
|
|
||
|
Allowance for depreciation and amortization
|
|
(6,368
|
)
|
(6,388
|
)
|
||
|
Property and equipment, net
|
|
$
|
2,704
|
|
$
|
2,872
|
|
SERVICE LIVES AND DEPRECIATION
Buildings and improvements for property and equipment have estimated lives that are generally at either the high end or low end of the range from
5 years
to
40 years
, depending on the type and performance of construction.
The maximum service lives for machinery and equipment varies among our operations:
|
•
|
Real Estate —
5 years
;
|
|
•
|
Timberlands —
15 years
;
|
|
•
|
Wood products manufacturing facilities —
20 years
; and
|
|
•
|
Primary pulp mills —
25 years
.
|
Depreciation expense, excluding discontinued operations, was:
|
•
|
$346 million
in
2013
,
|
|
•
|
$344 million
in
2012
and
|
|
•
|
$374 million
in
2011
.
|
NOTE 9:
EQUITY AFFILIATES
We have investments in unconsolidated equity affiliates over which we have significant influence that we account for using the equity method with taxes provided on undistributed earnings. We record earnings and accrue taxes in the period that the earnings are recorded by the affiliates.
WEYERHAEUSER COMPANY >
2013 ANNUAL REPORT AND FORM 10-K
69
Following is a list of our equity affiliates as of
December 31, 2013
:
Details About Our Equity Affiliates
|
AFFILIATE
|
WHAT IT DOES
|
OUR
OWNERSHIP
|
|
North Pacific Paper Corporation (NORPAC)
|
Owns and operates a newsprint manufacturing facility in Longview, Washington
|
50 percent
|
|
Catchlight Energy
|
Researching and developing technology for converting cellulose-based biomass into economical, low-carbon biofuels
|
50 percent
|
As of
December 31, 2013
, our Real Estate segment held equity investments in
five
real estate partnerships and limited liability companies. Our participation in these entities may be as a developer, a builder or an investment partner. Our ownership percentage varies from
7 percent
to
50 percent
depending on the investment.
During 2013, we sold part of our investment in Liaison Technologies Inc. and recognized an
$10 million
pretax gain, which is recorded in "Interest income and other" in our
Consolidated Statement of Operations
. Our remaining investment is accounted for under the cost method.
Unconsolidated Financial Information of Equity Affiliates
Aggregated assets, liabilities and operating results of the entities that we accounted for as equity affiliates are provided below.
Assets and Liabilities of Equity Affiliates
|
DOLLAR AMOUNTS IN MILLIONS
|
||||||
|
|
DECEMBER 31,
2013 |
|
DECEMBER 31,
2012 |
|
||
|
Current assets
|
$
|
141
|
|
$
|
201
|
|
|
Noncurrent assets
|
$
|
723
|
|
$
|
817
|
|
|
Current liabilities
|
$
|
125
|
|
$
|
175
|
|
|
Noncurrent liabilities
|
$
|
141
|
|
$
|
176
|
|
Operating Results of Equity Affiliates
|
DOLLAR AMOUNTS IN MILLIONS
|
|||||||||
|
|
2013
|
|
2012
|
|
2011
|
|
|||
|
Net sales
|
$
|
540
|
|
$
|
644
|
|
$
|
615
|
|
|
Operating income (loss)
|
$
|
(1
|
)
|
$
|
10
|
|
$
|
(2
|
)
|
|
Net loss
|
$
|
(1
|
)
|
$
|
(3
|
)
|
$
|
(1
|
)
|
Doing Business with Affiliates
Doing business with our affiliates varies by the individual affiliate. We:
|
•
|
provide a varying mix of goods and services to some of our affiliates and
|
|
•
|
buy finished products from some of our affiliates.
|
The goods and services we provide include:
|
•
|
raw materials,
|
|
•
|
management and marketing services,
|
|
•
|
support services and
|
|
•
|
shipping services.
|
In addition, we manage cash for NORPAC under a services agreement. Weyerhaeuser holds the cash and records a payable balance to NORPAC, which is included in accounts payable in the accompanying
Consolidated Balance Sheet
. We had the following payable balances to NORPAC:
|
•
|
$93 million
at
December 31, 2013
; and
|
|
•
|
$102 million
at
December 31, 2012
.
|
NOTE 10:
PENSION AND OTHER POSTRETIREMENT BENEFIT PLANS
We sponsor several retirement programs for our employees.
This note provides details about:
|
•
|
types of plans we sponsor,
|
|
•
|
significant transactions and events affecting plans we sponsor,
|
|
•
|
funded status of plans we sponsor,
|
|
•
|
pension assets,
|
|
•
|
activity of plans we sponsor and
|
|
•
|
actuarial assumptions.
|
TYPES OF PLANS WE SPONSOR
The plans we sponsor in the U.S. and Canada differ according to each country’s requirements.
WEYERHAEUSER COMPANY >
2013 ANNUAL REPORT AND FORM 10-K
70
In the U.S., our pension plans are:
|
•
|
qualified — plans that qualify under the Internal Revenue Code; and
|
|
•
|
nonqualified — plans for select employees that provide additional benefits not qualified under the Internal Revenue Code.
|
In Canada, our pension plans are:
|
•
|
registered — plans that are registered under the Income Tax Act and applicable provincial pension acts; and
|
|
•
|
nonregistered — plans for select employees that provide additional benefits that may not be registered under the Income Tax Act or provincial pension acts.
|
We also offer retiree medical and life insurance plans in the U.S. and Canada. These plans are referred to as other postretirement benefit plans in the following disclosures.
Employee Eligibility and Accounting
The Pension and Other Postretirement Benefit Plans section of
Note 1: Summary of Significant Accounting Policies
provides information about employee eligibility for pension plans and postretirement health care and life insurance benefits, as well as how we account for the plans and benefits. See "Effects of Significant Transactions and Events" below for changes to eligibility in the pension and other postretirement benefit plans.
Measurement Date
We measure the fair value of pension plan assets and pension and other postretirement benefit obligations as of the end of our fiscal year. The fair value of pension plan assets are estimated at the end of the year and are revised in the first half of the following year when the information needed to finalize fair values is received. There were no significant events that triggered remeasurement in 2013, 2012 or 2011.
EFFECTS OF SIGNIFICANT TRANSACTIONS AND EVENTS
The information that is provided in this note is affected by the following transactions and events.
Amendments of Pension and Other Postretirement Benefit Plans for Salaried Employees
Pension Benefit Plan Amendments
During fourth quarter 2013, we ratified an amendment to the Weyerhaeuser Pension Plan that closes the plan to newly hired and rehired salaried or non union employees effective January 1, 2014. Beginning January 1,2014, new hires will receive a company contribution for retirement in their 401(k) plan. The change was announced in December 2013.
During fourth quarter 2013, we ratified amendments to the Weyerhaeuser Company Limited Retirement Plan for Non-Union Employees and the Retirement Plan for Non-Union Employees of Weyerhaeuser Company Limited at Grand Prairie, Alberta and Grande Cache, Alberta that (1) closes these plans to new hires and rehires effective January 1, 2014 and (2) changes the early retirement reduction for current employees enrolled in these plans, effective for future years of service beginning January 1, 2016. Theses changes were announced to participants in December 2013.
During 2012 we ratified amendments to the Weyerhaeuser Pension Plan for various collectively bargained benefits. These changes increased the projected benefit obligation by
$12 million
.
During fourth quarter 2011, we ratified an amendment to the Weyerhaeuser Pension Plan that eliminated the Retiree Medical Enhancement for active employees effective July 1, 2012. This change reduced the Plan's projected benefit obligation by
$16 million
. This change was announced to affected participants in January 2012.
Postretirement Medical and Life Insurance Benefit Plan Amendments
During fourth quarter 2013, the decision was ratified to eliminate Company funding of the Post-Medicare Health Reimbursement Account (HRA) for certain salaried retirees. This change resulted in a
$70 million
reduction in the Company's postretirement liability as of December 31, 2013. This change was communicated to affected retirees during January, 2014.
During fourth quarter 2011, we ratified amendments to our postretirement medical and life insurance benefit plans for U.S. salaried employees that reduced or eliminated certain medical and life insurance benefits that were available to both past and present employees. The changes included the elimination of the Pre-Medicare Plan II company subsidy for those not enrolled as of July 1, 2012, and eliminated the Post-Medicare Health Reimbursement Account for those not enrolled or Medicare eligible, if enrolled, as of July 1, 2012. These changes resulted in a
$108 million
reduction in the company's postretirement liability as of December 31, 2011. These changes were announced to affected participants in January 2012.
Restructuring Activities
The information that is provided in this note is affected by company restructuring activities that occurred in 2011. There were
no
restructuring activities in
2013
or 2012 that affected the information provided in this note.
2011 Restructuring
The 2011 curtailments and special termination benefits are related to involuntary terminations due to company-wide restructuring activities, and the sale of our hardwoods and Westwood Shipping Lines operations. The total curtailment charge for U.S. pension plans was
$9 million
. In addition, we recognized a
$3 million
settlement charge for a Canadian pension plan in fourth quarter 2011. There were
no
curtailment charges or credits to the U.S. or Canadian postretirement plans.
Termination benefits were provided under the pension plan in the U.S. for those terminated employees who were not yet eligible to retire but whose age plus service was at least 65 and had at least ten years of service (Rule of 65). Special termination charges were
$6 million
.
WEYERHAEUSER COMPANY >
2013 ANNUAL REPORT AND FORM 10-K
71
FUNDED STATUS OF PLANS WE SPONSOR
The funded status of the plans we sponsor is determined by comparing the projected benefit obligation with the fair value of plan assets at the end of the year.
Changes in Projected Benefit Obligations of Our Pension and Other Postretirement Benefit Plans
|
DOLLAR AMOUNTS IN MILLIONS
|
||||||||||||
|
|
PENSION
|
OTHER
POSTRETIREMENT
BENEFITS
|
||||||||||
|
|
2013
|
|
2012
|
|
2013
|
|
2012
|
|
||||
|
Reconciliation of projected benefit obligation:
|
|
|
|
|
||||||||
|
Projected benefit obligation beginning of year
|
$
|
6,575
|
|
$
|
5,841
|
|
$
|
433
|
|
$
|
402
|
|
|
Service cost
|
64
|
|
53
|
|
1
|
|
1
|
|
||||
|
Interest cost
|
244
|
|
262
|
|
12
|
|
15
|
|
||||
|
Plan participants’ contributions
|
—
|
|
—
|
|
16
|
|
18
|
|
||||
|
Actuarial (gains) losses
|
(666
|
)
|
708
|
|
(23
|
)
|
(1
|
)
|
||||
|
Foreign currency exchange rate changes
|
(66
|
)
|
22
|
|
(5
|
)
|
2
|
|
||||
|
Benefits paid (includes lump sum settlements)
|
(317
|
)
|
(323
|
)
|
(50
|
)
|
(53
|
)
|
||||
|
Plan amendments and other
|
—
|
|
12
|
|
(66
|
)
|
49
|
|
||||
|
Acquisitions
|
—
|
|
—
|
|
3
|
|
—
|
|
||||
|
Projected benefit obligation at end of year
|
$
|
5,834
|
|
$
|
6,575
|
|
$
|
321
|
|
$
|
433
|
|
Changes in Fair Value of Plan Assets
|
DOLLAR AMOUNTS IN MILLIONS
|
||||||||||||
|
|
PENSION
|
OTHER
POSTRETIREMENT
BENEFITS
|
||||||||||
|
|
2013
|
|
2012
|
|
2013
|
|
2012
|
|
||||
|
Fair value of plan assets at beginning of year (estimated)
|
$
|
5,022
|
|
$
|
4,714
|
|
$
|
—
|
|
$
|
—
|
|
|
Adjustment for final fair value of plan assets
|
55
|
|
16
|
|
—
|
|
—
|
|
||||
|
Actual return on plan assets
|
808
|
|
490
|
|
—
|
|
—
|
|
||||
|
Foreign currency exchange rate changes
|
(57
|
)
|
15
|
|
—
|
|
—
|
|
||||
|
Employer contributions and benefit payments
|
103
|
|
110
|
|
34
|
|
35
|
|
||||
|
Plan participants’ contributions
|
—
|
|
—
|
|
16
|
|
18
|
|
||||
|
Benefits paid (includes lump sum settlements)
|
(317
|
)
|
(323
|
)
|
(50
|
)
|
(53
|
)
|
||||
|
Fair value of plan assets at end of year (estimated)
|
$
|
5,614
|
|
$
|
5,022
|
|
$
|
—
|
|
$
|
—
|
|
Funded Status of Our Pension and Other Postretirement Benefit Plans
|
DOLLAR AMOUNTS IN MILLIONS
|
||||||||||||
|
|
PENSION
|
OTHER
POSTRETIREMENT
BENEFITS
|
||||||||||
|
|
2013
|
|
2012
|
|
2013
|
|
2012
|
|
||||
|
Noncurrent assets
|
$
|
35
|
|
$
|
2
|
|
$
|
—
|
|
$
|
—
|
|
|
Current liabilities
|
(22
|
)
|
(21
|
)
|
(35
|
)
|
(37
|
)
|
||||
|
Noncurrent liabilities
|
(233
|
)
|
(1,534
|
)
|
(283
|
)
|
(396
|
)
|
||||
|
Funded status
|
$
|
(220
|
)
|
$
|
(1,553
|
)
|
$
|
(318
|
)
|
$
|
(433
|
)
|
Changes in actuarial assumptions, primarily discount rates, used to calculate our pension liabilities and increase in asset values resulted in an decrease of
$733 million
in the liabilities, which had a positive effect on the funded status of the pension plans as of the end of 2013. The discount rates increased from
3.70 percent
at the end of 2012 to
4.90 percent
at the end of 2013 for the U.S. plans. The discount rates increased from
4.10 percent
at the end of 2012 to
4.70 percent
at the end of 2013 for the Canadian plans.
Our qualified and registered pension plans and a portion of our nonregistered pension plans are funded. We contribute to these plans according to established funding standards. The nonqualified pension plan, a portion of the nonregistered pension plans, and the other postretirement benefit plans are unfunded. For the unfunded plans, we pay benefits to retirees from our general assets as they come due.
The values reported for our pension plan assets at the end of
2013
and
2012
were estimated. Additional information regarding the year-end values generally becomes available to us during the first half of the following year. We increased the fair value of plan assets by
$55 million
to reflect final valuations as of
December 31, 2012
.
WEYERHAEUSER COMPANY >
2013 ANNUAL REPORT AND FORM 10-K
72
During
2013
, we contributed
$79 million
for our Canadian registered plans, we made contributions and benefit payments of
$3 million
for our Canadian nonregistered pension plans and made benefit payments of
$21 million
for our nonqualified pension plans.
The asset or liability on our
Consolidated Balance Sheet
representing the funded status of the plans is different from the cumulative income or expense that we have recorded related to these plans. These differences are actuarial gains and losses and prior service costs and credits that are deferred and will be amortized into our periodic benefit costs in future periods. These unamortized amounts are recorded in "Cumulative Other Comprehensive Loss", which is a component of total equity on our
Consolidated Balance Sheet
. The Cumulative Other Comprehensive Income (Loss) section of
Note 18: Shareholder's Interest
details changes in the amounts included in cumulative other comprehensive income (loss) by component.
Accumulated Benefit Obligations Greater Than Plan Assets
As of
December 31, 2013
, pension plans with accumulated benefit obligations greater than plan assets had:
|
•
|
$971 million
in projected benefit obligations,
|
|
•
|
$948 million
in accumulated benefit obligations and
|
|
•
|
assets with a fair value of
$726 million
.
|
As of
December 31, 2012
, pension plans with accumulated benefit obligations greater than plan assets had:
|
•
|
$6.6 billion
in projected benefit obligations,
|
|
•
|
$6.4 billion
in accumulated benefit obligations and
|
|
•
|
assets with a fair value of
$5 billion
.
|
The accumulated benefit obligation for all of our defined benefit pension plans was:
|
•
|
$5.7 billion
at
December 31, 2013
; and
|
|
•
|
$6.4 billion
at
December 31, 2012
.
|
PENSION ASSETS
Our Investment Policies and Strategies
Our investment policies and strategies guide and direct how we manage funds for the benefit plans we sponsor. These funds include our:
|
•
|
U.S. Pension Trust — funds our U.S. qualified pension plans;
|
|
•
|
Canadian Pension Trust — funds our Canadian registered pension plans; and
|
|
•
|
Retirement Compensation Arrangements — fund a portion of our Canadian nonregistered pension plans.
|
U.S. and Canadian Pension Trusts
Our U.S. pension trust holds the funds for our U.S. qualified pension plans, while our Canadian pension trust holds the funds for our Canadian registered pension plans.
Our strategy within the trusts is to invest:
|
•
|
directly in a diversified mix of nontraditional investments; and
|
|
•
|
indirectly through derivatives to promote effective use of capital, increase returns and manage associated risk.
|
Consistent with past practice and in accordance with investment guidelines established by the company’s investment committee, the investment managers of the company’s pension plan asset portfolios utilize a diversified set of investment strategies.
Our direct investments include:
|
•
|
cash and short-term investments,
|
|
•
|
hedge funds,
|
|
•
|
private equity,
|
|
•
|
real estate fund investments and
|
|
•
|
common and preferred stocks.
|
Our indirect investments include:
|
•
|
equity index derivatives,
|
|
•
|
fixed income derivatives and
|
|
•
|
swaps and other derivative instruments.
|
The overall return for our pension trusts includes:
|
•
|
returns earned on our direct investments and
|
|
•
|
returns earned on the derivatives we use.
|
Cash and short-term investments generally consist of highly liquid money market and government securities and are primarily held to fund benefit payments, capital calls and margin requirements.
Hedge fund investments generally consist of privately-offered managed pools primarily structured as limited liability entities, with the general members or partners of such limited liability entities serving as portfolio manager and thus being responsible for the fund’s underlying investment decisions. Generally, these funds have varying degrees of liquidity and redemption provisions. Underlying investments within these funds may include long and short public and private equities, corporate, mortgage and sovereign debt, options, swaps, forwards and other derivative positions. These funds may also use varying degrees of leverage.
Private equity investments consist of investments in private equity, mezzanine, distressed, co-investments and other structures. Private equity funds generally participate in buyouts and venture capital of limited liability entities
through unlisted equity and debt instruments. These funds may also employ borrowing at the underlying entity level. Mezzanine and distressed funds generally follow strategies of investing in the debt of public or private companies with additional participation through warrants or other equity type options.
WEYERHAEUSER COMPANY >
2013 ANNUAL REPORT AND FORM 10-K
73
Real estate fund investments in real property may be initiated through private transactions between principals or public market vehicles such as real estate investment trusts and are generally held in limited liability entities.
Common and preferred stocks are equity instruments that generally have resulted from transactions related to private equity investment holdings.
Swaps and other derivative instruments generally are comprised of swaps, futures, forwards or options. In accordance with our investment risk and return objectives, some of these instruments are utilized to achieve target equity and bond asset exposure or to reduce exposure to certain market risks or to help manage the liquidity of our investments. The resulting asset mix achieved is intended to allow the assets to perform comparably with established benchmarks. Others, mainly total return swaps with limited exchange of principal, are designed to gain exposure to the return characteristics of specific financial strategies.
All swap, forward and option contracts are executed in a diversified manner through a number of financial institutions and in accordance with our investment guidelines.
Retirement Compensation Arrangements
Retirement Compensation Arrangements fund a portion of our Canadian nonregistered pension plans.
Under Retirement Compensation Arrangements, our contributions are split:
|
•
|
50 percent to our investments in a portfolio of equities; and
|
|
•
|
50 percent to a noninterest-bearing refundable tax account held by the Canada Revenue Agency — as required by Canadian tax rules.
|
The Canadian tax rules requirement means that — on average, over time — approximately 50 percent of our Canadian nonregistered pension plans’ assets do not earn returns.
Managing Risk
Investments and contracts, in general, are subject to risk, including market price, liquidity, currency, interest rate and credit risks. We have established governance practices to manage certain risks. The following provides an overview of these risks and describes actions we take to mitigate the potential adverse effects of these risks on the performance of our pension plan assets. Generally, we manage these risks through:
|
•
|
selection and diversification of managers and strategies,
|
|
•
|
use of limited-liability vehicles,
|
|
•
|
diversification and
|
|
•
|
constraining risk profiles to predefined limits on the percentage of pension trust assets that can be invested in certain categories.
|
Market price risk
is the risk that the future value of a financial instrument will fluctuate as a result of changes in its market price, whether caused by factors specific to the individual investment, its issuer, or any other market factor that may affect its price. We attempt to mitigate market price risk on the company’s pension plan asset portfolios by investing in a diversified set of assets whose returns exhibit low correlation to those of traditional asset classes and each other. In addition, we and our investment advisers monitor the investments on a regular basis to ensure the decision to invest in particular assets continues to be suitable, including performing ongoing qualitative and quantitative assessments and comprehensive investment and operational due diligence. Special attention is paid to organizational changes made by the underlying fund managers and to changes in policy relative to their investment objectives, valuation, hedging strategy, degree of diversification, leverage, alignment of fund principles and investors, risk governance and costs.
Liquidity risk
is the risk that the pension trusts will encounter difficulty in meeting obligations associated with their financial liabilities. Our financial obligations as they relate to the pension plans may consist of distributions and redemptions payable to pension plan participants, payments to counterparties and fees to service providers. As established, pension plan assets primarily consist of investments in limited liability pools for which there is no active secondary market. As a result, the investments may be illiquid. Further, hedge funds are subject to potential restrictions that may affect the timing of the realization of pending redemptions. Private equity funds are subject to distribution and funding schedules that are set by the private equity funds’ respective managers and market activity. To mitigate liquidity risk on the company’s pension plan asset portfolios, the hedge fund portfolios have been diversified across manager’s strategies and funds that possess varying liquidity provisions and the private equity portfolios have been diversified across different vintage years and strategies. In addition, the investment committee regularly reviews cash flows of the pension trusts and sets appropriate guidelines to address liquidity needs.
Currency risk
arises from holding pension plan assets denominated in a currency other than the currency in which its liabilities are settled. Such risk is managed generally through notional contracts designed to hedge the net exposure to non-functional currencies.
Interest rate risk
is the risk that a change in interest rates will adversely affect the fair value of fixed income securities. The pension trust’s primary exposure to interest rate risk is indirect and through their investments in limited liability pools. Such indirect exposure is managed by the respective fund managers in conjunction with their investment level decisions and predefined investment mandates.
Credit risk
relates to the extent to which failures by counterparties to discharge their obligations could reduce the amount of future cash flows on hand at the balance sheet date. The pension trusts’ exposure to counterparty credit risk is reflected as settlement receivables from derivative contracts within the pension plan assets. In evaluating credit risk, we will often be dependent upon information provided by the counterparty or a rating agency, which may be inaccurate. We decrease exposure to credit risk by only dealing with highly-rated financial counterparties, and as of year-end, our counterparties each had a credit rating of at least A from Standard and Poor’s.
We further manage this risk through:
|
•
|
diversification of counterparties,
|
|
•
|
predefined settlement and margining provisions and
|
|
•
|
documented agreements.
|
We expect that none of our counterparties will fail to meet its obligations. Also, no principal is at risk as a result of these types of investments. Only the amount of unsettled net receivables is at risk.
We are also exposed to credit risk indirectly through counterparty relationships struck by the underlying managers of investments in limited liability pools. This indirect exposure is mitigated through a due diligence process, which focuses on monitoring each investment fund to ensure the decision to invest in or maintain exposure to a fund continues to be suitable for the pension plans’ asset portfolios.
WEYERHAEUSER COMPANY >
2013 ANNUAL REPORT AND FORM 10-K
74
While we do not target specific direct investment or derivative allocations, we have established guidelines on the percentage of pension trust assets that can be invested in certain categories to provide diversification by investment type fund and investment managers, as well as to
manage overall liquidity.
Assets within our qualified and registered pension plans in our U.S. and Canadian pension trusts were invested as follows:
|
DECEMBER 31,
2013 |
|
DECEMBER 31,
2012 |
|
|
|
Fixed income
|
11.4
|
%
|
11.4
|
%
|
|
Hedge funds
|
57.5
|
|
55.3
|
|
|
Private equity and related funds
|
28.6
|
|
31.5
|
|
|
Real estate and related funds
|
1.8
|
|
1.8
|
|
|
Common and preferred stock and equity index instruments
|
0.9
|
|
0.4
|
|
|
Accrued liabilities
|
(0.2
|
)
|
(0.4
|
)
|
|
Total
|
100.0
|
%
|
100.0
|
%
|
Assets within our nonregistered plans that we are allowed to manage were invested as follows:
|
DECEMBER 31,
2013 |
|
DECEMBER 31,
2012 |
|
|
|
Equities
|
55.5
|
%
|
43.5
|
%
|
|
Cash and cash equivalents
|
44.5
|
|
56.5
|
|
|
Total
|
100.0
|
%
|
100.0
|
%
|
Valuation of Our Plan Assets
The pension assets are stated at fair value based upon the amount that would be received to sell an asset or paid to transfer a liability in an orderly transaction between market participants at the reporting date. We do not value pension investments based upon a forced or distressed sale scenario. Instead, we consider both observable and unobservable inputs that reflect assumptions applied by market participants when setting the exit price of an asset
or liability in an orderly transaction within the principal market of that asset or liability.
We value the pension plan assets based upon the observability of exit pricing inputs and classify pension plan assets based upon the lowest level input that is significant to the fair value measurement of the pension plan assets in their entirety. The fair value hierarchy we follow is outlined below;
Level 1: Inputs are unadjusted quoted prices for identical assets and liabilities traded in an active market.
Level 2: Inputs are quoted prices in non-active markets for which pricing inputs are observable either directly or indirectly at the reporting date.
Level 3: Inputs are derived from valuation techniques in which one or more significant inputs or value drivers are unobservable.
The pension assets are comprised of cash and short-term investments, derivative contracts, common and preferred stock and fund units. The fund units are typically limited liability interests in hedge funds, private equity funds, real estate funds and cash funds. Each of these assets participates in its own unique principal market.
Cash and short-term investments, when held directly, are valued at cost.
Common and preferred stocks are valued at exit prices quoted in the public markets.
Derivative contracts held by our pension trusts are not publicly traded and each derivative contract is specifically negotiated with a unique financial counterparty and references either illiquid fund units or a unique number of synthetic units of a publicly reported market index. The derivative contracts are valued based upon valuation statements received from the financial counterparties.
Fund units are valued based upon the net asset values of the funds which we believe represent the per-unit prices at which new investors are permitted to invest and the prices at which existing investors are permitted to exit. To the degree net asset values as of the end of the year have not been received, we use the most recently reported net asset values and adjust for market events and cash flows that have occurred between the interim date and the end of the year to estimate the fair values as of the end of the year.
Assets that do not have readily available quoted prices in an active market require a higher degree of judg
ment to value and have a higher degree of risk that the value that could have been realized upon sale as of the valuation date could be different from the reported value than assets with observable pricing inputs. It is possible that the full extent of market price, liquidity, currency, interest rate, or credit risks may not be fully factored into the fair values of our pension plan assets that use significant unobservable inputs. Approximately
$4.9 billion
, or
87.9 percent
, of
our pension plan assets were classified as Level 3 assets as of
December 31, 2013
.
We estimate the fair value of pension plan assets based upon the information available during the year-end reporting process. In some cases, primarily private equity funds, the information available consists of net asset values as of an interim date, cash flows between the interim date and the end of the year, and market events. When the difference is significant, we revise the year-end estimated fair value of pension plan assets to incorporate year-end net asset values received after we have filed our annual report on Form 10-K. We increased the fair value of
pension assets in the second quarter of 2013 by
$55 million
, or
1.1 percent
.
WEYERHAEUSER COMPANY >
2013 ANNUAL REPORT AND FORM 10-K
75
The net pension plan assets, when categorized in accordance with this fair value hierarchy, are as follows:
|
DOLLAR AMOUNTS IN MILLIONS
|
||||||||||||
|
2013
|
Level 1
|
|
Level 2
|
|
Level 3
|
|
Total
|
|
||||
|
Pension trust investments:
|
|
|
|
|
||||||||
|
Fixed income instruments
|
$
|
567
|
|
$
|
68
|
|
$
|
3
|
|
$
|
638
|
|
|
Hedge funds
|
—
|
|
(7
|
)
|
3,225
|
|
3,218
|
|
||||
|
Private equity and related funds
|
—
|
|
(2
|
)
|
1,606
|
|
1,604
|
|
||||
|
Real estate and related funds
|
—
|
|
—
|
|
101
|
|
101
|
|
||||
|
Common and preferred stock and equity index instruments
|
23
|
|
29
|
|
—
|
|
52
|
|
||||
|
Total pension trust investments
|
$
|
590
|
|
$
|
88
|
|
$
|
4,935
|
|
$
|
5,613
|
|
|
Accrued liabilities, net
|
(13
|
)
|
||||||||||
|
Pension trust net assets
|
$
|
5,600
|
|
|||||||||
|
Canadian nonregistered plan assets:
|
||||||||||||
|
Cash
|
$
|
8
|
|
$
|
—
|
|
$
|
—
|
|
$
|
8
|
|
|
Investments
|
6
|
|
—
|
|
—
|
|
6
|
|
||||
|
Total Canadian nonregistered plan assets
|
$
|
14
|
|
$
|
—
|
|
$
|
—
|
|
$
|
14
|
|
|
Total plan assets
|
$
|
5,614
|
|
|||||||||
|
DOLLAR AMOUNTS IN MILLIONS
|
||||||||||||
|
2012
|
Level 1
|
|
Level 2
|
|
Level 3
|
|
Total
|
|
||||
|
Pension trust investments:
|
|
|
|
|
||||||||
|
Fixed income instruments
|
$
|
476
|
|
$
|
93
|
|
$
|
4
|
|
$
|
573
|
|
|
Hedge funds
|
—
|
|
—
|
|
2,767
|
|
2,767
|
|
||||
|
Private equity and related funds
|
—
|
|
(2
|
)
|
1,577
|
|
1,575
|
|
||||
|
Real estate and related funds
|
—
|
|
—
|
|
91
|
|
91
|
|
||||
|
Common and preferred stock and equity index instruments
|
17
|
|
4
|
|
—
|
|
21
|
|
||||
|
Total pension trust investments
|
$
|
493
|
|
$
|
95
|
|
$
|
4,439
|
|
$
|
5,027
|
|
|
Accrued liabilities, net
|
(19
|
)
|
||||||||||
|
Pension trust net investments
|
$
|
5,008
|
|
|||||||||
|
Canadian nonregistered plan assets:
|
||||||||||||
|
Cash
|
$
|
8
|
|
$
|
—
|
|
$
|
—
|
|
$
|
8
|
|
|
Investments
|
6
|
|
—
|
|
—
|
|
6
|
|
||||
|
Total Canadian nonregistered plan assets
|
$
|
14
|
|
$
|
—
|
|
$
|
—
|
|
$
|
14
|
|
|
Total plan assets
|
$
|
5,022
|
|
|||||||||
WEYERHAEUSER COMPANY >
2013 ANNUAL REPORT AND FORM 10-K
76
A reconciliation of the beginning and ending balances of the pension plan assets measured at fair value using significant unobservable inputs (Level 3) is presented below:
|
DOLLAR AMOUNTS IN MILLIONS
|
|||||||||||||||
|
|
INVESTMENTS
|
||||||||||||||
|
|
Hedge funds
|
|
Private equity and
related funds
|
|
Real estate and
related funds
|
|
Fixed Income
|
|
Total
|
|
|||||
|
Balance as of December 31, 2011
|
$
|
2,432
|
|
$
|
1,627
|
|
$
|
96
|
|
$
|
4
|
|
$
|
4,159
|
|
|
Net realized gains
|
70
|
|
146
|
|
6
|
|
—
|
|
222
|
|
|||||
|
Net change in unrealized appreciation
|
228
|
|
31
|
|
6
|
|
—
|
|
265
|
|
|||||
|
Purchases
|
612
|
|
18
|
|
—
|
|
—
|
|
630
|
|
|||||
|
Sales
|
(507
|
)
|
(245
|
)
|
(17
|
)
|
—
|
|
(769
|
)
|
|||||
|
Settlements
|
(68
|
)
|
—
|
|
—
|
|
—
|
|
(68
|
)
|
|||||
|
Balance as of December 31, 2012
|
2,767
|
|
1,577
|
|
91
|
|
4
|
|
4,439
|
|
|||||
|
Net realized gains (losses)
|
164
|
|
90
|
|
(19
|
)
|
—
|
|
235
|
|
|||||
|
Net change in unrealized appreciation (depreciation)
|
275
|
|
138
|
|
23
|
|
(1
|
)
|
435
|
|
|||||
|
Purchases
|
743
|
|
188
|
|
29
|
|
—
|
|
960
|
|
|||||
|
Sales
|
(645
|
)
|
(387
|
)
|
(23
|
)
|
—
|
|
(1,055
|
)
|
|||||
|
Settlements
|
(79
|
)
|
—
|
|
—
|
|
—
|
|
(79
|
)
|
|||||
|
Balance as of December 31, 2013
|
$
|
3,225
|
|
$
|
1,606
|
|
$
|
101
|
|
$
|
3
|
|
$
|
4,935
|
|
This table shows the fair value of the derivatives held by our pension trusts — which fund our qualified and registered plans — at the end of the last two years.
|
DOLLAR AMOUNTS IN MILLIONS
|
||||||
|
|
DECEMBER 31,
2013 |
|
DECEMBER 31,
2012 |
|
||
|
Equity index instruments
|
$
|
29
|
|
$
|
4
|
|
|
Forward contracts
|
(9
|
)
|
(2
|
)
|
||
|
Swaps
|
405
|
|
288
|
|
||
|
Total
|
$
|
425
|
|
$
|
290
|
|
This table shows the aggregate notional amount of the derivatives held by our pension trusts — which fund our qualified and registered plans — at the end of the last two years.
|
DOLLAR AMOUNTS IN MILLIONS
|
||||||
|
|
DECEMBER 31,
2013 |
|
DECEMBER 31,
2012 |
|
||
|
Equity index instruments
|
$
|
399
|
|
$
|
569
|
|
|
Forward contracts
|
638
|
|
199
|
|
||
|
Swaps
|
1,568
|
|
1,538
|
|
||
|
Total
|
$
|
2,605
|
|
$
|
2,306
|
|
WEYERHAEUSER COMPANY >
2013 ANNUAL REPORT AND FORM 10-K
77
ACTIVITY OF PLANS WE SPONSOR
Net Periodic Benefit Cost (Credit)
|
DOLLAR AMOUNTS IN MILLIONS
|
||||||||||||||||||
|
|
PENSION
|
OTHER POSTRETIREMENT
BENEFITS
|
||||||||||||||||
|
|
2013
|
|
2012
|
|
2011
|
|
2013
|
|
2012
|
|
2011
|
|
||||||
|
Net periodic benefit cost (credit):
|
|
|
|
|
|
|
||||||||||||
|
Service cost
(1)(2)
|
$
|
64
|
|
$
|
53
|
|
$
|
48
|
|
$
|
1
|
|
$
|
1
|
|
$
|
2
|
|
|
Interest cost
|
244
|
|
262
|
|
276
|
|
12
|
|
15
|
|
24
|
|
||||||
|
Expected return on plan assets
|
(439
|
)
|
(422
|
)
|
(421
|
)
|
—
|
|
—
|
|
—
|
|
||||||
|
Amortization of actuarial loss
|
221
|
|
175
|
|
136
|
|
14
|
|
13
|
|
13
|
|
||||||
|
Amortization of prior service cost (credit)
|
7
|
|
7
|
|
14
|
|
(23
|
)
|
(127
|
)
|
(22
|
)
|
||||||
|
Recognition of curtailments, settlements and special termination benefits due to closures, restructuring or divestitures
(2)
|
—
|
|
—
|
|
18
|
|
—
|
|
—
|
|
—
|
|
||||||
|
Other
|
—
|
|
—
|
|
—
|
|
—
|
|
4
|
|
4
|
|
||||||
|
Net periodic benefit cost (credit)
|
$
|
97
|
|
$
|
75
|
|
$
|
71
|
|
$
|
4
|
|
$
|
(94
|
)
|
$
|
21
|
|
|
(1)
During fourth quarter 2011, we ratified amendments to our postretirement medical and life insurance benefit plans for U.S. salaried employees that reduced or eliminated certain benefits that were available to both past and present employees. The company recognized a gain of $103 million in 2012 due to these benefit changes. This gain is included in other operating income and reflected in the amortization of prior service credit in the table above. The benefit related to the fourth quarter 2011 amendments was fully recognized in first and second quarter 2012.
(2)
Service cost includes $2 million in 2011 for employees that were part of the sale of our hardwoods operations. Curtailment and special termination benefits includes charges of $11 million in 2011 related to the sale of our hardwoods and Westwood Shipping Lines operations. These charges are included in our results of discontinued operations.
|
||||||||||||||||||
Estimated Amortization from Cumulative Other Comprehensive Loss in 2014
Amortization of the net actuarial loss and prior service cost (credit) of our pension and postretirement benefit plans will affect our other comprehensive income in 2014. The net effect of the estimated amortization will be an
increase in net periodic benefit costs or a decrease in net periodic benefit credits in 2014.
|
DOLLAR AMOUNTS IN MILLIONS
|
|||||||||
|
|
PENSION
|
|
POSTRETIREMENT
|
|
TOTAL
|
|
|||
|
Net actuarial loss
|
$
|
123
|
|
$
|
12
|
|
$
|
135
|
|
|
Prior service cost (credit)
|
5
|
|
(190
|
)
|
(185
|
)
|
|||
|
Net effect cost (credit)
|
$
|
128
|
|
$
|
(178
|
)
|
$
|
(50
|
)
|
Expected Pension Funding
Established funding standards govern the funding requirements for our qualified and registered pension plans. We fund the benefit payments of our nonqualified and nonregistered plans as benefit payments come due.
During 2014, based on estimated year-end asset values and projections of plan liabilities, we expect to:
|
•
|
be required to contribute approximately
$53 million
for our Canadian registered plan;
|
|
•
|
be required to contribute or make benefit payments for our Canadian nonregistered plans of
$3 million
; and
|
|
•
|
make benefit payments of approximately
$20 million
for our U.S. nonqualified pension plans.
|
We do
not
anticipate a contribution being required for our U.S. qualified pension plan for 2014.
Expected Postretirement Benefit Funding
Our retiree medical and life insurance plans are unfunded. Benefits for these plans are paid from our general assets as they come due. We expect to make benefit payments of
$35 million
for our U.S. and Canadian other postretirement benefit plans in 2014, including
$9 million
expected to be required to cover benefit payments under collectively bargained contractual obligations.
WEYERHAEUSER COMPANY >
2013 ANNUAL REPORT AND FORM 10-K
78
Estimated Projected Benefit Payments for the Next 10 Years
|
DOLLAR AMOUNTS IN MILLIONS
|
||||||
|
|
PENSION
|
OTHER
POSTRETIREMENT
BENEFITS
|
||||
|
2014
|
$
|
341
|
|
$
|
35
|
|
|
2015
|
$
|
348
|
|
$
|
25
|
|
|
2016
|
$
|
354
|
|
$
|
24
|
|
|
2017
|
$
|
361
|
|
$
|
22
|
|
|
2018
|
$
|
367
|
|
$
|
21
|
|
|
2019-2023
|
$
|
1,924
|
|
$
|
90
|
|
ACTUARIAL ASSUMPTIONS
We use actuarial assumptions to estimate our benefit obligations and our net periodic benefit costs.
Rates We Use in Estimating Our Benefit Obligations
We use assumptions to estimate our benefit obligations that include:
|
•
|
discount rates in the U.S. and Canada, including discount rates used to value lump sum distributions;
|
|
•
|
rates of compensation increases for our salaried and hourly employees in the U.S. and Canada; and
|
|
•
|
estimated percentages of eligible retirees who will elect lump sum payments of benefits.
|
Discount Rates and Rates of Compensation Increase Used in Estimating Our Pension and Other Postretirement Benefit Obligation
|
|
PENSION
|
OTHER POSTRETIREMENT
BENEFITS
|
||||||
|
|
DECEMBER 31,
2013 |
|
DECEMBER 31,
2012 |
|
DECEMBER 31,
2013 |
|
DECEMBER 31,
2012 |
|
|
Discount rates:
|
|
|
|
|
||||
|
U.S.
|
4.90
|
%
|
3.70
|
%
|
4.00
|
%
|
3.00
|
%
|
|
Canada
|
4.70
|
%
|
4.10
|
%
|
4.60
|
%
|
4.00
|
%
|
|
Lump sum distributions (US salaried and nonqualified plans only)
(1)
|
PPA Table
|
PPA Phased Table
|
N/A
|
|
N/A
|
|
||
|
Rate of compensation increase:
|
|
|
|
|
|
|
|
|
|
Salaried:
|
|
|
|
|
|
|
|
|
|
United States
|
2.50% for 2014
and 3.50% thereafter |
2.50% for 2013
and 3.50% thereafter |
N/A
|
|
N/A
|
|
||
|
Canada
|
2.50% for 2014
and 3.50% thereafter |
2.50% for 2013
and 3.50% thereafter |
N/A
|
|
N/A
|
|
||
|
Hourly:
|
|
|
|
|
||||
|
United States
|
3.00
|
%
|
3.00
|
%
|
3.00
|
%
|
3.00
|
%
|
|
Canada
|
3.25
|
%
|
3.25
|
%
|
N/A
|
|
N/A
|
|
|
Election of lump sum or installment distributions (US salaried and nonqualified plans only)
|
60.00
|
%
|
56.00
|
%
|
N/A
|
|
N/A
|
|
|
(1) The PPA Phased Table: Interest and mortality assumptions as mandated by Pension Protection Act of 2006 including the phase out of the prior interest rate basis in 2013.
|
||||||||
Estimating Our Net Periodic Benefit Costs
The assumptions we use to estimate our net periodic benefit costs include:
|
•
|
discount rates in the U.S. and Canada, including discount rates used to value lump sum distributions;
|
|
•
|
expected returns on our plan assets;
|
|
•
|
rates of compensation increases for our salaried and hourly employees in the U.S. and Canada; and
|
|
•
|
estimated percentages of eligible retirees who will elect lump sum payments of benefits.
|
This table shows the discount rates, expected returns on our plan assets and rates of compensation increases we used the last three years to estimate our net periodic benefit costs.
WEYERHAEUSER COMPANY >
2013 ANNUAL REPORT AND FORM 10-K
79
Rates Used to Estimate Our Net Periodic Benefit Costs
|
|
PENSION
|
OTHER
POSTRETIREMENT
BENEFITS
|
||||
|
|
2013
|
2012
|
2011
|
2013
|
2012
|
2011
|
|
Discount rates:
|
|
|
|
|
|
|
|
U.S.
|
3.70%
|
4.50%
|
5.40%
|
3.00%
|
4.10%
|
5.00%
|
|
Salaried – lump sum distributions (U.S. salaried and nonqualified plan only)
(1)
|
PPA Table
|
PPA phased
Table |
PPA phased
Table |
N/A
|
N/A
|
N/A
|
|
Canada
|
4.10%
|
4.90%
|
5.30%
|
4.00%
|
4.80%
|
5.20%
|
|
Expected return on plan assets:
|
|
|
|
|
|
|
|
Qualified/registered plans
|
9.00%
|
9.00%
|
9.50%
|
|
|
|
|
Nonregistered plans (Canada only)
|
3.50%
|
3.50%
|
4.75%
|
|
|
|
|
Rate of compensation increase:
|
|
|
|
|
|
|
|
Salaried:
|
|
|
|
|
|
|
|
U.S.
|
2.50% for 2013
and 3.50% thereafter |
2.00% for 2012
and 3.50% thereafter |
2.00% for 2011
and 3.50% thereafter |
N/A
|
N/A
|
N/A
|
|
Canada
|
2.50% for 2013
and 3.50% thereafter |
2.10% for 2012
and 3.50% thereafter |
2.00% for 2011
and 3.50% thereafter |
N/A
|
N/A
|
N/A
|
|
Hourly:
|
|
|
|
|
|
|
|
U.S.
|
3.00%
|
3.00%
|
3.00%
|
3.00%
|
3.00%
|
3.00%
|
|
Canada
|
3.25%
|
3.25%
|
3.25%
|
N/A
|
N/A
|
N/A
|
|
Election of lump sum distributions (U.S. salaried and nonqualified plans only)
|
56.00%
|
60.00%
|
65.00%
|
N/A
|
N/A
|
N/A
|
|
(1) PPA Phased Table: Interest and mortality assumptions as mandated by Pension Protection Act of 2006 including the phase out of the prior interest rate basis in 2013.
|
||||||
Expected Return on Plan Assets
We estimate the expected long-term return on assets for our:
|
•
|
qualified and registered pension plans and
|
|
•
|
nonregistered plans.
|
Qualified and Registered Pension Plans.
Our expected long-term rate of return for plan assets as of December 31, 2013, is comprised of:
|
•
|
a
7.2 percent
assumed return from direct investments and
|
|
•
|
a
1.8 percent
assumed return from derivatives.
|
Determining our expected return:
|
•
|
requires a high degree of judgment,
|
|
•
|
uses our historical fund returns as a base and
|
|
•
|
places added weight on more recent pension plan asset performance.
|
Over the 29 years it has been in place, our U.S. pension trust investment strategy has achieved a
14.8 percent
net compound annual return rate.
Nonregistered plans.
Canadian tax rules require that 50 percent of the assets for nonregistered plans go to a noninterest-bearing refundable tax account. As a result, the return we earn investing the other 50 percent is spread over 100 percent of the assets.
Our expected long-term annual rate of return on the equity portion of this portfolio — the portion we are allowed to invest and manage — is
7 percent
. We base that expected rate of return on:
|
•
|
historical experience and
|
|
•
|
future return expectations.
|
Our expected overall annual return on assets that fund our nonregistered plans is
3.5 percent
.
Actual Returns on Assets Held by Our Pension Trusts
Based on valuations received as of year-end, our total actual return on assets held by our pension trusts was a gain of approximately
$808 million
in
2013
. These trusts fund our qualified, registered and a portion of our nonregistered pension plans.
|
DOLLAR AMOUNTS IN MILLIONS
|
|||||||||
|
|
2013
|
|
2012
|
|
2011
|
|
|||
|
Direct investments
|
$
|
568
|
|
$
|
324
|
|
$
|
48
|
|
|
Derivatives
|
240
|
|
166
|
|
1
|
|
|||
|
Total
|
$
|
808
|
|
$
|
490
|
|
$
|
49
|
|
WEYERHAEUSER COMPANY >
2013 ANNUAL REPORT AND FORM 10-K
80
HEALTH CARE COSTS
Rising costs of health care affect the costs of our other postretirement plans.
Health Care Cost Trend Rates
We use assumptions about health care cost trend rates to estimate the cost of benefits we provide. In
2013
, the assumed weighted health care cost trend rate was:
|
•
|
6.6 percent
in the U.S. and
|
|
•
|
6.2 percent
in Canada.
|
This table shows the assumptions we use in estimating the annual cost increase for health care benefits we provide.
Assumptions We Use in Estimating Health Care Benefit Costs
|
|
2013
|
2012
|
||||||
|
|
U.S.
|
|
CANADA
|
|
U.S.
|
|
CANADA
|
|
|
Weighted health care cost trend rate assumed for next year
|
6.40
|
%
|
6.10
|
%
|
6.60
|
%
|
6.20
|
%
|
|
Rate to which cost trend rate is assumed to decline (ultimate trend rate)
|
4.50
|
%
|
4.30
|
%
|
4.50
|
%
|
4.30
|
%
|
|
Year that the rate reaches the ultimate trend rate
|
2029
|
|
2028
|
|
2029
|
|
2028
|
|
A 1 percent change in our assumed health care cost trend rates can affect our accumulated benefit obligations.
Effect of a 1 Percent Change in Health Care Costs
|
AS OF DECEMBER 31, 2013 (DOLLAR AMOUNTS IN MILLIONS)
|
||||||
|
|
1% INCREASE
|
|
1% DECREASE
|
|
||
|
Effect on total service and interest cost components
|
$
|
2
|
|
$
|
(1
|
)
|
|
Effect on accumulated postretirement benefit obligation
|
$
|
8
|
|
$
|
(7
|
)
|
UNION-ADMINISTERED MULTIEMPLOYER BENEFIT PLANS
We contribute to multiemployer defined benefit plans under the terms of collective-bargaining agreements that cover some of our union-represented employees.
The U.S. plans are established to provide retirement income for eligible employees who meet certain age and service requirements at retirement. The benefits are generally based on:
|
•
|
a percentage of the employer contributions paid into the plan on the eligible employee's behalf or
|
|
•
|
a formula considering an eligible employee's service, the total contributions paid on their behalf plus a benefit based on the value of an eligible employee's account.
|
The Canadian plan is a negotiated cost defined benefit plan. The plan is established to provide retirement income for members based on their number of years of service in the industry, and the benefit rate that applied to that service.
The risks of participating in these multiemployer plans are different from single-employer plans in the following aspects:
|
•
|
Assets contributed to the multiemployer plan by one employer may be used to provide benefits to employees of other participating employers.
|
|
•
|
If a participating employer stops contributing to the plan, the unfunded obligations of the plan may be borne by the remaining participating employers.
|
|
•
|
If we choose to stop participating in some of the multiemployer plans, we may be required to pay those plans an amount based on the underfunded status of the plan, referred to as a withdrawal liability.
|
As of
December 31, 2013
, these plans covered approximately
1,300
of our employees.
Our contributions were:
|
•
|
$4 million
in
2013
,
|
|
•
|
$4 million
in
2012
and
|
|
•
|
$4 million
in
2011
.
|
There have been no significant changes that affect the comparability of the
2013
,
2012
and
2011
contributions. None of our contributions exceeded more than five percent of any plan's total contributions during
2013
,
2012
or
2011
.
DEFINED CONTRIBUTION PLANS
We sponsor various defined contribution plans for our U.S. and Canadian salaried and hourly employees. Our contributions to these plans were:
|
•
|
$20 million
in
2013
,
|
|
•
|
$19 million
in
2012
and
|
|
•
|
$19 million
in
2011
.
|
WEYERHAEUSER COMPANY >
2013 ANNUAL REPORT AND FORM 10-K
81
NOTE 11:
VARIABLE INTEREST ENTITIES
This note provides details about:
|
•
|
Special-purpose entities (SPEs) and
|
|
•
|
Variable interest entities (VIEs).
|
SPECIAL-PURPOSE ENTITIES
From 2002 through 2004, we sold certain nonstrategic timberlands in five separate transactions. We are the primary beneficiary and consolidate the assets and liabilities of certain monetization and buyer-sponsored SPEs involved in these transactions. We have an equity interest in the monetization SPEs, but no ownership interest in the buyer-sponsored SPEs. The following disclosures refer to assets of buyer-sponsored SPEs and liabilities of monetization SPEs. However, because these SPEs are distinct legal entities:
|
•
|
Assets of the SPEs are not available to satisfy our liabilities or obligations.
|
|
•
|
Liabilities of the SPEs are not our liabilities or obligations.
|
In 2013, we repaid a
$162 million
note and received
$184 million
related to one of our timber monetization SPEs undertaken in 2003. Net proceeds were
$22 million
. In 2012, we repaid a
$97 million
note and received
$110 million
related to one of our timber monetization SPEs undertaken in 2002. Net proceeds were
$13 million
.
Our
Consolidated Statement of Operations
includes:
|
•
|
Interest expense on SPE notes of:
|
–
$29 million
in
2013
,
–
$32 million
in
2012
and
–
$31 million
in
2011
.
|
•
|
Interest income on SPE investments of:
|
–
$34 million
in
2013
,
–
$34 million
in
2012
and
–
$34 million
in
2011
.
Sales proceeds paid to buyer-sponsored SPEs were invested in restricted financial investments with a balance of
$615 million
as of
December 31, 2013
, and
$799 million
as of
December 31, 2012
. The weighted average interest rate was
5.1 percent
during
2013
and
3.8 percent
during
2012
. Maturities of the financial investments at the end of
2013
were:
|
•
|
$253 million
in
2019
and
|
|
•
|
$362 million
in
2020
.
|
The long-term notes of our monetization SPEs were
$511 million
as of
December 31, 2013
, and
$672 million
as of
December 31, 2012
. The weighted average interest rate was
5.3 percent
during
2013
and
4.3 percent
in
2012
. Maturities of the notes at the end of
2013
were:
|
•
|
$209 million
in
2019
and
|
|
•
|
$302 million
in
2020
.
|
Financial investments consist of bank guarantees backed by bank notes for three of the SPE transactions. Interest earned from each financial investment is used to pay interest accrued on the corresponding SPE’s note. Any shortfall between interest earned and interest accrued reduces our equity in the monetization SPEs.
Upon dissolution of the SPEs and payment of all obligations of the entities, we would receive any net equity remaining in the monetization SPEs and would be required to report deferred tax gains on our income tax return. In the event that proceeds from the financial investments are insufficient to settle all of the liabilities of the SPEs, we are not obligated to contribute any funds to any of the SPEs. As of
December 31, 2013
, our net equity in the
three
SPEs was approximately
$105 million
and the deferred tax liability was estimated to be approximately
$180 million
.
VARIABLE INTEREST ENTITIES
In the ordinary course of business, our Real Estate segment enters into lot option purchase agreements in order to procure land and residential lots for development and the construction of homes in the future. The use of such lot option agreements generally allows us to reduce the risks associated with direct land ownership and development, and reduces our capital and financial commitments. Pursuant to these lot option purchase agreements, we generally provide a deposit to the seller as consideration for the right to purchase lots at different times in the future, usually at predetermined prices.
If the entity holding the lots under option is a VIE, our deposit represents a variable interest in that entity. If we are determined to be the primary beneficiary of the VIE, we consolidate the VIE in our financial statements and reflect its assets and liabilities as “Real estate in process of development and for sale”, "Land being processed for development" and “Long-term debt (nonrecourse to the company) held by variable interest entities.” Creditors of the entities with which we have option agreements have no recourse against us. The maximum exposure to loss under our lot option agreements is limited to non-refundable option deposits and any capitalized pre-acquisition costs. In some cases, we have also contracted to complete development work at a fixed cost on behalf of the land owner and budget shortfalls and savings will be borne by us.
In determining whether we are the primary beneficiary of a VIE, we consider our ability to control activities of the VIE including, but not limited to the ability to:
|
•
|
direct entitlement of land,
|
|
•
|
determine the budget and scope of land development work,
|
|
•
|
perform land development activities,
|
|
•
|
control financing decisions for the VIE and
|
|
•
|
acquire additional land into the VIE or dispose of land in the VIE not already under contract.
|
If we conclude that we control such activities of the VIE, we also consider whether we have an obligation to absorb losses of or a right to receive benefits from the VIE.
WEYERHAEUSER COMPANY >
2013 ANNUAL REPORT AND FORM 10-K
82
As of the end of both
2013
and
2012
, we had options to purchase
1,200
residential lots from VIEs we consolidated because we concluded we were the primary beneficiary. As of the end of both
2013
and
2012
, our non-refundable option deposits to VIEs and capitalized pre-acquisition costs on assets under option from VIEs that were not consolidated were not significant.
NOTE 12:
REAL ESTATE IN PROCESS OF DEVELOPMENT AND FOR SALE
Carrying Value of Our Real Estate in Process of Development and for Sale
|
DOLLAR AMOUNTS IN MILLIONS
|
||||||
|
|
DECEMBER 31,
2013 |
|
DECEMBER 31,
2012 |
|
||
|
Dwelling units
|
$
|
365
|
|
$
|
252
|
|
|
Residential lots
|
478
|
|
433
|
|
||
|
Commercial acreage, acreage for sale, and other
|
8
|
|
10
|
|
||
|
Total
|
$
|
851
|
|
$
|
695
|
|
HOW WE ACCOUNT FOR OUR REAL ESTATE IN PROCESS OF DEVELOPMENT AND FOR SALE
Real estate in process of development and for sale is stated at cost unless events and circumstances trigger an impairment. More information about real estate asset impairments can be found in
Note 20: Charges for Restructuring, Closures and Asset Impairments
.
NOTE 13:
ACCRUED LIABILITIES
Accrued liabilities were comprised of the following:
|
DOLLAR AMOUNTS IN MILLIONS
|
||||||
|
|
DECEMBER 31,
2013 |
|
DECEMBER 31,
2012 |
|
||
|
Wages, salaries and severance pay
|
$
|
174
|
|
$
|
160
|
|
|
Pension and postretirement
|
57
|
|
58
|
|
||
|
Vacation pay
|
52
|
|
50
|
|
||
|
Income taxes
|
4
|
|
—
|
|
||
|
Taxes – Social Security and real and personal property
|
36
|
|
29
|
|
||
|
Interest
|
104
|
|
100
|
|
||
|
Customer rebates and volume discounts
|
50
|
|
44
|
|
||
|
Deferred income
|
98
|
|
71
|
|
||
|
Estimated cost for real estate development completion
|
48
|
|
30
|
|
||
|
Other
|
119
|
|
120
|
|
||
|
Total
|
$
|
742
|
|
$
|
662
|
|
NOTE 14:
LINES OF CREDIT
This note provides details about our:
|
•
|
l
ines of credit and
|
|
•
|
other letters of credit and surety bonds.
|
OUR LINES OF CREDIT
During September 2013, we entered into a new
$1 billion
5-year senior unsecured revolving credit facility that expires in
September 2018
. This replaces a
$1 billion
revolving credit facility that was set to expire
June 2015
. Conditions of the line of credit include the following:
|
•
|
The entire amount is available to Weyerhaeuser Company.
|
|
•
|
$50 million
of the amount is available to Weyerhaeuser Real Estate Company (WRECO).
|
|
•
|
Neither Weyerhaeuser Company nor WRECO is a guarantor of the borrowing of the other.
|
Borrowings are at LIBOR plus a spread or at other interest rates mutually agreed upon between the borrower and the lending banks. As of
December 31, 2013
, there were
no
borrowings outstanding under the facility and Weyerhaeuser Company and WRECO were in compliance with the credit facility covenants.
OTHER LETTERS OF CREDIT AND SURETY BONDS
The amounts of other letters of credit and surety bonds we have entered into as of the end of our last two years are included in the following table:
|
DOLLAR AMOUNTS IN MILLIONS
|
||||||
|
|
DECEMBER 31,
2013 |
|
DECEMBER 31,
2012 |
|
||
|
Letters of credit
|
$
|
39
|
|
$
|
53
|
|
|
Surety bonds
|
$
|
414
|
|
$
|
418
|
|
WEYERHAEUSER COMPANY >
2013 ANNUAL REPORT AND FORM 10-K
83
Our compensating balance requirements for our letters of credit were
$11 million
as of
December 31, 2013
.
NOTE 15:
LONG-TERM DEBT
This note provides details about:
|
•
|
long-term debt and the portion due within one year and
|
|
•
|
long-term debt maturities.
|
Our long-term debt includes notes, debentures, revenue bonds and other borrowings. The following table lists our long-term debt, which includes Weyerhaeuser Company debt, by types and interest rates at the end of our last two years and includes the current portion.
Long-Term Debt by Types and Interest Rates (Includes Current Portion)
|
DOLLAR AMOUNTS IN MILLIONS
|
||||||
|
|
DECEMBER 31,
2013 |
|
DECEMBER 31,
2012 |
|
||
|
7.50% debentures due 2013
|
$
|
—
|
|
$
|
156
|
|
|
7.25% debentures due 2013
|
—
|
|
129
|
|
||
|
6.95% debentures due 2017
|
281
|
|
281
|
|
||
|
7.00% debentures due 2018
|
62
|
|
62
|
|
||
|
7.375% notes due 2019
|
500
|
|
500
|
|
||
|
Variable rate term loan credit facility due 2020
|
550
|
|
—
|
|
||
|
9.00% debentures due 2021
|
150
|
|
150
|
|
||
|
7.125% debentures due 2023
|
191
|
|
191
|
|
||
|
4.625% notes due 2023
|
500
|
|
—
|
|
||
|
8.50% debentures due 2025
|
300
|
|
300
|
|
||
|
7.95% debentures due 2025
|
136
|
|
136
|
|
||
|
7.70% debentures due 2026
|
150
|
|
150
|
|
||
|
7.35% debentures due 2026
|
62
|
|
62
|
|
||
|
7.85% debentures due 2026
|
100
|
|
100
|
|
||
|
6.95% debentures due 2027
|
300
|
|
300
|
|
||
|
7.375% debentures due 2032
|
1,250
|
|
1,250
|
|
||
|
6.875% debentures due 2033
|
275
|
|
275
|
|
||
|
Industrial revenue bonds, rates from 6.7% to 6.8%, due 2022
|
88
|
|
88
|
|
||
|
Medium-term notes, rates from 6.6% to 7.3%, due 2013
|
—
|
|
56
|
|
||
|
Notes payable, unsecured; weighted average interest rates are approximately 4.8%, due 2013-2027
|
—
|
|
109
|
|
||
|
Other
|
1
|
|
1
|
|
||
|
|
4,896
|
|
4,296
|
|
||
|
Less unamortized discounts
|
(5
|
)
|
(5
|
)
|
||
|
Total
|
$
|
4,891
|
|
$
|
4,291
|
|
|
Portion due within one year
|
$
|
—
|
|
$
|
409
|
|
In order to repay the debt that we assumed in the acquisition of Longview Timber, in 2013 we issued
$500 million
of
4.625 percent
notes due
September 15, 2023
. The net proceeds after deducting the discount, underwriting fees and issuance costs were
$495 million
. We also entered into a
$550 million
7-year senior unsecured term loan credit facility maturing in
September 2020
and borrowed
$550 million
. Borrowings are at LIBOR plus a spread or at other interest rates mutually agreed upon between the borrower and the lending banks.
On October 15, 2013, we repaid the
$1,118 million
carrying value of the debt that we assumed in the acquisition of Longview Timber and related fees, expenses and premiums using the proceeds from the notes issued and the borrowings from our term loan credit facility borrowed in 2013. A pretax charge of
$25 million
was included in our net interest expense in 2013, for early retirement premiums, unamortized debt issuance costs and other miscellaneous charges in connection with the early extinguishment of debt. See
Note 3: Longview Timber Purchase
for more information.
In addition to the Longview Timber debt and repaying debt that was scheduled to mature, we repaid approximately
$40 million
and
$518 million
of long-term debt in 2013 and
2011
, respectively. Included in our net interest expense, Weyerhaeuser recognized pretax charges in
2011
of
$26 million
, which included early retirement premiums, unamortized debt issuance costs and other miscellaneous charges in connection with early extinguishment of debt.
WEYERHAEUSER COMPANY >
2013 ANNUAL REPORT AND FORM 10-K
84
Amounts of Long-Term Debt Due Annually for the Next Five Years and the Total Amount Due After
2018
|
DOLLAR AMOUNTS IN MILLIONS
|
|||
|
|
DECEMBER 31, 2013
|
|
|
|
Long-term debt maturities:
|
|
|
|
|
2014
|
$
|
—
|
|
|
2015
|
$
|
—
|
|
|
2016
|
$
|
—
|
|
|
2017
|
$
|
281
|
|
|
2018
|
$
|
62
|
|
|
Thereafter
|
$
|
4,553
|
|
NOTE 16:
FAIR VALUE OF FINANCIAL INSTRUMENTS
This note provides information about the fair value of our:
|
•
|
debt and
|
|
•
|
other financial instruments.
|
FAIR VALUE OF DEBT
The estimated fair values and carrying values of our long-term debt consisted of the following:
|
DOLLAR AMOUNTS IN MILLIONS
|
||||||||||||
|
|
DECEMBER 31, 2013
|
DECEMBER 31, 2012
|
||||||||||
|
|
CARRYING
VALUE
|
|
FAIR VALUE
(LEVEL 2)
|
|
CARRYING
VALUE
|
|
FAIR VALUE
(LEVEL 2)
|
|
||||
|
Long-term debt (including current maturities)
|
$
|
4,891
|
|
$
|
5,683
|
|
$
|
4,291
|
|
$
|
5,106
|
|
To estimate the fair value of long-term debt, we used the following valuation approaches:
|
•
|
market approach — based on quoted market prices we received for the same types and issues of our debt; or
|
|
•
|
income approach — based on the discounted value of the future cash flows using market yields for the same type and comparable issues of debt.
|
The inputs to these valuations are based on market data obtained from independent sources or information derived principally from observable market data.
The difference between the fair value and the carrying value represents the theoretical net premium or discount we would pay or receive to retire all debt at the measurement date.
Long-term debt increased primarily due to the issuance of debt related to the acquisition of Longview Timber. See
Note: 3 Longview Timber Purchase
and
Note 15: Long-term Debt
.
FAIR VALUE OF OTHER FINANCIAL INSTRUMENTS
We believe that our other financial instruments, including cash and cash equivalents, short-term investments, receivables, and payables, have net carrying values that approximate their fair values with only insignificant differences. This is primarily due to:
|
•
|
the short-term nature of these instruments,
|
|
•
|
carrying short-term investments at expected net realizable value and
|
|
•
|
the allowance for doubtful accounts.
|
NOTE 17:
LEGAL PROCEEDINGS, COMMITMENTS AND CONTINGENCIES
This note provides details about our:
|
•
|
legal proceedings,
|
|
•
|
environmental matters and
|
|
•
|
commitments and other contingencies.
|
LEGAL PROCEEDINGS
We are party to various legal proceedings arising in the ordinary course of business, however, we are not currently a party to any legal proceeding that management believes could have a material adverse effect on our long-term consolidated financial position, results of operations or cash flows.
2011 Claim
On April 25, 2011, a complaint was filed in the United States District Court for the Western District of Washington on behalf of a person alleged to be a participant in the company
’
s U.S. Retirement Plan for salaried employees. The complaint alleged violations of the Employee Retirement Security Act (ERISA) with respect to the management of the plan
’
s assets and sought certification as a class action. On August 23, 2013, the Court dismissed the claim for money damages, but the claim for injunctive relief remained active. We recorded an accrual for
$5 million
that is
WEYERHAEUSER COMPANY >
2013 ANNUAL REPORT AND FORM 10-K
85
reflected in "Accrued liabilities" in our
Consolidated Balance Sheet
. In January 2014, we entered into a settlement of the litigation. The settlement was not material to either the current or future periods.
ENVIRONMENTAL MATTERS
Our environmental matters include:
|
•
|
site remediation and
|
|
•
|
asset retirement obligations.
|
Site Remediation
Under the Comprehensive Environmental Response, Compensation and Liability Act — commonly known as the Superfund — and similar state laws, we:
|
•
|
are a party to various proceedings related to the cleanup of hazardous waste sites and
|
|
•
|
have been notified that we may be a potentially responsible party related to the cleanup of other hazardous waste sites for which proceedings have not yet been initiated.
|
Our established reserves.
We have established reserves for estimated remediation costs on the active Superfund sites and other sites for which we are responsible. These reserves are recorded in "Accrued liabilities" and "Other liabilities" in our
Consolidated Balance Sheet
.
Changes in the Reserve for Environmental Remediation
|
DOLLAR AMOUNTS IN MILLIONS
|
|||
|
Reserve balance as of December 31, 2012
|
$
|
32
|
|
|
Reserve charges and adjustments, net
|
4
|
|
|
|
Payments
|
(6
|
)
|
|
|
Reserve balance as of December 31, 2013
|
$
|
30
|
|
|
Total active sites as of December 31, 2013
|
50
|
|
|
We change our accrual to reflect:
|
•
|
new information on any site concerning implementation of remediation alternatives,
|
|
•
|
updates on prior cost estimates and new sites and
|
|
•
|
c
osts incurred to remediate sites.
|
Estimates.
We believe it is reasonably possible, based on currently available information and analysis, that remediation costs for all identified sites may exceed our existing reserves by up to
$101 million
.
This estimate, in which those additional costs may be incurred over several years, is the upper end of the range of reasonably possible additional costs. The estimate:
|
•
|
is much less certain than the estimates on which our accruals currently are based, and
|
|
•
|
uses assumptions that are less favorable to us among the range of reasonably possible outcomes.
|
In estimating our current accruals and the possible range of additional future costs, we:
|
•
|
assumed we will not bear the entire cost of remediation of every site,
|
|
•
|
took into account the ability of other potentially responsible parties to participate, and
|
|
•
|
considered each party
’
s financial condition and probable contribution on a per-site basis.
|
We have not recorded any amounts for potential recoveries from insurance carriers.
Asset Retirement Obligations
We have obligations associated with the retirement of tangible long-lived assets consisting primarily of reforestation obligations related to forest management licenses in Canada and obligations to close and cap landfills. Some of our sites have asbestos containing materials. We have met our current legal obligation to identify and manage these materials. In situations where we cannot reasonably determine when asbestos containing materials might be removed from the sites, we have not recorded an accrual because the fair value of the obligation cannot be reasonably estimated. These obligations are recorded in "Accrued liabilities" and "Other liabilities" in our
Consolidated Balance Sheet
.
Changes in the Reserve for Asset Retirement Obligations
|
DOLLAR AMOUNTS IN MILLIONS
|
|||
|
Reserve balance as of December 31, 2012
|
$
|
63
|
|
|
Reserve charges and adjustments, net
|
8
|
|
|
|
Payments
|
(14
|
)
|
|
|
Other adjustments
|
(3
|
)
|
|
|
Reserve balance as of December 31, 2013
|
$
|
54
|
|
WEYERHAEUSER COMPANY >
2013 ANNUAL REPORT AND FORM 10-K
86
COMMITMENTS AND OTHER CONTINGENCIES
Our commitments and contingencies include:
|
•
|
guarantees of debt and performance,
|
|
•
|
purchase obligations for goods and services and
|
|
•
|
operating leases.
|
Guarantees
We have guaranteed the performance of the buyer/lessee of a timberlands lease we sold in 2005. Future payments on the lease — which expires in
2023
— are
$17 million
.
Our Real Estate segment has guaranteed buyer/lessee performance on ground leases that we sold. Future payments on the leases — which expire in
2041
— are
$12 million
.
Purchase Obligations
Our purchase obligations as of
December 31, 2013
were:
|
DOLLAR AMOUNTS IN MILLIONS
|
|||
|
|
DECEMBER 31, 2013
|
|
|
|
2014
|
$
|
61
|
|
|
2015
|
$
|
16
|
|
|
2016
|
$
|
4
|
|
|
2017
|
$
|
3
|
|
|
2018
|
$
|
3
|
|
|
Thereafter
|
$
|
8
|
|
Purchase obligations for goods or services are agreements that:
|
•
|
are enforceable and legally binding,
|
|
•
|
specify all significant terms and
|
|
•
|
cannot be canceled without penalty.
|
The terms include:
|
•
|
fixed or minimum quantities to be purchased,
|
|
•
|
fixed, minimum or variable price provisions, and
|
|
•
|
an approximate timing for the transaction.
|
Our purchase obligations include items such as:
|
•
|
stumpage and log purchases,
|
|
•
|
energy and
|
|
•
|
other service and supply contracts.
|
Operating Leases
Our rent expense was:
|
DOLLAR AMOUNTS IN MILLIONS
|
|||||||||
|
|
2013
|
|
2012
|
|
2011
|
|
|||
|
Rent expense
|
$
|
43
|
|
$
|
42
|
|
$
|
47
|
|
We have operating leases for:
|
•
|
various equipment, including logging equipment, lift trucks, automobiles and office equipment,
|
|
•
|
office and wholesale space,
|
|
•
|
model homes, and
|
|
•
|
real estate ground lease.
|
Commitments
Our operating lease commitments as of
December 31, 2013
were:
|
DOLLAR AMOUNTS IN MILLIONS
|
|||
|
|
DECEMBER 31, 2013
|
|
|
|
2014
|
$
|
39
|
|
|
2015
|
$
|
22
|
|
|
2016
|
$
|
19
|
|
|
2017
|
$
|
14
|
|
|
2018
|
$
|
10
|
|
|
Thereafter
|
$
|
112
|
|
WEYERHAEUSER COMPANY >
2013 ANNUAL REPORT AND FORM 10-K
87
Operating lease commitments have not been reduced by minimum sublease rental income of
$62 million
that is due in future periods under noncancellable sublease agreements. These commitments include a lease that has commitment increases based on a consumer price index built into the agreement. These lease commitment increases are not included in the figures above.
NOTE 18:
SHAREHOLDERS’ INTEREST
This note provides details about:
|
•
|
preferred and preference shares,
|
|
•
|
common shares,
|
|
•
|
share-repurchase programs and
|
|
•
|
cumulative other comprehensive income (loss).
|
PREFERRED AND PREFERENCE SHARES
We had
no
preferred shares outstanding at the end of
2013
or
2012
. However, we have authorization to issue
7 million
preferred shares with a par value of
$1
per share.
As part of our purchase of Longview Timber, we issued
13.8 million
of our 6.375 percent Mandatory Convertible Preference Shares, Series A, par value
$1.00
and liquidation preference of
$50.00
per share on
June 24, 2013
, for net proceeds of
$669 million
, which remained outstanding at year-end
2013
. Dividends will be payable on a cumulative basis when, as and if declared by our Board of Directors, at an annual rate of
6.375 percent
on the liquidation preference. We may pay declared dividends in cash or, subject to certain limitations, in common shares or by delivery of any combination of cash and common shares on January 1, April 1, July 1 and October 1 of each year, commencing on October 1, 2013, through, and including, July 1, 2016. These shares will automatically convert on July 1, 2016 into between
1.5015
and
1.8018
of our common shares, subject to anti-dilution adjustments. At any time prior to that date, holders may elect to convert each share into common shares at the minimum conversion rate of
1.5015
common shares, subject to anti-dilution adjustments. See
Note 3: Longview Timber Purchase
for more information.
We may issue preferred or preference shares at one time or through a series of offerings. The shares may have varying rights and preferences that can include:
|
•
|
dividend rates,
|
|
•
|
redemption rights,
|
|
•
|
conversion terms,
|
|
•
|
sinking-fund provisions,
|
|
•
|
values in liquidation and
|
|
•
|
voting rights.
|
When issued, outstanding preferred and preference shares rank senior to outstanding common shares. That means preferred and preference shares would receive dividends and assets available on liquidation before any payments are made to common shares.
COMMON SHARES
The number of common shares we have outstanding changes when:
|
•
|
new shares are issued,
|
|
•
|
stock options are exercised,
|
|
•
|
restricted stock units or performance share units vest,
|
|
•
|
stock-equivalent units are paid out,
|
|
•
|
shares are tendered,
|
|
•
|
shares are repurchased or
|
|
•
|
shares are canceled.
|
Reconciliation of Our Common Share Activity
|
IN THOUSANDS
|
||||||
|
|
2013
|
|
2012
|
|
2011
|
|
|
Outstanding at beginning of year
|
542,393
|
|
536,425
|
|
535,976
|
|
|
New issuance
(Note 3)
|
33,350
|
|
—
|
|
—
|
|
|
Stock options exercised
|
7,209
|
|
5,404
|
|
2,199
|
|
|
Issued for restricted stock units
|
462
|
|
523
|
|
540
|
|
|
Issued for performance shares
|
134
|
|
—
|
|
—
|
|
|
Issued for Directors
'
stock-equivalent units
|
—
|
|
41
|
|
—
|
|
|
Repurchased
|
—
|
|
—
|
|
(2,290
|
)
|
|
Outstanding at end of year
|
583,548
|
|
542,393
|
|
536,425
|
|
OUR SHARE REPURCHASE PROGRAMS
During 2011, we repurchased
1,199,800
shares of common stock for
$20 million
under the 2008 stock repurchase program. On August 11, 2011, our Board of Directors terminated the 2008 stock repurchase program and approved the 2011 stock repurchase program under which we are authorized to repurchase up to
$250 million
of outstanding shares. During 2011, we repurchased
1,089,824
shares of common stock for
$17 million
under the 2011 program. As of
December 31, 2013
, we had remaining authorization of
$233 million
for future share repurchases.
WEYERHAEUSER COMPANY >
2013 ANNUAL REPORT AND FORM 10-K
88
CUMULATIVE OTHER COMPREHENSIVE INCOME (LOSS)
Changes in amounts included in our cumulative other comprehensive income (loss) by component are:
|
DOLLAR AMOUNTS IN MILLIONS
|
|||||||||||||||||||||
|
PENSION
|
OTHER POSTRETIREMENT BENEFITS
|
||||||||||||||||||||
|
|
Foreign currency translation adjustments
|
Actuarial losses
|
Prior service costs
|
Actuarial losses
|
Prior service credits
|
Unrealized gains on available-for-sale securities
|
Total
|
||||||||||||||
|
Beginning balance as of
December 31, 2011 |
$
|
411
|
|
$
|
(1,674
|
)
|
$
|
(20
|
)
|
$
|
(147
|
)
|
$
|
247
|
|
$
|
4
|
|
$
|
(1,179
|
)
|
|
Other comprehensive income (loss) before reclassifications
|
2
|
|
(636
|
)
|
(11
|
)
|
—
|
|
(44
|
)
|
—
|
|
(689
|
)
|
|||||||
|
Income taxes
|
—
|
|
249
|
|
4
|
|
1
|
|
8
|
|
—
|
|
262
|
|
|||||||
|
Net other comprehensive income (loss) before reclassifications
|
2
|
|
(387
|
)
|
(7
|
)
|
1
|
|
(36
|
)
|
—
|
|
(427
|
)
|
|||||||
|
Amounts reclassified from cumulative other comprehensive income (loss)
(1)
|
—
|
|
175
|
|
7
|
|
13
|
|
(127
|
)
|
—
|
|
68
|
|
|||||||
|
Income taxes
|
—
|
|
(56
|
)
|
(3
|
)
|
(4
|
)
|
43
|
|
—
|
|
(20
|
)
|
|||||||
|
Net amounts reclassified from cumulative other comprehensive income (loss)
|
—
|
|
119
|
|
4
|
|
9
|
|
(84
|
)
|
—
|
|
48
|
|
|||||||
|
Total other comprehensive income (loss)
|
2
|
|
(268
|
)
|
(3
|
)
|
10
|
|
(120
|
)
|
—
|
|
(379
|
)
|
|||||||
|
Beginning balance as of
December 31, 2012
|
413
|
|
(1,942
|
)
|
(23
|
)
|
(137
|
)
|
127
|
|
4
|
|
(1,558
|
)
|
|||||||
|
Other comprehensive income (loss) before reclassifications
|
(59
|
)
|
1,123
|
|
—
|
|
24
|
|
66
|
|
2
|
|
1,156
|
|
|||||||
|
Income taxes
|
—
|
|
(394
|
)
|
—
|
|
(7
|
)
|
(27
|
)
|
—
|
|
(428
|
)
|
|||||||
|
Net other comprehensive income (loss) before reclassifications
|
(59
|
)
|
729
|
|
—
|
|
17
|
|
39
|
|
2
|
|
728
|
|
|||||||
|
Amounts reclassified from cumulative other comprehensive income (loss)
(1)
|
—
|
|
221
|
|
7
|
|
14
|
|
(23
|
)
|
—
|
|
219
|
|
|||||||
|
Income taxes
|
—
|
|
(74
|
)
|
(3
|
)
|
(5
|
)
|
7
|
|
—
|
|
(75
|
)
|
|||||||
|
Net amounts reclassified from cumulative other comprehensive income (loss)
|
—
|
|
147
|
|
4
|
|
9
|
|
(16
|
)
|
—
|
|
144
|
|
|||||||
|
Total other comprehensive income (loss)
|
(59
|
)
|
876
|
|
4
|
|
26
|
|
23
|
|
2
|
|
872
|
|
|||||||
|
Ending balance as of December 31, 2013
|
$
|
354
|
|
$
|
(1,066
|
)
|
$
|
(19
|
)
|
$
|
(111
|
)
|
$
|
150
|
|
$
|
6
|
|
$
|
(686
|
)
|
|
(1) Actuarial losses and prior service credits (costs) are included in the computation of net periodic benefit costs (credits). See
Note 10: Pension and Other Postretirement Benefit Plans
.
|
|||||||||||||||||||||
NOTE 19:
SHARE-BASED COMPENSATION
Share-based compensation expense was:
|
•
|
$42 million
in
2013
,
|
|
•
|
$37 million
in
2012
and
|
|
•
|
$25 million
in
2011
.
|
This note provides details about:
|
•
|
our Long-Term Incentive Compensation Plan (2013 Plan),
|
|
•
|
how we account for share-based awards,
|
|
•
|
tax benefits of share-based awards,
|
|
•
|
types of share-based compensation and
|
|
•
|
unrecognized share-based compensation.
|
OUR LONG-TERM INCENTIVE COMPENSATION PLAN
Our long-term incentive plans provide for share-based awards that include:
|
•
|
stock options,
|
|
•
|
stock appreciation rights,
|
|
•
|
restricted stock,
|
|
•
|
restricted stock units,
|
|
•
|
performance shares and
|
|
•
|
performance share units.
|
WEYERHAEUSER COMPANY >
2013 ANNUAL REPORT AND FORM 10-K
89
At our Annual Meeting of Shareholders held on April 11, 2013, our shareholders approved the 2013 Plan. Upon approval by our shareholders of the 2013 Plan, no further awards have been, or will be, granted under the company’s 2004 Long-Term Incentive Plan (2004 Plan) or 1998 Long-Term Incentive Compensation Plan (1998 Plan). Shareholders approved
10 million
shares of common stock for issuance under the 2013 Plan. In addition, approximately
9 million
shares authorized for issuance under our 2004 Plan and 1998 Plan that have not been issued and are not subject to outstanding awards are available for issuance under the 2013 Plan. Our Board of Directors had previously adopted and approved the 2013 Plan, subject to shareholder approval.
We may issue future grants of up to
19,902,470
shares under the 2013 Plan. We also have the right to reissue forfeited and expired grants.
For stock options and stock appreciation rights:
|
•
|
An individual participant may receive a grant of up to
2 million
shares in any one calendar year.
|
|
•
|
The exercise price is required to be the market price on the date of the grant.
|
For restricted stock, restricted stock units, performance shares, performance share units or other equity grants:
|
•
|
An individual participant may receive a grant of up to
1 million
shares annually.
|
|
•
|
No participant may be granted awards that exceed
$10 million
earned in a 12 month period.
|
The Compensation Committee of our Board of Directors (the Committee) annually establishes an overall pool of stock awards available for grants based on performance.
For stock-settled awards, we:
|
•
|
issue new stock into the marketplace and
|
|
•
|
generally do not repurchase shares in connection with issuing new awards.
|
Our common shares would increase by approximately
40 million
shares if all share-based awards were exercised or vested. These include:
|
•
|
all options, restricted stock units, and performance share units outstanding at
December 31, 2013
under the 2013 Plan, 2004 Plan and 1998 Plan; and
|
|
•
|
all remaining options, restricted stock units, and performance share units that could be granted under the 2013 Plan.
|
HOW WE ACCOUNT FOR SHARE-BASED AWARDS
We:
|
•
|
use a fair-value-based measurement for share-based awards, and
|
|
•
|
recognize the cost of share-based awards in our consolidated financial statements.
|
We recognize the cost of share-based awards in our
Consolidated Statement of Operations
over the required service period — generally the period from the date of the grant to the date when it is vested. Special situations include:
|
•
|
Awards that vest upon retirement — the required service period ends on the date an employee is eligible for retirement, including early retirement.
|
|
•
|
Awards that continue to vest following job elimination or the sale of a business — the required service period ends on the date the employment from the company is terminated.
|
In these special situations, compensation expense from share-based awards is recognized over a period that is shorter than the stated vesting period.
TAX BENEFITS OF SHARE-BASED AWARDS
Our total income tax benefit from share-based awards — as recognized in our
Consolidated Statement of Operations
— for the last three years was:
|
•
|
$10 million
in
2013
,
|
|
•
|
$9 million
in
2012
and
|
|
•
|
$6 million
in
2011
.
|
Tax benefits for share-based awards are accrued as stock compensation expense is recognized in the
Consolidated Statement of Operations
. Tax benefits on share-based awards are realized when:
|
•
|
restricted shares and restricted share units vest,
|
|
•
|
performance shares and performance share units vest,
|
|
•
|
stock options are exercised and
|
|
•
|
stock appreciation rights are exercised.
|
When actual tax benefits realized exceed the tax benefits accrued for share-based awards, we realize an excess tax benefit. We report the excess tax benefit as financing cash inflows rather than operating cash inflows. We had excess tax benefits of:
|
•
|
$13 million
in
2013
,
|
|
•
|
$5 million
in
2012
and
|
|
•
|
$2 million
in
2011
.
|
WEYERHAEUSER COMPANY >
2013 ANNUAL REPORT AND FORM 10-K
90
TYPES OF SHARE-BASED COMPENSATION
Our share-based compensation is in the form of:
|
•
|
stock options,
|
|
•
|
restricted stock units,
|
|
•
|
performance share units,
|
|
•
|
stock appreciation rights and
|
|
•
|
deferred compensation stock equivalent units.
|
STOCK OPTIONS
Stock options entitle award recipients to purchase shares of our common stock at a fixed exercise price. We grant stock options with an exercise price equal to the market price of our stock on the date of the grant.
The Details
Our stock options generally:
|
•
|
vest over four years of continuous service and
|
|
•
|
must be exercised within 10 years of the grant date.
|
The vesting and post-termination vesting terms for stock options granted in
2013
,
2012
and
2011
were as follows:
|
•
|
vest ratably over 4 years;
|
|
•
|
vest or continue to vest in the event of death, disability or retirement at an age of at least 62;
|
|
•
|
continue to vest upon retirement at an age of at least 62, but a portion of the grant is forfeited if retirement occurs before the one year anniversary of the grant depending on the number of months employed after grant date;
|
|
•
|
options continue to vest for one year in the event of involuntary termination when the retirement criteria has not been met; and
|
|
•
|
stop vesting for all other situations including early retirement prior to age 62.
|
Our Accounting
We use a Black-Scholes option valuation model to estimate the fair value of every stock option award on its grant date.
In our estimates, we use:
|
•
|
historical data — for option exercise time and employee terminations;
|
|
•
|
a Monte-Carlo simulation — for how long we expect granted options to be outstanding; and
|
|
•
|
the U.S. Treasury yield curve — for the risk-free rate. We use a yield curve over a period matching the expected term of the grant.
|
The expected volatility in our valuation model is based on:
|
•
|
implied volatilities from traded options on our stock,
|
|
•
|
historical volatility of our stock and
|
|
•
|
other factors.
|
Weighted Average Assumptions Used in Estimating Value of Stock Options Granted
|
|
2013
GRANTS
|
|
2012
GRANTS
|
|
2011
GRANTS
|
|
|||
|
Expected volatility
|
38.00
|
%
|
40.41
|
%
|
38.56
|
%
|
|||
|
Expected dividends
|
2.23
|
%
|
2.94
|
%
|
2.48
|
%
|
|||
|
Expected term (in years)
|
4.97
|
|
5.33
|
|
5.73
|
|
|||
|
Risk-free rate
|
0.92
|
%
|
1.01
|
%
|
2.65
|
%
|
|||
|
Weighted average grant date fair value
|
$
|
8.40
|
|
$
|
5.72
|
|
$
|
7.54
|
|
Share-based compensation expense for stock options is generally recognized over the vesting period. There are exceptions for stock options awarded to employees who:
|
•
|
are eligible for retirement;
|
|
•
|
will become eligible for retirement during the vesting period; or
|
|
•
|
whose employment is terminated during the vesting period due to job elimination or the sale of a business.
|
In these cases, we record the share-based compensation expense over a required service period that is less than the stated vesting period.
WEYERHAEUSER COMPANY >
2013 ANNUAL REPORT AND FORM 10-K
91
Activity
The following table shows our option unit activity for
2013
.
|
OPTIONS
(IN
THOUSANDS)
|
WEIGHTED
AVERAGE
EXERCISE
PRICE
|
|
WEIGHTED
AVERAGE
REMAINING
CONTRACTUAL
TERM
(IN YEARS)
|
AGGREGATE
INTRINSIC
VALUE (IN
MILLIONS)
|
|
|||
|
Outstanding at December 31, 2012
|
22,809
|
$
|
22.36
|
|
|
|
||
|
Granted
|
1,987
|
$
|
30.48
|
|
|
|
||
|
Exercised
|
(7,226)
|
$
|
22.37
|
|
|
|
||
|
Forfeited or expired
|
(515)
|
$
|
28.29
|
|
|
|
||
|
Outstanding at December 31, 2013
(1)
|
17,055
|
$
|
23.12
|
|
4.96
|
$
|
144
|
|
|
Exercisable at December 31, 2013
|
12,441
|
$
|
22.71
|
|
3.81
|
$
|
110
|
|
|
(1) As of December 31, 2013, there were approximately 955 thousand stock options that had met the requisite service period and will be released as identified in the grant terms.
|
||||||||
RESTRICTED STOCK UNITS
Through the Plan, we award restricted stock units — grants that entitle the holder to shares of our stock as the award vests.
The Details
Our restricted stock units granted in
2013
,
2012
and
2011
generally:
|
•
|
vest ratably over four years;
|
|
•
|
immediately vest in the event of death while employed or disability;
|
|
•
|
continue to vest upon retirement at an age of at least 62, but a portion of the grant is forfeited if retirement occurs before the one year anniversary of the grant depending on the number of months employed after grant date;
|
|
•
|
continue vesting for one year in the event of involuntary termination when the retirement has not been met; and
|
|
•
|
will be forfeited upon termination of employment in all other situations including early retirement prior to age 62.
|
Our Accounting
The fair value of our restricted stock units is the market price of our stock on the grant date of the awards.
We generally record share-based compensation expense for restricted stock units over the four-year vesting period. Generally for restricted stock units that continue to vest following the termination of employment, we record the share-based compensation expense over a required service period that is less than the stated vesting period.
Activity
The following table shows our restricted stock unit activity for
2013
.
|
STOCK UNITS
(IN THOUSANDS)
|
WEIGHTED
AVERAGE
GRANT-DATE
FAIR VALUE
|
|
||
|
Nonvested at December 31, 2012
|
1,649
|
$
|
22.25
|
|
|
Granted
|
729
|
$
|
30.54
|
|
|
Vested
|
(641)
|
$
|
22.28
|
|
|
Forfeited
|
(190)
|
$
|
24.78
|
|
|
Nonvested at December 31, 2013
(1)(2)
|
1,547
|
$
|
25.83
|
|
|
(1) As of December 31, 2013, there were approximately 165 thousand restricted stock units that had met the requisite service period and will be released as identified in the grant terms.
(2) Includes 90 thousand shares related to the Special Dividend associated with our REIT conversion in 2010. These units will be issued as the underlying shares vest. Nonvested units do not include any regular dividends.
|
||||
Nonvested restricted stock units accrue dividends that are paid out when restricted stock units vest. Any restricted stock units forfeited will not receive dividends.
As restricted stock units vest, a portion of the shares awarded is withheld to cover employee taxes. As a result, the number of stock units vested and the number of common shares issued will differ.
PERFORMANCE SHARE UNITS
As part of a new long-term incentive compensation strategy intended to tie executive compensation more closely to company performance, we granted a target number of performance share units to executives in
2013
,
2012
and
2011
. Performance share units will be paid in the form of shares of Weyerhaeuser stock – to the extent earned through company performance against financial goals – over a four-year vesting period.
The Details
The final number of shares awarded will range from
0 percent
to
150 percent
of each grant’s target, depending upon actual company performance.
WEYERHAEUSER COMPANY >
2013 ANNUAL REPORT AND FORM 10-K
92
The ultimate number of performance share units earned is based on two measures:
|
•
|
Weyerhaeuser’s cash flow during the first year determined the initial number of units earned and
|
|
•
|
Weyerhaeuser’s relative total shareholder return (TSR) ranking in the S&P 500 during the first two years is used to adjust the initial number of units earned up or down by
20 percent
.
|
At the end of the two-year performance period and over a further two-year vesting period, performance share units would be paid in shares of our stock. Performance share units granted and that are earned vest as follows:
|
•
|
units vest 50 percent, 25 percent and 25 percent on the second, third and fourth anniversaries of the grant date, respectively, as long as the individual remains employed by the company;
|
|
•
|
units fully vest in the event the participant dies or becomes disabled while employed;
|
|
•
|
continue to vest upon retirement at an age of at least 62, but a portion of the grant is forfeited if retirement occurs before the one year anniversary of the grant depending on the number of months employed after grant date;
|
|
•
|
continue vesting for one year in the event of involuntary termination when the retirement has not been met; and
|
|
•
|
unvested units will be forfeited upon termination of employment for all other reasons including early retirement prior to age 62.
|
Our Accounting
Since the award contains a market condition, the effect of the market condition is reflected in the grant date fair value which is estimated using a Monte Carlo simulation model. This model estimates the TSR ranking of the company among the S&P 500 index over the two-year performance period. Compensation expense is based on the estimated probable number of earned awards and recognized over the four-year vesting period on an accelerated basis. Generally, compensation expense would be reversed if the performance condition is not met unless the requisite service period has been achieved.
Weighted Average Assumptions Used in Estimating the Value of Performance Share Units
|
|
2013 GRANTS
|
|
2012 GRANTS
|
|
2011 GRANTS
|
|
|||
|
Performance period
|
1/1/2013 – 12/31/2014
|
|
1/1/2012 – 12/31/2013
|
|
1/1/2011 – 12/31/2012
|
|
|||
|
Valuation date closing stock price
|
$
|
30.48
|
|
$
|
20.56
|
|
$
|
24.32
|
|
|
Expected dividends
|
2.23
|
%
|
2.92
|
%
|
0.82
|
%
|
|||
|
Risk-free rate
|
0.09% - 0.46%
|
|
0.08% - 0.32%
|
|
0.12% - 0.80%
|
|
|||
|
Volatility
|
22.09% - 29.57%
|
|
34.86% - 34.66%
|
|
28.65% - 35.74%
|
|
|||
Activity
The following table shows our performance share unit activity for
2013
.
|
2013 GRANTS (IN THOUSANDS)
|
|
2012 GRANTS (IN THOUSANDS)
|
|
2011 GRANTS (IN THOUSANDS)
|
|
TOTAL GRANTS(IN THOUSANDS)
|
WEIGHTED
AVERAGE
GRANT-DATE
FAIR VALUE
|
|
||
|
Nonvested at December 31, 2012
|
—
|
|
420
|
|
394
|
|
814
|
$
|
24.38
|
|
|
Granted at target
|
389
|
|
0
|
|
—
|
|
389
|
$
|
31.37
|
|
|
Vested
|
0
|
|
0
|
|
(198
|
)
|
(198)
|
$
|
27.30
|
|
|
Forfeited
|
(63
|
)
|
(41
|
)
|
(18)
|
|
(122)
|
$
|
27.64
|
|
|
Performance adjustment
|
155
|
|
64
|
|
0
|
|
219
|
$
|
28.57
|
|
|
Nonvested at December 31, 2013
(1)
|
481
|
|
443
|
|
178
|
|
1,102
|
$
|
26.83
|
|
|
(1) As of December 31, 2013, there were approximately 331 thousand performance share units that had met the requisite service period and will be released as identified in the grant terms.
|
||||||||||
For 2013 grants, the company exceeded the cash flow target, resulting in an initial number of shares earned equal to
150 percent
of target.
For 2012 grants, the company exceeded the cash flow target, resulting in an initial number of shares earned equal to
122 percent
of target. Because the company's two-year TSR ranking was between the 50
th
and 75
th
percentile, the initial number of performance shares granted increased
17 percent
.
For 2011 grants, the company exceeded the cash flow target, resulting in an initial number of shares earned equal to
105 percent
of target. Because the company's two-year TSR ranking was greater than the 75
th
percentile, the initial number of shares granted increased by
20 percent
.
As performance share units vest, a portion of the shares awarded is withheld to cover participant taxes. As a result, the number of stock units vested and the number of common shares issued will differ.
STOCK APPRECIATION RIGHTS
Through the Plan, we grant cash-settled stock appreciation rights as part of certain compensation awards.
The Details
Stock appreciation rights are similar to stock options. Employees benefit when the market price of our stock is higher on the exercise date than it was on the date the stock appreciation rights were granted. The differences are that the employee:
|
•
|
receives the benefit as a cash award and
|
|
•
|
does not purchase the underlying stock.
|
WEYERHAEUSER COMPANY >
2013 ANNUAL REPORT AND FORM 10-K
93
The vesting conditions and exceptions are the same as for 10-year stock options. Details are in the Stock Options section earlier in this note.
Stock appreciation rights are generally issued to employees outside of the U.S.
Our Accounting
We use a Black-Scholes option-valuation model to estimate the fair value of a stock appreciation right on its grant
date and every subsequent reporting date that the right is outstanding. Stock appreciation rights are liability-classified awards and the fair value is remeasured at every reporting date.
The process used to develop our valuation assumptions is the same as for the 10-year stock options we grant. Details are in the Stock Options section earlier in this note.
Weighted Average Assumptions Used to Re-measure Value of Stock Appreciation Rights at Year-End
|
|
2013 GRANTS
|
2012 GRANTS
|
2011 GRANTS
|
||||||
|
Expected volatility
|
24.02
|
%
|
29.07
|
%
|
39.92
|
%
|
|||
|
Expected dividends
|
2.81
|
%
|
2.44
|
%
|
3.21
|
%
|
|||
|
Expected term (in years)
|
1.16
|
|
1.71
|
|
2.82
|
|
|||
|
Risk-free rate
|
0.19
|
%
|
0.27
|
%
|
0.44
|
%
|
|||
|
Weighted average fair value
|
$
|
8.68
|
|
$
|
7.25
|
|
$
|
3.24
|
|
Activity
The following table shows our stock appreciation rights activity for
2013
.
|
RIGHTS
(IN
THOUSANDS)
|
|
WEIGHTED
AVERAGE
EXERCISE
PRICE
|
|
AVERAGE
REMAINING
CONTRACTUAL
TERM
(IN YEARS)
|
|
AGGREGATE
INTRINSIC
VALUE (IN
MILLIONS)
|
|
|||
|
Outstanding at December 31, 2012
|
1,151
|
|
$
|
22.67
|
|
|
|
|||
|
Granted
|
—
|
|
$
|
—
|
|
|
|
|||
|
Exercised
|
(440
|
)
|
$
|
22.08
|
|
|
|
|||
|
Forfeited or expired
|
(16
|
)
|
$
|
26.20
|
|
|
|
|||
|
Outstanding at December 31, 2013
|
695
|
|
$
|
22.96
|
|
4.04
|
|
$
|
6
|
|
|
Exercisable at December 31, 2013
|
592
|
|
$
|
23.62
|
|
3.51
|
|
$
|
5
|
|
UNRECOGNIZED SHARE-BASED COMPENSATION
As of
December 31, 2013
, our unrecognized share-based compensation cost for all types of share-based awards included:
|
•
|
$43 million
related to non-vested equity-classified share-based compensation arrangements — expected to be recognized over a weighted average period of approximately
2.3
years; and
|
|
•
|
$1 million
related to non-vested liability-classified stock appreciation rights — expected to vest over a weighted average period of approximately
1.5
years.
|
DEFERRED COMPENSATION STOCK EQUIVALENT UNITS
Certain employees and our board of directors may defer compensation into stock-equivalent units.
The Details
The plan works differently for employees and directors.
Eligible employees:
|
•
|
may choose to defer all or part of their bonus into stock-equivalent units;
|
|
•
|
may choose to defer part of their salary, except for executive officers; and
|
|
•
|
receive a 15 percent premium if the deferral is for at least five years.
|
Our directors:
|
•
|
receive a portion of their annual retainer fee in the form of restricted stock units, which vest over one year and may be deferred into stock-equivalent units;
|
|
•
|
may choose to defer some or all of the remainder of their annual retainer fee into stock-equivalent units; and
|
|
•
|
do not receive a premium for their deferrals.
|
Employees and directors also choose when the deferrals will be paid out although no deferrals may be paid until after the separation from service of the employee or director.
Our Accounting
We settle all deferred compensation accounts in cash for our employees. Our directors receive shares of common stock as payment for stock-equivalent units. In addition, we credit all stock-equivalent accounts with dividend equivalents.
During 2012, the directors' deferred compensation plan was amended to allow the directors to elect to receive payments of amounts deferred into stock-equivalent units in cash or stock for elections made prior to December 31, 2011. Deferrals made beginning January 1, 2012, into stock-equivalent units will be paid in common shares. Elections to receive these deferred amounts in stock resulted in the issuance of
52,720
in
WEYERHAEUSER COMPANY >
2013 ANNUAL REPORT AND FORM 10-K
94
2013 and
40,899
shares in 2012. The number of common shares to be issued in the future to directors who elected common share payments is
557,519
.
Stock-equivalent units are:
|
•
|
liability-classified awards and
|
|
•
|
re-measured to fair value at every reporting date.
|
The fair value of a stock-equivalent unit is equal to the market price of our stock.
Activity
The number of stock-equivalent units outstanding in our deferred compensation accounts was:
|
•
|
915,160
as of
December 31, 2013
;
|
|
•
|
971,650
as of
December 31, 2012
; and
|
|
•
|
1,021,977
as of
December 31, 2011
.
|
NOTE 20:
CHARGES FOR RESTRUCTURING, CLOSURES AND ASSET IMPAIRMENTS
Items Included in Our Restructuring, Closure and Asset Impairment Charges
|
DOLLAR AMOUNTS IN MILLIONS
|
|||||||||
|
|
2013
|
|
2012
|
|
2011
|
|
|||
|
Restructuring and closure charges:
|
|
|
|
||||||
|
Termination benefits
|
$
|
7
|
|
$
|
—
|
|
$
|
4
|
|
|
Pension and postretirement charges
|
—
|
|
—
|
|
6
|
|
|||
|
Other restructuring and closure costs
|
9
|
|
8
|
|
17
|
|
|||
|
Charges for restructuring and closures
|
16
|
|
8
|
|
27
|
|
|||
|
Impairments of long-lived assets and other related charges:
|
|
|
|
||||||
|
Long-lived asset impairments
|
15
|
|
19
|
|
42
|
|
|||
|
Real estate impairments and charges
|
357
|
|
1
|
|
10
|
|
|||
|
Write-off of pre-acquisition costs and abandoned community costs
|
1
|
|
3
|
|
1
|
|
|||
|
Other assets
|
1
|
|
1
|
|
3
|
|
|||
|
Impairment of long-lived assets and other related charges
|
374
|
|
24
|
|
56
|
|
|||
|
Total charges for restructuring and impairment of long-lived assets
|
$
|
390
|
|
$
|
32
|
|
$
|
83
|
|
RESTRUCTURING AND CLOSURES
During 2013 our restructuring and closure charges were primarily related to our Real Estate divestiture. During 2012 and 2011, our restructuring and closure charges were primarily related to various Wood Products operations we closed or curtailed and restructuring our corporate staff functions to support achieving our competitive performance goals.
Other restructuring and closure costs include lease termination charges, dismantling and demolition of plant and equipment, gain or loss on disposition of assets, environmental cleanup costs and incremental costs to wind down operating facilities.
ASSET IMPAIRMENTS
The Impairment of Long-Lived Assets and Goodwill sections of
Note 1: Summary of Significant Accounting Policies
provide details about how we account for these impairments. Additional information can also be found in our
Critical Accounting Policies
.
Long-Lived Assets
Our long-lived asset impairments were primarily related to the following:
|
•
|
2013 — charges include
$9 million
related to the decision to permanently close our Colbert, Georgia engineered lumber facility in our Wood Products segment that was previously indefinitely closed. The fair value of the facility was determined using significant unobservable inputs (Level 3) based on liquidation values.
|
|
•
|
2012 — charges are primarily related to unutilized assets held in Unallocated Items that were sold or are currently held for sale. The fair values of the assets were determined using significant other observable inputs (Level 2) based on market quotes and significant unobservable inputs (Level 3) based on discounted cash flow models.
|
|
•
|
2011 — charges include
$29 million
related to the decision to permanently close four engineered lumber facilities in our Wood Products segment that were previously indefinitely closed. These facilities are located in Albany, Oregon; Dodson, Louisiana; Pine Hill, Alabama; and Simsboro, Louisiana. The fair values of the facilities were determined using significant unobservable inputs (Level 3) based on liquidation values.
|
Real Estate Impairments and Charges
Real estate impairments relate primarily to projects or communities held for development. Within a community that is held for development, there may be individual homes or parcels of land that are currently held for sale. Impairment charges recognized as a result of adjusting individual held-for-sale assets within a community to estimated fair value less cost to sell are also included in the total impairment charges above. Impairment charges also include impairments of certain assets that were disposed of during the year. The fair values of the assets were
WEYERHAEUSER COMPANY >
2013 ANNUAL REPORT AND FORM 10-K
95
determined using significant other observable inputs (Level 2) based on market quotes and significant unobservable inputs (Level 3) based on discounted future cash flows of the projects
.
We use present value techniques based on discounting the estimated cash flows using a rate commensurate with the inherent risk associated with the assets and related cash flow streams.
The real estate impairment charge in 2013 is primarily related to the impairment of the Coyote Springs Property. Under the terms of the TRI Pointe transaction, certain assets and liabilities of WRECO and its subsidiaries will be excluded from the transaction and retained by Weyerhaeuser, including assets and liabilities relating to the Coyote Springs Property. During fourth quarter 2013, following the announcement of the TRI Pointe transaction, WRECO and Weyerhaeuser began exploring strategic alternatives for the Coyote Springs Property and determined that Weyerhaeuser’s strategy for development of the Coyote Springs Property will likely differ from WRECO’s current development plan. WRECO’s development plan was long-term in nature with development and net cash flows covering at least 15-20 years. The undiscounted cash flows for the Coyote Springs Property under the WRECO development plan remained above the carrying value of the property. Weyerhaeuser Company’s strategy is to cease holding the Coyote Springs Property for development and to initiate activities in the near-term to market the assets to potential third-party buyers. The undiscounted cash flows under the Weyerhaeuser Company asset sale strategy were below the carrying value of the property. Consequently, we recorded a non-cash charge of
$356 million
in fourth quarter 2013 for the impairment of the Coyote Springs Property. Of this amount,
$343 million
was recorded in our Real Estate segment and
$13 million
in Unallocated Items. The fair value of the property was primarily based on an independent appraisal that was determined using both other observable inputs (Level 2) related to other market transactions and significant unobservable inputs (Level 3) such as the timing and amounts of future cash flows related to the development of the property, timing and amounts of proceeds from acreage sales, access to water for use on the property and discount rates applicable to the future cash flows. The property is recorded in "Land being processed for development" in our
Consolidated Balance Sheet
.
Write-off of Pre-Acquisition Costs and Abandoned Community Costs
In addition to owning land and residential lots, we also have option agreements to purchase land and lots at a future date. When the economics of a project no longer support acquisition of the land or lots under option, we may elect not to move forward with the acquisition. Option deposits and capitalized engineering and related costs associated with the assets under option may be forfeited at that time. Charges for such forfeitures are reported as write-off of pre-acquisition costs. As of
December 31, 2013
, non-refundable option deposits and capitalized pre-acquisition costs associated with these lots totaled
$47 million
. The deposits and costs are recorded in "Other assets" in our
Consolidated Balance Sheet
.
NOTE 21:
OTHER OPERATING INCOME, NET
Other operating income, net:
|
•
|
includes both recurring and occasional income and expense items and
|
|
•
|
can fluctuate from year to year.
|
Various Income and Expense Items Included in Other Operating Income, Net
|
DOLLAR AMOUNTS IN MILLIONS
|
|||||||||
|
|
2013
|
|
2012
|
|
2011
|
|
|||
|
Gain on the sale of non-strategic timberlands
|
$
|
—
|
|
$
|
—
|
|
$
|
(152
|
)
|
|
Gain on postretirement plan amendment
(Note 10)
|
—
|
|
(103
|
)
|
—
|
|
|||
|
Gain on disposition of assets
|
(19
|
)
|
(28
|
)
|
(17
|
)
|
|||
|
Foreign exchange (gains) losses, net
|
7
|
|
(6
|
)
|
5
|
|
|||
|
Land management income
|
(28
|
)
|
(27
|
)
|
(26
|
)
|
|||
|
Litigation expense, net
|
16
|
|
12
|
|
5
|
|
|||
|
Other, net
|
(1
|
)
|
(28
|
)
|
(27
|
)
|
|||
|
Total
|
$
|
(25
|
)
|
$
|
(180
|
)
|
$
|
(212
|
)
|
The
$152 million
pretax gain on sale of non-strategic timberlands in 2011 resulted from the sale of
82,000
acres in southwestern Washington. Timberland exchanges and smaller dispositions are included in our net sales and revenue and cost of products sold.
Foreign exchange (gains) losses result from changes in exchange rates primarily related to our Canadian operations.
Land management income includes income from recreational activities, land permits, grazing rights, firewood sales and other miscellaneous income related to land management activities.
NOTE 22:
INCOME TAXES
This note provides details about our income taxes applicable to continuing operations:
|
•
|
earnings before income taxes,
|
|
•
|
provision for income taxes,
|
|
•
|
effective income tax rate,
|
|
•
|
deferred tax assets and liabilities and
|
|
•
|
unrecognized tax benefits.
|
Income taxes related to discontinued operations are discussed in
Note 5: Discontinued Operations
.
WEYERHAEUSER COMPANY >
2013 ANNUAL REPORT AND FORM 10-K
96
EARNINGS BEFORE INCOME TAXES
Domestic and Foreign Earnings (Loss) From Continuing Operations Before Income Taxes
|
DOLLAR AMOUNTS IN MILLIONS
|
|||||||||
|
|
2013
|
|
2012
|
|
2011
|
|
|||
|
Domestic earnings
|
$
|
312
|
|
$
|
450
|
|
$
|
341
|
|
|
Foreign earnings (loss)
|
122
|
|
(11
|
)
|
(84
|
)
|
|||
|
Total
|
$
|
434
|
|
$
|
439
|
|
$
|
257
|
|
PROVISION FOR INCOME TAXES
Provision (Benefit) for Income Taxes From Continuing Operations
|
DOLLAR AMOUNTS IN MILLIONS
|
|||||||||
|
|
2013
|
|
2012
|
|
2011
|
|
|||
|
Current:
|
|
|
|
|
|
|
|||
|
Federal
|
$
|
(63
|
)
|
$
|
(69
|
)
|
$
|
(73
|
)
|
|
State
|
(16
|
)
|
(11
|
)
|
16
|
|
|||
|
Foreign
|
(21
|
)
|
26
|
|
8
|
|
|||
|
|
(100
|
)
|
(54
|
)
|
(49
|
)
|
|||
|
Deferred:
|
|
|
|
|
|
|
|||
|
Federal
|
(60
|
)
|
39
|
|
11
|
|
|||
|
State
|
10
|
|
4
|
|
(11
|
)
|
|||
|
Foreign
|
21
|
|
66
|
|
(13
|
)
|
|||
|
|
(29
|
)
|
109
|
|
(13
|
)
|
|||
|
Total income tax provision (benefit)
|
$
|
(129
|
)
|
$
|
55
|
|
$
|
(62
|
)
|
Included in our income tax provision for 2012 are recomputations of prior year taxes, resulting in reclassifications between foreign and domestic for both current and deferred taxes as a result of final tax proceedings between countries.
EFFECTIVE INCOME TAX RATE
Effective Income Tax Rate Applicable to Continuing Operations
|
DOLLAR AMOUNTS IN MILLIONS
|
|||||||||
|
|
2013
|
|
2012
|
|
2011
|
|
|||
|
U.S. federal statutory income tax
|
$
|
152
|
|
$
|
154
|
|
$
|
90
|
|
|
State income taxes, net of federal tax benefit
|
13
|
|
6
|
|
4
|
|
|||
|
REIT income not subject to federal income tax
|
(101
|
)
|
(94
|
)
|
(80
|
)
|
|||
|
Foreign taxes
|
(8
|
)
|
8
|
|
20
|
|
|||
|
Provision for unrecognized tax benefits
|
(193
|
)
|
(6
|
)
|
(7
|
)
|
|||
|
Repatriation of Canadian earnings
|
21
|
|
—
|
|
(76
|
)
|
|||
|
State income tax settlement
|
—
|
|
(10
|
)
|
—
|
|
|||
|
Domestic production activities deduction
|
(13
|
)
|
—
|
|
—
|
|
|||
|
Other, net
|
—
|
|
(3
|
)
|
(13
|
)
|
|||
|
Total income tax provision (benefit)
|
$
|
(129
|
)
|
$
|
55
|
|
$
|
(62
|
)
|
|
Effective income tax rate
|
(29.9
|
)%
|
12.5
|
%
|
(23.3
|
)%
|
|||
DEFERRED TAX ASSETS AND LIABILITIES
Deferred tax assets and liabilities reflect temporary differences between pretax book income and taxable income. Deferred tax assets represent tax benefits that have already been recorded for book purposes but will be recorded for tax purposes in the future. Deferred tax liabilities represent income that has been recorded for book purposes but will be reported as taxable income in the future.
WEYERHAEUSER COMPANY >
2013 ANNUAL REPORT AND FORM 10-K
97
Deferred Income Tax Assets (Liabilities) Related to Continuing Operations by Category
|
DOLLAR AMOUNTS IN MILLIONS
|
||||||
|
|
DECEMBER 31,
2013 |
|
DECEMBER 31,
2012 |
|
||
|
Assets:
|
||||||
|
Current
|
$
|
151
|
|
$
|
88
|
|
|
Noncurrent - domestic
|
37
|
|
285
|
|
||
|
Noncurrent - foreign
|
4
|
|
83
|
|
||
|
Noncurrent liabilities - domestic
|
(206
|
)
|
—
|
|
||
|
Net deferred tax asset (liability)
|
$
|
(14
|
)
|
$
|
456
|
|
Items Included in Our Deferred Income Tax Assets (Liabilities)
|
DOLLAR AMOUNTS IN MILLIONS
|
||||||
|
|
DECEMBER 31,
2013 |
|
DECEMBER 31,
2012 |
|
||
|
Postretirement benefits
|
$
|
102
|
|
$
|
144
|
|
|
Pension
|
57
|
|
521
|
|
||
|
Real estate impairments
|
214
|
|
115
|
|
||
|
State tax credits
|
59
|
|
59
|
|
||
|
Net operating loss carryforwards
|
144
|
|
187
|
|
||
|
Cellulosic biofuel producers credit
|
80
|
|
240
|
|
||
|
Other
|
310
|
|
336
|
|
||
|
Gross deferred tax assets
|
966
|
|
1,602
|
|
||
|
Valuation allowance
|
(97
|
)
|
(144
|
)
|
||
|
Net deferred tax assets
|
869
|
|
1,458
|
|
||
|
Property, plant and equipment
|
(538
|
)
|
(577
|
)
|
||
|
Timber installment notes
|
(180
|
)
|
(240
|
)
|
||
|
Other
|
(165
|
)
|
(185
|
)
|
||
|
Deferred tax liabilities
|
(883
|
)
|
(1,002
|
)
|
||
|
Net deferred tax asset (liability)
|
$
|
(14
|
)
|
$
|
456
|
|
OTHER INFORMATION ABOUT OUR DEFERRED INCOME TAX ASSETS (LIABILITIES)
Other information about our deferred income tax assets (liabilities) include:
|
•
|
net operating loss carryforwards,
|
|
•
|
valuation allowances and
|
|
•
|
reinvestment of undistributed earnings.
|
Net Operating Loss Carryforwards
Our state and foreign net operating loss carryforwards as of the end of
2013
are as follows:
|
•
|
$616 million
, which expire from
2014
through
2033
; and
|
|
•
|
$36 million
, which do not expire.
|
Valuation Allowances
With the exception of the valuation allowance discussed below, we believe it is more likely than not that we will have sufficient future taxable income to realize our deferred tax assets.
Our valuation allowance on our deferred tax assets was
$97 million
as of the end of
2013
. This primarily related to foreign and state net operating losses and state and provincial credits.
The total changes in our valuation allowance over the last year was a net decrease of
$47 million
. This net decrease resulted primarily from expiration of foreign and state net operating losses and credits.
Reinvestment of Undistributed Earnings
The balance of our foreign undistributed earnings was approximately
$23 million
at the end of
2013
and has been permanently reinvested; therefore, it is not subject to U.S. income tax. Generally, such earnings become subject to U.S. tax upon the remittance of dividends and under certain other circumstances. It is not practicable to estimate the amount of deferred tax liability on the remaining undistributed earnings.
HOW WE ACCOUNT FOR INCOME TAXES
The Income Taxes section of
Note 1: Summary of Significant Accounting Policies
provides details about how we account for our income taxes.
WEYERHAEUSER COMPANY >
2013 ANNUAL REPORT AND FORM 10-K
98
UNRECOGNIZED TAX BENEFITS
Unrecognized tax benefits represent potential future obligations to taxing authorities if uncertain tax positions we have taken on previously filed tax returns are not sustained. The total amount of unrecognized tax benefits as of
December 31, 2013
and
2012
, are
$26 million
and
$177 million
, respectively, which does not include related interest of
$4 million
and
$15 million
, respectively. These amounts represent the gross amount of exposure in individual jurisdictions and do not reflect any additional benefits expected to be realized if such positions were not sustained, such as the federal deduction that could be realized if an unrecognized state deduction was not sustained.
Reconciliation of the Beginning and Ending Amount of Unrecognized Tax Benefits
|
DOLLAR AMOUNTS IN MILLIONS
|
||||||
|
|
DECEMBER 31,
2013 |
|
DECEMBER 31,
2012 |
|
||
|
Balance at beginning of year
|
$
|
177
|
|
$
|
251
|
|
|
Additions for tax positions of prior years
|
—
|
|
2
|
|
||
|
Reductions for tax positions of prior years
|
(148
|
)
|
(21
|
)
|
||
|
Settlements
|
—
|
|
(53
|
)
|
||
|
Lapse of statute
|
(3
|
)
|
(2
|
)
|
||
|
Balance at end of year
|
$
|
26
|
|
$
|
177
|
|
The net liability recorded in our
Consolidated Balance Sheet
related to unrecognized tax benefits was
$24 million
as of
December 31, 2013
, and
$185 million
as of
December 31, 2012
, which includes interest of
$4 million
and
$15 million
respectively, net of payments made in advance of settlements.
The net liability recorded for tax positions across all jurisdictions that, if sustained, would affect our effective tax rate was
$16 million
as of
December 31, 2013
, and
$159 million
as of
December 31, 2012
, which includes interest of
$4 million
and
$15 million
, respectively.
During fourth quarter 2013, we received a final examination report from the IRS regarding our years under exam. As a result
,
we recognized a benefit for the reduction of our unrecognized tax benefits primarily relating to alternative fuel mixture credits. In addition, we recognized a benefit for a reduction of interest accrued primarily related to the U.S./Canada Competent Authority settlement. During third quarter 2012, as a result of reaching agreements with taxing authorities, we reduced our unrecognized tax benefits. This led to reclasses between our long-term tax receivables and payables and reduced our tax provision by
$7 million
.
In accordance with our accounting policy, we accrue interest and penalties related to unrecognized tax benefits as a component of income tax expense.
As of
December 31, 2013
, no U.S. federal income tax returns are under exam. Our U.S. federal statute is open for years 2008 forward. We are undergoing examinations in various state jurisdictions for tax years 2008-2011 and various foreign jurisdictions for tax years 2005-2012
.
We expect that the outcome of any examination will not have a material effect on our consolidated financial statements; however, audit outcomes and the timing of audit settlements are subject to significant uncertainty.
In the next 12 months, we estimate a decrease of up to
$15 million
in unrecognized tax benefits on several tax positions due to the lapse of applicable statutes of limitation.
WEYERHAEUSER COMPANY >
2013 ANNUAL REPORT AND FORM 10-K
99
NOTE 23:
GEOGRAPHIC AREAS
This note provides selected key financial data according to the geographical locations of our customers. The selected key financial data includes:
|
•
|
sales to unaffiliated customers,
|
|
•
|
export sales from the U.S., and
|
|
•
|
long-lived assets.
|
SALES
Our sales to unaffiliated customers outside the U.S. are primarily to customers in Canada, China, Japan and Europe. Our export sales include:
|
•
|
pulp, liquid packaging board, logs, lumber and wood chips to Japan;
|
|
•
|
pulp, logs and lumber to other Pacific Rim countries; and
|
|
•
|
pulp to Europe.
|
Sales by Geographic Area
|
FOR THE THREE-YEAR PERIOD ENDED DECEMBER 31, 2013
(DOLLAR AMOUNTS IN MILLIONS)
|
|||||||||
|
|
2013
|
|
2012
|
|
2011
|
|
|||
|
Sales to unaffiliated customers:
|
|
|
|
||||||
|
U.S.
|
$
|
6,036
|
|
$
|
4,937
|
|
$
|
4,008
|
|
|
Japan
|
758
|
|
639
|
|
640
|
|
|||
|
Europe
|
298
|
|
300
|
|
331
|
|
|||
|
China
|
453
|
|
360
|
|
446
|
|
|||
|
Canada
|
418
|
|
302
|
|
271
|
|
|||
|
South America
|
80
|
|
74
|
|
75
|
|
|||
|
Other foreign countries
|
486
|
|
447
|
|
445
|
|
|||
|
Total
|
$
|
8,529
|
|
$
|
7,059
|
|
$
|
6,216
|
|
|
Export sales from the U.S.:
|
|
|
|
||||||
|
Japan
|
$
|
676
|
|
$
|
583
|
|
$
|
581
|
|
|
China
|
411
|
|
329
|
|
389
|
|
|||
|
Other
|
804
|
|
770
|
|
805
|
|
|||
|
Total
|
$
|
1,891
|
|
$
|
1,682
|
|
$
|
1,775
|
|
LONG-LIVED ASSETS
Our long-lived assets — used in the generation of revenues in the different geographical areas — are nearly all in the U.S. and Canada. Our long-lived assets include:
|
•
|
goodwill,
|
|
•
|
timber and timberlands and
|
|
•
|
property and equipment, including construction in progress.
|
Long-Lived Assets by Geographic Area
|
DOLLAR AMOUNTS IN MILLIONS
|
|||||||||
|
|
December 31,
2013 |
|
December 31,
2012 |
|
December 31,
2011 |
|
|||
|
Long-lived assets:
|
|
|
|
||||||
|
U.S.
|
$
|
8,116
|
|
$
|
5,523
|
|
$
|
5,702
|
|
|
Canada
|
652
|
|
728
|
|
745
|
|
|||
|
Other foreign countries
|
670
|
|
672
|
|
637
|
|
|||
|
Total
|
$
|
9,438
|
|
$
|
6,923
|
|
$
|
7,084
|
|
Long-lived assets in the U.S. increased primarily due to the acquisition of Longview Timber. See
Note 3: Longview Timber Purchase
for more information.
WEYERHAEUSER COMPANY >
2013 ANNUAL REPORT AND FORM 10-K
100
NOTE 24:
SELECTED QUARTERLY FINANCIAL INFORMATION (unaudited)
Quarterly financial data provides a review of our results and performance throughout the year. Our earnings per share for the full year do not always equal the sum of the four quarterly earnings-per share amounts because of common share activity during the year.
Key Quarterly Financial Data for the Last Two Years
|
DOLLAR AMOUNTS IN MILLIONS EXCEPT PER-SHARE FIGURES
|
|||||||||||||||
|
|
First
Quarter
|
Second
Quarter
|
Third
Quarter
|
Fourth
Quarter
(1)
|
Full Year
|
||||||||||
|
2013:
|
|
|
|
|
|||||||||||
|
Net sales
|
$
|
1,951
|
|
$
|
2,141
|
|
$
|
2,181
|
|
$
|
2,256
|
|
$
|
8,529
|
|
|
Operating income (loss)
|
$
|
256
|
|
$
|
311
|
|
$
|
277
|
|
$
|
(97
|
)
|
$
|
747
|
|
|
Earnings (loss) from continuing operations before income taxes
|
$
|
185
|
|
$
|
240
|
|
$
|
203
|
|
$
|
(194
|
)
|
$
|
434
|
|
|
Net earnings
|
$
|
144
|
|
$
|
198
|
|
$
|
167
|
|
$
|
54
|
|
$
|
563
|
|
|
Net earnings attributable to Weyerhaeuser common shareholders
|
$
|
144
|
|
$
|
196
|
|
$
|
157
|
|
$
|
43
|
|
$
|
540
|
|
|
Basic net earnings per share attributable to Weyerhaeuser common shareholders
|
$
|
0.26
|
|
$
|
0.35
|
|
$
|
0.27
|
|
$
|
0.07
|
|
$
|
0.95
|
|
|
Diluted net earnings per share attributable to Weyerhaeuser common shareholders
|
$
|
0.26
|
|
$
|
0.35
|
|
$
|
0.27
|
|
$
|
0.07
|
|
$
|
0.95
|
|
|
Dividends paid per share
|
$
|
0.17
|
|
$
|
0.20
|
|
$
|
0.22
|
|
$
|
0.22
|
|
$
|
0.81
|
|
|
Market prices - high/low
|
$31.74 - $28.36
|
|
$33.24 - $26.38
|
|
$29.86 - $26.64
|
|
$32.00 - $28.01
|
|
$33.24 - $26.38
|
|
|||||
|
2012:
|
|||||||||||||||
|
Net sales
|
$
|
1,494
|
|
$
|
1,793
|
|
$
|
1,772
|
|
$
|
2,000
|
|
$
|
7,059
|
|
|
Operating income
|
$
|
101
|
|
$
|
176
|
|
$
|
202
|
|
$
|
256
|
|
$
|
735
|
|
|
Earnings from continuing operations before income taxes
|
$
|
26
|
|
$
|
101
|
|
$
|
130
|
|
$
|
182
|
|
$
|
439
|
|
|
Net earnings
|
$
|
41
|
|
$
|
84
|
|
$
|
117
|
|
$
|
142
|
|
$
|
384
|
|
|
Net earnings attributable to Weyerhaeuser common shareholders
|
$
|
41
|
|
$
|
84
|
|
$
|
117
|
|
$
|
143
|
|
$
|
385
|
|
|
Basic net earnings per share attributable to Weyerhaeuser common shareholders
|
$
|
0.08
|
|
$
|
0.16
|
|
$
|
0.22
|
|
$
|
0.26
|
|
$
|
0.71
|
|
|
Diluted net earnings per share attributable to Weyerhaeuser common shareholders
|
$
|
0.08
|
|
$
|
0.16
|
|
$
|
0.22
|
|
$
|
0.26
|
|
$
|
0.71
|
|
|
Dividends paid per share
|
$
|
0.15
|
|
$
|
0.15
|
|
$
|
0.15
|
|
$
|
0.17
|
|
$
|
0.62
|
|
|
Market prices - high/low
|
$22.36 - $18.50
|
|
$22.36 - $18.60
|
|
$28.06 - $21.87
|
|
$28.82 - $24.75
|
|
$28.82 - $18.50
|
|
|||||
|
(1) Fourth Quarter 2013 includes a $356 million non-cash impairment charge. See
Note 20: Charges for Restructuring, Closures and Asset Impairments
for more information.
|
|||||||||||||||
WEYERHAEUSER COMPANY >
2013 ANNUAL REPORT AND FORM 10-K
101
CHANGES IN AND DISAGREEMENTS WITH ACCOUNTANTS ON ACCOUNTING AND FINANCIAL DISCLOSURE
Not applicable.
CONTROLS AND PROCEDURES
|
EVALUATION OF DISCLOSURE CONTROLS AND PROCEDURES
|
The company’s principal executive officer and principal financial officer have evaluated the effectiveness of the company’s disclosure controls and procedures as of the end of the period covered by this annual report on Form 10-K. Disclosure controls are controls and other procedures that are designed to ensure that information required to be disclosed in the reports filed or submitted under the Exchange Act is recorded, processed, summarized and reported within the time periods specified in the Securities and Exchange Commission’s (SEC) rules and forms. Disclosure controls and procedures include, without limitation, controls and procedures designed to ensure that information required to be disclosed by an issuer in the reports that it files or submits under the Act is accumulated and communicated to the issuer’s management, including its principal executive and principal financial officers, to allow timely decisions regarding required disclosure.
Based on their evaluation, the company’s principal executive officer and principal financial officer have concluded that the company’s disclosure controls and procedures are effective to ensure that information required to be disclosed complies with the SEC’s rules and forms.
|
CHANGES IN INTERNAL CONTROL
|
No changes occurred in the company’s internal control over financial reporting during the period that have materially affected, or are reasonably likely to materially affect, the company’s internal control over financial reporting.
|
MANAGEMENT’S REPORT ON INTERNAL CONTROL OVER FINANCIAL REPORTING
|
Management is responsible for establishing and maintaining adequate internal control over financial reporting as is defined in the Securities and Exchange Act of 1934 rules. Management, under our supervision, conducted an evaluation of the effectiveness of the company’s internal control over financial reporting based on the framework in
Internal Control — Integrated Framework (1992)
issued by the Committee of Sponsoring Organizations of the Treadway Commission (COSO). Based on our evaluation under the framework in
Internal Control — Integrated Framework (1992)
, management concluded that the company’s internal control over financial reporting was effective as of
December 31, 2013
. The effectiveness of the company’s internal control over financial reporting as of
December 31, 2013
, has been audited by KPMG LLP, an independent registered public accounting firm, as stated in their report, which is included herein.
We completed the acquisition of Longview Timber in July 2013. Due to the timing of the acquisition we have excluded Longview Timber from our evaluation of the effectiveness of internal control over financial reporting. For the period ended December 31, 2013, Longview Timber net sales and assets represented approximately 1% of net sales and 20% of total assets.
WEYERHAEUSER COMPANY >
2013 ANNUAL REPORT AND FORM 10-K
102
|
REPORT OF INDEPENDENT REGISTERED PUBLIC ACCOUNTING FIRM
|
The Board of Directors and Shareholders
Weyerhaeuser Company:
We have audited Weyerhaeuser Company’s internal control over financial reporting as of December 31, 2013, based on criteria established in
Internal Control — Integrated Framework
(1992)
issued by the Committee of Sponsoring Organizations of the Treadway Commission (COSO). Weyerhaeuser Company’s management is responsible for maintaining effective internal control over financial reporting and for its assessment of the effectiveness of internal control over financial reporting, included in the accompanying Management’s Report on Internal Control Over Financial Reporting. Our responsibility is to express an opinion on the Company’s internal control over financial reporting based on our audit.
We conducted our audit in accordance with the standards of the Public Company Accounting Oversight Board (United States). Those standards require that we plan and perform the audit to obtain reasonable assurance about whether effective internal control over financial reporting was maintained in all material respects. Our audit included obtaining an understanding of internal control over financial reporting, assessing the risk that a material weakness exists, and testing and evaluating the design and operating effectiveness of internal control based on the assessed risk. Our audit also included performing such other procedures as we considered necessary in the circumstances. We believe that our audit provides a reasonable basis for our opinion.
A company’s internal control over financial reporting is a process designed to provide reasonable assurance regarding the reliability of financial reporting and the preparation of financial statements for external purposes in accordance with generally accepted accounting principles. A company’s internal control over financial reporting includes those policies and procedures that (1) pertain to the maintenance of records that, in reasonable detail, accurately and fairly reflect the transactions and dispositions of the assets of the company; (2) provide reasonable assurance that transactions are recorded as necessary to permit preparation of financial statements in accordance with generally accepted accounting principles, and that receipts and expenditures of the company are being made only in accordance with authorizations of management and directors of the company; and (3) provide reasonable assurance regarding prevention or timely detection of unauthorized acquisition, use, or disposition of the company’s assets that could have a material effect on the financial statements.
Because of its inherent limitations, internal control over financial reporting may not prevent or detect misstatements. Also, projections of any evaluation of effectiveness to future periods are subject to the risk that controls may become inadequate because of changes in conditions, or that the degree of compliance with the policies or procedures may deteriorate.
In our opinion, Weyerhaeuser Company maintained, in all material respects, effective internal control over financial reporting as of December 31, 2013, based on criteria established in
Internal Control — Integrated Framework
(1992)
issued by the Committee of Sponsoring Organizations of the Treadway Commission (COSO).
Weyerhaeuser Company completed the acquisition of Longview Timber in July 2013. Due to the timing of the acquisition Weyerhaeuser Company has excluded Longview Timber from its evaluation of the effectiveness of internal control over financial reporting. For the period ended December 31, 2013, Longview Timber net sales and assets represented approximately 1% of net sales and 20% of total assets. Our audit of internal control over financial reporting of Weyerhaeuser Company also excluded an evaluation of the internal control over financial reporting of Longview Timber.
We also have audited, in accordance with the standards of the Public Company Accounting Oversight Board (United States), the consolidated balance sheets of Weyerhaeuser Company and subsidiaries as of December 31, 2013 and 2012, and the related consolidated statements of operations, comprehensive income, cash flows, and changes in equity for each of the years in the three-year period ended December 31, 2013, and our report dated February 18, 2014 expressed an unqualified opinion on those consolidated financial statements.
/s/ KPMG LLP
Seattle, Washington
February 18, 2014
WEYERHAEUSER COMPANY >
2013 ANNUAL REPORT AND FORM 10-K
103
DIRECTORS, EXECUTIVE OFFICERS AND CORPORATE GOVERNANCE
A list of our executive officers and biographical information are found in the
Our Business — Executive Officers of the Registrant
section of this report. Information with respect to directors of the company and other governance matters, as required by this item, are included in the
Notice of
2014
Annual Meeting of Shareholders and Proxy Statement
for the company’s Annual Meeting of Shareholders to be held
April 10, 2014
under the headings “Nominees for Election — Terms Expire in 2015,” “Board of Directors and Committee Information,” “Section 16(a) Beneficial Ownership Reporting Compliance” and “Potential Payment upon Termination or Change in Control — Change in Control,” and “ — Severance” is incorporated herein by reference.
EXECUTIVE AND DIRECTOR COMPENSATION
Information with respect to executive and director compensation contained in the
Notice of
2014
Annual Meeting of Shareholders
and
Proxy Statement
for the company’s Annual Meeting of Shareholders to be held
April 10, 2014
, under the headings “Board of Directors and Committee Information — Directors’ Compensation,” “Compensation Discussion and Analysis,” “Compensation Committee Report,” “Compensation Committee Interlocks and Insider Participation,” “Summary Compensation Table,” “Grants of Plan-Based Awards,” “Outstanding Equity Awards at Fiscal Year Year-End,” “Options Exercise in Fiscal
2013
,” “Pension Benefits,” “Nonqualified Deferred Compensation,” and “Potential Payments Upon Termination or Change of Control” is incorporated herein by reference.
SECURITY OWNERSHIP OF CERTAIN BENEFICIAL OWNERS AND MANAGEMENT AND RELATED STOCKHOLDER MATTERS
Information with respect to security ownership of certain beneficial owners and management contained in the
Notice of
2014
Annual Meeting of Shareholders and Proxy Statement
for the company’s Annual Meeting of Shareholders to be held
April 10, 2014
, under the heading “Beneficial Ownership of Common Shares” is incorporated herein by reference.
CERTAIN RELATIONSHIPS AND RELATED TRANSACTIONS
Information with regard to certain relationships and related transactions contained in the
Notice of
2014
Annual Meeting of Shareholders and Proxy Statement
for the company’s Annual Meeting of Shareholders to be held
April 10, 2014
, under the headings “Review, Approval or Ratification of Transactions with Related Persons” and “Board of Directors and Committee Information” is incorporated herein by reference.
PRINCIPAL ACCOUNTING FEES AND SERVICES
Information with respect to principal accounting fees and services in the
Notice of
2014
Annual Meeting of Shareholders and Proxy Statement
for the company’s Annual Meeting of Shareholders to be held
April 10, 2014
, under the heading “Ratification of Selection of Independent Registered Public Accounting Firm” is incorporated herein by reference.
WEYERHAEUSER COMPANY >
2013 ANNUAL REPORT AND FORM 10-K
104
EXHIBITS AND FINANCIAL STATEMENT SCHEDULES
All financial statement schedules have been omitted because they are not applicable or the required information is included in the consolidated financial statements, or the notes thereto, in
Financial Statements and Supplementary Data
above.
|
EXHIBITS
|
|
|
|||
|
2
|
—
|
Plan of Acquisition, Reorganization, Arrangement, Liquidation or Succession
|
|
|
(a)
|
Stock Purchase Agreement, dated as of June 14, 2013, by and among Longview Timber Holdings, Corp., the securityholders listed on the signature pages thereto, Weyerhaeuser Columbia Holding Co., LLC and Weyerhaeuser Company (incorporated by reference to Current Report on Form 8-K filed with the Securities and Exchange Commission June 17, 2013 — Commission File Number 1-4825)
|
||
|
(b)
|
Transaction Agreement, dated as of November 3, 2013, among Weyerhaeuser Company, Weyerhaeuser Real Estate Company, TRI Pointe Homes, Inc. and Topaz Acquisition, Inc. (incorporated by reference to Current Report on Form 8-K filed with the Securities and Exchange Commission November 4, 2013 — Commission File Number 1-4825)
|
||
|
3
|
—
|
Articles of Incorporation
|
|
|
(a)
|
Articles of Incorporation (incorporated by reference to Quarterly Report on Form 10-Q filed with the Securities and Exchange Commission May 6, 2011 — Commission File Number 1-4825 and Current Report on Form 8-K filed with the Securities and Exchange Commission June 20, 2013 — Commission File Number 1-4825)
|
||
|
(b)
|
Bylaws (incorporated by reference to Quarterly Report on Form 10-Q filed with the Securities and Exchange Commission May 6, 2011 — Commission File Number 1-4825)
|
||
|
4
|
—
|
Instruments Defining the Rights of Security Holders, Including Indentures
|
|
|
(a)
|
Indenture dated as of April 1, 1986 between Weyerhaeuser Company and The Bank of New York Mellon Trust Company, N.A. (as successor to JPMorgan Chase Bank, formerly known as The Chase Manhattan Bank and Chemical Bank), a national banking association, as Trustee (incorporated by reference from the Registration Statement on Form S‑3, Registration No. 333-36753).
|
||
|
(b)
|
First Supplemental Indenture dated as of February 15, 1991 between Weyerhaeuser Company and The Bank of New York Mellon Trust Company, N.A. (as successor to JPMorgan Chase Bank, formerly known as The Chase Manhattan Bank and Chemical Bank), a national banking association, as Trustee (incorporated by reference from the Registration Statement on Form S‑3, Registration No. 33-52982).
|
||
|
(c)
|
Second Supplemental Indenture dated as of February 1, 1993 between Weyerhaeuser Company and The Bank of New York Mellon Trust Company, N.A. (as successor to JPMorgan Chase Bank, formerly known as The Chase Manhattan Bank and Chemical Bank), a national banking association, as Trustee (incorporated by reference from the Registration Statement on Form S‑3, Registration No. 33-59974).
|
||
|
(d)
|
Third Supplemental Indenture dated as of October 22, 2001 between Weyerhaeuser Company and The Bank of New York Mellon Trust Company, N.A. (as successor to JPMorgan Chase Bank, formerly known as The Chase Manhattan Bank and Chemical Bank), a national banking association, as Trustee (incorporated by reference from the Registration Statement on Form S-3, Registration No. 333-72356).
|
||
|
(e)
|
Fourth Supplemental Indenture dated as of March 12, 2002 between Weyerhaeuser Company and The Bank of New York Mellon Trust Company, N.A. (as successor to JPMorgan Chase Bank, formerly known as The Chase Manhattan Bank and Chemical Bank), a national banking association, as Trustee (incorporated by reference from the Registration Statement on Form S-4, Registration No. 333-82376).
|
||
|
10
|
—
|
Material Contracts
|
|
|
|
|
(a)
|
Form of Executive Change of Control Agreement (incorporated by reference to Form 8-K filed with the Securities and Exchange Commission January 24, 2014 — Commission File Number 1-4825) *
|
|
(b)
|
Form of Executive Severance Agreement (incorporated by reference to Form 8-K filed with the Securities and Exchange Commission January 24, 2014 — Commission File Number 1-4825) *
|
||
|
(c)
|
Weyerhaeuser Company 2013 Long-Term Incentive Plan (incorporated by reference to Form 8-K filed with the Securities and Exchange Commission February 19, 2013 — Commission File Number 1-4825) *
|
||
|
(d)
|
Form of Weyerhaeuser Company 2013 Long-Term Incentive Plan Stock Option Award Terms and Conditions (incorporated by reference to Current Report on Form 8-K filed with the Securities and Exchange Commission April 16, 2013 — Commission File Number 1-4825) *
|
||
|
(e)
|
Form of Weyerhaeuser Company 2013 Long-Term Incentive Plan Performance Share Award Terms and Conditions (incorporated by reference to Current Report on Form 8-K filed with the Securities and Exchange Commission April 16, 2013 — Commission File Number 1-4825) *
|
||
|
(f)
|
Form of Weyerhaeuser Company 2013 Long Term Incentive Plan Restricted Stock Unit Award Terms and Conditions (incorporated by reference to Current Report on Form 8-K filed with the Securities and Exchange Commission April 16, 2013 — Commission File Number 1-4825) *
|
||
|
(g)
|
Form of Weyerhaeuser Company 2004 Long-Term Incentive Plan Stock Option Award 2013 Terms and Conditions (incorporated by reference to Form 8-K filed with the Securities and Exchange Commission February 11, 2013 — Commission File Number 1-4825) *
|
||
|
(h)
|
Form of Weyerhaeuser Company 2004 Long-Term Incentive Plan Performance Share Award 2013 Terms and Conditions (incorporated by reference to Form 8-K filed with the Securities and Exchange Commission February 11, 2013 — Commission File Number 1-4825) *
|
||
WEYERHAEUSER COMPANY >
2013 ANNUAL REPORT AND FORM 10-K
105
|
(i)
|
Form of Weyerhaeuser Company 2004 Long-Term Incentive Plan Restricted Stock Award 2013 Terms and Conditions (incorporated by reference to Form 8-K filed with the Securities and Exchange Commission February 11, 2013 — Commission File Number 1-4825) *
|
||
|
(j)
|
Weyerhaeuser Company Annual Incentive Plan for Salaried Employees (Amended and Restated Effective January 1, 2013) (incorporated by reference to Current Report on Form 8-K filed with the Securities and Exchange Commission April 16, 2013 — Commission File Number 1-4825) *
|
||
|
(k)
|
Weyerhaeuser Company Deferred Compensation Plan (incorporated by reference to Form 8-K filed with the Securities and Exchange Commission December 29, 2010 — Commission File Number 1-4825) *
|
||
|
(l)
|
Weyerhaeuser Company Salaried Employees Supplemental Retirement Plan (incorporated by reference to 2004 Form 10-K filed with the Securities and Exchange Commission January 27, 2009 — Commission File Number 1-4825) *
|
||
|
(m)
|
2011 Fee Deferral Plan for Directors of Weyerhaeuser Company (Amended and Restated Effective January 1, 2012) (incorporated by reference to Current Report on Form 8-K filed with the Securities and Exchange Commission January 4, 2012 — Commission File Number 1-4825) *
|
||
|
(n)
|
Weyerhaeuser Real Estate Company Management Short-Term Incentive Plan (incorporated by reference to Form 8-K filed with the Securities and Exchange Commission February 9, 2010 — Commission File Number 1-4825) *
|
||
|
(o)
|
Weyerhaeuser Real Estate Company Management Long-Term Incentive Plan (incorporated by reference to Form 8-K filed with the Securities and Exchange Commission February 9, 2010 — Commission File Number 1-4825) *
|
||
|
(p)
|
Revolving Credit Facility Agreement among Weyerhaeuser Company, Weyerhaeuser Real Estate Company, JP Morgan Chase Bank, N.A. as administrative agent, Citibank, N.A., as syndication agent, CoBank, ACB, PNC Bank, National Association, The Bank of Tokyo-Mitsubishi UFJ, Ltd, and Wells Fargo Bank, N.A., as documentation agents, and the lenders, swing-line banks and initial fronting banks named therein (incorporated by reference to Current Report on Form 8-K filed with the Securities and Exchange Commission September 12, 2013 — Commission File Number 1-4825).
|
||
|
(q)
|
Credit Agreement among Weyerhaeuser Company, CoBank, ACB as administrative agent, and the lenders party thereto (incorporated by reference to Current Report on Form 8-K filed with the Securities and Exchange Commission September 16, 2013 — Commission File Number 1-4825)
|
||
|
(r)
|
Retention Agreement with Peter M. Orser (incorporated by reference to Current Report on Form 8-K filed with the Securities and Exchange Commission August 23, 2013 — Commission File Number 1-4825) *
|
||
|
(s)
|
Executive Change in Control Agreement (Tier I) with Doyle R. Simons (incorporated by reference to Current Report on Form 8-K filed with the Securities and Exchange Commission September 16, 2013 — Commission File Number 1-4825) *
|
||
|
(t)
|
Executive Severance Agreement (Tier I) with Doyle R. Simons (incorporated by reference to Current Report on Form 8-K filed with the Securities and Exchange Commission September 16, 2013 — Commission File Number 1-4825) *
|
||
|
(u)
|
Form of Tax Sharing Agreement to be entered into by and among Weyerhaeuser Company, Weyerhaeuser Real Estate Company and TRI Pointe Homes, Inc. (incorporated by reference to Current Report on Form 8-K filed with the Securities and Exchange Commission November 4, 2013 — Commission File Number 1-4825)
|
||
|
12
|
—
|
Statements regarding computation of ratios
|
|
|
14
|
—
|
Code of Business Conduct and Ethics (incorporated by reference to Form 8-K filed with the Securities and Exchange Commission April 20, 2010 — Commission File Number 1-4825)
|
|
|
21
|
—
|
Subsidiaries of the Registrant
|
|
|
23
|
—
|
Consent of Independent Registered Public Accounting Firm
|
|
|
31
|
—
|
Certification pursuant to Rule 13a-14(a) under the Securities Exchange Act of 1934, as amended
|
|
|
32
|
—
|
Certification pursuant to Rule 13a-14(b) under the Securities Exchange Act of 1934, as amended, and Section 1350 of Chapter 63 of Title 18 of the United States Code (18 U.S.C. 1350)
|
|
|
101.INS
|
—
|
XBRL Instance Document
|
|
|
101.SCH
|
—
|
XBRL Taxonomy Extension Schema Document
|
|
|
101.CAL
|
—
|
XBRL Taxonomy Extension Calculation Linkbase Document
|
|
|
101.DEF
|
—
|
XBRL Taxonomy Extension Definition Linkbase Document
|
|
|
101.LAB
|
—
|
XBRL Taxonomy Extension Label Linkbase Document
|
|
|
101.PRE
|
—
|
XBRL Taxonomy Extension Presentation Linkbase Document
|
|
* Denotes a management contract or compensatory plan or arrangement.
WEYERHAEUSER COMPANY >
2013 ANNUAL REPORT AND FORM 10-K
106
|
SIGNATURES
|
||||
Pursuant to the requirements of Section 13 or 15(d) of the Securities Exchange Act of 1934, the registrant has duly caused this report to be signed on its behalf by the undersigned, thereunto duly authorized
February 18, 2014
.
|
WEYERHAEUSER COMPANY
|
|
/s/ DOYLE R. SIMONS
|
|
Doyle R. Simons
|
|
President and Chief Executive Officer
|
Pursuant to the requirements of the Securities Exchange Act of 1934, this report has been signed below by the following persons on behalf of the registrant in the capacities indicated
February 18, 2014
.
|
/s/ DOYLE R. SIMONS
|
|
/s/ WAYNE W. MURDY
|
|
Doyle R. Simons
Principal Executive Officer
and Director
|
|
Wayne W. Murdy
Director
|
|
/s/ PATRICIA M. BEDIENT
|
/s/ NICOLE W. PIASECKI
|
|
|
Patricia M. Bedient
Principal Financial Officer
|
|
Nicole W. Piasecki
Director
|
|
/s/ JEANNE M. HILLMAN
|
||
|
Jeanne M. Hillman
Principal Accounting Officer
|
|
Richard H. Sinkfield
Director
|
|
/s/ DEBRA A. CAFARO
|
/s/ D. MICHAEL STEUERT
|
|
|
Debra A. Cafaro
Director
|
|
D. Michael Steuert
Director
|
|
/s/ MARK A. EMMERT
|
/s/ KIM WILLIAMS
|
|
|
Mark A. Emmert
Director
|
|
Kim Williams
Director
|
|
/s/ JOHN I. KIECKHEFER
|
/s/ CHARLES R. WILLIAMSON
|
|
|
John I. Kieckhefer
Director
|
|
Charles R. Williamson
Chairman of the Board and Director
|
WEYERHAEUSER COMPANY >
2013 ANNUAL REPORT AND FORM 10-K
107
TABLE OF CONTENTS
Note 1: Summary Of Significant Accounting PoliciesNote 2: Business SegmentsNote 3: Longview Timber PurchaseNote 4: Real Estate DivestitureNote 5: Discontinued OperationsNote 6: Net Earnings Per ShareNote 7: InventoriesNote 8: Property and EquipmentNote 9: Equity AffiliatesNote 10: Pension and Other Postretirement Benefit PlansNote 18: Shareholder's InterestNote 11: Variable Interest EntitiesNote 12: Real Estate in Process Of Development and For SaleNote 13: Accrued LiabilitiesNote 14: Lines Of CreditNote 15: Long-term DebtNote 16: Fair Value Of Financial InstrumentsNote 17: Legal Proceedings, Commitments and ContingenciesNote 18: Shareholders InterestNote 19: Share-based CompensationNote 20: Charges For Restructuring, Closures and Asset ImpairmentsNote 21: Other Operating Income, NetNote 22: Income TaxesNote 23: Geographic AreasNote 24: Selected Quarterly Financial Information (unaudited)