WEYERHAEUSER CO
10-Ks and 10-Qs
|
|
|
|
|
|
|
|
|
|
|
|
|
|
|
|
|
|
|
|
|
|
|
|
|
|
|
|
|
|
|
|
|
|
|
|
|
|
|
|
|
|
|
|
|
|
|
|
|
|
|
|
|
|
|
|
UNITED STATES
SECURITIES AND EXCHANGE COMMISSION
WASHINGTON, D.C. 20549
FORM 10-K
[X] ANNUAL REPORT PURSUANT TO SECTION 13 OR 15(D) OF THE SECURITIES EXCHANGE ACT OF 1934
FOR THE FISCAL YEAR ENDED
DECEMBER 31, 2016
or
[ ] TRANSITION REPORT PURSUANT TO SECTION 13 OR 15(D) OF THE SECURITIES EXCHANGE ACT OF 1934
FOR THE TRANSITION PERIOD FROM
TO
COMMISSION FILE NUMBER 1-4825
WEYERHAEUSER COMPANY
A WASHINGTON CORPORATION
91-0470860
(IRS EMPLOYER IDENTIFICATION NO.)
220 OCCIDENTAL AVENUE SOUTH, SEATTLE, WASHINGTON 98104-7800 TELEPHONE (206) 539-3000
SECURITIES REGISTERED PURSUANT TO SECTION 12(b) OF THE ACT:
|
TITLE OF EACH CLASS
|
|
NAME OF EACH EXCHANGE ON WHICH REGISTERED:
|
|
Common Shares ($1.25 par value)
|
|
Chicago Stock Exchange
|
|
|
New York Stock Exchange
|
|
|
Securities registered pursuant to Section 12(g) of the Act: None
|
||
Indicate by check mark if the registrant is a well-known seasoned issuer, as defined in Rule 405 of the Securities Act. [X] Yes [ ] No
Indicate by check mark if the registrant is not required to file reports pursuant to Section 13 or Section 15(d) of the Act. [ ] Yes [X] No
Indicate by check mark whether the registrant (1) has filed all reports required to be filed by Section 13 or 15(d) of the Securities Exchange Act of 1934 during the preceding 12 months (or for such shorter period that the registrant was required to file such reports), and (2) has been subject to such filing requirements for the past 90 days. [X] Yes [ ] No
Indicate by check mark whether the registrant has submitted electronically and posted on its corporate Website, if any, every Interactive Data File required to be submitted and posted pursuant to Rule 405 of Regulation S-T (§ 232.405 of this chapter) during the preceding 12 months (or for such shorter period that the registrant was required to submit and post such files). [X] Yes [ ] No
Indicate by check mark if disclosure of delinquent filers pursuant to Item 405 of Regulation S-K (§ 229.405 of this chapter) is not contained herein, and will not be contained, to the best of registrant’s knowledge, in definitive proxy or information statements incorporated by reference in Part III of this Form 10-K or any amendment to this Form 10-K. [X]
Indicate by check mark whether the registrant is a large accelerated filer, an accelerated filer, a non-accelerated filer, or a smaller reporting company. See the definitions of “large accelerated filer,” “accelerated filer” and “smaller reporting company” in Rule 12b-2 of the Exchange Act.
Large accelerated filer [X] Accelerated filer [ ] Non-accelerated filer [ ] Smaller reporting company [ ]
Indicate by check mark whether the registrant is a shell company (as defined in Rule 12b-2 of the Act). [ ] Yes [X] No
As of
June 30, 2016
, the aggregate market value of the registrant’s common stock held by non-affiliates of the registrant was
$21.6 billion
based on the closing sale price as reported on the New York Stock Exchange Composite Price Transactions.
As of
January 27, 2017
,
748,998,273
shares of the registrant’s common stock ($1.25 par value) were outstanding.
DOCUMENTS INCORPORATED BY REFERENCE
Portions of the
Notice of
2017
Annual Meeting of Shareholders and Proxy Statement
for the company’s Annual Meeting of Shareholders to be held
May 19, 2017
, are incorporated by reference into Part II and III.
WEYERHAEUSER COMPANY >
2015 ANNUAL REPORT AND FORM 10-K
TABLE OF CONTENTS
|
PART I
|
PAGE
|
|
|
ITEM 1.
|
||
|
ITEM 1A.
|
||
|
•
PEOPLE
|
||
|
ITEM 1B.
|
||
|
ITEM 2.
|
||
|
ITEM 3.
|
||
|
ITEM 4.
|
MINE SAFETY DISCLOSURES — NOT APPLICABLE
|
|
|
PART II
|
PAGE
|
|
|
ITEM 5.
|
||
|
ITEM 6.
|
||
|
ITEM 7.
|
||
|
ITEM 7A.
|
||
|
ITEM 8.
|
||
|
ITEM 9.
|
||
|
ITEM 9A.
|
||
|
ITEM 9B.
|
OTHER INFORMATION — NOT APPLICABLE
|
|
|
PART III
|
||
|
ITEM 10.
|
||
|
ITEM 11.
|
||
|
ITEM 12.
|
||
|
ITEM 13.
|
||
|
ITEM 14.
|
||
|
PART IV
|
||
|
ITEM 15.
|
||
OUR BUSINESS
We are one of the world's largest private owners of timberlands. We own or control
13.1 million
acres of timberlands, primarily in the U.S., and manage additional timberlands under long-term licenses in Canada. We manage these timberlands on a sustainable basis in compliance with internationally recognized forestry standards. Our objective is to maximize the long-term value of timberlands we own. We analyze each timberland acre comprehensively to understand its highest-value use. We realize this value in many different ways, including harvesting the trees and selling the timberland. In addition, we focus on opportunities to realize value for oil and natural gas production, construction aggregates and mineral extraction, wind power and communication and transportation rights of way that exist in our ownership. We are also one of the largest manufacturers of wood products in North America. Our company is a real estate investment trust (REIT).
We are committed to operate as a sustainable company and are listed on the Dow Jones World Sustainability Index. In our operations, we focus on increasing energy and resource efficiency, reducing greenhouse gas emissions, reducing water consumption, conserving natural resources, and offering products that meet our customers' needs with superior sustainability attributes. We operate with world class safety results, understand and address the needs of the communities in which we operate, and present ourselves transparently.
In
2016
, we generated
$6.4 billion
in net sales from continuing operations and employed approximately
10,400
people who serve customers worldwide.
This portion of our Annual Report on Form 10-K provides detailed information about who we are, what we do and where we are headed. Unless otherwise specified, current information reported in this Form 10-K is as of or for the fiscal year ended
December 31, 2016
.
We break out financial information such as revenues, earnings and assets by the business segments that form our company. We also discuss the development of our company and the geographic areas where we do business.
Throughout this Form 10-K, unless specified otherwise, references to “we,” “our,” “us” and “the company” refer to the consolidated company.
|
WE CAN TELL YOU MORE
|
AVAILABLE INFORMATION
We meet the information-reporting requirements of the Securities Exchange Act of 1934 by filing periodic reports, proxy statements and other information with the Securities and Exchange Commission (SEC). These reports and statements — information about our company’s business, financial results and other matters — are available at:
|
•
|
the SEC website — www.sec.gov;
|
|
•
|
the SEC’s Public Conference Room, 100 F St. N.E., Washington, D.C., 20549, (800) SEC-0330; and
|
|
•
|
our website — www.weyerhaeuser.com.
|
When we file the information electronically with the SEC, it also is posted to our website.
|
WHO WE ARE
|
We started out as Weyerhaeuser Timber Company, incorporated in the state of Washington in January 1900, when Frederick Weyerhaeuser and 15 partners bought 900,000 acres of timberland. Today, we are working to be the world's premier timber, land, and forest products company for our shareholders, customers and employees.
REAL ESTATE INVESTMENT TRUST (REIT) ELECTION
Starting with our 2010 fiscal year, we elected to be taxed as a REIT. REIT income can be distributed to shareholders without first paying corporate level tax, substantially eliminating the double taxation on income. We expect to derive most of our REIT income from investments in timberlands, including the sale of standing timber through pay-as-cut sales contracts and lump sum timber deeds. We continue to be required to pay federal corporate income taxes on earnings of our Taxable REIT Subsidiary (TRS), which includes our Wood Products segment and a portion of our Timberlands and Real Estate, Energy and Natural Resources (Real Estate & ENR) segments.
MERGER WITH PLUM CREEK
On February 19, 2016, pursuant to the Agreement and Plan of Merger dated November 6, 2015, Plum Creek Timber Company, Inc. (Plum Creek) merged with and into Weyerhaeuser. Plum Creek was a REIT that primarily owned and managed timberlands in the United States. Plum Creek also produced wood products, developed opportunities for mineral and other natural resource extraction, and sold real estate properties. The merger combined two industry leaders. The breadth and diversity of our combined timberlands, real estate, energy and natural resources assets, and wood products operations position Weyerhaeuser to capitalize on the improving housing market and to continue to capture value across the combined portfolio. Under the terms of the Agreement and Plan of Merger, each issued and outstanding share of Plum Creek common stock was exchanged for 1.60 Weyerhaeuser common shares. See
Note 4: Merger with Plum Creek
in the
Notes to Consolidated Financial Statements
for further information about the merger.
OUR BUSINESS SEGMENTS
During fiscal year 2016, the company's chief operating decision maker changed the information regularly reviewed for making decisions to allocate resources and assess performance. As a result, the company will report its financial performance based on three business segments:
|
•
|
Timberlands;
|
|
•
|
Real Estate, Energy and Natural Resources (Real Estate & ENR); and
|
|
•
|
Wood Products.
|
Prior to revising our segment structure, activities related to the Real Estate & ENR business segment were reported as part of the Timberlands business segment. Amounts for all periods presented have been reclassified throughout the consolidated financial statements and disclosures to conform to the new segment structure.
WEYERHAEUSER COMPANY >
2016 ANNUAL REPORT AND FORM 10-K
1
In the
Consolidated Results
section of
Management’s Discussion and Analysis of Financial Condition and Results of Operations
, you will find our overall performance results for our business segments.
Detailed financial information about our business segments and our geographic locations is provided in
Note 2: Business Segments
and
Note 20: Geographic Areas
in the
Notes to Consolidated Financial Statements
,
as well as in this section and in
Management’s Discussion and Analysis of Financial Condition and Results of Operations
.
We have made certain reclassifications in our consolidated financial statements to reflect discontinued operations related to our former Cellulose Fibers businesses disposed of during 2016, and Weyerhaeuser Real Estate Company (WRECO) disposed of during 2014. Cellulose Fibers was previously disclosed as a separate reportable business segment and WRECO and its subsidiaries were previously reported as the Real Estate segment. Refer to
Note 3: Discontinued Operations
in the
Notes to Consolidated Financial Statements
for further information.
EFFECT OF MARKET CONDITIONS
The health of the U.S. housing market strongly affects our Wood Products and Timberlands segments. Wood Products primarily sells into the new residential building and repair and remodel markets. Demand for logs from our Timberlands segment is affected by the production of wood-based building products as well as export demand. Real Estate is affected by local real estate market conditions, such as the level of supply of, or demand for, properties sharing the same or similar characteristics as our timberlands. Energy and Natural Resources are affected by the changes in commodity prices, including oil and gas.
COMPETITION IN OUR MARKETS
We operate in highly competitive domestic and foreign markets, with numerous companies selling similar products. Many of our products also face competition from substitutes for wood products. We compete in our markets primarily through product quality, service levels and price. We are relentlessly focused on improving operational excellence to ensure a competitive cost structure and producing quality products customers want and are willing to pay for.
Our business segments’ competitive strategies are as follows:
|
•
|
Timberlands — Extract maximum timber value from each acre we own or manage.
|
|
•
|
Real Estate & ENR — Deliver premiums to timber value by identifying and monetizing higher and better use lands and capturing the full value of surface and subsurface assets.
|
|
•
|
Wood Products — Deliver high-quality lumber, structural panels, engineered wood products and complementary building products for residential, multi-family, industrial and light commercial applications at competitive costs.
|
SALES OUTSIDE THE U.S.
In
2016
,
$915 million
—
14 percent
— of our total consolidated sales from continuing operations were to customers outside the U.S. Our sales outside the U.S. are generally denominated in U.S. dollars. The table below shows sales outside the U.S. for the last three years.
|
DOLLAR AMOUNTS IN MILLIONS
|
|||||||||
|
|
2016
|
|
2015
|
|
2014
|
|
|||
|
Exports from the U.S.
|
$
|
515
|
|
$
|
497
|
|
$
|
640
|
|
|
Canadian export and domestic sales
|
342
|
|
317
|
|
392
|
|
|||
|
Other foreign sales
|
58
|
|
69
|
|
80
|
|
|||
|
Total
|
$
|
915
|
|
$
|
883
|
|
$
|
1,112
|
|
|
Percent of total sales
|
14
|
%
|
17
|
%
|
20
|
%
|
|||
|
Excludes sales from Discontinued Operations. Refer to
Note 3: Discontinued Operations
in the
Notes to Consolidated Financial Statements
for further information.
|
|||||||||
OUR EMPLOYEES
We have approximately
10,400
employees. This number includes:
|
•
|
9,700
employed in North America and
|
|
•
|
700
employed by our operations outside of North America.
|
Of these employees, approximately
2,900
are members of unions covered by multi-year collective-bargaining agreements. More information about these agreements is provided in
Note 9: Pension and Other Postretirement Benefit Plans
in the
Notes to Consolidated Financial Statements
.
WEYERHAEUSER COMPANY >
2016 ANNUAL REPORT AND FORM 10-K
2
|
WHAT WE DO
|
This section provides information about how we:
|
•
|
grow and harvest trees;
|
|
•
|
maximize the value of every acre we own; and
|
|
•
|
manufacture and sell products made from them.
|
For each of our business segments, we provide details about what we do, where we do it, how much we sell and where we are headed.
TIMBERLANDS
Our Timberlands segment manages
13.1 million
acres of private commercial timberlands worldwide. We own
12.0 million
of those acres and have long-term leases on the other
1.1 million
acres. In addition, we have renewable, long-term licenses on
13.9 million
acres of Canadian timberlands. The tables presented in this section include data from this segment's business units as of the end of
2016
.
WHAT WE DO
Forestry Management
Our Timberlands segment:
|
•
|
plants seedlings to reforest harvested areas using the most effective regeneration method for the site and species (natural regeneration is employed and managed in parts of Canada and the northern U.S.);
|
|
•
|
monitors and cares for the planted trees as they grow to maturity;
|
|
•
|
harvests trees to be converted into lumber, wood products, pulp and paper;
|
|
•
|
strives to sustain and maximize the timber supply from our timberlands while keeping the health of our environment a key priority; and
|
|
•
|
offers recreational access to the public.
|
Our goal is to maximize returns by selling logs and stumpage to internal and external customers. We focus on solid wood and use intensive silviculture to improve forest productivity and returns while managing our forests on a sustainable basis to meet customer needs and public expectations.
Sustainable Forestry Practices
We are committed to responsible environmental stewardship wherever we operate, managing forests to produce financially mature timber while protecting the ecosystem services they provide. Our working forests include places with unique environmental, cultural, historical or recreational value. To protect their unique qualities, we follow regulatory requirements, voluntary standards and implement the Sustainable Forestry Initiative
®
(SFI) standard. Independent auditing of all of the forests we own or manage in the United States and Canada certifies that we meet the SFI standard. Our timberlands in Uruguay are certified under the Forest Stewardship Council (FSC) standard or the Uruguayan national forestry management standard which is endorsed by the Program for the Endorsement of Forest Certification (PEFC).
Canadian Forestry Operations
In Canada, we manage timberlands under long-term licenses that provide raw material for our manufacturing facilities in various provinces. When we harvest trees, we pay the provinces at stumpage rates set by the government, which generally are based on prevailing market prices. We transfer logs to our manufacturing facilities at cost, and do not generate any profit in the Timberlands segment from the harvest of timber from the licensed acres in Canada.
Timberlands Products
|
PRODUCTS
|
HOW THEY’RE USED
|
|
Grade logs
|
Grade logs are made into a diverse range of products including lumber, plywood, and veneer.
|
|
Fiber logs
|
Fiber logs are sold to pulp, paper, and oriented strand board mills.
|
|
Timber
|
Standing timber is sold to third parties.
|
|
Recreational leases
|
Timberlands are leased to the public for recreational purposes.
|
|
Other products
|
Seed and seedlings grown in the U.S. and plywood produced at our mill in Uruguay.
|
HOW WE MEASURE OUR PRODUCT
We previously reported Timberlands volumes information in cubic meters. Prior period volumes have been converted from cubic meters to tons using conversion factors as follows:
|
•
|
West: 1.056 m
3
= 1 ton
|
|
•
|
South: 0.818 m
3
= 1 ton
|
|
•
|
Uruguay: 0.907 m
3
= 1 ton
|
|
•
|
Canada: 1.244 m
3
= 1 ton
|
We also use multiple units of measure when transacting business including:
|
•
|
Thousand board feet (MBF) — used in the West to measure the expected lumber recovery from a tree or log. This measure does not include taper or recovery of non-lumber residual products.
|
|
•
|
Hundred cubic feet (CCF) — used in the West to measure the volume of a log. The measure does not include any calculation for expected lumber recovery.
|
|
•
|
Green tons (GT) — used in the South to measure weight; factors used for conversion to product volume can vary by species, size, location and season.
|
WEYERHAEUSER COMPANY >
2016 ANNUAL REPORT AND FORM 10-K
3
WHERE WE DO IT
Our timberlands assets are located primarily in North America. In the U.S. we own and manage sustainable timberlands in twenty states for use in wood products manufacturing. We own or lease:
|
•
|
2.9 million
acres in the western U.S. (Oregon and Washington);
|
|
•
|
7.4 million
acres in the southern U.S. (Alabama, Arkansas, Florida, Georgia, Louisiana, Mississippi, North Carolina, Oklahoma, South Carolina, Texas and Virginia); and
|
|
•
|
2.5 million
acres in the northern U.S. (Maine, Michigan, Montana, New Hampshire, Vermont, West Virginia and Wisconsin).
|
Included in the acreage above is the approximately 6.3 million acres of timberlands added through our merger with Plum Creek, which produced over 18 million tons of harvest volume in 2015. The merger resulted in the addition of the following acres:
|
•
|
0.4 million acres in the western U.S.,
|
|
•
|
3.4 million acres in the southern U.S. and
|
|
•
|
2.5 million
acres in the northern U.S.
|
In Uruguay, we own
299,000
acres and have long-term leases on
10,000
acres. In Canada, we manage timberlands under long-term licenses that provide raw material for our manufacturing facilities. These licenses are in Alberta, British Columbia, Ontario (license is managed by partnership) and Saskatchewan.
Our total timber inventory — including timber on owned and leased land— is approximately
645 million
tons. The amount of timber inventory does not translate into an amount of lumber or panel products because the quantity of end products varies according to the species, size and quality of the timber; and will change through time as the mix of these variables adjust.
The species, size and grade of the trees affects the relative value of our timberlands.
We maintain our timber inventory in an integrated resource inventory and geographic information system (“GIS”). The resource inventory component of the system is proprietary and is largely based on internally developed technologies, including growth and yield models developed by our research and development organization. The GIS component is based on GIS software that is viewed as the standard in our industry.
Timber inventory data collection and verification techniques include the use of industry standard field sampling procedures as well as proprietary remote sensing technologies in some geographies where they generate improved estimates. The data is collected and maintained at the timber stand level.
We also own and operate nurseries and seed orchards in Arkansas, Georgia, Louisiana, Mississippi, Oregon, South Carolina, and Washington
.
Summary of
2016
Standing Timber Inventory
|
GEOGRAPHIC AREA
|
MILLIONS OF TONS AT
DECEMBER 31, 2016 |
|
|
|
TOTAL
INVENTORY
(1)
|
|
|
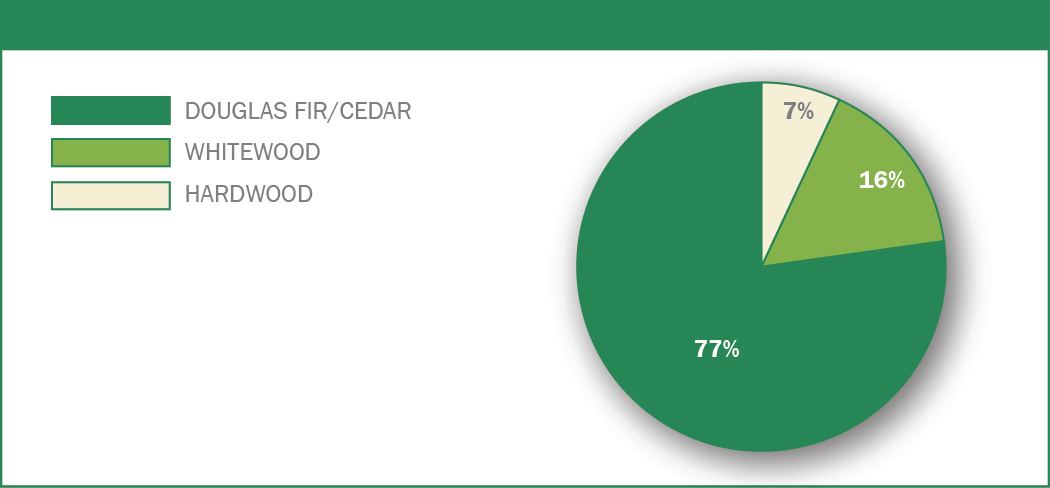
U.S.:
|
||
|
West
|
||
|
Douglas fir
|
159
|
|
|
Cedar
|
3
|
|
|
Whitewood
|
33
|
|
|
Hardwood
|
15
|
|
|
Total West
|
210
|
|
|
South
(2)
|
||
|
Southern yellow pine
|
278
|
|
|
Hardwood
|
71
|
|
|
Total South
|
349
|
|
|
North
|
||
|
Conifer
|
33
|
|
|
Hardwood
|
39
|
|
|
Total North
|
72
|
|
|
Total U.S.
|
631
|
|
|
Uruguay:
|
||
|
Loblolly pine
|
9
|
|
|
Eucalyptus
|
5
|
|
|
Total Uruguay
|
14
|
|
|
Total Company
|
645
|
|
|
(1) Inventory encompasses all conservation and non-harvest areas.
(2) Southern inventory includes our managed Twin Creeks operations.
|
||
WEYERHAEUSER COMPANY >
2016 ANNUAL REPORT AND FORM 10-K
4
Summary of
2016
Timberland Locations
|
GEOGRAPHIC AREA
|
THOUSANDS OF ACRES AT
DECEMBER 31, 2016 |
|||||
|
|
FEE OWNERSHIP
|
|
LONG-TERM LEASES
|
|
TOTAL
ACRES
(1)
|
|
|
U.S.:
|
||||||
|
West
|
||||||
|
Oregon
|
1,604
|
|
—
|
|
1,604
|
|
|
Washington
|
1,345
|
|
—
|
|
1,345
|
|
|
Total West
|
2,949
|
|
—
|
|
2,949
|
|
|
South
|
||||||
|
Alabama
|
394
|
|
279
|
|
673
|
|
|
Arkansas
|
1,216
|
|
64
|
|
1,280
|
|
|
Florida
|
228
|
|
85
|
|
313
|
|
|
Georgia
|
652
|
|
115
|
|
767
|
|
|
Louisiana
|
1,041
|
|
352
|
|
1,393
|
|
|
Mississippi
|
1,241
|
|
146
|
|
1,387
|
|
|
North Carolina
|
568
|
|
2
|
|
570
|
|
|
Oklahoma
|
497
|
|
—
|
|
497
|
|
|
South Carolina
|
285
|
|
46
|
|
331
|
|
|
Texas
|
30
|
|
2
|
|
32
|
|
|
Virginia
|
125
|
|
—
|
|
125
|
|
|
Total South
|
6,277
|
|
1,091
|
|
7,368
|
|
|
North
|
||||||
|
Maine
|
840
|
|
—
|
|
840
|
|
|
Michigan
|
563
|
|
—
|
|
563
|
|
|
Montana
|
738
|
|
—
|
|
738
|
|
|
New Hampshire
|
24
|
|
—
|
|
24
|
|
|
Vermont
|
86
|
|
—
|
|
86
|
|
|
West Virginia
|
258
|
|
—
|
|
258
|
|
|
Wisconsin
|
4
|
|
—
|
|
4
|
|
|
Total North
|
2,513
|
|
—
|
|
2,513
|
|
|
Total U.S.
|
11,739
|
|
1,091
|
|
12,830
|
|
|
Total Uruguay
|
299
|
|
10
|
|
309
|
|
|
Total Company
|
12,038
|
|
1,101
|
|
13,139
|
|
|
(1) Acres include all conservation and non-harvest areas.
|
||||||
We provide a constant year round flow of logs to internal and third-party customers. We sell grade logs to mills that manufacture a diverse range of products including lumber, plywood and veneer. We also sell standing timber to third parties. Our timberlands are well located to take advantage of road, logging and transportation systems for efficient delivery of logs to these customers.
Western United States
Our Western acres are well situated to serve the wood product markets in Oregon and Washington. Additionally, our location on the West Coast provides access to higher-value export markets for Douglas fir and whitewood logs to Japan, China and Korea. The size and quality of our Western Timberlands, coupled with their proximity to several deep-water port facilities, positions us to meet the needs of Pacific Rim log markets.
Our holdings are composed primarily of Douglas fir, a species highly valued for its structural strength. Our coastal holdings also contain whitewood and have a higher proportion of hemlock and other whitewoods than our western interior holdings. Our management systems provide us a competitive operating advantage in the areas of research and forestry, to technical planning models, mechanized harvesting, and marketing and logistics.
WEYERHAEUSER COMPANY >
2016 ANNUAL REPORT AND FORM 10-K
5
2016
Western U.S. Inventory by Species
2016
Western U.S. Inventory by Age / Species
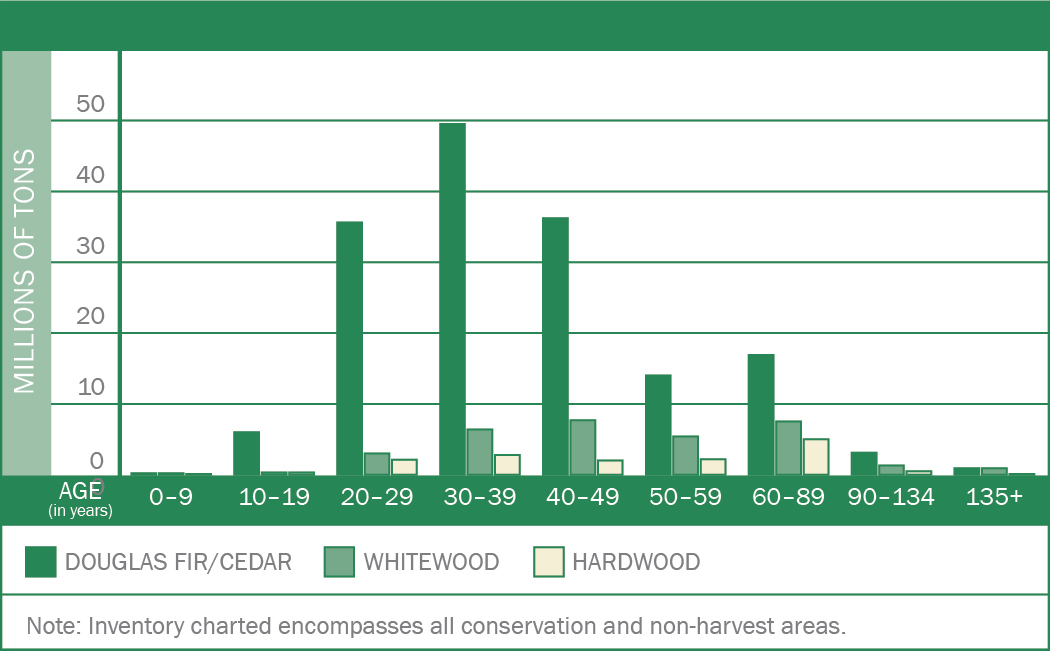
The average age of timber harvested from our Western timberlands in
2016
was 52 years. Most of our Western timberlands are intensively managed for timber production, but some areas are conserved for environmental and/or recreational reasons. Some of our older trees are protected in acreage set aside for conservation, and some are not yet logged due to harvest rate regulations. While over the long term our average harvest age will decrease in accordance with our sustainable forestry practices, we harvest approximately 2 percent of our Western acreage each year.
Southern United States
Our Southern forests predominantly contain southern yellow pine and include timberlands in 11 states.
We intensively manage our timber plantations using forestry research and planning systems to optimize grade log production. We do this while providing quality habitat for a range of animals and birds. We lease more than 92 percent of our Southern acreage for recreational purposes.
2016
Southern U.S. Inventory by Species

WEYERHAEUSER COMPANY >
2016 ANNUAL REPORT AND FORM 10-K
6
2016
Southern U.S. Inventory by Age / Species
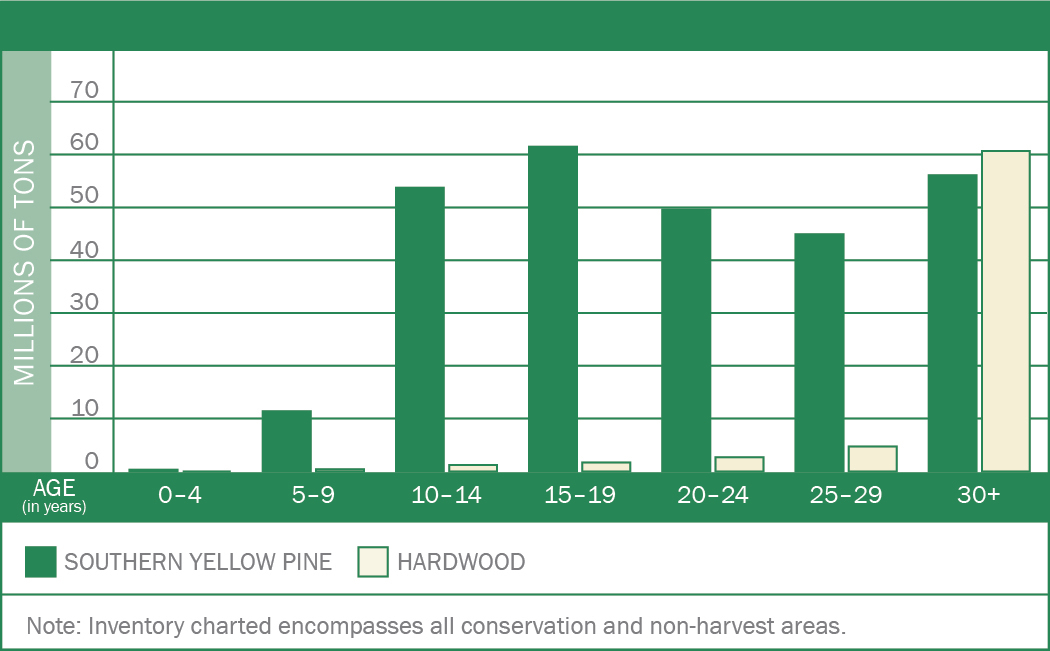
The average age of timber harvested from our Southern timberlands in
2016
was 29 years. In accordance with our sustainable forestry practices, we harvest approximately 3 percent of our acreage each year in the South.
Northern United States
Our Northern acres contain a diverse mix of temperate broadleaf hardwoods and mixed conifer species across timberlands located in seven states (Maine, Michigan, Montana, New Hampshire, Vermont, West Virginia and Wisconsin). Species include American beech, balsam fir, birch, cedar, cherry, Douglas fir, hemlock, maple, oak, red pine, spruce, Western larch and white pine.
Regeneration is predominantly natural, augmented by planting where appropriate. Environmental stewardship in the region is shaped by responsible forest management, the geography of our ownership and past management practices.
2016
Northern U.S. Inventory by Species

2016
Northern U.S. Inventory by Age / Species
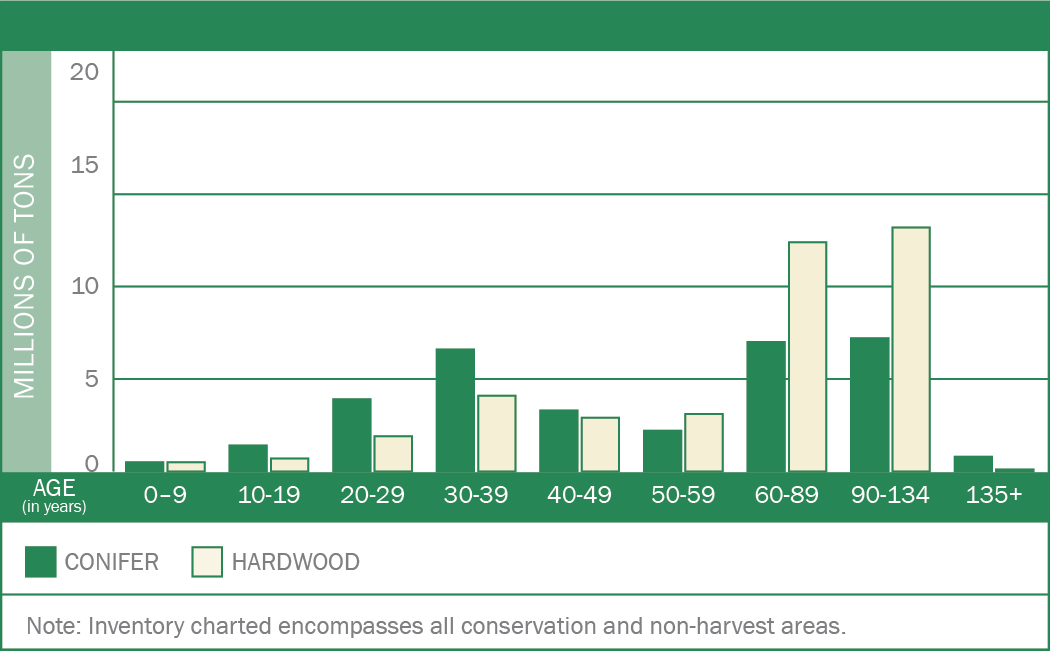
The average age of timber harvested from our Northern timberlands in
2016
was 66 years. Timber harvested in the North is sold predominately as delivered logs to domestic mills, including our manufacturing facilities located in Montana and West Virginia. In accordance with our sustainable forestry practices, we harvest less than 1 percent of our acreage each year in the North.
Uruguay
Our timberland acres in Uruguay are split approximately 49 percent loblolly pine and 51 percent eucalyptus. Loblolly pine comprises more of our timber inventory due to its older age. On average, our timber in Uruguay is in the second third of its rotation age. It is entering into that part of the growth rotation when we will see increased volume. About 98 percent of the area to be planted has been afforested to date.
WEYERHAEUSER COMPANY >
2016 ANNUAL REPORT AND FORM 10-K
7
2016
Uruguay Inventory by Species

In Uruguay, the target rotation ages are 21 to 22 years for pine and 14 to 17 years for eucalyptus. We manage both species to a grade (appearance) regime.
We also operate a plywood mill in Uruguay with a production capacity of approximately 260 thousand cubic meters. Mill operations are included in our Timberlands business segment. Production volume reached 228 thousand cubic meters in
2016
.
On October 12, 2016, we announced the exploration of strategic alternatives for our timberlands and manufacturing operations in Uruguay. We intend to consider a broad range of alternatives, including continuing to hold and operate the business, or a sale.
Canada — Licensed Timberlands
We manage timberlands in Canada under long-term licenses from the provincial governments to secure volume for our manufacturing facilities in various provinces. The provincial governments regulate the volume of timber that may be harvested each year through Annual Allowable Cuts (AAC), which are updated every 10 years. As of
December 31, 2016
, our AAC by province was:
|
•
|
Alberta — 3,107 thousand tons,
|
|
•
|
British Columbia — 627 thousand tons,
|
|
•
|
Ontario — 254 thousand tons and
|
|
•
|
Saskatchewan — 633 thousand tons.
|
When the volume is harvested, we pay the province at stumpage rates set by the government. The harvested logs are transferred to our manufacturing facilities at cost (stumpage plus harvest, haul and overhead costs less any margin on selling logs to third parties). Any profit from harvesting the log through to converting to finished products is recognized at the respective mill in our Wood Products segment.
A small amount of harvested volumes are sold to unaffiliated customers.
|
GEOGRAPHIC AREA
|
THOUSANDS OF ACRES AT
DECEMBER 31, 2016 |
|
|
|
TOTAL LICENSE
ARRANGEMENTS
|
|
|
Canada:
|
|
|
|
Alberta
|
5,321
|
|
|
British Columbia
|
1,011
|
|
|
Ontario
(1)
|
2,574
|
|
|
Saskatchewan
|
4,987
|
|
|
Total Canada
|
13,893
|
|
|
(1) License is managed by partnership.
|
||
WEYERHAEUSER COMPANY >
2016 ANNUAL REPORT AND FORM 10-K
8
HOW MUCH WE HARVEST
Our fee harvest volumes are managed sustainably across all regions to ensure the preservation of long-term economic value of the timber and to capture maximum value from the markets. This is accomplished by ensuring annual harvest schedules target financially mature timber and reforestation activities align with the growing of timber through its life cycle to financial maturity.
Five-Year Summary of Timberlands Fee Harvest Volumes
|
FEE HARVEST VOLUMES IN THOUSANDS
|
||||||||||
|
|
2016
|
|
2015
|
|
2014
|
|
2013
|
|
2012
|
|
|
Fee harvest volume – tons:
|
|
|
|
|
|
|
||||
|
West
|
11,083
|
|
10,563
|
|
10,580
|
|
8,435
|
|
6,790
|
|
|
South
|
26,343
|
|
14,113
|
|
14,276
|
|
14,177
|
|
14,046
|
|
|
North
|
2,044
|
|
—
|
|
—
|
|
—
|
|
—
|
|
|
Uruguay
|
1,119
|
|
980
|
|
1,091
|
|
902
|
|
841
|
|
|
Other
(1)
|
701
|
|
—
|
|
—
|
|
—
|
|
—
|
|
|
Total
|
41,290
|
|
25,656
|
|
25,947
|
|
23,514
|
|
21,677
|
|
|
(1) Other includes volumes managed for the Twin Creeks Venture. For additional information see
Note 8: Related Parties
in
Notes to Consolidated Financial Statements
.
|
||||||||||
Five-Year Summary of Timberlands Fee Harvest Volumes - Percentage of Grade and Fiber
|
PERCENTAGE OF GRADE AND FIBER
|
|||||||||||
|
|
2016
|
|
2015
|
|
2014
|
|
2013
|
|
2012
|
|
|
|
West
|
Grade
|
87
|
%
|
87
|
%
|
89
|
%
|
90
|
%
|
90
|
%
|
|
Fiber
|
13
|
%
|
13
|
%
|
11
|
%
|
10
|
%
|
10
|
%
|
|
|
South
|
Grade
|
52
|
%
|
59
|
%
|
59
|
%
|
57
|
%
|
59
|
%
|
|
Fiber
|
48
|
%
|
41
|
%
|
41
|
%
|
43
|
%
|
41
|
%
|
|
|
North
|
Grade
|
47
|
%
|
—
|
|
—
|
|
—
|
|
—
|
|
|
Fiber
|
53
|
%
|
—
|
|
—
|
|
—
|
|
—
|
|
|
|
Uruguay
|
Grade
|
66
|
%
|
65
|
%
|
63
|
%
|
60
|
%
|
67
|
%
|
|
Fiber
|
34
|
%
|
35
|
%
|
37
|
%
|
40
|
%
|
33
|
%
|
|
|
Other
(1)
|
Grade
|
45
|
%
|
—
|
|
—
|
|
—
|
|
—
|
|
|
Fiber
|
55
|
%
|
—
|
|
—
|
|
—
|
|
—
|
|
|
|
Total
|
Grade
|
64
|
%
|
73
|
%
|
73
|
%
|
69
|
%
|
71
|
%
|
|
Fiber
|
36
|
%
|
27
|
%
|
27
|
%
|
31
|
%
|
29
|
%
|
|
|
(1) Other includes volumes managed for the Twin Creeks Venture. For additional information see
Note 8: Related Parties
in
Notes to Consolidated Financial Statements
.
|
|||||||||||
HOW MUCH WE SELL
Our net sales to unaffiliated customers over the last two years were:
|
•
|
$1.8 billion
in
2016
— up
42 percent
from
2015
; and
|
|
•
|
$1.3 billion
in
2015
.
|
Our intersegment sales over the last two years were:
|
•
|
$840 million
in
2016
— up
1 percent
from
2015
; and
|
|
•
|
$830 million
in
2015
.
|
WEYERHAEUSER COMPANY >
2016 ANNUAL REPORT AND FORM 10-K
9
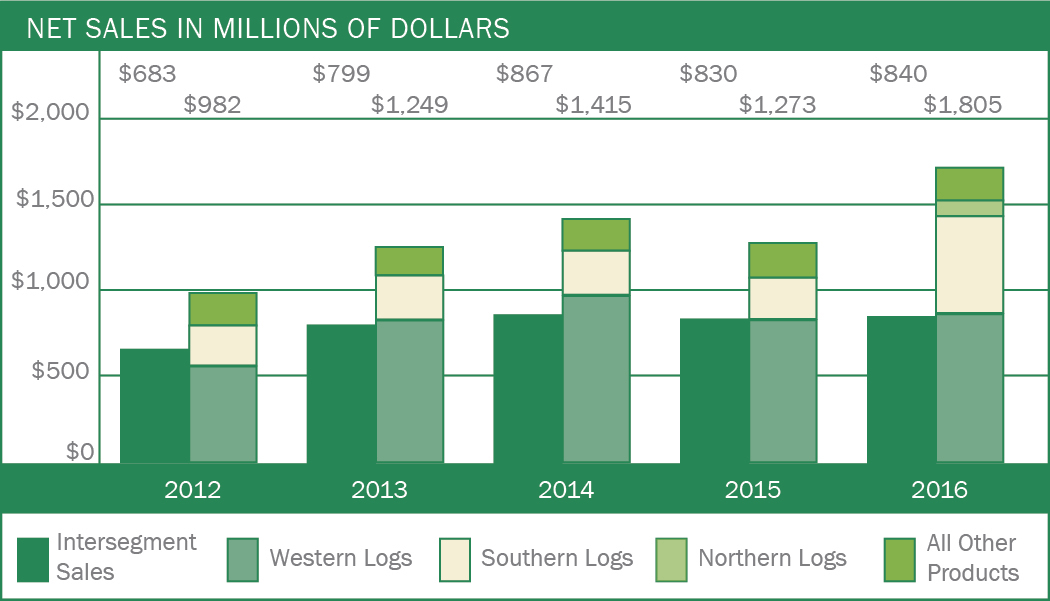
Five-Year Summary of Net Sales for Timberlands
|
NET SALES IN MILLIONS OF DOLLARS
|
|||||||||||||||
|
|
2016
|
|
2015
|
|
2014
|
|
2013
|
|
2012
|
|
|||||
|
To unaffiliated customers:
|
|
|
|
|
|
||||||||||
|
Delivered Logs:
|
|
|
|
|
|
||||||||||
|
West
|
$
|
865
|
|
$
|
830
|
|
$
|
972
|
|
$
|
828
|
|
$
|
559
|
|
|
South
|
566
|
|
241
|
|
257
|
|
256
|
|
233
|
|
|||||
|
North
|
91
|
|
—
|
|
—
|
|
—
|
|
—
|
|
|||||
|
Other
(1)
|
38
|
|
24
|
|
22
|
|
19
|
|
19
|
|
|||||
|
Total
|
1,560
|
|
1,095
|
|
1,251
|
|
1,103
|
|
811
|
|
|||||
|
Stumpage and pay-as-cut timber
|
85
|
|
37
|
|
18
|
|
9
|
|
11
|
|
|||||
|
Uruguay operations
(2)
|
79
|
|
87
|
|
88
|
|
76
|
|
92
|
|
|||||
|
Recreational lease revenue
|
44
|
|
25
|
|
22
|
|
21
|
|
19
|
|
|||||
|
Other products
(3)
|
37
|
|
29
|
|
36
|
|
40
|
|
49
|
|
|||||
|
Subtotal sales to unaffiliated customers
|
1,805
|
|
1,273
|
|
1,415
|
|
1,249
|
|
982
|
|
|||||
|
Intersegment sales:
|
|
|
|
|
|
||||||||||
|
United States
|
590
|
|
559
|
|
576
|
|
518
|
|
447
|
|
|||||
|
Canada
|
250
|
|
271
|
|
291
|
|
281
|
|
236
|
|
|||||
|
Subtotal intersegment sales
|
840
|
|
830
|
|
867
|
|
799
|
|
683
|
|
|||||
|
Total
|
$
|
2,645
|
|
$
|
2,103
|
|
$
|
2,282
|
|
$
|
2,048
|
|
$
|
1,665
|
|
|
(1) Other delivered logs includes sales to unaffiliated customers in Canada and sales from timberlands managed for the Twin Creeks Venture. For additional information about the Twin Creeks Venture see
Note 8: Related Parties
in
Notes to Consolidated Financial Statements
.
|
|||||||||||||||
|
(2) Sales from our Uruguay operations include plywood and hardwood lumber.
|
|||||||||||||||
|
(3) Other products sales include sales of seeds and seedlings from our nursery operations, chips, and sales from our operations in Brazil (operations sold in 2014) and China (operations sold in 2012).
|
|||||||||||||||
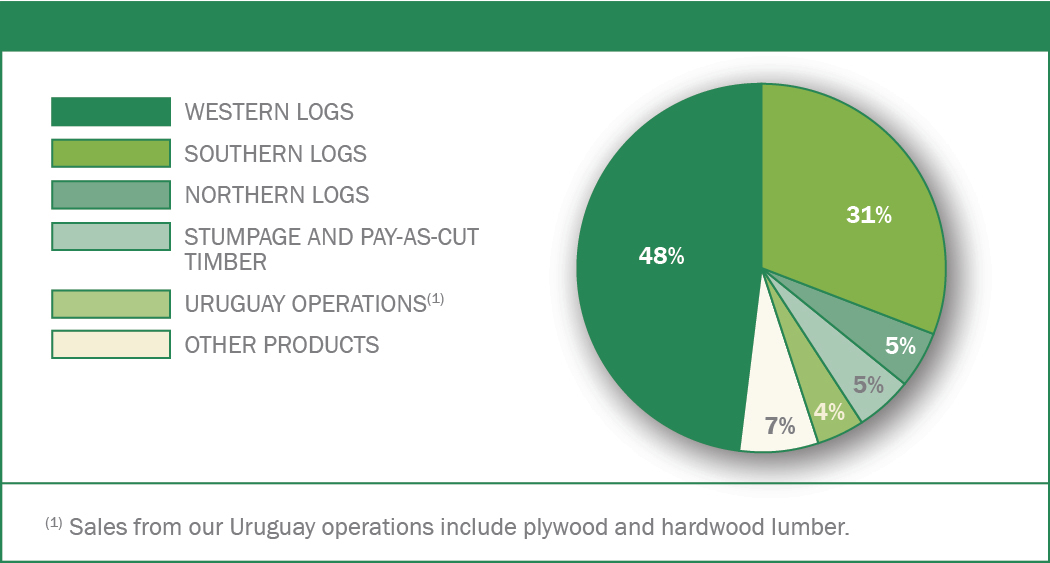
Five-Year Trend for Total Net Sales in Timberlands
Percentage of
2016
Sales Dollars to Unaffiliated Customers
WEYERHAEUSER COMPANY >
2016 ANNUAL REPORT AND FORM 10-K
10
Log Sales Volume
Logs sold to unaffiliated customers in
2016
increased
11.6 million
tons —
73 percent
— from
2015
.
|
•
|
Sales volume in the West increased
0.5 million
tons —
6 percent
— primarily due to the addition of volumes harvested from acquired Plum Creek timberlands.
|
|
•
|
Sales to unaffiliated customers in the South increased
9.5 million
tons —
146 percent
— primarily due to the addition of volumes harvested from acquired Plum Creek timberlands.
|
|
•
|
Sales to unaffiliated customers in the North were
1.5 million
tons, all generated from acquired Plum Creek timberlands.
|
We sell three grades of logs — domestic grade, domestic fiber and export. Factors that may affect log sales in each of these categories include:
|
•
|
domestic grade log sales — lumber usage, primarily for housing starts and repair and remodel activity, the needs of our own mills and the availability of logs from both outside markets and our own timberlands;
|
|
•
|
domestic fiber log sales — demand for chips by pulp, containerboard mills, and OSB mills; and
|
|
•
|
export log sales — the level of housing starts in Japan and construction in China.
|
Our sales volume includes logs purchased in the open market and all our domestic and export logs that are sold to unaffiliated customers or transferred at market prices to our internal mills.
Five-Year Summary of Log Sales Volume to Unaffiliated Customers
|
SALES VOLUME IN THOUSANDS
|
||||||||||
|
|
2016
|
|
2015
|
|
2014
|
|
2013
|
|
2012
|
|
|
Logs – tons:
|
|
|
|
|
|
|||||
|
West
|
8,713
|
|
8,212
|
|
8,504
|
|
7,300
|
|
5,585
|
|
|
South
|
15,967
|
|
6,480
|
|
6,941
|
|
7,198
|
|
6,816
|
|
|
North
|
1,500
|
|
—
|
|
—
|
|
—
|
|
—
|
|
|
Uruguay
|
470
|
|
714
|
|
667
|
|
394
|
|
379
|
|
|
Other
(1)
|
943
|
|
551
|
|
474
|
|
410
|
|
426
|
|
|
Total
|
27,593
|
|
15,957
|
|
16,586
|
|
15,302
|
|
13,206
|
|
|
(1) Other includes our Canadian operations and managed Twin Creeks operations.
|
||||||||||
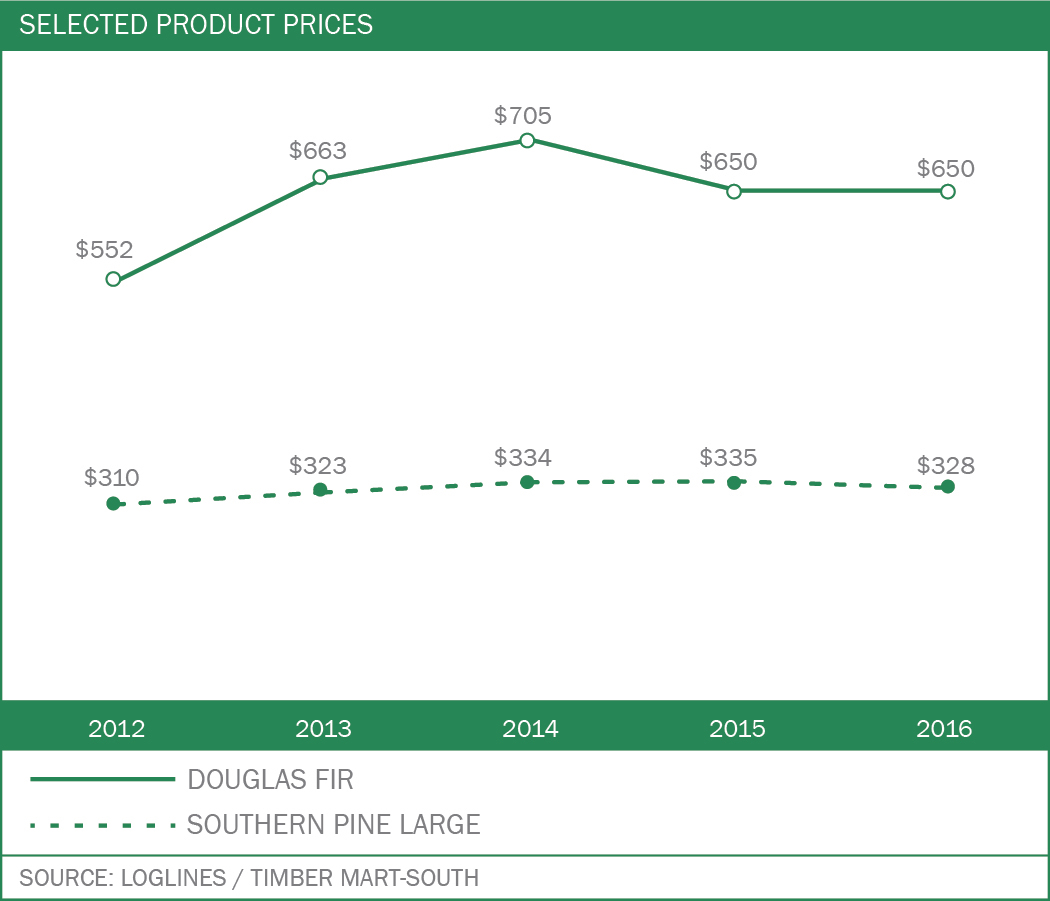
Log Prices
The majority of our log sales to unaffiliated customers involve sales to domestic sawmills and the export market. Log prices in the following tables are on a delivered (mill) basis:
Five-Year Summary of Published Domestic Log Prices (#2 Sawlog Bark On — $/MBF)
WEYERHAEUSER COMPANY >
2016 ANNUAL REPORT AND FORM 10-K
11
Five-Year Summary of Export Log Prices (#2 Sawlog Bark On — $/MBF)
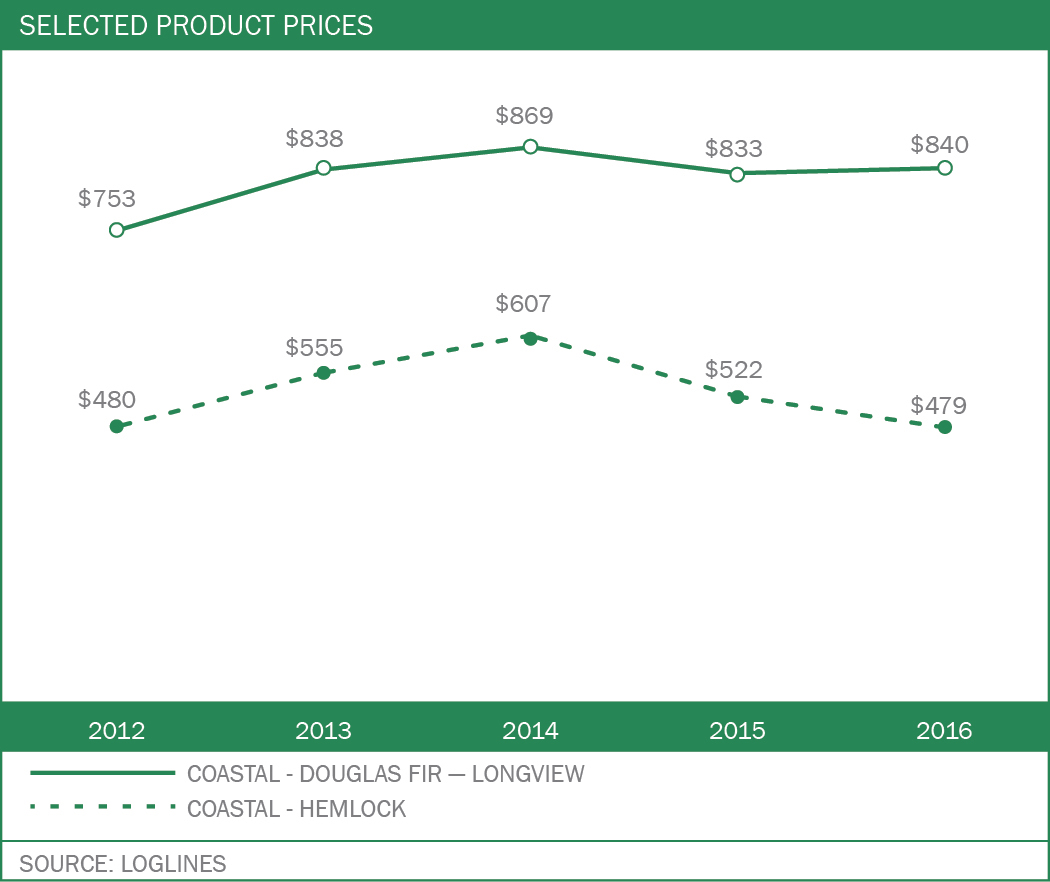
Our log prices are affected by the supply of and demand for grade and fiber logs and are influenced by the same factors that affect log sales. Export log prices are particularly affected by the Japanese housing market and Chinese demand.
Our average
2016
log realizations in the West decreased by 2 percent compared to
2015
— primarily due to grade mix and export vs. domestic sales mix.
Our average
2016
log realizations in the South decreased by 5 percent compared to
2015
— primarily as a result of lower realization pulpwood sales having increased and higher realization grade logs having decreased as a percentage of total sales volume. The change in mix is attributable to the addition of acquired Plum Creek timberlands that have historically produced a higher proportion of pulpwood vs. grade logs compared to legacy Weyerhaeuser timberlands.
WHERE WE’RE HEADED
Our competitive strategies include:
|
•
|
continuing to capitalize on our scale of operations, silviculture expertise and sustainability practices;
|
|
•
|
optimizing cash flow through operational excellence initiatives such as merchandising for value, harvest and transportation efficiencies, and flexing harvest to seasonal and short term opportunities;
|
|
•
|
sustaining our export and domestic market access, infrastructure and strong customer relationships;
|
|
•
|
increasing our recreational lease revenue stream; and
|
|
•
|
continuing to successfully integrate operations acquired in our merger with Plum Creek, capture operational synergies, and maximize the value of our combined timberlands portfolio.
|
REAL ESTATE, ENERGY AND NATURAL RESOURCES
Our Real Estate & ENR segment maximizes the value of our timberland ownership through application of our asset value optimization (AVO) process and captures the full value of surface and subsurface assets through development of oil, natural gas, minerals and wind resources.
WHAT WE DO
Real Estate
Properties that exhibit higher value than commercial timberlands are monetized within our Real Estate business. We analyze existing U.S. timberland holdings using a process we call asset value optimization. We start with understanding the value of a parcel operating as commercial timberlands and then assess the specific real estate attributes of the parcel and its corresponding market. The assessment includes demographics, infrastructure and proximity to amenities and recreation to determine the potential to yield a premium value to commercial timberland. Attributes can evolve over time, and accordingly, the assignment of value and opportunity can change.
The assessment includes third party experts and results in a categorization of properties with potential premium values. These properties are acres we expect to sell, exchange, and/or develop for recreational, conservation, commercial or residential purposes. Development is conducted using internal resources or through third-party arrangements.
Occasionally we enter into small, opportunistic timberlands transactions in areas where we choose to reduce our market presence or we can capture a price that exceeds the value derivable from holding and operating as commercial timberlands. These transactions will vary based on factors including the locations and physical characteristics of the timberlands.
The timing of real estate sales is a function of many factors, including the general state of the economy, demand in local real estate markets, the ability to obtain entitlements, the ability of buyers to obtain financing, the number of competing properties listed for sale, the seasonal nature of sales (particularly in the northern states), the plans of adjacent landowners, our expectation of future price appreciation, the timing of the harvesting activities, and the availability of government and not-for-profit funding (especially for conservation sales). In any period the average sales price per acre will vary based on the location and physical characteristics of parcels sold.
WEYERHAEUSER COMPANY >
2016 ANNUAL REPORT AND FORM 10-K
12
Energy and Natural Resources
In the United States, we analyze and manage mineral, oil and gas, and renewable energy opportunities on our timberlands. We recognize leasing, bonus, and option revenue over the terms of agreements with buyers. Revenue primarily comes from:
|
•
|
royalty payments on hard minerals (rock, sand and gravel);
|
|
•
|
royalty payments on oil and gas production;
|
|
•
|
bonus payments from oil and gas leasing and exploration activity;
|
|
•
|
wind power and communication and transmission rights of way;
|
|
•
|
coal royalties; and
|
|
•
|
the sale of mineral assets.
|
We generate revenue related to our ownership of mineral rights and, separately, related to our ownership of the surface. The ownership of mineral rights and surface rights may be held by two separate parties. Materials that can be mined from the surface, and whose value comes from factors other than their chemical composition typically belong to the surface owner. Examples of surface materials include rock, sand and gravel. The mineral rights owner holds the title to commodities that derive value from their unique chemical composition. Examples of mineral rights include oil, gas, coal (even if mined at the surface) and precious metals. If the two types of rights conflict, then mineral rights generally are superior to surface rights. A third type of land right is geothermal, which can belong to either the surface or mineral owner. We generally reserve mineral and geothermal rights when selling surface timberlands acreage.
We expect to continue to negotiate royalty arrangements and leases to capture the maximum value for our non-timber natural resources assets. Some of these activities are conducted through our wholly-owned taxable REIT subsidiaries.
Real Estate Development Joint Venture
Our share of equity earnings from WestRock-Charleston Land Partners, LLC (WR-CLP) are included in the net contribution to earnings of our Real Estate & ENR segment. WR-CLP develops and sells its acreage of high value rural lands and development-quality lands near Charleston, South Carolina. Refer to
Note 8: Related Parties
in
Notes to Consolidated Financial Statements
for further information.
Real Estate, Energy and Natural Resources Sources of Revenue
|
SOURCE
|
ACTIVITIES
|
|
Timberlands
|
Select timberland tracts are sold for recreational, conservation or residential purposes to maximize value or improve our timberland portfolio.
|
|
Minerals and mineral rights
|
Rights are sold to explore and extract minerals, oil and gas for sale into energy markets.
|
|
Surface materials
|
Rights are sold to access and extract surface materials (rock, sand and gravel) for sale into construction markets
|
|
Rights of way and easements
|
Rights are sold to access and utilize surface acreage for wind power, communications equipment, and transportation implementations (e.g. pipeline and power line easements)
|
Certain activities within this segment are performed by our REIT, whereas others are activities of our Taxable REIT Subsidiaries.
WHERE WE DO IT
Our Real Estate & ENR segment identifies opportunities to realize premium value for our U.S. timberland acreage.
The AVO review of our legacy Weyerhaeuser Southern timberlands was completed in fourth quarter 2016. The AVO review of our legacy Weyerhaeuser Western timberlands is currently underway and is expected to be completed in 2017. Beyond initially applying the AVO process to legacy Weyerhaeuser timberlands, we will continually revisit our AVO assessment of all of our U.S. timberland acres, including acreage acquired in our merger with Plum Creek that was subjected to the AVO process prior to the merger.
Our significant energy and natural resources revenue sources are generated from construction materials royalties in South Carolina and Georgia; oil and natural gas royalties in West Virginia and Louisiana; and coal reserves in West Virginia.
HOW MUCH WE SELL
Our net sales to unaffiliated buyers over the last two years were:
|
•
|
$226 million
in
2016
— up
124
percent from
2015
; and
|
|
•
|
$101 million
in
2015
.
|
Five-Year Summary of Net Sales for Real Estate, Energy and Natural Resources
|
NET SALES IN MILLIONS OF DOLLARS
|
|||||||||||||||
|
|
2016
|
|
2015
|
|
2014
|
|
2013
|
|
2012
|
|
|||||
|
Net Sales:
|
|
|
|
|
|
||||||||||
|
Real Estate
|
$
|
172
|
|
$
|
75
|
|
$
|
72
|
|
$
|
84
|
|
$
|
83
|
|
|
Energy and Natural Resources
|
54
|
|
26
|
|
32
|
|
31
|
|
31
|
|
|||||
|
Total
|
$
|
226
|
|
$
|
101
|
|
$
|
104
|
|
$
|
115
|
|
$
|
114
|
|
WEYERHAEUSER COMPANY >
2016 ANNUAL REPORT AND FORM 10-K
13
Five-Year Summary of Real Estate Sales Statistics
|
REAL ESTATE SALES STATISTICS
|
|||||||||||||||
|
|
2016
|
|
2015
|
|
2014
|
|
2013
|
|
2012
|
|
|||||
|
Acres sold
|
82,687
|
|
27,390
|
|
24,583
|
|
25,781
|
|
25,234
|
|
|||||
|
Average price per acre
|
$
|
2,072
|
|
$
|
2,490
|
|
$
|
2,428
|
|
$
|
2,462
|
|
$
|
2,123
|
|
WHERE WE’RE HEADED
Our competitive strategies include:
|
•
|
continuing to apply the AVO process to identify opportunities to capture a substantial premium to timber value;
|
|
•
|
maintaining a flexible, low-cost execution model by continuing to leverage strategic relationships with outside brokers;
|
|
•
|
capturing the full value of our surface and subsurface assets, including: aggregates and industrial minerals, oil and natural gas and wind resources; and
|
|
•
|
delivering the most value from every acre.
|
WOOD PRODUCTS
We are a large manufacturer of wood products in North America and distributor of wood products, primarily in North America.
WHAT WE DO
Our wood products segment:
|
•
|
provides high-quality softwood lumber, engineered wood products, structural panels, medium density fiberboard (MDF) and other specialty products to the residential, multi-family, industrial, light commercial and repair and remodel markets;
|
|
•
|
distributes our products as well as complementary building products that we purchase from other manufacturers; and
|
|
•
|
exports our softwood lumber, oriented strand board (OSB) and engineered wood products, primarily to Asia.
|
Wood Products
|
PRODUCTS
|
HOW THEY’RE USED
|
|
Structural lumber
|
Structural framing for new residential, repair and remodel, treated applications, industrial and commercial structures
|
|
Engineered wood products
• Solid section
• I-joists
|
Floor and roof joists, and headers and beams for residential, multi-family and commercial structures
|
|
Structural panels
• OSB
• Softwood plywood
|
Structural sheathing, subflooring and stair tread for residential, multi-family and commercial structures
|
|
Medium density fiberboard (MDF)
|
Furniture and cabinet components, architectural moldings, doors, store fixtures, core material for hardwood plywood, face material for softwood plywood, commercial wall paneling and substrate for laminate flooring
|
|
Other products
|
Wood chips and other byproducts
|
|
Complementary building products
|
Complementary building products such as cedar, decking, siding, insulation and rebar sold in our distribution facilities
|
WHERE WE DO IT
We operate manufacturing facilities in the United States and Canada. We distribute through a combination of Weyerhaeuser distribution centers and third-party distributors. Information about the locations, capacities and actual production of our manufacturing facilities is included below.
Principal Manufacturing Locations
Locations of our principal manufacturing facilities as of
December 31, 2016
, by major product group were:
|
•
|
Structural lumber
|
– U.S. — Alabama, Arkansas, Louisiana, Mississippi, Montana, North Carolina, Oklahoma, Oregon and Washington
– Canada — Alberta and British Columbia
|
•
|
Engineered wood products
|
– U.S. — Alabama, Louisiana, Oregon and West Virginia
– Canada — British Columbia and Ontario
|
•
|
Oriented strand board
|
– U.S. — Louisiana, Michigan, North Carolina and West Virginia
– Canada — Alberta and Saskatchewan
|
•
|
Softwood plywood
|
– U.S. — Arkansas, Montana and Louisiana
|
•
|
Medium density fiberboard
|
– U.S. — Montana
We also operate a facility in Foster, Oregon, that produces veneer, primarily for use in our engineered wood products facilities.
Upon our merger with Plum Creek, we acquired five manufacturing facilities in Montana, two plywood facilities, two lumber facilities, and one MDF facility. We permanently closed the lumber facility and softwood plywood facility in Columbia Falls, Montana during the third quarter of
WEYERHAEUSER COMPANY >
2016 ANNUAL REPORT AND FORM 10-K
14
2016. The closure of these facilities allows us to align the available log supply with our manufacturing capacity, including adding shifts at our Kalispell, Montana facilities to position our Montana operations for long-term success.
We also own or lease 17 distribution centers in the U.S. where our major products and complementary building products are sold. During 2015, we decided to close our distribution centers in Baltimore, Pittsburgh, Chicago, and St. Paul. These were permanently closed in 2016.
Summary of Wood Products Capacities as of
December 31, 2016
|
CAPACITIES IN MILLIONS
|
||||
|
|
PRODUCTION
CAPACITY
|
|
NUMBER OF
FACILITIES
|
|
|
Structural lumber – board feet
|
4,940
|
|
19
|
|
|
Engineered solid section – cubic feet
(1)
|
43
|
|
6
|
|
|
Oriented strand board – square feet (3/8”)
|
3,035
|
|
6
|
|
|
Softwood plywood – square feet (3/8”)
|
610
|
|
3
|
|
|
Medium density fiberboard – square feet (3/4')
|
265
|
|
1
|
|
|
(1) This represents total press capacity. Three facilities also produce I-Joist to meet market demand. In 2016, approximately 25% of the total press production was converted into 184 million linear feet of I-Joist.
|
||||
Production capacities listed represent annual production volume under normal operating conditions and producing a normal product mix for each individual facility. Production capacities do not include any capacity for facilities that were sold or permanently closed as of the end of
2016
.
Five-Year Summary of Wood Products Production
|
PRODUCTION IN MILLIONS
|
||||||||||
|
|
2016
|
|
2015
|
|
2014
|
|
2013
|
|
2012
|
|
|
Structural lumber – board feet
|
4,516
|
|
4,252
|
|
4,152
|
|
4,084
|
|
3,846
|
|
|
Engineered solid section – cubic feet
(1)
|
22.8
|
|
20.9
|
|
20.4
|
|
18.0
|
|
15.4
|
|
|
Engineered I-joists – lineal feet
(1)
|
184
|
|
185
|
|
182
|
|
168
|
|
147
|
|
|
Oriented strand board – square feet (3/8”)
|
2,910
|
|
2,847
|
|
2,749
|
|
2,723
|
|
2,511
|
|
|
Softwood plywood – square feet (3/8”)
(2)
|
396
|
|
248
|
|
252
|
|
241
|
|
214
|
|
|
MDF – square feet (3/4')
|
209
|
|
—
|
|
—
|
|
—
|
|
—
|
|
|
(1) Weyerhaeuser engineered I-joist facilities also may produce engineered solid section.
(2) All Weyerhaeuser plywood facilities also produce veneer.
|
||||||||||
HOW MUCH WE SELL
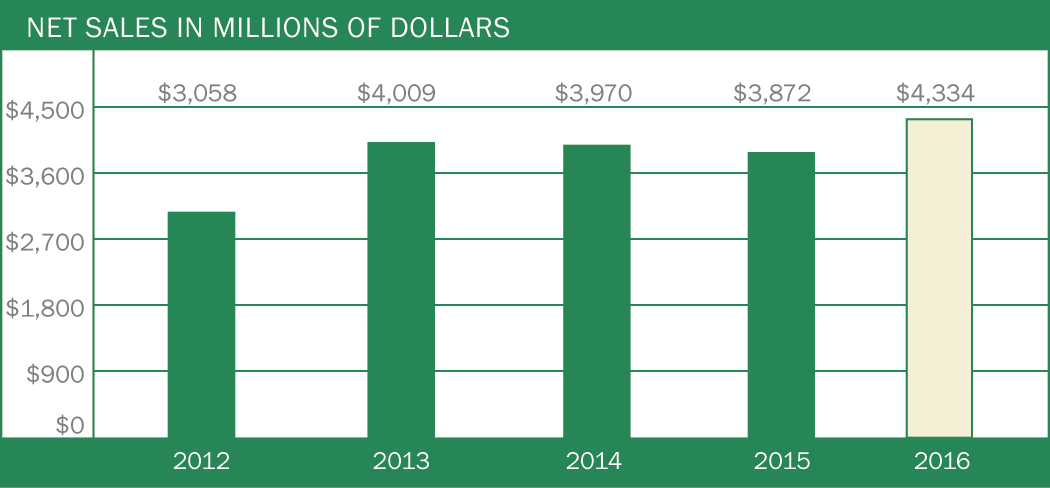
Revenues of our Wood Products segment come from sales to wood products dealers, do-it-yourself retailers, builders and industrial users. Wood Products net sales were
$4.3 billion
in
2016
and
$3.9 billion
2015
.
Five-Year Summary of Net Sales for Wood Products
|
NET SALES IN MILLIONS OF DOLLARS
|
|||||||||||||||
|
|
2016
|
|
2015
|
|
2014
|
|
2013
|
|
2012
|
|
|||||
|
Structural lumber
|
$
|
1,839
|
|
$
|
1,741
|
|
$
|
1,901
|
|
$
|
1,873
|
|
$
|
1,400
|
|
|
Engineered solid section
|
450
|
|
428
|
|
402
|
|
353
|
|
279
|
|
|||||
|
Engineered I-joists
|
290
|
|
284
|
|
277
|
|
247
|
|
190
|
|
|||||
|
Oriented strand board
|
707
|
|
595
|
|
610
|
|
809
|
|
612
|
|
|||||
|
Softwood plywood
|
174
|
|
129
|
|
143
|
|
144
|
|
115
|
|
|||||
|
Medium density fiberboard
|
158
|
|
—
|
|
—
|
|
—
|
|
—
|
|
|||||
|
Other products produced
|
201
|
|
189
|
|
176
|
|
171
|
|
167
|
|
|||||
|
Complementary building products
|
515
|
|
506
|
|
461
|
|
412
|
|
295
|
|
|||||
|
Total
|
$
|
4,334
|
|
$
|
3,872
|
|
$
|
3,970
|
|
$
|
4,009
|
|
$
|
3,058
|
|
Five-Year Trend for Total Net Sales in Wood Products
WEYERHAEUSER COMPANY >
2016 ANNUAL REPORT AND FORM 10-K
15
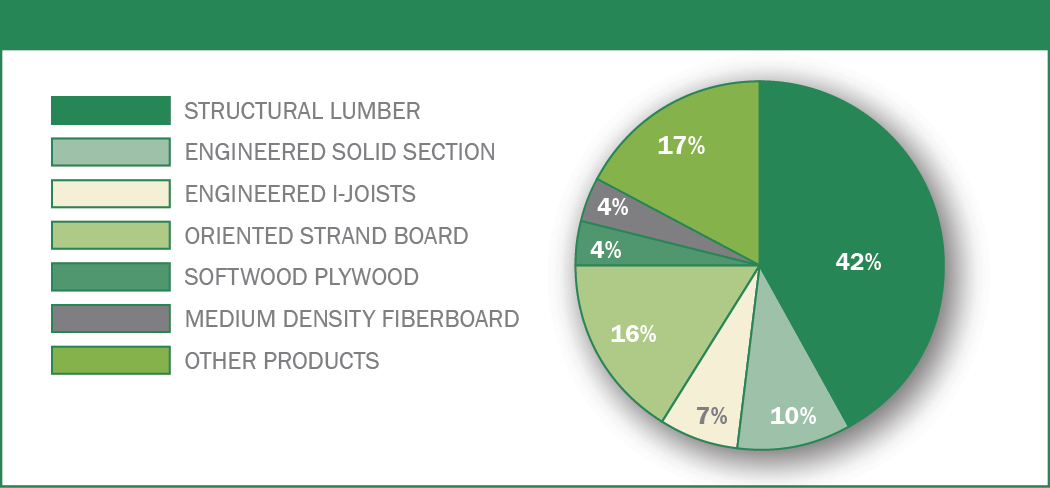
Percentage of
2016
Net Sales Dollars in Wood Products
Wood Products Volume
The volume of structural lumber, engineered wood products, OSB and plywood sold in
2016
increased from
2015
due to our our acquired Plum Creek operations and increased demand.
Five-Year Summary of Sales Volume for Wood Products
|
SALES VOLUME IN MILLIONS
|
||||||||||
|
|
2016
|
|
2015
|
|
2014
|
|
2013
|
|
2012
|
|
|
Structural lumber – board feet
|
4,723
|
|
4,588
|
|
4,463
|
|
4,436
|
|
4,031
|
|
|
Engineered solid section – cubic feet
|
23.3
|
|
21.3
|
|
20.0
|
|
18.2
|
|
15.4
|
|
|
Engineered I-joists – lineal feet
|
195
|
|
188
|
|
184
|
|
177
|
|
152
|
|
|
Oriented strand board – square feet (3/8”)
|
2,934
|
|
2,972
|
|
2,788
|
|
2,772
|
|
2,508
|
|
|
Softwood Plywood – square feet (3/8”)
|
481
|
|
381
|
|
395
|
|
402
|
|
340
|
|
|
MDF – square feet (3/4')
|
206
|
|
—
|
|
—
|
|
—
|
|
—
|
|
|
Sales volume includes sales of internally produced products and complementary building products sold primarily through our distribution centers.
|
||||||||||
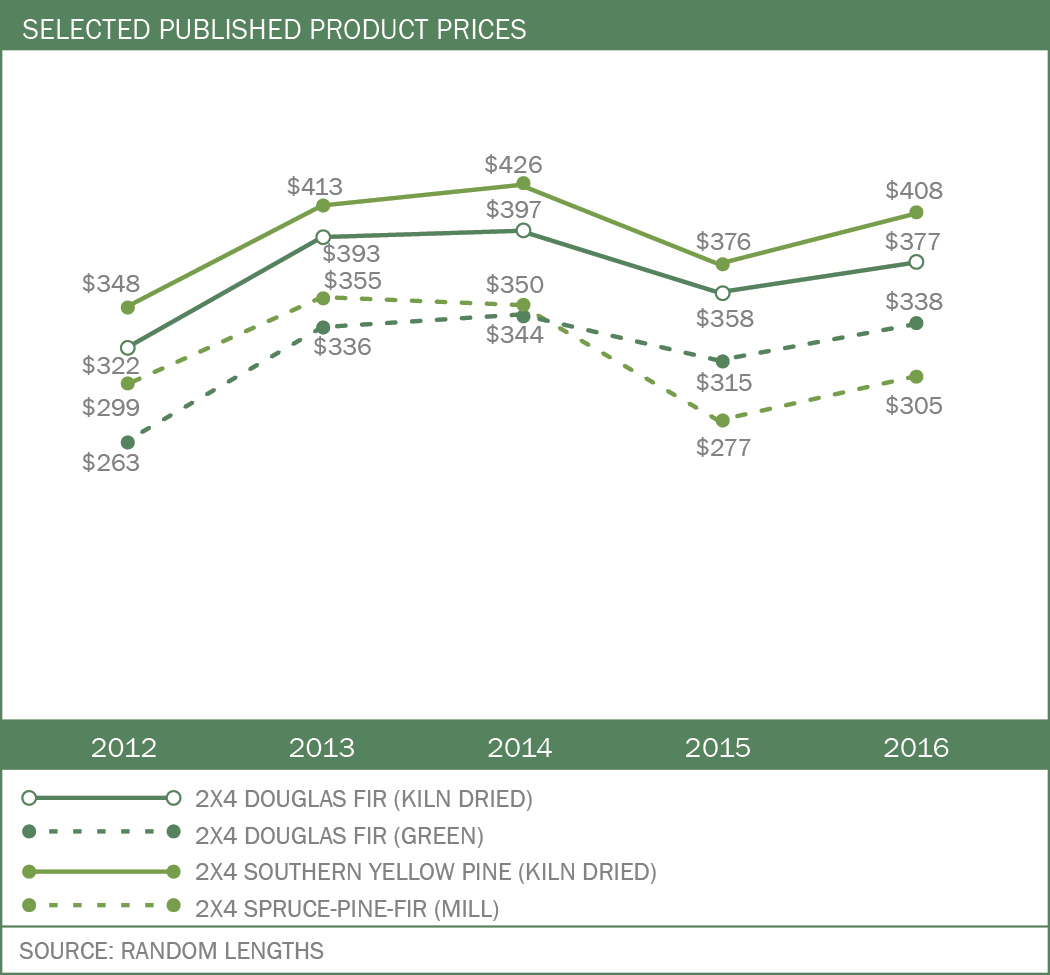
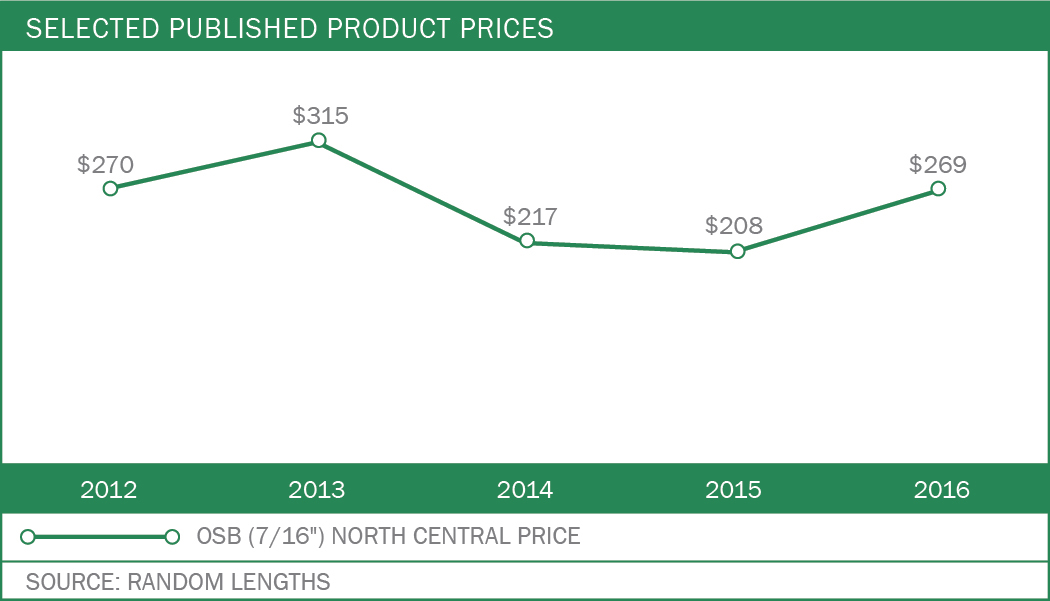
Wood Products Prices
Prices for commodity wood products — Structural lumber, OSB and Plywood — increased in
2016
from
2015
.
In general, the following factors influence prices for wood products:
|
•
|
Demand for wood products used in residential and multi-family construction and the repair and remodel of existing homes affects prices. Residential construction is influenced by factors such as population growth and other demographics, the level of employment, consumer confidence, consumer income, availability of financing and interest rate levels, and the supply and pricing of existing homes on the market. Repair and remodel activity is affected by the size and age of existing housing inventory and access to home equity financing and other credit.
|
|
•
|
The availability of supply of commodity building products such as structural lumber, OSB and plywood affects prices. A number of factors can influence supply, including changes in production capacity and utilization rates, weather, raw material supply and availability of transportation.
|
Demand for wood products continued to improve in
2016
. The following graphs reflect product price trends for the past five years.
Five-Year Summary of Published Lumber Prices — $/MBF
WEYERHAEUSER COMPANY >
2016 ANNUAL REPORT AND FORM 10-K
16
Five-Year Summary of Published Oriented Strand Board Prices — $/MSF
WHERE WE’RE HEADED
Our competitive strategies include:
|
•
|
reduce controllable manufacturing costs through operational excellence and disciplined capital execution;
|
|
•
|
strong alignment with fiber supply;
|
|
•
|
leverage our brand and reputation as the preferred provider of quality building products; and
|
|
•
|
pursue disciplined, profitable sales growth in target markets.
|
WEYERHAEUSER COMPANY >
2016 ANNUAL REPORT AND FORM 10-K
17
|
EXECUTIVE OFFICERS OF THE REGISTRANT
|
Adrian M. Blocker
, 60, has been senior vice president, Wood Products since January 2015. Previously, he served as senior vice president, Lumber, from August 2013 to December 2014. He joined the company in May 2013 as vice president, Lumber. Prior to joining the company, he served as CEO of the Wood Products Council. He has held numerous leadership positions in the industry focused on forest management, fiber procurement, consumer packaging, strategic planning, business development and manufacturing, including at West Fraser, International Paper and Champion International.
Russell S. Hagen
, 51, has been senior vice president and chief financial officer since February 2016. Previously, he served as senior vice president, Business Development, at Plum Creek. from December 2011 to February 2016. Prior to this he was vice president, Real Estate Development, overseeing the development activities of the company's real estate, oil and gas, construction materials and bioenergy businesses. Mr. Hagen began his career in 1988 with PricewaterhouseCoopers LLC where he was a certified public accountant and led the audits of public clients in technology, banking and natural resource industries. He joined Plum Creek in 1993 as Manager of Internal Audit and held director-level positions in accounting, financial operations, risk management and information technology.
Kristy T. Harlan
, 43, has been senior vice president, General Counsel and Corporate Secretary since January 2017. She leads the company's Law department, with responsibility for global legal, compliance, real estate services and land title functions. Before joining the company, she was a partner at K&L Gates LLP since 2007. Previously, she worked as an attorney at Preston Gates & Ellis LLP and Akin Gump Strauss Hauer & Feld.
Rhonda D. Hunter
, 54, has been senior vice president, Timberlands, since January 2014. Previously, she was vice president, Southern Timberlands from 2010 to 2014. She held a number of leadership positions in the Southern Timberlands organization and has experience in inventory and planning, regional timberlands management, environmental and work systems, finance and land acquisition. She joined Weyerhaeuser in 1987 as an accountant.
James A. Kilberg
, 60, has been senior vice president, Real Estate, Energy and Natural Resources, since April 2016. In this position, he oversees the company's real estate development, land asset management, conservation, mitigation banking, recreational lease management, oil and gas, construction materials, heavy minerals, wind and water. Prior to joining the company, he served as Plum Creek's senior vice president, Real Estate, Energy and Natural Resources, from 2006 until February 2016, and as Plum Creek’s vice president, Land Management, from 2001 until 2006. Prior to joining Plum Creek, Mr. Kilberg held several executive positions in real estate, asset management and development. He currently serves on the board of the Georgia Chamber of Commerce and the Alliance Theater, as well as the Corporate Council of the Land Trust Alliance.
Denise M. Merle
, 53, has been senior vice president, Human Resources and Information Technology, since February 2016. Prior to her current role, she was senior vice president, Human Resources and Investor Relations, since August 2014; and senior vice president, Human Resources, since February 2014. She was director, Finance and Human Resources, for the Lumber business since 2013. Prior to that, she was director, Compliance & Enterprise Planning, from 2009 to 2013, and director, Internal Audit, from 2004 to 2009. She has also held various roles in the company's paper and packaging businesses, including finance, capital planning and analysis, and business development. She is a licensed CPA in the state of Washington. She serves on the Board of Advisors of the Seattle University business school.
Doyle R. Simons
, 53, has been president and chief executive officer since August 2013 and a director of the company since June 2012. He was appointed chief executive officer-elect and an executive officer of the company in June 2013. Prior to joining the company, he served as chairman and chief executive officer of Temple-Inland, Inc., from 2008 until February 2012 when it was acquired by International Paper Company. He held various management positions with Temple-Inland, including executive vice president from 2005 through 2007 and chief administrative officer from 2003 to 2005. Prior to joining Temple-Inland in 1992, he practiced real estate and banking law with Hutcheson and Grundy, L.L.P. He also serves on the Board of Fiserv, Inc.
WEYERHAEUSER COMPANY >
2016 ANNUAL REPORT AND FORM 10-K
18
|
NATURAL RESOURCE AND ENVIRONMENTAL MATTERS
|
We are subject to a multitude of laws and regulations in the operation of our businesses. We also participate in voluntary certification of our timberlands to ensure that we sustain their overall quality, including the protection of wildlife and water quality. Changes in law and regulation, or certification standards, can significantly affect our business.
REGULATIONS AFFECTING FORESTRY PRACTICES
In the United States, regulations established by federal, state and local government agencies to protect water quality and wetlands could affect future harvests and forest management practices on our timberlands. Forest practice laws and regulations that affect present or future harvest and forest management activities in certain states include:
|
•
|
limits on the size of clearcuts,
|
|
•
|
requirements that some timber be left unharvested to protect water quality and fish and wildlife habitat,
|
|
•
|
regulations regarding construction and maintenance of forest roads,
|
|
•
|
rules requiring reforestation following timber harvest and
|
|
•
|
various related permit programs.
|
Each state in which we own timberlands has developed best management practices to reduce the effects of forest practices on water quality and aquatic habitats. Additional and more stringent regulations may be adopted by various state and local governments to achieve water-quality standards under the federal Clean Water Act, protect fish and wildlife habitats, human health, or achieve other public policy objectives.
In Canada, our forest operations are carried out on public timberlands under forest licenses with the provinces. All forest operations are subject to:
|
•
|
forest practices and environmental regulations and
|
|
•
|
license requirements established by contract between us and the relevant province designed to:
|
-
protect environmental values and
-
encourage other stewardship values.
In Canada, 21 member companies of the Forest Products Association of Canada (FPAC), including Weyerhaeuser
’
s Canadian subsidiary, announced in May 2010 the signing of a Canadian Boreal Forest Agreement (CBFA) with nine environmental organizations. The CBFA applies to approximately 72 million hectares of public forests licensed to FPAC members and, when fully implemented, is expected to lead to the conservation of significant areas of Canada
’
s boreal forest and protection of boreal species at risk, in particular woodland caribou. CBFA signatories continue to work on management plans with provincial governments, and seek the participation of aboriginal and local communities in advancing the goals of the CBFA. Progress under the CBFA is measured and reported on by an independent auditor.
ENDANGERED SPECIES PROTECTIONS
In the United States, a number of fish and wildlife species that inhabit geographic areas near or within our timberlands have been listed as threatened or endangered under the federal Endangered Species Act (ESA) or similar state laws, such as:
|
•
|
the northern spotted owl, the marbled murrelet, a number of salmon species, bull trout and steelhead trout in the Pacific Northwest;
|
|
•
|
several freshwater mussel and sturgeon species; and
|
|
•
|
the red-cockaded woodpecker, gopher tortoise, gopher frog, American burying beetle and Northern long-eared bat in the South or Southeast.
|
Additional species or populations may be listed as threatened or endangered as a result of pending or future citizen petitions or petitions initiated by federal or state agencies. In addition, significant citizen litigation seeks to compel the federal agencies to designate "critical habitat" for ESA-listed species, and many cases have resulted in settlements under which designations will be implemented over time. Such designations may adversely affect some management activities and options. Restrictions on timber harvests can result from:
|
•
|
federal and state requirements to protect habitat for threatened and endangered species;
|
|
•
|
regulatory actions by federal or state agencies to protect these species and their habitat; and
|
|
•
|
citizen suits under the ESA.
|
Such actions could increase our operating costs and affect timber supply and prices in general. To date, we do not believe that these measures have had, and we do not believe that in
2017
they will have, a significant effect on our harvesting operations. We anticipate that likely future actions will not disproportionately affect Weyerhaeuser as compared with comparable operations of U.S. competitors.
In Canada:
|
•
|
The federal Species at Risk Act (SARA) requires protective measures for species identified as being at risk and for critical habitat, pursuant to SARA, Environment Canada continues to identify and assess species deemed to be at risk and their critical habitat.
|
|
•
|
In October 2012, the Canadian Minister of the Environment released a strategy for the recovery of the boreal population of woodland caribou under the SARA. The population and distribution objectives for boreal caribou across Canada are to (1) maintain the current status of existing, self-sustaining local caribou populations and (2) stabilize and achieve self-sustaining status for non-self-sustaining local caribou populations. Critical habitat for boreal caribou is identified for all boreal caribou ranges, except for northern Saskatchewan’s Boreal Shield range (SK1) where additional information is required for that population. Species assessment and recovery plans are developed in consultation with aboriginal communities and stakeholders.
|
The identification and protection of habitat and the implementation of range plans and land use action plans may, over time, result in additional restrictions on timber harvests and other forest management practices that could increase operating costs for operators of timberlands in Canada. To date, we do not believe that these Canadian measures have had, and we do not believe that in
2017
they will have, a significant effect on our harvesting operations. We anticipate that likely future measures will not disproportionately affect Weyerhaeuser as compared with similar operations of Canadian competitors.
WEYERHAEUSER COMPANY >
2016 ANNUAL REPORT AND FORM 10-K
19
FOREST CERTIFICATION STANDARDS
We operate in North America under the Sustainable Forestry Initiative
(SFI
®
). This is a certification standard designed to supplement government regulatory programs with voluntary landowner initiatives to further protect certain public resources and values. SFI
®
is an independent standard, overseen by a governing board consisting of:
|
•
|
conservation organizations,
|
|
•
|
academia,
|
|
•
|
the forest industry and
|
|
•
|
large and small forest landowners.
|
Ongoing compliance with SFI
®
may result in some increases in our operating costs and curtailment of our timber harvests in some areas. There also is competition from other private certification systems, primarily the Forest Stewardship Council (FSC), coupled with efforts by supporters to further those systems by persuading customers of forest products to require products certified to their preferred system. Certain features of the FSC system could impose additional operating costs on timberland management. Because of the considerable variation in FSC standards, and variability in how those standards are interpreted and applied, if sufficient marketplace demand develops for products made from raw materials sourced from other than SFI-certified forests, we could incur substantial additional costs for operations and be required to reduce harvest levels.
WHAT THESE REGULATIONS AND CERTIFICATION PROGRAMS MEAN TO US
The regulatory and non-regulatory forest management programs described above have:
|
•
|
increased our operating costs;
|
|
•
|
resulted in changes in the value of timber and logs from our timberlands;
|
|
•
|
contributed to increases in the prices paid for wood products and wood chips during periods of high demand;
|
|
•
|
sometimes made it more difficult for us to respond to rapid changes in markets, extreme weather or other unexpected circumstances; and
|
|
•
|
potentially encouraged further reductions in the use of, or substitution of other products for, lumber, oriented strand board, and plywood.
|
We believe that these kinds of programs have not had, and in
2017
will not have, a significant effect on our total harvest of timber in the United States or Canada. However, these kinds of programs may have such an effect in the future. We expect we will not be disproportionately affected by these programs as compared with typical owners of comparable timberlands. We also expect that these programs will not significantly disrupt our planned operations over large areas or for extended periods.
CANADIAN ABORIGINAL RIGHTS
Many of the Canadian timberlands are subject to the constitutionally protected treaty or common-law rights of aboriginal peoples of Canada. Most of British Columbia (B.C.) is not covered by treaties, and as a result the claims of B.C.’s aboriginal peoples relating to forest resources have been largely unresolved. On June 26, 2014 the Supreme Court of Canada ruled that the Tsilhqot’in Nation holds aboriginal title to approximately 1,900 square kilometers in B.C. This was the first time that the court has declared title to exist based on historical occupation by aboriginal peoples. Many aboriginal groups continue to be engaged in treaty discussions with the governments of B.C., other provinces and Canada.
Final or interim resolution of claims brought by aboriginal groups can be expected to result in:
|
•
|
additional restrictions on the sale or harvest of timber,
|
|
•
|
potential increase in operating costs and
|
|
•
|
impact to timber supply and prices in Canada.
|
We believe that such claims will not have a significant effect on our total harvest of timber or production of forest products in
2017
, although they may have such an effect in the future. In 2008, FPAC, of which we are a member, signed a Memorandum of Understanding with the Assembly of First Nations, under which the parties agree to work together to strengthen Canada
’
s forest sector through economic-development initiatives and business investments, strong environmental stewardship and the creation of skill-development opportunities particularly targeted to aboriginal youth.
POLLUTION-CONTROL REGULATIONS
Our operations are subject to various laws and regulations, including:
|
•
|
federal,
|
|
•
|
state,
|
|
•
|
provincial and
|
|
•
|
local pollution controls.
|
These laws and regulations, as well as market demands, impose controls with regard to:
|
•
|
air, water and land;
|
|
•
|
solid and hazardous waste management;
|
|
•
|
waste disposal;
|
|
•
|
remediation of contaminated sites; and
|
|
•
|
the chemical content of some of our products.
|
Compliance with these laws, regulations and demands usually involves capital expenditures as well as additional operating costs. We cannot easily quantify the future amounts of capital expenditures we might have to make to comply with these laws, regulations and demands or the effects on our operating costs because in some instances compliance standards have not been developed or have not become final or definitive. In addition, it is difficult to isolate the environmental component of most manufacturing capital projects.
WEYERHAEUSER COMPANY >
2016 ANNUAL REPORT AND FORM 10-K
20
Our capital projects typically are designed to:
|
•
|
enhance safety,
|
|
•
|
extend the life of a facility,
|
|
•
|
increase capacity,
|
|
•
|
increase efficiency,
|
|
•
|
facilitate raw material changes and handling requirements,
|
|
•
|
increase the economic value of assets or products, and
|
|
•
|
comply with regulatory standards.
|
ENVIRONMENTAL CLEANUP
We are involved in the environmental investigation or remediation of numerous sites. Of these sites:
|
•
|
we may have the sole obligation to remediate,
|
|
•
|
we may share that obligation with one or more parties,
|
|
•
|
several parties may have joint and several obligations to remediate or
|
|
•
|
we may have been named as a potentially responsible party for sites designated as U
.
S
.
Superfund sites.
|
Our liability with respect to these various sites ranges from insignificant to substantial. The amount of liability depends on:
|
•
|
the quantity, toxicity and nature of materials at the site; and
|
|
•
|
the number and economic viability of the other responsible parties.
|
We spent approximately
$10 million
in
2016
and expect to spend approximately $10 million in
2017
on environmental remediation of these sites.
It is our policy to accrue for environmental-remediation costs when we:
|
•
|
determine it is probable that such an obligation exists and
|
|
•
|
can reasonably estimate the amount of the obligation.
|
We currently believe it is reasonably possible that our costs to remediate all the identified sites may exceed our current accruals of
$34 million
. The excess amounts required may be insignificant or could range, in the aggregate, up to
$110 million
over several years. This estimate of the upper end of the range of reasonably possible additional costs is much less certain than the estimates we currently are using to determine how much to accrue. The estimate of the upper range also uses assumptions less favorable to us among the range of reasonably possible outcomes.
REGULATION OF AIR EMISSIONS IN THE U.S.
The United States Environmental Protection Agency (EPA) has promulgated regulations for air emissions from:
|
•
|
wood products facilities and
|
|
•
|
industrial boilers.
|
These regulations cover:
|
•
|
hazardous air pollutants that require use of maximum achievable control technology (MACT); and
|
|
•
|
controls for pollutants that contribute to smog, haze and more recently, greenhouse gases.
|
Between 2011 and 2015 EPA issued three related portions of new MACT standards for industrial boilers and process heaters. In July 2016, a court decision was issued that remains unsettled at this time, but which will cause certain of the emissions standards to be re-issued. Some of these re-issued emissions standards will be applicable to a small number of our wood products mills. Because the court decision remains unsettled and because we do not know how or when the EPA will implement the final court decision, we cannot predict whether or when the emission standard revisions may have a material impact on regulatory compliance costs at our mills. We do not expect any material expenditures in 2017 to comply with MACT standards.
The EPA must still promulgate supplemental MACT standards for plywood, lumber and composite wood products facilities. The EPA is expected to collect information for these future rulemakings in 2017.
We cannot currently quantify the amount of capital we will need in the future to comply with new regulations being developed by the EPA because final rules have not been promulgated.
In 2010 EPA issued a final greenhouse gas rule limiting the growth of emissions from new projects meeting certain thresholds. On June 23, 2014, the US Supreme Court issued a decision that removed potential applicability of the underlying 2010 regulations based solely on greenhouse gas emissions and limited application of the rule’s technology requirements to larger emission sources as a result of new emissions from non-greenhouse gas pollutants. As a result of this Supreme Court ruling, EPA is expected to issue new regulations to set thresholds for when the greenhouse gas technology requirements apply if the non-greenhouse gas emissions trigger the rule in the first instance. The impact of the Supreme Court ruling is to end the potential applicability of the technology requirements for our smaller manufacturing operations and limit the applicability for our other operations.
In 2015 EPA issued an extensive regulatory program for new and existing electric utility generating units to scale back emissions of greenhouse gas carbon dioxide (CO2) arising from fossil fuel use to generate electricity. EPA also proposed additional regulations related to how states and federal agencies may implement the requirements finalized in 2015. This regulatory program potentially will have indirect impacts on our operations, such as from rising purchased electricity prices or from mandated energy demand reductions that could apply to our mills and other facilities that we operate. We are evaluating the regulations and additional proposals but are not able to predict whether the regulations, when complete and implemented, will have a material impact on our operations.
We use significant biomass for energy production at our mills. EPA is currently working on rules regarding regulation of biomass emissions.
The impact of these greenhouse gas and biomass rules, as well as recent court decisions, on our operations remains uncertain.
To address concerns about greenhouse gases as a pollutant, we:
|
•
|
closely monitor legislative, regulatory and scientific developments pertaining to climate change;
|
|
•
|
adopted in 2006, as part of the company's sustainability program, a goal of reducing greenhouse gas emissions by 40 percent by 2020 compared with our emissions in 2000, assuming a comparable portfolio and regulations;
|
WEYERHAEUSER COMPANY >
2016 ANNUAL REPORT AND FORM 10-K
21
|
•
|
determined to achieve this goal by increasing energy efficiency and using more greenhouse gas-neutral, biomass fuels instead of fossil fuels; and
|
|
•
|
reduced greenhouse gas emissions by approximately 25 percent considering changes in the asset portfolio according to 2014 data, compared to our 2000 baseline.
|
Additional factors that could affect greenhouse gas emissions in the future include:
|
•
|
policy proposals by federal or state governments regarding regulation of greenhouse gas emissions,
|
|
•
|
Congressional legislation regulating greenhouse gas emissions within the next several years and
|
|
•
|
establishment of a multistate or federal greenhouse gas emissions reduction trading systems with potentially significant implications for all U.S. businesses.
|
We believe these developments have not had, and in
2017
will not have, a significant effect on our operations. Although these measures could have a material adverse effect on our operations in the future, we expect that we will not be disproportionately affected by these measures as compared with owners of comparable operations. We maintain an active forestry research program to track and understand any potential effect from actual climate change related parameters that could affect the forests we own and manage and do not anticipate any disruptions to our planned operations.
REGULATION OF AIR EMISSIONS IN CANADA
In addition to existing provincial air quality regulations, the Canadian federal government has proposed an air quality management system (AQMS) as a comprehensive national approach for improving air quality in Canada. The federal proposed AQMS includes:
|
•
|
ambient air quality standards for outdoor air quality management across the country,
|
|
•
|
a framework for air zone air management within provinces and territories that targets specific sources of air emissions,
|
|
•
|
regional airsheds that facilitate coordinated action across borders,
|
|
•
|
industrial sector based emission requirements that set a national base level of performance for major industries in Canada and
|
|
•
|
improved intergovernmental collaboration to reduce emissions from the transportation sector.
|
In 2016, Environment Canada released the Pan-Canadian Framework on Clean Growth and Climate Change, a "Greenhouse Gas Emission Framework." The framework put in place a national, sector-based greenhouse gas reduction program applicable to a number of industries.
All Canadian provincial governments:
|
•
|
have greenhouse gas reporting requirements
,
|
|
•
|
are working on reduction strategies and
|
|
•
|
together with the Canadian federal government, are considering new or revised emission standards.
|
In addition, British Columbia has adopted a carbon tax and Alberta has a mandatory greenhouse gas emission reduction regulation.
We believe these measures have not had, and in
2017
will not have, a significant effect on our operations. Although these measures could have a material adverse effect on our operations in the future, we expect that we will not be disproportionately affected by these measures as compared with owners of comparable operations. We also expect that these measures will not significantly disrupt our planned operations.
REGULATION OF AIR EMISSIONS IN URUGUAY
Some provinces in Uruguay have established air quality monitoring networks and ambient air objectives have been proposed for the region where our Los Piques mill is located.
We believe these measures have not had, and in
2017
will not have, a significant effect on our operations. Although these measures could have a material adverse effect on our operations in the future, we expect that we will not be disproportionately affected by these measures as compared with owners of comparable operations. We also expect that these measures will not significantly disrupt our planned operations
.
REGULATION OF WATER
In the U.S., as a result of litigation under the federal Clean Water Act, additional federal or state permits are now required in some states for the application of pesticides, including herbicides, on timberlands. Those permits have entailed payment of additional costs. In addition, there is continuing litigation in the federal courts that may result in permit requirements for pollution discharges from forest roads and other drainage features on timberland, which would entail additional costs for forest landowners including Weyerhaeuser. Finally, federal regulatory agencies adopted rules in 2015 that potentially expand the definition of waters subject to federal Clean Water Act jurisdiction, which could increase the scope and number of permits required for forestry-related activities and entail additional costs for Weyerhaeuser and other forest landowners in the U.S. Those rules have been challenged in federal court by multiple parties and states and an injunction has been entered that prevents them from going into effect. We are not able to predict the ultimate resolution of these pending legal actions.
In 2016, Washington State Department of Ecology (WA DOE) adopted human health-based water quality criteria. The EPA subsequently promulgated its own water quality standards for Washington state for the protection of human health for certain pollutants. It is unclear what effect, if any, these rules will have on our manufacturing operations in Washington state.
In 2016, the EPA finalized new and revised federal Clean Water Act water quality standards and human health criteria that would apply to waters under the state of Maine's jurisdiction.
In addition:
|
•
|
In 2013, amendments to the Canadian Federal Fisheries Act came into force. These amendments change the focus from habitat protection to fisheries protection and increase penalties. We expect further changes to these regulations subsequent to review and regulatory consultations that took place in 2016, but we cannot predict the scope or potential impact, if any, on our operations.
|
|
•
|
Uruguay's national policy for water includes regulation of river basin planning, management and water use permits. Wastewater discharge authorization is required for industry, including our Los Piques mill.
|
WEYERHAEUSER COMPANY >
2016 ANNUAL REPORT AND FORM 10-K
22
We believe the above developments have not had, and in
2017
will not have, a significant effect on our operations. Although these measures could have a material adverse effect on our operations in the future, we expect that we will not be disproportionately affected by these measures as compared with owners of comparable operations. We also expect that these measures will not significantly disrupt our planned operations.
POTENTIAL CHANGES IN POLLUTION REGULATION
State governments continue to promulgate total maximum daily load (TMDL) requirements for pollutants in water bodies that do not meet state or EPA water quality standards. State TMDL requirements may:
|
•
|
set limits on pollutants that may be discharged to a body of water; or
|
|
•
|
set additional requirements, such as best management practices for nonpoint sources, including timberland operations, to reduce the amounts of pollutants.
|
It is not possible to estimate the capital expenditures that may be required for us to meet pollution allocations across the various proposed state TMDL programs until a specific TMDL is promulgated.
In Canada, various levels of government have been working to address water issues including use, quality and management. Recent areas of focus include water allocation, regional watershed protection, protection of drinking water, water pricing and a national water quality index.
WEYERHAEUSER COMPANY >
2016 ANNUAL REPORT AND FORM 10-K
23
|
FORWARD-LOOKING STATEMENTS
|
This report contains statements concerning our future results and performance that are forward-looking statements within the meaning of the Private Securities Litigation Reform Act of 1995. These statements:
|
•
|
are based on various assumptions we make and
|
|
•
|
may not be accurate because of risks and uncertainties surrounding the assumptions we make.
|
These statements reflect our current views with respect to future events. Factors listed in this section, factors discussed under "
Risk Factors
" and "
Management's Discussion and Analysis of Financial Condition and Results of Operations
" in this report, and other factors not included, may cause our actual results to differ significantly from our forward-looking statements. There is no guarantee that any of the events anticipated by our forward-looking statements will occur. Or if any of the events occur, there is no guarantee what effect it will have on our operations, cash flows, or financial condition.
We undertake no obligation to update our forward-looking statements after the date of this report.
FORWARD-LOOKING TERMINOLOGY
Forward-looking statements can be identified by the fact that they do not relate strictly to historical or current facts. They often use words such as expects, may, should, will, believes, anticipates, estimates, projects, intends, plans, targets or approximately, or similar words. They may use the positive, negative or another variation of those and similar words.
STATEMENTS
In this report we make forward-looking statements concerning our plans, strategies, intentions and expectations, including with respect to our strategic corporate initiatives; operational excellence initiatives, including costs and product development and production; estimated taxes and tax rates; future debt payments; future dividends; future restructuring charges; expected results of litigation and the sufficiency of litigation reserves; expected uses of cash, including share repurchases; expected capital expenditures; expected economic conditions, including markets, pricing and demand for our products; laws and regulations relevant to our businesses; and our expectations relating to pension contributions and benefit payments.
RISKS, UNCERTAINTIES AND ASSUMPTIONS
Major risks and uncertainties, and assumptions that we make, that affect our business and may cause actual results to differ materially from the content of these forward-looking statements include, but are not limited to:
|
•
|
the effect of general economic conditions, including employment rates, interest rates, housing starts, general availability of financing for home mortgages and the relative strength of the U.S. dollar;
|
|
•
|
market demand for the company's products, including market demand for our timberland properties with higher and better uses, which is related to, among other factors, the strength of the various U.S. business segments and U.S. and international economic conditions;
|
|
•
|
performance of our manufacturing operations, including maintenance requirements;
|
|
•
|
potential disruptions in our manufacturing operations;
|
|
•
|
level of competition from domestic and foreign producers;
|
|
•
|
our ability to successfully realize the expected benefits from the merger with Plum Creek;
|
|
•
|
the results of our strategic alternatives review of our operations in Uruguay;
|
|
•
|
the successful execution of our internal plans and strategic initiatives, including restructurings and cost reduction initiatives;
|
|
•
|
raw material availability and prices;
|
|
•
|
the effect of weather;
|
|
•
|
the risk of loss from fires, floods, windstorms, hurricanes, pest infestations and other natural disasters;
|
|
•
|
energy prices;
|
|
•
|
transportation and labor availability and costs;
|
|
•
|
federal tax policies;
|
|
•
|
the effect of forestry, land use, environmental and other governmental regulations;
|
|
•
|
legal proceedings;
|
|
•
|
performance of pension fund investments and related derivatives;
|
|
•
|
the effect of timing of retirements and changes in the market price of our common stock on charges for share-based compensation;
|
|
•
|
changes in accounting principles;
|
|
•
|
changes in implementation of acquisition accounting; and
|
|
•
|
other factors described under Risk Factors.
|
We are also a large exporter, and our business is thus affected by:
|
•
|
economic activity in Asia, especially Japan and China;
|
|
•
|
currency exchange rates, particularly the relative value of the U.S. dollar to the euro and the Canadian dollar, and the relative value of the euro to the yen; and
|
|
•
|
restrictions on international trade, tariffs imposed on imports and the availability and cost of shipping and transportation.
|
WEYERHAEUSER COMPANY >
2016 ANNUAL REPORT AND FORM 10-K
24
RISK FACTORS
We are subject to various risks and events that could adversely affect our business, our financial condition, our results of operations, our cash flows and the price of our common stock.
You should consider the following risk factors, in addition to the information presented elsewhere in this report, particularly in "
Our Business - Who We Are
", "
Our Business - What We Do
", "
Our Business - Natural Resources and Environmental Matters
", “
Forward-Looking Statements
” and "
Management's Discussion and Analysis of Financial Condition and Results of Operations
" as well as in the filings we make from time to time with the SEC, in evaluating us, our business and an investment in our securities.
The risks discussed below are not the only risks we face. Additional risks not currently known to us or that we currently deem immaterial also may adversely affect our business.
|
RISKS RELATED TO OUR INDUSTRIES AND BUSINESS
|
MACROECONOMIC CONDITIONS
The industries in which we operate are sensitive to macroeconomic conditions and consequently are highly cyclical.
The overall levels of demand for the products we manufacture and distribute reflect fluctuations in levels of end-user demand, which consequently impact our sales and profitability. End-user demand depends in part on general macroeconomic conditions, both in the U.S. and globally, as well as on local economic conditions. Current economic conditions in the United States reflect growth at or below historical trends and general business uncertainty. Global economic conditions reflect issues such as inflation and slowing growth in emerging countries. The construction and homebuilding industries continue to recover from the severe downturn caused by the overall collapse of credit markets and recession of 2009. However, construction activity remains below pre-recession and trend levels. Our Wood Products segment is highly dependent on the strength of the homebuilding industry. The decline in home construction activity due to the recession resulted in depressed prices of and reduced demand for wood products and building materials. This resulted in lower prices and demand for logs and reduced harvests in our Timberlands segment. The length and magnitude of industry cycles vary over time and by product, but generally reflect changes in macroeconomic conditions and levels of industry capacity. Those conditions have improved since the recession, but if macroeconomic conditions do not continue to improve we could experience lower sales volume and smaller margins.
COMMODITY PRODUCTS
Many of our products are commodities that are widely available from other producers.
Because commodity products have few distinguishing properties from producer to producer, competition for these products is based primarily on price, which is determined by supply relative to demand and competition from substitute products. In addition, prices for our products are affected by many other factors outside of our control. As a result, we have little influence over the timing and extent of price changes, which often are volatile. Our profitability with respect to these products depends, in part, on managing our costs, particularly raw material and energy costs, which represent significant components of our operating costs and can fluctuate based upon factors beyond our control. Both sales and profitability of our products are subject to volatility due to market forces beyond our control.
INDUSTRY SUPPLY OF LOGS AND WOOD PRODUCTS
Excess supply of logs and wood products may adversely affect prices and margins.
Our industry may increase harvest levels, which could lead to an oversupply of logs. Wood products producers may likewise expand manufacturing capacity, which could lead to an oversupply of manufactured wood products. Any occurrence, continuation or increase of industry oversupply to our markets could adversely affect our prices and margins.
HOMEBUILDING MARKET AND ECONOMIC RISKS
High unemployment, low demand and low levels of consumer confidence can adversely affect our business and results of operations.
Our business is dependent upon the health of the U.S. housing market. Demand for homes is sensitive to changes in economic conditions such as the level of employment, consumer confidence, consumer income, the availability of financing and interest rate levels. The legacy of the housing bubble, its collapse and ensuing credit crisis was tightened credit requirements and a reduced number of mortgage loans available for financing home purchases. Although credit conditions have eased, they remain more restrictive than prior to the housing bubble. Demand for new homes also has been adversely affected by factors such as limited wage growth and weak consumer confidence. Additionally, rising student loan debt among younger adults is limiting access to mortgage financing and home ownership. Foreclosure rates and distress sales of houses, have fallen significantly and are less of an impact compared to the years immediately following the housing collapse.
Homebuyers’ ability to qualify for and obtain affordable mortgages could be affected by changes in interest rates, government sponsored entities and private mortgage insurance companies supporting the mortgage market.
Access to affordable mortgage financing is critical to the health of the U.S. housing market. Recently, the U.S. Federal Reserve increased its benchmark interest rate, and further increases are expected in 2017. Generally, increases in interest rates make mortgage financing more difficult for home buyers to obtain, which could negatively affect demand for housing and, in turn, for our products.
Another significant role of the federal government in supporting mortgage lending has been through its sponsorship of Fannie Mae and Freddie Mac. As a result of turbulence in credit markets and the mortgage finance industry in the last few years, the effect of the federal government
’
s conservatorship of these government sponsored entities on the short-term and long-term demand for new housing remains unclear.
The liquidity provided to the mortgage industry by Fannie Mae and Freddie Mac, both of which purchase home mortgages and mortgage-backed securities originated by mortgage lenders, has been critical to the housing market. However, there have been questions and concerns about the future purpose of Fannie Mae and Freddie Mac, and a number of proposals to curtail their activities over time are under review. Limitations or restrictions on the availability of financing by these entities could also adversely affect interest rates and the availability of mortgage financing.
WEYERHAEUSER COMPANY >
2016 ANNUAL REPORT AND FORM 10-K
25
Whether resulting from direct increases in borrowing rates or reduced federal support of the mortgage lending industry, a challenging mortgage financing environment could reduce demand for housing and, therefore, adversely affect demand for our products.
Changes in regulations relating to tax deductions for mortgage interest expense and real estate taxes could harm our future sales and earnings.
Significant costs of homeownership include mortgage interest expense and real estate taxes, both of which are generally deductible for an individual
’
s federal and, in some cases, state income taxes. Any changes to income tax laws by the federal government or a state government to eliminate or substantially reduce these income tax deductions, as has been considered from time to time, would increase the after-tax cost of owning a home. Increases in real estate taxes by local governmental authorities would also increase the cost of homeownership. Any such increases to the cost of homeownership could adversely affect the demand for our products.
CAPITAL MARKETS
Deterioration in economic conditions and the credit markets could adversely affect our access to capital.
Challenging financial or credit market conditions can impair the company
’
s ability to borrow money or otherwise access credit markets on terms acceptable to us, which may, among other impacts, reduce our ability to take advantage of growth and expansion opportunities. Similarly, our customers may be unable to borrow money to fund their operations. Similarly, deteriorating or volatile market conditions could have an adverse effect on our customers and suppliers and their ability to purchase our products or sell products to us.
CHANGES IN CREDIT RATINGS
Changes in credit ratings issued by nationally recognized rating organizations could adversely affect our cost of financing and have an adverse effect on the market price of our securities.
Credit rating agencies rate our debt securities on factors that include our operating results and balance sheet, actions that we take, their view of the general outlook for our industry and their view of the general outlook for the economy. Actions taken by the rating agencies can include maintaining, upgrading or downgrading the current rating or placing the company on a watch list for possible future ratings actions. Downgrading the credit rating of our debt securities or placing us on a watch list for possible future downgrading could limit our access to the credit markets, increase our cost of financing, and have an adverse effect on the market price of our securities.
SUBSTITUTION
Some of our products are vulnerable to declines in demand due to competing technologies or materials.
Our products may compete with non-fiber based alternatives or with alternative products in certain market segments. For example, plastic, wood/plastic or composite materials may be used by builders as alternatives to the products produced by our Wood Products businesses such as lumber, veneer, plywood and oriented strand board. Changes in prices for oil, chemicals and wood-based fiber can change the competitive position of our products relative to available alternatives and could increase substitution of those products for our products. If use of these alternative products grows, demand for and pricing of our products could be adversely affected.
CHANGES IN PRODUCT MIX OR PRICING
Our results of operations and financial condition could be materially adversely affected by changes in product mix or pricing.
Our results may be adversely affected by a change in our product mix or pricing. If we are not successful in implementing previously announced or future price increases, or in our plans to increase sales of higher-priced, higher-value products, or if there are delays in acceptance of price increases or failure of customers to accept higher-priced products, our results of operations and financial condition could be materially and adversely affected. Price discounting, if required to maintain our competitive position, could result in lower than anticipated price realizations and margins.
INTENSE COMPETITION
We face intense competition in our markets, and the failure to compete effectively could have a material adverse effect on our business, financial condition and results of operations.
We compete with North American producers and, for some of our product lines, global producers, some of which may have greater financial resources and lower production costs than we do. The principal basis for competition for many of our products is selling price. Our ability to maintain satisfactory margins depends in large part on our ability to control our costs. Our industries also are particularly sensitive to other factors including innovation, design, quality and service, with varying emphasis on these factors depending on the product line. To the extent that one or more of our competitors become more successful with respect to any key competitive factor, our ability to attract and retain customers could be materially adversely affected. If we are unable to compete effectively, such failure could have a material adverse effect on our business, financial condition and results of operations.
Expiration of the Softwood Lumber Agreement creates uncertainty about competition from Canadian imports
.
Historically, Canada has been a significant source of lumber for the U.S. market, particularly in the new home construction market. We produce lumber in our Canadian mills, but the bulk of our production is in the U.S. The Softwood Lumber Agreement (SLA) between Canada and the U.S., originally signed in October 2006, expired in October 2015. The 2006 SLA required Canadian softwood lumber facilities, including our mills, to pay an export tax when the price of lumber is at or below a threshold price. We are not able to predict when or if a new agreement will be reached or, if reached, what the terms of the agreement would be. We could experience downward pressure on timber and lumber prices caused by Canadian lumber imports.
Another emerging form of competition is between brands of sustainably produced products; customer demand for certain brands could reduce competition among buyers for our products or cause other adverse effects.
In North America, our forests are third party-certified to the Sustainable Forestry Initiative (SFI
®
) standard. Some of our customers have expressed a preference in certain of our product lines for products made from raw materials sourced from forests certified to different standards, including standards of the Forest Stewardship Council (FSC). If and to the extent that preference for a standard other than SFI
®
becomes a
WEYERHAEUSER COMPANY >
2016 ANNUAL REPORT AND FORM 10-K
26
customer requirement, there may be reduced demand and lower prices for our products relative to competitors who can supply products sourced from forests certified to competing certification standards. If we seek to comply with such other standards, we could incur materially increased costs for our operations or be required to modify our operations, such as reducing harvest levels. FSC, in particular, employs standards that are geographically variable and could cause a material reduction in the harvest levels of some of our timberlands, most notably in the Pacific Northwest.
MATERIAL DISRUPTION OF MANUFACTURING
A material disruption at one of our manufacturing facilities could prevent us from meeting customer demand, reduce our sales or negatively affect our results of operation and financial condition.
Any of our manufacturing facilities, or any of our machines within an otherwise operational facility, could cease operations unexpectedly due to a number of events, including:
|
•
|
unscheduled maintenance outages;
|
|
•
|
prolonged power failures;
|
|
•
|
equipment failure;
|
|
•
|
a chemical spill or release;
|
|
•
|
explosion of a boiler;
|
|
•
|
fires, floods, windstorms, earthquakes, hurricanes or other severe weather conditions or catastrophes, affecting the production of goods or the supply of raw materials (including fiber);
|
|
•
|
the effect of drought or reduced rainfall on water supply;
|
|
•
|
labor difficulties;
|
|
•
|
disruptions in transportation infrastructure, including roads, bridges, rail, tunnels, shipping and port facilities;
|
|
•
|
terrorism or threats of terrorism;
|
|
•
|
governmental regulations; and
|
|
•
|
other operational problems.
|
Any such downtime or facility damage could prevent us from meeting customer demand for our products or require us to make unplanned capital expenditures. If one of our facilities or machines were to incur significant downtime, our ability to meet our production targets and satisfy customer requirements could be impaired, resulting in lower sales and income. Although some risks are not insurable and some coverage is limited, we purchase insurance protecting our manufacturing facilities from fires, floods, windstorms, earthquakes, equipment failures and boiler explosions.
STRATEGIC INITIATIVES
Our business and financial results may be adversely affected if we are unable to successfully execute on important strategic initiatives.
There can be no assurance that we will be able to successfully implement important strategic initiatives in accordance with our expectations, which may result in an adverse impact on our business and financial results. These strategic initiatives are designed to improve our results of operations and drive long-term shareholder value, and include, among others: optimizing cash flow through operational excellence; reducing costs to achieve industry-leading cost structure; and innovating in higher-margin products
.
We may be unsuccessful in carrying out our acquisition strategy.
We intend to strategically pursue acquisitions of timberland properties when market conditions warrant. As with any investment, our acquisitions may not perform in accordance with our expectations. In addition, we anticipate financing such acquisitions through cash from operations, borrowings under our unsecured credit facilities, proceeds from equity or debt offerings or proceeds from asset dispositions, or any combination thereof. Our inability to finance future acquisitions on favorable terms could adversely affect our results of operations.
Strategic Review of our Uruguay Operations.
On October 12, 2016, we announced that our board of directors authorized the exploration of strategic alternatives for our Uruguay timberlands and manufacturing businesses, including options to continue to hold and operate, or sell, the business. If a sale is pursued, there can be no assurance that an agreement with a third-party purchaser for the business will be reached, and if any such an agreement is reached, there can be no assurance that it will be on terms favorable to us or that the transactions contemplated by such an agreement will be consummated.
CAPITAL REQUIREMENTS
Our operations require substantial capital.
Our businesses require substantial capital for expansion and for repair or replacement of existing facilities or equipment. Although we maintain our production equipment with regular scheduled maintenance, key pieces of equipment may need to be repaired or replaced periodically. The costs of repairing or replacing such equipment and the associated downtime of the affected production line could have a material adverse effect on our financial condition, results of operations and cash flows.
While we believe our capital resources will be adequate to meet our current projected operating needs, capital expenditures and other cash requirements, if for any reason we are unable to provide for our operating needs, capital expenditures and other cash requirements on acceptable economic terms, we could experience a material adverse effect on our business, financial condition, results of operations and cash flows.
ENVIRONMENTAL LAWS AND REGULATIONS
We could incur substantial costs as a result of compliance with, violations of, or liabilities under applicable environmental laws and other laws and regulations.
We are subject to a wide range of general and industry-specific laws and regulations relating to the protection of the environment, including those governing:
WEYERHAEUSER COMPANY >
2016 ANNUAL REPORT AND FORM 10-K
27
|
•
|
air emissions,
|
|
•
|
wastewater discharges,
|
|
•
|
harvesting and other silvicultural activities,
|
|
•
|
forestry operations and endangered species habitat protection,
|
|
•
|
surface water management,
|
|
•
|
the storage, management and disposal of hazardous substances and wastes,
|
|
•
|
the cleanup of contaminated sites,
|
|
•
|
landfill operation and closure obligations,
|
|
•
|
building codes, and
|
|
•
|
health and safety matters.
|
We have incurred, and we expect to continue to incur, significant capital, operating and other expenditures complying with applicable environmental laws and regulations and as a result of remedial obligations. We also could incur substantial costs, such as civil or criminal fines, sanctions and enforcement actions (including orders limiting our operations or requiring corrective measures, installation of pollution control equipment or other remedial actions), cleanup and closure costs, and third-party claims for property damage and personal injury as a result of violations of, or liabilities under, environmental laws and regulations.
As the owner and operator of real estate, we may be liable under environmental laws for cleanup, closure and other damages resulting from the presence and release of hazardous substances on or from our properties or operations. In addition, surface water management regulations may present liabilities and are subject to change. The amount and timing of environmental expenditures is difficult to predict, and in some cases, our liability may exceed forecasted amounts or the value of the property itself. The discovery of additional contamination or the imposition of additional cleanup obligations at our sites or third-party sites may result in significant additional costs.
We also lease some of our properties to third-party operators for the purpose of exploring, extracting, developing and producing oil, gas, rock and other minerals in exchange for fees and royalty payments. These activities are also subject to federal, state and local laws and regulations. These operations may create risk of environmental liabilities for any unlawful discharge of oil, gas or other chemicals into the air, soil or water. Generally, these third-party operators indemnify us against any such liability, and we require that that they maintain liability insurance during the term of our lease with them. However, if for any reason our third-party operators are not able to honor their indemnity obligation, or if the required liability insurance were not in effect, then it is possible that we could be responsible for costs associated with
environmental liability caused by such third-party operators.
Any material liability we incur as a result of activities conducted on our properties by us or by others with whom we have a business relationship could adversely affect our financial condition or preclude us from making capital expenditures that otherwise would benefit our business.
We also anticipate public policy developments at the state, federal and international level regarding climate change and energy access, security and competitiveness. We expect these developments to address emission of carbon dioxide, renewable energy and fuel standards, and the monetization of carbon. Compliance with regulations that implement new public policy in these areas might require significant expenditures. These developments may also include mandated changes to energy use and building codes which could affect our homebuilding practices. Enactment of new environmental laws or regulations or changes in existing laws or regulations, or the interpretation of these laws or regulations, might require significant expenditures. We also anticipate public policy developments at the state, federal and international level regarding taxes and a number of other areas that could require significant expenditures.
Changes in global or regional climate conditions and governmental response to such changes at the international, U.S. federal and state levels may affect our operations or our planned or future growth activities.
There continue to be numerous international, U.S. federal and state-level initiatives and proposals to address domestic and global climate issues. Within the U.S. and Canada, some of these proposals would (and have in some Canadian provinces) regulate and/or tax the production of carbon dioxide and other greenhouse gases to facilitate the reduction of carbon compound emissions into the atmosphere and provide tax and other incentives to produce and use cleaner energy. Climate change impacts, if they occur, and governmental initiatives, laws and regulations to address potential climate concerns, could increase our costs and have a long-term adverse impact on our businesses and results of operations. Future legislation or regulatory activity in this area remains uncertain, and its impact on our operations is unclear at this time. However, it is possible that legislation or government mandates, standards or regulations intended to mitigate or reduce carbon compound or greenhouse gas emissions or other climate change impacts could adversely affect our operations. For example, such activities could limit harvest levels or result in significantly higher costs for energy and other raw materials. Because our manufacturing operations depend upon significant amounts of energy and raw materials, these initiatives could have an adverse impact on our results of operations and profitability.
CURRENCY EXCHANGE RATES
We will be affected by changes in currency exchange rates.
We have manufacturing operations in Canada and Uruguay. We are also an exporter and compete with global producers of products very similar to ours. Therefore, we are affected by changes in the strength of the U.S. dollar, particularly relative to the Canadian dollar, euro and yen, and the strength of the euro relative to the yen. Changes in exchange rates could materially and adversely affect our sales volume, margins and results of operations.
AVAILABILITY OF RAW MATERIALS AND ENERGY
Our business and operations could be materially adversely affected by changes in the cost or availability of raw materials and energy.
We rely heavily on certain raw materials (principally wood fiber and chemicals) and energy sources (principally natural gas, electricity and fuel oil) in our manufacturing processes. Our ability to increase earnings has been, and will continue to be, affected by changes in the costs and availability of such raw materials and energy sources. We may not be able to fully offset the effects of higher raw material or energy costs through hedging arrangements, price increases, productivity improvements or cost-reduction programs.
WEYERHAEUSER COMPANY >
2016 ANNUAL REPORT AND FORM 10-K
28
PEOPLE
Our business is dependent upon attracting, retaining and developing key personnel.
We believe that our success depends, to a significant extent, upon our ability to attract, retain and develop key senior management and operations management personnel. Our failure to recruit, retain, and develop key personnel could adversely affect our financial condition or results of operations.
TRANSPORTATION
We depend on third parties for transportation services and increases in costs and disruptions in the availability of transportation could materially adversely affect our business and operations.
Our business depends on the transportation of a large number of products, both domestically and internationally. We rely primarily on third parties for transportation of the products we manufacture or distribute as well as delivery of our raw materials. A significant portion of the goods we manufacture and raw materials we use are transported by marine, rail and truck, each of which is highly regulated. In addition, each has historically been subject to periodic disruption due to labor issues.
If any of our third-party transportation providers were to fail to deliver the goods we manufacture or distribute in a timely manner, we may be unable to sell those products at full value, or at all. Similarly, if any of these providers were to fail to deliver raw materials to us in a timely manner, we may be unable to manufacture our products in response to customer demand. In addition, if any of these third parties were to cease operations or cease doing business with us, we may be unable to replace them at reasonable cost. Our third-party transportation providers are also subject to events outside of their control, such as disruption of transportation infrastructure due to labor issues or natural disasters.
Any failure of a third-party transportation provider to deliver raw materials or finished products in a timely manner could harm our reputation, negatively affect our customer relationships and have a material adverse effect on our financial condition and results of operations.
In addition, an increase in transportation rates or fuel surcharges could materially adversely affect our sales and profitability.
REIT STATUS AND TAX IMPLICATIONS
If we fail to remain qualified as a REIT, our taxable income would be subject to tax at corporate rates and we would not be able to deduct dividends to shareholders.
In any taxable year in which we fail to qualify as a REIT, unless we are entitled to relief under the Internal Revenue Code:
|
•
|
We would not be allowed to deduct dividends to shareholders in computing our taxable income.
|
|
•
|
We would be subject to federal and state income tax on our taxable income at applicable corporate rates.
|
|
•
|
We also would be disqualified from treatment as a REIT for the four taxable years following the year during which we lost qualification.
|
Qualification as a REIT involves the application of highly technical and complex provisions of the Internal Revenue Code to our operations and the determination of various factual matters and circumstances not entirely within our control. There are only limited judicial or administrative interpretations of these provisions. Although we operate in a manner consistent with the REIT qualification rules, we cannot assure you that we are or will remain so qualified.
Certain of our business activities are subject to corporate-level income tax and potentially subject to prohibited transactions tax.
Under the Internal Revenue Code, REITs generally must engage in the ownership and management of income producing real estate. For the
company, this generally includes owning and managing a timberland portfolio for the production and sale of standing timber. Accordingly, the harvesting and sale of logs, the development or sale of certain timberlands and other real estate, and the manufacture and sale of wood products are conducted through one or more of our wholly-owned taxable REIT subsidiaries (TRSs) because such activities could generate non-qualifying REIT income and could constitute “prohibited transactions.” Prohibited transactions are defined by the Internal Revenue Code generally to be sales or other dispositions of property to customers in the ordinary course of a trade or business. By conducting our business in this manner we believe that we satisfy the REIT requirements of the Internal Revenue Code and are not subject to the 100 percent tax that could be imposed if a REIT were to conduct a prohibited transaction. The net income of our TRSs is subject to corporate-level income tax.
The extent of our use of our TRSs may affect the price of our common shares relative to the share price of other REITs.
We conduct a significant portion of our business activities through one or more TRSs. The use of our TRSs enables us to engage in non-REIT qualifying business activities such as the sale of logs, production and sale of wood products, and the development and sale of certain higher and better use (HBU) property. Our TRSs are subject to corporate-level income tax. Under the Code, no more than 25 percent (20 percent after December 31, 2017) of the value of the gross assets of a REIT may be represented by securities of one or more TRSs. This limitation may affect our ability to increase the size of our TRSs’ operations. Furthermore, our use of TRSs may cause the market to value our common shares differently than the shares of other REITs, which may not use TRSs as extensively as we use them.
We may be limited in our ability to fund distributions using cash generated through our TRSs.
The ability of the REIT to receive dividends from our TRSs is limited by the rules with which we must comply to maintain our status as a REIT. In particular, at least 75 percent of gross income for each taxable year as a REIT must be derived from real estate sources including sales of our standing timber and other types of qualifying real estate income and no more than 25 percent of our gross income may consist of dividends from our TRSs and other non-real estate income.
This limitation on our ability to receive dividends from our TRSs may affect our ability to fund cash distributions to our shareholders using cash flows from our TRSs. The net income of our TRSs is not required to be distributed, and TRS income that is not distributed to the REIT will not be subject to the REIT income distribution requirement.
Our cash dividends are not guaranteed and may fluctuate.
Generally, REITs are required to distribute 90 percent of their ordinary taxable income and 95 percent of their net capital gains income. Capital gains may be retained by the REIT but would be subject to corporate income taxes. If capital gains are retained rather than distributed, our shareholders would be notified and they would be deemed to have received a taxable distribution, with a refundable credit for any federal income tax paid by the REIT. Accordingly, we believe that we are not required to distribute material amounts of cash since substantially all of our taxable income is treated as capital gains income. Our board of directors, in its sole discretion, determines the amount of quarterly dividends to be
WEYERHAEUSER COMPANY >
2016 ANNUAL REPORT AND FORM 10-K
29
provided to our shareholders based on consideration of a number of factors. These factors include, but are not limited to, our results of operations, cash flow and capital requirements, economic conditions, tax considerations, borrowing capacity and other factors, including debt covenant restrictions that may impose limitations on cash payments, future acquisitions and divestitures, harvest levels, changes in the price and demand for our products and general market demand for timberlands including those timberland properties that have higher and better uses. Consequently, our dividend levels may fluctuate.
Changes in tax laws or their interpretation could adversely affect our shareholders and our results of operations.
Federal and state tax laws are constantly under review by persons involved in the legislative process, the Internal Revenue Service, the United States Department of the Treasury, and state taxing authorities. Changes to tax laws could adversely affect our shareholders or increase our effective tax rates. We cannot predict with certainty whether, when, in what forms, or with what effective dates, the tax laws applicable to us or our shareholders may be changed.
LEGAL PROCEEDINGS
We are a party to a number of legal proceedings, and adverse judgments in certain legal proceedings could have a material adverse effect on our financial condition.
The costs and other effects of pending litigation and legal proceedings against us and, if any, related insurance recoveries cannot be determined with certainty. Although the disclosures in
Note 14: Legal Proceedings, Commitments and Contingencies
and
Note 19: Income Taxes
of
Notes to Consolidated Financial Statements
contain management
’
s current views of the effect such litigation and legal proceedings could have on our financial results, there can be no assurance that the outcome of such proceedings will be as expected.
It is possible that there could be adverse judgments against us in some or all major litigation against us and that we could be required to take a charge and make cash payments for all or a portion of any damage award. Any such charge or cash payment could materially and adversely affect our results of operations or cash flows for the quarter or year in which we record or pay it.
IMPORT/EXPORT TAXES AND DUTIES
We may be required to pay significant taxes on our exported products or countervailing and anti-dumping duties on our imported products.
We export logs and finished wood products to foreign markets, and our ability to do so profitably is affected by U.S. and foreign trade policy.
International trade disputes occur frequently and can be taken to an International Trade Court for resolution of unfair trade practices between countries. As an example, there have been many disputes and subsequent trade agreements regarding sales of softwood lumber between Canada and the United States. The Softwood Lumber Agreement (SLA) between Canada and the U.S., originally signed in October 2006, expired in October 2015, and a new agreement has not been reached. The SLA required Canadian softwood lumber facilities, including our mills, to pay an export tax when the price of lumber is at or below a threshold price, which could be as high as 22.5 percent if a province exceeds its total allotted export share, as well as potentially impose additional countervailing antidumping duties.
Additionally, the new U.S. administration might adopt international trade policy that could result in one or more of our foreign export market jurisdictions adopting responsive trade policy making it more difficult or costly for us to export our products in those countries.
We could therefore experience reduced revenues and margins in any of our businesses that is
adversely affected by international trade
tariffs
, duties, taxes, customs or dispute settlement terms
. To the extent such trade policies increase prices, they could also reduce the demand for our products and could have a material adverse effect on our business, financial results and financial condition, including facility closures or impairments of assets.
We cannot predict future trade policy or the terms of any settlements of international trade disputes and their impact on our business.
DISTRIBUTION OF WRECO SHARES
We could incur substantial U.S. federal tax liability if the WRECO transaction were found not to qualify as a tax-free “reorganization” or the distribution of WRECO shares to Weyerhaeuser shareholders were found not to qualify as a tax-free distribution.
In 2014, we closed the divestiture of our home building business, Weyerhaeuser Real Estate Company (WRECO), via a "Reverse Morris Trust" transaction pursuant to which a wholly
-
owned subsidiary of TRI Pointe Homes, Inc. (TRI Pointe) merged with and into WRECO, with WRECO surviving the merger and becoming a wholly
-
owned subsidiary of TRI Pointe. The Reverse Morris Trust transaction was structured to qualify as a tax-free reorganization and the associated distribution of WRECO shares to Weyerhaeuser shareholders as a tax-free distribution. If the transaction were determined not to qualify as a tax-free reorganization
,
or if the distribution does not qualify as a tax-free distribution, then Weyerhaeuser or its subsidiaries or Weyerhaeuser shareholders may be required to pay substantial U.S. federal income taxes.
If the transaction were determined not to qualify as a tax-free reorganization or the distribution not to qualify as a tax-free distribution, or if Weyerhaeuser were required to indemnify TRI Pointe and WRECO, such taxes and indemnification obligations could be substantial and could materially and adversely affect the company’s cash flows, financial condition and results of operations.
OUR MERGER WITH PLUM CREEK TIMBER COMPANY, INC.
The merger with Plum Creek involved substantial costs, and the combined company may be unable to successfully integrate the businesses of the two companies and realize the anticipated benefits of the merger
.
On February 19, 2016, Plum Creek Timber Company, Inc. merged with and into Weyerhaeuser Company, with Weyerhaeuser continuing as the surviving company. We have incurred substantial costs and expenses, and expect to incur additional costs and expenses relating to the integration of the businesses, policies, procedures, operations, employees, technologies and systems of Plum Creek with those of Weyerhaeuser. These expenses could, particularly in the near term, exceed the savings that we expect to achieve from the realization of economies of scale and cost savings and synergies related to the integration of the businesses, and could therefore result in additional charges against earnings, but the amount and timing of such charges are uncertain.
The merger involved the combination of two independently operated public companies, and will require management to devote significant attention and resources to integrating business practices and operations. The combined company may fail to realize some or all of the anticipated benefits of the merger if the integration process takes longer than expected or is more costly than expected.
WEYERHAEUSER COMPANY >
2016 ANNUAL REPORT AND FORM 10-K
30
We are dependent on the valuable experience and industry knowledge of our officers and other employees to execute our business plans and successfully conduct operations. Our success after the merger will depend in part upon our ability to retain key personnel. Current and prospective employees may feel uncertain about their roles following the merger, which may materially adversely affect our ability to attract and retain key personnel
.
The market price of our common stock may decline in the future as a result of the merger
.
The market price of our common stock may decline in the future as a result of the merger for a number of reasons, including our inability to successfully integrate the two companies or our failure to achieve the perceived benefits of the merger, including financial results, as rapidly as or to the extent anticipated by financial or industry analysts. Failure to successfully integrate the two companies could negatively impact our revenues, earnings and cash flows, and could materially adversely affect our ability to pay dividends at historical levels, or at all.
The combined company may incur adverse tax consequences if either Weyerhaeuser or Plum Creek has failed or fails to qualify as a REIT for U.S. federal income tax purposes
.
Each of Weyerhaeuser and Plum Creek has operated in a manner that it believes has allowed it to qualify as a REIT for U.S. federal income tax purposes under the Code. See “REIT Status and Tax Implications” above for a description of the REIT requirements and consequences of failing to maintain REIT status. We intend to operate in a manner that allows us to continue to qualify as a REIT after the merger. However, even if we have operated so as to retain our REIT status, if Plum Creek were to lose its REIT status for a taxable year before the merger or that includes the merger, we will face serious tax consequences that could substantially reduce cash available for distribution to our shareholders and significantly impair our ability to expand our business and raise capital. If the merger were determined not to qualify as a tax-free merger, we could incur substantial federal tax liability that could materially and adversely affect the company's cash flows, financial condition and results of operations.
TIMBERLAND SPECIFIC RISKS
Our ability to harvest and deliver timber may be subject to limitations which could adversely affect our results of operations.
Our primary assets are our timberlands. Weather conditions, timber growth cycles, access limitations, and availability of contract loggers and haulers may restrict our ability to harvest our timberlands. Other factors that may restrict our timber harvest include damage to our standing timber by fire or by insect infestation, disease, prolonged drought, flooding, severe weather and other natural disasters. Changes in global climate conditions could intensify one or more of these factors. Although damage from such causes usually is localized and affects only a limited percentage of standing timber, there can be no assurance that any damage affecting our timberlands will in fact be limited. As is common in the forest products industry, we do not maintain insurance coverage for damage to our timberlands. Our revenues, net income and cash flow from operations are dependent to a significant extent on the pricing of our products and our continued ability to harvest timber at adequate levels. Therefore, if we were to be restricted from harvesting on a significant portion of our timberlands for a prolonged period of time, or if material damage to a significant portion of our standing timber were to occur, we could suffer a materially adverse impact to our results of operations.
On a short-term basis, we may adjust our timber harvest levels in response to market conditions. Longer term, our timber harvest levels may be affected by acquisitions of additional timberlands, sales of existing timberlands and shifts in harvest from one region to another. In addition to timberland acquisitions and sales, future timber harvest levels may be affected by changes in estimates of long-term sustainable yield because of silvicultural advances, natural disasters, fires, pests, insects and other hazards, regulatory constraints and other factors beyond our control.
Timber harvest activities are also subject to a number of federal, state and local regulations pertaining to the protection of fish, wildlife, water and other resources. Regulations, re-interpretations and litigation can restrict timber harvest activities and increase costs. Examples are federal and state laws protecting threatened, endangered and “at-risk” species, harvesting and forestry road building activities that may be restricted under the U.S. Federal Clean Water Act, state forestry practices laws, laws protecting aboriginal rights, and other similar regulations.
Our estimates of timber inventories and growth rates may be inaccurate, include risks inherent to such estimates, and may impair our ability to realize expected revenues.
We rely upon estimates of merchantable timber inventories, which include judgments regarding inventories that may be lawfully and economically harvested, timber growth rates and end-product yields when acquiring and managing working forests. These estimates, which are inherently inexact and uncertain in nature, are central to forecasting our anticipated timber harvests, revenues and expected cash flows. Timber growth rates and yield estimates are developed by forest biometricians and other experts using statistical measurements of a sample of trees on a given property. Timber growth equations are used that predict the rate of height and diameter growth of trees so that foresters can estimate the volume of timber that may be present in the tree stand at a given age. Tree growth varies by soil type, geographic area, and climate. Inappropriate application of growth equations in forest management planning may lead to inaccurate estimates of future volumes. If these estimates are inaccurate, our ability to manage our timberlands in a sustainable or profitable manner may be diminished, which may cause our results of operations and our stock price to be adversely affected.
Our operating results and cash flows will be materially affected by supply and demand for timber.
A variety of factors affect prices for timber, including available supply, changes in economic conditions that impact demand, the level of domestic new construction and remodeling activity, interest rates, credit availability, population growth, weather conditions and pest infestation, and other factors. These factors vary by region, timber type (sawlogs or pulpwood logs) and species.
Timber prices are affected by changes in demand on a local, national or international level. The closure of a mill in the regions where we own timber can have a material adverse effect on demand, and therefore pricing. As the demand for paper continues to decline, closures of pulp mills have adversely affected the demand for pulpwood and wood chips in certain regions in which we operate. We export logs to Asia. While demand for Asia has remained steady, recently Asian markets have experienced a high degree of volatility, especially in China. A decrease in demand of logs from Asia may have a negative impact on log and lumber in the markets in which we compete.
Timber prices are affected by changes in timber availability at the local, national and international level. Our timberland ownership is concentrated in Alabama, Arkansas, Louisiana, Mississippi, North Carolina, Oklahoma, Oregon and Washington. In some of these states, much of the timberland is privately owned. Increases in timber prices often result in substantial increases in harvesting on private timberlands, including lands not previously made available for commercial timber operations, causing a short-term increase in supply that moderates price increases. In western states such as Oregon, and Washington, where a greater proportion of timberland is government owned, any substantial
WEYERHAEUSER COMPANY >
2016 ANNUAL REPORT AND FORM 10-K
31
increase in timber harvesting from government-owned land could significantly reduce timber prices. On a local level, timber supplies can fluctuate depending upon factors such as changes in weather conditions and harvest strategies of local timberland owners, as well as occasionally high timber salvage efforts due to events such as unusual pest infestations or fires.
Timberlands make up a significant portion of our business portfolio.
Our real estate holdings are primarily timberlands and we may make additional timberlands acquisitions in the future. As the owner and manager of approximately
13.1 million
acres of timberlands, we are subject to the risks that are inherent in concentrated real estate investments. A downturn in the real estate industry generally, or the timber or forest products industries specifically, could reduce the value of our properties and adversely affect our results of operations. Such a downturn could also adversely affect our customers and reduce the demand for our products, as well as our ability to realize upon our strategy of selling non-strategic timberlands and timberland properties that have higher and better uses at attractive prices. These risks may be more pronounced than if we diversified our investments outside real estate or outside timberlands.
CYBERSECURITY RISKS
We rely on information technology to support our operations and reporting environments. A security failure of that technology could impact our ability to operate our businesses effectively, adversely affect our reported financial results, impact our reputation and expose us to potential liability or litigation.
We use information systems to carry out our operational activities and maintain our business records. Some systems are internally managed and some are maintained by third-party service providers. We and our service providers employ what we believe are adequate security measures. Our ability to conduct business could be materially and adversely affected if these systems or resources are compromised, damaged or fail. This could be a result of a cyber incident, natural disaster, hardware or software corruption, failure or error, telecommunications system failure, service provider error or failure, intentional or unintentional personnel actions or other disruption.
In the ordinary course of our business, we collect and store sensitive data, including intellectual property, other proprietary information and personally identifiable information. If this data is compromised, destroyed or inappropriately disclosed, it could have a material adverse effect, including damage to our reputation, loss of customers, significant expenses to address and resolve the issues, or litigation or other proceedings by affected individuals, business partners and/or regulators.
|
RISKS RELATED TO OWNERSHIP OF OUR COMMON STOCK
|
STOCK-PRICE VOLATILITY
The market price of our common stock may be influenced by many factors, some of which are beyond our control.
The market price of our common stock may be influenced by many factors, some of which are beyond our control, including those described above under "
Risks Related to our Industries and Business
" and the following:
|
•
|
actual or anticipated fluctuations in our operating results or our competitors' operating results;
|
|
•
|
announcements by us or our competitors of new products, capacity changes, significant contracts, acquisitions or strategic investments;
|
|
•
|
our growth rate and our competitors
’
growth rates;
|
|
•
|
general economic conditions;
|
|
•
|
conditions in the financial markets;
|
|
•
|
changes in stock market analyst recommendations regarding us, our competitors or the forest products industry generally, or lack of analyst coverage of our common stock;
|
|
•
|
sales of our common stock by our executive officers, directors and significant stockholders;
|
|
•
|
sales or repurchases of substantial amounts of common stock;
|
|
•
|
changes in accounting principles; and
|
|
•
|
changes in tax laws and regulations.
|
In addition, there has been significant volatility in the market price and trading volume of securities of companies operating in the forest products industry that often has been unrelated to the operating performance of particular companies.
Some companies that have had volatile market prices for their securities have had securities litigation brought against them. If litigation of this type is brought against us, it could result in substantial costs and divert management
’
s attention and resources.
WEYERHAEUSER COMPANY >
2016 ANNUAL REPORT AND FORM 10-K
32
UNRESOLVED STAFF COMMENTS
There are no unresolved comments that were received from the SEC staff relating to our periodic or current reports under the Securities Exchange Act of 1934.
PROPERTIES
Details about our facilities, production capacities and locations are found in the
Our Business — What We Do
section of this report.
|
•
|
For details about our Timberlands properties, go to
Our Business/What We Do/Timberlands/Where We Do It
.
|
|
•
|
For details about our Real Estate, Energy and Natural Resources properties, go to
Our Business/What We Do/Real Estate, Energy and Natural Resources/Where We Do It
.
|
|
•
|
For details about our Wood Products properties, go to
Our Business/What We Do/Wood Products/Where We Do It
.
|
LEGAL PROCEEDINGS
See
Note 14: Legal Proceedings, Commitments and Contingencies
and
Note 19: Income Taxes
in the
Notes to Consolidated Financial Statements
for a summary of legal proceedings.
MARKET FOR REGISTRANT’S COMMON EQUITY, RELATED STOCKHOLDER MATTERS AND ISSUER PURCHASES OF EQUITY SECURITIES
Our common stock trades on the following exchanges under the symbol WY:
|
•
|
New York Stock Exchange and
|
|
•
|
Chicago Stock Exchange
|
As of
December 31, 2016
, there were
15,504
holders of record of our common shares. Dividend-per-share data and the range of closing market prices for our common stock for each of the four quarters in
2016
and
2015
are included in
Note 21: Selected Quarterly Financial Information (unaudited)
in the
Notes to Consolidated Financial Statements
.
INFORMATION ABOUT SECURITIES AUTHORIZED FOR ISSUANCE UNDER OUR EQUITY COMPENSATION PLAN
|
NUMBER OF
SECURITIES TO BE
ISSUED UPON
EXERCISE OF
OUTSTANDING
OPTIONS,
WARRANTS AND
RIGHTS
|
|
WEIGHTED
AVERAGE EXERCISE
PRICE OF
OUTSTANDING
OPTIONS,
WARRANTS AND
RIGHTS
|
|
NUMBER OF
SECURITIES
REMAINING AVAILABLE
FOR FUTURE ISSUANCE
UNDER EQUITY
COMPENSATION PLANS
(EXCLUDING
SECURITIES TO BE ISSUED UPON EXERCISE)
|
|
||
|
Equity compensation plans approved by security holders
(1)
|
17,440,704
|
|
$
|
21.58
|
|
21,646,924
|
|
|
Equity compensation plans not approved by security holders
|
N/A
|
|
N/A
|
|
N/A
|
|
|
|
Total
|
17,440,704
|
|
$
|
21.58
|
|
21,646,924
|
|
|
(1) Includes 1,582,831 restricted stock units and 760,650 performance share units. Because there is no exercise price associated with restricted stock units and performance share units, excluding these stock units the weighted average exercise price calculation would be $24.93.
|
|||||||
WEYERHAEUSER COMPANY >
2016 ANNUAL REPORT AND FORM 10-K
33
INFORMATION ABOUT COMMON STOCK REPURCHASES DURING
2016
|
TOTAL NUMBER OF SHARES (OR UNITS) PURCHASED
|
|
AVERAGE PRICE PAID PER SHARE (OR UNIT)
|
|
TOTAL NUMBER OF SHARES (OR UNITS) PURCHASED AS PART OF PUBLICLY ANNOUNCED PLANS OF PROGRAMS
|
|
MAXIMUM NUMBER (OR APPROXIMATE DOLLAR VALUE) OF SHARES (OR UNITS) THAT MAY YET BE PURCHASED UNDER THE PLANS OR PROGRAMS
(1)
|
|
|||
|
Common Stock Repurchases During First Quarter:
|
||||||||||
|
January
|
—
|
|
$
|
—
|
|
—
|
|
$
|
478,442,984
|
|
|
February
|
11,151,586
|
|
$
|
24.90
|
|
11,151,586
|
|
$
|
2,222,380,446
|
|
|
March
|
20,215,955
|
|
$
|
28.93
|
|
20,215,955
|
|
$
|
1,637,554,693
|
|
|
Total repurchases during first quarter
|
31,367,541
|
|
$
|
27.49
|
|
31,367,541
|
|
$
|
1,637,554,693
|
|
|
Common Stock Repurchases During Second Quarter:
|
||||||||||
|
April
|
12,288,096
|
|
$
|
31.48
|
|
12,288,096
|
|
$
|
1,250,716,457
|
|
|
May
|
12,124,893
|
|
$
|
31.16
|
|
12,124,893
|
|
$
|
872,903,002
|
|
|
June
|
2,260,407
|
|
$
|
29.47
|
|
2,260,407
|
|
$
|
806,283,924
|
|
|
Total repurchases during second quarter
|
26,673,396
|
|
$
|
31.16
|
|
26,673,396
|
|
$
|
806,283,924
|
|
|
Common Stock Repurchases During Third Quarter:
|
||||||||||
|
July
|
8,579,989
|
|
$
|
31.16
|
|
8,579,989
|
|
$
|
538,928,998
|
|
|
August
|
1,195,884
|
|
$
|
32.55
|
|
1,195,884
|
|
$
|
500,000,011
|
|
|
September
|
—
|
|
$
|
—
|
|
—
|
|
$
|
500,000,011
|
|
|
Total repurchases during third quarter
|
9,775,873
|
|
$
|
31.33
|
|
9,775,873
|
|
$
|
500,000,011
|
|
|
Common Stock Repurchases During Fourth Quarter:
|
||||||||||
|
October
|
—
|
|
$
|
—
|
|
—
|
|
$
|
500,000,011
|
|
|
November
|
—
|
|
$
|
—
|
|
—
|
|
$
|
500,000,011
|
|
|
December
|
—
|
|
$
|
—
|
|
—
|
|
$
|
500,000,011
|
|
|
Total repurchases during fourth quarter
|
—
|
|
$
|
—
|
|
—
|
|
$
|
500,000,011
|
|
|
Total common stock repurchases during 2016
|
67,816,810
|
|
$
|
29.49
|
|
67,816,810
|
|
$
|
500,000,011
|
|
|
(1) The 2016 Share Repurchase Authorization was approved in November 2015 by our Board of Directors and authorized management to repurchase up to $2.5 billion of outstanding shares subsequent to the closing of our merger with Plum Creek. Transaction fees incurred for repurchases are not counted as use of funds authorized for repurchase under the 2016 Share Repurchase Authorization. All common stock purchases under the stock repurchase program were made in open-market transactions.
|
||||||||||
WEYERHAEUSER COMPANY >
2016 ANNUAL REPORT AND FORM 10-K
34
COMPARISON OF FIVE-YEAR CUMULATIVE TOTAL SHAREHOLDER RETURN
Weyerhaeuser Company, S&P 500 and S&P Global Timber & Forestry Index
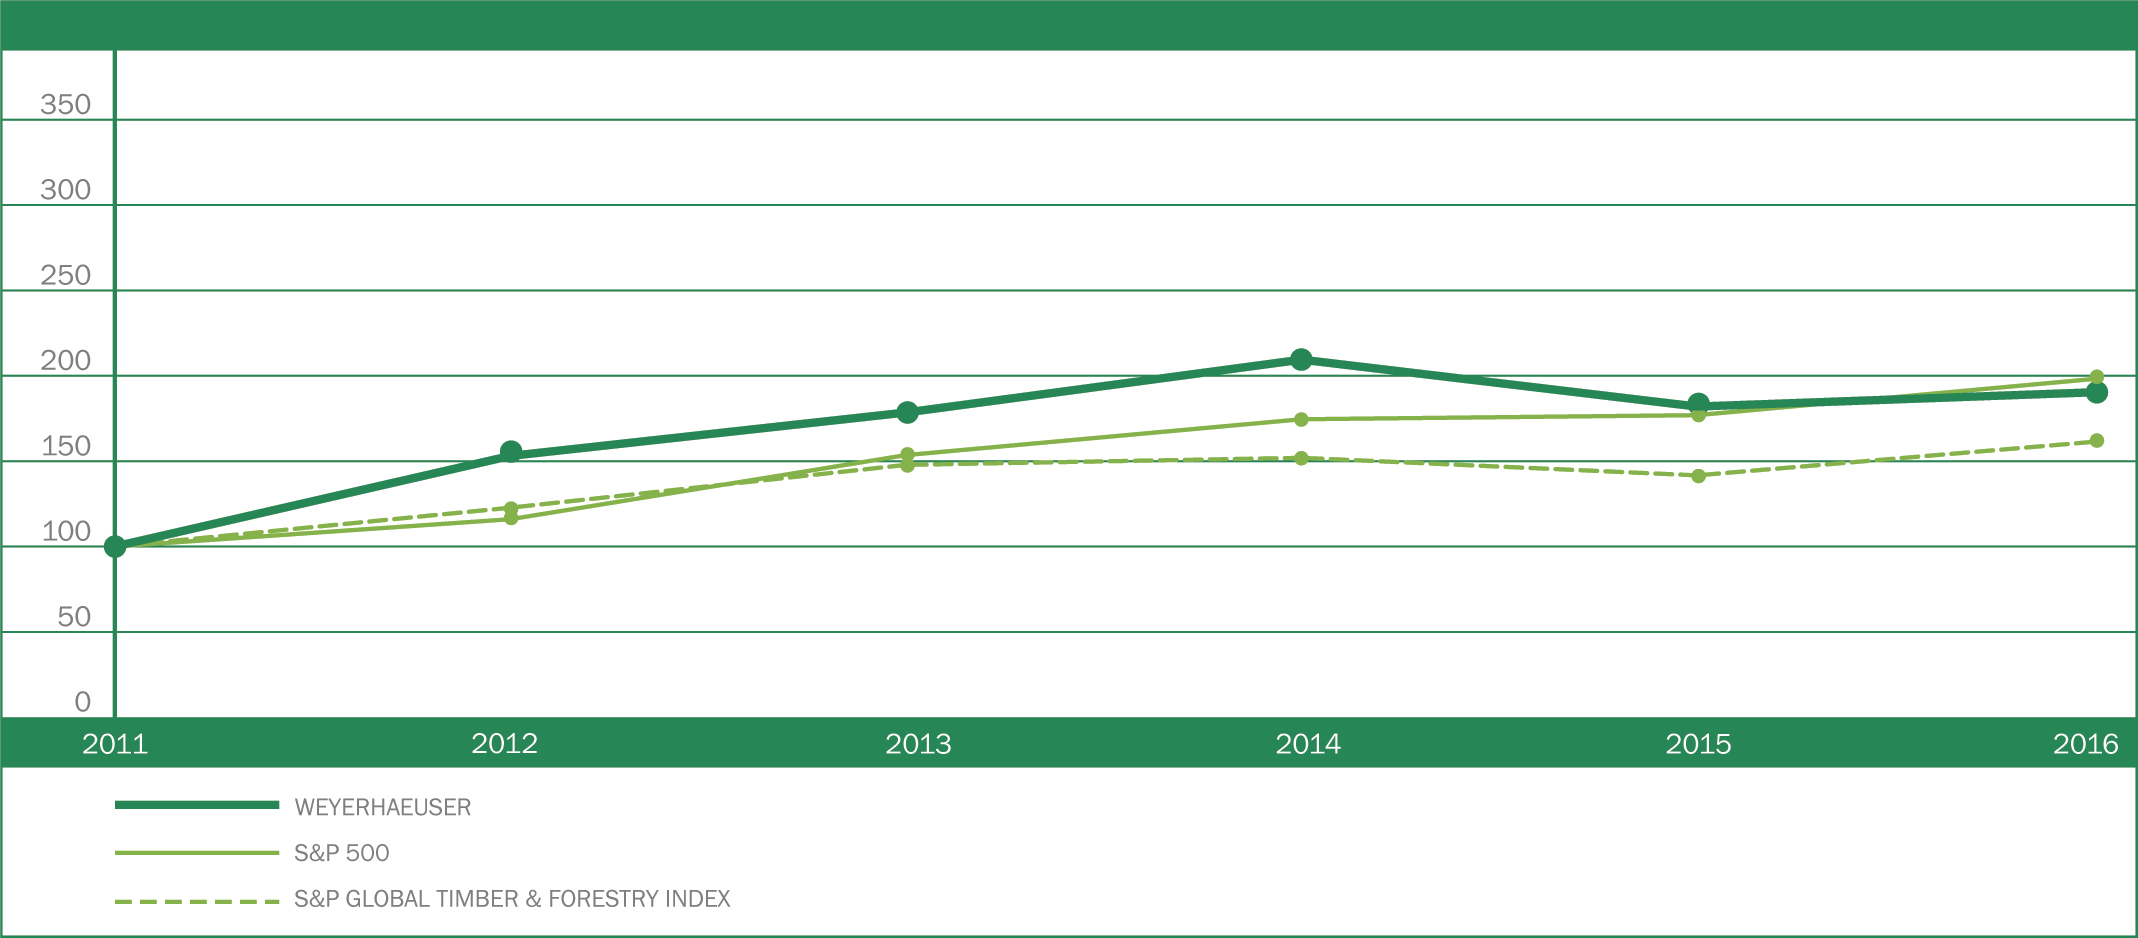
PERFORMANCE GRAPH ASSUMPTIONS
|
•
|
Assumes $100 invested on
December 31, 2011
in Weyerhaeuser common stock, the S&P 500 Index and the S&P Global Timber & Forestry Index.
|
|
•
|
Total return assumes dividends received are reinvested at month end.
|
|
•
|
Measurement dates are the last trading day of the calendar year shown.
|
WEYERHAEUSER COMPANY >
2016 ANNUAL REPORT AND FORM 10-K
35
SELECTED FINANCIAL DATA
DOLLAR AMOUNTS IN MILLIONS, EXCEPT PER-SHARE FIGURES
|
PER COMMON SHARE
|
|||||||||||
|
|
2016
|
|
2015
|
|
2014
|
|
2013
|
|
2012
|
|
|
|
Diluted earnings from continuing operations attributable to Weyerhaeuser common shareholders
|
$
|
0.55
|
|
0.71
|
|
1.02
|
|
0.54
|
|
0.29
|
|
|
Diluted earnings from discontinued operations attributable to Weyerhaeuser common shareholders
|
0.84
|
|
0.18
|
|
2.16
|
|
0.41
|
|
0.42
|
|
|
|
Diluted net earnings attributable to Weyerhaeuser common shareholders
|
$
|
1.39
|
|
0.89
|
|
3.18
|
|
0.95
|
|
0.71
|
|
|
Dividends paid
|
$
|
1.24
|
|
1.20
|
|
1.02
|
|
0.81
|
|
0.62
|
|
|
Weyerhaeuser shareholders’ interest (end of year)
|
$
|
12.26
|
|
9.54
|
|
10.11
|
|
11.64
|
|
7.50
|
|
|
FINANCIAL POSITION
(1)
|
|||||||||||
|
|
2016
|
|
2015
|
|
2014
|
|
2013
|
|
2012
|
|
|
|
Total assets
|
$
|
19,243
|
|
12,470
|
|
13,247
|
|
14,352
|
|
12,594
|
|
|
Total long-term debt, including current portion
|
$
|
6,610
|
|
4,875
|
|
4,873
|
|
4,871
|
|
4,276
|
|
|
Weyerhaeuser shareholders’ interest
|
$
|
9,180
|
|
4,869
|
|
5,304
|
|
6,795
|
|
4,070
|
|
|
Percent earned on average year-end Weyerhaeuser shareholders’ interest
|
14.3
|
%
|
9.1
|
%
|
29.5
|
%
|
9.9
|
%
|
9.2
|
%
|
|
|
OPERATING RESULTS
|
|||||||||||
|
|
2016
|
|
2015
|
|
2014
|
|
2013
|
|
2012
|
|
|
|
Net sales
|
$
|
6,365
|
|
5,246
|
|
5,489
|
|
5,373
|
|
4,154
|
|
|
Earnings from continuing operations
|
$
|
415
|
|
411
|
|
616
|
|
330
|
|
156
|
|
|
Discontinued operations, net of income taxes
|
612
|
|
95
|
|
1,210
|
|
233
|
|
228
|
|
|
|
Net earnings
|
1,027
|
|
506
|
|
1,826
|
|
563
|
|
384
|
|
|
|
Net loss (earnings) attributable to noncontrolling interest
|
—
|
|
—
|
|
—
|
|
—
|
|
1
|
|
|
|
Net earnings attributable to Weyerhaeuser
|
1,027
|
|
506
|
|
1,826
|
|
563
|
|
385
|
|
|
|
Dividends on preference shares
|
(22
|
)
|
(44
|
)
|
(44
|
)
|
(23
|
)
|
—
|
|
|
|
Net earnings attributable to Weyerhaeuser common shareholders
|
$
|
1,005
|
|
462
|
|
1,782
|
|
540
|
|
385
|
|
|
CASH FLOWS
(1)
|
|||||||||||
|
|
2016
|
|
2015
|
|
2014
|
|
2013
|
|
2012
|
|
|
|
Net cash from operations
|
$
|
735
|
|
1,075
|
|
1,109
|
|
1,023
|
|
586
|
|
|
Net cash from investing activities
|
2,559
|
|
(487
|
)
|
361
|
|
(1,848
|
)
|
(197
|
)
|
|
|
Net cash from financing activities
|
(3,630
|
)
|
(1,156
|
)
|
(725
|
)
|
762
|
|
(444
|
)
|
|
|
Net change in cash and cash equivalents
|
$
|
(336
|
)
|
(568
|
)
|
745
|
|
(63
|
)
|
(55
|
)
|
|
STATISTICS (UNAUDITED)
|
|||||||||||
|
|
2016
|
|
2015
|
|
2014
|
|
2013
|
|
2012
|
|
|
|
Number of employees
|
10,400
|
|
12,600
|
|
12,800
|
|
13,700
|
|
13,200
|
|
|
|
Number of common shareholder accounts at year-end
|
15,504
|
|
7,700
|
|
8,248
|
|
8,859
|
|
9,227
|
|
|
|
Number of common shares outstanding at year-end (thousands)
|
748,528
|
|
510,483
|
|
524,474
|
|
583,548
|
|
542,393
|
|
|
|
Weighted average common shares outstanding – diluted (thousands)
|
722,401
|
|
519,618
|
|
560,899
|
|
571,239
|
|
542,310
|
|
|
|
(1) Amounts are not updated for the Cellulose Fibers divestitures. See
Note 3: Discontinued Operations
in the
Notes to Consolidated Financial Statements
.
|
|||||||||||
WEYERHAEUSER COMPANY >
2016 ANNUAL REPORT AND FORM 10-K
36
MANAGEMENT’S DISCUSSION AND ANALYSIS OF FINANCIAL CONDITION AND RESULTS OF OPERATIONS (MD&A)
|
WHAT YOU WILL FIND IN THIS MD&A
|
Our MD&A includes the following major sections:
|
•
|
economic and market conditions affecting our operations;
|
|
•
|
financial performance summary;
|
|
•
|
results of our operations — consolidated and by segment;
|
|
•
|
liquidity and capital resources — where we discuss our cash flows;
|
|
•
|
off-balance sheet arrangements;
|
|
•
|
environmental matters, legal proceedings and other contingencies; and
|
|
•
|
accounting matters — where we discuss critical accounting policies and areas requiring judgments and estimates.
|
|
ECONOMIC AND MARKET CONDITIONS AFFECTING OUR OPERATIONS
|
The strength of the U.S. housing market strongly affects our Wood Products, Timberlands and Real Estate segments. As published by the U.S. Census Bureau, total U.S. housing starts for 2016 were 1,166,000 units, with single-family units accounting for 781,000 of the total. This represents an almost 10 percent increase in single-family starts from 2015, which were 715,000 units. Multi-family construction was slightly weaker in 2016 falling to 385,000 units compared with 396,000 in 2015. Expectations are for a 6 percent to 12 percent increase in total starts in 2017. Consensus forecasts place expected total housing starts between 1.24 and 1.31 million units for 2017. Sources include NAHB, Fannie Mae, Mortgage Bankers Association, APA, and FEA. Demand for homes remains strong relative to inventories. US Census reported new homes sales of 563 thousand units, a 12.2 percent rise in sales over 2015 and consistently low inventories as measured by months of supply which averaged 5.3 months through 2016. Existing homes performed similarly, with total sales for 2016 of 5.45 million units, a gain of 4 percent over 2015 and the highest sales level since 2006 according to the National Association of Realtors. Existing home inventories were also tight with supplies, averaging 4.3 months for the year. While housing has improved significantly since the recession of 2009, current demand for new housing continues to run below historic levels. The Joint Center for Housing Studies at Harvard projects trend demand at 1.7 million total units which is well above current levels. Remodeling activity also affects our Wood Products and Timberlands segments. According to the Joint Center for Housing Studies at Harvard, the Leading Indicator of Remodeling Activity (LIRA) increased 6 percent in 2016 and is expected to rise 7.8 percent in 2017.
Real estate sales are affected by local economic conditions, the ability of borrowers to obtain financing, the number of competing properties listed for sale and the availability of government and not for profit funding, especially for conservation sales.
Wood Products primarily sells into the new residential building and repair and remodel markets. Demand for wood products continued to improve in 2016, following the growth in home construction and remodeling. The Random Lengths framing lumber composite was 4 percent higher in 2016 versus 2015 while oriented strand board (OSB) was 29 percent higher in 2016 versus 2015 as measured by Random Lengths North Central Price. Expectations are for similar to slightly higher wood product prices in 2017 as demand continues to increase with growth in housing starts and remodeling.
Demand for logs from our Timberlands segment is affected by the production of wood-based building products as well as export demand in our Western holdings. In the South, Southern pine sawlog prices, as reported by TimberMart-South, were 2 percent lower in 2016 compared with 2015 as available supplies continue to match or exceed growth in demand. Western domestic log prices, as reported by Loglines, were flat in 2016 while Export logs to Japan were 1 percent higher, however, exports of Hemlock logs, whose primary destinations are China and Korea, sold at prices 8 percent below 2015 levels. Expectations are for slightly improved log prices as off-shore demand improves over 2016 and domestic wood products manufacturing output increases with rising housing starts creating increased log demand.
Energy markets hit their low point in early 2016 and rebounded through the remainder of the year. For the year, oil prices averaged $43/BBL for West Texas Intermediate crude, an 11 percent decline from 2015. Prices bottomed in February at $30/BBL, recovering to almost $52/BBL in December. Natural gas prices were also lower in 2016 but the decline from 2015 was more modest at 4 percent for the Henry Hub price. Expectations are for energy prices to slowly increase in 2017.
WEYERHAEUSER COMPANY >
2016 ANNUAL REPORT AND FORM 10-K
37
|
FINANCIAL PERFORMANCE SUMMARY
|
Net Sales by Segment
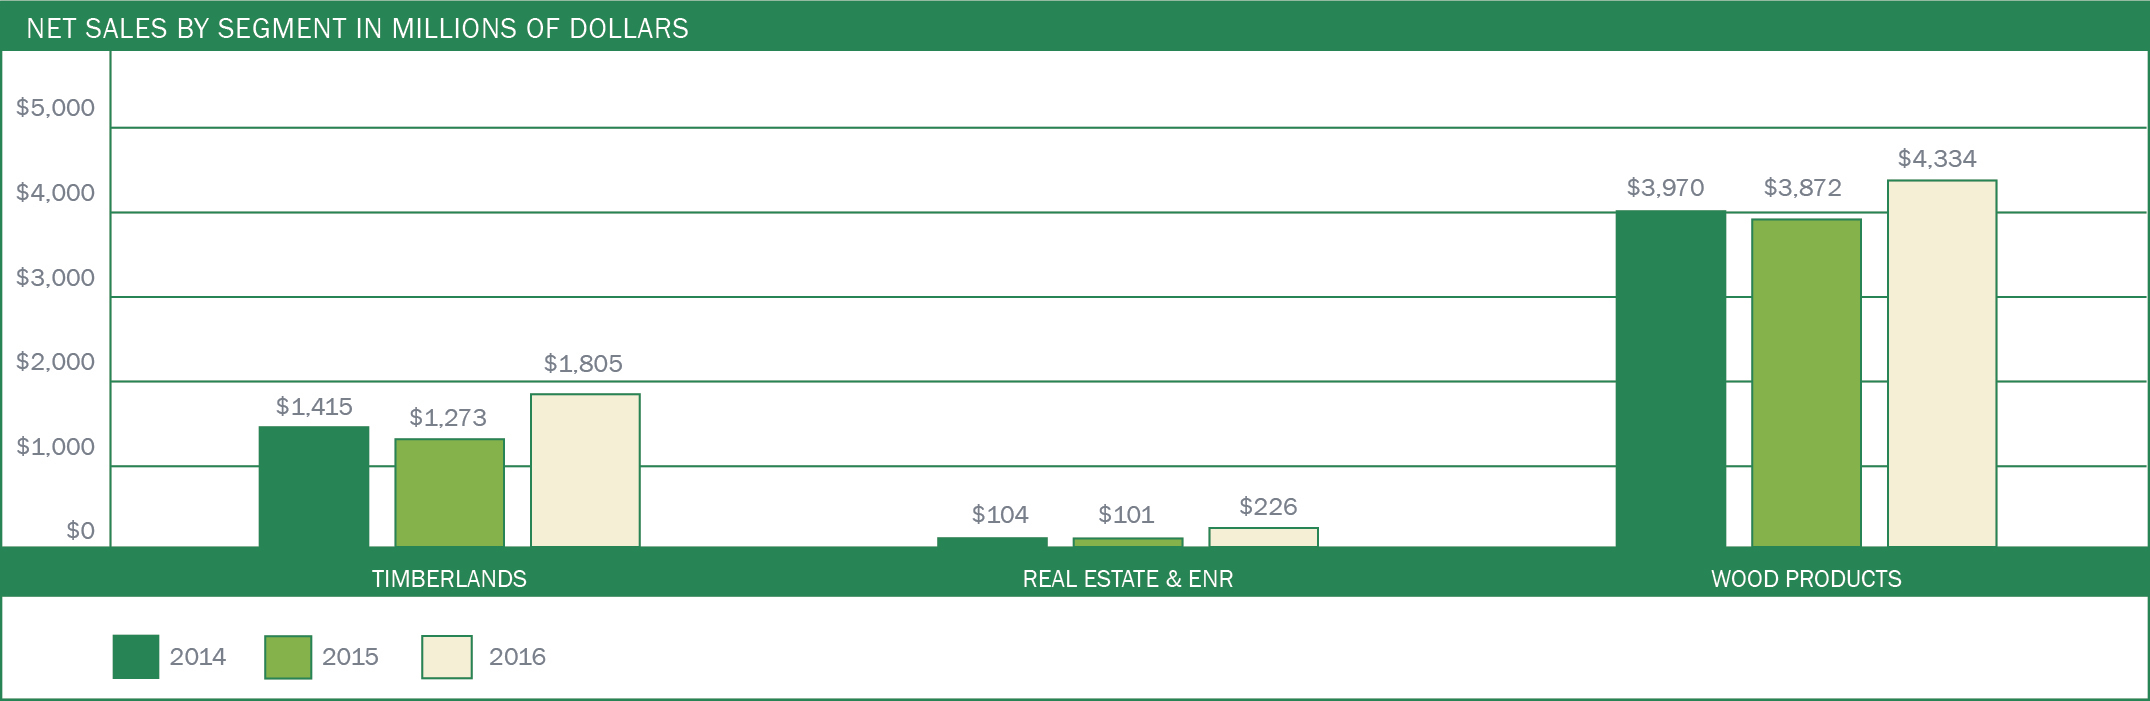
Contribution to Pretax Earnings by
Segment
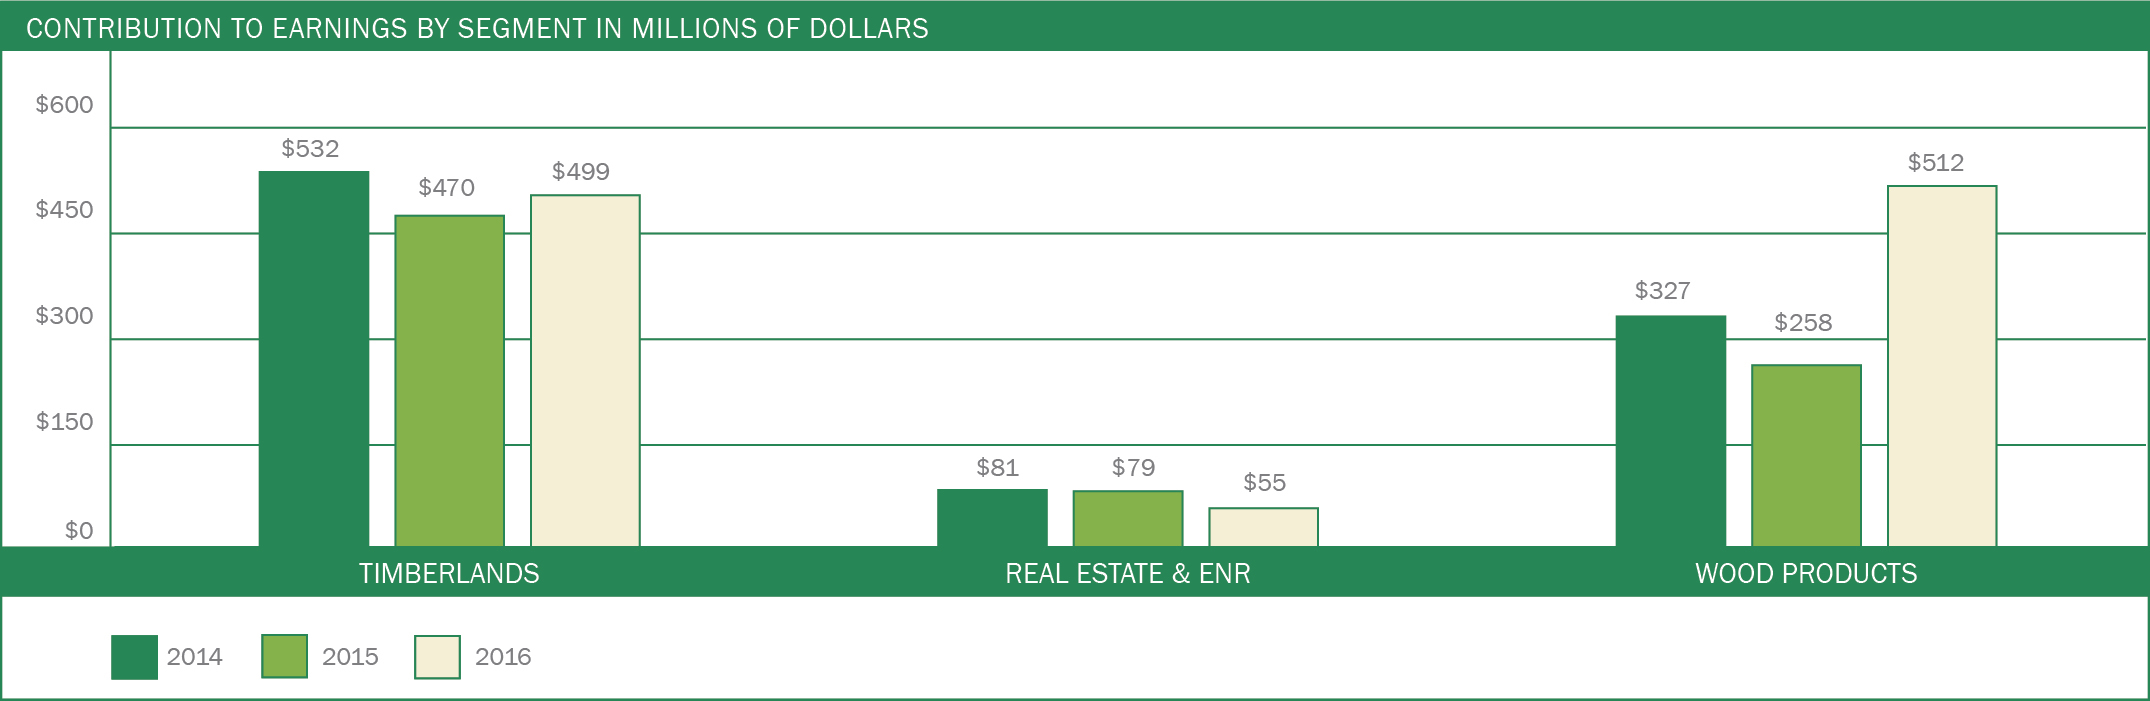
WEYERHAEUSER COMPANY >
2016 ANNUAL REPORT AND FORM 10-K
38
|
RESULTS OF OPERATIONS
|
In reviewing our results of operations, it is important to understand these terms:
|
•
|
Sales realizations refer to net selling prices — this includes selling price plus freight minus normal sales deductions.
|
|
•
|
Net contribution to earnings refers to earnings (loss) attributable to Weyerhaeuser shareholders before interest expense and income taxes.
|
Our merger with Plum Creek during first quarter 2016 significantly affected the comparability of our consolidated operating results between 2016 and prior periods. As a result of progress made to integrate financial processes and systems since the merger date, the results beginning on February 19, 2016, from acquired Plum Creek operations and the respective impacts of these results on our current period results are impracticable to disclose in the year-to-date period ended December 31, 2016. Our prior period results do not include pre-merger results of Plum Creek operations.
When compared to historical Plum Creek results, the post-merger results of the acquired operations are significantly affected by the following items:
|
•
|
increased depletion charges and increased basis of real estate sold as a result of applying acquisition accounting to timberland and real estate and energy and natural resources assets acquired as described in
Note 4: Merger with Plum Creek
in
Notes to Consolidated Financial Statements
; and
|
|
•
|
certain merger-related costs as described in
Note 17: Charges for Integration and Restructuring, Closures and Asset Impairments
in
Notes to Consolidated Financial Statements
.
|
CONSOLIDATED RESULTS
HOW WE DID IN
2016
Summary of Financial Results
|
DOLLAR AMOUNTS IN MILLIONS, EXCEPT PER-SHARE FIGURES
|
|||||||||||||||
|
|
|
|
|
AMOUNT OF CHANGE
|
|||||||||||
|
|
2016
|
|
2015
|
|
2014
|
|
2016
vs. 2015 |
|
2015
vs. 2014 |
|
|||||
|
Net sales
|
$
|
6,365
|
|
$
|
5,246
|
|
$
|
5,489
|
|
$
|
1,119
|
|
$
|
(243
|
)
|
|
Costs of products sold
|
$
|
4,926
|
|
$
|
4,121
|
|
$
|
4,183
|
|
$
|
805
|
|
$
|
(62
|
)
|
|
Operating income
|
$
|
870
|
|
$
|
658
|
|
$
|
987
|
|
$
|
212
|
|
$
|
(329
|
)
|
|
Earnings from discontinued operations, net of tax
|
$
|
612
|
|
$
|
95
|
|
$
|
1,210
|
|
$
|
517
|
|
$
|
(1,115
|
)
|
|
Net earnings attributable to Weyerhaeuser common shareholders
|
$
|
1,005
|
|
$
|
462
|
|
$
|
1,782
|
|
$
|
543
|
|
$
|
(1,320
|
)
|
|
Basic earnings per share attributable to Weyerhaeuser common shareholders
|
$
|
1.40
|
|
$
|
0.89
|
|
$
|
3.20
|
|
$
|
0.51
|
|
$
|
(2.31
|
)
|
|
Diluted earnings per share attributable to Weyerhaeuser common shareholders
|
$
|
1.39
|
|
$
|
0.89
|
|
$
|
3.18
|
|
$
|
0.50
|
|
$
|
(2.29
|
)
|
COMPARING
2016
WITH
2015
Net Sales
Net sales increased
$1,119 million
—
21 percent
— due to the following developments:
|
•
|
Timberlands segment sales increased
$532 million
—
42 percent
— primarily due to sales from acquired Plum Creek operations. This increase was partially offset by lower average sales realizations. The decrease in average sales realizations is primarily attributable to the increase in sales volume for the South, which has lower average sales realizations compared to the West. The South comprised 31 percent of Timberlands' sales to unaffiliated customers in 2016 compared to 19 percent in 2015.
|
|
•
|
Real Estate & ENR segment sales increased
$125 million
— 124 percent — attributable to increased volume of timberland acres sold and increased ENR sales volume attributable to the operations acquired in our merger with Plum Creek. These increases were partially offset by a decrease in average price realized per acre due to geographic mix of properties sold.
|
|
•
|
Wood Products segment sales increased
$462 million
— 12 percent — due to increased medium density fiberboard and plywood sales generated from our operations acquired from our merger with Plum Creek; and increased oriented strand board and lumber average sales realizations.
|
Costs of Products Sold
Costs of products sold increased
$805 million
—
20 percent
— primarily attributable to the following developments:
|
•
|
Timberlands costs of products sold increased
$488 million
— 31 percent — due to increased sales volume as explained above and to higher depletion rates in the South and West for acquired Plum Creek timberlands, which were measured at fair value as of the merger date;
|
|
•
|
Real Estate & ENR costs of products sold increased
$114 million
— 570 percent — attributable to increased real estate and ENR sales volume as explained above and to higher basis in real estate sold resulting from measuring acquired Plum Creek properties at fair value as of the February 19, 2016, merger date.
|
|
•
|
Wood Products costs of products sold increased
$201 million
— 6 percent — primarily attributable to increased sales volume as explained above. This increase was partially offset by lower log costs and lower manufacturing costs per unit.
|
WEYERHAEUSER COMPANY >
2016 ANNUAL REPORT AND FORM 10-K
39
Operating Income
Operating income increased
$212 million
—
32 percent
— primarily due to:
|
•
|
an increase to company-wide gross margin of $314 million — 28 percent — as described above;
|
|
•
|
a favorable shift in gain on foreign currency remeasurement —
$52 million
; and
|
|
•
|
a gain on the sale of our Federal Way headquarters campus — $36 million.
|
These increases were partially offset by:
|
•
|
a $131 million increase in charges for integration and restructuring, closures and asset impairments, primarily attributable to incurring
$146 million
of costs related to our merger with Plum Creek in 2016 compared to
$14 million
incurred in 2015; and
|
|
•
|
a $63 million increase in selling, general and administrative expenses primarily attributable to merging legacy Weyerhaeuser and Plum Creek operations.
|
Net Earnings Attributable to Weyerhaeuser Common Shareholders
Our net earnings attributable to Weyerhaeuser common shareholders increased
$543 million
— 118 percent — compared to 2015. Earnings from continuing operations before income taxes increased $151 million — 43 percent — due to the variances in net sales, costs of products sold and operating income explained above. The increase was offset by a $147 million increase to income taxes from continuing operations resulting from increased taxable earnings generated by our TRSs.
Earnings from discontinued operations, net of tax, increased
$517 million
— 544 percent — primarily due to:
|
•
|
the after-tax gains recognized from divesting from our Cellulose Fibers business in 2016 —
$546 million
;
|
|
•
|
a decrease in the equity loss from our printing papers joint venture — $101 million — primarily attributable to an $84 million noncash asset impairment recorded in fourth quarter 2015; and
|
|
•
|
lower costs of products sold, primarily due to lower sales volume and the cessation of depreciation when Cellulose Fibers manufacturing assets were classified as held-for-sale in second quarter 2016.
|
These increases were partially offset by:
|
•
|
lower average sales realizations for pulp and liquid packaging board;
|
|
•
|
lower sales volume for pulp and liquid packaging board attributable to a partial year of operations in 2016 compared to a full year in 2015;
|
|
•
|
increased charges for restructuring, closures and asset impairments and transaction-related costs related to our strategic evaluation and divestiture of the Cellulose Fibers businesses.
|
COMPARING
2015
WITH
2014
Net Sales
Net sales decreased
$243 million
— 4 percent — primarily due to the following developments:
|
•
|
Timberlands segment sales decreased
$142 million
—
10 percent
— primarily due to lower average log sales realizations and export sales volume in the West, and lower log sales volume in the South;
|
|
•
|
Real Estate & ENR segment sales decreased
$3 million
—
3 percent
— attributable to decreased energy and natural resources sales, partially offset by increased net real estate sales; and
|
|
•
|
Wood Products segment sales decreased
$98 million
— 2 percent — primarily due to decreased structural lumber and OSB average realizations, partially offset by higher structural lumber, OSB, and engineered solid section sales volume and higher sales of complementary building products.
|
Costs of Products Sold
Costs of products sold decreased
$62 million
— 1 percent — primarily attributable to lower Timberlands segment costs of products sold —
$101 million
— primarily due to decreased sales volume as explained above.
Operating Income
Operating income decreased
$329 million
— 33 percent — primarily due to:
|
•
|
Other operating costs or income changed from income of
$148 million
in
2014
to costs of
$52 million
in
2015
— a $200 million change — primarily attributable to:
|
|
◦
|
a $151 million pretax gain recognized in
2014
related to a previously announced postretirement plan amendment;
|
|
◦
|
a $22 million pretax gain recognized in
2014
on the sale of a landfill in Washington state; and
|
|
◦
|
a $13 million noncash impairment charge related to a nonstrategic asset sale in
2015
.
|
|
•
|
$14 million
of Plum Creek merger-related costs in
2015
.
|
|
•
|
Lower gross margin — $181 million — primarily due to lower average sales realizations in lumber and OSB in our Wood Products segment and lower average log sales realizations and sales volume in our Timberlands segment.
|
These decreases were partially offset by lower general and administrative expenses — $47 million.
Net Earnings Attributable to Weyerhaeuser Common Shareholders
Our net earnings attributable to Weyerhaeuser common shareholders decreased
$1,320 million
— 74 percent — primarily due to:
|
•
|
earnings from discontinued operations, net of taxes decreased $1,115 million — primarily due to:
|
|
◦
|
a
$972 million
net gain on the WRECO Divestiture recognized in
2014
and
|
|
◦
|
a
$105 million
equity loss from our Printing Papers joint venture recognized in
2015
— primarily due to an $84 million noncash asset impairment recorded by our joint venture.
|
WEYERHAEUSER COMPANY >
2016 ANNUAL REPORT AND FORM 10-K
40
TIMBERLANDS
HOW WE DID IN
2016
We report sales volume and annual production data for our Timberlands segment in
Our Business/What We Do/Timberlands
.
Here is a comparison of net sales to unaffiliated customers, intersegment sales, cost of products sold and net contribution to earnings for the last three years:
Net Sales and Net Contribution to Earnings for Timberlands
|
DOLLAR AMOUNTS IN MILLIONS
|
|||||||||||||||
|
|
|
|
|
AMOUNT OF CHANGE
|
|||||||||||
|
|
2016
|
|
2015
|
|
2014
|
|
2016
vs. 2015 |
|
2015
vs. 2014 |
|
|||||
|
Net sales to unaffiliated customers:
|
|
|
|
|
|
||||||||||
|
Delivered logs
(1)
:
|
|
|
|
|
|
||||||||||
|
West
|
$
|
865
|
|
$
|
830
|
|
$
|
972
|
|
$
|
35
|
|
$
|
(142
|
)
|
|
South
|
566
|
|
241
|
|
257
|
|
325
|
|
(16
|
)
|
|||||
|
North
|
91
|
|
—
|
|
—
|
|
91
|
|
—
|
|
|||||
|
Other
|
38
|
|
24
|
|
22
|
|
14
|
|
2
|
|
|||||
|
Total
|
1,560
|
|
1,095
|
|
1,251
|
|
465
|
|
(156
|
)
|
|||||
|
Stumpage and pay-as-cut timber
|
85
|
|
37
|
|
18
|
|
48
|
|
19
|
|
|||||
|
Uruguay operations
(2)
|
79
|
|
87
|
|
88
|
|
(8
|
)
|
(1
|
)
|
|||||
|
Recreational and other lease revenue
|
44
|
|
25
|
|
22
|
|
19
|
|
3
|
|
|||||
|
Other products
(3)
|
37
|
|
29
|
|
36
|
|
8
|
|
(7
|
)
|
|||||
|
Subtotal sales to unaffiliated customers
|
1,805
|
|
1,273
|
|
1,415
|
|
532
|
|
(142
|
)
|
|||||
|
Intersegment sales:
|
|
|
|
|
|
||||||||||
|
United States
|
590
|
|
559
|
|
576
|
|
31
|
|
(17
|
)
|
|||||
|
Other
|
250
|
|
271
|
|
291
|
|
(21
|
)
|
(20
|
)
|
|||||
|
Subtotal intersegment sales
|
840
|
|
830
|
|
867
|
|
10
|
|
(37
|
)
|
|||||
|
Total
|
$
|
2,645
|
|
$
|
2,103
|
|
$
|
2,282
|
|
$
|
542
|
|
$
|
(179
|
)
|
|
Costs of products sold
|
$
|
2,054
|
|
$
|
1,566
|
|
$
|
1,667
|
|
$
|
488
|
|
$
|
(101
|
)
|
|
Operating income and Net contribution to earnings
|
$
|
499
|
|
$
|
470
|
|
$
|
532
|
|
$
|
29
|
|
$
|
(62
|
)
|
|
(1)
The Western region includes Oregon and Washington. The Southern region includes Alabama, Arkansas, Georgia, Florida, Louisiana, Mississippi, North Carolina, Oklahoma, South Carolina, Texas and Virginia. The Northern region includes Maine, Michigan, Montana, New Hampshire, Vermont, West Virginia and Wisconsin. Other includes our Canadian operations and the timberlands of the Twin Creeks Venture that we manage.
(2)
Sales from our Uruguay operations include plywood and hardwood lumber.
(3)
Other products sales include sales of seeds and seedlings from our nursery operations, chips, and sales for our operations in Brazil (operations sold in 2014).
|
|||||||||||||||
COMPARING
2016
WITH
2015
Compared to 2015, the changes to the results of operations for our Timberlands segment are primarily attributable to the addition of approximately 6.3 million acres of Plum Creek timberlands, which produced over 18 million tons of harvest volume in 2015. The merger results in expansion of our Southern timberlands from 4.0 million acres to 7.4 million acres — an 85 percent increase — and our Western timberlands from 2.6 to 3.0 million acres — a 15 percent increase. The merger also added 2.5 million acres across Maine, Michigan, Montana, New Hampshire, Vermont, West Virginia and Wisconsin, which we refer to collectively as our Northern timberlands. Increases to sales volume are primarily attributable to the significant increases in the overall size of and harvests from our timberlands holdings by region, particularly in the South and North regions.
The composition of our sales volume by region was also altered by the merger, as the South and North regions, which have lower average sales realizations compared to the West, now comprise a greater portion of our overall sales. Additionally, within the South the acquired timberlands alter the overall sales mix, as lower realization pulpwood sales have increased and higher realization grade logs have decreased as a percentage of total sales volume, resulting in lower average sales realizations overall for the region compared with 2015.
As a result of applying acquisition accounting to Timber and timberland assets acquired as described in
Note 4: Merger with Plum Creek
in
Notes to Consolidated Financial Statements
, depletion rates have increased significantly in 2016 compared to 2015. When combined with increased sales volume, these higher depletion rates drive the significant increases in our costs of products sold in 2016 compared to 2015 for the periods presented.
WEYERHAEUSER COMPANY >
2016 ANNUAL REPORT AND FORM 10-K
41
Net Sales — Unaffiliated Customers
Net sales to unaffiliated customers increased
$532 million
—
42 percent
— primarily due to:
|
•
|
a
$325 million
— 135 percent — increase in Southern log sales as a result of a 146 percent increase in delivered logs sales volume primarily attributable to adding acquired Plum Creek operations, partially offset by a 5 percent decrease in average sales realizations of delivered logs due to mix of sawlogs and pulp logs;
|
|
•
|
a
$91 million
increase in Northern log sales attributable entirely to operations acquired upon our merger with Plum Creek; and
|
|
•
|
a
$35 million
increase in Western log sales as a result of a 6 percent increase in delivered logs sales volume attributable to adding acquired Plum Creek operations, partially offset by a 2 percent decrease in average sales realizations for delivered logs;
|
|
•
|
a
$48 million
increase in stumpage and pay-as-cut timber, which is primarily attributable to adding stumpage sales from acquired Plum Creek timberlands in the South; and
|
|
•
|
a
$19 million
increase in recreational and other lease revenue due entirely to the acquired Plum Creek leases.
|
Intersegment Sales
Intersegment sales increased
$10 million
—
1 percent
— due to a
$31 million
increase in intersegment sales in the United States. This increase is attributable to adding intersegment log sales volume for the Montana operations acquired from Plum Creek. This increase was partially offset by a decrease in average intersegment sales realizations.
The increase in the United States intersegment sales was partially offset by a
$21 million
decrease in intersegment sales in Canada. This decrease is attributable to lower log and chip sales volume to our former Cellulose Fibers segment as a result of divesting from our pulp mill in Grand Prairie, Alberta. There was also a slight decrease in average intersegment sales realizations compared to 2015.
Costs of Products Sold
Costs of products sold increased
$488 million
— 31 percent — primarily due to a 78 percent increase in sales volume attributable to the operations acquired in our merger with Plum Creek. Additionally, per unit costs increased due to higher depletion rates in the South and West attributable to acquired Plum Creek timberlands, which were measured at fair value as of the merger date.
Operating Income and Net Contribution to Earnings
Net contribution to earnings increased
$29 million
— 6 percent — primarily attributable to the changes in net sales and costs of products sold as explained above.
COMPARING
2015
WITH
2014
Net Sales — Unaffiliated Customers
Net sales to unaffiliated customers decreased
$142 million
—
10 percent
— primarily due to a
$142 million
decrease in Western log sales as a result of lower average sales realizations and export sales volume, and a
$16 million
decrease in Southern log sales due to lower sales volume.
Intersegment Sales
Intersegment sales decreased
$37 million
—
4 percent
— primarily due to a
$20 million
decrease in Canada due to lower translated revenues as a result of the strengthening U.S. dollar, and a
$17 million
decrease in the United States due to lower Southern log sales volume and decreased Western average realizations.
Costs of Products Sold
Costs of products sold decreased
$101 million
—
6 percent
— primarily due to decreased sales volume as described above.
Operating Income and Net Contribution to Earnings
Operating income and Net contribution to earnings decreased
$62 million
—
12 percent
— primarily due to:
|
•
|
lower average log sales realizations in the West — $106 million and
|
|
•
|
lower sales volume in the West and South — $46 million.
|
These decreases were partially offset by:
|
•
|
lower selling, general and administrative expenses — $11 million and
|
|
•
|
lower operating costs, primarily due to lower logging and silviculture costs in the South and lower log purchases in the West — $68 million.
|
WEYERHAEUSER COMPANY >
2016 ANNUAL REPORT AND FORM 10-K
42
REAL ESTATE, ENERGY AND NATURAL RESOURCES
HOW WE DID IN
2016
We report acres sold and average price per acre for our Real Estate, Energy and Natural Resources segment in
Our Business/What We Do/Real Estate, Energy and Natural Resources
.
Here is a comparison of net sales, cost of products sold and net contribution to earnings for the last three years:
Net Sales and Net Contribution to Earnings for Real Estate, Energy and Natural Resources
|
DOLLAR AMOUNTS IN MILLIONS
|
|||||||||||||||
|
|
|
|
|
AMOUNT OF CHANGE
|
|||||||||||
|
|
2016
|
|
2015
|
|
2014
|
|
2016
vs. 2015 |
|
2015
vs. 2014 |
|
|||||
|
Net sales to unaffiliated buyers:
|
|
|
|
|
|
||||||||||
|
Real estate
|
$
|
172
|
|
$
|
75
|
|
$
|
72
|
|
$
|
97
|
|
$
|
3
|
|
|
Energy and natural resources
|
54
|
|
26
|
|
32
|
|
28
|
|
(6
|
)
|
|||||
|
Subtotal sales to unaffiliated buyers
|
226
|
|
101
|
|
104
|
|
125
|
|
(3
|
)
|
|||||
|
Intersegment sales
|
1
|
|
—
|
|
—
|
|
1
|
|
—
|
|
|||||
|
Total
|
$
|
227
|
|
$
|
101
|
|
$
|
104
|
|
$
|
126
|
|
$
|
(3
|
)
|
|
Cost of products sold
|
$
|
134
|
|
$
|
20
|
|
$
|
19
|
|
$
|
114
|
|
$
|
1
|
|
|
Operating income
|
$
|
53
|
|
$
|
79
|
|
$
|
81
|
|
$
|
(26
|
)
|
$
|
(2
|
)
|
|
Equity earnings (loss) from joint venture
|
2
|
|
—
|
|
—
|
|
2
|
|
—
|
|
|||||
|
Net contribution to earnings
|
$
|
55
|
|
$
|
79
|
|
$
|
81
|
|
$
|
(24
|
)
|
$
|
(2
|
)
|
The timing of real estate sales is a function of many factors, including the general state of the economy, demand in local real estate markets, the ability to obtain entitlements, the ability of buyers to obtain financing, the number of competing properties listed for sale, the seasonal nature of sales (particularly in the northern states), the plans of adjacent landowners, our expectations of future price appreciation, the timing of harvesting activities, and the availability of government and not-for-profit funding (especially for conservation sales). In any period the average sales price per acre will vary based on the location and physical characteristics of parcels sold.
COMPARING
2016
WITH
2015
Land acquired as a result of our merger with Plum Creek generally carries a higher per acre cost basis compared to our other acreage as a result of measuring acquired land at fair value via acquisition accounting as of the February 19, 2016, merger date. As a result, our costs of timberlands will vary period-to-period based on the sales mix between acquired Plum Creek acreage and acreage owned by Weyerhaeuser prior to the merger.
Net Sales — Unaffiliated Buyers
Net sales to unaffiliated buyers increased
$125 million
— 124 percent — attributable to the following developments:
|
•
|
Net real estate sales increased
$97 million
— 129 percent — attributable to increases in volume of timberlands acres sold. This increase was partially offset by a decrease in average price realized per acre due to mix of properties sold.
|
|
•
|
Net energy and natural resources sales increased
$28 million
— 108 percent — due primarily to increased sales volume attributable to the operations acquired in our merger with Plum Creek.
|
Costs of Products Sold
Costs of products sold increased
$114 million
— 570 percent — due primarily to:
|
•
|
increased real estate and ENR sales volume, as explained above;
|
|
•
|
higher basis in real estate sold resulting from measuring acquired Plum Creek properties at fair value as of the February 19, 2016, merger date; and
|
|
•
|
an $11 million increase in commissions and closing costs that corresponds with the increased volume of transactions.
|
Net Contribution to Earnings
Net contribution to earnings decreased
$24 million
— 30 percent — primarily attributable to increased general and administrative expenses of $20 million. The increase in general and administrative expenses is the result of creating a standalone business segment separate from Timberlands and dedicating more staff to the expanded land and natural resource footprint.
COMPARING
2015
WITH
2014
Net Sales
Net sales decreased
$3 million
—
3 percent
— attributable to decreased net energy and natural resources sales —
$6 million
— primarily due to decreased oil and gas prices.
This decrease was partially offset by increased net real estate sales —
$3 million
, attributable to increases in volume of timberlands acres sold and an increase in average price realized per acre.
WEYERHAEUSER COMPANY >
2016 ANNUAL REPORT AND FORM 10-K
43
Costs of Products Sold and Net Contribution to Earnings
Costs of products sold and net contribution to earnings remained relatively flat between
2014
and
2015
.
WOOD PRODUCTS
HOW WE DID IN
2016
We report sales volume and annual production data for our Wood Products segment in
Our Business/What We Do/Wood Products
.
Net Sales and Net Contribution to Earnings for Wood Products
|
DOLLAR AMOUNTS IN MILLIONS
|
|||||||||||||||
|
|
|
|
|
AMOUNT OF CHANGE
|
|||||||||||
|
|
2016
|
|
2015
|
|
2014
|
|
2016
vs. 2015 |
|
2015
vs. 2014 |
|
|||||
|
Net sales:
|
|
|
|
|
|
||||||||||
|
Structural lumber
|
$
|
1,839
|
|
$
|
1,741
|
|
$
|
1,901
|
|
$
|
98
|
|
$
|
(160
|
)
|
|
Engineered solid section
|
450
|
|
428
|
|
402
|
|
22
|
|
26
|
|
|||||
|
Engineered I-joists
|
290
|
|
284
|
|
277
|
|
6
|
|
7
|
|
|||||
|
Oriented strand board
|
707
|
|
595
|
|
610
|
|
112
|
|
(15
|
)
|
|||||
|
Softwood plywood
|
174
|
|
129
|
|
143
|
|
45
|
|
(14
|
)
|
|||||
|
Medium density fiberboard
|
158
|
|
—
|
|
—
|
|
158
|
|
—
|
|
|||||
|
Other products produced
|
201
|
|
189
|
|
176
|
|
12
|
|
13
|
|
|||||
|
Complementary building products
|
515
|
|
506
|
|
461
|
|
9
|
|
45
|
|
|||||
|
Total
|
$
|
4,334
|
|
$
|
3,872
|
|
$
|
3,970
|
|
$
|
462
|
|
$
|
(98
|
)
|
|
Costs of products sold
|
$
|
3,688
|
|
$
|
3,487
|
|
$
|
3,495
|
|
$
|
201
|
|
$
|
(8
|
)
|
|
Operating income and Net contribution to earnings
|
$
|
512
|
|
$
|
258
|
|
$
|
327
|
|
$
|
254
|
|
$
|
(69
|
)
|
COMPARING
2016
WITH
2015
Upon our merger with Plum Creek, we acquired five manufacturing facilities in Montana. The sales and net contribution to earnings of these facilities as of the merger date are included in the results of our Wood Products segment. The results of the plywood facilities are reported in softwood plywood and the lumber facilities are reported in structural lumber.
The Medium Density Fiberboard (MDF) facility supplies high-quality MDF to a wide range of customers throughout North America. Some of the more common uses for our MDF include furniture and cabinet components, architectural moldings, doors, store fixtures, core material for hardwood plywood, face material for softwood plywood, commercial wall paneling and substrate for laminate flooring.
We permanently closed two of the five acquired Plum Creek mills, the lumber facility and softwood plywood facility in Columbia Falls, Montana, during third quarter 2016. The closure of these facilities allows us to align the available log supply with our manufacturing capacity, including adding shifts at our Kalispell, Montana facilities, to position our Montana operations for long-term success.
Net Sales
Net sales increased
$462 million
— 12 percent — primarily due to:
|
•
|
a
$158 million
increase in medium density fiberboard sales generated from operations acquired in our merger with Plum Creek;
|
|
•
|
a
$112 million
increase in oriented strand board sales, attributable primarily to a 21 percent increase in average sales realizations;
|
|
•
|
a
$98 million
increase in lumber sales, attributable to a 3 percent increase in average sales realizations and a 3 percent increase in sales volume; and
|
|
•
|
a
$45 million
increase in plywood sales, attributable to a 9 percent increase in average sales realizations and a 26 percent increase in sales volume, with the volume increase due in part to acquired Plum Creek operations.
|
Costs of Products Sold
Costs of products sold increased
$201 million
— 6 percent — primarily due to increased sales volume across most product lines and from added volumes produced and sold by the manufacturing operations acquired from our merger with Plum Creek. This increase is partially offset by lower log costs and lower manufacturing costs per unit.
Operating Income and Net Contribution to Earnings
Net contribution to earnings increased
$254 million
— 98 percent — primarily attributable to the changes in net sales and costs of products sold, as explained above.
COMPARING
2015
WITH
2014
Net Sales
Net sales decreased
$98 million
— 2 percent — primarily due to an 11 percent decrease in structural lumber average sales realizations, and a 9 percent decrease in OSB average sales realizations.
WEYERHAEUSER COMPANY >
2016 ANNUAL REPORT AND FORM 10-K
44
These decreases were partially offset by:
|
•
|
higher structural lumber sales volume — 3 percent;
|
|
•
|
higher OSB sales volume — 7 percent;
|
|
•
|
higher engineered solid section sales volume — 6 percent; and
|
|
•
|
higher sales of complementary building products — 10 percent.
|
Costs of Products Sold
Costs of products sold decreased
$8 million
primarily due to lower log, resin and manufacturing costs per unit.
Operating Income and Net Contribution to Earnings
Operating income and Net contribution to earnings decreased
$69 million
— 21 percent —primarily due to:
|
•
|
lower average sales realizations in lumber and OSB — $258 million and
|
|
•
|
pretax restructuring charges related to the closure of four distribution centers — $8 million.
|
These decreases were partially offset by:
|
•
|
lower unit manufacturing costs due to lower resin and other input costs, higher operating rates, and lower Canadian operating costs due to the strengthening of the U.S. dollar — $96 million;
|
|
•
|
lower costs due to decreasing log prices and lower Canadian log costs due to the strengthening of the U.S. dollar — $45 million;
|
|
•
|
lower general and administrative expenses — $28 million;
|
|
•
|
lower freight costs due to declining fuel prices — $18 million; and
|
|
•
|
higher sales volume across most product lines — $17 million.
|
UNALLOCATED ITEMS
Unallocated Items are gains or charges from continuing operations not related to or allocated to an individual operating segment. They include a portion of items such as: share-based compensation, pension and postretirement costs, foreign exchange transaction gains and losses associated with financing, and the elimination of intersegment profit in inventory and the LIFO reserve. As a result of reclassifying our former Cellulose Fibers segment and WRECO as discontinued operations, Unallocated Items also includes retained indirect corporate overhead costs previously allocated to the former segments.
Net Contribution to Earnings for Unallocated Items
|
DOLLAR AMOUNTS IN MILLIONS
|
|||||||||||||||
|
|
|
|
|
AMOUNT OF CHANGE
|
|||||||||||
|
|
2016
|
|
2015
|
|
2014
|
|
2016
vs. 2015 |
|
2015
vs. 2014 |
|
|||||
|
Unallocated corporate function expenses
|
$
|
(87
|
)
|
$
|
(64
|
)
|
$
|
(68
|
)
|
$
|
(23
|
)
|
$
|
4
|
|
|
Unallocated share-based compensation
|
(3
|
)
|
6
|
|
(9
|
)
|
(9
|
)
|
15
|
|
|||||
|
Unallocated pension and postretirement credits (costs)
|
43
|
|
11
|
|
196
|
|
32
|
|
(185
|
)
|
|||||
|
Foreign exchange gains (losses)
|
6
|
|
(46
|
)
|
(27
|
)
|
52
|
|
(19
|
)
|
|||||
|
Elimination of intersegment profit in inventory and LIFO
|
(18
|
)
|
8
|
|
(7
|
)
|
(26
|
)
|
15
|
|
|||||
|
Gain (loss) from sales of non-strategic assets
|
50
|
|
6
|
|
(1
|
)
|
44
|
|
7
|
|
|||||
|
Charges for integration and restructuring, closures and asset impairments:
|
|||||||||||||||
|
Plum Creek merger-and integration-related costs
|
(146
|
)
|
(14
|
)
|
—
|
|
(132
|
)
|
(14
|
)
|
|||||
|
Other restructuring, closures, and asset impairments
|
(2
|
)
|
(15
|
)
|
(41
|
)
|
13
|
|
26
|
|
|||||
|
Other
|
(37
|
)
|
(41
|
)
|
4
|
|
4
|
|
(45
|
)
|
|||||
|
Operating income (loss)
|
(194
|
)
|
(149
|
)
|
47
|
|
(45
|
)
|
(196
|
)
|
|||||
|
Equity earnings from joint venture
|
20
|
|
—
|
|
—
|
|
20
|
|
—
|
|
|||||
|
Interest income and other
|
43
|
|
36
|
|
38
|
|
7
|
|
(2
|
)
|
|||||
|
Net contribution to earnings
|
$
|
(131
|
)
|
$
|
(113
|
)
|
$
|
85
|
|
$
|
(18
|
)
|
$
|
(198
|
)
|
Unallocated Items in
2016
include:
|
•
|
charges recognized in 2016 related to our merger with Plum Creek (refer to
Note 17: Charges for Integration and Restructuring, Closures and Asset Impairments
in
Notes to Consolidated Financial Statements
) —
$146 million
;
|
|
•
|
an increase in unallocated corporate function expenses primarily as a result of retaining costs allocatable to our former Cellulose Fibers segment —
$23 million
;
|
|
•
|
a gain related to the sale of our Federal Way, Washington headquarters campus, which is recorded in "Other operating costs (income), net" in our
Consolidated Statement of Operations
– $36 million.
|
WEYERHAEUSER COMPANY >
2016 ANNUAL REPORT AND FORM 10-K
45
Unallocated Items in
2015
include:
|
•
|
$13 million noncash impairment charge recognized in first quarter 2015 related to a nonstrategic asset that was sold in second quarter 2015 which is recorded in "Charges for integration and restructuring, closures and asset impairments" in our
Consolidated Statement of Operations
. See
Note 17: Charges for Integration and Restructuring, Closures and Asset Impairments
in the
Notes to Consolidated Financial Statements
for more information.
|
|
•
|
$14 million Plum Creek merger-related costs which are recorded in "Charges for integration and restructuring, closures and asset impairments" in our
Consolidated Statement of Operations
.
|
INTEREST EXPENSE
Our net interest expense incurred for the last three years was:
|
•
|
$431 million
in
2016
,
|
|
•
|
$341 million
in
2015
and
|
|
•
|
$338 million
in
2014
.
|
The primary factor driving the $90 million increase in interest expense in 2016 is the increase in our average indebtedness throughout the year. Our outstanding debt balance and effective interest rate did not materially change during
2015
or
2014
.
INCOME TAXES
As a REIT, we generally are not subject to federal corporate level income taxes on REIT taxable income that is distributed to shareholders. Historical distributions to shareholders, including amounts and tax characteristics, for the years ended December 31 are summarized in the table below.
We are no longer subject to the REIT built-in gains tax as of December 31, 2014. Our built-in gains tax period expired in 2015 due to a change in U.S. tax law that statutorily shortened the built-in gains tax period to 5 years from 10 years. This means we are no longer subject to federal corporate level income taxes on sales of REIT property that had a fair market value in excess of tax basis when we converted to a REIT on January 1, 2010.
|
AMOUNTS PER SHARE
|
|||||||||
|
|
2016
|
|
2015
|
|
2014
|
|
|||
|
Preference - capital gain distribution
|
$
|
1.59
|
|
$
|
3.19
|
|
$
|
3.19
|
|
|
Common - capital gain distribution
|
$
|
1.24
|
|
$
|
1.20
|
|
$
|
1.02
|
|
The table below summarizes the items of tax preference for alternative minimum tax (AMT) purposes which have been apportioned to shareholders for the years ended December 31.
|
AMOUNTS PER SHARE
|
|||||||||
|
|
2016
|
|
2015
|
|
2014
|
|
|||
|
Preference - AMT
|
$
|
0.0120
|
|
$
|
—
|
|
$
|
—
|
|
|
Common - AMT
|
$
|
0.0094
|
|
$
|
—
|
|
$
|
—
|
|
We are required to pay corporate income taxes on earnings of our TRSs, which includes our manufacturing business and portions of our Timberlands and Real Estate & ENR segments' earnings. Our provision for income taxes is primarily driven by earnings generated by our TRSs. Overall performance results for our business segments can be found in
Results of Operations/Timberlands
,
Results of Operations/Real Estate, Energy and Natural Resources
, and
Results of Operations/Wood Products
.
Our provision (benefit) for income taxes for our continuing operations over the last three years was:
|
•
|
$89 million
in
2016
,
|
|
•
|
$(58) million
in
2015
and
|
|
•
|
$71 million
in
2014
.
|
During 2016, we recorded a $24 million tax charge related to the repatriation of Canadian earnings.
During 2015, we recorded a $13 million tax benefit for the expiration of the company’s built-in-gains tax period due to a change in tax law in the fourth quarter 2015.
See also
Note 19: Income Taxes
in
Notes to Consolidated Financial Statements
, which outlines the major components related to our income tax provision.
WEYERHAEUSER COMPANY >
2016 ANNUAL REPORT AND FORM 10-K
46
|
LIQUIDITY AND CAPITAL RESOURCES
|
We are committed to maintaining a sound, conservative capital structure that enables us to:
|
•
|
protect the interests of our shareholders and lenders and
|
|
•
|
have access at all times to major financial markets.
|
CASH FROM OPERATIONS
Consolidated net cash provided by our continuing and discontinued operations was:
|
•
|
$735 million
in
2016
,
|
|
•
|
$1,075 million
in
2015
and
|
|
•
|
$1,109 million
in
2014
.
|
COMPARING
2016
WITH
2015
Net cash provided by our continuing and discontinued operations decreased
$340 million
, primarily due to:
|
•
|
an increase in cash paid for income taxes of
$471 million
largely due to taxes paid in connection with the sale of our Cellulose Fibers businesses;
|
|
•
|
decreased operating cash flows from discontinued operations of
$233 million
;
|
|
•
|
an increase in cash paid for interest of
$99 million
corresponding with our increased average indebtedness; and
|
|
•
|
cash payments made in 2016 related to the Plum Creek merger of $154 million, comprised of:
|
|
◦
|
termination benefits – $33 million;
|
|
◦
|
investment banking and other professional services fees –
$52 million
;
|
|
◦
|
settlement of Value Management Awards –
$6 million
;
|
|
◦
|
pension and postretirement benefits –
$38 million
; and
|
|
◦
|
other merger-related costs –
$14 million
.
|
These decreases were partially offset by increased cash flows from our business segments of $547 million. See
Performance Measures
for our Adjusted EBITDA by segment.
COMPARING
2015
WITH
2014
Net cash provided by our continuing and discontinued operations decreased
$34 million
, primarily due to an increase in cash paid for income taxes of
$51 million
and an increase in cash paid for interest of
$28 million
. These decreases were partially offset by increased operating cash flows from discontinued operations of
$30 million
and a decrease in cash used to fund our pension plans of $18 million.
Pension Contributions and Benefit Payments Made and Expected
During
2016
, we:
|
•
|
contributed $16 million for our Canadian registered plan in accordance with minimum funding rules and respective provincial regulations;
|
|
•
|
contributed to or made benefit payments for our Canadian nonregistered pension plans of
$2 million
;
|
|
•
|
made benefit payments of
$60 million
for our U.S. nonqualified pension plans; and
|
|
•
|
made benefit payments of
$21 million
for our U.S. and Canadian other postretirement plans.
|
There was no minimum required contribution for our U.S. qualified plan for
2016
, nor were any contributions made to this plan in
2016
.
During
2017
, based on estimated year-end assets and projections of plan liabilities, we expect to:
|
•
|
be required to contribute approximately $19 million for our Canadian registered plan;
|
|
•
|
be required to contribute or make benefit payments for our Canadian nonregistered plans of $3 million;
|
|
•
|
make benefit payments of $26 million for our U.S. nonqualified pension plans; and
|
|
•
|
make benefit payments of $21 million for our U.S. and Canadian other postretirement plans.
|
We do not anticipate a contribution being required to our U.S. qualified pension plan for
2017
.
INVESTING IN OUR BUSINESS
Cash from investing activities includes:
|
•
|
acquisitions of property, equipment, timberlands and reforestation;
|
|
•
|
investments in or distribution from equity affiliates;
|
|
•
|
proceeds from sale of assets and operations; and
|
|
•
|
purchases and redemptions of short-term investments.
|
Consolidated net cash provided by (used in) investing activities was:
|
•
|
$2,559 million
in
2016
,
|
|
•
|
$(487) million
in
2015
and
|
|
•
|
$361 million
in
2014
.
|
WEYERHAEUSER COMPANY >
2016 ANNUAL REPORT AND FORM 10-K
47
COMPARING
2016
WITH
2015
Net cash from investing activities changed $
3,046 million
to an inflow in
2016
as compared with an outflow in
2015
, primarily due to:
|
•
|
net proceeds from the divestitures of our Cellulose Fibers businesses in 2016 —
$2.5 billion
;
|
|
•
|
proceeds received for our contribution of Timberlands to the Twin Creeks Venture —
$440 million
;
|
|
•
|
proceeds from sales of non-strategic assets —
$104 million
; and
|
|
•
|
distributions received from joint ventures during 2016 —
$46 million
.
|
COMPARING
2015
WITH
2014
Net cash from investing activities changed
$848 million
to an outflow in 2015 as compared with an inflow in 2014, primarily due to:
|
•
|
net proceeds from the WRECO Divestiture, net of cash divested in 2014; and
|
|
•
|
higher capital spending in 2015.
|
CELLULOSE FIBERS DIVESTITURES IN 2016
We divested our Cellulose Fibers business operations in three separate transactions during 2016.
On May 1, 2016, we entered into an agreement to sell our Cellulose Fibers pulp business to International Paper for
$2.2 billion
in cash. The pulp business consists of five pulp mills located in Columbus, Mississippi; Flint River, Georgia; New Bern, North Carolina; Port Wentworth, Georgia and Grand Prairie, Alberta, and two modified fiber mills located in Columbus, Mississippi and Gdansk, Poland. On December 1, 2016, we completed the sale and recognized a pretax gain of
$735 million
.
On June 15, 2016, we entered into an agreement to sell our Cellulose Fibers liquid packaging board business to Nippon Paper Industries Co., Ltd., for
$285 million
in cash. Our liquid packaging board business consisted of one mill located in Longview, Washington. On August 31, 2016, we completed the sale. We recognized a pretax gain of
$53 million
.
On October 4, 2016, we entered into an agreement to sell our interest in our printing papers joint venture to One Rock Capital Partners, LLC. The transaction included the printing papers mill located in Longview, Washington. On November 1, 2016, we completed the sale.
We used
$1.7 billion
of the after-tax proceeds from the sale of our Cellulose Fibers businesses for repayment of term loans.
More information can be found in
Note 3: Discontinued Operations
in
Notes to Consolidated Financial Statements
.
WRECO DIVESTITURE IN 2014
At the close of the WRECO Divestiture in July 2014, WRECO used $744 million of the debt proceeds to repay intercompany debt and interest to Weyerhaeuser Company. The newly issued debt, remaining proceeds and other WRECO assets and liabilities, including $5 million cash on hand, were acquired by TRI Pointe Homes, Inc. (TRI Pointe) when WRECO became a wholly-owned subsidiary of TRI Pointe at the closing of the transaction. Additionally, $32 million related to the adjustment amount payable pursuant to the terms of the transaction agreement was paid to TRI Pointe. Our net cash proceeds in connection with the WRECO Divestiture totaled $707 million. More information can be found in
Note 3: Discontinued Operations
in
Notes to Consolidated Financial Statements
and the "Cash from Financing Activities" section below.
Three-Year Summary of Capital Spending by Business Segment
|
DOLLAR AMOUNTS IN MILLIONS
|
|||||||||
|
|
2016
|
|
2015
|
|
2014
|
|
|||
|
Timberlands
|
$
|
116
|
|
$
|
75
|
|
$
|
74
|
|
|
Real Estate & ENR
|
1
|
|
—
|
|
—
|
|
|||
|
Wood Products
|
297
|
|
287
|
|
190
|
|
|||
|
Unallocated Items
|
11
|
|
3
|
|
4
|
|
|||
|
Discontinued operations
|
85
|
|
118
|
|
127
|
|
|||
|
Total
|
$
|
510
|
|
$
|
483
|
|
$
|
395
|
|
We expect our net capital expenditures for
2017
to be $435 million, which is comparable to
2016
capital spend for continuing operations. The amount we spend on capital expenditures could change due to:
|
•
|
future economic conditions,
|
|
•
|
environmental regulations,
|
|
•
|
changes in the composition of our business,
|
|
•
|
weather and
|
|
•
|
timing of equipment purchases.
|
NOTE RECEIVABLE
In 2014, we received $25 million in full payment of a note receivable and interest of $7 million made in connection with the divestiture of our hardwoods operations in 2011, which is recorded in "Other" in the "Cash flows from investing activities" in our
Consolidated Statement of Cash Flows
.
WEYERHAEUSER COMPANY >
2016 ANNUAL REPORT AND FORM 10-K
48
PROCEEDS FROM THE SALE OF NONSTRATEGIC ASSETS
Proceeds received from the sale of various nonstrategic assets over the last three years were:
|
•
|
$104 million
in
2016
,
|
|
•
|
$19 million
in
2015
and
|
|
•
|
$28 million
in
2014
.
|
In first quarter 2016, we sold our former corporate headquarters located in Federal Way, Washington, for $70 million.
FINANCING
Cash from financing activities includes:
|
•
|
issuances and payments of debt,
|
|
•
|
borrowings and payments under revolving lines of credit,
|
|
•
|
proceeds from stock offerings and option exercises and
|
|
•
|
payments for cash dividends and repurchasing stock.
|
Consolidated net cash used in financing activities was:
|
•
|
$3,630 million
in
2016
,
|
|
•
|
$1,156 million
in
2015
and
|
|
•
|
$725 million
in
2014
.
|
COMPARING
2016
WITH
2015
Net cash used in financing activities increased
$2,474 million
in
2016
, primarily due to:
|
•
|
a $1,485 million increase in repurchase shares,
|
|
•
|
payment of
$720 million
of the debt assumed in our merger with Plum Creek on the merger date and
|
|
•
|
a $313 million increase in dividends paid to common shareholders.
|
COMPARING
2015
WITH
2014
Net cash used in financing activities increased
$431 million
in
2015
, primarily due to a $315 million increase in share repurchases, an $85 million decrease in proceeds from employee stock option exercises, and a $56 million increase in common stock dividends paid.
Our consolidated long-term debt was
$6.6 billion
as of
December 31, 2016
, and
$4.8 billion
as of
December 31, 2015
, and
December 31, 2014
. The increase in our long-term debt during
2016
is primarily due to the $3.4 billion of long-term debt assumed from our merger with Plum Creek. Refer to
Note 4: Merger with Plum Creek
in
Notes to Consolidated Financial Statements
for further information. Immediately following the merger we paid back
$720 million
of the debt assumed. Additionally,
$88 million
of long-term debt was assumed by International Paper when they acquired our Cellulose Fibers Pulp business in fourth quarter 2016.
Aside from the WRECO debt and term loans described below, there were no long-term debt proceeds in 2016,
2015
and
2014
.
During 2014, our wholly-owned subsidiary, WRECO, issued $450 million of unsecured and unsubordinated senior debt obligations bearing an interest rate of 4.375 percent due June 15, 2019, and $450 million of unsecured and unsubordinated senior debt obligations bearing an interest rate of 5.875 percent due June 15, 2024. The net proceeds were deposited into an escrow account. Upon closure of the transaction, the newly issued debt and remaining proceeds were acquired by TRI Pointe, along with other WRECO assets and liabilities.
Aside from the term loans described below and the payment of a portion of the Plum Creek debt assumed in the merger on the merger date as described above, there were no long-term debt retirements in 2016,
2015
and
2014
.
We have
$281 million
of long-term debt scheduled to mature in the next twelve months.
See
Note 3: Discontinued Operations
and
Note 12: Long-Term Debt
in the
Notes to Consolidated Financial Statements
for more information.
TERM LOANS ISSUED AND EXTINGUISHED
During
February 2016
, and subsequent to completion of the Plum Creek merger, we entered into a
$600 million
18-month
senior unsecured term loan maturing in
August 2017
. Borrowings were at
LIBOR plus 1.05 percent
. The
$600 million
outstanding under this facility was repaid in full and terminated during fourth quarter 2016.
During
March 2016
, we entered into a
$1.9 billion
18-month
senior unsecured term loan maturing in
September 2017
. Borrowings were at
LIBOR plus 1.05 percent
. The
$1.1 billion
outstanding under this facility was repaid in full and terminated during fourth quarter 2016.
REVOLVING CREDIT FACILITIES
During September 2013, Weyerhaeuser Company entered into a $1 billion 5-year senior unsecured revolving credit facility that expires in September 2018. As of June 16, 2014, WRECO terminated its participation as a borrower in the facility. There were no net proceeds from the issuance of debt or from borrowings (repayments) under our available credit facility in
2016
,
2015
or
2014
.
Debt covenants:
As of
December 31, 2016
, Weyerhaeuser Company:
|
•
|
had no borrowings outstanding under our credit facility and
|
|
•
|
was in compliance with the credit facility covenants.
|
WEYERHAEUSER COMPANY >
2016 ANNUAL REPORT AND FORM 10-K
49
Weyerhaeuser Company Covenants:
Key covenants related to Weyerhaeuser Company include the requirement to maintain:
|
•
|
a minimum defined net worth of $3.0 billion;
|
|
•
|
a defined debt-to-total-capital ratio of 65 percent or less; and
|
|
•
|
ownership of, or long-term leases on, no less than four million acres of timberlands.
|
Weyerhaeuser Company’s defined net worth is comprised of:
|
•
|
total Weyerhaeuser shareholders’ interest,
|
|
•
|
excluding accumulated comprehensive income (loss) related to pension and postretirement benefits,
|
|
•
|
minus Weyerhaeuser Company’s investment in our unrestricted subsidiaries.
|
Total Weyerhaeuser Company capitalization is comprised of:
|
•
|
total Weyerhaeuser Company debt
|
|
•
|
plus total defined net worth.
|
As of
December 31, 2016
, Weyerhaeuser Company had:
|
•
|
a defined net worth of $10.8 billion and
|
|
•
|
a defined debt-to-total-capital ratio of 38 percent.
|
Debt agreements that were assumed by Weyerhaeuser in the merger with Plum Creek were amended to materially conform key covenants with the covenants described above.
When calculating compliance in accordance with financial debt covenants, we exclude the impact of our pension and other postretirement plans recorded within cumulative other comprehensive income from adjusted shareholders' interest (equity). The excluded amounts are
$1,698 million
and
$1,425 million
and are equal to the cumulative actuarial losses and prior service costs for our pension and postretirement plans at December 31, 2016, and December 31, 2015, respectively (see
Note 15: Shareholders' Interest
in the
Notes to Consolidated Financial Statements
).
There are no other significant financial debt covenants related to our third party debt. See
Note 11: Lines of Credit
in the
Notes to Consolidated Financial Statements
for more information.
CREDIT RATINGS
Upon completion of our merger with Plum Creek on February 19, 2016, S&P changed our long-term issuer credit ratings from BBB to BBB-.
On April 14, 2015, Moody's Investors Service upgraded our long-term issuer credit ratings from Baa3 to Baa2. There was no change to our Moody's rating as a result of completing the merger with Plum Creek.
OPTION EXERCISES
Our cash proceeds from the exercise of stock options were:
|
•
|
$61 million in
2016
,
|
|
•
|
$34 million in
2015
and
|
|
•
|
$119 million
in
2014
.
|
Our average stock price was $30.01, $31.67 and $31.89 in
2016
,
2015
and
2014
, respectively.
DIVIDENDS
We paid cash dividends on common shares of:
|
•
|
$932 million
in
2016
,
|
|
•
|
$619 million
in
2015
and
|
|
•
|
$563 million
in
2014
.
|
Changes in the amount of dividends we paid were primarily due to:
|
•
|
an increase in our quarterly dividend from 22 cents per share to 29 cents per share in August 2014;
|
|
•
|
an increase in our quarterly dividend from 29 cents per share to 31 cents per share in August 2015; and
|
|
•
|
an increase in the number of common shares outstanding during 2016, which was primarily attributable to the
278,886,704
shares issued as consideration in our merger with Plum Creek on February 19, 2016, offset by our subsequent repurchase of
67,816,810
shares between March 2016 and July 2016.
|
We paid cash dividends on preference shares of
$22 million
in
2016
and $44 million in
2015
.
Our dividends declared on preference shares were 79.69 cents per share in:
|
•
|
February and May
2016
,
|
|
•
|
February, May, August and October
2015
and
|
|
•
|
February, April, August and October
2014
.
|
On July 1, 2016, all outstanding 6.375 percent Mandatory Convertible Preference Shares, Series A (Preference Shares) converted into Weyerhaeuser common shares at a rate of 1.6929 Weyerhaeuser common shares per Preference Share. See
Note 5: Net Earnings Per Share
in the
Notes to Consolidated Financial Statements
for more information.
On February 10, 2017, our board of directors declared a dividend of 31 cents per share, payable on March 17, 2017, to shareholders of record at the close of business March 3, 2017.
WEYERHAEUSER COMPANY >
2016 ANNUAL REPORT AND FORM 10-K
50
STOCK REPURCHASES
On August 13, 2014, our board of directors approved a stock repurchase program under which we were authorized to repurchase up to
$700 million
of outstanding shares (the 2014 Repurchase Program). The 2014 Repurchase Program replaced the prior 2011 stock repurchase program. During 2014, we repurchased
6,062,993
shares of common stock for
$203 million
under the 2014 Repurchase Program. During 2015 we completed the 2014 Repurchase Program by repurchasing
15,471,962
shares of common stock for
$497 million
. All common stock purchases under the stock repurchase program were made in open-market transactions.
On August 27, 2015, our board of directors approved a new share repurchase program of up to
$500 million
of outstanding shares (the 2015 Repurchase Program), commencing upon completion of the 2014 Repurchase Program. During 2015, we repurchased
717,464
shares of common stock for
$22 million
under the 2015 Repurchase Program. As of December 31, 2015 we had remaining authorization of
$478 million
for future stock repurchases. All common stock purchases under the stock repurchase program were made in open-market transactions.
The 2016 Share Repurchase Authorization was approved in November 2015 by our Board of Directors and authorized management to repurchase up to
$2.5 billion
of outstanding shares subsequent to the closing of our merger with Plum Creek (the 2016 Repurchase Program). This new authorization replaced the August 2015 share repurchase authorization. During 2016, we repurchased
67,816,810
shares of common stock for
$2 billion
under the 2016 Repurchase Program. As of December 31, 2016, we had remaining authorization of
$500 million
for future stock repurchases. All common stock purchases under the stock repurchase program were made in open-market transactions. We had
748,528,131
shares of common stock outstanding as of December 31, 2016.
OUR CONTRACTUAL OBLIGATIONS AND COMMERCIAL COMMITMENTS
More details about our contractual obligations and commercial commitments are in
Note 9: Pension and Other Postretirement Benefit Plans
,
Note 12: Long-Term Debt
,
Note 14: Legal Proceedings, Commitments and Contingencies
and
Note 19: Income Taxes
in the
Notes to Consolidated Financial Statements
.
Significant Contractual Obligations as of
December 31, 2016
|
DOLLAR AMOUNTS IN MILLIONS
|
|||||||||||||||
|
|
|
|
PAYMENTS DUE BY PERIOD
|
||||||||||||
|
|
TOTAL
|
|
LESS THAN
1 YEAR
|
|
1–3
YEARS
|
|
3–5
YEARS
|
|
MORE THAN
5 YEARS
|
|
|||||
|
Long-term debt obligations, including current portion
|
$
|
6,628
|
|
$
|
281
|
|
$
|
562
|
|
$
|
1,306
|
|
$
|
4,479
|
|
|
Interest
(1)
|
3,490
|
|
392
|
|
738
|
|
633
|
|
1,727
|
|
|||||
|
Operating lease obligations
|
269
|
|
34
|
|
59
|
|
45
|
|
131
|
|
|||||
|
Purchase obligations
(2)
|
76
|
|
55
|
|
21
|
|
—
|
|
—
|
|
|||||
|
Harvest commitments
(3)
|
39
|
|
12
|
|
26
|
|
—
|
|
1
|
|
|||||
|
Employee-related obligations
(4)
|
483
|
|
174
|
|
63
|
|
40
|
|
94
|
|
|||||
|
Liabilities related to unrecognized tax benefits
(Note 19)
(5)
|
6
|
|
—
|
|
—
|
|
—
|
|
—
|
|
|||||
|
Total
|
$
|
10,991
|
|
$
|
948
|
|
$
|
1,469
|
|
$
|
2,024
|
|
$
|
6,432
|
|
|
(1) Amounts presented for interest payments assume that all long-term debt obligations outstanding as of December 31, 2016 will remain outstanding until maturity, and interest rates on variable-rate debt in effect as of December 31, 2016 will remain in effect until maturity.
(2) Purchase obligations include agreements to purchase goods or services that are enforceable and legally binding on the company and that specify all significant terms, including: fixed or minimum quantities to be purchased; fixed, minimum or variable price provisions; and the approximate timing of the transaction. Purchase obligations exclude arrangements that the company can cancel without penalty.
(3) Harvest commitments are purchased at market value and can be resold at market value in the future.
(4) The timing of certain of these payments will be triggered by retirements or other events. These payments can include workers' compensation, deferred compensation and banked vacation, among other obligations. When the timing of payment is uncertain, the amounts are included in the total column only. Minimum pension funding is required by established funding standards and estimates are not made beyond 2017. Estimated payments of contractually obligated postretirement benefits are not included due to the uncertainty of payment timing.
(5) We have recognized total liabilities related to unrecognized tax benefits of $6 million as of December 31, 2016. The timing of payments related to these obligations is uncertain; however, none of this amount is expected to be paid within the next year.
|
|||||||||||||||
|
OFF-BALANCE SHEET ARRANGEMENTS
|
Off-balance sheet arrangements have not had — and are not reasonably likely to have — a material effect on our current or future financial condition, results of operations or cash flows.
Note 8: Related Parties
and
Note 11: Lines of Credit
in the
Notes to Consolidated Financial Statements
contain our disclosures of:
|
•
|
surety bonds,
|
|
•
|
letters of credit and guarantees and
|
|
•
|
information regarding variable interest entities.
|
|
ENVIRONMENTAL MATTERS, LEGAL PROCEEDINGS AND OTHER CONTINGENCIES
|
See
Note 14: Legal Proceedings, Commitments and Contingencies
in the
Notes to Consolidated Financial Statements
.
WEYERHAEUSER COMPANY >
2016 ANNUAL REPORT AND FORM 10-K
51
|
ACCOUNTING MATTERS
|
CRITICAL ACCOUNTING POLICIES
Our critical accounting policies involve a higher degree of judgment and estimates. They also have a high degree of complexity.
In accounting, we base our judgments and estimates on:
|
•
|
historical experience and
|
|
•
|
assumptions we believe are appropriate and reasonable under current circumstances.
|
Actual results, however, may differ from the estimated amounts we have recorded.
Our most critical accounting policies relate to our:
|
•
|
pension and postretirement benefit plans;
|
|
•
|
potential impairments of long-lived assets;
|
|
•
|
legal, environmental and product liability reserves;
|
|
•
|
timber depletion; and
|
|
•
|
business combinations.
|
Details about our other significant accounting policies — what we use and how we estimate — are in
Note 1: Summary of Significant Accounting Policies
in the
Notes to Consolidated Financial Statements
.
PENSION AND POSTRETIREMENT BENEFIT PLANS
We sponsor several pension and postretirement benefit plans for our employees. Key assumptions we use in accounting for the plans include our:
|
•
|
expected long-term rate of return on plan assets,
|
|
•
|
discount rates,
|
|
•
|
anticipated trends in health care costs,
|
|
•
|
assumed increases in salaries and
|
|
•
|
mortality rates.
|
At the end of every year, we review our assumptions with external advisers and make adjustments as appropriate. Actual experience that differs from our assumptions or any changes in our assumptions could have a significant effect on our financial position, results of operations and cash flows.
Other factors that affect our accounting for the plans include:
|
•
|
actual pension fund performance,
|
|
•
|
level of lump sum distributions,
|
|
•
|
plan changes and amendments,
|
|
•
|
changes in plan participation or coverage and
|
|
•
|
portfolio changes and restructuring.
|
This section provides more information about our:
|
•
|
expected long-term rate of return and
|
|
•
|
discount rates.
|
Expected Long-Term Rate of Return on Plan Assets
Plan assets are assets of the pension plan trusts that fund the benefits provided under the pension plans. The expected long-term rate of return is our estimate of the long-term rate of return that our plan assets will earn. Our expected long-term rate of return is important in determining the net periodic benefit or cost we recognize for our plans.
Over the
32 years
it has been in place, our U.S. pension trust investment strategy has achieved a
13.8 percent
net compound annual return rate.
After considering available information at the end of
2016
, we have determined that we will reduce our assumption of long-term rate of return on plan assets used in determining net periodic benefit cost from 9 percent for the year ended December 31, 2016, to 8 percent for the year ended December 31, 2017.
Factors we considered include:
|
•
|
the net compounded annual return of
8.1 percent
achieved by our U.S. pension trust investment strategy the past 5 years and
|
|
•
|
current and expected valuation levels in the global equity and credit markets.
|
Our expected long-term rate of return is important in determining the net periodic benefit or cost we recognize for our plans. Every 50 basis point decrease in our expected long-term rate of return would increase expense or reduce a credit by approximately:
|
•
|
$23 million for our U.S. qualified pension plans and
|
|
•
|
$4 million for our Canadian registered pension plans.
|
The actual return on plan assets in any given year may vary from our expected long-term rate of return. Actual returns on plan assets affect the funded status of the plans. Differences between actual returns on plan assets and the expected long-term rate of return are reflected as adjustments to cumulative other comprehensive income (loss), a component of total equity.
Discount Rates
Our discount rates as of
December 31, 2016
, are:
|
•
|
4.3 percent
for our U.S. pension plans — compared with
4.5 percent
at
December 31, 2015
;
|
|
•
|
3.7 percent
for our U.S. postretirement plans — compared with
4.0 percent
at
December 31, 2015
;
|
WEYERHAEUSER COMPANY >
2016 ANNUAL REPORT AND FORM 10-K
52
|
•
|
3.7 percent
for our Canadian pension plans — compared with
4.0 percent
at
December 31, 2015
; and
|
|
•
|
3.6 percent
for our Canadian postretirement plans — compared with
3.9 percent
at
December 31, 2015
.
|
We review our discount rates annually and revise them as needed. The discount rates are selected at the measurement date by matching current spot rates of high-quality corporate bonds with maturities similar to the timing of expected cash outflows for benefits.
Pension and postretirement benefit expenses for
2017
will be based on the
4.3 percent
and
3.7 percent
assumed discount rates for U.S. plans and
3.7 percent
and
3.6 percent
assumed discount rates for the Canadian plans.
Our discount rates are important in determining the cost of our plans. A 50 basis point decrease in our discount rate would increase expense or reduce a credit by approximately:
|
•
|
$42 million for our U.S. qualified pension plans and
|
|
•
|
$5 million for our Canadian registered pension plans.
|
LONG-LIVED ASSETS
We review the carrying value of our long-lived assets whenever events or changes in circumstances indicate that the carrying value of the assets may not be recoverable through future operations. The carrying value is the amount assigned to long-lived assets in our financial statements.
An impairment occurs when the carrying value of long-lived assets will not be recovered from future cash flows and is more than fair market value. Fair market value is the estimated amount we would receive if we were to sell the assets.
In determining fair market value and whether impairment has occurred, we are required to estimate:
|
•
|
future cash flows,
|
|
•
|
residual values and
|
|
•
|
fair values of the assets.
|
Key assumptions we use in developing the estimates include:
|
•
|
probability of alternative outcomes,
|
|
•
|
product pricing,
|
|
•
|
raw material costs,
|
|
•
|
product sales and
|
|
•
|
discount rate.
|
CONTINGENT LIABILITIES
We are subject to lawsuits, investigations and other claims related to environmental, product and other matters, and are required to assess the likelihood of any adverse judgments or outcomes to these matters, as well as potential ranges of probable losses.
We record contingent liabilities when:
|
•
|
it becomes probable that we will have to make payments and
|
|
•
|
the amount of loss can be reasonably estimated.
|
Assessing probability of loss and estimating probable losses requires analysis of multiple factors, including:
|
•
|
historical experience,
|
|
•
|
judgments about the potential actions of third party claimants and courts and
|
|
•
|
recommendations of legal counsel.
|
In addition to contingent liabilities recorded for probable losses, we disclose contingent liabilities when there is a reasonable possibility that an ultimate loss may occur.
While we do our best in developing our projections, recorded contingent liabilities are based on the best information available and actual losses in any future period are inherently uncertain. If estimated probable future losses or actual losses exceed our recorded liability for such claims, we would record additional charges in other (income) expense, net. These exposures and proceedings can be significant and the ultimate negative outcomes could be material to our operating results or cash flow in any given quarter or year. See
Note 14: Legal Proceedings, Commitments and Contingencies
in the
Notes to Consolidated Financial Statements
for more information.
TIMBER DEPLETION
We record depletion, the costs attributed to timber harvested, as trees are harvested.
To calculate our depletion rates, which are updated annually, we:
|
•
|
take the total carrying cost of the timber and
|
|
•
|
divide by the total timber volume estimated to be harvested during the harvest cycle.
|
Estimating the volume of timber available for harvest over the harvest cycle requires consideration of the following factors:
|
•
|
effects of fertilizer and pesticide applications,
|
|
•
|
changes in environmental regulations and other regulatory restrictions,
|
|
•
|
limits on harvesting certain timberlands,
|
|
•
|
changes in harvest plans,
|
|
•
|
scientific advancement in seedling and growing technology; and
|
|
•
|
changes in weather patterns.
|
In addition, the duration of the harvest cycle varies by geographic region and species of timber.
WEYERHAEUSER COMPANY >
2016 ANNUAL REPORT AND FORM 10-K
53
Depletion rate calculations do not include estimates for:
|
•
|
future silviculture or sustainable forest management costs associated with existing stands,
|
|
•
|
future reforestation costs associated with a stand's final harvest; and
|
|
•
|
future volume in connection with the replanting of a stand subsequent to its final harvest.
|
A 5 percent decrease in our estimate of future harvest volumes would have:
|
•
|
increased depletion expense by $13 million for
2016
and
|
|
•
|
increased depletion expense by $7 million for
2015
.
|
BUSINESS COMBINATIONS
We recognize identifiable assets acquired and liabilities assumed at their acquisition date fair value. Goodwill, if any, as of the acquisition date is measured as the excess of consideration transferred over the net of the acquisition date fair values of the assets acquired and the liabilities assumed. While we use our best estimates and assumptions for the purchase price allocation process to value assets acquired and liabilities assumed at the acquisition date, our estimates are inherently uncertain and subject to refinement. As a result, during the measurement period, which may be up to one year from the acquisition date, we record adjustments to the assets acquired and liabilities assumed, with the corresponding offset to any goodwill previously recorded (or to earnings in the event that no goodwill was previously recorded) to the extent that we identify adjustments to the preliminary purchase price allocation. Beginning January 1, 2016, we have adopted ASU 2015-16, which eliminates the requirements to retrospectively apply measurement period adjustments to the preliminary purchase price allocation and revise comparative information on the income statement and balance sheet for any prior periods affected. We will recognize measurement period adjustments and any resulting effect on earnings during the period in which the adjustment is identified. Upon the conclusion of the measurement period or final determination of the values of assets acquired or liabilities assumed, whichever comes first, any subsequent adjustments are recorded to our consolidated statement of operations.
PROSPECTIVE ACCOUNTING PRONOUNCEMENTS
A summary of prospective accounting pronouncements is in
Note 1: Summary of Significant Accounting Policies
in the
Notes to Consolidated Financial Statements
.
|
PERFORMANCE MEASURES
|
We use Adjusted Earnings before Interest, Taxes, Depreciation, Depletion and Amortization (Adjusted EBITDA) as a key performance measure to evaluate the performance of the consolidated company and our business segments. This measure should not be considered in isolation from and is not intended to represent an alternative to our results reported in accordance with U.S. generally accepted accounting principles (U.S. GAAP). However, we believe Adjusted EBITDA provides meaningful supplemental information for our investors about our operating performance, better facilitates period to period comparisons, and is widely used by analysts, lenders, rating agencies and other interested parties. Our definition of Adjusted EBITDA may be different from similarly titled measures reported by other companies. Due to organizational changes and our February 19, 2016 merger with Plum Creek, effective for 2016, we have revised our definition of Adjusted EBITDA to add back the basis of real estate sold. We have revised our prior-period presentation to conform to our current reporting. Adjusted EBITDA, as we define it, is operating income from continuing operations adjusted for depreciation, depletion, amortization, basis of real estate sold, pension and postretirement costs not allocated to business segments (primarily interest cost, expected return on plan assets, amortization of actuarial loss and amortization of prior service cost/credit), and special items. Adjusted EBITDA excludes results from joint ventures.
Adjusted EBITDA by Segment
|
DOLLAR AMOUNTS IN MILLIONS
|
|||||||||
|
|
2016
|
|
2015
|
|
2014
|
|
|||
|
Timberlands
|
$
|
865
|
|
$
|
678
|
|
$
|
739
|
|
|
Real Estate & ENR
|
189
|
|
98
|
|
98
|
|
|||
|
Wood Products
|
641
|
|
372
|
|
446
|
|
|||
|
1,695
|
|
1,148
|
|
1,283
|
|
||||
|
Unallocated Items
|
(112
|
)
|
(123
|
)
|
(120
|
)
|
|||
|
Total
|
$
|
1,583
|
|
$
|
1,025
|
|
$
|
1,163
|
|
We reconcile Adjusted EBITDA to net earnings for the consolidated company and to operating income for the business segments, as those are the most directly comparable U.S. GAAP measures for each.
WEYERHAEUSER COMPANY >
2016 ANNUAL REPORT AND FORM 10-K
54
The table below reconciles Adjusted EBITDA by segment to net earnings during the year ended
2016
:
|
DOLLAR AMOUNTS IN MILLIONS
|
|||||||||||||||
|
|
TIMBERLANDS
|
|
REAL ESTATE & ENR
|
|
WOOD PRODUCTS
|
|
UNALLOCATED ITEMS
|
|
TOTAL
|
|
|||||
|
Net earnings
|
$
|
1,027
|
|
||||||||||||
|
Earnings from discontinued operations, net of taxes
|
(612
|
)
|
|||||||||||||
|
Interest expense, net of capitalized interest
|
431
|
|
|||||||||||||
|
Income taxes
|
89
|
|
|||||||||||||
|
Net contribution to earnings
|
$
|
499
|
|
$
|
55
|
|
$
|
512
|
|
$
|
(131
|
)
|
$
|
935
|
|
|
Equity earnings from joint ventures
|
—
|
|
(2
|
)
|
—
|
|
(20
|
)
|
(22
|
)
|
|||||
|
Interest income and other
|
—
|
|
—
|
|
—
|
|
(43
|
)
|
(43
|
)
|
|||||
|
Operating income
|
499
|
|
53
|
|
512
|
|
(194
|
)
|
870
|
|
|||||
|
Depreciation, depletion and amortization
|
366
|
|
13
|
|
129
|
|
4
|
|
512
|
|
|||||
|
Basis of real estate sold
|
—
|
|
109
|
|
—
|
|
—
|
|
109
|
|
|||||
|
Non-operating pension and postretirement credits
|
—
|
|
—
|
|
—
|
|
(43
|
)
|
(43
|
)
|
|||||
|
Special items
(1)(2)
|
—
|
|
14
|
|
—
|
|
121
|
|
135
|
|
|||||
|
Total
|
$
|
865
|
|
$
|
189
|
|
$
|
641
|
|
$
|
(112
|
)
|
$
|
1,583
|
|
|
(1) Special items included in Real Estate & ENR relates to an asset impairment charge recorded for development projects.
(2) Special items included in Unallocated Items consist of: $146 million Plum Creek merger-related costs, $36 million gain on sale of non strategic assets, and $11 million of legal expense. |
|||||||||||||||
The table below reconciles Adjusted EBITDA by segment to net earnings during the year ended
2015
:
|
DOLLAR AMOUNTS IN MILLIONS
|
|||||||||||||||
|
|
TIMBERLANDS
|
|
REAL ESTATE & ENR
|
|
WOOD PRODUCTS
|
|
UNALLOCATED ITEMS
|
|
TOTAL
|
|
|||||
|
Net earnings
|
$
|
506
|
|
||||||||||||
|
Earnings from discontinued operations, net of taxes
|
(95
|
)
|
|||||||||||||
|
Interest expense, net of capitalized interest
|
341
|
|
|||||||||||||
|
Income taxes
|
(58
|
)
|
|||||||||||||
|
Net contribution to earnings
|
$
|
470
|
|
$
|
79
|
|
$
|
258
|
|
$
|
(113
|
)
|
$
|
694
|
|
|
Equity earnings from joint ventures
|
—
|
|
—
|
|
—
|
|
—
|
|
—
|
|
|||||
|
Interest income and other
|
—
|
|
—
|
|
—
|
|
(36
|
)
|
(36
|
)
|
|||||
|
Operating income
|
470
|
|
79
|
|
258
|
|
(149
|
)
|
658
|
|
|||||
|
Depreciation, depletion and amortization
|
208
|
|
1
|
|
106
|
|
10
|
|
325
|
|
|||||
|
Basis of real estate sold
|
—
|
|
18
|
|
—
|
|
—
|
|
18
|
|
|||||
|
Non-operating pension and postretirement credits
|
—
|
|
—
|
|
—
|
|
(11
|
)
|
(11
|
)
|
|||||
|
Special items
(1)(2)
|
—
|
|
—
|
|
8
|
|
27
|
|
35
|
|
|||||
|
Total
|
$
|
678
|
|
$
|
98
|
|
$
|
372
|
|
$
|
(123
|
)
|
$
|
1,025
|
|
|
(1) Special items included in Wood Products are pretax restructuring charges related to the closure of four distribution centers.
(2) Special items included in Unallocated Items consist of a $13 million noncash impairment charge related to a nonstrategic asset that was sold in the second quarter and $14 million of Plum Creek merger-related costs. |
|||||||||||||||
WEYERHAEUSER COMPANY >
2016 ANNUAL REPORT AND FORM 10-K
55
The table below reconciles Adjusted EBITDA by segment to net earnings during the year ended
2014
:
|
DOLLAR AMOUNTS IN MILLIONS
|
|||||||||||||||
|
|
TIMBERLANDS
|
|
REAL ESTATE & ENR
|
|
WOOD PRODUCTS
|
|
UNALLOCATED ITEMS
|
|
TOTAL
|
|
|||||
|
Net earnings
|
$
|
1,826
|
|
||||||||||||
|
Earnings from discontinued operations, net of taxes
|
(1,210
|
)
|
|||||||||||||
|
Interest expense, net of capitalized interest
|
338
|
|
|||||||||||||
|
Income taxes
|
71
|
|
|||||||||||||
|
Net contribution to earnings
|
$
|
532
|
|
$
|
81
|
|
$
|
327
|
|
$
|
85
|
|
$
|
1,025
|
|
|
Equity earnings from joint ventures
|
—
|
|
—
|
|
—
|
|
—
|
|
—
|
|
|||||
|
Interest income and other
|
—
|
|
—
|
|
—
|
|
(38
|
)
|
(38
|
)
|
|||||
|
Operating income
|
532
|
|
81
|
|
327
|
|
47
|
|
987
|
|
|||||
|
Depreciation, depletion and amortization
|
207
|
|
—
|
|
119
|
|
12
|
|
338
|
|
|||||
|
Basis of real estate sold
|
—
|
|
17
|
|
—
|
|
—
|
|
17
|
|
|||||
|
Non-operating pension and postretirement costs
|
—
|
|
—
|
|
—
|
|
(45
|
)
|
(45
|
)
|
|||||
|
Special items
(1)
|
—
|
|
—
|
|
—
|
|
(134
|
)
|
(134
|
)
|
|||||
|
Total
|
$
|
739
|
|
$
|
98
|
|
$
|
446
|
|
$
|
(120
|
)
|
$
|
1,163
|
|
|
(1) Special Items included: a $151 million pretax gain related to a previously announced postretirement plan amendment, $39 million in restructuring and closure charges related to our selling, general and administrative cost reduction initiative and a $22 million pretax gain on the sale of a landfill in Washington state.
|
|||||||||||||||
QUANTITATIVE AND QUALITATIVE DISCLOSURES ABOUT MARKET RISK
|
LONG-TERM DEBT OBLIGATIONS
|
The following summary of our long-term debt obligations includes:
|
•
|
scheduled principal repayments for the next five years and after,
|
|
•
|
weighted average interest rates for debt maturing in each of the next five years and after and
|
|
•
|
estimated fair values of outstanding obligations.
|
We estimate the fair value of long-term debt based on quoted market prices we received for the same types and issues of our debt or on the discounted value of the future cash flows using market yields for the same type and comparable issues of debt. Changes in market rates of interest affect the fair value of our fixed-rate debt.
SUMMARY OF LONG-TERM DEBT OBLIGATIONS AS OF
DECEMBER 31, 2016
|
DOLLAR AMOUNTS IN MILLIONS
|
||||||||||||||||||||||||
|
|
2017
|
|
2018
|
|
2019
|
|
2020
|
|
2021
|
|
THEREAFTER
|
|
TOTAL
|
|
FAIR VALUE
|
|
||||||||
|
Fixed-rate debt
|
$
|
281
|
|
$
|
62
|
|
$
|
500
|
|
$
|
—
|
|
$
|
756
|
|
$
|
4,479
|
|
$
|
6,078
|
|
$
|
6,925
|
|
|
Average interest rate
|
6.95
|
%
|
7.00
|
%
|
7.38
|
%
|
—
|
%
|
5.55
|
%
|
6.38
|
%
|
6.39
|
%
|
N/A
|
|
||||||||
|
Variable-rate debt
|
$
|
—
|
|
$
|
—
|
|
$
|
—
|
|
$
|
550
|
|
$
|
—
|
|
$
|
—
|
|
$
|
550
|
|
$
|
550
|
|
|
Average interest rate
|
—
|
%
|
—
|
%
|
—
|
%
|
2.36
|
%
|
—
|
%
|
—
|
%
|
2.36
|
%
|
N/A
|
|
||||||||
WEYERHAEUSER COMPANY >
2016 ANNUAL REPORT AND FORM 10-K
56
FINANCIAL STATEMENTS AND SUPPLEMENTARY DATA
|
REPORT OF INDEPENDENT REGISTERED PUBLIC ACCOUNTING FIRM
|
The Board of Directors and Shareholders
Weyerhaeuser Company:
We have audited the accompanying consolidated balance sheets of Weyerhaeuser Company and subsidiaries as of December 31, 2016 and 2015, and the related consolidated statements of operations, comprehensive income, cash flows and changes in equity for each of the years in the three-year period ended December 31, 2016. These consolidated financial statements are the responsibility of the Company’s management. Our responsibility is to express an opinion on these consolidated financial statements based on our audits.
We conducted our audits in accordance with the standards of the Public Company Accounting Oversight Board (United States). Those standards require that we plan and perform the audit to obtain reasonable assurance about whether the financial statements are free of material misstatement. An audit includes examining, on a test basis, evidence supporting the amounts and disclosures in the financial statements. An audit also includes assessing the accounting principles used and significant estimates made by management, as well as evaluating the overall financial statement presentation. We believe that our audits provide a reasonable basis for our opinion.
In our opinion, the consolidated financial statements referred to above present fairly, in all material respects, the financial position of Weyerhaeuser Company and subsidiaries as of December 31, 2016 and 2015, and the results of their operations and their cash flows for each of the years in the three-year period ended December 31, 2016, in conformity with U.S. generally accepted accounting principles.
We also have audited, in accordance with the standards of the Public Company Accounting Oversight Board (United States), Weyerhaeuser Company’s internal control over financial reporting as of December 31, 2016, based on criteria established in
Internal Control - Integrated Framework (2013)
issued by the Committee of Sponsoring Organizations of the Treadway Commission (COSO), and our report dated February 24, 2017 expressed an unqualified opinion on the effectiveness of the Company’s internal control over financial reporting.
Our report dated February 24, 2017, on the effectiveness of internal control over financial reporting as of December 31, 2016, contains an explanatory paragraph that states Weyerhaeuser Company acquired Plum Creek Timber Company, Inc. during 2016, and management excluded from its assessment of the effectiveness of Weyerhaeuser’s internal control over financial reporting as of December 31, 2016, certain components of Plum Creek Timber Company, Inc.’s internal control over financial reporting associated with less than 10% of total assets and less than 10% of net sales included in the consolidated financial statements of Weyerhaeuser Company and subsidiaries as of and for the year ended December 31, 2016. Our audit of internal control over financial reporting of Weyerhaeuser Company also excluded an evaluation of the internal control over financial reporting of certain components of Plum Creek Timber Company, Inc.
/s/ KPMG LLP
Seattle, Washington
February 24, 2017
WEYERHAEUSER COMPANY >
2016 ANNUAL REPORT AND FORM 10-K
57
|
|
FOR THE THREE-YEAR PERIOD ENDED
DECEMBER 31, 2016
|
DOLLAR AMOUNTS IN MILLIONS, EXCEPT PER-SHARE FIGURES
|
|||||||||
|
|
2016
|
|
2015
|
|
2014
|
|
|||
|
Net sales
|
$
|
6,365
|
|
$
|
5,246
|
|
$
|
5,489
|
|
|
Costs of products sold
|
4,926
|
|
4,121
|
|
4,183
|
|
|||
|
Gross margin
|
1,439
|
|
1,125
|
|
1,306
|
|
|||
|
Selling expenses
|
89
|
|
99
|
|
97
|
|
|||
|
General and administrative expenses
|
332
|
|
259
|
|
306
|
|
|||
|
Research and development expenses
|
19
|
|
18
|
|
20
|
|
|||
|
Charges for integration and restructuring, closures and asset impairments
(Note 17) |
170
|
|
39
|
|
44
|
|
|||
|
Other operating costs (income), net
(Note 18)
|
(41
|
)
|
52
|
|
(148
|
)
|
|||
|
Operating income
|
870
|
|
658
|
|
987
|
|
|||
|
Equity earnings from joint ventures
(Note 8)
|
22
|
|
—
|
|
—
|
|
|||
|
Interest income and other
|
43
|
|
36
|
|
38
|
|
|||
|
Interest expense, net of capitalized interest
|
(431
|
)
|
(341
|
)
|
(338
|
)
|
|||
|
Earnings from continuing operations before income taxes
|
504
|
|
353
|
|
687
|
|
|||
|
Income taxes
(Note 19)
|
(89
|
)
|
58
|
|
(71
|
)
|
|||
|
Earnings from continuing operations
|
415
|
|
411
|
|
616
|
|
|||
|
Earnings from discontinued operations, net of income taxes
(Note 3)
|
612
|
|
95
|
|
1,210
|
|
|||
|
Net earnings
|
1,027
|
|
506
|
|
1,826
|
|
|||
|
Dividends on preference shares
|
(22
|
)
|
(44
|
)
|
(44
|
)
|
|||
|
Net earnings attributable to Weyerhaeuser common shareholders
|
$
|
1,005
|
|
$
|
462
|
|
$
|
1,782
|
|
|
Basic earnings per share attributable to Weyerhaeuser common shareholders
(Note 5)
:
|
|
|
|||||||
|
Continuing operations
|
$
|
0.55
|
|
$
|
0.71
|
|
$
|
1.03
|
|
|
Discontinued operations
|
0.85
|
|
0.18
|
|
2.17
|
|
|||
|
Net earnings per share
|
$
|
1.40
|
|
$
|
0.89
|
|
$
|
3.20
|
|
|
Diluted earnings per share attributable to Weyerhaeuser common shareholders
(Note 5)
:
|
|
|
|
||||||
|
Continuing operations
|
$
|
0.55
|
|
$
|
0.71
|
|
$
|
1.02
|
|
|
Discontinued operations
|
0.84
|
|
0.18
|
|
2.16
|
|
|||
|
Net earnings per share
|
$
|
1.39
|
|
$
|
0.89
|
|
$
|
3.18
|
|
|
Dividends paid per common share
|
$
|
1.24
|
|
$
|
1.20
|
|
$
|
1.02
|
|
|
Weighted average shares outstanding (in thousands)
(Note 5)
:
|
|
|
|
||||||
|
Basic
|
718,560
|
|
516,371
|
|
556,705
|
|
|||
|
Diluted
|
722,401
|
|
519,618
|
|
560,899
|
|
|||
See accompanying
Notes to Consolidated Financial Statements
.
WEYERHAEUSER COMPANY >
2016 ANNUAL REPORT AND FORM 10-K
58
|
CONSOLIDATED STATEMENT OF COMPREHENSIVE INCOME
|
FOR THE THREE-YEAR PERIOD ENDED
DECEMBER 31, 2016
|
DOLLAR AMOUNTS IN MILLIONS
|
|||||||||
|
|
2016
|
|
2015
|
|
2014
|
|
|||
|
Comprehensive income:
|
|
|
|
||||||
|
Net earnings
|
$
|
1,027
|
|
$
|
506
|
|
$
|
1,826
|
|
|
Other comprehensive income (loss):
|
|
|
|
||||||
|
Foreign currency translation adjustments
|
25
|
|
(97
|
)
|
(50
|
)
|
|||
|
Changes in unamortized net pension and other postretirement benefit gain (loss), net of tax expense (benefit) of ($151) in 2016, $131 in 2015, and ($323) in 2014
|
(269
|
)
|
282
|
|
(554
|
)
|
|||
|
Changes in unamortized prior service cost, net of tax benefit of $0 in 2016, $1 in 2015 and $64 in 2014
|
(4
|
)
|
(4
|
)
|
(103
|
)
|
|||
|
Unrealized gains on available-for-sale securities
|
1
|
|
—
|
|
—
|
|
|||
|
Total comprehensive income
|
$
|
780
|
|
$
|
687
|
|
$
|
1,119
|
|
See accompanying
Notes to Consolidated Financial Statements
.
WEYERHAEUSER COMPANY >
2016 ANNUAL REPORT AND FORM 10-K
59
|
|
|
DOLLAR AMOUNTS IN MILLIONS
|
||||||
|
|
DECEMBER 31,
2016 |
|
DECEMBER 31,
2015 |
|
||
|
ASSETS
|
||||||
|
Current assets:
|
|
|
||||
|
Cash and cash equivalents
|
$
|
676
|
|
$
|
1,011
|
|
|
Receivables, less discounts and allowances of $1 and $1
|
390
|
|
276
|
|
||
|
Receivables for taxes
|
84
|
|
30
|
|
||
|
Inventories
(Note 6)
|
358
|
|
325
|
|
||
|
Prepaid expenses and other current assets
|
114
|
|
63
|
|
||
|
Assets of discontinued operations
(Note 3)
|
—
|
|
1,934
|
|
||
|
Total current assets
|
1,622
|
|
3,639
|
|
||
|
Property and equipment, less accumulated depreciation of $3,306 and $3,287
(Note 7)
|
1,562
|
|
1,233
|
|
||
|
Construction in progress
|
213
|
|
144
|
|
||
|
Timber and timberlands at cost, less depletion charged to disposals
|
14,299
|
|
6,552
|
|
||
|
Minerals and mineral rights, less depletion
|
319
|
|
14
|
|
||
|
Investments in and advances to joint ventures
(Note 8)
|
56
|
|
—
|
|
||
|
Goodwill
|
40
|
|
40
|
|
||
|
Deferred tax assets
(Note 19)
|
293
|
|
254
|
|
||
|
Other assets
|
224
|
|
229
|
|
||
|
Restricted financial investments held by variable interest entities
(Note 8)
|
615
|
|
615
|
|
||
|
Total assets
|
$
|
19,243
|
|
$
|
12,720
|
|
|
LIABILITIES AND EQUITY
|
||||||
|
Current liabilities:
|
||||||
|
$
|
281
|
|
$
|
—
|
|
|
|
Notes payable
|
1
|
|
4
|
|
||
|
Accounts payable
|
233
|
|
204
|
|
||
|
Accrued liabilities
(Note 10)
|
691
|
|
427
|
|
||
|
Liabilities of discontinued operations
(Note 3)
|
—
|
|
690
|
|
||
|
Total current liabilities
|
1,206
|
|
1,325
|
|
||
|
Long-term debt (
Notes 12
and
13
)
|
6,329
|
|
4,787
|
|
||
|
Long-term debt (nonrecourse to the company) held by variable interest entities
(Note 8)
|
511
|
|
511
|
|
||
|
Deferred pension and other postretirement benefits
(Note 9)
|
1,322
|
|
987
|
|
||
|
Deposit received from contribution of timberlands to related party
(Note 8)
|
426
|
|
—
|
|
||
|
Other liabilities
|
269
|
|
241
|
|
||
|
Commitments and contingencies
(Note 14)
|
|
|
|
|
||
|
Total liabilities
|
10,063
|
|
7,851
|
|
||
|
Equity:
|
||||||
|
Weyerhaeuser shareholders’ interest (
Notes 15
and
16
):
|
||||||
|
Mandatory convertible preference shares, series A: $1.00 par value; $50.00 liquidation; authorized 40,000,000 shares; issued and outstanding: 0 and 13,799,711 shares
|
—
|
|
14
|
|
||
|
Common shares: $1.25 par value; authorized 1,360,000,000 shares; issued and outstanding: 748,528,131 and 510,483,285 shares
|
936
|
|
638
|
|
||
|
Other capital
|
8,282
|
|
4,080
|
|
||
|
Retained earnings
|
1,421
|
|
1,349
|
|
||
|
Cumulative other comprehensive loss
|
(1,459
|
)
|
(1,212
|
)
|
||
|
Total equity
|
9,180
|
|
4,869
|
|
||
|
Total liabilities and equity
|
$
|
19,243
|
|
$
|
12,720
|
|
See accompanying
Notes to Consolidated Financial Statements
.
WEYERHAEUSER COMPANY >
2016 ANNUAL REPORT AND FORM 10-K
60
|
|
FOR THE THREE-YEAR PERIOD ENDED
DECEMBER 31, 2016
|
DOLLAR AMOUNTS IN MILLIONS
|
|||||||||
|
|
2016
|
|
2015
|
|
2014
|
|
|||
|
Cash flows from operations:
|
|
|
|
||||||
|
Net earnings
|
$
|
1,027
|
|
$
|
506
|
|
$
|
1,826
|
|
|
Noncash charges (credits) to income:
|
|
|
|
||||||
|
Depreciation, depletion and amortization
|
565
|
|
479
|
|
500
|
|
|||
|
Basis of real estate sold
|
109
|
|
18
|
|
17
|
|
|||
|
Deferred income taxes, net
|
(159
|
)
|
—
|
|
205
|
|
|||
|
Pension and other postretirement benefits
|
5
|
|
42
|
|
(152
|
)
|
|||
|
Share-based compensation expense
(Note 16)
|
60
|
|
31
|
|
40
|
|
|||
|
Charges for impairment of assets
|
37
|
|
15
|
|
2
|
|
|||
|
Equity (earnings) loss from joint ventures
|
(18
|
)
|
105
|
|
1
|
|
|||
|
Net gains on disposition of discontinued operations
(Note 3)
|
(789
|
)
|
—
|
|
(972
|
)
|
|||
|
Net gains on sale of nonstrategic assets
|
(73
|
)
|
(38
|
)
|
(78
|
)
|
|||
|
Foreign exchange transaction (gains) losses
(Note 18)
|
(5
|
)
|
47
|
|
27
|
|
|||
|
Change in, net of acquisition:
|
|
|
|
||||||
|
Receivables less allowances
|
(54
|
)
|
17
|
|
29
|
|
|||
|
Receivable for taxes
|
106
|
|
(5
|
)
|
76
|
|
|||
|
Inventories
|
61
|
|
10
|
|
(66
|
)
|
|||
|
Real estate and land
|
—
|
|
—
|
|
(133
|
)
|
|||
|
Prepaid expenses
|
5
|
|
3
|
|
17
|
|
|||
|
Accounts payable and accrued liabilities
|
11
|
|
(35
|
)
|
(98
|
)
|
|||
|
Deposits on land positions and other assets
|
—
|
|
—
|
|
15
|
|
|||
|
Pension and postretirement contributions / benefit payments
|
(99
|
)
|
(83
|
)
|
(101
|
)
|
|||
|
Distributions received from joint ventures
|
14
|
|
15
|
|
4
|
|
|||
|
Other
|
(68
|
)
|
(52
|
)
|
(50
|
)
|
|||
|
Net cash from operations
|
735
|
|
1,075
|
|
1,109
|
|
|||
|
Cash flows from investing activities:
|
|
|
|
||||||
|
Capital expenditures for property and equipment
|
(451
|
)
|
(443
|
)
|
(354
|
)
|
|||
|
Capital expenditures for timberlands reforestation
|
(59
|
)
|
(40
|
)
|
(41
|
)
|
|||
|
Acquisition of timberlands
|
(10
|
)
|
(36
|
)
|
—
|
|
|||
|
Proceeds from disposition of discontinued operations
(Note 3)
|
2,486
|
|
—
|
|
707
|
|
|||
|
Proceeds from sale of nonstrategic assets
|
104
|
|
19
|
|
28
|
|
|||
|
Proceeds from contribution of timberlands to related party
|
440
|
|
—
|
|
—
|
|
|||
|
Distributions received from joint ventures
|
46
|
|
—
|
|
—
|
|
|||
|
Other
|
3
|
|
13
|
|
21
|
|
|||
|
Net cash from investing activities
|
2,559
|
|
(487
|
)
|
361
|
|
|||
|
Cash flows from financing activities:
|
|
|
|
||||||
|
Cash dividends on common shares
|
(932
|
)
|
(619
|
)
|
(563
|
)
|
|||
|
Cash dividends on preference shares
|
(22
|
)
|
(44
|
)
|
(44
|
)
|
|||
|
Proceeds from issuance of long-term debt
|
1,698
|
|
—
|
|
—
|
|
|||
|
Payments of debt
|
(2,423
|
)
|
—
|
|
—
|
|
|||
|
Proceeds from exercise of stock options
|
61
|
|
34
|
|
119
|
|
|||
|
Repurchase of common stock
|
(2,003
|
)
|
(518
|
)
|
(203
|
)
|
|||
|
Net proceeds from issuance of WRECO debt
(Note 3)
|
—
|
|
—
|
|
887
|
|
|||
|
Deposit of WRECO debt proceeds into escrow
(Note 3)
|
—
|
|
—
|
|
(887
|
)
|
|||
|
Other
|
(9
|
)
|
(9
|
)
|
(34
|
)
|
|||
|
Net cash from financing activities
|
(3,630
|
)
|
(1,156
|
)
|
(725
|
)
|
|||
|
Net change in cash and cash equivalents
|
$
|
(336
|
)
|
$
|
(568
|
)
|
$
|
745
|
|
|
Cash and cash equivalents from continuing operations at beginning of year
|
$
|
1,011
|
|
$
|
1,577
|
|
$
|
822
|
|
|
Cash and cash equivalents from discontinued operations at beginning of year
|
1
|
|
3
|
|
13
|
|
|||
|
Cash and cash equivalents at beginning of year
|
$
|
1,012
|
|
$
|
1,580
|
|
$
|
835
|
|
|
Cash and cash equivalents from continuing operations at end of year
|
$
|
676
|
|
$
|
1,011
|
|
$
|
1,577
|
|
|
Cash and cash equivalents from discontinued operations at end of year
|
—
|
|
1
|
|
3
|
|
|||
|
Cash and cash equivalents at end of year
|
$
|
676
|
|
$
|
1,012
|
|
$
|
1,580
|
|
|
Cash paid (received) during the year for:
|
|
|
|
|
|
|
|||
|
Interest, net of amounts capitalized of $8 in 2016, $7 in 2015 and $13 in 2014
|
$
|
446
|
|
$
|
347
|
|
$
|
319
|
|
|
Income taxes
|
$
|
485
|
|
$
|
14
|
|
$
|
(37
|
)
|
See accompanying
Notes to Consolidated Financial Statements
.
WEYERHAEUSER COMPANY >
2016 ANNUAL REPORT AND FORM 10-K
61
|
CONSOLIDATED STATEMENT OF CHANGES IN EQUITY
|
FOR THE THREE-YEAR PERIOD ENDED
DECEMBER 31, 2016
|
DOLLAR AMOUNTS IN MILLIONS
|
|||||||||
|
|
2016
|
|
2015
|
|
2014
|
|
|||
|
Mandatory convertible preference shares, series A:
|
|
|
|
|
|||||
|
Balance at beginning of year
|
$
|
14
|
|
$
|
14
|
|
$
|
14
|
|
|
Conversion to common shares
|
(14
|
)
|
—
|
|
—
|
|
|||
|
Balance at end of year
|
$
|
—
|
|
$
|
14
|
|
$
|
14
|
|
|
Common shares:
|
|
|
|
|
|||||
|
Balance at beginning of year
|
$
|
638
|
|
$
|
656
|
|
$
|
729
|
|
|
Preference shares converted to common shares
|
29
|
|
—
|
|
—
|
|
|||
|
Shares tendered
(Note 3)
|
—
|
|
—
|
|
(73
|
)
|
|||
|
Issued for exercise of stock options
|
3
|
|
2
|
|
7
|
|
|||
|
Repurchases of common shares
|
(85
|
)
|
(20
|
)
|
(7
|
)
|
|||
|
Release of vested restricted stock units
|
2
|
|
—
|
|
—
|
|
|||
|
Plum Creek acquisition
|
349
|
|
—
|
|
—
|
|
|||
|
Balance at end of year
|
$
|
936
|
|
$
|
638
|
|
$
|
656
|
|
|
Other capital:
|
|
|
|
||||||
|
Balance at beginning of year
|
$
|
4,080
|
|
$
|
4,519
|
|
$
|
6,444
|
|
|
Shares tendered
(Note 3)
|
—
|
|
—
|
|
(1,881
|
)
|
|||
|
Issued for exercise of stock options
|
61
|
|
32
|
|
112
|
|
|||
|
Repurchase of common shares
|
(1,918
|
)
|
(498
|
)
|
(196
|
)
|
|||
|
Share-based compensation
|
35
|
|
32
|
|
35
|
|
|||
|
Plum Creek acquisition
|
6,046
|
|
—
|
|
—
|
|
|||
|
Other transactions, net
|
(22
|
)
|
(5
|
)
|
5
|
|
|||
|
Balance at end of year
|
$
|
8,282
|
|
$
|
4,080
|
|
$
|
4,519
|
|
|
Retained earnings:
|
|
|
|
||||||
|
Balance at beginning of year
|
$
|
1,349
|
|
$
|
1,508
|
|
$
|
294
|
|
|
Net earnings
|
1,027
|
|
506
|
|
1,826
|
|
|||
|
Dividends on common shares
|
(933
|
)
|
(621
|
)
|
(568
|
)
|
|||
|
Cash dividends on preference shares
|
(22
|
)
|
(44
|
)
|
(44
|
)
|
|||
|
Balance at end of year
|
$
|
1,421
|
|
$
|
1,349
|
|
$
|
1,508
|
|
|
Cumulative other comprehensive loss:
|
|
|
|
||||||
|
Balance at beginning of year
|
$
|
(1,212
|
)
|
$
|
(1,393
|
)
|
$
|
(686
|
)
|
|
Annual changes – net of tax:
|
|
|
|
|
|||||
|
Foreign currency translation adjustments
|
25
|
|
(97
|
)
|
(50
|
)
|
|||
|
Changes in unamortized net pension and other postretirement benefit gain (loss)
(Note 9)
|
(269
|
)
|
282
|
|
(554
|
)
|
|||
|
Changes in unamortized prior service credit (cost)
(Note 9)
|
(4
|
)
|
(4
|
)
|
(103
|
)
|
|||
|
Unrealized gains on available-for-sale securities
|
1
|
|
—
|
|
—
|
|
|||
|
Balance at end of year
|
$
|
(1,459
|
)
|
$
|
(1,212
|
)
|
$
|
(1,393
|
)
|
|
Total Weyerhaeuser shareholders’ interest:
|
|
|
|
||||||
|
Balance at end of year
|
$
|
9,180
|
|
$
|
4,869
|
|
$
|
5,304
|
|
|
Noncontrolling interests:
|
|
|
|
||||||
|
Balance at beginning of year
|
$
|
—
|
|
$
|
—
|
|
$
|
37
|
|
|
New consolidations, de-consolidations and other transactions
|
—
|
|
—
|
|
(37
|
)
|
|||
|
Balance at end of year
|
$
|
—
|
|
$
|
—
|
|
$
|
—
|
|
|
Total equity:
|
|
|
|
||||||
|
Balance at end of year
|
$
|
9,180
|
|
$
|
4,869
|
|
$
|
5,304
|
|
See accompanying
Notes to Consolidated Financial Statements
.
WEYERHAEUSER COMPANY >
2016 ANNUAL REPORT AND FORM 10-K
62
|
INDEX FOR NOTES TO CONSOLIDATED FINANCIAL STATEMENTS
|
|
NOTE 1:
|
||
|
NOTE 2:
|
||
|
NOTE 3:
|
||
|
NOTE 4:
|
||
|
NOTE 5:
|
||
|
NOTE 6:
|
||
|
NOTE 7:
|
||
|
NOTE 8:
|
||
|
NOTE 9:
|
||
|
NOTE 10:
|
||
|
NOTE 11:
|
||
|
NOTE 12:
|
||
|
NOTE 13:
|
||
|
NOTE 14:
|
||
|
NOTE 15:
|
||
|
NOTE 16:
|
||
|
NOTE 17:
|
||
|
NOTE 18:
|
||
|
NOTE 19:
|
||
|
NOTE 20:
|
||
|
NOTE 21:
|
||
WEYERHAEUSER COMPANY >
2016 ANNUAL REPORT AND FORM 10-K
63
|
NOTES TO CONSOLIDATED FINANCIAL STATEMENTS
|
NOTE 1:
SUMMARY OF SIGNIFICANT ACCOUNTING POLICIES
Our significant accounting policies describe:
|
•
|
our election to be taxed as a real estate investment trust,
|
|
•
|
how we report our results,
|
|
•
|
changes in how we report our results and
|
|
•
|
how we account for various items.
|
OUR ELECTION TO BE TAXED AS A REAL ESTATE INVESTMENT TRUST (REIT)
Starting with our 2010 fiscal year, we elected to be taxed as a REIT. REIT income can be distributed to shareholders without first paying corporate level tax, substantially eliminating the double taxation on income. We expect to derive most of our REIT income from investments in timberlands, including the sale of standing timber through pay-as-cut sales contracts and lump sum timber deeds.
We were no longer subject to the REIT built-in gains tax as of December 31, 2014. Our built-in gains tax period expired in 2015 due to a change in U.S. tax law that statutorily shortened the built-in gains tax period to 5 years from 10 years. This means we are no longer subject to federal corporate level income taxes on sales of REIT property that had a fair market value in excess of tax basis when we converted to a REIT on January 1, 2010. We continue to be required to pay federal corporate income taxes on earnings of our Taxable REIT Subsidiary (TRS), which includes our Wood Products segment and portions of our Timberlands and Real Estate, Energy and Natural Resources (Real Estate & ENR) segments.
HOW WE REPORT OUR RESULTS
Our report includes:
|
•
|
consolidated financial statements,
|
|
•
|
our business segments,
|
|
•
|
foreign currency translation,
|
|
•
|
estimates, and
|
|
•
|
fair value measurements.
|
CONSOLIDATED FINANCIAL STATEMENTS
Our consolidated financial statements provide an overall view of our results and financial condition. They include our accounts and the accounts of entities that we control, including:
|
•
|
majority-owned domestic and foreign subsidiaries and
|
|
•
|
variable interest entities in which we are the primary beneficiary.
|
They do not include our intercompany transactions and accounts, which are eliminated, and noncontrolling interests are presented as a separate component of equity.
We account for investments in and advances to unconsolidated equity affiliates using the equity method. We record our share of equity in net earnings of equity affiliates within "Equity earnings from joint ventures" in our
Consolidated Statement of Operations
in the period in which the earnings are recorded by our equity affiliates.
Throughout these Notes to Consolidated Financial Statements, unless specified otherwise, references to “Weyerhaeuser,” "the company," “we” and “our” refer to the consolidated company.
OUR BUSINESS SEGMENTS
Reportable business segments are determined based on the company's management approach. The management approach, as defined by FASB ASC 280, "Segment Reporting," is based on the way the chief operating decision maker organizes the segments within a company when making decisions about resources to be allocated and assessing their performance.
During fiscal year 2016, the company's chief operating decision maker changed the information regularly reviewed when making decisions to allocate resources and assess performance. As a result, the company will report its financial performance based on three business segments: Timberlands, Real Estate & ENR, and Wood Products. Prior to revising our segment structure, activities related to the Real Estate & ENR business segment were reported as part of the Timberlands business segment.
Amounts for all periods presented have been reclassified throughout the consolidated financial statements and disclosures to conform to the new segment structure.
We are principally engaged in:
|
•
|
growing and harvesting timber;
|
|
•
|
manufacturing, distributing and selling products made from trees;
|
|
•
|
maximizing the value of every acre we own through the sale of higher and better use (HBU) properties; and
|
|
•
|
monetizing reserves of minerals, oil, gas, coal, and other natural resources on our timberlands.
|
Our business segments are organized based primarily on products and services.
WEYERHAEUSER COMPANY >
2016 ANNUAL REPORT AND FORM 10-K
64
Our Business Segments and Products
|
SEGMENT
|
PRODUCTS AND SERVICES
|
|
Timberlands
|
Logs, timber, and recreational access via leases
|
|
Real Estate & ENR
|
Sales of timberlands; rights to explore for and extract hard minerals, oil and gas production, and coal; and equity interests in our Real Estate Development Ventures
|
|
Wood Products
|
Softwood lumber, engineered wood products, structural panels, medium density fiberboard and building materials distribution
|
We also transfer raw materials, semifinished materials and end products among our business segments. Because of this intracompany activity, accounting for our business segments involves:
|
•
|
pricing products transferred between our business segments at current market values and
|
|
•
|
allocating joint conversion and common facility costs according to usage by our business segment product lines.
|
Gains or charges not related to or allocated to an individual operating segment are held in Unallocated Items. This includes a portion of items such as: share-based compensation; pension and postretirement costs; foreign exchange transaction gains and losses associated with financing; the elimination of intersegment profit in inventory and the LIFO reserve.
FOREIGN CURRENCY TRANSLATION
Local currencies are the functional currencies for most of our operations outside the U.S. We translate foreign currencies into U.S. dollars in two ways:
|
•
|
assets and liabilities — at the exchange rates in effect as of our balance sheet date; and
|
|
•
|
revenues and expenses — at average monthly exchange rates throughout the year.
|
ESTIMATES
We prepare our financial statements according to U.S. generally accepted accounting principles (U.S. GAAP). This requires us to make estimates and assumptions during our reporting periods and at the date of our financial statements. The estimates and assumptions affect our:
|
•
|
reported amounts of assets, liabilities and equity;
|
|
•
|
disclosure of contingent assets and liabilities; and
|
|
•
|
reported amounts of revenues and expenses.
|
While we do our best in preparing these estimates, actual results can and do differ from those estimates and assumptions.
FAIR VALUE MEASUREMENTS
We use a fair value hierarchy in accounting for certain nonfinancial assets and liabilities including:
|
•
|
long-lived assets (asset groups) measured at fair value for an impairment assessment;
|
|
•
|
reporting units measured at fair value in the first step of a goodwill impairment test;
|
|
•
|
nonfinancial assets and nonfinancial liabilities measured at fair value in the second step of a goodwill impairment assessment;
|
|
•
|
assets acquired and liabilities assumed in a business acquisition; and
|
|
•
|
asset retirement obligations initially measured at fair value.
|
The fair value hierarchy is based on inputs to valuation techniques that are used to measure fair value that are either observable or unobservable. Observable inputs reflect assumptions market participants would use in pricing an asset or liability based on market data obtained from independent sources while unobservable inputs reflect a reporting entity’s pricing based upon its own market assumptions.
The fair value hierarchy consists of the following three levels:
|
•
|
Level 1 — Inputs are quoted prices in active markets for identical assets or liabilities.
|
|
•
|
Level 2 — Inputs are:
|
– quoted prices for similar assets or liabilities in an active market;
– quoted prices for identical or similar assets or liabilities in markets that are not active; or
– inputs other than quoted prices that are observable and market-corroborated inputs, which are derived principally from or corroborated by observable market data.
|
•
|
Level 3 — Inputs are derived from valuation techniques in which one or more significant inputs or value drivers are unobservable.
|
CHANGES IN HOW WE REPORT OUR RESULTS
Changes in how we report our results come from:
|
•
|
accounting changes made upon our adoption of new accounting guidance and
|
|
•
|
our reclassification of certain balances and results from prior years to make them consistent with our current reporting.
|
RECLASSIFICATIONS
We have reclassified certain balances and results from the prior years to be consistent with our
2016
reporting. This makes year-to-year comparisons easier. Our reclassifications had no effect on net earnings or equity.
WEYERHAEUSER COMPANY >
2016 ANNUAL REPORT AND FORM 10-K
65
Our reclassifications present:
|
•
|
our adoption of new accounting pronouncements.
|
|
•
|
the results of discontinued operations separately from results of continuing operations on our
Consolidated Statement of Operations
,
Consolidated Balance Sheet
and in the related footnotes.
Note 3: Discontinued Operations
provides more information about our discontinued operations.
|
|
•
|
our revised business segments.
Note 2: Business Segments
provides information about our revised business segments.
|
NEW ACCOUNTING PRONOUNCEMENTS
In May 2014, the Financial Accounting Standards Board (FASB) issued Accounting Standards Update (ASU) 2014-09, a comprehensive new revenue recognition model that requires an entity to recognize revenue to depict the transfer of goods or services to customers at an amount that reflects the consideration it expects to receive in exchange for those goods or services. In August 2015, FASB issued ASU 2015-14, which deferred the effective date for an additional year. In March 2016, FASB issued ASU 2016-08, which does not change the core principle of the guidance; however, it does clarify the implementation guidance on principal versus agent considerations. In April 2016, FASB issued ASU 2016-10, which clarifies two aspects of ASU 2014-09: identifying performance obligations and the licensing implementation guidance. In May 2016, FASB issued ASU 2016-12, which amends ASU 2014-09 to provide improvements and practical expedients to the new revenue recognition model. Finally, in December 2016, the FASB issued ASU 2016-20, which amends ASU 2014-09 for technical corrections and to correct for unintended application of the guidance.
The company expects to adopt and implement the new revenue recognition guidance effective January 1, 2018. The new standard is required to be applied retrospectively to each prior reporting period presented (full retrospective transition method) or retrospectively with the cumulative effect of initially applying it recognized at the date of initial application (cumulative effect method). We expect to adopt using the cumulative effect method. We expect that the adoption of the new revenue recognition guidance will not materially impact our operating results, balance sheet, cash flows or financial reporting aside from adding expanded disclosures.
In April 2015, FASB issued ASU 2015-03, which amends the presentation of debt issuance costs on the consolidated balance sheet. Under the new guidance, debt issuance costs are presented as a direct deduction from the carrying amount of the debt liability rather than as an asset. The new guidance is effective retrospectively for fiscal periods starting after December 15, 2015 and early adoption is permitted. We adopted on January 1, 2016, and have reclassified balances of debt issuance costs accordingly in our consolidated balance sheet and in related disclosures for all periods presented.
In May 2015, FASB issued ASU 2015-07, which clarifies the presentation within the fair value hierarchy of certain investments held within our pension plan. The new guidance is effective retrospectively for fiscal periods starting after December 15, 2015. This new guidance removes the requirement to categorize within the fair value hierarchy investments for which fair value is measured using the net asset value per share as a practical expedient and, instead, permits separate disclosure. Upon adoption these investments are presented separately from the fair value hierarchy and reconciled to total investments in our consolidated financial statements and related disclosures. We adopted on January 1, 2016. We have included all new required disclosures in
Note 9: Pension and Other Postretirement Benefit Plans
.
In July 2015, FASB issued ASU 2015-11, which simplifies the measurement of inventories valued under most methods, including our inventories valued under FIFO – the first-in, first-out – and moving average cost methods. Inventories valued under LIFO – the last-in, first-out method – are excluded. Under this new guidance, inventories valued under these methods would be valued at the lower of cost or net realizable value, with net realizable value defined as the estimated selling price less reasonable costs to sell the inventory. The new guidance is effective prospectively for fiscal periods starting after December 15, 2016, and early adoption is permitted. We adopted on January 1, 2017, and determined this pronouncement does not have a material impact on our consolidated financial statements and related disclosures.
In September 2015, FASB issued ASU 2015-16, which results in the ability to recognize, in current period earnings, any changes in provisional amounts during the measurement period after the closing of an acquisition, instead of restating prior periods for these changes. We adopted on January 1, 2016. Measurement period adjustments related to our merger with Plum Creek did not have a material impact to earnings or cash flows for the year ended December 31, 2016.
In February 2016, FASB issued ASU 2016-02, which requires lessees to recognize assets and liabilities for the rights and obligations created by those leases and requires both capital and operating leases to be recognized on the balance sheet. The new guidance is effective for fiscal years beginning after December 15, 2018, and early adoption is permitted. We expect to adopt on January 1, 2019, and are evaluating the impact on our consolidated financial statements and related disclosures.
In March 2016, FASB issued ASU 2016-09, which simplifies several aspects of accounting for share-based payment transactions, including income tax consequences, award classification, cash flows reporting, and forfeiture rate application. Specifically, the update requires all excess tax benefits and tax deficiencies to be recognized as income tax expense or benefit in the income statement with a cumulative-effect adjustment to equity as of the beginning of the period of adoption. The update allows excess tax benefits to be classified along with other income tax cash flows as an operating activity on the statement of cash flows. When accruing compensation cost, an entity can make an entity-wide accounting policy election to either estimate the number of awards expected to vest or to account for forfeitures as they occur with a cumulative-effect adjustment to equity as of the beginning of the period of adoption. The update requires cash paid by an employer when directly withholding shares for tax-withholding purposes to be classified as a financing activity on the statement of cash flows, applied retrospectively. This guidance is effective for fiscal years beginning after December 15, 2016. As permitted, we elected to adopt early, and applied the different aspects as prescribed by the standard effective January 1, 2016. The adoption of this guidance represents a change in accounting policy and did not have a material impact on our consolidated financial statements. Shares withheld by the employer for tax-withholding purposes for the years ended December 31, 2015, and December 31, 2014, of
$11 million
and
$21 million
, respectively, were retrospectively reclassified from an operating activity to a financing activity in the
Consolidated Statement of Cash Flows
.
In August 2016, FASB issued ASU 2016-15, which reduces diversity in practice in how certain transactions are classified in the statement of cash flows. These transactions include: debt prepayment or debt extinguishment costs, settlement of zero-coupon debt instruments, contingent consideration payments made after a business combination, proceeds from the settlement of insurance claims, proceeds from the settlement of corporate-owned life insurance policies, distributions received from equity method investments, beneficial interests in securitization transactions,
WEYERHAEUSER COMPANY >
2016 ANNUAL REPORT AND FORM 10-K
66
and separately identifiable cash flows and application of the predominance principle. The new guidance is effective for fiscal years beginning after December 15, 2017, and early adoption is permitted. We have adopted this update effective July 1, 2016, and our adoption did not materially impact our Consolidated Statement of Cash Flows.
In October 2016, FASB issued ASU 2016-16, which requires immediate recognition of the income tax consequences upon intra-entity transfers of assets other than inventory. The new guidance is effective for annual periods beginning after December 15, 2017, and early adoption is permitted. We adopted this accounting standard update on January 1, 2017, which does not materially impact our consolidated financial statements or related disclosures. In general, we do not have material intra-entity taxable sales of assets other than inventory.
HOW WE ACCOUNT FOR VARIOUS ITEMS
This section provides information about how we account for certain key items related to:
|
•
|
capital investments,
|
|
•
|
financing our business and
|
|
•
|
operations.
|
ITEMS RELATED TO CAPITAL INVESTMENTS
Key items related to accounting for capital investments pertain to property and equipment, timber and timberlands, impairment of long-lived assets and goodwill.
Property and Equipment
We maintain property accounts on an individual asset basis. Here is how we handle major items:
|
•
|
Improvements to and replacements of major units of property are capitalized.
|
|
•
|
Maintenance, repairs and minor replacements are expensed.
|
|
•
|
Depreciation is calculated using a straight-line method at rates based on estimated service lives.
|
|
•
|
Logging roads are generally amortized — as timber is harvested — at rates based on the volume of timber estimated to be removed.
|
|
•
|
Cost and accumulated depreciation of property sold or retired are removed from the accounts and the gain or loss is included in earnings.
|
Timber and Timberlands
We carry timber and timberlands at cost less depletion charged to disposals. Depletion refers to the carrying value of timber that is harvested, lost as a result of casualty, or sold.
Key activities affecting how we account for timber and timberlands include:
|
•
|
reforestation,
|
|
•
|
depletion and
|
|
•
|
forest management in Canada.
|
Reforestation.
Generally, we capitalize initial site preparation and planting costs as reforestation. We transfer reforestation to a merchantable timber classification when the timber is considered harvestable. This generally occurs after:
|
•
|
15
years in the South and
|
|
•
|
30
years in the West.
|
Generally, we expense costs after the first planting as they are incurred or over the period of expected benefit. These costs include:
|
•
|
fertilization,
|
|
•
|
vegetation and insect control,
|
|
•
|
pruning and precommercial thinning,
|
|
•
|
property taxes and
|
|
•
|
interest.
|
Accounting practices for these costs do not change when timber becomes merchantable and harvesting starts.
Timber depletion.
To determine depletion rates, we divide the net carrying value of timber by the related volume of timber estimated to be available over the growth cycle. To determine the growth cycle volume of timber, we consider:
|
•
|
regulatory and environmental constraints,
|
|
•
|
our management strategies,
|
|
•
|
inventory data improvements,
|
|
•
|
growth rate revisions and recalibrations and
|
|
•
|
known dispositions and inoperable acres.
|
We include the cost of timber harvested in the carrying values of raw materials and product inventories. As these inventories are sold to third parties, we include them in the cost of products sold.
Forest management in Canada.
We manage timberlands under long-term licenses in various Canadian provinces that are:
|
•
|
granted by the provincial governments;
|
|
•
|
granted for initial periods of
15
to
25
years; and
|
|
•
|
renewable provided we meet reforestation, operating and management guidelines.
|
Calculation of the fees we pay on the timber we harvest:
|
•
|
varies from province to province,
|
|
•
|
is tied to product market pricing and
|
|
•
|
depends upon the allocation of land management responsibilities in the license.
|
WEYERHAEUSER COMPANY >
2016 ANNUAL REPORT AND FORM 10-K
67
Impairment of Long-Lived Assets
We review long-lived assets — including certain identifiable intangibles — for impairment whenever events or changes in circumstances indicate that the carrying amount of the assets may not be recoverable. Impaired assets held for use are written down to fair value. Impaired assets held for sale are written down to fair value less cost to sell. We determine fair value based on:
|
•
|
appraisals,
|
|
•
|
market pricing of comparable assets,
|
|
•
|
discounted value of estimated cash flows from the asset and
|
|
•
|
replacement values of comparable assets.
|
Goodwill
Goodwill is the purchase price minus the fair value of net assets acquired when we buy another entity. We assess goodwill for impairment:
|
•
|
using a fair-value-based approach and
|
|
•
|
at least annually — at the beginning of the fourth quarter.
|
In
2016
, the fair value of the reporting unit with goodwill substantially exceeded its carrying value.
ITEMS RELATED TO FINANCING OUR BUSINESS
Key items related to financing our business include financial instruments, cash and cash equivalents, accounts payable and concentration of risk.
Financial Instruments
We estimate the fair value of financial instruments where appropriate. The assumptions we use — including the discount rate and estimates of cash flows — can significantly affect our fair-value amounts. Our fair values are estimates and may not match the amounts we would realize upon sale or settlement of our financial positions.
Cash Equivalents
Cash equivalents are investments with original maturities of
90
days or less. We state cash equivalents at cost, which approximates market.
Accounts Payable
Our banking system replenishes our major bank accounts daily as checks we have issued are presented for payment. As a result, we have negative book cash balances due to outstanding checks that have not yet been paid by the bank. These negative balances are included in "Accounts payable" on our
Consolidated Balance Sheet
. Changes in these negative cash balances are reported as financing activities in our
Consolidated Statement of Cash Flows
. We had
no
negative book cash balances as of
December 31, 2016
and
December 31, 2015
.
Concentration of Risk
We disclose customers that represent a concentration of credit risk. As of
December 31, 2016
and
December 31, 2015
, no customer accounted for 10 percent or more of our net sales.
ITEMS RELATED TO OPERATIONS
Key items related to operations include revenue recognition, inventories, shipping and handling costs, income taxes, share-based compensation, pension and other postretirement plans, and environmental remediation.
Revenue Recognition
Operations generally recognize revenue upon shipment to customers. For certain export sales, revenue is recognized when title transfers at the foreign port.
For timberland sales, we recognize revenue when title and possession have been transferred to the buyer and all other criteria for sale and profit recognition have been satisfied.
Inventories
We state inventories at the lower of cost or market. Cost includes labor, materials and production overhead. LIFO — the last-in, first-out method — applies to major inventory products held at our U.S. domestic locations. We began to use the LIFO method for domestic products in the 1940s as required to conform with the tax method elected. Subsequent acquisitions of entities added new products under the FIFO — the first-in, first-out method — or moving average cost methods that have continued under those methods. The FIFO or moving average cost methods applies to the balance of our domestic raw material and product inventories as well as for all material and supply inventories and all foreign inventories.
Shipping and Handling Costs
We classify shipping and handling costs in "Costs of products sold" on our
Consolidated Statement of Operations
.
Income Taxes
We account for income taxes under the asset and liability method. Unrecognized tax benefits represent potential future funding obligations to taxing authorities if uncertain tax positions the company has taken on previously filed tax returns are not sustained. In accordance with the company’s accounting policy, accrued interest and penalties related to unrecognized tax benefits are recognized as a component of income tax expense.
We recognize deferred tax assets and liabilities to reflect:
|
•
|
future tax consequences due to differences between the carrying amounts for financial purposes and the tax bases of certain items and
|
|
•
|
operating loss and tax credit carryforwards.
|
WEYERHAEUSER COMPANY >
2016 ANNUAL REPORT AND FORM 10-K
68
To measure deferred tax assets and liabilities, we:
|
•
|
determine when the differences between the carrying amounts and tax bases of affected items are expected to be recovered or resolved and
|
|
•
|
use enacted tax rates expected to apply to taxable income in those years.
|
Share-Based Compensation
We generally measure the fair value of share-based awards on the dates they are granted or modified. These measurements establish the cost of the share-based awards for accounting purposes. We then recognize the cost of share-based awards in our
Consolidated Statement of Operations
over each employee’s required service period.
Note 16: Share-Based Compensation
provides more information about our share-based compensation.
Pension and Other Postretirement Benefit Plans
We recognize the overfunded or underfunded status of our defined benefit pension and other postretirement plans on our
Consolidated Balance Sheet
and recognize changes in the funded status through comprehensive income (loss) in the year in which the changes occur.
Actuarial valuations determine the amount of the pension and other postretirement benefit obligations and the net periodic benefit cost we recognize. The net periodic benefit cost includes:
|
•
|
cost of benefits provided in exchange for employees’ services rendered during the year;
|
|
•
|
interest cost of the obligations;
|
|
•
|
expected long-term return on plan assets;
|
|
•
|
gains or losses on plan settlements and curtailments;
|
|
•
|
amortization of prior service costs and plan amendments over the average remaining service period of the active employee group covered by the plans or the average remaining life expectancy in situations where the plan participants affected by the plan amendment are inactive; and
|
|
•
|
amortization of cumulative unrecognized net actuarial gains and losses — generally in excess of 10 percent of the greater of the benefit obligation or market-related value of plan assets at the beginning of the year — over the average remaining service period of the active employee group covered by the plans or the average remaining life expectancy in situations where the plan participants are inactive.
|
Pension plans.
We have pension plans covering most of our employees. Determination of benefits differs for salaried, hourly and union employees:
|
•
|
Salaried employee benefits are based on each employee’s highest monthly earnings for five consecutive years during the final 10 years before retirement.
|
|
•
|
Hourly and union employee benefits generally are stated amounts for each year of service.
|
|
•
|
Union employee benefits are set through collective-bargaining agreements.
|
We contribute to our U.S. and Canadian pension plans according to established funding standards. The funding standards for the plans are:
|
•
|
U.S. pension plans — according to the Employee Retirement Income Security Act of 1974; and
|
|
•
|
Canadian pension plans — according to the applicable provincial pension act and the Income Tax Act.
|
Postretirement benefits other than pensions.
We provide certain postretirement health care and life insurance benefits for some retired employees. In some cases, we pay a portion of the cost of the benefit.
Note 9: Pension and Other Postretirement Benefit Plans
provides additional information about changes made in our postretirement benefit plans during
2016
and
2015
.
Environmental Remediation
We accrue losses associated with environmental remediation obligations when such losses are probable and reasonably estimable. Future expenditures for environmental remediation obligations are not discounted to their present value. Recoveries of environmental remediation costs from other parties are recorded as assets when the recovery is deemed probable and does not exceed the amount of losses previously recorded.
WEYERHAEUSER COMPANY >
2016 ANNUAL REPORT AND FORM 10-K
69
NOTE 2:
BUSINESS SEGMENTS
Our business segments and how we account for those segments are discussed in
Note 1: Summary of Significant Accounting Policies
. This note provides key financial data by business segment.
KEY FINANCIAL DATA BY BUSINESS SEGMENT
Sales and Contribution (Charge) to Earnings
|
DOLLAR AMOUNTS IN MILLIONS
|
|||||||||||||||
|
|
TIMBERLANDS
|
|
REAL ESTATE
& ENR (1) |
|
WOOD
PRODUCTS |
|
UNALLOCATED ITEMS
(2)
AND INTERSEGMENT ELIMINATIONS
|
|
CONSOLIDATED
|
|
|||||
|
Sales to unaffiliated customers
|
|||||||||||||||
|
2016
|
$
|
1,805
|
|
$
|
226
|
|
$
|
4,334
|
|
$
|
—
|
|
$
|
6,365
|
|
|
2015
|
$
|
1,273
|
|
$
|
101
|
|
$
|
3,872
|
|
$
|
—
|
|
$
|
5,246
|
|
|
2014
|
$
|
1,415
|
|
$
|
104
|
|
$
|
3,970
|
|
$
|
—
|
|
$
|
5,489
|
|
|
Intersegment sales
|
|||||||||||||||
|
2016
|
$
|
840
|
|
$
|
1
|
|
$
|
68
|
|
$
|
(909
|
)
|
$
|
—
|
|
|
2015
|
$
|
830
|
|
$
|
—
|
|
$
|
82
|
|
$
|
(912
|
)
|
$
|
—
|
|
|
2014
|
$
|
867
|
|
$
|
—
|
|
$
|
80
|
|
$
|
(947
|
)
|
$
|
—
|
|
|
Contribution (charge) to earnings from continuing operations
|
|||||||||||||||
|
2016
|
$
|
499
|
|
$
|
55
|
|
$
|
512
|
|
$
|
(131
|
)
|
$
|
935
|
|
|
2015
|
$
|
470
|
|
$
|
79
|
|
$
|
258
|
|
$
|
(113
|
)
|
$
|
694
|
|
|
2014
|
$
|
532
|
|
$
|
81
|
|
$
|
327
|
|
$
|
85
|
|
$
|
1,025
|
|
|
(1) The Real Estate & ENR segment includes the equity earnings from, investments in and advances to our Real Estate Development Ventures (as defined and described in
Note 8: Related Parties
), which are accounted for under the equity method.
(2) Unallocated items are gains or charges not related to or allocated to an individual operating segment. They include a portion of items such as: share-based compensation, pension and postretirement costs, foreign exchange transaction gains and losses associated with financing, equity earnings from our Timberland Venture (as defined and described in
Note 8: Related Parties
), the elimination of intersegment profit in inventory and the LIFO reserve. As a result of reclassifying our former Cellulose Fibers segment as discontinued operations, Unallocated items also includes retained indirect corporate overhead costs previously allocated to the former segment.
|
|||||||||||||||
Management evaluates segment performance based on the contributions to earnings of the respective segments. An analysis and reconciliation of our business segment information to the consolidated financial statements follows:
Reconciliation of Contribution to Earnings to Net Earnings
|
DOLLAR AMOUNTS IN MILLIONS
|
|||||||||
|
|
2016
|
|
2015
|
|
2014
|
|
|||
|
Net contribution to earnings from continuing operations
|
$
|
935
|
|
$
|
694
|
|
$
|
1,025
|
|
|
Net contribution to earnings from discontinued operations
|
957
|
|
156
|
|
1,349
|
|
|||
|
Total contribution to earnings
|
1,892
|
|
850
|
|
2,374
|
|
|||
|
Interest expense, net of capitalized interest (continuing and discontinued operations)
|
(436
|
)
|
(347
|
)
|
(347
|
)
|
|||
|
Income before income taxes (continuing and discontinued operations)
|
1,456
|
|
503
|
|
2,027
|
|
|||
|
Income taxes (continuing and discontinued operations)
|
(429
|
)
|
3
|
|
(201
|
)
|
|||
|
Net earnings
|
$
|
1,027
|
|
$
|
506
|
|
$
|
1,826
|
|
WEYERHAEUSER COMPANY >
2016 ANNUAL REPORT AND FORM 10-K
70
Additional Financial Information
|
DOLLAR AMOUNTS IN MILLIONS
|
|||||||||||||||
|
|
TIMBERLANDS
|
|
REAL ESTATE & ENR
|
|
WOOD PRODUCTS
|
|
UNALLOCATED
ITEMS
|
|
CONSOLIDATED
|
|
|||||
|
Depreciation, depletion and amortization
|
|||||||||||||||
|
2016
|
$
|
366
|
|
$
|
13
|
|
$
|
129
|
|
$
|
4
|
|
$
|
512
|
|
|
2015
|
$
|
208
|
|
$
|
1
|
|
$
|
106
|
|
$
|
10
|
|
$
|
325
|
|
|
2014
|
$
|
207
|
|
$
|
—
|
|
$
|
119
|
|
$
|
12
|
|
$
|
338
|
|
|
Net pension and postretirement cost (credit)
(1)
|
|||||||||||||||
|
2016
|
$
|
8
|
|
$
|
—
|
|
$
|
22
|
|
$
|
(43
|
)
|
$
|
(13
|
)
|
|
2015
|
$
|
9
|
|
$
|
—
|
|
$
|
27
|
|
$
|
(11
|
)
|
$
|
25
|
|
|
2014
|
$
|
10
|
|
$
|
—
|
|
$
|
24
|
|
$
|
(45
|
)
|
$
|
(11
|
)
|
|
Charges for integration and restructuring, closures and asset impairments
(2)
|
|||||||||||||||
|
2016
|
$
|
—
|
|
$
|
15
|
|
$
|
7
|
|
$
|
148
|
|
$
|
170
|
|
|
2015
|
$
|
—
|
|
$
|
—
|
|
$
|
10
|
|
$
|
29
|
|
$
|
39
|
|
|
2014
|
$
|
1
|
|
$
|
—
|
|
$
|
2
|
|
$
|
41
|
|
$
|
44
|
|
|
Equity earnings (loss) from joint ventures
|
|||||||||||||||
|
2016
|
$
|
—
|
|
$
|
2
|
|
$
|
—
|
|
$
|
20
|
|
$
|
22
|
|
|
2015
|
$
|
—
|
|
$
|
—
|
|
$
|
—
|
|
$
|
—
|
|
$
|
—
|
|
|
2014
|
$
|
—
|
|
$
|
—
|
|
$
|
—
|
|
$
|
—
|
|
$
|
—
|
|
|
Capital expenditures
|
|||||||||||||||
|
2016
|
$
|
116
|
|
$
|
1
|
|
$
|
297
|
|
$
|
11
|
|
$
|
425
|
|
|
2015
|
$
|
75
|
|
$
|
—
|
|
$
|
287
|
|
$
|
3
|
|
$
|
365
|
|
|
2014
|
$
|
71
|
|
$
|
3
|
|
$
|
190
|
|
$
|
4
|
|
$
|
268
|
|
|
Investments in and advances to joint ventures
|
|||||||||||||||
|
2016
|
$
|
—
|
|
$
|
56
|
|
$
|
—
|
|
$
|
—
|
|
$
|
56
|
|
|
2015
|
$
|
—
|
|
$
|
—
|
|
$
|
—
|
|
$
|
—
|
|
$
|
—
|
|
|
2014
|
$
|
—
|
|
$
|
—
|
|
$
|
—
|
|
$
|
—
|
|
$
|
—
|
|
|
(1) Net pension and postretirement cost (credit) excludes special items, as well as the recognition of curtailments, settlements and special termination benefits due to closures, restructuring or divestitures. See
Note 9: Pension and Other Postretirement Benefit Plans
for more information.
|
|||||||||||||||
|
(2) See
Note 17: Charges for Integration and Restructuring, Closures and Asset Impairments
for more information.
|
|||||||||||||||
Total Assets
|
DOLLAR AMOUNTS IN MILLIONS
|
||||||||||||
|
TIMBERLANDS and
REAL ESTATE & ENR
|
|
WOOD
PRODUCTS
|
|
UNALLOCATED
ITEMS
|
|
CONSOLIDATED
|
|
|||||
|
Total assets
(1)(2)
|
||||||||||||
|
2016
|
$
|
15,608
|
|
$
|
1,910
|
|
$
|
1,725
|
|
$
|
19,243
|
|
|
2015
|
$
|
7,260
|
|
$
|
1,541
|
|
$
|
3,919
|
|
$
|
12,720
|
|
|
2014
|
$
|
7,327
|
|
$
|
1,430
|
|
$
|
4,846
|
|
$
|
13,603
|
|
|
(1) Assets attributable to the Real Estate & ENR business segment are combined with total assets for the Timberlands segment because we do not produce separate balance sheets internally.
(2) Unallocated Items total assets includes assets of discontinued operations.
|
||||||||||||
DISCONTINUED OPERATIONS
During 2016, we disposed of our former Cellulose Fibers segment, and during 2014 we disposed of Weyerhaeuser Real Estate Company (WRECO), both of which are excluded from the segment results above unless otherwise noted. See
Note 3: Discontinued Operations
for information regarding our discontinued operations and the segments affected.
NOTE 3:
DISCONTINUED OPERATIONS
We have made certain reclassifications in our consolidated financial statements to reflect discontinued operations related to our former Cellulose Fibers businesses and WRECO. These results have been summarized in "Earnings from discontinued operations, net of income taxes" on our
Consolidated Statement of Operations
for each period presented. The related assets and liabilities of these operations have been reclassified as discontinued operations on our
Consolidated Balance Sheet
for each date presented. We did not reclassify our
Consolidated Statement of Cash Flows
to reflect discontinued operations.
Cellulose Fibers was previously disclosed as a separate reportable business segment, and WRECO and its subsidiaries were previously reported as the Real Estate segment. Retained indirect corporate overhead costs previously allocated to Cellulose Fibers and WRECO are now reported as part of Unallocated Items.
WEYERHAEUSER COMPANY >
2016 ANNUAL REPORT AND FORM 10-K
71
On October 12, 2016, we announced the exploration of strategic alternatives for our timberlands and manufacturing operations in Uruguay. We intend to consider a broad range of alternatives, including continuing to hold and operate the business, or a sale. The related assets and liabilities of our Uruguay operations have not met the criteria for classification as "held for sale" and are not included in our results of discontinued operations for the year ended December 31, 2016.
OPERATIONS INCLUDED IN DISCONTINUED OPERATIONS
Cellulose Fibers Divestitures
On November 8, 2015, Weyerhaeuser announced that the board authorized the exploration of strategic alternatives for its Cellulose Fibers business segment.
On May 1, 2016, we entered into an agreement to sell our Cellulose Fibers pulp business to International Paper for
$2.2 billion
in cash. The pulp business consists of five pulp mills located in Columbus, Mississippi; Flint River, Georgia; New Bern, North Carolina; Port Wentworth, Georgia and Grand Prairie, Alberta, and two modified fiber mills located in Columbus, Mississippi and Gdansk, Poland. On December 1, 2016, we completed the sale and recognized a pretax gain of
$735 million
, which is included in "Earnings from discontinued operations, net of income taxes" on the
Consolidated Statement of Operations
.
On June 15, 2016, we entered into an agreement to sell our Cellulose Fibers liquid packaging board business to Nippon Paper Industries Co., Ltd., for
$285 million
in cash. Our liquid packaging board business consisted of one mill located in Longview, Washington. On August 31, 2016, we completed the sale. We recognized a pretax gain of
$53 million
, which is included in "Earnings from discontinued operations, net of income taxes" on the
Consolidated Statement of Operations
.
On October 4, 2016, we entered into an agreement to sell our interest in our printing papers joint venture to One Rock Capital Partners, LLC, for
$42 million
of cash proceeds. The transaction included the printing papers mill located in Longview, Washington. On November 1, 2016, we completed the sale.
We used
$1.7 billion
of the after-tax proceeds from the sale of our Cellulose Fibers business segment for repayment of debt.
The following table presents the components of the net gain on the divestiture of Cellulose Fibers:
|
DOLLAR AMOUNTS IN MILLIONS
|
|||
|
|
2016
|
|
|
|
Proceeds, net of cash and cash equivalents disposed of
|
$
|
2,486
|
|
|
Less:
|
|||
|
Net book value of assets and liabilities disposed of
|
(1,678
|
)
|
|
|
Transaction costs, net of reimbursement
|
(19
|
)
|
|
|
(1,697
|
)
|
||
|
Pretax gain on Cellulose Fibers divestitures
|
789
|
|
|
|
Income taxes
|
(243
|
)
|
|
|
Net gain on Cellulose Fibers divestitures
|
$
|
546
|
|
WRECO Divestiture
On
July 7, 2014
, we completed the following set of transactions resulting in our homebuilding and real estate development business becoming wholly-owned by TRI Pointe Homes, Inc. (TRI Pointe):
|
•
|
the distribution of shares of WRECO to our shareholders in exchange for
59 million
shares of our common stock; and
|
|
•
|
the merger of WRECO into a special purpose subsidiary of TRI Pointe, with WRECO surviving the merger and becoming a wholly-owned subsidiary of TRI Pointe.
|
Collectively, these transactions are referred to as the “WRECO Divestiture”.
During June 2014, our wholly-owned subsidiary, WRECO, issued
$900 million
of unsecured and unsubordinated senior debt obligations. The net proceeds after deducting the discount, underwriting fees and issuance costs were
$870 million
. At the close of the WRECO Divestiture in July 2014, WRECO used
$744 million
of the debt proceeds to repay intercompany debt and interest to Weyerhaeuser Company. The newly issued debt, remaining proceeds and other WRECO assets and liabilities, including
$5 million
cash on hand, were acquired by TRI Pointe when WRECO became a wholly-owned subsidiary of TRI Pointe at the closing of the transaction. Additionally,
$32 million
related to the adjustment amount payable pursuant to the terms of the transaction agreement was paid to TRI Pointe. Our net cash proceeds in connection with the WRECO Divestiture totaled
$707 million
.
Prior to the distribution of WRECO shares to our shareholders, WRECO was a wholly-owned subsidiary. Concurrent with the distribution to shareholders, WRECO ceased being a subsidiary.
WEYERHAEUSER COMPANY >
2016 ANNUAL REPORT AND FORM 10-K
72
The following table presents the components of the net gain on the divestiture of WRECO:
|
DOLLAR AMOUNTS IN MILLIONS
|
|||
|
|
2014
|
|
|
|
Proceeds:
|
|||
|
Common shares tendered (58,813,151 shares at $33.22 per share)
|
$
|
1,954
|
|
|
Cash
|
707
|
|
|
|
2,661
|
|
||
|
Less:
|
|||
|
Net book value of contributed assets
|
(1,671
|
)
|
|
|
Transaction costs, net of reimbursement
|
(18
|
)
|
|
|
(1,689
|
)
|
||
|
Gain on WRECO divestiture
|
$
|
972
|
|
The net gain on the WRECO Divestiture of
$972 million
is not taxable and was recognized in 2014 in discontinued operations.
NET EARNINGS FROM DISCONTINUED OPERATIONS
Sales and Net Earnings from Discontinued Operations
|
DOLLAR AMOUNTS IN MILLIONS
|
|||||||||
|
|
2016
(1)
|
|
2015
(2)
|
|
2014
(3)
|
|
|||
|
Total net sales
|
$
|
1,537
|
|
$
|
1,860
|
|
$
|
2,509
|
|
|
Costs of products sold
|
1,283
|
|
1,573
|
|
2,030
|
|
|||
|
Gross margin
|
254
|
|
287
|
|
479
|
|
|||
|
Selling expenses
|
12
|
|
14
|
|
61
|
|
|||
|
General and administrative expenses
|
29
|
|
30
|
|
57
|
|
|||
|
Research and development expenses
|
5
|
|
6
|
|
7
|
|
|||
|
Charges for integration and restructuring, closures and asset impairments
(4)
|
63
|
|
2
|
|
3
|
|
|||
|
Other operating income, net
|
(27
|
)
|
(26
|
)
|
(27
|
)
|
|||
|
Operating income
|
172
|
|
261
|
|
378
|
|
|||
|
Equity loss from joint venture
|
(4
|
)
|
(105
|
)
|
(1
|
)
|
|||
|
Interest expense, net of capitalized interest
|
(5
|
)
|
(6
|
)
|
(9
|
)
|
|||
|
Earnings from discontinued operations before income taxes
|
163
|
|
150
|
|
368
|
|
|||
|
Income taxes
|
(97
|
)
|
(55
|
)
|
(130
|
)
|
|||
|
Net earnings from operations
|
66
|
|
95
|
|
238
|
|
|||
|
Net gain on divestiture of Cellulose Fibers
|
546
|
|
—
|
|
—
|
|
|||
|
Net gain on divestiture of WRECO
|
—
|
|
—
|
|
972
|
|
|||
|
Net earnings from discontinued operations
|
$
|
612
|
|
$
|
95
|
|
$
|
1,210
|
|
|
(1) Discontinued operations in 2016 includes 335 days of the pulp business, 305 days of our printing papers joint venture operations, and 244 days of the liquid packaging board business.
(2) Discontinued operations in 2015 includes a full year of the Cellulose Fibers business segment operations.
(3) Discontinued operations in 2014 includes a full year of the Cellulose Fibers business segment operations and 188 days of WRECO operations.
(4) Charges for integration and restructuring, closures and asset impairments consist of costs related to our strategic evaluation of the Cellulose Fibers businesses and transaction-related costs.
|
|||||||||
Results of discontinued operations exclude certain general corporate overhead costs that have been allocated to and are included in contribution to earnings for the operating segments.
WEYERHAEUSER COMPANY >
2016 ANNUAL REPORT AND FORM 10-K
73
CARRYING VALUE OF ASSETS AND LIABILITIES OF DISCONTINUED OPERATIONS
The following table shows carrying values for assets and liabilities classified as discontinued operations as of
December 31, 2015
.
Carrying Value of Assets and Liabilities of Discontinued Operations
|
DOLLAR AMOUNTS IN MILLIONS
|
|||
|
|
DECEMBER 31,
2015 |
|
|
|
Assets
|
|||
|
Cash and cash equivalents
|
$
|
1
|
|
|
Receivables, less discounts and allowances
|
211
|
|
|
|
Inventories
|
243
|
|
|
|
Prepaid expenses
|
14
|
|
|
|
Property and equipment, net
|
1,339
|
|
|
|
Construction in progress
|
51
|
|
|
|
Timber and timberlands at cost, less depletion charged to disposals
|
1
|
|
|
|
Investments in and advances to equity affiliates
|
74
|
|
|
|
Total assets of discontinued operations
|
$
|
1,934
|
|
|
Liabilities
|
|||
|
Accounts payable
|
$
|
122
|
|
|
Accrued liabilities
|
118
|
|
|
|
Long-term debt
|
88
|
|
|
|
Deferred income taxes
|
336
|
|
|
|
Other liabilities
|
26
|
|
|
|
Total liabilities of discontinued operations
|
$
|
690
|
|
CASH FLOWS FROM DISCONTINUED OPERATIONS
The following table shows cash flows from discontinued operations for the three-year period ended
December 31, 2016
.
Cash Flows from Discontinued Operations
|
DOLLAR AMOUNTS IN MILLIONS
|
|||||||||
|
|
2016
(1)
|
|
2015
(2)
|
|
2014
(3)
|
|
|||
|
Net cash provided by (used in) operating activities
|
$
|
196
|
|
$
|
429
|
|
$
|
399
|
|
|
Net cash provided by (used in) investing activities
|
$
|
2,356
|
|
$
|
(118
|
)
|
$
|
581
|
|
|
(1) Discontinued operations in 2016 includes 335 days of the pulp business, 305 days of our printing papers joint venture operations, and 244 days of the liquid packaging board business, and the cash flows associated with the CF divestitures.
(2) Discontinued operations in 2015 includes a full year of the Cellulose Fibers business segment operations.
(3) Discontinued operations in 2014 includes a full year of the Cellulose Fibers business segment operations, 188 days of WRECO operations and the cash flows associated with the WRECO divestiture.
|
|||||||||
RELATED PARTY TRANSACTIONS WITH PRINTING PAPERS JOINT VENTURE
Prior to November 1, 2016, we held a
50 percent
ownership interest in North Pacific Paper Corporation (NORPAC), our printing papers joint venture, which we considered a related party. We provided goods and services to NORPAC, including raw materials and support services. The amount paid to Weyerhaeuser by this joint venture for goods and services were:
|
•
|
$126 million
in
2016
,
|
|
•
|
$197 million
in
2015
and
|
|
•
|
$195 million
in
2014
.
|
Prior to the divestiture, we managed cash for NORPAC under a services agreement. Weyerhaeuser held the cash and recorded a payable balance to NORPAC, which is included in "Accounts payable" in the accompanying
Consolidated Balance Sheet
. We had
$46 million
payable to NORPAC at
December 31, 2015
.
NOTE 4:
MERGER WITH PLUM CREEK
MERGER WITH PLUM CREEK
On February 19, 2016, we merged with Plum Creek Timber Company, Inc. (Plum Creek). Plum Creek was a REIT that primarily owned and managed timberlands in the United States. Plum Creek also produced wood products, developed opportunities for mineral and other natural resource extraction, and sold real estate properties. The merger combined two industry leaders. The breadth and diversity of our combined timberlands, real estate, energy and natural resources assets, and wood products operations position Weyerhaeuser to capitalize on the improving housing market and to continue to capture premium land values across the combined portfolio.
WEYERHAEUSER COMPANY >
2016 ANNUAL REPORT AND FORM 10-K
74
Under the merger agreement, each issued and outstanding share of Plum Creek common stock was exchanged for
1.60
Weyerhaeuser common shares, with cash paid in lieu of any fractional shares. Upon consummation of the merger, all outstanding Plum Creek stock options (all fully vested as of the merger date) and restricted stock units were converted into Weyerhaeuser stock options and restricted stock units, after giving effect to the
1.60
exchange ratio. Because the Plum Creek stock options were fully vested and relate to services rendered to Plum Creek prior to the merger, the replacement stock options were also fully vested and their fair value is included in the consideration transferred. Replacement restricted stock units relate to services to be performed post-merger and therefore were not included in consideration transferred. See additional details about replacement share-based payment awards in
Note 16: Share-based Compensation
.
The acquisition of total assets of
$10.0 billion
was a noncash investing and financing activity comprised of
$6.4 billion
in equity consideration transferred and
$3.6 billion
of liabilities assumed. See
Note 12: Long-term Debt
for additional details of indebtedness assumed.
The following table summarizes the equity consideration transferred in the merger:
|
DOLLAR AMOUNTS IN MILLIONS, EXCEPT PER-SHARE FIGURES
|
||||||
|
Number of Plum Creek common shares outstanding
(1)
|
174,307,267
|
|
||||
|
Exchange ratio per the merger agreement
|
1.60
|
|
||||
|
Weyerhaeuser shares issued in exchange for Plum Creek equity
(2)
|
278,886,704
|
|
||||
|
Price per Weyerhaeuser common share
(3)
|
$
|
22.87
|
|
|||
|
Aggregate value of Weyerhaeuser common stock issued
|
$
|
6,378
|
|
|||
|
Fair value of stock options
(4)
|
5
|
|
||||
|
Estimated equity consideration transferred
|
$
|
6,383
|
|
|||
|
(1) The number of shares of Plum Creek common stock issued and outstanding as of February 19, 2016.
(2) Total shares issued net of partial shares settled in cash.
(3) The closing price of Weyerhaeuser common stock on the NYSE on February 19, 2016.
(4) The estimated fair value of Plum Creek stock options for pre-merger services rendered.
|
||||||
We recognized
$146 million
of merger-related costs that were expensed during the year ended
December 31, 2016
. We also recognized
$14 million
of merger-related costs that were expensed during the fourth quarter 2015. See
Note 17: Charges for Integration and Restructuring, Closures, and Asset Impairments
for descriptions of the components of merger-related costs. These costs are included in "Charges for integration and restructuring, closures and asset impairments" in our
Consolidated Statement of Operations
.
As a result of progress made to integrate financial systems since the merger date, the amount of revenue and loss before income taxes from acquired Plum Creek operations is no longer practicable to disclose for the year-to-date period ended
December 31, 2016
.
Summarized Unaudited Pro Forma Information that Presents Combined Amounts as if this Merger Occurred at the Beginning of 2015
|
DOLLAR AMOUNTS IN MILLIONS, EXCEPT PER-SHARE FIGURES
|
||||||
|
|
2016
|
|
2015
|
|
||
|
Net sales
|
$
|
6,525
|
|
$
|
6,664
|
|
|
Net earnings from continuing operations attributable to Weyerhaeuser common shareholders
|
$
|
519
|
|
$
|
487
|
|
|
Net earnings from continuing operations per share attributable to Weyerhaeuser common shareholders, basic
|
$
|
0.69
|
|
$
|
0.61
|
|
|
Net earnings from continuing operations per share attributable to Weyerhaeuser common shareholders, diluted
|
$
|
0.68
|
|
$
|
0.61
|
|
Pro forma net earnings attributable to Weyerhaeuser common shareholders exclude
$155 million
of non-recurring merger-related costs (net of tax) incurred in the year ended
December 31, 2016
. During the year ended
December 31, 2015
we incurred
$22 million
of non-recurring merger-related costs. Pro forma data may not be indicative of the results that would have been obtained had these events occurred at the beginning of the periods presented, nor is it intended to be a projection of future results.
Weyerhaeuser has accounted for the merger transaction as the acquirer and has applied the acquisition method of accounting. Under the acquisition method, the assets acquired and liabilities assumed by Weyerhaeuser from Plum Creek were recorded as of the date of the acquisition at their respective estimated fair values.
The fair values of the assets acquired and liabilities assumed were determined using the income, cost or market approaches. The fair value measurements were generally based on significant inputs that are not observable in the market and thus represent Level 3 measurements as defined in ASC 820, Fair Value Measurement, with the exception of certain long-term debt instruments assumed in the acquisition that were valued using observable market inputs and are therefore Level 2 measurements. The income approach was primarily used to value acquired timberlands, minerals and mineral rights, equity investments in the Timberland Venture (as defined and described in
Note 8: Related Parties
) and Real Estate Development Ventures (as defined and described in
Note 8: Related Parties
), and the Note Payable to Timberland Venture (as defined and described in
Note 12: Long-term Debt
). The income approach estimates fair value for an asset based on the present value of cash flow projected to be generated by the asset. Projected cash flows are discounted at rates of return that reflect the relative risk of achieving the cash flows and the time value of money. The cost approach, which estimates value by determining the current cost of replacing an asset with another of equivalent economic utility, was used, as appropriate, for property and equipment. The cost to replace a given asset reflects the estimated reproduction or replacement cost for the property, less an allowance for loss in value due to depreciation. The market approach was primarily used to value higher and better use real estate tracts included within acquired timberlands, certain land and building assets included within acquired property and equipment, and long-term debt instruments. The market approach estimates fair value for an asset based on values of recent comparable transactions.
WEYERHAEUSER COMPANY >
2016 ANNUAL REPORT AND FORM 10-K
75
Initial and Final Estimated Fair Value of Identifiable Assets Acquired and Liabilities Assumed as of the Merger Date
|
DOLLAR AMOUNTS IN MILLIONS
|
|||||||||
|
|
PRELIMINARY ALLOCATION
|
|
MEASUREMENT PERIOD ADJUSTMENTS
|
|
FINAL ALLOCATION
|
|
|||
|
Current assets
|
$
|
128
|
|
$
|
10
|
|
$
|
138
|
|
|
Timber and timberlands
|
8,124
|
|
2
|
|
8,126
|
|
|||
|
Minerals and mineral rights
|
312
|
|
6
|
|
318
|
|
|||
|
Property and equipment
|
272
|
|
5
|
|
277
|
|
|||
|
Equity investment in Timberland Venture
|
876
|
|
(29
|
)
|
847
|
|
|||
|
Equity investment in Real Estate Development Ventures
|
88
|
|
(3
|
)
|
85
|
|
|||
|
Other assets
|
163
|
|
4
|
|
167
|
|
|||
|
Total assets acquired
|
9,963
|
|
(5
|
)
|
9,958
|
|
|||
|
Current liabilities
|
610
|
|
—
|
|
610
|
|
|||
|
Long-term debt
|
2,056
|
|
—
|
|
2,056
|
|
|||
|
Note payable to Timberland Venture
|
837
|
|
1
|
|
838
|
|
|||
|
Other liabilities
|
77
|
|
(6
|
)
|
71
|
|
|||
|
Total liabilities assumed
|
3,580
|
|
(5
|
)
|
3,575
|
|
|||
|
Net assets acquired
|
$
|
6,383
|
|
$
|
—
|
|
$
|
6,383
|
|
The initial allocation of purchase price was recorded using preliminary estimated fair value of assets acquired and liabilities assumed based upon the best information available to management at the time. The purchase price allocation was finalized as of December 31, 2016. The measurement period adjustments reflect additional information obtained to record the fair value of certain assets acquired and liabilities assumed based on facts and circumstances existing as of the acquisition date. Measurement period adjustments reflected above did not have a material impact to earnings or cash flows for the year ended
December 31, 2016
.
NOTE 5:
NET EARNINGS PER SHARE
Our basic earnings per share attributable to Weyerhaeuser common shareholders for the last three years were:
|
•
|
$1.40
in
2016
,
|
|
•
|
$0.89
in
2015
and
|
|
•
|
$3.20
in
2014
.
|
Our diluted earnings per share attributable to Weyerhaeuser common shareholders for the last three years were:
|
•
|
$1.39
in
2016
,
|
|
•
|
$0.89
in
2015
and
|
|
•
|
$3.18
in
2014
.
|
This note discloses:
|
•
|
how we calculate basic and diluted net earnings per share and
|
|
•
|
shares excluded from dilutive effect.
|
HOW WE CALCULATE BASIC AND DILUTED NET EARNINGS PER SHARE
"Basic earnings" per share is net earnings available to common shareholders divided by the weighted average number of our outstanding common shares, including stock equivalent units where there is no circumstance under which those shares would not be issued.
"Diluted earnings" per share is net earnings available to common shareholders divided by the sum of the:
|
•
|
weighted average number of our outstanding common shares and
|
|
•
|
the effect of our outstanding dilutive potential common shares.
|
Dilutive potential common shares may include:
|
•
|
outstanding stock options,
|
|
•
|
restricted stock units,
|
|
•
|
performance share units and
|
|
•
|
preference shares.
|
WEYERHAEUSER COMPANY >
2016 ANNUAL REPORT AND FORM 10-K
76
Diluted earnings per share is net earnings available to common shareholders divided by the sum of the weighted average number of our outstanding common shares and the effect of our outstanding dilutive potential common shares:
|
SHARES IN THOUSANDS
|
||||||
|
2016
|
|
2015
|
|
2014
|
|
|
|
Weighted average number of outstanding shares - basic
|
718,560
|
|
516,371
|
|
556,705
|
|
|
Dilutive potential common shares:
|
||||||
|
Stock options
|
2,672
|
|
2,342
|
|
3,190
|
|
|
Restricted stock units
|
756
|
|
381
|
|
510
|
|
|
Performance share units
|
413
|
|
524
|
|
494
|
|
|
Total effect of outstanding dilutive potential common shares
|
3,841
|
|
3,247
|
|
4,194
|
|
|
Weighted average number of outstanding common shares - dilutive
|
722,401
|
|
519,618
|
|
560,899
|
|
We use the treasury stock method to calculate the dilutive effect of our outstanding stock options, restricted stock units and performance share units. Share-based payment awards that are contingently issuable upon the achievement of specified performance or market conditions are included in our diluted earnings per share calculation in the period in which the conditions are satisfied.
We issued
13.8 million
6.375 percent Mandatory Convertible Preference Shares, Series A on June 24, 2013. For all periods presented, the Preference Shares were antidilutive as determined using the if-converted method. In applying the if-converted method, conversion was not assumed for purposes of computing diluted earnings per share if the effect was antidilutive. Preference shares were antidilutive whenever the amount of the dividend declared in or accumulated for the current period per common share obtainable on conversion exceeded diluted earnings per share exclusive of the preference shares.
Preference shares were evaluated for participation on a quarterly basis to determine whether two-class presentation was required. Preference shares were considered to be participating as of the financial reporting period end to the extent they would participate in dividends paid to common shareholders. Preference shares were not considered participating for the years ended
December 31, 2015
and
December 31, 2014
. Under the provisions of the two-class method, basic and diluted earnings per share would be presented for both preference and common shareholders.
All remaining outstanding preference shares were converted to common shares on July 1, 2016. See further information at
Note 15: Shareholders' Interest
.
SHARES EXCLUDED FROM DILUTIVE EFFECT
The following shares were not included in the computation of diluted earnings per share because they were either antidilutive or the required performance or market conditions were not met. Some or all of these shares may be dilutive potential common shares in future periods.
Potential Shares Not Included in the Computation of Diluted Earnings per Share
|
SHARES IN THOUSANDS
|
||||||
|
|
2016
|
|
2015
|
|
2014
|
|
|
Stock options
|
1,462
|
|
5,016
|
|
—
|
|
|
Performance share units
|
384
|
|
155
|
|
—
|
|
|
Preference Shares
|
—
|
|
25,307
|
|
24,988
|
|
NOTE 6:
INVENTORIES
Inventories include raw materials, work-in-process and finished goods.
Inventories as of the End of Our Last Two Years
|
DOLLAR AMOUNTS IN MILLIONS
|
||||||
|
|
DECEMBER 31,
2016 |
|
DECEMBER 31,
2015 |
|
||
|
LIFO inventories:
|
||||||
|
Logs
|
$
|
18
|
|
$
|
5
|
|
|
Lumber, plywood and panels
|
51
|
|
48
|
|
||
|
Other products
|
20
|
|
11
|
|
||
|
FIFO or moving average cost inventories:
|
||||||
|
Logs
|
21
|
|
36
|
|
||
|
Lumber, plywood, panels and engineered wood products
|
71
|
|
75
|
|
||
|
Other products
|
92
|
|
84
|
|
||
|
Materials and supplies
|
85
|
|
66
|
|
||
|
Total
|
$
|
358
|
|
$
|
325
|
|
LIFO — the last-in, first-out method — applies to major inventory products held at our U.S. domestic locations. The FIFO — the first-in, first-out method — or moving average cost methods apply to the balance of our domestic raw material and product inventories as well as for all material and supply inventories and all foreign inventories. If we used FIFO for all LIFO inventories, our stated inventories would have been higher by
$71 million
as of
December 31, 2016
, and
$67 million
as of
December 31, 2015
, respectively.
WEYERHAEUSER COMPANY >
2016 ANNUAL REPORT AND FORM 10-K
77
HOW WE ACCOUNT FOR OUR INVENTORIES
The Inventories section of
Note 1: Summary of Significant Accounting Policies
provides details about how we account for our inventories.
NOTE 7:
PROPERTY AND EQUIPMENT
Property and equipment includes land, buildings and improvements, machinery and equipment, roads and other items.
Carrying Value of Property and Equipment and Estimated Service Lives
|
DOLLAR AMOUNTS IN MILLIONS
|
|||||||
|
|
RANGE OF LIVES
|
DECEMBER 31,
2016 |
|
DECEMBER 31,
2015 |
|
||
|
Property and equipment, at cost:
|
|
|
|
||||
|
Land
|
N/A
|
$
|
90
|
|
$
|
99
|
|
|
Buildings and improvements
|
15-35
|
789
|
|
791
|
|
||
|
Machinery and equipment
|
5-25
|
3,022
|
|
2,811
|
|
||
|
Roads
|
10-25
|
773
|
|
624
|
|
||
|
Other
|
3-10
|
194
|
|
195
|
|
||
|
Total cost
|
|
4,868
|
|
4,520
|
|
||
|
Allowance for depreciation and amortization
|
|
(3,306
|
)
|
(3,287
|
)
|
||
|
Property and equipment, net
|
|
$
|
1,562
|
|
$
|
1,233
|
|
SERVICE LIVES AND DEPRECIATION
In general, additions are classified into components, each with its own estimated useful life as determined at the time of purchase. Buildings and improvements for property and equipment have estimated lives that are generally at either the high end or low end of the range from
15 years
to
35 years
, depending on the type and performance of construction.
Depreciation expense, excluding discontinued operations, was:
|
•
|
$198 million
in
2016
,
|
|
•
|
$160 million
in
2015
and
|
|
•
|
$178 million
in
2014
.
|
NOTE 8:
RELATED PARTIES
This note provides details about and our transactions with related parties. Our related parties consist of:
|
•
|
joint ventures accounted for using the equity method,
|
|
•
|
our Twin Creeks Venture and
|
|
•
|
special-purpose entities (SPEs).
|
JOINT VENTURES ACCOUNTED FOR USING THE EQUITY METHOD
We have investments in unconsolidated joint ventures over which we have significant influence that we account for using the equity method. We record our share of net earnings within "Equity earnings from joint ventures" in our
Consolidated Statement of Operations
in the period in which earnings are recorded by the affiliates. Through our merger with Plum Creek on February 19, 2016, we acquired equity interests in the Real Estate Development Ventures and the Timberland Venture.
Real Estate Development Ventures
WestRock-Charleston Land Partners, LLC (WR-CLP) is a limited liability company which holds residential and commercial real estate development properties, currently under development (Class A Properties) and higher-value timber and development lands (Class B Properties) (referred to collectively as the Real Estate Development Ventures). We have a
3 percent
interest in Class A Properties and a
50 percent
interest in Class B Properties. WestRock Company is the other member of WR-CLP and owns
97 percent
of the Class A Properties and
50 percent
of the Class B Properties. The company uses the equity method for both its Class A and Class B interests. Our share of the equity earnings are included in the net contribution to earnings of our Real Estate & ENR segment.
WR-CLP is a variable interest entity and is financed by regular capital calls from the manager of WR-CLP in proportion to a member’s ownership interest. If a member does not make a capital contribution, the member’s ownership interest is diluted. We are not committed to make any material capital contributions during the remaining term of the venture, which expires in
2020
. We do not intend to provide any additional sources of financing for WR-CLP.
We are not the primary beneficiary of WR-CLP. We consider the activities that most significantly impact the economic performance of WR-CLP to be the day-to-day operating decisions along with the oversight responsibilities for the real estate development projects and properties. WestRock Company (the other equity member) has the power to direct the activities of WR-CLP that most significantly impact its economic performance through its ability to manage the day-to-day operations of WR-CLP. WestRock Company also has the ability to control all management decisions associated with all Class A and Class B Properties through its majority representation on the board of directors for the Class A Properties and due to its equal representation on the board of directors for the Class B Properties.
Our maximum exposure to loss is
$56 million
, the carrying amount of our investment in WR-CLP at
December 31, 2016
, plus any required future capital contributions.
WEYERHAEUSER COMPANY >
2016 ANNUAL REPORT AND FORM 10-K
78
Timberland Venture
Beginning on the date of our merger with Plum Creek until August 31, 2016, we held preferred and common interests in Southern Diversified Timber, LLC, a timberland joint venture (Timberland Venture), which included
100 percent
of the preferred interests and
9 percent
of the common interests. The Timberland Venture’s other member, an affiliate of Campbell Global LLC (TCG Member), held
91 percent
of the Timberland Venture’s common interests.
The activities of the Timberland Venture consisted primarily of:
|
•
|
owning, growing, managing and sustaining its timberlands;
|
|
•
|
entering into cutting contracts with an affiliate of Campbell Global LLC for the sale and harvest of timber; and
|
|
•
|
owning a promissory note payable to the Timberland Venture (Note Payable to Timberland Venture) and collecting interest thereon.
|
Our investment in and share of the equity earnings of the Timberland Venture was not attributed to one of our business segments, and was reported in Unallocated Items.
On August 31, 2016, the Timberland Venture redeemed TCG Member’s interest. Upon the redemption, the Timberland Venture distributed all of the timberlands, a portion of the cash balance, and other net assets to TCG Member equal in total to the fair value of TCG Member's adjusted capital account. Following the redemption and distribution of assets to TCG Member, the Timberland Venture's remaining assets consisted of cash and a note receivable from Weyerhaeuser.
As we now hold all of the equity interests in the Timberland Venture, we have consolidated it as a wholly-owned subsidiary and eliminated our equity method investment in the Timberland Venture. As a result, the note payable to Timberland Venture is now eliminated for financial reporting purposes in consolidation as it is now intercompany indebtedness and therefore no longer appears on our
Consolidated Balance Sheet
.
In conjunction with the redemption of TCG Member, we remeasured our previously held equity interest to fair value at August 31, 2016, resulting in recognition of a gain of
$6 million
in "Interest income and other" on our
Consolidated Statement of Operations
during third quarter 2016.
Other Joint Ventures
During 2016, we sold our interest in North Pacific Paper Corporation (NORPAC). See
Note 3: Discontinued Operations
for additional information.
During 2014, Catchlight Energy was dissolved. We received
no
proceeds from the dissolution.
OUR TWIN CREEKS VENTURE
Through the merger with Plum Creek, Weyerhaeuser assumed the benefits and obligations associated with the formation of Twin Creeks Timber, LLC, a timberland venture (Twin Creeks Venture).
On April 1, 2016, we contributed approximately
260,000
acres of our southern timberlands with an agreed-upon value of approximately
$560 million
to Twin Creeks Timber, LLC (Twin Creeks Venture), in exchange for cash of approximately
$440 million
and a
21 percent
ownership interest. The other members contributed cash of approximately
$440 million
for a combined
79 percent
ownership interest.
The Twin Creeks Venture is expected to raise total committed capital of up to
$950 million
from its investors over the next several years. We expect to maintain a
21 percent
ownership interest and to contribute additional capital of up to
$85 million
during the next several years. Unless extended by unanimous vote of all the investors, the term of the Twin Creeks Venture is
15
years.
In conjunction with contributing to the venture, we entered into a separate agreement to manage the timberlands owned by the Twin Creeks Venture, including harvesting activities, marketing and log sales activities, and replanting and silviculture activities. This management agreement guarantees the Twin Creeks Venture an annual return equal to
three percent
of the contributed value of the managed timberlands in the form of minimum quarterly payments from Weyerhaeuser. We are also required to annually distribute
75 percent
of any profits earned by us in excess of the minimum quarterly payments. The management agreement is cancellable at any time by Twin Creeks Timber, LLC, and otherwise will expire on April 1, 2019.
The guaranteed return that the management agreement requires Weyerhaeuser to provide to the Twin Creeks Venture constitutes continuing involvement in the timberlands we contributed to the venture. This continuing involvement prohibits recognition of the contribution as a sale and requires application of the deposit method to account for the cash payment received. By applying the deposit method to the contribution of timberlands to the venture:
|
•
|
Our receipt of
$440 million
proceeds from the contribution of timberlands to the venture was recorded as a noncurrent liability - "Deposit from contribution of timberlands to related party" - on our
Consolidated Balance Sheet
.
|
|
•
|
The contributed timberlands will continue to be reported within the "Timber and timberlands at cost, less depletion charged to disposals" on our
Consolidated Balance Sheet
with no change in value.
|
|
•
|
No gain or loss was recognized in our
Consolidated Statement of Operations
.
|
|
•
|
Our balance sheet does not reflect our
21 percent
ownership interest in the Twin Creeks Venture.
|
The receipt of
$440 million
was classified as a cash flow from investing activities in our
Consolidated Statement of Cash Flows
. The cash proceeds from our contribution of timberlands were used to fund our share repurchases.
Changes in our deposit from contribution of timberlands to related party balance during
2016
were as follows:
|
DOLLAR AMOUNTS IN MILLIONS
|
|||
|
|
|||
|
Balance at December 31, 2015
|
$
|
—
|
|
|
Initial cash receipt upon contribution of timberlands to Twin Creeks Venture
|
440
|
|
|
|
Lease payments to Twin Creeks Venture
|
(17
|
)
|
|
|
Distributions from Twin Creeks Venture
|
3
|
|
|
|
Balance at December 31, 2016
|
$
|
426
|
|
WEYERHAEUSER COMPANY >
2016 ANNUAL REPORT AND FORM 10-K
79
SPECIAL-PURPOSE ENTITIES
From 2002 through 2004, we sold certain nonstrategic timberlands in five separate transactions. We are the primary beneficiary and consolidate the assets and liabilities of certain monetization and buyer-sponsored SPEs involved in these transactions. We have an equity interest in the monetization SPEs, but no ownership interest in the buyer-sponsored SPEs. The following disclosures refer to assets of buyer-sponsored SPEs and liabilities of monetization SPEs. However, because these SPEs are distinct legal entities:
|
•
|
Assets of the SPEs are not available to satisfy our liabilities or obligations.
|
|
•
|
Liabilities of the SPEs are not our liabilities or obligations.
|
Our
Consolidated Statement of Operations
includes:
|
•
|
Interest expense on SPE notes of:
|
–
$29 million
in
2016
,
–
$29 million
in
2015
and
–
$29 million
in
2014
.
|
•
|
Interest income on SPE investments of:
|
–
$34 million
in
2016
,
–
$34 million
in
2015
and
–
$34 million
in
2014
.
Sales proceeds paid to buyer-sponsored SPEs were invested in restricted financial investments with a balance of
$615 million
as of both
December 31, 2016
, and
December 31, 2015
. The weighted average interest rate was
5.5 percent
during
2016
and
2015
. Maturities of the financial investments at the end of
2016
were:
|
•
|
$253 million
in
2019
and
|
|
•
|
$362 million
in
2020
.
|
The long-term notes of our monetization SPEs were
$511 million
as of both
December 31, 2016
, and
December 31, 2015
. The weighted average interest rate was
5.6 percent
during
2016
and
2015
. Maturities of the notes at the end of
2016
were:
|
•
|
$209 million
in
2019
and
|
|
•
|
$302 million
in
2020
.
|
Financial investments consist of bank guarantees backed by bank notes for three of the SPE transactions. Interest earned from each financial investment is used to pay interest accrued on the corresponding SPE’s note. Any shortfall between interest earned and interest accrued reduces our equity in the monetization SPEs.
Upon dissolution of the SPEs and payment of all obligations of the entities, we would receive any net equity remaining in the monetization SPEs and would be required to report deferred tax gains on our income tax return. In the event that proceeds from the financial investments are insufficient to settle all of the liabilities of the SPEs, we are not obligated to contribute any funds to any of the SPEs. As of
December 31, 2016
, our net equity in the
three
SPEs was approximately
$105 million
and the deferred tax liability was estimated to be approximately
$180 million
.
NOTE 9:
PENSION AND OTHER POSTRETIREMENT BENEFIT PLANS
We sponsor several retirement programs for our employees.
This note provides details about:
|
•
|
defined benefit plans we sponsor, including:
|
|
◦
|
overview of plans,
|
|
◦
|
funded status of plans,
|
|
◦
|
pension assets,
|
|
◦
|
actuarial assumptions and
|
|
◦
|
activity of plans;
|
|
•
|
union-administered multiemployer plans; and
|
|
•
|
defined contribution plans.
|
DEFINED BENEFIT PLANS WE SPONSOR
OVERVIEW OF PLANS
The defined benefit plans we sponsor in the U.S. and Canada differ according to each country’s requirements.
In the U.S., our pension plans are:
|
•
|
qualified — plans that qualify under the Internal Revenue Code; and
|
|
•
|
nonqualified — plans for select employees that provide additional benefits not qualified under the Internal Revenue Code.
|
In Canada, our pension plans are:
|
•
|
registered — plans that are registered under the Income Tax Act and applicable provincial pension acts; and
|
|
•
|
nonregistered — plans for select employees that provide additional benefits that may not be registered under the Income Tax Act or provincial pension acts.
|
Upon our merger with Plum Creek, we assumed one qualified pension plan and two nonqualified pension plans. Refer to "Assumed Plans from Merger with Plum Creek," below, for further information.
We also offer retiree medical and life insurance plans in the U.S. and Canada. These plans are referred to as other postretirement benefit plans in the following disclosures.
WEYERHAEUSER COMPANY >
2016 ANNUAL REPORT AND FORM 10-K
80
Employee Eligibility and Accounting
The Pension and Other Postretirement Benefit Plans section of
Note 1: Summary of Significant Accounting Policies
provides information about employee eligibility for pension plans and postretirement health care and life insurance benefits, as well as how we account for the plans and benefits. See "Effects of Significant Transactions and Events," below, for changes to eligibility in the pension and other postretirement benefit plans.
Measurement Date
We measure the fair value of pension plan assets and pension and other postretirement benefit obligations as of the end of our fiscal year. The fair value of pension plan assets are estimated at the end of the year and are revised in the first half of the following year when the information needed to finalize fair values is received. Additionally, we receive updated census data that is used to refine our estimated benefit obligation.
Assumed Plans from Merger with Plum Creek
Upon our merger with Plum Creek, we assumed one qualified pension plan and two nonqualified pension plans. All active participants in these plans became fully vested and the plans were frozen as of February 19, 2016.
The fair value of these items as of February 19, 2016, were as follows:
|
•
|
$137 million
qualified pension plan assets,
|
|
•
|
$149 million
qualified pension plan projected benefit obligation and
|
|
•
|
$50 million
nonqualified pension plan projected benefit obligation.
|
We also assumed assets of
$47 million
related to the nonqualified plans held in a grantor trust. These assets are subject to the claims of creditors in the event of bankruptcy. As a result, these are not considered plan assets and have not been netted against the nonqualified pension liability. These assets are included in "Other assets" in our
Consolidated Balance Sheet
. Subsequent to the merger date, we redeemed and paid
$38 million
of nonqualified pension benefits payments, which included
$4 million
of the enhanced benefits triggered by change in control provisions. An additional
$4 million
of grantor trust assets were sold during fourth quarter 2016 in anticipation of benefit payments in early 2017. The balance of assets held in the grantor trust was
$5 million
as of December 31, 2016.
During first quarter 2016, we recognized
$5 million
of pension benefit costs from change in control provisions for certain Plum Creek executives. These enhanced pension benefits were triggered by changes in control and retention decisions made after the completion of the merger (see
Note 17: Charges for Integration and Restructuring, Closures and Asset Impairments
).
Effective December 31, 2016, the Plum Creek Pension Plan was merged into the Weyerhaeuser Pension Plan. Similarly, the Plum Creek Supplemental Pension Plan and the Plum Creek Supplemental Benefits Plan were both merged into the Weyerhaeuser Supplemental Retirement Plan.
Amendments of Pension and Other Postretirement Benefit Plans for Salaried Employees
Pension Benefit Plan Amendments
Aside from the December 31, 2016, amendments to merge the Plum Creek plans into the Weyerhaeuser plans as described above, there were no material plan amendments in 2016. There were also no material pension benefit plan amendments in 2015 or 2014.
Postretirement Medical and Life Insurance Benefit Plan Amendments
There were no material postretirement medical or life insurance benefit plan amendments in 2016, 2015 and 2014.
During fourth quarter 2013, the decision was ratified to eliminate company funding of the Post-Medicare Health Reimbursement Account (HRA) for certain salaried retirees after 2014. This change was communicated to affected retirees during January 2014. As a result, we recognized a pretax gain of
$151 million
in 2014 from this plan amendment.
Midyear Remeasurement of Assets and Liabilities
Our pension plans are typically remeasured as of fiscal year-end unless a significant event occurs that requires remeasurement. There were no midyear remeasurements during 2016 or 2015. In 2014 we recorded a midyear remeasurement to capture the impacts of the WRECO Divestiture and our SG&A reduction initiatives. See the "Activity of Plans" section below for additional details about the impact of the 2014 midyear remeasurement.
FUNDED STATUS OF PLANS
The funded status of the plans we sponsor is determined by comparing the projected benefit obligation with the fair value of plan assets at the end of the year. The following table demonstrates how our plans' funded status is reflected on the
Consolidated Balance Sheet
.
|
DOLLAR AMOUNTS IN MILLIONS
|
||||||||||||
|
|
PENSION
|
OTHER
POSTRETIREMENT
BENEFITS
|
||||||||||
|
|
2016
|
|
2015
|
|
2016
|
|
2015
|
|
||||
|
Funded status:
|
||||||||||||
|
Fair value of plan assets
|
$
|
5,351
|
|
$
|
5,491
|
|
$
|
—
|
|
$
|
—
|
|
|
Projected benefit obligations
|
(6,469
|
)
|
(6,211
|
)
|
(225
|
)
|
(240
|
)
|
||||
|
Funded status
|
$
|
(1,118
|
)
|
$
|
(720
|
)
|
$
|
(225
|
)
|
$
|
(240
|
)
|
|
Presentation on our Consolidated Balance Sheet:
|
||||||||||||
|
Noncurrent assets
|
$
|
27
|
|
$
|
70
|
|
$
|
—
|
|
$
|
—
|
|
|
Current liabilities
|
(28
|
)
|
(21
|
)
|
(21
|
)
|
(22
|
)
|
||||
|
Noncurrent liabilities
|
(1,117
|
)
|
(769
|
)
|
(204
|
)
|
(218
|
)
|
||||
|
Funded status
|
$
|
(1,118
|
)
|
$
|
(720
|
)
|
$
|
(225
|
)
|
$
|
(240
|
)
|
WEYERHAEUSER COMPANY >
2016 ANNUAL REPORT AND FORM 10-K
81
Our qualified and registered pension plans and a portion of our nonregistered pension plans are funded. We contribute to these plans according to established funding standards. The nonqualified pension plan, a portion of the nonregistered pension plans, and the other postretirement benefit plans are unfunded. For the unfunded plans, we pay benefits to retirees from our general assets as they come due.
The asset or liability on our
Consolidated Balance Sheet
representing the funded status of the plans is different from the cumulative income or expense that we have recorded related to these plans. These differences are actuarial gains and losses and prior service costs and credits that are deferred and will be amortized into our periodic benefit costs in future periods. These unamortized amounts are recorded in "Cumulative Other Comprehensive Loss", which is a component of total equity on our
Consolidated Balance Sheet
. The Cumulative Other Comprehensive Income (Loss) section of
Note 15: Shareholder's Interest
details changes in the amounts included in cumulative other comprehensive income (loss) by component.
Changes in Fair Value of Plan Assets
|
DOLLAR AMOUNTS IN MILLIONS
|
||||||||||||
|
|
PENSION
|
OTHER
POSTRETIREMENT
BENEFITS
|
||||||||||
|
|
2016
|
|
2015
|
|
2016
|
|
2015
|
|
||||
|
Fair value of plan assets at beginning of year (estimated)
|
$
|
5,491
|
|
$
|
5,643
|
|
$
|
—
|
|
$
|
—
|
|
|
Adjustment for final fair value of plan assets
|
7
|
|
57
|
|
—
|
|
—
|
|
||||
|
Actual return on plan assets
|
27
|
|
226
|
|
—
|
|
—
|
|
||||
|
Foreign currency translation
|
29
|
|
(155
|
)
|
—
|
|
—
|
|
||||
|
Employer contributions and benefit payments
|
78
|
|
60
|
|
21
|
|
23
|
|
||||
|
Plan participants’ contributions
|
—
|
|
—
|
|
7
|
|
9
|
|
||||
|
Plan transfers
|
1
|
|
2
|
|
—
|
|
—
|
|
||||
|
Plan acquisitions
|
137
|
|
—
|
|
—
|
|
—
|
|
||||
|
Benefits paid (includes lump sum settlements)
|
(419
|
)
|
(342
|
)
|
(28
|
)
|
(32
|
)
|
||||
|
Fair value of plan assets at end of year (estimated)
|
$
|
5,351
|
|
$
|
5,491
|
|
$
|
—
|
|
$
|
—
|
|
The values reported for our pension plan assets at year end are estimated using information available at the time. Additional information regarding the year-end values generally becomes available to us during the first half of the following year. To reflect additional information that became available in the first half of 2016, the fair value of plan assets as of
December 31, 2015
was increased by
$7 million
.
See additional details about the changes in the fair value of plan assets in the "Pension Assets" section below.
Changes in Projected Benefit Obligations of Our Pension and Other Postretirement Benefit Plans
|
DOLLAR AMOUNTS IN MILLIONS
|
||||||||||||
|
|
PENSION
|
OTHER
POSTRETIREMENT
BENEFITS
|
||||||||||
|
|
2016
|
|
2015
|
|
2016
|
|
2015
|
|
||||
|
Reconciliation of projected benefit obligation:
|
|
|
|
|
||||||||
|
Projected benefit obligation beginning of year
|
$
|
6,211
|
|
$
|
6,698
|
|
$
|
240
|
|
$
|
303
|
|
|
Service cost
|
48
|
|
57
|
|
—
|
|
—
|
|
||||
|
Interest cost
|
277
|
|
265
|
|
8
|
|
9
|
|
||||
|
Plan participants’ contributions
|
—
|
|
—
|
|
7
|
|
9
|
|
||||
|
Actuarial (gains) losses
|
120
|
|
(309
|
)
|
(5
|
)
|
(34
|
)
|
||||
|
Foreign currency translation
|
27
|
|
(159
|
)
|
3
|
|
(15
|
)
|
||||
|
Benefits paid (includes lump sum settlements)
|
(419
|
)
|
(342
|
)
|
(28
|
)
|
(32
|
)
|
||||
|
Plan amendments and other
|
—
|
|
(1
|
)
|
—
|
|
—
|
|
||||
|
Special/contractual termination benefits
|
—
|
|
—
|
|
—
|
|
—
|
|
||||
|
Plan transfers
|
1
|
|
2
|
|
—
|
|
—
|
|
||||
|
Plan acquisitions
|
199
|
|
—
|
|
—
|
|
—
|
|
||||
|
Change in control enhanced benefits
|
5
|
|
$
|
—
|
|
$
|
—
|
|
$
|
—
|
|
|
|
Projected benefit obligation at end of year
|
$
|
6,469
|
|
$
|
6,211
|
|
$
|
225
|
|
$
|
240
|
|
Changes in actuarial assumptions increased liabilities by
$115 million
as of the end of
2016
. The increase was primarily attributable to decreases in discount rates applied. Discount rates decreased from
4.50 percent
at the end of
2015
to
4.30 percent
at the end of
2016
for the U.S. pension plans, and decreased from
4.00 percent
at the end of
2015
to
3.70 percent
at the end of
2016
for U.S. postretirement. The discount rates decreased from
4.00 percent
at the end of
2015
to
3.70 percent
at the end of
2016
for the Canadian pension plans, and decreased from
3.90 percent
at the end
2015
to
3.60 percent
at the end of
2016
for Canadian postretirement.
During
2016
, we contributed
$16 million
for our Canadian registered plans, we made contributions and benefit payments of
$2 million
for our Canadian nonregistered pension plans and made benefit payments of
$60 million
for our nonqualified pension plans, including
$4 million
of
WEYERHAEUSER COMPANY >
2016 ANNUAL REPORT AND FORM 10-K
82
enhanced pension benefit payments from change in control provisions. There was no minimum required contribution for our U.S. qualified plan for 2016, nor were any contributions made to this plan in 2016.
See additional details about the actuarial assumptions and changes in the projected benefit obligation in the "Actuarial Assumptions" section below.
Accumulated Benefit Obligations Greater Than Plan Assets
As of
December 31, 2016
, pension plans with accumulated benefit obligations greater than plan assets had:
|
•
|
$5.7 billion
in projected benefit obligations,
|
|
•
|
$5.6 billion
in accumulated benefit obligations and
|
|
•
|
assets with a fair value of
$4.5 billion
.
|
As of
December 31, 2015
, pension plans with accumulated benefit obligations greater than plan assets had:
|
•
|
$5.5 billion
in projected benefit obligations,
|
|
•
|
$5.4 billion
in accumulated benefit obligations and
|
|
•
|
assets with a fair value of
$4.7 billion
.
|
The accumulated benefit obligation for all of our defined benefit pension plans was:
|
•
|
$6.4 billion
at
December 31, 2016
; and
|
|
•
|
$6.1 billion
at
December 31, 2015
.
|
PENSION ASSETS
Our Investment Policies and Strategies
Our investment policies and strategies guide and direct how we manage funds for the benefit plans we sponsor. These funds include our:
|
•
|
U.S. Pension Trust — funds our U.S. qualified pension plans;
|
|
•
|
Canadian Pension Trust — funds our Canadian registered pension plans; and
|
|
•
|
Retirement Compensation Arrangements — fund a portion of our Canadian nonregistered pension plans.
|
U.S. and Canadian Pension Trusts
Our U.S. pension trust holds the funds for our U.S. qualified pension plans, while our Canadian pension trust holds the funds for our Canadian registered pension plans.
Our strategy within the trusts is to invest:
|
•
|
directly in a diversified mix of nontraditional investments; and
|
|
•
|
indirectly through derivatives to promote effective use of capital, increase returns and manage associated risk.
|
Consistent with past practice and in accordance with investment guidelines established by the company’s investment committee, the investment managers of the company’s pension plan asset portfolios utilize a diversified set of investment strategies.
Our direct investments include:
|
•
|
cash and short-term investments,
|
|
•
|
common and preferred stocks,
|
|
•
|
hedge funds and related investments and
|
|
•
|
private equity and related investments.
|
Our indirect investments include:
|
•
|
equity and fixed income index derivatives,
|
|
•
|
foreign currency derivatives and
|
|
•
|
total return swaps.
|
The overall return for our pension trusts includes:
|
•
|
returns earned on our direct investments and
|
|
•
|
returns earned on the derivatives we use.
|
Cash and short-term investments generally consist of highly liquid money market and government securities and are primarily held to fund benefit payments, capital calls, margin requirements or to meet regulatory requirements.
Common and preferred stocks are equity instruments that have been purchased directly or resulted from transactions related to private equity investment holdings.
Hedge fund investments generally consist of privately-offered managed pools primarily structured as limited liability entities, with the general members or partners of such limited liability entities serving as portfolio manager and thus being responsible for the fund’s underlying investment decisions. Generally, these funds have varying degrees of liquidity and redemption provisions. Underlying investments within these funds may include long and short public and private equities, corporate, mortgage and sovereign debt, options, swaps, forwards and other derivative positions. These funds may also use varying degrees of leverage.
Private equity investments consist of investments in private equity, mezzanine, distressed, co-investments and other structures. Private equity funds generally participate in buyouts and venture capital of limited liability entities
through unlisted equity and debt instruments. These funds may also employ borrowing at the underlying entity level. Mezzanine and distressed funds generally follow strategies of investing in the debt of public or private companies with additional participation through warrants or other equity type options. Exposure to real property may be initiated through private transactions between principals or public market vehicles such as real estate investment trusts and are generally held in limited liability entities.
WEYERHAEUSER COMPANY >
2016 ANNUAL REPORT AND FORM 10-K
83
Derivative instruments generally are comprised of swaps, futures, forwards or options. Equity and fixed income index derivatives are utilized to achieve target equity and bond asset exposure or to reduce exposure to certain market risks. Foreign currency derivatives are utilized to reduce exposure to certain currency risks. Total return swaps are designed to gain exposure to the return characteristics of specific financial strategies with limited exchange of principal. All derivative instruments are executed in a diversified manner through a number of financial institutions and in accordance with our investment guidelines.
Retirement Compensation Arrangements
Retirement Compensation Arrangements fund a portion of our Canadian nonregistered pension plans.
Under Retirement Compensation Arrangements, our contributions are split:
|
•
|
50 percent to our investments in a portfolio of equities; and
|
|
•
|
50 percent to a noninterest-bearing refundable tax account held by the Canada Revenue Agency — as required by Canadian tax rules.
|
The Canadian tax rules requirement means that — on average, over time — approximately 50 percent of our Canadian nonregistered pension plans’ assets do not earn returns.
Managing Risk
Investments and contracts, in general, are subject to risk, including market price, liquidity, currency, interest rate and credit risks. We have established governance practices to manage certain risks. The following provides an overview of these risks and describes actions we take to mitigate the potential adverse effects of these risks on the performance of our pension plan assets. Generally, we manage these risks through:
|
•
|
selection and diversification of managers and strategies,
|
|
•
|
use of limited-liability vehicles and
|
|
•
|
limiting the percentage of pension trust assets that can be invested in certain categories.
|
Market price risk
is the risk that the future value of a financial instrument will fluctuate as a result of changes in its market price, whether caused by factors specific to the individual investment, its issuer, or any other market factor that may affect its price. We attempt to mitigate market price risk on the company’s pension plan asset portfolios by investing in a diversified set of assets whose returns exhibit low correlation to those of traditional asset classes and each other. In addition, we and our investment advisers monitor the investments on a regular basis to ensure the decision to invest in particular assets continues to be suitable, including performing ongoing qualitative and quantitative assessments and comprehensive investment and operational due diligence. Special attention is paid to organizational changes made by the underlying fund managers and to changes in policy relative to their investment objectives, valuation, hedging strategy, degree of diversification, leverage, alignment of fund principles and investors, risk governance and costs.
Liquidity risk
is the risk that the pension trusts will encounter difficulty in meeting obligations associated with their financial liabilities. Our financial obligations as they relate to the pension plans generally consist of distributions and redemptions payable to pension plan participants, payments to counterparties and fees to service providers. As established, pension plan assets primarily consist of investments in limited liability pools for which there is no active secondary market. As a result, the investments may be illiquid. Further, hedge funds are subject to potential restrictions that may affect the timing of the realization of pending redemptions. Private equity funds, including those private equity funds that invest in real estate assets, are subject to distribution and funding schedules that are set by the private equity funds’ respective managers and market activity, and the period over which the funds are expected to liquidate is uncertain and dependent upon realization of the respective funds' underlying investments which will vary over time. To mitigate liquidity risk on the company’s pension plan asset portfolios, private equity portfolios have been diversified across different vintage years and strategies and hedge fund portfolios have been diversified across investment fund managers, strategies and funds that possess varying liquidity provisions. By doing so, the company seeks to maintain a liquidity profile wherein the potential liquidity offered by the pension plan assets is diversified over time. For instance, under normal operating conditions, the frequency by which investments in hedge funds may be redeemed ranges from daily to every three years with notice periods as few as five days to as much as a year. This liquidity profile, however, can be affected by existing terms that permit redemption restrictions and decisions by underlying fund managers to create illiquid side pockets, adopt a fund liquidation strategy or suspend redemptions altogether. In addition, the investment committee regularly reviews cash flows of the pension trusts and sets appropriate guidelines to address liquidity needs.
Currency risk
arises from holding pension plan assets denominated in a currency other than the currency in which its liabilities are settled. Such risk is managed generally through notional contracts designed to hedge the net exposure to non-functional currencies.
Interest rate risk
is the risk that a change in interest rates will adversely affect the fair value of fixed income securities. The pension trust’s primary exposure to interest rate risk is indirect and through their investments in limited liability pools. Such indirect exposure is managed by the respective fund managers in conjunction with their investment level decisions and predefined investment mandates.
Credit risk
relates to the extent to which failures by counterparties to discharge their obligations could reduce the amount of future cash flows on hand at the balance sheet date. The pension trusts’ exposure to counterparty credit risk is reflected in settlement receivables from derivative contracts within the pension plan assets. In evaluating credit risk, we will often be dependent upon information provided by the counterparty or a rating agency, which may be inaccurate. We decrease exposure to credit risk by only dealing with highly-rated financial counterparties, and as of year-end, our counterparties each had a credit rating of at least A from S&P.
We further manage this risk through:
|
•
|
diversification of counterparties,
|
|
•
|
predefined settlement and margining provisions and
|
|
•
|
documented agreements.
|
We expect that none of our counterparties will fail to meet their obligations. Also, no principal is at risk as a result of these types of investments. Only the amount of unsettled net receivables is at risk.
We are also exposed to credit risk indirectly through counterparty relationships entered into by the underlying managers of investments in limited liability pools. This indirect exposure is mitigated through a due diligence process, which focuses on monitoring each investment fund to ensure the decision to invest in or maintain exposure to a fund continues to be suitable for the pension plans’ asset portfolios.
While we do not target specific direct investment or derivative allocations, we have established guidelines on the percentage of pension trust assets that can be invested in certain categories to provide diversification by investment type fund and investment managers, as well as to manage overall liquidity.
WEYERHAEUSER COMPANY >
2016 ANNUAL REPORT AND FORM 10-K
84
Assets within our qualified and registered pension plans in our U.S. and Canadian pension trusts were invested as follows:
|
DECEMBER 31, 2016
|
|
DECEMBER 31, 2015
|
|
|
|
Cash and short-term investments
|
13.7
|
%
|
13.2
|
%
|
|
Common and preferred stock
|
0.1
|
|
—
|
|
|
Hedge funds and related investments
|
56.6
|
|
54.4
|
|
|
Private equity and related investments
|
22.7
|
|
24.2
|
|
|
Derivative instruments, net
|
7.1
|
|
8.3
|
|
|
Accrued liabilities
|
(0.2
|
)
|
(0.1
|
)
|
|
Total
|
100.0
|
%
|
100.0
|
%
|
Assets within our Canadian nonregistered plans were invested as follows:
|
DECEMBER 31, 2016
|
|
DECEMBER 31, 2015
|
|
|
|
Cash and short-term investments
|
53.4
|
%
|
55.9
|
%
|
|
Common and preferred stock
|
46.6
|
|
44.1
|
|
|
Total
|
100.0
|
%
|
100.0
|
%
|
Valuation of Our Plan Assets
The pension assets are stated at fair value based upon the amount that would be received to sell an asset or paid to transfer a liability in an orderly transaction between market participants at the reporting date. We do not value pension investments based upon a forced or distressed sale scenario. Instead, we consider both observable and unobservable inputs that reflect assumptions applied by market participants when setting the exit price of an asset
or liability in an orderly transaction within the principal market of that asset or liability.
We value the pension plan assets based upon the observability of exit pricing inputs and classify pension plan assets based upon the lowest level input that is significant to the fair value measurement of the pension plan assets in their entirety. The fair value hierarchy we follow is outlined below;
Level 1: Inputs are unadjusted quoted prices for identical assets and liabilities traded in an active market.
Level 2: Inputs are quoted prices in non-active markets for which pricing inputs are observable either directly or indirectly at the reporting date.
Level 3: Inputs are derived from valuation techniques in which one or more significant inputs or value drivers are unobservable.
The pension assets are comprised of cash and short-term investments, derivative investments, common and preferred stock and fund units. The fund units are typically limited liability interests in hedge funds, private equity and related investments. Each of these assets participates in its own unique principal market.
Cash and short-term investments when held directly are valued at cost, which approximates market.
Common and preferred stocks are valued at exit prices quoted in the public markets.
Fund units are valued based upon the net asset values of the funds which we believe represent the per-unit prices at which new investors are permitted to invest and the prices at which existing investors are permitted to exit. To the degree net asset values as of the end of the year have not been received, we use the most recently reported net asset values and adjust for market events and cash flows that have occurred between the interim date and the end of the year to estimate the fair values as of the end of the year.
Derivative instruments held by our pension trusts are not publicly traded and each derivative contract is specifically negotiated with a unique financial counterparty and references either illiquid fund units or a unique number of synthetic units of a publicly reported market index. The derivative contracts are valued based upon valuation statements received from the financial counterparties.
Assets that do not have readily available quoted prices in an active market require a higher degree of judgment to value and have a higher degree of risk that the value that could have been realized upon sale as of the valuation date could be different from the reported value than assets with observable pricing inputs. It is possible that the full extent of market price, liquidity, currency, interest rate, or credit risks may not be fully factored into the fair values of our pension plan assets that use significant unobservable inputs. Approximately
$455 million
, or
8.5 percent
, of our pension plan assets were classified as Level 3 assets as of
December 31, 2016
.
We estimate the fair value of pension plan assets based upon the information available during the year-end reporting process. In some cases, primarily private equity funds, the information available consists of net asset values as of an interim date, cash flows between the interim date and the end of the year, and market events. When the difference is significant, we revise the year-end estimated fair value of pension plan assets to incorporate year-end net asset values received after we have filed our annual report on Form 10-K. We increased the fair value of pension assets in second quarter
2016
by
$7 million
, or less than
1.0 percent
.
WEYERHAEUSER COMPANY >
2016 ANNUAL REPORT AND FORM 10-K
85
The net pension plan assets, when categorized in accordance with this fair value hierarchy, are as follows:
|
DOLLAR AMOUNTS IN MILLIONS
|
||||||||||||
|
2016
|
LEVEL 1
|
|
LEVEL 2
|
|
LEVEL 3
|
|
TOTAL
|
|
||||
|
Pension trust investments:
|
|
|
|
|
|
|||||||
|
Cash and short-term investments
|
$
|
715
|
|
$
|
16
|
|
$
|
—
|
|
$
|
731
|
|
|
Common and preferred stock
|
7
|
|
—
|
|
—
|
|
7
|
|
||||
|
Hedge fund and related investments:
|
||||||||||||
|
Measured within the fair value hierarchy
|
62
|
|
—
|
|
4
|
|
66
|
|
||||
|
Measured at net asset value
(1)
|
2,957
|
|
||||||||||
|
Private equity and related investments:
|
||||||||||||
|
Measured within the fair value hierarchy
|
—
|
|
—
|
|
75
|
|
75
|
|
||||
|
Measured at net asset value
(1)
|
1,138
|
|
||||||||||
|
Derivative instruments:
|
||||||||||||
|
Assets
|
—
|
|
10
|
|
376
|
|
386
|
|
||||
|
Liabilities
|
—
|
|
(8
|
)
|
—
|
|
(8
|
)
|
||||
|
Total pension trust investments
|
784
|
|
18
|
|
455
|
|
5,352
|
|
||||
|
Accrued liabilities, net
|
(11
|
)
|
||||||||||
|
Pension trust net assets
|
5,341
|
|
||||||||||
|
Canadian nonregistered plan assets:
|
||||||||||||
|
Cash and short-term investments
|
5
|
|
—
|
|
—
|
|
5
|
|
||||
|
Common and preferred stock
|
5
|
|
—
|
|
—
|
|
5
|
|
||||
|
Total Canadian nonregistered plan assets
|
10
|
|
—
|
|
—
|
|
10
|
|
||||
|
Total plan assets
|
$
|
5,351
|
|
|||||||||
|
(1) As a result of adopting ASU 2015-07, investments for which fair value is measured using the net asset value per share as a practical expedient are not categorized within the fair value hierarchy. See
Note 1: Summary of Significant Accounting Polices
for additional information.
|
||||||||||||
|
DOLLAR AMOUNTS IN MILLIONS
|
||||||||||||
|
2015
|
LEVEL 1
|
|
LEVEL 2
|
|
LEVEL 3
|
|
TOTAL
|
|
||||
|
Pension trust investments:
|
|
|
|
|
|
|||||||
|
Cash and short-term investments
|
$
|
676
|
|
$
|
46
|
|
$
|
—
|
|
$
|
722
|
|
|
Common and preferred stock
|
—
|
|
—
|
|
—
|
|
—
|
|
||||
|
Hedge fund and related investments:
|
||||||||||||
|
Measured within the fair value hierarchy
|
87
|
|
—
|
|
3
|
|
90
|
|
||||
|
Measured at net asset value
(1)
|
2,893
|
|
||||||||||
|
Private equity and related investments:
|
||||||||||||
|
Measured within the fair value hierarchy
|
—
|
|
—
|
|
52
|
|
52
|
|
||||
|
Measured at net asset value
(1)
|
1,275
|
|
||||||||||
|
Derivative instruments:
|
||||||||||||
|
Assets
|
—
|
|
4
|
|
491
|
|
495
|
|
||||
|
Liabilities
|
—
|
|
(41
|
)
|
—
|
|
(41
|
)
|
||||
|
Total pension trust investments
|
763
|
|
9
|
|
546
|
|
5,486
|
|
||||
|
Accrued liabilities, net
|
(5
|
)
|
||||||||||
|
Pension trust net investments
|
5,481
|
|
||||||||||
|
Canadian nonregistered plan assets:
|
||||||||||||
|
Cash and short-term investments
|
6
|
|
—
|
|
—
|
|
6
|
|
||||
|
Common and preferred stock
|
4
|
|
—
|
|
—
|
|
4
|
|
||||
|
Total Canadian nonregistered plan assets
|
10
|
|
—
|
|
—
|
|
10
|
|
||||
|
Total plan assets
|
$
|
5,491
|
|
|||||||||
|
(1) As a result of adopting ASU 2015-07, investments for which fair value is measured using the net asset value per share as a practical expedient are not categorized within the fair value hierarchy. See
Note 1: Summary of Significant Accounting Polices
for additional information.
|
||||||||||||
WEYERHAEUSER COMPANY >
2016 ANNUAL REPORT AND FORM 10-K
86
This table shows the fair value of the derivative instruments held by our pension trusts at the end of the last two years.
|
DOLLAR AMOUNTS IN MILLIONS
|
||||||
|
|
DECEMBER 31,
2016 |
|
DECEMBER 31,
2015 |
|
||
|
Equity and fixed income index derivatives, net
|
$
|
10
|
|
$
|
3
|
|
|
Foreign currency derivatives, net
|
(5
|
)
|
(37
|
)
|
||
|
Total return swaps, net
|
373
|
|
488
|
|
||
|
Total
|
$
|
378
|
|
$
|
454
|
|
This table shows the aggregate notional amount of the derivative instruments held by our pension trusts at the end of the last two years.
|
DOLLAR AMOUNTS IN MILLIONS
|
||||||
|
|
DECEMBER 31,
2016 |
|
DECEMBER 31,
2015 |
|
||
|
Equity and fixed income index derivatives
|
$
|
405
|
|
$
|
449
|
|
|
Foreign currency derivatives
|
2,811
|
|
1,023
|
|
||
|
Total return swaps
|
1,515
|
|
1,609
|
|
||
|
Total
|
$
|
4,731
|
|
$
|
3,081
|
|
A reconciliation of the beginning and ending balances of the pension plan assets measured at fair value using significant unobservable inputs (Level 3) is presented below:
|
DOLLAR AMOUNTS IN MILLIONS
|
||||||||||||
|
|
INVESTMENTS
|
|||||||||||
|
|
Hedge funds and related investments
|
|
Private equity and related investments
|
|
Derivative instruments, net
|
|
Total
|
|
||||
|
Balance as of December 31, 2014
|
$
|
5
|
|
$
|
65
|
|
$
|
425
|
|
$
|
495
|
|
|
Net realized gains (losses)
|
—
|
|
1
|
|
35
|
|
36
|
|
||||
|
Net change in unrealized gains (losses)
|
(2
|
)
|
(15
|
)
|
67
|
|
50
|
|
||||
|
Purchases
|
—
|
|
4
|
|
—
|
|
4
|
|
||||
|
Sales
|
—
|
|
(3
|
)
|
—
|
|
(3
|
)
|
||||
|
Issuances
|
—
|
|
—
|
|
48
|
|
48
|
|
||||
|
Settlements
|
—
|
|
—
|
|
(84
|
)
|
(84
|
)
|
||||
|
Transfers into Level 3
|
—
|
|
—
|
|
—
|
|
—
|
|
||||
|
Transfers out of Level 3
|
—
|
|
—
|
|
—
|
|
—
|
|
||||
|
Balance as of December 31, 2015
|
3
|
|
52
|
|
491
|
|
546
|
|
||||
|
Net realized gains (losses)
|
(1
|
)
|
(2
|
)
|
134
|
|
131
|
|
||||
|
Net change in unrealized gains (losses)
|
2
|
|
(3
|
)
|
(121
|
)
|
(122
|
)
|
||||
|
Purchases
|
—
|
|
21
|
|
—
|
|
21
|
|
||||
|
Sales
|
—
|
|
(18
|
)
|
—
|
|
(18
|
)
|
||||
|
Issuances
|
—
|
|
—
|
|
39
|
|
39
|
|
||||
|
Settlements
|
—
|
|
—
|
|
(167
|
)
|
(167
|
)
|
||||
|
Transfers into Level 3
|
—
|
|
25
|
|
—
|
|
25
|
|
||||
|
Transfers out of Level 3
|
—
|
|
—
|
|
—
|
|
—
|
|
||||
|
Balance as of December 31, 2016
|
$
|
4
|
|
$
|
75
|
|
$
|
376
|
|
$
|
455
|
|
Transfers in and out of Level 3 are considered to occur at the beginning of the period. Transfers into Level 3 in the hedge fund and private equity classifications relate to investments for which net asset value was used to measure fair value at the end of the prior period, but not at the end of the current period. Transfers out of Level 3 in the hedge fund and private equity classifications were investments for which net asset value was used to measure fair value at the end of the current period, but not at the end of the prior period.
ACTUARIAL ASSUMPTIONS
We use actuarial assumptions to estimate our benefit obligations and our net periodic benefit costs.
Rates We Use in Estimating Our Benefit Obligations
We use assumptions to estimate our benefit obligations that include:
|
•
|
discount rates in the U.S. and Canada, including discount rates used to value lump sum distributions;
|
|
•
|
rates of compensation increases for our salaried and hourly employees in the U.S. and Canada; and
|
|
•
|
estimated percentages of eligible retirees who will elect lump sum payments of benefits.
|
WEYERHAEUSER COMPANY >
2016 ANNUAL REPORT AND FORM 10-K
87
Discount Rates and Rates of Compensation Increase Used in Estimating Our Pension and Other Postretirement Benefit Obligation
|
|
PENSION
|
OTHER POSTRETIREMENT
BENEFITS
|
||
|
|
DECEMBER 31,
2016 |
DECEMBER 31,
2015 |
DECEMBER 31,
2016 |
DECEMBER 31,
2015 |
|
Discount rates:
|
|
|
|
|
|
United States
|
4.30%
|
4.50%
|
3.70%
|
4.00%
|
|
Canada
|
3.70%
|
4.00%
|
3.60%
|
3.90%
|
|
Lump sum distributions
(US salaried and nonqualified plans only)
(1)
|
PPA Table
|
PPA Table
|
N/A
|
N/A
|
|
Rate of compensation increase:
|
|
|
|
|
|
Salaried:
|
|
|
|
|
|
United States
|
13.00% to 2.00% decreasing with participant's age
|
13.00% to 2.00% decreasing with participant's age
|
N/A
|
N/A
|
|
Canada
|
—
|
2.50% for 2015
and 3.50% thereafter |
N/A
|
N/A
|
|
Hourly:
|
|
|
|
|
|
United States
|
13.00% to 2.30% decreasing with participant's age
|
13.00% to 2.30% decreasing with participant's age
|
N/A
|
N/A
|
|
Canada
|
3.25%
|
3.25%
|
N/A
|
N/A
|
|
Election of lump sum or installment distributions (US salaried and nonqualified plans only)
|
60.00%
|
60.00%
|
N/A
|
N/A
|
|
(1) The PPA Phased Table: Interest and mortality assumptions as mandated by Pension Protection Act of 2006 including the phase out of the prior interest rate basis in 2013.
|
||||
Estimating Our Net Periodic Benefit Costs
The assumptions we use to estimate our net periodic benefit costs include:
|
•
|
discount rates in the U.S. and Canada, including discount rates used to value lump sum distributions;
|
|
•
|
expected returns on our plan assets;
|
|
•
|
rates of compensation increases for our salaried and hourly employees in the U.S. and Canada; and
|
|
•
|
estimated percentages of eligible retirees who will elect lump sum payments of benefits.
|
This table shows the discount rates, expected returns on our plan assets and rates of compensation increases we used the last three years to estimate our net periodic benefit costs.
WEYERHAEUSER COMPANY >
2016 ANNUAL REPORT AND FORM 10-K
88
Rates Used to Estimate Our Net Periodic Benefit Costs
|
|
PENSION
|
OTHER
POSTRETIREMENT
BENEFITS
|
||||
|
|
2016
|
2015
|
2014
|
2016
|
2015
|
2014
|
|
Discount rates:
|
|
|
|
|
|
|
|
United States
|
4.50%
|
4.10%
|
4.90% for the first half of 2014 and 4.40% for the second half of 2014
|
4.00%
|
3.60%
|
4.00%
|
|
Salaried – lump sum distributions (U.S. salaried and nonqualified plan only)
(1)
|
PPA Table
|
PPA Table
|
PPA Table
|
N/A
|
N/A
|
N/A
|
|
Canada
|
4.00%
|
3.90%
|
4.70%
|
3.90%
|
3.80%
|
4.60%
|
|
Expected return on plan assets:
|
|
|
|
|
|
|
|
Qualified/registered plans
|
9.00% for all plans except 7.00% for plans assumed from Plum Creek
(2)
|
9.00%
|
9.00%
|
N/A
|
N/A
|
N/A
|
|
Nonregistered plans (Canada only)
|
3.50%
|
3.50%
|
3.50%
|
N/A
|
N/A
|
N/A
|
|
Rate of compensation increase:
|
|
|
|
|
|
|
|
Salaried:
|
|
|
|
|
|
|
|
United States
|
13.00% to 2.00% decreasing with participant's age
|
2.50% for 2015 and 3.50% thereafter
|
2.50% for 2014
and 3.50% thereafter |
N/A
|
N/A
|
N/A
|
|
Canada
|
3.50%
|
2.50% for 2015
and 3.50% thereafter |
2.50% for 2014
and 3.50% thereafter |
N/A
|
N/A
|
N/A
|
|
Hourly:
|
|
|
|
|
|
|
|
United States
|
13.00% to 2.30% decreasing with participant age
|
3.00%
|
3.00%
|
N/A
|
N/A
|
N/A
|
|
Canada
|
3.25%
|
3.25%
|
3.25%
|
N/A
|
N/A
|
N/A
|
|
Election of lump sum distributions (U.S. salaried and nonqualified plans only)
|
60.00%
|
60.00%
|
60.00%
|
N/A
|
N/A
|
N/A
|
|
(1) PPA Phased Table: Interest and mortality assumptions as mandated by Pension Protection Act of 2006 including the phase out of the prior interest rate basis in 2013.
(2) Beginning in 2017 we will use an assumed expected return on plan assets of 8.00% for qualified and registered pension plans.
|
||||||
Expected Return on Plan Assets
We estimate the expected long-term return on assets for our:
|
•
|
qualified and registered pension plans and
|
|
•
|
nonregistered plans.
|
Qualified and Registered Pension Plans.
We have assumed a long-term rate of return on plan assets of
9 percent
for the year ended December 31, 2016. As part of our annual evaluation of key assumptions which includes consideration of actual pension fund performance over multiple years and current and expected valuation levels in the global equity and credit markets, we have determined that we will reduce our assumption of long-term rate of return on plan assets to
8 percent
for estimated 2017 net periodic benefit cost.
Determining our expected return:
|
•
|
requires a high degree of judgment,
|
|
•
|
uses our historical fund returns as a base and
|
|
•
|
places added weight on more recent pension plan asset performance.
|
Over the
32 years
it has been in place, our U.S. pension trust investment strategy has achieved a
13.8 percent
net compound annual return rate. The past 5 years, our net compounded annual return was
8.1 percent
.
Nonregistered plans.
Canadian tax rules require that 50 percent of the assets for nonregistered plans go to a noninterest-bearing refundable tax account. As a result, the return we earn investing the other 50 percent is spread over 100 percent of the assets.
WEYERHAEUSER COMPANY >
2016 ANNUAL REPORT AND FORM 10-K
89
Our expected long-term annual rate of return on the equity portion of this portfolio — the portion we are allowed to invest and manage — is
7 percent
. We base that expected rate of return on:
|
•
|
historical experience and
|
|
•
|
future return expectations.
|
Our expected overall annual return on assets that fund our nonregistered plans is
3.5 percent
.
Actual Returns on Assets Held by Our Pension Trusts
Based on valuations received as of year-end, our total actual return on assets held by our pension trusts was a gain of approximately
$27 million
in
2016
. These trusts fund our qualified, registered and a portion of our nonregistered pension plans.
|
DOLLAR AMOUNTS IN MILLIONS
|
|||||||||
|
|
2016
|
|
2015
|
|
2014
|
|
|||
|
Direct investments
|
$
|
12
|
|
$
|
175
|
|
$
|
258
|
|
|
Derivative instruments
|
15
|
|
51
|
|
110
|
|
|||
|
Total
|
$
|
27
|
|
$
|
226
|
|
$
|
368
|
|
Health Care Costs
Rising costs of health care affect the costs of our other postretirement plans.
Health Care Cost Trend Rates
We use assumptions about health care cost trend rates to estimate the cost of benefits we provide. In
2016
, the assumed weighted health care cost trend rate was:
|
•
|
7.2 percent
for U.S. Pre-Medicare
|
|
•
|
4.5 percent
for U.S. HRA
|
|
•
|
5.0 percent
for Canada
|
This table shows the assumptions we use in estimating the annual cost increase for health care benefits we provide.
Assumptions We Use in Estimating Health Care Benefit Costs
|
|
2016
|
2015
|
||
|
|
U.S.
|
CANADA
|
U.S.
|
CANADA
|
|
Weighted health care cost trend rate assumed for next year
|
8.90% for
Pre-Medicare and 4.50% for HRA |
4.90%
|
7.20% for
Pre-Medicare and 4.50% for HRA |
5.00%
|
|
Rate to which cost trend rate is assumed to decline (ultimate trend rate)
|
4.50%
|
4.30%
|
4.50%
|
4.30%
|
|
Year that the rate reaches the ultimate trend rate
|
2037
|
2028
|
2036
|
2028
|
The assumed health care cost trend rate can significantly influence projected postretirement benefit plan payments. Some of the benefits are defined dollar amounts and are unaffected by changes in health care costs. To determine the health care cost trend rate, we look at historical market experience, current environment and future expectations. The following table demonstrates the effect a one percent change in assumed health care cost trend rates would have with all other assumptions remaining constant.
Effect of a One Percent Change in Health Care Costs
|
AS OF DECEMBER 31, 2016 (DOLLAR AMOUNTS IN MILLIONS)
|
||||||
|
|
1% INCREASE
|
|
1% DECREASE
|
|
||
|
Effect on total service and interest cost components
|
less than $1
|
|
less than $(1)
|
|
||
|
Effect on accumulated postretirement benefit obligation
|
$
|
8
|
|
$
|
(7
|
)
|
WEYERHAEUSER COMPANY >
2016 ANNUAL REPORT AND FORM 10-K
90
ACTIVITY OF PLANS
Net Periodic Benefit Cost (Credit)
|
DOLLAR AMOUNTS IN MILLIONS
|
||||||||||||||||||
|
|
PENSION
|
OTHER POSTRETIREMENT
BENEFITS
|
||||||||||||||||
|
|
2016
|
|
2015
|
|
2014
|
|
2016
|
|
2015
|
|
2014
|
|
||||||
|
Net periodic benefit cost (credit):
|
|
|
|
|
|
|
||||||||||||
|
Service cost
(1)
|
$
|
48
|
|
$
|
57
|
|
$
|
53
|
|
$
|
—
|
|
$
|
—
|
|
$
|
1
|
|
|
Interest cost
|
277
|
|
265
|
|
271
|
|
8
|
|
9
|
|
10
|
|
||||||
|
Expected return on plan assets
|
(495
|
)
|
(476
|
)
|
(467
|
)
|
—
|
|
—
|
|
—
|
|
||||||
|
Amortization of actuarial loss
|
156
|
|
182
|
|
125
|
|
9
|
|
10
|
|
12
|
|
||||||
|
Amortization of prior service cost (credit)
(2)
|
4
|
|
4
|
|
5
|
|
(7
|
)
|
(9
|
)
|
(161
|
)
|
||||||
|
Recognition of curtailments, settlements and special termination benefits due to closures, restructuring or divestitures
(3)
|
—
|
|
—
|
|
9
|
|
—
|
|
—
|
|
—
|
|
||||||
|
Accelerated pension costs for Plum Creek merger-related change-in-control provisions
|
5
|
|
—
|
|
—
|
|
—
|
|
—
|
|
—
|
|
||||||
|
Other
|
—
|
|
—
|
|
—
|
|
—
|
|
—
|
|
(4
|
)
|
||||||
|
Net periodic benefit cost (credit)
|
$
|
(5
|
)
|
$
|
32
|
|
$
|
(4
|
)
|
$
|
10
|
|
$
|
10
|
|
$
|
(142
|
)
|
|
(1) Service cost includes $13 million in 2016, $17 million in 2015, and $11 million in 2014 for employees that were part of our Cellulose Fibers divestitures. Service cost includes $2 million in 2014 for employees that were part of the WRECO Divestiture. These charges are included in our results of discontinued operations. Curtailment and special termination benefits are related to involuntary terminations, due to restructuring activities, as well as the WRECO Divestiture.
(2) During fourth quarter 2013, the decision was ratified to eliminate company funding of the Post-Medicare Health Reimbursement Account (HRA) for certain salaried retirees after 2014. This change was communicated to affected retirees during January 2014. As a result, we recognized a pretax gain of $151 million in 2014 from this plan amendment.
(3) As a result of the WRECO Divestiture as well as our selling, general and administrative cost reduction initiative, we remeasured our U.S. qualified pension plan during third quarter 2014. We recognized a $9 million charge in third quarter 2014 for curtailments and special termination benefits. Of this amount, $6 million is included in the net gain on the WRECO Divestiture and is presented in "Earnings from discontinued operations, net of income taxes" in our
Consolidated Statement of Operations
. The remaining $3 million is included in "Charges for restructuring, closures and impairments" in our
Consolidated Statement of Operations
.
|
||||||||||||||||||
Estimated Amortization from Cumulative Other Comprehensive Loss in
2017
Amortization of the net actuarial loss and prior service cost (credit) of our pension and postretirement benefit plans will affect our other comprehensive income in
2017
. The net effect of the estimated amortization will be an
increase in net periodic benefit costs or a decrease in net periodic benefit credits in
2017
.
|
DOLLAR AMOUNTS IN MILLIONS
|
|||||||||
|
|
PENSION
|
|
OTHER POSTRETIREMENT BENEFITS
|
|
TOTAL
|
|
|||
|
Net actuarial loss
|
$
|
219
|
|
$
|
8
|
|
$
|
227
|
|
|
Prior service cost (credit)
|
4
|
|
(8
|
)
|
(4
|
)
|
|||
|
Net effect cost
|
$
|
223
|
|
$
|
—
|
|
$
|
223
|
|
Expected Pension Funding
Established funding standards govern the funding requirements for our qualified and registered pension plans. We fund the benefit payments of our nonqualified and nonregistered plans as benefit payments come due.
During
2017
, based on estimated year-end asset values and projections of plan liabilities, we expect to:
|
•
|
be required to contribute approximately
$19 million
for our Canadian registered plan;
|
|
•
|
be required to contribute or make benefit payments for our Canadian nonregistered plans of
$3 million
; and
|
|
•
|
make benefit payments of approximately
$26 million
for our U.S. nonqualified pension plans.
|
We do
not
anticipate a contribution being required for our U.S. qualified pension plan for
2017
.
Expected Postretirement Benefit Funding
Our retiree medical and life insurance plans are unfunded. Benefits for these plans are paid from our general assets as they come due. We expect to make benefit payments of
$21 million
for our U.S. and Canadian other postretirement benefit plans in
2017
, including
$7 million
expected to be required to cover benefit payments under collectively bargained contractual obligations.
WEYERHAEUSER COMPANY >
2016 ANNUAL REPORT AND FORM 10-K
91
Estimated Projected Benefit Payments for the Next 10 Years
|
DOLLAR AMOUNTS IN MILLIONS
|
||||||
|
|
PENSION
|
|
OTHER
POSTRETIREMENT
BENEFITS
|
|
||
|
2017
(1)
|
$
|
478
|
|
$
|
21
|
|
|
2018
|
362
|
|
20
|
|
||
|
2019
|
366
|
|
19
|
|
||
|
2020
|
370
|
|
18
|
|
||
|
2021
|
371
|
|
17
|
|
||
|
2022-2026
|
1,873
|
|
75
|
|
||
|
(1) The estimate of projected benefit payments in 2017 assumes that former employees of our divested Cellulose Fibers businesses that participate in sponsored pension plans and are eligible to take a lump sum payment will do so during 2017, using our current assumption.
|
||||||
UNION-ADMINISTERED MULTIEMPLOYER BENEFIT PLANS
We contribute to multiemployer defined benefit plans under the terms of collective-bargaining agreements that cover some of our union-represented employees.
The U.S. plans are established to provide retirement income for eligible employees who meet certain age and service requirements at retirement. The benefits are generally based on:
|
•
|
a percentage of the employer contributions paid into the plan on the eligible employee's behalf or
|
|
•
|
a formula considering an eligible employee's service, the total contributions paid on their behalf plus a benefit based on the value of an eligible employee's account.
|
The Canadian plan is a negotiated cost defined benefit plan. The plan is established to provide retirement income for members based on their number of years of service in the industry, and the benefit rate that applied to that service.
The risks of participating in these multiemployer plans are different from single-employer plans in the following aspects:
|
•
|
Assets contributed to the multiemployer plan by one employer may be used to provide benefits to employees of other participating employers.
|
|
•
|
If a participating employer stops contributing to the plan, the unfunded obligations of the plan may be borne by the remaining participating employers.
|
|
•
|
If we choose to stop participating in some of the multiemployer plans, we may be required to pay those plans an amount based on the underfunded status of the plan, referred to as a withdrawal liability.
|
As of
December 31, 2016
, these plans covered approximately
1,200
of our employees.
Our contributions were:
|
•
|
$4 million
in
2016
,
|
|
•
|
$4 million
in
2015
and
|
|
•
|
$4 million
in
2014
.
|
There have been no significant changes that affect the comparability of the
2016
,
2015
and
2014
contributions. None of our contributions exceeded more than 5 percent of any plan's total contributions during
2016
,
2015
or
2014
.
DEFINED CONTRIBUTION PLANS
We sponsor various defined contribution plans for our U.S. and Canadian salaried and hourly employees. Our contributions to these plans were:
|
•
|
$27 million
in
2016
,
|
|
•
|
$21 million
in
2015
and
|
|
•
|
$20 million
in
2014
.
|
Upon our merger with Plum Creek, we assumed one defined contribution plan, the Plum Creek Thrift and Profit Sharing Plan. Effective July 15, 2016, the assets and liabilities of this plan were merged into the Weyerhaeuser 401(k) Plan.
WEYERHAEUSER COMPANY >
2016 ANNUAL REPORT AND FORM 10-K
92
NOTE 10:
ACCRUED LIABILITIES
Accrued liabilities were comprised of the following:
|
DOLLAR AMOUNTS IN MILLIONS
|
||||||
|
|
DECEMBER 31,
2016 |
|
DECEMBER 31,
2015 |
|
||
|
Wages, salaries and severance pay
|
$
|
178
|
|
$
|
117
|
|
|
Pension and other postretirement benefits
|
49
|
|
44
|
|
||
|
Vacation pay
|
33
|
|
30
|
|
||
|
Taxes – Social Security and real and personal property
|
20
|
|
17
|
|
||
|
Interest
|
120
|
|
102
|
|
||
|
Customer rebates and volume discounts
|
39
|
|
31
|
|
||
|
Deferred income
|
40
|
|
28
|
|
||
|
Accrued income taxes
|
139
|
|
—
|
|
||
|
Other
|
73
|
|
58
|
|
||
|
Total
|
$
|
691
|
|
$
|
427
|
|
NOTE 11:
LINES OF CREDIT
This note provides details about our:
|
•
|
lines of credit and
|
|
•
|
other letters of credit and surety bonds.
|
OUR LINES OF CREDIT
During September 2013, we entered into a
$1 billion
5-year senior unsecured revolving credit facility that expires in
September 2018
. As of June 16, 2014, WRECO terminated its participation as a borrower in the facility. There were no changes to our lines of credit during
2016
. Borrowings are at LIBOR plus a spread or at other interest rates mutually agreed upon between the borrower and the lending banks. As of
December 31, 2016
, there were
no
borrowings outstanding under the facility and we were in compliance with the credit facility covenants.
OTHER LETTERS OF CREDIT AND SURETY BONDS
The amounts of other letters of credit and surety bonds we have entered into as of the end of our last two years are included in the following table:
|
DOLLAR AMOUNTS IN MILLIONS
|
||||||
|
|
DECEMBER 31,
2016 |
|
DECEMBER 31,
2015 |
|
||
|
Letters of credit
|
$
|
38
|
|
$
|
47
|
|
|
Surety bonds
|
$
|
125
|
|
$
|
113
|
|
Our compensating balance requirements for our letters of credit were
$6 million
as of
December 31, 2016
.
NOTE 12:
LONG-TERM DEBT
This note provides details about:
|
•
|
long-term debt assumed in the Plum Creek merger,
|
|
•
|
term loans issued and extinguished,
|
|
•
|
long-term debt and the portion due within one year and
|
|
•
|
long-term debt maturities.
|
Our long-term debt includes notes, debentures and other borrowings.
LONG-TERM DEBT ASSUMED IN THE PLUM CREEK MERGER
Through our merger with Plum Creek, we assumed long-term debt instruments consisting of:
|
•
|
two issuances of publicly traded Senior Notes,
|
|
•
|
an Installment Note (defined and described below) and
|
|
•
|
the Note Payable to Timberland Venture (defined and described below).
|
Concurrent with the merger, we repaid in full the outstanding balances of Plum Creek's Revolving Line of Credit and Term Loan using
$720 million
of cash on hand.
Senior Notes
The assumed Senior Notes are publicly traded and were issued by Plum Creek Timberlands, L.P. (PC Timberlands) and were fully and unconditionally guaranteed by Weyerhaeuser Company as of the acquisition date. During third quarter 2016, PC Timberlands was merged into Weyerhaeuser Company and Weyerhaeuser Company assumed the obligations. There were two separate Senior Notes:
$569 million
(principal) of
4.70 percent
notes which mature in
2021
and
$325 million
(principal) of
3.25 percent
notes which mature in
2023
. The Senior Notes are
WEYERHAEUSER COMPANY >
2016 ANNUAL REPORT AND FORM 10-K
93
redeemable prior to maturity; however, they are subject to a premium on redemption, which is based upon interest rates of U.S. Treasury securities having similar average maturities.
Through acquisition accounting the Senior Notes were recognized at estimated fair values of
$614 million
for the
4.70 percent
notes and
$324 million
for the
3.25 percent
notes as of the acquisition date. The differences between cash interest payments and the amounts recorded as interest expense at the effective market rates will adjust the carrying values of the notes to the principal amounts at maturity.
Installment Note
We assumed an installment note (Installment Note) payable to WestRock Land and Development, LLC (WR LD) that was issued in connection with Plum Creek's acquisition of certain timberland assets. The principal balance of the Installment Note is
$860 million
. Following the issuance, WR LD pledged the installment note to certain banks. The annual interest rate on the Installment Note is fixed at
5.207 percent
. Interest is paid semi-annually with the principal due upon maturity in
December 2023
. The term may be extended at the request of the holder if the company at the time of the request intends to refinance all or a portion of the Installment Note for a term of
five years
or more. The Installment Note is generally not redeemable prior to maturity except in certain limited circumstances and could be subject to a premium on redemption.
We receive patronage refunds under the Installment Note. Patronage refunds are distributions of profits from banks in the farm credit system, which are cooperatives that are required to distribute profits to their members. Patronage distributions, which are made in either cash or stock, are received in the year after they were earned and are recorded as offsets to interest expense.
Through acquisition accounting, the Installment Note was recognized at an estimated fair value of
$893 million
as of the acquisition date. The difference between the cash interest payments and the amount being recorded as interest expense at the effective market rate will reduce the carrying value of the Installment Note to the principal amount at the maturity date.
Note Payable to Timberland Venture
We assumed the Note Payable to Timberland Venture, which has a principal balance of
$783 million
. The annual interest rate on the Note Payable to Timberland Venture is fixed at
7.375 percent
. Interest is paid quarterly with the principal due upon maturity. The note matures on
October 1, 2018
, but may be extended until
October 1, 2020
, at our election. The note is not redeemable prior to maturity.
Through acquisition accounting, the Note Payable to Timberland Venture was recognized at an estimated fair value of
$838 million
as of the acquisition date. The difference between the cash interest payments and the amount being recorded as interest expense at the effective market rate will reduce the carrying value of the note to the principal amount at the maturity date.
On August 31, 2016, the Timberland Venture redeemed TCG Member's interest and Weyerhaeuser obtained full ownership of the Timberland Venture's equity. As a result, we consolidated the Timberland Venture as a wholly-owned subsidiary and the Note Payable to Timberland Venture is therefore eliminated for financial reporting purposes upon consolidation as it is now intercompany indebtedness. The redemption transaction and consolidation is described in
Note 8: Related Parties
.
TERM LOANS ISSUED AND EXTINGUISHED
During
February 2016
, and subsequent to completion of the Plum Creek merger, we entered into a
$600 million
18-month
senior unsecured term loan maturing in
August 2017
. Borrowings were at
LIBOR plus 1.05 percent
. The
$600 million
outstanding under this facility was repaid in full and terminated during fourth quarter 2016.
During
March 2016
, we entered into a
$1.9 billion
18-month
senior unsecured term loan maturing in
September 2017
. Borrowings were at
LIBOR plus 1.05 percent
. The
$1.1 billion
outstanding under this facility was repaid in full and terminated during fourth quarter 2016.
WEYERHAEUSER COMPANY >
2016 ANNUAL REPORT AND FORM 10-K
94
LONG-TERM DEBT AND LONG-TERM DEBT MATURITIES
The following table lists our long-term debt by types and interest rates at the end of our last two years and includes the current portion.
Long-Term Debt by Types and Interest Rates (Includes Current Portion)
|
DOLLAR AMOUNTS IN MILLIONS
|
||||||
|
|
DECEMBER 31,
2016 |
|
DECEMBER 31,
2015 |
|
||
|
6.95% debentures due 2017
|
$
|
281
|
|
$
|
281
|
|
|
7.00% debentures due 2018
|
62
|
|
62
|
|
||
|
7.375% notes due 2019
|
500
|
|
500
|
|
||
|
Variable rate term loan credit facility matures 2020
|
550
|
|
550
|
|
||
|
9.00% debentures due 2021
|
150
|
|
150
|
|
||
|
4.70% debentures due 2021
|
606
|
|
—
|
|
||
|
7.125% debentures due 2023
|
191
|
|
191
|
|
||
|
5.207% debentures due 2023
|
889
|
|
—
|
|
||
|
4.625% notes due 2023
|
500
|
|
500
|
|
||
|
3.25% debentures due 2023
|
324
|
|
—
|
|
||
|
8.50% debentures due 2025
|
300
|
|
300
|
|
||
|
7.95% debentures due 2025
|
136
|
|
136
|
|
||
|
7.70% debentures due 2026
|
150
|
|
150
|
|
||
|
7.35% debentures due 2026
|
62
|
|
62
|
|
||
|
7.85% debentures due 2026
|
100
|
|
100
|
|
||
|
6.95% debentures due 2027
|
300
|
|
300
|
|
||
|
7.375% debentures due 2032
|
1,250
|
|
1,250
|
|
||
|
6.875% debentures due 2033
|
275
|
|
275
|
|
||
|
Other
|
2
|
|
1
|
|
||
|
|
6,628
|
|
4,808
|
|
||
|
Less unamortized discounts
|
(5
|
)
|
(5
|
)
|
||
|
Less unamortized debt expense
|
(13
|
)
|
(16
|
)
|
||
|
Total
|
$
|
6,610
|
|
$
|
4,787
|
|
|
Portion due within one year
|
$
|
281
|
|
$
|
—
|
|
Amounts of Long-Term Debt Due Annually for the Next Five Years and the Total Amount Due After
2021
|
DOLLAR AMOUNTS IN MILLIONS
|
|||
|
|
DECEMBER 31, 2016
|
|
|
|
2017
|
$
|
281
|
|
|
2018
|
$
|
62
|
|
|
2019
|
$
|
500
|
|
|
2020
|
$
|
550
|
|
|
2021
|
$
|
756
|
|
|
Thereafter
|
$
|
4,479
|
|
NOTE 13:
FAIR VALUE OF FINANCIAL INSTRUMENTS
This note provides information about the fair value of our:
|
•
|
debt and
|
|
•
|
other financial instruments.
|
FAIR VALUE OF DEBT
The estimated fair values and carrying values of our long-term debt consisted of the following:
|
DOLLAR AMOUNTS IN MILLIONS
|
||||||||||||
|
|
DECEMBER 31, 2016
|
DECEMBER 31, 2015
|
||||||||||
|
|
CARRYING
VALUE
|
|
FAIR VALUE
(LEVEL 2)
|
|
CARRYING
VALUE
|
|
FAIR VALUE
(LEVEL 2)
|
|
||||
|
Long-term debt (including current maturities):
|
||||||||||||
|
Fixed rate
|
$
|
6,061
|
|
$
|
6,925
|
|
$
|
4,238
|
|
$
|
4,967
|
|
|
Variable rate
|
549
|
|
550
|
|
549
|
|
550
|
|
||||
|
Total Debt
|
$
|
6,610
|
|
$
|
7,475
|
|
$
|
4,787
|
|
$
|
5,517
|
|
WEYERHAEUSER COMPANY >
2016 ANNUAL REPORT AND FORM 10-K
95
To estimate the fair value of long-term debt, we used the following valuation approaches:
|
•
|
market approach — based on quoted market prices we received for the same types and issues of our debt; or
|
|
•
|
income approach — based on the discounted value of the future cash flows using market yields for the same type and comparable issues of debt.
|
We believe that our variable rate long-term debt instruments have net carrying values that approximate their fair values with only insignificant differences.
The inputs to these valuations are based on market data obtained from independent sources or information derived principally from observable market data. The difference between the fair value and the carrying value represents the theoretical net premium or discount we would pay or receive to retire all debt at the measurement date.
FAIR VALUE OF OTHER FINANCIAL INSTRUMENTS
We believe that our other financial instruments, including cash and cash equivalents, short-term investments, mutual fund investments held in grantor trusts, receivables, and payables, have net carrying values that approximate their fair values with only insignificant differences. This is primarily due to the short term nature of these instruments and the allowance for doubtful accounts.
NOTE 14:
LEGAL PROCEEDINGS, COMMITMENTS AND CONTINGENCIES
This note provides details about our:
|
•
|
legal proceedings,
|
|
•
|
environmental matters and
|
|
•
|
commitments and other contingencies.
|
LEGAL PROCEEDINGS
We are party to various legal proceedings arising in the ordinary course of business. We are not currently a party to any legal proceeding that management believes could have a material adverse effect on our long-term consolidated financial position, results of operations or cash flows. See
Note 19: Income Taxes
for a discussion of a tax proceeding involving Plum Creek REIT's 2008 U.S. federal income tax return.
ENVIRONMENTAL MATTERS
Our environmental matters include:
|
•
|
site remediation and
|
|
•
|
asset retirement obligations.
|
Site Remediation
Under the Comprehensive Environmental Response, Compensation and Liability Act — commonly known as the Superfund — and similar state laws, we:
|
•
|
are a party to various proceedings related to the cleanup of hazardous waste sites and
|
|
•
|
have been notified that we may be a potentially responsible party related to the cleanup of other hazardous waste sites for which proceedings have not yet been initiated.
|
We have received notification from the Environmental Protection Agency (the EPA) and have acknowledged that we are a potentially responsible party in a portion of the Kalamazoo River Superfund site in southwest Michigan. Our involvement in the remediation site is based on our former ownership of the Plainwell, Michigan, mill located within the remediation site. In 2015, we received invitations from the EPA to negotiate an administrative order on consent for a contaminant removal action for a portion of the site comprising a stretch of the river approximately 1.7 miles long that the EPA refers to as the Otsego Township Dam Area. Several other companies also operated upstream pulp mills, and two other parties received the same invitations. On April 14, 2016, the EPA issued an administrative order to the company and the other parties, the terms and scope of which are generally consistent with the company’s and the other parties’ discussions with the EPA. The company and the other parties have begun to jointly implement the administrative order. On December 16, 2016, the EPA issued a Unilateral Administrative Order to the company and the other parties requiring response action for Area 1 of Operable Unit 5 of the Kalamazoo River Superfund site. The parties and the EPA are currently in discussion regarding implementation of the order. At this time we do not expect to incur material losses related to the implementation of the administrative orders.
Our established reserves.
We have established reserves for estimated remediation costs on the active Superfund sites and other sites for which we are responsible. These reserves are recorded in "Accrued liabilities" and "Other liabilities" in our
Consolidated Balance Sheet
.
Changes in the Reserve for Environmental Remediation
|
DOLLAR AMOUNTS IN MILLIONS
|
|||
|
Reserve balance as of December 31, 2015
|
$
|
37
|
|
|
Reserve charges and adjustments, net
|
7
|
|
|
|
Payments
|
(10
|
)
|
|
|
Reserve balance as of December 31, 2016
|
$
|
34
|
|
|
Total active sites as of December 31, 2016
|
35
|
|
|
We change our accrual to reflect:
|
•
|
new information on any site concerning implementation of remediation alternatives,
|
|
•
|
updates on prior cost estimates and new sites and
|
|
•
|
costs incurred to remediate sites.
|
WEYERHAEUSER COMPANY >
2016 ANNUAL REPORT AND FORM 10-K
96
Estimates.
We believe it is reasonably possible, based on currently available information and analysis, that remediation costs for all identified sites may exceed our existing reserves by up to
$110 million
.
This estimate, in which those additional costs may be incurred over several years, is the upper end of the range of reasonably possible additional costs. The estimate:
|
•
|
is much less certain than the estimates on which our accruals currently are based and
|
|
•
|
uses assumptions that are less favorable to us among the range of reasonably possible outcomes.
|
In estimating our current accruals and the possible range of additional future costs, we:
|
•
|
assumed we will not bear the entire cost of remediation of every site,
|
|
•
|
took into account the ability of other potentially responsible parties to participate and
|
|
•
|
considered each party
’
s financial condition and probable contribution on a per-site basis.
|
We have not recorded any amounts for potential recoveries from insurance carriers.
Asset Retirement Obligations
We have obligations associated with the retirement of tangible long-lived assets consisting primarily of reforestation obligations related to forest management licenses in Canada and obligations to close and cap landfills. Some of our sites have asbestos containing materials. We have met our current legal obligation to identify and manage these materials. In situations where we cannot reasonably determine when asbestos containing materials might be removed from the sites, we have not recorded an accrual because the fair value of the obligation cannot be reasonably estimated. These obligations are recorded in "Accrued liabilities" and "Other liabilities" in our
Consolidated Balance Sheet
.
Changes in the Reserve for Asset Retirement Obligations
|
DOLLAR AMOUNTS IN MILLIONS
|
|||
|
Reserve balance as of December 31, 2015
(1)
|
$
|
29
|
|
|
Reserve charges and adjustments, net
|
8
|
|
|
|
Payments
|
(10
|
)
|
|
|
Other adjustments
(2)
|
2
|
|
|
|
Reserve balance as of December 31, 2016
|
$
|
29
|
|
|
(1) Reserve balance for continuing operations
(2) Primarily related to a foreign currency remeasurement gain for our Canadian reforestation obligation
|
|||
COMMITMENTS AND OTHER CONTINGENCIES
Our commitments and contingencies include:
|
•
|
guarantees of debt and performance,
|
|
•
|
purchase obligations for goods and services and
|
|
•
|
operating leases.
|
Guarantees
We have guaranteed the performance of the buyer/lessee of a timberlands lease we sold in 2005. Future payments on the lease, which expires in
2023
, are
$14 million
.
Operating Leases
Our rent expense for continuing operations was:
|
DOLLAR AMOUNTS IN MILLIONS
|
|||||||||
|
|
2016
|
|
2015
|
|
2014
|
|
|||
|
Rent expense
|
$
|
37
|
|
$
|
24
|
|
$
|
25
|
|
We have operating leases for:
|
•
|
various equipment, including logging equipment, lift trucks, automobiles and office equipment; and
|
|
•
|
office and wholesale space.
|
Future Commitments on Operating Leases
Our operating lease commitments as of
December 31, 2016
were:
|
DOLLAR AMOUNTS IN MILLIONS
|
|||
|
|
DECEMBER 31, 2016
|
|
|
|
2017
|
$
|
34
|
|
|
2018
|
$
|
32
|
|
|
2019
|
$
|
27
|
|
|
2020
|
$
|
24
|
|
|
2021
|
$
|
21
|
|
|
Thereafter
|
$
|
131
|
|
WEYERHAEUSER COMPANY >
2016 ANNUAL REPORT AND FORM 10-K
97
NOTE 15:
SHAREHOLDERS’ INTEREST
This note provides details about:
|
•
|
preferred and preference shares,
|
|
•
|
common shares,
|
|
•
|
share-repurchase programs and
|
|
•
|
cumulative other comprehensive income (loss).
|
PREFERRED AND PREFERENCE SHARES
We had
no
preferred shares outstanding at the end of
2016
or
2015
. However, we have authorization to issue
7 million
preferred shares with a par value of
$1
per share.
On June 24, 2013, we issued
13.8 million
of our 6.375 percent Mandatory Convertible Preference Shares, Series A, par value
$1.00
and liquidation preference of
$50.00
per share, for net proceeds of
$669 million
, which remained outstanding at
December 31, 2015
. Dividends were payable on a cumulative basis when, as and if declared by our board of directors, at an annual rate of
6.375 percent
on the liquidation preference. We could pay declared dividends in cash or, subject to certain limitations, in common shares or by delivery of any combination of cash and common shares on January 1, April 1, July 1 and October 1 of each year, commencing on October 1, 2013, through and including, July 1, 2016. These shares automatically converted to common shares on July 1, 2016. At any time prior to that date, holders could elect to convert each share into common shares at the minimum conversion rate of
1.5283
common shares, subject to anti-dilution adjustments.
On July 1, 2016, all outstanding 6.375 percent Mandatory Convertible Preference Shares, Series A (Preference Shares) converted into Weyerhaeuser common shares at a rate of
1.6929
Weyerhaeuser common shares per Preference Share. The company issued a total of
23.2 million
Weyerhaeuser common shares in conjunction with the conversion, based on
13.7 million
Preference Shares outstanding as of the conversion date.
In accordance with the terms of the Preference Shares, the number of Weyerhaeuser common shares issuable on conversion was determined based on the average volume weighted average price of
$29.54
for Weyerhaeuser common shares over the 20-trading-day period beginning June 1, 2016, and ending on June 28, 2016.
We may issue preferred or preference shares at one time or through a series of offerings. The shares may have varying rights and preferences that can include:
|
•
|
dividend rights and amounts,
|
|
•
|
redemption rights,
|
|
•
|
conversion terms,
|
|
•
|
sinking-fund provisions,
|
|
•
|
values in liquidation and
|
|
•
|
voting rights.
|
When issued, outstanding preferred and preference shares rank senior to outstanding common shares. That means preferred and preference shares would receive dividends and assets available on liquidation before any payments are made to common shares.
COMMON SHARES
The number of common shares we have outstanding changes when:
|
•
|
new shares are issued,
|
|
•
|
stock options are exercised,
|
|
•
|
restricted stock units or performance share units vest,
|
|
•
|
stock-equivalent units are paid out,
|
|
•
|
shares are tendered,
|
|
•
|
shares are repurchased or
|
|
•
|
shares are canceled.
|
Reconciliation of Our Common Share Activity
|
SHARES IN THOUSANDS
|
||||||
|
|
2016
|
|
2015
|
|
2014
|
|
|
Outstanding at beginning of year
|
510,483
|
|
524,474
|
|
583,548
|
|
|
Issuance from merger with Plum Creek
(Note 4)
|
278,887
|
|
—
|
|
—
|
|
|
New issuance
|
—
|
|
—
|
|
—
|
|
|
Shares tendered
(Note 3)
|
—
|
|
—
|
|
(58,813
|
)
|
|
Stock options exercised
|
2,571
|
|
1,592
|
|
5,134
|
|
|
Issued for restricted stock units
|
840
|
|
365
|
|
451
|
|
|
Issued for performance shares
|
219
|
|
242
|
|
217
|
|
|
Preference shares converted to common
|
23,345
|
|
—
|
|
—
|
|
|
Repurchased
|
(67,817
|
)
|
(16,190
|
)
|
(6,063
|
)
|
|
Outstanding at end of year
|
748,528
|
|
510,483
|
|
524,474
|
|
OUR SHARE REPURCHASE PROGRAMS
On August 13, 2014, our board of directors approved a stock repurchase program under which we were authorized to repurchase up to
$700 million
of outstanding shares (the 2014 Repurchase Program). The 2014 Repurchase Program replaced the prior 2011 stock repurchase
WEYERHAEUSER COMPANY >
2016 ANNUAL REPORT AND FORM 10-K
98
program. During 2014, we repurchased
6,062,993
shares of common stock for
$203 million
under the 2014 Repurchase Program. During 2015 we completed the 2014 Repurchase Program by repurchasing
15,471,962
shares of common stock for
$497 million
.
On August 27, 2015, our board of directors approved a new share repurchase program of up to
$500 million
on outstanding shares (the 2015 Repurchase Program), commencing upon completion of the 2014 Repurchase Program. During 2015, we repurchased
717,464
shares of common stock for
$22 million
under the 2015 Repurchase Program. As of
December 31, 2015
, we had remaining authorization of
$478 million
for future stock repurchases.
In November 2015, our board of directors approved a stock repurchase program under which we were authorized to repurchase up to
$2.5 billion
of outstanding shares subsequent to the closing of our merger with Plum Creek (the 2016 Repurchase Program). This new authorization replaced the August 2015 share repurchase authorization. Transaction fees incurred for repurchases are not counted as use of funds authorized for repurchases under the 2016 Share Repurchase Authorization. During 2016, we repurchased
67,816,810
shares of common stock for
$2 billion
under the 2016 Share Repurchase Authorization. As of
December 31, 2016
, we had remaining authorization of
$500 million
for future stock repurchases. We had
748,528,131
shares of common stock outstanding as of
December 31, 2016
.
All common stock purchases under the
2016
,
2015
, and
2014
Repurchase Programs were made in open-market transactions.
We record share repurchases upon trade date as opposed to the settlement date when cash is disbursed. We record a liability to account for repurchases that have not been cash settled. There were
no
unsettled repurchases as of
December 31, 2016
, or
December 31, 2015
.
CUMULATIVE OTHER COMPREHENSIVE INCOME (LOSS)
Changes in amounts included in our cumulative other comprehensive income (loss) by component are:
|
DOLLAR AMOUNTS IN MILLIONS
|
|||||||||||||||||||||
|
PENSION
|
OTHER POSTRETIREMENT BENEFITS
|
||||||||||||||||||||
|
|
Foreign currency translation adjustments
|
Actuarial losses
|
Prior service costs
|
Actuarial losses
|
Prior service credits
|
Unrealized gains on available-for-sale securities
|
Total
|
||||||||||||||
|
Beginning balance as of January 1, 2015
|
$
|
304
|
|
$
|
(1,623
|
)
|
$
|
(15
|
)
|
$
|
(108
|
)
|
$
|
43
|
|
$
|
6
|
|
$
|
(1,393
|
)
|
|
Other comprehensive income (loss) before reclassifications
|
(97
|
)
|
184
|
|
2
|
|
37
|
|
(2
|
)
|
—
|
|
124
|
|
|||||||
|
Income taxes
|
—
|
|
(52
|
)
|
—
|
|
(12
|
)
|
—
|
|
—
|
|
(64
|
)
|
|||||||
|
Net other comprehensive income (loss) before reclassifications
|
(97
|
)
|
132
|
|
2
|
|
25
|
|
(2
|
)
|
—
|
|
60
|
|
|||||||
|
Amounts reclassified from cumulative other comprehensive income (loss)
(1)
|
—
|
|
182
|
|
4
|
|
10
|
|
(9
|
)
|
—
|
|
187
|
|
|||||||
|
Income taxes
|
—
|
|
(63
|
)
|
(2
|
)
|
(4
|
)
|
3
|
|
—
|
|
(66
|
)
|
|||||||
|
Net amounts reclassified from cumulative other comprehensive income (loss)
|
—
|
|
119
|
|
2
|
|
6
|
|
(6
|
)
|
—
|
|
121
|
|
|||||||
|
Total other comprehensive income (loss)
|
(97
|
)
|
251
|
|
4
|
|
31
|
|
(8
|
)
|
—
|
|
181
|
|
|||||||
|
Beginning balance as of January 1, 2016
|
207
|
|
(1,372
|
)
|
(11
|
)
|
(77
|
)
|
35
|
|
6
|
|
(1,212
|
)
|
|||||||
|
Other comprehensive income (loss) before reclassifications
|
25
|
|
(590
|
)
|
—
|
|
5
|
|
—
|
|
1
|
|
(559
|
)
|
|||||||
|
Income taxes
|
—
|
|
208
|
|
—
|
|
(1
|
)
|
—
|
|
—
|
|
207
|
|
|||||||
|
Net other comprehensive income (loss) before reclassifications
|
25
|
|
(382
|
)
|
—
|
|
4
|
|
—
|
|
1
|
|
(352
|
)
|
|||||||
|
Amounts reclassified from cumulative other comprehensive income (loss)
(1)
|
—
|
|
156
|
|
4
|
|
9
|
|
(7
|
)
|
—
|
|
162
|
|
|||||||
|
Income taxes
|
—
|
|
(53
|
)
|
(2
|
)
|
(3
|
)
|
1
|
|
—
|
|
(57
|
)
|
|||||||
|
Net amounts reclassified from cumulative other comprehensive income (loss)
|
—
|
|
103
|
|
2
|
|
6
|
|
(6
|
)
|
—
|
|
105
|
|
|||||||
|
Total other comprehensive income (loss)
|
25
|
|
(279
|
)
|
2
|
|
10
|
|
(6
|
)
|
1
|
|
(247
|
)
|
|||||||
|
Ending balance as of December 31, 2016
|
$
|
232
|
|
$
|
(1,651
|
)
|
$
|
(9
|
)
|
$
|
(67
|
)
|
$
|
29
|
|
$
|
7
|
|
$
|
(1,459
|
)
|
|
(1) Actuarial losses and prior service credits (costs) are included in the computation of net periodic benefit costs (credits). See
Note: 9 Pension and Other Postretirement Benefit Plans
.
|
|||||||||||||||||||||
NOTE 16:
SHARE-BASED COMPENSATION
Share-based compensation expense was:
|
•
|
$60 million
in
2016
,
|
|
•
|
$31 million
in
2015
and
|
|
•
|
$40 million
in
2014
.
|
WEYERHAEUSER COMPANY >
2016 ANNUAL REPORT AND FORM 10-K
99
The amounts above contain awards to employees of the divested Cellulose Fibers businesses and WRECO and are included in our results of discontinued operations. These amounts are:
|
•
|
$6 million
in
2016
,
|
|
•
|
$6 million
in
2015
and
|
|
•
|
$10 million
in
2014
.
|
This note provides details about:
|
•
|
our Long-Term Incentive Compensation Plan (2013 Plan),
|
|
•
|
share-based compensation resulting from our merger with Plum Creek,
|
|
•
|
how we account for share-based awards,
|
|
•
|
tax benefits of share-based awards,
|
|
•
|
types of share-based compensation and
|
|
•
|
unrecognized share-based compensation.
|
OUR LONG-TERM INCENTIVE COMPENSATION PLAN
Our long-term incentive plans provide for share-based awards that include:
|
•
|
stock options,
|
|
•
|
stock appreciation rights,
|
|
•
|
restricted stock,
|
|
•
|
restricted stock units,
|
|
•
|
performance shares and
|
|
•
|
performance share units.
|
We may issue future grants of up to
21,646,924
shares under the 2013 Plan. We also have the right to reissue forfeited and expired grants.
For stock options and stock appreciation rights:
|
•
|
An individual participant may receive a grant of up to
2 million
shares in any one calendar year.
|
|
•
|
The exercise price is required to be the market price on the date of the grant.
|
For restricted stock, restricted stock units, performance shares, performance share units or other equity grants:
|
•
|
An individual participant may receive a grant of up to
1 million
shares annually.
|
|
•
|
No participant may be granted awards that exceed
$10 million
earned in a 12 month period.
|
The Compensation Committee of our board of directors (the Committee) annually establishes an overall pool of stock awards available for grants based on performance.
For stock-settled awards, we:
|
•
|
issue new stock into the marketplace and
|
|
•
|
generally do not repurchase shares in connection with issuing new awards.
|
Our common shares would increase by approximately
39 million
shares if all share-based awards were exercised or vested. These include:
|
•
|
all options, restricted stock units, and performance share units outstanding at
December 31, 2016
under the 2013 Plan and 2004 Plan; and
|
|
•
|
all remaining options, restricted stock units, and performance share units that could be granted under the 2013 Plan.
|
SHARE-BASED COMPENSATION RESULTING FROM OUR MERGER WITH PLUM CREEK
Replacement awards were granted as a result of the merger with Plum Creek. Eligible outstanding Plum Creek stock options, restricted stock units and deferred stock unit awards were converted into equivalent equity awards with respect to Weyerhaeuser Common Shares, after giving effect to the appropriate adjustments to reflect the consummation of the merger. In total, we issued replacement awards consisting of
1,953,128
stock options and
1,248,006
RSUs. We also assumed
289,910
value management awards (VMAs) through the merger with Plum Creek.
Replacement Stock Option Awards
The replacement stock option awards issued as a result of the merger with Plum Creek have similar exercise provisions as the terms of our current awards. All replacement stock option awards were fully vested prior to the date of the merger, so no expense will be recorded. The value of the replacement stock option awards was
$5 million
, which was included in the equity consideration issued in the merger as described in
Note 4: Merger with Plum Creek
.
Replacement Restricted Stock Unit Awards
The replacement RSUs issued as a result of the merger with Plum Creek have similar vesting provisions as the terms of existing Weyerhaeuser restricted stock unit awards. Expense for replacement RSUs will continue to be recognized over the remaining service period unless a qualifying termination occurs. A qualifying termination of an awardee will result in acceleration of vesting and expense recognition in the period that the qualifying termination occurs. Qualifying terminations during 2016 resulted in accelerated vesting of
705,394
of the replacement RSUs and recognition of
$15 million
of expense. The accelerated expense is included in the merger-related integration costs as described in
Note 17: Charges for Integration and Restructuring, Closures and Asset Impairments
.
Value Management Awards
Following the merger, the VMAs assumed were valued at target. All outstanding VMAs, if earned, will vest December 31, 2017, and will be paid in the first quarter 2018. The VMAs are classified and accounted for as liabilities, as they will be settled in cash upon vesting. The expense recognized over the remaining performance period will equal the cash value of an award as of the last day of the performance period multiplied by the number of awards that are earned. Expense for VMAs will continue to be recognized over the remaining service period unless a qualifying termination occurs. A qualifying termination of an awardee will result in the acceleration of vesting and expense recognition in the period that the qualifying termination occurs. Qualifying terminations during 2016 resulted in
$6 million
of expense recognized. This accelerated expense is
WEYERHAEUSER COMPANY >
2016 ANNUAL REPORT AND FORM 10-K
100
included in merger-related integration costs as described in
Note 17: Charges for Integration and Restructuring, Closures and Asset Impairments
.
HOW WE ACCOUNT FOR SHARE-BASED AWARDS
When accounting for share-based awards we:
|
•
|
use a fair-value-based measurement for share-based awards and
|
|
•
|
recognize the cost of share-based awards in our consolidated financial statements.
|
We recognize the cost of share-based awards in our
Consolidated Statement of Operations
over the required service period — generally the period from the date of the grant to the date when it is vested. Special situations include:
|
•
|
Awards that vest upon retirement — the required service period ends on the date an employee is eligible for retirement, including early retirement.
|
|
•
|
Awards that continue to vest following job elimination or the sale of a business — the required service period ends on the date the employment from the company is terminated.
|
In these special situations, compensation expense from share-based awards is recognized over a period that is shorter than the stated vesting period.
TAX BENEFITS OF SHARE-BASED AWARDS
Our total income tax benefit from share-based awards — as recognized in our
Consolidated Statement of Operations
— for the last three years was:
|
•
|
$12 million
in
2016
,
|
|
•
|
$8 million
in
2015
and
|
|
•
|
$11 million
in
2014
.
|
The amounts above contain income tax benefit from share-based awards to employees that were part of the Cellulose Fibers divestitures and WRECO Divestiture and are included in our results of discontinued operations. These amounts are:
|
•
|
$2 million
in
2016
,
|
|
•
|
$2 million
in
2015
and
|
|
•
|
$4 million
in
2014
.
|
Tax benefits from share-based awards are accrued as stock compensation expense is recognized in the
Consolidated Statement of Operations
. Tax benefits from share-based awards are realized when:
|
•
|
restricted shares and restricted share units vest,
|
|
•
|
performance shares and performance share units vest,
|
|
•
|
stock options are exercised and
|
|
•
|
stock appreciation rights are exercised.
|
TYPES OF SHARE-BASED COMPENSATION
Our share-based compensation is in the form of:
|
•
|
stock options,
|
|
•
|
restricted stock units,
|
|
•
|
performance share units,
|
|
•
|
stock appreciation rights,
|
|
•
|
deferred compensation stock equivalent units and
|
|
•
|
value management awards assumed in merger with Plum Creek.
|
STOCK OPTIONS
Stock options entitle award recipients to purchase shares of our common stock at a fixed exercise price. We grant stock options with an exercise price equal to the market price of our stock on the date of the grant.
The Details
Our stock options generally:
|
•
|
vest over four years of continuous service and
|
|
•
|
must be exercised within 10 years of the grant-date.
|
The vesting and post-termination vesting terms for stock options granted in
2016
,
2015
and
2014
were as follows:
|
•
|
vest ratably over
four
years;
|
|
•
|
vest or continue to vest in the event of death while employed or disability;
|
|
•
|
continue to vest upon retirement at an age of at least 62, but a portion of the grant is forfeited if retirement occurs before the one year anniversary of the grant;
|
|
•
|
continue to vest for one year in the event of involuntary termination when the retirement criteria has not been met; and
|
|
•
|
stop vesting for all other situations including early retirement prior to age 62.
|
Our Accounting
We use a Black-Scholes option valuation model to estimate the fair value of every stock option award on its grant-date.
In our estimates, we use:
|
•
|
historical data — for option exercise time and employee terminations;
|
|
•
|
a Monte-Carlo simulation — for how long we expect granted options to be outstanding; and
|
WEYERHAEUSER COMPANY >
2016 ANNUAL REPORT AND FORM 10-K
101
|
•
|
the U.S. Treasury yield curve — for the risk-free rate. We use a yield curve over a period matching the expected term of the grant.
|
The expected volatility in our valuation model is based on:
|
•
|
implied volatilities from traded options on our stock,
|
|
•
|
historical volatility of our stock and
|
|
•
|
other factors.
|
Weighted Average Assumptions Used in Estimating Value of Stock Options Granted
|
|
2016
GRANTS |
|
2015
GRANTS |
|
2014
GRANTS |
|
|||
|
Expected volatility
|
25.43
|
%
|
25.92
|
%
|
31.71
|
%
|
|||
|
Expected dividends
|
5.37
|
%
|
3.28
|
%
|
2.92
|
%
|
|||
|
Expected term (in years)
|
4.95
|
|
4.77
|
|
4.97
|
|
|||
|
Risk-free rate
|
1.28
|
%
|
1.54
|
%
|
1.57
|
%
|
|||
|
Weighted average grant-date fair value
|
$
|
2.73
|
|
$
|
5.85
|
|
$
|
6.62
|
|
Share-based compensation expense for stock options is generally recognized over the vesting period. There are exceptions for stock options awarded to employees who:
|
•
|
are eligible for retirement,
|
|
•
|
will become eligible for retirement during the vesting period or
|
|
•
|
whose employment is terminated during the vesting period due to job elimination or the sale of a business.
|
In these cases, we record the share-based compensation expense over a required service period that is less than the stated vesting period.
Activity
The following table shows our option unit activity for
2016
.
|
OPTIONS
(IN
THOUSANDS)
|
WEIGHTED
AVERAGE
EXERCISE
PRICE
|
|
WEIGHTED
AVERAGE
REMAINING
CONTRACTUAL
TERM
(IN YEARS)
|
AGGREGATE
INTRINSIC
VALUE (IN
MILLIONS)
|
|
|||
|
Outstanding at December 31, 2015
|
12,763
|
$
|
25.88
|
|
||||
|
Granted
(1)
|
6,122
|
$
|
23.47
|
|
|
|
||
|
Exercised
|
(2,570)
|
$
|
25.01
|
|
|
|
||
|
Forfeited or expired
|
(1,603)
|
$
|
25.98
|
|
|
|
||
|
Outstanding at December 31, 2016
(2)
|
14,712
|
$
|
24.96
|
|
5.47
|
$
|
528
|
|
|
Exercisable at December 31, 2016
|
9,152
|
$
|
23.63
|
|
3.65
|
$
|
338
|
|
|
(1) Includes 1,953 thousand stock option replacement awards issued as a result of the merger with Plum Creek.
(2) As of December 31, 2016, there were approximately 1,624 thousand stock options that had met the requisite service period and will be released as identified in the grant terms.
|
||||||||
The total intrinsic value of stock options exercised was:
|
•
|
$18 million
in
2016
,
|
|
•
|
$13 million
in
2015
and
|
|
•
|
$55 million
in
2014
.
|
The total grant-date fair value of stock options vested was:
|
•
|
$14 million
in
2016
,
|
|
•
|
$14 million
in
2015
and
|
|
•
|
$16 million
in
2014
.
|
RESTRICTED STOCK UNITS
Through the Plan, we award restricted stock units — grants that entitle the holder to shares of our stock as the award vests.
The Details
Our restricted stock units granted in
2016
,
2015
and
2014
generally:
|
•
|
vest ratably over
four
years;
|
|
•
|
immediately vest in the event of death while employed or disability;
|
|
•
|
continue to vest upon retirement at an age of at least 62, but a portion of the grant is forfeited if retirement occurs before the one year anniversary of the grant;
|
|
•
|
continue vesting for one year in the event of involuntary termination when the retirement has not been met; and
|
|
•
|
will be forfeited upon termination of employment in all other situations including early retirement prior to age 62.
|
Our Accounting
The fair value of our restricted stock units is the market price of our stock on the grant-date of the awards.
WEYERHAEUSER COMPANY >
2016 ANNUAL REPORT AND FORM 10-K
102
We generally record share-based compensation expense for restricted stock units over the four-year vesting period. Generally for restricted stock units that continue to vest following the termination of employment, we record the share-based compensation expense over a required service period that is less than the stated vesting period.
Activity
The following table shows our restricted stock unit activity for
2016
.
|
STOCK UNITS
(IN THOUSANDS)
|
WEIGHTED
AVERAGE
GRANT-DATE
FAIR VALUE
|
|
||
|
Nonvested at December 31, 2015
|
1,104
|
$
|
31.37
|
|
|
Granted
(1)
|
1,925
|
$
|
30.25
|
|
|
Vested
|
(1,202)
|
$
|
32.94
|
|
|
Forfeited
|
(244)
|
$
|
27.04
|
|
|
Nonvested at December 31, 2016
(2)
|
1,583
|
$
|
26.49
|
|
|
(1) Includes 1,248 thousand restricted stock unit replacement awards issued as a result of the merger with Plum Creek.
(2) As of December 31, 2016, there were approximately 385 thousand restricted stock units that had met the requisite service period and will be released as identified in the grant terms.
|
||||
The weighted average grant-date fair value for restricted stock units was:
|
•
|
$30.25
in
2016
,
|
|
•
|
$35.41
in
2015
and
|
|
•
|
$30.14
in
2014
.
|
The total grant-date fair value of restricted stock units vested was:
|
•
|
$36 million
in
2016
,
|
|
•
|
$14 million
in
2015
and
|
|
•
|
$16 million
in
2014
.
|
Nonvested restricted stock units accrue dividends that are paid out when restricted stock units vest. Any restricted stock units forfeited will not receive dividends.
As restricted stock units vest, a portion of the shares awarded is withheld to cover employee taxes. As a result, the number of stock units vested and the number of common shares issued will differ.
PERFORMANCE SHARE UNITS
Through the Plan, we award performance share units — grants that entitle the holder to shares of our stock as the award vests.
The Details
The final number of shares awarded will range from
0 percent
to
150 percent
of each grant’s target, depending upon actual company performance.
For shares granted in
2016
, the ultimate number of performance share units earned is based on three measures:
|
•
|
our relative total shareholder return (TSR) ranking measured against the S&P 500 over a three year period,
|
|
•
|
our relative TSR ranking measured against an industry peer group of companies over a three year period and
|
|
•
|
achievement of Plum Creek merger cost synergy targets.
|
For shares granted in 2015, the ultimate number of performance share units earned is based on two measures:
|
•
|
our relative total shareholder return (TSR) ranking measured against the S&P 500 over a three year period and
|
|
•
|
our relative TSR ranking measured against an industry peer group of companies over a three year period.
|
The vesting provisions for performance share units granted in
2016
and 2015 were as follows:
|
•
|
vest 100 percent on the third anniversary of the grant date as long as the individual remains employed by the company;
|
|
•
|
fully vest in the event the participant dies or becomes disabled while employed;
|
|
•
|
continue to vest upon retirement at an age of at least 62, but a portion of the grant is forfeited if retirement occurs before the one year anniversary of the grant;
|
|
•
|
continue vesting for one year in the event of involuntary termination when the retirement criteria has not been met and the employee has met the second anniversary of the grant date; and
|
|
•
|
will be forfeited upon termination of employment in all other situations including early retirement prior to age 62.
|
For shares granted in 2014, the ultimate number of performance share units earned is based on two measures:
|
•
|
Weyerhaeuser’s cash flow during the first year determined the initial number of units earned.
|
|
•
|
Weyerhaeuser’s relative total shareholder return (TSR) ranking in the S&P 500 during the first two years is used to adjust the initial number of units earned up or down by
20 percent
.
|
WEYERHAEUSER COMPANY >
2016 ANNUAL REPORT AND FORM 10-K
103
For shares granted in 2014, at the end of the two-year performance period and over a further two-year vesting period, performance share units would be paid in shares of our stock. Performance share units granted and that are earned vest as follows:
|
•
|
vest 50 percent, 25 percent and 25 percent on the second, third and fourth anniversaries of the grant-date, respectively, as long as the individual remains employed by the company;
|
|
•
|
fully vest in the event the participant dies or becomes disabled while employed;
|
|
•
|
continue to vest upon retirement at an age of at least 62, but a portion of the grant is forfeited if retirement occurs before the one year anniversary of the grant;
|
|
•
|
continue vesting for one year in the event of involuntary termination when the retirement has not been met; and
|
|
•
|
will be forfeited upon termination of employment in all other situations including early retirement prior to age 62.
|
Our Accounting
Since the awards contain a market condition, the effect of the market condition is reflected in the grant-date fair value which is estimated using a Monte Carlo simulation model. This model estimates the TSR ranking of the company over the performance period. Compensation expense is based on the estimated probable number of earned awards and recognized over the vesting period on an accelerated basis. Generally, compensation expense would be reversed if the performance condition is not met unless the requisite service period has been achieved.
Weighted Average Assumptions Used in Estimating the Value of Performance Share Units
|
|
2016
GRANTS |
|
2015
GRANTS |
|
2014
GRANTS |
|
|||
|
Performance period
|
1/1/2016 – 12/31/2018
|
|
1/1/2015 – 12/31/2017
|
|
1/1/2014 – 12/31/2015
|
|
|||
|
Expected dividends
|
3.92% - 5.37%
|
|
3.26
|
%
|
2.91
|
%
|
|||
|
Risk-free rate
|
0.45% - 0.97%
|
|
0.05% - 1.07%
|
|
0.03% - 0.79%
|
|
|||
|
Volatility
|
21.87% - 28.09%
|
|
16.33% - 20.89%
|
|
20.74% - 23.53%
|
|
|||
|
Weighted average grant-date fair value
|
$
|
22.58
|
|
$
|
34.75
|
|
$
|
30.62
|
|
Activity
The following table shows our performance share unit activity for
2016
.
|
GRANTS (IN
THOUSANDS)
|
|
WEIGHTED
AVERAGE
GRANT-DATE
FAIR VALUE
|
|
||
|
Nonvested at December 31, 2015
|
680
|
|
$
|
31.42
|
|
|
Granted at target
|
493
|
|
$
|
22.58
|
|
|
Vested
|
(261
|
)
|
$
|
21.26
|
|
|
Forfeited
|
(151
|
)
|
$
|
25.72
|
|
|
Nonvested at December 31, 2016
(1)
|
761
|
|
$
|
25.23
|
|
|
(1) As of December 31, 2016, there were approximately 89 thousand performance share units that had met the requisite service period and will be released as identified in the grant terms.
|
|||||
The total grant-date fair value of performance share units vested was:
|
•
|
$8 million
in
2016
,
|
|
•
|
$9 million
in
2015
and
|
|
•
|
$7 million
in
2014
.
|
For 2014 grants, the company exceeded the cash flow target, resulting in an initial number of shares earned equal to
114 percent
of target. Because the company's two-year TSR ranking was between the 25
th
and 50
th
percentile, the initial number of performance shares granted decreased
11 percent
.
As performance share units vest, a portion of the shares awarded is withheld to cover participant taxes. As a result, the number of stock units vested and the number of common shares issued will differ.
STOCK APPRECIATION RIGHTS
Through the Plan, we grant cash-settled stock appreciation rights as part of certain compensation awards.
The Details
Stock appreciation rights are similar to stock options. Employees benefit when the market price of our stock is higher on the exercise date than it was on the date the stock appreciation rights were granted. The differences are that the employee:
|
•
|
receives the benefit as a cash award and
|
|
•
|
does not purchase the underlying stock.
|
The vesting conditions and exceptions are the same as for 10-year stock options. Details are in the Stock Options section earlier in this note.
Stock appreciation rights are generally issued to employees outside of the U.S.
WEYERHAEUSER COMPANY >
2016 ANNUAL REPORT AND FORM 10-K
104
Our Accounting
We use a Black-Scholes option-valuation model to estimate the fair value of a stock appreciation right on its grant
-
date and every subsequent reporting date that the right is outstanding. Stock appreciation rights are liability-classified awards and the fair value is remeasured at every reporting date.
The process used to develop our valuation assumptions is the same as for the 10-year stock options we grant. Details are in the Stock Options section earlier in this note.
Weighted Average Assumptions Used to Re-measure Value of Stock Appreciation Rights at Year-End
|
|
2016
GRANTS |
|
2015
GRANTS |
|
2014
GRANTS |
|
|||
|
Expected volatility
|
24.12
|
%
|
22.10
|
%
|
18.20
|
%
|
|||
|
Expected dividends
|
4.04
|
%
|
4.20
|
%
|
3.21
|
%
|
|||
|
Expected term (in years)
|
2.20
|
|
1.94
|
|
1.32
|
|
|||
|
Risk-free rate
|
1.36
|
%
|
0.99
|
%
|
0.45
|
%
|
|||
|
Weighted average fair value
|
$
|
7.84
|
|
$
|
6.96
|
|
$
|
12.70
|
|
Activity
The following table shows our stock appreciation rights activity for
2016
.
|
RIGHTS
(IN
THOUSANDS)
|
|
WEIGHTED
AVERAGE
EXERCISE
PRICE
|
|
AVERAGE
REMAINING
CONTRACTUAL
TERM
(IN YEARS)
|
AGGREGATE
INTRINSIC
VALUE (IN
MILLIONS)
|
|
|||
|
Outstanding at December 31, 2015
|
382
|
|
$
|
24.25
|
|
||||
|
Granted
|
107
|
|
$
|
23.09
|
|
|
|
||
|
Exercised
|
(66
|
)
|
$
|
23.42
|
|
|
|
||
|
Forfeited or expired
|
(37
|
)
|
$
|
26.90
|
|
|
|
||
|
Outstanding at December 31, 2016
|
386
|
|
$
|
23.82
|
|
5.24
|
$
|
3
|
|
|
Exercisable at December 31, 2016
|
233
|
|
$
|
21.85
|
|
3.03
|
$
|
2
|
|
The total liabilities paid for stock appreciation rights was:
|
•
|
$1 million
in
2016
,
|
|
•
|
$1 million
in
2015
and
|
|
•
|
$2 million
in
2014
.
|
UNRECOGNIZED SHARE-BASED COMPENSATION
As of
December 31, 2016
, our unrecognized share-based compensation cost for all types of share-based awards included
$41 million
related to non-vested equity-classified share-based compensation arrangements — expected to be recognized over a weighted average period of approximately
2.3 years
.
DEFERRED COMPENSATION STOCK EQUIVALENT UNITS
Certain employees and our board of directors may defer compensation into stock-equivalent units.
The Details
The plan works differently for employees and directors.
Eligible employees:
|
•
|
may choose to defer all or part of their bonus into stock-equivalent units;
|
|
•
|
may choose to defer part of their salary, except for executive officers; and
|
|
•
|
receive a 15 percent premium if the deferral is for at least five years.
|
Our directors:
|
•
|
receive a portion of their annual retainer fee in the form of restricted stock units, which vest over one year and may be deferred into stock-equivalent units;
|
|
•
|
may choose to defer some or all of the remainder of their annual retainer fee into stock-equivalent units; and
|
|
•
|
do not receive a premium for their deferrals.
|
Employees and directors also choose when the deferrals will be paid out although no deferrals may be paid until after the separation from service of the employee or director.
Our Accounting
We settle all deferred compensation accounts in cash for our employees. Our directors receive shares of common stock as payment for stock-equivalent units. In addition, we credit all stock-equivalent accounts with dividend equivalents. The number of common shares to be issued in the future to directors is
665,774
.
WEYERHAEUSER COMPANY >
2016 ANNUAL REPORT AND FORM 10-K
105
Stock-equivalent units are:
|
•
|
liability-classified awards and
|
|
•
|
re-measured to fair value at every reporting date.
|
The fair value of a stock-equivalent unit is equal to the market price of our stock.
Activity
The number of stock-equivalent units outstanding in our deferred compensation accounts was:
|
•
|
1,004,448
as of
December 31, 2016
,
|
|
•
|
1,003,053
as of
December 31, 2015
and
|
|
•
|
944,966
as of
December 31, 2014
.
|
NOTE 17:
CHARGES FOR INTEGRATION AND RESTRUCTURING, CLOSURES AND ASSET IMPAIRMENTS
Items Included in Our Charges for Integration and Restructuring, Closures, and Asset Impairments
|
DOLLAR AMOUNTS IN MILLIONS
|
|||||||||
|
|
2016
|
|
2015
|
|
2014
|
|
|||
|
Integration and restructuring charges related to our merger with Plum Creek
(1)
:
|
|
|
|
|
|
|
|||
|
Termination benefits
|
$
|
54
|
|
$
|
—
|
|
$
|
—
|
|
|
Acceleration of share-based compensation related to qualifying terminations
(Note 16)
|
21
|
|
—
|
|
—
|
|
|||
|
Acceleration of pension benefits related to qualifying terminations
(Note 9)
|
5
|
|
—
|
|
—
|
|
|||
|
Professional services
|
52
|
|
14
|
|
—
|
|
|||
|
Other integration and restructuring costs
|
14
|
|
—
|
|
—
|
|
|||
|
Total integration and restructuring charges related to our merger with Plum Creek
|
146
|
|
14
|
|
—
|
|
|||
|
Charges related to closures and other restructuring activities:
|
|||||||||
|
Termination benefits
|
4
|
|
4
|
|
27
|
|
|||
|
Pension and postretirement charges
|
—
|
|
—
|
|
3
|
|
|||
|
Other closures and restructuring costs
|
4
|
|
6
|
|
12
|
|
|||
|
Total charges related to closures and other restructuring activities
|
8
|
|
10
|
|
42
|
|
|||
|
Impairment of long-lived assets
|
16
|
|
15
|
|
2
|
|
|||
|
Total charges for integration and restructuring, closures and asset impairments
|
$
|
170
|
|
$
|
39
|
|
$
|
44
|
|
|
(1) 2015 integration and restructuring charges related to our merger with Plum Creek were classified within "Other operating costs (income), net" in the
Consolidated Statement of Operations
. We reclassified these costs to "Charges for integration and restructuring, closures and asset impairments" to align with current period classification.
|
|||||||||
INTEGRATION, RESTRUCTURING AND CLOSURES
During 2016, we incurred and accrued for termination benefits (primarily severance), accelerated share-based payment costs, and accelerated pension benefits based upon actual and expected qualifying terminations of certain employees as a result of restructuring decisions made subsequent to the merger. We also incurred non-recurring professional services costs for investment banking, legal and consulting, and certain other fees directly attributable to our merger with Plum Creek.
During 2015, we incurred non-recurring professional services costs for banking, legal and consulting fees directly attributable to our merger with Plum Creek. We also incurred restructuring and closure charges related to the closure of four distribution centers for our Wood Products business.
During 2014, our restructuring and closure charges were primarily related to our selling, general and administrative cost reduction initiative to support achieving our competitive performance goals.
Other restructuring and closure costs include lease termination charges, dismantling and demolition of plant and equipment, gain or loss on disposition of assets, environmental cleanup costs and incremental costs to wind down operating facilities.
ACCRUED TERMINATION BENEFITS
Changes in accrued severance related to restructuring during
2016
were as follows:
|
DOLLAR AMOUNTS IN MILLIONS
|
|||
|
Accrued severance as of December 31, 2015
|
$
|
5
|
|
|
Charges
|
58
|
|
|
|
Payments
|
(37
|
)
|
|
|
Accrued severance as of December 31, 2016
|
$
|
26
|
|
In addition to the amounts shown above, there were severance charges and payments of
$8 million
related to the Cellulose Fibers divestitures during 2016.
ASSET IMPAIRMENTS
The Impairment of Long-Lived Assets and Goodwill sections of
Note 1: Summary of Significant Accounting Policies
provide details about how we account for these impairments. Additional information can also be found in our
Critical Accounting Policies
.
WEYERHAEUSER COMPANY >
2016 ANNUAL REPORT AND FORM 10-K
106
Long-Lived Assets
Our long-lived asset impairments were primarily related to the following:
|
•
|
2016 — We reviewed all of our development projects during 2016. As a result, we ceased development and initiated plans to sell certain projects. We plan to continue to develop or hold for future development our other projects and did not identify any indicators of impairment for these projects. We analyzed each of the projects we ceased development and initiated plans to sell and determined which had a book value greater than fair value. We recognized a
$15 million
impairment charge in Real Estate & ENR which represents the fair value less direct selling costs of these projects. The fair values of the projects were determined using significant unobservable inputs (Level 3) based on broker opinion of value reports.
|
Our remaining projects did not have any indicators of impairment; however, we corroborated this evaluation with an assessment of the undiscounted cash flows for the legacy Weyerhaeuser projects or noted that projects acquired from Plum Creek were recorded at estimated fair value when acquired in 2016.
|
•
|
2015 — We recognized an impairment charge of
$13 million
related to a nonstrategic asset held in Unallocated Items. The fair value of the asset was determined using significant unobservable inputs (Level 3) based on a discounted cash flow model. The asset was subsequently sold for no gain during 2015.
|
NOTE 18:
OTHER OPERATING COSTS (INCOME), NET
Other operating costs (income), net:
|
•
|
includes both recurring and occasional income and expense items and
|
|
•
|
can fluctuate from year to year.
|
Various Income and Expense Items Included in Other Operating Costs (Income), Net
|
DOLLAR AMOUNTS IN MILLIONS
|
|||||||||
|
|
2016
|
|
2015
|
|
2014
|
|
|||
|
Gain on disposition of nonstrategic assets
|
$
|
(60
|
)
|
$
|
(12
|
)
|
$
|
(27
|
)
|
|
Foreign exchange losses (gains), net
|
(6
|
)
|
47
|
|
28
|
|
|||
|
Litigation expense, net
|
24
|
|
23
|
|
9
|
|
|||
|
Gain on postretirement plan amendment
(Note 9)
|
—
|
|
—
|
|
(151
|
)
|
|||
|
Other, net
|
1
|
|
(6
|
)
|
(7
|
)
|
|||
|
Total other operating costs (income), net
|
$
|
(41
|
)
|
$
|
52
|
|
$
|
(148
|
)
|
Gain on disposition of nonstrategic assets in 2016 included a
$36 million
pretax gain recognized in first quarter 2016 on the sale of our Federal Way, Washington headquarters campus.
Gain on disposition of nonstrategic assets in 2014 included a
$22 million
pretax gain on the sale of a landfill in Washington State.
Foreign exchange gains and losses result from changes in exchange rates primarily related to our U.S. dollar denominated debt that is held by our Canadian subsidiary.
NOTE 19:
INCOME TAXES
This note provides details about our income taxes applicable to continuing operations:
|
•
|
earnings before income taxes,
|
|
•
|
provision for income taxes,
|
|
•
|
effective income tax rate,
|
|
•
|
deferred tax assets and liabilities and
|
|
•
|
unrecognized tax benefits.
|
Income taxes related to discontinued operations are discussed in
Note 3: Discontinued Operations
.
The Income Taxes section of
Note 1: Summary of Significant Accounting Policies
provides details about how we account for our income taxes.
Following the merger with Plum Creek in first quarter 2016, our income tax receivables and deferred income tax balances for our TRSs have been adjusted to include Plum Creek’s TRSs. The Plum Creek TRS balances as of the merger date were
$11 million
in income tax receivables and
$67 million
in deferred income tax assets arising from temporary differences between the tax bases and book bases of assets acquired and liabilities assumed in the merger. See
Note 4: Merger with Plum Creek
for additional details.
EARNINGS BEFORE INCOME TAXES
Domestic and Foreign Earnings From Continuing Operations Before Income Taxes
|
DOLLAR AMOUNTS IN MILLIONS
|
|||||||||
|
|
2016
|
|
2015
|
|
2014
|
|
|||
|
Domestic earnings
|
$
|
353
|
|
$
|
326
|
|
$
|
679
|
|
|
Foreign earnings
|
151
|
|
27
|
|
8
|
|
|||
|
Total earnings before income taxes
|
$
|
504
|
|
$
|
353
|
|
$
|
687
|
|
WEYERHAEUSER COMPANY >
2016 ANNUAL REPORT AND FORM 10-K
107
PROVISION FOR INCOME TAXES
Provision (Benefit) for Income Taxes From Continuing Operations
|
DOLLAR AMOUNTS IN MILLIONS
|
|||||||||
|
|
2016
|
|
2015
|
|
2014
|
|
|||
|
Current:
|
|
|
|
|
|
|
|||
|
Federal
|
$
|
1
|
|
$
|
7
|
|
$
|
(49
|
)
|
|
State
|
1
|
|
(2
|
)
|
7
|
|
|||
|
Foreign
|
11
|
|
(5
|
)
|
3
|
|
|||
|
Total current
|
13
|
|
—
|
|
(39
|
)
|
|||
|
Deferred:
|
|
|
|
|
|
|
|||
|
Federal
|
37
|
|
(69
|
)
|
107
|
|
|||
|
State
|
(3
|
)
|
(3
|
)
|
—
|
|
|||
|
Foreign
|
42
|
|
14
|
|
3
|
|
|||
|
Total deferred
|
76
|
|
(58
|
)
|
110
|
|
|||
|
Total income tax provision (benefit)
|
$
|
89
|
|
$
|
(58
|
)
|
$
|
71
|
|
EFFECTIVE INCOME TAX RATE
Effective Income Tax Rate Applicable to Continuing Operations
|
DOLLAR AMOUNTS IN MILLIONS
|
|||||||||
|
|
2016
|
|
2015
|
|
2014
|
|
|||
|
U.S. federal statutory income tax
|
$
|
177
|
|
$
|
123
|
|
$
|
240
|
|
|
State income taxes, net of federal tax benefit
|
(3
|
)
|
(5
|
)
|
5
|
|
|||
|
REIT income not subject to federal income tax
|
(99
|
)
|
(158
|
)
|
(161
|
)
|
|||
|
REIT benefit from change to tax law
|
—
|
|
(13
|
)
|
—
|
|
|||
|
Foreign taxes
|
(4
|
)
|
4
|
|
2
|
|
|||
|
Provision for unrecognized tax benefits
|
—
|
|
(7
|
)
|
(4
|
)
|
|||
|
Repatriation of Canadian earnings
|
24
|
|
—
|
|
—
|
|
|||
|
Other, net
|
(6
|
)
|
(2
|
)
|
(11
|
)
|
|||
|
Total income tax provision (benefit)
|
$
|
89
|
|
$
|
(58
|
)
|
$
|
71
|
|
|
Effective income tax rate
|
17.6
|
%
|
(16.4
|
)%
|
10.3
|
%
|
|||
DEFERRED TAX ASSETS AND LIABILITIES
Deferred tax assets and liabilities reflect the future tax impact created by differences between the timing of when income or deductions are recognized for pretax financial book reporting purposes versus income tax purposes. Deferred tax assets represent a future tax benefit (or reduction to income taxes in a future period), while deferred tax liabilities represent a future tax obligation (or increase to income taxes in a future period).
Balance Sheet Classification of Deferred Income Tax Assets (Liabilities) Related to Continuing Operations
|
DOLLAR AMOUNTS IN MILLIONS
|
||||||
|
|
DECEMBER 31,
2016 |
|
DECEMBER 31,
2015 |
|
||
|
Net noncurrent deferred tax asset
|
$
|
293
|
|
$
|
254
|
|
|
Net noncurrent deferred tax liability
|
—
|
|
—
|
|
||
|
Net deferred tax asset (liability)
|
$
|
293
|
|
$
|
254
|
|
WEYERHAEUSER COMPANY >
2016 ANNUAL REPORT AND FORM 10-K
108
Items Included in Our Deferred Income Tax Assets (Liabilities)
|
DOLLAR AMOUNTS IN MILLIONS
|
||||||
|
|
DECEMBER 31,
2016 |
|
DECEMBER 31,
2015 |
|
||
|
Postretirement benefits
|
$
|
76
|
|
$
|
80
|
|
|
Pension
|
395
|
|
260
|
|
||
|
State tax credits
|
46
|
|
49
|
|
||
|
Net operating loss carryforwards
|
25
|
|
64
|
|
||
|
Cellulosic biofuel producers credit
|
—
|
|
78
|
|
||
|
Other
|
232
|
|
178
|
|
||
|
Gross deferred tax assets
|
774
|
|
709
|
|
||
|
Valuation allowance
|
(56
|
)
|
(65
|
)
|
||
|
Net deferred tax assets
|
718
|
|
644
|
|
||
|
Property, plant and equipment
|
(214
|
)
|
(169
|
)
|
||
|
Timber installment notes
|
(180
|
)
|
(180
|
)
|
||
|
Other
|
(31
|
)
|
(41
|
)
|
||
|
Deferred tax liabilities
|
(425
|
)
|
(390
|
)
|
||
|
Net deferred tax asset (liability)
|
$
|
293
|
|
$
|
254
|
|
OTHER INFORMATION ABOUT OUR DEFERRED INCOME TAX ASSETS (LIABILITIES)
Other information about our deferred income tax assets (liabilities) include:
|
•
|
net operating loss and credit carryforwards,
|
|
•
|
valuation allowances and
|
|
•
|
reinvestment of undistributed earnings.
|
Net Operating Loss and Credit Carryforwards
Our gross federal, state and foreign net operating loss carryforwards as of the end of
2016
totaled
$1.1 billion
as follows:
|
•
|
U.S. REIT -
$742 million
, which expire from
2027
through
2036
;
|
|
•
|
State -
$335 million
, which expire from
2017
through
2036
; and
|
|
•
|
Foreign -
$40 million
, which expire from
2017
through
2021
.
|
Our gross state credit carryforwards at the end of
2016
totaled
$71 million
, which includes
$24 million
that expire from
2017
through
2030
and
$47 million
that do not expire. We have no federal or foreign credit carryforwards.
Valuation Allowances
With the exception of the valuation allowance discussed below, we believe it is more likely than not that we will have sufficient future taxable income to realize our deferred tax assets.
Our valuation allowance on our deferred tax assets was
$56 million
at the end of
2016
, primarily related to state credits and state and foreign net operating losses.
Reinvestment of Undistributed Earnings
The balance of our foreign undistributed earnings was approximately
$35 million
at the end of
2016
, all of which is permanently reinvested; therefore, it is not subject to U.S. income tax. Generally, such earnings become subject to U.S. tax upon the remittance of dividends and under certain other circumstances. It is not practicable to estimate the amount of deferred tax liability related to investments in our foreign subsidiaries.
UNRECOGNIZED TAX BENEFITS
Unrecognized tax benefits represent potential future obligations to taxing authorities if uncertain tax positions we have taken on previously filed tax returns are not sustained. The total amount of unrecognized tax benefits as of
December 31, 2016
and
2015
, is
$6 million
, which does not include related interest of
$1 million
. This amount represents the gross amount of exposure in individual jurisdictions and does not reflect any additional benefits expected to be realized if such positions are not sustained, such as the federal deduction that could be realized if an unrecognized state deduction is not sustained.
WEYERHAEUSER COMPANY >
2016 ANNUAL REPORT AND FORM 10-K
109
Reconciliation of the Beginning and Ending Amount of Unrecognized Tax Benefits
|
DOLLAR AMOUNTS IN MILLIONS
|
||||||
|
|
DECEMBER 31,
2016 |
|
DECEMBER 31,
2015 |
|
||
|
Balance at beginning of year
|
$
|
6
|
|
$
|
11
|
|
|
Settlements
|
—
|
|
(4
|
)
|
||
|
Lapse of statute
|
—
|
|
(1
|
)
|
||
|
Balance at end of year
|
$
|
6
|
|
$
|
6
|
|
The net liability recorded in our
Consolidated Balance Sheet
related to unrecognized tax benefits is
$5 million
as of
December 31, 2016
, which includes interest of
$1 million
and is net of
$2 million
in loss carryforwards available to offset the liability. The net liability as of
December 31, 2015
, was
$4 million
, which includes interest of
$1 million
and is net of
$3 million
in credits and loss carryovers available to offset the liability.
The net liability recorded for tax positions across all jurisdictions that, if sustained, would affect our effective tax rate is
$5 million
as of
December 31, 2016
and 2015, which includes interest of
$1 million
.
In accordance with our accounting policy, we accrue interest and penalties related to unrecognized tax benefits as a component of income tax expense. See
Note 1: Summary of Significant Accounting Policies.
As of
December 31, 2016
, none of our U.S. federal income tax returns are under examination, with years 2013 forward open to examination. The 2014 U.S. federal income tax return for NORPAC is currently under examination, and we held a
50 percent
ownership interest in the entity that year. See
Note 3: Discontinued Operations.
We are undergoing examinations in state jurisdictions for tax years 2012 through 2014, with tax years 2009 forward open to examination. We are also undergoing examinations in foreign jurisdictions for tax years 2010-2011 and 2013-2014, with tax years 2010 forward open to examination
.
We expect that the outcome of any examination will not have a material effect on our consolidated financial statements; however, audit outcomes and the timing of audit settlements are subject to significant uncertainty.
In the next 12 months, we estimate a decrease of
$2 million
in unrecognized tax benefits due to the lapse of applicable statutes of limitation.
ONGOING IRS MATTER
We received a Notice of Final Partnership Administrative Adjustment (FPAA), dated July 20, 2016, from the Internal Revenue Service (IRS) in regard to Plum Creek REIT’s 2008 U.S. federal income tax treatment of the transaction forming the Timberland Venture. The IRS is asserting that the transfer of the timberlands to the Timberland Venture was a taxable transaction to the company at the time of the transfer rather than a nontaxable capital contribution. We have filed a petition in the U.S. Tax Court and will vigorously contest this adjustment.
In the event that we are unsuccessful in this tax litigation, we could be required to recognize and distribute gain to shareholders of approximately
$600 million
and pay built-in gains tax of approximately
$100 million
. We would also be required to pay interest on both of those amounts, which would be substantial. We expect that as much as
80 percent
of any such distribution could be made with our common stock, and shareholders would be subject to tax on the distribution at the applicable capital gains tax rate. Alternatively, we could elect to retain the gain and pay corporate-level tax to minimize interest costs to the company.
Although the outcome of this process cannot be predicted with certainty, we are confident in our position based on U.S. tax law and believe we will be successful in defending it. Accordingly, no reserve has been recorded related to this matter.
WEYERHAEUSER COMPANY >
2016 ANNUAL REPORT AND FORM 10-K
110
NOTE 20:
GEOGRAPHIC AREAS
This note provides selected key financial data according to the geographical locations of our customers. The selected key financial data includes:
|
•
|
sales to unaffiliated customers,
|
|
•
|
export sales from the U.S. and
|
|
•
|
long-lived assets.
|
SALES
Our sales to unaffiliated customers outside the U.S. are primarily to customers in Canada, China and Japan. Our export sales include:
|
•
|
logs, lumber and wood chips to Japan;
|
|
•
|
logs and lumber to other Pacific Rim countries; and
|
|
•
|
plywood to South America and Europe.
|
Sales by Geographic Area
|
DOLLAR AMOUNTS IN MILLIONS
|
|||||||||
|
|
2016
|
|
2015
|
|
2014
|
|
|||
|
Sales to unaffiliated customers:
|
|
|
|
||||||
|
U.S.
|
$
|
5,451
|
|
$
|
4,362
|
|
$
|
4,377
|
|
|
Japan
|
369
|
|
363
|
|
412
|
|
|||
|
China
|
108
|
|
99
|
|
176
|
|
|||
|
Korea
|
30
|
|
34
|
|
53
|
|
|||
|
Canada
|
341
|
|
307
|
|
382
|
|
|||
|
Europe
|
9
|
|
10
|
|
13
|
|
|||
|
South America
|
16
|
|
23
|
|
31
|
|
|||
|
Other foreign countries
|
41
|
|
48
|
|
45
|
|
|||
|
Total
|
$
|
6,365
|
|
$
|
5,246
|
|
$
|
5,489
|
|
|
Export sales from the U.S.:
|
|
|
|
||||||
|
Japan
|
$
|
314
|
|
$
|
309
|
|
$
|
350
|
|
|
China
|
103
|
|
97
|
|
174
|
|
|||
|
Other
|
98
|
|
91
|
|
116
|
|
|||
|
Total
|
$
|
515
|
|
$
|
497
|
|
$
|
640
|
|
LONG-LIVED ASSETS
Our long-lived assets — used in the generation of revenues in the different geographical areas — are nearly all in the U.S. and Canada. Our long-lived assets include:
|
•
|
property and equipment, including construction in progress;
|
|
•
|
timber and timberlands;
|
|
•
|
minerals and mineral rights; and
|
|
•
|
goodwill.
|
Long-Lived Assets by Geographic Area
|
DOLLAR AMOUNTS IN MILLIONS
|
|||||||||
|
|
DECEMBER 31, 2016
|
|
DECEMBER 31, 2015
(1)
|
|
DECEMBER 31, 2014
(1)
|
|
|||
|
U.S.
|
$
|
15,700
|
|
$
|
8,260
|
|
$
|
8,069
|
|
|
Canada
|
206
|
|
460
|
|
579
|
|
|||
|
Other foreign countries
|
527
|
|
654
|
|
676
|
|
|||
|
Total
|
$
|
16,433
|
|
$
|
9,374
|
|
$
|
9,324
|
|
|
(1) Includes assets of discontinued operations.
|
|||||||||
WEYERHAEUSER COMPANY >
2016 ANNUAL REPORT AND FORM 10-K
111
NOTE 21:
SELECTED QUARTERLY FINANCIAL INFORMATION (unaudited)
Quarterly financial data provides a review of our results and performance throughout the year. Our earnings per share for the full year do not always equal the sum of the four quarterly earnings-per share amounts because of common share activity during the year.
Key Quarterly Financial Data for the Last Two Years
|
DOLLAR AMOUNTS IN MILLIONS EXCEPT PER-SHARE FIGURES
|
|||||||||||||||
|
|
FIRST
QUARTER
|
|
SECOND
QUARTER
|
|
THIRD
QUARTER
(1)
|
|
FOURTH
QUARTER
(1)
|
|
FULL YEAR
|
|
|||||
|
2016:
|
|
|
|
|
|||||||||||
|
Net sales
|
$
|
1,405
|
|
$
|
1,655
|
|
$
|
1,709
|
|
$
|
1,596
|
|
$
|
6,365
|
|
|
Operating income from continuing operations
|
$
|
153
|
|
$
|
258
|
|
$
|
274
|
|
$
|
185
|
|
$
|
870
|
|
|
Earnings from continuing operations before income taxes
|
$
|
72
|
|
$
|
161
|
|
$
|
184
|
|
$
|
87
|
|
$
|
504
|
|
|
Net earnings
|
$
|
81
|
|
$
|
168
|
|
$
|
227
|
|
$
|
551
|
|
$
|
1,027
|
|
|
Net earnings attributable to Weyerhaeuser common shareholders
|
$
|
70
|
|
$
|
157
|
|
$
|
227
|
|
$
|
551
|
|
$
|
1,005
|
|
|
Basic net earnings per share attributable to Weyerhaeuser common shareholders
|
$
|
0.11
|
|
$
|
0.21
|
|
$
|
0.30
|
|
$
|
0.74
|
|
$
|
1.40
|
|
|
Diluted net earnings per share attributable to Weyerhaeuser common shareholders
|
$
|
0.11
|
|
$
|
0.21
|
|
$
|
0.30
|
|
$
|
0.73
|
|
$
|
1.39
|
|
|
Dividends paid per share
|
$
|
0.31
|
|
$
|
0.31
|
|
$
|
0.31
|
|
$
|
0.31
|
|
$
|
1.24
|
|
|
Market prices - high/low
|
$31.38 - $22.06
|
|
$32.56 - $26.55
|
|
$33.17 - $29.52
|
|
$33.28 - $28.58
|
|
$33.28 - $22.06
|
|
|||||
|
2015:
|
|||||||||||||||
|
Net sales
|
$
|
1,280
|
|
$
|
1,345
|
|
$
|
1,355
|
|
$
|
1,266
|
|
$
|
5,246
|
|
|
Operating income from continuing operations
|
$
|
150
|
|
$
|
200
|
|
$
|
166
|
|
$
|
142
|
|
$
|
658
|
|
|
Earnings from continuing operations before income taxes
|
$
|
77
|
|
$
|
124
|
|
$
|
88
|
|
$
|
64
|
|
$
|
353
|
|
|
Net earnings
|
$
|
101
|
|
$
|
144
|
|
$
|
191
|
|
$
|
70
|
|
$
|
506
|
|
|
Net earnings attributable to Weyerhaeuser common shareholders
|
$
|
90
|
|
$
|
133
|
|
$
|
180
|
|
$
|
59
|
|
$
|
462
|
|
|
Basic net earnings per share attributable to Weyerhaeuser common shareholders
|
$
|
0.17
|
|
$
|
0.26
|
|
$
|
0.35
|
|
$
|
0.11
|
|
$
|
0.89
|
|
|
Diluted net earnings per share attributable to Weyerhaeuser common shareholders
|
$
|
0.17
|
|
$
|
0.26
|
|
$
|
0.35
|
|
$
|
0.11
|
|
$
|
0.89
|
|
|
Dividends paid per share
|
$
|
0.29
|
|
$
|
0.29
|
|
$
|
0.31
|
|
$
|
0.31
|
|
$
|
1.20
|
|
|
Market prices - high/low
|
$37.04 - $32.74
|
|
$33.19 - $31.06
|
|
$32.34 - $26.76
|
|
$32.72 - $26.73
|
|
$37.04 - $26.73
|
|
|||||
|
(1) Third and fourth quarter 2016 include a gain on our Cellulose Fibers divestitures. Refer to
Note 3: Discontinued Operations
for further information.
|
|||||||||||||||
WEYERHAEUSER COMPANY >
2016 ANNUAL REPORT AND FORM 10-K
112
CHANGES IN AND DISAGREEMENTS WITH ACCOUNTANTS ON ACCOUNTING AND FINANCIAL DISCLOSURE
Not applicable.
CONTROLS AND PROCEDURES
|
EVALUATION OF DISCLOSURE CONTROLS AND PROCEDURES
|
The company’s principal executive officer and principal financial officer have evaluated the effectiveness of the company’s disclosure controls and procedures as of the end of the period covered by this annual report on Form 10-K. Disclosure controls are controls and other procedures that are designed to ensure that information required to be disclosed in the reports filed or submitted under the Securities Exchange Act of 1934, as amended (Act), is recorded, processed, summarized and reported within the time periods specified in the Securities and Exchange Commission’s (SEC) rules and forms. Disclosure controls and procedures include, without limitation, controls and procedures designed to ensure that information required to be disclosed by an issuer in the reports that it files or submits under the Act is accumulated and communicated to the company's management, including its principal executive and principal financial officers, to allow timely decisions regarding required disclosure.
Based on their evaluation, the company’s principal executive officer and principal financial officer have concluded that the company’s disclosure controls and procedures are effective to ensure that information required to be disclosed complies with the SEC’s rules and forms.
|
CHANGES IN INTERNAL CONTROL
|
As a result of our February 2016 merger with Plum Creek, the company implemented internal controls over significant processes specific to the acquisition that management believes are appropriate in consideration of related integration of operations, systems, control activities, and accounting for the merger and merger-related transactions. As of the date of this Annual Report on Form 10-K, we are in the final stages of integrating the acquired Plum Creek operations into our overall internal controls over financial reporting.
Except as described above, no changes occurred in the company’s internal control over financial reporting during the period that have materially affected, or are reasonably likely to materially affect, the company’s internal control over financial reporting.
|
MANAGEMENT’S REPORT ON INTERNAL CONTROL OVER FINANCIAL REPORTING
|
Management is responsible for establishing and maintaining adequate internal control over financial reporting as that term is defined in the rules of the Act. Management, under our supervision, conducted an evaluation of the effectiveness of the company’s internal control over financial reporting based on the framework set forth in
Internal Control - Integrated Framework (2013)
issued by the Committee of Sponsoring Organizations of the Treadway Commission (COSO). Based on our evaluation conducted under the framework in
Internal Control - Integrated Framework (2013)
, management has concluded that the company’s internal control over financial reporting was effective as of December 31, 2016.
On February 19, 2016, we merged with Plum Creek. A registrant may omit an assessment of internal control over financial reporting of an acquired business from the registrant’s assessment of internal control over financial reporting; however, such an omission may not extend beyond one year from the date of the acquisition, nor may such an assessment of the acquired business’s internal control over financial reporting be omitted from more than one annual management report on internal control over financial reporting. We have made progress to integrate financial processes and systems since the merger date, but have not completed the integration. Accordingly, we have omitted certain components of acquired Plum Creek operations from our assessment of internal control over financial reporting. Those certain components of the acquired Plum Creek operations represent less than 10% of our total assets and less than 10% of our net sales as of and for the year ended December 31, 2016.
The effectiveness of the company’s internal control over financial reporting as of December 31, 2016, has been audited by KPMG LLP, an independent registered public accounting firm, as stated in their report, which is included herein.
WEYERHAEUSER COMPANY >
2016 ANNUAL REPORT AND FORM 10-K
113
|
REPORT OF INDEPENDENT REGISTERED PUBLIC ACCOUNTING FIRM
|
The Board of Directors and Shareholders
Weyerhaeuser Company:
We have audited Weyerhaeuser Company’s internal control over financial reporting as of December 31, 2016, based on criteria established in
Internal Control - Integrated Framework (2013)
issued by the Committee of Sponsoring Organizations of the Treadway Commission (COSO)
.
Weyerhaeuser Company’s management is responsible for maintaining effective internal control over financial reporting and for its assessment of the effectiveness of internal control over financial reporting, included in the accompanying Management’s Report on Internal Control Over Financial Reporting. Our responsibility is to express an opinion on the Company’s internal control over financial reporting based on our audit.
We conducted our audit in accordance with the standards of the Public Company Accounting Oversight Board (United States). Those standards require that we plan and perform the audit to obtain reasonable assurance about whether effective internal control over financial reporting was maintained in all material respects. Our audit included obtaining an understanding of internal control over financial reporting, assessing the risk that a material weakness exists, and testing and evaluating the design and operating effectiveness of internal control based on the assessed risk. Our audit also included performing such other procedures as we considered necessary in the circumstances. We believe that our audit provides a reasonable basis for our opinion.
A company’s internal control over financial reporting is a process designed to provide reasonable assurance regarding the reliability of financial reporting and the preparation of financial statements for external purposes in accordance with generally accepted accounting principles. A company’s internal control over financial reporting includes those policies and procedures that (1) pertain to the maintenance of records that, in reasonable detail, accurately and fairly reflect the transactions and dispositions of the assets of the company; (2) provide reasonable assurance that transactions are recorded as necessary to permit preparation of financial statements in accordance with generally accepted accounting principles, and that receipts and expenditures of the company are being made only in accordance with authorizations of management and directors of the company; and (3) provide reasonable assurance regarding prevention or timely detection of unauthorized acquisition, use, or disposition of the company’s assets that could have a material effect on the financial statements.
Because of its inherent limitations, internal control over financial reporting may not prevent or detect misstatements. Also, projections of any evaluation of effectiveness to future periods are subject to the risk that controls may become inadequate because of changes in conditions, or that the degree of compliance with the policies or procedures may deteriorate.
In our opinion, Weyerhaeuser Company maintained, in all material respects, effective internal control over financial reporting as of December 31, 2016, based on criteria established in
Internal Control - Integrated Framework (2013)
issued by the Committee of Sponsoring Organizations of the Treadway Commission (COSO).
Weyerhaeuser Company acquired Plum Creek Timber Company, Inc. during 2016, and management excluded from its assessment of the effectiveness of Weyerhaeuser’s internal control over financial reporting as of December 31, 2016, certain components of Plum Creek Timber Company, Inc.’s internal control over financial reporting. Those certain components of the acquired Plum Creek operations represent less than 10% of total assets and less than 10% of net sales included in the consolidated financial statements of Weyerhaeuser Company and subsidiaries as of and for the year ended December 31, 2016. Our audit of internal control over financial reporting of Weyerhaeuser Company also excluded an evaluation of the internal control over financial reporting of certain components of Plum Creek Timber Company, Inc.
We also have audited, in accordance with the standards of the Public Company Accounting Oversight Board (United States), the consolidated balance sheets of Weyerhaeuser Company and subsidiaries as of December 31, 2016 and 2015, and the related consolidated statements of operations, comprehensive income, changes in equity, and cash flows for each of the years in the three-year period ended December 31, 2016, and our report dated February 24, 2017 expressed an unqualified opinion on those consolidated financial statements.
/s/ KPMG LLP
Seattle, Washington
February 24, 2017
WEYERHAEUSER COMPANY >
2016 ANNUAL REPORT AND FORM 10-K
114
DIRECTORS, EXECUTIVE OFFICERS AND CORPORATE GOVERNANCE
A list of our executive officers and biographical information are found in the
Our Business — Executive Officers of the Registrant
section of this report. Information with respect to directors of the company and other governance matters, as required by this item is included in the
Notice of the
2017
Annual Meeting and Proxy Statement
for the company’s Annual Meeting of Shareholders to be held
May 19, 2017
under the headings “Nominees for Election,” “Board of Directors and Committee Information,” “Section 16(a) Beneficial Ownership Reporting Compliance,” and “Code of Ethics,” and is incorporated herein by reference.
EXECUTIVE AND DIRECTOR COMPENSATION
Information with respect to executive and director compensation contained in the
Notice of the
2017
Annual Meeting and Proxy Statement
for the company’s Annual Meeting of Shareholders to be held
May 19, 2017
, under the headings “Board of Directors and Committee Information — Directors’ Compensation,” “Compensation Discussion and Analysis,” “Risk Analysis of Our Compensation Programs,” “Compensation Committee Report,” “Compensation Committee Interlocks and Insider Participation,” “Summary Compensation Table,” “Grants of Plan-Based Awards for
2016
,” “Outstanding Equity Awards at
2016
Fiscal Year-End,” “Option Exercises and Stock Vested in
2016
,” “Pension Benefits,” “Nonqualified Deferred Compensation,” and “Potential Payments Upon Termination or Change of Control” is incorporated herein by reference.
SECURITY OWNERSHIP OF CERTAIN BENEFICIAL OWNERS AND MANAGEMENT AND RELATED STOCKHOLDER MATTERS
Information with respect to security ownership of certain beneficial owners and management contained in the
Notice of the
2017
Annual Meeting and Proxy Statement
for the company’s Annual Meeting of Shareholders to be held
May 19, 2017
under the heading “Beneficial Ownership of Common Shares” is incorporated herein by reference.
CERTAIN RELATIONSHIPS AND RELATED TRANSACTIONS
Information with regard to certain relationships and related transactions contained in the
Notice of the
2017
Annual Meeting and Proxy Statement
for the company’s Annual Meeting of Shareholders to be held
May 19, 2017
under the headings “Review, Approval or Ratification of Transactions with Related Persons” and “Board of Directors and Committee Information” is incorporated herein by reference.
PRINCIPAL ACCOUNTING FEES AND SERVICES
Information with respect to principal accounting fees and services in the
Notice of the
2017
Annual Meeting and Proxy Statement
for the company’s Annual Meeting of Shareholders to be held
May 19, 2017
under the heading “Ratification of Selection of Independent Registered Public Accounting Firm” is incorporated herein by reference.
WEYERHAEUSER COMPANY >
2016 ANNUAL REPORT AND FORM 10-K
115
EXHIBITS AND FINANCIAL STATEMENT SCHEDULES
All financial statement schedules have been omitted because they are not applicable or the required information is included in the consolidated financial statements, or the notes thereto, in
Financial Statements and Supplementary Data
above.
|
EXHIBITS
|
|
|
|||
|
2
|
—
|
Plan of Acquisition, Reorganization, Arrangement, Liquidation or Succession
|
|
|
(a)
|
Transaction Agreement, dated as of November 3, 2013, among Weyerhaeuser Company, Weyerhaeuser Real Estate Company, TRI Pointe Homes, Inc. and Topaz Acquisition, Inc. (incorporated by reference to Exhibit 2.1 to the Current Report on Form 8-K filed on November 4, 2013 - Commission File Number 1-4825)
|
||
|
(b)
|
Agreement and Plan of Merger, dated as of November 6, 2015, between Weyerhaeuser Company and Plum Creek Timber Company, Inc. (incorporated by reference to Exhibit 2.1 to the Current Report on Form 8-K filed on November 9, 2015 - Commission File Number 1-4825)
|
||
|
(c)
|
Asset Purchase Agreement, dated as of June 15, 2016, by and between Weyerhaeuser NR Company and Nippon Paper Industries, Co., Ltd. (incorporated by reference to Exhibit 2.1 to the Quarterly Report on Form 10-Q filed on August 5, 2016 - Commission File Number 1-4825)
|
||
|
(d)
|
Asset Purchase Agreement, dated as of May 1, 2016, by and between Weyerhaeuser NR Company and International Paper Company (incorporated by reference to Exhibit 2.2 to the Quarterly Report on Form 10-Q filed on August 5, 2016 - Commission File Number 1-4825)
|
||
|
3
|
—
|
Articles of Incorporation
|
|
|
(a)
|
Articles of Incorporation (incorporated by reference to Exhibit 3.1 to the Quarterly Report on Form 10-Q filed on May 6, 2011 - Commission File Number 1-4825, and to Exhibit 3.1 to the Current Report on Form 8-K filed on June 20, 2013 - Commission File Number 1-4825)
|
||
|
(b)
|
Bylaws (incorporated by reference to Exhibit 3.2 to the Quarterly Report on Form 10-Q filed on May 6, 2011 - Commission File Number 1-4825)
|
||
|
4
|
—
|
Instruments Defining the Rights of Security Holders, Including Indentures
|
|
|
(a)
|
Indenture dated as of April 1, 1986 between Weyerhaeuser Company and The Bank of New York Mellon Trust Company, N.A. (as successor to JPMorgan Chase Bank, formerly known as The Chase Manhattan Bank and Chemical Bank), a national banking association, as Trustee (incorporated by reference from the Registration Statement on Form S-3, Registration No. 333-36753)
|
||
|
(b)
|
First Supplemental Indenture dated as of February 15, 1991 between Weyerhaeuser Company and The Bank of New York Mellon Trust Company, N.A. (as successor to JPMorgan Chase Bank, formerly known as The Chase Manhattan Bank and Chemical Bank), a national banking association, as Trustee (incorporated by reference from the Registration Statement on Form S-3, Registration No. 333-52982)
|
||
|
(c)
|
Second Supplemental Indenture dated as of February 1, 1993 between Weyerhaeuser Company and The Bank of New York Mellon Trust Company, N.A. (as successor to JPMorgan Chase Bank, formerly known as The Chase Manhattan Bank and Chemical Bank), a national banking association, as Trustee (incorporated by reference from the Registration Statement on Form S-3, Registration No. 333-59974)
|
||
|
(d)
|
Third Supplemental Indenture dated as of October 22, 2001 between Weyerhaeuser Company and The Bank of New York Mellon Trust Company, N.A. (as successor to JPMorgan Chase Bank, formerly known as The Chase Manhattan Bank and Chemical Bank), a national banking association, as Trustee (incorporated by reference from the Registration Statement on Form S-3, Registration No. 333-72356)
|
||
|
(e)
|
Fourth Supplemental Indenture dated as of March 12, 2002 between Weyerhaeuser Company and The Bank of New York Mellon Trust Company, N.A. (as successor to JPMorgan Chase Bank, formerly known as The Chase Manhattan Bank and Chemical Bank), a national banking association, as Trustee (incorporated by reference to Exhibit 4.8 from the Registration Statement on Form S-4/A, Registration No. 333-82376)
|
||
|
(f)
|
Note Indenture dated November 14, 2005 by and among Plum Creek Timberlands, L.P., as Issuer, Weyerhaeuser Company, as successor to Plum Creek Timber Company, Inc., as Guarantor, and U.S. Bank National Association, as Trustee (incorporated by reference to Exhibit 4.2 to the Current Report on Form 8-K filed on February 19, 2016 - Commission File Number 1-4825)
|
||
|
(g)
|
Supplemental Indenture No. 1 dated as of February 19, 2016 by and among Plum Creek Timberlands, L.P., as Issuer, Weyerhaeuser Company, as Guarantor, and U.S. Bank National Association, as Trustee (incorporated by reference to Exhibit 4.1 to the Current Report on Form 8-K filed on February 19, 2016 - Commission File Number 1-4825)
|
||
|
(h)
|
Supplemental Indenture No. 2 dated September 28, 2016 by and between Weyerhaeuser Company, as successor Issuer, and U.S. Bank National Association, as Trustee, relating to the 4.70% Notes due 2021 and the 3.25% Notes due 2023 (incorporated by reference to Exhibit 4.1 to the Current Report on Form 8-K filed on September 30, 2016 - Commission File Number 1-4825)
|
||
|
(i)
|
Officer’s Certificate dated November 15, 2010 executed by Plum Creek Timberlands, L.P., as Issuer, establishing the terms and form of the 4.70% Notes due 2021 (incorporated by reference to Exhibit 4.3 to the Current Report on Form 8-K filed on February 19, 2016 - Commission File Number 1-4825 )
|
||
|
(j)
|
Officer’s Certificate dated November 26, 2012 executed by Plum Creek Timberlands, L.P., as Issuer, establishing the terms and form of the 3.25% Notes due 2023 (incorporated by reference to Exhibit 4.4 to the Current Report on Form 8-K filed on February 19, 2016 - Commission File Number 1-4825 )
|
||
|
(k)
|
Assumption and Amendment Agreement and Installment Note dated as of April 28, 2016 by and among Plum Creek Timberlands, L.P., Weyerhaeuser Company and MeadWestvaco Timber Note Holding Company II, L.L.C. (incorporated by reference to Exhibit 4.1 to the Current Report on Form 8-K filed on May 4, 2016 - Commission File Number 1-4825)
|
||
WEYERHAEUSER COMPANY >
2016 ANNUAL REPORT AND FORM 10-K
116
|
10
|
—
|
Material Contracts
|
|
|
|
|
(a)
|
Form of Weyerhaeuser Executive Change of Control Agreement for Adrian Blocker, Kristy Harlan, Rhonda Hunter, Denise Merle and Doyle Simons (refiled solely to remove cover sheet)*
|
|
(b)
|
Form of Executive Severance Agreement for Adrian Blocker, Kristy Harlan, Russell Hagen, Rhonda Hunter, Jim Kilberg, Denise Merle and Doyle Simons (refiled solely to update cover sheet)*
|
||
|
(c)
|
Form of Plum Creek Executive Change in Control Agreement for Russell Hagen, Jim Kilberg, and Tom Lindquist*
|
||
|
(d)
|
Executive Employment Agreement with Doyle Simons dated February 17, 2016 (incorporated by reference to Exhibit 10(v) to the Annual Report on Form 10-K for the annual period ended December 31, 2015 - Commission File Number 1-4825)*
|
||
|
(e)
|
Retention Agreement with Catherine I. Slater dated effective November 4, 2015 (incorporated by reference to Exhibit 10(w) to the Annual Report on Form 10-K for the annual period ended December 31, 2015 - Commission File Number 1-4825)*
|
||
|
(f)
|
Weyerhaeuser Company 2013 Long-Term Incentive Plan (incorporated by reference to Exhibit 10.1 to the Current Report on Form 8-K filed with the Securities and Exchange Commission on February 19, 2013 - Commission File Number 1-4825)*
|
||
|
(g)
|
Form of Weyerhaeuser Company 2013 Long-Term Incentive Plan Stock Option Award Terms and Conditions (incorporated by reference to Exhibit 10.2 to the Current Report on Form 8-K filed on April 16, 2013 - Commission File Number 1-4825)*
|
||
|
(h)
|
Form of Weyerhaeuser Company 2013 Long-Term Incentive Plan Performance Share Unit Award Terms and Conditions (incorporated by reference to Exhibit 10.4 to the Current Report on Form 8-K filed on April 16, 2013 - Commission File Number 1-4825)*
|
||
|
(i)
|
Form of Weyerhaeuser Company 2013 Long-Term Incentive Plan Performance Share Unit Award Terms and Conditions (incorporated by reference to Exhibit 10.2 to the Current Report on Form 8-K filed on December 22, 2014 - Commission File Number 1-4825)*
|
||
|
(j)
|
Form of Weyerhaeuser Company 2013 Long Term Incentive Plan Performance Share Unit Award Terms and Conditions (incorporated by reference to Exhibit 10.1 to the Current Report on Form 8-K filed on January 22, 2016 - Commission File Number 1-4825)*
|
||
|
(k)
|
Form of Weyerhaeuser Company 2013 Long Term Incentive Plan Performance Share Unit Award Terms and Conditions (incorporated by reference to Exhibit 10.1 the Current Report on Form 8-K filed on January 26, 2017 - Commission File Number 1-4825)
|
||
|
(l)
|
Form of Weyerhaeuser Company 2013 Long-Term Incentive Plan Restricted Stock Unit Award Terms and Conditions (incorporated by reference to Exhibit 10.3 to the Current Report on Form 8-K filed on April 16, 2013 - Commission File Number 1-4825)*
|
||
|
(m)
|
Form of Weyerhaeuser Company 2013 Long-Term Incentive Plan Restricted Stock Unit Award Terms and Conditions (incorporated by reference to Exhibit 10.2 to the Current Report on Form 8-K filed on January 22, 2016 - Commission File Number 1-4825)*
|
||
|
(n)
|
Form of Weyerhaeuser Company 2013 Long-Term Incentive Plan Restricted Stock Unit Award Terms and Conditions (incorporated by reference to Exhibit 10.2 the Current Report on Form 8-K filed on January 26, 2017 - Commission File Number 1-4825)
|
||
|
(o)
|
Form of Weyerhaeuser Company 2004 Long-Term Incentive Plan Stock Option Award Terms and Conditions (incorporated by reference to Exhibit 10.1 to the Current Report on Form 8-K filed on February 11, 2013 - Commission File Number 1-4825)*
|
||
|
(p)
|
Form of Weyerhaeuser Company 2004 Long-Term Incentive Plan Performance Share Award Terms and Conditions (incorporated by reference to Exhibit 10.3 to the Current Report on Form 8-K filed on February 11, 2013 - Commission File Number 1-4825)*
|
||
|
(q)
|
Form of Weyerhaeuser Company 2004 Long-Term Incentive Plan Restricted Stock Award Terms and Conditions (incorporated by reference to Exhibit 10.2 to the Current Report on Form 8-K filed on February 11, 2013 - Commission File Number 1-4825)*
|
||
|
(r)
|
Weyerhaeuser Company 2004 Long-Term Incentive Compensation Plan, as Amended and Restated (incorporated by reference to Exhibit 10.5 to the Current Report on Form 8-K filed on December 29, 2010 - Commission File Number 1-4825)*
|
||
|
(s)
|
Form of Plum Creek Executive Stock Option, Restricted Stock Unit and Value Management Award Agreement For Plan Year 2007*
|
||
|
(t)
|
Form of Plum Creek Executive Stock Option, Restricted Stock Unit and Value Management Award Agreement For Plan Year 2008*
|
||
|
(u)
|
Form of Plum Creek Executive Stock Option, Restricted Stock Unit and Value Management Award Agreement For Plan Year 2009*
|
||
|
(v)
|
Form of Plum Creek Executive Stock Option, Restricted Stock Unit and Value Management Award Agreement For Plan Year 2010*
|
||
|
(w)
|
Form of Plum Creek Executive Stock Option, Restricted Stock Unit and Value Management Award Agreement For Plan Year 2011*
|
||
|
(x)
|
Form of Plum Creek Executive Restricted Stock Unit and Value Management Award Agreement For Plan Year 2013*
|
||
|
(y)
|
Form of Plum Creek Executive Restricted Stock Unit and Value Management Award Agreement For Plan Year 2014*
|
||
|
(z)
|
Form of Plum Creek Executive Restricted Stock Unit and Value Management Award Agreement for Plan Year 2015*
|
||
|
(aa)
|
Form of Plum Creek Executive Restricted Stock Unit Agreement for Plan Year 2016*
|
||
|
(bb)
|
2012 Plum Creek Timber Company, Inc. Stock Incentive Plan (incorporated by reference to Exhibit 99.1 from the Registration Statement on Form S-8, Registration No. 333-209617)*
|
||
|
(cc)
|
Amended and Restated Plum Creek Timber Company, Inc. Stock Incentive Plan (incorporated by reference to Exhibit 99.2 from the Registration Statement on Form S-8, Registration No. 333-209617)*
|
||
WEYERHAEUSER COMPANY >
2016 ANNUAL REPORT AND FORM 10-K
117
|
(dd)
|
Plum Creek Supplemental Pension Plan*
|
||
|
(ee)
|
Plum Creek Pension Plan*
|
||
|
(ff)
|
Plum Creek Supplemental Benefits Plan*
|
||
|
(gg)
|
Weyerhaeuser Company Annual Incentive Plan for Salaried Employees (Amended and Restated Effective May 19, 2016) (incorporated by reference to Exhibit 10.1 to the Current Report on Form 8-K filed on May 25, 2016 - Commission File Number 1-4825)*
|
||
|
(hh)
|
Weyerhaeuser Company 2015 Deferred Compensation Plan (incorporated by reference to Exhibit 10.3 to the Current Report on Form 8-K filed on December 22, 2014 - Commission File Number 1-4825)*
|
||
|
(ii)
|
Weyerhaeuser Company Salaried Employees Supplemental Retirement Plan (incorporated by reference to Exhibit 10(p) to the Annual Report on Form 10-K for the annual period ended December 31, 2004 - Commission File Number 1-4825)*
|
||
|
(jj)
|
2016 Fee Deferral Plan for Directors of Weyerhaeuser Company (Amended and Restated Effective January 1, 2016) (incorporated by reference to Exhibit 10.1 to the Quarterly Report on Form 10-Q filed on May 6, 2016 - Commission File Number 1-4825)*
|
||
|
(kk)
|
Form of Weyerhaeuser Company 2013 Long-Term Incentive Plan Director Restricted Stock Unit Award Terms and Conditions (incorporated by reference to Exhibit 10(q) to the Annual Report on Form 10-K for the annual period ended December 31, 2015 - Commission File Number 1-4825)*
|
||
|
(ll)
|
Revolving Credit Facility Agreement among Weyerhaeuser Company, Weyerhaeuser Real Estate Company, JP Morgan Chase Bank, N.A. as administrative agent, Citibank, N.A., as syndication agent, CoBank, ACB, PNC Bank, National Association, The Bank of Tokyo-Mitsubishi UFJ, Ltd, and Wells Fargo Bank, N.A., as documentation agents, and the lenders, swing-line banks and initial fronting banks named therein (incorporated by reference to Exhibit 10.1 to the Current Report on Form 8-K filed on September 12, 2013 - Commission File Number 1-4825)
|
||
|
(mm)
|
Credit Agreement among Weyerhaeuser Company, CoBank, ACB as administrative agent, and the lenders party thereto (incorporated by reference to Exhibit 10.1 to the Current Report on Form 8-K filed on September 16, 2013 - Commission File Number 1-4825)
|
||
|
(nn)
|
Form of Tax Sharing Agreement to be entered into by and among Weyerhaeuser Company, Weyerhaeuser Real Estate Company and TRI Pointe Homes, Inc. (incorporated by reference to Exhibit 10.5 to the Current Report on Form 8-K filed on November 4, 2013 - Commission File Number 1-4825)
|
||
|
(oo)
|
First Amendment to Tax Sharing Agreement dated as of July 7, 2015 by and among Weyerhaeuser Company, TRI Pointe Holdings, Inc. (f/k/a Weyerhaeuser Real Estate Company) and TRI Pointe Homes, Inc. (incorporated by reference to Exhibit 10 to the Quarterly Report on Form 10-Q filed on July 31, 2015 - Commission File Number 1-4825)
|
||
|
(pp)
|
Redemption Agreement dated as of August 30, 2016 by and among Southern Diversified Timber, LLC, Weyerhaeuser NR Company, TCG Member, LLC, Plum Creek Timber Operations I, L.L.C., TCG/Southern Diversified Manager, LLC, Southern Diversified, LLC, Campbell Opportunity Fund VI, L.P., and Campbell Opportunity Fund VI-A, L.P. (incorporated by reference to Exhibit 10.1 to the Quarterly Report on Form 10-Q filed on October 28, 2016 - Commission File Number 1-4825)
|
||
|
12
|
—
|
Statements regarding computation of ratios
|
|
|
14
|
—
|
Code of Business Conduct and Ethics (incorporated by reference to Exhibit 14.1 to the Current Report on Form 8-K filed on August 22, 2016 - Commission File Number 1-4825)
|
|
|
21
|
—
|
Subsidiaries of the Registrant
|
|
|
23
|
—
|
Consent of Independent Registered Public Accounting Firm
|
|
|
31
|
—
|
Certification pursuant to Rule 13a-14(a) under the Securities Exchange Act of 1934, as amended
|
|
|
32
|
—
|
Certification pursuant to Rule 13a-14(b) under the Securities Exchange Act of 1934, as amended, and Section 1350 of Chapter 63 of Title 18 of the United States Code (18 U.S.C. 1350)
|
|
|
101.INS
|
—
|
XBRL Instance Document
|
|
|
101.SCH
|
—
|
XBRL Taxonomy Extension Schema Document
|
|
|
101.CAL
|
—
|
XBRL Taxonomy Extension Calculation Linkbase Document
|
|
|
101.DEF
|
—
|
XBRL Taxonomy Extension Definition Linkbase Document
|
|
|
101.LAB
|
—
|
XBRL Taxonomy Extension Label Linkbase Document
|
|
|
101.PRE
|
—
|
XBRL Taxonomy Extension Presentation Linkbase Document
|
|
* Denotes a management contract or compensatory plan or arrangement.
WEYERHAEUSER COMPANY >
2016 ANNUAL REPORT AND FORM 10-K
118
|
SIGNATURES
|
||||
Pursuant to the requirements of Section 13 or 15(d) of the Securities Exchange Act of 1934, the registrant has duly caused this report to be signed on its behalf by the undersigned, thereunto duly authorized
February 24, 2017
.
|
WEYERHAEUSER COMPANY
|
|
/s/ DOYLE R. SIMONS
|
|
Doyle R. Simons
|
|
President and Chief Executive Officer
|
Pursuant to the requirements of the Securities Exchange Act of 1934, this report has been signed below by the following persons on behalf of the registrant in the capacities indicated
February 24, 2017
.
|
/s/ DOYLE R. SIMONS
|
|
/s/ RICK R. HOLLEY
|
|
Doyle R. Simons
Principal Executive Officer and Director
|
|
Rick R. Holley
Chairman of the Board and Director
|
|
/s/ RUSSELL S. HAGEN
|
/s/ JOHN I. KIECKHEFER
|
|
|
Russell S. Hagen
Principal Financial Officer
|
|
John I. Kieckhefer
Director |
|
/s/ JEANNE M. HILLMAN
|
/s/ JOHN F. MORGAN, SR.
|
|
|
Jeanne M. Hillman
Principal Accounting Officer
|
|
John F. Morgan, Sr.
Director
|
|
/s/ DAVID P. BOZEMAN
|
/s/ NICOLE W. PIASECKI
|
|
|
David P. Bozeman
Director
|
|
Nicole W. Piasecki
Director
|
|
/s/ MARK A. EMMERT
|
/s/ MARC F. RACICOT
|
|
|
Mark A. Emmert
Director |
|
Marc F. Racicot
Director
|
|
/s/ SARA GROOTWASSINK LEWIS
|
/s/ LAWRENCE A. SELZER
|
|
|
Sara Grootwassink Lewis
Director
|
|
Lawrence A. Selzer
Director
|
|
/s/ D. MICHAEL STEUERT
|
/s/ KIM WILLIAMS
|
|
|
D. Michael Steuert
Director |
Kim Williams
Director |
|
|
/s/ CHARLES R. WILLIAMSON
|
||
|
Charles R. Williamson
Director |
||
WEYERHAEUSER COMPANY >
2016 ANNUAL REPORT AND FORM 10-K
119
TABLE OF CONTENTS
Note 1: Summary Of Significant Accounting PoliciesNote 2: Business SegmentsNote 3: Discontinued OperationsNote 4: Merger with Plum CreekNote 5: Net Earnings Per ShareNote 6: InventoriesNote 7: Property and EquipmentNote 8: Related PartiesNote 9: Pension and Other Postretirement Benefit PlansNote 10: Accrued LiabilitiesNote 11: Lines Of CreditNote 12: Long-term DebtNote 13: Fair Value Of Financial InstrumentsNote 14: Legal Proceedings, Commitments and ContingenciesNote 15: Shareholders InterestNote 16: Share-based CompensationNote 17: Charges For Integration and Restructuring, Closures and Asset ImpairmentsNote 18: Other Operating Costs (income), NetNote 19: Income TaxesNote 20: Geographic AreasNote 21: Selected Quarterly Financial Information (unaudited)